UNITED STATES
SECURITIES AND EXCHANGE COMMISSION
Washington, D.C. 20549
FORM N-CSRS
CERTIFIED SHAREHOLDER REPORT OF REGISTERED
MANAGEMENT INVESTMENT COMPANIES
Investment Company Act file number: 811-09689
Allspring Master Trust
(Exact name of registrant as specified in charter)
1415 Vantage Park Drive, 3rd Floor, Charlotte, NC 28203
(Address of principal executive offices) (Zip code)
Matthew Prasse
Allspring Funds Management, LLC
1415 Vantage Park Drive, 3rd Floor, Charlotte, NC 28203
(Name and address of agent for service)
Registrant’s telephone number, including area code: 800-222-8222
Date of fiscal year end: February 28
Registrant is making a filing for 10 of its series: Allspring Bloomberg US Aggregate ex-Corporate Portfolio, Allspring Emerging Markets Bond Portfolio, Allspring Factor Enhanced Emerging Markets Equity Portfolio, Allspring Factor Enhanced International Equity Portfolio, Allspring Factor Enhanced U.S. Large Cap Equity Portfolio, Allspring Factor Enhanced U.S. Small Cap Equity Portfolio, Allspring High Yield Corporate Bond Portfolio, Allspring Investment Grade Corporate Bond Portfolio, Allspring Strategic Retirement Bond Portfolio, and Allspring U.S. REIT Portfolio.
Date of reporting period: August 31, 2023
ITEM 1. REPORT TO STOCKHOLDERS
Allspring Bloomberg US Aggregate
ex-Corporate Portfolio
Semi-Annual Report
August 31, 2023
Allspring Bloomberg US Aggregate Ex-Corporate Portfolio | 1
Portfolio information (unaudited)
| The Portfolio seeks to replicate the total return of the Bloomberg U.S. Aggregate ex-Corporate Index,† before fees and expenses. |
| Allspring Funds Management, LLC |
| Allspring Global Investments, LLC |
| Manjunath Boraiah, Christopher Y. Kauffman, CFA, Janet S. Rilling, CFA, CPA, Michal Stanczyk |
Ten largest holdings (%) as of August 31, 20231 |
| |
| |
U.S. Treasury Notes, 0.25%, 7-31-2025 | |
U.S. Treasury Notes, 0.25%, 5-31-2025 | |
U.S. Treasury Bonds, 1.13%, 5-15-2040 | |
U.S. Treasury Bonds, 5.25%, 11-15-2028 | |
U.S. Treasury Notes, 0.75%, 11-15-2024 | |
U.S. Treasury Bonds, 3.00%, 5-15-2047 | |
| |
U.S. Treasury Notes, 0.25%, 8-31-2025 | |
| Figures represent the percentage of the Portfolio’s net assets. Holdings are subject to change and may have changed since the date specified. |
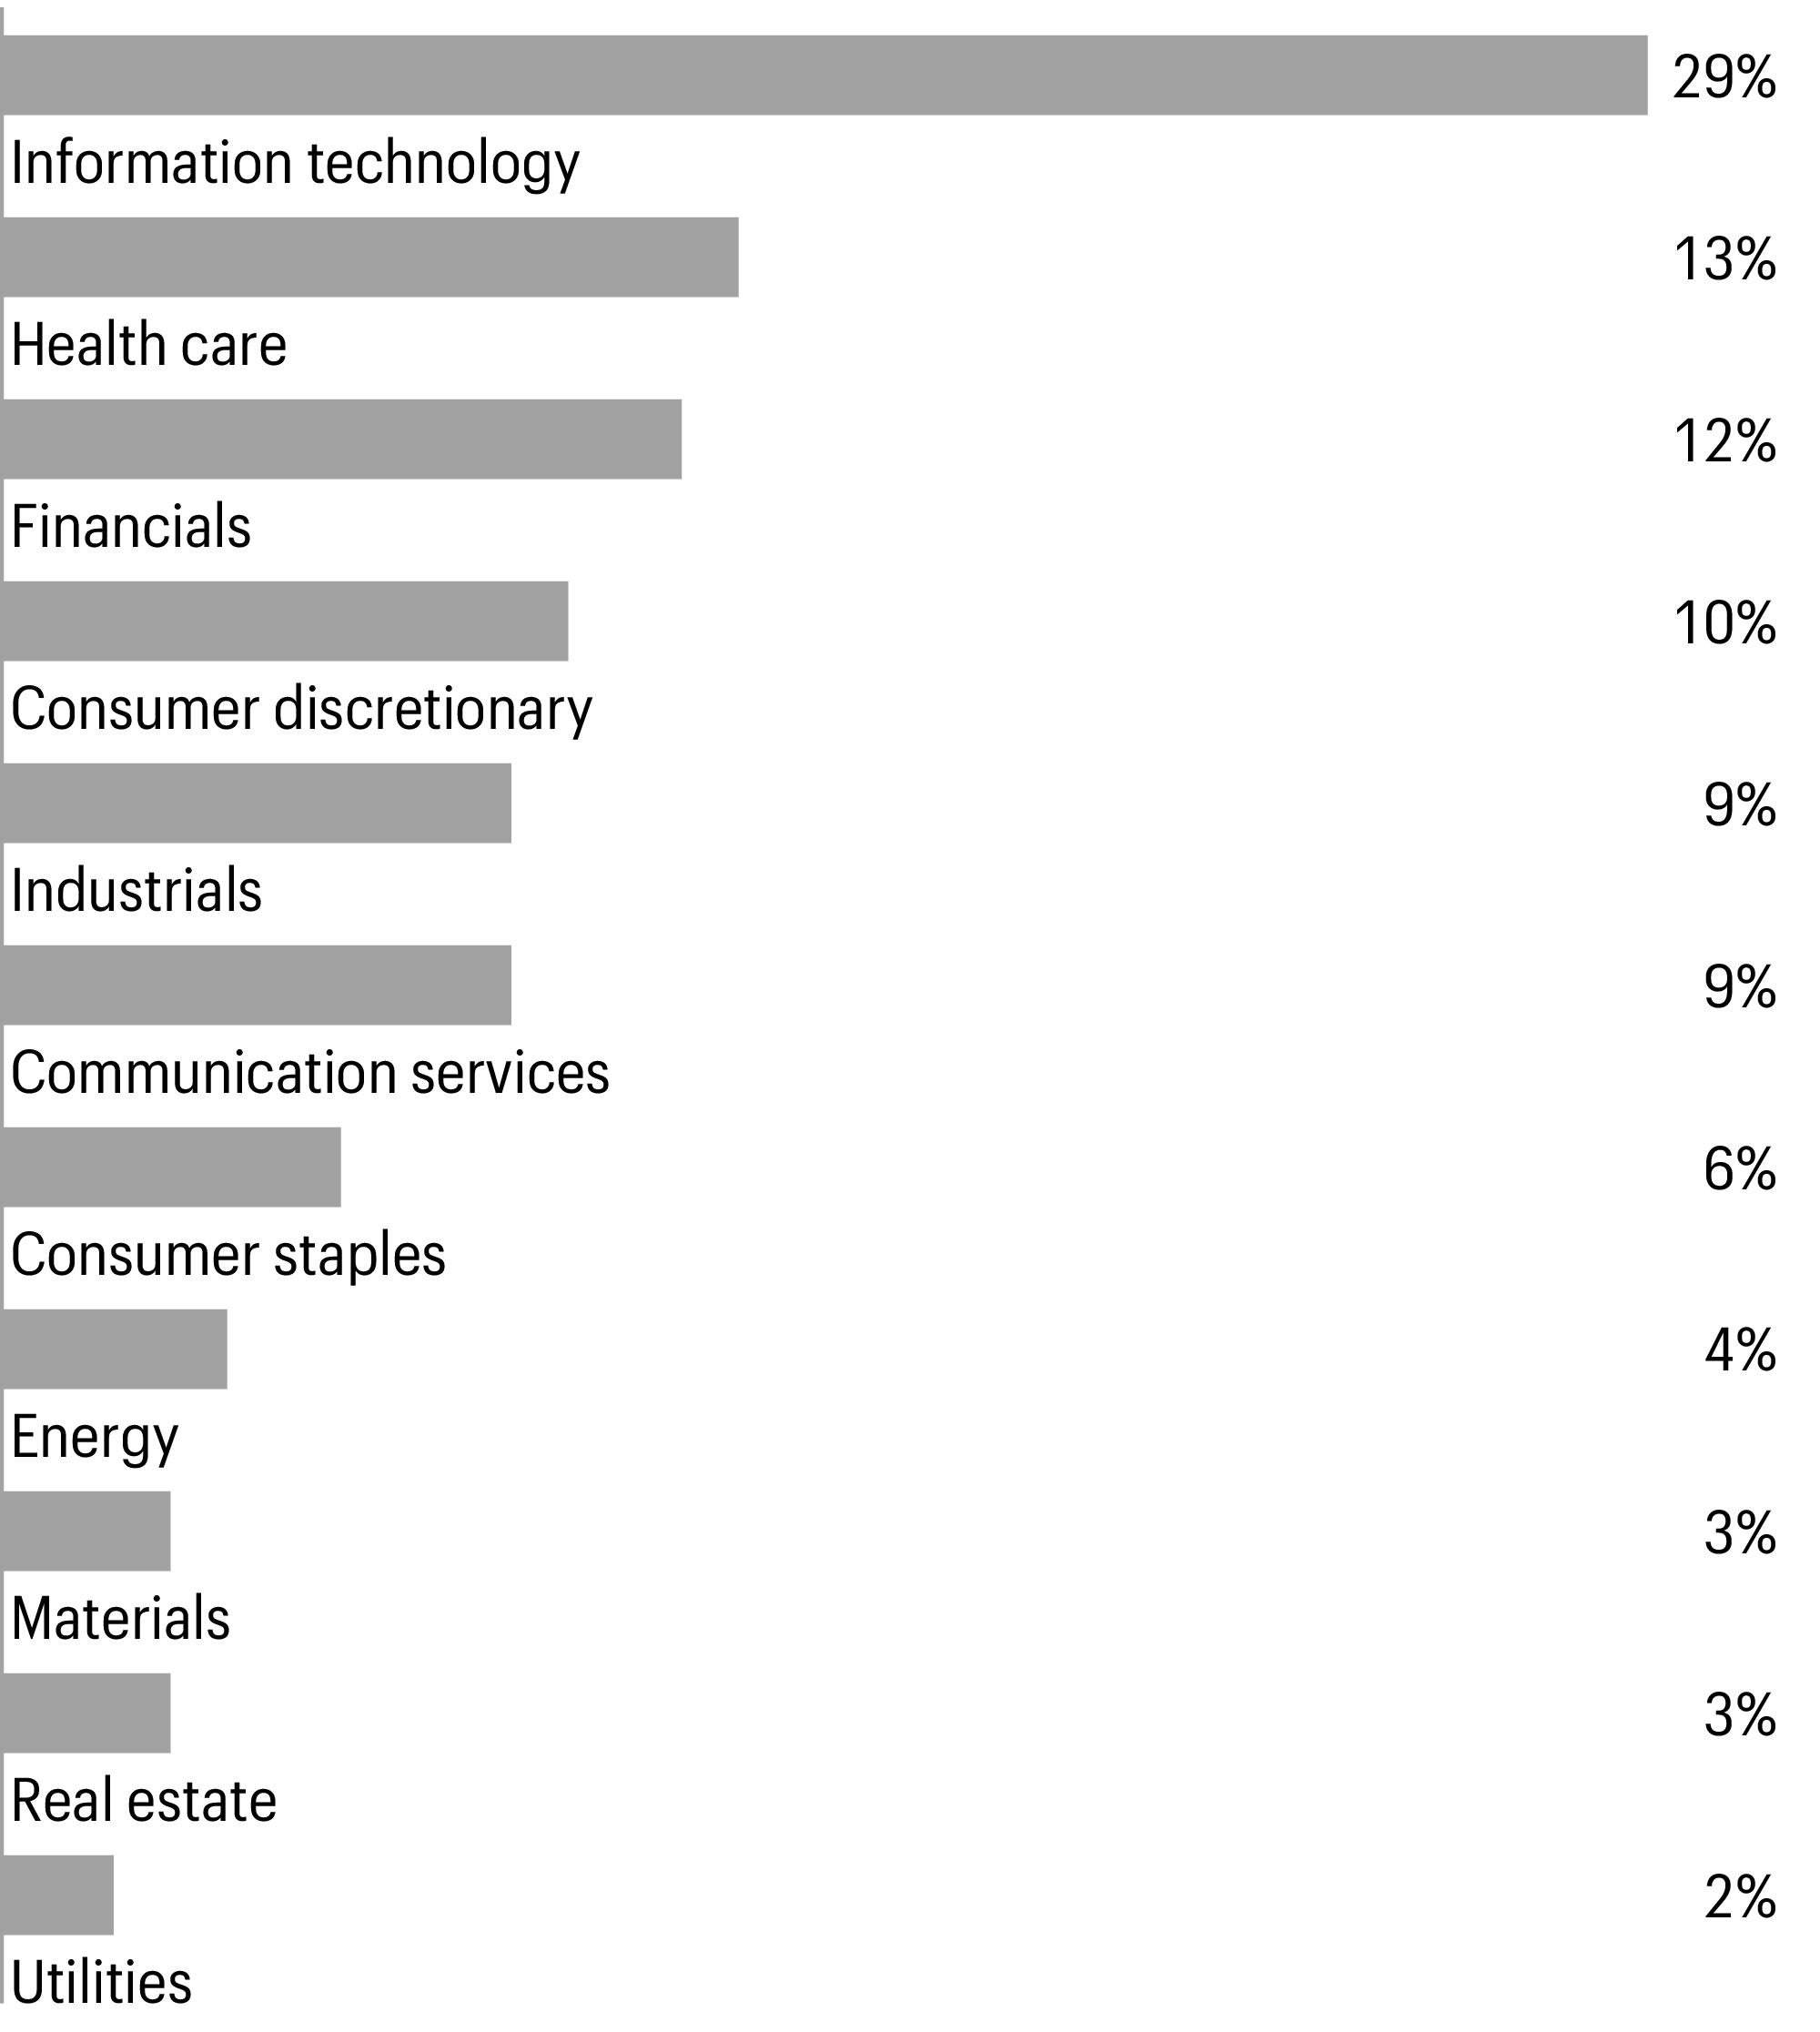
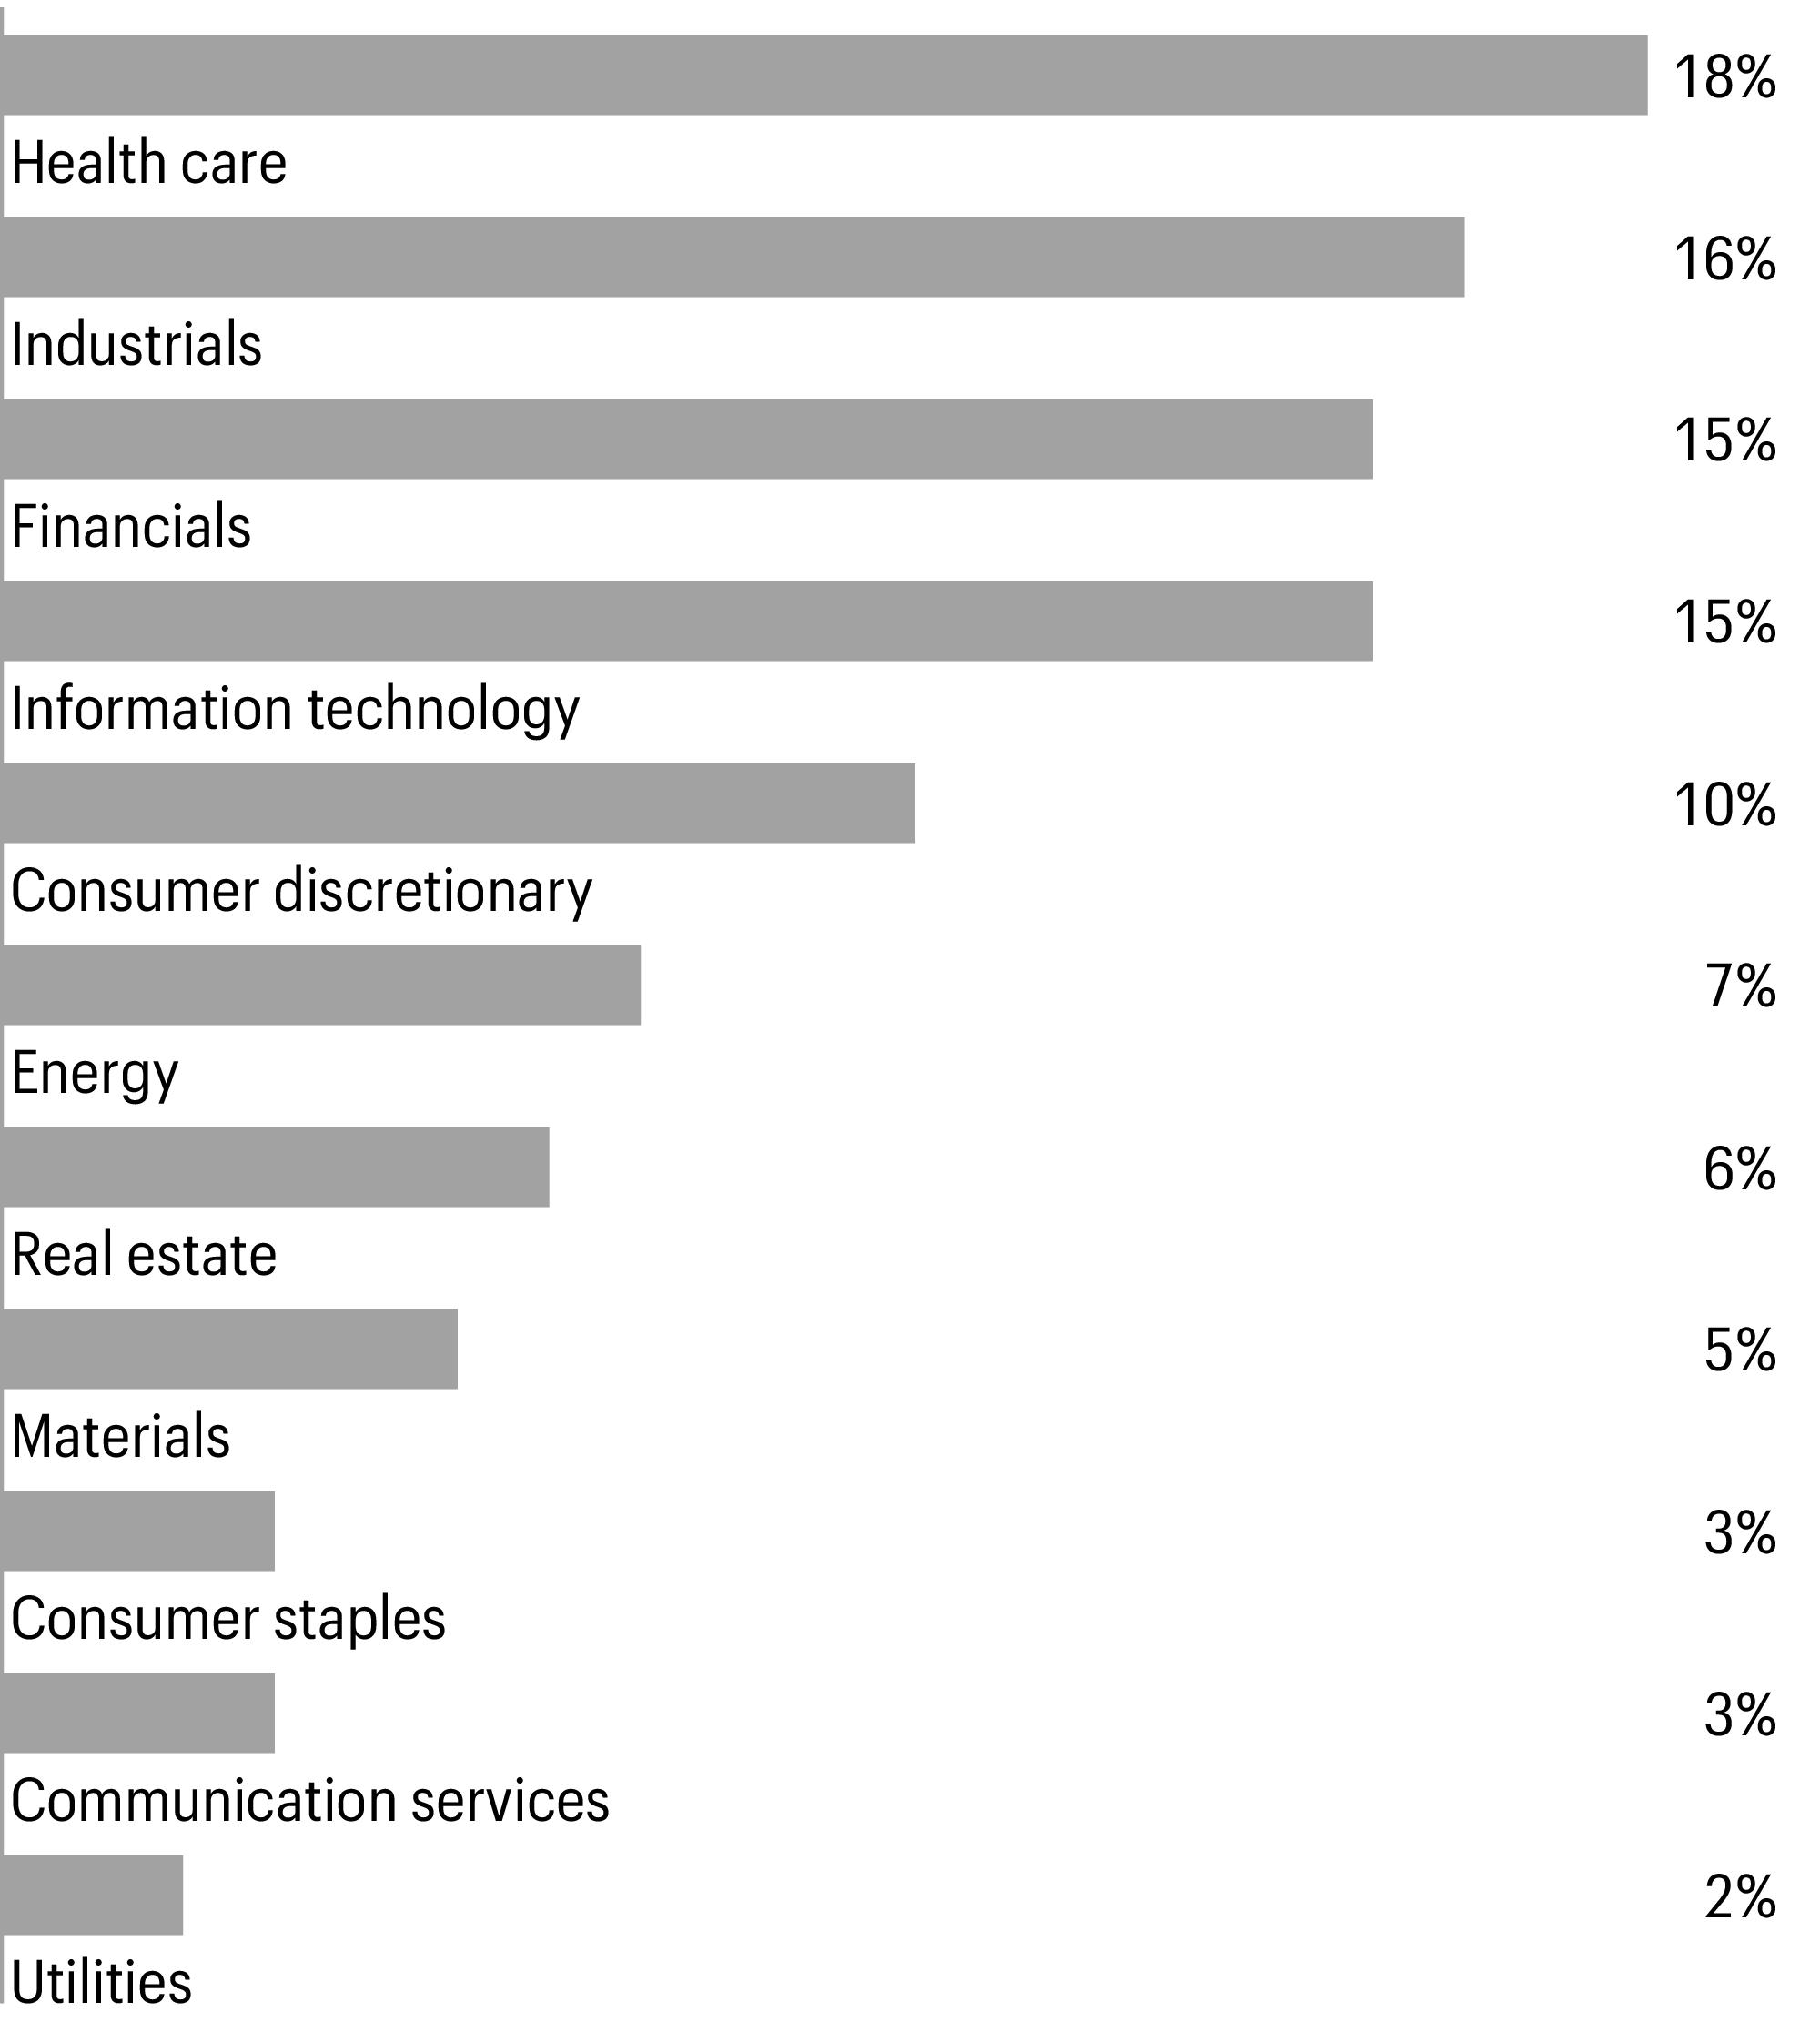
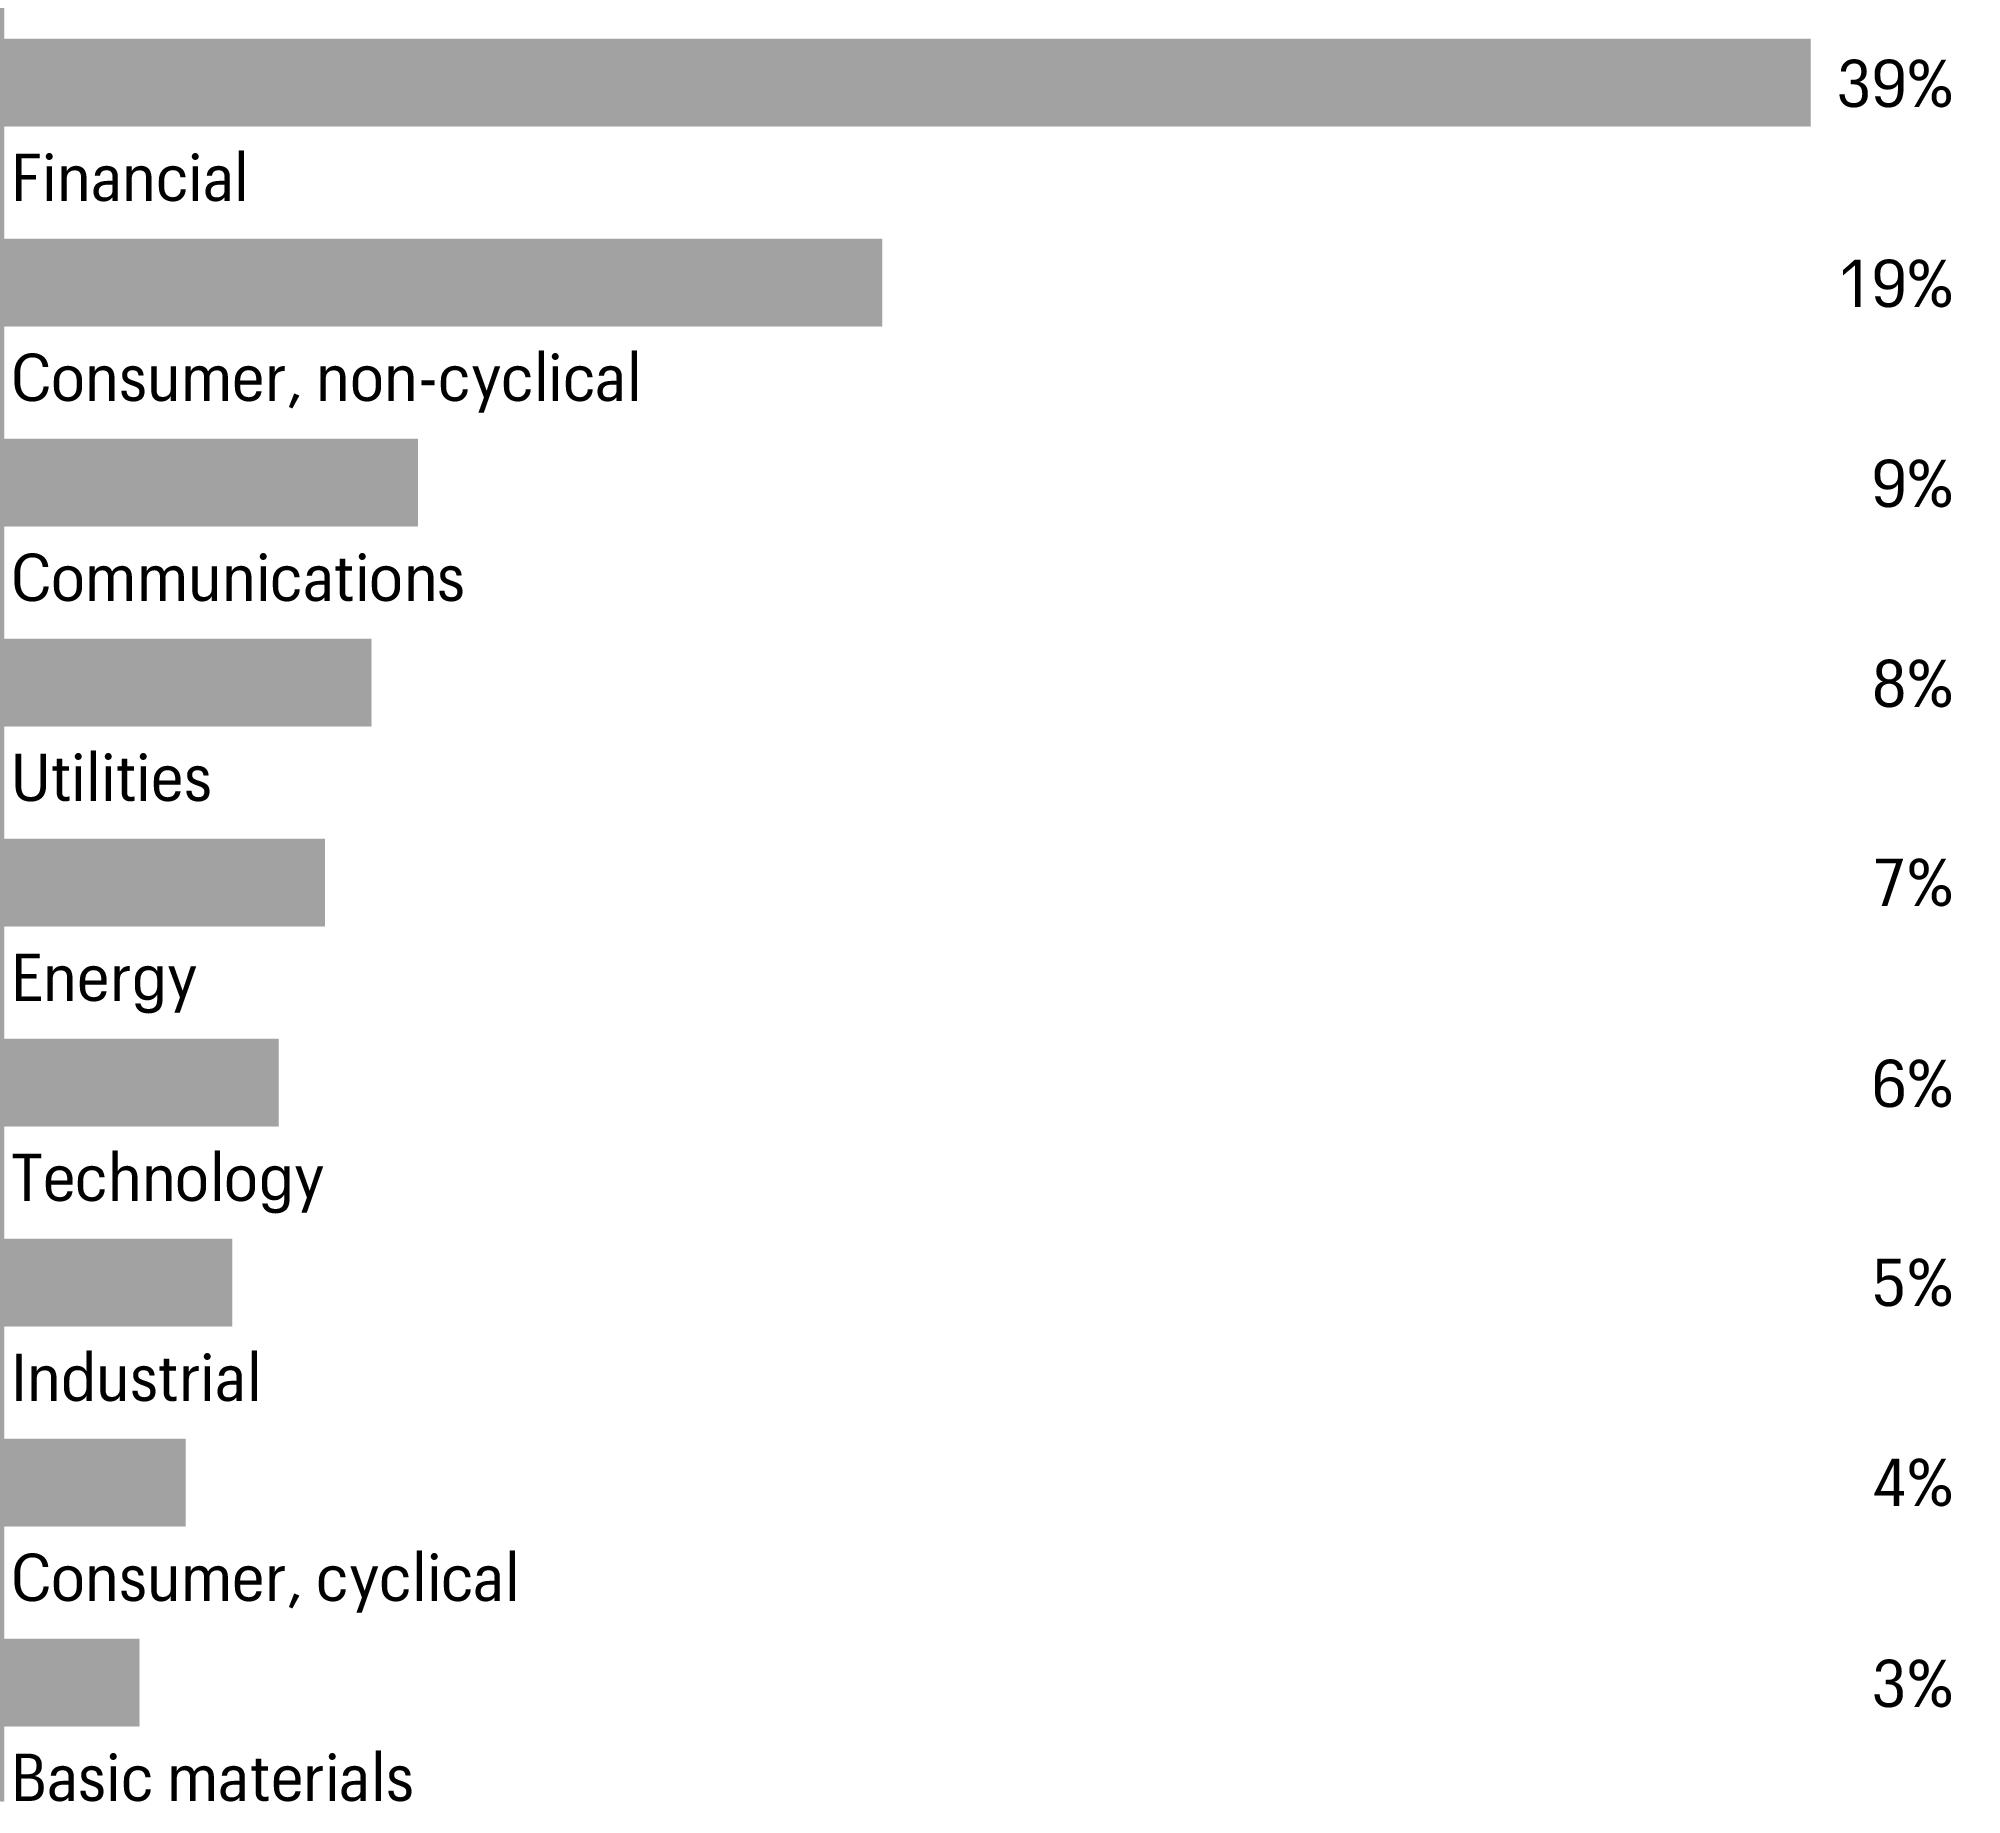
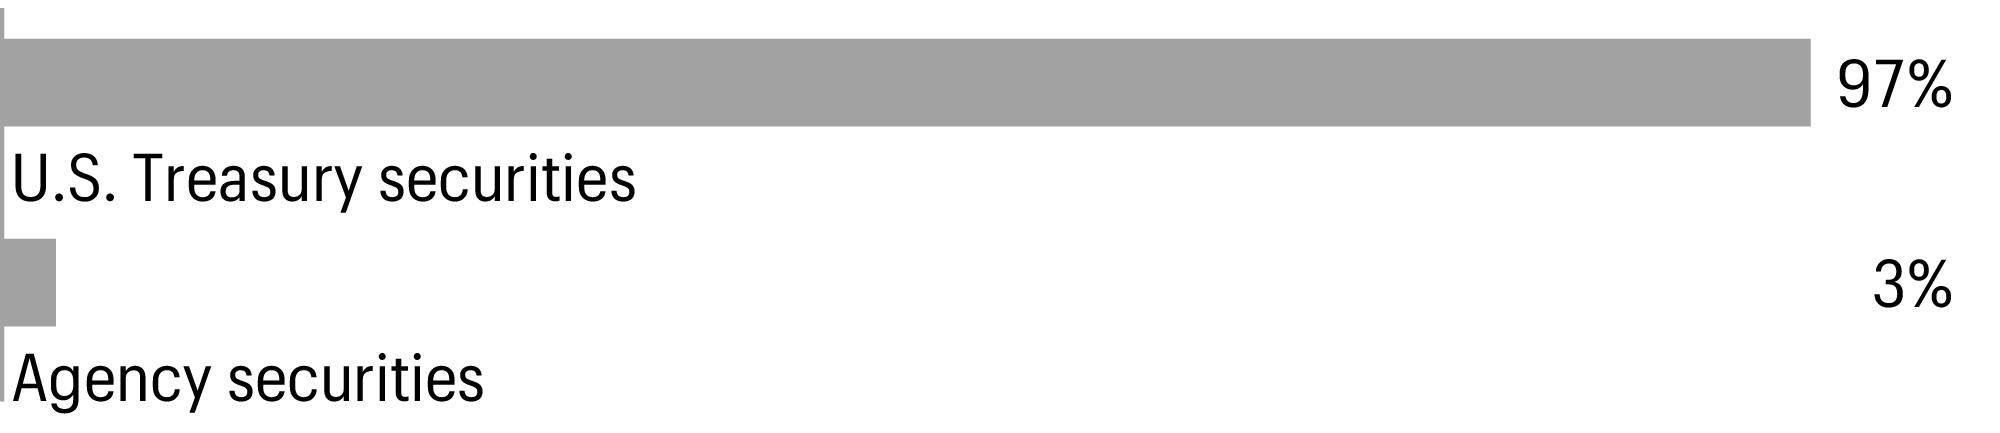
Portfolio composition as of August 31, 20231 |
| Figures represent the percentage of the Portfolio’s long-term investments. Allocations are subject to change and may have changed since the date specified. |
| The Bloomberg U.S. Aggregate ex-Corporate Index is a broad-based benchmark that includes Treasuries, government-related securities, mortgage-backed securities (agency fixed-rate and hybrid adjustable-rate mortgage pass-throughs), asset-backed securities and commercial mortgage-backed securities (agency and non-agency). You cannot invest directly in an index. |
| CFA® and Chartered Financial Analyst® are trademarks owned by CFA Institute. |
2 | Allspring Bloomberg US Aggregate Ex-Corporate Portfolio
Portfolio of investments—August 31, 2023 (unaudited)
| | | | | |
Agency securities: 38.59% | | | | | | |
| | | | | | |
| | | | | | |
| | | | | | |
| | | | | | |
| | | | | | |
| | | | | | |
| | | | | | |
| | | | | | |
| | | | | | |
| | | | | | |
| | | | | | |
| | | | | | |
| | | | | | |
| | | | | | |
| | | | | | |
| | | | | | |
| | | | | | |
| | | | | | |
| | | | | | |
| | | | | | |
| | | | | | |
| | | | | | |
| | | | | | |
| | | | | | |
| | | | | | |
| | | | | | |
| | | | | | |
| | | | | | |
| | | | | | |
| | | | | | |
| | | | | | |
| | | | | | |
| | | | | | |
FHLMC Multifamily Structured Pass-Through Certificates Series K063 Class A2±± | | | | | | |
FHLMC Multifamily Structured Pass-Through Certificates Series K070 Class A2±± | | | | | | |
FHLMC Multifamily Structured Pass-Through Certificates Series K152 Class A1 | | | | | | |
FHLMC Multifamily Structured Pass-Through Certificates Series K152 Class A2 | | | | | | |
FHLMC Multifamily Structured Pass-Through Certificates Series K153 Class A3±± | | | | | | |
FHLMC Multifamily Structured Pass-Through Certificates Series K155 Class A3 | | | | | | |
| | | | | | |
| | | | | | |
| | | | | | |
The accompanying notes are an integral part of these financial statements.
Allspring Bloomberg US Aggregate ex-Corporate Portfolio | 3
Portfolio of investments—August 31, 2023 (unaudited)
| | | | | |
Agency securities (continued) | | | | | | |
| | | | | | |
| | | | | | |
| | | | | | |
| | | | | | |
| | | | | | |
| | | | | | |
| | | | | | |
| | | | | | |
| | | | | | |
| | | | | | |
| | | | | | |
| | | | | | |
| | | | | | |
| | | | | | |
| | | | | | |
| | | | | | |
| | | | | | |
| | | | | | |
| | | | | | |
| | | | | | |
| | | | | | |
| | | | | | |
| | | | | | |
| | | | | | |
| | | | | | |
| | | | | | |
| | | | | | |
| | | | | | |
| | | | | | |
| | | | | | |
| | | | | | |
| | | | | | |
| | | | | | |
| | | | | | |
| | | | | | |
| | | | | | |
| | | | | | |
| | | | | | |
| | | | | | |
| | | | | | |
| | | | | | |
| | | | | | |
| | | | | | |
| | | | | | |
| | | | | | |
FNMA Series 2016-M5 Class A2 | | | | | | |
FNMA Series 2016-M7 Class A2 | | | | | | |
FNMA Series 2017-M1 Class A2±± | | | | | | |
The accompanying notes are an integral part of these financial statements.
4 | Allspring Bloomberg US Aggregate ex-Corporate Portfolio
Portfolio of investments—August 31, 2023 (unaudited)
| | | | | |
Agency securities (continued) | | | | | | |
FNMA Series 2017-M11 Class A2 | | | | | | |
FNMA Series 2017-M5 Class A2±± | | | | | | |
FNMA Series 2018-M1 Class A2±± | | | | | | |
FNMA Series 2018-M13 Class A2±± | | | | | | |
FNMA Series 2019-M4 Class A2 | | | | | | |
FNMA Series 2019-M7 Class A2 | | | | | | |
| | | | | | |
| | | | | | |
| | | | | | |
| | | | | | |
| | | | | | |
| | | | | | |
| | | | | | |
| | | | | | |
| | | | | | |
| | | | | | |
| | | | | | |
| | | | | | |
| | | | | | |
| | | | | | |
| | | | | | |
| | | | | | |
| | | | | | |
| | | | | | |
| | | | | | |
| | | | | | |
| | | | | | |
| | | | | | |
| | | | | | |
| | | | | | |
Total agency securities (Cost $106,668,877) | | | | | | |
Asset-backed securities: 0.17% | | | | | | |
BMW Vehicle Lease Trust Series 2021-2 Class A3 | | | | | | |
Citibank Credit Card Issuance Trust Series 2018-A7 Class A7 | | | | | | |
Ford Credit Floorplan Master Owner Trust Series 2019-2 Class A | | | | | | |
T-Mobile U.S. Trust Series 2022-1A Class A144A | | | | | | |
Total asset-backed securities (Cost $452,354) | | | | | | |
Municipal obligations: 0.83% | | | | | | |
| | | | | | |
| | | | | | |
California State University Series B | | | | | | |
University of California Series AD | | | | | | |
| | | | | | |
The accompanying notes are an integral part of these financial statements.
Allspring Bloomberg US Aggregate ex-Corporate Portfolio | 5
Portfolio of investments—August 31, 2023 (unaudited)
| | | | | |
| | | | | | |
Los Angeles Community College District GO | | | | | | |
Los Angeles Unified School District GO | | | | | | |
Los Angeles Unified School District GO | | | | | | |
| | | | | | |
| | | | | | |
| | | | | | |
| | | | | | |
| | | | | | |
| | | | | | |
Regents of the University of California Medical Center Pooled Revenue Series N | | | | | | |
Transportation revenue: 0.08% | | | | | | |
Bay Area Toll Authority Series F-2 | | | | | | |
Bay Area Toll Authority Series S1 | | | | | | |
Bay Area Toll Authority Series S1 | | | | | | |
| | | | | | |
| | | | | | |
Los Angeles Department of Water & Power Power System Revenue | | | | | | |
| | | | | | |
| | | | | | |
Miscellaneous revenue: 0.02% | | | | | | |
State Board of Administration Finance Corp. Florida Hurricane Catastrophe Fund Series A | | | | | | |
| | | | | | |
| | | | | | |
Municipal Electric Authority of Georgia Series B | | | | | | |
| | | | | | |
| | | | | | |
| | | | | | |
State of Illinois Series 3 GO | | | | | | |
| | | | | | |
| | | | | | |
Chicago Transit Authority Sales & Transfer Tax Receipts Revenue Series B | | | | | | |
| | | | | | |
| | | | | | |
| | | | | | |
Kansas Development Finance Authority Department of Administration Series H | | | | | | |
The accompanying notes are an integral part of these financial statements.
6 | Allspring Bloomberg US Aggregate ex-Corporate Portfolio
Portfolio of investments—August 31, 2023 (unaudited)
| | | | | |
| | | | | | |
| | | | | | |
Commonwealth of Massachusetts GO | | | | | | |
Commonwealth of Massachusetts Series D GO | | | | | | |
| | | | | | |
| | | | | | |
| | | | | | |
| | | | | | |
Transportation revenue: 0.03% | | | | | | |
New Jersey Turnpike Authority Series A | | | | | | |
| | | | | | |
| | | | | | |
| | | | | | |
Port Authority of New York & New Jersey | | | | | | |
Port Authority of New York & New Jersey Series 201 | | | | | | |
| | | | | | |
Miscellaneous revenue: 0.07% | | | | | | |
Metropolitan Transportation Authority Dedicated Tax Fund Series C | | | | | | |
Water & sewer revenue: 0.00% | | | | | | |
New York City Municipal Water Finance Authority Water & Sewer System Series AA | | | | | | |
| | | | | | |
| | | | | | |
| | | | | | |
Ohio State University Series C | | | | | | |
| | | | | | |
| | | | | | |
State of Oregon Department of Transportation Series A | | | | | | |
| | | | | | |
Transportation revenue: 0.00% | | | | | | |
Pennsylvania Turnpike Commission Series B | | | | | | |
| | | | | | |
| | | | | | |
Dallas Fort Worth International Airport Series C | | | | | | |
| | | | | | |
Texas Transportation Commission GO | | | | | | |
The accompanying notes are an integral part of these financial statements.
Allspring Bloomberg US Aggregate ex-Corporate Portfolio | 7
Portfolio of investments—August 31, 2023 (unaudited)
| | | | | |
Transportation revenue: 0.03% | | | | | | |
Grand Parkway Transportation Corp. Series E | | | | | | |
Texas Private Activity Bond Surface Transportation Corp. NTE Mobility Partners LLC Series B | | | | | | |
| | | | | | |
| | | | | | |
| | | | | | |
| | | | | | |
State of Wisconsin Series C | | | | | | |
Total municipal obligations (Cost $2,509,053) | | | | | | |
Non-agency mortgage-backed securities: 0.70% | | | | | | |
Benchmark Mortgage Trust Series 2018-B1 Class A4 | | | | | | |
Benchmark Mortgage Trust Series 2018-B6 Class A4 | | | | | | |
CFCRE Commercial Mortgage Trust Series 2016-C7 Class A3 | | | | | | |
Citigroup Commercial Mortgage Trust Series 2015-GC27 Class A5 | | | | | | |
Citigroup Commercial Mortgage Trust Series 2016-GC36 Class B±± | | | | | | |
Citigroup Commercial Mortgage Trust Series 2016-GC36 Class C±± | | | | | | |
Citigroup Commercial Mortgage Trust Series 2016-GC37 Class B | | | | | | |
Citigroup Commercial Mortgage Trust Series 2016-P4 Class A4 | | | | | | |
COMM Mortgage Trust Series 2014-UBS5 Class C±± | | | | | | |
COMM Mortgage Trust Series 2014-UBS6 Class C±± | | | | | | |
COMM Mortgage Trust Series 2015-CR23 Class A3 | | | | | | |
COMM Mortgage Trust Series 2016-COR1 Class C±± | | | | | | |
COMM Mortgage Trust Series 2016-CR28 Class A4 | | | | | | |
GS Mortgage Securities Trust Series 2018-GS10 Class AAB±± | | | | | | |
GS Mortgage Securities Trust Series 2018-GS9 Class A4±± | | | | | | |
JPMBB Commercial Mortgage Securities Trust Series 2015-C29 Class A4 | | | | | | |
JPMBB Commercial Mortgage Securities Trust Series 2015-C31 Class A3 | | | | | | |
Morgan Stanley Bank of America Merrill Lynch Trust Series 2015-C22 Class A4 | | | | | | |
Total non-agency mortgage-backed securities (Cost $1,963,662) | | | | | | |
U.S. Treasury securities: 54.36% | | | | | | |
| | | | | | |
| | | | | | |
| | | | | | |
| | | | | | |
| | | | | | |
| | | | | | |
| | | | | | |
| | | | | | |
| | | | | | |
| | | | | | |
| | | | | | |
| | | | | | |
The accompanying notes are an integral part of these financial statements.
8 | Allspring Bloomberg US Aggregate ex-Corporate Portfolio
Portfolio of investments—August 31, 2023 (unaudited)
| | | | | |
U.S. Treasury securities (continued) | | | | | | |
| | | | | | |
| | | | | | |
| | | | | | |
| | | | | | |
| | | | | | |
| | | | | | |
| | | | | | |
| | | | | | |
| | | | | | |
| | | | | | |
| | | | | | |
| | | | | | |
| | | | | | |
| | | | | | |
| | | | | | |
| | | | | | |
| | | | | | |
| | | | | | |
| | | | | | |
| | | | | | |
| | | | | | |
| | | | | | |
| | | | | | |
| | | | | | |
| | | | | | |
| | | | | | |
| | | | | | |
| | | | | | |
| | | | | | |
| | | | | | |
| | | | | | |
| | | | | | |
| | | | | | |
| | | | | | |
| | | | | | |
| | | | | | |
| | | | | | |
| | | | | | |
| | | | | | |
| | | | | | |
| | | | | | |
| | | | | | |
| | | | | | |
| | | | | | |
| | | | | | |
| | | | | | |
| | | | | | |
| | | | | | |
The accompanying notes are an integral part of these financial statements.
Allspring Bloomberg US Aggregate ex-Corporate Portfolio | 9
Portfolio of investments—August 31, 2023 (unaudited)
| | | | | |
U.S. Treasury securities (continued) | | | | | | |
| | | | | | |
| | | | | | |
| | | | | | |
| | | | | | |
| | | | | | |
| | | | | | |
| | | | | | |
| | | | | | |
| | | | | | |
| | | | | | |
| | | | | | |
| | | | | | |
| | | | | | |
| | | | | | |
| | | | | | |
| | | | | | |
| | | | | | |
| | | | | | |
| | | | | | |
| | | | | | |
| | | | | | |
| | | | | | |
| | | | | | |
| | | | | | |
| | | | | | |
| | | | | | |
| | | | | | |
| | | | | | |
| | | | | | |
| | | | | | |
| | | | | | |
| | | | | | |
| | | | | | |
| | | | | | |
| | | | | | |
| | | | | | |
| | | | | | |
| | | | | | |
| | | | | | |
| | | | | | |
| | | | | | |
Total U.S. Treasury securities (Cost $151,098,732) | | | | | | |
Yankee corporate bonds and notes: 2.33% | | | | | | |
| | | | | | |
| | | | | | |
| | | | | | |
The accompanying notes are an integral part of these financial statements.
10 | Allspring Bloomberg US Aggregate ex-Corporate Portfolio
Portfolio of investments—August 31, 2023 (unaudited)
| | | | | |
| | | | | | |
| | | | | | |
| | | | | | |
| | | | | | |
| | | | | | |
| | | | | | |
Kreditanstalt fuer Wiederaufbau¤ | | | | | | |
Kreditanstalt fuer Wiederaufbau | | | | | | |
Kreditanstalt fuer Wiederaufbau | | | | | | |
Kreditanstalt fuer Wiederaufbau | | | | | | |
Kreditanstalt fuer Wiederaufbau | | | | | | |
Kreditanstalt fuer Wiederaufbau | | | | | | |
Kreditanstalt fuer Wiederaufbau | | | | | | |
Landwirtschaftliche Rentenbank | | | | | | |
Landwirtschaftliche Rentenbank | | | | | | |
Oesterreichische Kontrollbank AG | | | | | | |
| | | | | | |
Government securities: 1.79% | | | | | | |
| | | | | | |
| | | | | | |
| | | | | | |
| | | | | | |
| | | | | | |
| | | | | | |
| | | | | | |
| | | | | | |
| | | | | | |
| | | | | | |
| | | | | | |
Asian Infrastructure Investment Bank | | | | | | |
European Bank for Reconstruction & Development | | | | | | |
| | | | | | |
| | | | | | |
| | | | | | |
| | | | | | |
Inter-American Development Bank | | | | | | |
Inter-American Development Bank | | | | | | |
Inter-American Development Bank | | | | | | |
Inter-American Development Bank | | | | | | |
Inter-American Development Bank | | | | | | |
Inter-American Development Bank | | | | | | |
Inter-American Development Bank | | | | | | |
International Bank for Reconstruction & Development | | | | | | |
International Bank for Reconstruction & Development | | | | | | |
International Bank for Reconstruction & Development | | | | | | |
International Bank for Reconstruction & Development | | | | | | |
International Bank for Reconstruction & Development | | | | | | |
The accompanying notes are an integral part of these financial statements.
Allspring Bloomberg US Aggregate ex-Corporate Portfolio | 11
Portfolio of investments—August 31, 2023 (unaudited)
| | | | | |
Multi-national (continued) | | | | | | |
International Bank for Reconstruction & Development | | | | | | |
International Bank for Reconstruction & Development | | | | | | |
International Bank for Reconstruction & Development | | | | | | |
International Bank for Reconstruction & Development | | | | | | |
International Finance Corp. | | | | | | |
International Finance Corp. | | | | | | |
| | | | | | |
| | | | | | |
Total yankee corporate bonds and notes (Cost $6,351,866) | | | | | | |
Yankee government bonds: 2.06% | | | | | | |
| | | | | | |
| | | | | | |
| | | | | | |
Export-Import Bank of Korea | | | | | | |
| | | | | | |
| | | | | | |
| | | | | | |
| | | | | | |
| | | | | | |
Japan Bank for International Cooperation | | | | | | |
Japan Bank for International Cooperation | | | | | | |
| | | | | | |
| | | | | | |
| | | | | | |
| | | | | | |
| | | | | | |
| | | | | | |
| | | | | | |
| | | | | | |
| | | | | | |
| | | | | | |
| | | | | | |
| | | | | | |
| | | | | | |
| | | | | | |
| | | | | | |
| | | | | | |
| | | | | | |
| | | | | | |
| | | | | | |
| | | | | | |
| | | | | | |
| | | | | | |
Province of British Columbia | | | | | | |
| | | | | | |
| | | | | | |
| | | | | | |
The accompanying notes are an integral part of these financial statements.
12 | Allspring Bloomberg US Aggregate ex-Corporate Portfolio
Portfolio of investments—August 31, 2023 (unaudited)
| | | | | |
Yankee government bonds (continued) | | | | | | |
| | | | | | |
| | | | | | |
| | | | | | |
| | | | | | |
| | | | | | |
| | | | | | |
| | | | | | |
| | | | | | |
Total yankee government bonds (Cost $5,832,920) | | | | | | |
| | | | | |
Short-term investments: 2.39% | | | | | | |
Investment companies: 2.39% | | | | | | |
Allspring Government Money Market Fund Select Class♠∞## | | | | | | |
Total short-term investments (Cost $6,004,409) | | | | | | |
Total investments in securities (Cost $280,881,873) | | | | | | |
Other assets and liabilities, net | | | | | | |
| | | | | | |
| The coupon of the security is adjusted based on the principal and/or interest payments received from the underlying pool of mortgages as well as the credit quality and the actual prepayment speed of the underlying mortgages. The rate shown is the rate in effect at period end. |
| The security is purchased on a when-issued basis. |
| The security may be resold in transactions exempt from registration, normally to qualified institutional buyers, pursuant to Rule 144A under the Securities Act of 1933. |
| The security is issued in zero coupon form with no periodic interest payments. |
| The issuer of the security is an affiliated person of the Portfolio as defined in the Investment Company Act of 1940. |
| The rate represents the 7-day annualized yield at period end. |
| All or a portion of this security is segregated as collateral for when-issued securities. |
|
| Federal Farm Credit Banks |
| |
| Federal Home Loan Mortgage Corporation |
| Federal National Mortgage Association |
| Government National Mortgage Association |
| |
| Transportation Trust Fund Authority |
| Tennessee Valley Authority |
The accompanying notes are an integral part of these financial statements.
Allspring Bloomberg US Aggregate ex-Corporate Portfolio | 13
Portfolio of investments—August 31, 2023 (unaudited)
Investments in affiliates
An affiliated investment is an investment in which the Portfolio owns at least 5% of the outstanding voting shares of the issuer or as a result of other relationships, such as the Portfolio and the issuer having the same adviser or investment manager. Transactions with issuers that were affiliates of the Portfolio at the end of the period were as follows:
| | | | | Net
change in
unrealized
gains
(losses) | | | Income
from
affiliated
securities |
| | | | | | | | |
Allspring Government Money Market Fund Select Class | | | | | | | | |
The accompanying notes are an integral part of these financial statements.
14 | Allspring Bloomberg US Aggregate ex-Corporate Portfolio
Statement of assets and liabilities—August 31, 2023 (unaudited)
Financial statements
Statement of assets and liabilities
| |
Investments in unaffiliated securities, at value (cost $274,877,464) | |
Investments in affiliated securities, at value (cost $6,004,409) | |
| |
Foreign currency, at value (cost $19) | |
| |
| |
| |
Payable for when-issued transactions | |
| |
Accrued expenses and other liabilities | |
| |
| |
The accompanying notes are an integral part of these financial statements.
Allspring Bloomberg US Aggregate ex-Corporate Portfolio | 15
Statement of operations—six months ended August 31, 2023 (unaudited)
Statement of operations
| |
Interest (net of foreign withholding taxes of $442) | |
Income from affiliated securities | |
| |
| |
| |
Custody and accounting fees | |
| |
Interest holder report expenses | |
Trustees’ fees and expenses | |
| |
| |
Less: Fee waivers and/or expense reimbursements | |
| |
| |
Realized and unrealized gains (losses) on investments | |
Net realized losses on investments | |
Net change in unrealized gains (losses) on investments | |
Net realized and unrealized gains (losses) on investments | |
Net increase in net assets resulting from operations | |
The accompanying notes are an integral part of these financial statements.
16 | Allspring Bloomberg US Aggregate ex-Corporate Portfolio
Statement of changes in net assets
Statement of changes in net assets
|
Six months ended
August 31, 2023 (unaudited) | Year ended February 28, 2023 |
| | | | |
| | | | |
Net realized losses on investments | | | | |
Net change in unrealized gains (losses) on investments | | | | |
Net increase (decrease) in net assets resulting from operations | | | | |
| | | | |
Transactions in investors’ beneficial interests | | | | |
| | | | |
| | | | |
Net decrease in net assets resulting from capital transactions | | | | |
Total decrease in net assets | | | | |
| | | | |
| | | | |
| | | | |
The accompanying notes are an integral part of these financial statements.
Allspring Bloomberg US Aggregate ex-Corporate Portfolio | 17
| Six months ended
August 31, 2023
(unaudited) | |
| | | | | |
| | | | | | |
Ratios to average net assets (annualized) | | | | | | |
| | | | | | |
| | | | | | |
| | | | | | |
| | | | | | |
| | | | | | |
| Ratio includes expenses which were voluntarily waived by the adviser. Without these voluntary waivers, the net expense ratios would be increased by the following amounts: |
Six months ended August 31, 2023 (unaudited) | |
Year ended February 28, 2023 | |
Year ended February 28, 2022 | |
Year ended February 28, 2021 | |
| |
| Returns for periods of less than one year are not annualized. |
The accompanying notes are an integral part of these financial statements.
18 | Allspring Bloomberg US Aggregate ex-Corporate Portfolio
Notes to financial statements (unaudited)
Notes to financial statements
Allspring Master Trust (the “Trust”), a Delaware statutory trust organized on March 10, 1999, is an open-end management investment company registered under the Investment Company Act of 1940, as amended (the “1940 Act”). As an investment company, the Trust follows the accounting and reporting guidance in Financial Accounting Standards Board (“FASB”) Accounting Standards Codification Topic 946, Financial Services – Investment Companies. These financial statements report on the Allspring Bloomberg US Aggregate ex-Corporate Portfolio (the “Portfolio”) which is a diversified series of the Trust.
Interests in the Portfolio are available solely through private placement transactions that do not involve any “public offering” within the meaning of Section 4(a)(2) of the Securities Act of 1933.
2.
SIGNIFICANT ACCOUNTING POLICIES
The following significant accounting policies, which are consistently followed in the preparation of the financial statements of the Portfolio, are in conformity with U.S. generally accepted accounting principles which require management to make estimates and assumptions that affect the reported amounts of assets and liabilities, disclosure of contingent assets and liabilities at the date of the financial statements, and the reported amounts of income and expenses during the reporting period. Actual results could differ from those estimates.
Securities valuation
All investments are valued each business day as of the close of regular trading on the New York Stock Exchange (generally 4 p.m. Eastern Time), although the Portfolio may deviate from this calculation time under unusual or unexpected circumstances.
Debt securities are valued at the evaluated bid price provided by an independent pricing service (e.g. taking into account various factors, including yields, maturities, or credit ratings) or, if a reliable price is not available, the quoted bid price from an independent broker-dealer.
Investments in registered open-end investment companies (other than those listed on a foreign or domestic exchange or market) are valued at net asset value.
Investments which are not valued using the methods discussed above are valued at their fair value, as determined in good faith by Allspring Funds Management, LLC (“Allspring Funds Management”), which was named the valuation designee by the Board of Trustees. As the valuation designee, Allspring Funds Management is responsible for day-to-day valuation activities for the Allspring Funds. In connection with these responsibilities, Allspring Funds Management has established a Valuation Committee and has delegated to it the authority to take any actions regarding the valuation of portfolio securities that the Valuation Committee deems necessary or appropriate, including determining the fair value of portfolio securities. On a quarterly basis, the Board of Trustees receives reports of valuation actions taken by the Valuation Committee. On at least an annual basis, the Board of Trustees receives an assessment of the adequacy and effectiveness of Allspring Funds Management’s process for determining the fair value of the portfolio of investments.
When-issued transactions
The Portfolio may purchase securities on a forward commitment or when-issued basis. The Portfolio records a when-issued transaction on the trade date and will segregate assets in an amount at least equal in value to the Portfolio’s commitment to purchase when-issued securities. Securities purchased on a when-issued basis are marked-to-market daily and the Portfolio begins earning interest on the settlement date. Losses may arise due to changes in the market value of the underlying securities or if the counterparty does not perform under the contract.
Security transactions and income recognition
Securities transactions are recorded on a trade date basis. Realized gains or losses are recorded on the basis of identified cost.
Interest income is accrued daily and bond discounts are accreted and premiums are amortized daily. To the extent debt obligations are placed on non-accrual status, any related interest income may be reduced by writing off interest receivables when the collection of all or a portion of interest has been determined to be doubtful based on consistently applied procedures and the fair value has decreased. If the issuer subsequently resumes interest payments or when the collectability of interest is reasonably assured, the debt obligation is removed from non-accrual status. Interest income is recorded net of foreign taxes withheld where recovery of such taxes is not assured. Paydown gains and losses are included in interest income.
Federal and other taxes
The Portfolio is not required to pay federal income taxes on its net investment income and net capital gains as it is treated as a partnership for federal income tax purposes. All income, gains and losses of the Portfolio are deemed to have been “passed through” to the interest holders in proportion to their holdings of the Portfolio regardless of whether income and gains have been distributed by the Portfolio.
The Portfolio’s income tax returns and all financial records supporting those returns for the prior three fiscal years are subject to examination by the federal revenue authority. Management has analyzed the Portfolio’s tax positions taken on federal, state, and foreign tax returns, as applicable, for all open tax years and does not believe that there are any uncertain tax positions that require recognition of a tax liability.
Allspring Bloomberg US Aggregate ex-Corporate Portfolio | 19
Notes to financial statements (unaudited)
As of August 31, 2023, the aggregate cost of all investments for federal income tax purposes was $280,852,549 and the unrealized gains (losses) consisted of:
3.
FAIR VALUATION MEASUREMENTS
Fair value measurements of investments are determined within a framework that has established a fair value hierarchy based upon the various data inputs utilized in determining the value of the Portfolio’s investments. The three-level hierarchy gives the highest priority to unadjusted quoted prices in active markets for identical assets or liabilities (Level 1) and the lowest priority to unobservable inputs (Level 3). The Portfolio’s investments are classified within the fair value hierarchy based on the lowest level of input that is significant to the fair value measurement. The inputs are summarized into three broad levels as follows:
•Level 1—quoted prices in active markets for identical securities
•Level 2—other significant observable inputs (including quoted prices for similar securities, interest rates, prepayment speeds, credit risk, etc.)
•Level 3—significant unobservable inputs (including the Portfolio’s own assumptions in determining the fair value of investments)
The inputs or methodologies used for valuing investments in securities are not necessarily an indication of the risk associated with investing in those securities.
The following is a summary of the inputs used in valuing the Portfolio’s assets and liabilities as of August 31, 2023:
| | Other significant
observable inputs
(Level 2) | Significant
unobservable inputs
(Level 3) | |
| | | | |
| | | | |
| | | | |
| | | | |
| | | | |
Non-agency mortgage-backed securities | | | | |
| | | | |
Yankee corporate bonds and notes | | | | |
| | | | |
| | | | |
| | | | |
| | | | |
Additional sector, industry or geographic detail, if any, is included in the Portfolio of Investments.
For the six months ended August 31, 2023, the Portfolio did not have any transfers into/out of Level 3.
4.
TRANSACTIONS WITH AFFILIATES
Advisory fee
The Trust has entered into an advisory contract with Allspring Funds Management, a wholly owned subsidiary of Allspring Global Investments Holdings, LLC, a holding company indirectly owned by certain private funds of GTCR LLC and Reverence Capital Partners, L.P. The adviser is responsible for implementing investment policies and guidelines and for supervising the subadviser, who is responsible for day-to-day portfolio management of the Portfolio. Pursuant to the contract, Allspring Funds Management is entitled to receive an advisory fee at the following annual rate based on the Portfolio’s average daily net assets:
For the six months ended August 31, 2023, the advisory fee was equivalent to an annual rate of 0.05% of the Portfolio’s average daily net assets.
20 | Allspring Bloomberg US Aggregate ex-Corporate Portfolio
Notes to financial statements (unaudited)
Allspring Funds Management has retained the services of a subadviser to provide daily portfolio management to the Portfolio. The fee for subadvisory services is borne by Allspring Funds Management. Allspring Global Investments, LLC, an affiliate of Allspring Funds Management and a wholly owned subsidiary of Allspring Global Investments Holdings, LLC, is the subadviser to the Portfolio and is entitled to receive a fee from Allspring Funds Management at an annual rate starting at 0.04% and declining to 0.03% as the average daily net assets of the Portfolio increase.
Allspring Funds Management has voluntarily waived and/or reimbursed advisory fees to reduce the net operating expense ratio of the Portfolio. These voluntary waivers may be discontinued at any time.
Interfund transactions
The Portfolio may purchase or sell portfolio investment securities to certain affiliates pursuant to Rule 17a-7 under the 1940 Act and under procedures adopted by the Board of Trustees. The procedures have been designed to ensure that these interfund transactions, which do not incur broker commissions, are effected at current market prices. Pursuant to these procedures, the Portfolio did not have any interfund transactions during the six months ended August 31, 2023.
5.
INVESTMENT PORTFOLIO TRANSACTIONS
Purchases and sales of investments, excluding short-term securities, for the six months ended August 31, 2023 were as follows:
The Trust, along with Allspring Variable Trust and Allspring Funds Trust (excluding the money market funds), are parties to a $350,000,000 revolving credit agreement whereby the Portfolio is permitted to use bank borrowings for temporary or emergency purposes, such as to fund interest holders withdrawal requests. Interest under the credit agreement is charged to the Portfolio based on a borrowing rate equal to the higher of the Federal Funds rate or the overnight bank funding rate in effect on that day plus a spread. In addition, an annual commitment fee based on the unused balance is allocated to each participating fund.
For the six months ended August 31, 2023, there were no borrowings by the Portfolio under the agreement.
Under the Portfolio’s organizational documents, the officers and Trustees have been granted certain indemnification rights against certain liabilities that may arise out of performance of their duties to the Portfolio. The Portfolio has entered into a separate agreement with each Trustee that converts indemnification rights currently existing under the Portfolio’s organizational documents into contractual rights that cannot be changed in the future without the consent of the Trustee. Additionally, in the normal course of business, the Portfolio may enter into contracts with service providers that contain a variety of indemnification clauses. The Portfolio’s maximum exposure under these arrangements is dependent on future claims that may be made against the Portfolio and, therefore, cannot be estimated.
Allspring Bloomberg US Aggregate ex-Corporate Portfolio | 21
Other information (unaudited)
Other information
Proxy voting information
A description of the policies and procedures used to determine how to vote proxies relating to portfolio securities is available without charge, upon request, by calling 1-866-259-3305, visiting our website at allspringglobal.com, or visiting the SEC website at sec.gov. Information regarding how the proxies related to portfolio securities were voted during the most recent 12-month period ended June 30 is available on the website at allspringglobal.com or by visiting the SEC website at sec.gov.
Quarterly portfolio holdings information
The Portfolio files its complete schedule of portfolio holdings with the SEC for the first and third quarters of each fiscal year as an exhibit to its reports on Form N-PORT. Interest holders may view the filed Form N-PORT by visiting the SEC website at sec.gov.
22 | Allspring Bloomberg US Aggregate ex-Corporate Portfolio
Other information (unaudited)
Board of trustees and officers
Each of the Trustees and Officers listed in the table below acts in identical capacities for each fund in the Allspring family of funds, which consists of 126 mutual funds comprising the Allspring Funds Trust, Allspring Variable Trust, Allspring Master Trust and four closed-end funds (collectively the “Fund Complex”). This table should be read in conjunction with the Prospectus and the Statement of Additional Information1. The mailing address of each Trustee and Officer is 1415 Vantage Park Drive, 3rd Floor, Charlotte, NC 28203. Each Trustee and Officer serves an indefinite term, however, each Trustee serves such term until reaching the mandatory retirement age established by the Trustees.
Independent Trustees
| | Principal occupations during past five years or longer | Current other
public company or
investment
company
directorships |
William R. Ebsworth
(Born 1957) | | Retired. From 1984 to 2013, equities analyst, portfolio manager, research director and chief investment officer at Fidelity Management and Research Company in Boston, Tokyo, and Hong Kong, and retired in 2013 as Chief Investment Officer of Fidelity Strategic Advisers, Inc. where he led a team of investment professionals managing client assets. Prior thereto, Board member of Hong Kong Securities Clearing Co., Hong Kong Options Clearing Corp., the Thailand International Fund, Ltd., Fidelity Investments Life Insurance Company, and Empire Fidelity Investments Life Insurance Company. Audit Committee Chair and Investment Committee Chair of the Vincent Memorial Hospital Foundation (non-profit organization). Mr. Ebsworth is a CFA charterholder. | |
Jane A. Freeman
(Born 1953) | Trustee,
since 2015;
Chair Liaison,
since 2018 | Retired. From 2012 to 2014 and 1999 to 2008, Chief Financial Officer of Scientific Learning Corporation. From 2008 to 2012, Ms. Freeman provided consulting services related to strategic business projects. Prior to 1999, Portfolio Manager at Rockefeller & Co. and Scudder, Stevens & Clark. Board member of the Harding Loevner Funds from 1996 to 2014, serving as both Lead Independent Director and chair of the Audit Committee. Board member of the Russell Exchange Traded Funds Trust from 2011 to 2012 and the chair of the Audit Committee. Ms. Freeman is also an inactive Chartered Financial Analyst. | |
Isaiah Harris, Jr.
(Born 1952) | Trustee,
since 2009;
Audit Committee Chair,
since 2019 | Retired. Member of the Advisory Board of CEF of East Central Florida. Chairman of the Board of CIGNA Corporation from 2009 to 2021, and Director from 2005 to 2008. From 2003 to 2011, Director of Deluxe Corporation. Prior thereto, President and CEO of BellSouth Advertising and Publishing Corp. from 2005 to 2007, President and CEO of BellSouth Enterprises from 2004 to 2005 and President of BellSouth Consumer Services from 2000 to 2003. Emeritus member of the Iowa State University Foundation Board of Governors. Emeritus Member of the Advisory board of Iowa State University School of Business. Advisory Board Member, Palm Harbor Academy (private school). Advisory Board Member, Fellowship of Christian Athletes. Mr. Harris is a certified public accountant (inactive status). | |
David F. Larcker
(Born 1950) | | Distinguished Visiting Fellow at the Hoover Institution since 2022. James Irvin Miller Professor of Accounting at the Graduate School of Business (Emeritus), Stanford University, Director of the Corporate Governance Research Initiative and Senior Faculty of The Rock Center for Corporate Governance since 2006. From 2005 to 2008, Professor of Accounting at the Graduate School of Business, Stanford University. Prior thereto, Ernst & Young Professor of Accounting at The Wharton School, University of Pennsylvania from 1985 to 2005. | |
Olivia S. Mitchell
(Born 1953) | Trustee,
since 2006;
Nominating and Governance Committee Chair,
since 2018 | International Foundation of Employee Benefit Plans Professor since 1993, Wharton School of the University of Pennsylvania. Director of Wharton’s Pension Research Council and Boettner Center on Pensions & Retirement Research, and Research Associate at the National Bureau of Economic Research. Previously taught at Cornell University from 1978 to 1993. | |
Timothy J. Penny
(Born 1951) | Trustee,
since 1996;
Chair,
since 2018 | President and Chief Executive Officer of Southern Minnesota Initiative Foundation, a non-profit organization, since 2007. Vice Chair of the Economic Club of Minnesota, since 2007. Co-Chair of the Committee for a Responsible Federal Budget, since 1995. Member of the Board of Trustees of NorthStar Education Finance, Inc., a non-profit organization, from 2007-2022. Senior Fellow of the University of Minnesota Humphrey Institute from 1995 to 2017. | |
1
The Statement of Additional Information includes additional information about the Trustees and is available, without charge, upon request, by calling 1-800-222-8222 or by visiting the website at allspringglobal.com.
Allspring Bloomberg US Aggregate ex-Corporate Portfolio | 23
Other information (unaudited)
| Position held and length of service* | Principal occupations during past five years or longer | Current other public company or investment company directorships |
James G. Polisson
(Born 1959) | | Retired. Chief Marketing Officer, Source (ETF) UK Services, Ltd, from 2015 to 2017. From 2012 to 2015, Principal of The Polisson Group, LLC, a management consulting, corporate advisory and principal investing company. Chief Executive Officer and Managing Director at Russell Investments, Global Exchange Traded Funds from 2010 to 2012. Managing Director of Barclays Global Investors from 1998 to 2010 and Global Chief Marketing Officer for iShares and Barclays Global Investors from 2000 to 2010. Trustee of the San Francisco Mechanics’ Institute, a non- profit organization, from 2013 to 2015. Board member of the Russell Exchange Traded Fund Trust from 2011 to 2012. Director of Barclays Global Investors Holdings Deutschland GmbH from 2006 to 2009. Mr. Polisson is an attorney and has a retired status with the Massachusetts and District of Columbia Bar Associations. | |
Pamela Wheelock
(Born 1959) | Trustee,
since January 2020;
previously Trustee from
January 2018 to
July 2019 | Retired. Executive and Senior Financial leadership positions in the public, private and nonprofit sectors. Interim President and CEO, McKnight Foundation, 2020. Interim Commissioner, Minnesota Department of Human Services, 2019. Chief Operating Officer, Twin Cities Habitat for Humanity, 2017-2019. Vice President for University Services, University of Minnesota, 2012- 2016. Interim President and CEO, Blue Cross and Blue Shield of Minnesota, 2011-2012. Executive Vice-President and Chief Financial Officer, Minnesota Wild, 2002-2008. Commissioner, Minnesota Department of Finance, 1999-2002. Chair of the Board of Directors of Destination Medical Center Corporation. Board member of the Minnesota Wild Foundation. | |
| Length of service dates reflect the Trustee’s commencement of service with the Trust’s predecessor entities, where applicable. |
24 | Allspring Bloomberg US Aggregate ex-Corporate Portfolio
Other information (unaudited)
Officers1
| Position held and
length of service | Principal occupations during past five years or longer |
| | President and Chief Executive Officer of Allspring Funds Management, LLC since 2017 and Head of Global Fund Governance of Allspring Global Investments since 2022. Prior thereto, co-president of Galliard Capital Management, LLC, an affiliate of Allspring Funds Management, LLC, from 2019 to 2022 and Head of Affiliated Managers, Allspring Global Investments, from 2014 to 2019 and Executive Vice President responsible for marketing, investments and product development for Allspring Funds Management, LLC, from 2009 to 2014. |
Jeremy DePalma
(Born 1974) | Treasurer,
since 2012
(for certain funds in
the Fund Complex);
since 2021 (for
the remaining funds in the Complex) | Senior Vice President of Allspring Funds Management, LLC since 2009. Senior Vice President of Evergreen Investment Management Company, LLC from 2008 to 2010 and head of the Fund Reporting and Control Team within Fund Administration from 2005 to 2010. |
Christopher Baker
(Born 1976) | Chief Compliance Officer,
since 2022 | Global Chief Compliance Officer for Allspring Global Investments since 2022. Prior thereto, Chief Compliance Officer for State Street Global Advisors from 2018 to 2021. Senior Compliance Officer for the State Street divisions of Alternative Investment Solutions, Sector Solutions, and Global Marketing from 2015 to 2018. From 2010 to 2015 Vice President, Global Head of Investment and Marketing Compliance for State Street Global Advisors. |
Matthew Prasse
(Born 1983) | Chief Legal Officer,
since 2022;
Secretary,
since 2021 | Senior Counsel of the Allspring Legal Department since 2021. Senior Counsel of the Wells Fargo Legal Department from 2018 to 2021. Previously, Counsel for Barings LLC from 2015 to 2018. Prior to joining Barings, Associate at Morgan, Lewis & Bockius LLP from 2008 to 2015. |
1 For those Officers with tenures at Allspring Global Investments and/or Allspring Funds Management, LLC that began prior to 2021, such tenures include years of service during which these businesses/entities were known as Wells Fargo Asset Management and Wells Fargo Funds Management, LLC, respectively.
Allspring Bloomberg US Aggregate ex-Corporate Portfolio | 25
Other information (unaudited)
Board consideration of investment advisory and sub-advisory agreements:
Allspring Bloomberg US Aggregate ex-Corporate Portfolio, Allspring Emerging Markets Bond Portfolio, Allspring Factor Enhanced Emerging Markets Equity Portfolio, Allspring Factor Enhanced International Equity Portfolio, Allspring Factor Enhanced U.S. Large Cap Equity Portfolio, Allspring Factor Enhanced U.S. Small Cap Equity Portfolio, Allspring High Yield Corporate Bond Portfolio, Allspring Investment Grade Corporate Bond Portfolio, Allspring Strategic Retirement Bond Portfolio, and Allspring U.S. REIT Portfolio
Under the Investment Company Act of 1940 (the “1940 Act”), the Board of Trustees (the “Board”) of Allspring Master Trust (the “Trust”) must determine annually whether to approve the continuation of the Trust’s investment advisory and sub-advisory agreements. In this regard, at a meeting held on May 15-17, 2023 (the “Meeting”), the Board, all the members of which have no direct or indirect interest in the investment advisory and sub-advisory agreements and are not “interested persons” of the Trust, as defined in the 1940 Act (the “Independent Trustees”), reviewed and approved for each of the portfolios of the Trust identified in the table below (individually, a “Portfolio” and collectively, the “Portfolios”): (i) an investment advisory agreement (the “Advisory Agreement”) with Allspring Funds Management, LLC (“Allspring Funds Management”); and (ii) an investment sub-advisory agreement (each, a “Sub-Advisory Agreement” and collectively, the “Sub-Advisory Agreements”) with the Sub-Advisers(s) identified in the table below (each, a “Sub-Adviser” and collectively, the “Sub-Advisers”) for the corresponding Portfolio identified. The Advisory Agreement and the Sub-Advisory Agreements are collectively referred to as the “Advisory Agreements.”
| |
Allspring Bloomberg Barclays US Aggregate ex-Corporate Portfolio | Allspring Global Investments, LLC |
Allspring Emerging Markets Bond Portfolio | Allspring Global Investments, LLC, Allspring Global Investments (UK) Limited |
Allspring Factor Enhanced Emerging Markets Equity Portfolio | Allspring Global Investments, LLC |
Allspring Factor Enhanced International Equity Portfolio | Allspring Global Investments, LLC |
Allspring Factor Enhanced U.S. Large Cap Equity Portfolio | Allspring Global Investments, LLC |
Allspring Factor Enhanced U.S. Small Cap Equity Portfolio | Allspring Global Investments, LLC |
Allspring High Yield Corporate Bond Portfolio | Allspring Global Investments, LLC |
Allspring Investment Grade Corporate Bond Portfolio | Allspring Global Investments, LLC |
Allspring Strategic Retirement Bond Portfolio | Allspring Global Investments, LLC |
Allspring U.S. REIT Portfolio | Allspring Global Investments, LLC |
At the Meeting, the Board considered the factors and reached the conclusions described below relating to the selection of Allspring Funds Management and the Sub-Advisers and the approval of the Advisory Agreements. Prior to the Meeting, including at a Board meeting held in April 2023, the Trustees conferred extensively among themselves and with representatives of Allspring Funds Management about these matters. The Board has adopted a team-based approach, with each team consisting of a sub-set of Trustees, to assist the full Board in the discharge of its duties in reviewing investment performance and other matters throughout the year. The Independent Trustees were assisted in their evaluation of the Advisory Agreements by independent legal counsel, from whom they received separate legal advice and with whom they met separately.
The Board noted that it initially approved the Advisory Agreements at a Board meeting held in May 2021, each for a two-year term, in advance of the sale of Wells Fargo Asset Management to Allspring Global Investments Holdings, LLC,1 a holding company indirectly owned by certain private funds of GTCR LLC and Reverence Capital Partners, L.P. (the “Transaction”). The Trustees also noted that, while they did not specifically consider the continuation of the Advisory Agreements in 2022 as a result of the two-year term that was approved in 2021, the Trustees received and considered certain information at a Board meeting held in April 2022 that was applicable to the Advisory Agreements, including an overview and financial review of the Allspring Global Investments business, information regarding certain ancillary agreements that were approved by the Board at the April 2022 Board meeting, and comparative data regarding Fund fees and expenses.
In providing information to the Board, Allspring Funds Management and the Sub-Advisers were guided by a detailed set of requests for information submitted to them by independent legal counsel on behalf of the Independent Trustees at the start of the Board’s annual contract renewal process earlier in 2023. In considering and approving the Advisory Agreements, the Trustees considered the information they believed relevant, including but not limited to the information discussed below. The Board considered not only the specific information presented in connection with the Meeting, but also the knowledge gained over time through interaction with Allspring Funds Management and the Sub-Advisers about various topics. In this regard, the Board reviewed reports of Allspring Funds Management at each of its quarterly meetings, which included, among other things, portfolio reviews and investment performance reports. In addition, the Board and the teams mentioned above confer with portfolio managers at various times throughout the year. The Board did not identify any particular information or consideration that was all-important or controlling, and each individual Trustee may have attributed different weights to various factors.
1
The trade name for the asset management firm that includes Allspring Funds Management and the Sub-Adviser is “Allspring Global Investments.”
26 | Allspring Bloomberg US Aggregate ex-Corporate Portfolio
Other information (unaudited)
After its deliberations, the Board unanimously determined that the compensation or the absence of compensation payable to Allspring Funds Management and each of the Sub-Advisers under each of the Advisory Agreements was reasonable, and approved the continuation of the Advisory Agreements for a one-year term. The Board considered the approval of the Advisory Agreements for the Portfolios as part of its consideration of agreements for funds across the complex, but its approvals were made on a fund-by-fund basis. The following summarizes a number of important, but not necessarily all, factors considered by the Board in support of its approvals.
Nature, extent and quality of services
The Board received and considered various information regarding the nature, extent, and quality of services provided to the Portfolios by Allspring Funds Management and the Sub-Advisers under the Advisory Agreements. This information included a description of the investment advisory services and Portfolio-level administrative services covered by the Advisory Agreement, as well as, among other things, a summary of the background and experience of senior management of Allspring Global Investments, of which Allspring Funds Management and the Sub-Advisers are a part, and a summary of investments made in the Allspring Global Investments business. The Board also considered information about retention arrangements with respect to key personnel of Allspring Global Investments that were put in place in connection with the Transaction. The Board took into account information about the services that continue to be provided by Wells Fargo & Co. and/or its affiliates (“Wells Fargo”) since the Transaction under a transition services agreement and the anticipated timeline for exiting the transition services agreement. In addition, the Board received and considered information about the full range of services provided to the Fund by Allspring Funds Management and its affiliates.
The Board considered the qualifications, background, tenure, and responsibilities of each of the portfolio managers primarily responsible for the day-to-day portfolio management of the Portfolios. The Board evaluated the ability of Allspring Funds Management and the Sub-Advisers to attract and retain qualified investment professionals, including research, advisory, and supervisory personnel.
The Board further considered the compliance programs and compliance records of Allspring Funds Management and the Sub-Advisers. The Board received and considered information about Allspring Global Investments’ risk management functions, which included information about Allspring Funds Management’s and the Sub-Advisers’ business continuity plans, their approaches to data privacy and cybersecurity, and Allspring Funds Management’s role as administrator of the Portfolios’ liquidity risk management program, and the derivatives risk management program for Allspring Bloomberg Barclays US Aggregate ex-Corporate Portfolio and Allspring Factor Enhanced U.S. Large Cap Equity Portfolio. The Board also received and considered information about Allspring Funds Management’s intermediary and vendor oversight program.
Portfolio investment performance and expenses
The Board considered the investment performance results for each of the Portfolios over various time periods ended December 31, 2022. The Board considered these results in comparison to the investment performance of funds in a universe that was determined by Broadridge Inc. (“Broadridge”) to be similar to each respective Portfolios (each, a “Universe”), and in comparison to each Portfolios’ benchmark index and to other comparative data. Broadridge is an independent provider of investment company data. The Board received a description of the methodology used by Broadridge to select the mutual funds in the performance Universe. The Board noted the short performance history of the Portfolios.
With respect to the investment performance of each Portfolio relative to its respective Universe, the Board noted the following: (i) the investment performance of Allspring Bloomberg US Aggregate ex-Corporate Portfolio was higher than the average investment performance of the Universe for all periods under review; the investment performance of Allspring Bloomberg US Aggregate ex-Corporate Portfolio was higher than the investment performance of its benchmark index, the Bloomberg U.S. Aggregate ex Corporate Index, for the one-year period and was in range of the investment performance of its benchmark index for the three- and five-year periods under review; (ii) the investment performance of Allspring Emerging Markets Bond Portfolio was lower than the average investment performance of the Universe for the one- and three-year periods and was in range of the average investment performance of the Universe for the five-year period; the investment performance of Allspring Emerging Markets Bond Portfolio was higher than the investment performance of its benchmark index, the J.P. Morgan EM Bond Global Diversified Index, for the one-year period and was in range of the investment performance of its benchmark index for the three- and five-year periods under review; (iii) the investment performance of Allspring Factor Enhanced Emerging Markets Equity Portfolio was higher than the average investment performance of the Universe for the one-year period and was lower than the average investment performance of the Universe for the three- and five-year periods; the investment performance of Allspring Factor Enhanced Emerging Markets Equity Portfolio was higher than the investment performance of its benchmark index, the MSCI Emerging Markets Index (Net), for the one-year period and was lower than the investment performance of its benchmark index for the three- and five-year periods under review; (iv) the investment performance of Allspring Factor Enhanced International Equity Portfolio was higher than the average investment performance of the Universe for all periods under review; the investment performance of Allspring Factor Enhanced International Equity Portfolio was higher than the investment performance of its benchmark index, the MSCI World ex US Index (Net), for all periods under review; (v) the investment performance of Allspring Factor Enhanced U.S. Large Cap Equity Portfolio was higher than the average investment performance of the Universe for the one- and five-year periods and was lower than the average investment performance of the Universe for the three-year period; the investment performance of Allspring Factor Enhanced U.S. Large Cap Equity Portfolio was higher than the investment performance of its benchmark index, the Russell 1000® Index, for the one-year period and was lower than the investment performance of its benchmark index for the three- and five-year periods under review; (vi) the investment performance of Allspring Factor Enhanced U.S. Small Cap Equity Portfolio was lower than the average investment performance of the Universe for all periods under review; the investment performance of Allspring Factor Enhanced U.S. Small Cap Equity Portfolio was higher than the
Allspring Bloomberg US Aggregate ex-Corporate Portfolio | 27
Other information (unaudited)
investment performance of its benchmark index, the Russell 2000® Index, for the one-year period and was lower than the investment performance of its benchmark index for the three- and five-year periods under review; (vii) the investment performance of Allspring High Yield Corporate Bond Portfolio was lower than the average investment performance of the Universe for all periods under review; the investment performance of Allspring High Yield Corporate Bond Portfolio was in range of the investment performance of its benchmark index, the Bloomberg U.S. Corporate High Yield 2% Issuer Capped, for the one-year period and was lower than the investment performance of its benchmark index for the three- and five-year periods under review; (viii) the investment performance of Allspring Investment Grade Corporate Bond Portfolio was higher than the average investment performance of the Universe for the one- and five-year periods and in rage of the average investment performance of the Universe for the three-year period; the investment performance of Allspring Investment Grade Corporate Bond Portfolio was higher than the investment performance of its benchmark index, the Bloomberg U.S. Corporate Bond Index, for the one-year period and was in range of the investment performance of its benchmark index for the three- and five-year periods under review; (ix) the investment performance of Allspring Strategic Retirement Bond Portfolio was higher than the average investment performance of the Universe for all periods under review; the investment performance of Allspring Strategic Retirement Bond Portfolio was higher than the investment performance of its benchmark index, the Strategic Retirement Blended Index, for the one- and three-year periods and was in range of the investment performance of its benchmark index for the five-year period; (x) the investment performance of Allspring U.S. REIT Portfolio was lower than the average investment performance of the Universe for the one-year period and was in range of the average investment performance of the Universe for the three- and five-year periods; the investment performance of Allspring U.S. REIT Portfolio was higher than the investment performance of its benchmark index, the Dow Jones U.S. Select REIT Index, for all periods under review.
The Board received information concerning, and discussed factors contributing to, the underperformance of each of Allspring Emerging Markets Bond Portfolio, Allspring Factor Enhanced Emerging Markets Equity Portfolio, Allspring Factor Enhanced U.S. Large Cap Equity Portfolio, Allspring Factor Enhanced U.S. Small Cap Equity Portfolio and Allspring High Yield Corporate Bond Portfolio relative to such Portfolio’s Universe and benchmark index for the periods identified above. The Board took note of the explanations for the relative underperformance during these periods, including with respect to investment decisions and market factors that affected each Portfolio’s investment performance.
The Board also received and considered information regarding the fee rates that are payable to Allspring Funds Management for investment advisory services (as discussed below), which are the only fees charged to the Portfolios, relative to corresponding class-specific expense groups that were determined by Broadridge to be similar to the Portfolios (the “Groups”). The Board received a description of the methodology used by Broadridge to select the mutual funds in the expense Groups and an explanation of how funds comprising expense groups and their expense ratios may vary from year-to-year.
The Board took into account the Portfolios’ investment performance and expense information provided to it among the factors considered in deciding to re-approve the Advisory Agreements.
Investment advisory and sub-advisory fee rates
The Board reviewed and considered the contractual fee rates payable by the Portfolios to Allspring Funds Management under the Advisory Agreement. The Board also reviewed and considered the contractual investment sub-advisory fee rates that are payable by Allspring Funds Management to the Sub-Advisers for investment sub-advisory services.
Among other information reviewed by the Board was a comparison of the Portfolios’ Advisory Rates with the average contractual investment advisory fee rates of funds in the expense Groups at a common asset level as well as transfer agency costs of the Portfolios in the expense Groups. The Board noted that the Advisory Rates of the Portfolios were lower than or in range of the mean rates for the Portfolios’ expense Groups.
The Board also received and considered information about the portions of the total advisory fees that were retained by Allspring Funds Management after payment of the fees to the Sub-Advisers for sub-advisory services. In assessing the reasonableness of these amounts, the Board received and evaluated information about the nature and extent of responsibilities retained and risks assumed by Allspring Funds Management and not delegated to or assumed by the Sub-Advisers, and about Allspring Funds Management’s on-going oversight services. Given the affiliation between Allspring Funds Management and the Sub-Advisers, the Board ascribed limited relevance to the allocation of fees between them.
For all Portfolios, except Allspring Factor Enhanced U.S. Small Cap Equity Portfolio, Allspring Factor Enhanced International Equity Portfolio, Allspring Factor Enhanced Emerging Markets Equity Portfolio, Allspring U.S. REIT Portfolio, Allspring Investment Grade Corporate Bond Portfolio, and Allspring Strategic Retirement Bond Portfolio, the Board also received and considered information about the nature and extent of services offered and fee rates charged by Allspring Funds Management and the Sub-Advisers to other types of clients with investment strategies similar to those of certain Portfolios. In this regard, the Board received information about the significantly greater scope of services, and compliance, reporting and other legal burdens and risks of managing proprietary mutual funds compared with those associated with managing assets of other types of clients, including third-party sub-advised fund clients and non-mutual fund clients such as institutional separate accounts.
Based on its consideration of the factors and information it deemed relevant, including those described here, the Board determined that the compensation payable to Allspring Funds Management under the Advisory Agreement and to the Sub-Advisers under the Sub-Advisory Agreements was reasonable.
28 | Allspring Bloomberg US Aggregate ex-Corporate Portfolio
Other information (unaudited)
Profitability
The Board received and considered information concerning the profitability of Allspring Funds Management, as well as the profitability of Allspring Global Investments, from providing services to the fund complex as a whole. The Board noted that the Sub-Adviser’s profitability information with respect to providing services to the Portfolios and other funds in the complex was subsumed in the Allspring Global Investments profitability analysis.
Allspring Funds Management reported on the methodologies and estimates used in calculating profitability, including a description of the methodology used to allocate certain expenses and differences in how Allspring Global Investments calculates its pre-tax profit metric versus the methodology used when Allspring Funds Management was part of Wells Fargo. It was noted that the impact of such differences had only minor impact on the financial results presented. Among other things, the Board noted that the levels of profitability reported on a fund-by-fund basis varied widely, depending on factors such as the size, type, and age of fund.
Based on its review, the Board did not deem the profits reported by Allspring Funds Management or Allspring Global Investments from services provided to the Portfolios to be at a level that would prevent it from approving the continuation of the Advisory Agreements.
Economies of scale
The Board received and considered information about the potential for Allspring Funds Management to experience economies of scale in the provision of management services to the Portfolios, the difficulties of calculating economies of scale at an individual fund level, and the extent to which potential scale benefits are shared with Portfolio shareholders. The Board noted the existence of breakpoints in the Portfolios’ advisory fee structure, which operate generally to reduce the Portfolios’ expense ratios as the Portfolios grow in size, and the size of the Portfolios in relation to such breakpoints. The Board considered that in addition to advisory fee breakpoints, Allspring Funds Management shares potential economies of scale from its management business in a variety of ways, including through fee waiver and expense reimbursement arrangements, competitive advisory fee rates set at the outset without regard to breakpoints, and investments in the business intended to enhance services available to shareholders.
The Board concluded that Allspring Funds Management’s arrangements with respect to the Portfolios, including contractual breakpoints, constituted a reasonable approach to sharing potential economies of scale with the Portfolios and their shareholders.
Other benefits to Allspring Funds Management and the Sub-Advisers
The Board received and considered information regarding potential “fall-out” or ancillary benefits received by Allspring Funds Management and its affiliates, including the Sub-Advisers, as a result of their relationships with the Portfolios. Ancillary benefits could include, among others, benefits directly attributable to other relationships with the Portfolios and benefits potentially derived from an increase in Allspring Funds Management’s and the Sub-Advisers’ businesses as a result of their relationships with the Portfolios. The Board noted that Allspring Funds Distributor, LLC, an affiliate of Allspring Funds Management, receives distribution-related fees in respect of shares sold or held through it.
The Board also reviewed information about soft dollar credits earned and utilized by the Sub-Advisers and fees earned in the past by Allspring Funds Management and the Sub-Advisers from managing a private investment vehicle for the fund complex’s securities lending collateral.
Based on its consideration of the factors and information it deemed relevant, including those described here, the Board did not find that any ancillary benefits received by Allspring Funds Management and its affiliates, including the Sub-Advisers, were unreasonable.
Conclusion
At the Meeting, after considering the above-described factors and based on its deliberations and its evaluation of the information described above, the Board unanimously determined that the compensation payable to Allspring Funds Management and the Sub-Advisers under each of the Advisory Agreements was reasonable, and approved the continuation of the Advisory Agreements for a one-year term.
Allspring Bloomberg US Aggregate ex-Corporate Portfolio | 29
Other information (unaudited)
Liquidity risk management program
In accordance with Rule 22e-4 under the Investment Company Act of 1940, as amended (the “Liquidity Rule”), Allspring Master Trust (the “Trust”) has adopted and implemented a liquidity risk management program (the “Program”) on behalf of each of its series, including the Portfolio, which is reasonably designed to assess and manage the Portfolio’s liquidity risk. “Liquidity risk” is defined under the Liquidity Rule as the risk that the Portfolio is unable to meet redemption requests without significantly diluting remaining investors’ interests in the Portfolio. The Trust’s Board of Trustees (the “Board”) previously approved the designation of Allspring Funds Management, LLC (“Allspring Funds Management”), the Portfolio’s investment adviser, to administer the Program, and Allspring Funds Management has established a Liquidity Risk Management Council (the “Council”) composed of personnel from multiple departments within Allspring Funds Management and its affiliates to assist Allspring Funds Management in the administration of the Program.
The Program is comprised of various components designed to support the assessment and/or management of liquidity risk, including: (1) the periodic assessment (no less frequently than annually) of certain factors that influence the Portfolio’s liquidity risk; (2) the periodic classification (no less frequently than monthly) of the Portfolio’s investments into one of four liquidity categories that reflect an estimate of their liquidity under current market conditions; (3) a 15% limit on the acquisition of “illiquid investments” (as defined under the Liquidity Rule); (4) to the extent the Portfolio does not invest primarily in “highly liquid investments” (as defined under the Liquidity Rule), the determination of a minimum percentage of the Portfolio’s assets that generally will be invested in highly liquid investments (an “HLIM”); (5) if the Portfolio has established an HLIM, the periodic review (no less frequently than annually) of the HLIM and the adoption of policies and procedures for responding to a shortfall of the Portfolio��s “highly liquid investments” below its HLIM; and (6) periodic reporting to the Board.
At a meeting of the Board held on May 16-17, 2023, the Board received and reviewed a written report (the “Report”) from Allspring Funds Management that, among other things, addressed the operation of the Program and assessed its adequacy and effectiveness for the period from January 1, 2022 through December 31, 2022 (the “Reporting Period”). The Report noted significant liquidity events impacting the Portfolios related to extended foreign market holidays as well as the difficulty of trading and settlement of most Russia-related securities due to sanctions activity. The Report noted that there were no material changes to the Program during the Reporting Period.
Allspring Funds Management determined in the Report that the Program has been implemented and operates effectively to manage each Portfolio’s, including the Portfolio’s, liquidity risk, and Allspring Funds Management continues to believe that the Program has been and continues to be adequately and effectively implemented to monitor and, as applicable, respond to the Portfolio’s liquidity developments.
There can be no assurance that the Program will achieve its objectives under all circumstances in the future.
30 | Allspring Bloomberg US Aggregate ex-Corporate Portfolio
This page is intentionally left blank.
This page is intentionally left blank.
For more information
More information about Allspring Funds is available free upon request. To obtain literature, please write, visit the Portfolio’s website, or call:
Allspring Funds
P.O. Box 219967
Kansas City, MO 64121-9967
Website: allspringglobal.com
Individual investors: 1-800-222-8222
Retail investment professionals: 1-888-877-9275
Institutional investment professionals: 1-800-260-5969
This report and the financial statements contained herein are submitted for the general information of the interest holders of the Portfolio. If this report is used for promotional purposes, distribution of the report must be accompanied or preceded by a current prospectus. Before investing, please consider the investment objectives, risks, charges, and expenses of the investment. For a current prospectus and, if available, a summary prospectus, containing this information, call 1-800-222-8222 or visit the Portfolio’s website at allspringglobal.com. Read the prospectus carefully before you invest or send money.
Allspring Global InvestmentsTM is the trade name for the asset management firms of Allspring Global Investments Holdings, LLC, a holding company indirectly owned by certain private funds of GTCR LLC and Reverence Capital Partners, L.P. These firms include but are not limited to Allspring Global Investments, LLC, and Allspring Funds Management, LLC. Certain products managed by Allspring entities are distributed by Allspring Funds Distributor, LLC (a broker-dealer and Member FINRA/SIPC).
This material is for general informational and educational purposes only and is NOT intended to provide investment advice or a recommendation of any kind - including a recommendation for any specific investment, strategy, or plan.
© 2023 Allspring Global Investments Holdings, LLC. All rights reserved.
Allspring Emerging Markets Bond Portfolio
Semi-Annual Report
August 31, 2023
Allspring Emerging Markets Bond Portfolio | 1
Performance highlights (unaudited)
Performance highlights
| The Portfolio seeks to replicate the total return of the J.P. Morgan EMBI Global Diversified Index† , before fees and expenses. |
| Allspring Funds Management, LLC |
| Allspring Global Investments (UK) Limited |
| Allspring Global Investments, LLC |
| Richard Bishop, CFA, Manjunath Boraiah, Michael Lee, Limin Xiao, CFA, Ph.D. |
Ten largest holdings (%) as of August 31, 20231 |
| |
State Grid Overseas Investment 2014 Ltd., 4.13%, 5-7-2024 | |
Dominican Republic, 5.95%, 1-25-2027 | |
| |
Petronas Capital Ltd., 4.50%, 3-18-2045 | |
Republic of South Africa, 6.25%, 3-8-2041 | |
Kazakhstan, 6.50%, 7-21-2045 | |
Bahrain, 7.00%, 10-12-2028 | |
State Oil Co. of the Azerbaijan Republic, 6.95%, 3-18-2030 | |
Philippines, 5.50%, 3-30-2026 | |
| Figures represent the percentage of the Portfolio’s net assets. Holdings are subject to change and may have changed since the date specified. |
Portfolio composition as of August 31, 20231 |
| Figures represent the percentage of the Portfolio’s long-term investments. Allocations are subject to change and may have changed since the date specified. |
| The J.P. Morgan Emerging Markets Bond Index (“EMBI”) Global Diversified Index is a composite index representing an unleveraged investment in emerging market bonds that is broadly based across the spectrum of emerging market bonds and includes reinvestment of income (to represent real assets). You cannot invest directly in an index. |
| CFA® and Chartered Financial Analyst® are trademarks owned by CFA Institute. |
2 | Allspring Emerging Markets Bond Portfolio
Portfolio of investments—August 31, 2023 (unaudited)
| | | | | |
Yankee corporate bonds and notes: 20.22% | | | | | | |
| | | | | | |
State Oil Co. of the Azerbaijan Republic (Energy, Oil & gas) | | | | | | |
| | | | | | |
Corp. Nacional del Cobre de Chile (Basic materials, Mining) | | | | | | |
| | | | | | |
State Grid Overseas Investment 2014 Ltd. (Utilities, Electric) | | | | | | |
State Grid Overseas Investment BVI Ltd. (Utilities, Electric) | | | | | | |
| | | | | | |
| | | | | | |
Pertamina Persero PT (Energy, Oil & gas) | | | | | | |
Perusahaan Perseroan Persero PT Perusahaan Listrik Negara (Utilities, Electric) | | | | | | |
| | | | | | |
| | | | | | |
Petronas Capital Ltd. (Energy, Oil & gas) | | | | | | |
Petronas Capital Ltd. (Energy, Oil & gas) | | | | | | |
| | | | | | |
| | | | | | |
Petroleos Mexicanos (Energy, Oil & gas) | | | | | | |
Petroleos Mexicanos (Energy, Oil & gas) | | | | | | |
Petroleos Mexicanos (Energy, Oil & gas) | | | | | | |
Petroleos Mexicanos (Energy, Oil & gas) | | | | | | |
Petroleos Mexicanos (Energy, Oil & gas) | | | | | | |
Petroleos Mexicanos (Energy, Oil & gas) | | | | | | |
| | | | | | |
| | | | | | |
Petroleos del Peru SA (Energy, Oil & gas) | | | | | | |
| | | | | | |
Eskom Holdings SOC Ltd. (Utilities, Electric) | | | | | | |
United Arab Emirates: 2.79% | | | | | | |
Abu Dhabi Crude Oil Pipeline LLC (Energy, Pipelines) | | | | | | |
MDGH GMTN RSC Ltd. (Financial, Investment Companies) | | | | | | |
| | | | | | |
Total yankee corporate bonds and notes (Cost $3,113,311) | | | | | | |
Yankee government bonds: 76.96% | | | | | | |
| | | | | | |
| | | | | | |
| | | | | | |
| | | | | | |
The accompanying notes are an integral part of these financial statements.
Allspring Emerging Markets Bond Portfolio | 3
Portfolio of investments—August 31, 2023 (unaudited)
| | | | | |
Yankee government bonds (continued) | | | | | | |
| | | | | | |
| | | | | | |
| | | | | | |
| | | | | | |
| | | | | | |
| | | | | | |
| | | | | | |
| | | | | | |
| | | | | | |
| | | | | | |
| | | | | | |
| | | | | | |
| | | | | | |
| | | | | | |
| | | | | | |
| | | | | | |
| | | | | | |
| | | | | | |
| | | | | | |
| | | | | | |
| | | | | | |
| | | | | | |
| | | | | | |
| | | | | | |
| | | | | | |
| | | | | | |
| | | | | | |
| | | | | | |
| | | | | | |
| | | | | | |
| | | | | | |
| | | | | | |
| | | | | | |
| | | | | | |
| | | | | | |
| | | | | | |
| | | | | | |
| | | | | | |
| | | | | | |
| | | | | | |
| | | | | | |
| | | | | | |
| | | | | | |
| | | | | | |
| | | | | | |
Perusahaan Penerbit SBSN Indonesia III | | | | | | |
| | | | | | |
| | | | | | |
The accompanying notes are an integral part of these financial statements.
4 | Allspring Emerging Markets Bond Portfolio
Portfolio of investments—August 31, 2023 (unaudited)
| | | | | |
Yankee government bonds (continued) | | | | | | |
| | | | | | |
| | | | | | |
| | | | | | |
| | | | | | |
| | | | | | |
| | | | | | |
| | | | | | |
| | | | | | |
| | | | | | |
| | | | | | |
| | | | | | |
| | | | | | |
| | | | | | |
| | | | | | |
| | | | | | |
| | | | | | |
| | | | | | |
Total yankee government bonds (Cost $12,526,585) | | | | | | |
| | | | | |
Short-term investments: 1.41% | | | | | | |
Investment companies: 1.41% | | | | | | |
Allspring Government Money Market Fund Select Class♠∞ | | | | | | |
Total short-term investments (Cost $189,241) | | | | | | |
Total investments in securities (Cost $15,829,137) | | | | | | |
Other assets and liabilities, net | | | | | | |
| | | | | | |
| The interest rate is determined and reset by the issuer periodically depending upon the terms of the security. The rate shown is the rate in effect at period end. |
| Non-income-earning security |
| The issuer of the security is an affiliated person of the Portfolio as defined in the Investment Company Act of 1940. |
| The rate represents the 7-day annualized yield at period end. |
Investments in affiliates
An affiliated investment is an investment in which the Portfolio owns at least 5% of the outstanding voting shares of the issuer or as a result of other relationships, such as the Portfolio and the issuer having the same adviser or investment manager. Transactions with issuers that were affiliates of the Portfolio at the end of the period were as follows:
| | | | | Net
change in
unrealized
gains
(losses) | | | Income
from
affiliated
securities |
| | | | | | | | |
Allspring Government Money Market Fund Select Class | | | | | | | | |
The accompanying notes are an integral part of these financial statements.
Allspring Emerging Markets Bond Portfolio | 5
Statement of assets and liabilities—August 31, 2023 (unaudited)
Financial statements
Statement of assets and liabilities
| |
Investments in unaffiliated securities, at value (cost $15,639,896) | |
Investments in affiliated securities, at value (cost $189,241) | |
| |
Foreign currency, at value (cost $8) | |
| |
| |
Prepaid expenses and other assets | |
| |
| |
Professional fees payable | |
Custody and accounting fees payable | |
Interest holder report expenses payable | |
Trustees’ fees and expenses payable | |
| |
| |
The accompanying notes are an integral part of these financial statements.
6 | Allspring Emerging Markets Bond Portfolio
Statement of operations—six months ended August 31, 2023 (unaudited)
Statement of operations
| |
| |
Income from affiliated securities | |
| |
| |
| |
Custody and accounting fees | |
| |
Interest holder report expenses | |
Trustees’ fees and expenses | |
| |
| |
Less: Fee waivers and/or expense reimbursements | |
| |
| |
Realized and unrealized gains (losses) on investments | |
Net realized losses on investments | |
Net change in unrealized gains (losses) on investments | |
Net realized and unrealized gains (losses) on investments | |
Net increase in net assets resulting from operations | |
The accompanying notes are an integral part of these financial statements.
Allspring Emerging Markets Bond Portfolio | 7
Statement of changes in net assets
Statement of changes in net assets
|
Six months ended
August 31, 2023 (unaudited) | Year ended February 28, 2023 |
| | | | |
| | | | |
Net realized losses on investments | | | | |
Net change in unrealized gains (losses) on investments | | | | |
Net increase (decrease) in net assets resulting from operations | | | | |
| | | | |
Transactions in investors’ beneficial interests | | | | |
| | | | |
| | | | |
Net decrease in net assets resulting from capital transactions | | | | |
Total decrease in net assets | | | | |
| | | | |
| | | | |
| | | | |
The accompanying notes are an integral part of these financial statements.
8 | Allspring Emerging Markets Bond Portfolio
| Six months ended
August 31, 2023
(unaudited) | |
| | | | | |
| | | | | | |
Ratios to average net assets (annualized) | | | | | | |
| | | | | | |
| | | | | | |
| | | | | | |
| | | | | | |
| | | | | | |
| Ratio includes expenses which were voluntarily waived by the adviser. Without these voluntary waivers, the net expense ratios would be increased by the following amounts: |
Six months ended August 31, 2023 (unaudited) | |
Year ended February 28, 2023 | |
Year ended February 28, 2022 | |
Year ended February 28, 2021 | |
| |
| Returns for periods of less than one year are not annualized. |
The accompanying notes are an integral part of these financial statements.
Allspring Emerging Markets Bond Portfolio | 9
Notes to financial statements (unaudited)
Notes to financial statements
Allspring Master Trust (the “Trust”), a Delaware statutory trust organized on March 10, 1999, is an open-end management investment company registered under the Investment Company Act of 1940, as amended (the “1940 Act”). As an investment company, the Trust follows the accounting and reporting guidance in Financial Accounting Standards Board (“FASB”) Accounting Standards Codification Topic 946, Financial Services – Investment Companies. These financial statements report on the Allspring Emerging Markets Bond Portfolio (the “Portfolio”) which is a diversified series of the Trust.
Interests in the Portfolio are available solely through private placement transactions that do not involve any “public offering” within the meaning of Section 4(a)(2) of the Securities Act of 1933.
2.
SIGNIFICANT ACCOUNTING POLICIES
The following significant accounting policies, which are consistently followed in the preparation of the financial statements of the Portfolio, are in conformity with U.S. generally accepted accounting principles which require management to make estimates and assumptions that affect the reported amounts of assets and liabilities, disclosure of contingent assets and liabilities at the date of the financial statements, and the reported amounts of income and expenses during the reporting period. Actual results could differ from those estimates.
Securities valuation
All investments are valued each business day as of the close of regular trading on the New York Stock Exchange (generally 4 p.m. Eastern Time), although the Portfolio may deviate from this calculation time under unusual or unexpected circumstances.
Debt securities are valued at the evaluated bid price provided by an independent pricing service (e.g. taking into account various factors, including yields, maturities, or credit ratings) or, if a reliable price is not available, the quoted bid price from an independent broker-dealer.
Investments in registered open-end investment companies (other than those listed on a foreign or domestic exchange or market) are valued at net asset value.
Investments which are not valued using the methods discussed above are valued at their fair value, as determined in good faith by Allspring Funds Management, LLC (“Allspring Funds Management”), which was named the valuation designee by the Board of Trustees. As the valuation designee, Allspring Funds Management is responsible for day-to-day valuation activities for the Allspring Funds. In connection with these responsibilities, Allspring Funds Management has established a Valuation Committee and has delegated to it the authority to take any actions regarding the valuation of portfolio securities that the Valuation Committee deems necessary or appropriate, including determining the fair value of portfolio securities. On a quarterly basis, the Board of Trustees receives reports of valuation actions taken by the Valuation Committee. On at least an annual basis, the Board of Trustees receives an assessment of the adequacy and effectiveness of Allspring Funds Management’s process for determining the fair value of the portfolio of investments.
Foreign currency translation
The accounting records of the Portfolio are maintained in U.S. dollars. The values of other assets and liabilities denominated in foreign currencies are translated into U.S. dollars at rates provided by an independent foreign currency pricing source at a time each business day specified by the Valuation Committee. Purchases and sales of securities, and income and expenses are converted at the rate of exchange on the respective dates of such transactions. Net realized foreign exchange gains or losses arise from sales of foreign currencies, currency gains or losses realized between the trade and settlement dates on securities transactions, and the difference between the amounts of dividends, interest and foreign withholding taxes recorded and the U.S. dollar equivalent of the amounts actually paid or received. Net unrealized foreign exchange gains and losses arise from changes in the fair value of assets and liabilities other than investments in securities resulting from changes in exchange rates. The changes in net assets arising from changes in exchange rates of securities and the changes in net assets resulting from changes in market prices of securities are not separately presented. Such changes are included in net realized and unrealized gains or losses from investments.
Security transactions and income recognition
Securities transactions are recorded on a trade date basis. Realized gains or losses are recorded on the basis of identified cost.
Interest income is accrued daily and bond discounts are accreted and premiums are amortized daily. To the extent debt obligations are placed on non-accrual status, any related interest income may be reduced by writing off interest receivables when the collection of all or a portion of interest has been determined to be doubtful based on consistently applied procedures and the fair value has decreased. If the issuer subsequently resumes interest payments or when the collectability of interest is reasonably assured, the debt obligation is removed from non-accrual status.
Federal and other taxes
The Portfolio is not required to pay federal income taxes on its net investment income and net capital gains as it is treated as a partnership for federal income tax purposes. All income, gains and losses of the Portfolio are deemed to have been “passed through” to the interest holders in proportion to their holdings of the Portfolio regardless of whether income and gains have been distributed by the Portfolio.
10 | Allspring Emerging Markets Bond Portfolio
Notes to financial statements (unaudited)
The Portfolio’s income and federal excise tax returns and all financial records supporting those returns for the prior three fiscal years are subject to examination by the federal and Delaware revenue authorities. Management has analyzed the Portfolio’s tax positions taken on federal, state, and foreign tax returns, as applicable, for all open tax years and does not believe that there are any uncertain tax positions that require recognition of a tax liability.
As of August 31, 2023, the aggregate cost of all investments for federal income tax purposes was $15,829,137 and the unrealized gains (losses) consisted of:
3.
FAIR VALUATION MEASUREMENTS
Fair value measurements of investments are determined within a framework that has established a fair value hierarchy based upon the various data inputs utilized in determining the value of the Portfolio’s investments. The three-level hierarchy gives the highest priority to unadjusted quoted prices in active markets for identical assets or liabilities (Level 1) and the lowest priority to unobservable inputs (Level 3). The Portfolio’s investments are classified within the fair value hierarchy based on the lowest level of input that is significant to the fair value measurement. The inputs are summarized into three broad levels as follows:
•Level 1—quoted prices in active markets for identical securities
•Level 2—other significant observable inputs (including quoted prices for similar securities, interest rates, prepayment speeds, credit risk, etc.)
•Level 3—significant unobservable inputs (including the Portfolio’s own assumptions in determining the fair value of investments)
The inputs or methodologies used for valuing investments in securities are not necessarily an indication of the risk associated with investing in those securities.
The following is a summary of the inputs used in valuing the Portfolio’s assets and liabilities as of August 31, 2023:
| | Other significant
observable inputs
(Level 2) | Significant
unobservable inputs
(Level 3) | |
| | | | |
| | | | |
Yankee corporate bonds and notes | | | | |
| | | | |
| | | | |
| | | | |
| | | | |
Additional sector, industry or geographic detail, if any, is included in the Portfolio of Investments.
For the six months ended August 31, 2023, the Portfolio did not have any transfers into/out of Level 3.
4.
TRANSACTIONS WITH AFFILIATES
Advisory fee
The Trust has entered into an advisory contract with Allspring Funds Management, a wholly owned subsidiary of Allspring Global Investments Holdings, LLC, a holding company indirectly owned by certain private funds of GTCR LLC and Reverence Capital Partners, L.P. The adviser is responsible for implementing investment policies and guidelines and for supervising the subadvisers, who are responsible for day-to-day portfolio management of the Portfolio. Pursuant to the contract, Allspring Funds Management is entitled to receive an advisory fee at the following annual rate based on the Portfolio’s average daily net assets:
For the six months ended August 31, 2023, the advisory fee was equivalent to an annual rate of 0.25% of the Portfolio’s average daily net assets.
Allspring Funds Management has retained the services of a subadviser to provide daily portfolio management to the Portfolio. The fee for subadvisory services is borne by Allspring Funds Management. Allspring Global Investments (UK) Limited (“Allspring UK”), an affiliate of Allspring Funds Management
Allspring Emerging Markets Bond Portfolio | 11
Notes to financial statements (unaudited)
and a wholly owned subsidiary of Allspring Global Investments Holdings, LLC, is the subadviser to the Portfolio and is entitled to receive a fee from Allspring Funds Management at an annual rate starting at 0.09% and declining to 0.07% as the average daily net assets of the Portfolio increase. Allspring Global Investments, LLC, an affiliate of Allspring Funds Management and wholly owned subsidiary of Allspring Global Investments Holdings, LLC, is also a subadviser to the Portfolio and is entitled to receive a fee from Allspring UK at an annual rate starting at 0.0045% and declining to 0.0035% as the average daily net assets of the Portfolio increase.
Allspring Funds Management has voluntarily waived and/or reimbursed expenses to reduced the net operating expense ratio of the Portfolio. These voluntary waivers may be discontinued at any time.
Interfund transactions
The Portfolio may purchase or sell portfolio investment securities to certain affiliates pursuant to Rule 17a-7 under the 1940 Act and under procedures adopted by the Board of Trustees. The procedures have been designed to ensure that these interfund transactions, which do not incur broker commissions, are effected at current market prices. Pursuant to these procedures, the Portfolio did not have any interfund transactions during the six months ended August 31, 2023.
5.
INVESTMENT PORTFOLIO TRANSACTIONS
Purchases and sales of investments, excluding U.S. government obligations (if any) and short-term securities, for the six months ended August 31, 2023 were $434,185 and $579,582, respectively.
The Trust, along with Allspring Variable Trust and Allspring Funds Trust (excluding the money market funds), are parties to a $350,000,000 revolving credit agreement whereby the Portfolio is permitted to use bank borrowings for temporary or emergency purposes, such as to fund interest holders withdrawal requests. Interest under the credit agreement is charged to the Portfolio based on a borrowing rate equal to the higher of the Federal Funds rate or the overnight bank funding rate in effect on that day plus a spread. In addition, an annual commitment fee based on the unused balance is allocated to each participating fund.
For the six months ended August 31, 2023, there were no borrowings by the Portfolio under the agreement.
Under the Portfolio’s organizational documents, the officers and Trustees have been granted certain indemnification rights against certain liabilities that may arise out of performance of their duties to the Portfolio. The Portfolio has entered into a separate agreement with each Trustee that converts indemnification rights currently existing under the Portfolio’s organizational documents into contractual rights that cannot be changed in the future without the consent of the Trustee. Additionally, in the normal course of business, the Portfolio may enter into contracts with service providers that contain a variety of indemnification clauses. The Portfolio’s maximum exposure under these arrangements is dependent on future claims that may be made against the Portfolio and, therefore, cannot be estimated.
12 | Allspring Emerging Markets Bond Portfolio
Other information (unaudited)
Other information
Proxy voting information
A description of the policies and procedures used to determine how to vote proxies relating to portfolio securities is available without charge, upon request, by calling 1-866-259-3305, visiting our website at allspringglobal.com, or visiting the SEC website at sec.gov. Information regarding how the proxies related to portfolio securities were voted during the most recent 12-month period ended June 30 is available on the website at allspringglobal.com or by visiting the SEC website at sec.gov.
Quarterly portfolio holdings information
The Portfolio files its complete schedule of portfolio holdings with the SEC for the first and third quarters of each fiscal year as an exhibit to its reports on Form N-PORT. Interest holders may view the filed Form N-PORT by visiting the SEC website at sec.gov.
Allspring Emerging Markets Bond Portfolio | 13
Other information (unaudited)
Board of trustees and officers
Each of the Trustees and Officers listed in the table below acts in identical capacities for each fund in the Allspring family of funds, which consists of 126 mutual funds comprising the Allspring Funds Trust, Allspring Variable Trust, Allspring Master Trust and four closed-end funds (collectively the “Fund Complex”). This table should be read in conjunction with the Prospectus and the Statement of Additional Information1. The mailing address of each Trustee and Officer is 1415 Vantage Park Drive, 3rd Floor, Charlotte, NC 28203. Each Trustee and Officer serves an indefinite term, however, each Trustee serves such term until reaching the mandatory retirement age established by the Trustees.
Independent Trustees
| | Principal occupations during past five years or longer | Current other
public company or
investment
company
directorships |
William R. Ebsworth
(Born 1957) | | Retired. From 1984 to 2013, equities analyst, portfolio manager, research director and chief investment officer at Fidelity Management and Research Company in Boston, Tokyo, and Hong Kong, and retired in 2013 as Chief Investment Officer of Fidelity Strategic Advisers, Inc. where he led a team of investment professionals managing client assets. Prior thereto, Board member of Hong Kong Securities Clearing Co., Hong Kong Options Clearing Corp., the Thailand International Fund, Ltd., Fidelity Investments Life Insurance Company, and Empire Fidelity Investments Life Insurance Company. Audit Committee Chair and Investment Committee Chair of the Vincent Memorial Hospital Foundation (non-profit organization). Mr. Ebsworth is a CFA charterholder. | |
Jane A. Freeman
(Born 1953) | Trustee,
since 2015;
Chair Liaison,
since 2018 | Retired. From 2012 to 2014 and 1999 to 2008, Chief Financial Officer of Scientific Learning Corporation. From 2008 to 2012, Ms. Freeman provided consulting services related to strategic business projects. Prior to 1999, Portfolio Manager at Rockefeller & Co. and Scudder, Stevens & Clark. Board member of the Harding Loevner Funds from 1996 to 2014, serving as both Lead Independent Director and chair of the Audit Committee. Board member of the Russell Exchange Traded Funds Trust from 2011 to 2012 and the chair of the Audit Committee. Ms. Freeman is also an inactive Chartered Financial Analyst. | |
Isaiah Harris, Jr.
(Born 1952) | Trustee,
since 2009;
Audit Committee Chair,
since 2019 | Retired. Member of the Advisory Board of CEF of East Central Florida. Chairman of the Board of CIGNA Corporation from 2009 to 2021, and Director from 2005 to 2008. From 2003 to 2011, Director of Deluxe Corporation. Prior thereto, President and CEO of BellSouth Advertising and Publishing Corp. from 2005 to 2007, President and CEO of BellSouth Enterprises from 2004 to 2005 and President of BellSouth Consumer Services from 2000 to 2003. Emeritus member of the Iowa State University Foundation Board of Governors. Emeritus Member of the Advisory board of Iowa State University School of Business. Advisory Board Member, Palm Harbor Academy (private school). Advisory Board Member, Fellowship of Christian Athletes. Mr. Harris is a certified public accountant (inactive status). | |
David F. Larcker
(Born 1950) | | Distinguished Visiting Fellow at the Hoover Institution since 2022. James Irvin Miller Professor of Accounting at the Graduate School of Business (Emeritus), Stanford University, Director of the Corporate Governance Research Initiative and Senior Faculty of The Rock Center for Corporate Governance since 2006. From 2005 to 2008, Professor of Accounting at the Graduate School of Business, Stanford University. Prior thereto, Ernst & Young Professor of Accounting at The Wharton School, University of Pennsylvania from 1985 to 2005. | |
Olivia S. Mitchell
(Born 1953) | Trustee,
since 2006;
Nominating and Governance Committee Chair,
since 2018 | International Foundation of Employee Benefit Plans Professor since 1993, Wharton School of the University of Pennsylvania. Director of Wharton’s Pension Research Council and Boettner Center on Pensions & Retirement Research, and Research Associate at the National Bureau of Economic Research. Previously taught at Cornell University from 1978 to 1993. | |
Timothy J. Penny
(Born 1951) | Trustee,
since 1996;
Chair,
since 2018 | President and Chief Executive Officer of Southern Minnesota Initiative Foundation, a non-profit organization, since 2007. Vice Chair of the Economic Club of Minnesota, since 2007. Co-Chair of the Committee for a Responsible Federal Budget, since 1995. Member of the Board of Trustees of NorthStar Education Finance, Inc., a non-profit organization, from 2007-2022. Senior Fellow of the University of Minnesota Humphrey Institute from 1995 to 2017. | |
1
The Statement of Additional Information includes additional information about the Trustees and is available, without charge, upon request, by calling 1-800-222-8222 or by visiting the website at allspringglobal.com.
14 | Allspring Emerging Markets Bond Portfolio
Other information (unaudited)
| Position held and length of service* | Principal occupations during past five years or longer | Current other public company or investment company directorships |
James G. Polisson
(Born 1959) | | Retired. Chief Marketing Officer, Source (ETF) UK Services, Ltd, from 2015 to 2017. From 2012 to 2015, Principal of The Polisson Group, LLC, a management consulting, corporate advisory and principal investing company. Chief Executive Officer and Managing Director at Russell Investments, Global Exchange Traded Funds from 2010 to 2012. Managing Director of Barclays Global Investors from 1998 to 2010 and Global Chief Marketing Officer for iShares and Barclays Global Investors from 2000 to 2010. Trustee of the San Francisco Mechanics’ Institute, a non- profit organization, from 2013 to 2015. Board member of the Russell Exchange Traded Fund Trust from 2011 to 2012. Director of Barclays Global Investors Holdings Deutschland GmbH from 2006 to 2009. Mr. Polisson is an attorney and has a retired status with the Massachusetts and District of Columbia Bar Associations. | |
Pamela Wheelock
(Born 1959) | Trustee,
since January 2020;
previously Trustee from
January 2018 to
July 2019 | Retired. Executive and Senior Financial leadership positions in the public, private and nonprofit sectors. Interim President and CEO, McKnight Foundation, 2020. Interim Commissioner, Minnesota Department of Human Services, 2019. Chief Operating Officer, Twin Cities Habitat for Humanity, 2017-2019. Vice President for University Services, University of Minnesota, 2012- 2016. Interim President and CEO, Blue Cross and Blue Shield of Minnesota, 2011-2012. Executive Vice-President and Chief Financial Officer, Minnesota Wild, 2002-2008. Commissioner, Minnesota Department of Finance, 1999-2002. Chair of the Board of Directors of Destination Medical Center Corporation. Board member of the Minnesota Wild Foundation. | |
| Length of service dates reflect the Trustee’s commencement of service with the Trust’s predecessor entities, where applicable. |
Allspring Emerging Markets Bond Portfolio | 15
Other information (unaudited)
Officers1
| Position held and
length of service | Principal occupations during past five years or longer |
| | President and Chief Executive Officer of Allspring Funds Management, LLC since 2017 and Head of Global Fund Governance of Allspring Global Investments since 2022. Prior thereto, co-president of Galliard Capital Management, LLC, an affiliate of Allspring Funds Management, LLC, from 2019 to 2022 and Head of Affiliated Managers, Allspring Global Investments, from 2014 to 2019 and Executive Vice President responsible for marketing, investments and product development for Allspring Funds Management, LLC, from 2009 to 2014. |
Jeremy DePalma
(Born 1974) | Treasurer,
since 2012
(for certain funds in
the Fund Complex);
since 2021 (for
the remaining funds in the Complex) | Senior Vice President of Allspring Funds Management, LLC since 2009. Senior Vice President of Evergreen Investment Management Company, LLC from 2008 to 2010 and head of the Fund Reporting and Control Team within Fund Administration from 2005 to 2010. |
Christopher Baker
(Born 1976) | Chief Compliance Officer,
since 2022 | Global Chief Compliance Officer for Allspring Global Investments since 2022. Prior thereto, Chief Compliance Officer for State Street Global Advisors from 2018 to 2021. Senior Compliance Officer for the State Street divisions of Alternative Investment Solutions, Sector Solutions, and Global Marketing from 2015 to 2018. From 2010 to 2015 Vice President, Global Head of Investment and Marketing Compliance for State Street Global Advisors. |
Matthew Prasse
(Born 1983) | Chief Legal Officer,
since 2022;
Secretary,
since 2021 | Senior Counsel of the Allspring Legal Department since 2021. Senior Counsel of the Wells Fargo Legal Department from 2018 to 2021. Previously, Counsel for Barings LLC from 2015 to 2018. Prior to joining Barings, Associate at Morgan, Lewis & Bockius LLP from 2008 to 2015. |
1 For those Officers with tenures at Allspring Global Investments and/or Allspring Funds Management, LLC that began prior to 2021, such tenures include years of service during which these businesses/entities were known as Wells Fargo Asset Management and Wells Fargo Funds Management, LLC, respectively.
16 | Allspring Emerging Markets Bond Portfolio
Other information (unaudited)
Board consideration of investment advisory and sub-advisory agreements:
Allspring Bloomberg US Aggregate ex-Corporate Portfolio, Allspring Emerging Markets Bond Portfolio, Allspring Factor Enhanced Emerging Markets Equity Portfolio, Allspring Factor Enhanced International Equity Portfolio, Allspring Factor Enhanced U.S. Large Cap Equity Portfolio, Allspring Factor Enhanced U.S. Small Cap Equity Portfolio, Allspring High Yield Corporate Bond Portfolio, Allspring Investment Grade Corporate Bond Portfolio, Allspring Strategic Retirement Bond Portfolio, and Allspring U.S. REIT Portfolio
Under the Investment Company Act of 1940 (the “1940 Act”), the Board of Trustees (the “Board”) of Allspring Master Trust (the “Trust”) must determine annually whether to approve the continuation of the Trust’s investment advisory and sub-advisory agreements. In this regard, at a meeting held on May 15-17, 2023 (the “Meeting”), the Board, all the members of which have no direct or indirect interest in the investment advisory and sub-advisory agreements and are not “interested persons” of the Trust, as defined in the 1940 Act (the “Independent Trustees”), reviewed and approved for each of the portfolios of the Trust identified in the table below (individually, a “Portfolio” and collectively, the “Portfolios”): (i) an investment advisory agreement (the “Advisory Agreement”) with Allspring Funds Management, LLC (“Allspring Funds Management”); and (ii) an investment sub-advisory agreement (each, a “Sub-Advisory Agreement” and collectively, the “Sub-Advisory Agreements”) with the Sub-Advisers(s) identified in the table below (each, a “Sub-Adviser” and collectively, the “Sub-Advisers”) for the corresponding Portfolio identified. The Advisory Agreement and the Sub-Advisory Agreements are collectively referred to as the “Advisory Agreements.”
| |
Allspring Bloomberg Barclays US Aggregate ex-Corporate Portfolio | Allspring Global Investments, LLC |
Allspring Emerging Markets Bond Portfolio | Allspring Global Investments, LLC, Allspring Global Investments (UK) Limited |
Allspring Factor Enhanced Emerging Markets Equity Portfolio | Allspring Global Investments, LLC |
Allspring Factor Enhanced International Equity Portfolio | Allspring Global Investments, LLC |
Allspring Factor Enhanced U.S. Large Cap Equity Portfolio | Allspring Global Investments, LLC |
Allspring Factor Enhanced U.S. Small Cap Equity Portfolio | Allspring Global Investments, LLC |
Allspring High Yield Corporate Bond Portfolio | Allspring Global Investments, LLC |
Allspring Investment Grade Corporate Bond Portfolio | Allspring Global Investments, LLC |
Allspring Strategic Retirement Bond Portfolio | Allspring Global Investments, LLC |
Allspring U.S. REIT Portfolio | Allspring Global Investments, LLC |
At the Meeting, the Board considered the factors and reached the conclusions described below relating to the selection of Allspring Funds Management and the Sub-Advisers and the approval of the Advisory Agreements. Prior to the Meeting, including at a Board meeting held in April 2023, the Trustees conferred extensively among themselves and with representatives of Allspring Funds Management about these matters. The Board has adopted a team-based approach, with each team consisting of a sub-set of Trustees, to assist the full Board in the discharge of its duties in reviewing investment performance and other matters throughout the year. The Independent Trustees were assisted in their evaluation of the Advisory Agreements by independent legal counsel, from whom they received separate legal advice and with whom they met separately.
The Board noted that it initially approved the Advisory Agreements at a Board meeting held in May 2021, each for a two-year term, in advance of the sale of Wells Fargo Asset Management to Allspring Global Investments Holdings, LLC,1 a holding company indirectly owned by certain private funds of GTCR LLC and Reverence Capital Partners, L.P. (the “Transaction”). The Trustees also noted that, while they did not specifically consider the continuation of the Advisory Agreements in 2022 as a result of the two-year term that was approved in 2021, the Trustees received and considered certain information at a Board meeting held in April 2022 that was applicable to the Advisory Agreements, including an overview and financial review of the Allspring Global Investments business, information regarding certain ancillary agreements that were approved by the Board at the April 2022 Board meeting, and comparative data regarding Fund fees and expenses.
In providing information to the Board, Allspring Funds Management and the Sub-Advisers were guided by a detailed set of requests for information submitted to them by independent legal counsel on behalf of the Independent Trustees at the start of the Board’s annual contract renewal process earlier in 2023. In considering and approving the Advisory Agreements, the Trustees considered the information they believed relevant, including but not limited to the information discussed below. The Board considered not only the specific information presented in connection with the Meeting, but also the knowledge gained over time through interaction with Allspring Funds Management and the Sub-Advisers about various topics. In this regard, the Board reviewed reports of Allspring Funds Management at each of its quarterly meetings, which included, among other things, portfolio reviews and investment performance reports. In addition, the Board and the teams mentioned above confer with portfolio managers at various times throughout the year. The Board did not identify any particular information or consideration that was all-important or controlling, and each individual Trustee may have attributed different weights to various factors.
1
The trade name for the asset management firm that includes Allspring Funds Management and the Sub-Adviser is “Allspring Global Investments.”
Allspring Emerging Markets Bond Portfolio | 17
Other information (unaudited)
After its deliberations, the Board unanimously determined that the compensation or the absence of compensation payable to Allspring Funds Management and each of the Sub-Advisers under each of the Advisory Agreements was reasonable, and approved the continuation of the Advisory Agreements for a one-year term. The Board considered the approval of the Advisory Agreements for the Portfolios as part of its consideration of agreements for funds across the complex, but its approvals were made on a fund-by-fund basis. The following summarizes a number of important, but not necessarily all, factors considered by the Board in support of its approvals.
Nature, extent and quality of services
The Board received and considered various information regarding the nature, extent, and quality of services provided to the Portfolios by Allspring Funds Management and the Sub-Advisers under the Advisory Agreements. This information included a description of the investment advisory services and Portfolio-level administrative services covered by the Advisory Agreement, as well as, among other things, a summary of the background and experience of senior management of Allspring Global Investments, of which Allspring Funds Management and the Sub-Advisers are a part, and a summary of investments made in the Allspring Global Investments business. The Board also considered information about retention arrangements with respect to key personnel of Allspring Global Investments that were put in place in connection with the Transaction. The Board took into account information about the services that continue to be provided by Wells Fargo & Co. and/or its affiliates (“Wells Fargo”) since the Transaction under a transition services agreement and the anticipated timeline for exiting the transition services agreement. In addition, the Board received and considered information about the full range of services provided to the Fund by Allspring Funds Management and its affiliates.
The Board considered the qualifications, background, tenure, and responsibilities of each of the portfolio managers primarily responsible for the day-to-day portfolio management of the Portfolios. The Board evaluated the ability of Allspring Funds Management and the Sub-Advisers to attract and retain qualified investment professionals, including research, advisory, and supervisory personnel.
The Board further considered the compliance programs and compliance records of Allspring Funds Management and the Sub-Advisers. The Board received and considered information about Allspring Global Investments’ risk management functions, which included information about Allspring Funds Management’s and the Sub-Advisers’ business continuity plans, their approaches to data privacy and cybersecurity, and Allspring Funds Management’s role as administrator of the Portfolios’ liquidity risk management program, and the derivatives risk management program for Allspring Bloomberg Barclays US Aggregate ex-Corporate Portfolio and Allspring Factor Enhanced U.S. Large Cap Equity Portfolio. The Board also received and considered information about Allspring Funds Management’s intermediary and vendor oversight program.
Portfolio investment performance and expenses
The Board considered the investment performance results for each of the Portfolios over various time periods ended December 31, 2022. The Board considered these results in comparison to the investment performance of funds in a universe that was determined by Broadridge Inc. (“Broadridge”) to be similar to each respective Portfolios (each, a “Universe”), and in comparison to each Portfolios’ benchmark index and to other comparative data. Broadridge is an independent provider of investment company data. The Board received a description of the methodology used by Broadridge to select the mutual funds in the performance Universe. The Board noted the short performance history of the Portfolios.
With respect to the investment performance of each Portfolio relative to its respective Universe, the Board noted the following: (i) the investment performance of Allspring Bloomberg US Aggregate ex-Corporate Portfolio was higher than the average investment performance of the Universe for all periods under review; the investment performance of Allspring Bloomberg US Aggregate ex-Corporate Portfolio was higher than the investment performance of its benchmark index, the Bloomberg U.S. Aggregate ex Corporate Index, for the one-year period and was in range of the investment performance of its benchmark index for the three- and five-year periods under review; (ii) the investment performance of Allspring Emerging Markets Bond Portfolio was lower than the average investment performance of the Universe for the one- and three-year periods and was in range of the average investment performance of the Universe for the five-year period; the investment performance of Allspring Emerging Markets Bond Portfolio was higher than the investment performance of its benchmark index, the J.P. Morgan EM Bond Global Diversified Index, for the one-year period and was in range of the investment performance of its benchmark index for the three- and five-year periods under review; (iii) the investment performance of Allspring Factor Enhanced Emerging Markets Equity Portfolio was higher than the average investment performance of the Universe for the one-year period and was lower than the average investment performance of the Universe for the three- and five-year periods; the investment performance of Allspring Factor Enhanced Emerging Markets Equity Portfolio was higher than the investment performance of its benchmark index, the MSCI Emerging Markets Index (Net), for the one-year period and was lower than the investment performance of its benchmark index for the three- and five-year periods under review; (iv) the investment performance of Allspring Factor Enhanced International Equity Portfolio was higher than the average investment performance of the Universe for all periods under review; the investment performance of Allspring Factor Enhanced International Equity Portfolio was higher than the investment performance of its benchmark index, the MSCI World ex US Index (Net), for all periods under review; (v) the investment performance of Allspring Factor Enhanced U.S. Large Cap Equity Portfolio was higher than the average investment performance of the Universe for the one- and five-year periods and was lower than the average investment performance of the Universe for the three-year period; the investment performance of Allspring Factor Enhanced U.S. Large Cap Equity Portfolio was higher than the investment performance of its benchmark index, the Russell 1000® Index, for the one-year period and was lower than the investment performance of its benchmark index for the three- and five-year periods under review; (vi) the investment performance of Allspring Factor Enhanced U.S. Small Cap Equity Portfolio was lower than the average investment performance of the Universe for all periods under review; the investment performance of Allspring Factor Enhanced U.S. Small Cap Equity Portfolio was higher than the
18 | Allspring Emerging Markets Bond Portfolio
Other information (unaudited)
investment performance of its benchmark index, the Russell 2000® Index, for the one-year period and was lower than the investment performance of its benchmark index for the three- and five-year periods under review; (vii) the investment performance of Allspring High Yield Corporate Bond Portfolio was lower than the average investment performance of the Universe for all periods under review; the investment performance of Allspring High Yield Corporate Bond Portfolio was in range of the investment performance of its benchmark index, the Bloomberg U.S. Corporate High Yield 2% Issuer Capped, for the one-year period and was lower than the investment performance of its benchmark index for the three- and five-year periods under review; (viii) the investment performance of Allspring Investment Grade Corporate Bond Portfolio was higher than the average investment performance of the Universe for the one- and five-year periods and in rage of the average investment performance of the Universe for the three-year period; the investment performance of Allspring Investment Grade Corporate Bond Portfolio was higher than the investment performance of its benchmark index, the Bloomberg U.S. Corporate Bond Index, for the one-year period and was in range of the investment performance of its benchmark index for the three- and five-year periods under review; (ix) the investment performance of Allspring Strategic Retirement Bond Portfolio was higher than the average investment performance of the Universe for all periods under review; the investment performance of Allspring Strategic Retirement Bond Portfolio was higher than the investment performance of its benchmark index, the Strategic Retirement Blended Index, for the one- and three-year periods and was in range of the investment performance of its benchmark index for the five-year period; (x) the investment performance of Allspring U.S. REIT Portfolio was lower than the average investment performance of the Universe for the one-year period and was in range of the average investment performance of the Universe for the three- and five-year periods; the investment performance of Allspring U.S. REIT Portfolio was higher than the investment performance of its benchmark index, the Dow Jones U.S. Select REIT Index, for all periods under review.
The Board received information concerning, and discussed factors contributing to, the underperformance of each of Allspring Emerging Markets Bond Portfolio, Allspring Factor Enhanced Emerging Markets Equity Portfolio, Allspring Factor Enhanced U.S. Large Cap Equity Portfolio, Allspring Factor Enhanced U.S. Small Cap Equity Portfolio and Allspring High Yield Corporate Bond Portfolio relative to such Portfolio’s Universe and benchmark index for the periods identified above. The Board took note of the explanations for the relative underperformance during these periods, including with respect to investment decisions and market factors that affected each Portfolio’s investment performance.
The Board also received and considered information regarding the fee rates that are payable to Allspring Funds Management for investment advisory services (as discussed below), which are the only fees charged to the Portfolios, relative to corresponding class-specific expense groups that were determined by Broadridge to be similar to the Portfolios (the “Groups”). The Board received a description of the methodology used by Broadridge to select the mutual funds in the expense Groups and an explanation of how funds comprising expense groups and their expense ratios may vary from year-to-year.
The Board took into account the Portfolios’ investment performance and expense information provided to it among the factors considered in deciding to re-approve the Advisory Agreements.
Investment advisory and sub-advisory fee rates
The Board reviewed and considered the contractual fee rates payable by the Portfolios to Allspring Funds Management under the Advisory Agreement. The Board also reviewed and considered the contractual investment sub-advisory fee rates that are payable by Allspring Funds Management to the Sub-Advisers for investment sub-advisory services.
Among other information reviewed by the Board was a comparison of the Portfolios’ Advisory Rates with the average contractual investment advisory fee rates of funds in the expense Groups at a common asset level as well as transfer agency costs of the Portfolios in the expense Groups. The Board noted that the Advisory Rates of the Portfolios were lower than or in range of the mean rates for the Portfolios’ expense Groups.
The Board also received and considered information about the portions of the total advisory fees that were retained by Allspring Funds Management after payment of the fees to the Sub-Advisers for sub-advisory services. In assessing the reasonableness of these amounts, the Board received and evaluated information about the nature and extent of responsibilities retained and risks assumed by Allspring Funds Management and not delegated to or assumed by the Sub-Advisers, and about Allspring Funds Management’s on-going oversight services. Given the affiliation between Allspring Funds Management and the Sub-Advisers, the Board ascribed limited relevance to the allocation of fees between them.
For all Portfolios, except Allspring Factor Enhanced U.S. Small Cap Equity Portfolio, Allspring Factor Enhanced International Equity Portfolio, Allspring Factor Enhanced Emerging Markets Equity Portfolio, Allspring U.S. REIT Portfolio, Allspring Investment Grade Corporate Bond Portfolio, and Allspring Strategic Retirement Bond Portfolio, the Board also received and considered information about the nature and extent of services offered and fee rates charged by Allspring Funds Management and the Sub-Advisers to other types of clients with investment strategies similar to those of certain Portfolios. In this regard, the Board received information about the significantly greater scope of services, and compliance, reporting and other legal burdens and risks of managing proprietary mutual funds compared with those associated with managing assets of other types of clients, including third-party sub-advised fund clients and non-mutual fund clients such as institutional separate accounts.
Based on its consideration of the factors and information it deemed relevant, including those described here, the Board determined that the compensation payable to Allspring Funds Management under the Advisory Agreement and to the Sub-Advisers under the Sub-Advisory Agreements was reasonable.
Allspring Emerging Markets Bond Portfolio | 19
Other information (unaudited)
Profitability
The Board received and considered information concerning the profitability of Allspring Funds Management, as well as the profitability of Allspring Global Investments, from providing services to the fund complex as a whole. The Board noted that the Sub-Adviser’s profitability information with respect to providing services to the Portfolios and other funds in the complex was subsumed in the Allspring Global Investments profitability analysis.
Allspring Funds Management reported on the methodologies and estimates used in calculating profitability, including a description of the methodology used to allocate certain expenses and differences in how Allspring Global Investments calculates its pre-tax profit metric versus the methodology used when Allspring Funds Management was part of Wells Fargo. It was noted that the impact of such differences had only minor impact on the financial results presented. Among other things, the Board noted that the levels of profitability reported on a fund-by-fund basis varied widely, depending on factors such as the size, type, and age of fund.
Based on its review, the Board did not deem the profits reported by Allspring Funds Management or Allspring Global Investments from services provided to the Portfolios to be at a level that would prevent it from approving the continuation of the Advisory Agreements.
Economies of scale
The Board received and considered information about the potential for Allspring Funds Management to experience economies of scale in the provision of management services to the Portfolios, the difficulties of calculating economies of scale at an individual fund level, and the extent to which potential scale benefits are shared with Portfolio shareholders. The Board noted the existence of breakpoints in the Portfolios’ advisory fee structure, which operate generally to reduce the Portfolios’ expense ratios as the Portfolios grow in size, and the size of the Portfolios in relation to such breakpoints. The Board considered that in addition to advisory fee breakpoints, Allspring Funds Management shares potential economies of scale from its management business in a variety of ways, including through fee waiver and expense reimbursement arrangements, competitive advisory fee rates set at the outset without regard to breakpoints, and investments in the business intended to enhance services available to shareholders.
The Board concluded that Allspring Funds Management’s arrangements with respect to the Portfolios, including contractual breakpoints, constituted a reasonable approach to sharing potential economies of scale with the Portfolios and their shareholders.
Other benefits to Allspring Funds Management and the Sub-Advisers
The Board received and considered information regarding potential “fall-out” or ancillary benefits received by Allspring Funds Management and its affiliates, including the Sub-Advisers, as a result of their relationships with the Portfolios. Ancillary benefits could include, among others, benefits directly attributable to other relationships with the Portfolios and benefits potentially derived from an increase in Allspring Funds Management’s and the Sub-Advisers’ businesses as a result of their relationships with the Portfolios. The Board noted that Allspring Funds Distributor, LLC, an affiliate of Allspring Funds Management, receives distribution-related fees in respect of shares sold or held through it.
The Board also reviewed information about soft dollar credits earned and utilized by the Sub-Advisers and fees earned in the past by Allspring Funds Management and the Sub-Advisers from managing a private investment vehicle for the fund complex’s securities lending collateral.
Based on its consideration of the factors and information it deemed relevant, including those described here, the Board did not find that any ancillary benefits received by Allspring Funds Management and its affiliates, including the Sub-Advisers, were unreasonable.
Conclusion
At the Meeting, after considering the above-described factors and based on its deliberations and its evaluation of the information described above, the Board unanimously determined that the compensation payable to Allspring Funds Management and the Sub-Advisers under each of the Advisory Agreements was reasonable, and approved the continuation of the Advisory Agreements for a one-year term.
20 | Allspring Emerging Markets Bond Portfolio
Other information (unaudited)
Liquidity risk management program
In accordance with Rule 22e-4 under the Investment Company Act of 1940, as amended (the “Liquidity Rule”), Allspring Master Trust (the “Trust”) has adopted and implemented a liquidity risk management program (the “Program”) on behalf of each of its series, including the Portfolio, which is reasonably designed to assess and manage the Portfolio’s liquidity risk. “Liquidity risk” is defined under the Liquidity Rule as the risk that the Portfolio is unable to meet redemption requests without significantly diluting remaining investors’ interests in the Portfolio. The Trust’s Board of Trustees (the “Board”) previously approved the designation of Allspring Funds Management, LLC (“Allspring Funds Management”), the Portfolio’s investment adviser, to administer the Program, and Allspring Funds Management has established a Liquidity Risk Management Council (the “Council”) composed of personnel from multiple departments within Allspring Funds Management and its affiliates to assist Allspring Funds Management in the administration of the Program.
The Program is comprised of various components designed to support the assessment and/or management of liquidity risk, including: (1) the periodic assessment (no less frequently than annually) of certain factors that influence the Portfolio’s liquidity risk; (2) the periodic classification (no less frequently than monthly) of the Portfolio’s investments into one of four liquidity categories that reflect an estimate of their liquidity under current market conditions; (3) a 15% limit on the acquisition of “illiquid investments” (as defined under the Liquidity Rule); (4) to the extent the Portfolio does not invest primarily in “highly liquid investments” (as defined under the Liquidity Rule), the determination of a minimum percentage of the Portfolio’s assets that generally will be invested in highly liquid investments (an “HLIM”); (5) if the Portfolio has established an HLIM, the periodic review (no less frequently than annually) of the HLIM and the adoption of policies and procedures for responding to a shortfall of the Portfolio’s “highly liquid investments” below its HLIM; and (6) periodic reporting to the Board.
At a meeting of the Board held on May 16-17, 2023, the Board received and reviewed a written report (the “Report”) from Allspring Funds Management that, among other things, addressed the operation of the Program and assessed its adequacy and effectiveness for the period from January 1, 2022 through December 31, 2022 (the “Reporting Period”). The Report noted significant liquidity events impacting the Portfolios related to extended foreign market holidays as well as the difficulty of trading and settlement of most Russia-related securities due to sanctions activity. The Report noted that there were no material changes to the Program during the Reporting Period.
Allspring Funds Management determined in the Report that the Program has been implemented and operates effectively to manage each Portfolio’s, including the Portfolio’s, liquidity risk, and Allspring Funds Management continues to believe that the Program has been and continues to be adequately and effectively implemented to monitor and, as applicable, respond to the Portfolio’s liquidity developments.
There can be no assurance that the Program will achieve its objectives under all circumstances in the future.
Allspring Emerging Markets Bond Portfolio | 21
For more information
More information about Allspring Funds is available free upon request. To obtain literature, please write, visit the Portfolio’s website, or call:
Allspring Funds
P.O. Box 219967
Kansas City, MO 64121-9967
Website: allspringglobal.com
Individual investors: 1-800-222-8222
Retail investment professionals: 1-888-877-9275
Institutional investment professionals: 1-800-260-5969
This report and the financial statements contained herein are submitted for the general information of the interest holders of the Portfolio. If this report is used for promotional purposes, distribution of the report must be accompanied or preceded by a current prospectus. Before investing, please consider the investment objectives, risks, charges, and expenses of the investment. For a current prospectus and, if available, a summary prospectus, containing this information, call 1-800-222-8222 or visit the Portfolio’s website at allspringglobal.com. Read the prospectus carefully before you invest or send money.
Allspring Global InvestmentsTM is the trade name for the asset management firms of Allspring Global Investments Holdings, LLC, a holding company indirectly owned by certain private funds of GTCR LLC and Reverence Capital Partners, L.P. These firms include but are not limited to Allspring Global Investments, LLC, and Allspring Funds Management, LLC. Certain products managed by Allspring entities are distributed by Allspring Funds Distributor, LLC (a broker-dealer and Member FINRA/SIPC).
This material is for general informational and educational purposes only and is NOT intended to provide investment advice or a recommendation of any kind - including a recommendation for any specific investment, strategy, or plan.
© 2023 Allspring Global Investments Holdings, LLC. All rights reserved.
Allspring Factor Enhanced Emerging Markets Equity Portfolio
Semi-Annual Report
August 31, 2023
Allspring Factor Enhanced Emerging Markets Equity Portfolio | 1
Performance highlights (unaudited)
Performance highlights
| The Portfolio seeks long-term capital appreciation. |
| Allspring Funds Management, LLC |
| Allspring Global Investments, LLC |
| Harindra de Silva, Ph.D., CFA, Monisha Jayakumar |
Ten largest holdings (%) as of August 31, 20231 |
Taiwan Semiconductor Manufacturing Co. Ltd. | |
| |
Samsung Electronics Co. Ltd. | |
Alibaba Group Holding Ltd. | |
| |
| |
| |
| |
| |
| |
| Figures represent the percentage of the Portfolio’s net assets. Holdings are subject to change and may have changed since the date specified. |
Sector allocation as of August 31, 20231 |
| Figures represent the percentage of the Portfolio’s long-term investments. Allocations are subject to change and may have changed since the date specified. |
Country allocation as of August 31, 20231 |
| Figures represent the percentage of the Portfolio’s long-term investments. Allocations are subject to change and may have changed since the date specified. |
| CFA® and Chartered Financial Analyst® are trademarks owned by CFA Institute. |
2 | Allspring Factor Enhanced Emerging Markets Equity Portfolio
Portfolio of investments—August 31, 2023 (unaudited)
| | | | | |
| | | | | | |
| | | | | | |
Ambev SA (Consumer staples, Beverages) | | | | | | |
B3 SA - Brasil Bolsa Balcao (Financials, Capital markets) | | | | | | |
Banco Bradesco SA (Financials, Banks) | | | | | | |
Banco BTG Pactual SA (Financials, Capital markets) | | | | | | |
Banco do Brasil SA (Financials, Banks) | | | | | | |
Banco Santander Brasil SA (Financials, Banks) | | | | | | |
BB Seguridade Participacoes SA (Financials, Insurance) | | | | | | |
CCR SA (Industrials, Transportation infrastructure) | | | | | | |
Cia de Saneamento Basico do Estado de Sao Paulo (Utilities, Water utilities) | | | | | | |
Cia Siderurgica Nacional SA (Materials, Metals & mining) | | | | | | |
CPFL Energia SA (Utilities, Electric utilities) | | | | | | |
Energisa SA (Utilities, Electric utilities) | | | | | | |
Engie Brasil Energia SA (Utilities, Independent power and renewable electricity producers) | | | | | | |
Equatorial Energia SA (Utilities, Electric utilities) | | | | | | |
JBS SA (Consumer staples, Food products) | | | | | | |
Klabin SA (Materials, Containers & packaging) | | | | | | |
Localiza Rent a Car SA (Industrials, Ground transportation) | | | | | | |
Lojas Renner SA (Consumer discretionary, Specialty retail) | | | | | | |
Magazine Luiza SA (Consumer discretionary, Broadline retail)† | | | | | | |
Natura & Co. Holding SA (Consumer staples, Personal care products)† | | | | | | |
Petroleo Brasileiro SA (Energy, Oil, gas & consumable fuels) | | | | | | |
PRIO SA (Energy, Oil, gas & consumable fuels)† | | | | | | |
Raia Drogasil SA (Consumer staples, Consumer staples distribution & retail) | | | | | | |
Rumo SA (Industrials, Ground transportation) | | | | | | |
Sendas Distribuidora S/A (Consumer staples, Consumer staples distribution & retail) | | | | | | |
Suzano SA (Materials, Paper & forest products) | | | | | | |
Telefonica Brasil SA (Communication services, Diversified telecommunication services) | | | | | | |
TIM SA (Communication services, Wireless telecommunication services) | | | | | | |
TOTVS SA (Information technology, Software) | | | | | | |
Ultrapar Participacoes SA (Energy, Oil, gas & consumable fuels) | | | | | | |
Vale SA (Materials, Metals & mining) | | | | | | |
Vibra Energia SA (Consumer discretionary, Specialty retail) | | | | | | |
WEG SA (Industrials, Electrical equipment) | | | | | | |
| | | | | | |
| | | | | | |
Banco de Chile (Financials, Banks) | | | | | | |
Banco de Credito e Inversiones SA (Financials, Banks) | | | | | | |
Banco Santander Chile (Financials, Banks) | | | | | | |
Cencosud SA (Consumer staples, Consumer staples distribution & retail) | | | | | | |
Cia Cervecerias Unidas SA (Consumer staples, Beverages) | | | | | | |
Empresas CMPC SA (Materials, Paper & forest products) | | | | | | |
Enel Chile SA (Utilities, Electric utilities) | | | | | | |
Falabella SA (Consumer discretionary, Broadline retail) | | | | | | |
| | | | | | |
The accompanying notes are an integral part of these financial statements.
Allspring Factor Enhanced Emerging Markets Equity Portfolio | 3
Portfolio of investments—August 31, 2023 (unaudited)
| | | | | |
| | | | | | |
37 Interactive Entertainment Network Technology Group Co. Ltd. Class A (Communication services, Entertainment) | | | | | | |
3SBio, Inc. (Health care, Biotechnology)144A† | | | | | | |
AAC Technologies Holdings, Inc. (Information technology, Electronic equipment, instruments & components)† | | | | | | |
Agricultural Bank of China Ltd. Class H (Financials, Banks) | | | | | | |
Airtac International Group (Industrials, Machinery)† | | | | | | |
Alibaba Group Holding Ltd. (Consumer discretionary, Broadline retail)† | | | | | | |
Aluminum Corp. of China Ltd. Class A (Materials, Metals & mining) | | | | | | |
Aluminum Corp. of China Ltd. Class H (Materials, Metals & mining) | | | | | | |
Amlogic Shanghai Co. Ltd. Class A (Information technology, Semiconductors & semiconductor equipment)† | | | | | | |
Anhui Conch Cement Co. Ltd. Class H (Materials, Construction materials) | | | | | | |
Anhui Gujing Distillery Co. Ltd. Class B (Consumer staples, Beverages) | | | | | | |
ANTA Sports Products Ltd. (Consumer discretionary, Textiles, apparel & luxury goods) | | | | | | |
Autobio Diagnostics Co. Ltd. Class A (Health care, Health care equipment & supplies) | | | | | | |
AviChina Industry & Technology Co. Ltd. Class H (Industrials, Aerospace & defense) | | | | | | |
Baidu, Inc. Class A (Communication services, Interactive media & services)† | | | | | | |
Bank of Beijing Co. Ltd. Class A (Financials, Banks) | | | | | | |
Bank of Changsha Co. Ltd. Class A (Financials, Banks) | | | | | | |
Bank of China Ltd. Class A (Financials, Banks) | | | | | | |
Bank of China Ltd. Class H (Financials, Banks) | | | | | | |
Bank of Communications Co. Ltd. Class A (Financials, Banks) | | | | | | |
Bank of Communications Co. Ltd. Class H (Financials, Banks) | | | | | | |
Bank of Suzhou Co. Ltd. Class A (Financials, Banks) | | | | | | |
BeiGene Ltd. (Health care, Biotechnology)† | | | | | | |
Beijing E-Hualu Information Technology Co. Ltd. Class A (Information technology, Software)† | | | | | | |
Beijing Kingsoft Office Software, Inc. Class A (Information technology, Software) | | | | | | |
Beijing Tiantan Biological Products Corp. Ltd. Class A (Health care, Biotechnology) | | | | | | |
Beijing United Information Technology Co. Ltd. Class A (Industrials, Trading companies & distributors) | | | | | | |
Beijing Wantai Biological Pharmacy Enterprise Co. Ltd. Class A (Health care, Biotechnology) | | | | | | |
Beijing Yanjing Brewery Co. Ltd. Class A (Consumer staples, Beverages) | | | | | | |
BGI Genomics Co. Ltd. Class A (Health care, Biotechnology) | | | | | | |
Bilibili, Inc. Class Z (Communication services, Entertainment)† | | | | | | |
Bloomage Biotechnology Corp. Ltd. Class A (Health care, Biotechnology) | | | | | | |
BYD Co. Ltd. Class H (Consumer discretionary, Automobiles) | | | | | | |
By-health Co. Ltd. Class A (Consumer staples, Personal care products) | | | | | | |
Canmax Technologies Co. Ltd. Class A (Materials, Chemicals) | | | | | | |
CGN Power Co. Ltd. Class H (Utilities, Independent power and renewable electricity producers)144A | | | | | | |
China Cinda Asset Management Co. Ltd. Class H (Financials, Capital markets) | | | | | | |
China CITIC Bank Corp. Ltd. Class H (Financials, Banks) | | | | | | |
China Coal Energy Co. Ltd. Class H (Energy, Oil, gas & consumable fuels) | | | | | | |
China Communications Services Corp. Ltd. Class H (Industrials, Construction & engineering) | | | | | | |
The accompanying notes are an integral part of these financial statements.
4 | Allspring Factor Enhanced Emerging Markets Equity Portfolio
Portfolio of investments—August 31, 2023 (unaudited)
| | | | | |
| | | | | | |
China Construction Bank Corp. Class A (Financials, Banks) | | | | | | |
China Construction Bank Corp. Class H (Financials, Banks) | | | | | | |
China Feihe Ltd. (Consumer staples, Food products)144A | | | | | | |
China Galaxy Securities Co. Ltd. Class H (Financials, Capital markets) | | | | | | |
China Hongqiao Group Ltd. (Materials, Metals & mining) | | | | | | |
China International Capital Corp. Ltd. Class H (Financials, Capital markets)144A | | | | | | |
China Lesso Group Holdings Ltd. (Industrials, Building products)† | | | | | | |
China Life Insurance Co. Ltd. Class H (Financials, Insurance) | | | | | | |
China Literature Ltd. (Communication services, Media)144A† | | | | | | |
China Longyuan Power Group Corp. Ltd. Class H (Utilities, Independent power and renewable electricity producers) | | | | | | |
China Medical System Holdings Ltd. (Health care, Pharmaceuticals) | | | | | | |
China Meheco Co. Ltd. Class A (Health care, Health care providers & services) | | | | | | |
China Meidong Auto Holdings Ltd. (Consumer discretionary, Specialty retail) | | | | | | |
China Mengniu Dairy Co. Ltd. (Consumer staples, Food products)† | | | | | | |
China Merchants Bank Co. Ltd. Class A (Financials, Banks) | | | | | | |
China Merchants Bank Co. Ltd. Class H (Financials, Banks) | | | | | | |
China Minsheng Banking Corp. Ltd. Class A (Financials, Banks) | | | | | | |
China Minsheng Banking Corp. Ltd. Class H (Financials, Banks) | | | | | | |
China National Building Material Co. Ltd. Class H (Materials, Construction materials) | | | | | | |
China National Medicines Corp. Ltd. Class A (Health care, Health care providers & services) | | | | | | |
China National Software & Service Co. Ltd. Class A (Information technology, Software) | | | | | | |
China Oilfield Services Ltd. Class H (Energy, Energy equipment & services) | | | | | | |
China Overseas Property Holdings Ltd. (Real estate, Real estate management & development) | | | | | | |
China Pacific Insurance Group Co. Ltd. Class H (Financials, Insurance) | | | | | | |
China Petroleum & Chemical Corp. Class A (Energy, Oil, gas & consumable fuels) | | | | | | |
China Petroleum & Chemical Corp. Class H (Energy, Oil, gas & consumable fuels) | | | | | | |
China Railway Group Ltd. Class H (Industrials, Construction & engineering) | | | | | | |
China Rare Earth Resources & Technology Co. Ltd. Class A (Materials, Metals & mining) | | | | | | |
China Resources Land Ltd. (Real estate, Real estate management & development) | | | | | | |
China Resources Sanjiu Medical & Pharmaceutical Co. Ltd. Class A (Health care, Pharmaceuticals) | | | | | | |
China Shenhua Energy Co. Ltd. Class H (Energy, Oil, gas & consumable fuels) | | | | | | |
China Tourism Group Duty Free Corp. Ltd. Class H (Consumer discretionary, Specialty retail)144A† | | | | | | |
China Tower Corp. Ltd. Class H (Communication services, Diversified telecommunication services)144A | | | | | | |
China Vanke Co. Ltd. Class H (Real estate, Real estate management & development) | | | | | | |
Chinasoft International Ltd. (Information technology, IT services)† | | | | | | |
Chongqing Rural Commercial Bank Co. Ltd. Class A (Financials, Banks) | | | | | | |
Chongqing Zhifei Biological Products Co. Ltd. Class A (Health care, Biotechnology) | | | | | | |
CMOC Group Ltd. Class H (Materials, Metals & mining) | | | | | | |
COSCO SHIPPING Energy Transportation Co. Ltd. Class H (Energy, Oil, gas & consumable fuels) | | | | | | |
COSCO SHIPPING Holdings Co. Ltd. Class H (Industrials, Marine transportation) | | | | | | |
The accompanying notes are an integral part of these financial statements.
Allspring Factor Enhanced Emerging Markets Equity Portfolio | 5
Portfolio of investments—August 31, 2023 (unaudited)
| | | | | |
| | | | | | |
COSCO SHIPPING Ports Ltd. (Industrials, Transportation infrastructure) | | | | | | |
Country Garden Holdings Co. Ltd. (Real estate, Real estate management & development)† | | | | | | |
Country Garden Services Holdings Co. Ltd. (Real estate, Real estate management & development) | | | | | | |
CRRC Corp. Ltd. Class A (Industrials, Machinery) | | | | | | |
CRRC Corp. Ltd. Class H (Industrials, Machinery) | | | | | | |
Daan Gene Co. Ltd. Class A (Health care, Biotechnology) | | | | | | |
Daqin Railway Co. Ltd. Class A (Industrials, Ground transportation) | | | | | | |
DaShenLin Pharmaceutical Group Co. Ltd. Class A (Consumer staples, Consumer staples distribution & retail) | | | | | | |
Datang International Power Generation Co. Ltd. Class A (Utilities, Independent power and renewable electricity producers) | | | | | | |
Dong-E-E-Jiao Co. Ltd. Class A (Health care, Pharmaceuticals) | | | | | | |
Dongfang Electric Corp. Ltd. Class A (Industrials, Electrical equipment) | | | | | | |
Dongfeng Motor Group Co. Ltd. Class H (Consumer discretionary, Automobiles) | | | | | | |
Dongyue Group Ltd. (Materials, Chemicals) | | | | | | |
East Buy Holding Ltd. (Consumer discretionary, Diversified consumer services)144A† | | | | | | |
ENN Energy Holdings Ltd. (Utilities, Gas utilities) | | | | | | |
Flat Glass Group Co. Ltd. Class H (Information technology, Semiconductors & semiconductor equipment)† | | | | | | |
Focus Media Information Technology Co. Ltd. Class A (Communication services, Media)† | | | | | | |
Foxconn Industrial Internet Co. Ltd. Class A (Information technology, Electronic equipment, instruments & components) | | | | | | |
Fuyao Glass Industry Group Co. Ltd. Class H (Consumer discretionary, Automobile components)144A | | | | | | |
Ganfeng Lithium Group Co. Ltd. Class H (Materials, Chemicals)144A | | | | | | |
G-bits Network Technology Xiamen Co. Ltd. Class A (Communication services, Entertainment) | | | | | | |
GCL Technology Holdings Ltd. (Information technology, Semiconductors & semiconductor equipment)† | | | | | | |
Giant Network Group Co. Ltd. Class A (Communication services, Entertainment)† | | | | | | |
GoodWe Technologies Co. Ltd. Class A (Industrials, Electrical equipment) | | | | | | |
Great Wall Motor Co. Ltd. Class H (Consumer discretionary, Automobiles) | | | | | | |
Greenland Holdings Corp. Ltd. Class A (Real estate, Real estate management & development)† | | | | | | |
Greentown China Holdings Ltd. (Real estate, Real estate management & development) | | | | | | |
Greentown Service Group Co. Ltd. (Real estate, Real estate management & development) | | | | | | |
Guangzhou Automobile Group Co. Ltd. Class H (Consumer discretionary, Automobiles) | | | | | | |
Guangzhou Baiyunshan Pharmaceutical Holdings Co. Ltd. Class A (Health care, Health care providers & services) | | | | | | |
Guangzhou Kingmed Diagnostics Group Co. Ltd. Class A (Health care, Health care providers & services) | | | | | | |
Haidilao International Holding Ltd. (Consumer discretionary, Hotels, restaurants & leisure)144A | | | | | | |
The accompanying notes are an integral part of these financial statements.
6 | Allspring Factor Enhanced Emerging Markets Equity Portfolio
Portfolio of investments—August 31, 2023 (unaudited)
| | | | | |
| | | | | | |
Haier Smart Home Co. Ltd. Class H (Consumer discretionary, Household durables) | | | | | | |
Haitian International Holdings Ltd. (Industrials, Machinery)† | | | | | | |
Hangzhou Tigermed Consulting Co. Ltd. Class A (Health care, Life sciences tools & services) | | | | | | |
Hangzhou Tigermed Consulting Co. Ltd. Class H (Health care, Life sciences tools & services)144A | | | | | | |
Hebei Yangyuan Zhihui Beverage Co. Ltd. Class A (Consumer staples, Food products) | | | | | | |
Henan Shenhuo Coal & Power Co. Ltd. Class A (Materials, Metals & mining) | | | | | | |
Henan Shuanghui Investment & Development Co. Ltd. Class A (Consumer staples, Food products) | | | | | | |
Hengan International Group Co. Ltd. (Consumer staples, Personal care products) | | | | | | |
Hengyi Petrochemical Co. Ltd. Class A (Materials, Chemicals)† | | | | | | |
Hithink RoyalFlush Information Network Co. Ltd. Class A (Financials, Capital markets) | | | | | | |
Huadian Power International Corp. Ltd. Class A (Utilities, Independent power and renewable electricity producers) | | | | | | |
Hualan Biological Engineering, Inc. Class A (Health care, Biotechnology) | | | | | | |
Huaneng Power International, Inc. Class A (Utilities, Independent power and renewable electricity producers)† | | | | | | |
Huaneng Power International, Inc. Class H (Utilities, Independent power and renewable electricity producers)† | | | | | | |
Huaxia Bank Co. Ltd. Class A (Financials, Banks) | | | | | | |
Hubei Jumpcan Pharmaceutical Co. Ltd. Class A (Health care, Pharmaceuticals) | | | | | | |
Humanwell Healthcare Group Co. Ltd. Class A (Health care, Pharmaceuticals) | | | | | | |
Hunan Changyuan Lico Co. Ltd. Class A (Materials, Chemicals) | | | | | | |
Hunan Valin Steel Co. Ltd. Class A (Materials, Metals & mining) | | | | | | |
Hundsun Technologies, Inc. Class A (Information technology, Software) | | | | | | |
Imeik Technology Development Co. Ltd. Class A (Health care, Biotechnology) | | | | | | |
Industrial & Commercial Bank of China Ltd. Class H (Financials, Banks) | | | | | | |
Inner Mongolia Yitai Coal Co. Ltd. Class B (Energy, Oil, gas & consumable fuels)† | | | | | | |
Isoftstone Information Technology Group Co. Ltd. Class A (Information technology, IT services)† | | | | | | |
JCET Group Co. Ltd. Class A (Information technology, Semiconductors & semiconductor equipment) | | | | | | |
JD.com, Inc. Class A (Consumer discretionary, Broadline retail)† | | | | | | |
Jiangsu Expressway Co. Ltd. Class H (Industrials, Transportation infrastructure) | | | | | | |
Jiangsu Pacific Quartz Co. Ltd. Class A (Information technology, Semiconductors & semiconductor equipment) | | | | | | |
Jiangsu Yuyue Medical Equipment & Supply Co. Ltd. Class A (Health care, Health care equipment & supplies) | | | | | | |
Jiangsu Zhongtian Technology Co. Ltd. Class A (Industrials, Electrical equipment) | | | | | | |
Jiangxi Copper Co. Ltd. Class A (Materials, Metals & mining) | | | | | | |
Jiangxi Copper Co. Ltd. Class H (Materials, Metals & mining) | | | | | | |
Jiangxi Special Electric Motor Co. Ltd. Class A (Industrials, Electrical equipment)† | | | | | | |
Jiumaojiu International Holdings Ltd. (Consumer discretionary, Hotels, restaurants & leisure)144A | | | | | | |
Jizhong Energy Resources Co. Ltd. Class A (Energy, Oil, gas & consumable fuels) | | | | | | |
Joincare Pharmaceutical Group Industry Co. Ltd. Class A (Health care, Pharmaceuticals) | | | | | | |
The accompanying notes are an integral part of these financial statements.
Allspring Factor Enhanced Emerging Markets Equity Portfolio | 7
Portfolio of investments—August 31, 2023 (unaudited)
| | | | | |
| | | | | | |
Joinn Laboratories China Co. Ltd. Class A (Health care, Life sciences tools & services) | | | | | | |
Jointown Pharmaceutical Group Co. Ltd. Class A (Health care, Health care providers & services) | | | | | | |
Kingboard Holdings Ltd. (Information technology, Electronic equipment, instruments & components) | | | | | | |
Kuaishou Technology (Communication services, Interactive media & services)144A† | | | | | | |
Kunlun Energy Co. Ltd. (Utilities, Gas utilities) | | | | | | |
Kunlun Tech Co. Ltd. Class A (Communication services, Entertainment)† | | | | | | |
Kweichow Moutai Co. Ltd. Class A (Consumer staples, Beverages) | | | | | | |
Lepu Medical Technology Beijing Co. Ltd. Class A (Health care, Health care equipment & supplies) | | | | | | |
Li Auto, Inc. Class A (Consumer discretionary, Automobiles)† | | | | | | |
Li Ning Co. Ltd. (Consumer discretionary, Textiles, apparel & luxury goods) | | | | | | |
Lingyi iTech Guangdong Co. Class A (Information technology, Electronic equipment, instruments & components)† | | | | | | |
Livzon Pharmaceutical Group, Inc. Class A (Health care, Pharmaceuticals) | | | | | | |
Longfor Group Holdings Ltd. (Real estate, Real estate management & development)144A | | | | | | |
Luxi Chemical Group Co. Ltd. Class A (Materials, Chemicals) | | | | | | |
Meituan Class B (Consumer discretionary, Hotels, restaurants & leisure)144A† | | | | | | |
Minth Group Ltd. (Consumer discretionary, Automobile components) | | | | | | |
NetEase, Inc. (Communication services, Entertainment) | | | | | | |
New Oriental Education & Technology Group, Inc. (Consumer discretionary, Diversified consumer services)† | | | | | | |
PDD Holdings, Inc. ADR (Consumer discretionary, Broadline retail)† | | | | | | |
People’s Insurance Co. Group of China Ltd. Class H (Financials, Insurance)† | | | | | | |
Perfect World Co. Ltd. Class A (Communication services, Entertainment) | | | | | | |
PetroChina Co. Ltd. Class H (Energy, Oil, gas & consumable fuels) | | | | | | |
Pharmaron Beijing Co. Ltd. Class A (Health care, Life sciences tools & services) | | | | | | |
Pharmaron Beijing Co. Ltd. Class H (Health care, Life sciences tools & services)144A | | | | | | |
PICC Property & Casualty Co. Ltd. Class H (Financials, Insurance) | | | | | | |
Ping An Insurance Group Co. of China Ltd. Class H (Financials, Insurance) | | | | | | |
Postal Savings Bank of China Co. Ltd. Class H (Financials, Banks)144A | | | | | | |
Risen Energy Co. Ltd. Class A (Information technology, Semiconductors & semiconductor equipment) | | | | | | |
SDIC Power Holdings Co. Ltd. Class A (Utilities, Independent power and renewable electricity producers) | | | | | | |
Seazen Holdings Co. Ltd. Class A (Real estate, Real estate management & development)† | | | | | | |
Shandong Hualu Hengsheng Chemical Co. Ltd. Class A (Materials, Chemicals) | | | | | | |
Shandong Weigao Group Medical Polymer Co. Ltd. Class H (Health care, Health care equipment & supplies) | | | | | | |
Shanghai Aiko Solar Energy Co. Ltd. Class A (Information technology, Semiconductors & semiconductor equipment)† | | | | | | |
Shanghai Baosight Software Co. Ltd. Class A (Information technology, Software) | | | | | | |
Shanghai Baosight Software Co. Ltd. Class B (Information technology, Software) | | | | | | |
Shanghai Fudan Microelectronics Group Co. Ltd. Class A (Information technology, Semiconductors & semiconductor equipment) | | | | | | |
The accompanying notes are an integral part of these financial statements.
8 | Allspring Factor Enhanced Emerging Markets Equity Portfolio
Portfolio of investments—August 31, 2023 (unaudited)
| | | | | |
| | | | | | |
Shanghai Fudan Microelectronics Group Co. Ltd. Class H (Information technology, Semiconductors & semiconductor equipment) | | | | | | |
Shanghai Lujiazui Finance & Trade Zone Development Co. Ltd. Class B (Real estate, Real estate management & development) | | | | | | |
Shanghai M&G Stationery, Inc. Class A (Industrials, Commercial services & supplies) | | | | | | |
Shanghai Pharmaceuticals Holding Co. Ltd. Class A (Health care, Health care providers & services) | | | | | | |
Shanghai Pharmaceuticals Holding Co. Ltd. Class H (Health care, Health care providers & services) | | | | | | |
Shanghai RAAS Blood Products Co. Ltd. Class A (Health care, Biotechnology) | | | | | | |
Shanxi Coal International Energy Group Co. Ltd. Class A (Industrials, Trading companies & distributors) | | | | | | |
Shenergy Co. Ltd. Class A (Utilities, Independent power and renewable electricity producers) | | | | | | |
Shenzhen International Holdings Ltd. (Industrials, Transportation infrastructure) | | | | | | |
Shenzhen Kstar Science & Technology Co. Ltd. Class A (Industrials, Electrical equipment) | | | | | | |
Shenzhen Mindray Bio-Medical Electronics Co. Ltd. Class A (Health care, Health care equipment & supplies) | | | | | | |
Shenzhen New Industries Biomedical Engineering Co. Ltd. Class A (Health care, Health care equipment & supplies) | | | | | | |
Shenzhen SED Industry Co. Ltd. Class A (Information technology, Electronic equipment, instruments & components) | | | | | | |
Shenzhen Transsion Holdings Co. Ltd. Class A (Information technology, Technology hardware, storage & peripherals) | | | | | | |
Shenzhou International Group Holdings Ltd. (Consumer discretionary, Textiles, apparel & luxury goods) | | | | | | |
Shijiazhuang Yiling Pharmaceutical Co. Ltd. Class A (Health care, Pharmaceuticals) | | | | | | |
Sichuan Kelun Pharmaceutical Co. Ltd. Class A (Health care, Pharmaceuticals) | | | | | | |
Sichuan Yahua Industrial Group Co. Ltd. Class A (Materials, Chemicals) | | | | | | |
Sieyuan Electric Co. Ltd. Class A (Industrials, Electrical equipment) | | | | | | |
Silergy Corp. (Information technology, Semiconductors & semiconductor equipment) | | | | | | |
Sinopec Shanghai Petrochemical Co. Ltd. Class A (Materials, Chemicals)† | | | | | | |
Sinopharm Group Co. Ltd. Class H (Health care, Health care providers & services) | | | | | | |
Tencent Holdings Ltd. (Communication services, Interactive media & services) | | | | | | |
Tingyi Cayman Islands Holding Corp. (Consumer staples, Food products) | | | | | | |
Toly Bread Co. Ltd. Class A (Consumer staples, Food products) | | | | | | |
TongFu Microelectronics Co. Ltd. Class A (Information technology, Semiconductors & semiconductor equipment) | | | | | | |
Tongling Nonferrous Metals Group Co. Ltd. Class A (Materials, Metals & mining) | | | | | | |
Topsports International Holdings Ltd. (Consumer discretionary, Specialty retail)144A | | | | | | |
TravelSky Technology Ltd. Class H (Consumer discretionary, Hotels, restaurants & leisure) | | | | | | |
Trip.com Group Ltd. (Consumer discretionary, Hotels, restaurants & leisure)† | | | | | | |
Tsingtao Brewery Co. Ltd. Class H (Consumer staples, Beverages) | | | | | | |
Uni-President China Holdings Ltd. (Consumer staples, Food products) | | | | | | |
Unisplendour Corp. Ltd. Class A (Information technology, Electronic equipment, instruments & components)† | | | | | | |
The accompanying notes are an integral part of these financial statements.
Allspring Factor Enhanced Emerging Markets Equity Portfolio | 9
Portfolio of investments—August 31, 2023 (unaudited)
| | | | | |
| | | | | | |
Universal Scientific Industrial Shanghai Co. Ltd. Class A (Information technology, Electronic equipment, instruments & components) | | | | | | |
Vipshop Holdings Ltd. ADR (Consumer discretionary, Broadline retail)† | | | | | | |
Weibo Corp. ADR (Communication services, Interactive media & services) | | | | | | |
Weichai Power Co. Ltd. Class H (Industrials, Machinery)† | | | | | | |
Western Mining Co. Ltd. Class A (Materials, Metals & mining) | | | | | | |
WUS Printed Circuit Kunshan Co. Ltd. Class A (Information technology, Electronic equipment, instruments & components) | | | | | | |
WuXi AppTec Co. Ltd. Class A (Health care, Life sciences tools & services) | | | | | | |
WuXi AppTec Co. Ltd. Class H (Health care, Life sciences tools & services)144A | | | | | | |
Wuxi Biologics Cayman, Inc. (Health care, Life sciences tools & services)144A† | | | | | | |
Xiamen C & D, Inc. Class A (Industrials, Trading companies & distributors) | | | | | | |
Xiaomi Corp. Class B (Information technology, Technology hardware, storage & peripherals)144A† | | | | | | |
Xinjiang Daqo New Energy Co. Ltd. Class A (Information technology, Semiconductors & semiconductor equipment) | | | | | | |
Xinjiang Zhongtai Chemical Co. Ltd. Class A (Materials, Chemicals) | | | | | | |
XPeng, Inc. Class A (Consumer discretionary, Automobiles)† | | | | | | |
Yadea Group Holdings Ltd. (Consumer discretionary, Automobiles)144A | | | | | | |
Yankuang Energy Group Co. Ltd. Class H (Energy, Oil, gas & consumable fuels) | | | | | | |
Yifeng Pharmacy Chain Co. Ltd. Class A (Consumer staples, Consumer staples distribution & retail) | | | | | | |
Yihai International Holding Ltd. (Consumer staples, Food products)† | | | | | | |
Yonghui Superstores Co. Ltd. Class A (Consumer staples, Consumer staples distribution & retail)† | | | | | | |
Youngor Group Co. Ltd. Class A (Real estate, Real estate management & development) | | | | | | |
Youngy Co. Ltd. Class A (Materials, Metals & mining)† | | | | | | |
Yunnan Aluminium Co. Ltd. Class A (Materials, Metals & mining) | | | | | | |
Yunnan Tin Co. Ltd. Class A (Materials, Metals & mining) | | | | | | |
Yunnan Yuntianhua Co. Ltd. Class A (Materials, Chemicals)† | | | | | | |
Zai Lab Ltd. (Health care, Biotechnology)† | | | | | | |
Zhefu Holding Group Co. Ltd. Class A (Industrials, Electrical equipment) | | | | | | |
Zhejiang China Commodities City Group Co. Ltd. Class A (Real estate, Real estate management & development) | | | | | | |
Zhejiang Expressway Co. Ltd. Class H (Industrials, Transportation infrastructure) | | | | | | |
Zhejiang Supor Co. Ltd. Class A (Consumer discretionary, Household durables) | | | | | | |
Zhejiang Weixing New Building Materials Co. Ltd. Class A (Industrials, Building products) | | | | | | |
Zhejiang Zheneng Electric Power Co. Ltd. Class A (Utilities, Independent power and renewable electricity producers)† | | | | | | |
Zhongjin Gold Corp. Ltd. Class A (Materials, Metals & mining) | | | | | | |
Zhongsheng Group Holdings Ltd. (Consumer discretionary, Specialty retail) | | | | | | |
Zhuzhou CRRC Times Electric Co. Ltd. (Industrials, Machinery) | | | | | | |
Zijin Mining Group Co. Ltd. Class H (Materials, Metals & mining)† | | | | | | |
ZTE Corp. Class H (Information technology, Communications equipment) | | | | | | |
| | | | | | |
The accompanying notes are an integral part of these financial statements.
10 | Allspring Factor Enhanced Emerging Markets Equity Portfolio
Portfolio of investments—August 31, 2023 (unaudited)
| | | | | |
| | | | | | |
Bancolombia SA (Financials, Banks) | | | | | | |
| | | | | | |
Komercni Banka AS (Financials, Banks) | | | | | | |
Moneta Money Bank AS (Financials, Banks)144A | | | | | | |
| | | | | | |
| | | | | | |
Commercial International Bank Egypt SAE ADR (Financials, Banks) | | | | | | |
| | | | | | |
Alpha Services & Holdings SA (Financials, Banks)† | | | | | | |
Eurobank Ergasias Services & Holdings SA Class A (Financials, Banks)† | | | | | | |
FF Group (Consumer discretionary, Textiles, apparel & luxury goods)♦† | | | | | | |
Hellenic Telecommunications Organization SA (Communication services, Diversified telecommunication services) | | | | | | |
JUMBO SA (Consumer discretionary, Specialty retail) | | | | | | |
Motor Oil Hellas Corinth Refineries SA (Energy, Oil, gas & consumable fuels) | | | | | | |
Mytilineos SA (Industrials, Industrial conglomerates) | | | | | | |
National Bank of Greece SA (Financials, Banks)† | | | | | | |
OPAP SA (Consumer discretionary, Hotels, restaurants & leisure)† | | | | | | |
| | | | | | |
| | | | | | |
Beijing Enterprises Holdings Ltd. (Utilities, Gas utilities) | | | | | | |
China Everbright Environment Group Ltd. (Industrials, Commercial services & supplies) | | | | | | |
China Jinmao Holdings Group Ltd. (Real estate, Real estate management & development) | | | | | | |
China Merchants Port Holdings Co. Ltd. (Industrials, Transportation infrastructure) | | | | | | |
China Overseas Land & Investment Ltd. (Real estate, Real estate management & development) | | | | | | |
China Resources Beer Holdings Co. Ltd. (Consumer staples, Beverages) | | | | | | |
China Resources Pharmaceutical Group Ltd. (Health care, Pharmaceuticals)144A | | | | | | |
China Resources Power Holdings Co. Ltd. (Utilities, Independent power and renewable electricity producers) | | | | | | |
China Taiping Insurance Holdings Co. Ltd. (Financials, Insurance) | | | | | | |
China Traditional Chinese Medicine Holdings Co. Ltd. (Health care, Pharmaceuticals)† | | | | | | |
CITIC Ltd. (Industrials, Industrial conglomerates) | | | | | | |
CSPC Pharmaceutical Group Ltd. (Health care, Pharmaceuticals) | | | | | | |
Far East Horizon Ltd. (Financials, Financial services) | | | | | | |
Hua Hong Semiconductor Ltd. (Information technology, Semiconductors & semiconductor equipment)144A† | | | | | | |
Kingboard Laminates Holdings Ltd. (Information technology, Electronic equipment, instruments & components) | | | | | | |
Lenovo Group Ltd. (Information technology, Technology hardware, storage & peripherals) | | | | | | |
The accompanying notes are an integral part of these financial statements.
Allspring Factor Enhanced Emerging Markets Equity Portfolio | 11
Portfolio of investments—August 31, 2023 (unaudited)
| | | | | |
| | | | | | |
Orient Overseas International Ltd. (Industrials, Marine transportation) | | | | | | |
Yuexiu Property Co. Ltd. (Real estate, Real estate management & development) | | | | | | |
| | | | | | |
| | | | | | |
MOL Hungarian Oil & Gas PLC (Energy, Oil, gas & consumable fuels) | | | | | | |
OTP Bank Nyrt (Financials, Banks) | | | | | | |
Richter Gedeon Nyrt (Health care, Pharmaceuticals) | | | | | | |
| | | | | | |
| | | | | | |
ABB India Ltd. (Industrials, Electrical equipment) | | | | | | |
Apollo Hospitals Enterprise Ltd. (Health care, Health care providers & services) | | | | | | |
Asian Paints Ltd. (Materials, Chemicals) | | | | | | |
AU Small Finance Bank Ltd. (Financials, Banks)144A | | | | | | |
Aurobindo Pharma Ltd. (Health care, Pharmaceuticals) | | | | | | |
Avenue Supermarts Ltd. (Consumer staples, Consumer staples distribution & retail)144A† | | | | | | |
Axis Bank Ltd. (Financials, Banks) | | | | | | |
Bajaj Auto Ltd. (Consumer discretionary, Automobiles) | | | | | | |
Bajaj Finance Ltd. (Financials, Consumer finance) | | | | | | |
Bajaj Finserv Ltd. (Financials, Financial services) | | | | | | |
Bandhan Bank Ltd. (Financials, Banks)144A | | | | | | |
Bank of Baroda (Financials, Banks) | | | | | | |
Bharat Electronics Ltd. (Industrials, Aerospace & defense) | | | | | | |
Bharat Petroleum Corp. Ltd. (Energy, Oil, gas & consumable fuels) | | | | | | |
Bharti Airtel Ltd. (Communication services, Wireless telecommunication services) | | | | | | |
Britannia Industries Ltd. (Consumer staples, Food products) | | | | | | |
CG Power & Industrial Solutions Ltd. (Industrials, Electrical equipment) | | | | | | |
Cholamandalam Investment & Finance Co. Ltd. (Financials, Consumer finance) | | | | | | |
Cipla Ltd. (Health care, Pharmaceuticals) | | | | | | |
Coal India Ltd. (Energy, Oil, gas & consumable fuels) | | | | | | |
Colgate-Palmolive India Ltd. (Consumer staples, Personal care products) | | | | | | |
Container Corp. Of India Ltd. (Industrials, Ground transportation) | | | | | | |
Dabur India Ltd. (Consumer staples, Personal care products) | | | | | | |
Divi’s Laboratories Ltd. (Health care, Life sciences tools & services) | | | | | | |
DLF Ltd. (Real estate, Real estate management & development) | | | | | | |
Dr Reddy’s Laboratories Ltd. (Health care, Pharmaceuticals) | | | | | | |
Eicher Motors Ltd. (Consumer discretionary, Automobiles) | | | | | | |
GAIL India Ltd. (Utilities, Gas utilities) | | | | | | |
Godrej Consumer Products Ltd. (Consumer staples, Personal care products)† | | | | | | |
Havells India Ltd. (Industrials, Electrical equipment) | | | | | | |
HCL Technologies Ltd. (Information technology, IT services) | | | | | | |
HDFC Life Insurance Co. Ltd. (Financials, Insurance)144A | | | | | | |
Hero MotoCorp Ltd. (Consumer discretionary, Automobiles) | | | | | | |
Hindalco Industries Ltd. (Materials, Metals & mining) | | | | | | |
Hindustan Aeronautics Ltd. (Industrials, Aerospace & defense) | | | | | | |
Hindustan Petroleum Corp. Ltd. (Energy, Oil, gas & consumable fuels) | | | | | | |
Hindustan Unilever Ltd. (Consumer staples, Personal care products) | | | | | | |
The accompanying notes are an integral part of these financial statements.
12 | Allspring Factor Enhanced Emerging Markets Equity Portfolio
Portfolio of investments—August 31, 2023 (unaudited)
| | | | | |
| | | | | | |
ICICI Bank Ltd. (Financials, Banks) | | | | | | |
ICICI Lombard General Insurance Co. Ltd. (Financials, Insurance)144A | | | | | | |
Indian Hotels Co. Ltd. (Consumer discretionary, Hotels, restaurants & leisure) | | | | | | |
Indian Oil Corp. Ltd. (Energy, Oil, gas & consumable fuels) | | | | | | |
Indraprastha Gas Ltd. (Utilities, Gas utilities) | | | | | | |
Info Edge India Ltd. (Communication services, Interactive media & services) | | | | | | |
Infosys Ltd. (Information technology, IT services) | | | | | | |
InterGlobe Aviation Ltd. (Industrials, Passenger airlines)144A† | | | | | | |
ITC Ltd. (Consumer staples, Tobacco) | | | | | | |
Jindal Steel & Power Ltd. (Materials, Metals & mining) | | | | | | |
Jio Financial Services Ltd. (Financials, Financial services)† | | | | | | |
JSW Steel Ltd. (Materials, Metals & mining) | | | | | | |
Jubilant Foodworks Ltd. (Consumer discretionary, Hotels, restaurants & leisure) | | | | | | |
Kotak Mahindra Bank Ltd. (Financials, Banks) | | | | | | |
Larsen & Toubro Ltd. (Industrials, Construction & engineering) | | | | | | |
LTIMindtree Ltd. (Information technology, IT services)144A | | | | | | |
Lupin Ltd. (Health care, Pharmaceuticals) | | | | | | |
Mahindra & Mahindra Ltd. (Consumer discretionary, Automobiles) | | | | | | |
Marico Ltd. (Consumer staples, Food products) | | | | | | |
Maruti Suzuki India Ltd. (Consumer discretionary, Automobiles) | | | | | | |
MRF Ltd. (Consumer discretionary, Automobile components) | | | | | | |
Muthoot Finance Ltd. (Financials, Consumer finance) | | | | | | |
Nestle India Ltd. (Consumer staples, Food products) | | | | | | |
NTPC Ltd. (Utilities, Independent power and renewable electricity producers) | | | | | | |
Oil & Natural Gas Corp. Ltd. (Energy, Oil, gas & consumable fuels) | | | | | | |
Petronet LNG Ltd. (Energy, Oil, gas & consumable fuels) | | | | | | |
PI Industries Ltd. (Materials, Chemicals) | | | | | | |
Pidilite Industries Ltd. (Materials, Chemicals) | | | | | | |
Power Grid Corp. of India Ltd. (Utilities, Electric utilities) | | | | | | |
Reliance Industries Ltd. (Energy, Oil, gas & consumable fuels) | | | | | | |
Samvardhana Motherson International Ltd. (Consumer discretionary, Automobile components) | | | | | | |
SBI Life Insurance Co. Ltd. (Financials, Insurance)144A | | | | | | |
Shree Cement Ltd. (Materials, Construction materials) | | | | | | |
Shriram Finance Ltd. (Financials, Consumer finance) | | | | | | |
Siemens Ltd. (Industrials, Industrial conglomerates) | | | | | | |
SRF Ltd. (Materials, Chemicals) | | | | | | |
State Bank of India (Financials, Banks) | | | | | | |
Sun Pharmaceutical Industries Ltd. (Health care, Pharmaceuticals) | | | | | | |
Tata Consultancy Services Ltd. (Information technology, IT services) | | | | | | |
Tata Elxsi Ltd. (Information technology, Software) | | | | | | |
Tata Motors Ltd. (Consumer discretionary, Automobiles) | | | | | | |
Tata Power Co. Ltd. (Utilities, Electric utilities) | | | | | | |
Tata Steel Ltd. (Materials, Metals & mining) | | | | | | |
Tech Mahindra Ltd. (Information technology, IT services) | | | | | | |
Titan Co. Ltd. (Consumer discretionary, Textiles, apparel & luxury goods) | | | | | | |
Torrent Pharmaceuticals Ltd. (Health care, Pharmaceuticals) | | | | | | |
Tube Investments of India Ltd. (Consumer discretionary, Automobile components) | | | | | | |
TVS Motor Co. Ltd. (Consumer discretionary, Automobiles) | | | | | | |
The accompanying notes are an integral part of these financial statements.
Allspring Factor Enhanced Emerging Markets Equity Portfolio | 13
Portfolio of investments—August 31, 2023 (unaudited)
| | | | | |
| | | | | | |
UltraTech Cement Ltd. (Materials, Construction materials) | | | | | | |
United Spirits Ltd. (Consumer staples, Beverages)† | | | | | | |
UPL Ltd. (Materials, Chemicals) | | | | | | |
Varun Beverages Ltd. (Consumer staples, Beverages) | | | | | | |
Vedanta Ltd. (Materials, Metals & mining) | | | | | | |
Yes Bank Ltd. (Financials, Banks)† | | | | | | |
| | | | | | |
| | | | | | |
Adaro Energy Indonesia Tbk PT (Energy, Oil, gas & consumable fuels) | | | | | | |
Aneka Tambang Tbk PT (Materials, Metals & mining) | | | | | | |
Astra International Tbk PT (Industrials, Industrial conglomerates) | | | | | | |
Bank Central Asia Tbk PT (Financials, Banks) | | | | | | |
Bank Mandiri Persero Tbk PT (Financials, Banks) | | | | | | |
Bank Negara Indonesia Persero Tbk PT (Financials, Banks) | | | | | | |
Bank Rakyat Indonesia Persero Tbk PT (Financials, Banks)† | | | | | | |
Charoen Pokphand Indonesia Tbk PT (Consumer staples, Food products)† | | | | | | |
Hanson International Tbk PT (Real estate, Real estate management & development)♦† | | | | | | |
Indofood CBP Sukses Makmur Tbk PT (Consumer staples, Food products) | | | | | | |
Indofood Sukses Makmur Tbk PT (Consumer staples, Food products) | | | | | | |
Kalbe Farma Tbk PT (Health care, Pharmaceuticals) | | | | | | |
Semen Indonesia Persero Tbk PT (Materials, Construction materials) | | | | | | |
Sumber Alfaria Trijaya Tbk PT (Consumer staples, Consumer staples distribution & retail) | | | | | | |
Telkom Indonesia Persero Tbk PT (Communication services, Diversified telecommunication services) | | | | | | |
Unilever Indonesia Tbk PT (Consumer staples, Household products) | | | | | | |
| | | | | | |
| | | | | | |
Agility Public Warehousing Co. KSC (Industrials, Air freight & logistics)† | | | | | | |
Gulf Bank KSCP (Financials, Banks) | | | | | | |
Kuwait Finance House KSCP (Financials, Banks) | | | | | | |
Mabanee Co. KPSC (Real estate, Real estate management & development) | | | | | | |
Mobile Telecommunications Co. KSCP (Communication services, Wireless telecommunication services) | | | | | | |
National Bank of Kuwait SAKP (Financials, Banks) | | | | | | |
| | | | | | |
| | | | | | |
Reinet Investments SCA (Financials, Capital markets) | | | | | | |
| | | | | | |
AMMB Holdings Bhd (Financials, Banks) | | | | | | |
CIMB Group Holdings Bhd (Financials, Banks) | | | | | | |
Gamuda Bhd (Industrials, Construction & engineering) | | | | | | |
Genting Bhd (Consumer discretionary, Hotels, restaurants & leisure) | | | | | | |
Genting Malaysia Bhd (Consumer discretionary, Hotels, restaurants & leisure) | | | | | | |
The accompanying notes are an integral part of these financial statements.
14 | Allspring Factor Enhanced Emerging Markets Equity Portfolio
Portfolio of investments—August 31, 2023 (unaudited)
| | | | | |
| | | | | | |
Hong Leong Bank Bhd (Financials, Banks) | | | | | | |
Hong Leong Financial Group Bhd (Financials, Banks) | | | | | | |
Inari Amertron Bhd (Information technology, Semiconductors & semiconductor equipment) | | | | | | |
IOI Corp. Bhd (Consumer staples, Food products) | | | | | | |
Kuala Lumpur Kepong Bhd (Consumer staples, Food products) | | | | | | |
Malayan Banking Bhd (Financials, Banks) | | | | | | |
Malaysia Airports Holdings Bhd (Industrials, Transportation infrastructure)† | | | | | | |
Maxis Bhd (Communication services, Wireless telecommunication services) | | | | | | |
Nestle Malaysia Bhd (Consumer staples, Food products) | | | | | | |
Petronas Chemicals Group Bhd (Materials, Chemicals) | | | | | | |
Petronas Dagangan Bhd (Energy, Oil, gas & consumable fuels) | | | | | | |
PPB Group Bhd (Consumer staples, Food products) | | | | | | |
Press Metal Aluminium Holdings Bhd (Materials, Metals & mining) | | | | | | |
Public Bank Bhd (Financials, Banks) | | | | | | |
QL Resources Bhd (Consumer staples, Food products) | | | | | | |
RHB Bank Bhd (Financials, Banks) | | | | | | |
Sime Darby Bhd (Industrials, Industrial conglomerates) | | | | | | |
Sime Darby Plantation Bhd (Consumer staples, Food products) | | | | | | |
Telekom Malaysia Bhd (Communication services, Diversified telecommunication services) | | | | | | |
Tenaga Nasional Bhd (Utilities, Electric utilities) | | | | | | |
Top Glove Corp. Bhd (Health care, Health care equipment & supplies)† | | | | | | |
| | | | | | |
| | | | | | |
Alfa SAB de CV Class A (Industrials, Industrial conglomerates) | | | | | | |
America Movil SAB de CV (Communication services, Wireless telecommunication services) | | | | | | |
Arca Continental SAB de CV (Consumer staples, Beverages) | | | | | | |
Banco del Bajio SA (Financials, Banks)144A | | | | | | |
Cemex SAB de CV (Materials, Construction materials)† | | | | | | |
Coca-Cola Femsa SAB de CV (Consumer staples, Beverages) | | | | | | |
Fibra Uno Administracion SA de CV (Real estate, Diversified REITs) | | | | | | |
Fomento Economico Mexicano SAB de CV (Consumer staples, Beverages) | | | | | | |
Gruma SAB de CV Class B (Consumer staples, Food products) | | | | | | |
Grupo Aeroportuario del Pacifico SAB de CV Class B (Industrials, Transportation infrastructure) | | | | | | |
Grupo Aeroportuario del Sureste SAB de CV Class B (Industrials, Transportation infrastructure) | | | | | | |
Grupo Bimbo SAB de CV Class A (Consumer staples, Food products) | | | | | | |
Grupo Carso SAB de CV (Industrials, Industrial conglomerates) | | | | | | |
Grupo Financiero Banorte SAB de CV Class O (Financials, Banks) | | | | | | |
Grupo Financiero Inbursa SAB de CV Class O (Financials, Banks)† | | | | | | |
Grupo Mexico SAB de CV Class B (Materials, Metals & mining) | | | | | | |
Kimberly-Clark de Mexico SAB de CV Class A (Consumer staples, Household products) | | | | | | |
Orbia Advance Corp. SAB de CV (Materials, Chemicals) | | | | | | |
The accompanying notes are an integral part of these financial statements.
Allspring Factor Enhanced Emerging Markets Equity Portfolio | 15
Portfolio of investments—August 31, 2023 (unaudited)
| | | | | |
| | | | | | |
Promotora y Operadora de Infraestructura SAB de CV (Industrials, Transportation infrastructure) | | | | | | |
Wal-Mart de Mexico SAB de CV (Consumer staples, Consumer staples distribution & retail) | | | | | | |
| | | | | | |
| | | | | | |
NEPI Rockcastle NV (Real estate, Real estate management & development)† | | | | | | |
Pepco Group NV (Consumer discretionary, Broadline retail)† | | | | | | |
| | | | | | |
| | | | | | |
Credicorp Ltd. (Financials, Banks) | | | | | | |
| | | | | | |
ACEN Corp. (Utilities, Independent power and renewable electricity producers) | | | | | | |
Ayala Corp. (Industrials, Industrial conglomerates) | | | | | | |
Bank of the Philippine Islands (Financials, Banks) | | | | | | |
BDO Unibank, Inc. (Financials, Banks) | | | | | | |
Energy Development Corp. (Utilities, Independent power and renewable electricity producers)♦† | | | | | | |
International Container Terminal Services, Inc. (Industrials, Transportation infrastructure) | | | | | | |
Jollibee Foods Corp. (Consumer discretionary, Hotels, restaurants & leisure) | | | | | | |
Manila Electric Co. (Utilities, Electric utilities) | | | | | | |
Metropolitan Bank & Trust Co. (Financials, Banks) | | | | | | |
PLDT, Inc. (Communication services, Wireless telecommunication services) | | | | | | |
Universal Robina Corp. (Consumer staples, Food products) | | | | | | |
| | | | | | |
| | | | | | |
Bank Polska Kasa Opieki SA (Financials, Banks) | | | | | | |
CD Projekt SA (Communication services, Entertainment) | | | | | | |
Cyfrowy Polsat SA (Communication services, Media)† | | | | | | |
Dino Polska SA (Consumer staples, Consumer staples distribution & retail)144A† | | | | | | |
KGHM Polska Miedz SA (Materials, Metals & mining) | | | | | | |
mBank SA (Financials, Banks)† | | | | | | |
PGE Polska Grupa Energetyczna SA (Utilities, Electric utilities)† | | | | | | |
Polski Koncern Naftowy ORLEN SA (Energy, Oil, gas & consumable fuels) | | | | | | |
Powszechna Kasa Oszczednosci Bank Polski SA (Financials, Banks)† | | | | | | |
Powszechny Zaklad Ubezpieczen SA (Financials, Insurance)† | | | | | | |
Santander Bank Polska SA (Financials, Banks)† | | | | | | |
| | | | | | |
| | | | | | |
Alrosa PJSC (Acquired 5-6-2021, cost $89,583) (Materials, Metals & mining)♦†˃ | | | | | | |
Gazprom PJSC (Acquired 1-29-2019, cost $384,585) (Energy, Oil, gas & consumable fuels)♦†˃ | | | | | | |
Inter RAO UES PJSC (Acquired 5-7-2020, cost $59,563) (Utilities, Electric utilities)♦†˃ | | | | | | |
The accompanying notes are an integral part of these financial statements.
16 | Allspring Factor Enhanced Emerging Markets Equity Portfolio
Portfolio of investments—August 31, 2023 (unaudited)
| | | | | |
| | | | | | |
LUKOIL PJSC (Acquired 3-18-2020, cost $576,228) (Energy, Oil, gas & consumable fuels)♦†˃ | | | | | | |
Magnit PJSC GDR (Acquired 7-8-2021, cost $58) (Consumer staples, Consumer staples distribution & retail)♦‡†˃ | | | | | | |
MMC Norilsk Nickel PJSC (Acquired 6-6-2017, cost $349,985) (Materials, Metals & mining)♦†˃ | | | | | | |
Mobile TeleSystems PJSC (Acquired 10-9-2020, cost $54,568) (Communication services, Wireless telecommunication services)♦†˃ | | | | | | |
Novolipetsk Steel PJSC (Acquired 5-7-2020, cost $58,368) (Materials, Metals & mining)♦†˃ | | | | | | |
PhosAgro PJSC (Acquired 4-8-2021, cost $323) (Materials, Chemicals)♦‡†˃ | | | | | | |
PhosAgro PJSC (Acquired 4-8-2021, cost $50,199) (Materials, Chemicals)♦†˃ | | | | | | |
PhosAgro PJSC GDR (Acquired 4-8-2021, cost $0) (Materials, Chemicals)♦‡†˃ | | | | | | |
Polyus PJSC (Acquired 10-15-2021, cost $135,672) (Materials, Metals & mining)♦†˃ | | | | | | |
Rosneft Oil Co. PJSC (Acquired 1-31-2020, cost $125,766) (Energy, Oil, gas & consumable fuels)♦†˃ | | | | | | |
Sberbank of Russia PJSC (Acquired 7-31-2019, cost $713,153) (Financials, Banks)♦†˃ | | | | | | |
Severstal PAO (Acquired 7-5-2020, cost $62,518) (Materials, Metals & mining)♦†˃ | | | | | | |
Tatneft PJSC (Acquired 5-7-2020, cost $171,025) (Energy, Oil, gas & consumable fuels)♦†˃ | | | | | | |
VTB Bank PJSC (Acquired 7-2-2018, cost $13,240) (Financials, Banks)♦†˃ | | | | | | |
| | | | | | |
| | | | | | |
Absa Group Ltd. (Financials, Banks) | | | | | | |
African Rainbow Minerals Ltd. (Materials, Metals & mining) | | | | | | |
Anglo American Platinum Ltd. (Materials, Metals & mining) | | | | | | |
AngloGold Ashanti Ltd. (Materials, Metals & mining) | | | | | | |
Aspen Pharmacare Holdings Ltd. (Health care, Pharmaceuticals) | | | | | | |
Bid Corp. Ltd. (Consumer staples, Consumer staples distribution & retail) | | | | | | |
Bidvest Group Ltd. (Industrials, Industrial conglomerates) | | | | | | |
Capitec Bank Holdings Ltd. (Financials, Banks) | | | | | | |
Clicks Group Ltd. (Consumer staples, Consumer staples distribution & retail) | | | | | | |
Exxaro Resources Ltd. (Energy, Oil, gas & consumable fuels) | | | | | | |
FirstRand Ltd. (Financials, Financial services) | | | | | | |
Foschini Group Ltd. (Consumer discretionary, Specialty retail) | | | | | | |
Gold Fields Ltd. (Materials, Metals & mining) | | | | | | |
Harmony Gold Mining Co. Ltd. (Materials, Metals & mining)† | | | | | | |
Impala Platinum Holdings Ltd. (Materials, Metals & mining) | | | | | | |
Kumba Iron Ore Ltd. (Materials, Metals & mining) | | | | | | |
Mr Price Group Ltd. (Consumer discretionary, Specialty retail) | | | | | | |
MTN Group Ltd. (Communication services, Wireless telecommunication services) | | | | | | |
MultiChoice Group (Communication services, Media)† | | | | | | |
Naspers Ltd. Class N (Consumer discretionary, Broadline retail) | | | | | | |
Nedbank Group Ltd. (Financials, Banks) | | | | | | |
Old Mutual Ltd. (Financials, Insurance) | | | | | | |
OUTsurance Group Ltd. (Financials, Insurance) | | | | | | |
Remgro Ltd. (Financials, Financial services) | | | | | | |
The accompanying notes are an integral part of these financial statements.
Allspring Factor Enhanced Emerging Markets Equity Portfolio | 17
Portfolio of investments—August 31, 2023 (unaudited)
| | | | | |
| | | | | | |
Sanlam Ltd. (Financials, Insurance) | | | | | | |
Sasol Ltd. (Materials, Chemicals) | | | | | | |
Shoprite Holdings Ltd. (Consumer staples, Consumer staples distribution & retail) | | | | | | |
Sibanye Stillwater Ltd. (Materials, Metals & mining) | | | | | | |
Standard Bank Group Ltd. (Financials, Banks) | | | | | | |
Woolworths Holdings Ltd. (Consumer discretionary, Broadline retail) | | | | | | |
| | | | | | |
| | | | | | |
Amorepacific Corp. (Consumer staples, Personal care products) | | | | | | |
BGF retail Co. Ltd. (Consumer staples, Consumer staples distribution & retail) | | | | | | |
Celltrion, Inc. (Health care, Biotechnology) | | | | | | |
CJ Corp. (Industrials, Industrial conglomerates) | | | | | | |
Coway Co. Ltd. (Consumer discretionary, Household durables) | | | | | | |
DB Insurance Co. Ltd. (Financials, Insurance) | | | | | | |
Doosan Bobcat, Inc. (Industrials, Machinery) | | | | | | |
Doosan Enerbility Co. Ltd. (Industrials, Electrical equipment)† | | | | | | |
Ecopro BM Co. Ltd. (Industrials, Electrical equipment) | | | | | | |
E-MART, Inc. (Consumer staples, Consumer staples distribution & retail) | | | | | | |
F&F Co. Ltd. (Consumer discretionary, Textiles, apparel & luxury goods) | | | | | | |
GS Holdings Corp. (Industrials, Industrial conglomerates) | | | | | | |
Hana Financial Group, Inc. (Financials, Banks) | | | | | | |
Hankook Tire & Technology Co. Ltd. (Consumer discretionary, Automobile components) | | | | | | |
Hanmi Pharm Co. Ltd. (Health care, Pharmaceuticals) | | | | | | |
Hanon Systems (Consumer discretionary, Automobile components) | | | | | | |
Hanwha Aerospace Co. Ltd. (Industrials, Aerospace & defense) | | | | | | |
Hanwha Solutions Corp. (Materials, Chemicals)† | | | | | | |
HMM Co. Ltd. (Industrials, Marine transportation) | | | | | | |
Hotel Shilla Co. Ltd. (Consumer discretionary, Specialty retail) | | | | | | |
Hyundai Engineering & Construction Co. Ltd. (Industrials, Construction & engineering) | | | | | | |
Hyundai Glovis Co. Ltd. (Industrials, Air freight & logistics) | | | | | | |
Hyundai Mobis Co. Ltd. (Consumer discretionary, Automobile components) | | | | | | |
Hyundai Motor Co. (Consumer discretionary, Automobiles) | | | | | | |
Hyundai Steel Co. (Materials, Metals & mining) | | | | | | |
Industrial Bank of Korea (Financials, Banks) | | | | | | |
Kakao Corp. (Communication services, Interactive media & services) | | | | | | |
Kangwon Land, Inc. (Consumer discretionary, Hotels, restaurants & leisure) | | | | | | |
KB Financial Group, Inc. (Financials, Banks) | | | | | | |
Kia Corp. (Consumer discretionary, Automobiles) | | | | | | |
Korea Investment Holdings Co. Ltd. (Financials, Capital markets) | | | | | | |
Korea Zinc Co. Ltd. (Materials, Metals & mining) | | | | | | |
Korean Air Lines Co. Ltd. (Industrials, Passenger airlines) | | | | | | |
Krafton, Inc. (Communication services, Entertainment)† | | | | | | |
KT&G Corp. (Consumer staples, Tobacco) | | | | | | |
Kumho Petrochemical Co. Ltd. (Materials, Chemicals) | | | | | | |
LG Chem Ltd. (Materials, Chemicals) | | | | | | |
LG Corp. (Industrials, Industrial conglomerates) | | | | | | |
The accompanying notes are an integral part of these financial statements.
18 | Allspring Factor Enhanced Emerging Markets Equity Portfolio
Portfolio of investments—August 31, 2023 (unaudited)
| | | | | |
| | | | | | |
LG Electronics, Inc. (Consumer discretionary, Household durables) | | | | | | |
LG H&H Co. Ltd. (Consumer staples, Personal care products) | | | | | | |
LG Innotek Co. Ltd. (Information technology, Electronic equipment, instruments & components) | | | | | | |
LG Uplus Corp. (Communication services, Diversified telecommunication services) | | | | | | |
Lotte Chemical Corp. (Materials, Chemicals) | | | | | | |
Meritz Financial Group, Inc. (Financials, Financial services) | | | | | | |
Mirae Asset Securities Co. Ltd. (Financials, Capital markets) | | | | | | |
NAVER Corp. (Communication services, Interactive media & services) | | | | | | |
NCSoft Corp. (Communication services, Entertainment) | | | | | | |
NH Investment & Securities Co. Ltd. Class C (Financials, Capital markets) | | | | | | |
Orion Corp. (Consumer staples, Food products) | | | | | | |
Pan Ocean Co. Ltd. (Industrials, Marine transportation) | | | | | | |
POSCO Future M Co. Ltd. (Industrials, Electrical equipment) | | | | | | |
POSCO Holdings, Inc. (Materials, Metals & mining) | | | | | | |
Posco International Corp. (Industrials, Trading companies & distributors) | | | | | | |
Samsung C&T Corp. (Industrials, Industrial conglomerates) | | | | | | |
Samsung Electro-Mechanics Co. Ltd. (Information technology, Electronic equipment, instruments & components) | | | | | | |
Samsung Electronics Co. Ltd. (Information technology, Technology hardware, storage & peripherals) | | | | | | |
Samsung Engineering Co. Ltd. (Industrials, Construction & engineering)† | | | | | | |
Samsung Fire & Marine Insurance Co. Ltd. (Financials, Insurance) | | | | | | |
Samsung Life Insurance Co. Ltd. (Financials, Insurance) | | | | | | |
Samsung SDI Co. Ltd. (Information technology, Electronic equipment, instruments & components) | | | | | | |
Samsung SDS Co. Ltd. (Information technology, IT services) | | | | | | |
Samsung Securities Co. Ltd. (Financials, Capital markets) | | | | | | |
Shinhan Financial Group Co. Ltd. (Financials, Banks) | | | | | | |
SK Hynix, Inc. (Information technology, Semiconductors & semiconductor equipment) | | | | | | |
S-Oil Corp. (Energy, Oil, gas & consumable fuels) | | | | | | |
Woori Financial Group, Inc. (Financials, Banks) | | | | | | |
Yuhan Corp. (Health care, Pharmaceuticals) | | | | | | |
| | | | | | |
| | | | | | |
Accton Technology Corp. (Information technology, Communications equipment) | | | | | | |
Acer, Inc. (Information technology, Technology hardware, storage & peripherals) | | | | | | |
Advantech Co. Ltd. (Information technology, Technology hardware, storage & peripherals) | | | | | | |
ASE Technology Holding Co. Ltd. (Information technology, Semiconductors & semiconductor equipment) | | | | | | |
Asia Cement Corp. (Materials, Construction materials) | | | | | | |
Asustek Computer, Inc. (Information technology, Technology hardware, storage & peripherals) | | | | | | |
AUO Corp. (Information technology, Electronic equipment, instruments & components)† | | | | | | |
The accompanying notes are an integral part of these financial statements.
Allspring Factor Enhanced Emerging Markets Equity Portfolio | 19
Portfolio of investments—August 31, 2023 (unaudited)
| | | | | |
| | | | | | |
Catcher Technology Co. Ltd. (Information technology, Technology hardware, storage & peripherals) | | | | | | |
Cathay Financial Holding Co. Ltd. (Financials, Insurance)† | | | | | | |
Chailease Holding Co. Ltd. (Financials, Financial services) | | | | | | |
Cheng Shin Rubber Industry Co. Ltd. (Consumer discretionary, Automobile components) | | | | | | |
China Airlines Ltd. (Industrials, Passenger airlines) | | | | | | |
China Steel Corp. (Materials, Metals & mining) | | | | | | |
Chunghwa Telecom Co. Ltd. (Communication services, Diversified telecommunication services) | | | | | | |
Compal Electronics, Inc. (Information technology, Technology hardware, storage & peripherals) | | | | | | |
CTBC Financial Holding Co. Ltd. (Financials, Banks) | | | | | | |
Delta Electronics, Inc. (Information technology, Electronic equipment, instruments & components) | | | | | | |
E Ink Holdings, Inc. (Information technology, Electronic equipment, instruments & components) | | | | | | |
E.Sun Financial Holding Co. Ltd. (Financials, Banks) | | | | | | |
Eclat Textile Co. Ltd. (Consumer discretionary, Textiles, apparel & luxury goods) | | | | | | |
eMemory Technology, Inc. (Information technology, Semiconductors & semiconductor equipment) | | | | | | |
Eva Airways Corp. (Industrials, Passenger airlines) | | | | | | |
Evergreen Marine Corp. Taiwan Ltd. (Industrials, Marine transportation) | | | | | | |
Far Eastern New Century Corp. (Industrials, Industrial conglomerates) | | | | | | |
Far EasTone Telecommunications Co. Ltd. (Communication services, Wireless telecommunication services) | | | | | | |
Feng TAY Enterprise Co. Ltd. (Consumer discretionary, Textiles, apparel & luxury goods) | | | | | | |
First Financial Holding Co. Ltd. (Financials, Banks) | | | | | | |
Formosa Chemicals & Fibre Corp. (Materials, Chemicals) | | | | | | |
Formosa Plastics Corp. (Materials, Chemicals) | | | | | | |
Fubon Financial Holding Co. Ltd. (Financials, Insurance) | | | | | | |
Giant Manufacturing Co. Ltd. (Consumer discretionary, Leisure products) | | | | | | |
Global Unichip Corp. (Information technology, Semiconductors & semiconductor equipment) | | | | | | |
Globalwafers Co. Ltd. (Information technology, Semiconductors & semiconductor equipment) | | | | | | |
Hon Hai Precision Industry Co. Ltd. (Information technology, Electronic equipment, instruments & components) | | | | | | |
Hua Nan Financial Holdings Co. Ltd. Class C (Financials, Banks) | | | | | | |
Inventec Corp. (Information technology, Technology hardware, storage & peripherals) | | | | | | |
Largan Precision Co. Ltd. (Information technology, Electronic equipment, instruments & components) | | | | | | |
Lite-On Technology Corp. (Information technology, Technology hardware, storage & peripherals) | | | | | | |
MediaTek, Inc. (Information technology, Semiconductors & semiconductor equipment) | | | | | | |
Mega Financial Holding Co. Ltd. (Financials, Banks) | | | | | | |
The accompanying notes are an integral part of these financial statements.
20 | Allspring Factor Enhanced Emerging Markets Equity Portfolio
Portfolio of investments—August 31, 2023 (unaudited)
| | | | | |
| | | | | | |
Micro-Star International Co. Ltd. (Information technology, Technology hardware, storage & peripherals) | | | | | | |
momo.com, Inc. (Consumer discretionary, Broadline retail) | | | | | | |
Nan Ya Plastics Corp. (Materials, Chemicals) | | | | | | |
Nan Ya Printed Circuit Board Corp. (Information technology, Electronic equipment, instruments & components) | | | | | | |
Nanya Technology Corp. (Information technology, Semiconductors & semiconductor equipment) | | | | | | |
Nien Made Enterprise Co. Ltd. (Consumer discretionary, Household durables) | | | | | | |
Novatek Microelectronics Corp. (Information technology, Semiconductors & semiconductor equipment) | | | | | | |
Pegatron Corp. (Information technology, Technology hardware, storage & peripherals) | | | | | | |
Pharmally International Holding Co. Ltd. (Health care, Pharmaceuticals)♦† | | | | | | |
Pou Chen Corp. (Consumer discretionary, Textiles, apparel & luxury goods) | | | | | | |
Powerchip Semiconductor Manufacturing Corp. (Information technology, Semiconductors & semiconductor equipment)† | | | | | | |
President Chain Store Corp. (Consumer staples, Consumer staples distribution & retail) | | | | | | |
Quanta Computer, Inc. (Information technology, Technology hardware, storage & peripherals) | | | | | | |
Realtek Semiconductor Corp. (Information technology, Semiconductors & semiconductor equipment)† | | | | | | |
Ruentex Development Co. Ltd. (Real estate, Real estate management & development)† | | | | | | |
Shanghai Commercial & Savings Bank Ltd. (Financials, Banks) | | | | | | |
SinoPac Financial Holdings Co. Ltd. (Financials, Banks) | | | | | | |
Synnex Technology International Corp. (Information technology, Electronic equipment, instruments & components) | | | | | | |
Taishin Financial Holding Co. Ltd. (Financials, Banks) | | | | | | |
Taiwan High Speed Rail Corp. (Industrials, Transportation infrastructure) | | | | | | |
Taiwan Mobile Co. Ltd. (Communication services, Wireless telecommunication services) | | | | | | |
Taiwan Semiconductor Manufacturing Co. Ltd. (Information technology, Semiconductors & semiconductor equipment) | | | | | | |
Unimicron Technology Corp. (Information technology, Electronic equipment, instruments & components) | | | | | | |
Uni-President Enterprises Corp. (Consumer staples, Food products) | | | | | | |
United Microelectronics Corp. (Information technology, Semiconductors & semiconductor equipment) | | | | | | |
Vanguard International Semiconductor Corp. (Information technology, Semiconductors & semiconductor equipment) | | | | | | |
Voltronic Power Technology Corp. (Industrials, Electrical equipment) | | | | | | |
Walsin Lihwa Corp. (Industrials, Electrical equipment) | | | | | | |
Win Semiconductors Corp. (Information technology, Semiconductors & semiconductor equipment) | | | | | | |
Winbond Electronics Corp. (Information technology, Semiconductors & semiconductor equipment)† | | | | | | |
Wistron Corp. (Information technology, Technology hardware, storage & peripherals) | | | | | | |
The accompanying notes are an integral part of these financial statements.
Allspring Factor Enhanced Emerging Markets Equity Portfolio | 21
Portfolio of investments—August 31, 2023 (unaudited)
| | | | | |
| | | | | | |
Wiwynn Corp. (Information technology, Technology hardware, storage & peripherals) | | | | | | |
WPG Holdings Ltd. (Information technology, Electronic equipment, instruments & components) | | | | | | |
Yageo Corp. (Information technology, Electronic equipment, instruments & components) | | | | | | |
Yuanta Financial Holding Co. Ltd. (Financials, Financial services) | | | | | | |
Zhen Ding Technology Holding Ltd. (Information technology, Electronic equipment, instruments & components) | | | | | | |
| | | | | | |
| | | | | | |
Advanced Info Service PCL (Communication services, Wireless telecommunication services) | | | | | | |
Asset World Corp. PCL (Consumer discretionary, Hotels, restaurants & leisure) | | | | | | |
Bangkok Dusit Medical Services PCL (Health care, Health care providers & services) | | | | | | |
Berli Jucker PCL (Consumer staples, Consumer staples distribution & retail) | | | | | | |
Bumrungrad Hospital PCL (Health care, Health care providers & services) | | | | | | |
Carabao Group PCL (Consumer staples, Beverages) | | | | | | |
Central Pattana PCL (Real estate, Real estate management & development) | | | | | | |
Central Retail Corp. PCL (Consumer discretionary, Broadline retail) | | | | | | |
Delta Electronics Thailand PCL (Information technology, Electronic equipment, instruments & components) | | | | | | |
Electricity Generating PCL (Utilities, Independent power and renewable electricity producers) | | | | | | |
Home Product Center PCL (Consumer discretionary, Specialty retail) | | | | | | |
Indorama Ventures PCL (Materials, Chemicals) | | | | | | |
Intouch Holdings PCL (Communication services, Wireless telecommunication services) | | | | | | |
Kasikornbank PCL (Financials, Banks) | | | | | | |
Krung Thai Bank PCL (Financials, Banks) | | | | | | |
Krungthai Card PCL (Financials, Consumer finance) | | | | | | |
Land & Houses PCL (Real estate, Real estate management & development) | | | | | | |
Minor International PCL (Consumer discretionary, Hotels, restaurants & leisure)† | | | | | | |
Muangthai Capital PCL NVDR (Financials, Consumer finance) | | | | | | |
Osotspa PCL (Consumer staples, Beverages) | | | | | | |
PTT Exploration & Production PCL (Energy, Oil, gas & consumable fuels) | | | | | | |
PTT Oil & Retail Business PCL (Consumer discretionary, Specialty retail) | | | | | | |
Ratch Group PCL (Utilities, Independent power and renewable electricity producers) | | | | | | |
Siam Cement PCL (Materials, Construction materials) | | | | | | |
Srisawad Corp. PCL (Financials, Consumer finance) | | | | | | |
Thai Oil PCL (Energy, Oil, gas & consumable fuels) | | | | | | |
| | | | | | |
| | | | | | |
Akbank TAS (Financials, Banks) | | | | | | |
Aselsan Elektronik Sanayi Ve Ticaret AS (Industrials, Aerospace & defense) | | | | | | |
BIM Birlesik Magazalar AS (Consumer staples, Consumer staples distribution & retail) | | | | | | |
Ford Otomotiv Sanayi AS (Consumer discretionary, Automobiles) | | | | | | |
The accompanying notes are an integral part of these financial statements.
22 | Allspring Factor Enhanced Emerging Markets Equity Portfolio
Portfolio of investments—August 31, 2023 (unaudited)
| | | | | |
| | | | | | |
Haci Omer Sabanci Holding AS (Financials, Banks) | | | | | | |
KOC Holding AS (Industrials, Industrial conglomerates) | | | | | | |
Pegasus Hava Tasimaciligi AS (Industrials, Passenger airlines)† | | | | | | |
Tofas Turk Otomobil Fabrikasi AS (Consumer discretionary, Automobiles) | | | | | | |
Turk Hava Yollari AO (Industrials, Passenger airlines)† | | | | | | |
Turkcell Iletisim Hizmetleri AS (Communication services, Wireless telecommunication services) | | | | | | |
Turkiye Is Bankasi AS Class C (Financials, Banks) | | | | | | |
Yapi ve Kredi Bankasi AS (Financials, Banks) | | | | | | |
| | | | | | |
| | | | | | |
Parade Technologies Ltd. (Information technology, Semiconductors & semiconductor equipment) | | | | | | |
Yum China Holdings, Inc. (Consumer discretionary, Hotels, restaurants & leisure) | | | | | | |
| | | | | | |
Total common stocks (Cost $97,490,280) | | | | | | |
| | | | | |
| | | | | | |
| | | | | | |
Banco Bradesco SA (Financials, Banks) | | | | | | |
Centrais Eletricas Brasileiras SA Class B (Utilities, Electric utilities) | | | | | | |
Cia Energetica de Minas Gerais (Utilities, Electric utilities) | | | | | | |
Gerdau SA (Materials, Metals & mining) | | | | | | |
Itau Unibanco Holding SA (Financials, Banks) | | | | | | |
Itausa SA (Financials, Banks) | | | | | | |
Petroleo Brasileiro SA (Energy, Oil, gas & consumable fuels) | | | | | | |
| | | | | | |
| | | | | | |
Sociedad Quimica y Minera de Chile SA Class B (Industrials, Electrical equipment) | | | | | | |
| | | | | | |
Bancolombia SA (Financials, Banks) | | | | | | |
| | | | | | |
Hyundai Motor Co. (Consumer discretionary, Automobiles) | | | | | | |
LG Chem Ltd. (Materials, Chemicals) | | | | | | |
Samsung Electronics Co. Ltd. (Information technology, Technology hardware, storage & peripherals) | | | | | | |
| | | | | | |
Total preferred stocks (Cost $2,908,934) | | | | | | |
The accompanying notes are an integral part of these financial statements.
Allspring Factor Enhanced Emerging Markets Equity Portfolio | 23
Portfolio of investments—August 31, 2023 (unaudited)
| | | | | |
Short-term investments: 3.28% | | | | | | |
Investment companies: 3.28% | | | | | | |
Allspring Government Money Market Fund Select Class♠∞ | | | | | | |
Total short-term investments (Cost $3,475,967) | | | | | | |
Total investments in securities (Cost $103,875,181) | | | | | | |
Other assets and liabilities, net | | | | | | |
| | | | | | |
| Non-income-earning security |
| The security may be resold in transactions exempt from registration, normally to qualified institutional buyers, pursuant to Rule 144A under the Securities Act of 1933. |
| The security is fair valued in accordance with procedures approved by the Board of Trustees. |
| Restricted security as to resale, excluding Rule 144A securities. The Fund held restricted securities with an aggregate current value of $0 (original aggregate cost of $2,844,834), representing 0.00% of its net assets as of period end. |
| Security is valued using significant unobservable inputs. |
| The issuer of the security is an affiliated person of the Portfolio as defined in the Investment Company Act of 1940. |
| The rate represents the 7-day annualized yield at period end. |
|
| American depositary receipt |
| Global depositary receipt |
| Real estate investment trust |
Investments in affiliates
An affiliated investment is an investment in which the Portfolio owns at least 5% of the outstanding voting shares of the issuer or as a result of other relationships, such as the Portfolio and the issuer having the same adviser or investment manager. Transactions with issuers that were affiliates of the Portfolio at the end of the period were as follows:
| | | | | Net
change in
unrealized
gains
(losses) | | | Income
from
affiliated
securities |
| | | | | | | | |
Allspring Government Money Market Fund Select Class | | | | | | | | |
Futures contracts
| | | | | | |
| | | | | | |
MSCI Emerging Markets Index | | | | | | |
The accompanying notes are an integral part of these financial statements.
24 | Allspring Factor Enhanced Emerging Markets Equity Portfolio
Statement of assets and liabilities—August 31, 2023 (unaudited)
Financial statements
Statement of assets and liabilities
| |
Investments in unaffiliated securities, at value (cost $100,399,215) | |
Investments in affiliated securities, at value (cost $3,475,967) | |
Cash at broker segregated for futures contracts | |
Foreign currency, at value (cost $51,280) | |
| |
| |
Prepaid expenses and other assets | |
| |
| |
Custody and accounting fees payable | |
| |
Payable for daily variation margin on open futures contracts | |
Accrued expenses and other liabilities | |
| |
| |
The accompanying notes are an integral part of these financial statements.
Allspring Factor Enhanced Emerging Markets Equity Portfolio | 25
Statement of operations—six months ended August 31, 2023 (unaudited)
Statement of operations
| |
Dividends (net of foreign withholdings taxes of $330,315) | |
Income from affiliated securities | |
| |
| |
| |
| |
Custody and accounting fees | |
| |
Interest holder report expenses | |
Trustees’ fees and expenses | |
| |
| |
Less: Fee waivers and/or expense reimbursements | |
| |
| |
Realized and unrealized gains (losses) on investments | |
| |
| |
Foreign currency and foreign currency translations | |
| |
Net realized losses on investments | |
Net change in unrealized gains (losses) on | |
Unaffiliated securities (net of deferred foreign capital gains tax of $181,975) | |
Foreign currency and foreign currency translations | |
| |
Net change in unrealized gains (losses) on investments | |
Net realized and unrealized gains (losses) on investments | |
Net increase in net assets resulting from operations | |
The accompanying notes are an integral part of these financial statements.
26 | Allspring Factor Enhanced Emerging Markets Equity Portfolio
Statement of changes in net assets
Statement of changes in net assets
|
Six months ended
August 31, 2023 (unaudited) | Year ended February 28, 2023 |
| | | | |
| | | | |
Net realized losses on investments | | | | |
Net change in unrealized gains (losses) on investments | | | | |
Net increase (decrease) in net assets resulting from operations | | | | |
| | | | |
Transactions in investors’ beneficial interests | | | | |
| | | | |
| | | | |
Net decrease in net assets resulting from capital transactions | | | | |
Total increase (decrease) in net assets | | | | |
| | | | |
| | | | |
| | | | |
The accompanying notes are an integral part of these financial statements.
Allspring Factor Enhanced Emerging Markets Equity Portfolio | 27
| Six months ended
August 31, 2023
(unaudited) | |
| | | | | |
| | | | | | |
Ratios to average net assets (annualized) | | | | | | |
| | | | | | |
| | | | | | |
| | | | | | |
| | | | | | |
| | | | | | |
| Ratio includes expenses which were voluntarily waived by the adviser. Without these voluntary waivers, the net expense ratios would be increased by the following amounts: |
Six months ended August 31, 2023 (unaudited) | |
Year ended February 28, 2023 | |
Year ended February 28, 2022 | |
Year ended February 28, 2021 | |
| |
| Returns for periods of less than one year are not annualized. |
The accompanying notes are an integral part of these financial statements.
28 | Allspring Factor Enhanced Emerging Markets Equity Portfolio
Notes to financial statements (unaudited)
Notes to financial statements
Allspring Master Trust (the “Trust”), a Delaware statutory trust organized on March 10, 1999, is an open-end management investment company registered under the Investment Company Act of 1940, as amended (the “1940 Act”). As an investment company, the Trust follows the accounting and reporting guidance in Financial Accounting Standards Board (“FASB”) Accounting Standards Codification Topic 946, Financial Services – Investment Companies. These financial statements report on the Allspring Factor Enhanced Emerging Markets Equity Portfolio (the “Portfolio”) which is a diversified series of the Trust.
Interests in the Portfolio are available solely through private placement transactions that do not involve any “public offering” within the meaning of Section 4(a)(2) of the Securities Act of 1933.
2.
SIGNIFICANT ACCOUNTING POLICIES
The following significant accounting policies, which are consistently followed in the preparation of the financial statements of the Portfolio, are in conformity with U.S. generally accepted accounting principles which require management to make estimates and assumptions that affect the reported amounts of assets and liabilities, disclosure of contingent assets and liabilities at the date of the financial statements, and the reported amounts of income and expenses during the reporting period. Actual results could differ from those estimates.
Securities valuation
All investments are valued each business day as of the close of regular trading on the New York Stock Exchange (generally 4 p.m. Eastern Time), although the Portfolio may deviate from this calculation time under unusual or unexpected circumstances.
Equity securities and futures contracts that are listed on a foreign or domestic exchange or market are valued at the official closing price or, if none, the last sales price.
The values of securities denominated in foreign currencies are translated into U.S. dollars at rates provided by an independent foreign currency pricing source at a time each business day specified by the Valuation Committee at Allspring Funds Management, LLC (“Allspring Funds Management”).
Many securities markets and exchanges outside the U.S. close prior to the close of the New York Stock Exchange and therefore may not fully reflect trading or events that occur after the close of the principal exchange in which the foreign securities are traded, but before the close of the New York Stock Exchange. If such trading or events are expected to materially affect the value of such securities, then fair value pricing procedures implemented by Allspring Funds Management are applied. These procedures take into account multiple factors including movements in U.S. securities markets after foreign exchanges close. Foreign securities that are fair valued under these procedures are categorized as Level 2 and the application of these procedures may result in transfers between Level 1 and Level 2. Depending on market activity, such fair valuations may be frequent. Such fair value pricing may result in net asset values that are higher or lower than net asset values based on the last reported sales price or latest quoted bid price. On August 31, 2023, such fair value pricing was used in pricing certain foreign securities.
Investments in registered open-end investment companies (other than those listed on a foreign or domestic exchange or market) are valued at net asset value.
Investments which are not valued using the methods discussed above are valued at their fair value, as determined in good faith by Allspring Funds Management, which was named the valuation designee by the Board of Trustees. As the valuation designee, Allspring Funds Management is responsible for day-to-day valuation activities for the Allspring Funds. In connection with these responsibilities, Allspring Funds Management has established a Valuation Committee and has delegated to it the authority to take any actions regarding the valuation of portfolio securities that the Valuation Committee deems necessary or appropriate, including determining the fair value of portfolio securities. On a quarterly basis, the Board of Trustees receives reports of valuation actions taken by the Valuation Committee. On at least an annual basis, the Board of Trustees receives an assessment of the adequacy and effectiveness of Allspring Funds Management’s process for determining the fair value of the portfolio of investments.
Foreign currency translation
The accounting records of the Portfolio are maintained in U.S. dollars. The values of other assets and liabilities denominated in foreign currencies are translated into U.S. dollars at rates provided by an independent foreign currency pricing source at a time each business day specified by the Valuation Committee. Purchases and sales of securities, and income and expenses are converted at the rate of exchange on the respective dates of such transactions. Net realized foreign exchange gains or losses arise from sales of foreign currencies, currency gains or losses realized between the trade and settlement dates on securities transactions, and the difference between the amounts of dividends, interest and foreign withholding taxes recorded and the U.S. dollar equivalent of the amounts actually paid or received. Net unrealized foreign exchange gains and losses arise from changes in the fair value of assets and liabilities other than investments in securities resulting from changes in exchange rates. The changes in net assets arising from changes in exchange rates of securities and the changes in net assets resulting from changes in market prices of securities are not separately presented. Such changes are included in net realized and unrealized gains or losses from investments.
Allspring Factor Enhanced Emerging Markets Equity Portfolio | 29
Notes to financial statements (unaudited)
Futures contracts
Futures contracts are agreements between the Portfolio and a counterparty to buy or sell a specific amount of a commodity, financial instrument or currency at a specified price and on a specified date. The Portfolio may buy and sell futures contracts in order to gain exposure to, or protect against, changes in security values and is subject to equity price risk. The primary risks associated with the use of futures contracts are the imperfect correlation between changes in market values of securities held by the Portfolio and the prices of futures contracts, and the possibility of an illiquid market. Futures contracts are generally entered into on a regulated futures exchange and cleared through a clearinghouse associated with the exchange. With futures contracts, there is minimal counterparty risk to the Portfolio since futures contracts are exchange-traded and the exchange’s clearinghouse, as the counterparty to all exchange-traded futures, guarantees the futures contracts against default.
Upon entering into a futures contract, the Portfolio is required to deposit either cash or securities (initial margin) with the broker in an amount equal to a certain percentage of the contract value. Subsequent payments (variation margin) are paid to or received from the broker each day equal to the daily changes in the contract value. Such payments are recorded as unrealized gains or losses and, if any, shown as variation margin receivable (payable) in the Statement of Assets and Liabilities. Should the Portfolio fail to make requested variation margin payments, the broker can gain access to the initial margin to satisfy the Portfolio’s payment obligations. When the contracts are closed, a realized gain or loss is recorded in the Statement of Operations.
Security transactions and income recognition
Securities transactions are recorded on a trade date basis. Realized gains or losses are recorded on the basis of identified cost.
Dividend income is recognized on the ex-dividend date, except for certain dividends from foreign securities, which are recorded as soon as the custodian verifies the ex-dividend date. Dividend income is recorded net of foreign taxes withheld where recovery of such taxes is not assured.
Distributions received from REIT investments may be characterized as ordinary income, capital gains, or a return of capital to the Portfolio based on information provided by the REIT. The proper characterization of REIT distributions is generally not known until after the end of each calendar year. As such, estimates may be used in reporting the character of income and distributions for financial statement purposes.
Federal and other taxes
The Portfolio is not required to pay federal income taxes on its net investment income and net capital gains as it is treated as a partnership for federal income tax purposes. All income, gains and losses of the Portfolio are deemed to have been “passed through” to the interest holders in proportion to their holdings of the Portfolio regardless of whether income and gains have been distributed by the Portfolio.
The Portfolio’s income tax returns and all financial records supporting those returns for the prior three fiscal years are subject to examination by the federal revenue authority. Management has analyzed the Portfolio’s tax positions taken on federal, state, and foreign tax returns, as applicable, for all open tax years and does not believe that there are any uncertain tax positions that require recognition of a tax liability.
As of August 31, 2023, the aggregate cost of all investments for federal income tax purposes was $103,822,447 and the unrealized gains (losses) consisted of:
3.
FAIR VALUATION MEASUREMENTS
Fair value measurements of investments are determined within a framework that has established a fair value hierarchy based upon the various data inputs utilized in determining the value of the Portfolio’s investments. The three-level hierarchy gives the highest priority to unadjusted quoted prices in active markets for identical assets or liabilities (Level 1) and the lowest priority to unobservable inputs (Level 3). The Portfolio’s investments are classified within the fair value hierarchy based on the lowest level of input that is significant to the fair value measurement. The inputs are summarized into three broad levels as follows:
•Level 1—quoted prices in active markets for identical securities
•Level 2—other significant observable inputs (including quoted prices for similar securities, interest rates, prepayment speeds, credit risk, etc.)
•Level 3—significant unobservable inputs (including the Portfolio’s own assumptions in determining the fair value of investments)
The inputs or methodologies used for valuing investments in securities are not necessarily an indication of the risk associated with investing in those securities.
30 | Allspring Factor Enhanced Emerging Markets Equity Portfolio
Notes to financial statements (unaudited)
The following is a summary of the inputs used in valuing the Portfolio’s assets and liabilities as of August 31, 2023:
| | Other significant
observable inputs
(Level 2) | Significant
unobservable inputs
(Level 3) | |
| | | | |
| | | | |
| | | | |
| | | | |
| | | | |
| | | | |
| | | | |
| | | | |
| | | | |
| | | | |
| | | | |
| | | | |
| | | | |
| | | | |
| | | | |
| | | | |
| | | | |
| | | | |
| | | | |
| | | | |
| | | | |
| | | | |
| | | | |
| | | | |
| | | | |
| | | | |
| | | | |
| | | | |
| | | | |
| | | | |
| | | | |
| | | | |
| | | | |
| | | | |
| | | | |
| | | | |
| | | | |
| | | | |
| | | | |
| | | | |
Futures contracts are reported at their cumulative unrealized gains (losses) at measurement date as reported in the table following the Portfolio of Investments. For futures contracts, the current day’s variation margin is reported on the Statement of Assets and Liabilities. All other assets and liabilities are reported at their market value at measurement date.
Additional sector, industry or geographic detail, if any, is included in the Portfolio of Investments.
For the six months ended August 31, 2023, the Portfolio did not have any transfers into/out of Level 3.
4.
TRANSACTIONS WITH AFFILIATES
Advisory fee
The Trust has entered into an advisory contract with Allspring Funds Management, a wholly owned subsidiary of Allspring Global Investments Holdings, LLC, a holding company indirectly owned by certain private funds of GTCR LLC and Reverence Capital Partners, L.P. The adviser is responsible for implementing investment policies and guidelines and for supervising the subadviser, who is responsible for day-to-day portfolio management of the
Allspring Factor Enhanced Emerging Markets Equity Portfolio | 31
Notes to financial statements (unaudited)
Portfolio. Pursuant to the contract, Allspring Funds Management is entitled to receive an advisory fee at the following annual rate based on the Portfolio’s average daily net assets:
For the six months ended August 31, 2023, the advisory fee was equivalent to an annual rate of 0.15% of the Portfolio’s average daily net assets.
Allspring Funds Management has retained the services of a subadviser to provide daily portfolio management to the Portfolio. The fee for subadvisory services is borne by Allspring Funds Management. Allspring Global Investments, LLC, an affiliate of Allspring Funds Management and a wholly owned subsidiary of Allspring Global Investments Holdings, LLC, is the subadviser to the Portfolio and is entitled to receive a fee from Allspring Funds Management at an annual rate starting at 0.08% and declining to 0.05% as the average daily net assets of the Portfolio increase.
Allspring Funds Management has voluntarily waived and/or reimbursed expenses to reduce the net operating expense ratio of the Portfolio. These voluntary waivers may be discontinued at any time.
Interfund transactions
The Portfolio may purchase or sell portfolio investment securities to certain affiliates pursuant to Rule 17a-7 under the 1940 Act and under procedures adopted by the Board of Trustees. The procedures have been designed to ensure that these interfund transactions, which do not incur broker commissions, are effected at current market prices. Pursuant to these procedures, the Portfolio did not have any interfund transactions during the six months ended August 31, 2023.
5.
INVESTMENT PORTFOLIO TRANSACTIONS
Purchases and sales of investments, excluding U.S. government obligations (if any) and short-term securities, for the six months ended August 31, 2023 were $37,219,807 and $34,102,821, respectively.
6.
DERIVATIVE TRANSACTIONS
During the six months ended August 31, 2023, the Portfolio entered into futures contracts to gain market exposure. The Portfolio had an average notional amount of $3,270,968 in long futures contracts during the six months ended August 31, 2023.
The fair value, realized gains or losses and change in unrealized gains or losses, if any, on derivative instruments are reflected in the corresponding financial statement captions.
The Trust, along with Allspring Variable Trust and Allspring Funds Trust (excluding the money market funds), are parties to a $350,000,000 revolving credit agreement whereby the Portfolio is permitted to use bank borrowings for temporary or emergency purposes, such as to fund interest holders withdrawal requests. Interest under the credit agreement is charged to the Portfolio based on a borrowing rate equal to the higher of the Federal Funds rate or the overnight bank funding rate in effect on that day plus a spread. In addition, an annual commitment fee based on the unused balance is allocated to each participating fund.
For the six months ended August 31, 2023, there were no borrowings by the Portfolio under the agreement.
As of the end of the period, the Portfolio concentrated its portfolio of investments in China. A fund that invests a substantial portion of its assets in any country or geographic region will be more vulnerable than a fund that invests its assets more broadly to the economic, financial, political or other developments affecting that country or region. Such developments may have a significant impact on the Portfolio’s investment performance causing such performance to be more volatile than the investment performance of a more geographically diversified fund.
Under the Portfolio’s organizational documents, the officers and Trustees have been granted certain indemnification rights against certain liabilities that may arise out of performance of their duties to the Portfolio. The Portfolio has entered into a separate agreement with each Trustee that converts indemnification rights currently existing under the Portfolio’s organizational documents into contractual rights that cannot be changed in the future without the consent of the Trustee. Additionally, in the normal course of business, the Portfolio may enter into contracts with service providers that contain a variety of indemnification clauses. The Portfolio’s maximum exposure under these arrangements is dependent on future claims that may be made against the Portfolio and, therefore, cannot be estimated.
32 | Allspring Factor Enhanced Emerging Markets Equity Portfolio
Other information (unaudited)
Other information
Proxy voting information
A description of the policies and procedures used to determine how to vote proxies relating to portfolio securities is available without charge, upon request, by calling 1-866-259-3305, visiting our website at allspringglobal.com, or visiting the SEC website at sec.gov. Information regarding how the proxies related to portfolio securities were voted during the most recent 12-month period ended June 30 is available on the website at allspringglobal.com or by visiting the SEC website at sec.gov.
Quarterly portfolio holdings information
The Portfolio files its complete schedule of portfolio holdings with the SEC for the first and third quarters of each fiscal year as an exhibit to its reports on Form N-PORT. Interest holders may view the filed Form N-PORT by visiting the SEC website at sec.gov.
Allspring Factor Enhanced Emerging Markets Equity Portfolio | 33
Other information (unaudited)
Board of trustees and officers
Each of the Trustees and Officers listed in the table below acts in identical capacities for each fund in the Allspring family of funds, which consists of 126 mutual funds comprising the Allspring Funds Trust, Allspring Variable Trust, Allspring Master Trust and four closed-end funds (collectively the “Fund Complex”). This table should be read in conjunction with the Prospectus and the Statement of Additional Information1. The mailing address of each Trustee and Officer is 1415 Vantage Park Drive, 3rd Floor, Charlotte, NC 28203. Each Trustee and Officer serves an indefinite term, however, each Trustee serves such term until reaching the mandatory retirement age established by the Trustees.
Independent Trustees
| | Principal occupations during past five years or longer | Current other
public company or
investment
company
directorships |
William R. Ebsworth
(Born 1957) | | Retired. From 1984 to 2013, equities analyst, portfolio manager, research director and chief investment officer at Fidelity Management and Research Company in Boston, Tokyo, and Hong Kong, and retired in 2013 as Chief Investment Officer of Fidelity Strategic Advisers, Inc. where he led a team of investment professionals managing client assets. Prior thereto, Board member of Hong Kong Securities Clearing Co., Hong Kong Options Clearing Corp., the Thailand International Fund, Ltd., Fidelity Investments Life Insurance Company, and Empire Fidelity Investments Life Insurance Company. Audit Committee Chair and Investment Committee Chair of the Vincent Memorial Hospital Foundation (non-profit organization). Mr. Ebsworth is a CFA charterholder. | |
Jane A. Freeman
(Born 1953) | Trustee,
since 2015;
Chair Liaison,
since 2018 | Retired. From 2012 to 2014 and 1999 to 2008, Chief Financial Officer of Scientific Learning Corporation. From 2008 to 2012, Ms. Freeman provided consulting services related to strategic business projects. Prior to 1999, Portfolio Manager at Rockefeller & Co. and Scudder, Stevens & Clark. Board member of the Harding Loevner Funds from 1996 to 2014, serving as both Lead Independent Director and chair of the Audit Committee. Board member of the Russell Exchange Traded Funds Trust from 2011 to 2012 and the chair of the Audit Committee. Ms. Freeman is also an inactive Chartered Financial Analyst. | |
Isaiah Harris, Jr.
(Born 1952) | Trustee,
since 2009;
Audit Committee Chair,
since 2019 | Retired. Member of the Advisory Board of CEF of East Central Florida. Chairman of the Board of CIGNA Corporation from 2009 to 2021, and Director from 2005 to 2008. From 2003 to 2011, Director of Deluxe Corporation. Prior thereto, President and CEO of BellSouth Advertising and Publishing Corp. from 2005 to 2007, President and CEO of BellSouth Enterprises from 2004 to 2005 and President of BellSouth Consumer Services from 2000 to 2003. Emeritus member of the Iowa State University Foundation Board of Governors. Emeritus Member of the Advisory board of Iowa State University School of Business. Advisory Board Member, Palm Harbor Academy (private school). Advisory Board Member, Fellowship of Christian Athletes. Mr. Harris is a certified public accountant (inactive status). | |
David F. Larcker
(Born 1950) | | Distinguished Visiting Fellow at the Hoover Institution since 2022. James Irvin Miller Professor of Accounting at the Graduate School of Business (Emeritus), Stanford University, Director of the Corporate Governance Research Initiative and Senior Faculty of The Rock Center for Corporate Governance since 2006. From 2005 to 2008, Professor of Accounting at the Graduate School of Business, Stanford University. Prior thereto, Ernst & Young Professor of Accounting at The Wharton School, University of Pennsylvania from 1985 to 2005. | |
Olivia S. Mitchell
(Born 1953) | Trustee,
since 2006;
Nominating and Governance Committee Chair,
since 2018 | International Foundation of Employee Benefit Plans Professor since 1993, Wharton School of the University of Pennsylvania. Director of Wharton’s Pension Research Council and Boettner Center on Pensions & Retirement Research, and Research Associate at the National Bureau of Economic Research. Previously taught at Cornell University from 1978 to 1993. | |
Timothy J. Penny
(Born 1951) | Trustee,
since 1996;
Chair,
since 2018 | President and Chief Executive Officer of Southern Minnesota Initiative Foundation, a non-profit organization, since 2007. Vice Chair of the Economic Club of Minnesota, since 2007. Co-Chair of the Committee for a Responsible Federal Budget, since 1995. Member of the Board of Trustees of NorthStar Education Finance, Inc., a non-profit organization, from 2007-2022. Senior Fellow of the University of Minnesota Humphrey Institute from 1995 to 2017. | |
1
The Statement of Additional Information includes additional information about the Trustees and is available, without charge, upon request, by calling 1-800-222-8222 or by visiting the website at allspringglobal.com.
34 | Allspring Factor Enhanced Emerging Markets Equity Portfolio
Other information (unaudited)
| Position held and length of service* | Principal occupations during past five years or longer | Current other public company or investment company directorships |
James G. Polisson
(Born 1959) | | Retired. Chief Marketing Officer, Source (ETF) UK Services, Ltd, from 2015 to 2017. From 2012 to 2015, Principal of The Polisson Group, LLC, a management consulting, corporate advisory and principal investing company. Chief Executive Officer and Managing Director at Russell Investments, Global Exchange Traded Funds from 2010 to 2012. Managing Director of Barclays Global Investors from 1998 to 2010 and Global Chief Marketing Officer for iShares and Barclays Global Investors from 2000 to 2010. Trustee of the San Francisco Mechanics’ Institute, a non- profit organization, from 2013 to 2015. Board member of the Russell Exchange Traded Fund Trust from 2011 to 2012. Director of Barclays Global Investors Holdings Deutschland GmbH from 2006 to 2009. Mr. Polisson is an attorney and has a retired status with the Massachusetts and District of Columbia Bar Associations. | |
Pamela Wheelock
(Born 1959) | Trustee,
since January 2020;
previously Trustee from
January 2018 to
July 2019 | Retired. Executive and Senior Financial leadership positions in the public, private and nonprofit sectors. Interim President and CEO, McKnight Foundation, 2020. Interim Commissioner, Minnesota Department of Human Services, 2019. Chief Operating Officer, Twin Cities Habitat for Humanity, 2017-2019. Vice President for University Services, University of Minnesota, 2012- 2016. Interim President and CEO, Blue Cross and Blue Shield of Minnesota, 2011-2012. Executive Vice-President and Chief Financial Officer, Minnesota Wild, 2002-2008. Commissioner, Minnesota Department of Finance, 1999-2002. Chair of the Board of Directors of Destination Medical Center Corporation. Board member of the Minnesota Wild Foundation. | |
| Length of service dates reflect the Trustee’s commencement of service with the Trust’s predecessor entities, where applicable. |
Allspring Factor Enhanced Emerging Markets Equity Portfolio | 35
Other information (unaudited)
Officers1
| Position held and
length of service | Principal occupations during past five years or longer |
| | President and Chief Executive Officer of Allspring Funds Management, LLC since 2017 and Head of Global Fund Governance of Allspring Global Investments since 2022. Prior thereto, co-president of Galliard Capital Management, LLC, an affiliate of Allspring Funds Management, LLC, from 2019 to 2022 and Head of Affiliated Managers, Allspring Global Investments, from 2014 to 2019 and Executive Vice President responsible for marketing, investments and product development for Allspring Funds Management, LLC, from 2009 to 2014. |
Jeremy DePalma
(Born 1974) | Treasurer,
since 2012
(for certain funds in
the Fund Complex);
since 2021 (for
the remaining funds in the Complex) | Senior Vice President of Allspring Funds Management, LLC since 2009. Senior Vice President of Evergreen Investment Management Company, LLC from 2008 to 2010 and head of the Fund Reporting and Control Team within Fund Administration from 2005 to 2010. |
Christopher Baker
(Born 1976) | Chief Compliance Officer,
since 2022 | Global Chief Compliance Officer for Allspring Global Investments since 2022. Prior thereto, Chief Compliance Officer for State Street Global Advisors from 2018 to 2021. Senior Compliance Officer for the State Street divisions of Alternative Investment Solutions, Sector Solutions, and Global Marketing from 2015 to 2018. From 2010 to 2015 Vice President, Global Head of Investment and Marketing Compliance for State Street Global Advisors. |
Matthew Prasse
(Born 1983) | Chief Legal Officer,
since 2022;
Secretary,
since 2021 | Senior Counsel of the Allspring Legal Department since 2021. Senior Counsel of the Wells Fargo Legal Department from 2018 to 2021. Previously, Counsel for Barings LLC from 2015 to 2018. Prior to joining Barings, Associate at Morgan, Lewis & Bockius LLP from 2008 to 2015. |
1 For those Officers with tenures at Allspring Global Investments and/or Allspring Funds Management, LLC that began prior to 2021, such tenures include years of service during which these businesses/entities were known as Wells Fargo Asset Management and Wells Fargo Funds Management, LLC, respectively.
36 | Allspring Factor Enhanced Emerging Markets Equity Portfolio
Other information (unaudited)
Board consideration of investment advisory and sub-advisory agreements:
Allspring Bloomberg US Aggregate ex-Corporate Portfolio, Allspring Emerging Markets Bond Portfolio, Allspring Factor Enhanced Emerging Markets Equity Portfolio, Allspring Factor Enhanced International Equity Portfolio, Allspring Factor Enhanced U.S. Large Cap Equity Portfolio, Allspring Factor Enhanced U.S. Small Cap Equity Portfolio, Allspring High Yield Corporate Bond Portfolio, Allspring Investment Grade Corporate Bond Portfolio, Allspring Strategic Retirement Bond Portfolio, and Allspring U.S. REIT Portfolio
Under the Investment Company Act of 1940 (the “1940 Act”), the Board of Trustees (the “Board”) of Allspring Master Trust (the “Trust”) must determine annually whether to approve the continuation of the Trust’s investment advisory and sub-advisory agreements. In this regard, at a meeting held on May 15-17, 2023 (the “Meeting”), the Board, all the members of which have no direct or indirect interest in the investment advisory and sub-advisory agreements and are not “interested persons” of the Trust, as defined in the 1940 Act (the “Independent Trustees”), reviewed and approved for each of the portfolios of the Trust identified in the table below (individually, a “Portfolio” and collectively, the “Portfolios”): (i) an investment advisory agreement (the “Advisory Agreement”) with Allspring Funds Management, LLC (“Allspring Funds Management”); and (ii) an investment sub-advisory agreement (each, a “Sub-Advisory Agreement” and collectively, the “Sub-Advisory Agreements”) with the Sub-Advisers(s) identified in the table below (each, a “Sub-Adviser” and collectively, the “Sub-Advisers”) for the corresponding Portfolio identified. The Advisory Agreement and the Sub-Advisory Agreements are collectively referred to as the “Advisory Agreements.”
| |
Allspring Bloomberg Barclays US Aggregate ex-Corporate Portfolio | Allspring Global Investments, LLC |
Allspring Emerging Markets Bond Portfolio | Allspring Global Investments, LLC, Allspring Global Investments (UK) Limited |
Allspring Factor Enhanced Emerging Markets Equity Portfolio | Allspring Global Investments, LLC |
Allspring Factor Enhanced International Equity Portfolio | Allspring Global Investments, LLC |
Allspring Factor Enhanced U.S. Large Cap Equity Portfolio | Allspring Global Investments, LLC |
Allspring Factor Enhanced U.S. Small Cap Equity Portfolio | Allspring Global Investments, LLC |
Allspring High Yield Corporate Bond Portfolio | Allspring Global Investments, LLC |
Allspring Investment Grade Corporate Bond Portfolio | Allspring Global Investments, LLC |
Allspring Strategic Retirement Bond Portfolio | Allspring Global Investments, LLC |
Allspring U.S. REIT Portfolio | Allspring Global Investments, LLC |
At the Meeting, the Board considered the factors and reached the conclusions described below relating to the selection of Allspring Funds Management and the Sub-Advisers and the approval of the Advisory Agreements. Prior to the Meeting, including at a Board meeting held in April 2023, the Trustees conferred extensively among themselves and with representatives of Allspring Funds Management about these matters. The Board has adopted a team-based approach, with each team consisting of a sub-set of Trustees, to assist the full Board in the discharge of its duties in reviewing investment performance and other matters throughout the year. The Independent Trustees were assisted in their evaluation of the Advisory Agreements by independent legal counsel, from whom they received separate legal advice and with whom they met separately.
The Board noted that it initially approved the Advisory Agreements at a Board meeting held in May 2021, each for a two-year term, in advance of the sale of Wells Fargo Asset Management to Allspring Global Investments Holdings, LLC,1 a holding company indirectly owned by certain private funds of GTCR LLC and Reverence Capital Partners, L.P. (the “Transaction”). The Trustees also noted that, while they did not specifically consider the continuation of the Advisory Agreements in 2022 as a result of the two-year term that was approved in 2021, the Trustees received and considered certain information at a Board meeting held in April 2022 that was applicable to the Advisory Agreements, including an overview and financial review of the Allspring Global Investments business, information regarding certain ancillary agreements that were approved by the Board at the April 2022 Board meeting, and comparative data regarding Fund fees and expenses.
In providing information to the Board, Allspring Funds Management and the Sub-Advisers were guided by a detailed set of requests for information submitted to them by independent legal counsel on behalf of the Independent Trustees at the start of the Board’s annual contract renewal process earlier in 2023. In considering and approving the Advisory Agreements, the Trustees considered the information they believed relevant, including but not limited to the information discussed below. The Board considered not only the specific information presented in connection with the Meeting, but also the knowledge gained over time through interaction with Allspring Funds Management and the Sub-Advisers about various topics. In this regard, the Board reviewed reports of Allspring Funds Management at each of its quarterly meetings, which included, among other things, portfolio reviews and investment performance reports. In addition, the Board and the teams mentioned above confer with portfolio managers at various times throughout the year. The Board did not identify any particular information or consideration that was all-important or controlling, and each individual Trustee may have attributed different weights to various factors.
1
The trade name for the asset management firm that includes Allspring Funds Management and the Sub-Adviser is “Allspring Global Investments.”
Allspring Factor Enhanced Emerging Markets Equity Portfolio | 37
Other information (unaudited)
After its deliberations, the Board unanimously determined that the compensation or the absence of compensation payable to Allspring Funds Management and each of the Sub-Advisers under each of the Advisory Agreements was reasonable, and approved the continuation of the Advisory Agreements for a one-year term. The Board considered the approval of the Advisory Agreements for the Portfolios as part of its consideration of agreements for funds across the complex, but its approvals were made on a fund-by-fund basis. The following summarizes a number of important, but not necessarily all, factors considered by the Board in support of its approvals.
Nature, extent and quality of services
The Board received and considered various information regarding the nature, extent, and quality of services provided to the Portfolios by Allspring Funds Management and the Sub-Advisers under the Advisory Agreements. This information included a description of the investment advisory services and Portfolio-level administrative services covered by the Advisory Agreement, as well as, among other things, a summary of the background and experience of senior management of Allspring Global Investments, of which Allspring Funds Management and the Sub-Advisers are a part, and a summary of investments made in the Allspring Global Investments business. The Board also considered information about retention arrangements with respect to key personnel of Allspring Global Investments that were put in place in connection with the Transaction. The Board took into account information about the services that continue to be provided by Wells Fargo & Co. and/or its affiliates (“Wells Fargo”) since the Transaction under a transition services agreement and the anticipated timeline for exiting the transition services agreement. In addition, the Board received and considered information about the full range of services provided to the Fund by Allspring Funds Management and its affiliates.
The Board considered the qualifications, background, tenure, and responsibilities of each of the portfolio managers primarily responsible for the day-to-day portfolio management of the Portfolios. The Board evaluated the ability of Allspring Funds Management and the Sub-Advisers to attract and retain qualified investment professionals, including research, advisory, and supervisory personnel.
The Board further considered the compliance programs and compliance records of Allspring Funds Management and the Sub-Advisers. The Board received and considered information about Allspring Global Investments’ risk management functions, which included information about Allspring Funds Management’s and the Sub-Advisers’ business continuity plans, their approaches to data privacy and cybersecurity, and Allspring Funds Management’s role as administrator of the Portfolios’ liquidity risk management program, and the derivatives risk management program for Allspring Bloomberg Barclays US Aggregate ex-Corporate Portfolio and Allspring Factor Enhanced U.S. Large Cap Equity Portfolio. The Board also received and considered information about Allspring Funds Management’s intermediary and vendor oversight program.
Portfolio investment performance and expenses
The Board considered the investment performance results for each of the Portfolios over various time periods ended December 31, 2022. The Board considered these results in comparison to the investment performance of funds in a universe that was determined by Broadridge Inc. (“Broadridge”) to be similar to each respective Portfolios (each, a “Universe”), and in comparison to each Portfolios’ benchmark index and to other comparative data. Broadridge is an independent provider of investment company data. The Board received a description of the methodology used by Broadridge to select the mutual funds in the performance Universe. The Board noted the short performance history of the Portfolios.
With respect to the investment performance of each Portfolio relative to its respective Universe, the Board noted the following: (i) the investment performance of Allspring Bloomberg US Aggregate ex-Corporate Portfolio was higher than the average investment performance of the Universe for all periods under review; the investment performance of Allspring Bloomberg US Aggregate ex-Corporate Portfolio was higher than the investment performance of its benchmark index, the Bloomberg U.S. Aggregate ex Corporate Index, for the one-year period and was in range of the investment performance of its benchmark index for the three- and five-year periods under review; (ii) the investment performance of Allspring Emerging Markets Bond Portfolio was lower than the average investment performance of the Universe for the one- and three-year periods and was in range of the average investment performance of the Universe for the five-year period; the investment performance of Allspring Emerging Markets Bond Portfolio was higher than the investment performance of its benchmark index, the J.P. Morgan EM Bond Global Diversified Index, for the one-year period and was in range of the investment performance of its benchmark index for the three- and five-year periods under review; (iii) the investment performance of Allspring Factor Enhanced Emerging Markets Equity Portfolio was higher than the average investment performance of the Universe for the one-year period and was lower than the average investment performance of the Universe for the three- and five-year periods; the investment performance of Allspring Factor Enhanced Emerging Markets Equity Portfolio was higher than the investment performance of its benchmark index, the MSCI Emerging Markets Index (Net), for the one-year period and was lower than the investment performance of its benchmark index for the three- and five-year periods under review; (iv) the investment performance of Allspring Factor Enhanced International Equity Portfolio was higher than the average investment performance of the Universe for all periods under review; the investment performance of Allspring Factor Enhanced International Equity Portfolio was higher than the investment performance of its benchmark index, the MSCI World ex US Index (Net), for all periods under review; (v) the investment performance of Allspring Factor Enhanced U.S. Large Cap Equity Portfolio was higher than the average investment performance of the Universe for the one- and five-year periods and was lower than the average investment performance of the Universe for the three-year period; the investment performance of Allspring Factor Enhanced U.S. Large Cap Equity Portfolio was higher than the investment performance of its benchmark index, the Russell 1000® Index, for the one-year period and was lower than the investment performance of its benchmark index for the three- and five-year periods under review; (vi) the investment performance of Allspring Factor Enhanced U.S. Small Cap Equity Portfolio was lower than the average investment performance of the Universe for all periods under review; the investment performance of Allspring Factor Enhanced U.S. Small Cap Equity Portfolio was higher than the
38 | Allspring Factor Enhanced Emerging Markets Equity Portfolio
Other information (unaudited)
investment performance of its benchmark index, the Russell 2000® Index, for the one-year period and was lower than the investment performance of its benchmark index for the three- and five-year periods under review; (vii) the investment performance of Allspring High Yield Corporate Bond Portfolio was lower than the average investment performance of the Universe for all periods under review; the investment performance of Allspring High Yield Corporate Bond Portfolio was in range of the investment performance of its benchmark index, the Bloomberg U.S. Corporate High Yield 2% Issuer Capped, for the one-year period and was lower than the investment performance of its benchmark index for the three- and five-year periods under review; (viii) the investment performance of Allspring Investment Grade Corporate Bond Portfolio was higher than the average investment performance of the Universe for the one- and five-year periods and in rage of the average investment performance of the Universe for the three-year period; the investment performance of Allspring Investment Grade Corporate Bond Portfolio was higher than the investment performance of its benchmark index, the Bloomberg U.S. Corporate Bond Index, for the one-year period and was in range of the investment performance of its benchmark index for the three- and five-year periods under review; (ix) the investment performance of Allspring Strategic Retirement Bond Portfolio was higher than the average investment performance of the Universe for all periods under review; the investment performance of Allspring Strategic Retirement Bond Portfolio was higher than the investment performance of its benchmark index, the Strategic Retirement Blended Index, for the one- and three-year periods and was in range of the investment performance of its benchmark index for the five-year period; (x) the investment performance of Allspring U.S. REIT Portfolio was lower than the average investment performance of the Universe for the one-year period and was in range of the average investment performance of the Universe for the three- and five-year periods; the investment performance of Allspring U.S. REIT Portfolio was higher than the investment performance of its benchmark index, the Dow Jones U.S. Select REIT Index, for all periods under review.
The Board received information concerning, and discussed factors contributing to, the underperformance of each of Allspring Emerging Markets Bond Portfolio, Allspring Factor Enhanced Emerging Markets Equity Portfolio, Allspring Factor Enhanced U.S. Large Cap Equity Portfolio, Allspring Factor Enhanced U.S. Small Cap Equity Portfolio and Allspring High Yield Corporate Bond Portfolio relative to such Portfolio’s Universe and benchmark index for the periods identified above. The Board took note of the explanations for the relative underperformance during these periods, including with respect to investment decisions and market factors that affected each Portfolio’s investment performance.
The Board also received and considered information regarding the fee rates that are payable to Allspring Funds Management for investment advisory services (as discussed below), which are the only fees charged to the Portfolios, relative to corresponding class-specific expense groups that were determined by Broadridge to be similar to the Portfolios (the “Groups”). The Board received a description of the methodology used by Broadridge to select the mutual funds in the expense Groups and an explanation of how funds comprising expense groups and their expense ratios may vary from year-to-year.
The Board took into account the Portfolios’ investment performance and expense information provided to it among the factors considered in deciding to re-approve the Advisory Agreements.
Investment advisory and sub-advisory fee rates
The Board reviewed and considered the contractual fee rates payable by the Portfolios to Allspring Funds Management under the Advisory Agreement. The Board also reviewed and considered the contractual investment sub-advisory fee rates that are payable by Allspring Funds Management to the Sub-Advisers for investment sub-advisory services.
Among other information reviewed by the Board was a comparison of the Portfolios’ Advisory Rates with the average contractual investment advisory fee rates of funds in the expense Groups at a common asset level as well as transfer agency costs of the Portfolios in the expense Groups. The Board noted that the Advisory Rates of the Portfolios were lower than or in range of the mean rates for the Portfolios’ expense Groups.
The Board also received and considered information about the portions of the total advisory fees that were retained by Allspring Funds Management after payment of the fees to the Sub-Advisers for sub-advisory services. In assessing the reasonableness of these amounts, the Board received and evaluated information about the nature and extent of responsibilities retained and risks assumed by Allspring Funds Management and not delegated to or assumed by the Sub-Advisers, and about Allspring Funds Management’s on-going oversight services. Given the affiliation between Allspring Funds Management and the Sub-Advisers, the Board ascribed limited relevance to the allocation of fees between them.
For all Portfolios, except Allspring Factor Enhanced U.S. Small Cap Equity Portfolio, Allspring Factor Enhanced International Equity Portfolio, Allspring Factor Enhanced Emerging Markets Equity Portfolio, Allspring U.S. REIT Portfolio, Allspring Investment Grade Corporate Bond Portfolio, and Allspring Strategic Retirement Bond Portfolio, the Board also received and considered information about the nature and extent of services offered and fee rates charged by Allspring Funds Management and the Sub-Advisers to other types of clients with investment strategies similar to those of certain Portfolios. In this regard, the Board received information about the significantly greater scope of services, and compliance, reporting and other legal burdens and risks of managing proprietary mutual funds compared with those associated with managing assets of other types of clients, including third-party sub-advised fund clients and non-mutual fund clients such as institutional separate accounts.
Based on its consideration of the factors and information it deemed relevant, including those described here, the Board determined that the compensation payable to Allspring Funds Management under the Advisory Agreement and to the Sub-Advisers under the Sub-Advisory Agreements was reasonable.
Allspring Factor Enhanced Emerging Markets Equity Portfolio | 39
Other information (unaudited)
Profitability
The Board received and considered information concerning the profitability of Allspring Funds Management, as well as the profitability of Allspring Global Investments, from providing services to the fund complex as a whole. The Board noted that the Sub-Adviser’s profitability information with respect to providing services to the Portfolios and other funds in the complex was subsumed in the Allspring Global Investments profitability analysis.
Allspring Funds Management reported on the methodologies and estimates used in calculating profitability, including a description of the methodology used to allocate certain expenses and differences in how Allspring Global Investments calculates its pre-tax profit metric versus the methodology used when Allspring Funds Management was part of Wells Fargo. It was noted that the impact of such differences had only minor impact on the financial results presented. Among other things, the Board noted that the levels of profitability reported on a fund-by-fund basis varied widely, depending on factors such as the size, type, and age of fund.
Based on its review, the Board did not deem the profits reported by Allspring Funds Management or Allspring Global Investments from services provided to the Portfolios to be at a level that would prevent it from approving the continuation of the Advisory Agreements.
Economies of scale
The Board received and considered information about the potential for Allspring Funds Management to experience economies of scale in the provision of management services to the Portfolios, the difficulties of calculating economies of scale at an individual fund level, and the extent to which potential scale benefits are shared with Portfolio shareholders. The Board noted the existence of breakpoints in the Portfolios’ advisory fee structure, which operate generally to reduce the Portfolios’ expense ratios as the Portfolios grow in size, and the size of the Portfolios in relation to such breakpoints. The Board considered that in addition to advisory fee breakpoints, Allspring Funds Management shares potential economies of scale from its management business in a variety of ways, including through fee waiver and expense reimbursement arrangements, competitive advisory fee rates set at the outset without regard to breakpoints, and investments in the business intended to enhance services available to shareholders.
The Board concluded that Allspring Funds Management’s arrangements with respect to the Portfolios, including contractual breakpoints, constituted a reasonable approach to sharing potential economies of scale with the Portfolios and their shareholders.
Other benefits to Allspring Funds Management and the Sub-Advisers
The Board received and considered information regarding potential “fall-out” or ancillary benefits received by Allspring Funds Management and its affiliates, including the Sub-Advisers, as a result of their relationships with the Portfolios. Ancillary benefits could include, among others, benefits directly attributable to other relationships with the Portfolios and benefits potentially derived from an increase in Allspring Funds Management’s and the Sub-Advisers’ businesses as a result of their relationships with the Portfolios. The Board noted that Allspring Funds Distributor, LLC, an affiliate of Allspring Funds Management, receives distribution-related fees in respect of shares sold or held through it.
The Board also reviewed information about soft dollar credits earned and utilized by the Sub-Advisers and fees earned in the past by Allspring Funds Management and the Sub-Advisers from managing a private investment vehicle for the fund complex’s securities lending collateral.
Based on its consideration of the factors and information it deemed relevant, including those described here, the Board did not find that any ancillary benefits received by Allspring Funds Management and its affiliates, including the Sub-Advisers, were unreasonable.
Conclusion
At the Meeting, after considering the above-described factors and based on its deliberations and its evaluation of the information described above, the Board unanimously determined that the compensation payable to Allspring Funds Management and the Sub-Advisers under each of the Advisory Agreements was reasonable, and approved the continuation of the Advisory Agreements for a one-year term.
40 | Allspring Factor Enhanced Emerging Markets Equity Portfolio
Other information (unaudited)
Liquidity risk management program
In accordance with Rule 22e-4 under the Investment Company Act of 1940, as amended (the “Liquidity Rule”), Allspring Master Trust (the “Trust”) has adopted and implemented a liquidity risk management program (the “Program”) on behalf of each of its series, including the Portfolio, which is reasonably designed to assess and manage the Portfolio’s liquidity risk. “Liquidity risk” is defined under the Liquidity Rule as the risk that the Portfolio is unable to meet redemption requests without significantly diluting remaining investors’ interests in the Portfolio. The Trust’s Board of Trustees (the “Board”) previously approved the designation of Allspring Funds Management, LLC (“Allspring Funds Management”), the Portfolio’s investment adviser, to administer the Program, and Allspring Funds Management has established a Liquidity Risk Management Council (the “Council”) composed of personnel from multiple departments within Allspring Funds Management and its affiliates to assist Allspring Funds Management in the administration of the Program.
The Program is comprised of various components designed to support the assessment and/or management of liquidity risk, including: (1) the periodic assessment (no less frequently than annually) of certain factors that influence the Portfolio’s liquidity risk; (2) the periodic classification (no less frequently than monthly) of the Portfolio’s investments into one of four liquidity categories that reflect an estimate of their liquidity under current market conditions; (3) a 15% limit on the acquisition of “illiquid investments” (as defined under the Liquidity Rule); (4) to the extent the Portfolio does not invest primarily in “highly liquid investments” (as defined under the Liquidity Rule), the determination of a minimum percentage of the Portfolio’s assets that generally will be invested in highly liquid investments (an “HLIM”); (5) if the Portfolio has established an HLIM, the periodic review (no less frequently than annually) of the HLIM and the adoption of policies and procedures for responding to a shortfall of the Portfolio’s “highly liquid investments” below its HLIM; and (6) periodic reporting to the Board.
At a meeting of the Board held on May 16-17, 2023, the Board received and reviewed a written report (the “Report”) from Allspring Funds Management that, among other things, addressed the operation of the Program and assessed its adequacy and effectiveness for the period from January 1, 2022 through December 31, 2022 (the “Reporting Period”). The Report noted significant liquidity events impacting the Portfolios related to extended foreign market holidays as well as the difficulty of trading and settlement of most Russia-related securities due to sanctions activity. The Report noted that there were no material changes to the Program during the Reporting Period.
Allspring Funds Management determined in the Report that the Program has been implemented and operates effectively to manage each Portfolio’s, including the Portfolio’s, liquidity risk, and Allspring Funds Management continues to believe that the Program has been and continues to be adequately and effectively implemented to monitor and, as applicable, respond to the Portfolio’s liquidity developments.
There can be no assurance that the Program will achieve its objectives under all circumstances in the future.
Allspring Factor Enhanced Emerging Markets Equity Portfolio | 41
For more information
More information about Allspring Funds is available free upon request. To obtain literature, please write, visit the Portfolio’s website, or call:
Allspring Funds
P.O. Box 219967
Kansas City, MO 64121-9967
Website: allspringglobal.com
Individual investors: 1-800-222-8222
Retail investment professionals: 1-888-877-9275
Institutional investment professionals: 1-800-260-5969
This report and the financial statements contained herein are submitted for the general information of the interest holders of the Portfolio. If this report is used for promotional purposes, distribution of the report must be accompanied or preceded by a current prospectus. Before investing, please consider the investment objectives, risks, charges, and expenses of the investment. For a current prospectus and, if available, a summary prospectus, containing this information, call 1-800-222-8222 or visit the Portfolio’s website at allspringglobal.com. Read the prospectus carefully before you invest or send money.
Allspring Global InvestmentsTM is the trade name for the asset management firms of Allspring Global Investments Holdings, LLC, a holding company indirectly owned by certain private funds of GTCR LLC and Reverence Capital Partners, L.P. These firms include but are not limited to Allspring Global Investments, LLC, and Allspring Funds Management, LLC. Certain products managed by Allspring entities are distributed by Allspring Funds Distributor, LLC (a broker-dealer and Member FINRA/SIPC).
This material is for general informational and educational purposes only and is NOT intended to provide investment advice or a recommendation of any kind - including a recommendation for any specific investment, strategy, or plan.
© 2023 Allspring Global Investments Holdings, LLC. All rights reserved.
Allspring Factor Enhanced International Equity Portfolio
Semi-Annual Report
August 31, 2023
Allspring Factor Enhanced International Equity Portfolio | 1
Performance highlights (unaudited)
Performance highlights
| The Portfolio seeks long-term capital appreciation. |
| Allspring Funds Management, LLC |
| Allspring Global Investments, LLC |
| Harindra de Silva, Ph.D., CFA, Monisha Jayakumar |
Ten largest holdings (%) as of August 31, 20231 |
| |
| |
| |
LVMH Moet Hennessy Louis Vuitton SE | |
| |
| |
| |
| |
| |
| |
| Figures represent the percentage of the Portfolio’s net assets. Holdings are subject to change and may have changed since the date specified. |
Sector allocation as of August 31, 20231 |
| Figures represent the percentage of the Portfolio’s long-term investments. Allocations are subject to change and may have changed since the date specified. |
Country allocation as of August 31, 20231 |
| Figures represent the percentage of the Portfolio’s long-term investments. Allocations are subject to change and may have changed since the date specified. |
| CFA® and Chartered Financial Analyst® are trademarks owned by CFA Institute. |
2 | Allspring Factor Enhanced International Equity Portfolio
Portfolio of investments—August 31, 2023 (unaudited)
| | | | | |
| | | | | | |
| | | | | | |
Ampol Ltd. (Energy, Oil, gas & consumable fuels) | | | | | | |
ANZ Group Holdings Ltd. (Financials, Banks) | | | | | | |
Aristocrat Leisure Ltd. (Consumer discretionary, Hotels, restaurants & leisure) | | | | | | |
Aurizon Holdings Ltd. (Industrials, Ground transportation) | | | | | | |
BHP Group Ltd. (Materials, Metals & mining) | | | | | | |
BlueScope Steel Ltd. (Materials, Metals & mining) | | | | | | |
Brambles Ltd. (Industrials, Commercial services & supplies) | | | | | | |
Cochlear Ltd. (Health care, Health care equipment & supplies) | | | | | | |
Coles Group Ltd. (Consumer staples, Consumer staples distribution & retail) | | | | | | |
Commonwealth Bank of Australia (Financials, Banks) | | | | | | |
CSL Ltd. (Health care, Biotechnology) | | | | | | |
Dexus (Real estate, Office REITs) | | | | | | |
Fortescue Metals Group Ltd. (Materials, Metals & mining) | | | | | | |
Glencore PLC (Materials, Metals & mining) | | | | | | |
Goodman Group (Real estate, Industrial REITs) | | | | | | |
GPT Group (Real estate, Diversified REITs) | | | | | | |
IGO Ltd. (Materials, Metals & mining) | | | | | | |
Insurance Australia Group Ltd. (Financials, Insurance) | | | | | | |
Macquarie Group Ltd. (Financials, Capital markets) | | | | | | |
Medibank Pvt Ltd. (Financials, Insurance) | | | | | | |
Mineral Resources Ltd. (Materials, Metals & mining) | | | | | | |
Mirvac Group (Real estate, Diversified REITs) | | | | | | |
National Australia Bank Ltd. (Financials, Banks) | | | | | | |
Northern Star Resources Ltd. (Materials, Metals & mining) | | | | | | |
Orica Ltd. (Materials, Chemicals) | | | | | | |
Pilbara Minerals Ltd. (Materials, Metals & mining) | | | | | | |
Qantas Airways Ltd. (Industrials, Passenger airlines)† | | | | | | |
QBE Insurance Group Ltd. (Financials, Insurance) | | | | | | |
REA Group Ltd. (Communication services, Interactive media & services) | | | | | | |
Reece Ltd. (Industrials, Trading companies & distributors) | | | | | | |
Rio Tinto Ltd. (Materials, Metals & mining) | | | | | | |
Scentre Group (Real estate, Retail REITs) | | | | | | |
SEEK Ltd. (Communication services, Interactive media & services) | | | | | | |
Sonic Healthcare Ltd. (Health care, Health care providers & services) | | | | | | |
South32 Ltd. (Materials, Metals & mining) | | | | | | |
Stockland (Real estate, Diversified REITs) | | | | | | |
Telstra Group Ltd. (Communication services, Diversified telecommunication services) | | | | | | |
Treasury Wine Estates Ltd. (Consumer staples, Beverages) | | | | | | |
Vicinity Ltd. (Real estate, Retail REITs) | | | | | | |
Washington H Soul Pattinson & Co. Ltd. (Financials, Financial services) | | | | | | |
Wesfarmers Ltd. (Consumer discretionary, Broadline retail) | | | | | | |
Westpac Banking Corp. (Financials, Banks) | | | | | | |
WiseTech Global Ltd. (Information technology, Software) | | | | | | |
The accompanying notes are an integral part of these financial statements.
Allspring Factor Enhanced International Equity Portfolio | 3
Portfolio of investments—August 31, 2023 (unaudited)
| | | | | |
| | | | | | |
Woodside Energy Group Ltd. (Energy, Oil, gas & consumable fuels) | | | | | | |
Woolworths Group Ltd. (Consumer staples, Consumer staples distribution & retail) | | | | | | |
| | | | | | |
| | | | | | |
Erste Group Bank AG (Financials, Banks) | | | | | | |
OMV AG (Energy, Oil, gas & consumable fuels) | | | | | | |
voestalpine AG (Materials, Metals & mining) | | | | | | |
| | | | | | |
| | | | | | |
Ageas SA (Financials, Insurance) | | | | | | |
Anheuser-Busch InBev SA (Consumer staples, Beverages) | | | | | | |
D’ieteren Group (Consumer discretionary, Distributors) | | | | | | |
Groupe Bruxelles Lambert NV (Financials, Financial services) | | | | | | |
KBC Group NV (Financials, Banks)† | | | | | | |
Solvay SA (Materials, Chemicals) | | | | | | |
UCB SA (Health care, Pharmaceuticals) | | | | | | |
Umicore SA (Materials, Chemicals) | | | | | | |
| | | | | | |
| | | | | | |
Alimentation Couche-Tard, Inc. (Consumer staples, Consumer staples distribution & retail) | | | | | | |
AltaGas Ltd. (Utilities, Gas utilities) | | | | | | |
ARC Resources Ltd. (Energy, Oil, gas & consumable fuels) | | | | | | |
Bank of Montreal (Financials, Banks) | | | | | | |
Bank of Nova Scotia (Financials, Banks) | | | | | | |
Barrick Gold Corp. (Materials, Metals & mining) | | | | | | |
Brookfield Asset Management Ltd. Class A (Financials, Capital markets) | | | | | | |
Brookfield Renewable Corp. Class A (Utilities, Independent power and renewable electricity producers) | | | | | | |
BRP, Inc. (Consumer discretionary, Leisure products) | | | | | | |
Canadian Imperial Bank of Commerce (Financials, Banks) | | | | | | |
Canadian National Railway Co. (Industrials, Ground transportation) | | | | | | |
Canadian Natural Resources Ltd. (Energy, Oil, gas & consumable fuels) | | | | | | |
Canadian Pacific Kansas City Ltd. (Industrials, Ground transportation) | | | | | | |
Canadian Tire Corp. Ltd. Class A (Consumer discretionary, Broadline retail) | | | | | | |
Canadian Utilities Ltd. Class A (Utilities, Multi-utilities) | | | | | | |
CCL Industries, Inc. Class B (Materials, Containers & packaging) | | | | | | |
Cenovus Energy, Inc. (Energy, Oil, gas & consumable fuels) | | | | | | |
CGI, Inc. (Information technology, IT services)† | | | | | | |
Constellation Software, Inc. (Information technology, Software) | | | | | | |
Descartes Systems Group, Inc. (Information technology, Software)† | | | | | | |
Dollarama, Inc. (Consumer discretionary, Broadline retail) | | | | | | |
The accompanying notes are an integral part of these financial statements.
4 | Allspring Factor Enhanced International Equity Portfolio
Portfolio of investments—August 31, 2023 (unaudited)
| | | | | |
| | | | | | |
Element Fleet Management Corp. (Financials, Financial services) | | | | | | |
Empire Co. Ltd. Class A (Consumer staples, Consumer staples distribution & retail) | | | | | | |
Enbridge, Inc. (Energy, Oil, gas & consumable fuels) | | | | | | |
Fairfax Financial Holdings Ltd. (Financials, Insurance) | | | | | | |
First Quantum Minerals Ltd. (Materials, Metals & mining) | | | | | | |
FirstService Corp. (Real estate, Real estate management & development) | | | | | | |
Fortis, Inc. (Utilities, Electric utilities) | | | | | | |
Franco-Nevada Corp. (Materials, Metals & mining) | | | | | | |
George Weston Ltd. (Consumer staples, Consumer staples distribution & retail) | | | | | | |
Gildan Activewear, Inc. (Consumer discretionary, Textiles, apparel & luxury goods) | | | | | | |
Hydro One Ltd. (Utilities, Electric utilities)144A | | | | | | |
iA Financial Corp., Inc. (Financials, Insurance) | | | | | | |
IGM Financial, Inc. (Financials, Capital markets) | | | | | | |
Imperial Oil Ltd. (Energy, Oil, gas & consumable fuels) | | | | | | |
Intact Financial Corp. (Financials, Insurance) | | | | | | |
Kinross Gold Corp. (Materials, Metals & mining) | | | | | | |
Loblaw Cos. Ltd. (Consumer staples, Consumer staples distribution & retail) | | | | | | |
Lundin Mining Corp. (Materials, Metals & mining) | | | | | | |
Magna International, Inc. (Consumer discretionary, Automobile components) | | | | | | |
Manulife Financial Corp. (Financials, Insurance) | | | | | | |
Metro, Inc. (Consumer staples, Consumer staples distribution & retail) | | | | | | |
National Bank of Canada (Financials, Banks) | | | | | | |
Northland Power, Inc. (Utilities, Independent power and renewable electricity producers) | | | | | | |
Nutrien Ltd. (Materials, Chemicals) | | | | | | |
Open Text Corp. (Information technology, Software) | | | | | | |
Parkland Corp. (Energy, Oil, gas & consumable fuels) | | | | | | |
Pembina Pipeline Corp. (Energy, Oil, gas & consumable fuels) | | | | | | |
Power Corp. of Canada (Financials, Insurance) | | | | | | |
Quebecor, Inc. Class B (Communication services, Media) | | | | | | |
Restaurant Brands International, Inc. (Consumer discretionary, Hotels, restaurants & leisure) | | | | | | |
RioCan REIT (Real estate, Retail REITs) | | | | | | |
Rogers Communications, Inc. Class B (Communication services, Wireless telecommunication services) | | | | | | |
Royal Bank of Canada (Financials, Banks) | | | | | | |
Saputo, Inc. (Consumer staples, Food products) | | | | | | |
Shopify, Inc. Class A (Information technology, IT services)† | | | | | | |
Sun Life Financial, Inc. (Financials, Insurance) | | | | | | |
Suncor Energy, Inc. (Energy, Oil, gas & consumable fuels) | | | | | | |
TFI International, Inc. (Industrials, Ground transportation) | | | | | | |
Thomson Reuters Corp. (Industrials, Professional services) | | | | | | |
The accompanying notes are an integral part of these financial statements.
Allspring Factor Enhanced International Equity Portfolio | 5
Portfolio of investments—August 31, 2023 (unaudited)
| | | | | |
| | | | | | |
TMX Group Ltd. (Financials, Capital markets) | | | | | | |
Toromont Industries Ltd. (Industrials, Trading companies & distributors) | | | | | | |
Toronto-Dominion Bank (Financials, Banks) | | | | | | |
Tourmaline Oil Corp. (Energy, Oil, gas & consumable fuels) | | | | | | |
West Fraser Timber Co. Ltd. (Materials, Paper & forest products) | | | | | | |
Wheaton Precious Metals Corp. (Materials, Metals & mining) | | | | | | |
| | | | | | |
| | | | | | |
SITC International Holdings Co. Ltd. (Industrials, Marine transportation) | | | | | | |
Xinyi Glass Holdings Ltd. (Industrials, Building products) | | | | | | |
| | | | | | |
| | | | | | |
AP Moller - Maersk AS Class B (Industrials, Marine transportation) | | | | | | |
Carlsberg AS Class B (Consumer staples, Beverages) | | | | | | |
Coloplast AS Class B (Health care, Health care equipment & supplies) | | | | | | |
Danske Bank AS (Financials, Banks) | | | | | | |
Demant AS (Health care, Health care equipment & supplies)† | | | | | | |
DSV AS (Industrials, Air freight & logistics) | | | | | | |
Genmab AS (Health care, Biotechnology)† | | | | | | |
Novo Nordisk AS Class B (Health care, Pharmaceuticals) | | | | | | |
Pandora AS (Consumer discretionary, Textiles, apparel & luxury goods)† | | | | | | |
ROCKWOOL AS Class B (Industrials, Building products) | | | | | | |
Vestas Wind Systems AS (Industrials, Electrical equipment)† | | | | | | |
| | | | | | |
| | | | | | |
Elisa Oyj (Communication services, Diversified telecommunication services) | | | | | | |
Kesko Oyj Class B (Consumer staples, Consumer staples distribution & retail) | | | | | | |
Kone Oyj Class B (Industrials, Machinery) | | | | | | |
Metso Oyj (Industrials, Machinery) | | | | | | |
Nokia Oyj (Information technology, Communications equipment) | | | | | | |
Nordea Bank Abp (Financials, Banks) | | | | | | |
Orion Oyj Class B (Health care, Pharmaceuticals) | | | | | | |
Sampo Oyj Class A (Financials, Insurance) | | | | | | |
Wartsila Oyj Abp (Industrials, Machinery) | | | | | | |
| | | | | | |
| | | | | | |
Aeroports de Paris (Industrials, Transportation infrastructure)† | | | | | | |
Air Liquide SA (Materials, Chemicals) | | | | | | |
Amundi SA (Financials, Capital markets)144A | | | | | | |
Arkema SA (Materials, Chemicals) | | | | | | |
The accompanying notes are an integral part of these financial statements.
6 | Allspring Factor Enhanced International Equity Portfolio
Portfolio of investments—August 31, 2023 (unaudited)
| | | | | |
| | | | | | |
AXA SA (Financials, Insurance) | | | | | | |
BioMerieux (Health care, Health care equipment & supplies) | | | | | | |
BNP Paribas SA (Financials, Banks)† | | | | | | |
Bollore SE (Communication services, Entertainment) | | | | | | |
Bouygues SA (Industrials, Construction & engineering) | | | | | | |
Capgemini SE (Information technology, IT services) | | | | | | |
Carrefour SA (Consumer staples, Consumer staples distribution & retail) | | | | | | |
CIE de Saint-Gobain (Industrials, Building products) | | | | | | |
Cie Generale des Etablissements Michelin SCA (Consumer discretionary, Automobile components) | | | | | | |
Covivio SA (Real estate, Office REITs) | | | | | | |
Credit Agricole Corporate & Investment Bank SA (Financials, Banks) | | | | | | |
Danone SA (Consumer staples, Food products) | | | | | | |
Dassault Systemes SE (Information technology, Software) | | | | | | |
Edenred (Financials, Financial services) | | | | | | |
Eiffage SA (Industrials, Construction & engineering) | | | | | | |
Engie SA (Utilities, Multi-utilities) | | | | | | |
EssilorLuxottica SA (Health care, Health care equipment & supplies) | | | | | | |
Eurazeo SE (Financials, Financial services) | | | | | | |
Gecina SA (Real estate, Office REITs) | | | | | | |
Hermes International (Consumer discretionary, Textiles, apparel & luxury goods) | | | | | | |
Ipsen SA (Health care, Pharmaceuticals) | | | | | | |
Kering SA (Consumer discretionary, Textiles, apparel & luxury goods) | | | | | | |
Klepierre SA (Real estate, Retail REITs)† | | | | | | |
La Francaise des Jeux SAEM (Consumer discretionary, Hotels, restaurants & leisure)144A | | | | | | |
Legrand SA (Industrials, Electrical equipment) | | | | | | |
L’Oreal SA (Consumer staples, Personal care products) | | | | | | |
LVMH Moet Hennessy Louis Vuitton SE (Consumer discretionary, Textiles, apparel & luxury goods) | | | | | | |
Orange SA (Communication services, Diversified telecommunication services) | | | | | | |
Pernod Ricard SA (Consumer staples, Beverages) | | | | | | |
Publicis Groupe SA (Communication services, Media) | | | | | | |
Renault SA (Consumer discretionary, Automobiles) | | | | | | |
Safran SA (Industrials, Aerospace & defense) | | | | | | |
Sanofi (Health care, Pharmaceuticals) | | | | | | |
Schneider Electric SE (Industrials, Electrical equipment) | | | | | | |
SEB SA (Consumer discretionary, Household durables) | | | | | | |
Societe Generale SA (Financials, Banks) | | | | | | |
Sodexo SA (Consumer discretionary, Hotels, restaurants & leisure)† | | | | | | |
Teleperformance (Industrials, Professional services) | | | | | | |
Thales SA (Industrials, Aerospace & defense) | | | | | | |
TotalEnergies SE (Energy, Oil, gas & consumable fuels) | | | | | | |
Veolia Environnement SA (Utilities, Multi-utilities) | | | | | | |
Vinci SA (Industrials, Construction & engineering) | | | | | | |
The accompanying notes are an integral part of these financial statements.
Allspring Factor Enhanced International Equity Portfolio | 7
Portfolio of investments—August 31, 2023 (unaudited)
| | | | | |
| | | | | | |
Vivendi SE (Communication services, Media) | | | | | | |
Wendel SE (Financials, Financial services) | | | | | | |
| | | | | | |
| | | | | | |
adidas AG (Consumer discretionary, Textiles, apparel & luxury goods) | | | | | | |
Allianz SE (Financials, Insurance) | | | | | | |
BASF SE (Materials, Chemicals) | | | | | | |
Bayer AG (Health care, Pharmaceuticals) | | | | | | |
Bayerische Motoren Werke AG (Consumer discretionary, Automobiles) | | | | | | |
Bechtle AG (Information technology, IT services) | | | | | | |
Beiersdorf AG (Consumer staples, Personal care products) | | | | | | |
Brenntag SE (Industrials, Trading companies & distributors) | | | | | | |
Commerzbank AG (Financials, Banks) | | | | | | |
Continental AG (Consumer discretionary, Automobile components) | | | | | | |
Covestro AG (Materials, Chemicals)144A† | | | | | | |
Daimler Truck Holding AG (Industrials, Machinery) | | | | | | |
Deutsche Bank AG (Financials, Capital markets) | | | | | | |
Deutsche Lufthansa AG (Industrials, Passenger airlines)† | | | | | | |
Deutsche Telekom AG (Communication services, Diversified telecommunication services) | | | | | | |
DHL Group (Industrials, Air freight & logistics) | | | | | | |
Evonik Industries AG (Materials, Chemicals) | | | | | | |
Fresenius Medical Care AG & Co. KGaA (Health care, Health care providers & services) | | | | | | |
Fresenius SE & Co. KGaA (Health care, Health care providers & services) | | | | | | |
GEA Group AG (Industrials, Machinery) | | | | | | |
Hannover Rueck SE (Financials, Insurance) | | | | | | |
Heidelberg Materials AG (Materials, Construction materials) | | | | | | |
Henkel AG & Co. KGaA (Consumer staples, Household products) | | | | | | |
Infineon Technologies AG (Information technology, Semiconductors & semiconductor equipment) | | | | | | |
Knorr-Bremse AG (Industrials, Machinery) | | | | | | |
Mercedes-Benz Group AG (Consumer discretionary, Automobiles) | | | | | | |
Merck KGaA (Health care, Pharmaceuticals) | | | | | | |
MTU Aero Engines AG (Industrials, Aerospace & defense) | | | | | | |
Muenchener Rueckversicherungs-Gesellschaft AG in Muenchen (Financials, Insurance) | | | | | | |
Rheinmetall AG (Industrials, Aerospace & defense) | | | | | | |
RWE AG (Utilities, Independent power and renewable electricity producers) | | | | | | |
SAP SE (Information technology, Software) | | | | | | |
Scout24 SE (Communication services, Interactive media & services)144A | | | | | | |
Siemens AG (Industrials, Industrial conglomerates) | | | | | | |
Siemens Healthineers AG (Health care, Health care equipment & supplies)144A | | | | | | |
The accompanying notes are an integral part of these financial statements.
8 | Allspring Factor Enhanced International Equity Portfolio
Portfolio of investments—August 31, 2023 (unaudited)
| | | | | |
| | | | | | |
Talanx AG (Financials, Insurance)† | | | | | | |
Wacker Chemie AG (Materials, Chemicals) | | | | | | |
| | | | | | |
| | | | | | |
AIA Group Ltd. (Financials, Insurance) | | | | | | |
CK Asset Holdings Ltd. (Real estate, Real estate management & development) | | | | | | |
CK Infrastructure Holdings Ltd. (Utilities, Electric utilities) | | | | | | |
CLP Holdings Ltd. (Utilities, Electric utilities) | | | | | | |
Hang Lung Properties Ltd. (Real estate, Real estate management & development) | | | | | | |
Henderson Land Development Co. Ltd. (Real estate, Real estate management & development) | | | | | | |
Hong Kong Exchanges & Clearing Ltd. (Financials, Capital markets) | | | | | | |
Jardine Matheson Holdings Ltd. (Industrials, Industrial conglomerates) | | | | | | |
Link REIT (Real estate, Retail REITs) | | | | | | |
New World Development Co. Ltd. (Real estate, Real estate management & development) | | | | | | |
Power Assets Holdings Ltd. (Utilities, Electric utilities) | | | | | | |
Sino Land Co. Ltd. (Real estate, Real estate management & development) | | | | | | |
Sun Hung Kai Properties Ltd. (Real estate, Real estate management & development) | | | | | | |
Swire Pacific Ltd. Class A (Real estate, Real estate management & development) | | | | | | |
Swire Properties Ltd. (Real estate, Real estate management & development) | | | | | | |
Techtronic Industries Co. Ltd. (Industrials, Machinery) | | | | | | |
WH Group Ltd. (Consumer staples, Food products)144A | | | | | | |
Wharf Real Estate Investment Co. Ltd. (Real estate, Real estate management & development) | | | | | | |
| | | | | | |
| | | | | | |
AIB Group PLC (Financials, Banks) | | | | | | |
Bank of Ireland Group PLC (Financials, Banks)† | | | | | | |
CRH PLC (Materials, Construction materials) | | | | | | |
DCC PLC (Industrials, Industrial conglomerates) | | | | | | |
Flutter Entertainment PLC (Consumer discretionary, Hotels, restaurants & leisure)† | | | | | | |
Smurfit Kappa Group PLC (Materials, Containers & packaging) | | | | | | |
| | | | | | |
| | | | | | |
Bank Hapoalim BM (Financials, Banks) | | | | | | |
Bank Leumi Le-Israel BM (Financials, Banks) | | | | | | |
Check Point Software Technologies Ltd. (Information technology, Software)† | | | | | | |
The accompanying notes are an integral part of these financial statements.
Allspring Factor Enhanced International Equity Portfolio | 9
Portfolio of investments—August 31, 2023 (unaudited)
| | | | | |
| | | | | | |
ICL Group Ltd. (Materials, Chemicals) | | | | | | |
Israel Discount Bank Ltd. Class A (Financials, Banks) | | | | | | |
Mizrahi Tefahot Bank Ltd. (Financials, Banks) | | | | | | |
Nice Ltd. (Information technology, Software)† | | | | | | |
Tower Semiconductor Ltd. (Information technology, Semiconductors & semiconductor equipment)† | | | | | | |
Wix.com Ltd. (Information technology, IT services)† | | | | | | |
| | | | | | |
| | | | | | |
Assicurazioni Generali SpA (Financials, Insurance) | | | | | | |
ENEL SpA (Utilities, Electric utilities) | | | | | | |
ENI SpA (Energy, Oil, gas & consumable fuels)† | | | | | | |
Infrastrutture Wireless Italiane SpA (Communication services, Diversified telecommunication services)144A | | | | | | |
Intesa Sanpaolo SpA (Financials, Banks) | | | | | | |
Mediobanca Banca di Credito Finanziario SpA (Financials, Banks) | | | | | | |
Moncler SpA (Consumer discretionary, Textiles, apparel & luxury goods) | | | | | | |
Poste Italiane SpA (Financials, Insurance)144A | | | | | | |
Prysmian SpA (Industrials, Electrical equipment) | | | | | | |
Snam SpA (Utilities, Gas utilities) | | | | | | |
Telecom Italia SpA (Communication services, Diversified telecommunication services)† | | | | | | |
Terna - Rete Elettrica Nazionale (Utilities, Electric utilities) | | | | | | |
UniCredit SpA (Financials, Banks) | | | | | | |
| | | | | | |
| | | | | | |
Advantest Corp. (Information technology, Semiconductors & semiconductor equipment) | | | | | | |
AGC, Inc. (Industrials, Building products) | | | | | | |
Aisin Corp. (Consumer discretionary, Automobile components) | | | | | | |
Ajinomoto Co., Inc. (Consumer staples, Food products) | | | | | | |
Asahi Group Holdings Ltd. (Consumer staples, Beverages) | | | | | | |
Astellas Pharma, Inc. (Health care, Pharmaceuticals) | | | | | | |
Azbil Corp. (Information technology, Electronic equipment, instruments & components) | | | | | | |
BayCurrent Consulting, Inc. (Industrials, Professional services) | | | | | | |
Bridgestone Corp. (Consumer discretionary, Automobile components) | | | | | | |
Canon, Inc. (Information technology, Technology hardware, storage & peripherals) | | | | | | |
Capcom Co. Ltd. (Communication services, Entertainment) | | | | | | |
Central Japan Railway Co. (Industrials, Ground transportation) | | | | | | |
Chubu Electric Power Co., Inc. (Utilities, Electric utilities) | | | | | | |
Chugai Pharmaceutical Co. Ltd. (Health care, Pharmaceuticals) | | | | | | |
CyberAgent, Inc. (Communication services, Media) | | | | | | |
The accompanying notes are an integral part of these financial statements.
10 | Allspring Factor Enhanced International Equity Portfolio
Portfolio of investments—August 31, 2023 (unaudited)
| | | | | |
| | | | | | |
Dai Nippon Printing Co. Ltd. (Industrials, Commercial services & supplies) | | | | | | |
Daifuku Co. Ltd. (Industrials, Machinery) | | | | | | |
Dai-ichi Life Holdings, Inc. (Financials, Insurance) | | | | | | |
Daiichi Sankyo Co. Ltd. (Health care, Pharmaceuticals) | | | | | | |
Daikin Industries Ltd. (Industrials, Building products) | | | | | | |
Daito Trust Construction Co. Ltd. (Real estate, Real estate management & development) | | | | | | |
Daiwa House Industry Co. Ltd. (Real estate, Real estate management & development) | | | | | | |
Daiwa Securities Group, Inc. (Financials, Capital markets) | | | | | | |
Denso Corp. (Consumer discretionary, Automobile components) | | | | | | |
Disco Corp. (Information technology, Semiconductors & semiconductor equipment) | | | | | | |
East Japan Railway Co. (Industrials, Ground transportation) | | | | | | |
ENEOS Holdings, Inc. (Energy, Oil, gas & consumable fuels) | | | | | | |
FANUC Corp. (Industrials, Machinery) | | | | | | |
Fast Retailing Co. Ltd. (Consumer discretionary, Specialty retail) | | | | | | |
Fuji Electric Co. Ltd. (Industrials, Electrical equipment) | | | | | | |
FUJIFILM Holdings Corp. (Information technology, Technology hardware, storage & peripherals) | | | | | | |
Fujitsu Ltd. (Information technology, IT services) | | | | | | |
Hamamatsu Photonics KK (Information technology, Electronic equipment, instruments & components) | | | | | | |
Hankyu Hanshin Holdings, Inc. (Industrials, Ground transportation) | | | | | | |
Hikari Tsushin, Inc. (Industrials, Industrial conglomerates) | | | | | | |
Hirose Electric Co. Ltd. (Information technology, Electronic equipment, instruments & components) | | | | | | |
Hitachi Construction Machinery Co. Ltd. (Industrials, Machinery) | | | | | | |
Hitachi Ltd. (Industrials, Industrial conglomerates) | | | | | | |
Honda Motor Co. Ltd. (Consumer discretionary, Automobiles) | | | | | | |
Hoshizaki Corp. (Industrials, Machinery) | | | | | | |
Hoya Corp. (Health care, Health care equipment & supplies) | | | | | | |
Hulic Co. Ltd. (Real estate, Real estate management & development) | | | | | | |
Ibiden Co. Ltd. (Information technology, Electronic equipment, instruments & components) | | | | | | |
Idemitsu Kosan Co. Ltd. (Energy, Oil, gas & consumable fuels) | | | | | | |
INPEX Corp. (Energy, Oil, gas & consumable fuels) | | | | | | |
ITOCHU Corp. (Industrials, Trading companies & distributors) | | | | | | |
Japan Post Holdings Co. Ltd. (Financials, Insurance) | | | | | | |
Japan Post Insurance Co. Ltd. (Financials, Insurance) | | | | | | |
Japan Tobacco, Inc. (Consumer staples, Tobacco) | | | | | | |
JFE Holdings, Inc. (Materials, Metals & mining) | | | | | | |
Kajima Corp. (Industrials, Construction & engineering) | | | | | | |
Kansai Electric Power Co., Inc. (Utilities, Electric utilities) | | | | | | |
Kao Corp. (Consumer staples, Personal care products) | | | | | | |
Kawasaki Kisen Kaisha Ltd. (Industrials, Marine transportation) | | | | | | |
KDDI Corp. (Communication services, Wireless telecommunication services) | | | | | | |
The accompanying notes are an integral part of these financial statements.
Allspring Factor Enhanced International Equity Portfolio | 11
Portfolio of investments—August 31, 2023 (unaudited)
| | | | | |
| | | | | | |
Keisei Electric Railway Co. Ltd. (Industrials, Ground transportation) | | | | | | |
Keyence Corp. (Information technology, Electronic equipment, instruments & components) | | | | | | |
Kintetsu Group Holdings Co. Ltd. (Industrials, Ground transportation) | | | | | | |
Kirin Holdings Co. Ltd. (Consumer staples, Beverages) | | | | | | |
Kobayashi Pharmaceutical Co. Ltd. (Consumer staples, Personal care products) | | | | | | |
Kobe Bussan Co. Ltd. (Consumer staples, Consumer staples distribution & retail) | | | | | | |
Koei Tecmo Holdings Co. Ltd. (Communication services, Entertainment) | | | | | | |
Komatsu Ltd. (Industrials, Machinery) | | | | | | |
Konami Group Corp. (Communication services, Entertainment) | | | | | | |
Kose Corp. (Consumer staples, Personal care products) | | | | | | |
Kyocera Corp. (Information technology, Electronic equipment, instruments & components) | | | | | | |
M3, Inc. (Health care, Health care technology) | | | | | | |
Marubeni Corp. (Industrials, Trading companies & distributors) | | | | | | |
Mazda Motor Corp. (Consumer discretionary, Automobiles) | | | | | | |
McDonald’s Holdings Co. Japan Ltd. (Consumer discretionary, Hotels, restaurants & leisure) | | | | | | |
MEIJI Holdings Co. Ltd. (Consumer staples, Food products) | | | | | | |
MinebeaMitsumi, Inc. (Industrials, Machinery) | | | | | | |
Mitsubishi Chemical Group Corp. (Materials, Chemicals) | | | | | | |
Mitsubishi Corp. (Industrials, Trading companies & distributors) | | | | | | |
Mitsubishi Electric Corp. (Industrials, Electrical equipment) | | | | | | |
Mitsubishi HC Capital, Inc. (Financials, Financial services) | | | | | | |
Mitsubishi Heavy Industries Ltd. (Industrials, Machinery) | | | | | | |
Mitsubishi UFJ Financial Group, Inc. (Financials, Banks) | | | | | | |
Mitsui & Co. Ltd. (Industrials, Trading companies & distributors) | | | | | | |
Mitsui Chemicals, Inc. (Materials, Chemicals) | | | | | | |
Mitsui OSK Lines Ltd. (Industrials, Marine transportation) | | | | | | |
Mizuho Financial Group, Inc. (Financials, Banks) | | | | | | |
MS&AD Insurance Group Holdings, Inc. (Financials, Insurance) | | | | | | |
Murata Manufacturing Co. Ltd. (Information technology, Electronic equipment, instruments & components) | | | | | | |
NEC Corp. (Information technology, IT services) | | | | | | |
Nexon Co. Ltd. (Communication services, Entertainment) | | | | | | |
NGK Insulators Ltd. (Industrials, Machinery) | | | | | | |
Nintendo Co. Ltd. (Communication services, Entertainment) | | | | | | |
NIPPON EXPRESS HOLDINGS, Inc. (Industrials, Air freight & logistics) | | | | | | |
Nippon Sanso Holdings Corp. (Materials, Chemicals) | | | | | | |
Nippon Shinyaku Co. Ltd. (Health care, Pharmaceuticals) | | | | | | |
Nippon Steel Corp. (Materials, Metals & mining) | | | | | | |
Nippon Telegraph & Telephone Corp. (Communication services, Diversified telecommunication services) | | | | | | |
Nippon Yusen KK (Industrials, Marine transportation) | | | | | | |
Nissan Motor Co. Ltd. (Consumer discretionary, Automobiles) | | | | | | |
Nisshin Seifun Group, Inc. (Consumer staples, Food products) | | | | | | |
The accompanying notes are an integral part of these financial statements.
12 | Allspring Factor Enhanced International Equity Portfolio
Portfolio of investments—August 31, 2023 (unaudited)
| | | | | |
| | | | | | |
Nissin Foods Holdings Co. Ltd. (Consumer staples, Food products) | | | | | | |
Nitto Denko Corp. (Materials, Chemicals) | | | | | | |
Nomura Holdings, Inc. (Financials, Capital markets) | | | | | | |
Nomura Real Estate Holdings, Inc. (Real estate, Real estate management & development) | | | | | | |
Nomura Real Estate Master Fund, Inc. (Real estate, Diversified REITs) | | | | | | |
NTT Data Corp. (Information technology, IT services) | | | | | | |
Obayashi Corp. (Industrials, Construction & engineering) | | | | | | |
Odakyu Electric Railway Co. Ltd. (Industrials, Ground transportation) | | | | | | |
Oji Holdings Corp. (Materials, Paper & forest products) | | | | | | |
Olympus Corp. (Health care, Health care equipment & supplies) | | | | | | |
Omron Corp. (Information technology, Electronic equipment, instruments & components) | | | | | | |
Ono Pharmaceutical Co. Ltd. (Health care, Pharmaceuticals) | | | | | | |
Open House Group Co. Ltd. (Consumer discretionary, Household durables) | | | | | | |
Oracle Corp. Japan (Information technology, Software) | | | | | | |
Oriental Land Co. Ltd. (Consumer discretionary, Hotels, restaurants & leisure) | | | | | | |
ORIX Corp. (Financials, Financial services) | | | | | | |
Otsuka Corp. (Information technology, IT services) | | | | | | |
Otsuka Holdings Co. Ltd. (Health care, Pharmaceuticals) | | | | | | |
Pan Pacific International Holdings Corp. (Consumer discretionary, Broadline retail) | | | | | | |
Panasonic Holdings Corp. (Consumer discretionary, Household durables) | | | | | | |
Persol Holdings Co. Ltd. (Industrials, Professional services) | | | | | | |
Recruit Holdings Co. Ltd. (Industrials, Professional services) | | | | | | |
Renesas Electronics Corp. (Information technology, Semiconductors & semiconductor equipment)† | | | | | | |
Ricoh Co. Ltd. (Information technology, Technology hardware, storage & peripherals) | | | | | | |
SBI Holdings, Inc. (Financials, Capital markets) | | | | | | |
SCSK Corp. (Information technology, IT services) | | | | | | |
Secom Co. Ltd. (Industrials, Commercial services & supplies) | | | | | | |
Seiko Epson Corp. (Information technology, Technology hardware, storage & peripherals) | | | | | | |
Sekisui Chemical Co. Ltd. (Consumer discretionary, Household durables) | | | | | | |
Sekisui House Ltd. (Consumer discretionary, Household durables) | | | | | | |
Seven & i Holdings Co. Ltd. (Consumer staples, Consumer staples distribution & retail) | | | | | | |
Shimano, Inc. (Consumer discretionary, Leisure products) | | | | | | |
Shimizu Corp. (Industrials, Construction & engineering) | | | | | | |
Shin-Etsu Chemical Co. Ltd. (Materials, Chemicals) | | | | | | |
Shiseido Co. Ltd. (Consumer staples, Personal care products) | | | | | | |
Shizuoka Financial Group, Inc. (Financials, Banks) | | | | | | |
SMC Corp. (Industrials, Machinery) | | | | | | |
SoftBank Corp. (Communication services, Wireless telecommunication services) | | | | | | |
The accompanying notes are an integral part of these financial statements.
Allspring Factor Enhanced International Equity Portfolio | 13
Portfolio of investments—August 31, 2023 (unaudited)
| | | | | |
| | | | | | |
SoftBank Group Corp. (Communication services, Wireless telecommunication services) | | | | | | |
Sompo Holdings, Inc. (Financials, Insurance) | | | | | | |
Sony Group Corp. (Consumer discretionary, Household durables) | | | | | | |
Square Enix Holdings Co. Ltd. (Communication services, Entertainment) | | | | | | |
Subaru Corp. (Consumer discretionary, Automobiles) | | | | | | |
SUMCO Corp. (Information technology, Semiconductors & semiconductor equipment) | | | | | | |
Sumitomo Corp. (Industrials, Trading companies & distributors) | | | | | | |
Sumitomo Electric Industries Ltd. (Consumer discretionary, Automobile components) | | | | | | |
Sumitomo Mitsui Financial Group, Inc. (Financials, Banks) | | | | | | |
Sumitomo Mitsui Trust Holdings, Inc. (Financials, Banks) | | | | | | |
Sumitomo Realty & Development Co. Ltd. (Real estate, Real estate management & development) | | | | | | |
Suntory Beverage & Food Ltd. (Consumer staples, Beverages) | | | | | | |
Suzuki Motor Corp. (Consumer discretionary, Automobiles) | | | | | | |
Sysmex Corp. (Health care, Health care equipment & supplies) | | | | | | |
T&D Holdings, Inc. (Financials, Insurance) | | | | | | |
Taisei Corp. (Industrials, Construction & engineering) | | | | | | |
Takeda Pharmaceutical Co. Ltd. (Health care, Pharmaceuticals) | | | | | | |
TDK Corp. (Information technology, Electronic equipment, instruments & components) | | | | | | |
Terumo Corp. (Health care, Health care equipment & supplies) | | | | | | |
TIS, Inc. (Information technology, IT services) | | | | | | |
Tobu Railway Co. Ltd. (Industrials, Ground transportation) | | | | | | |
Toho Co. Ltd. (Communication services, Entertainment) | | | | | | |
Tokio Marine Holdings, Inc. (Financials, Insurance) | | | | | | |
Tokyo Electron Ltd. (Information technology, Semiconductors & semiconductor equipment) | | | | | | |
Tokyo Gas Co. Ltd. (Utilities, Gas utilities) | | | | | | |
TOPPAN, Inc. (Industrials, Commercial services & supplies) | | | | | | |
Toray Industries, Inc. (Materials, Chemicals) | | | | | | |
Tosoh Corp. (Materials, Chemicals) | | | | | | |
TOTO Ltd. (Industrials, Building products) | | | | | | |
Toyota Motor Corp. (Consumer discretionary, Automobiles) | | | | | | |
Toyota Tsusho Corp. (Industrials, Trading companies & distributors) | | | | | | |
Unicharm Corp. (Consumer staples, Household products) | | | | | | |
Welcia Holdings Co. Ltd. (Consumer staples, Consumer staples distribution & retail) | | | | | | |
West Japan Railway Co. (Industrials, Ground transportation) | | | | | | |
Yakult Honsha Co. Ltd. (Consumer staples, Food products) | | | | | | |
Yamaha Motor Co. Ltd. (Consumer discretionary, Automobiles) | | | | | | |
Yamato Holdings Co. Ltd. (Industrials, Air freight & logistics) | | | | | | |
Yaskawa Electric Corp. (Industrials, Machinery) | | | | | | |
The accompanying notes are an integral part of these financial statements.
14 | Allspring Factor Enhanced International Equity Portfolio
Portfolio of investments—August 31, 2023 (unaudited)
| | | | | |
| | | | | | |
Yokogawa Electric Corp. (Information technology, Electronic equipment, instruments & components) | | | | | | |
ZOZO, Inc. (Consumer discretionary, Specialty retail) | | | | | | |
| | | | | | |
| | | | | | |
ArcelorMittal SA (Materials, Metals & mining)† | | | | | | |
Eurofins Scientific SE (Health care, Life sciences tools & services) | | | | | | |
Tenaris SA (Energy, Energy equipment & services) | | | | | | |
| | | | | | |
| | | | | | |
ABN AMRO Bank NV (Financials, Banks)144A | | | | | | |
Adyen NV (Financials, Financial services)144A† | | | | | | |
Airbus SE (Industrials, Aerospace & defense) | | | | | | |
Akzo Nobel NV (Materials, Chemicals) | | | | | | |
ASM International NV (Information technology, Semiconductors & semiconductor equipment) | | | | | | |
ASML Holding NV (Information technology, Semiconductors & semiconductor equipment) | | | | | | |
CNH Industrial NV (Industrials, Machinery) | | | | | | |
EXOR NV (Financials, Financial services)† | | | | | | |
Heineken Holding NV (Consumer staples, Beverages) | | | | | | |
Heineken NV (Consumer staples, Beverages) | | | | | | |
ING Groep NV (Financials, Banks) | | | | | | |
JDE Peet’s NV (Consumer staples, Food products) | | | | | | |
Koninklijke Ahold Delhaize NV (Consumer staples, Consumer staples distribution & retail) | | | | | | |
Koninklijke KPN NV (Communication services, Diversified telecommunication services) | | | | | | |
Koninklijke Philips NV (Health care, Health care equipment & supplies)† | | | | | | |
NN Group NV (Financials, Insurance) | | | | | | |
OCI NV (Materials, Chemicals)† | | | | | | |
Prosus NV (Consumer discretionary, Broadline retail)† | | | | | | |
Randstad NV (Industrials, Professional services) | | | | | | |
Stellantis NV (Consumer discretionary, Automobiles) | | | | | | |
STMicroelectronics NV (Information technology, Semiconductors & semiconductor equipment) | | | | | | |
Universal Music Group NV (Communication services, Entertainment) | | | | | | |
Wolters Kluwer NV (Industrials, Professional services) | | | | | | |
| | | | | | |
| | | | | | |
Fisher & Paykel Healthcare Corp. Ltd. Class C (Health care, Health care equipment & supplies) | | | | | | |
The accompanying notes are an integral part of these financial statements.
Allspring Factor Enhanced International Equity Portfolio | 15
Portfolio of investments—August 31, 2023 (unaudited)
| | | | | |
| | | | | | |
Meridian Energy Ltd. (Utilities, Independent power and renewable electricity producers) | | | | | | |
Spark New Zealand Ltd. (Communication services, Diversified telecommunication services) | | | | | | |
| | | | | | |
| | | | | | |
DNB Bank ASA (Financials, Banks) | | | | | | |
Equinor ASA (Energy, Oil, gas & consumable fuels) | | | | | | |
Kongsberg Gruppen ASA (Industrials, Aerospace & defense) | | | | | | |
Mowi ASA (Consumer staples, Food products) | | | | | | |
Norsk Hydro ASA (Materials, Metals & mining) | | | | | | |
Orkla ASA (Consumer staples, Food products) | | | | | | |
Telenor ASA (Communication services, Diversified telecommunication services) | | | | | | |
Yara International ASA (Materials, Chemicals) | | | | | | |
| | | | | | |
| | | | | | |
EDP - Energias de Portugal SA (Utilities, Electric utilities) | | | | | | |
Galp Energia SGPS SA (Energy, Oil, gas & consumable fuels) | | | | | | |
Jeronimo Martins SGPS SA (Consumer staples, Consumer staples distribution & retail) | | | | | | |
| | | | | | |
| | | | | | |
CapitaLand Ascendas REIT (Real estate, Industrial REITs)† | | | | | | |
CapitaLand Integrated Commercial Trust (Real estate, Retail REITs)† | | | | | | |
CapitaLand Investment Ltd. (Real estate, Real estate management & development) | | | | | | |
City Developments Ltd. (Real estate, Real estate management & development) | | | | | | |
DBS Group Holdings Ltd. (Financials, Banks) | | | | | | |
Genting Singapore Ltd. (Consumer discretionary, Hotels, restaurants & leisure) | | | | | | |
Jardine Cycle & Carriage Ltd. (Industrials, Industrial conglomerates) | | | | | | |
Keppel Corp. Ltd. (Industrials, Industrial conglomerates) | | | | | | |
Mapletree Logistics Trust (Real estate, Industrial REITs)† | | | | | | |
Oversea-Chinese Banking Corp. Ltd. (Financials, Banks) | | | | | | |
Singapore Airlines Ltd. (Industrials, Passenger airlines)† | | | | | | |
Singapore Exchange Ltd. (Financials, Capital markets) | | | | | | |
Singapore Telecommunications Ltd. (Communication services, Diversified telecommunication services) | | | | | | |
United Overseas Bank Ltd. (Financials, Banks) | | | | | | |
UOL Group Ltd. (Real estate, Real estate management & development) | | | | | | |
The accompanying notes are an integral part of these financial statements.
16 | Allspring Factor Enhanced International Equity Portfolio
Portfolio of investments—August 31, 2023 (unaudited)
| | | | | |
| | | | | | |
Venture Corp. Ltd. (Information technology, Electronic equipment, instruments & components) | | | | | | |
Wilmar International Ltd. (Consumer staples, Food products) | | | | | | |
| | | | | | |
| | | | | | |
ACS Actividades de Construccion y Servicios SA (Industrials, Construction & engineering) | | | | | | |
Aena SME SA (Industrials, Transportation infrastructure)144A | | | | | | |
Amadeus IT Group SA (Consumer discretionary, Hotels, restaurants & leisure) | | | | | | |
Banco Bilbao Vizcaya Argentaria SA (Financials, Banks) | | | | | | |
Banco Santander SA (Financials, Banks) | | | | | | |
CaixaBank SA (Financials, Banks) | | | | | | |
Enagas SA (Utilities, Gas utilities) | | | | | | |
Endesa SA (Utilities, Electric utilities) | | | | | | |
Grifols SA (Health care, Biotechnology)† | | | | | | |
Iberdrola SA (Utilities, Electric utilities) | | | | | | |
Industria de Diseno Textil SA (Consumer discretionary, Specialty retail) | | | | | | |
Naturgy Energy Group SA (Utilities, Gas utilities) | | | | | | |
Red Electrica Corp. SA (Utilities, Electric utilities) | | | | | | |
Repsol SA (Energy, Oil, gas & consumable fuels) | | | | | | |
Telefonica SA (Communication services, Diversified telecommunication services) | | | | | | |
| | | | | | |
| | | | | | |
Alfa Laval AB (Industrials, Machinery) | | | | | | |
Assa Abloy AB Class B (Industrials, Building products) | | | | | | |
Atlas Copco AB Class A (Industrials, Machinery) | | | | | | |
Atlas Copco AB Class B (Industrials, Machinery) | | | | | | |
Boliden AB (Materials, Metals & mining)† | | | | | | |
Embracer Group AB Class B (Communication services, Entertainment)† | | | | | | |
Epiroc AB Class A (Industrials, Machinery) | | | | | | |
Essity AB Class B (Consumer staples, Household products) | | | | | | |
Evolution AB (Consumer discretionary, Hotels, restaurants & leisure)144A | | | | | | |
Fastighets AB Balder Class B (Real estate, Real estate management & development)† | | | | | | |
Getinge AB Class B (Health care, Health care equipment & supplies) | | | | | | |
H & M Hennes & Mauritz AB Class B (Consumer discretionary, Specialty retail) | | | | | | |
Hexagon AB Class B (Information technology, Electronic equipment, instruments & components) | | | | | | |
Husqvarna AB Class B (Industrials, Machinery) | | | | | | |
Industrivarden AB Class C (Financials, Financial services) | | | | | | |
Investor AB Class B (Financials, Financial services) | | | | | | |
The accompanying notes are an integral part of these financial statements.
Allspring Factor Enhanced International Equity Portfolio | 17
Portfolio of investments—August 31, 2023 (unaudited)
| | | | | |
| | | | | | |
Kinnevik AB Class B (Financials, Financial services)† | | | | | | |
Saab AB Class B (Industrials, Aerospace & defense) | | | | | | |
Sandvik AB (Industrials, Machinery) | | | | | | |
Securitas AB Class B (Industrials, Commercial services & supplies)† | | | | | | |
Skandinaviska Enskilda Banken AB Class A (Financials, Banks) | | | | | | |
Skanska AB Class B (Industrials, Construction & engineering) | | | | | | |
SKF AB Class B (Industrials, Machinery) | | | | | | |
Svenska Handelsbanken AB Class A (Financials, Banks) | | | | | | |
Swedbank AB Class A (Financials, Banks) | | | | | | |
Swedish Orphan Biovitrum AB (Health care, Biotechnology)† | | | | | | |
Tele2 AB Class B (Communication services, Wireless telecommunication services) | | | | | | |
Telefonaktiebolaget LM Ericsson Class B (Information technology, Communications equipment) | | | | | | |
Volvo AB Class A (Industrials, Machinery) | | | | | | |
Volvo AB Class B (Industrials, Machinery) | | | | | | |
| | | | | | |
| | | | | | |
ABB Ltd. (Industrials, Electrical equipment) | | | | | | |
Adecco Group AG (Industrials, Professional services) | | | | | | |
Alcon, Inc. (Health care, Health care equipment & supplies) | | | | | | |
Bachem Holding AG (Health care, Life sciences tools & services) | | | | | | |
BKW AG (Utilities, Electric utilities) | | | | | | |
Chocoladefabriken Lindt & Spruengli AG (Consumer staples, Food products) | | | | | | |
Chocoladefabriken Lindt & Spruengli AG (Consumer staples, Food products) | | | | | | |
CIE Financiere Richemont SA Class A (Consumer discretionary, Textiles, apparel & luxury goods) | | | | | | |
Coca-Cola HBC AG (Consumer staples, Beverages)† | | | | | | |
Dufry AG (Consumer discretionary, Specialty retail)† | | | | | | |
Geberit AG (Industrials, Building products) | | | | | | |
Givaudan SA (Materials, Chemicals) | | | | | | |
Helvetia Holding AG (Financials, Insurance) | | | | | | |
Holcim AG (Materials, Construction materials) | | | | | | |
Julius Baer Group Ltd. (Financials, Capital markets) | | | | | | |
Kuehne & Nagel International AG (Industrials, Marine transportation) | | | | | | |
Logitech International SA (Information technology, Technology hardware, storage & peripherals) | | | | | | |
Lonza Group AG (Health care, Life sciences tools & services) | | | | | | |
Nestle SA (Consumer staples, Food products) | | | | | | |
Novartis AG (Health care, Pharmaceuticals) | | | | | | |
Partners Group Holding AG (Financials, Capital markets) | | | | | | |
Roche Holding AG (Health care, Pharmaceuticals) | | | | | | |
Roche Holding AG (Health care, Pharmaceuticals) | | | | | | |
Schindler Holding AG (Industrials, Machinery) | | | | | | |
Schindler Holding AG (Industrials, Machinery) | | | | | | |
SGS SA (Industrials, Professional services) | | | | | | |
The accompanying notes are an integral part of these financial statements.
18 | Allspring Factor Enhanced International Equity Portfolio
Portfolio of investments—August 31, 2023 (unaudited)
| | | | | |
| | | | | | |
Sika AG (Materials, Chemicals) | | | | | | |
Sonova Holding AG (Health care, Health care equipment & supplies) | | | | | | |
Straumann Holding AG (Health care, Health care equipment & supplies) | | | | | | |
Swatch Group AG (Consumer discretionary, Textiles, apparel & luxury goods) | | | | | | |
Swiss Life Holding AG (Financials, Insurance) | | | | | | |
Swiss Re AG (Financials, Insurance) | | | | | | |
Swisscom AG (Communication services, Diversified telecommunication services) | | | | | | |
Temenos AG (Information technology, Software) | | | | | | |
UBS Group AG (Financials, Capital markets) | | | | | | |
VAT Group AG (Industrials, Machinery)144A | | | | | | |
Zurich Insurance Group AG (Financials, Insurance) | | | | | | |
| | | | | | |
| | | | | | |
3i Group PLC (Financials, Capital markets) | | | | | | |
abrdn PLC (Financials, Capital markets) | | | | | | |
Admiral Group PLC (Financials, Insurance) | | | | | | |
Anglo American PLC (Materials, Metals & mining) | | | | | | |
Ashtead Group PLC (Industrials, Trading companies & distributors) | | | | | | |
Associated British Foods PLC (Consumer staples, Food products) | | | | | | |
AstraZeneca PLC (Health care, Pharmaceuticals) | | | | | | |
Auto Trader Group PLC (Communication services, Interactive media & services)144A | | | | | | |
Aviva PLC (Financials, Insurance) | | | | | | |
BAE Systems PLC (Industrials, Aerospace & defense) | | | | | | |
Barclays PLC (Financials, Banks) | | | | | | |
Barratt Developments PLC (Consumer discretionary, Household durables) | | | | | | |
BP PLC (Energy, Oil, gas & consumable fuels) | | | | | | |
British American Tobacco PLC (Consumer staples, Tobacco) | | | | | | |
BT Group PLC (Communication services, Diversified telecommunication services) | | | | | | |
Bunzl PLC (Industrials, Trading companies & distributors) | | | | | | |
Burberry Group PLC (Consumer discretionary, Textiles, apparel & luxury goods) | | | | | | |
Centrica PLC (Utilities, Multi-utilities) | | | | | | |
CK Hutchison Holdings Ltd. (Industrials, Industrial conglomerates) | | | | | | |
Coca-Cola Europacific Partners PLC (Consumer staples, Beverages) | | | | | | |
Compass Group PLC (Consumer discretionary, Hotels, restaurants & leisure) | | | | | | |
Diageo PLC (Consumer staples, Beverages) | | | | | | |
Endeavour Mining PLC (Materials, Metals & mining) | | | | | | |
Entain PLC (Consumer discretionary, Hotels, restaurants & leisure) | | | | | | |
GSK PLC (Health care, Pharmaceuticals) | | | | | | |
Haleon PLC (Consumer staples, Personal care products) | | | | | | |
Hargreaves Lansdown PLC (Financials, Capital markets) | | | | | | |
The accompanying notes are an integral part of these financial statements.
Allspring Factor Enhanced International Equity Portfolio | 19
Portfolio of investments—August 31, 2023 (unaudited)
| | | | | |
United Kingdom (continued) | | | | | | |
Hikma Pharmaceuticals PLC (Health care, Pharmaceuticals) | | | | | | |
HSBC Holdings PLC (Financials, Banks)† | | | | | | |
Imperial Brands PLC (Consumer staples, Tobacco) | | | | | | |
InterContinental Hotels Group PLC (Consumer discretionary, Hotels, restaurants & leisure) | | | | | | |
Intertek Group PLC (Industrials, Professional services) | | | | | | |
J Sainsbury PLC (Consumer staples, Consumer staples distribution & retail) | | | | | | |
JD Sports Fashion PLC (Consumer discretionary, Specialty retail) | | | | | | |
Johnson Matthey PLC (Materials, Chemicals) | | | | | | |
Kingfisher PLC (Consumer discretionary, Specialty retail) | | | | | | |
Lloyds Banking Group PLC (Financials, Banks) | | | | | | |
London Stock Exchange Group PLC (Financials, Capital markets) | | | | | | |
National Grid PLC (Utilities, Multi-utilities) | | | | | | |
NatWest Group PLC (Financials, Banks) | | | | | | |
Next PLC (Consumer discretionary, Broadline retail) | | | | | | |
NMC Health PLC (Health care, Health care providers & services)♦† | | | | | | |
Pearson PLC (Consumer discretionary, Diversified consumer services) | | | | | | |
Persimmon PLC (Consumer discretionary, Household durables) | | | | | | |
Prudential PLC (Financials, Insurance) | | | | | | |
Reckitt Benckiser Group PLC (Consumer staples, Household products) | | | | | | |
RELX PLC (Industrials, Professional services) | | | | | | |
Rio Tinto PLC (Materials, Metals & mining) | | | | | | |
Rolls-Royce Holdings PLC (Industrials, Aerospace & defense)† | | | | | | |
Sage Group PLC (Information technology, Software) | | | | | | |
Schroders PLC (Financials, Capital markets) | | | | | | |
Shell PLC (Energy, Oil, gas & consumable fuels) | | | | | | |
Smith & Nephew PLC (Health care, Health care equipment & supplies) | | | | | | |
Smiths Group PLC (Industrials, Industrial conglomerates) | | | | | | |
SSE PLC (Utilities, Electric utilities) | | | | | | |
Standard Chartered PLC (Financials, Banks) | | | | | | |
Taylor Wimpey PLC (Consumer discretionary, Household durables) | | | | | | |
Tesco PLC (Consumer staples, Consumer staples distribution & retail) | | | | | | |
Unilever PLC (Consumer staples, Personal care products) | | | | | | |
United Utilities Group PLC (Utilities, Water utilities) | | | | | | |
Vodafone Group PLC (Communication services, Wireless telecommunication services) | | | | | | |
Whitbread PLC (Consumer discretionary, Hotels, restaurants & leisure) | | | | | | |
WPP PLC (Communication services, Media) | | | | | | |
| | | | | | |
| | | | | | |
Experian PLC (Industrials, Professional services) | | | | | | |
Total common stocks (Cost $348,251,419) | | | | | | |
The accompanying notes are an integral part of these financial statements.
20 | Allspring Factor Enhanced International Equity Portfolio
Portfolio of investments—August 31, 2023 (unaudited)
| | | | | |
| | | | | | |
| | | | | | |
Bayerische Motoren Werke AG (Consumer discretionary, Automobiles) | | | | | | |
Henkel AG & Co. KGaA (Consumer staples, Household products) | | | | | | |
Sartorius AG (Health care, Life sciences tools & services) | | | | | | |
Volkswagen AG (Consumer discretionary, Automobiles) | | | | | | |
Total preferred stocks (Cost $2,073,180) | | | | | | |
| | | | | |
| | | | | | |
| | | | | | |
Constellation Software, Inc. (Information technology, Software)† | | | | | | |
| | | | | | |
Swedish Orphan Biovitrum AB (Health care, Biotechnology)† | | | | | | |
| | | | | | |
| | | | | | |
| | | | | | |
Constellation Software, Inc. (Information technology, Software)♦† | | | | | | |
| | | | | | |
| | | | | |
Short-term investments: 4.13% | | | | | | |
Investment companies: 4.13% | | | | | | |
Allspring Government Money Market Fund Select Class♠∞ | | | | | | |
Total short-term investments (Cost $18,101,648) | | | | | | |
Total investments in securities (Cost $368,426,437) | | | | | | |
Other assets and liabilities, net | | | | | | |
| | | | | | |
| Non-income-earning security |
| The security may be resold in transactions exempt from registration, normally to qualified institutional buyers, pursuant to Rule 144A under the Securities Act of 1933. |
| The security is fair valued in accordance with procedures approved by the Board of Trustees. |
| The issuer of the security is an affiliated person of the Portfolio as defined in the Investment Company Act of 1940. |
| The rate represents the 7-day annualized yield at period end. |
|
| Real estate investment trust |
The accompanying notes are an integral part of these financial statements.
Allspring Factor Enhanced International Equity Portfolio | 21
Portfolio of investments—August 31, 2023 (unaudited)
Investments in affiliates
An affiliated investment is an investment in which the Portfolio owns at least 5% of the outstanding voting shares of the issuer or as a result of other relationships, such as the Portfolio and the issuer having the same adviser or investment manager. Transactions with issuers that were affiliates of the Portfolio at the end of the period were as follows:
| | | | | Net
change in
unrealized
gains
(losses) | | | Income
from
affiliated
securities |
| | | | | | | | |
Allspring Government Money Market Fund Select Class | | | | | | | | |
Futures contracts
The accompanying notes are an integral part of these financial statements.
22 | Allspring Factor Enhanced International Equity Portfolio
Statement of assets and liabilities—August 31, 2023 (unaudited)
Financial statements
Statement of assets and liabilities
| |
Investments in unaffiliated securities, at value (cost $350,324,789) | |
Investments in affiliated securities, at value (cost $18,101,648) | |
Cash at broker segregated for futures contracts | |
Foreign currency, at value (cost $139,317) | |
| |
Prepaid expenses and other assets | |
| |
| |
Custody and accounting fees payable | |
Payable for daily variation margin on open futures contracts | |
| |
Interest holder report expenses payable | |
Professional fees payable | |
Trustees’ fees and expenses payable | |
Payable for investments purchased | |
Accrued expenses and other liabilities | |
| |
| |
The accompanying notes are an integral part of these financial statements.
Allspring Factor Enhanced International Equity Portfolio | 23
Statement of operations—six months ended August 31, 2023 (unaudited)
Statement of operations
| |
Dividends (net of foreign withholdings taxes of $1,399,425) | |
Income from affiliated securities | |
| |
| |
| |
| |
Custody and accounting fees | |
| |
Interest holder report expenses | |
Trustees’ fees and expenses | |
| |
| |
Less: Fee waivers and/or expense reimbursements | |
| |
| |
Realized and unrealized gains (losses) on investments | |
Net realized gains (losses) on | |
| |
Foreign currency and foreign currency translations | |
| |
Net realized gains on investments | |
Net change in unrealized gains (losses) on | |
| |
Foreign currency and foreign currency translations | |
| |
Net change in unrealized gains (losses) on investments | |
Net realized and unrealized gains (losses) on investments | |
Net increase in net assets resulting from operations | |
The accompanying notes are an integral part of these financial statements.
24 | Allspring Factor Enhanced International Equity Portfolio
Statement of changes in net assets
Statement of changes in net assets
|
Six months ended
August 31, 2023 (unaudited) | Year ended February 28, 2023 |
| | | | |
| | | | |
Net realized gains (losses) on investments | | | | |
Net change in unrealized gains (losses) on investments | | | | |
Net increase (decrease) in net assets resulting from operations | | | | |
| | | | |
Transactions in investors’ beneficial interests | | | | |
| | | | |
| | | | |
Net decrease in net assets resulting from capital transactions | | | | |
Total decrease in net assets | | | | |
| | | | |
| | | | |
| | | | |
The accompanying notes are an integral part of these financial statements.
Allspring Factor Enhanced International Equity Portfolio | 25
| Six months ended
August 31, 2023
(unaudited) | |
| | | | | |
| | | | | | |
Ratios to average net assets (annualized) | | | | | | |
| | | | | | |
| | | | | | |
| | | | | | |
| | | | | | |
| | | | | | |
| Ratio includes expenses which were voluntarily waived by the adviser. Without these voluntary waivers, the net expense ratios would be increased by the following amounts: |
Six months ended August 31, 2023 (unaudited) | |
Year ended February 28, 2023 | |
Year ended February 28, 2022 | |
Year ended February 28, 2021 | |
| |
| Returns for periods of less than one year are not annualized. |
The accompanying notes are an integral part of these financial statements.
26 | Allspring Factor Enhanced International Equity Portfolio
Notes to financial statements (unaudited)
Notes to financial statements
Allspring Master Trust (the “Trust”), a Delaware statutory trust organized on March 10, 1999, is an open-end management investment company registered under the Investment Company Act of 1940, as amended (the “1940 Act”). As an investment company, the Trust follows the accounting and reporting guidance in Financial Accounting Standards Board (“FASB”) Accounting Standards Codification Topic 946, Financial Services – Investment Companies. These financial statements report on the Allspring Factor Enhanced International Equity Portfolio (the “Portfolio”) which is a diversified series of the Trust.
Interests in the Portfolio are available solely through private placement transactions that do not involve any “public offering” within the meaning of Section 4(a)(2) of the Securities Act of 1933.
2.
SIGNIFICANT ACCOUNTING POLICIES
The following significant accounting policies, which are consistently followed in the preparation of the financial statements of the Portfolio, are in conformity with U.S. generally accepted accounting principles which require management to make estimates and assumptions that affect the reported amounts of assets and liabilities, disclosure of contingent assets and liabilities at the date of the financial statements, and the reported amounts of income and expenses during the reporting period. Actual results could differ from those estimates.
Securities valuation
All investments are valued each business day as of the close of regular trading on the New York Stock Exchange (generally 4 p.m. Eastern Time), although the Portfolio may deviate from this calculation time under unusual or unexpected circumstances.
Equity securities and futures contracts that are listed on a foreign or domestic exchange or market are valued at the official closing price or, if none, the last sales price.
The values of securities denominated in foreign currencies are translated into U.S. dollars at rates provided by an independent foreign currency pricing source at a time each business day specified by the Valuation Committee at Allspring Funds Management, LLC (“Allspring Funds Management”).
Many securities markets and exchanges outside the U.S. close prior to the close of the New York Stock Exchange and therefore may not fully reflect trading or events that occur after the close of the principal exchange in which the foreign securities are traded, but before the close of the New York Stock Exchange. If such trading or events are expected to materially affect the value of such securities, then fair value pricing procedures implemented by Allspring Funds Management are applied. These procedures take into account multiple factors including movements in U.S. securities markets after foreign exchanges close. Foreign securities that are fair valued under these procedures are categorized as Level 2 and the application of these procedures may result in transfers between Level 1 and Level 2. Depending on market activity, such fair valuations may be frequent. Such fair value pricing may result in net asset values that are higher or lower than net asset values based on the last reported sales price or latest quoted bid price. On August 31, 2023, such fair value pricing was not used in pricing foreign securities.
Investments in registered open-end investment companies (other than those listed on a foreign or domestic exchange or market) are valued at net asset value.
Investments which are not valued using the methods discussed above are valued at their fair value, as determined in good faith by Allspring Funds Management, which was named the valuation designee by the Board of Trustees. As the valuation designee, Allspring Funds Management is responsible for day-to-day valuation activities for the Allspring Funds. In connection with these responsibilities, Allspring Funds Management has established a Valuation Committee and has delegated to it the authority to take any actions regarding the valuation of portfolio securities that the Valuation Committee deems necessary or appropriate, including determining the fair value of portfolio securities. On a quarterly basis, the Board of Trustees receives reports of valuation actions taken by the Valuation Committee. On at least an annual basis, the Board of Trustees receives an assessment of the adequacy and effectiveness of Allspring Funds Management’s process for determining the fair value of the portfolio of investments.
Foreign currency translation
The accounting records of the Portfolio are maintained in U.S. dollars. The values of other assets and liabilities denominated in foreign currencies are translated into U.S. dollars at rates provided by an independent foreign currency pricing source at a time each business day specified by the Valuation Committee. Purchases and sales of securities, and income and expenses are converted at the rate of exchange on the respective dates of such transactions. Net realized foreign exchange gains or losses arise from sales of foreign currencies, currency gains or losses realized between the trade and settlement dates on securities transactions, and the difference between the amounts of dividends, interest and foreign withholding taxes recorded and the U.S. dollar equivalent of the amounts actually paid or received. Net unrealized foreign exchange gains and losses arise from changes in the fair value of assets and liabilities other than investments in securities resulting from changes in exchange rates. The changes in net assets arising from changes in exchange rates of securities and the changes in net assets resulting from changes in market prices of securities are not separately presented. Such changes are included in net realized and unrealized gains or losses from investments.
Futures contracts
Futures contracts are agreements between the Portfolio and a counterparty to buy or sell a specific amount of a commodity, financial instrument or currency at a specified price and on a specified date. The Portfolio may buy and sell futures contracts in order to gain exposure to, or protect against,
Allspring Factor Enhanced International Equity Portfolio | 27
Notes to financial statements (unaudited)
changes in security values and is subject to equity price risk. The primary risks associated with the use of futures contracts are the imperfect correlation between changes in market values of securities held by the Portfolio and the prices of futures contracts, and the possibility of an illiquid market. Futures contracts are generally entered into on a regulated futures exchange and cleared through a clearinghouse associated with the exchange. With futures contracts, there is minimal counterparty risk to the Portfolio since futures contracts are exchange-traded and the exchange’s clearinghouse, as the counterparty to all exchange-traded futures, guarantees the futures contracts against default.
Upon entering into a futures contract, the Portfolio is required to deposit either cash or securities (initial margin) with the broker in an amount equal to a certain percentage of the contract value. Subsequent payments (variation margin) are paid to or received from the broker each day equal to the daily changes in the contract value. Such payments are recorded as unrealized gains or losses and, if any, shown as variation margin receivable (payable) in the Statement of Assets and Liabilities. Should the Portfolio fail to make requested variation margin payments, the broker can gain access to the initial margin to satisfy the Portfolio’s payment obligations. When the contracts are closed, a realized gain or loss is recorded in the Statement of Operations.
Security transactions and income recognition
Securities transactions are recorded on a trade date basis. Realized gains or losses are recorded on the basis of identified cost.
Dividend income is recognized on the ex-dividend date, except for certain dividends from foreign securities, which are recorded as soon as the custodian verifies the ex-dividend date. Dividend income is recorded net of foreign taxes withheld where recovery of such taxes is not assured.
Distributions received from REIT investments may be characterized as ordinary income, capital gains, or a return of capital to the Portfolio based on information provided by the REIT. The proper characterization of REIT distributions is generally not known until after the end of each calendar year. As such, estimates may be used in reporting the character of income and distributions for financial statement purposes.
Federal and other taxes
The Portfolio is not required to pay federal income taxes on its net investment income and net capital gains as it is treated as a partnership for federal income tax purposes. All income, gains and losses of the Portfolio are deemed to have been “passed through” to the interest holders in proportion to their holdings of the Portfolio regardless of whether income and gains have been distributed by the Portfolio.
The Portfolio’s income tax returns and all financial records supporting those returns for the prior three fiscal years are subject to examination by the federal revenue authority. Management has analyzed the Portfolio’s tax positions taken on federal, state, and foreign tax returns, as applicable, for all open tax years and does not believe that there are any uncertain tax positions that require recognition of a tax liability.
As of August 31, 2023, the aggregate cost of all investments for federal income tax purposes was $370,759,861 and the unrealized gains (losses) consisted of:
3.
FAIR VALUATION MEASUREMENTS
Fair value measurements of investments are determined within a framework that has established a fair value hierarchy based upon the various data inputs utilized in determining the value of the Portfolio’s investments. The three-level hierarchy gives the highest priority to unadjusted quoted prices in active markets for identical assets or liabilities (Level 1) and the lowest priority to unobservable inputs (Level 3). The Portfolio’s investments are classified within the fair value hierarchy based on the lowest level of input that is significant to the fair value measurement. The inputs are summarized into three broad levels as follows:
•Level 1—quoted prices in active markets for identical securities
•Level 2—other significant observable inputs (including quoted prices for similar securities, interest rates, prepayment speeds, credit risk, etc.)
•Level 3—significant unobservable inputs (including the Portfolio’s own assumptions in determining the fair value of investments)
The inputs or methodologies used for valuing investments in securities are not necessarily an indication of the risk associated with investing in those securities.
28 | Allspring Factor Enhanced International Equity Portfolio
Notes to financial statements (unaudited)
The following is a summary of the inputs used in valuing the Portfolio’s assets and liabilities as of August 31, 2023:
| | Other significant
observable inputs
(Level 2) | Significant
unobservable inputs
(Level 3) | |
| | | | |
| | | | |
| | | | |
| | | | |
| | | | |
| | | | |
| | | | |
| | | | |
| | | | |
| | | | |
| | | | |
| | | | |
| | | | |
| | | | |
| | | | |
| | | | |
| | | | |
| | | | |
| | | | |
| | | | |
| | | | |
| | | | |
| | | | |
| | | | |
| | | | |
| | | | |
| | | | |
| | | | |
| | | | |
| | | | |
| | | | |
| | | | |
| | | | |
| | | | |
| | | | |
| | | | |
| | | | |
| | | | |
| | | | |
| | | | |
| | | | |
Futures contracts are reported at their cumulative unrealized gains (losses) at measurement date as reported in the table following the Portfolio of Investments. For futures contracts, the current day’s variation margin is reported on the Statement of Assets and Liabilities. All other assets and liabilities are reported at their market value at measurement date.
Additional sector, industry or geographic detail, if any, is included in the Portfolio of Investments.
For the six months ended August 31, 2023, the Portfolio did not have any transfers into/out of Level 3.
4.
TRANSACTIONS WITH AFFILIATES
Advisory fee
The Trust has entered into an advisory contract with Allspring Funds Management, a wholly owned subsidiary of Allspring Global Investments Holdings, LLC, a holding company indirectly owned by certain private funds of GTCR LLC and Reverence Capital Partners, L.P. The adviser is responsible
Allspring Factor Enhanced International Equity Portfolio | 29
Notes to financial statements (unaudited)
for implementing investment policies and guidelines and for supervising the subadviser, who is responsible for day-to-day portfolio management of the Portfolio. Pursuant to the contract, Allspring Funds Management is entitled to receive an advisory fee at the following annual rate based on the Portfolio’s average daily net assets:
For the six months ended August 31, 2023, the advisory fee was equivalent to an annual rate of 0.15% of the Portfolio’s average daily net assets.
Allspring Funds Management has retained the services of a subadviser to provide daily portfolio management to the Portfolio. The fee for subadvisory services is borne by Allspring Funds Management. Allspring Global Investments, LLC, an affiliate of Allspring Funds Management and a wholly owned subsidiary of Allspring Global Investments Holdings, LLC, is the subadviser to the Portfolio and is entitled to receive a fee from Allspring Funds Management at an annual rate starting at 0.08% and declining to 0.05% as the average daily net assets of the Portfolio increase.
Allspring Funds Management has voluntarily waived and/or reimbursed expenses to reduce the net operating expense ratio of the Portfolio. These voluntary waivers may be discontinued at any time.
Interfund transactions
The Portfolio may purchase or sell portfolio investment securities to certain affiliates pursuant to Rule 17a-7 under the 1940 Act and under procedures adopted by the Board of Trustees. The procedures have been designed to ensure that these interfund transactions, which do not incur broker commissions, are effected at current market prices. Pursuant to these procedures, the Portfolio did not have any interfund transactions during the six months ended August 31, 2023.
5.
INVESTMENT PORTFOLIO TRANSACTIONS
Purchases and sales of investments, excluding U.S. government obligations (if any) and short-term securities, for the six months ended August 31, 2023 were $110,098,041 and $130,228,943, respectively.
6.
DERIVATIVE TRANSACTIONS
During the six months ended August 31, 2023, the Portfolio entered into futures contracts to gain market exposure. The Portfolio had an average notional amount of $12,489,973 in long futures contracts during the six months ended August 31, 2023.
The fair value, realized gains or losses and change in unrealized gains or losses, if any, on derivative instruments are reflected in the corresponding financial statement captions.
The Trust, along with Allspring Variable Trust and Allspring Funds Trust (excluding the money market funds), are parties to a $350,000,000 revolving credit agreement whereby the Portfolio is permitted to use bank borrowings for temporary or emergency purposes, such as to fund interest holders withdrawal requests. Interest under the credit agreement is charged to the Portfolio based on a borrowing rate equal to the higher of the Federal Funds rate or the overnight bank funding rate in effect on that day plus a spread. In addition, an annual commitment fee based on the unused balance is allocated to each participating fund.
For the six months ended August 31, 2023, there were no borrowings by the Portfolio under the agreement.
Under the Portfolio’s organizational documents, the officers and Trustees have been granted certain indemnification rights against certain liabilities that may arise out of performance of their duties to the Portfolio. The Portfolio has entered into a separate agreement with each Trustee that converts indemnification rights currently existing under the Portfolio’s organizational documents into contractual rights that cannot be changed in the future without the consent of the Trustee. Additionally, in the normal course of business, the Portfolio may enter into contracts with service providers that contain a variety of indemnification clauses. The Portfolio’s maximum exposure under these arrangements is dependent on future claims that may be made against the Portfolio and, therefore, cannot be estimated.
30 | Allspring Factor Enhanced International Equity Portfolio
Other information (unaudited)
Other information
Proxy voting information
A description of the policies and procedures used to determine how to vote proxies relating to portfolio securities is available without charge, upon request, by calling 1-866-259-3305, visiting our website at allspringglobal.com, or visiting the SEC website at sec.gov. Information regarding how the proxies related to portfolio securities were voted during the most recent 12-month period ended June 30 is available on the website at allspringglobal.com or by visiting the SEC website at sec.gov.
Quarterly portfolio holdings information
The Portfolio files its complete schedule of portfolio holdings with the SEC for the first and third quarters of each fiscal year as an exhibit to its reports on Form N-PORT. Interest holders may view the filed Form N-PORT by visiting the SEC website at sec.gov.
Allspring Factor Enhanced International Equity Portfolio | 31
Other information (unaudited)
Board of trustees and officers
Each of the Trustees and Officers listed in the table below acts in identical capacities for each fund in the Allspring family of funds, which consists of 126 mutual funds comprising the Allspring Funds Trust, Allspring Variable Trust, Allspring Master Trust and four closed-end funds (collectively the “Fund Complex”). This table should be read in conjunction with the Prospectus and the Statement of Additional Information1. The mailing address of each Trustee and Officer is 1415 Vantage Park Drive, 3rd Floor, Charlotte, NC 28203. Each Trustee and Officer serves an indefinite term, however, each Trustee serves such term until reaching the mandatory retirement age established by the Trustees.
Independent Trustees
| | Principal occupations during past five years or longer | Current other
public company or
investment
company
directorships |
William R. Ebsworth
(Born 1957) | | Retired. From 1984 to 2013, equities analyst, portfolio manager, research director and chief investment officer at Fidelity Management and Research Company in Boston, Tokyo, and Hong Kong, and retired in 2013 as Chief Investment Officer of Fidelity Strategic Advisers, Inc. where he led a team of investment professionals managing client assets. Prior thereto, Board member of Hong Kong Securities Clearing Co., Hong Kong Options Clearing Corp., the Thailand International Fund, Ltd., Fidelity Investments Life Insurance Company, and Empire Fidelity Investments Life Insurance Company. Audit Committee Chair and Investment Committee Chair of the Vincent Memorial Hospital Foundation (non-profit organization). Mr. Ebsworth is a CFA charterholder. | |
Jane A. Freeman
(Born 1953) | Trustee,
since 2015;
Chair Liaison,
since 2018 | Retired. From 2012 to 2014 and 1999 to 2008, Chief Financial Officer of Scientific Learning Corporation. From 2008 to 2012, Ms. Freeman provided consulting services related to strategic business projects. Prior to 1999, Portfolio Manager at Rockefeller & Co. and Scudder, Stevens & Clark. Board member of the Harding Loevner Funds from 1996 to 2014, serving as both Lead Independent Director and chair of the Audit Committee. Board member of the Russell Exchange Traded Funds Trust from 2011 to 2012 and the chair of the Audit Committee. Ms. Freeman is also an inactive Chartered Financial Analyst. | |
Isaiah Harris, Jr.
(Born 1952) | Trustee,
since 2009;
Audit Committee Chair,
since 2019 | Retired. Member of the Advisory Board of CEF of East Central Florida. Chairman of the Board of CIGNA Corporation from 2009 to 2021, and Director from 2005 to 2008. From 2003 to 2011, Director of Deluxe Corporation. Prior thereto, President and CEO of BellSouth Advertising and Publishing Corp. from 2005 to 2007, President and CEO of BellSouth Enterprises from 2004 to 2005 and President of BellSouth Consumer Services from 2000 to 2003. Emeritus member of the Iowa State University Foundation Board of Governors. Emeritus Member of the Advisory board of Iowa State University School of Business. Advisory Board Member, Palm Harbor Academy (private school). Advisory Board Member, Fellowship of Christian Athletes. Mr. Harris is a certified public accountant (inactive status). | |
David F. Larcker
(Born 1950) | | Distinguished Visiting Fellow at the Hoover Institution since 2022. James Irvin Miller Professor of Accounting at the Graduate School of Business (Emeritus), Stanford University, Director of the Corporate Governance Research Initiative and Senior Faculty of The Rock Center for Corporate Governance since 2006. From 2005 to 2008, Professor of Accounting at the Graduate School of Business, Stanford University. Prior thereto, Ernst & Young Professor of Accounting at The Wharton School, University of Pennsylvania from 1985 to 2005. | |
Olivia S. Mitchell
(Born 1953) | Trustee,
since 2006;
Nominating and Governance Committee Chair,
since 2018 | International Foundation of Employee Benefit Plans Professor since 1993, Wharton School of the University of Pennsylvania. Director of Wharton’s Pension Research Council and Boettner Center on Pensions & Retirement Research, and Research Associate at the National Bureau of Economic Research. Previously taught at Cornell University from 1978 to 1993. | |
Timothy J. Penny
(Born 1951) | Trustee,
since 1996;
Chair,
since 2018 | President and Chief Executive Officer of Southern Minnesota Initiative Foundation, a non-profit organization, since 2007. Vice Chair of the Economic Club of Minnesota, since 2007. Co-Chair of the Committee for a Responsible Federal Budget, since 1995. Member of the Board of Trustees of NorthStar Education Finance, Inc., a non-profit organization, from 2007-2022. Senior Fellow of the University of Minnesota Humphrey Institute from 1995 to 2017. | |
1
The Statement of Additional Information includes additional information about the Trustees and is available, without charge, upon request, by calling 1-800-222-8222 or by visiting the website at allspringglobal.com.
32 | Allspring Factor Enhanced International Equity Portfolio
Other information (unaudited)
| Position held and length of service* | Principal occupations during past five years or longer | Current other public company or investment company directorships |
James G. Polisson
(Born 1959) | | Retired. Chief Marketing Officer, Source (ETF) UK Services, Ltd, from 2015 to 2017. From 2012 to 2015, Principal of The Polisson Group, LLC, a management consulting, corporate advisory and principal investing company. Chief Executive Officer and Managing Director at Russell Investments, Global Exchange Traded Funds from 2010 to 2012. Managing Director of Barclays Global Investors from 1998 to 2010 and Global Chief Marketing Officer for iShares and Barclays Global Investors from 2000 to 2010. Trustee of the San Francisco Mechanics’ Institute, a non- profit organization, from 2013 to 2015. Board member of the Russell Exchange Traded Fund Trust from 2011 to 2012. Director of Barclays Global Investors Holdings Deutschland GmbH from 2006 to 2009. Mr. Polisson is an attorney and has a retired status with the Massachusetts and District of Columbia Bar Associations. | |
Pamela Wheelock
(Born 1959) | Trustee,
since January 2020;
previously Trustee from
January 2018 to
July 2019 | Retired. Executive and Senior Financial leadership positions in the public, private and nonprofit sectors. Interim President and CEO, McKnight Foundation, 2020. Interim Commissioner, Minnesota Department of Human Services, 2019. Chief Operating Officer, Twin Cities Habitat for Humanity, 2017-2019. Vice President for University Services, University of Minnesota, 2012- 2016. Interim President and CEO, Blue Cross and Blue Shield of Minnesota, 2011-2012. Executive Vice-President and Chief Financial Officer, Minnesota Wild, 2002-2008. Commissioner, Minnesota Department of Finance, 1999-2002. Chair of the Board of Directors of Destination Medical Center Corporation. Board member of the Minnesota Wild Foundation. | |
| Length of service dates reflect the Trustee’s commencement of service with the Trust’s predecessor entities, where applicable. |
Allspring Factor Enhanced International Equity Portfolio | 33
Other information (unaudited)
Officers1
| Position held and
length of service | Principal occupations during past five years or longer |
| | President and Chief Executive Officer of Allspring Funds Management, LLC since 2017 and Head of Global Fund Governance of Allspring Global Investments since 2022. Prior thereto, co-president of Galliard Capital Management, LLC, an affiliate of Allspring Funds Management, LLC, from 2019 to 2022 and Head of Affiliated Managers, Allspring Global Investments, from 2014 to 2019 and Executive Vice President responsible for marketing, investments and product development for Allspring Funds Management, LLC, from 2009 to 2014. |
Jeremy DePalma
(Born 1974) | Treasurer,
since 2012
(for certain funds in
the Fund Complex);
since 2021 (for
the remaining funds in the Complex) | Senior Vice President of Allspring Funds Management, LLC since 2009. Senior Vice President of Evergreen Investment Management Company, LLC from 2008 to 2010 and head of the Fund Reporting and Control Team within Fund Administration from 2005 to 2010. |
Christopher Baker
(Born 1976) | Chief Compliance Officer,
since 2022 | Global Chief Compliance Officer for Allspring Global Investments since 2022. Prior thereto, Chief Compliance Officer for State Street Global Advisors from 2018 to 2021. Senior Compliance Officer for the State Street divisions of Alternative Investment Solutions, Sector Solutions, and Global Marketing from 2015 to 2018. From 2010 to 2015 Vice President, Global Head of Investment and Marketing Compliance for State Street Global Advisors. |
Matthew Prasse
(Born 1983) | Chief Legal Officer,
since 2022;
Secretary,
since 2021 | Senior Counsel of the Allspring Legal Department since 2021. Senior Counsel of the Wells Fargo Legal Department from 2018 to 2021. Previously, Counsel for Barings LLC from 2015 to 2018. Prior to joining Barings, Associate at Morgan, Lewis & Bockius LLP from 2008 to 2015. |
1 For those Officers with tenures at Allspring Global Investments and/or Allspring Funds Management, LLC that began prior to 2021, such tenures include years of service during which these businesses/entities were known as Wells Fargo Asset Management and Wells Fargo Funds Management, LLC, respectively.
34 | Allspring Factor Enhanced International Equity Portfolio
Other information (unaudited)
Board consideration of investment advisory and sub-advisory agreements:
Allspring Bloomberg US Aggregate ex-Corporate Portfolio, Allspring Emerging Markets Bond Portfolio, Allspring Factor Enhanced Emerging Markets Equity Portfolio, Allspring Factor Enhanced International Equity Portfolio, Allspring Factor Enhanced U.S. Large Cap Equity Portfolio, Allspring Factor Enhanced U.S. Small Cap Equity Portfolio, Allspring High Yield Corporate Bond Portfolio, Allspring Investment Grade Corporate Bond Portfolio, Allspring Strategic Retirement Bond Portfolio, and Allspring U.S. REIT Portfolio
Under the Investment Company Act of 1940 (the “1940 Act”), the Board of Trustees (the “Board”) of Allspring Master Trust (the “Trust”) must determine annually whether to approve the continuation of the Trust’s investment advisory and sub-advisory agreements. In this regard, at a meeting held on May 15-17, 2023 (the “Meeting”), the Board, all the members of which have no direct or indirect interest in the investment advisory and sub-advisory agreements and are not “interested persons” of the Trust, as defined in the 1940 Act (the “Independent Trustees”), reviewed and approved for each of the portfolios of the Trust identified in the table below (individually, a “Portfolio” and collectively, the “Portfolios”): (i) an investment advisory agreement (the “Advisory Agreement”) with Allspring Funds Management, LLC (“Allspring Funds Management”); and (ii) an investment sub-advisory agreement (each, a “Sub-Advisory Agreement” and collectively, the “Sub-Advisory Agreements”) with the Sub-Advisers(s) identified in the table below (each, a “Sub-Adviser” and collectively, the “Sub-Advisers”) for the corresponding Portfolio identified. The Advisory Agreement and the Sub-Advisory Agreements are collectively referred to as the “Advisory Agreements.”
| |
Allspring Bloomberg Barclays US Aggregate ex-Corporate Portfolio | Allspring Global Investments, LLC |
Allspring Emerging Markets Bond Portfolio | Allspring Global Investments, LLC, Allspring Global Investments (UK) Limited |
Allspring Factor Enhanced Emerging Markets Equity Portfolio | Allspring Global Investments, LLC |
Allspring Factor Enhanced International Equity Portfolio | Allspring Global Investments, LLC |
Allspring Factor Enhanced U.S. Large Cap Equity Portfolio | Allspring Global Investments, LLC |
Allspring Factor Enhanced U.S. Small Cap Equity Portfolio | Allspring Global Investments, LLC |
Allspring High Yield Corporate Bond Portfolio | Allspring Global Investments, LLC |
Allspring Investment Grade Corporate Bond Portfolio | Allspring Global Investments, LLC |
Allspring Strategic Retirement Bond Portfolio | Allspring Global Investments, LLC |
Allspring U.S. REIT Portfolio | Allspring Global Investments, LLC |
At the Meeting, the Board considered the factors and reached the conclusions described below relating to the selection of Allspring Funds Management and the Sub-Advisers and the approval of the Advisory Agreements. Prior to the Meeting, including at a Board meeting held in April 2023, the Trustees conferred extensively among themselves and with representatives of Allspring Funds Management about these matters. The Board has adopted a team-based approach, with each team consisting of a sub-set of Trustees, to assist the full Board in the discharge of its duties in reviewing investment performance and other matters throughout the year. The Independent Trustees were assisted in their evaluation of the Advisory Agreements by independent legal counsel, from whom they received separate legal advice and with whom they met separately.
The Board noted that it initially approved the Advisory Agreements at a Board meeting held in May 2021, each for a two-year term, in advance of the sale of Wells Fargo Asset Management to Allspring Global Investments Holdings, LLC,1 a holding company indirectly owned by certain private funds of GTCR LLC and Reverence Capital Partners, L.P. (the “Transaction”). The Trustees also noted that, while they did not specifically consider the continuation of the Advisory Agreements in 2022 as a result of the two-year term that was approved in 2021, the Trustees received and considered certain information at a Board meeting held in April 2022 that was applicable to the Advisory Agreements, including an overview and financial review of the Allspring Global Investments business, information regarding certain ancillary agreements that were approved by the Board at the April 2022 Board meeting, and comparative data regarding Fund fees and expenses.
In providing information to the Board, Allspring Funds Management and the Sub-Advisers were guided by a detailed set of requests for information submitted to them by independent legal counsel on behalf of the Independent Trustees at the start of the Board’s annual contract renewal process earlier in 2023. In considering and approving the Advisory Agreements, the Trustees considered the information they believed relevant, including but not limited to the information discussed below. The Board considered not only the specific information presented in connection with the Meeting, but also the knowledge gained over time through interaction with Allspring Funds Management and the Sub-Advisers about various topics. In this regard, the Board reviewed reports of Allspring Funds Management at each of its quarterly meetings, which included, among other things, portfolio reviews and investment performance reports. In addition, the Board and the teams mentioned above confer with portfolio managers at various times throughout the year. The Board did not identify any particular information or consideration that was all-important or controlling, and each individual Trustee may have attributed different weights to various factors.
1
The trade name for the asset management firm that includes Allspring Funds Management and the Sub-Adviser is “Allspring Global Investments.”
Allspring Factor Enhanced International Equity Portfolio | 35
Other information (unaudited)
After its deliberations, the Board unanimously determined that the compensation or the absence of compensation payable to Allspring Funds Management and each of the Sub-Advisers under each of the Advisory Agreements was reasonable, and approved the continuation of the Advisory Agreements for a one-year term. The Board considered the approval of the Advisory Agreements for the Portfolios as part of its consideration of agreements for funds across the complex, but its approvals were made on a fund-by-fund basis. The following summarizes a number of important, but not necessarily all, factors considered by the Board in support of its approvals.
Nature, extent and quality of services
The Board received and considered various information regarding the nature, extent, and quality of services provided to the Portfolios by Allspring Funds Management and the Sub-Advisers under the Advisory Agreements. This information included a description of the investment advisory services and Portfolio-level administrative services covered by the Advisory Agreement, as well as, among other things, a summary of the background and experience of senior management of Allspring Global Investments, of which Allspring Funds Management and the Sub-Advisers are a part, and a summary of investments made in the Allspring Global Investments business. The Board also considered information about retention arrangements with respect to key personnel of Allspring Global Investments that were put in place in connection with the Transaction. The Board took into account information about the services that continue to be provided by Wells Fargo & Co. and/or its affiliates (“Wells Fargo”) since the Transaction under a transition services agreement and the anticipated timeline for exiting the transition services agreement. In addition, the Board received and considered information about the full range of services provided to the Fund by Allspring Funds Management and its affiliates.
The Board considered the qualifications, background, tenure, and responsibilities of each of the portfolio managers primarily responsible for the day-to-day portfolio management of the Portfolios. The Board evaluated the ability of Allspring Funds Management and the Sub-Advisers to attract and retain qualified investment professionals, including research, advisory, and supervisory personnel.
The Board further considered the compliance programs and compliance records of Allspring Funds Management and the Sub-Advisers. The Board received and considered information about Allspring Global Investments’ risk management functions, which included information about Allspring Funds Management’s and the Sub-Advisers’ business continuity plans, their approaches to data privacy and cybersecurity, and Allspring Funds Management’s role as administrator of the Portfolios’ liquidity risk management program, and the derivatives risk management program for Allspring Bloomberg Barclays US Aggregate ex-Corporate Portfolio and Allspring Factor Enhanced U.S. Large Cap Equity Portfolio. The Board also received and considered information about Allspring Funds Management’s intermediary and vendor oversight program.
Portfolio investment performance and expenses
The Board considered the investment performance results for each of the Portfolios over various time periods ended December 31, 2022. The Board considered these results in comparison to the investment performance of funds in a universe that was determined by Broadridge Inc. (“Broadridge”) to be similar to each respective Portfolios (each, a “Universe”), and in comparison to each Portfolios’ benchmark index and to other comparative data. Broadridge is an independent provider of investment company data. The Board received a description of the methodology used by Broadridge to select the mutual funds in the performance Universe. The Board noted the short performance history of the Portfolios.
With respect to the investment performance of each Portfolio relative to its respective Universe, the Board noted the following: (i) the investment performance of Allspring Bloomberg US Aggregate ex-Corporate Portfolio was higher than the average investment performance of the Universe for all periods under review; the investment performance of Allspring Bloomberg US Aggregate ex-Corporate Portfolio was higher than the investment performance of its benchmark index, the Bloomberg U.S. Aggregate ex Corporate Index, for the one-year period and was in range of the investment performance of its benchmark index for the three- and five-year periods under review; (ii) the investment performance of Allspring Emerging Markets Bond Portfolio was lower than the average investment performance of the Universe for the one- and three-year periods and was in range of the average investment performance of the Universe for the five-year period; the investment performance of Allspring Emerging Markets Bond Portfolio was higher than the investment performance of its benchmark index, the J.P. Morgan EM Bond Global Diversified Index, for the one-year period and was in range of the investment performance of its benchmark index for the three- and five-year periods under review; (iii) the investment performance of Allspring Factor Enhanced Emerging Markets Equity Portfolio was higher than the average investment performance of the Universe for the one-year period and was lower than the average investment performance of the Universe for the three- and five-year periods; the investment performance of Allspring Factor Enhanced Emerging Markets Equity Portfolio was higher than the investment performance of its benchmark index, the MSCI Emerging Markets Index (Net), for the one-year period and was lower than the investment performance of its benchmark index for the three- and five-year periods under review; (iv) the investment performance of Allspring Factor Enhanced International Equity Portfolio was higher than the average investment performance of the Universe for all periods under review; the investment performance of Allspring Factor Enhanced International Equity Portfolio was higher than the investment performance of its benchmark index, the MSCI World ex US Index (Net), for all periods under review; (v) the investment performance of Allspring Factor Enhanced U.S. Large Cap Equity Portfolio was higher than the average investment performance of the Universe for the one- and five-year periods and was lower than the average investment performance of the Universe for the three-year period; the investment performance of Allspring Factor Enhanced U.S. Large Cap Equity Portfolio was higher than the investment performance of its benchmark index, the Russell 1000® Index, for the one-year period and was lower than the investment performance of its benchmark index for the three- and five-year periods under review; (vi) the investment performance of Allspring Factor Enhanced U.S. Small Cap Equity Portfolio was lower than the average investment performance of the Universe for all periods under review; the investment performance of Allspring Factor Enhanced U.S. Small Cap Equity Portfolio was higher than the
36 | Allspring Factor Enhanced International Equity Portfolio
Other information (unaudited)
investment performance of its benchmark index, the Russell 2000® Index, for the one-year period and was lower than the investment performance of its benchmark index for the three- and five-year periods under review; (vii) the investment performance of Allspring High Yield Corporate Bond Portfolio was lower than the average investment performance of the Universe for all periods under review; the investment performance of Allspring High Yield Corporate Bond Portfolio was in range of the investment performance of its benchmark index, the Bloomberg U.S. Corporate High Yield 2% Issuer Capped, for the one-year period and was lower than the investment performance of its benchmark index for the three- and five-year periods under review; (viii) the investment performance of Allspring Investment Grade Corporate Bond Portfolio was higher than the average investment performance of the Universe for the one- and five-year periods and in rage of the average investment performance of the Universe for the three-year period; the investment performance of Allspring Investment Grade Corporate Bond Portfolio was higher than the investment performance of its benchmark index, the Bloomberg U.S. Corporate Bond Index, for the one-year period and was in range of the investment performance of its benchmark index for the three- and five-year periods under review; (ix) the investment performance of Allspring Strategic Retirement Bond Portfolio was higher than the average investment performance of the Universe for all periods under review; the investment performance of Allspring Strategic Retirement Bond Portfolio was higher than the investment performance of its benchmark index, the Strategic Retirement Blended Index, for the one- and three-year periods and was in range of the investment performance of its benchmark index for the five-year period; (x) the investment performance of Allspring U.S. REIT Portfolio was lower than the average investment performance of the Universe for the one-year period and was in range of the average investment performance of the Universe for the three- and five-year periods; the investment performance of Allspring U.S. REIT Portfolio was higher than the investment performance of its benchmark index, the Dow Jones U.S. Select REIT Index, for all periods under review.
The Board received information concerning, and discussed factors contributing to, the underperformance of each of Allspring Emerging Markets Bond Portfolio, Allspring Factor Enhanced Emerging Markets Equity Portfolio, Allspring Factor Enhanced U.S. Large Cap Equity Portfolio, Allspring Factor Enhanced U.S. Small Cap Equity Portfolio and Allspring High Yield Corporate Bond Portfolio relative to such Portfolio’s Universe and benchmark index for the periods identified above. The Board took note of the explanations for the relative underperformance during these periods, including with respect to investment decisions and market factors that affected each Portfolio’s investment performance.
The Board also received and considered information regarding the fee rates that are payable to Allspring Funds Management for investment advisory services (as discussed below), which are the only fees charged to the Portfolios, relative to corresponding class-specific expense groups that were determined by Broadridge to be similar to the Portfolios (the “Groups”). The Board received a description of the methodology used by Broadridge to select the mutual funds in the expense Groups and an explanation of how funds comprising expense groups and their expense ratios may vary from year-to-year.
The Board took into account the Portfolios’ investment performance and expense information provided to it among the factors considered in deciding to re-approve the Advisory Agreements.
Investment advisory and sub-advisory fee rates
The Board reviewed and considered the contractual fee rates payable by the Portfolios to Allspring Funds Management under the Advisory Agreement. The Board also reviewed and considered the contractual investment sub-advisory fee rates that are payable by Allspring Funds Management to the Sub-Advisers for investment sub-advisory services.
Among other information reviewed by the Board was a comparison of the Portfolios’ Advisory Rates with the average contractual investment advisory fee rates of funds in the expense Groups at a common asset level as well as transfer agency costs of the Portfolios in the expense Groups. The Board noted that the Advisory Rates of the Portfolios were lower than or in range of the mean rates for the Portfolios’ expense Groups.
The Board also received and considered information about the portions of the total advisory fees that were retained by Allspring Funds Management after payment of the fees to the Sub-Advisers for sub-advisory services. In assessing the reasonableness of these amounts, the Board received and evaluated information about the nature and extent of responsibilities retained and risks assumed by Allspring Funds Management and not delegated to or assumed by the Sub-Advisers, and about Allspring Funds Management’s on-going oversight services. Given the affiliation between Allspring Funds Management and the Sub-Advisers, the Board ascribed limited relevance to the allocation of fees between them.
For all Portfolios, except Allspring Factor Enhanced U.S. Small Cap Equity Portfolio, Allspring Factor Enhanced International Equity Portfolio, Allspring Factor Enhanced Emerging Markets Equity Portfolio, Allspring U.S. REIT Portfolio, Allspring Investment Grade Corporate Bond Portfolio, and Allspring Strategic Retirement Bond Portfolio, the Board also received and considered information about the nature and extent of services offered and fee rates charged by Allspring Funds Management and the Sub-Advisers to other types of clients with investment strategies similar to those of certain Portfolios. In this regard, the Board received information about the significantly greater scope of services, and compliance, reporting and other legal burdens and risks of managing proprietary mutual funds compared with those associated with managing assets of other types of clients, including third-party sub-advised fund clients and non-mutual fund clients such as institutional separate accounts.
Based on its consideration of the factors and information it deemed relevant, including those described here, the Board determined that the compensation payable to Allspring Funds Management under the Advisory Agreement and to the Sub-Advisers under the Sub-Advisory Agreements was reasonable.
Allspring Factor Enhanced International Equity Portfolio | 37
Other information (unaudited)
Profitability
The Board received and considered information concerning the profitability of Allspring Funds Management, as well as the profitability of Allspring Global Investments, from providing services to the fund complex as a whole. The Board noted that the Sub-Adviser’s profitability information with respect to providing services to the Portfolios and other funds in the complex was subsumed in the Allspring Global Investments profitability analysis.
Allspring Funds Management reported on the methodologies and estimates used in calculating profitability, including a description of the methodology used to allocate certain expenses and differences in how Allspring Global Investments calculates its pre-tax profit metric versus the methodology used when Allspring Funds Management was part of Wells Fargo. It was noted that the impact of such differences had only minor impact on the financial results presented. Among other things, the Board noted that the levels of profitability reported on a fund-by-fund basis varied widely, depending on factors such as the size, type, and age of fund.
Based on its review, the Board did not deem the profits reported by Allspring Funds Management or Allspring Global Investments from services provided to the Portfolios to be at a level that would prevent it from approving the continuation of the Advisory Agreements.
Economies of scale
The Board received and considered information about the potential for Allspring Funds Management to experience economies of scale in the provision of management services to the Portfolios, the difficulties of calculating economies of scale at an individual fund level, and the extent to which potential scale benefits are shared with Portfolio shareholders. The Board noted the existence of breakpoints in the Portfolios’ advisory fee structure, which operate generally to reduce the Portfolios’ expense ratios as the Portfolios grow in size, and the size of the Portfolios in relation to such breakpoints. The Board considered that in addition to advisory fee breakpoints, Allspring Funds Management shares potential economies of scale from its management business in a variety of ways, including through fee waiver and expense reimbursement arrangements, competitive advisory fee rates set at the outset without regard to breakpoints, and investments in the business intended to enhance services available to shareholders.
The Board concluded that Allspring Funds Management’s arrangements with respect to the Portfolios, including contractual breakpoints, constituted a reasonable approach to sharing potential economies of scale with the Portfolios and their shareholders.
Other benefits to Allspring Funds Management and the Sub-Advisers
The Board received and considered information regarding potential “fall-out” or ancillary benefits received by Allspring Funds Management and its affiliates, including the Sub-Advisers, as a result of their relationships with the Portfolios. Ancillary benefits could include, among others, benefits directly attributable to other relationships with the Portfolios and benefits potentially derived from an increase in Allspring Funds Management’s and the Sub-Advisers’ businesses as a result of their relationships with the Portfolios. The Board noted that Allspring Funds Distributor, LLC, an affiliate of Allspring Funds Management, receives distribution-related fees in respect of shares sold or held through it.
The Board also reviewed information about soft dollar credits earned and utilized by the Sub-Advisers and fees earned in the past by Allspring Funds Management and the Sub-Advisers from managing a private investment vehicle for the fund complex’s securities lending collateral.
Based on its consideration of the factors and information it deemed relevant, including those described here, the Board did not find that any ancillary benefits received by Allspring Funds Management and its affiliates, including the Sub-Advisers, were unreasonable.
Conclusion
At the Meeting, after considering the above-described factors and based on its deliberations and its evaluation of the information described above, the Board unanimously determined that the compensation payable to Allspring Funds Management and the Sub-Advisers under each of the Advisory Agreements was reasonable, and approved the continuation of the Advisory Agreements for a one-year term.
38 | Allspring Factor Enhanced International Equity Portfolio
Other information (unaudited)
Liquidity risk management program
In accordance with Rule 22e-4 under the Investment Company Act of 1940, as amended (the “Liquidity Rule”), Allspring Master Trust (the “Trust”) has adopted and implemented a liquidity risk management program (the “Program”) on behalf of each of its series, including the Portfolio, which is reasonably designed to assess and manage the Portfolio’s liquidity risk. “Liquidity risk” is defined under the Liquidity Rule as the risk that the Portfolio is unable to meet redemption requests without significantly diluting remaining investors’ interests in the Portfolio. The Trust’s Board of Trustees (the “Board”) previously approved the designation of Allspring Funds Management, LLC (“Allspring Funds Management”), the Portfolio’s investment adviser, to administer the Program, and Allspring Funds Management has established a Liquidity Risk Management Council (the “Council”) composed of personnel from multiple departments within Allspring Funds Management and its affiliates to assist Allspring Funds Management in the administration of the Program.
The Program is comprised of various components designed to support the assessment and/or management of liquidity risk, including: (1) the periodic assessment (no less frequently than annually) of certain factors that influence the Portfolio’s liquidity risk; (2) the periodic classification (no less frequently than monthly) of the Portfolio’s investments into one of four liquidity categories that reflect an estimate of their liquidity under current market conditions; (3) a 15% limit on the acquisition of “illiquid investments” (as defined under the Liquidity Rule); (4) to the extent the Portfolio does not invest primarily in “highly liquid investments” (as defined under the Liquidity Rule), the determination of a minimum percentage of the Portfolio’s assets that generally will be invested in highly liquid investments (an “HLIM”); (5) if the Portfolio has established an HLIM, the periodic review (no less frequently than annually) of the HLIM and the adoption of policies and procedures for responding to a shortfall of the Portfolio’s “highly liquid investments” below its HLIM; and (6) periodic reporting to the Board.
At a meeting of the Board held on May 16-17, 2023, the Board received and reviewed a written report (the “Report”) from Allspring Funds Management that, among other things, addressed the operation of the Program and assessed its adequacy and effectiveness for the period from January 1, 2022 through December 31, 2022 (the “Reporting Period”). The Report noted significant liquidity events impacting the Portfolios related to extended foreign market holidays as well as the difficulty of trading and settlement of most Russia-related securities due to sanctions activity. The Report noted that there were no material changes to the Program during the Reporting Period.
Allspring Funds Management determined in the Report that the Program has been implemented and operates effectively to manage each Portfolio’s, including the Portfolio’s, liquidity risk, and Allspring Funds Management continues to believe that the Program has been and continues to be adequately and effectively implemented to monitor and, as applicable, respond to the Portfolio’s liquidity developments.
There can be no assurance that the Program will achieve its objectives under all circumstances in the future.
Allspring Factor Enhanced International Equity Portfolio | 39
This page is intentionally left blank.
For more information
More information about Allspring Funds is available free upon request. To obtain literature, please write, visit the Portfolio’s website, or call:
Allspring Funds
P.O. Box 219967
Kansas City, MO 64121-9967
Website: allspringglobal.com
Individual investors: 1-800-222-8222
Retail investment professionals: 1-888-877-9275
Institutional investment professionals: 1-800-260-5969
This report and the financial statements contained herein are submitted for the general information of the interest holders of the Portfolio. If this report is used for promotional purposes, distribution of the report must be accompanied or preceded by a current prospectus. Before investing, please consider the investment objectives, risks, charges, and expenses of the investment. For a current prospectus and, if available, a summary prospectus, containing this information, call 1-800-222-8222 or visit the Portfolio’s website at allspringglobal.com. Read the prospectus carefully before you invest or send money.
Allspring Global InvestmentsTM is the trade name for the asset management firms of Allspring Global Investments Holdings, LLC, a holding company indirectly owned by certain private funds of GTCR LLC and Reverence Capital Partners, L.P. These firms include but are not limited to Allspring Global Investments, LLC, and Allspring Funds Management, LLC. Certain products managed by Allspring entities are distributed by Allspring Funds Distributor, LLC (a broker-dealer and Member FINRA/SIPC).
This material is for general informational and educational purposes only and is NOT intended to provide investment advice or a recommendation of any kind - including a recommendation for any specific investment, strategy, or plan.
© 2023 Allspring Global Investments Holdings, LLC. All rights reserved.
Allspring Factor Enhanced U.S. Large Cap Equity Portfolio
Semi-Annual Report
August 31, 2023
Allspring Factor Enhanced U.S. Large Cap Equity Portfolio | 1
Portfolio information (unaudited)
| The Portfolio seeks long-term capital appreciation. |
| Allspring Funds Management, LLC |
| Allspring Global Investments, LLC |
| Harindra de Silva, Ph.D., CFA, Monisha Jayakumar |
Ten largest holdings (%) as of August 31, 20231 |
| |
| |
| |
| |
| |
| |
Berkshire Hathaway, Inc. Class B | |
Meta Platforms, Inc. Class A | |
| |
| |
| Figures represent the percentage of the Portfolio’s net assets. Holdings are subject to change and may have changed since the date specified. |
Sector allocation as of August 31, 20231 |
| Figures represent the percentage of the Portfolio’s long-term investments. Allocations are subject to change and may have changed since the date specified. |
| CFA® and Chartered Financial Analyst® are trademarks owned by CFA Institute. |
2 | Allspring Factor Enhanced U.S. Large Cap Equity Portfolio
Portfolio of investments—August 31, 2023 (unaudited)
| | | | | |
| | | | | | |
Communication services: 8.29% | | | | | | |
Diversified telecommunication services: 0.65% | | | | | | |
| | | | | | |
Verizon Communications, Inc. | | | | | | |
| | | | | | |
| | | | | | |
AMC Entertainment Holdings, Inc. Class A† | | | | | | |
| | | | | | |
Madison Square Garden Sports Corp. | | | | | | |
| | | | | | |
| | | | | | |
| | | | | | |
| | | | | | |
| | | | | | |
Interactive media & services: 5.22% | | | | | | |
| | | | | | |
| | | | | | |
| | | | | | |
| | | | | | |
Meta Platforms, Inc. Class A† | | | | | | |
| | | | | | |
| | | | | | |
| | | | | | |
| | | | | | |
Charter Communications, Inc. Class A† | | | | | | |
| | | | | | |
| | | | | | |
Interpublic Group of Cos., Inc. | | | | | | |
New York Times Co. Class A | | | | | | |
| | | | | | |
| | | | | | |
| | | | | | |
| | | | | | |
Wireless telecommunication services: 0.17% | | | | | | |
| | | | | | |
Consumer discretionary: 10.01% | | | | | | |
Automobile components: 0.31% | | | | | | |
| | | | | | |
| | | | | | |
| | | | | | |
| | | | | | |
| | | | | | |
| | | | | | |
The accompanying notes are an integral part of these financial statements.
Allspring Factor Enhanced U.S. Large Cap Equity Portfolio | 3
Portfolio of investments—August 31, 2023 (unaudited)
| | | | | |
| | | | | | |
| | | | | | |
| | | | | | |
| | | | | | |
| | | | | | |
| | | | | | |
| | | | | | |
| | | | | | |
| | | | | | |
| | | | | | |
| | | | | | |
| | | | | | |
| | | | | | |
| | | | | | |
| | | | | | |
| | | | | | |
Diversified consumer services: 0.24% | | | | | | |
Grand Canyon Education, Inc.† | | | | | | |
| | | | | | |
| | | | | | |
Hotels, restaurants & leisure: 1.64% | | | | | | |
| | | | | | |
| | | | | | |
| | | | | | |
Chipotle Mexican Grill, Inc.† | | | | | | |
| | | | | | |
| | | | | | |
| | | | | | |
Hyatt Hotels Corp. Class A | | | | | | |
Marriott International, Inc. Class A | | | | | | |
| | | | | | |
Royal Caribbean Cruises Ltd.† | | | | | | |
| | | | | | |
Texas Roadhouse, Inc. Class A | | | | | | |
| | | | | | |
| | | | | | |
| | | | | | |
Household durables: 0.32% | | | | | | |
| | | | | | |
| | | | | | |
| | | | | | |
| | | | | | |
| | | | | | |
| | | | | | |
| | | | | | |
The accompanying notes are an integral part of these financial statements.
4 | Allspring Factor Enhanced U.S. Large Cap Equity Portfolio
Portfolio of investments—August 31, 2023 (unaudited)
| | | | | |
| | | | | | |
| | | | | | |
Peloton Interactive, Inc. Class A† | | | | | | |
| | | | | | |
| | | | | | |
| | | | | | |
| | | | | | |
| | | | | | |
| | | | | | |
Dick’s Sporting Goods, Inc. | | | | | | |
| | | | | | |
| | | | | | |
| | | | | | |
| | | | | | |
| | | | | | |
O’Reilly Automotive, Inc.† | | | | | | |
Penske Automotive Group, Inc. | | | | | | |
| | | | | | |
| | | | | | |
| | | | | | |
| | | | | | |
| | | | | | |
| | | | | | |
Textiles, apparel & luxury goods: 0.21% | | | | | | |
| | | | | | |
| | | | | | |
| | | | | | |
| | | | | | |
Under Armour, Inc. Class A† | | | | | | |
Under Armour, Inc. Class C† | | | | | | |
| | | | | | |
| | | | | | |
| | | | | | |
Boston Beer Co., Inc. Class A† | | | | | | |
| | | | | | |
Constellation Brands, Inc. Class A | | | | | | |
Molson Coors Beverage Co. Class B | | | | | | |
| | | | | | |
| | | | | | |
| | | | | | |
Consumer staples distribution & retail: 1.55% | | | | | | |
BJ’s Wholesale Club Holdings, Inc.† | | | | | | |
Casey’s General Stores, Inc. | | | | | | |
| | | | | | |
| | | | | | |
Performance Food Group Co.† | | | | | | |
The accompanying notes are an integral part of these financial statements.
Allspring Factor Enhanced U.S. Large Cap Equity Portfolio | 5
Portfolio of investments—August 31, 2023 (unaudited)
| | | | | |
Consumer staples distribution & retail (continued) | | | | | | |
| | | | | | |
| | | | | | |
U.S. Foods Holding Corp.† | | | | | | |
Walgreens Boots Alliance, Inc. | | | | | | |
| | | | | | |
| | | | | | |
| | | | | | |
Archer-Daniels-Midland Co. | | | | | | |
| | | | | | |
| | | | | | |
| | | | | | |
| | | | | | |
| | | | | | |
| | | | | | |
| | | | | | |
| | | | | | |
| | | | | | |
| | | | | | |
Lamb Weston Holdings, Inc. | | | | | | |
Mondelez International, Inc. Class A | | | | | | |
| | | | | | |
| | | | | | |
Household products: 1.23% | | | | | | |
| | | | | | |
| | | | | | |
| | | | | | |
| | | | | | |
Reynolds Consumer Products, Inc. | | | | | | |
| | | | | | |
Personal care products: 0.12% | | | | | | |
| | | | | | |
Estee Lauder Cos., Inc. Class A | | | | | | |
| | | | | | |
| | | | | | |
| | | | | | |
Philip Morris International, Inc. | | | | | | |
| | | | | | |
| | | | | | |
Energy equipment & services: 0.20% | | | | | | |
| | | | | | |
| | | | | | |
| | | | | | |
| | | | | | |
The accompanying notes are an integral part of these financial statements.
6 | Allspring Factor Enhanced U.S. Large Cap Equity Portfolio
Portfolio of investments—August 31, 2023 (unaudited)
| | | | | |
Oil, gas & consumable fuels: 3.35% | | | | | | |
| | | | | | |
| | | | | | |
| | | | | | |
| | | | | | |
| | | | | | |
| | | | | | |
| | | | | | |
| | | | | | |
| | | | | | |
Occidental Petroleum Corp. | | | | | | |
| | | | | | |
| | | | | | |
| | | | | | |
Pioneer Natural Resources Co. | | | | | | |
| | | | | | |
| | | | | | |
| | | | | | |
| | | | | | |
| | | | | | |
| | | | | | |
| | | | | | |
| | | | | | |
| | | | | | |
| | | | | | |
| | | | | | |
| | | | | | |
| | | | | | |
First Citizens BancShares, Inc. Class A | | | | | | |
| | | | | | |
Huntington Bancshares, Inc. | | | | | | |
| | | | | | |
NU Holdings Ltd. Class A† | | | | | | |
PNC Financial Services Group, Inc. | | | | | | |
| | | | | | |
| | | | | | |
| | | | | | |
| | | | | | |
| | | | | | |
Affiliated Managers Group, Inc. | | | | | | |
Ameriprise Financial, Inc. | | | | | | |
Ares Management Corp. Class A | | | | | | |
Bank of New York Mellon Corp. | | | | | | |
| | | | | | |
Cboe Global Markets, Inc. | | | | | | |
| | | | | | |
| | | | | | |
| | | | | | |
The accompanying notes are an integral part of these financial statements.
Allspring Factor Enhanced U.S. Large Cap Equity Portfolio | 7
Portfolio of investments—August 31, 2023 (unaudited)
| | | | | |
Capital markets (continued) | | | | | | |
Goldman Sachs Group, Inc. | | | | | | |
| | | | | | |
Interactive Brokers Group, Inc. Class A | | | | | | |
Intercontinental Exchange, Inc. | | | | | | |
| | | | | | |
Janus Henderson Group PLC | | | | | | |
Jefferies Financial Group, Inc. | | | | | | |
LPL Financial Holdings, Inc. | | | | | | |
| | | | | | |
| | | | | | |
Raymond James Financial, Inc. | | | | | | |
| | | | | | |
| | | | | | |
| | | | | | |
| | | | | | |
| | | | | | |
| | | | | | |
Virtu Financial, Inc. Class A | | | | | | |
| | | | | | |
| | | | | | |
| | | | | | |
Capital One Financial Corp. | | | | | | |
| | | | | | |
| | | | | | |
| | | | | | |
| | | | | | |
Financial services: 4.10% | | | | | | |
Berkshire Hathaway, Inc. Class B† | | | | | | |
| | | | | | |
| | | | | | |
| | | | | | |
FleetCor Technologies, Inc.† | | | | | | |
| | | | | | |
| | | | | | |
| | | | | | |
Rocket Cos., Inc. Class A† | | | | | | |
Shift4 Payments, Inc. Class A† | | | | | | |
| | | | | | |
| | | | | | |
| | | | | | |
| | | | | | |
| | | | | | |
| | | | | | |
| | | | | | |
| | | | | | |
| | | | | | |
The accompanying notes are an integral part of these financial statements.
8 | Allspring Factor Enhanced U.S. Large Cap Equity Portfolio
Portfolio of investments—August 31, 2023 (unaudited)
| | | | | |
| | | | | | |
American International Group, Inc. | | | | | | |
| | | | | | |
| | | | | | |
Axis Capital Holdings Ltd. | | | | | | |
Brighthouse Financial, Inc.† | | | | | | |
| | | | | | |
| | | | | | |
First American Financial Corp. | | | | | | |
| | | | | | |
Hartford Financial Services Group, Inc. | | | | | | |
| | | | | | |
Marsh & McLennan Cos., Inc. | | | | | | |
| | | | | | |
Old Republic International Corp. | | | | | | |
| | | | | | |
| | | | | | |
Prudential Financial, Inc. | | | | | | |
Reinsurance Group of America, Inc. | | | | | | |
RenaissanceRe Holdings Ltd. | | | | | | |
| | | | | | |
| | | | | | |
| | | | | | |
| | | | | | |
Mortgage real estate investment trusts (REITs): 0.03% | | | | | | |
| | | | | | |
Starwood Property Trust, Inc. | | | | | | |
| | | | | | |
| | | | | | |
| | | | | | |
| | | | | | |
Alnylam Pharmaceuticals, Inc.† | | | | | | |
| | | | | | |
| | | | | | |
BioMarin Pharmaceutical, Inc.† | | | | | | |
| | | | | | |
| | | | | | |
| | | | | | |
| | | | | | |
Neurocrine Biosciences, Inc.† | | | | | | |
Regeneron Pharmaceuticals, Inc.† | | | | | | |
| | | | | | |
Sarepta Therapeutics, Inc.† | | | | | | |
United Therapeutics Corp.† | | | | | | |
Vertex Pharmaceuticals, Inc.† | | | | | | |
| | | | | | |
The accompanying notes are an integral part of these financial statements.
Allspring Factor Enhanced U.S. Large Cap Equity Portfolio | 9
Portfolio of investments—August 31, 2023 (unaudited)
| | | | | |
Health care equipment & supplies: 2.64% | | | | | | |
| | | | | | |
| | | | | | |
Baxter International, Inc. | | | | | | |
| | | | | | |
| | | | | | |
| | | | | | |
| | | | | | |
Edwards Lifesciences Corp.† | | | | | | |
| | | | | | |
| | | | | | |
GE HealthCare Technologies, Inc.† | | | | | | |
Globus Medical, Inc. Class A† | | | | | | |
| | | | | | |
| | | | | | |
IDEXX Laboratories, Inc.† | | | | | | |
Integra LifeSciences Holdings Corp.† | | | | | | |
Intuitive Surgical, Inc.† | | | | | | |
| | | | | | |
| | | | | | |
| | | | | | |
| | | | | | |
| | | | | | |
| | | | | | |
Zimmer Biomet Holdings, Inc. | | | | | | |
| | | | | | |
Health care providers & services: 1.86% | | | | | | |
| | | | | | |
| | | | | | |
| | | | | | |
| | | | | | |
| | | | | | |
| | | | | | |
| | | | | | |
| | | | | | |
| | | | | | |
| | | | | | |
| | | | | | |
| | | | | | |
Universal Health Services, Inc. Class B | | | | | | |
| | | | | | |
Health care technology: 0.15% | | | | | | |
| | | | | | |
Life sciences tools & services: 1.80% | | | | | | |
10X Genomics, Inc. Class A† | | | | | | |
Agilent Technologies, Inc. | | | | | | |
| | | | | | |
The accompanying notes are an integral part of these financial statements.
10 | Allspring Factor Enhanced U.S. Large Cap Equity Portfolio
Portfolio of investments—August 31, 2023 (unaudited)
| | | | | |
Life sciences tools & services (continued) | | | | | | |
Bio-Rad Laboratories, Inc. Class A† | | | | | | |
| | | | | | |
Charles River Laboratories International, Inc.† | | | | | | |
| | | | | | |
| | | | | | |
| | | | | | |
| | | | | | |
| | | | | | |
Mettler-Toledo International, Inc.† | | | | | | |
| | | | | | |
Thermo Fisher Scientific, Inc. | | | | | | |
| | | | | | |
West Pharmaceutical Services, Inc. | | | | | | |
| | | | | | |
| | | | | | |
| | | | | | |
Elanco Animal Health, Inc.† | | | | | | |
| | | | | | |
| | | | | | |
| | | | | | |
| | | | | | |
| | | | | | |
| | | | | | |
| | | | | | |
| | | | | | |
| | | | | | |
| | | | | | |
Aerospace & defense: 1.27% | | | | | | |
| | | | | | |
| | | | | | |
| | | | | | |
| | | | | | |
| | | | | | |
Huntington Ingalls Industries, Inc. | | | | | | |
L3Harris Technologies, Inc. | | | | | | |
| | | | | | |
| | | | | | |
| | | | | | |
Spirit AeroSystems Holdings, Inc. Class A† | | | | | | |
| | | | | | |
| | | | | | |
Air freight & logistics: 0.52% | | | | | | |
CH Robinson Worldwide, Inc. | | | | | | |
Expeditors International of Washington, Inc. | | | | | | |
The accompanying notes are an integral part of these financial statements.
Allspring Factor Enhanced U.S. Large Cap Equity Portfolio | 11
Portfolio of investments—August 31, 2023 (unaudited)
| | | | | |
Air freight & logistics (continued) | | | | | | |
| | | | | | |
United Parcel Service, Inc. Class B | | | | | | |
| | | | | | |
| | | | | | |
| | | | | | |
Builders FirstSource, Inc.† | | | | | | |
| | | | | | |
Fortune Brands Innovations, Inc. | | | | | | |
Johnson Controls International PLC | | | | | | |
Lennox International, Inc. | | | | | | |
| | | | | | |
| | | | | | |
| | | | | | |
| | | | | | |
Commercial services & supplies: 0.47% | | | | | | |
| | | | | | |
| | | | | | |
| | | | | | |
| | | | | | |
| | | | | | |
| | | | | | |
| | | | | | |
| | | | | | |
| | | | | | |
Construction & engineering: 0.13% | | | | | | |
| | | | | | |
| | | | | | |
| | | | | | |
| | | | | | |
Electrical equipment: 1.10% | | | | | | |
| | | | | | |
| | | | | | |
| | | | | | |
| | | | | | |
| | | | | | |
Rockwell Automation, Inc. | | | | | | |
Sensata Technologies Holding plc | | | | | | |
| | | | | | |
| | | | | | |
Ground transportation: 0.94% | | | | | | |
| | | | | | |
Old Dominion Freight Line, Inc. | | | | | | |
| | | | | | |
Schneider National, Inc. Class B | | | | | | |
The accompanying notes are an integral part of these financial statements.
12 | Allspring Factor Enhanced U.S. Large Cap Equity Portfolio
Portfolio of investments—August 31, 2023 (unaudited)
| | | | | |
Ground transportation (continued) | | | | | | |
| | | | | | |
| | | | | | |
| | | | | | |
| | | | | | |
| | | | | | |
Industrial conglomerates: 0.63% | | | | | | |
| | | | | | |
| | | | | | |
Honeywell International, Inc. | | | | | | |
| | | | | | |
| | | | | | |
| | | | | | |
Allison Transmission Holdings, Inc. | | | | | | |
| | | | | | |
| | | | | | |
| | | | | | |
| | | | | | |
| | | | | | |
| | | | | | |
| | | | | | |
Gates Industrial Corp. PLC† | | | | | | |
Illinois Tool Works, Inc. | | | | | | |
| | | | | | |
Lincoln Electric Holdings, Inc. | | | | | | |
| | | | | | |
| | | | | | |
| | | | | | |
| | | | | | |
| | | | | | |
| | | | | | |
| | | | | | |
Passenger airlines: 0.00% | | | | | | |
| | | | | | |
Professional services: 1.55% | | | | | | |
Automatic Data Processing, Inc. | | | | | | |
Booz Allen Hamilton Holding Corp. | | | | | | |
Broadridge Financial Solutions, Inc. | | | | | | |
CACI International, Inc. Class A† | | | | | | |
| | | | | | |
| | | | | | |
| | | | | | |
| | | | | | |
| | | | | | |
| | | | | | |
Robert Half International, Inc. | | | | | | |
The accompanying notes are an integral part of these financial statements.
Allspring Factor Enhanced U.S. Large Cap Equity Portfolio | 13
Portfolio of investments—August 31, 2023 (unaudited)
| | | | | |
Professional services (continued) | | | | | | |
Science Applications International Corp. | | | | | | |
SS&C Technologies Holdings, Inc. | | | | | | |
| | | | | | |
| | | | | | |
Trading companies & distributors: 0.25% | | | | | | |
Core & Main, Inc. Class A† | | | | | | |
| | | | | | |
MSC Industrial Direct Co., Inc. Class A | | | | | | |
| | | | | | |
WESCO International, Inc. | | | | | | |
| | | | | | |
| | | | | | |
Information technology: 27.65% | | | | | | |
Communications equipment: 0.93% | | | | | | |
| | | | | | |
| | | | | | |
| | | | | | |
| | | | | | |
| | | | | | |
| | | | | | |
Electronic equipment, instruments & components: 0.92% | | | | | | |
| | | | | | |
| | | | | | |
| | | | | | |
| | | | | | |
| | | | | | |
| | | | | | |
| | | | | | |
| | | | | | |
| | | | | | |
| | | | | | |
| | | | | | |
Akamai Technologies, Inc.† | | | | | | |
| | | | | | |
Cognizant Technology Solutions Corp. Class A | | | | | | |
| | | | | | |
| | | | | | |
| | | | | | |
International Business Machines Corp. | | | | | | |
| | | | | | |
| | | | | | |
| | | | | | |
Semiconductors & semiconductor equipment: 6.47% | | | | | | |
Advanced Micro Devices, Inc.† | | | | | | |
The accompanying notes are an integral part of these financial statements.
14 | Allspring Factor Enhanced U.S. Large Cap Equity Portfolio
Portfolio of investments—August 31, 2023 (unaudited)
| | | | | |
Semiconductors & semiconductor equipment (continued) | | | | | | |
Allegro MicroSystems, Inc.† | | | | | | |
| | | | | | |
| | | | | | |
| | | | | | |
| | | | | | |
| | | | | | |
| | | | | | |
| | | | | | |
| | | | | | |
Lattice Semiconductor Corp.† | | | | | | |
| | | | | | |
Microchip Technology, Inc. | | | | | | |
| | | | | | |
| | | | | | |
| | | | | | |
| | | | | | |
| | | | | | |
| | | | | | |
| | | | | | |
| | | | | | |
| | | | | | |
| | | | | | |
| | | | | | |
| | | | | | |
| | | | | | |
| | | | | | |
| | | | | | |
Cadence Design Systems, Inc.† | | | | | | |
CCC Intelligent Solutions Holdings, Inc.† | | | | | | |
| | | | | | |
Dolby Laboratories, Inc. Class A | | | | | | |
DoubleVerify Holdings, Inc.† | | | | | | |
| | | | | | |
| | | | | | |
| | | | | | |
| | | | | | |
| | | | | | |
Guidewire Software, Inc.† | | | | | | |
| | | | | | |
| | | | | | |
Manhattan Associates, Inc.† | | | | | | |
| | | | | | |
| | | | | | |
| | | | | | |
| | | | | | |
Palantir Technologies, Inc. Class A† | | | | | | |
Palo Alto Networks, Inc.† | | | | | | |
| | | | | | |
The accompanying notes are an integral part of these financial statements.
Allspring Factor Enhanced U.S. Large Cap Equity Portfolio | 15
Portfolio of investments—August 31, 2023 (unaudited)
| | | | | |
| | | | | | |
| | | | | | |
RingCentral, Inc. Class A† | | | | | | |
| | | | | | |
| | | | | | |
| | | | | | |
Smartsheet, Inc. Class A† | | | | | | |
| | | | | | |
| | | | | | |
| | | | | | |
Tyler Technologies, Inc.† | | | | | | |
| | | | | | |
Zoom Video Communications, Inc. Class A† | | | | | | |
| | | | | | |
Technology hardware, storage & peripherals: 6.65% | | | | | | |
| | | | | | |
Hewlett Packard Enterprise Co. | | | | | | |
| | | | | | |
| | | | | | |
| | | | | | |
| | | | | | |
| | | | | | |
Air Products & Chemicals, Inc. | | | | | | |
Axalta Coating Systems Ltd.† | | | | | | |
| | | | | | |
| | | | | | |
| | | | | | |
| | | | | | |
| | | | | | |
LyondellBasell Industries NV Class A | | | | | | |
| | | | | | |
| | | | | | |
| | | | | | |
| | | | | | |
| | | | | | |
| | | | | | |
| | | | | | |
Construction materials: 0.05% | | | | | | |
| | | | | | |
Containers & packaging: 0.37% | | | | | | |
| | | | | | |
| | | | | | |
Graphic Packaging Holding Co. | | | | | | |
| | | | | | |
| | | | | | |
| | | | | | |
The accompanying notes are an integral part of these financial statements.
16 | Allspring Factor Enhanced U.S. Large Cap Equity Portfolio
Portfolio of investments—August 31, 2023 (unaudited)
| | | | | |
| | | | | | |
| | | | | | |
| | | | | | |
| | | | | | |
| | | | | | |
Reliance Steel & Aluminum Co. | | | | | | |
| | | | | | |
| | | | | | |
| | | | | | |
| | | | | | |
| | | | | | |
Medical Properties Trust, Inc. | | | | | | |
Omega Healthcare Investors, Inc. | | | | | | |
| | | | | | |
| | | | | | |
| | | | | | |
Hotel & resort REITs: 0.34% | | | | | | |
Host Hotels & Resorts, Inc. | | | | | | |
Park Hotels & Resorts, Inc. | | | | | | |
| | | | | | |
| | | | | | |
Americold Realty Trust, Inc. | | | | | | |
First Industrial Realty Trust, Inc. | | | | | | |
| | | | | | |
| | | | | | |
| | | | | | |
| | | | | | |
Highwoods Properties, Inc. | | | | | | |
Real estate management & development: 0.21% | | | | | | |
CBRE Group, Inc. Class A† | | | | | | |
Jones Lang LaSalle, Inc.† | | | | | | |
Zillow Group, Inc. Class A† | | | | | | |
| | | | | | |
Residential REITs : 0.06% | | | | | | |
AvalonBay Communities, Inc. | | | | | | |
Equity LifeStyle Properties, Inc. | | | | | | |
| | | | | | |
| | | | | | |
| | | | | | |
Brixmor Property Group, Inc. | | | | | | |
Federal Realty Investment Trust | | | | | | |
The accompanying notes are an integral part of these financial statements.
Allspring Factor Enhanced U.S. Large Cap Equity Portfolio | 17
Portfolio of investments—August 31, 2023 (unaudited)
| | | | | |
| | | | | | |
| | | | | | |
Simon Property Group, Inc. | | | | | | |
| | | | | | |
Specialized REITs : 1.14% | | | | | | |
| | | | | | |
| | | | | | |
| | | | | | |
Digital Realty Trust, Inc. | | | | | | |
| | | | | | |
| | | | | | |
Gaming & Leisure Properties, Inc. | | | | | | |
| | | | | | |
Lamar Advertising Co. Class A | | | | | | |
| | | | | | |
| | | | | | |
| | | | | | |
| | | | | | |
| | | | | | |
Electric utilities: 1.42% | | | | | | |
American Electric Power Co., Inc. | | | | | | |
Constellation Energy Corp. | | | | | | |
| | | | | | |
| | | | | | |
| | | | | | |
| | | | | | |
| | | | | | |
| | | | | | |
| | | | | | |
| | | | | | |
| | | | | | |
Pinnacle West Capital Corp. | | | | | | |
| | | | | | |
| | | | | | |
| | | | | | |
| | | | | | |
| | | | | | |
| | | | | | |
| | | | | | |
Independent power and renewable electricity producers: 0.10% | | | | | | |
| | | | | | |
Clearway Energy, Inc. Class A | | | | | | |
| | | | | | |
| | | | | | |
The accompanying notes are an integral part of these financial statements.
18 | Allspring Factor Enhanced U.S. Large Cap Equity Portfolio
Portfolio of investments—August 31, 2023 (unaudited)
| | | | | |
| | | | | | |
| | | | | | |
| | | | | | |
| | | | | | |
Consolidated Edison, Inc. | | | | | | |
| | | | | | |
| | | | | | |
Public Service Enterprise Group, Inc. | | | | | | |
| | | | | | |
| | | | | | |
| | | | | | |
| | | | | | |
American Water Works Co., Inc. | | | | | | |
Essential Utilities, Inc. | | | | | | |
| | | | | | |
Total common stocks (Cost $349,991,534) | | | | | | |
| | | | | |
Short-term investments: 3.18% | | | | | | |
Investment companies: 3.18% | | | | | | |
Allspring Government Money Market Fund Select Class♠∞ | | | | | | |
Total short-term investments (Cost $15,328,636) | | | | | | |
Total investments in securities (Cost $365,320,170) | | | | | | |
Other assets and liabilities, net | | | | | | |
| | | | | | |
| Non-income-earning security |
| The issuer of the security is an affiliated person of the Portfolio as defined in the Investment Company Act of 1940. |
| The rate represents the 7-day annualized yield at period end. |
|
| Real estate investment trust |
Investments in affiliates
An affiliated investment is an investment in which the Portfolio owns at least 5% of the outstanding voting shares of the issuer or as a result of other relationships, such as the Portfolio and the issuer having the same adviser or investment manager. Transactions with issuers that were affiliates of the Portfolio at the end of the period were as follows:
| | | | | Net
change in
unrealized
gains
(losses) | | | Income
from
affiliated
securities |
| | | | | | | | |
Allspring Government Money Market Fund Select Class | | | | | | | | |
The accompanying notes are an integral part of these financial statements.
Allspring Factor Enhanced U.S. Large Cap Equity Portfolio | 19
Portfolio of investments—August 31, 2023 (unaudited)
The accompanying notes are an integral part of these financial statements.
20 | Allspring Factor Enhanced U.S. Large Cap Equity Portfolio
Statement of assets and liabilities—August 31, 2023 (unaudited)
Financial statements
Statement of assets and liabilities
| |
Investments in unaffiliated securities, at value (cost $349,991,534) | |
Investments in affiliated securities, at value (cost $15,328,636) | |
| |
Cash at broker segregated for futures contracts | |
| |
Prepaid expenses and other assets | |
| |
| |
| |
Payable for daily variation margin on open futures contracts | |
Custody and accounting fees payable | |
Professional fees payable | |
Accrued expenses and other liabilities | |
| |
| |
The accompanying notes are an integral part of these financial statements.
Allspring Factor Enhanced U.S. Large Cap Equity Portfolio | 21
Statement of operations—six months ended August 31, 2023 (unaudited)
Statement of operations
| |
Dividends (net of foreign withholdings taxes of $17,786) | |
Income from affiliated securities | |
| |
| |
| |
| |
Custody and accounting fees | |
| |
Interest holder report expenses | |
Trustees’ fees and expenses | |
| |
| |
Less: Fee waivers and/or expense reimbursements | |
| |
| |
Realized and unrealized gains (losses) on investments | |
| |
| |
| |
Net realized gains on investments | |
Net change in unrealized gains (losses) on | |
| |
| |
Net change in unrealized gains (losses) on investments | |
Net realized and unrealized gains (losses) on investments | |
Net increase in net assets resulting from operations | |
The accompanying notes are an integral part of these financial statements.
22 | Allspring Factor Enhanced U.S. Large Cap Equity Portfolio
Statement of changes in net assets
Statement of changes in net assets
|
Six months ended
August 31, 2023 (unaudited) | Year ended February 28, 2023 |
| | | | |
| | | | |
Net realized gains on investments | | | | |
Net change in unrealized gains (losses) on investments | | | | |
Net increase (decrease) in net assets resulting from operations | | | | |
| | | | |
Transactions in investors’ beneficial interests | | | | |
| | | | |
| | | | |
Net decrease in net assets resulting from capital transactions | | | | |
Total increase (decrease) in net assets | | | | |
| | | | |
| | | | |
| | | | |
The accompanying notes are an integral part of these financial statements.
Allspring Factor Enhanced U.S. Large Cap Equity Portfolio | 23
| Six months ended
August 31, 2023
(unaudited) | |
| | | | | |
| | | | | | |
Ratios to average net assets (annualized) | | | | | | |
| | | | | | |
| | | | | | |
| | | | | | |
| | | | | | |
| | | | | | |
| Ratio includes expenses which were voluntarily waived by the adviser. Without these voluntary waivers, the net expense ratios would be increased by the following amounts: |
Six months ended August 31, 2023 (unaudited) | |
Year ended February 28, 2023 | |
Year ended February 28, 2022 | |
Year ended February 28, 2021 | |
| |
| Returns for periods of less than one year are not annualized. |
The accompanying notes are an integral part of these financial statements.
24 | Allspring Factor Enhanced U.S. Large Cap Equity Portfolio
Notes to financial statements (unaudited)
Notes to financial statements
Allspring Master Trust (the “Trust”), a Delaware statutory trust organized on March 10, 1999, is an open-end management investment company registered under the Investment Company Act of 1940, as amended (the “1940 Act”). As an investment company, the Trust follows the accounting and reporting guidance in Financial Accounting Standards Board (“FASB”) Accounting Standards Codification Topic 946, Financial Services – Investment Companies. These financial statements report on the Allspring Factor Enhanced U.S. Large Cap Equity Portfolio (the “Portfolio”) which is a diversified series of the Trust.
Interests in the Portfolio are available solely through private placement transactions that do not involve any “public offering” within the meaning of Section 4(a)(2) of the Securities Act of 1933.
2.
SIGNIFICANT ACCOUNTING POLICIES
The following significant accounting policies, which are consistently followed in the preparation of the financial statements of the Portfolio, are in conformity with U.S. generally accepted accounting principles which require management to make estimates and assumptions that affect the reported amounts of assets and liabilities, disclosure of contingent assets and liabilities at the date of the financial statements, and the reported amounts of income and expenses during the reporting period. Actual results could differ from those estimates.
Securities valuation
All investments are valued each business day as of the close of regular trading on the New York Stock Exchange (generally 4 p.m. Eastern Time), although the Portfolio may deviate from this calculation time under unusual or unexpected circumstances.
Equity securities and futures contracts that are listed on a foreign or domestic exchange or market are valued at the official closing price or, if none, the last sales price.
Investments in registered open-end investment companies (other than those listed on a foreign or domestic exchange or market) are valued at net asset value.
Investments which are not valued using the methods discussed above are valued at their fair value, as determined in good faith by Allspring Funds Management, LLC (“Allspring Funds Management”), which was named the valuation designee by the Board of Trustees. As the valuation designee, Allspring Funds Management is responsible for day-to-day valuation activities for the Allspring Funds. In connection with these responsibilities, Allspring Funds Management has established a Valuation Committee and has delegated to it the authority to take any actions regarding the valuation of portfolio securities that the Valuation Committee deems necessary or appropriate, including determining the fair value of portfolio securities. On a quarterly basis, the Board of Trustees receives reports of valuation actions taken by the Valuation Committee. On at least an annual basis, the Board of Trustees receives an assessment of the adequacy and effectiveness of Allspring Funds Management’s process for determining the fair value of the portfolio of investments.
Futures contracts
Futures contracts are agreements between the Portfolio and a counterparty to buy or sell a specific amount of a commodity, financial instrument or currency at a specified price and on a specified date. The Portfolio may buy and sell futures contracts in order to gain exposure to, or protect against, changes in security values and is subject to equity price risk. The primary risks associated with the use of futures contracts are the imperfect correlation between changes in market values of securities held by the Portfolio and the prices of futures contracts, and the possibility of an illiquid market. Futures contracts are generally entered into on a regulated futures exchange and cleared through a clearinghouse associated with the exchange. With futures contracts, there is minimal counterparty risk to the Portfolio since futures contracts are exchange-traded and the exchange’s clearinghouse, as the counterparty to all exchange-traded futures, guarantees the futures contracts against default.
Upon entering into a futures contract, the Portfolio is required to deposit either cash or securities (initial margin) with the broker in an amount equal to a certain percentage of the contract value. Subsequent payments (variation margin) are paid to or received from the broker each day equal to the daily changes in the contract value. Such payments are recorded as unrealized gains or losses and, if any, shown as variation margin receivable (payable) in the Statement of Assets and Liabilities. Should the Portfolio fail to make requested variation margin payments, the broker can gain access to the initial margin to satisfy the Portfolio’s payment obligations. When the contracts are closed, a realized gain or loss is recorded in the Statement of Operations.
Security transactions and income recognition
Securities transactions are recorded on a trade date basis. Realized gains or losses are recorded on the basis of identified cost.
Dividend income is recognized on the ex-dividend date. Dividend income is recorded net of foreign taxes withheld where recovery of such taxes is not assured.
Distributions received from REIT investments may be characterized as ordinary income, capital gains, or a return of capital to the Portfolio based on information provided by the REIT. The proper characterization of REIT distributions is generally not known until after the end of each calendar year. As such, estimates may be used in reporting the character of income and distributions for financial statement purposes.
Allspring Factor Enhanced U.S. Large Cap Equity Portfolio | 25
Notes to financial statements (unaudited)
Federal and other taxes
The Portfolio is not required to pay federal income taxes on its net investment income and net capital gains as it is treated as a partnership for federal income tax purposes. All income, gains and losses of the Portfolio are deemed to have been “passed through” to the interest holders in proportion to their holdings of the Portfolio regardless of whether income and gains have been distributed by the Portfolio.
The Portfolio’s income tax returns and all financial records supporting those returns for the prior three fiscal years are subject to examination by the federal revenue authority. Management has analyzed the Portfolio’s tax positions taken on federal, state, and foreign tax returns, as applicable, for all open tax years and does not believe that there are any uncertain tax positions that require recognition of a tax liability.
As of August 31, 2023, the aggregate cost of all investments for federal income tax purposes was $366,963,117 and the unrealized gains (losses) consisted of:
3.
FAIR VALUATION MEASUREMENTS
Fair value measurements of investments are determined within a framework that has established a fair value hierarchy based upon the various data inputs utilized in determining the value of the Portfolio’s investments. The three-level hierarchy gives the highest priority to unadjusted quoted prices in active markets for identical assets or liabilities (Level 1) and the lowest priority to unobservable inputs (Level 3). The Portfolio’s investments are classified within the fair value hierarchy based on the lowest level of input that is significant to the fair value measurement. The inputs are summarized into three broad levels as follows:
•Level 1—quoted prices in active markets for identical securities
•Level 2—other significant observable inputs (including quoted prices for similar securities, interest rates, prepayment speeds, credit risk, etc.)
•Level 3—significant unobservable inputs (including the Portfolio’s own assumptions in determining the fair value of investments)
The inputs or methodologies used for valuing investments in securities are not necessarily an indication of the risk associated with investing in those securities.
The following is a summary of the inputs used in valuing the Portfolio’s assets and liabilities as of August 31, 2023:
| | Other significant
observable inputs
(Level 2) | Significant
unobservable inputs
(Level 3) | |
| | | | |
| | | | |
| | | | |
| | | | |
| | | | |
| | | | |
| | | | |
| | | | |
| | | | |
| | | | |
| | | | |
| | | | |
| | | | |
| | | | |
| | | | |
| | | | |
| | | | |
|
| | | | |
| | | | |
26 | Allspring Factor Enhanced U.S. Large Cap Equity Portfolio
Notes to financial statements (unaudited)
Futures contracts are reported at their cumulative unrealized gains (losses) at measurement date as reported in the table following the Portfolio of Investments. For futures contracts, the current day’s variation margin is reported on the Statement of Assets and Liabilities. All other assets and liabilities are reported at their market value at measurement date.
Additional sector, industry or geographic detail, if any, is included in the Portfolio of Investments.
For the six months ended August 31, 2023, the Portfolio did not have any transfers into/out of Level 3.
4.
TRANSACTIONS WITH AFFILIATES
Advisory fee
The Trust has entered into an advisory contract with Allspring Funds Management, a wholly owned subsidiary of Allspring Global Investments Holdings, LLC, a holding company indirectly owned by certain private funds of GTCR LLC and Reverence Capital Partners, L.P. The adviser is responsible for implementing investment policies and guidelines and for supervising the subadviser, who is responsible for day-to-day portfolio management of the Portfolio. Pursuant to the contract, Allspring Funds Management is entitled to receive an advisory fee at the following annual rate based on the Portfolio’s average daily net assets:
For the six months ended August 31, 2023, the advisory fee was equivalent to an annual rate of 0.10% of the Portfolio’s average daily net assets.
Allspring Funds Management has retained the services of a subadviser to provide daily portfolio management to the Portfolio. The fee for subadvisory services is borne by Allspring Funds Management. Allspring Global Investments, LLC, an affiliate of Allspring Funds Management and a wholly owned subsidiary of Allspring Global Investments Holdings, LLC, is the subadviser to the Portfolio and is entitled to receive a fee from Allspring Funds Management at an annual rate starting at 0.06% and declining to 0.04% as the average daily net assets of the Portfolio increase.
Allspring Funds Management has voluntarily waived and/or reimbursed advisory fees to reduce the net operating expense ratio of the Portfolio. These voluntary waivers may be discontinued at any time.
Interfund transactions
The Portfolio may purchase or sell portfolio investment securities to certain affiliates pursuant to Rule 17a-7 under the 1940 Act and under procedures adopted by the Board of Trustees. The procedures have been designed to ensure that these interfund transactions, which do not incur broker commissions, are effected at current market prices. Pursuant to these procedures, the Portfolio did not have any interfund transactions during the six months ended August 31, 2023.
5.
INVESTMENT PORTFOLIO TRANSACTIONS
Purchases and sales of investments, excluding U.S. government obligations (if any) and short-term securities, for the six months ended August 31, 2023 were $124,525,685 and $172,810,631, respectively.
6.
DERIVATIVE TRANSACTIONS
During the six months ended August 31, 2023, the Portfolio entered into futures contracts to gain market exposure. The Portfolio had an average notional amount of $12,152,807 in long futures contracts during the six months ended August 31, 2023.
The fair value, realized gains or losses and change in unrealized gains or losses, if any, on derivative instruments are reflected in the corresponding financial statement captions.
The Trust, along with Allspring Variable Trust and Allspring Funds Trust (excluding the money market funds), are parties to a $350,000,000 revolving credit agreement whereby the Portfolio is permitted to use bank borrowings for temporary or emergency purposes, such as to fund interest holders withdrawal requests. Interest under the credit agreement is charged to the Portfolio based on a borrowing rate equal to the higher of the Federal Funds rate or the overnight bank funding rate in effect on that day plus a spread. In addition, an annual commitment fee based on the unused balance is allocated to each participating fund.
For the six months ended August 31, 2023, there were no borrowings by the Portfolio under the agreement.
Allspring Factor Enhanced U.S. Large Cap Equity Portfolio | 27
Notes to financial statements (unaudited)
As of the end of the period, the Portfolio concentrated its portfolio of investments in the information technology sector. A fund that invests a substantial portion of its assets in any sector may be more affected by changes in that sector than would be a fund whose investments are not heavily weighted in any sector.
Under the Portfolio’s organizational documents, the officers and Trustees have been granted certain indemnification rights against certain liabilities that may arise out of performance of their duties to the Portfolio. The Portfolio has entered into a separate agreement with each Trustee that converts indemnification rights currently existing under the Portfolio’s organizational documents into contractual rights that cannot be changed in the future without the consent of the Trustee. Additionally, in the normal course of business, the Portfolio may enter into contracts with service providers that contain a variety of indemnification clauses. The Portfolio’s maximum exposure under these arrangements is dependent on future claims that may be made against the Portfolio and, therefore, cannot be estimated.
28 | Allspring Factor Enhanced U.S. Large Cap Equity Portfolio
Other information (unaudited)
Other information
Proxy voting information
A description of the policies and procedures used to determine how to vote proxies relating to portfolio securities is available without charge, upon request, by calling 1-866-259-3305, visiting our website at allspringglobal.com, or visiting the SEC website at sec.gov. Information regarding how the proxies related to portfolio securities were voted during the most recent 12-month period ended June 30 is available on the website at allspringglobal.com or by visiting the SEC website at sec.gov.
Quarterly portfolio holdings information
The Portfolio files its complete schedule of portfolio holdings with the SEC for the first and third quarters of each fiscal year as an exhibit to its reports on Form N-PORT. Interest holders may view the filed Form N-PORT by visiting the SEC website at sec.gov.
Allspring Factor Enhanced U.S. Large Cap Equity Portfolio | 29
Other information (unaudited)
Board of trustees and officers
Each of the Trustees and Officers listed in the table below acts in identical capacities for each fund in the Allspring family of funds, which consists of 126 mutual funds comprising the Allspring Funds Trust, Allspring Variable Trust, Allspring Master Trust and four closed-end funds (collectively the “Fund Complex”). This table should be read in conjunction with the Prospectus and the Statement of Additional Information1. The mailing address of each Trustee and Officer is 1415 Vantage Park Drive, 3rd Floor, Charlotte, NC 28203. Each Trustee and Officer serves an indefinite term, however, each Trustee serves such term until reaching the mandatory retirement age established by the Trustees.
Independent Trustees
| | Principal occupations during past five years or longer | Current other
public company or
investment
company
directorships |
William R. Ebsworth
(Born 1957) | | Retired. From 1984 to 2013, equities analyst, portfolio manager, research director and chief investment officer at Fidelity Management and Research Company in Boston, Tokyo, and Hong Kong, and retired in 2013 as Chief Investment Officer of Fidelity Strategic Advisers, Inc. where he led a team of investment professionals managing client assets. Prior thereto, Board member of Hong Kong Securities Clearing Co., Hong Kong Options Clearing Corp., the Thailand International Fund, Ltd., Fidelity Investments Life Insurance Company, and Empire Fidelity Investments Life Insurance Company. Audit Committee Chair and Investment Committee Chair of the Vincent Memorial Hospital Foundation (non-profit organization). Mr. Ebsworth is a CFA charterholder. | |
Jane A. Freeman
(Born 1953) | Trustee,
since 2015;
Chair Liaison,
since 2018 | Retired. From 2012 to 2014 and 1999 to 2008, Chief Financial Officer of Scientific Learning Corporation. From 2008 to 2012, Ms. Freeman provided consulting services related to strategic business projects. Prior to 1999, Portfolio Manager at Rockefeller & Co. and Scudder, Stevens & Clark. Board member of the Harding Loevner Funds from 1996 to 2014, serving as both Lead Independent Director and chair of the Audit Committee. Board member of the Russell Exchange Traded Funds Trust from 2011 to 2012 and the chair of the Audit Committee. Ms. Freeman is also an inactive Chartered Financial Analyst. | |
Isaiah Harris, Jr.
(Born 1952) | Trustee,
since 2009;
Audit Committee Chair,
since 2019 | Retired. Member of the Advisory Board of CEF of East Central Florida. Chairman of the Board of CIGNA Corporation from 2009 to 2021, and Director from 2005 to 2008. From 2003 to 2011, Director of Deluxe Corporation. Prior thereto, President and CEO of BellSouth Advertising and Publishing Corp. from 2005 to 2007, President and CEO of BellSouth Enterprises from 2004 to 2005 and President of BellSouth Consumer Services from 2000 to 2003. Emeritus member of the Iowa State University Foundation Board of Governors. Emeritus Member of the Advisory board of Iowa State University School of Business. Advisory Board Member, Palm Harbor Academy (private school). Advisory Board Member, Fellowship of Christian Athletes. Mr. Harris is a certified public accountant (inactive status). | |
David F. Larcker
(Born 1950) | | Distinguished Visiting Fellow at the Hoover Institution since 2022. James Irvin Miller Professor of Accounting at the Graduate School of Business (Emeritus), Stanford University, Director of the Corporate Governance Research Initiative and Senior Faculty of The Rock Center for Corporate Governance since 2006. From 2005 to 2008, Professor of Accounting at the Graduate School of Business, Stanford University. Prior thereto, Ernst & Young Professor of Accounting at The Wharton School, University of Pennsylvania from 1985 to 2005. | |
Olivia S. Mitchell
(Born 1953) | Trustee,
since 2006;
Nominating and Governance Committee Chair,
since 2018 | International Foundation of Employee Benefit Plans Professor since 1993, Wharton School of the University of Pennsylvania. Director of Wharton’s Pension Research Council and Boettner Center on Pensions & Retirement Research, and Research Associate at the National Bureau of Economic Research. Previously taught at Cornell University from 1978 to 1993. | |
Timothy J. Penny
(Born 1951) | Trustee,
since 1996;
Chair,
since 2018 | President and Chief Executive Officer of Southern Minnesota Initiative Foundation, a non-profit organization, since 2007. Vice Chair of the Economic Club of Minnesota, since 2007. Co-Chair of the Committee for a Responsible Federal Budget, since 1995. Member of the Board of Trustees of NorthStar Education Finance, Inc., a non-profit organization, from 2007-2022. Senior Fellow of the University of Minnesota Humphrey Institute from 1995 to 2017. | |
1
The Statement of Additional Information includes additional information about the Trustees and is available, without charge, upon request, by calling 1-800-222-8222 or by visiting the website at allspringglobal.com.
30 | Allspring Factor Enhanced U.S. Large Cap Equity Portfolio
Other information (unaudited)
| Position held and length of service* | Principal occupations during past five years or longer | Current other public company or investment company directorships |
James G. Polisson
(Born 1959) | | Retired. Chief Marketing Officer, Source (ETF) UK Services, Ltd, from 2015 to 2017. From 2012 to 2015, Principal of The Polisson Group, LLC, a management consulting, corporate advisory and principal investing company. Chief Executive Officer and Managing Director at Russell Investments, Global Exchange Traded Funds from 2010 to 2012. Managing Director of Barclays Global Investors from 1998 to 2010 and Global Chief Marketing Officer for iShares and Barclays Global Investors from 2000 to 2010. Trustee of the San Francisco Mechanics’ Institute, a non- profit organization, from 2013 to 2015. Board member of the Russell Exchange Traded Fund Trust from 2011 to 2012. Director of Barclays Global Investors Holdings Deutschland GmbH from 2006 to 2009. Mr. Polisson is an attorney and has a retired status with the Massachusetts and District of Columbia Bar Associations. | |
Pamela Wheelock
(Born 1959) | Trustee,
since January 2020;
previously Trustee from
January 2018 to
July 2019 | Retired. Executive and Senior Financial leadership positions in the public, private and nonprofit sectors. Interim President and CEO, McKnight Foundation, 2020. Interim Commissioner, Minnesota Department of Human Services, 2019. Chief Operating Officer, Twin Cities Habitat for Humanity, 2017-2019. Vice President for University Services, University of Minnesota, 2012- 2016. Interim President and CEO, Blue Cross and Blue Shield of Minnesota, 2011-2012. Executive Vice-President and Chief Financial Officer, Minnesota Wild, 2002-2008. Commissioner, Minnesota Department of Finance, 1999-2002. Chair of the Board of Directors of Destination Medical Center Corporation. Board member of the Minnesota Wild Foundation. | |
| Length of service dates reflect the Trustee’s commencement of service with the Trust’s predecessor entities, where applicable. |
Allspring Factor Enhanced U.S. Large Cap Equity Portfolio | 31
Other information (unaudited)
Officers1
| Position held and
length of service | Principal occupations during past five years or longer |
| | President and Chief Executive Officer of Allspring Funds Management, LLC since 2017 and Head of Global Fund Governance of Allspring Global Investments since 2022. Prior thereto, co-president of Galliard Capital Management, LLC, an affiliate of Allspring Funds Management, LLC, from 2019 to 2022 and Head of Affiliated Managers, Allspring Global Investments, from 2014 to 2019 and Executive Vice President responsible for marketing, investments and product development for Allspring Funds Management, LLC, from 2009 to 2014. |
Jeremy DePalma
(Born 1974) | Treasurer,
since 2012
(for certain funds in
the Fund Complex);
since 2021 (for
the remaining funds in the Complex) | Senior Vice President of Allspring Funds Management, LLC since 2009. Senior Vice President of Evergreen Investment Management Company, LLC from 2008 to 2010 and head of the Fund Reporting and Control Team within Fund Administration from 2005 to 2010. |
Christopher Baker
(Born 1976) | Chief Compliance Officer,
since 2022 | Global Chief Compliance Officer for Allspring Global Investments since 2022. Prior thereto, Chief Compliance Officer for State Street Global Advisors from 2018 to 2021. Senior Compliance Officer for the State Street divisions of Alternative Investment Solutions, Sector Solutions, and Global Marketing from 2015 to 2018. From 2010 to 2015 Vice President, Global Head of Investment and Marketing Compliance for State Street Global Advisors. |
Matthew Prasse
(Born 1983) | Chief Legal Officer,
since 2022;
Secretary,
since 2021 | Senior Counsel of the Allspring Legal Department since 2021. Senior Counsel of the Wells Fargo Legal Department from 2018 to 2021. Previously, Counsel for Barings LLC from 2015 to 2018. Prior to joining Barings, Associate at Morgan, Lewis & Bockius LLP from 2008 to 2015. |
1 For those Officers with tenures at Allspring Global Investments and/or Allspring Funds Management, LLC that began prior to 2021, such tenures include years of service during which these businesses/entities were known as Wells Fargo Asset Management and Wells Fargo Funds Management, LLC, respectively.
32 | Allspring Factor Enhanced U.S. Large Cap Equity Portfolio
Other information (unaudited)
Board consideration of investment advisory and sub-advisory agreements:
Allspring Bloomberg US Aggregate ex-Corporate Portfolio, Allspring Emerging Markets Bond Portfolio, Allspring Factor Enhanced Emerging Markets Equity Portfolio, Allspring Factor Enhanced International Equity Portfolio, Allspring Factor Enhanced U.S. Large Cap Equity Portfolio, Allspring Factor Enhanced U.S. Small Cap Equity Portfolio, Allspring High Yield Corporate Bond Portfolio, Allspring Investment Grade Corporate Bond Portfolio, Allspring Strategic Retirement Bond Portfolio, and Allspring U.S. REIT Portfolio
Under the Investment Company Act of 1940 (the “1940 Act”), the Board of Trustees (the “Board”) of Allspring Master Trust (the “Trust”) must determine annually whether to approve the continuation of the Trust’s investment advisory and sub-advisory agreements. In this regard, at a meeting held on May 15-17, 2023 (the “Meeting”), the Board, all the members of which have no direct or indirect interest in the investment advisory and sub-advisory agreements and are not “interested persons” of the Trust, as defined in the 1940 Act (the “Independent Trustees”), reviewed and approved for each of the portfolios of the Trust identified in the table below (individually, a “Portfolio” and collectively, the “Portfolios”): (i) an investment advisory agreement (the “Advisory Agreement”) with Allspring Funds Management, LLC (“Allspring Funds Management”); and (ii) an investment sub-advisory agreement (each, a “Sub-Advisory Agreement” and collectively, the “Sub-Advisory Agreements”) with the Sub-Advisers(s) identified in the table below (each, a “Sub-Adviser” and collectively, the “Sub-Advisers”) for the corresponding Portfolio identified. The Advisory Agreement and the Sub-Advisory Agreements are collectively referred to as the “Advisory Agreements.”
| |
Allspring Bloomberg Barclays US Aggregate ex-Corporate Portfolio | Allspring Global Investments, LLC |
Allspring Emerging Markets Bond Portfolio | Allspring Global Investments, LLC, Allspring Global Investments (UK) Limited |
Allspring Factor Enhanced Emerging Markets Equity Portfolio | Allspring Global Investments, LLC |
Allspring Factor Enhanced International Equity Portfolio | Allspring Global Investments, LLC |
Allspring Factor Enhanced U.S. Large Cap Equity Portfolio | Allspring Global Investments, LLC |
Allspring Factor Enhanced U.S. Small Cap Equity Portfolio | Allspring Global Investments, LLC |
Allspring High Yield Corporate Bond Portfolio | Allspring Global Investments, LLC |
Allspring Investment Grade Corporate Bond Portfolio | Allspring Global Investments, LLC |
Allspring Strategic Retirement Bond Portfolio | Allspring Global Investments, LLC |
Allspring U.S. REIT Portfolio | Allspring Global Investments, LLC |
At the Meeting, the Board considered the factors and reached the conclusions described below relating to the selection of Allspring Funds Management and the Sub-Advisers and the approval of the Advisory Agreements. Prior to the Meeting, including at a Board meeting held in April 2023, the Trustees conferred extensively among themselves and with representatives of Allspring Funds Management about these matters. The Board has adopted a team-based approach, with each team consisting of a sub-set of Trustees, to assist the full Board in the discharge of its duties in reviewing investment performance and other matters throughout the year. The Independent Trustees were assisted in their evaluation of the Advisory Agreements by independent legal counsel, from whom they received separate legal advice and with whom they met separately.
The Board noted that it initially approved the Advisory Agreements at a Board meeting held in May 2021, each for a two-year term, in advance of the sale of Wells Fargo Asset Management to Allspring Global Investments Holdings, LLC,1 a holding company indirectly owned by certain private funds of GTCR LLC and Reverence Capital Partners, L.P. (the “Transaction”). The Trustees also noted that, while they did not specifically consider the continuation of the Advisory Agreements in 2022 as a result of the two-year term that was approved in 2021, the Trustees received and considered certain information at a Board meeting held in April 2022 that was applicable to the Advisory Agreements, including an overview and financial review of the Allspring Global Investments business, information regarding certain ancillary agreements that were approved by the Board at the April 2022 Board meeting, and comparative data regarding Fund fees and expenses.
In providing information to the Board, Allspring Funds Management and the Sub-Advisers were guided by a detailed set of requests for information submitted to them by independent legal counsel on behalf of the Independent Trustees at the start of the Board’s annual contract renewal process earlier in 2023. In considering and approving the Advisory Agreements, the Trustees considered the information they believed relevant, including but not limited to the information discussed below. The Board considered not only the specific information presented in connection with the Meeting, but also the knowledge gained over time through interaction with Allspring Funds Management and the Sub-Advisers about various topics. In this regard, the Board reviewed reports of Allspring Funds Management at each of its quarterly meetings, which included, among other things, portfolio reviews and investment performance reports. In addition, the Board and the teams mentioned above confer with portfolio managers at various times throughout the year. The Board did not identify any particular information or consideration that was all-important or controlling, and each individual Trustee may have attributed different weights to various factors.
1
The trade name for the asset management firm that includes Allspring Funds Management and the Sub-Adviser is “Allspring Global Investments.”
Allspring Factor Enhanced U.S. Large Cap Equity Portfolio | 33
Other information (unaudited)
After its deliberations, the Board unanimously determined that the compensation or the absence of compensation payable to Allspring Funds Management and each of the Sub-Advisers under each of the Advisory Agreements was reasonable, and approved the continuation of the Advisory Agreements for a one-year term. The Board considered the approval of the Advisory Agreements for the Portfolios as part of its consideration of agreements for funds across the complex, but its approvals were made on a fund-by-fund basis. The following summarizes a number of important, but not necessarily all, factors considered by the Board in support of its approvals.
Nature, extent and quality of services
The Board received and considered various information regarding the nature, extent, and quality of services provided to the Portfolios by Allspring Funds Management and the Sub-Advisers under the Advisory Agreements. This information included a description of the investment advisory services and Portfolio-level administrative services covered by the Advisory Agreement, as well as, among other things, a summary of the background and experience of senior management of Allspring Global Investments, of which Allspring Funds Management and the Sub-Advisers are a part, and a summary of investments made in the Allspring Global Investments business. The Board also considered information about retention arrangements with respect to key personnel of Allspring Global Investments that were put in place in connection with the Transaction. The Board took into account information about the services that continue to be provided by Wells Fargo & Co. and/or its affiliates (“Wells Fargo”) since the Transaction under a transition services agreement and the anticipated timeline for exiting the transition services agreement. In addition, the Board received and considered information about the full range of services provided to the Fund by Allspring Funds Management and its affiliates.
The Board considered the qualifications, background, tenure, and responsibilities of each of the portfolio managers primarily responsible for the day-to-day portfolio management of the Portfolios. The Board evaluated the ability of Allspring Funds Management and the Sub-Advisers to attract and retain qualified investment professionals, including research, advisory, and supervisory personnel.
The Board further considered the compliance programs and compliance records of Allspring Funds Management and the Sub-Advisers. The Board received and considered information about Allspring Global Investments’ risk management functions, which included information about Allspring Funds Management’s and the Sub-Advisers’ business continuity plans, their approaches to data privacy and cybersecurity, and Allspring Funds Management’s role as administrator of the Portfolios’ liquidity risk management program, and the derivatives risk management program for Allspring Bloomberg Barclays US Aggregate ex-Corporate Portfolio and Allspring Factor Enhanced U.S. Large Cap Equity Portfolio. The Board also received and considered information about Allspring Funds Management’s intermediary and vendor oversight program.
Portfolio investment performance and expenses
The Board considered the investment performance results for each of the Portfolios over various time periods ended December 31, 2022. The Board considered these results in comparison to the investment performance of funds in a universe that was determined by Broadridge Inc. (“Broadridge”) to be similar to each respective Portfolios (each, a “Universe”), and in comparison to each Portfolios’ benchmark index and to other comparative data. Broadridge is an independent provider of investment company data. The Board received a description of the methodology used by Broadridge to select the mutual funds in the performance Universe. The Board noted the short performance history of the Portfolios.
With respect to the investment performance of each Portfolio relative to its respective Universe, the Board noted the following: (i) the investment performance of Allspring Bloomberg US Aggregate ex-Corporate Portfolio was higher than the average investment performance of the Universe for all periods under review; the investment performance of Allspring Bloomberg US Aggregate ex-Corporate Portfolio was higher than the investment performance of its benchmark index, the Bloomberg U.S. Aggregate ex Corporate Index, for the one-year period and was in range of the investment performance of its benchmark index for the three- and five-year periods under review; (ii) the investment performance of Allspring Emerging Markets Bond Portfolio was lower than the average investment performance of the Universe for the one- and three-year periods and was in range of the average investment performance of the Universe for the five-year period; the investment performance of Allspring Emerging Markets Bond Portfolio was higher than the investment performance of its benchmark index, the J.P. Morgan EM Bond Global Diversified Index, for the one-year period and was in range of the investment performance of its benchmark index for the three- and five-year periods under review; (iii) the investment performance of Allspring Factor Enhanced Emerging Markets Equity Portfolio was higher than the average investment performance of the Universe for the one-year period and was lower than the average investment performance of the Universe for the three- and five-year periods; the investment performance of Allspring Factor Enhanced Emerging Markets Equity Portfolio was higher than the investment performance of its benchmark index, the MSCI Emerging Markets Index (Net), for the one-year period and was lower than the investment performance of its benchmark index for the three- and five-year periods under review; (iv) the investment performance of Allspring Factor Enhanced International Equity Portfolio was higher than the average investment performance of the Universe for all periods under review; the investment performance of Allspring Factor Enhanced International Equity Portfolio was higher than the investment performance of its benchmark index, the MSCI World ex US Index (Net), for all periods under review; (v) the investment performance of Allspring Factor Enhanced U.S. Large Cap Equity Portfolio was higher than the average investment performance of the Universe for the one- and five-year periods and was lower than the average investment performance of the Universe for the three-year period; the investment performance of Allspring Factor Enhanced U.S. Large Cap Equity Portfolio was higher than the investment performance of its benchmark index, the Russell 1000® Index, for the one-year period and was lower than the investment performance of its benchmark index for the three- and five-year periods under review; (vi) the investment performance of Allspring Factor Enhanced U.S. Small Cap Equity Portfolio was lower than the average investment performance of the Universe for all periods under review; the investment performance of Allspring Factor Enhanced U.S. Small Cap Equity Portfolio was higher than the
34 | Allspring Factor Enhanced U.S. Large Cap Equity Portfolio
Other information (unaudited)
investment performance of its benchmark index, the Russell 2000® Index, for the one-year period and was lower than the investment performance of its benchmark index for the three- and five-year periods under review; (vii) the investment performance of Allspring High Yield Corporate Bond Portfolio was lower than the average investment performance of the Universe for all periods under review; the investment performance of Allspring High Yield Corporate Bond Portfolio was in range of the investment performance of its benchmark index, the Bloomberg U.S. Corporate High Yield 2% Issuer Capped, for the one-year period and was lower than the investment performance of its benchmark index for the three- and five-year periods under review; (viii) the investment performance of Allspring Investment Grade Corporate Bond Portfolio was higher than the average investment performance of the Universe for the one- and five-year periods and in rage of the average investment performance of the Universe for the three-year period; the investment performance of Allspring Investment Grade Corporate Bond Portfolio was higher than the investment performance of its benchmark index, the Bloomberg U.S. Corporate Bond Index, for the one-year period and was in range of the investment performance of its benchmark index for the three- and five-year periods under review; (ix) the investment performance of Allspring Strategic Retirement Bond Portfolio was higher than the average investment performance of the Universe for all periods under review; the investment performance of Allspring Strategic Retirement Bond Portfolio was higher than the investment performance of its benchmark index, the Strategic Retirement Blended Index, for the one- and three-year periods and was in range of the investment performance of its benchmark index for the five-year period; (x) the investment performance of Allspring U.S. REIT Portfolio was lower than the average investment performance of the Universe for the one-year period and was in range of the average investment performance of the Universe for the three- and five-year periods; the investment performance of Allspring U.S. REIT Portfolio was higher than the investment performance of its benchmark index, the Dow Jones U.S. Select REIT Index, for all periods under review.
The Board received information concerning, and discussed factors contributing to, the underperformance of each of Allspring Emerging Markets Bond Portfolio, Allspring Factor Enhanced Emerging Markets Equity Portfolio, Allspring Factor Enhanced U.S. Large Cap Equity Portfolio, Allspring Factor Enhanced U.S. Small Cap Equity Portfolio and Allspring High Yield Corporate Bond Portfolio relative to such Portfolio’s Universe and benchmark index for the periods identified above. The Board took note of the explanations for the relative underperformance during these periods, including with respect to investment decisions and market factors that affected each Portfolio’s investment performance.
The Board also received and considered information regarding the fee rates that are payable to Allspring Funds Management for investment advisory services (as discussed below), which are the only fees charged to the Portfolios, relative to corresponding class-specific expense groups that were determined by Broadridge to be similar to the Portfolios (the “Groups”). The Board received a description of the methodology used by Broadridge to select the mutual funds in the expense Groups and an explanation of how funds comprising expense groups and their expense ratios may vary from year-to-year.
The Board took into account the Portfolios’ investment performance and expense information provided to it among the factors considered in deciding to re-approve the Advisory Agreements.
Investment advisory and sub-advisory fee rates
The Board reviewed and considered the contractual fee rates payable by the Portfolios to Allspring Funds Management under the Advisory Agreement. The Board also reviewed and considered the contractual investment sub-advisory fee rates that are payable by Allspring Funds Management to the Sub-Advisers for investment sub-advisory services.
Among other information reviewed by the Board was a comparison of the Portfolios’ Advisory Rates with the average contractual investment advisory fee rates of funds in the expense Groups at a common asset level as well as transfer agency costs of the Portfolios in the expense Groups. The Board noted that the Advisory Rates of the Portfolios were lower than or in range of the mean rates for the Portfolios’ expense Groups.
The Board also received and considered information about the portions of the total advisory fees that were retained by Allspring Funds Management after payment of the fees to the Sub-Advisers for sub-advisory services. In assessing the reasonableness of these amounts, the Board received and evaluated information about the nature and extent of responsibilities retained and risks assumed by Allspring Funds Management and not delegated to or assumed by the Sub-Advisers, and about Allspring Funds Management’s on-going oversight services. Given the affiliation between Allspring Funds Management and the Sub-Advisers, the Board ascribed limited relevance to the allocation of fees between them.
For all Portfolios, except Allspring Factor Enhanced U.S. Small Cap Equity Portfolio, Allspring Factor Enhanced International Equity Portfolio, Allspring Factor Enhanced Emerging Markets Equity Portfolio, Allspring U.S. REIT Portfolio, Allspring Investment Grade Corporate Bond Portfolio, and Allspring Strategic Retirement Bond Portfolio, the Board also received and considered information about the nature and extent of services offered and fee rates charged by Allspring Funds Management and the Sub-Advisers to other types of clients with investment strategies similar to those of certain Portfolios. In this regard, the Board received information about the significantly greater scope of services, and compliance, reporting and other legal burdens and risks of managing proprietary mutual funds compared with those associated with managing assets of other types of clients, including third-party sub-advised fund clients and non-mutual fund clients such as institutional separate accounts.
Based on its consideration of the factors and information it deemed relevant, including those described here, the Board determined that the compensation payable to Allspring Funds Management under the Advisory Agreement and to the Sub-Advisers under the Sub-Advisory Agreements was reasonable.
Allspring Factor Enhanced U.S. Large Cap Equity Portfolio | 35
Other information (unaudited)
Profitability
The Board received and considered information concerning the profitability of Allspring Funds Management, as well as the profitability of Allspring Global Investments, from providing services to the fund complex as a whole. The Board noted that the Sub-Adviser’s profitability information with respect to providing services to the Portfolios and other funds in the complex was subsumed in the Allspring Global Investments profitability analysis.
Allspring Funds Management reported on the methodologies and estimates used in calculating profitability, including a description of the methodology used to allocate certain expenses and differences in how Allspring Global Investments calculates its pre-tax profit metric versus the methodology used when Allspring Funds Management was part of Wells Fargo. It was noted that the impact of such differences had only minor impact on the financial results presented. Among other things, the Board noted that the levels of profitability reported on a fund-by-fund basis varied widely, depending on factors such as the size, type, and age of fund.
Based on its review, the Board did not deem the profits reported by Allspring Funds Management or Allspring Global Investments from services provided to the Portfolios to be at a level that would prevent it from approving the continuation of the Advisory Agreements.
Economies of scale
The Board received and considered information about the potential for Allspring Funds Management to experience economies of scale in the provision of management services to the Portfolios, the difficulties of calculating economies of scale at an individual fund level, and the extent to which potential scale benefits are shared with Portfolio shareholders. The Board noted the existence of breakpoints in the Portfolios’ advisory fee structure, which operate generally to reduce the Portfolios’ expense ratios as the Portfolios grow in size, and the size of the Portfolios in relation to such breakpoints. The Board considered that in addition to advisory fee breakpoints, Allspring Funds Management shares potential economies of scale from its management business in a variety of ways, including through fee waiver and expense reimbursement arrangements, competitive advisory fee rates set at the outset without regard to breakpoints, and investments in the business intended to enhance services available to shareholders.
The Board concluded that Allspring Funds Management’s arrangements with respect to the Portfolios, including contractual breakpoints, constituted a reasonable approach to sharing potential economies of scale with the Portfolios and their shareholders.
Other benefits to Allspring Funds Management and the Sub-Advisers
The Board received and considered information regarding potential “fall-out” or ancillary benefits received by Allspring Funds Management and its affiliates, including the Sub-Advisers, as a result of their relationships with the Portfolios. Ancillary benefits could include, among others, benefits directly attributable to other relationships with the Portfolios and benefits potentially derived from an increase in Allspring Funds Management’s and the Sub-Advisers’ businesses as a result of their relationships with the Portfolios. The Board noted that Allspring Funds Distributor, LLC, an affiliate of Allspring Funds Management, receives distribution-related fees in respect of shares sold or held through it.
The Board also reviewed information about soft dollar credits earned and utilized by the Sub-Advisers and fees earned in the past by Allspring Funds Management and the Sub-Advisers from managing a private investment vehicle for the fund complex’s securities lending collateral.
Based on its consideration of the factors and information it deemed relevant, including those described here, the Board did not find that any ancillary benefits received by Allspring Funds Management and its affiliates, including the Sub-Advisers, were unreasonable.
Conclusion
At the Meeting, after considering the above-described factors and based on its deliberations and its evaluation of the information described above, the Board unanimously determined that the compensation payable to Allspring Funds Management and the Sub-Advisers under each of the Advisory Agreements was reasonable, and approved the continuation of the Advisory Agreements for a one-year term.
36 | Allspring Factor Enhanced U.S. Large Cap Equity Portfolio
Other information (unaudited)
Liquidity risk management program
In accordance with Rule 22e-4 under the Investment Company Act of 1940, as amended (the “Liquidity Rule”), Allspring Master Trust (the “Trust”) has adopted and implemented a liquidity risk management program (the “Program”) on behalf of each of its series, including the Portfolio, which is reasonably designed to assess and manage the Portfolio’s liquidity risk. “Liquidity risk” is defined under the Liquidity Rule as the risk that the Portfolio is unable to meet redemption requests without significantly diluting remaining investors’ interests in the Portfolio. The Trust’s Board of Trustees (the “Board”) previously approved the designation of Allspring Funds Management, LLC (“Allspring Funds Management”), the Portfolio’s investment adviser, to administer the Program, and Allspring Funds Management has established a Liquidity Risk Management Council (the “Council”) composed of personnel from multiple departments within Allspring Funds Management and its affiliates to assist Allspring Funds Management in the administration of the Program.
The Program is comprised of various components designed to support the assessment and/or management of liquidity risk, including: (1) the periodic assessment (no less frequently than annually) of certain factors that influence the Portfolio’s liquidity risk; (2) the periodic classification (no less frequently than monthly) of the Portfolio’s investments into one of four liquidity categories that reflect an estimate of their liquidity under current market conditions; (3) a 15% limit on the acquisition of “illiquid investments” (as defined under the Liquidity Rule); (4) to the extent the Portfolio does not invest primarily in “highly liquid investments” (as defined under the Liquidity Rule), the determination of a minimum percentage of the Portfolio’s assets that generally will be invested in highly liquid investments (an “HLIM”); (5) if the Portfolio has established an HLIM, the periodic review (no less frequently than annually) of the HLIM and the adoption of policies and procedures for responding to a shortfall of the Portfolio’s “highly liquid investments” below its HLIM; and (6) periodic reporting to the Board.
At a meeting of the Board held on May 16-17, 2023, the Board received and reviewed a written report (the “Report”) from Allspring Funds Management that, among other things, addressed the operation of the Program and assessed its adequacy and effectiveness for the period from January 1, 2022 through December 31, 2022 (the “Reporting Period”). The Report noted significant liquidity events impacting the Portfolios related to extended foreign market holidays as well as the difficulty of trading and settlement of most Russia-related securities due to sanctions activity. The Report noted that there were no material changes to the Program during the Reporting Period.
Allspring Funds Management determined in the Report that the Program has been implemented and operates effectively to manage each Portfolio’s, including the Portfolio’s, liquidity risk, and Allspring Funds Management continues to believe that the Program has been and continues to be adequately and effectively implemented to monitor and, as applicable, respond to the Portfolio’s liquidity developments.
There can be no assurance that the Program will achieve its objectives under all circumstances in the future.
Allspring Factor Enhanced U.S. Large Cap Equity Portfolio | 37
For more information
More information about Allspring Funds is available free upon request. To obtain literature, please write, visit the Portfolio’s website, or call:
Allspring Funds
P.O. Box 219967
Kansas City, MO 64121-9967
Website: allspringglobal.com
Individual investors: 1-800-222-8222
Retail investment professionals: 1-888-877-9275
Institutional investment professionals: 1-800-260-5969
This report and the financial statements contained herein are submitted for the general information of the interest holders of the Portfolio. If this report is used for promotional purposes, distribution of the report must be accompanied or preceded by a current prospectus. Before investing, please consider the investment objectives, risks, charges, and expenses of the investment. For a current prospectus and, if available, a summary prospectus, containing this information, call 1-800-222-8222 or visit the Portfolio’s website at allspringglobal.com. Read the prospectus carefully before you invest or send money.
Allspring Global InvestmentsTM is the trade name for the asset management firms of Allspring Global Investments Holdings, LLC, a holding company indirectly owned by certain private funds of GTCR LLC and Reverence Capital Partners, L.P. These firms include but are not limited to Allspring Global Investments, LLC, and Allspring Funds Management, LLC. Certain products managed by Allspring entities are distributed by Allspring Funds Distributor, LLC (a broker-dealer and Member FINRA/SIPC).
This material is for general informational and educational purposes only and is NOT intended to provide investment advice or a recommendation of any kind - including a recommendation for any specific investment, strategy, or plan.
© 2023 Allspring Global Investments Holdings, LLC. All rights reserved.
Allspring Factor Enhanced U.S. Small Cap Equity Portfolio
Semi-Annual Report
August 31, 2023
Allspring Factor Enhanced U.S. Small Cap Equity Portfolio | 1
Portfolio information (unaudited)
| The Portfolio seeks long-term capital appreciation. |
| Allspring Funds Management, LLC |
| Allspring Global Investments, LLC |
| Harindra de Silva, Ph.D., CFA, Monisha Jayakumar |
Ten largest holdings (%) as of August 31, 20231 |
Super Micro Computer, Inc. | |
| |
| |
Winnebago Industries, Inc. | |
| |
| |
| |
| |
| |
Weatherford International PLC | |
| Figures represent the percentage of the Portfolio’s net assets. Holdings are subject to change and may have changed since the date specified. |
Sector allocation as of August 31, 20231 |
| Figures represent the percentage of the Portfolio’s long-term investments. Allocations are subject to change and may have changed since the date specified. |
| CFA® and Chartered Financial Analyst® are trademarks owned by CFA Institute. |
2 | Allspring Factor Enhanced U.S. Small Cap Equity Portfolio
Portfolio of investments—August 31, 2023 (unaudited)
| | | | | |
| | | | | | |
Communication services: 2.82% | | | | | | |
Diversified telecommunication services: 0.83% | | | | | | |
| | | | | | |
Charge Enterprises, Inc.† | | | | | | |
Cogent Communications Holdings, Inc. | | | | | | |
| | | | | | |
Liberty Latin America Ltd. Class A† | | | | | | |
Liberty Latin America Ltd. Class C† | | | | | | |
Lumen Technologies, Inc.† | | | | | | |
| | | | | | |
| | | | | | |
| | | | | | |
| | | | | | |
| | | | | | |
| | | | | | |
Lions Gate Entertainment Corp. Class A† | | | | | | |
Lions Gate Entertainment Corp. Class B† | | | | | | |
Madison Square Garden Entertainment Corp.† | | | | | | |
| | | | | | |
| | | | | | |
Sphere Entertainment Co.† | | | | | | |
| | | | | | |
Interactive media & services: 0.88% | | | | | | |
| | | | | | |
| | | | | | |
| | | | | | |
Eventbrite, Inc. Class A† | | | | | | |
| | | | | | |
| | | | | | |
Liberty TripAdvisor Holdings, Inc. Class B† | | | | | | |
MediaAlpha, Inc. Class A† | | | | | | |
| | | | | | |
| | | | | | |
| | | | | | |
| | | | | | |
| | | | | | |
| | | | | | |
| | | | | | |
| | | | | | |
ZipRecruiter, Inc. Class A† | | | | | | |
| | | | | | |
| | | | | | |
Advantage Solutions, Inc.† | | | | | | |
AMC Networks, Inc. Class A† | | | | | | |
Clear Channel Outdoor Holdings, Inc.† | | | | | | |
| | | | | | |
The accompanying notes are an integral part of these financial statements.
Allspring Factor Enhanced U.S. Small Cap Equity Portfolio | 3
Portfolio of investments—August 31, 2023 (unaudited)
| | | | | |
| | | | | | |
Entravision Communications Corp. Class A | | | | | | |
| | | | | | |
| | | | | | |
| | | | | | |
iHeartMedia, Inc. Class A† | | | | | | |
John Wiley & Sons, Inc. Class A | | | | | | |
| | | | | | |
| | | | | | |
| | | | | | |
| | | | | | |
| | | | | | |
| | | | | | |
| | | | | | |
| | | | | | |
| | | | | | |
Wireless telecommunication services: 0.13% | | | | | | |
| | | | | | |
| | | | | | |
Telephone & Data Systems, Inc. | | | | | | |
| | | | | | |
Consumer discretionary: 9.70% | | | | | | |
Automobile components: 1.45% | | | | | | |
| | | | | | |
American Axle & Manufacturing Holdings, Inc.† | | | | | | |
Cooper-Standard Holdings, Inc.† | | | | | | |
| | | | | | |
| | | | | | |
Fox Factory Holding Corp.† | | | | | | |
| | | | | | |
Goodyear Tire & Rubber Co.† | | | | | | |
| | | | | | |
Modine Manufacturing Co.† | | | | | | |
| | | | | | |
Standard Motor Products, Inc. | | | | | | |
| | | | | | |
| | | | | | |
| | | | | | |
| | | | | | |
| | | | | | |
| | | | | | |
Winnebago Industries, Inc. | | | | | | |
| | | | | | |
| | | | | | |
The accompanying notes are an integral part of these financial statements.
4 | Allspring Factor Enhanced U.S. Small Cap Equity Portfolio
Portfolio of investments—August 31, 2023 (unaudited)
| | | | | |
| | | | | | |
| | | | | | |
Qurate Retail, Inc. Class B† | | | | | | |
| | | | | | |
Diversified consumer services: 1.05% | | | | | | |
| | | | | | |
Adtalem Global Education, Inc.† | | | | | | |
| | | | | | |
| | | | | | |
| | | | | | |
| | | | | | |
| | | | | | |
Graham Holdings Co. Class B | | | | | | |
| | | | | | |
Lincoln Educational Services Corp.† | | | | | | |
| | | | | | |
OneSpaWorld Holdings Ltd.† | | | | | | |
| | | | | | |
Strategic Education, Inc. | | | | | | |
| | | | | | |
| | | | | | |
| | | | | | |
Hotels, restaurants & leisure: 1.98% | | | | | | |
Biglari Holdings, Inc. Class B† | | | | | | |
| | | | | | |
| | | | | | |
Bluegreen Vacations Holding Corp. | | | | | | |
| | | | | | |
Brinker International, Inc.† | | | | | | |
| | | | | | |
| | | | | | |
Cracker Barrel Old Country Store, Inc. | | | | | | |
Dave & Buster’s Entertainment, Inc.† | | | | | | |
| | | | | | |
| | | | | | |
El Pollo Loco Holdings, Inc. | | | | | | |
| | | | | | |
Golden Entertainment, Inc. | | | | | | |
Hilton Grand Vacations, Inc.† | | | | | | |
Inspired Entertainment, Inc.† | | | | | | |
International Game Technology PLC | | | | | | |
| | | | | | |
| | | | | | |
Monarch Casino & Resort, Inc. | | | | | | |
| | | | | | |
| | | | | | |
ONE Group Hospitality, Inc.† | | | | | | |
Papa John’s International, Inc. | | | | | | |
The accompanying notes are an integral part of these financial statements.
Allspring Factor Enhanced U.S. Small Cap Equity Portfolio | 5
Portfolio of investments—August 31, 2023 (unaudited)
| | | | | |
Hotels, restaurants & leisure (continued) | | | | | | |
| | | | | | |
| | | | | | |
RCI Hospitality Holdings, Inc. | | | | | | |
Red Robin Gourmet Burgers, Inc.† | | | | | | |
Red Rock Resorts, Inc. Class A | | | | | | |
| | | | | | |
SeaWorld Entertainment, Inc.† | | | | | | |
Shake Shack, Inc. Class A† | | | | | | |
| | | | | | |
Household durables: 1.73% | | | | | | |
| | | | | | |
| | | | | | |
Century Communities, Inc. | | | | | | |
| | | | | | |
Dream Finders Homes, Inc. Class A† | | | | | | |
Ethan Allen Interiors, Inc. | | | | | | |
Green Brick Partners, Inc.† | | | | | | |
Hovnanian Enterprises, Inc. Class A† | | | | | | |
Installed Building Products, Inc. | | | | | | |
| | | | | | |
| | | | | | |
| | | | | | |
| | | | | | |
| | | | | | |
| | | | | | |
| | | | | | |
Taylor Morrison Home Corp.† | | | | | | |
| | | | | | |
| | | | | | |
| | | | | | |
| | | | | | |
| | | | | | |
Johnson Outdoors, Inc. Class A | | | | | | |
Malibu Boats, Inc. Class A† | | | | | | |
| | | | | | |
MasterCraft Boat Holdings, Inc.† | | | | | | |
| | | | | | |
| | | | | | |
| | | | | | |
| | | | | | |
Abercrombie & Fitch Co. Class A† | | | | | | |
Academy Sports & Outdoors, Inc. | | | | | | |
American Eagle Outfitters, Inc. | | | | | | |
Asbury Automotive Group, Inc.† | | | | | | |
Boot Barn Holdings, Inc.† | | | | | | |
| | | | | | |
The accompanying notes are an integral part of these financial statements.
6 | Allspring Factor Enhanced U.S. Small Cap Equity Portfolio
Portfolio of investments—August 31, 2023 (unaudited)
| | | | | |
Specialty retail (continued) | | | | | | |
Build-A-Bear Workshop, Inc. | | | | | | |
| | | | | | |
Camping World Holdings, Inc. Class A | | | | | | |
| | | | | | |
| | | | | | |
Designer Brands, Inc. Class A | | | | | | |
Destination XL Group, Inc.† | | | | | | |
| | | | | | |
| | | | | | |
| | | | | | |
| | | | | | |
Haverty Furniture Cos., Inc. | | | | | | |
| | | | | | |
| | | | | | |
National Vision Holdings, Inc.† | | | | | | |
| | | | | | |
| | | | | | |
| | | | | | |
Sally Beauty Holdings, Inc.† | | | | | | |
| | | | | | |
| | | | | | |
| | | | | | |
Sonic Automotive, Inc. Class A | | | | | | |
Stitch Fix, Inc. Class A† | | | | | | |
Tile Shop Holdings, Inc.† | | | | | | |
| | | | | | |
| | | | | | |
| | | | | | |
| | | | | | |
| | | | | | |
Textiles, apparel & luxury goods: 0.50% | | | | | | |
| | | | | | |
| | | | | | |
| | | | | | |
| | | | | | |
| | | | | | |
| | | | | | |
| | | | | | |
Wolverine World Wide, Inc. | | | | | | |
| | | | | | |
| | | | | | |
| | | | | | |
Coca-Cola Consolidated, Inc. | | | | | | |
| | | | | | |
| | | | | | |
| | | | | | |
The accompanying notes are an integral part of these financial statements.
Allspring Factor Enhanced U.S. Small Cap Equity Portfolio | 7
Portfolio of investments—August 31, 2023 (unaudited)
| | | | | |
| | | | | | |
| | | | | | |
| | | | | | |
| | | | | | |
Consumer staples distribution & retail: 0.37% | | | | | | |
| | | | | | |
| | | | | | |
Sprouts Farmers Market, Inc.† | | | | | | |
United Natural Foods, Inc.† | | | | | | |
| | | | | | |
| | | | | | |
| | | | | | |
| | | | | | |
| | | | | | |
| | | | | | |
Fresh Del Monte Produce, Inc. | | | | | | |
| | | | | | |
| | | | | | |
John B Sanfilippo & Son, Inc. | | | | | | |
| | | | | | |
| | | | | | |
| | | | | | |
| | | | | | |
| | | | | | |
| | | | | | |
| | | | | | |
Household products: 0.19% | | | | | | |
Central Garden & Pet Co.† | | | | | | |
Central Garden & Pet Co. Class A† | | | | | | |
| | | | | | |
| | | | | | |
| | | | | | |
Personal care products: 0.81% | | | | | | |
| | | | | | |
Edgewell Personal Care Co. | | | | | | |
| | | | | | |
| | | | | | |
| | | | | | |
| | | | | | |
Nu Skin Enterprises, Inc. Class A | | | | | | |
| | | | | | |
| | | | | | |
| | | | | | |
The accompanying notes are an integral part of these financial statements.
8 | Allspring Factor Enhanced U.S. Small Cap Equity Portfolio
Portfolio of investments—August 31, 2023 (unaudited)
| | | | | |
| | | | | | |
Energy equipment & services: 1.99% | | | | | | |
| | | | | | |
| | | | | | |
| | | | | | |
| | | | | | |
| | | | | | |
Diamond Offshore Drilling, Inc.† | | | | | | |
| | | | | | |
| | | | | | |
| | | | | | |
Mammoth Energy Services, Inc.† | | | | | | |
| | | | | | |
| | | | | | |
Oceaneering International, Inc.† | | | | | | |
Oil States International, Inc.† | | | | | | |
Patterson-UTI Energy, Inc. | | | | | | |
| | | | | | |
Ranger Energy Services, Inc. | | | | | | |
| | | | | | |
| | | | | | |
Select Water Solutions, Inc. Class A | | | | | | |
| | | | | | |
U.S. Silica Holdings, Inc.† | | | | | | |
| | | | | | |
Weatherford International PLC† | | | | | | |
| | | | | | |
Oil, gas & consumable fuels: 4.56% | | | | | | |
| | | | | | |
| | | | | | |
| | | | | | |
California Resources Corp. | | | | | | |
| | | | | | |
Centrus Energy Corp. Class A† | | | | | | |
| | | | | | |
| | | | | | |
| | | | | | |
| | | | | | |
| | | | | | |
Crescent Energy Co. Class A | | | | | | |
| | | | | | |
Delek U.S. Holdings, Inc. | | | | | | |
| | | | | | |
| | | | | | |
Earthstone Energy, Inc. Class A† | | | | | | |
Equitrans Midstream Corp. | | | | | | |
Evolution Petroleum Corp. | | | | | | |
| | | | | | |
| | | | | | |
The accompanying notes are an integral part of these financial statements.
Allspring Factor Enhanced U.S. Small Cap Equity Portfolio | 9
Portfolio of investments—August 31, 2023 (unaudited)
| | | | | |
Oil, gas & consumable fuels (continued) | | | | | | |
| | | | | | |
| | | | | | |
International Seaways, Inc. | | | | | | |
| | | | | | |
Magnolia Oil & Gas Corp. Class A | | | | | | |
| | | | | | |
| | | | | | |
Nordic American Tankers Ltd. | | | | | | |
| | | | | | |
Par Pacific Holdings, Inc.† | | | | | | |
| | | | | | |
| | | | | | |
| | | | | | |
Riley Exploration Permian, Inc. | | | | | | |
| | | | | | |
SilverBow Resources, Inc.† | | | | | | |
| | | | | | |
| | | | | | |
| | | | | | |
Teekay Tankers Ltd. Class A | | | | | | |
| | | | | | |
| | | | | | |
| | | | | | |
| | | | | | |
| | | | | | |
| | | | | | |
| | | | | | |
| | | | | | |
Amalgamated Financial Corp. | | | | | | |
| | | | | | |
| | | | | | |
| | | | | | |
Atlantic Union Bankshares Corp. | | | | | | |
| | | | | | |
| | | | | | |
| | | | | | |
| | | | | | |
| | | | | | |
Bank of NT Butterfield & Son Ltd. | | | | | | |
| | | | | | |
| | | | | | |
| | | | | | |
| | | | | | |
| | | | | | |
Berkshire Hills Bancorp, Inc. | | | | | | |
| | | | | | |
Burke & Herbert Financial Services Corp. | | | | | | |
| | | | | | |
The accompanying notes are an integral part of these financial statements.
10 | Allspring Factor Enhanced U.S. Small Cap Equity Portfolio
Portfolio of investments—August 31, 2023 (unaudited)
| | | | | |
| | | | | | |
| | | | | | |
| | | | | | |
Capital City Bank Group, Inc. | | | | | | |
| | | | | | |
| | | | | | |
Central Pacific Financial Corp. | | | | | | |
Central Valley Community Bancorp | | | | | | |
| | | | | | |
ChoiceOne Financial Services, Inc. | | | | | | |
Citizens Financial Services, Inc. | | | | | | |
| | | | | | |
| | | | | | |
| | | | | | |
| | | | | | |
Codorus Valley Bancorp, Inc. | | | | | | |
Community Bank System, Inc. | | | | | | |
Community Trust Bancorp, Inc. | | | | | | |
| | | | | | |
| | | | | | |
| | | | | | |
Dime Community Bancshares, Inc. | | | | | | |
| | | | | | |
Enterprise Financial Services Corp. | | | | | | |
Esquire Financial Holdings, Inc. | | | | | | |
| | | | | | |
| | | | | | |
Farmers National Banc Corp. | | | | | | |
Fidelity D&D Bancorp, Inc. | | | | | | |
| | | | | | |
First Bancorp New York Stock Exchange | | | | | | |
| | | | | | |
| | | | | | |
First Business Financial Services, Inc. | | | | | | |
First Commonwealth Financial Corp. | | | | | | |
First Community Bankshares, Inc. | | | | | | |
| | | | | | |
| | | | | | |
First Financial Bankshares, Inc. | | | | | | |
| | | | | | |
| | | | | | |
| | | | | | |
| | | | | | |
| | | | | | |
| | | | | | |
| | | | | | |
Heartland Financial USA, Inc. | | | | | | |
| | | | | | |
| | | | | | |
| | | | | | |
The accompanying notes are an integral part of these financial statements.
Allspring Factor Enhanced U.S. Small Cap Equity Portfolio | 11
Portfolio of investments—August 31, 2023 (unaudited)
| | | | | |
| | | | | | |
| | | | | | |
| | | | | | |
| | | | | | |
HomeTrust Bancshares, Inc. | | | | | | |
| | | | | | |
| | | | | | |
| | | | | | |
Independent Bank Corp. NASDAQ GS | | | | | | |
International Bancshares Corp. | | | | | | |
| | | | | | |
Live Oak Bancshares, Inc. | | | | | | |
| | | | | | |
MainStreet Bancshares, Inc. | | | | | | |
| | | | | | |
Metrocity Bankshares, Inc. | | | | | | |
Metropolitan Bank Holding Corp.† | | | | | | |
| | | | | | |
| | | | | | |
Midland States Bancorp, Inc. | | | | | | |
National Bank Holdings Corp. Class A | | | | | | |
National Bankshares, Inc. | | | | | | |
| | | | | | |
Northeast Community Bancorp, Inc. | | | | | | |
| | | | | | |
Northwest Bancshares, Inc. | | | | | | |
| | | | | | |
| | | | | | |
OceanFirst Financial Corp. | | | | | | |
| | | | | | |
| | | | | | |
| | | | | | |
Orange County Bancorp, Inc. | | | | | | |
Pacific Premier Bancorp, Inc. | | | | | | |
| | | | | | |
| | | | | | |
Peapack-Gladstone Financial Corp. | | | | | | |
Penns Woods Bancorp, Inc. | | | | | | |
| | | | | | |
| | | | | | |
| | | | | | |
| | | | | | |
Provident Financial Services, Inc. | | | | | | |
| | | | | | |
| | | | | | |
Republic Bancorp, Inc. Class A | | | | | | |
| | | | | | |
ServisFirst Bancshares, Inc. | | | | | | |
Simmons First National Corp. Class A | | | | | | |
South Plains Financial, Inc. | | | | | | |
The accompanying notes are an integral part of these financial statements.
12 | Allspring Factor Enhanced U.S. Small Cap Equity Portfolio
Portfolio of investments—August 31, 2023 (unaudited)
| | | | | |
| | | | | | |
Southern States Bancshares, Inc. | | | | | | |
| | | | | | |
Texas Capital Bancshares, Inc.† | | | | | | |
| | | | | | |
| | | | | | |
| | | | | | |
| | | | | | |
| | | | | | |
| | | | | | |
| | | | | | |
| | | | | | |
United Community Banks, Inc. | | | | | | |
| | | | | | |
| | | | | | |
| | | | | | |
| | | | | | |
Virginia National Bankshares Corp. | | | | | | |
| | | | | | |
| | | | | | |
| | | | | | |
| | | | | | |
| | | | | | |
| | | | | | |
Artisan Partners Asset Management, Inc. Class A | | | | | | |
AssetMark Financial Holdings, Inc.† | | | | | | |
| | | | | | |
Brightsphere Investment Group, Inc. | | | | | | |
Donnelley Financial Solutions, Inc.† | | | | | | |
GCM Grosvenor, Inc. Class A | | | | | | |
Hamilton Lane, Inc. Class A | | | | | | |
| | | | | | |
| | | | | | |
Open Lending Corp. Class A† | | | | | | |
Patria Investments Ltd. Class A | | | | | | |
Perella Weinberg Partners | | | | | | |
| | | | | | |
PJT Partners, Inc. Class A | | | | | | |
Silvercrest Asset Management Group, Inc. Class A | | | | | | |
| | | | | | |
Victory Capital Holdings, Inc. Class A | | | | | | |
Virtus Investment Partners, Inc. | | | | | | |
| | | | | | |
| | | | | | |
| | | | | | |
Atlanticus Holdings Corp.† | | | | | | |
Bread Financial Holdings, Inc. | | | | | | |
Encore Capital Group, Inc.† | | | | | | |
The accompanying notes are an integral part of these financial statements.
Allspring Factor Enhanced U.S. Small Cap Equity Portfolio | 13
Portfolio of investments—August 31, 2023 (unaudited)
| | | | | |
Consumer finance (continued) | | | | | | |
Enova International, Inc.† | | | | | | |
| | | | | | |
| | | | | | |
| | | | | | |
| | | | | | |
| | | | | | |
| | | | | | |
| | | | | | |
Financial services: 2.35% | | | | | | |
A-Mark Precious Metals, Inc. | | | | | | |
Banco Latinoamericano de Comercio Exterior SA | | | | | | |
| | | | | | |
| | | | | | |
Cass Information Systems, Inc. | | | | | | |
Compass Diversified Holdings | | | | | | |
| | | | | | |
| | | | | | |
| | | | | | |
Federal Agricultural Mortgage Corp. Class C | | | | | | |
| | | | | | |
International Money Express, Inc.† | | | | | | |
Jackson Financial, Inc. Class A | | | | | | |
| | | | | | |
| | | | | | |
| | | | | | |
| | | | | | |
NMI Holdings, Inc. Class A† | | | | | | |
Pagseguro Digital Ltd. Class A† | | | | | | |
| | | | | | |
PennyMac Financial Services, Inc. | | | | | | |
| | | | | | |
| | | | | | |
| | | | | | |
Security National Financial Corp. Class A† | | | | | | |
| | | | | | |
| | | | | | |
| | | | | | |
| | | | | | |
Ambac Financial Group, Inc.† | | | | | | |
| | | | | | |
| | | | | | |
CNO Financial Group, Inc. | | | | | | |
| | | | | | |
| | | | | | |
| | | | | | |
| | | | | | |
Genworth Financial, Inc. Class A† | | | | | | |
The accompanying notes are an integral part of these financial statements.
14 | Allspring Factor Enhanced U.S. Small Cap Equity Portfolio
Portfolio of investments—August 31, 2023 (unaudited)
| | | | | |
| | | | | | |
Goosehead Insurance, Inc. Class A† | | | | | | |
Greenlight Capital Re Ltd. Class A† | | | | | | |
Horace Mann Educators Corp. | | | | | | |
Kingsway Financial Services, Inc.† | | | | | | |
National Western Life Group, Inc. Class A | | | | | | |
Oscar Health, Inc. Class A† | | | | | | |
| | | | | | |
Selective Insurance Group, Inc. | | | | | | |
| | | | | | |
| | | | | | |
Stewart Information Services Corp. | | | | | | |
| | | | | | |
| | | | | | |
Mortgage real estate investment trusts (REITs): 1.34% | | | | | | |
| | | | | | |
Apollo Commercial Real Estate Finance, Inc. | | | | | | |
| | | | | | |
Ares Commercial Real Estate Corp. | | | | | | |
Blackstone Mortgage Trust, Inc. Class A | | | | | | |
BrightSpire Capital, Inc. | | | | | | |
Chicago Atlantic Real Estate Finance, Inc. | | | | | | |
| | | | | | |
Claros Mortgage Trust, Inc. | | | | | | |
Franklin BSP Realty Trust, Inc. | | | | | | |
Granite Point Mortgage Trust, Inc. | | | | | | |
Hannon Armstrong Sustainable Infrastructure Capital, Inc. | | | | | | |
Invesco Mortgage Capital, Inc. | | | | | | |
| | | | | | |
| | | | | | |
Nexpoint Real Estate Finance, Inc. | | | | | | |
PennyMac Mortgage Investment Trust | | | | | | |
| | | | | | |
| | | | | | |
TPG RE Finance Trust, Inc. | | | | | | |
| | | | | | |
| | | | | | |
| | | | | | |
Acadia Pharmaceuticals, Inc.† | | | | | | |
Acrivon Therapeutics, Inc.† | | | | | | |
| | | | | | |
| | | | | | |
Agios Pharmaceuticals, Inc.† | | | | | | |
Akero Therapeutics, Inc.† | | | | | | |
Aldeyra Therapeutics, Inc.† | | | | | | |
| | | | | | |
Alpine Immune Sciences, Inc.† | | | | | | |
Amicus Therapeutics, Inc.† | | | | | | |
The accompanying notes are an integral part of these financial statements.
Allspring Factor Enhanced U.S. Small Cap Equity Portfolio | 15
Portfolio of investments—August 31, 2023 (unaudited)
| | | | | |
Biotechnology (continued) | | | | | | |
Anavex Life Sciences Corp.† | | | | | | |
Anika Therapeutics, Inc.† | | | | | | |
Arcturus Therapeutics Holdings, Inc.† | | | | | | |
| | | | | | |
| | | | | | |
Arrowhead Pharmaceuticals, Inc.† | | | | | | |
Atara Biotherapeutics, Inc.† | | | | | | |
Aurinia Pharmaceuticals, Inc.† | | | | | | |
| | | | | | |
| | | | | | |
| | | | | | |
BioCryst Pharmaceuticals, Inc.† | | | | | | |
| | | | | | |
| | | | | | |
| | | | | | |
Blueprint Medicines Corp.† | | | | | | |
| | | | | | |
| | | | | | |
| | | | | | |
Carisma Therapeutics, Inc. | | | | | | |
Catalyst Pharmaceuticals, Inc.† | | | | | | |
Celldex Therapeutics, Inc.† | | | | | | |
Coherus Biosciences, Inc.† | | | | | | |
| | | | | | |
Deciphera Pharmaceuticals, Inc.† | | | | | | |
Denali Therapeutics, Inc.† | | | | | | |
| | | | | | |
Dynavax Technologies Corp.† | | | | | | |
| | | | | | |
Eagle Pharmaceuticals, Inc.† | | | | | | |
Fennec Pharmaceuticals, Inc.† | | | | | | |
| | | | | | |
Halozyme Therapeutics, Inc.† | | | | | | |
Heron Therapeutics, Inc.† | | | | | | |
| | | | | | |
Ideaya Biosciences, Inc.† | | | | | | |
| | | | | | |
| | | | | | |
| | | | | | |
Intellia Therapeutics, Inc.† | | | | | | |
Intercept Pharmaceuticals, Inc.† | | | | | | |
Ironwood Pharmaceuticals, Inc.† | | | | | | |
iTeos Therapeutics, Inc.† | | | | | | |
Janux Therapeutics, Inc.† | | | | | | |
Karyopharm Therapeutics, Inc.† | | | | | | |
Keros Therapeutics, Inc.† | | | | | | |
Kiniksa Pharmaceuticals Ltd. Class A† | | | | | | |
| | | | | | |
| | | | | | |
The accompanying notes are an integral part of these financial statements.
16 | Allspring Factor Enhanced U.S. Small Cap Equity Portfolio
Portfolio of investments—August 31, 2023 (unaudited)
| | | | | |
Biotechnology (continued) | | | | | | |
Kymera Therapeutics, Inc.† | | | | | | |
Lyell Immunopharma, Inc.† | | | | | | |
| | | | | | |
Madrigal Pharmaceuticals, Inc.† | | | | | | |
| | | | | | |
| | | | | | |
Mineralys Therapeutics, Inc.† | | | | | | |
| | | | | | |
| | | | | | |
| | | | | | |
| | | | | | |
| | | | | | |
Omega Therapeutics, Inc.† | | | | | | |
ORIC Pharmaceuticals, Inc.† | | | | | | |
Outlook Therapeutics, Inc.† | | | | | | |
| | | | | | |
| | | | | | |
| | | | | | |
| | | | | | |
Point Biopharma Global, Inc.† | | | | | | |
Poseida Therapeutics, Inc.† | | | | | | |
| | | | | | |
Prelude Therapeutics, Inc.† | | | | | | |
| | | | | | |
| | | | | | |
Protagonist Therapeutics, Inc.† | | | | | | |
Protalix BioTherapeutics, Inc.† | | | | | | |
| | | | | | |
| | | | | | |
Recursion Pharmaceuticals, Inc. Class A† | | | | | | |
Reneo Pharmaceuticals, Inc.† | | | | | | |
REVOLUTION Medicines, Inc.† | | | | | | |
Rhythm Pharmaceuticals, Inc.† | | | | | | |
Rigel Pharmaceuticals, Inc.† | | | | | | |
Rocket Pharmaceuticals, Inc.† | | | | | | |
| | | | | | |
Sana Biotechnology, Inc.† | | | | | | |
Sangamo Therapeutics, Inc.† | | | | | | |
| | | | | | |
Selecta Biosciences, Inc.† | | | | | | |
Tango Therapeutics, Inc.† | | | | | | |
| | | | | | |
Travere Therapeutics, Inc.† | | | | | | |
| | | | | | |
Vanda Pharmaceuticals, Inc.† | | | | | | |
| | | | | | |
| | | | | | |
| | | | | | |
Viking Therapeutics, Inc.† | | | | | | |
The accompanying notes are an integral part of these financial statements.
Allspring Factor Enhanced U.S. Small Cap Equity Portfolio | 17
Portfolio of investments—August 31, 2023 (unaudited)
| | | | | |
Biotechnology (continued) | | | | | | |
| | | | | | |
Voyager Therapeutics, Inc.† | | | | | | |
| | | | | | |
Y-mAbs Therapeutics, Inc.† | | | | | | |
| | | | | | |
| | | | | | |
Health care equipment & supplies: 3.37% | | | | | | |
| | | | | | |
| | | | | | |
| | | | | | |
| | | | | | |
| | | | | | |
| | | | | | |
| | | | | | |
| | | | | | |
| | | | | | |
| | | | | | |
| | | | | | |
| | | | | | |
| | | | | | |
| | | | | | |
| | | | | | |
| | | | | | |
| | | | | | |
| | | | | | |
| | | | | | |
iRhythm Technologies, Inc.† | | | | | | |
| | | | | | |
| | | | | | |
| | | | | | |
Merit Medical Systems, Inc.† | | | | | | |
| | | | | | |
| | | | | | |
| | | | | | |
| | | | | | |
OraSure Technologies, Inc.† | | | | | | |
Orchestra BioMed Holdings, Inc.† | | | | | | |
| | | | | | |
| | | | | | |
| | | | | | |
| | | | | | |
| | | | | | |
Tactile Systems Technology, Inc.† | | | | | | |
| | | | | | |
Treace Medical Concepts, Inc.† | | | | | | |
| | | | | | |
Utah Medical Products, Inc. | | | | | | |
| | | | | | |
The accompanying notes are an integral part of these financial statements.
18 | Allspring Factor Enhanced U.S. Small Cap Equity Portfolio
Portfolio of investments—August 31, 2023 (unaudited)
| | | | | |
Health care equipment & supplies (continued) | | | | | | |
| | | | | | |
| | | | | | |
| | | | | | |
| | | | | | |
Health care providers & services: 2.62% | | | | | | |
| | | | | | |
| | | | | | |
| | | | | | |
AMN Healthcare Services, Inc.† | | | | | | |
Apollo Medical Holdings, Inc.† | | | | | | |
ATI Physical Therapy, Inc.† | | | | | | |
Brookdale Senior Living, Inc.† | | | | | | |
| | | | | | |
Community Health Systems, Inc.† | | | | | | |
| | | | | | |
Cross Country Healthcare, Inc.† | | | | | | |
| | | | | | |
| | | | | | |
| | | | | | |
| | | | | | |
Hims & Hers Health, Inc.† | | | | | | |
InfuSystem Holdings, Inc.† | | | | | | |
| | | | | | |
| | | | | | |
| | | | | | |
| | | | | | |
Option Care Health, Inc.† | | | | | | |
| | | | | | |
P3 Health Partners, Inc.† | | | | | | |
| | | | | | |
Pediatrix Medical Group, Inc.† | | | | | | |
| | | | | | |
| | | | | | |
Privia Health Group, Inc.† | | | | | | |
| | | | | | |
Quipt Home Medical Corp.† | | | | | | |
| | | | | | |
Select Medical Holdings Corp. | | | | | | |
| | | | | | |
| | | | | | |
Health care technology: 0.64% | | | | | | |
Computer Programs & Systems, Inc.† | | | | | | |
Evolent Health, Inc. Class A† | | | | | | |
| | | | | | |
| | | | | | |
| | | | | | |
NextGen Healthcare, Inc.† | | | | | | |
The accompanying notes are an integral part of these financial statements.
Allspring Factor Enhanced U.S. Small Cap Equity Portfolio | 19
Portfolio of investments—August 31, 2023 (unaudited)
| | | | | |
Health care technology (continued) | | | | | | |
| | | | | | |
| | | | | | |
| | | | | | |
| | | | | | |
| | | | | | |
| | | | | | |
Life sciences tools & services: 0.69% | | | | | | |
Adaptive Biotechnologies Corp.† | | | | | | |
| | | | | | |
| | | | | | |
| | | | | | |
| | | | | | |
| | | | | | |
Harvard Bioscience, Inc.† | | | | | | |
NanoString Technologies, Inc.† | | | | | | |
OmniAb, Inc. $12.5 Earnout shares♦† | | | | | | |
OmniAb, Inc. $15 Earnout shares♦† | | | | | | |
Pacific Biosciences of California, Inc.† | | | | | | |
| | | | | | |
| | | | | | |
| | | | | | |
| | | | | | |
Amneal Pharmaceuticals, Inc.† | | | | | | |
Amphastar Pharmaceuticals, Inc.† | | | | | | |
ANI Pharmaceuticals, Inc.† | | | | | | |
| | | | | | |
Axsome Therapeutics, Inc.† | | | | | | |
| | | | | | |
| | | | | | |
| | | | | | |
Citius Pharmaceuticals, Inc.† | | | | | | |
Collegium Pharmaceutical, Inc.† | | | | | | |
Corcept Therapeutics, Inc.† | | | | | | |
Enliven Therapeutics, Inc.† | | | | | | |
| | | | | | |
Harmony Biosciences Holdings, Inc.† | | | | | | |
| | | | | | |
| | | | | | |
Intra-Cellular Therapies, Inc.† | | | | | | |
Ligand Pharmaceuticals, Inc.† | | | | | | |
Longboard Pharmaceuticals, Inc.† | | | | | | |
Ocular Therapeutix, Inc.† | | | | | | |
Pacira BioSciences, Inc.† | | | | | | |
Phibro Animal Health Corp. Class A | | | | | | |
Prestige Consumer Healthcare, Inc.† | | | | | | |
Revance Therapeutics, Inc.† | | | | | | |
| | | | | | |
The accompanying notes are an integral part of these financial statements.
20 | Allspring Factor Enhanced U.S. Small Cap Equity Portfolio
Portfolio of investments—August 31, 2023 (unaudited)
| | | | | |
Pharmaceuticals (continued) | | | | | | |
| | | | | | |
Supernus Pharmaceuticals, Inc.† | | | | | | |
Taro Pharmaceutical Industries Ltd.† | | | | | | |
Third Harmonic Bio, Inc.† | | | | | | |
| | | | | | |
Verrica Pharmaceuticals, Inc.† | | | | | | |
Zevra Therapeutics, Inc.† | | | | | | |
| | | | | | |
| | | | | | |
Aerospace & defense: 1.11% | | | | | | |
| | | | | | |
| | | | | | |
| | | | | | |
| | | | | | |
| | | | | | |
| | | | | | |
Kratos Defense & Security Solutions, Inc.† | | | | | | |
| | | | | | |
| | | | | | |
National Presto Industries, Inc. | | | | | | |
| | | | | | |
| | | | | | |
| | | | | | |
| | | | | | |
| | | | | | |
| | | | | | |
| | | | | | |
Air freight & logistics: 0.15% | | | | | | |
| | | | | | |
| | | | | | |
| | | | | | |
| | | | | | |
| | | | | | |
| | | | | | |
| | | | | | |
| | | | | | |
| | | | | | |
Gibraltar Industries, Inc.† | | | | | | |
| | | | | | |
| | | | | | |
Janus International Group, Inc.† | | | | | | |
| | | | | | |
Masonite International Corp.† | | | | | | |
| | | | | | |
Quanex Building Products Corp. | | | | | | |
Resideo Technologies, Inc.† | | | | | | |
The accompanying notes are an integral part of these financial statements.
Allspring Factor Enhanced U.S. Small Cap Equity Portfolio | 21
Portfolio of investments—August 31, 2023 (unaudited)
| | | | | |
Building products (continued) | | | | | | |
Simpson Manufacturing Co., Inc. | | | | | | |
| | | | | | |
Zurn Elkay Water Solutions Corp. Class C | | | | | | |
| | | | | | |
Commercial services & supplies: 1.11% | | | | | | |
| | | | | | |
| | | | | | |
ACV Auctions, Inc. Class A† | | | | | | |
| | | | | | |
Casella Waste Systems, Inc. Class A† | | | | | | |
CECO Environmental Corp.† | | | | | | |
| | | | | | |
| | | | | | |
| | | | | | |
| | | | | | |
| | | | | | |
| | | | | | |
Healthcare Services Group, Inc.† | | | | | | |
| | | | | | |
Matthews International Corp. Class A | | | | | | |
| | | | | | |
| | | | | | |
| | | | | | |
| | | | | | |
| | | | | | |
| | | | | | |
| | | | | | |
| | | | | | |
Construction & engineering: 1.11% | | | | | | |
| | | | | | |
| | | | | | |
| | | | | | |
Comfort Systems USA, Inc. | | | | | | |
Construction Partners, Inc. Class A† | | | | | | |
| | | | | | |
| | | | | | |
Granite Construction, Inc. | | | | | | |
| | | | | | |
| | | | | | |
| | | | | | |
| | | | | | |
Sterling Infrastructure, Inc.† | | | | | | |
| | | | | | |
Electrical equipment: 2.49% | | | | | | |
Allied Motion Technologies, Inc. | | | | | | |
Amprius Technologies, Inc.† | | | | | | |
The accompanying notes are an integral part of these financial statements.
22 | Allspring Factor Enhanced U.S. Small Cap Equity Portfolio
Portfolio of investments—August 31, 2023 (unaudited)
| | | | | |
Electrical equipment (continued) | | | | | | |
Array Technologies, Inc.† | | | | | | |
| | | | | | |
Babcock & Wilcox Enterprises, Inc.† | | | | | | |
Bloom Energy Corp. Class A† | | | | | | |
Dragonfly Energy Holdings Corp.† | | | | | | |
| | | | | | |
Energy Vault Holdings, Inc.† | | | | | | |
| | | | | | |
| | | | | | |
| | | | | | |
| | | | | | |
| | | | | | |
GrafTech International Ltd.† | | | | | | |
| | | | | | |
NEXTracker, Inc. Class A† | | | | | | |
| | | | | | |
Preformed Line Products Co. | | | | | | |
Shoals Technologies Group, Inc. Class A† | | | | | | |
| | | | | | |
| | | | | | |
Thermon Group Holdings, Inc.† | | | | | | |
| | | | | | |
| | | | | | |
| | | | | | |
Ground transportation: 0.45% | | | | | | |
| | | | | | |
Covenant Logistics Group, Inc. | | | | | | |
| | | | | | |
FTAI Infrastructure, Inc. | | | | | | |
| | | | | | |
| | | | | | |
Universal Logistics Holdings, Inc. | | | | | | |
| | | | | | |
| | | | | | |
| | | | | | |
| | | | | | |
Albany International Corp. Class A | | | | | | |
| | | | | | |
| | | | | | |
Briggs & Stratton Corp.♦† | | | | | | |
| | | | | | |
| | | | | | |
Commercial Vehicle Group, Inc.† | | | | | | |
| | | | | | |
| | | | | | |
| | | | | | |
| | | | | | |
The accompanying notes are an integral part of these financial statements.
Allspring Factor Enhanced U.S. Small Cap Equity Portfolio | 23
Portfolio of investments—August 31, 2023 (unaudited)
| | | | | |
| | | | | | |
| | | | | | |
| | | | | | |
Franklin Electric Co., Inc. | | | | | | |
| | | | | | |
| | | | | | |
Helios Technologies, Inc. | | | | | | |
| | | | | | |
| | | | | | |
Hyster-Yale Materials Handling, Inc. | | | | | | |
John Bean Technologies Corp. | | | | | | |
| | | | | | |
| | | | | | |
| | | | | | |
Mayville Engineering Co., Inc.† | | | | | | |
| | | | | | |
| | | | | | |
Mueller Water Products, Inc. Class A | | | | | | |
| | | | | | |
| | | | | | |
| | | | | | |
| | | | | | |
Standex International Corp. | | | | | | |
| | | | | | |
| | | | | | |
Titan International, Inc.† | | | | | | |
| | | | | | |
| | | | | | |
| | | | | | |
Watts Water Technologies, Inc. Class A | | | | | | |
| | | | | | |
Marine transportation: 0.02% | | | | | | |
| | | | | | |
| | | | | | |
| | | | | | |
Passenger airlines: 0.37% | | | | | | |
| | | | | | |
Blade Air Mobility, Inc.† | | | | | | |
Frontier Group Holdings, Inc.† | | | | | | |
| | | | | | |
| | | | | | |
| | | | | | |
Sun Country Airlines Holdings, Inc.† | | | | | | |
| | | | | | |
Professional services: 2.15% | | | | | | |
| | | | | | |
| | | | | | |
The accompanying notes are an integral part of these financial statements.
24 | Allspring Factor Enhanced U.S. Small Cap Equity Portfolio
Portfolio of investments—August 31, 2023 (unaudited)
| | | | | |
Professional services (continued) | | | | | | |
| | | | | | |
Barrett Business Services, Inc. | | | | | | |
| | | | | | |
| | | | | | |
CSG Systems International, Inc. | | | | | | |
ExlService Holdings, Inc.† | | | | | | |
| | | | | | |
Heidrick & Struggles International, Inc. | | | | | | |
Huron Consulting Group, Inc.† | | | | | | |
| | | | | | |
| | | | | | |
| | | | | | |
| | | | | | |
Kelly Services, Inc. Class A | | | | | | |
| | | | | | |
| | | | | | |
| | | | | | |
| | | | | | |
| | | | | | |
| | | | | | |
| | | | | | |
| | | | | | |
| | | | | | |
| | | | | | |
Trading companies & distributors: 1.36% | | | | | | |
Applied Industrial Technologies, Inc. | | | | | | |
Beacon Roofing Supply, Inc.† | | | | | | |
| | | | | | |
| | | | | | |
| | | | | | |
| | | | | | |
| | | | | | |
H&E Equipment Services, Inc. | | | | | | |
| | | | | | |
Hudson Technologies, Inc.† | | | | | | |
| | | | | | |
| | | | | | |
| | | | | | |
Rush Enterprises, Inc. Class A | | | | | | |
Rush Enterprises, Inc. Class B | | | | | | |
Textainer Group Holdings Ltd. | | | | | | |
| | | | | | |
| | | | | | |
Information technology: 14.07% | | | | | | |
Communications equipment: 0.49% | | | | | | |
| | | | | | |
| | | | | | |
The accompanying notes are an integral part of these financial statements.
Allspring Factor Enhanced U.S. Small Cap Equity Portfolio | 25
Portfolio of investments—August 31, 2023 (unaudited)
| | | | | |
Communications equipment (continued) | | | | | | |
| | | | | | |
CommScope Holding Co., Inc.† | | | | | | |
Comtech Telecommunications Corp. | | | | | | |
Digi International, Inc.† | | | | | | |
| | | | | | |
| | | | | | |
| | | | | | |
| | | | | | |
Ribbon Communications, Inc.† | | | | | | |
| | | | | | |
Electronic equipment, instruments & components: 2.64% | | | | | | |
Advanced Energy Industries, Inc. | | | | | | |
| | | | | | |
| | | | | | |
| | | | | | |
Benchmark Electronics, Inc. | | | | | | |
Climb Global Solutions, Inc. | | | | | | |
| | | | | | |
| | | | | | |
| | | | | | |
| | | | | | |
Insight Enterprises, Inc.† | | | | | | |
| | | | | | |
| | | | | | |
Kimball Electronics, Inc.† | | | | | | |
Methode Electronics, Inc. | | | | | | |
Mirion Technologies, Inc.† | | | | | | |
Napco Security Technologies, Inc. | | | | | | |
| | | | | | |
| | | | | | |
| | | | | | |
| | | | | | |
| | | | | | |
Richardson Electronics Ltd. | | | | | | |
| | | | | | |
| | | | | | |
| | | | | | |
| | | | | | |
Vishay Intertechnology, Inc. | | | | | | |
Vishay Precision Group, Inc.† | | | | | | |
| | | | | | |
| | | | | | |
BigBear.ai Holdings, Inc.† | | | | | | |
BigCommerce Holdings, Inc.† | | | | | | |
| | | | | | |
Core Scientific, Inc. Class A† | | | | | | |
DigitalOcean Holdings, Inc.† | | | | | | |
The accompanying notes are an integral part of these financial statements.
26 | Allspring Factor Enhanced U.S. Small Cap Equity Portfolio
Portfolio of investments—August 31, 2023 (unaudited)
| | | | | |
| | | | | | |
| | | | | | |
| | | | | | |
Information Services Group, Inc. | | | | | | |
| | | | | | |
Rackspace Technology, Inc.† | | | | | | |
Squarespace, Inc. Class A† | | | | | | |
Thoughtworks Holding, Inc.† | | | | | | |
| | | | | | |
| | | | | | |
| | | | | | |
Semiconductors & semiconductor equipment: 3.14% | | | | | | |
ACM Research, Inc. Class A† | | | | | | |
| | | | | | |
Alpha & Omega Semiconductor Ltd.† | | | | | | |
| | | | | | |
| | | | | | |
Axcelis Technologies, Inc.† | | | | | | |
| | | | | | |
| | | | | | |
| | | | | | |
| | | | | | |
| | | | | | |
Kulicke & Soffa Industries, Inc. | | | | | | |
MACOM Technology Solutions Holdings, Inc.† | | | | | | |
| | | | | | |
| | | | | | |
| | | | | | |
| | | | | | |
| | | | | | |
| | | | | | |
| | | | | | |
Silicon Laboratories, Inc.† | | | | | | |
SMART Global Holdings, Inc.† | | | | | | |
| | | | | | |
| | | | | | |
Ultra Clean Holdings, Inc.† | | | | | | |
| | | | | | |
| | | | | | |
| | | | | | |
| | | | | | |
| | | | | | |
| | | | | | |
| | | | | | |
| | | | | | |
Altair Engineering, Inc. Class A† | | | | | | |
| | | | | | |
| | | | | | |
The accompanying notes are an integral part of these financial statements.
Allspring Factor Enhanced U.S. Small Cap Equity Portfolio | 27
Portfolio of investments—August 31, 2023 (unaudited)
| | | | | |
| | | | | | |
| | | | | | |
| | | | | | |
| | | | | | |
| | | | | | |
| | | | | | |
| | | | | | |
| | | | | | |
| | | | | | |
Clear Secure, Inc. Class A | | | | | | |
| | | | | | |
Consensus Cloud Solutions, Inc.† | | | | | | |
| | | | | | |
| | | | | | |
| | | | | | |
| | | | | | |
| | | | | | |
E2open Parent Holdings, Inc.† | | | | | | |
| | | | | | |
| | | | | | |
| | | | | | |
| | | | | | |
| | | | | | |
Freshworks, Inc. Class A† | | | | | | |
| | | | | | |
| | | | | | |
| | | | | | |
| | | | | | |
| | | | | | |
Marathon Digital Holdings, Inc.† | | | | | | |
| | | | | | |
| | | | | | |
MicroStrategy, Inc. Class A† | | | | | | |
| | | | | | |
| | | | | | |
| | | | | | |
| | | | | | |
| | | | | | |
| | | | | | |
PowerSchool Holdings, Inc. Class A† | | | | | | |
| | | | | | |
| | | | | | |
| | | | | | |
| | | | | | |
| | | | | | |
| | | | | | |
| | | | | | |
Sapiens International Corp. NV | | | | | | |
| | | | | | |
| | | | | | |
The accompanying notes are an integral part of these financial statements.
28 | Allspring Factor Enhanced U.S. Small Cap Equity Portfolio
Portfolio of investments—August 31, 2023 (unaudited)
| | | | | |
| | | | | | |
Sprout Social, Inc. Class A† | | | | | | |
| | | | | | |
| | | | | | |
| | | | | | |
| | | | | | |
| | | | | | |
Viant Technology, Inc. Class A† | | | | | | |
| | | | | | |
| | | | | | |
| | | | | | |
Zeta Global Holdings Corp. Class A† | | | | | | |
| | | | | | |
| | | | | | |
Technology hardware, storage & peripherals: 0.72% | | | | | | |
| | | | | | |
| | | | | | |
| | | | | | |
| | | | | | |
| | | | | | |
Super Micro Computer, Inc.† | | | | | | |
| | | | | | |
| | | | | | |
| | | | | | |
| | | | | | |
| | | | | | |
| | | | | | |
| | | | | | |
| | | | | | |
Core Molding Technologies, Inc.† | | | | | | |
| | | | | | |
| | | | | | |
| | | | | | |
| | | | | | |
| | | | | | |
| | | | | | |
| | | | | | |
| | | | | | |
| | | | | | |
| | | | | | |
Minerals Technologies, Inc. | | | | | | |
Orion Engineered Carbons SA | | | | | | |
| | | | | | |
Rayonier Advanced Materials, Inc.† | | | | | | |
Sensient Technologies Corp. | | | | | | |
| | | | | | |
| | | | | | |
The accompanying notes are an integral part of these financial statements.
Allspring Factor Enhanced U.S. Small Cap Equity Portfolio | 29
Portfolio of investments—August 31, 2023 (unaudited)
| | | | | |
| | | | | | |
| | | | | | |
| | | | | | |
| | | | | | |
Construction materials: 0.18% | | | | | | |
| | | | | | |
Summit Materials, Inc. Class A† | | | | | | |
U.S. Lime & Minerals, Inc. | | | | | | |
| | | | | | |
Containers & packaging: 0.24% | | | | | | |
| | | | | | |
| | | | | | |
| | | | | | |
| | | | | | |
| | | | | | |
Alpha Metallurgical Resources, Inc. | | | | | | |
| | | | | | |
| | | | | | |
Caledonia Mining Corp. PLC | | | | | | |
Carpenter Technology Corp. | | | | | | |
| | | | | | |
| | | | | | |
Compass Minerals International, Inc. | | | | | | |
| | | | | | |
Haynes International, Inc. | | | | | | |
| | | | | | |
| | | | | | |
| | | | | | |
| | | | | | |
| | | | | | |
Ramaco Resources, Inc. Class A | | | | | | |
| | | | | | |
Schnitzer Steel Industries, Inc. Class A | | | | | | |
| | | | | | |
| | | | | | |
| | | | | | |
| | | | | | |
Worthington Industries, Inc. | | | | | | |
| | | | | | |
Paper & forest products: 0.07% | | | | | | |
| | | | | | |
| | | | | | |
| | | | | | |
Alexander & Baldwin, Inc. | | | | | | |
Alpine Income Property Trust, Inc. | | | | | | |
The accompanying notes are an integral part of these financial statements.
30 | Allspring Factor Enhanced U.S. Small Cap Equity Portfolio
Portfolio of investments—August 31, 2023 (unaudited)
| | | | | |
Diversified REITs (continued) | | | | | | |
American Assets Trust, Inc. | | | | | | |
Armada Hoffler Properties, Inc. | | | | | | |
Broadstone Net Lease, Inc. | | | | | | |
Empire State Realty Trust, Inc. Class A | | | | | | |
Essential Properties Realty Trust, Inc. | | | | | | |
| | | | | | |
| | | | | | |
| | | | | | |
| | | | | | |
| | | | | | |
| | | | | | |
Global Medical REIT, Inc. | | | | | | |
| | | | | | |
National Health Investors, Inc. | | | | | | |
| | | | | | |
Sabra Health Care REIT, Inc. | | | | | | |
Universal Health Realty Income Trust | | | | | | |
| | | | | | |
Hotel & resort REITs: 1.23% | | | | | | |
Apple Hospitality REIT, Inc. | | | | | | |
Braemar Hotels & Resorts, Inc. | | | | | | |
| | | | | | |
DiamondRock Hospitality Co. | | | | | | |
Hersha Hospitality Trust Class A | | | | | | |
| | | | | | |
| | | | | | |
Ryman Hospitality Properties, Inc. | | | | | | |
| | | | | | |
Summit Hotel Properties, Inc. | | | | | | |
Sunstone Hotel Investors, Inc. | | | | | | |
Xenia Hotels & Resorts, Inc. | | | | | | |
| | | | | | |
| | | | | | |
Innovative Industrial Properties, Inc. | | | | | | |
| | | | | | |
Plymouth Industrial REIT, Inc. | | | | | | |
| | | | | | |
| | | | | | |
| | | | | | |
Corporate Office Properties Trust | | | | | | |
| | | | | | |
| | | | | | |
| | | | | | |
Office Properties Income Trust | | | | | | |
| | | | | | |
The accompanying notes are an integral part of these financial statements.
Allspring Factor Enhanced U.S. Small Cap Equity Portfolio | 31
Portfolio of investments—August 31, 2023 (unaudited)
| | | | | |
| | | | | | |
Piedmont Office Realty Trust, Inc. Class A | | | | | | |
| | | | | | |
| | | | | | |
Real estate management & development: 0.96% | | | | | | |
American Realty Investors, Inc.† | | | | | | |
Anywhere Real Estate, Inc.† | | | | | | |
| | | | | | |
| | | | | | |
DigitalBridge Group, Inc. | | | | | | |
| | | | | | |
| | | | | | |
| | | | | | |
Newmark Group, Inc. Class A | | | | | | |
Opendoor Technologies, Inc.† | | | | | | |
| | | | | | |
| | | | | | |
| | | | | | |
Transcontinental Realty Investors, Inc.† | | | | | | |
| | | | | | |
Residential REITs : 0.24% | | | | | | |
Apartment Investment & Management Co. Class A | | | | | | |
| | | | | | |
| | | | | | |
| | | | | | |
Independence Realty Trust, Inc. | | | | | | |
| | | | | | |
| | | | | | |
| | | | | | |
| | | | | | |
| | | | | | |
CBL & Associates Properties, Inc. | | | | | | |
| | | | | | |
InvenTrust Properties Corp. | | | | | | |
| | | | | | |
| | | | | | |
Phillips Edison & Co., Inc. | | | | | | |
Retail Opportunity Investments Corp. | | | | | | |
| | | | | | |
| | | | | | |
Tanger Factory Outlet Centers, Inc. | | | | | | |
| | | | | | |
| | | | | | |
| | | | | | |
Specialized REITs : 0.43% | | | | | | |
| | | | | | |
The accompanying notes are an integral part of these financial statements.
32 | Allspring Factor Enhanced U.S. Small Cap Equity Portfolio
Portfolio of investments—August 31, 2023 (unaudited)
| | | | | |
Specialized REITs (continued) | | | | | | |
Four Corners Property Trust, Inc. | | | | | | |
| | | | | | |
| | | | | | |
| | | | | | |
| | | | | | |
| | | | | | |
Electric utilities: 0.48% | | | | | | |
| | | | | | |
Genie Energy Ltd. Class B | | | | | | |
| | | | | | |
| | | | | | |
Portland General Electric Co. | | | | | | |
| | | | | | |
| | | | | | |
Brookfield Infrastructure Corp. Class A | | | | | | |
Chesapeake Utilities Corp. | | | | | | |
New Jersey Resources Corp. | | | | | | |
Northwest Natural Holding Co. | | | | | | |
| | | | | | |
| | | | | | |
| | | | | | |
| | | | | | |
Independent power and renewable electricity producers: 0.43% | | | | | | |
| | | | | | |
Montauk Renewables, Inc.† | | | | | | |
| | | | | | |
Sunnova Energy International, Inc.† | | | | | | |
| | | | | | |
| | | | | | |
| | | | | | |
| | | | | | |
| | | | | | |
| | | | | | |
| | | | | | |
| | | | | | |
American States Water Co. | | | | | | |
California Water Service Group | | | | | | |
| | | | | | |
| | | | | | |
| | | | | | |
Total common stocks (Cost $103,715,039) | | | | | | |
The accompanying notes are an integral part of these financial statements.
Allspring Factor Enhanced U.S. Small Cap Equity Portfolio | 33
Portfolio of investments—August 31, 2023 (unaudited)
| | | | | |
Short-term investments: 4.16% | | | | | | |
Investment companies: 4.16% | | | | | | |
Allspring Government Money Market Fund Select Class♠∞ | | | | | | |
Total short-term investments (Cost $5,041,771) | | | | | | |
Total investments in securities (Cost $108,756,810) | | | | | | |
Other assets and liabilities, net | | | | | | |
| | | | | | |
| Non-income-earning security |
| The security is fair valued in accordance with procedures approved by the Board of Trustees. |
| Security is valued using significant unobservable inputs. |
| The issuer of the security is an affiliated person of the Portfolio as defined in the Investment Company Act of 1940. |
| The rate represents the 7-day annualized yield at period end. |
|
| Real estate investment trust |
Investments in affiliates
An affiliated investment is an investment in which the Portfolio owns at least 5% of the outstanding voting shares of the issuer or as a result of other relationships, such as the Portfolio and the issuer having the same adviser or investment manager. Transactions with issuers that were affiliates of the Portfolio at the end of the period were as follows:
| | | | | Net
change in
unrealized
gains
(losses) | | | Income
from
affiliated
securities |
| | | | | | | | |
Allspring Government Money Market Fund Select Class | | | | | | | | |
Futures contracts
| | | | | | |
| | | | | | |
E-Mini Russell 2000 Index | | | | | | |
The accompanying notes are an integral part of these financial statements.
34 | Allspring Factor Enhanced U.S. Small Cap Equity Portfolio
Statement of assets and liabilities—August 31, 2023 (unaudited)
Financial statements
Statement of assets and liabilities
| |
Investments in unaffiliated securities, at value (cost $103,715,039) | |
Investments in affiliated securities, at value (cost $5,041,771) | |
| |
Cash at broker segregated for futures contracts | |
| |
Prepaid expenses and other assets | |
| |
| |
Custody and accounting fees payable | |
Professional fees payable | |
Payable for daily variation margin on open futures contracts | |
| |
Interest holder report expenses payable | |
Trustees’ fees and expenses payable | |
Accrued expenses and other liabilities | |
| |
| |
The accompanying notes are an integral part of these financial statements.
Allspring Factor Enhanced U.S. Small Cap Equity Portfolio | 35
Statement of operations—six months ended August 31, 2023 (unaudited)
Statement of operations
| |
Dividends (net of foreign withholdings taxes of $2,242) | |
Income from affiliated securities | |
| |
| |
| |
| |
Custody and accounting fees | |
| |
Interest holder report expenses | |
Trustees’ fees and expenses | |
| |
| |
Less: Fee waivers and/or expense reimbursements | |
| |
| |
Realized and unrealized gains (losses) on investments | |
Net realized gains (losses) on | |
| |
| |
Net realized losses on investments | |
Net change in unrealized gains (losses) on | |
| |
| |
Net change in unrealized gains (losses) on investments | |
Net realized and unrealized gains (losses) on investments | |
Net increase in net assets resulting from operations | |
The accompanying notes are an integral part of these financial statements.
36 | Allspring Factor Enhanced U.S. Small Cap Equity Portfolio
Statement of changes in net assets
Statement of changes in net assets
|
Six months ended
August 31, 2023 (unaudited) | Year ended February 28, 2023 |
| | | | |
| | | | |
Net realized losses on investments | | | | |
Net change in unrealized gains (losses) on investments | | | | |
Net increase (decrease) in net assets resulting from operations | | | | |
| | | | |
Transactions in investors’ beneficial interests | | | | |
| | | | |
| | | | |
Net decrease in net assets resulting from capital transactions | | | | |
Total decrease in net assets | | | | |
| | | | |
| | | | |
| | | | |
The accompanying notes are an integral part of these financial statements.
Allspring Factor Enhanced U.S. Small Cap Equity Portfolio | 37
| Six months ended
August 31, 2023
(unaudited) | |
| | | | | |
| | | | | | |
Ratios to average net assets (annualized) | | | | | | |
| | | | | | |
| | | | | | |
| | | | | | |
| | | | | | |
| | | | | | |
| Ratio includes expenses which were voluntarily waived by the adviser. Without these voluntary waivers, the net expense ratios would be increased by the following amounts: |
Six months ended August 31, 2023 (unaudited) | |
Year ended February 28, 2023 | |
Year ended February 28, 2022 | |
Year ended February 28, 2021 | |
| |
| Returns for periods of less than one year are not annualized. |
The accompanying notes are an integral part of these financial statements.
38 | Allspring Factor Enhanced U.S. Small Cap Equity Portfolio
Notes to financial statements (unaudited)
Notes to financial statements
Allspring Master Trust (the “Trust”), a Delaware statutory trust organized on March 10, 1999, is an open-end management investment company registered under the Investment Company Act of 1940, as amended (the “1940 Act”). As an investment company, the Trust follows the accounting and reporting guidance in Financial Accounting Standards Board (“FASB”) Accounting Standards Codification Topic 946, Financial Services – Investment Companies. These financial statements report on the Allspring Factor Enhanced U.S. Small Cap Equity Portfolio (the “Portfolio”) which is a diversified series of the Trust.
Interests in the Portfolio are available solely through private placement transactions that do not involve any “public offering” within the meaning of Section 4(a)(2) of the Securities Act of 1933.
2.
SIGNIFICANT ACCOUNTING POLICIES
The following significant accounting policies, which are consistently followed in the preparation of the financial statements of the Portfolio, are in conformity with U.S. generally accepted accounting principles which require management to make estimates and assumptions that affect the reported amounts of assets and liabilities, disclosure of contingent assets and liabilities at the date of the financial statements, and the reported amounts of income and expenses during the reporting period. Actual results could differ from those estimates.
Securities valuation
All investments are valued each business day as of the close of regular trading on the New York Stock Exchange (generally 4 p.m. Eastern Time), although the Portfolio may deviate from this calculation time under unusual or unexpected circumstances.
Equity securities and futures contracts that are listed on a foreign or domestic exchange or market are valued at the official closing price or, if none, the last sales price.
Investments in registered open-end investment companies (other than those listed on a foreign or domestic exchange or market) are valued at net asset value.
Investments which are not valued using the methods discussed above are valued at their fair value, as determined in good faith by Allspring Funds Management, LLC (“Allspring Funds Management”), which was named the valuation designee by the Board of Trustees. As the valuation designee, Allspring Funds Management is responsible for day-to-day valuation activities for the Allspring Funds. In connection with these responsibilities, Allspring Funds Management has established a Valuation Committee and has delegated to it the authority to take any actions regarding the valuation of portfolio securities that the Valuation Committee deems necessary or appropriate, including determining the fair value of portfolio securities. On a quarterly basis, the Board of Trustees receives reports of valuation actions taken by the Valuation Committee. On at least an annual basis, the Board of Trustees receives an assessment of the adequacy and effectiveness of Allspring Funds Management’s process for determining the fair value of the portfolio of investments.
Futures contracts
Futures contracts are agreements between the Portfolio and a counterparty to buy or sell a specific amount of a commodity, financial instrument or currency at a specified price and on a specified date. The Portfolio may buy and sell futures contracts in order to gain exposure to, or protect against, changes in security values and is subject to equity price risk. The primary risks associated with the use of futures contracts are the imperfect correlation between changes in market values of securities held by the Portfolio and the prices of futures contracts, and the possibility of an illiquid market. Futures contracts are generally entered into on a regulated futures exchange and cleared through a clearinghouse associated with the exchange. With futures contracts, there is minimal counterparty risk to the Portfolio since futures contracts are exchange-traded and the exchange’s clearinghouse, as the counterparty to all exchange-traded futures, guarantees the futures contracts against default.
Upon entering into a futures contract, the Portfolio is required to deposit either cash or securities (initial margin) with the broker in an amount equal to a certain percentage of the contract value. Subsequent payments (variation margin) are paid to or received from the broker each day equal to the daily changes in the contract value. Such payments are recorded as unrealized gains or losses and, if any, shown as variation margin receivable (payable) in the Statement of Assets and Liabilities. Should the Portfolio fail to make requested variation margin payments, the broker can gain access to the initial margin to satisfy the Portfolio’s payment obligations. When the contracts are closed, a realized gain or loss is recorded in the Statement of Operations.
Security transactions and income recognition
Securities transactions are recorded on a trade date basis. Realized gains or losses are recorded on the basis of identified cost.
Dividend income is recognized on the ex-dividend date. Dividend income is recorded net of foreign taxes withheld where recovery of such taxes is not assured.
Distributions received from REIT investments may be characterized as ordinary income, capital gains, or a return of capital to the Portfolio based on information provided by the REIT. The proper characterization of REIT distributions is generally not known until after the end of each calendar year. As such, estimates may be used in reporting the character of income and distributions for financial statement purposes.
Allspring Factor Enhanced U.S. Small Cap Equity Portfolio | 39
Notes to financial statements (unaudited)
Federal and other taxes
The Portfolio is not required to pay federal income taxes on its net investment income and net capital gains as it is treated as a partnership for federal income tax purposes. All income, gains and losses of the Portfolio are deemed to have been “passed through” to the interest holders in proportion to their holdings of the Portfolio regardless of whether income and gains have been distributed by the Portfolio.
The Portfolio’s income tax returns and all financial records supporting those returns for the prior three fiscal years are subject to examination by the federal revenue authority. Management has analyzed the Portfolio’s tax positions taken on federal, state, and foreign tax returns, as applicable, for all open tax years and does not believe that there are any uncertain tax positions that require recognition of a tax liability.
As of August 31, 2023, the aggregate cost of all investments for federal income tax purposes was $109,290,371 and the unrealized gains (losses) consisted of:
3.
FAIR VALUATION MEASUREMENTS
Fair value measurements of investments are determined within a framework that has established a fair value hierarchy based upon the various data inputs utilized in determining the value of the Portfolio’s investments. The three-level hierarchy gives the highest priority to unadjusted quoted prices in active markets for identical assets or liabilities (Level 1) and the lowest priority to unobservable inputs (Level 3). The Portfolio’s investments are classified within the fair value hierarchy based on the lowest level of input that is significant to the fair value measurement. The inputs are summarized into three broad levels as follows:
•Level 1—quoted prices in active markets for identical securities
•Level 2—other significant observable inputs (including quoted prices for similar securities, interest rates, prepayment speeds, credit risk, etc.)
•Level 3—significant unobservable inputs (including the Portfolio’s own assumptions in determining the fair value of investments)
The inputs or methodologies used for valuing investments in securities are not necessarily an indication of the risk associated with investing in those securities.
The following is a summary of the inputs used in valuing the Portfolio’s assets and liabilities as of August 31, 2023:
| | Other significant
observable inputs
(Level 2) | Significant
unobservable inputs
(Level 3) | |
| | | | |
| | | | |
| | | | |
| | | | |
| | | | |
| | | | |
| | | | |
| | | | |
| | | | |
| | | | |
| | | | |
| | | | |
| | | | |
| | | | |
| | | | |
| | | | |
| | | | |
|
| | | | |
| | | | |
40 | Allspring Factor Enhanced U.S. Small Cap Equity Portfolio
Notes to financial statements (unaudited)
Futures contracts are reported at their cumulative unrealized gains (losses) at measurement date as reported in the table following the Portfolio of Investments. For futures contracts, the current day’s variation margin is reported on the Statement of Assets and Liabilities. All other assets and liabilities are reported at their market value at measurement date.
Additional sector, industry or geographic detail, if any, is included in the Portfolio of Investments.
For the six months ended August 31, 2023, the Portfolio did not have any transfers into/out of Level 3.
4.
TRANSACTIONS WITH AFFILIATES
Advisory fee
The Trust has entered into an advisory contract with Allspring Funds Management, a wholly owned subsidiary of Allspring Global Investments Holdings, LLC, a holding company indirectly owned by certain private funds of GTCR LLC and Reverence Capital Partners, L.P. The adviser is responsible for implementing investment policies and guidelines and for supervising the subadviser, who is responsible for day-to-day portfolio management of the Portfolio. Pursuant to the contract, Allspring Funds Management is entitled to receive an advisory fee at the following annual rate based on the Portfolio’s average daily net assets:
For the six months ended August 31, 2023, the advisory fee was equivalent to an annual rate of 0.15% of the Portfolio’s average daily net assets.
Allspring Funds Management has retained the services of a subadviser to provide daily portfolio management to the Portfolio. The fee for subadvisory services is borne by Allspring Funds Management. Allspring Global Investments, LLC, an affiliate of Allspring Funds Management and a wholly owned subsidiary of Allspring Global Investments Holdings, LLC, is the subadviser to the Portfolio and is entitled to receive a fee from Allspring Funds Management at an annual rate starting at 0.08% and declining to 0.05% as the average daily net assets of the Portfolio increase.
Allspring Funds Management has voluntarily waived and/or reimbursed expenses to reduce the net operating expense ratio of the Portfolio. These voluntary waivers may be discontinued at any time.
Interfund transactions
The Portfolio may purchase or sell portfolio investment securities to certain affiliates pursuant to Rule 17a-7 under the 1940 Act and under procedures adopted by the Board of Trustees. The procedures have been designed to ensure that these interfund transactions, which do not incur broker commissions, are effected at current market prices. Pursuant to these procedures, the Portfolio did not have any interfund transactions during the six months ended August 31, 2023.
5.
INVESTMENT PORTFOLIO TRANSACTIONS
Purchases and sales of investments, excluding U.S. government obligations (if any) and short-term securities, for the six months ended August 31, 2023 were $53,178,650 and $55,014,495, respectively.
6.
DERIVATIVE TRANSACTIONS
During the six months ended August 31, 2023, the Portfolio entered into futures contracts to gain market exposure. The Portfolio had an average notional amount of $4,476,754 in long futures contracts during the six months ended August 31, 2023.
The fair value, realized gains or losses and change in unrealized gains or losses, if any, on derivative instruments are reflected in the corresponding financial statement captions.
The Trust, along with Allspring Variable Trust and Allspring Funds Trust (excluding the money market funds), are parties to a $350,000,000 revolving credit agreement whereby the Portfolio is permitted to use bank borrowings for temporary or emergency purposes, such as to fund interest holders withdrawal requests. Interest under the credit agreement is charged to the Portfolio based on a borrowing rate equal to the higher of the Federal Funds rate or the overnight bank funding rate in effect on that day plus a spread. In addition, an annual commitment fee based on the unused balance is allocated to each participating fund.
For the six months ended August 31, 2023, there were no borrowings by the Portfolio under the agreement.
Allspring Factor Enhanced U.S. Small Cap Equity Portfolio | 41
Notes to financial statements (unaudited)
Under the Portfolio’s organizational documents, the officers and Trustees have been granted certain indemnification rights against certain liabilities that may arise out of performance of their duties to the Portfolio. The Portfolio has entered into a separate agreement with each Trustee that converts indemnification rights currently existing under the Portfolio’s organizational documents into contractual rights that cannot be changed in the future without the consent of the Trustee. Additionally, in the normal course of business, the Portfolio may enter into contracts with service providers that contain a variety of indemnification clauses. The Portfolio’s maximum exposure under these arrangements is dependent on future claims that may be made against the Portfolio and, therefore, cannot be estimated.
42 | Allspring Factor Enhanced U.S. Small Cap Equity Portfolio
Other information (unaudited)
Other information
Proxy voting information
A description of the policies and procedures used to determine how to vote proxies relating to portfolio securities is available without charge, upon request, by calling 1-866-259-3305, visiting our website at allspringglobal.com, or visiting the SEC website at sec.gov. Information regarding how the proxies related to portfolio securities were voted during the most recent 12-month period ended June 30 is available on the website at allspringglobal.com or by visiting the SEC website at sec.gov.
Quarterly portfolio holdings information
The Portfolio files its complete schedule of portfolio holdings with the SEC for the first and third quarters of each fiscal year as an exhibit to its reports on Form N-PORT. Interest holders may view the filed Form N-PORT by visiting the SEC website at sec.gov.
Allspring Factor Enhanced U.S. Small Cap Equity Portfolio | 43
Other information (unaudited)
Board of trustees and officers
Each of the Trustees and Officers listed in the table below acts in identical capacities for each fund in the Allspring family of funds, which consists of 126 mutual funds comprising the Allspring Funds Trust, Allspring Variable Trust, Allspring Master Trust and four closed-end funds (collectively the “Fund Complex”). This table should be read in conjunction with the Prospectus and the Statement of Additional Information1. The mailing address of each Trustee and Officer is 1415 Vantage Park Drive, 3rd Floor, Charlotte, NC 28203. Each Trustee and Officer serves an indefinite term, however, each Trustee serves such term until reaching the mandatory retirement age established by the Trustees.
Independent Trustees
| | Principal occupations during past five years or longer | Current other
public company or
investment
company
directorships |
William R. Ebsworth
(Born 1957) | | Retired. From 1984 to 2013, equities analyst, portfolio manager, research director and chief investment officer at Fidelity Management and Research Company in Boston, Tokyo, and Hong Kong, and retired in 2013 as Chief Investment Officer of Fidelity Strategic Advisers, Inc. where he led a team of investment professionals managing client assets. Prior thereto, Board member of Hong Kong Securities Clearing Co., Hong Kong Options Clearing Corp., the Thailand International Fund, Ltd., Fidelity Investments Life Insurance Company, and Empire Fidelity Investments Life Insurance Company. Audit Committee Chair and Investment Committee Chair of the Vincent Memorial Hospital Foundation (non-profit organization). Mr. Ebsworth is a CFA charterholder. | |
Jane A. Freeman
(Born 1953) | Trustee,
since 2015;
Chair Liaison,
since 2018 | Retired. From 2012 to 2014 and 1999 to 2008, Chief Financial Officer of Scientific Learning Corporation. From 2008 to 2012, Ms. Freeman provided consulting services related to strategic business projects. Prior to 1999, Portfolio Manager at Rockefeller & Co. and Scudder, Stevens & Clark. Board member of the Harding Loevner Funds from 1996 to 2014, serving as both Lead Independent Director and chair of the Audit Committee. Board member of the Russell Exchange Traded Funds Trust from 2011 to 2012 and the chair of the Audit Committee. Ms. Freeman is also an inactive Chartered Financial Analyst. | |
Isaiah Harris, Jr.
(Born 1952) | Trustee,
since 2009;
Audit Committee Chair,
since 2019 | Retired. Member of the Advisory Board of CEF of East Central Florida. Chairman of the Board of CIGNA Corporation from 2009 to 2021, and Director from 2005 to 2008. From 2003 to 2011, Director of Deluxe Corporation. Prior thereto, President and CEO of BellSouth Advertising and Publishing Corp. from 2005 to 2007, President and CEO of BellSouth Enterprises from 2004 to 2005 and President of BellSouth Consumer Services from 2000 to 2003. Emeritus member of the Iowa State University Foundation Board of Governors. Emeritus Member of the Advisory board of Iowa State University School of Business. Advisory Board Member, Palm Harbor Academy (private school). Advisory Board Member, Fellowship of Christian Athletes. Mr. Harris is a certified public accountant (inactive status). | |
David F. Larcker
(Born 1950) | | Distinguished Visiting Fellow at the Hoover Institution since 2022. James Irvin Miller Professor of Accounting at the Graduate School of Business (Emeritus), Stanford University, Director of the Corporate Governance Research Initiative and Senior Faculty of The Rock Center for Corporate Governance since 2006. From 2005 to 2008, Professor of Accounting at the Graduate School of Business, Stanford University. Prior thereto, Ernst & Young Professor of Accounting at The Wharton School, University of Pennsylvania from 1985 to 2005. | |
Olivia S. Mitchell
(Born 1953) | Trustee,
since 2006;
Nominating and Governance Committee Chair,
since 2018 | International Foundation of Employee Benefit Plans Professor since 1993, Wharton School of the University of Pennsylvania. Director of Wharton’s Pension Research Council and Boettner Center on Pensions & Retirement Research, and Research Associate at the National Bureau of Economic Research. Previously taught at Cornell University from 1978 to 1993. | |
Timothy J. Penny
(Born 1951) | Trustee,
since 1996;
Chair,
since 2018 | President and Chief Executive Officer of Southern Minnesota Initiative Foundation, a non-profit organization, since 2007. Vice Chair of the Economic Club of Minnesota, since 2007. Co-Chair of the Committee for a Responsible Federal Budget, since 1995. Member of the Board of Trustees of NorthStar Education Finance, Inc., a non-profit organization, from 2007-2022. Senior Fellow of the University of Minnesota Humphrey Institute from 1995 to 2017. | |
1
The Statement of Additional Information includes additional information about the Trustees and is available, without charge, upon request, by calling 1-800-222-8222 or by visiting the website at allspringglobal.com.
44 | Allspring Factor Enhanced U.S. Small Cap Equity Portfolio
Other information (unaudited)
| Position held and length of service* | Principal occupations during past five years or longer | Current other public company or investment company directorships |
James G. Polisson
(Born 1959) | | Retired. Chief Marketing Officer, Source (ETF) UK Services, Ltd, from 2015 to 2017. From 2012 to 2015, Principal of The Polisson Group, LLC, a management consulting, corporate advisory and principal investing company. Chief Executive Officer and Managing Director at Russell Investments, Global Exchange Traded Funds from 2010 to 2012. Managing Director of Barclays Global Investors from 1998 to 2010 and Global Chief Marketing Officer for iShares and Barclays Global Investors from 2000 to 2010. Trustee of the San Francisco Mechanics’ Institute, a non- profit organization, from 2013 to 2015. Board member of the Russell Exchange Traded Fund Trust from 2011 to 2012. Director of Barclays Global Investors Holdings Deutschland GmbH from 2006 to 2009. Mr. Polisson is an attorney and has a retired status with the Massachusetts and District of Columbia Bar Associations. | |
Pamela Wheelock
(Born 1959) | Trustee,
since January 2020;
previously Trustee from
January 2018 to
July 2019 | Retired. Executive and Senior Financial leadership positions in the public, private and nonprofit sectors. Interim President and CEO, McKnight Foundation, 2020. Interim Commissioner, Minnesota Department of Human Services, 2019. Chief Operating Officer, Twin Cities Habitat for Humanity, 2017-2019. Vice President for University Services, University of Minnesota, 2012- 2016. Interim President and CEO, Blue Cross and Blue Shield of Minnesota, 2011-2012. Executive Vice-President and Chief Financial Officer, Minnesota Wild, 2002-2008. Commissioner, Minnesota Department of Finance, 1999-2002. Chair of the Board of Directors of Destination Medical Center Corporation. Board member of the Minnesota Wild Foundation. | |
| Length of service dates reflect the Trustee’s commencement of service with the Trust’s predecessor entities, where applicable. |
Allspring Factor Enhanced U.S. Small Cap Equity Portfolio | 45
Other information (unaudited)
Officers1
| Position held and
length of service | Principal occupations during past five years or longer |
| | President and Chief Executive Officer of Allspring Funds Management, LLC since 2017 and Head of Global Fund Governance of Allspring Global Investments since 2022. Prior thereto, co-president of Galliard Capital Management, LLC, an affiliate of Allspring Funds Management, LLC, from 2019 to 2022 and Head of Affiliated Managers, Allspring Global Investments, from 2014 to 2019 and Executive Vice President responsible for marketing, investments and product development for Allspring Funds Management, LLC, from 2009 to 2014. |
Jeremy DePalma
(Born 1974) | Treasurer,
since 2012
(for certain funds in
the Fund Complex);
since 2021 (for
the remaining funds in the Complex) | Senior Vice President of Allspring Funds Management, LLC since 2009. Senior Vice President of Evergreen Investment Management Company, LLC from 2008 to 2010 and head of the Fund Reporting and Control Team within Fund Administration from 2005 to 2010. |
Christopher Baker
(Born 1976) | Chief Compliance Officer,
since 2022 | Global Chief Compliance Officer for Allspring Global Investments since 2022. Prior thereto, Chief Compliance Officer for State Street Global Advisors from 2018 to 2021. Senior Compliance Officer for the State Street divisions of Alternative Investment Solutions, Sector Solutions, and Global Marketing from 2015 to 2018. From 2010 to 2015 Vice President, Global Head of Investment and Marketing Compliance for State Street Global Advisors. |
Matthew Prasse
(Born 1983) | Chief Legal Officer,
since 2022;
Secretary,
since 2021 | Senior Counsel of the Allspring Legal Department since 2021. Senior Counsel of the Wells Fargo Legal Department from 2018 to 2021. Previously, Counsel for Barings LLC from 2015 to 2018. Prior to joining Barings, Associate at Morgan, Lewis & Bockius LLP from 2008 to 2015. |
1 For those Officers with tenures at Allspring Global Investments and/or Allspring Funds Management, LLC that began prior to 2021, such tenures include years of service during which these businesses/entities were known as Wells Fargo Asset Management and Wells Fargo Funds Management, LLC, respectively.
46 | Allspring Factor Enhanced U.S. Small Cap Equity Portfolio
Other information (unaudited)
Board consideration of investment advisory and sub-advisory agreements:
Allspring Bloomberg US Aggregate ex-Corporate Portfolio, Allspring Emerging Markets Bond Portfolio, Allspring Factor Enhanced Emerging Markets Equity Portfolio, Allspring Factor Enhanced International Equity Portfolio, Allspring Factor Enhanced U.S. Large Cap Equity Portfolio, Allspring Factor Enhanced U.S. Small Cap Equity Portfolio, Allspring High Yield Corporate Bond Portfolio, Allspring Investment Grade Corporate Bond Portfolio, Allspring Strategic Retirement Bond Portfolio, and Allspring U.S. REIT Portfolio
Under the Investment Company Act of 1940 (the “1940 Act”), the Board of Trustees (the “Board”) of Allspring Master Trust (the “Trust”) must determine annually whether to approve the continuation of the Trust’s investment advisory and sub-advisory agreements. In this regard, at a meeting held on May 15-17, 2023 (the “Meeting”), the Board, all the members of which have no direct or indirect interest in the investment advisory and sub-advisory agreements and are not “interested persons” of the Trust, as defined in the 1940 Act (the “Independent Trustees”), reviewed and approved for each of the portfolios of the Trust identified in the table below (individually, a “Portfolio” and collectively, the “Portfolios”): (i) an investment advisory agreement (the “Advisory Agreement”) with Allspring Funds Management, LLC (“Allspring Funds Management”); and (ii) an investment sub-advisory agreement (each, a “Sub-Advisory Agreement” and collectively, the “Sub-Advisory Agreements”) with the Sub-Advisers(s) identified in the table below (each, a “Sub-Adviser” and collectively, the “Sub-Advisers”) for the corresponding Portfolio identified. The Advisory Agreement and the Sub-Advisory Agreements are collectively referred to as the “Advisory Agreements.”
| |
Allspring Bloomberg Barclays US Aggregate ex-Corporate Portfolio | Allspring Global Investments, LLC |
Allspring Emerging Markets Bond Portfolio | Allspring Global Investments, LLC, Allspring Global Investments (UK) Limited |
Allspring Factor Enhanced Emerging Markets Equity Portfolio | Allspring Global Investments, LLC |
Allspring Factor Enhanced International Equity Portfolio | Allspring Global Investments, LLC |
Allspring Factor Enhanced U.S. Large Cap Equity Portfolio | Allspring Global Investments, LLC |
Allspring Factor Enhanced U.S. Small Cap Equity Portfolio | Allspring Global Investments, LLC |
Allspring High Yield Corporate Bond Portfolio | Allspring Global Investments, LLC |
Allspring Investment Grade Corporate Bond Portfolio | Allspring Global Investments, LLC |
Allspring Strategic Retirement Bond Portfolio | Allspring Global Investments, LLC |
Allspring U.S. REIT Portfolio | Allspring Global Investments, LLC |
At the Meeting, the Board considered the factors and reached the conclusions described below relating to the selection of Allspring Funds Management and the Sub-Advisers and the approval of the Advisory Agreements. Prior to the Meeting, including at a Board meeting held in April 2023, the Trustees conferred extensively among themselves and with representatives of Allspring Funds Management about these matters. The Board has adopted a team-based approach, with each team consisting of a sub-set of Trustees, to assist the full Board in the discharge of its duties in reviewing investment performance and other matters throughout the year. The Independent Trustees were assisted in their evaluation of the Advisory Agreements by independent legal counsel, from whom they received separate legal advice and with whom they met separately.
The Board noted that it initially approved the Advisory Agreements at a Board meeting held in May 2021, each for a two-year term, in advance of the sale of Wells Fargo Asset Management to Allspring Global Investments Holdings, LLC,1 a holding company indirectly owned by certain private funds of GTCR LLC and Reverence Capital Partners, L.P. (the “Transaction”). The Trustees also noted that, while they did not specifically consider the continuation of the Advisory Agreements in 2022 as a result of the two-year term that was approved in 2021, the Trustees received and considered certain information at a Board meeting held in April 2022 that was applicable to the Advisory Agreements, including an overview and financial review of the Allspring Global Investments business, information regarding certain ancillary agreements that were approved by the Board at the April 2022 Board meeting, and comparative data regarding Fund fees and expenses.
In providing information to the Board, Allspring Funds Management and the Sub-Advisers were guided by a detailed set of requests for information submitted to them by independent legal counsel on behalf of the Independent Trustees at the start of the Board’s annual contract renewal process earlier in 2023. In considering and approving the Advisory Agreements, the Trustees considered the information they believed relevant, including but not limited to the information discussed below. The Board considered not only the specific information presented in connection with the Meeting, but also the knowledge gained over time through interaction with Allspring Funds Management and the Sub-Advisers about various topics. In this regard, the Board reviewed reports of Allspring Funds Management at each of its quarterly meetings, which included, among other things, portfolio reviews and investment performance reports. In addition, the Board and the teams mentioned above confer with portfolio managers at various times throughout the year. The Board did not identify any particular information or consideration that was all-important or controlling, and each individual Trustee may have attributed different weights to various factors.
1
The trade name for the asset management firm that includes Allspring Funds Management and the Sub-Adviser is “Allspring Global Investments.”
Allspring Factor Enhanced U.S. Small Cap Equity Portfolio | 47
Other information (unaudited)
After its deliberations, the Board unanimously determined that the compensation or the absence of compensation payable to Allspring Funds Management and each of the Sub-Advisers under each of the Advisory Agreements was reasonable, and approved the continuation of the Advisory Agreements for a one-year term. The Board considered the approval of the Advisory Agreements for the Portfolios as part of its consideration of agreements for funds across the complex, but its approvals were made on a fund-by-fund basis. The following summarizes a number of important, but not necessarily all, factors considered by the Board in support of its approvals.
Nature, extent and quality of services
The Board received and considered various information regarding the nature, extent, and quality of services provided to the Portfolios by Allspring Funds Management and the Sub-Advisers under the Advisory Agreements. This information included a description of the investment advisory services and Portfolio-level administrative services covered by the Advisory Agreement, as well as, among other things, a summary of the background and experience of senior management of Allspring Global Investments, of which Allspring Funds Management and the Sub-Advisers are a part, and a summary of investments made in the Allspring Global Investments business. The Board also considered information about retention arrangements with respect to key personnel of Allspring Global Investments that were put in place in connection with the Transaction. The Board took into account information about the services that continue to be provided by Wells Fargo & Co. and/or its affiliates (“Wells Fargo”) since the Transaction under a transition services agreement and the anticipated timeline for exiting the transition services agreement. In addition, the Board received and considered information about the full range of services provided to the Fund by Allspring Funds Management and its affiliates.
The Board considered the qualifications, background, tenure, and responsibilities of each of the portfolio managers primarily responsible for the day-to-day portfolio management of the Portfolios. The Board evaluated the ability of Allspring Funds Management and the Sub-Advisers to attract and retain qualified investment professionals, including research, advisory, and supervisory personnel.
The Board further considered the compliance programs and compliance records of Allspring Funds Management and the Sub-Advisers. The Board received and considered information about Allspring Global Investments’ risk management functions, which included information about Allspring Funds Management’s and the Sub-Advisers’ business continuity plans, their approaches to data privacy and cybersecurity, and Allspring Funds Management’s role as administrator of the Portfolios’ liquidity risk management program, and the derivatives risk management program for Allspring Bloomberg Barclays US Aggregate ex-Corporate Portfolio and Allspring Factor Enhanced U.S. Large Cap Equity Portfolio. The Board also received and considered information about Allspring Funds Management’s intermediary and vendor oversight program.
Portfolio investment performance and expenses
The Board considered the investment performance results for each of the Portfolios over various time periods ended December 31, 2022. The Board considered these results in comparison to the investment performance of funds in a universe that was determined by Broadridge Inc. (“Broadridge”) to be similar to each respective Portfolios (each, a “Universe”), and in comparison to each Portfolios’ benchmark index and to other comparative data. Broadridge is an independent provider of investment company data. The Board received a description of the methodology used by Broadridge to select the mutual funds in the performance Universe. The Board noted the short performance history of the Portfolios.
With respect to the investment performance of each Portfolio relative to its respective Universe, the Board noted the following: (i) the investment performance of Allspring Bloomberg US Aggregate ex-Corporate Portfolio was higher than the average investment performance of the Universe for all periods under review; the investment performance of Allspring Bloomberg US Aggregate ex-Corporate Portfolio was higher than the investment performance of its benchmark index, the Bloomberg U.S. Aggregate ex Corporate Index, for the one-year period and was in range of the investment performance of its benchmark index for the three- and five-year periods under review; (ii) the investment performance of Allspring Emerging Markets Bond Portfolio was lower than the average investment performance of the Universe for the one- and three-year periods and was in range of the average investment performance of the Universe for the five-year period; the investment performance of Allspring Emerging Markets Bond Portfolio was higher than the investment performance of its benchmark index, the J.P. Morgan EM Bond Global Diversified Index, for the one-year period and was in range of the investment performance of its benchmark index for the three- and five-year periods under review; (iii) the investment performance of Allspring Factor Enhanced Emerging Markets Equity Portfolio was higher than the average investment performance of the Universe for the one-year period and was lower than the average investment performance of the Universe for the three- and five-year periods; the investment performance of Allspring Factor Enhanced Emerging Markets Equity Portfolio was higher than the investment performance of its benchmark index, the MSCI Emerging Markets Index (Net), for the one-year period and was lower than the investment performance of its benchmark index for the three- and five-year periods under review; (iv) the investment performance of Allspring Factor Enhanced International Equity Portfolio was higher than the average investment performance of the Universe for all periods under review; the investment performance of Allspring Factor Enhanced International Equity Portfolio was higher than the investment performance of its benchmark index, the MSCI World ex US Index (Net), for all periods under review; (v) the investment performance of Allspring Factor Enhanced U.S. Large Cap Equity Portfolio was higher than the average investment performance of the Universe for the one- and five-year periods and was lower than the average investment performance of the Universe for the three-year period; the investment performance of Allspring Factor Enhanced U.S. Large Cap Equity Portfolio was higher than the investment performance of its benchmark index, the Russell 1000® Index, for the one-year period and was lower than the investment performance of its benchmark index for the three- and five-year periods under review; (vi) the investment performance of Allspring Factor Enhanced U.S. Small Cap Equity Portfolio was lower than the average investment performance of the Universe for all periods under review; the investment performance of Allspring Factor Enhanced U.S. Small Cap Equity Portfolio was higher than the
48 | Allspring Factor Enhanced U.S. Small Cap Equity Portfolio
Other information (unaudited)
investment performance of its benchmark index, the Russell 2000® Index, for the one-year period and was lower than the investment performance of its benchmark index for the three- and five-year periods under review; (vii) the investment performance of Allspring High Yield Corporate Bond Portfolio was lower than the average investment performance of the Universe for all periods under review; the investment performance of Allspring High Yield Corporate Bond Portfolio was in range of the investment performance of its benchmark index, the Bloomberg U.S. Corporate High Yield 2% Issuer Capped, for the one-year period and was lower than the investment performance of its benchmark index for the three- and five-year periods under review; (viii) the investment performance of Allspring Investment Grade Corporate Bond Portfolio was higher than the average investment performance of the Universe for the one- and five-year periods and in rage of the average investment performance of the Universe for the three-year period; the investment performance of Allspring Investment Grade Corporate Bond Portfolio was higher than the investment performance of its benchmark index, the Bloomberg U.S. Corporate Bond Index, for the one-year period and was in range of the investment performance of its benchmark index for the three- and five-year periods under review; (ix) the investment performance of Allspring Strategic Retirement Bond Portfolio was higher than the average investment performance of the Universe for all periods under review; the investment performance of Allspring Strategic Retirement Bond Portfolio was higher than the investment performance of its benchmark index, the Strategic Retirement Blended Index, for the one- and three-year periods and was in range of the investment performance of its benchmark index for the five-year period; (x) the investment performance of Allspring U.S. REIT Portfolio was lower than the average investment performance of the Universe for the one-year period and was in range of the average investment performance of the Universe for the three- and five-year periods; the investment performance of Allspring U.S. REIT Portfolio was higher than the investment performance of its benchmark index, the Dow Jones U.S. Select REIT Index, for all periods under review.
The Board received information concerning, and discussed factors contributing to, the underperformance of each of Allspring Emerging Markets Bond Portfolio, Allspring Factor Enhanced Emerging Markets Equity Portfolio, Allspring Factor Enhanced U.S. Large Cap Equity Portfolio, Allspring Factor Enhanced U.S. Small Cap Equity Portfolio and Allspring High Yield Corporate Bond Portfolio relative to such Portfolio’s Universe and benchmark index for the periods identified above. The Board took note of the explanations for the relative underperformance during these periods, including with respect to investment decisions and market factors that affected each Portfolio’s investment performance.
The Board also received and considered information regarding the fee rates that are payable to Allspring Funds Management for investment advisory services (as discussed below), which are the only fees charged to the Portfolios, relative to corresponding class-specific expense groups that were determined by Broadridge to be similar to the Portfolios (the “Groups”). The Board received a description of the methodology used by Broadridge to select the mutual funds in the expense Groups and an explanation of how funds comprising expense groups and their expense ratios may vary from year-to-year.
The Board took into account the Portfolios’ investment performance and expense information provided to it among the factors considered in deciding to re-approve the Advisory Agreements.
Investment advisory and sub-advisory fee rates
The Board reviewed and considered the contractual fee rates payable by the Portfolios to Allspring Funds Management under the Advisory Agreement. The Board also reviewed and considered the contractual investment sub-advisory fee rates that are payable by Allspring Funds Management to the Sub-Advisers for investment sub-advisory services.
Among other information reviewed by the Board was a comparison of the Portfolios’ Advisory Rates with the average contractual investment advisory fee rates of funds in the expense Groups at a common asset level as well as transfer agency costs of the Portfolios in the expense Groups. The Board noted that the Advisory Rates of the Portfolios were lower than or in range of the mean rates for the Portfolios’ expense Groups.
The Board also received and considered information about the portions of the total advisory fees that were retained by Allspring Funds Management after payment of the fees to the Sub-Advisers for sub-advisory services. In assessing the reasonableness of these amounts, the Board received and evaluated information about the nature and extent of responsibilities retained and risks assumed by Allspring Funds Management and not delegated to or assumed by the Sub-Advisers, and about Allspring Funds Management’s on-going oversight services. Given the affiliation between Allspring Funds Management and the Sub-Advisers, the Board ascribed limited relevance to the allocation of fees between them.
For all Portfolios, except Allspring Factor Enhanced U.S. Small Cap Equity Portfolio, Allspring Factor Enhanced International Equity Portfolio, Allspring Factor Enhanced Emerging Markets Equity Portfolio, Allspring U.S. REIT Portfolio, Allspring Investment Grade Corporate Bond Portfolio, and Allspring Strategic Retirement Bond Portfolio, the Board also received and considered information about the nature and extent of services offered and fee rates charged by Allspring Funds Management and the Sub-Advisers to other types of clients with investment strategies similar to those of certain Portfolios. In this regard, the Board received information about the significantly greater scope of services, and compliance, reporting and other legal burdens and risks of managing proprietary mutual funds compared with those associated with managing assets of other types of clients, including third-party sub-advised fund clients and non-mutual fund clients such as institutional separate accounts.
Based on its consideration of the factors and information it deemed relevant, including those described here, the Board determined that the compensation payable to Allspring Funds Management under the Advisory Agreement and to the Sub-Advisers under the Sub-Advisory Agreements was reasonable.
Allspring Factor Enhanced U.S. Small Cap Equity Portfolio | 49
Other information (unaudited)
Profitability
The Board received and considered information concerning the profitability of Allspring Funds Management, as well as the profitability of Allspring Global Investments, from providing services to the fund complex as a whole. The Board noted that the Sub-Adviser’s profitability information with respect to providing services to the Portfolios and other funds in the complex was subsumed in the Allspring Global Investments profitability analysis.
Allspring Funds Management reported on the methodologies and estimates used in calculating profitability, including a description of the methodology used to allocate certain expenses and differences in how Allspring Global Investments calculates its pre-tax profit metric versus the methodology used when Allspring Funds Management was part of Wells Fargo. It was noted that the impact of such differences had only minor impact on the financial results presented. Among other things, the Board noted that the levels of profitability reported on a fund-by-fund basis varied widely, depending on factors such as the size, type, and age of fund.
Based on its review, the Board did not deem the profits reported by Allspring Funds Management or Allspring Global Investments from services provided to the Portfolios to be at a level that would prevent it from approving the continuation of the Advisory Agreements.
Economies of scale
The Board received and considered information about the potential for Allspring Funds Management to experience economies of scale in the provision of management services to the Portfolios, the difficulties of calculating economies of scale at an individual fund level, and the extent to which potential scale benefits are shared with Portfolio shareholders. The Board noted the existence of breakpoints in the Portfolios’ advisory fee structure, which operate generally to reduce the Portfolios’ expense ratios as the Portfolios grow in size, and the size of the Portfolios in relation to such breakpoints. The Board considered that in addition to advisory fee breakpoints, Allspring Funds Management shares potential economies of scale from its management business in a variety of ways, including through fee waiver and expense reimbursement arrangements, competitive advisory fee rates set at the outset without regard to breakpoints, and investments in the business intended to enhance services available to shareholders.
The Board concluded that Allspring Funds Management’s arrangements with respect to the Portfolios, including contractual breakpoints, constituted a reasonable approach to sharing potential economies of scale with the Portfolios and their shareholders.
Other benefits to Allspring Funds Management and the Sub-Advisers
The Board received and considered information regarding potential “fall-out” or ancillary benefits received by Allspring Funds Management and its affiliates, including the Sub-Advisers, as a result of their relationships with the Portfolios. Ancillary benefits could include, among others, benefits directly attributable to other relationships with the Portfolios and benefits potentially derived from an increase in Allspring Funds Management’s and the Sub-Advisers’ businesses as a result of their relationships with the Portfolios. The Board noted that Allspring Funds Distributor, LLC, an affiliate of Allspring Funds Management, receives distribution-related fees in respect of shares sold or held through it.
The Board also reviewed information about soft dollar credits earned and utilized by the Sub-Advisers and fees earned in the past by Allspring Funds Management and the Sub-Advisers from managing a private investment vehicle for the fund complex’s securities lending collateral.
Based on its consideration of the factors and information it deemed relevant, including those described here, the Board did not find that any ancillary benefits received by Allspring Funds Management and its affiliates, including the Sub-Advisers, were unreasonable.
Conclusion
At the Meeting, after considering the above-described factors and based on its deliberations and its evaluation of the information described above, the Board unanimously determined that the compensation payable to Allspring Funds Management and the Sub-Advisers under each of the Advisory Agreements was reasonable, and approved the continuation of the Advisory Agreements for a one-year term.
50 | Allspring Factor Enhanced U.S. Small Cap Equity Portfolio
Other information (unaudited)
Liquidity risk management program
In accordance with Rule 22e-4 under the Investment Company Act of 1940, as amended (the “Liquidity Rule”), Allspring Master Trust (the “Trust”) has adopted and implemented a liquidity risk management program (the “Program”) on behalf of each of its series, including the Portfolio, which is reasonably designed to assess and manage the Portfolio’s liquidity risk. “Liquidity risk” is defined under the Liquidity Rule as the risk that the Portfolio is unable to meet redemption requests without significantly diluting remaining investors’ interests in the Portfolio. The Trust’s Board of Trustees (the “Board”) previously approved the designation of Allspring Funds Management, LLC (“Allspring Funds Management”), the Portfolio’s investment adviser, to administer the Program, and Allspring Funds Management has established a Liquidity Risk Management Council (the “Council”) composed of personnel from multiple departments within Allspring Funds Management and its affiliates to assist Allspring Funds Management in the administration of the Program.
The Program is comprised of various components designed to support the assessment and/or management of liquidity risk, including: (1) the periodic assessment (no less frequently than annually) of certain factors that influence the Portfolio’s liquidity risk; (2) the periodic classification (no less frequently than monthly) of the Portfolio’s investments into one of four liquidity categories that reflect an estimate of their liquidity under current market conditions; (3) a 15% limit on the acquisition of “illiquid investments” (as defined under the Liquidity Rule); (4) to the extent the Portfolio does not invest primarily in “highly liquid investments” (as defined under the Liquidity Rule), the determination of a minimum percentage of the Portfolio’s assets that generally will be invested in highly liquid investments (an “HLIM”); (5) if the Portfolio has established an HLIM, the periodic review (no less frequently than annually) of the HLIM and the adoption of policies and procedures for responding to a shortfall of the Portfolio’s “highly liquid investments” below its HLIM; and (6) periodic reporting to the Board.
At a meeting of the Board held on May 16-17, 2023, the Board received and reviewed a written report (the “Report”) from Allspring Funds Management that, among other things, addressed the operation of the Program and assessed its adequacy and effectiveness for the period from January 1, 2022 through December 31, 2022 (the “Reporting Period”). The Report noted significant liquidity events impacting the Portfolios related to extended foreign market holidays as well as the difficulty of trading and settlement of most Russia-related securities due to sanctions activity. The Report noted that there were no material changes to the Program during the Reporting Period.
Allspring Funds Management determined in the Report that the Program has been implemented and operates effectively to manage each Portfolio’s, including the Portfolio’s, liquidity risk, and Allspring Funds Management continues to believe that the Program has been and continues to be adequately and effectively implemented to monitor and, as applicable, respond to the Portfolio’s liquidity developments.
There can be no assurance that the Program will achieve its objectives under all circumstances in the future.
Allspring Factor Enhanced U.S. Small Cap Equity Portfolio | 51
This page is intentionally left blank.
For more information
More information about Allspring Funds is available free upon request. To obtain literature, please write, visit the Portfolio’s website, or call:
Allspring Funds
P.O. Box 219967
Kansas City, MO 64121-9967
Website: allspringglobal.com
Individual investors: 1-800-222-8222
Retail investment professionals: 1-888-877-9275
Institutional investment professionals: 1-800-260-5969
This report and the financial statements contained herein are submitted for the general information of the interest holders of the Portfolio. If this report is used for promotional purposes, distribution of the report must be accompanied or preceded by a current prospectus. Before investing, please consider the investment objectives, risks, charges, and expenses of the investment. For a current prospectus and, if available, a summary prospectus, containing this information, call 1-800-222-8222 or visit the Portfolio’s website at allspringglobal.com. Read the prospectus carefully before you invest or send money.
Allspring Global InvestmentsTM is the trade name for the asset management firms of Allspring Global Investments Holdings, LLC, a holding company indirectly owned by certain private funds of GTCR LLC and Reverence Capital Partners, L.P. These firms include but are not limited to Allspring Global Investments, LLC, and Allspring Funds Management, LLC. Certain products managed by Allspring entities are distributed by Allspring Funds Distributor, LLC (a broker-dealer and Member FINRA/SIPC).
This material is for general informational and educational purposes only and is NOT intended to provide investment advice or a recommendation of any kind - including a recommendation for any specific investment, strategy, or plan.
© 2023 Allspring Global Investments Holdings, LLC. All rights reserved.
Allspring High Yield Corporate Bond Portfolio
Semi-Annual Report
August 31, 2023
Allspring High Yield Corporate Bond Portfolio | 1
Portfolio information (unaudited)
| The Portfolio seeks to replicate the total return of the Bloomberg U.S. High Yield 2% Issuer Capped Bond Index,† before fees and expenses. |
| Allspring Funds Management, LLC |
| Allspring Global Investments, LLC |
| Manjunath Boraiah, Brian Prucyk, Janet S. Rilling, CFA, CPA, Michael J. Schueller, CFA |
Ten largest holdings (%) as of August 31, 20231 |
DaVita, Inc., 4.63%, 6-1-2030 | |
DISH Network Corp., 11.75%, 11-15-2027 | |
Brand Industrial Services, Inc., 10.38%, 8-1-2030 | |
Cloud Software Group, Inc., 9.00%, 9-30-2029 | |
BroadStreet Partners, Inc., 5.88%, 4-15-2029 | |
Staples, Inc., 7.50%, 4-15-2026 | |
Aston Martin Capital Holdings Ltd., 10.50%, 11-30-2025 | |
CCO Holdings LLC/CCO Holdings Capital Corp., 4.50%, 5-1-2032 | |
Tenet Healthcare Corp., 4.88%, 1-1-2026 | |
Bombardier, Inc., 7.13%, 6-15-2026 | |
| Figures represent the percentage of the Portfolio’s net assets. Holdings are subject to change and may have changed since the date specified. |
Credit quality as of August 31, 20231 |

| The credit quality distribution of portfolio holdings reflected in the chart is based on ratings from Standard & Poor’s, Moody’s Investors Service, and/or Fitch Ratings Ltd. Credit quality ratings apply to the underlying holdings of the Portfolio and not to the Portfolio itself. The percentages of the portfolio with the ratings depicted in the chart are calculated based on the market value of fixed income securities held by the Portfolio. If a security was rated by all three rating agencies, the middle rating was utilized. If rated by two of the three rating agencies, the lower rating was utilized, and if rated by one of the rating agencies, that rating was utilized. Standard & Poor’s rates the creditworthiness of bonds, ranging from AAA (highest) to D (lowest). Ratings from A to CCC may be modified by the addition of a plus (+) or minus (-) sign to show relative standing within the rating categories. Standard & Poor’s rates the creditworthiness of short- term notes from SP-1 (highest) to SP-3 (lowest). Moody’s rates the creditworthiness of bonds, ranging from Aaa (highest) to C (lowest). Ratings Aa to B may be modified by the addition of a number 1 (highest) to 3 (lowest) to show relative standing within the ratings categories. Moody’s rates the creditworthiness of short-term U.S. tax-exempt municipal securities from MIG 1/VMIG 1 (highest) to SG (lowest). Fitch rates the creditworthiness of bonds, ranging from AAA (highest) to D (lowest). Credit quality distribution is subject to change and may have changed since the date specified. |
| The Bloomberg U.S. High Yield 2% Issuer Capped Bond Index is composed of fixed-rate, publicly issued, non-investment-grade debt with at least one year remaining tomaturity as well as an outstanding par value of $100 million. You cannot invest directly in an index. |
| CFA® and Chartered Financial Analyst® are trademarks owned by CFA Institute. |
2 | Allspring High Yield Corporate Bond Portfolio
Portfolio of investments—August 31, 2023 (unaudited)
| | | | | |
Corporate bonds and notes: 79.70% | | | | | | |
| | | | | | |
| | | | | | |
| | | | | | |
| | | | | | |
| | | | | | |
| | | | | | |
| | | | | | |
| | | | | | |
Outfront Media Capital LLC/Outfront Media Capital Corp.144A | | | | | | |
| | | | | | |
| | | | | | |
CCO Holdings LLC/CCO Holdings Capital Corp. | | | | | | |
CCO Holdings LLC/CCO Holdings Capital Corp.144A | | | | | | |
| | | | | | |
| | | | | | |
| | | | | | |
Gray Television, Inc.144A | | | | | | |
Univision Communications, Inc.144A | | | | | | |
| | | | | | |
Telecommunications: 4.52% | | | | | | |
CommScope Technologies LLC144A | | | | | | |
Frontier Communications Holdings LLC144A | | | | | | |
Level 3 Financing, Inc.144A | | | | | | |
Level 3 Financing, Inc.144A | | | | | | |
| | | | | | |
Consumer, cyclical: 19.02% | | | | | | |
| | | | | | |
| | | | | | |
United Airlines, Inc.144A | | | | | | |
| | | | | | |
Auto manufacturers: 2.90% | | | | | | |
Allison Transmission, Inc.144A | | | | | | |
| | | | | | |
| | | | | | |
Auto parts & equipment: 4.19% | | | | | | |
Adient Global Holdings Ltd.144A | | | | | | |
| | | | | | |
Goodyear Tire & Rubber Co. | | | | | | |
| | | | | | |
The accompanying notes are an integral part of these financial statements.
Allspring High Yield Corporate Bond Portfolio | 3
Portfolio of investments—August 31, 2023 (unaudited)
| | | | | |
Distribution/wholesale: 2.20% | | | | | | |
American Builders & Contractors Supply Co., Inc.144A | | | | | | |
| | | | | | |
Wesco Aircraft Holdings, Inc.144A† | | | | | | |
| | | | | | |
| | | | | | |
| | | | | | |
| | | | | | |
Hilton Domestic Operating Co., Inc. | | | | | | |
MGM Resorts International | | | | | | |
| | | | | | |
| | | | | | |
Ferrellgas LP/Ferrellgas Finance Corp.144A | | | | | | |
| | | | | | |
| | | | | | |
Consumer, non-cyclical: 12.63% | | | | | | |
Commercial services: 2.72% | | | | | | |
Allied Universal Holdco LLC/Allied Universal Finance Corp.144A | | | | | | |
| | | | | | |
| | | | | | |
| | | | | | |
Performance Food Group, Inc.144A | | | | | | |
Healthcare-products: 1.39% | | | | | | |
Avantor Funding, Inc.144A | | | | | | |
Healthcare-services: 5.73% | | | | | | |
CHS/Community Health Systems, Inc.144A | | | | | | |
| | | | | | |
| | | | | | |
| | | | | | |
| | | | | | |
| | | | | | |
Organon & Co./Organon Foreign Debt Co.-Issuer BV144A | | | | | | |
| | | | | | |
| | | | | | |
Moss Creek Resources Holdings, Inc.144A | | | | | | |
| | | | | | |
| | | | | | |
Sunoco LP/Sunoco Finance Corp. | | | | | | |
| | | | | | |
The accompanying notes are an integral part of these financial statements.
4 | Allspring High Yield Corporate Bond Portfolio
Portfolio of investments—August 31, 2023 (unaudited)
| | | | | |
Oil & gas services: 1.48% | | | | | | |
USA Compression Partners LP/USA Compression Finance Corp. | | | | | | |
| | | | | | |
Antero Midstream Partners LP/Antero Midstream Finance Corp.144A | | | | | | |
| | | | | | |
EQM Midstream Partners LP | | | | | | |
| | | | | | |
| | | | | | |
Diversified financial services: 1.36% | | | | | | |
| | | | | | |
| | | | | | |
Acrisure LLC/Acrisure Finance, Inc.144A | | | | | | |
BroadStreet Partners, Inc.144A | | | | | | |
HUB International Ltd.144A | | | | | | |
| | | | | | |
Investment Companies: 1.17% | | | | | | |
Compass Group Diversified Holdings LLC144A | | | | | | |
| | | | | | |
| | | | | | |
| | | | | | |
MPT Operating Partnership LP/MPT Finance Corp. | | | | | | |
| | | | | | |
| | | | | | |
| | | | | | |
| | | | | | |
| | | | | | |
Electrical components & equipment: 1.28% | | | | | | |
Energizer Holdings, Inc.144A | | | | | | |
Engineering & construction: 1.58% | | | | | | |
Brand Industrial Services, Inc.144A | | | | | | |
| | | | | | |
| | | | | | |
| | | | | | |
| | | | | | |
Cloud Software Group, Inc.144A | | | | | | |
| | | | | | |
| | | | | | |
| | | | | | |
Total corporate bonds and notes (Cost $11,780,834) | | | | | | |
The accompanying notes are an integral part of these financial statements.
Allspring High Yield Corporate Bond Portfolio | 5
Portfolio of investments—August 31, 2023 (unaudited)
| | | | | |
Yankee corporate bonds and notes: 16.75% | | | | | | |
| | | | | | |
| | | | | | |
| | | | | | |
| | | | | | |
| | | | | | |
Telecommunications: 2.82% | | | | | | |
| | | | | | |
Vodafone Group PLC (USD Swap Semi Annual (vs. 3 Month LIBOR) 5 Year+4.87%)± | | | | | | |
| | | | | | |
Consumer, cyclical: 6.95% | | | | | | |
Auto manufacturers: 1.52% | | | | | | |
Aston Martin Capital Holdings Ltd.144A | | | | | | |
| | | | | | |
| | | | | | |
Royal Caribbean Cruises Ltd.144A | | | | | | |
| | | | | | |
| | | | | | |
1011778 BC ULC/New Red Finance, Inc.144A | | | | | | |
1011778 BC ULC/New Red Finance, Inc.144A | | | | | | |
| | | | | | |
Consumer, non-cyclical: 1.45% | | | | | | |
| | | | | | |
Bausch Health Cos., Inc.144A | | | | | | |
| | | | | | |
| | | | | | |
| | | | | | |
| | | | | | |
| | | | | | |
Atlantica Sustainable Infrastructure PLC144A | | | | | | |
Total yankee corporate bonds and notes (Cost $2,408,209) | | | | | | |
The accompanying notes are an integral part of these financial statements.
6 | Allspring High Yield Corporate Bond Portfolio
Portfolio of investments—August 31, 2023 (unaudited)
| | | | | |
Short-term investments: 2.01% | | | | | | |
Investment companies: 2.01% | | | | | | |
Allspring Government Money Market Fund Select Class♠∞ | | | | | | |
Total short-term investments (Cost $269,334) | | | | | | |
Total investments in securities (Cost $14,458,377) | | | | | | |
Other assets and liabilities, net | | | | | | |
| | | | | | |
| The security may be resold in transactions exempt from registration, normally to qualified institutional buyers, pursuant to Rule 144A under the Securities Act of 1933. |
| Non-income-earning security |
| Variable rate investment. The rate shown is the rate in effect at period end. |
| The issuer of the security is an affiliated person of the Portfolio as defined in the Investment Company Act of 1940. |
| The rate represents the 7-day annualized yield at period end. |
|
| London Interbank Offered Rate |
| Real estate investment trust |
Investments in affiliates
An affiliated investment is an investment in which the Portfolio owns at least 5% of the outstanding voting shares of the issuer or as a result of other relationships, such as the Portfolio and the issuer having the same adviser or investment manager. Transactions with issuers that were affiliates of the Portfolio at the end of the period were as follows:
| | | | | Net
change in
unrealized
gains
(losses) | | | Income
from
affiliated
securities |
| | | | | | | | |
Allspring Government Money Market Fund Select Class | | | | | | | | |
The accompanying notes are an integral part of these financial statements.
Allspring High Yield Corporate Bond Portfolio | 7
Statement of assets and liabilities—August 31, 2023 (unaudited)
Financial statements
Statement of assets and liabilities
| |
Investments in unaffiliated securities, at value (cost $14,189,043) | |
Investments in affiliated securities, at value (cost $269,334) | |
| |
| |
| |
Prepaid expenses and other assets | |
| |
| |
Professional fees payable | |
Custody and accounting fees payable | |
Interest holder report expenses payable | |
| |
| |
The accompanying notes are an integral part of these financial statements.
8 | Allspring High Yield Corporate Bond Portfolio
Statement of operations—six months ended August 31, 2023 (unaudited)
Statement of operations
| |
| |
Income from affiliated securities | |
| |
| |
| |
Custody and accounting fees | |
| |
Interest holder report expenses | |
Trustees’ fees and expenses | |
| |
| |
Less: Fee waivers and/or expense reimbursements | |
| |
| |
Realized and unrealized gains (losses) on investments | |
Net realized losses on investments | |
Net change in unrealized gains (losses) on investments | |
Net realized and unrealized gains (losses) on investments | |
Net increase in net assets resulting from operations | |
The accompanying notes are an integral part of these financial statements.
Allspring High Yield Corporate Bond Portfolio | 9
Statement of changes in net assets
Statement of changes in net assets
|
Six months ended
August 31, 2023 (unaudited) | Year ended February 28, 2023 |
| | | | |
| | | | |
Net realized losses on investments | | | | |
Net change in unrealized gains (losses) on investments | | | | |
Net increase (decrease) in net assets resulting from operations | | | | |
| | | | |
Transactions in investors’ beneficial interests | | | | |
| | | | |
| | | | |
Net decrease in net assets resulting from capital transactions | | | | |
Total decrease in net assets | | | | |
| | | | |
| | | | |
| | | | |
The accompanying notes are an integral part of these financial statements.
10 | Allspring High Yield Corporate Bond Portfolio
| Six months ended
August 31, 2023
(unaudited) | |
| | | | | |
| | | | | | |
Ratios to average net assets (annualized) | | | | | | |
| | | | | | |
| | | | | | |
| | | | | | |
| | | | | | |
| | | | | | |
| Ratio includes expenses which were voluntarily waived by the adviser. Without these voluntary waivers, the net expense ratios would be increased by the following amounts: |
Six months ended August 31, 2023 (unaudited) | |
Year ended February 28, 2023 | |
Year ended February 28, 2022 | |
Year ended February 28, 2021 | |
| |
| Returns for periods of less than one year are not annualized. |
The accompanying notes are an integral part of these financial statements.
Allspring High Yield Corporate Bond Portfolio | 11
Notes to financial statements (unaudited)
Notes to financial statements
Allspring Master Trust (the “Trust”), a Delaware statutory trust organized on March 10, 1999, is an open-end management investment company registered under the Investment Company Act of 1940, as amended (the “1940 Act”). As an investment company, the Trust follows the accounting and reporting guidance in Financial Accounting Standards Board (“FASB”) Accounting Standards Codification Topic 946, Financial Services – Investment Companies. These financial statements report on the Allspring High Yield Corporate Bond Portfolio (the “Portfolio”) which is a diversified series of the Trust.
Interests in the Portfolio are available solely through private placement transactions that do not involve any “public offering” within the meaning of Section 4(a)(2) of the Securities Act of 1933.
2.
SIGNIFICANT ACCOUNTING POLICIES
The following significant accounting policies, which are consistently followed in the preparation of the financial statements of the Portfolio, are in conformity with U.S. generally accepted accounting principles which require management to make estimates and assumptions that affect the reported amounts of assets and liabilities, disclosure of contingent assets and liabilities at the date of the financial statements, and the reported amounts of income and expenses during the reporting period. Actual results could differ from those estimates.
Securities valuation
All investments are valued each business day as of the close of regular trading on the New York Stock Exchange (generally 4 p.m. Eastern Time), although the Portfolio may deviate from this calculation time under unusual or unexpected circumstances.
Debt securities are valued at the evaluated bid price provided by an independent pricing service (e.g. taking into account various factors, including yields, maturities, or credit ratings) or, if a reliable price is not available, the quoted bid price from an independent broker-dealer.
Investments in registered open-end investment companies (other than those listed on a foreign or domestic exchange or market) are valued at net asset value.
Investments which are not valued using the methods discussed above are valued at their fair value, as determined in good faith by Allspring Funds Management, LLC (“Allspring Funds Management”), which was named the valuation designee by the Board of Trustees. As the valuation designee, Allspring Funds Management is responsible for day-to-day valuation activities for the Allspring Funds. In connection with these responsibilities, Allspring Funds Management has established a Valuation Committee and has delegated to it the authority to take any actions regarding the valuation of portfolio securities that the Valuation Committee deems necessary or appropriate, including determining the fair value of portfolio securities. On a quarterly basis, the Board of Trustees receives reports of valuation actions taken by the Valuation Committee. On at least an annual basis, the Board of Trustees receives an assessment of the adequacy and effectiveness of Allspring Funds Management’s process for determining the fair value of the portfolio of investments.
Security transactions and income recognition
Securities transactions are recorded on a trade date basis. Realized gains or losses are recorded on the basis of identified cost.
Interest income is accrued daily and bond discounts are accreted and premiums are amortized daily. To the extent debt obligations are placed on non-accrual status, any related interest income may be reduced by writing off interest receivables when the collection of all or a portion of interest has been determined to be doubtful based on consistently applied procedures and the fair value has decreased. If the issuer subsequently resumes interest payments or when the collectability of interest is reasonably assured, the debt obligation is removed from non-accrual status.
Federal and other taxes
The Portfolio is not required to pay federal income taxes on its net investment income and net capital gains as it is treated as a partnership for federal income tax purposes. All income, gains and losses of the Portfolio are deemed to have been “passed through” to the interest holders in proportion to their holdings of the Portfolio regardless of whether income and gains have been distributed by the Portfolio.
The Portfolio’s income tax returns and all financial records supporting those returns for the prior three fiscal years are subject to examination by the federal revenue authority. Management has analyzed the Portfolio’s tax positions taken on federal, state, and foreign tax returns, as applicable, for all open tax years and does not believe that there are any uncertain tax positions that require recognition of a tax liability.
As of August 31, 2023, the aggregate cost of all investments for federal income tax purposes was $14,503,428 and the unrealized gains (losses) consisted of:
12 | Allspring High Yield Corporate Bond Portfolio
Notes to financial statements (unaudited)
3.
FAIR VALUATION MEASUREMENTS
Fair value measurements of investments are determined within a framework that has established a fair value hierarchy based upon the various data inputs utilized in determining the value of the Portfolio’s investments. The three-level hierarchy gives the highest priority to unadjusted quoted prices in active markets for identical assets or liabilities (Level 1) and the lowest priority to unobservable inputs (Level 3). The Portfolio’s investments are classified within the fair value hierarchy based on the lowest level of input that is significant to the fair value measurement. The inputs are summarized into three broad levels as follows:
•Level 1—quoted prices in active markets for identical securities
•Level 2—other significant observable inputs (including quoted prices for similar securities, interest rates, prepayment speeds, credit risk, etc.)
•Level 3—significant unobservable inputs (including the Portfolio’s own assumptions in determining the fair value of investments)
The inputs or methodologies used for valuing investments in securities are not necessarily an indication of the risk associated with investing in those securities.
The following is a summary of the inputs used in valuing the Portfolio’s assets and liabilities as of August 31, 2023:
| | Other significant
observable inputs
(Level 2) | Significant
unobservable inputs
(Level 3) | |
| | | | |
| | | | |
Corporate bonds and notes | | | | |
Yankee corporate bonds and notes | | | | |
| | | | |
| | | | |
| | | | |
Additional sector, industry or geographic detail, if any, is included in the Portfolio of Investments.
For the six months ended August 31, 2023, the Portfolio did not have any transfers into/out of Level 3.
4.
TRANSACTIONS WITH AFFILIATES
Advisory fee
The Trust has entered into an advisory contract with Allspring Funds Management, a wholly owned subsidiary of Allspring Global Investments Holdings, LLC, a holding company indirectly owned by certain private funds of GTCR LLC and Reverence Capital Partners, L.P. The adviser is responsible for implementing investment policies and guidelines and for supervising the subadviser, who is responsible for day-to-day portfolio management of the Portfolio. Pursuant to the contract, Allspring Funds Management is entitled to receive an advisory fee at the following annual rate based on the Portfolio’s average daily net assets:
For the six months ended August 31, 2023, the advisory fee was equivalent to an annual rate of 0.25% of the Portfolio’s average daily net assets.
Allspring Funds Management has retained the services of a subadviser to provide daily portfolio management to the Portfolio. The fee for subadvisory services is borne by Allspring Funds Management. Allspring Global Investments, LLC, an affiliate of Allspring Funds Management and a wholly owned subsidiary of Allspring Global Investments Holdings, LLC, is the subadviser to the Portfolio and is entitled to receive a fee from Allspring Funds Management at an annual rate starting at 0.09% and declining to 0.07% as the average daily net assets of the Portfolio increase.
Allspring Funds Management has voluntarily waived and/or reimbursed expenses to reduce the net operating expense ratio of the Portfolio. These voluntary waivers may be discontinued at any time.
Interfund transactions
The Portfolio may purchase or sell portfolio investment securities to certain affiliates pursuant to Rule 17a-7 under the 1940 Act and under procedures adopted by the Board of Trustees. The procedures have been designed to ensure that these interfund transactions, which do not incur broker commissions, are effected at current market prices. Pursuant to these procedures, the Portfolio did not have any interfund transactions during the six months ended August 31, 2023.
Allspring High Yield Corporate Bond Portfolio | 13
Notes to financial statements (unaudited)
5.
INVESTMENT PORTFOLIO TRANSACTIONS
Purchases and sales of investments, excluding U.S. government obligations (if any) and short-term securities, for the six months ended August 31, 2023 were $3,289,251 and $3,335,266, respectively.
The Trust, along with Allspring Variable Trust and Allspring Funds Trust (excluding the money market funds), are parties to a $350,000,000 revolving credit agreement whereby the Portfolio is permitted to use bank borrowings for temporary or emergency purposes, such as to fund interest holders withdrawal requests. Interest under the credit agreement is charged to the Portfolio based on a borrowing rate equal to the higher of the Federal Funds rate or the overnight bank funding rate in effect on that day plus a spread. In addition, an annual commitment fee based on the unused balance is allocated to each participating fund.
For the six months ended August 31, 2023, there were no borrowings by the Portfolio under the agreement.
Under the Portfolio’s organizational documents, the officers and Trustees have been granted certain indemnification rights against certain liabilities that may arise out of performance of their duties to the Portfolio. The Portfolio has entered into a separate agreement with each Trustee that converts indemnification rights currently existing under the Portfolio’s organizational documents into contractual rights that cannot be changed in the future without the consent of the Trustee. Additionally, in the normal course of business, the Portfolio may enter into contracts with service providers that contain a variety of indemnification clauses. The Portfolio’s maximum exposure under these arrangements is dependent on future claims that may be made against the Portfolio and, therefore, cannot be estimated.
14 | Allspring High Yield Corporate Bond Portfolio
Other information (unaudited)
Other information
Proxy voting information
A description of the policies and procedures used to determine how to vote proxies relating to portfolio securities is available without charge, upon request, by calling 1-866-259-3305, visiting our website at allspringglobal.com, or visiting the SEC website at sec.gov. Information regarding how the proxies related to portfolio securities were voted during the most recent 12-month period ended June 30 is available on the website at allspringglobal.com or by visiting the SEC website at sec.gov.
Quarterly portfolio holdings information
The Portfolio files its complete schedule of portfolio holdings with the SEC for the first and third quarters of each fiscal year as an exhibit to its reports on Form N-PORT. Interest holders may view the filed Form N-PORT by visiting the SEC website at sec.gov.
Allspring High Yield Corporate Bond Portfolio | 15
Other information (unaudited)
Board of trustees and officers
Each of the Trustees and Officers listed in the table below acts in identical capacities for each fund in the Allspring family of funds, which consists of 126 mutual funds comprising the Allspring Funds Trust, Allspring Variable Trust, Allspring Master Trust and four closed-end funds (collectively the “Fund Complex”). This table should be read in conjunction with the Prospectus and the Statement of Additional Information1. The mailing address of each Trustee and Officer is 1415 Vantage Park Drive, 3rd Floor, Charlotte, NC 28203. Each Trustee and Officer serves an indefinite term, however, each Trustee serves such term until reaching the mandatory retirement age established by the Trustees.
Independent Trustees
| | Principal occupations during past five years or longer | Current other
public company or
investment
company
directorships |
William R. Ebsworth
(Born 1957) | | Retired. From 1984 to 2013, equities analyst, portfolio manager, research director and chief investment officer at Fidelity Management and Research Company in Boston, Tokyo, and Hong Kong, and retired in 2013 as Chief Investment Officer of Fidelity Strategic Advisers, Inc. where he led a team of investment professionals managing client assets. Prior thereto, Board member of Hong Kong Securities Clearing Co., Hong Kong Options Clearing Corp., the Thailand International Fund, Ltd., Fidelity Investments Life Insurance Company, and Empire Fidelity Investments Life Insurance Company. Audit Committee Chair and Investment Committee Chair of the Vincent Memorial Hospital Foundation (non-profit organization). Mr. Ebsworth is a CFA charterholder. | |
Jane A. Freeman
(Born 1953) | Trustee,
since 2015;
Chair Liaison,
since 2018 | Retired. From 2012 to 2014 and 1999 to 2008, Chief Financial Officer of Scientific Learning Corporation. From 2008 to 2012, Ms. Freeman provided consulting services related to strategic business projects. Prior to 1999, Portfolio Manager at Rockefeller & Co. and Scudder, Stevens & Clark. Board member of the Harding Loevner Funds from 1996 to 2014, serving as both Lead Independent Director and chair of the Audit Committee. Board member of the Russell Exchange Traded Funds Trust from 2011 to 2012 and the chair of the Audit Committee. Ms. Freeman is also an inactive Chartered Financial Analyst. | |
Isaiah Harris, Jr.
(Born 1952) | Trustee,
since 2009;
Audit Committee Chair,
since 2019 | Retired. Member of the Advisory Board of CEF of East Central Florida. Chairman of the Board of CIGNA Corporation from 2009 to 2021, and Director from 2005 to 2008. From 2003 to 2011, Director of Deluxe Corporation. Prior thereto, President and CEO of BellSouth Advertising and Publishing Corp. from 2005 to 2007, President and CEO of BellSouth Enterprises from 2004 to 2005 and President of BellSouth Consumer Services from 2000 to 2003. Emeritus member of the Iowa State University Foundation Board of Governors. Emeritus Member of the Advisory board of Iowa State University School of Business. Advisory Board Member, Palm Harbor Academy (private school). Advisory Board Member, Fellowship of Christian Athletes. Mr. Harris is a certified public accountant (inactive status). | |
David F. Larcker
(Born 1950) | | Distinguished Visiting Fellow at the Hoover Institution since 2022. James Irvin Miller Professor of Accounting at the Graduate School of Business (Emeritus), Stanford University, Director of the Corporate Governance Research Initiative and Senior Faculty of The Rock Center for Corporate Governance since 2006. From 2005 to 2008, Professor of Accounting at the Graduate School of Business, Stanford University. Prior thereto, Ernst & Young Professor of Accounting at The Wharton School, University of Pennsylvania from 1985 to 2005. | |
Olivia S. Mitchell
(Born 1953) | Trustee,
since 2006;
Nominating and Governance Committee Chair,
since 2018 | International Foundation of Employee Benefit Plans Professor since 1993, Wharton School of the University of Pennsylvania. Director of Wharton’s Pension Research Council and Boettner Center on Pensions & Retirement Research, and Research Associate at the National Bureau of Economic Research. Previously taught at Cornell University from 1978 to 1993. | |
Timothy J. Penny
(Born 1951) | Trustee,
since 1996;
Chair,
since 2018 | President and Chief Executive Officer of Southern Minnesota Initiative Foundation, a non-profit organization, since 2007. Vice Chair of the Economic Club of Minnesota, since 2007. Co-Chair of the Committee for a Responsible Federal Budget, since 1995. Member of the Board of Trustees of NorthStar Education Finance, Inc., a non-profit organization, from 2007-2022. Senior Fellow of the University of Minnesota Humphrey Institute from 1995 to 2017. | |
1
The Statement of Additional Information includes additional information about the Trustees and is available, without charge, upon request, by calling 1-800-222-8222 or by visiting the website at allspringglobal.com.
16 | Allspring High Yield Corporate Bond Portfolio
Other information (unaudited)
| Position held and length of service* | Principal occupations during past five years or longer | Current other public company or investment company directorships |
James G. Polisson
(Born 1959) | | Retired. Chief Marketing Officer, Source (ETF) UK Services, Ltd, from 2015 to 2017. From 2012 to 2015, Principal of The Polisson Group, LLC, a management consulting, corporate advisory and principal investing company. Chief Executive Officer and Managing Director at Russell Investments, Global Exchange Traded Funds from 2010 to 2012. Managing Director of Barclays Global Investors from 1998 to 2010 and Global Chief Marketing Officer for iShares and Barclays Global Investors from 2000 to 2010. Trustee of the San Francisco Mechanics’ Institute, a non- profit organization, from 2013 to 2015. Board member of the Russell Exchange Traded Fund Trust from 2011 to 2012. Director of Barclays Global Investors Holdings Deutschland GmbH from 2006 to 2009. Mr. Polisson is an attorney and has a retired status with the Massachusetts and District of Columbia Bar Associations. | |
Pamela Wheelock
(Born 1959) | Trustee,
since January 2020;
previously Trustee from
January 2018 to
July 2019 | Retired. Executive and Senior Financial leadership positions in the public, private and nonprofit sectors. Interim President and CEO, McKnight Foundation, 2020. Interim Commissioner, Minnesota Department of Human Services, 2019. Chief Operating Officer, Twin Cities Habitat for Humanity, 2017-2019. Vice President for University Services, University of Minnesota, 2012- 2016. Interim President and CEO, Blue Cross and Blue Shield of Minnesota, 2011-2012. Executive Vice-President and Chief Financial Officer, Minnesota Wild, 2002-2008. Commissioner, Minnesota Department of Finance, 1999-2002. Chair of the Board of Directors of Destination Medical Center Corporation. Board member of the Minnesota Wild Foundation. | |
| Length of service dates reflect the Trustee’s commencement of service with the Trust’s predecessor entities, where applicable. |
Allspring High Yield Corporate Bond Portfolio | 17
Other information (unaudited)
Officers1
| Position held and
length of service | Principal occupations during past five years or longer |
| | President and Chief Executive Officer of Allspring Funds Management, LLC since 2017 and Head of Global Fund Governance of Allspring Global Investments since 2022. Prior thereto, co-president of Galliard Capital Management, LLC, an affiliate of Allspring Funds Management, LLC, from 2019 to 2022 and Head of Affiliated Managers, Allspring Global Investments, from 2014 to 2019 and Executive Vice President responsible for marketing, investments and product development for Allspring Funds Management, LLC, from 2009 to 2014. |
Jeremy DePalma
(Born 1974) | Treasurer,
since 2012
(for certain funds in
the Fund Complex);
since 2021 (for
the remaining funds in the Complex) | Senior Vice President of Allspring Funds Management, LLC since 2009. Senior Vice President of Evergreen Investment Management Company, LLC from 2008 to 2010 and head of the Fund Reporting and Control Team within Fund Administration from 2005 to 2010. |
Christopher Baker
(Born 1976) | Chief Compliance Officer,
since 2022 | Global Chief Compliance Officer for Allspring Global Investments since 2022. Prior thereto, Chief Compliance Officer for State Street Global Advisors from 2018 to 2021. Senior Compliance Officer for the State Street divisions of Alternative Investment Solutions, Sector Solutions, and Global Marketing from 2015 to 2018. From 2010 to 2015 Vice President, Global Head of Investment and Marketing Compliance for State Street Global Advisors. |
Matthew Prasse
(Born 1983) | Chief Legal Officer,
since 2022;
Secretary,
since 2021 | Senior Counsel of the Allspring Legal Department since 2021. Senior Counsel of the Wells Fargo Legal Department from 2018 to 2021. Previously, Counsel for Barings LLC from 2015 to 2018. Prior to joining Barings, Associate at Morgan, Lewis & Bockius LLP from 2008 to 2015. |
1 For those Officers with tenures at Allspring Global Investments and/or Allspring Funds Management, LLC that began prior to 2021, such tenures include years of service during which these businesses/entities were known as Wells Fargo Asset Management and Wells Fargo Funds Management, LLC, respectively.
18 | Allspring High Yield Corporate Bond Portfolio
Other information (unaudited)
Board consideration of investment advisory and sub-advisory agreements:
Allspring Bloomberg US Aggregate ex-Corporate Portfolio, Allspring Emerging Markets Bond Portfolio, Allspring Factor Enhanced Emerging Markets Equity Portfolio, Allspring Factor Enhanced International Equity Portfolio, Allspring Factor Enhanced U.S. Large Cap Equity Portfolio, Allspring Factor Enhanced U.S. Small Cap Equity Portfolio, Allspring High Yield Corporate Bond Portfolio, Allspring Investment Grade Corporate Bond Portfolio, Allspring Strategic Retirement Bond Portfolio, and Allspring U.S. REIT Portfolio
Under the Investment Company Act of 1940 (the “1940 Act”), the Board of Trustees (the “Board”) of Allspring Master Trust (the “Trust”) must determine annually whether to approve the continuation of the Trust’s investment advisory and sub-advisory agreements. In this regard, at a meeting held on May 15-17, 2023 (the “Meeting”), the Board, all the members of which have no direct or indirect interest in the investment advisory and sub-advisory agreements and are not “interested persons” of the Trust, as defined in the 1940 Act (the “Independent Trustees”), reviewed and approved for each of the portfolios of the Trust identified in the table below (individually, a “Portfolio” and collectively, the “Portfolios”): (i) an investment advisory agreement (the “Advisory Agreement”) with Allspring Funds Management, LLC (“Allspring Funds Management”); and (ii) an investment sub-advisory agreement (each, a “Sub-Advisory Agreement” and collectively, the “Sub-Advisory Agreements”) with the Sub-Advisers(s) identified in the table below (each, a “Sub-Adviser” and collectively, the “Sub-Advisers”) for the corresponding Portfolio identified. The Advisory Agreement and the Sub-Advisory Agreements are collectively referred to as the “Advisory Agreements.”
| |
Allspring Bloomberg Barclays US Aggregate ex-Corporate Portfolio | Allspring Global Investments, LLC |
Allspring Emerging Markets Bond Portfolio | Allspring Global Investments, LLC, Allspring Global Investments (UK) Limited |
Allspring Factor Enhanced Emerging Markets Equity Portfolio | Allspring Global Investments, LLC |
Allspring Factor Enhanced International Equity Portfolio | Allspring Global Investments, LLC |
Allspring Factor Enhanced U.S. Large Cap Equity Portfolio | Allspring Global Investments, LLC |
Allspring Factor Enhanced U.S. Small Cap Equity Portfolio | Allspring Global Investments, LLC |
Allspring High Yield Corporate Bond Portfolio | Allspring Global Investments, LLC |
Allspring Investment Grade Corporate Bond Portfolio | Allspring Global Investments, LLC |
Allspring Strategic Retirement Bond Portfolio | Allspring Global Investments, LLC |
Allspring U.S. REIT Portfolio | Allspring Global Investments, LLC |
At the Meeting, the Board considered the factors and reached the conclusions described below relating to the selection of Allspring Funds Management and the Sub-Advisers and the approval of the Advisory Agreements. Prior to the Meeting, including at a Board meeting held in April 2023, the Trustees conferred extensively among themselves and with representatives of Allspring Funds Management about these matters. The Board has adopted a team-based approach, with each team consisting of a sub-set of Trustees, to assist the full Board in the discharge of its duties in reviewing investment performance and other matters throughout the year. The Independent Trustees were assisted in their evaluation of the Advisory Agreements by independent legal counsel, from whom they received separate legal advice and with whom they met separately.
The Board noted that it initially approved the Advisory Agreements at a Board meeting held in May 2021, each for a two-year term, in advance of the sale of Wells Fargo Asset Management to Allspring Global Investments Holdings, LLC,1 a holding company indirectly owned by certain private funds of GTCR LLC and Reverence Capital Partners, L.P. (the “Transaction”). The Trustees also noted that, while they did not specifically consider the continuation of the Advisory Agreements in 2022 as a result of the two-year term that was approved in 2021, the Trustees received and considered certain information at a Board meeting held in April 2022 that was applicable to the Advisory Agreements, including an overview and financial review of the Allspring Global Investments business, information regarding certain ancillary agreements that were approved by the Board at the April 2022 Board meeting, and comparative data regarding Fund fees and expenses.
In providing information to the Board, Allspring Funds Management and the Sub-Advisers were guided by a detailed set of requests for information submitted to them by independent legal counsel on behalf of the Independent Trustees at the start of the Board’s annual contract renewal process earlier in 2023. In considering and approving the Advisory Agreements, the Trustees considered the information they believed relevant, including but not limited to the information discussed below. The Board considered not only the specific information presented in connection with the Meeting, but also the knowledge gained over time through interaction with Allspring Funds Management and the Sub-Advisers about various topics. In this regard, the Board reviewed reports of Allspring Funds Management at each of its quarterly meetings, which included, among other things, portfolio reviews and investment performance reports. In addition, the Board and the teams mentioned above confer with portfolio managers at various times throughout the year. The Board did not identify any particular information or consideration that was all-important or controlling, and each individual Trustee may have attributed different weights to various factors.
1
The trade name for the asset management firm that includes Allspring Funds Management and the Sub-Adviser is “Allspring Global Investments.”
Allspring High Yield Corporate Bond Portfolio | 19
Other information (unaudited)
After its deliberations, the Board unanimously determined that the compensation or the absence of compensation payable to Allspring Funds Management and each of the Sub-Advisers under each of the Advisory Agreements was reasonable, and approved the continuation of the Advisory Agreements for a one-year term. The Board considered the approval of the Advisory Agreements for the Portfolios as part of its consideration of agreements for funds across the complex, but its approvals were made on a fund-by-fund basis. The following summarizes a number of important, but not necessarily all, factors considered by the Board in support of its approvals.
Nature, extent and quality of services
The Board received and considered various information regarding the nature, extent, and quality of services provided to the Portfolios by Allspring Funds Management and the Sub-Advisers under the Advisory Agreements. This information included a description of the investment advisory services and Portfolio-level administrative services covered by the Advisory Agreement, as well as, among other things, a summary of the background and experience of senior management of Allspring Global Investments, of which Allspring Funds Management and the Sub-Advisers are a part, and a summary of investments made in the Allspring Global Investments business. The Board also considered information about retention arrangements with respect to key personnel of Allspring Global Investments that were put in place in connection with the Transaction. The Board took into account information about the services that continue to be provided by Wells Fargo & Co. and/or its affiliates (“Wells Fargo”) since the Transaction under a transition services agreement and the anticipated timeline for exiting the transition services agreement. In addition, the Board received and considered information about the full range of services provided to the Fund by Allspring Funds Management and its affiliates.
The Board considered the qualifications, background, tenure, and responsibilities of each of the portfolio managers primarily responsible for the day-to-day portfolio management of the Portfolios. The Board evaluated the ability of Allspring Funds Management and the Sub-Advisers to attract and retain qualified investment professionals, including research, advisory, and supervisory personnel.
The Board further considered the compliance programs and compliance records of Allspring Funds Management and the Sub-Advisers. The Board received and considered information about Allspring Global Investments’ risk management functions, which included information about Allspring Funds Management’s and the Sub-Advisers’ business continuity plans, their approaches to data privacy and cybersecurity, and Allspring Funds Management’s role as administrator of the Portfolios’ liquidity risk management program, and the derivatives risk management program for Allspring Bloomberg Barclays US Aggregate ex-Corporate Portfolio and Allspring Factor Enhanced U.S. Large Cap Equity Portfolio. The Board also received and considered information about Allspring Funds Management’s intermediary and vendor oversight program.
Portfolio investment performance and expenses
The Board considered the investment performance results for each of the Portfolios over various time periods ended December 31, 2022. The Board considered these results in comparison to the investment performance of funds in a universe that was determined by Broadridge Inc. (“Broadridge”) to be similar to each respective Portfolios (each, a “Universe”), and in comparison to each Portfolios’ benchmark index and to other comparative data. Broadridge is an independent provider of investment company data. The Board received a description of the methodology used by Broadridge to select the mutual funds in the performance Universe. The Board noted the short performance history of the Portfolios.
With respect to the investment performance of each Portfolio relative to its respective Universe, the Board noted the following: (i) the investment performance of Allspring Bloomberg US Aggregate ex-Corporate Portfolio was higher than the average investment performance of the Universe for all periods under review; the investment performance of Allspring Bloomberg US Aggregate ex-Corporate Portfolio was higher than the investment performance of its benchmark index, the Bloomberg U.S. Aggregate ex Corporate Index, for the one-year period and was in range of the investment performance of its benchmark index for the three- and five-year periods under review; (ii) the investment performance of Allspring Emerging Markets Bond Portfolio was lower than the average investment performance of the Universe for the one- and three-year periods and was in range of the average investment performance of the Universe for the five-year period; the investment performance of Allspring Emerging Markets Bond Portfolio was higher than the investment performance of its benchmark index, the J.P. Morgan EM Bond Global Diversified Index, for the one-year period and was in range of the investment performance of its benchmark index for the three- and five-year periods under review; (iii) the investment performance of Allspring Factor Enhanced Emerging Markets Equity Portfolio was higher than the average investment performance of the Universe for the one-year period and was lower than the average investment performance of the Universe for the three- and five-year periods; the investment performance of Allspring Factor Enhanced Emerging Markets Equity Portfolio was higher than the investment performance of its benchmark index, the MSCI Emerging Markets Index (Net), for the one-year period and was lower than the investment performance of its benchmark index for the three- and five-year periods under review; (iv) the investment performance of Allspring Factor Enhanced International Equity Portfolio was higher than the average investment performance of the Universe for all periods under review; the investment performance of Allspring Factor Enhanced International Equity Portfolio was higher than the investment performance of its benchmark index, the MSCI World ex US Index (Net), for all periods under review; (v) the investment performance of Allspring Factor Enhanced U.S. Large Cap Equity Portfolio was higher than the average investment performance of the Universe for the one- and five-year periods and was lower than the average investment performance of the Universe for the three-year period; the investment performance of Allspring Factor Enhanced U.S. Large Cap Equity Portfolio was higher than the investment performance of its benchmark index, the Russell 1000® Index, for the one-year period and was lower than the investment performance of its benchmark index for the three- and five-year periods under review; (vi) the investment performance of Allspring Factor Enhanced U.S. Small Cap Equity Portfolio was lower than the average investment performance of the Universe for all periods under review; the investment performance of Allspring Factor Enhanced U.S. Small Cap Equity Portfolio was higher than the
20 | Allspring High Yield Corporate Bond Portfolio
Other information (unaudited)
investment performance of its benchmark index, the Russell 2000® Index, for the one-year period and was lower than the investment performance of its benchmark index for the three- and five-year periods under review; (vii) the investment performance of Allspring High Yield Corporate Bond Portfolio was lower than the average investment performance of the Universe for all periods under review; the investment performance of Allspring High Yield Corporate Bond Portfolio was in range of the investment performance of its benchmark index, the Bloomberg U.S. Corporate High Yield 2% Issuer Capped, for the one-year period and was lower than the investment performance of its benchmark index for the three- and five-year periods under review; (viii) the investment performance of Allspring Investment Grade Corporate Bond Portfolio was higher than the average investment performance of the Universe for the one- and five-year periods and in rage of the average investment performance of the Universe for the three-year period; the investment performance of Allspring Investment Grade Corporate Bond Portfolio was higher than the investment performance of its benchmark index, the Bloomberg U.S. Corporate Bond Index, for the one-year period and was in range of the investment performance of its benchmark index for the three- and five-year periods under review; (ix) the investment performance of Allspring Strategic Retirement Bond Portfolio was higher than the average investment performance of the Universe for all periods under review; the investment performance of Allspring Strategic Retirement Bond Portfolio was higher than the investment performance of its benchmark index, the Strategic Retirement Blended Index, for the one- and three-year periods and was in range of the investment performance of its benchmark index for the five-year period; (x) the investment performance of Allspring U.S. REIT Portfolio was lower than the average investment performance of the Universe for the one-year period and was in range of the average investment performance of the Universe for the three- and five-year periods; the investment performance of Allspring U.S. REIT Portfolio was higher than the investment performance of its benchmark index, the Dow Jones U.S. Select REIT Index, for all periods under review.
The Board received information concerning, and discussed factors contributing to, the underperformance of each of Allspring Emerging Markets Bond Portfolio, Allspring Factor Enhanced Emerging Markets Equity Portfolio, Allspring Factor Enhanced U.S. Large Cap Equity Portfolio, Allspring Factor Enhanced U.S. Small Cap Equity Portfolio and Allspring High Yield Corporate Bond Portfolio relative to such Portfolio’s Universe and benchmark index for the periods identified above. The Board took note of the explanations for the relative underperformance during these periods, including with respect to investment decisions and market factors that affected each Portfolio’s investment performance.
The Board also received and considered information regarding the fee rates that are payable to Allspring Funds Management for investment advisory services (as discussed below), which are the only fees charged to the Portfolios, relative to corresponding class-specific expense groups that were determined by Broadridge to be similar to the Portfolios (the “Groups”). The Board received a description of the methodology used by Broadridge to select the mutual funds in the expense Groups and an explanation of how funds comprising expense groups and their expense ratios may vary from year-to-year.
The Board took into account the Portfolios’ investment performance and expense information provided to it among the factors considered in deciding to re-approve the Advisory Agreements.
Investment advisory and sub-advisory fee rates
The Board reviewed and considered the contractual fee rates payable by the Portfolios to Allspring Funds Management under the Advisory Agreement. The Board also reviewed and considered the contractual investment sub-advisory fee rates that are payable by Allspring Funds Management to the Sub-Advisers for investment sub-advisory services.
Among other information reviewed by the Board was a comparison of the Portfolios’ Advisory Rates with the average contractual investment advisory fee rates of funds in the expense Groups at a common asset level as well as transfer agency costs of the Portfolios in the expense Groups. The Board noted that the Advisory Rates of the Portfolios were lower than or in range of the mean rates for the Portfolios’ expense Groups.
The Board also received and considered information about the portions of the total advisory fees that were retained by Allspring Funds Management after payment of the fees to the Sub-Advisers for sub-advisory services. In assessing the reasonableness of these amounts, the Board received and evaluated information about the nature and extent of responsibilities retained and risks assumed by Allspring Funds Management and not delegated to or assumed by the Sub-Advisers, and about Allspring Funds Management’s on-going oversight services. Given the affiliation between Allspring Funds Management and the Sub-Advisers, the Board ascribed limited relevance to the allocation of fees between them.
For all Portfolios, except Allspring Factor Enhanced U.S. Small Cap Equity Portfolio, Allspring Factor Enhanced International Equity Portfolio, Allspring Factor Enhanced Emerging Markets Equity Portfolio, Allspring U.S. REIT Portfolio, Allspring Investment Grade Corporate Bond Portfolio, and Allspring Strategic Retirement Bond Portfolio, the Board also received and considered information about the nature and extent of services offered and fee rates charged by Allspring Funds Management and the Sub-Advisers to other types of clients with investment strategies similar to those of certain Portfolios. In this regard, the Board received information about the significantly greater scope of services, and compliance, reporting and other legal burdens and risks of managing proprietary mutual funds compared with those associated with managing assets of other types of clients, including third-party sub-advised fund clients and non-mutual fund clients such as institutional separate accounts.
Based on its consideration of the factors and information it deemed relevant, including those described here, the Board determined that the compensation payable to Allspring Funds Management under the Advisory Agreement and to the Sub-Advisers under the Sub-Advisory Agreements was reasonable.
Allspring High Yield Corporate Bond Portfolio | 21
Other information (unaudited)
Profitability
The Board received and considered information concerning the profitability of Allspring Funds Management, as well as the profitability of Allspring Global Investments, from providing services to the fund complex as a whole. The Board noted that the Sub-Adviser’s profitability information with respect to providing services to the Portfolios and other funds in the complex was subsumed in the Allspring Global Investments profitability analysis.
Allspring Funds Management reported on the methodologies and estimates used in calculating profitability, including a description of the methodology used to allocate certain expenses and differences in how Allspring Global Investments calculates its pre-tax profit metric versus the methodology used when Allspring Funds Management was part of Wells Fargo. It was noted that the impact of such differences had only minor impact on the financial results presented. Among other things, the Board noted that the levels of profitability reported on a fund-by-fund basis varied widely, depending on factors such as the size, type, and age of fund.
Based on its review, the Board did not deem the profits reported by Allspring Funds Management or Allspring Global Investments from services provided to the Portfolios to be at a level that would prevent it from approving the continuation of the Advisory Agreements.
Economies of scale
The Board received and considered information about the potential for Allspring Funds Management to experience economies of scale in the provision of management services to the Portfolios, the difficulties of calculating economies of scale at an individual fund level, and the extent to which potential scale benefits are shared with Portfolio shareholders. The Board noted the existence of breakpoints in the Portfolios’ advisory fee structure, which operate generally to reduce the Portfolios’ expense ratios as the Portfolios grow in size, and the size of the Portfolios in relation to such breakpoints. The Board considered that in addition to advisory fee breakpoints, Allspring Funds Management shares potential economies of scale from its management business in a variety of ways, including through fee waiver and expense reimbursement arrangements, competitive advisory fee rates set at the outset without regard to breakpoints, and investments in the business intended to enhance services available to shareholders.
The Board concluded that Allspring Funds Management’s arrangements with respect to the Portfolios, including contractual breakpoints, constituted a reasonable approach to sharing potential economies of scale with the Portfolios and their shareholders.
Other benefits to Allspring Funds Management and the Sub-Advisers
The Board received and considered information regarding potential “fall-out” or ancillary benefits received by Allspring Funds Management and its affiliates, including the Sub-Advisers, as a result of their relationships with the Portfolios. Ancillary benefits could include, among others, benefits directly attributable to other relationships with the Portfolios and benefits potentially derived from an increase in Allspring Funds Management’s and the Sub-Advisers’ businesses as a result of their relationships with the Portfolios. The Board noted that Allspring Funds Distributor, LLC, an affiliate of Allspring Funds Management, receives distribution-related fees in respect of shares sold or held through it.
The Board also reviewed information about soft dollar credits earned and utilized by the Sub-Advisers and fees earned in the past by Allspring Funds Management and the Sub-Advisers from managing a private investment vehicle for the fund complex’s securities lending collateral.
Based on its consideration of the factors and information it deemed relevant, including those described here, the Board did not find that any ancillary benefits received by Allspring Funds Management and its affiliates, including the Sub-Advisers, were unreasonable.
Conclusion
At the Meeting, after considering the above-described factors and based on its deliberations and its evaluation of the information described above, the Board unanimously determined that the compensation payable to Allspring Funds Management and the Sub-Advisers under each of the Advisory Agreements was reasonable, and approved the continuation of the Advisory Agreements for a one-year term.
22 | Allspring High Yield Corporate Bond Portfolio
Other information (unaudited)
Liquidity risk management program
In accordance with Rule 22e-4 under the Investment Company Act of 1940, as amended (the “Liquidity Rule”), Allspring Master Trust (the “Trust”) has adopted and implemented a liquidity risk management program (the “Program”) on behalf of each of its series, including the Portfolio, which is reasonably designed to assess and manage the Portfolio’s liquidity risk. “Liquidity risk” is defined under the Liquidity Rule as the risk that the Portfolio is unable to meet redemption requests without significantly diluting remaining investors’ interests in the Portfolio. The Trust’s Board of Trustees (the “Board”) previously approved the designation of Allspring Funds Management, LLC (“Allspring Funds Management”), the Portfolio’s investment adviser, to administer the Program, and Allspring Funds Management has established a Liquidity Risk Management Council (the “Council”) composed of personnel from multiple departments within Allspring Funds Management and its affiliates to assist Allspring Funds Management in the administration of the Program.
The Program is comprised of various components designed to support the assessment and/or management of liquidity risk, including: (1) the periodic assessment (no less frequently than annually) of certain factors that influence the Portfolio’s liquidity risk; (2) the periodic classification (no less frequently than monthly) of the Portfolio’s investments into one of four liquidity categories that reflect an estimate of their liquidity under current market conditions; (3) a 15% limit on the acquisition of “illiquid investments” (as defined under the Liquidity Rule); (4) to the extent the Portfolio does not invest primarily in “highly liquid investments” (as defined under the Liquidity Rule), the determination of a minimum percentage of the Portfolio’s assets that generally will be invested in highly liquid investments (an “HLIM”); (5) if the Portfolio has established an HLIM, the periodic review (no less frequently than annually) of the HLIM and the adoption of policies and procedures for responding to a shortfall of the Portfolio’s “highly liquid investments” below its HLIM; and (6) periodic reporting to the Board.
At a meeting of the Board held on May 16-17, 2023, the Board received and reviewed a written report (the “Report”) from Allspring Funds Management that, among other things, addressed the operation of the Program and assessed its adequacy and effectiveness for the period from January 1, 2022 through December 31, 2022 (the “Reporting Period”). The Report noted significant liquidity events impacting the Portfolios related to extended foreign market holidays as well as the difficulty of trading and settlement of most Russia-related securities due to sanctions activity. The Report noted that there were no material changes to the Program during the Reporting Period.
Allspring Funds Management determined in the Report that the Program has been implemented and operates effectively to manage each Portfolio’s, including the Portfolio’s, liquidity risk, and Allspring Funds Management continues to believe that the Program has been and continues to be adequately and effectively implemented to monitor and, as applicable, respond to the Portfolio’s liquidity developments.
There can be no assurance that the Program will achieve its objectives under all circumstances in the future.
Allspring High Yield Corporate Bond Portfolio | 23
This page is intentionally left blank.
For more information
More information about Allspring Funds is available free upon request. To obtain literature, please write, visit the Portfolio’s website, or call:
Allspring Funds
P.O. Box 219967
Kansas City, MO 64121-9967
Website: allspringglobal.com
Individual investors: 1-800-222-8222
Retail investment professionals: 1-888-877-9275
Institutional investment professionals: 1-800-260-5969
This report and the financial statements contained herein are submitted for the general information of the interest holders of the Portfolio. If this report is used for promotional purposes, distribution of the report must be accompanied or preceded by a current prospectus. Before investing, please consider the investment objectives, risks, charges, and expenses of the investment. For a current prospectus and, if available, a summary prospectus, containing this information, call 1-800-222-8222 or visit the Portfolio’s website at allspringglobal.com. Read the prospectus carefully before you invest or send money.
Allspring Global InvestmentsTM is the trade name for the asset management firms of Allspring Global Investments Holdings, LLC, a holding company indirectly owned by certain private funds of GTCR LLC and Reverence Capital Partners, L.P. These firms include but are not limited to Allspring Global Investments, LLC, and Allspring Funds Management, LLC. Certain products managed by Allspring entities are distributed by Allspring Funds Distributor, LLC (a broker-dealer and Member FINRA/SIPC).
This material is for general informational and educational purposes only and is NOT intended to provide investment advice or a recommendation of any kind - including a recommendation for any specific investment, strategy, or plan.
© 2023 Allspring Global Investments Holdings, LLC. All rights reserved.
Allspring Investment Grade Corporate Bond Portfolio
Semi-Annual Report
August 31, 2023
Allspring Investment Grade Corporate Bond Portfolio | 1
Portfolio information (unaudited)
| The Portfolio seeks to replicate the total return of the Bloomberg U.S. Corporate Bond Index,1 before fees and expenses. |
| Allspring Funds Management, LLC |
| Allspring Global Investments, LLC |
| Manjunath Boraiah, Mark Clegg, CFA, Brian Prucyk, Janet S. Rilling, CFA, CPA |
Ten largest holdings (%) as of August 31, 20231 |
Andrew W Mellon Foundation, 0.95%, 8-1-2027 | |
CHRISTUS Health, 4.34%, 7-1-2028 | |
Boston Scientific Corp., 1.90%, 6-1-2025 | |
Johnson & Johnson, 4.38%, 12-5-2033 | |
Air Lease Corp., 2.30%, 2-1-2025 | |
National Australia Bank Ltd., 2.50%, 7-12-2026 | |
Toronto-Dominion Bank, 3.63%, 9-15-2031 | |
Walt Disney Co., 2.65%, 1-13-2031 | |
Kemper Corp., 4.35%, 2-15-2025 | |
Eaton Corp., 4.15%, 3-15-2033 | |
| Figures represent the percentage of the Portfolio’s net assets. Holdings are subject to change and may have changed since the date specified. |
Sector allocation as of August 31, 20231 |
| Figures represent the percentage of the Portfolio’s long-term investments. Allocations are subject to change and may have changed since the date specified. |
| CFA® and Chartered Financial Analyst® are trademarks owned by CFA Institute. |
| The Bloomberg U.S. Corporate Bond Index is an unmanaged market-value-weighted index of investment-grade corporate fixed-rate debt issues with maturities of one year or more. You cannot invest directly in an index. |
2 | Allspring Investment Grade Corporate Bond Portfolio
Portfolio of investments—August 31, 2023 (unaudited)
| | | | | |
Corporate bonds and notes: 80.78% | | | | | | |
| | | | | | |
| | | | | | |
Celanese U.S. Holdings LLC | | | | | | |
| | | | | | |
| | | | | | |
| | | | | | |
LYB International Finance III LLC | | | | | | |
| | | | | | |
| | | | | | |
| | | | | | |
| | | | | | |
| | | | | | |
| | | | | | |
| | | | | | |
| | | | | | |
| | | | | | |
| | | | | | |
| | | | | | |
| | | | | | |
| | | | | | |
| | | | | | |
| | | | | | |
Charter Communications Operating LLC/Charter Communications Operating Capital | | | | | | |
Charter Communications Operating LLC/Charter Communications Operating Capital | | | | | | |
| | | | | | |
| | | | | | |
| | | | | | |
Discovery Communications LLC | | | | | | |
Discovery Communications LLC | | | | | | |
| | | | | | |
| | | | | | |
| | | | | | |
| | | | | | |
Telecommunications: 2.61% | | | | | | |
| | | | | | |
| | | | | | |
| | | | | | |
| | | | | | |
| | | | | | |
| | | | | | |
The accompanying notes are an integral part of these financial statements.
Allspring Investment Grade Corporate Bond Portfolio | 3
Portfolio of investments—August 31, 2023 (unaudited)
| | | | | |
Telecommunications (continued) | | | | | | |
Verizon Communications, Inc. | | | | | | |
Verizon Communications, Inc. | | | | | | |
| | | | | | |
Consumer, cyclical: 4.12% | | | | | | |
| | | | | | |
American Airlines Pass-Through Trust Series 2016-2 Class AA | | | | | | |
United Airlines Pass-Through Trust Series 2013-1 Class A | | | | | | |
| | | | | | |
| | | | | | |
| | | | | | |
Auto manufacturers: 0.37% | | | | | | |
| | | | | | |
General Motors Financial Co., Inc. | | | | | | |
| | | | | | |
Distribution/wholesale: 0.31% | | | | | | |
| | | | | | |
| | | | | | |
Warnermedia Holdings, Inc. | | | | | | |
| | | | | | |
| | | | | | |
| | | | | | |
| | | | | | |
| | | | | | |
| | | | | | |
| | | | | | |
| | | | | | |
| | | | | | |
Consumer, non-cyclical: 16.54% | | | | | | |
| | | | | | |
| | | | | | |
| | | | | | |
Philip Morris International, Inc. | | | | | | |
Philip Morris International, Inc. | | | | | | |
| | | | | | |
| | | | | | |
| | | | | | |
Anheuser-Busch Cos. LLC/Anheuser-Busch InBev Worldwide, Inc. | | | | | | |
Anheuser-Busch InBev Worldwide, Inc. | | | | | | |
Anheuser-Busch InBev Worldwide, Inc. | | | | | | |
| | | | | | |
Constellation Brands, Inc. | | | | | | |
The accompanying notes are an integral part of these financial statements.
4 | Allspring Investment Grade Corporate Bond Portfolio
Portfolio of investments—August 31, 2023 (unaudited)
| | | | | |
| | | | | | |
| | | | | | |
Molson Coors Beverage Co. | | | | | | |
| | | | | | |
| | | | | | |
| | | | | | |
| | | | | | |
| | | | | | |
| | | | | | |
| | | | | | |
Commercial services: 0.19% | | | | | | |
Ford Foundation Series 2020 | | | | | | |
Cosmetics/Personal Care: 0.18% | | | | | | |
| | | | | | |
| | | | | | |
| | | | | | |
| | | | | | |
Mondelez International, Inc. | | | | | | |
| | | | | | |
| | | | | | |
| | | | | | |
Healthcare-products: 1.28% | | | | | | |
| | | | | | |
| | | | | | |
| | | | | | |
| | | | | | |
Healthcare-services: 3.57% | | | | | | |
| | | | | | |
| | | | | | |
Baptist Health South Florida Obligated Group Series 2021 | | | | | | |
| | | | | | |
| | | | | | |
| | | | | | |
| | | | | | |
| | | | | | |
| | | | | | |
| | | | | | |
| | | | | | |
| | | | | | |
| | | | | | |
| | | | | | |
Household products/wares: 0.20% | | | | | | |
| | | | | | |
The accompanying notes are an integral part of these financial statements.
Allspring Investment Grade Corporate Bond Portfolio | 5
Portfolio of investments—August 31, 2023 (unaudited)
| | | | | |
| | | | | | |
| | | | | | |
| | | | | | |
| | | | | | |
| | | | | | |
| | | | | | |
| | | | | | |
| | | | | | |
| | | | | | |
Mead Johnson Nutrition Co. | | | | | | |
| | | | | | |
| | | | | | |
| | | | | | |
| | | | | | |
| | | | | | |
| | | | | | |
BP Capital Markets America, Inc. | | | | | | |
| | | | | | |
| | | | | | |
| | | | | | |
| | | | | | |
| | | | | | |
Oil & gas services: 0.93% | | | | | | |
Baker Hughes Holdings LLC/Baker Hughes Co.-Obligor, Inc. | | | | | | |
| | | | | | |
| | | | | | |
| | | | | | |
Enbridge Energy Partners LP | | | | | | |
| | | | | | |
| | | | | | |
Enterprise Products Operating LLC | | | | | | |
Enterprise Products Operating LLC | | | | | | |
Kinder Morgan Energy Partners LP | | | | | | |
Kinder Morgan Energy Partners LP | | | | | | |
Kinder Morgan Energy Partners LP | | | | | | |
| | | | | | |
Plains All American Pipeline LP/PAA Finance Corp. | | | | | | |
Spectra Energy Partners LP | | | | | | |
| | | | | | |
| | | | | | |
| | | | | | |
| | | | | | |
Bank of America Corp. (5 Year Treasury Constant Maturity+1.20%)± | | | | | | |
Bank of America Corp. (U.S. SOFR+1.37%)± | | | | | | |
Bank of America Corp. (U.S. SOFR+1.56%)± | | | | | | |
The accompanying notes are an integral part of these financial statements.
6 | Allspring Investment Grade Corporate Bond Portfolio
Portfolio of investments—August 31, 2023 (unaudited)
| | | | | |
| | | | | | |
Bank of America Corp. (U.S. SOFR 3 Month+3.41%)± | | | | | | |
Citigroup, Inc. (U.S. SOFR+0.69%)± | | | | | | |
Citigroup, Inc. (U.S. SOFR+1.17%)± | | | | | | |
Citigroup, Inc. (U.S. SOFR+1.94%)± | | | | | | |
Citigroup, Inc. (U.S. SOFR+2.66%)± | | | | | | |
Citigroup, Inc. (U.S. SOFR 3 Month+1.65%)± | | | | | | |
Citizens Financial Group, Inc. (5 Year Treasury Constant Maturity+2.50%)± | | | | | | |
| | | | | | |
| | | | | | |
| | | | | | |
Goldman Sachs Group, Inc. | | | | | | |
Goldman Sachs Group, Inc. (U.S. SOFR 3 Month+1.42%)± | | | | | | |
Goldman Sachs Group, Inc. (U.S. SOFR 3 Month+1.69%)± | | | | | | |
| | | | | | |
JPMorgan Chase & Co. (U.S. SOFR+2.58%)± | | | | | | |
JPMorgan Chase & Co. (U.S. SOFR 3 Month+2.52%)± | | | | | | |
| | | | | | |
| | | | | | |
Morgan Stanley (U.S. SOFR+1.36%)± | | | | | | |
| | | | | | |
| | | | | | |
Santander Holdings USA, Inc. | | | | | | |
| | | | | | |
| | | | | | |
| | | | | | |
| | | | | | |
Diversified financial services: 7.39% | | | | | | |
| | | | | | |
| | | | | | |
American Express Co. (U.S. SOFR+1.76%)± | | | | | | |
American Express Credit Corp. | | | | | | |
Andrew W Mellon Foundation Series 2020 | | | | | | |
| | | | | | |
Capital One Financial Corp. | | | | | | |
| | | | | | |
| | | | | | |
Intercontinental Exchange, Inc. | | | | | | |
| | | | | | |
| | | | | | |
| | | | | | |
| | | | | | |
| | | | | | |
| | | | | | |
| | | | | | |
The accompanying notes are an integral part of these financial statements.
Allspring Investment Grade Corporate Bond Portfolio | 7
Portfolio of investments—August 31, 2023 (unaudited)
| | | | | |
| | | | | | |
Allstate Corp. (3 Month LIBOR+2.12%)± | | | | | | |
American International Group, Inc. Series A-9 (3 Month LIBOR+2.87%)± | | | | | | |
| | | | | | |
Arch Capital Group U.S., Inc. | | | | | | |
Berkshire Hathaway Finance Corp. | | | | | | |
| | | | | | |
| | | | | | |
| | | | | | |
| | | | | | |
Marsh & McLennan Cos., Inc. | | | | | | |
| | | | | | |
Principal Financial Group, Inc. | | | | | | |
| | | | | | |
Prudential Financial, Inc. Series B | | | | | | |
Transatlantic Holdings, Inc. | | | | | | |
| | | | | | |
| | | | | | |
Investment Companies: 0.82% | | | | | | |
| | | | | | |
Bain Capital Specialty Finance, Inc. | | | | | | |
Blackstone Private Credit Fund | | | | | | |
| | | | | | |
| | | | | | |
| | | | | | |
Alexandria Real Estate Equities, Inc. | | | | | | |
| | | | | | |
| | | | | | |
GLP Capital LP/GLP Financing II, Inc. | | | | | | |
| | | | | | |
| | | | | | |
| | | | | | |
| | | | | | |
| | | | | | |
| | | | | | |
| | | | | | |
| | | | | | |
| | | | | | |
| | | | | | |
| | | | | | |
| | | | | | |
| | | | | | |
| | | | | | |
| | | | | | |
| | | | | | |
Lockheed Martin Corp. Series B | | | | | | |
The accompanying notes are an integral part of these financial statements.
8 | Allspring Investment Grade Corporate Bond Portfolio
Portfolio of investments—August 31, 2023 (unaudited)
| | | | | |
Aerospace/defense (continued) | | | | | | |
| | | | | | |
| | | | | | |
| | | | | | |
| | | | | | |
Honeywell International, Inc. | | | | | | |
Keysight Technologies, Inc. | | | | | | |
| | | | | | |
Machinery-construction & mining: 0.24% | | | | | | |
Caterpillar Financial Services Corp. | | | | | | |
Machinery-diversified: 0.51% | | | | | | |
| | | | | | |
| | | | | | |
Rockwell Automation, Inc. | | | | | | |
| | | | | | |
Metal fabricate/hardware: 0.14% | | | | | | |
Precision Castparts Corp. | | | | | | |
Miscellaneous manufacturing: 0.87% | | | | | | |
| | | | | | |
| | | | | | |
Burlington Northern Santa Fe LLC | | | | | | |
| | | | | | |
| | | | | | |
| | | | | | |
United Parcel Service, Inc. | | | | | | |
| | | | | | |
| | | | | | |
| | | | | | |
| | | | | | |
| | | | | | |
| | | | | | |
| | | | | | |
Dell International LLC/EMC Corp. | | | | | | |
| | | | | | |
| | | | | | |
| | | | | | |
| | | | | | |
| | | | | | |
| | | | | | |
| | | | | | |
The accompanying notes are an integral part of these financial statements.
Allspring Investment Grade Corporate Bond Portfolio | 9
Portfolio of investments—August 31, 2023 (unaudited)
| | | | | |
Semiconductors (continued) | | | | | | |
| | | | | | |
| | | | | | |
| | | | | | |
| | | | | | |
| | | | | | |
| | | | | | |
| | | | | | |
| | | | | | |
| | | | | | |
| | | | | | |
| | | | | | |
| | | | | | |
| | | | | | |
| | | | | | |
| | | | | | |
| | | | | | |
| | | | | | |
| | | | | | |
Arizona Public Service Co. | | | | | | |
Arizona Public Service Co. | | | | | | |
CenterPoint Energy Houston Electric LLC | | | | | | |
| | | | | | |
Consolidated Edison Co. of New York, Inc. Series A | | | | | | |
| | | | | | |
Dominion Energy, Inc. Series B | | | | | | |
| | | | | | |
Duke Energy Indiana LLC Series WWW | | | | | | |
| | | | | | |
| | | | | | |
| | | | | | |
Evergy Kansas Central, Inc. | | | | | | |
| | | | | | |
Florida Power & Light Co. | | | | | | |
| | | | | | |
National Rural Utilities Cooperative Finance Corp. | | | | | | |
| | | | | | |
| | | | | | |
Oncor Electric Delivery Co. LLC | | | | | | |
Pacific Gas & Electric Co. | | | | | | |
| | | | | | |
PPL Capital Funding, Inc. | | | | | | |
PPL Electric Utilities Corp. | | | | | | |
| | | | | | |
Public Service Electric & Gas Co. | | | | | | |
Public Service Electric & Gas Co. | | | | | | |
Public Service Electric & Gas Co. Series E | | | | | | |
The accompanying notes are an integral part of these financial statements.
10 | Allspring Investment Grade Corporate Bond Portfolio
Portfolio of investments—August 31, 2023 (unaudited)
| | | | | |
| | | | | | |
| | | | | | |
Southern California Edison Co. | | | | | | |
Southern California Edison Co. Series 2004-B | | | | | | |
Southern California Edison Co. Series 2005-E | | | | | | |
| | | | | | |
| | | | | | |
Virginia Electric & Power Co. | | | | | | |
Virginia Electric & Power Co. Series A | | | | | | |
Virginia Electric & Power Co. Series B | | | | | | |
Wisconsin Electric Power Co. | | | | | | |
| | | | | | |
| | | | | | |
Southern California Gas Co. Series MM | | | | | | |
Total corporate bonds and notes (Cost $73,666,973) | | | | | | |
Yankee corporate bonds and notes: 17.73% | | | | | | |
| | | | | | |
| | | | | | |
| | | | | | |
| | | | | | |
| | | | | | |
| | | | | | |
| | | | | | |
| | | | | | |
| | | | | | |
Alibaba Group Holding Ltd. | | | | | | |
Alibaba Group Holding Ltd. | | | | | | |
Alibaba Group Holding Ltd. | | | | | | |
| | | | | | |
Telecommunications: 0.75% | | | | | | |
| | | | | | |
Bell Telephone Co. of Canada or Bell Canada | | | | | | |
Rogers Communications, Inc. | | | | | | |
| | | | | | |
| | | | | | |
Consumer, non-cyclical: 1.77% | | | | | | |
| | | | | | |
| | | | | | |
Healthcare-products: 0.11% | | | | | | |
DH Europe Finance II Sarl | | | | | | |
The accompanying notes are an integral part of these financial statements.
Allspring Investment Grade Corporate Bond Portfolio | 11
Portfolio of investments—August 31, 2023 (unaudited)
| | | | | |
| | | | | | |
| | | | | | |
| | | | | | |
Pfizer Investment Enterprises Pte. Ltd. | | | | | | |
Pfizer Investment Enterprises Pte. Ltd. | | | | | | |
| | | | | | |
| | | | | | |
| | | | | | |
Canadian Natural Resources Ltd. | | | | | | |
| | | | | | |
Shell International Finance BV | | | | | | |
Shell International Finance BV | | | | | | |
Shell International Finance BV | | | | | | |
TotalEnergies Capital International SA | | | | | | |
| | | | | | |
| | | | | | |
TransCanada PipeLines Ltd. | | | | | | |
| | | | | | |
| | | | | | |
Banco Santander SA (1 Year Treasury Constant Maturity+0.90%)± | | | | | | |
| | | | | | |
Barclays PLC (1 Year Treasury Constant Maturity+2.30%)± | | | | | | |
Barclays PLC (3 Month LIBOR+1.90%)± | | | | | | |
Barclays PLC (U.S. SOFR+3.57%)± | | | | | | |
| | | | | | |
| | | | | | |
Deutsche Bank AG (U.S. SOFR+2.26%)± | | | | | | |
HSBC Holdings PLC (U.S. SOFR+1.19%)± | | | | | | |
HSBC Holdings PLC (U.S. SOFR 3 Month+1.80%)± | | | | | | |
| | | | | | |
ING Groep NV (U.S. SOFR+1.83%)± | | | | | | |
Lloyds Banking Group PLC (1 Year Treasury Constant Maturity+3.75%)± | | | | | | |
National Australia Bank Ltd. | | | | | | |
| | | | | | |
Sumitomo Mitsui Financial Group, Inc. | | | | | | |
Toronto-Dominion Bank (USD Swap Semi Annual (vs. 3 Month LIBOR) 5 Year+2.21%)± | | | | | | |
| | | | | | |
| | | | | | |
| | | | | | |
Diversified financial services: 0.46% | | | | | | |
AerCap Ireland Capital DAC/AerCap Global Aviation Trust | | | | | | |
AerCap Ireland Capital DAC/AerCap Global Aviation Trust | | | | | | |
| | | | | | |
The accompanying notes are an integral part of these financial statements.
12 | Allspring Investment Grade Corporate Bond Portfolio
Portfolio of investments—August 31, 2023 (unaudited)
| | | | | |
| | | | | | |
| | | | | | |
| | | | | | |
| | | | | | |
| | | | | | |
Miscellaneous manufacturing: 0.64% | | | | | | |
GE Capital International Funding Co. Unlimited Co. | | | | | | |
| | | | | | |
Canadian National Railway Co. | | | | | | |
| | | | | | |
| | | | | | |
NXP BV/NXP Funding LLC/NXP USA, Inc. | | | | | | |
| | | | | | |
| | | | | | |
| | | | | | |
Total yankee corporate bonds and notes (Cost $15,599,994) | | | | | | |
| | | | | |
Short-term investments: 0.36% | | | | | | |
Investment companies: 0.36% | | | | | | |
Allspring Government Money Market Fund Select Class♠∞ | | | | | | |
Total short-term investments (Cost $294,636) | | | | | | |
Total investments in securities (Cost $89,561,603) | | | | | | |
Other assets and liabilities, net | | | | | | |
| | | | | | |
| The security may be resold in transactions exempt from registration, normally to qualified institutional buyers, pursuant to Rule 144A under the Securities Act of 1933. |
| Variable rate investment. The rate shown is the rate in effect at period end. |
| The issuer of the security is an affiliated person of the Portfolio as defined in the Investment Company Act of 1940. |
| The rate represents the 7-day annualized yield at period end. |
|
| London Interbank Offered Rate |
| Real estate investment trust |
| Secured Overnight Financing Rate |
The accompanying notes are an integral part of these financial statements.
Allspring Investment Grade Corporate Bond Portfolio | 13
Portfolio of investments—August 31, 2023 (unaudited)
Investments in affiliates
An affiliated investment is an investment in which the Portfolio owns at least 5% of the outstanding voting shares of the issuer or as a result of other relationships, such as the Portfolio and the issuer having the same adviser or investment manager. Transactions with issuers that were affiliates of the Portfolio at the end of the period were as follows:
| | | | | Net
change in
unrealized
gains
(losses) | | | Income
from
affiliated
securities |
| | | | | | | | |
Allspring Government Money Market Fund Select Class | | | | | | | | |
The accompanying notes are an integral part of these financial statements.
14 | Allspring Investment Grade Corporate Bond Portfolio
Statement of assets and liabilities—August 31, 2023 (unaudited)
Financial statements
Statement of assets and liabilities
| |
Investments in unaffiliated securities, at value (cost $89,266,967) | |
Investments in affiliated securities, at value (cost $294,636) | |
| |
| |
Prepaid expenses and other assets | |
| |
| |
Professional fees payable | |
Custody and accounting fees payable | |
Interest holder report expenses payable | |
| |
| |
The accompanying notes are an integral part of these financial statements.
Allspring Investment Grade Corporate Bond Portfolio | 15
Statement of operations—six months ended August 31, 2023 (unaudited)
Statement of operations
| |
| |
Income from affiliated securities | |
| |
| |
| |
Custody and accounting fees | |
| |
Interest holder report expenses | |
Trustees’ fees and expenses | |
| |
| |
Less: Fee waivers and/or expense reimbursements | |
| |
| |
Realized and unrealized gains (losses) on investments | |
Net realized losses on investments | |
Net change in unrealized gains (losses) on investments | |
Net realized and unrealized gains (losses) on investments | |
Net increase in net assets resulting from operations | |
The accompanying notes are an integral part of these financial statements.
16 | Allspring Investment Grade Corporate Bond Portfolio
Statement of changes in net assets
Statement of changes in net assets
|
Six months ended
August 31, 2023 (unaudited) | Year ended February 28, 2023 |
| | | | |
| | | | |
Net realized losses on investments | | | | |
Net change in unrealized gains (losses) on investments | | | | |
Net increase (decrease) in net assets resulting from operations | | | | |
| | | | |
Transactions in investors’ beneficial interests | | | | |
| | | | |
| | | | |
Net decrease in net assets resulting from capital transactions | | | | |
Total decrease in net assets | | | | |
| | | | |
| | | | |
| | | | |
The accompanying notes are an integral part of these financial statements.
Allspring Investment Grade Corporate Bond Portfolio | 17
| Six months ended
August 31, 2023
(unaudited) | |
| | | | | |
| | | | | | |
Ratios to average net assets (annualized) | | | | | | |
| | | | | | |
| | | | | | |
| | | | | | |
| | | | | | |
| | | | | | |
| Ratio includes expenses which were voluntarily waived by the adviser. Without these voluntary waivers, the net expense ratios would be increased by the following amounts: |
Six months ended August 31, 2023 (unaudited) | |
Year ended February 28, 2023 | |
Year ended February 28, 2022 | |
Year ended February 28, 2021 | |
| |
| Returns for periods of less than one year are not annualized. |
The accompanying notes are an integral part of these financial statements.
18 | Allspring Investment Grade Corporate Bond Portfolio
Notes to financial statements (unaudited)
Notes to financial statements
Allspring Master Trust (the “Trust”), a Delaware statutory trust organized on March 10, 1999, is an open-end management investment company registered under the Investment Company Act of 1940, as amended (the “1940 Act”). As an investment company, the Trust follows the accounting and reporting guidance in Financial Accounting Standards Board (“FASB”) Accounting Standards Codification Topic 946, Financial Services – Investment Companies. These financial statements report on the Allspring Investment Grade Corporate Bond Portfolio (the “Portfolio”) which is a diversified series of the Trust.
Interests in the Portfolio are available solely through private placement transactions that do not involve any “public offering” within the meaning of Section 4(a)(2) of the Securities Act of 1933.
2.
SIGNIFICANT ACCOUNTING POLICIES
The following significant accounting policies, which are consistently followed in the preparation of the financial statements of the Portfolio, are in conformity with U.S. generally accepted accounting principles which require management to make estimates and assumptions that affect the reported amounts of assets and liabilities, disclosure of contingent assets and liabilities at the date of the financial statements, and the reported amounts of income and expenses during the reporting period. Actual results could differ from those estimates.
Securities valuation
All investments are valued each business day as of the close of regular trading on the New York Stock Exchange (generally 4 p.m. Eastern Time), although the Portfolio may deviate from this calculation time under unusual or unexpected circumstances.
Debt securities are valued at the evaluated bid price provided by an independent pricing service (e.g. taking into account various factors, including yields, maturities, or credit ratings) or, if a reliable price is not available, the quoted bid price from an independent broker-dealer.
Investments in registered open-end investment companies (other than those listed on a foreign or domestic exchange or market) are valued at net asset value.
Investments which are not valued using the methods discussed above are valued at their fair value, as determined in good faith by Allspring Funds Management, LLC (“Allspring Funds Management”), which was named the valuation designee by the Board of Trustees. As the valuation designee, Allspring Funds Management is responsible for day-to-day valuation activities for the Allspring Funds. In connection with these responsibilities, Allspring Funds Management has established a Valuation Committee and has delegated to it the authority to take any actions regarding the valuation of portfolio securities that the Valuation Committee deems necessary or appropriate, including determining the fair value of portfolio securities. On a quarterly basis, the Board of Trustees receives reports of valuation actions taken by the Valuation Committee. On at least an annual basis, the Board of Trustees receives an assessment of the adequacy and effectiveness of Allspring Funds Management’s process for determining the fair value of the portfolio of investments.
Security transactions and income recognition
Securities transactions are recorded on a trade date basis. Realized gains or losses are recorded on the basis of identified cost.
Interest income is accrued daily and bond discounts are accreted and premiums are amortized daily. To the extent debt obligations are placed on non-accrual status, any related interest income may be reduced by writing off interest receivables when the collection of all or a portion of interest has been determined to be doubtful based on consistently applied procedures and the fair value has decreased. If the issuer subsequently resumes interest payments or when the collectability of interest is reasonably assured, the debt obligation is removed from non-accrual status. Paydown gains and losses are included in interest income.
Federal and other taxes
The Portfolio is not required to pay federal income taxes on its net investment income and net capital gains as it is treated as a partnership for federal income tax purposes. All income, gains and losses of the Portfolio are deemed to have been “passed through” to the interest holders in proportion to their holdings of the Portfolio regardless of whether income and gains have been distributed by the Portfolio.
The Portfolio’s income tax returns and all financial records supporting those returns for the prior three fiscal years are subject to examination by the federal revenue authority. Management has analyzed the Portfolio’s tax positions taken on federal, state, and foreign tax returns, as applicable, for all open tax years and does not believe that there are any uncertain tax positions that require recognition of a tax liability.
As of August 31, 2023, the aggregate cost of all investments for federal income tax purposes was $89,633,800 and the unrealized gains (losses) consisted of:
Allspring Investment Grade Corporate Bond Portfolio | 19
Notes to financial statements (unaudited)
3.
FAIR VALUATION MEASUREMENTS
Fair value measurements of investments are determined within a framework that has established a fair value hierarchy based upon the various data inputs utilized in determining the value of the Portfolio’s investments. The three-level hierarchy gives the highest priority to unadjusted quoted prices in active markets for identical assets or liabilities (Level 1) and the lowest priority to unobservable inputs (Level 3). The Portfolio’s investments are classified within the fair value hierarchy based on the lowest level of input that is significant to the fair value measurement. The inputs are summarized into three broad levels as follows:
•Level 1—quoted prices in active markets for identical securities
•Level 2—other significant observable inputs (including quoted prices for similar securities, interest rates, prepayment speeds, credit risk, etc.)
•Level 3—significant unobservable inputs (including the Portfolio’s own assumptions in determining the fair value of investments)
The inputs or methodologies used for valuing investments in securities are not necessarily an indication of the risk associated with investing in those securities.
The following is a summary of the inputs used in valuing the Portfolio’s assets and liabilities as of August 31, 2023:
| | Other significant
observable inputs
(Level 2) | Significant
unobservable inputs
(Level 3) | |
| | | | |
| | | | |
Corporate bonds and notes | | | | |
Yankee corporate bonds and notes | | | | |
| | | | |
| | | | |
| | | | |
Additional sector, industry or geographic detail, if any, is included in the Portfolio of Investments.
For the six months ended August 31, 2023, the Portfolio did not have transfers into/out of Level 3.
4.
TRANSACTIONS WITH AFFILIATES
Advisory fee
The Trust has entered into an advisory contract with Allspring Funds Management, a wholly owned subsidiary of Allspring Global Investments Holdings, LLC, a holding company indirectly owned by certain private funds of GTCR LLC and Reverence Capital Partners, L.P. The adviser is responsible for implementing investment policies and guidelines and for supervising the subadviser, who is responsible for day-to-day portfolio management of the Portfolio. Pursuant to the contract, Allspring Funds Management is entitled to receive an advisory fee at the following annual rate based on the Portfolio’s average daily net assets:
For the six months ended August 31, 2023, the advisory fee was equivalent to an annual rate of 0.05% of the Portfolio’s average daily net assets.
Allspring Funds Management has retained the services of a subadviser to provide daily portfolio management to the Portfolio. The fee for subadvisory services is borne by Allspring Funds Management. Allspring Global Investments, LLC, an affiliate of Allspring Funds Management and a wholly owned subsidiary of Allspring Global Investments Holdings, LLC, is the subadviser to the Portfolio and is entitled to receive a fee from Allspring Funds Management at an annual rate starting at 0.04% and declining to 0.03% as the average daily net assets of the Portfolio increase.
Allspring Funds Management has voluntarily waived and/or reimbursed expenses to reduce the net operating expense ratio of the Portfolio. These voluntary waivers may be discontinued at any time.
Interfund transactions
The Portfolio may purchase or sell portfolio investment securities to certain affiliates pursuant to Rule 17a-7 under the 1940 Act and under procedures adopted by the Board of Trustees. The procedures have been designed to ensure that these interfund transactions, which do not incur broker commissions, are effected at current market prices. Pursuant to these procedures, the Portfolio did not have any interfund transactions during the six months ended August 31, 2023.
20 | Allspring Investment Grade Corporate Bond Portfolio
Notes to financial statements (unaudited)
5.
INVESTMENT PORTFOLIO TRANSACTIONS
Purchases and sales of investments, excluding U.S. government obligations (if any) and short-term securities, for the six months ended August 31, 2023 were $7,675,311 and $7,990,007, respectively.
The Trust, along with Allspring Variable Trust and Allspring Funds Trust (excluding the money market funds), are parties to a $350,000,000 revolving credit agreement whereby the Portfolio is permitted to use bank borrowings for temporary or emergency purposes, such as to fund interest holders withdrawal requests. Interest under the credit agreement is charged to the Portfolio based on a borrowing rate equal to the higher of the Federal Funds rate or the overnight bank funding rate in effect on that day plus a spread. In addition, an annual commitment fee based on the unused balance is allocated to each participating fund.
For the six months ended August 31, 2023, there were no borrowings by the Portfolio under the agreement.
As of the end of the period, the Portfolio concentrated its portfolio of investments in financials sector. A fund that invests a substantial portion of its assets in any sector may be more affected by changes in that sector than would be a fund whose investments are not heavily weighted in any sector.
Under the Portfolio’s organizational documents, the officers and Trustees have been granted certain indemnification rights against certain liabilities that may arise out of performance of their duties to the Portfolio. The Portfolio has entered into a separate agreement with each Trustee that converts indemnification rights currently existing under the Portfolio’s organizational documents into contractual rights that cannot be changed in the future without the consent of the Trustee. Additionally, in the normal course of business, the Portfolio may enter into contracts with service providers that contain a variety of indemnification clauses. The Portfolio’s maximum exposure under these arrangements is dependent on future claims that may be made against the Portfolio and, therefore, cannot be estimated.
Allspring Investment Grade Corporate Bond Portfolio | 21
Other information (unaudited)
Other information
Proxy voting information
A description of the policies and procedures used to determine how to vote proxies relating to portfolio securities is available without charge, upon request, by calling 1-866-259-3305, visiting our website at allspringglobal.com, or visiting the SEC website at sec.gov. Information regarding how the proxies related to portfolio securities were voted during the most recent 12-month period ended June 30 is available on the website at allspringglobal.com or by visiting the SEC website at sec.gov.
Quarterly portfolio holdings information
The Portfolio files its complete schedule of portfolio holdings with the SEC for the first and third quarters of each fiscal year as an exhibit to its reports on Form N-PORT. Interest holders may view the filed Form N-PORT by visiting the SEC website at sec.gov.
22 | Allspring Investment Grade Corporate Bond Portfolio
Other information (unaudited)
Board of trustees and officers
Each of the Trustees and Officers listed in the table below acts in identical capacities for each fund in the Allspring family of funds, which consists of 126 mutual funds comprising the Allspring Funds Trust, Allspring Variable Trust, Allspring Master Trust and four closed-end funds (collectively the “Fund Complex”). This table should be read in conjunction with the Prospectus and the Statement of Additional Information1. The mailing address of each Trustee and Officer is 1415 Vantage Park Drive, 3rd Floor, Charlotte, NC 28203. Each Trustee and Officer serves an indefinite term, however, each Trustee serves such term until reaching the mandatory retirement age established by the Trustees.
Independent Trustees
| | Principal occupations during past five years or longer | Current other
public company or
investment
company
directorships |
William R. Ebsworth
(Born 1957) | | Retired. From 1984 to 2013, equities analyst, portfolio manager, research director and chief investment officer at Fidelity Management and Research Company in Boston, Tokyo, and Hong Kong, and retired in 2013 as Chief Investment Officer of Fidelity Strategic Advisers, Inc. where he led a team of investment professionals managing client assets. Prior thereto, Board member of Hong Kong Securities Clearing Co., Hong Kong Options Clearing Corp., the Thailand International Fund, Ltd., Fidelity Investments Life Insurance Company, and Empire Fidelity Investments Life Insurance Company. Audit Committee Chair and Investment Committee Chair of the Vincent Memorial Hospital Foundation (non-profit organization). Mr. Ebsworth is a CFA charterholder. | |
Jane A. Freeman
(Born 1953) | Trustee,
since 2015;
Chair Liaison,
since 2018 | Retired. From 2012 to 2014 and 1999 to 2008, Chief Financial Officer of Scientific Learning Corporation. From 2008 to 2012, Ms. Freeman provided consulting services related to strategic business projects. Prior to 1999, Portfolio Manager at Rockefeller & Co. and Scudder, Stevens & Clark. Board member of the Harding Loevner Funds from 1996 to 2014, serving as both Lead Independent Director and chair of the Audit Committee. Board member of the Russell Exchange Traded Funds Trust from 2011 to 2012 and the chair of the Audit Committee. Ms. Freeman is also an inactive Chartered Financial Analyst. | |
Isaiah Harris, Jr.
(Born 1952) | Trustee,
since 2009;
Audit Committee Chair,
since 2019 | Retired. Member of the Advisory Board of CEF of East Central Florida. Chairman of the Board of CIGNA Corporation from 2009 to 2021, and Director from 2005 to 2008. From 2003 to 2011, Director of Deluxe Corporation. Prior thereto, President and CEO of BellSouth Advertising and Publishing Corp. from 2005 to 2007, President and CEO of BellSouth Enterprises from 2004 to 2005 and President of BellSouth Consumer Services from 2000 to 2003. Emeritus member of the Iowa State University Foundation Board of Governors. Emeritus Member of the Advisory board of Iowa State University School of Business. Advisory Board Member, Palm Harbor Academy (private school). Advisory Board Member, Fellowship of Christian Athletes. Mr. Harris is a certified public accountant (inactive status). | |
David F. Larcker
(Born 1950) | | Distinguished Visiting Fellow at the Hoover Institution since 2022. James Irvin Miller Professor of Accounting at the Graduate School of Business (Emeritus), Stanford University, Director of the Corporate Governance Research Initiative and Senior Faculty of The Rock Center for Corporate Governance since 2006. From 2005 to 2008, Professor of Accounting at the Graduate School of Business, Stanford University. Prior thereto, Ernst & Young Professor of Accounting at The Wharton School, University of Pennsylvania from 1985 to 2005. | |
Olivia S. Mitchell
(Born 1953) | Trustee,
since 2006;
Nominating and Governance Committee Chair,
since 2018 | International Foundation of Employee Benefit Plans Professor since 1993, Wharton School of the University of Pennsylvania. Director of Wharton’s Pension Research Council and Boettner Center on Pensions & Retirement Research, and Research Associate at the National Bureau of Economic Research. Previously taught at Cornell University from 1978 to 1993. | |
Timothy J. Penny
(Born 1951) | Trustee,
since 1996;
Chair,
since 2018 | President and Chief Executive Officer of Southern Minnesota Initiative Foundation, a non-profit organization, since 2007. Vice Chair of the Economic Club of Minnesota, since 2007. Co-Chair of the Committee for a Responsible Federal Budget, since 1995. Member of the Board of Trustees of NorthStar Education Finance, Inc., a non-profit organization, from 2007-2022. Senior Fellow of the University of Minnesota Humphrey Institute from 1995 to 2017. | |
1
The Statement of Additional Information includes additional information about the Trustees and is available, without charge, upon request, by calling 1-800-222-8222 or by visiting the website at allspringglobal.com.
Allspring Investment Grade Corporate Bond Portfolio | 23
Other information (unaudited)
| Position held and length of service* | Principal occupations during past five years or longer | Current other public company or investment company directorships |
James G. Polisson
(Born 1959) | | Retired. Chief Marketing Officer, Source (ETF) UK Services, Ltd, from 2015 to 2017. From 2012 to 2015, Principal of The Polisson Group, LLC, a management consulting, corporate advisory and principal investing company. Chief Executive Officer and Managing Director at Russell Investments, Global Exchange Traded Funds from 2010 to 2012. Managing Director of Barclays Global Investors from 1998 to 2010 and Global Chief Marketing Officer for iShares and Barclays Global Investors from 2000 to 2010. Trustee of the San Francisco Mechanics’ Institute, a non- profit organization, from 2013 to 2015. Board member of the Russell Exchange Traded Fund Trust from 2011 to 2012. Director of Barclays Global Investors Holdings Deutschland GmbH from 2006 to 2009. Mr. Polisson is an attorney and has a retired status with the Massachusetts and District of Columbia Bar Associations. | |
Pamela Wheelock
(Born 1959) | Trustee,
since January 2020;
previously Trustee from
January 2018 to
July 2019 | Retired. Executive and Senior Financial leadership positions in the public, private and nonprofit sectors. Interim President and CEO, McKnight Foundation, 2020. Interim Commissioner, Minnesota Department of Human Services, 2019. Chief Operating Officer, Twin Cities Habitat for Humanity, 2017-2019. Vice President for University Services, University of Minnesota, 2012- 2016. Interim President and CEO, Blue Cross and Blue Shield of Minnesota, 2011-2012. Executive Vice-President and Chief Financial Officer, Minnesota Wild, 2002-2008. Commissioner, Minnesota Department of Finance, 1999-2002. Chair of the Board of Directors of Destination Medical Center Corporation. Board member of the Minnesota Wild Foundation. | |
| Length of service dates reflect the Trustee’s commencement of service with the Trust’s predecessor entities, where applicable. |
24 | Allspring Investment Grade Corporate Bond Portfolio
Other information (unaudited)
Officers1
| Position held and
length of service | Principal occupations during past five years or longer |
| | President and Chief Executive Officer of Allspring Funds Management, LLC since 2017 and Head of Global Fund Governance of Allspring Global Investments since 2022. Prior thereto, co-president of Galliard Capital Management, LLC, an affiliate of Allspring Funds Management, LLC, from 2019 to 2022 and Head of Affiliated Managers, Allspring Global Investments, from 2014 to 2019 and Executive Vice President responsible for marketing, investments and product development for Allspring Funds Management, LLC, from 2009 to 2014. |
Jeremy DePalma
(Born 1974) | Treasurer,
since 2012
(for certain funds in
the Fund Complex);
since 2021 (for
the remaining funds in the Complex) | Senior Vice President of Allspring Funds Management, LLC since 2009. Senior Vice President of Evergreen Investment Management Company, LLC from 2008 to 2010 and head of the Fund Reporting and Control Team within Fund Administration from 2005 to 2010. |
Christopher Baker
(Born 1976) | Chief Compliance Officer,
since 2022 | Global Chief Compliance Officer for Allspring Global Investments since 2022. Prior thereto, Chief Compliance Officer for State Street Global Advisors from 2018 to 2021. Senior Compliance Officer for the State Street divisions of Alternative Investment Solutions, Sector Solutions, and Global Marketing from 2015 to 2018. From 2010 to 2015 Vice President, Global Head of Investment and Marketing Compliance for State Street Global Advisors. |
Matthew Prasse
(Born 1983) | Chief Legal Officer,
since 2022;
Secretary,
since 2021 | Senior Counsel of the Allspring Legal Department since 2021. Senior Counsel of the Wells Fargo Legal Department from 2018 to 2021. Previously, Counsel for Barings LLC from 2015 to 2018. Prior to joining Barings, Associate at Morgan, Lewis & Bockius LLP from 2008 to 2015. |
1 For those Officers with tenures at Allspring Global Investments and/or Allspring Funds Management, LLC that began prior to 2021, such tenures include years of service during which these businesses/entities were known as Wells Fargo Asset Management and Wells Fargo Funds Management, LLC, respectively.
Allspring Investment Grade Corporate Bond Portfolio | 25
Other information (unaudited)
Board consideration of investment advisory and sub-advisory agreements:
Allspring Bloomberg US Aggregate ex-Corporate Portfolio, Allspring Emerging Markets Bond Portfolio, Allspring Factor Enhanced Emerging Markets Equity Portfolio, Allspring Factor Enhanced International Equity Portfolio, Allspring Factor Enhanced U.S. Large Cap Equity Portfolio, Allspring Factor Enhanced U.S. Small Cap Equity Portfolio, Allspring High Yield Corporate Bond Portfolio, Allspring Investment Grade Corporate Bond Portfolio, Allspring Strategic Retirement Bond Portfolio, and Allspring U.S. REIT Portfolio
Under the Investment Company Act of 1940 (the “1940 Act”), the Board of Trustees (the “Board”) of Allspring Master Trust (the “Trust”) must determine annually whether to approve the continuation of the Trust’s investment advisory and sub-advisory agreements. In this regard, at a meeting held on May 15-17, 2023 (the “Meeting”), the Board, all the members of which have no direct or indirect interest in the investment advisory and sub-advisory agreements and are not “interested persons” of the Trust, as defined in the 1940 Act (the “Independent Trustees”), reviewed and approved for each of the portfolios of the Trust identified in the table below (individually, a “Portfolio” and collectively, the “Portfolios”): (i) an investment advisory agreement (the “Advisory Agreement”) with Allspring Funds Management, LLC (“Allspring Funds Management”); and (ii) an investment sub-advisory agreement (each, a “Sub-Advisory Agreement” and collectively, the “Sub-Advisory Agreements”) with the Sub-Advisers(s) identified in the table below (each, a “Sub-Adviser” and collectively, the “Sub-Advisers”) for the corresponding Portfolio identified. The Advisory Agreement and the Sub-Advisory Agreements are collectively referred to as the “Advisory Agreements.”
| |
Allspring Bloomberg Barclays US Aggregate ex-Corporate Portfolio | Allspring Global Investments, LLC |
Allspring Emerging Markets Bond Portfolio | Allspring Global Investments, LLC, Allspring Global Investments (UK) Limited |
Allspring Factor Enhanced Emerging Markets Equity Portfolio | Allspring Global Investments, LLC |
Allspring Factor Enhanced International Equity Portfolio | Allspring Global Investments, LLC |
Allspring Factor Enhanced U.S. Large Cap Equity Portfolio | Allspring Global Investments, LLC |
Allspring Factor Enhanced U.S. Small Cap Equity Portfolio | Allspring Global Investments, LLC |
Allspring High Yield Corporate Bond Portfolio | Allspring Global Investments, LLC |
Allspring Investment Grade Corporate Bond Portfolio | Allspring Global Investments, LLC |
Allspring Strategic Retirement Bond Portfolio | Allspring Global Investments, LLC |
Allspring U.S. REIT Portfolio | Allspring Global Investments, LLC |
At the Meeting, the Board considered the factors and reached the conclusions described below relating to the selection of Allspring Funds Management and the Sub-Advisers and the approval of the Advisory Agreements. Prior to the Meeting, including at a Board meeting held in April 2023, the Trustees conferred extensively among themselves and with representatives of Allspring Funds Management about these matters. The Board has adopted a team-based approach, with each team consisting of a sub-set of Trustees, to assist the full Board in the discharge of its duties in reviewing investment performance and other matters throughout the year. The Independent Trustees were assisted in their evaluation of the Advisory Agreements by independent legal counsel, from whom they received separate legal advice and with whom they met separately.
The Board noted that it initially approved the Advisory Agreements at a Board meeting held in May 2021, each for a two-year term, in advance of the sale of Wells Fargo Asset Management to Allspring Global Investments Holdings, LLC,1 a holding company indirectly owned by certain private funds of GTCR LLC and Reverence Capital Partners, L.P. (the “Transaction”). The Trustees also noted that, while they did not specifically consider the continuation of the Advisory Agreements in 2022 as a result of the two-year term that was approved in 2021, the Trustees received and considered certain information at a Board meeting held in April 2022 that was applicable to the Advisory Agreements, including an overview and financial review of the Allspring Global Investments business, information regarding certain ancillary agreements that were approved by the Board at the April 2022 Board meeting, and comparative data regarding Fund fees and expenses.
In providing information to the Board, Allspring Funds Management and the Sub-Advisers were guided by a detailed set of requests for information submitted to them by independent legal counsel on behalf of the Independent Trustees at the start of the Board’s annual contract renewal process earlier in 2023. In considering and approving the Advisory Agreements, the Trustees considered the information they believed relevant, including but not limited to the information discussed below. The Board considered not only the specific information presented in connection with the Meeting, but also the knowledge gained over time through interaction with Allspring Funds Management and the Sub-Advisers about various topics. In this regard, the Board reviewed reports of Allspring Funds Management at each of its quarterly meetings, which included, among other things, portfolio reviews and investment performance reports. In addition, the Board and the teams mentioned above confer with portfolio managers at various times throughout the year. The Board did not identify any particular information or consideration that was all-important or controlling, and each individual Trustee may have attributed different weights to various factors.
1
The trade name for the asset management firm that includes Allspring Funds Management and the Sub-Adviser is “Allspring Global Investments.”
26 | Allspring Investment Grade Corporate Bond Portfolio
Other information (unaudited)
After its deliberations, the Board unanimously determined that the compensation or the absence of compensation payable to Allspring Funds Management and each of the Sub-Advisers under each of the Advisory Agreements was reasonable, and approved the continuation of the Advisory Agreements for a one-year term. The Board considered the approval of the Advisory Agreements for the Portfolios as part of its consideration of agreements for funds across the complex, but its approvals were made on a fund-by-fund basis. The following summarizes a number of important, but not necessarily all, factors considered by the Board in support of its approvals.
Nature, extent and quality of services
The Board received and considered various information regarding the nature, extent, and quality of services provided to the Portfolios by Allspring Funds Management and the Sub-Advisers under the Advisory Agreements. This information included a description of the investment advisory services and Portfolio-level administrative services covered by the Advisory Agreement, as well as, among other things, a summary of the background and experience of senior management of Allspring Global Investments, of which Allspring Funds Management and the Sub-Advisers are a part, and a summary of investments made in the Allspring Global Investments business. The Board also considered information about retention arrangements with respect to key personnel of Allspring Global Investments that were put in place in connection with the Transaction. The Board took into account information about the services that continue to be provided by Wells Fargo & Co. and/or its affiliates (“Wells Fargo”) since the Transaction under a transition services agreement and the anticipated timeline for exiting the transition services agreement. In addition, the Board received and considered information about the full range of services provided to the Fund by Allspring Funds Management and its affiliates.
The Board considered the qualifications, background, tenure, and responsibilities of each of the portfolio managers primarily responsible for the day-to-day portfolio management of the Portfolios. The Board evaluated the ability of Allspring Funds Management and the Sub-Advisers to attract and retain qualified investment professionals, including research, advisory, and supervisory personnel.
The Board further considered the compliance programs and compliance records of Allspring Funds Management and the Sub-Advisers. The Board received and considered information about Allspring Global Investments’ risk management functions, which included information about Allspring Funds Management’s and the Sub-Advisers’ business continuity plans, their approaches to data privacy and cybersecurity, and Allspring Funds Management’s role as administrator of the Portfolios’ liquidity risk management program, and the derivatives risk management program for Allspring Bloomberg Barclays US Aggregate ex-Corporate Portfolio and Allspring Factor Enhanced U.S. Large Cap Equity Portfolio. The Board also received and considered information about Allspring Funds Management’s intermediary and vendor oversight program.
Portfolio investment performance and expenses
The Board considered the investment performance results for each of the Portfolios over various time periods ended December 31, 2022. The Board considered these results in comparison to the investment performance of funds in a universe that was determined by Broadridge Inc. (“Broadridge”) to be similar to each respective Portfolios (each, a “Universe”), and in comparison to each Portfolios’ benchmark index and to other comparative data. Broadridge is an independent provider of investment company data. The Board received a description of the methodology used by Broadridge to select the mutual funds in the performance Universe. The Board noted the short performance history of the Portfolios.
With respect to the investment performance of each Portfolio relative to its respective Universe, the Board noted the following: (i) the investment performance of Allspring Bloomberg US Aggregate ex-Corporate Portfolio was higher than the average investment performance of the Universe for all periods under review; the investment performance of Allspring Bloomberg US Aggregate ex-Corporate Portfolio was higher than the investment performance of its benchmark index, the Bloomberg U.S. Aggregate ex Corporate Index, for the one-year period and was in range of the investment performance of its benchmark index for the three- and five-year periods under review; (ii) the investment performance of Allspring Emerging Markets Bond Portfolio was lower than the average investment performance of the Universe for the one- and three-year periods and was in range of the average investment performance of the Universe for the five-year period; the investment performance of Allspring Emerging Markets Bond Portfolio was higher than the investment performance of its benchmark index, the J.P. Morgan EM Bond Global Diversified Index, for the one-year period and was in range of the investment performance of its benchmark index for the three- and five-year periods under review; (iii) the investment performance of Allspring Factor Enhanced Emerging Markets Equity Portfolio was higher than the average investment performance of the Universe for the one-year period and was lower than the average investment performance of the Universe for the three- and five-year periods; the investment performance of Allspring Factor Enhanced Emerging Markets Equity Portfolio was higher than the investment performance of its benchmark index, the MSCI Emerging Markets Index (Net), for the one-year period and was lower than the investment performance of its benchmark index for the three- and five-year periods under review; (iv) the investment performance of Allspring Factor Enhanced International Equity Portfolio was higher than the average investment performance of the Universe for all periods under review; the investment performance of Allspring Factor Enhanced International Equity Portfolio was higher than the investment performance of its benchmark index, the MSCI World ex US Index (Net), for all periods under review; (v) the investment performance of Allspring Factor Enhanced U.S. Large Cap Equity Portfolio was higher than the average investment performance of the Universe for the one- and five-year periods and was lower than the average investment performance of the Universe for the three-year period; the investment performance of Allspring Factor Enhanced U.S. Large Cap Equity Portfolio was higher than the investment performance of its benchmark index, the Russell 1000® Index, for the one-year period and was lower than the investment performance of its benchmark index for the three- and five-year periods under review; (vi) the investment performance of Allspring Factor Enhanced U.S. Small Cap Equity Portfolio was lower than the average investment performance of the Universe for all periods under review; the investment performance of Allspring Factor Enhanced U.S. Small Cap Equity Portfolio was higher than the
Allspring Investment Grade Corporate Bond Portfolio | 27
Other information (unaudited)
investment performance of its benchmark index, the Russell 2000® Index, for the one-year period and was lower than the investment performance of its benchmark index for the three- and five-year periods under review; (vii) the investment performance of Allspring High Yield Corporate Bond Portfolio was lower than the average investment performance of the Universe for all periods under review; the investment performance of Allspring High Yield Corporate Bond Portfolio was in range of the investment performance of its benchmark index, the Bloomberg U.S. Corporate High Yield 2% Issuer Capped, for the one-year period and was lower than the investment performance of its benchmark index for the three- and five-year periods under review; (viii) the investment performance of Allspring Investment Grade Corporate Bond Portfolio was higher than the average investment performance of the Universe for the one- and five-year periods and in rage of the average investment performance of the Universe for the three-year period; the investment performance of Allspring Investment Grade Corporate Bond Portfolio was higher than the investment performance of its benchmark index, the Bloomberg U.S. Corporate Bond Index, for the one-year period and was in range of the investment performance of its benchmark index for the three- and five-year periods under review; (ix) the investment performance of Allspring Strategic Retirement Bond Portfolio was higher than the average investment performance of the Universe for all periods under review; the investment performance of Allspring Strategic Retirement Bond Portfolio was higher than the investment performance of its benchmark index, the Strategic Retirement Blended Index, for the one- and three-year periods and was in range of the investment performance of its benchmark index for the five-year period; (x) the investment performance of Allspring U.S. REIT Portfolio was lower than the average investment performance of the Universe for the one-year period and was in range of the average investment performance of the Universe for the three- and five-year periods; the investment performance of Allspring U.S. REIT Portfolio was higher than the investment performance of its benchmark index, the Dow Jones U.S. Select REIT Index, for all periods under review.
The Board received information concerning, and discussed factors contributing to, the underperformance of each of Allspring Emerging Markets Bond Portfolio, Allspring Factor Enhanced Emerging Markets Equity Portfolio, Allspring Factor Enhanced U.S. Large Cap Equity Portfolio, Allspring Factor Enhanced U.S. Small Cap Equity Portfolio and Allspring High Yield Corporate Bond Portfolio relative to such Portfolio’s Universe and benchmark index for the periods identified above. The Board took note of the explanations for the relative underperformance during these periods, including with respect to investment decisions and market factors that affected each Portfolio’s investment performance.
The Board also received and considered information regarding the fee rates that are payable to Allspring Funds Management for investment advisory services (as discussed below), which are the only fees charged to the Portfolios, relative to corresponding class-specific expense groups that were determined by Broadridge to be similar to the Portfolios (the “Groups”). The Board received a description of the methodology used by Broadridge to select the mutual funds in the expense Groups and an explanation of how funds comprising expense groups and their expense ratios may vary from year-to-year.
The Board took into account the Portfolios’ investment performance and expense information provided to it among the factors considered in deciding to re-approve the Advisory Agreements.
Investment advisory and sub-advisory fee rates
The Board reviewed and considered the contractual fee rates payable by the Portfolios to Allspring Funds Management under the Advisory Agreement. The Board also reviewed and considered the contractual investment sub-advisory fee rates that are payable by Allspring Funds Management to the Sub-Advisers for investment sub-advisory services.
Among other information reviewed by the Board was a comparison of the Portfolios’ Advisory Rates with the average contractual investment advisory fee rates of funds in the expense Groups at a common asset level as well as transfer agency costs of the Portfolios in the expense Groups. The Board noted that the Advisory Rates of the Portfolios were lower than or in range of the mean rates for the Portfolios’ expense Groups.
The Board also received and considered information about the portions of the total advisory fees that were retained by Allspring Funds Management after payment of the fees to the Sub-Advisers for sub-advisory services. In assessing the reasonableness of these amounts, the Board received and evaluated information about the nature and extent of responsibilities retained and risks assumed by Allspring Funds Management and not delegated to or assumed by the Sub-Advisers, and about Allspring Funds Management’s on-going oversight services. Given the affiliation between Allspring Funds Management and the Sub-Advisers, the Board ascribed limited relevance to the allocation of fees between them.
For all Portfolios, except Allspring Factor Enhanced U.S. Small Cap Equity Portfolio, Allspring Factor Enhanced International Equity Portfolio, Allspring Factor Enhanced Emerging Markets Equity Portfolio, Allspring U.S. REIT Portfolio, Allspring Investment Grade Corporate Bond Portfolio, and Allspring Strategic Retirement Bond Portfolio, the Board also received and considered information about the nature and extent of services offered and fee rates charged by Allspring Funds Management and the Sub-Advisers to other types of clients with investment strategies similar to those of certain Portfolios. In this regard, the Board received information about the significantly greater scope of services, and compliance, reporting and other legal burdens and risks of managing proprietary mutual funds compared with those associated with managing assets of other types of clients, including third-party sub-advised fund clients and non-mutual fund clients such as institutional separate accounts.
Based on its consideration of the factors and information it deemed relevant, including those described here, the Board determined that the compensation payable to Allspring Funds Management under the Advisory Agreement and to the Sub-Advisers under the Sub-Advisory Agreements was reasonable.
28 | Allspring Investment Grade Corporate Bond Portfolio
Other information (unaudited)
Profitability
The Board received and considered information concerning the profitability of Allspring Funds Management, as well as the profitability of Allspring Global Investments, from providing services to the fund complex as a whole. The Board noted that the Sub-Adviser’s profitability information with respect to providing services to the Portfolios and other funds in the complex was subsumed in the Allspring Global Investments profitability analysis.
Allspring Funds Management reported on the methodologies and estimates used in calculating profitability, including a description of the methodology used to allocate certain expenses and differences in how Allspring Global Investments calculates its pre-tax profit metric versus the methodology used when Allspring Funds Management was part of Wells Fargo. It was noted that the impact of such differences had only minor impact on the financial results presented. Among other things, the Board noted that the levels of profitability reported on a fund-by-fund basis varied widely, depending on factors such as the size, type, and age of fund.
Based on its review, the Board did not deem the profits reported by Allspring Funds Management or Allspring Global Investments from services provided to the Portfolios to be at a level that would prevent it from approving the continuation of the Advisory Agreements.
Economies of scale
The Board received and considered information about the potential for Allspring Funds Management to experience economies of scale in the provision of management services to the Portfolios, the difficulties of calculating economies of scale at an individual fund level, and the extent to which potential scale benefits are shared with Portfolio shareholders. The Board noted the existence of breakpoints in the Portfolios’ advisory fee structure, which operate generally to reduce the Portfolios’ expense ratios as the Portfolios grow in size, and the size of the Portfolios in relation to such breakpoints. The Board considered that in addition to advisory fee breakpoints, Allspring Funds Management shares potential economies of scale from its management business in a variety of ways, including through fee waiver and expense reimbursement arrangements, competitive advisory fee rates set at the outset without regard to breakpoints, and investments in the business intended to enhance services available to shareholders.
The Board concluded that Allspring Funds Management’s arrangements with respect to the Portfolios, including contractual breakpoints, constituted a reasonable approach to sharing potential economies of scale with the Portfolios and their shareholders.
Other benefits to Allspring Funds Management and the Sub-Advisers
The Board received and considered information regarding potential “fall-out” or ancillary benefits received by Allspring Funds Management and its affiliates, including the Sub-Advisers, as a result of their relationships with the Portfolios. Ancillary benefits could include, among others, benefits directly attributable to other relationships with the Portfolios and benefits potentially derived from an increase in Allspring Funds Management’s and the Sub-Advisers’ businesses as a result of their relationships with the Portfolios. The Board noted that Allspring Funds Distributor, LLC, an affiliate of Allspring Funds Management, receives distribution-related fees in respect of shares sold or held through it.
The Board also reviewed information about soft dollar credits earned and utilized by the Sub-Advisers and fees earned in the past by Allspring Funds Management and the Sub-Advisers from managing a private investment vehicle for the fund complex’s securities lending collateral.
Based on its consideration of the factors and information it deemed relevant, including those described here, the Board did not find that any ancillary benefits received by Allspring Funds Management and its affiliates, including the Sub-Advisers, were unreasonable.
Conclusion
At the Meeting, after considering the above-described factors and based on its deliberations and its evaluation of the information described above, the Board unanimously determined that the compensation payable to Allspring Funds Management and the Sub-Advisers under each of the Advisory Agreements was reasonable, and approved the continuation of the Advisory Agreements for a one-year term.
Allspring Investment Grade Corporate Bond Portfolio | 29
Other information (unaudited)
Liquidity risk management program
In accordance with Rule 22e-4 under the Investment Company Act of 1940, as amended (the “Liquidity Rule”), Allspring Master Trust (the “Trust”) has adopted and implemented a liquidity risk management program (the “Program”) on behalf of each of its series, including the Portfolio, which is reasonably designed to assess and manage the Portfolio’s liquidity risk. “Liquidity risk” is defined under the Liquidity Rule as the risk that the Portfolio is unable to meet redemption requests without significantly diluting remaining investors’ interests in the Portfolio. The Trust’s Board of Trustees (the “Board”) previously approved the designation of Allspring Funds Management, LLC (“Allspring Funds Management”), the Portfolio’s investment adviser, to administer the Program, and Allspring Funds Management has established a Liquidity Risk Management Council (the “Council”) composed of personnel from multiple departments within Allspring Funds Management and its affiliates to assist Allspring Funds Management in the administration of the Program.
The Program is comprised of various components designed to support the assessment and/or management of liquidity risk, including: (1) the periodic assessment (no less frequently than annually) of certain factors that influence the Portfolio’s liquidity risk; (2) the periodic classification (no less frequently than monthly) of the Portfolio’s investments into one of four liquidity categories that reflect an estimate of their liquidity under current market conditions; (3) a 15% limit on the acquisition of “illiquid investments” (as defined under the Liquidity Rule); (4) to the extent the Portfolio does not invest primarily in “highly liquid investments” (as defined under the Liquidity Rule), the determination of a minimum percentage of the Portfolio’s assets that generally will be invested in highly liquid investments (an “HLIM”); (5) if the Portfolio has established an HLIM, the periodic review (no less frequently than annually) of the HLIM and the adoption of policies and procedures for responding to a shortfall of the Portfolio’s “highly liquid investments” below its HLIM; and (6) periodic reporting to the Board.
At a meeting of the Board held on May 16-17, 2023, the Board received and reviewed a written report (the “Report”) from Allspring Funds Management that, among other things, addressed the operation of the Program and assessed its adequacy and effectiveness for the period from January 1, 2022 through December 31, 2022 (the “Reporting Period”). The Report noted significant liquidity events impacting the Portfolios related to extended foreign market holidays as well as the difficulty of trading and settlement of most Russia-related securities due to sanctions activity. The Report noted that there were no material changes to the Program during the Reporting Period.
Allspring Funds Management determined in the Report that the Program has been implemented and operates effectively to manage each Portfolio’s, including the Portfolio’s, liquidity risk, and Allspring Funds Management continues to believe that the Program has been and continues to be adequately and effectively implemented to monitor and, as applicable, respond to the Portfolio’s liquidity developments.
There can be no assurance that the Program will achieve its objectives under all circumstances in the future.
30 | Allspring Investment Grade Corporate Bond Portfolio
This page is intentionally left blank.
This page is intentionally left blank.
For more information
More information about Allspring Funds is available free upon request. To obtain literature, please write, visit the Portfolio’s website, or call:
Allspring Funds
P.O. Box 219967
Kansas City, MO 64121-9967
Website: allspringglobal.com
Individual investors: 1-800-222-8222
Retail investment professionals: 1-888-877-9275
Institutional investment professionals: 1-800-260-5969
This report and the financial statements contained herein are submitted for the general information of the interest holders of the Portfolio. If this report is used for promotional purposes, distribution of the report must be accompanied or preceded by a current prospectus. Before investing, please consider the investment objectives, risks, charges, and expenses of the investment. For a current prospectus and, if available, a summary prospectus, containing this information, call 1-800-222-8222 or visit the Portfolio’s website at allspringglobal.com. Read the prospectus carefully before you invest or send money.
Allspring Global InvestmentsTM is the trade name for the asset management firms of Allspring Global Investments Holdings, LLC, a holding company indirectly owned by certain private funds of GTCR LLC and Reverence Capital Partners, L.P. These firms include but are not limited to Allspring Global Investments, LLC, and Allspring Funds Management, LLC. Certain products managed by Allspring entities are distributed by Allspring Funds Distributor, LLC (a broker-dealer and Member FINRA/SIPC).
This material is for general informational and educational purposes only and is NOT intended to provide investment advice or a recommendation of any kind - including a recommendation for any specific investment, strategy, or plan.
© 2023 Allspring Global Investments Holdings, LLC. All rights reserved.
Allspring Strategic Retirement Bond Portfolio
Semi-Annual Report
August 31, 2023
Allspring Strategic Retirement Bond Portfolio | 1
Portfolio information (unaudited)
| The Portfolio seeks to replicate the total return of a blended index that is weighted 50% to the Bloomberg U.S. Treasury Inflation-Linked 1-10 Year Index† and 50% to the Bloomberg U.S. Government Intermediate Bond Index,†† before fees and expenses. |
| Allspring Funds Management, LLC |
| Allspring Global Investments, LLC |
| Manjunath Boraiah, Brian Prucyk, Janet S. Rilling, CFA, CPA, Michal Stanczyk, Nick Toporkov, CFA |
Ten largest holdings (%) as of August 31, 20231 |
| |
| |
| |
| |
| |
U.S. Treasury Bonds, 6.13%, 11-15-2027 | |
U.S. Treasury Notes, 1.13%, 2-15-2031 | |
| |
| |
| |
| Figures represent the percentage of the Portfolio’s net assets. Holdings are subject to change and may have changed since the date specified. |
Portfolio composition as of August 31, 20231 |
| Figures represent the percentage of the Portfolio’s long-term investments. Allocations are subject to change and may have changed since the date specified. |
| The Bloomberg U.S. Treasury Inflation-Linked 1-10 Year Bond Index measures the performance of the U.S. Treasury Inflation-Protected Securities (TIPS) market with maturities of more than 1 year and less than 10 years. Federal Reserve holdings of U.S. TIPS are not index eligible and are excluded from the face amount outstanding of each bond in the index. You cannot invest directly in an index. |
| The Bloomberg U.S. Government Intermediate Bond Index is an unmanaged index composed of U.S. government securities with maturities in the 1- to 10-year range, including securities issued by the U.S. Treasury and U.S. government agencies. You cannot invest directly in an index. |
| CFA® and Chartered Financial Analyst® are trademarks owned by CFA Institute. |
2 | Allspring Strategic Retirement Bond Portfolio
Portfolio of investments—August 31, 2023 (unaudited)
| | | | | |
| | | | | | |
| | | | | | |
| | | | | | |
| | | | | | |
| | | | | | |
| | | | | | |
| | | | | | |
| | | | | | |
Total agency securities (Cost $770,522) | | | | | | |
U.S. Treasury securities: 95.99% | | | | | | |
| | | | | | |
| | | | | | |
| | | | | | |
| | | | | | |
| | | | | | |
| | | | | | |
| | | | | | |
| | | | | | |
| | | | | | |
| | | | | | |
| | | | | | |
| | | | | | |
| | | | | | |
| | | | | | |
| | | | | | |
| | | | | | |
| | | | | | |
| | | | | | |
| | | | | | |
| | | | | | |
| | | | | | |
| | | | | | |
| | | | | | |
| | | | | | |
| | | | | | |
| | | | | | |
| | | | | | |
| | | | | | |
| | | | | | |
| | | | | | |
| | | | | | |
| | | | | | |
| | | | | | |
| | | | | | |
| | | | | | |
| | | | | | |
| | | | | | |
| | | | | | |
The accompanying notes are an integral part of these financial statements.
Allspring Strategic Retirement Bond Portfolio | 3
Portfolio of investments—August 31, 2023 (unaudited)
| | | | | |
U.S. Treasury securities (continued) | | | | | | |
| | | | | | |
| | | | | | |
| | | | | | |
| | | | | | |
| | | | | | |
| | | | | | |
| | | | | | |
| | | | | | |
| | | | | | |
| | | | | | |
| | | | | | |
| | | | | | |
| | | | | | |
| | | | | | |
| | | | | | |
| | | | | | |
| | | | | | |
| | | | | | |
| | | | | | |
| | | | | | |
| | | | | | |
| | | | | | |
| | | | | | |
| | | | | | |
| | | | | | |
| | | | | | |
| | | | | | |
| | | | | | |
| | | | | | |
| | | | | | |
| | | | | | |
| | | | | | |
| | | | | | |
| | | | | | |
| | | | | | |
| | | | | | |
| | | | | | |
| | | | | | |
| | | | | | |
| | | | | | |
| | | | | | |
| | | | | | |
| | | | | | |
| | | | | | |
| | | | | | |
| | | | | | |
| | | | | | |
| | | | | | |
The accompanying notes are an integral part of these financial statements.
4 | Allspring Strategic Retirement Bond Portfolio
Portfolio of investments—August 31, 2023 (unaudited)
| | | | | |
U.S. Treasury securities (continued) | | | | | | |
| | | | | | |
| | | | | | |
| | | | | | |
Total U.S. Treasury securities (Cost $29,079,166) | | | | | | |
| | | | | |
Short-term investments: 1.09% | | | | | | |
Investment companies: 1.09% | | | | | | |
Allspring Government Money Market Fund Select Class♠∞ | | | | | | |
Total short-term investments (Cost $306,207) | | | | | | |
Total investments in securities (Cost $30,155,895) | | | | | | |
Other assets and liabilities, net | | | | | | |
| | | | | | |
| The issuer of the security is an affiliated person of the Portfolio as defined in the Investment Company Act of 1940. |
| The rate represents the 7-day annualized yield at period end. |
|
| Federal Farm Credit Banks |
| |
| Federal Home Loan Mortgage Corporation |
| Federal National Mortgage Association |
| Treasury Inflation-Protected Securities |
| Tennessee Valley Authority |
Investments in affiliates
An affiliated investment is an investment in which the Portfolio owns at least 5% of the outstanding voting shares of the issuer or as a result of other relationships, such as the Portfolio and the issuer having the same adviser or investment manager. Transactions with issuers that were affiliates of the Portfolio at the end of the period were as follows:
| | | | | Net
change in
unrealized
gains
(losses) | | | Income
from
affiliated
securities |
| | | | | | | | |
Allspring Government Money Market Fund Select Class | | | | | | | | |
The accompanying notes are an integral part of these financial statements.
Allspring Strategic Retirement Bond Portfolio | 5
Statement of assets and liabilities—August 31, 2023 (unaudited)
Financial statements
Statement of assets and liabilities
| |
Investments in unaffiliated securities, at value (cost $29,849,688) | |
Investments in affiliated securities, at value (cost $306,207) | |
| |
| |
Prepaid expenses and other assets | |
| |
| |
Professional fees payable | |
Custody and accounting fees payable | |
Interest holder report expenses payable | |
Trustees’ fees and expenses payable | |
| |
| |
The accompanying notes are an integral part of these financial statements.
6 | Allspring Strategic Retirement Bond Portfolio
Statement of operations—six months ended August 31, 2023 (unaudited)
Statement of operations
| |
| |
Income from affiliated securities | |
| |
| |
| |
Custody and accounting fees | |
| |
Interest holder report expenses | |
Trustees’ fees and expenses | |
| |
| |
Less: Fee waivers and/or expense reimbursements | |
| |
| |
Realized and unrealized gains (losses) on investments | |
Net realized losses on investments | |
Net change in unrealized gains (losses) on investments | |
Net realized and unrealized gains (losses) on investments | |
Net increase in net assets resulting from operations | |
The accompanying notes are an integral part of these financial statements.
Allspring Strategic Retirement Bond Portfolio | 7
Statement of changes in net assets
Statement of changes in net assets
|
Six months ended
August 31, 2023 (unaudited) | Year ended February 28, 2023 |
| | | | |
| | | | |
Net realized losses on investments | | | | |
Net change in unrealized gains (losses) on investments | | | | |
Net increase (decrease) in net assets resulting from operations | | | | |
| | | | |
Transactions in investors’ beneficial interests | | | | |
| | | | |
| | | | |
Net decrease in net assets resulting from capital transactions | | | | |
Total decrease in net assets | | | | |
| | | | |
| | | | |
| | | | |
The accompanying notes are an integral part of these financial statements.
8 | Allspring Strategic Retirement Bond Portfolio
| Six months ended
August 31, 2023
(unaudited) | |
| | | | | |
| | | | | | |
Ratios to average net assets (annualized) | | | | | | |
| | | | | | |
| | | | | | |
| | | | | | |
| | | | | | |
| | | | | | |
| Ratio includes expenses which were voluntarily waived by the adviser. Without these voluntary waivers, the net expense ratios would be increased by the following amounts: |
Six months ended August 31, 2023 (unaudited) | |
Year ended February 28, 2023 | |
Year ended February 28, 2022 | |
Year ended February 28, 2021 | |
| |
| Returns for periods of less than one year are not annualized. |
The accompanying notes are an integral part of these financial statements.
Allspring Strategic Retirement Bond Portfolio | 9
Notes to financial statements (unaudited)
Notes to financial statements
Allspring Master Trust (the “Trust”), a Delaware statutory trust organized on March 10, 1999, is an open-end management investment company registered under the Investment Company Act of 1940, as amended (the “1940 Act”). As an investment company, the Trust follows the accounting and reporting guidance in Financial Accounting Standards Board (“FASB”) Accounting Standards Codification Topic 946, Financial Services – Investment Companies. These financial statements report on the Allspring Strategic Retirement Bond Portfolio (the “Portfolio”) which is a diversified series of the Trust.
Interests in the Portfolio are available solely through private placement transactions that do not involve any “public offering” within the meaning of Section 4(a)(2) of the Securities Act of 1933.
2.
SIGNIFICANT ACCOUNTING POLICIES
The following significant accounting policies, which are consistently followed in the preparation of the financial statements of the Portfolio, are in conformity with U.S. generally accepted accounting principles which require management to make estimates and assumptions that affect the reported amounts of assets and liabilities, disclosure of contingent assets and liabilities at the date of the financial statements, and the reported amounts of income and expenses during the reporting period. Actual results could differ from those estimates.
Securities valuation
All investments are valued each business day as of the close of regular trading on the New York Stock Exchange (generally 4 p.m. Eastern Time), although the Portfolio may deviate from this calculation time under unusual or unexpected circumstances.
Debt securities are valued at the evaluated bid price provided by an independent pricing service (e.g. taking into account various factors, including yields, maturities, or credit ratings) or, if a reliable price is not available, the quoted bid price from an independent broker-dealer.
Investments in registered open-end investment companies (other than those listed on a foreign or domestic exchange or market) are valued at net asset value.
Investments which are not valued using the methods discussed above are valued at their fair value, as determined in good faith by Allspring Funds Management, LLC (“Allspring Funds Management”), which was named the valuation designee by the Board of Trustees. As the valuation designee, Allspring Funds Management is responsible for day-to-day valuation activities for the Allspring Funds. In connection with these responsibilities, Allspring Funds Management has established a Valuation Committee and has delegated to it the authority to take any actions regarding the valuation of portfolio securities that the Valuation Committee deems necessary or appropriate, including determining the fair value of portfolio securities. On a quarterly basis, the Board of Trustees receives reports of valuation actions taken by the Valuation Committee. On at least an annual basis, the Board of Trustees receives an assessment of the adequacy and effectiveness of Allspring Funds Management’s process for determining the fair value of the portfolio of investments.
Security transactions and income recognition
Securities transactions are recorded on a trade date basis. Realized gains or losses are recorded on the basis of identified cost.
Interest income is accrued daily and bond discounts are accreted and premiums are amortized daily. To the extent debt obligations are placed on non-accrual status, any related interest income may be reduced by writing off interest receivables when the collection of all or a portion of interest has been determined to be doubtful based on consistently applied procedures and the fair value has decreased. If the issuer subsequently resumes interest payments or when the collectability of interest is reasonably assured, the debt obligation is removed from non-accrual status.
Federal and other taxes
The Portfolio is not required to pay federal income taxes on its net investment income and net capital gains as it is treated as a partnership for federal income tax purposes. All income, gains and losses of the Portfolio are deemed to have been “passed through” to the interest holders in proportion to their holdings of the Portfolio regardless of whether income and gains have been distributed by the Portfolio.
The Portfolio’s income tax returns and all financial records supporting those returns for the prior three fiscal years are subject to examination by the federal revenue authority. Management has analyzed the Portfolio’s tax positions taken on federal, state, and foreign tax returns, as applicable, for all open tax years and does not believe that there are any uncertain tax positions that require recognition of a tax liability.
As of August 31, 2023, the aggregate cost of all investments for federal income tax purposes was $30,237,128 and the unrealized gains (losses) consisted of:
10 | Allspring Strategic Retirement Bond Portfolio
Notes to financial statements (unaudited)
3.
FAIR VALUATION MEASUREMENTS
Fair value measurements of investments are determined within a framework that has established a fair value hierarchy based upon the various data inputs utilized in determining the value of the Portfolio’s investments. The three-level hierarchy gives the highest priority to unadjusted quoted prices in active markets for identical assets or liabilities (Level 1) and the lowest priority to unobservable inputs (Level 3). The Portfolio’s investments are classified within the fair value hierarchy based on the lowest level of input that is significant to the fair value measurement. The inputs are summarized into three broad levels as follows:
•Level 1—quoted prices in active markets for identical securities
•Level 2—other significant observable inputs (including quoted prices for similar securities, interest rates, prepayment speeds, credit risk, etc.)
•Level 3—significant unobservable inputs (including the Portfolio’s own assumptions in determining the fair value of investments)
The inputs or methodologies used for valuing investments in securities are not necessarily an indication of the risk associated with investing in those securities.
The following is a summary of the inputs used in valuing the Portfolio’s assets and liabilities as of August 31, 2023:
| | Other significant
observable inputs
(Level 2) | Significant
unobservable inputs
(Level 3) | |
| | | | |
| | | | |
| | | | |
| | | | |
| | | | |
| | | | |
| | | | |
Additional sector, industry or geographic detail, if any, is included in the Portfolio of Investments.
For the six months ended August 31, 2023, the Portfolio did not have any transfers into/out of Level 3.
4.
TRANSACTIONS WITH AFFILIATES
Advisory fee
The Trust has entered into an advisory contract with Allspring Funds Management, a wholly owned subsidiary of Allspring Global Investments Holdings, LLC, a holding company indirectly owned by certain private funds of GTCR LLC and Reverence Capital Partners, L.P. The adviser is responsible for implementing investment policies and guidelines and for supervising the subadviser, who is responsible for day-to-day portfolio management of the Portfolio. Pursuant to the contract, Allspring Funds Management is entitled to receive an advisory fee at the following annual rate based on the Portfolio’s average daily net assets:
For the six months ended August 31, 2023, the advisory fee was equivalent to an annual rate of 0.05% of the Portfolio’s average daily net assets.
Allspring Funds Management has retained the services of a subadviser to provide daily portfolio management to the Portfolio. The fee for subadvisory services is borne by Allspring Funds Management. Allspring Global Investments, LLC, an affiliate of Allspring Funds Management and a wholly owned subsidiary of Allspring Global Investments Holdings, LLC, is the subadviser to the Portfolio and is entitled to receive a fee from Allspring Funds Management at an annual rate starting at 0.04% and declining to 0.03% as the average daily net assets of the Portfolio increase.
Allspring Funds Management has voluntarily waived and/or reimbursed expenses to reduce the net operating expense ratio of the Portfolio. These voluntary waivers may be discontinued at any time.
Interfund transactions
The Portfolio may purchase or sell portfolio investment securities to certain affiliates pursuant to Rule 17a-7 under the 1940 Act and under procedures adopted by the Board of Trustees. The procedures have been designed to ensure that these interfund transactions, which do not incur broker commissions, are effected at current market prices. Pursuant to these procedures, the Portfolio did not have any interfund transactions during the six months ended August 31, 2023.
Allspring Strategic Retirement Bond Portfolio | 11
Notes to financial statements (unaudited)
5.
INVESTMENT PORTFOLIO TRANSACTIONS
Purchases and sales of investments, excluding U.S. government obligations (if any) and short-term securities, for the six months ended August 31, 2023 were $3,636,876 and $4,919,376, respectively.
The Trust, along with Allspring Variable Trust and Allspring Funds Trust (excluding the money market funds), are parties to a $350,000,000 revolving credit agreement whereby the Portfolio is permitted to use bank borrowings for temporary or emergency purposes, such as to fund interest holders withdrawal requests. Interest under the credit agreement is charged to the Portfolio based on a borrowing rate equal to the higher of the Federal Funds rate or the overnight bank funding rate in effect on that day plus a spread. In addition, an annual commitment fee based on the unused balance is allocated to each participating fund.
For the six months ended August 31, 2023, there were no borrowings by the Portfolio under the agreement.
Under the Portfolio’s organizational documents, the officers and Trustees have been granted certain indemnification rights against certain liabilities that may arise out of performance of their duties to the Portfolio. The Portfolio has entered into a separate agreement with each Trustee that converts indemnification rights currently existing under the Portfolio’s organizational documents into contractual rights that cannot be changed in the future without the consent of the Trustee. Additionally, in the normal course of business, the Portfolio may enter into contracts with service providers that contain a variety of indemnification clauses. The Portfolio’s maximum exposure under these arrangements is dependent on future claims that may be made against the Portfolio and, therefore, cannot be estimated.
12 | Allspring Strategic Retirement Bond Portfolio
Other information (unaudited)
Other information
Proxy voting information
A description of the policies and procedures used to determine how to vote proxies relating to portfolio securities is available without charge, upon request, by calling 1-866-259-3305, visiting our website at allspringglobal.com, or visiting the SEC website at sec.gov. Information regarding how the proxies related to portfolio securities were voted during the most recent 12-month period ended June 30 is available on the website at allspringglobal.com or by visiting the SEC website at sec.gov.
Quarterly portfolio holdings information
The Portfolio files its complete schedule of portfolio holdings with the SEC for the first and third quarters of each fiscal year as an exhibit to its reports on Form N-PORT. Interest holders may view the filed Form N-PORT by visiting the SEC website at sec.gov.
Allspring Strategic Retirement Bond Portfolio | 13
Other information (unaudited)
Board of trustees and officers
Each of the Trustees and Officers listed in the table below acts in identical capacities for each fund in the Allspring family of funds, which consists of 126 mutual funds comprising the Allspring Funds Trust, Allspring Variable Trust, Allspring Master Trust and four closed-end funds (collectively the “Fund Complex”). This table should be read in conjunction with the Prospectus and the Statement of Additional Information1. The mailing address of each Trustee and Officer is 1415 Vantage Park Drive, 3rd Floor, Charlotte, NC 28203. Each Trustee and Officer serves an indefinite term, however, each Trustee serves such term until reaching the mandatory retirement age established by the Trustees.
Independent Trustees
| | Principal occupations during past five years or longer | Current other
public company or
investment
company
directorships |
William R. Ebsworth
(Born 1957) | | Retired. From 1984 to 2013, equities analyst, portfolio manager, research director and chief investment officer at Fidelity Management and Research Company in Boston, Tokyo, and Hong Kong, and retired in 2013 as Chief Investment Officer of Fidelity Strategic Advisers, Inc. where he led a team of investment professionals managing client assets. Prior thereto, Board member of Hong Kong Securities Clearing Co., Hong Kong Options Clearing Corp., the Thailand International Fund, Ltd., Fidelity Investments Life Insurance Company, and Empire Fidelity Investments Life Insurance Company. Audit Committee Chair and Investment Committee Chair of the Vincent Memorial Hospital Foundation (non-profit organization). Mr. Ebsworth is a CFA charterholder. | |
Jane A. Freeman
(Born 1953) | Trustee,
since 2015;
Chair Liaison,
since 2018 | Retired. From 2012 to 2014 and 1999 to 2008, Chief Financial Officer of Scientific Learning Corporation. From 2008 to 2012, Ms. Freeman provided consulting services related to strategic business projects. Prior to 1999, Portfolio Manager at Rockefeller & Co. and Scudder, Stevens & Clark. Board member of the Harding Loevner Funds from 1996 to 2014, serving as both Lead Independent Director and chair of the Audit Committee. Board member of the Russell Exchange Traded Funds Trust from 2011 to 2012 and the chair of the Audit Committee. Ms. Freeman is also an inactive Chartered Financial Analyst. | |
Isaiah Harris, Jr.
(Born 1952) | Trustee,
since 2009;
Audit Committee Chair,
since 2019 | Retired. Member of the Advisory Board of CEF of East Central Florida. Chairman of the Board of CIGNA Corporation from 2009 to 2021, and Director from 2005 to 2008. From 2003 to 2011, Director of Deluxe Corporation. Prior thereto, President and CEO of BellSouth Advertising and Publishing Corp. from 2005 to 2007, President and CEO of BellSouth Enterprises from 2004 to 2005 and President of BellSouth Consumer Services from 2000 to 2003. Emeritus member of the Iowa State University Foundation Board of Governors. Emeritus Member of the Advisory board of Iowa State University School of Business. Advisory Board Member, Palm Harbor Academy (private school). Advisory Board Member, Fellowship of Christian Athletes. Mr. Harris is a certified public accountant (inactive status). | |
David F. Larcker
(Born 1950) | | Distinguished Visiting Fellow at the Hoover Institution since 2022. James Irvin Miller Professor of Accounting at the Graduate School of Business (Emeritus), Stanford University, Director of the Corporate Governance Research Initiative and Senior Faculty of The Rock Center for Corporate Governance since 2006. From 2005 to 2008, Professor of Accounting at the Graduate School of Business, Stanford University. Prior thereto, Ernst & Young Professor of Accounting at The Wharton School, University of Pennsylvania from 1985 to 2005. | |
Olivia S. Mitchell
(Born 1953) | Trustee,
since 2006;
Nominating and Governance Committee Chair,
since 2018 | International Foundation of Employee Benefit Plans Professor since 1993, Wharton School of the University of Pennsylvania. Director of Wharton’s Pension Research Council and Boettner Center on Pensions & Retirement Research, and Research Associate at the National Bureau of Economic Research. Previously taught at Cornell University from 1978 to 1993. | |
Timothy J. Penny
(Born 1951) | Trustee,
since 1996;
Chair,
since 2018 | President and Chief Executive Officer of Southern Minnesota Initiative Foundation, a non-profit organization, since 2007. Vice Chair of the Economic Club of Minnesota, since 2007. Co-Chair of the Committee for a Responsible Federal Budget, since 1995. Member of the Board of Trustees of NorthStar Education Finance, Inc., a non-profit organization, from 2007-2022. Senior Fellow of the University of Minnesota Humphrey Institute from 1995 to 2017. | |
1
The Statement of Additional Information includes additional information about the Trustees and is available, without charge, upon request, by calling 1-800-222-8222 or by visiting the website at allspringglobal.com.
14 | Allspring Strategic Retirement Bond Portfolio
Other information (unaudited)
| Position held and length of service* | Principal occupations during past five years or longer | Current other public company or investment company directorships |
James G. Polisson
(Born 1959) | | Retired. Chief Marketing Officer, Source (ETF) UK Services, Ltd, from 2015 to 2017. From 2012 to 2015, Principal of The Polisson Group, LLC, a management consulting, corporate advisory and principal investing company. Chief Executive Officer and Managing Director at Russell Investments, Global Exchange Traded Funds from 2010 to 2012. Managing Director of Barclays Global Investors from 1998 to 2010 and Global Chief Marketing Officer for iShares and Barclays Global Investors from 2000 to 2010. Trustee of the San Francisco Mechanics’ Institute, a non- profit organization, from 2013 to 2015. Board member of the Russell Exchange Traded Fund Trust from 2011 to 2012. Director of Barclays Global Investors Holdings Deutschland GmbH from 2006 to 2009. Mr. Polisson is an attorney and has a retired status with the Massachusetts and District of Columbia Bar Associations. | |
Pamela Wheelock
(Born 1959) | Trustee,
since January 2020;
previously Trustee from
January 2018 to
July 2019 | Retired. Executive and Senior Financial leadership positions in the public, private and nonprofit sectors. Interim President and CEO, McKnight Foundation, 2020. Interim Commissioner, Minnesota Department of Human Services, 2019. Chief Operating Officer, Twin Cities Habitat for Humanity, 2017-2019. Vice President for University Services, University of Minnesota, 2012- 2016. Interim President and CEO, Blue Cross and Blue Shield of Minnesota, 2011-2012. Executive Vice-President and Chief Financial Officer, Minnesota Wild, 2002-2008. Commissioner, Minnesota Department of Finance, 1999-2002. Chair of the Board of Directors of Destination Medical Center Corporation. Board member of the Minnesota Wild Foundation. | |
| Length of service dates reflect the Trustee’s commencement of service with the Trust’s predecessor entities, where applicable. |
Allspring Strategic Retirement Bond Portfolio | 15
Other information (unaudited)
Officers1
| Position held and
length of service | Principal occupations during past five years or longer |
| | President and Chief Executive Officer of Allspring Funds Management, LLC since 2017 and Head of Global Fund Governance of Allspring Global Investments since 2022. Prior thereto, co-president of Galliard Capital Management, LLC, an affiliate of Allspring Funds Management, LLC, from 2019 to 2022 and Head of Affiliated Managers, Allspring Global Investments, from 2014 to 2019 and Executive Vice President responsible for marketing, investments and product development for Allspring Funds Management, LLC, from 2009 to 2014. |
Jeremy DePalma
(Born 1974) | Treasurer,
since 2012
(for certain funds in
the Fund Complex);
since 2021 (for
the remaining funds in the Complex) | Senior Vice President of Allspring Funds Management, LLC since 2009. Senior Vice President of Evergreen Investment Management Company, LLC from 2008 to 2010 and head of the Fund Reporting and Control Team within Fund Administration from 2005 to 2010. |
Christopher Baker
(Born 1976) | Chief Compliance Officer,
since 2022 | Global Chief Compliance Officer for Allspring Global Investments since 2022. Prior thereto, Chief Compliance Officer for State Street Global Advisors from 2018 to 2021. Senior Compliance Officer for the State Street divisions of Alternative Investment Solutions, Sector Solutions, and Global Marketing from 2015 to 2018. From 2010 to 2015 Vice President, Global Head of Investment and Marketing Compliance for State Street Global Advisors. |
Matthew Prasse
(Born 1983) | Chief Legal Officer,
since 2022;
Secretary,
since 2021 | Senior Counsel of the Allspring Legal Department since 2021. Senior Counsel of the Wells Fargo Legal Department from 2018 to 2021. Previously, Counsel for Barings LLC from 2015 to 2018. Prior to joining Barings, Associate at Morgan, Lewis & Bockius LLP from 2008 to 2015. |
1 For those Officers with tenures at Allspring Global Investments and/or Allspring Funds Management, LLC that began prior to 2021, such tenures include years of service during which these businesses/entities were known as Wells Fargo Asset Management and Wells Fargo Funds Management, LLC, respectively.
16 | Allspring Strategic Retirement Bond Portfolio
Other information (unaudited)
Board consideration of investment advisory and sub-advisory agreements:
Allspring Bloomberg US Aggregate ex-Corporate Portfolio, Allspring Emerging Markets Bond Portfolio, Allspring Factor Enhanced Emerging Markets Equity Portfolio, Allspring Factor Enhanced International Equity Portfolio, Allspring Factor Enhanced U.S. Large Cap Equity Portfolio, Allspring Factor Enhanced U.S. Small Cap Equity Portfolio, Allspring High Yield Corporate Bond Portfolio, Allspring Investment Grade Corporate Bond Portfolio, Allspring Strategic Retirement Bond Portfolio, and Allspring U.S. REIT Portfolio
Under the Investment Company Act of 1940 (the “1940 Act”), the Board of Trustees (the “Board”) of Allspring Master Trust (the “Trust”) must determine annually whether to approve the continuation of the Trust’s investment advisory and sub-advisory agreements. In this regard, at a meeting held on May 15-17, 2023 (the “Meeting”), the Board, all the members of which have no direct or indirect interest in the investment advisory and sub-advisory agreements and are not “interested persons” of the Trust, as defined in the 1940 Act (the “Independent Trustees”), reviewed and approved for each of the portfolios of the Trust identified in the table below (individually, a “Portfolio” and collectively, the “Portfolios”): (i) an investment advisory agreement (the “Advisory Agreement”) with Allspring Funds Management, LLC (“Allspring Funds Management”); and (ii) an investment sub-advisory agreement (each, a “Sub-Advisory Agreement” and collectively, the “Sub-Advisory Agreements”) with the Sub-Advisers(s) identified in the table below (each, a “Sub-Adviser” and collectively, the “Sub-Advisers”) for the corresponding Portfolio identified. The Advisory Agreement and the Sub-Advisory Agreements are collectively referred to as the “Advisory Agreements.”
| |
Allspring Bloomberg Barclays US Aggregate ex-Corporate Portfolio | Allspring Global Investments, LLC |
Allspring Emerging Markets Bond Portfolio | Allspring Global Investments, LLC, Allspring Global Investments (UK) Limited |
Allspring Factor Enhanced Emerging Markets Equity Portfolio | Allspring Global Investments, LLC |
Allspring Factor Enhanced International Equity Portfolio | Allspring Global Investments, LLC |
Allspring Factor Enhanced U.S. Large Cap Equity Portfolio | Allspring Global Investments, LLC |
Allspring Factor Enhanced U.S. Small Cap Equity Portfolio | Allspring Global Investments, LLC |
Allspring High Yield Corporate Bond Portfolio | Allspring Global Investments, LLC |
Allspring Investment Grade Corporate Bond Portfolio | Allspring Global Investments, LLC |
Allspring Strategic Retirement Bond Portfolio | Allspring Global Investments, LLC |
Allspring U.S. REIT Portfolio | Allspring Global Investments, LLC |
At the Meeting, the Board considered the factors and reached the conclusions described below relating to the selection of Allspring Funds Management and the Sub-Advisers and the approval of the Advisory Agreements. Prior to the Meeting, including at a Board meeting held in April 2023, the Trustees conferred extensively among themselves and with representatives of Allspring Funds Management about these matters. The Board has adopted a team-based approach, with each team consisting of a sub-set of Trustees, to assist the full Board in the discharge of its duties in reviewing investment performance and other matters throughout the year. The Independent Trustees were assisted in their evaluation of the Advisory Agreements by independent legal counsel, from whom they received separate legal advice and with whom they met separately.
The Board noted that it initially approved the Advisory Agreements at a Board meeting held in May 2021, each for a two-year term, in advance of the sale of Wells Fargo Asset Management to Allspring Global Investments Holdings, LLC,1 a holding company indirectly owned by certain private funds of GTCR LLC and Reverence Capital Partners, L.P. (the “Transaction”). The Trustees also noted that, while they did not specifically consider the continuation of the Advisory Agreements in 2022 as a result of the two-year term that was approved in 2021, the Trustees received and considered certain information at a Board meeting held in April 2022 that was applicable to the Advisory Agreements, including an overview and financial review of the Allspring Global Investments business, information regarding certain ancillary agreements that were approved by the Board at the April 2022 Board meeting, and comparative data regarding Fund fees and expenses.
In providing information to the Board, Allspring Funds Management and the Sub-Advisers were guided by a detailed set of requests for information submitted to them by independent legal counsel on behalf of the Independent Trustees at the start of the Board’s annual contract renewal process earlier in 2023. In considering and approving the Advisory Agreements, the Trustees considered the information they believed relevant, including but not limited to the information discussed below. The Board considered not only the specific information presented in connection with the Meeting, but also the knowledge gained over time through interaction with Allspring Funds Management and the Sub-Advisers about various topics. In this regard, the Board reviewed reports of Allspring Funds Management at each of its quarterly meetings, which included, among other things, portfolio reviews and investment performance reports. In addition, the Board and the teams mentioned above confer with portfolio managers at various times throughout the year. The Board did not identify any particular information or consideration that was all-important or controlling, and each individual Trustee may have attributed different weights to various factors.
1
The trade name for the asset management firm that includes Allspring Funds Management and the Sub-Adviser is “Allspring Global Investments.”
Allspring Strategic Retirement Bond Portfolio | 17
Other information (unaudited)
After its deliberations, the Board unanimously determined that the compensation or the absence of compensation payable to Allspring Funds Management and each of the Sub-Advisers under each of the Advisory Agreements was reasonable, and approved the continuation of the Advisory Agreements for a one-year term. The Board considered the approval of the Advisory Agreements for the Portfolios as part of its consideration of agreements for funds across the complex, but its approvals were made on a fund-by-fund basis. The following summarizes a number of important, but not necessarily all, factors considered by the Board in support of its approvals.
Nature, extent and quality of services
The Board received and considered various information regarding the nature, extent, and quality of services provided to the Portfolios by Allspring Funds Management and the Sub-Advisers under the Advisory Agreements. This information included a description of the investment advisory services and Portfolio-level administrative services covered by the Advisory Agreement, as well as, among other things, a summary of the background and experience of senior management of Allspring Global Investments, of which Allspring Funds Management and the Sub-Advisers are a part, and a summary of investments made in the Allspring Global Investments business. The Board also considered information about retention arrangements with respect to key personnel of Allspring Global Investments that were put in place in connection with the Transaction. The Board took into account information about the services that continue to be provided by Wells Fargo & Co. and/or its affiliates (“Wells Fargo”) since the Transaction under a transition services agreement and the anticipated timeline for exiting the transition services agreement. In addition, the Board received and considered information about the full range of services provided to the Fund by Allspring Funds Management and its affiliates.
The Board considered the qualifications, background, tenure, and responsibilities of each of the portfolio managers primarily responsible for the day-to-day portfolio management of the Portfolios. The Board evaluated the ability of Allspring Funds Management and the Sub-Advisers to attract and retain qualified investment professionals, including research, advisory, and supervisory personnel.
The Board further considered the compliance programs and compliance records of Allspring Funds Management and the Sub-Advisers. The Board received and considered information about Allspring Global Investments’ risk management functions, which included information about Allspring Funds Management’s and the Sub-Advisers’ business continuity plans, their approaches to data privacy and cybersecurity, and Allspring Funds Management’s role as administrator of the Portfolios’ liquidity risk management program, and the derivatives risk management program for Allspring Bloomberg Barclays US Aggregate ex-Corporate Portfolio and Allspring Factor Enhanced U.S. Large Cap Equity Portfolio. The Board also received and considered information about Allspring Funds Management’s intermediary and vendor oversight program.
Portfolio investment performance and expenses
The Board considered the investment performance results for each of the Portfolios over various time periods ended December 31, 2022. The Board considered these results in comparison to the investment performance of funds in a universe that was determined by Broadridge Inc. (“Broadridge”) to be similar to each respective Portfolios (each, a “Universe”), and in comparison to each Portfolios’ benchmark index and to other comparative data. Broadridge is an independent provider of investment company data. The Board received a description of the methodology used by Broadridge to select the mutual funds in the performance Universe. The Board noted the short performance history of the Portfolios.
With respect to the investment performance of each Portfolio relative to its respective Universe, the Board noted the following: (i) the investment performance of Allspring Bloomberg US Aggregate ex-Corporate Portfolio was higher than the average investment performance of the Universe for all periods under review; the investment performance of Allspring Bloomberg US Aggregate ex-Corporate Portfolio was higher than the investment performance of its benchmark index, the Bloomberg U.S. Aggregate ex Corporate Index, for the one-year period and was in range of the investment performance of its benchmark index for the three- and five-year periods under review; (ii) the investment performance of Allspring Emerging Markets Bond Portfolio was lower than the average investment performance of the Universe for the one- and three-year periods and was in range of the average investment performance of the Universe for the five-year period; the investment performance of Allspring Emerging Markets Bond Portfolio was higher than the investment performance of its benchmark index, the J.P. Morgan EM Bond Global Diversified Index, for the one-year period and was in range of the investment performance of its benchmark index for the three- and five-year periods under review; (iii) the investment performance of Allspring Factor Enhanced Emerging Markets Equity Portfolio was higher than the average investment performance of the Universe for the one-year period and was lower than the average investment performance of the Universe for the three- and five-year periods; the investment performance of Allspring Factor Enhanced Emerging Markets Equity Portfolio was higher than the investment performance of its benchmark index, the MSCI Emerging Markets Index (Net), for the one-year period and was lower than the investment performance of its benchmark index for the three- and five-year periods under review; (iv) the investment performance of Allspring Factor Enhanced International Equity Portfolio was higher than the average investment performance of the Universe for all periods under review; the investment performance of Allspring Factor Enhanced International Equity Portfolio was higher than the investment performance of its benchmark index, the MSCI World ex US Index (Net), for all periods under review; (v) the investment performance of Allspring Factor Enhanced U.S. Large Cap Equity Portfolio was higher than the average investment performance of the Universe for the one- and five-year periods and was lower than the average investment performance of the Universe for the three-year period; the investment performance of Allspring Factor Enhanced U.S. Large Cap Equity Portfolio was higher than the investment performance of its benchmark index, the Russell 1000® Index, for the one-year period and was lower than the investment performance of its benchmark index for the three- and five-year periods under review; (vi) the investment performance of Allspring Factor Enhanced U.S. Small Cap Equity Portfolio was lower than the average investment performance of the Universe for all periods under review; the investment performance of Allspring Factor Enhanced U.S. Small Cap Equity Portfolio was higher than the
18 | Allspring Strategic Retirement Bond Portfolio
Other information (unaudited)
investment performance of its benchmark index, the Russell 2000® Index, for the one-year period and was lower than the investment performance of its benchmark index for the three- and five-year periods under review; (vii) the investment performance of Allspring High Yield Corporate Bond Portfolio was lower than the average investment performance of the Universe for all periods under review; the investment performance of Allspring High Yield Corporate Bond Portfolio was in range of the investment performance of its benchmark index, the Bloomberg U.S. Corporate High Yield 2% Issuer Capped, for the one-year period and was lower than the investment performance of its benchmark index for the three- and five-year periods under review; (viii) the investment performance of Allspring Investment Grade Corporate Bond Portfolio was higher than the average investment performance of the Universe for the one- and five-year periods and in rage of the average investment performance of the Universe for the three-year period; the investment performance of Allspring Investment Grade Corporate Bond Portfolio was higher than the investment performance of its benchmark index, the Bloomberg U.S. Corporate Bond Index, for the one-year period and was in range of the investment performance of its benchmark index for the three- and five-year periods under review; (ix) the investment performance of Allspring Strategic Retirement Bond Portfolio was higher than the average investment performance of the Universe for all periods under review; the investment performance of Allspring Strategic Retirement Bond Portfolio was higher than the investment performance of its benchmark index, the Strategic Retirement Blended Index, for the one- and three-year periods and was in range of the investment performance of its benchmark index for the five-year period; (x) the investment performance of Allspring U.S. REIT Portfolio was lower than the average investment performance of the Universe for the one-year period and was in range of the average investment performance of the Universe for the three- and five-year periods; the investment performance of Allspring U.S. REIT Portfolio was higher than the investment performance of its benchmark index, the Dow Jones U.S. Select REIT Index, for all periods under review.
The Board received information concerning, and discussed factors contributing to, the underperformance of each of Allspring Emerging Markets Bond Portfolio, Allspring Factor Enhanced Emerging Markets Equity Portfolio, Allspring Factor Enhanced U.S. Large Cap Equity Portfolio, Allspring Factor Enhanced U.S. Small Cap Equity Portfolio and Allspring High Yield Corporate Bond Portfolio relative to such Portfolio’s Universe and benchmark index for the periods identified above. The Board took note of the explanations for the relative underperformance during these periods, including with respect to investment decisions and market factors that affected each Portfolio’s investment performance.
The Board also received and considered information regarding the fee rates that are payable to Allspring Funds Management for investment advisory services (as discussed below), which are the only fees charged to the Portfolios, relative to corresponding class-specific expense groups that were determined by Broadridge to be similar to the Portfolios (the “Groups”). The Board received a description of the methodology used by Broadridge to select the mutual funds in the expense Groups and an explanation of how funds comprising expense groups and their expense ratios may vary from year-to-year.
The Board took into account the Portfolios’ investment performance and expense information provided to it among the factors considered in deciding to re-approve the Advisory Agreements.
Investment advisory and sub-advisory fee rates
The Board reviewed and considered the contractual fee rates payable by the Portfolios to Allspring Funds Management under the Advisory Agreement. The Board also reviewed and considered the contractual investment sub-advisory fee rates that are payable by Allspring Funds Management to the Sub-Advisers for investment sub-advisory services.
Among other information reviewed by the Board was a comparison of the Portfolios’ Advisory Rates with the average contractual investment advisory fee rates of funds in the expense Groups at a common asset level as well as transfer agency costs of the Portfolios in the expense Groups. The Board noted that the Advisory Rates of the Portfolios were lower than or in range of the mean rates for the Portfolios’ expense Groups.
The Board also received and considered information about the portions of the total advisory fees that were retained by Allspring Funds Management after payment of the fees to the Sub-Advisers for sub-advisory services. In assessing the reasonableness of these amounts, the Board received and evaluated information about the nature and extent of responsibilities retained and risks assumed by Allspring Funds Management and not delegated to or assumed by the Sub-Advisers, and about Allspring Funds Management’s on-going oversight services. Given the affiliation between Allspring Funds Management and the Sub-Advisers, the Board ascribed limited relevance to the allocation of fees between them.
For all Portfolios, except Allspring Factor Enhanced U.S. Small Cap Equity Portfolio, Allspring Factor Enhanced International Equity Portfolio, Allspring Factor Enhanced Emerging Markets Equity Portfolio, Allspring U.S. REIT Portfolio, Allspring Investment Grade Corporate Bond Portfolio, and Allspring Strategic Retirement Bond Portfolio, the Board also received and considered information about the nature and extent of services offered and fee rates charged by Allspring Funds Management and the Sub-Advisers to other types of clients with investment strategies similar to those of certain Portfolios. In this regard, the Board received information about the significantly greater scope of services, and compliance, reporting and other legal burdens and risks of managing proprietary mutual funds compared with those associated with managing assets of other types of clients, including third-party sub-advised fund clients and non-mutual fund clients such as institutional separate accounts.
Based on its consideration of the factors and information it deemed relevant, including those described here, the Board determined that the compensation payable to Allspring Funds Management under the Advisory Agreement and to the Sub-Advisers under the Sub-Advisory Agreements was reasonable.
Allspring Strategic Retirement Bond Portfolio | 19
Other information (unaudited)
Profitability
The Board received and considered information concerning the profitability of Allspring Funds Management, as well as the profitability of Allspring Global Investments, from providing services to the fund complex as a whole. The Board noted that the Sub-Adviser’s profitability information with respect to providing services to the Portfolios and other funds in the complex was subsumed in the Allspring Global Investments profitability analysis.
Allspring Funds Management reported on the methodologies and estimates used in calculating profitability, including a description of the methodology used to allocate certain expenses and differences in how Allspring Global Investments calculates its pre-tax profit metric versus the methodology used when Allspring Funds Management was part of Wells Fargo. It was noted that the impact of such differences had only minor impact on the financial results presented. Among other things, the Board noted that the levels of profitability reported on a fund-by-fund basis varied widely, depending on factors such as the size, type, and age of fund.
Based on its review, the Board did not deem the profits reported by Allspring Funds Management or Allspring Global Investments from services provided to the Portfolios to be at a level that would prevent it from approving the continuation of the Advisory Agreements.
Economies of scale
The Board received and considered information about the potential for Allspring Funds Management to experience economies of scale in the provision of management services to the Portfolios, the difficulties of calculating economies of scale at an individual fund level, and the extent to which potential scale benefits are shared with Portfolio shareholders. The Board noted the existence of breakpoints in the Portfolios’ advisory fee structure, which operate generally to reduce the Portfolios’ expense ratios as the Portfolios grow in size, and the size of the Portfolios in relation to such breakpoints. The Board considered that in addition to advisory fee breakpoints, Allspring Funds Management shares potential economies of scale from its management business in a variety of ways, including through fee waiver and expense reimbursement arrangements, competitive advisory fee rates set at the outset without regard to breakpoints, and investments in the business intended to enhance services available to shareholders.
The Board concluded that Allspring Funds Management’s arrangements with respect to the Portfolios, including contractual breakpoints, constituted a reasonable approach to sharing potential economies of scale with the Portfolios and their shareholders.
Other benefits to Allspring Funds Management and the Sub-Advisers
The Board received and considered information regarding potential “fall-out” or ancillary benefits received by Allspring Funds Management and its affiliates, including the Sub-Advisers, as a result of their relationships with the Portfolios. Ancillary benefits could include, among others, benefits directly attributable to other relationships with the Portfolios and benefits potentially derived from an increase in Allspring Funds Management’s and the Sub-Advisers’ businesses as a result of their relationships with the Portfolios. The Board noted that Allspring Funds Distributor, LLC, an affiliate of Allspring Funds Management, receives distribution-related fees in respect of shares sold or held through it.
The Board also reviewed information about soft dollar credits earned and utilized by the Sub-Advisers and fees earned in the past by Allspring Funds Management and the Sub-Advisers from managing a private investment vehicle for the fund complex’s securities lending collateral.
Based on its consideration of the factors and information it deemed relevant, including those described here, the Board did not find that any ancillary benefits received by Allspring Funds Management and its affiliates, including the Sub-Advisers, were unreasonable.
Conclusion
At the Meeting, after considering the above-described factors and based on its deliberations and its evaluation of the information described above, the Board unanimously determined that the compensation payable to Allspring Funds Management and the Sub-Advisers under each of the Advisory Agreements was reasonable, and approved the continuation of the Advisory Agreements for a one-year term.
20 | Allspring Strategic Retirement Bond Portfolio
Other information (unaudited)
Liquidity risk management program
In accordance with Rule 22e-4 under the Investment Company Act of 1940, as amended (the “Liquidity Rule”), Allspring Master Trust (the “Trust”) has adopted and implemented a liquidity risk management program (the “Program”) on behalf of each of its series, including the Portfolio, which is reasonably designed to assess and manage the Portfolio’s liquidity risk. “Liquidity risk” is defined under the Liquidity Rule as the risk that the Portfolio is unable to meet redemption requests without significantly diluting remaining investors’ interests in the Portfolio. The Trust’s Board of Trustees (the “Board”) previously approved the designation of Allspring Funds Management, LLC (“Allspring Funds Management”), the Portfolio’s investment adviser, to administer the Program, and Allspring Funds Management has established a Liquidity Risk Management Council (the “Council”) composed of personnel from multiple departments within Allspring Funds Management and its affiliates to assist Allspring Funds Management in the administration of the Program.
The Program is comprised of various components designed to support the assessment and/or management of liquidity risk, including: (1) the periodic assessment (no less frequently than annually) of certain factors that influence the Portfolio’s liquidity risk; (2) the periodic classification (no less frequently than monthly) of the Portfolio’s investments into one of four liquidity categories that reflect an estimate of their liquidity under current market conditions; (3) a 15% limit on the acquisition of “illiquid investments” (as defined under the Liquidity Rule); (4) to the extent the Portfolio does not invest primarily in “highly liquid investments” (as defined under the Liquidity Rule), the determination of a minimum percentage of the Portfolio’s assets that generally will be invested in highly liquid investments (an “HLIM”); (5) if the Portfolio has established an HLIM, the periodic review (no less frequently than annually) of the HLIM and the adoption of policies and procedures for responding to a shortfall of the Portfolio’s “highly liquid investments” below its HLIM; and (6) periodic reporting to the Board.
At a meeting of the Board held on May 16-17, 2023, the Board received and reviewed a written report (the “Report”) from Allspring Funds Management that, among other things, addressed the operation of the Program and assessed its adequacy and effectiveness for the period from January 1, 2022 through December 31, 2022 (the “Reporting Period”). The Report noted significant liquidity events impacting the Portfolios related to extended foreign market holidays as well as the difficulty of trading and settlement of most Russia-related securities due to sanctions activity. The Report noted that there were no material changes to the Program during the Reporting Period.
Allspring Funds Management determined in the Report that the Program has been implemented and operates effectively to manage each Portfolio’s, including the Portfolio’s, liquidity risk, and Allspring Funds Management continues to believe that the Program has been and continues to be adequately and effectively implemented to monitor and, as applicable, respond to the Portfolio’s liquidity developments.
There can be no assurance that the Program will achieve its objectives under all circumstances in the future.
Allspring Strategic Retirement Bond Portfolio | 21
For more information
More information about Allspring Funds is available free upon request. To obtain literature, please write, visit the Portfolio’s website, or call:
Allspring Funds
P.O. Box 219967
Kansas City, MO 64121-9967
Website: allspringglobal.com
Individual investors: 1-800-222-8222
Retail investment professionals: 1-888-877-9275
Institutional investment professionals: 1-800-260-5969
This report and the financial statements contained herein are submitted for the general information of the interest holders of the Portfolio. If this report is used for promotional purposes, distribution of the report must be accompanied or preceded by a current prospectus. Before investing, please consider the investment objectives, risks, charges, and expenses of the investment. For a current prospectus and, if available, a summary prospectus, containing this information, call 1-800-222-8222 or visit the Portfolio’s website at allspringglobal.com. Read the prospectus carefully before you invest or send money.
Allspring Global InvestmentsTM is the trade name for the asset management firms of Allspring Global Investments Holdings, LLC, a holding company indirectly owned by certain private funds of GTCR LLC and Reverence Capital Partners, L.P. These firms include but are not limited to Allspring Global Investments, LLC, and Allspring Funds Management, LLC. Certain products managed by Allspring entities are distributed by Allspring Funds Distributor, LLC (a broker-dealer and Member FINRA/SIPC).
This material is for general informational and educational purposes only and is NOT intended to provide investment advice or a recommendation of any kind - including a recommendation for any specific investment, strategy, or plan.
© 2023 Allspring Global Investments Holdings, LLC. All rights reserved.
Allspring U.S. REIT Portfolio
Semi-Annual Report
August 31, 2023
Allspring U.S. REIT Portfolio | 1
Performance highlights (unaudited)
Performance highlights
| The Portfolio seeks to replicate the total return of the Dow Jones U.S. Select REIT Index,† before fees and expenses. |
| Allspring Funds Management, LLC |
| Allspring Global Investments, LLC |
| Petros N. Bocray, CFA, FRM |
Ten largest holdings (%) as of August 31, 20231 |
| |
| |
| |
| |
Digital Realty Trust, Inc. | |
| |
Simon Property Group, Inc. | |
Extra Space Storage, Inc. | |
AvalonBay Communities, Inc. | |
| |
| Figures represent the percentage of the Portfolio’s net assets. Holdings are subject to change and may have changed since the date specified. |
| The Dow Jones U.S. Select REIT Index tracks the performance of publicly traded REITs and REIT-like securities and is designed to serve as a proxy for direct real estate investment, in part by excluding companies whose performance may be driven by factors other than the value of real estate. You cannot invest directly in an index. |
| CFA® and Chartered Financial Analyst® are trademarks owned by CFA Institute. |
2 | Allspring U.S. REIT Portfolio
Portfolio of investments—August 31, 2023 (unaudited)
| | | | | |
| | | | | | |
| | | | | | |
| | | | | | |
American Assets Trust, Inc. | | | | | | |
Broadstone Net Lease, Inc. | | | | | | |
Empire State Realty Trust, Inc. Class A | | | | | | |
Essential Properties Realty Trust, Inc. | | | | | | |
| | | | | | |
| | | | | | |
| | | | | | |
Health care REITs: 10.56% | | | | | | |
| | | | | | |
Community Healthcare Trust, Inc. | | | | | | |
Diversified Healthcare Trust | | | | | | |
Global Medical REIT, Inc. | | | | | | |
Healthcare Realty Trust, Inc. Class A | | | | | | |
Healthpeak Properties, Inc. | | | | | | |
| | | | | | |
Medical Properties Trust, Inc. | | | | | | |
National Health Investors, Inc. | | | | | | |
Omega Healthcare Investors, Inc. | | | | | | |
Universal Health Realty Income Trust | | | | | | |
| | | | | | |
| | | | | | |
| | | | | | |
Hotel & resort REITs: 3.64% | | | | | | |
Apple Hospitality REIT, Inc. | | | | | | |
Ashford Hospitality Trust, Inc.† | | | | | | |
| | | | | | |
DiamondRock Hospitality Co. | | | | | | |
Hersha Hospitality Trust Class A | | | | | | |
Host Hotels & Resorts, Inc. | | | | | | |
Park Hotels & Resorts, Inc. | | | | | | |
| | | | | | |
| | | | | | |
Ryman Hospitality Properties, Inc. | | | | | | |
| | | | | | |
Summit Hotel Properties, Inc. | | | | | | |
Sunstone Hotel Investors, Inc. | | | | | | |
Xenia Hotels & Resorts, Inc. | | | | | | |
| | | | | | |
Industrial REITs : 18.18% | | | | | | |
Americold Realty Trust, Inc. | | | | | | |
EastGroup Properties, Inc. | | | | | | |
First Industrial Realty Trust, Inc. | | | | | | |
Industrial Logistics Properties Trust | | | | | | |
Innovative Industrial Properties, Inc. | | | | | | |
The accompanying notes are an integral part of these financial statements.
Allspring U.S. REIT Portfolio | 3
Portfolio of investments—August 31, 2023 (unaudited)
| | | | | |
Industrial REITs (continued) | | | | | | |
| | | | | | |
Plymouth Industrial REIT, Inc. | | | | | | |
| | | | | | |
Rexford Industrial Realty, Inc. | | | | | | |
| | | | | | |
| | | | | | |
| | | | | | |
| | | | | | |
Alexandria Real Estate Equities, Inc. | | | | | | |
| | | | | | |
| | | | | | |
| | | | | | |
Corporate Office Properties Trust | | | | | | |
| | | | | | |
| | | | | | |
Easterly Government Properties, Inc. | | | | | | |
| | | | | | |
Franklin Street Properties Corp. Class C | | | | | | |
Highwoods Properties, Inc. | | | | | | |
Hudson Pacific Properties, Inc. | | | | | | |
| | | | | | |
| | | | | | |
Office Properties Income Trust | | | | | | |
| | | | | | |
| | | | | | |
Piedmont Office Realty Trust, Inc. Class A | | | | | | |
| | | | | | |
| | | | | | |
| | | | | | |
Residential REITs : 19.44% | | | | | | |
American Homes 4 Rent Class A | | | | | | |
Apartment Income REIT Corp. | | | | | | |
Apartment Investment & Management Co. Class A | | | | | | |
AvalonBay Communities, Inc. | | | | | | |
| | | | | | |
| | | | | | |
| | | | | | |
Equity LifeStyle Properties, Inc. | | | | | | |
| | | | | | |
Essex Property Trust, Inc. | | | | | | |
Independence Realty Trust, Inc. | | | | | | |
| | | | | | |
Mid-America Apartment Communities, Inc. | | | | | | |
NexPoint Residential Trust, Inc. | | | | | | |
| | | | | | |
| | | | | | |
The accompanying notes are an integral part of these financial statements.
4 | Allspring U.S. REIT Portfolio
Portfolio of investments—August 31, 2023 (unaudited)
| | | | | |
Residential REITs (continued) | | | | | | |
| | | | | | |
| | | | | | |
| | | | | | |
| | | | | | |
| | | | | | |
| | | | | | |
Brixmor Property Group, Inc. | | | | | | |
Federal Realty Investment Trust | | | | | | |
| | | | | | |
| | | | | | |
| | | | | | |
| | | | | | |
Necessity Retail REIT, Inc. | | | | | | |
| | | | | | |
| | | | | | |
| | | | | | |
| | | | | | |
Retail Opportunity Investments Corp. | | | | | | |
| | | | | | |
Simon Property Group, Inc. | | | | | | |
| | | | | | |
Spirit Realty Capital, Inc. | | | | | | |
Tanger Factory Outlet Centers, Inc. | | | | | | |
| | | | | | |
| | | | | | |
Specialized REITs : 21.86% | | | | | | |
| | | | | | |
Digital Realty Trust, Inc. | | | | | | |
| | | | | | |
| | | | | | |
Extra Space Storage, Inc. | | | | | | |
Four Corners Property Trust, Inc. | | | | | | |
National Storage Affiliates Trust | | | | | | |
| | | | | | |
| | | | | | |
Total common stocks (Cost $15,486,764) | | | | | | |
The accompanying notes are an integral part of these financial statements.
Allspring U.S. REIT Portfolio | 5
Portfolio of investments—August 31, 2023 (unaudited)
| | | | | |
Short-term investments: 0.86% | | | | | | |
Investment companies: 0.86% | | | | | | |
Allspring Government Money Market Fund Select Class♠∞ | | | | | | |
Total short-term investments (Cost $146,638) | | | | | | |
Total investments in securities (Cost $15,633,402) | | | | | | |
Other assets and liabilities, net | | | | | | |
| | | | | | |
| Non-income-earning security |
| The issuer of the security is an affiliated person of the Portfolio as defined in the Investment Company Act of 1940. |
| The rate represents the 7-day annualized yield at period end. |
|
| Real estate investment trust |
Investments in affiliates
An affiliated investment is an investment in which the Portfolio owns at least 5% of the outstanding voting shares of the issuer or as a result of other relationships, such as the Portfolio and the issuer having the same adviser or investment manager. Transactions with issuers that were affiliates of the Portfolio at the end of the period were as follows:
| | | | | Net
change in
unrealized
gains
(losses) | | | Income
from
affiliated
securities |
| | | | | | | | |
Allspring Government Money Market Fund Select Class | | | | | | | | |
The accompanying notes are an integral part of these financial statements.
6 | Allspring U.S. REIT Portfolio
Statement of assets and liabilities—August 31, 2023 (unaudited)
Financial statements
Statement of assets and liabilities
| |
Investments in unaffiliated securities, at value (cost $15,486,764) | |
Investments in affiliated securities, at value (cost $146,638) | |
| |
| |
| |
Prepaid expenses and other assets | |
| |
| |
Custody and accounting fees payable | |
Professional fees payable | |
Interest holder report expenses payable | |
| |
| |
The accompanying notes are an integral part of these financial statements.
Allspring U.S. REIT Portfolio | 7
Statement of operations—six months ended August 31, 2023 (unaudited)
Statement of operations
| |
| |
Income from affiliated securities | |
| |
| |
| |
| |
Custody and accounting fees | |
| |
Interest holder report expenses | |
Trustees’ fees and expenses | |
| |
| |
Less: Fee waivers and/or expense reimbursements | |
| |
| |
Realized and unrealized gains (losses) on investments | |
Net realized losses on investments | |
Net change in unrealized gains (losses) on investments | |
Net realized and unrealized gains (losses) on investments | |
Net increase in net assets resulting from operations | |
The accompanying notes are an integral part of these financial statements.
8 | Allspring U.S. REIT Portfolio
Statement of changes in net assets
Statement of changes in net assets
|
Six months ended
August 31, 2023 (unaudited) | Year ended February 28, 2023 |
| | | | |
| | | | |
Net realized gains (losses) on investments | | | | |
Net change in unrealized gains (losses) on investments | | | | |
Net increase (decrease) in net assets resulting from operations | | | | |
| | | | |
Transactions in investors’ beneficial interests | | | | |
| | | | |
| | | | |
Net decrease in net assets resulting from capital transactions | | | | |
Total decrease in net assets | | | | |
| | | | |
| | | | |
| | | | |
The accompanying notes are an integral part of these financial statements.
Allspring U.S. REIT Portfolio | 9
| Six months ended
August 31, 2023
(unaudited) | |
| | | | | |
| | | | | | |
Ratios to average net assets (annualized) | | | | | | |
| | | | | | |
| | | | | | |
| | | | | | |
| | | | | | |
| | | | | | |
| Ratio includes expenses which were voluntarily waived by the adviser. Without these voluntary waivers, the net expense ratios would be increased by the following amounts: |
Six months ended August 31, 2023 (unaudited) | |
Year ended February 28, 2023 | |
Year ended February 28, 2022 | |
Year ended February 28, 2021 | |
| |
| Returns for periods of less than one year are not annualized. |
The accompanying notes are an integral part of these financial statements.
10 | Allspring U.S. REIT Portfolio
Notes to financial statements (unaudited)
Notes to financial statements
Allspring Master Trust (the “Trust”), a Delaware statutory trust organized on March 10, 1999, is an open-end management investment company registered under the Investment Company Act of 1940, as amended (the “1940 Act”). As an investment company, the Trust follows the accounting and reporting guidance in Financial Accounting Standards Board (“FASB”) Accounting Standards Codification Topic 946, Financial Services – Investment Companies. These financial statements report on the Allspring U.S. REIT Portfolio (the “Portfolio”) which is a non-diversified series of the Trust.
Interests in the Portfolio are available solely through private placement transactions that do not involve any “public offering” within the meaning of Section 4(a)(2) of the Securities Act of 1933.
2.
SIGNIFICANT ACCOUNTING POLICIES
The following significant accounting policies, which are consistently followed in the preparation of the financial statements of the Portfolio, are in conformity with U.S. generally accepted accounting principles which require management to make estimates and assumptions that affect the reported amounts of assets and liabilities, disclosure of contingent assets and liabilities at the date of the financial statements, and the reported amounts of income and expenses during the reporting period. Actual results could differ from those estimates.
Securities valuation
All investments are valued each business day as of the close of regular trading on the New York Stock Exchange (generally 4 p.m. Eastern Time), although the Portfolio may deviate from this calculation time under unusual or unexpected circumstances.
Equity securities that are listed on a foreign or domestic exchange or market are valued at the official closing price or, if none, the last sales price.
Investments in registered open-end investment companies (other than those listed on a foreign or domestic exchange or market) are valued at net asset value.
Investments which are not valued using the methods discussed above are valued at their fair value, as determined in good faith by Allspring Funds Management, LLC (“Allspring Funds Management”), which was named the valuation designee by the Board of Trustees. As the valuation designee, Allspring Funds Management is responsible for day-to-day valuation activities for the Allspring Funds. In connection with these responsibilities, Allspring Funds Management has established a Valuation Committee and has delegated to it the authority to take any actions regarding the valuation of portfolio securities that the Valuation Committee deems necessary or appropriate, including determining the fair value of portfolio securities. On a quarterly basis, the Board of Trustees receives reports of valuation actions taken by the Valuation Committee. On at least an annual basis, the Board of Trustees receives an assessment of the adequacy and effectiveness of Allspring Funds Management’s process for determining the fair value of the portfolio of investments.
Security transactions and income recognition
Securities transactions are recorded on a trade date basis. Realized gains or losses are recorded on the basis of identified cost.
Dividend income is recognized on the ex-dividend date.
Distributions received from REIT investments may be characterized as ordinary income, capital gains, or a return of capital to the Portfolio based on information provided by the REIT. The proper characterization of REIT distributions is generally not known until after the end of each calendar year. As such, estimates may be used in reporting the character of income and distributions for financial statement purposes.
Federal and other taxes
The Portfolio is not required to pay federal income taxes on its net investment income and net capital gains as it is treated as a partnership for federal income tax purposes. All income, gains and losses of the Portfolio are deemed to have been “passed through” to the interest holders in proportion to their holdings of the Portfolio regardless of whether income and gains have been distributed by the Portfolio.
The Portfolio’s income tax returns and all financial records supporting those returns for the prior three fiscal years are subject to examination by the federal revenue authority. Management has analyzed the Portfolio’s tax positions taken on federal, state, and foreign tax returns, as applicable, for all open tax years and does not believe that there are any uncertain tax positions that require recognition of a tax liability.
As of August 31, 2023, the aggregate cost of all investments for federal income tax purposes was $15,568,242 and the unrealized gains (losses) consisted of:
Allspring U.S. REIT Portfolio | 11
Notes to financial statements (unaudited)
3.
FAIR VALUATION MEASUREMENTS
Fair value measurements of investments are determined within a framework that has established a fair value hierarchy based upon the various data inputs utilized in determining the value of the Portfolio’s investments. The three-level hierarchy gives the highest priority to unadjusted quoted prices in active markets for identical assets or liabilities (Level 1) and the lowest priority to unobservable inputs (Level 3). The Portfolio’s investments are classified within the fair value hierarchy based on the lowest level of input that is significant to the fair value measurement. The inputs are summarized into three broad levels as follows:
•Level 1—quoted prices in active markets for identical securities
•Level 2—other significant observable inputs (including quoted prices for similar securities, interest rates, prepayment speeds, credit risk, etc.)
•Level 3—significant unobservable inputs (including the Portfolio’s own assumptions in determining the fair value of investments)
The inputs or methodologies used for valuing investments in securities are not necessarily an indication of the risk associated with investing in those securities.
The following is a summary of the inputs used in valuing the Portfolio’s assets and liabilities as of August 31, 2023:
| | Other significant
observable inputs
(Level 2) | Significant
unobservable inputs
(Level 3) | |
| | | | |
| | | | |
| | | | |
| | | | |
| | | | |
| | | | |
| | | | |
Additional sector, industry or geographic detail, if any, is included in the Portfolio of Investments.
For the six months ended August 31, 2023, the Portfolio did not have transfers into/out of Level 3.
4.
TRANSACTIONS WITH AFFILIATES
Advisory fee
The Trust has entered into an advisory contract with Allspring Funds Management, a wholly owned subsidiary of Allspring Global Investments Holdings, LLC, a holding company indirectly owned by certain private funds of GTCR LLC and Reverence Capital Partners, L.P. The adviser is responsible for implementing investment policies and guidelines and for supervising the subadviser, who is responsible for day-to-day portfolio management of the Portfolio. Pursuant to the contract, Allspring Funds Management is entitled to receive an advisory fee at the following annual rate based on the Portfolio’s average daily net assets:
For the six months ended August 31, 2023, the advisory fee was equivalent to an annual rate of 0.10% of the Portfolio’s average daily net assets.
Allspring Funds Management has retained the services of a subadviser to provide daily portfolio management to the Portfolio. The fee for subadvisory services is borne by Allspring Funds Management. Allspring Global Investments, LLC, an affiliate of Allspring Funds Management and a wholly owned subsidiary of Allspring Global Investments Holdings, LLC, is the subadviser to the Portfolio and is entitled to receive a fee from Allspring Funds Management at an annual rate starting at 0.06% and declining to 0.04% as the average daily net assets of the Portfolio increase.
Allspring Funds Management has voluntarily waived and/or reimbursed expenses to reduce the net operating expense ratio of the Portfolio. These voluntary waivers may be discontinued at any time.
Interfund transactions
The Portfolio may purchase or sell portfolio investment securities to certain affiliates pursuant to Rule 17a-7 under the 1940 Act and under procedures adopted by the Board of Trustees. The procedures have been designed to ensure that these interfund transactions, which do not incur broker commissions, are effected at current market prices. Pursuant to these procedures, the Portfolio did not have any interfund transactions during the six months ended August 31, 2023.
12 | Allspring U.S. REIT Portfolio
Notes to financial statements (unaudited)
5.
INVESTMENT PORTFOLIO TRANSACTIONS
Purchases and sales of investments, excluding U.S. government obligations (if any) and short-term securities, for the six months ended August 31, 2023 were $1,694,452 and $1,396,614, respectively.
The Trust, along with Allspring Variable Trust and Allspring Funds Trust (excluding the money market funds), are parties to a $350,000,000 revolving credit agreement whereby the Portfolio is permitted to use bank borrowings for temporary or emergency purposes, such as to fund interest holders withdrawal requests. Interest under the credit agreement is charged to the Portfolio based on a borrowing rate equal to the higher of the Federal Funds rate or the overnight bank funding rate in effect on that day plus a spread. In addition, an annual commitment fee based on the unused balance is allocated to each participating fund.
For the six months ended August 31, 2023, there were no borrowings by the Portfolio under the agreement.
As of the end of the period, the Portfolio concentrated its portfolio of investments in real estate sector. A fund that invests a substantial portion of its assets in any sector may be more affected by changes in that sector than would be a fund whose investments are not heavily weighted in any sector.
Under the Portfolio’s organizational documents, the officers and Trustees have been granted certain indemnification rights against certain liabilities that may arise out of performance of their duties to the Portfolio. The Portfolio has entered into a separate agreement with each Trustee that converts indemnification rights currently existing under the Portfolio’s organizational documents into contractual rights that cannot be changed in the future without the consent of the Trustee. Additionally, in the normal course of business, the Portfolio may enter into contracts with service providers that contain a variety of indemnification clauses. The Portfolio’s maximum exposure under these arrangements is dependent on future claims that may be made against the Portfolio and, therefore, cannot be estimated.
Allspring U.S. REIT Portfolio | 13
Other information (unaudited)
Other information
Proxy voting information
A description of the policies and procedures used to determine how to vote proxies relating to portfolio securities is available without charge, upon request, by calling 1-866-259-3305, visiting our website at allspringglobal.com, or visiting the SEC website at sec.gov. Information regarding how the proxies related to portfolio securities were voted during the most recent 12-month period ended June 30 is available on the website at allspringglobal.com or by visiting the SEC website at sec.gov.
Quarterly portfolio holdings information
The Portfolio files its complete schedule of portfolio holdings with the SEC for the first and third quarters of each fiscal year as an exhibit to its reports on Form N-PORT. Interest holders may view the filed Form N-PORT by visiting the SEC website at sec.gov.
14 | Allspring U.S. REIT Portfolio
Other information (unaudited)
Board of trustees and officers
Each of the Trustees and Officers listed in the table below acts in identical capacities for each fund in the Allspring family of funds, which consists of 126 mutual funds comprising the Allspring Funds Trust, Allspring Variable Trust, Allspring Master Trust and four closed-end funds (collectively the “Fund Complex”). This table should be read in conjunction with the Prospectus and the Statement of Additional Information1. The mailing address of each Trustee and Officer is 1415 Vantage Park Drive, 3rd Floor, Charlotte, NC 28203. Each Trustee and Officer serves an indefinite term, however, each Trustee serves such term until reaching the mandatory retirement age established by the Trustees.
Independent Trustees
| | Principal occupations during past five years or longer | Current other
public company or
investment
company
directorships |
William R. Ebsworth
(Born 1957) | | Retired. From 1984 to 2013, equities analyst, portfolio manager, research director and chief investment officer at Fidelity Management and Research Company in Boston, Tokyo, and Hong Kong, and retired in 2013 as Chief Investment Officer of Fidelity Strategic Advisers, Inc. where he led a team of investment professionals managing client assets. Prior thereto, Board member of Hong Kong Securities Clearing Co., Hong Kong Options Clearing Corp., the Thailand International Fund, Ltd., Fidelity Investments Life Insurance Company, and Empire Fidelity Investments Life Insurance Company. Audit Committee Chair and Investment Committee Chair of the Vincent Memorial Hospital Foundation (non-profit organization). Mr. Ebsworth is a CFA charterholder. | |
Jane A. Freeman
(Born 1953) | Trustee,
since 2015;
Chair Liaison,
since 2018 | Retired. From 2012 to 2014 and 1999 to 2008, Chief Financial Officer of Scientific Learning Corporation. From 2008 to 2012, Ms. Freeman provided consulting services related to strategic business projects. Prior to 1999, Portfolio Manager at Rockefeller & Co. and Scudder, Stevens & Clark. Board member of the Harding Loevner Funds from 1996 to 2014, serving as both Lead Independent Director and chair of the Audit Committee. Board member of the Russell Exchange Traded Funds Trust from 2011 to 2012 and the chair of the Audit Committee. Ms. Freeman is also an inactive Chartered Financial Analyst. | |
Isaiah Harris, Jr.
(Born 1952) | Trustee,
since 2009;
Audit Committee Chair,
since 2019 | Retired. Member of the Advisory Board of CEF of East Central Florida. Chairman of the Board of CIGNA Corporation from 2009 to 2021, and Director from 2005 to 2008. From 2003 to 2011, Director of Deluxe Corporation. Prior thereto, President and CEO of BellSouth Advertising and Publishing Corp. from 2005 to 2007, President and CEO of BellSouth Enterprises from 2004 to 2005 and President of BellSouth Consumer Services from 2000 to 2003. Emeritus member of the Iowa State University Foundation Board of Governors. Emeritus Member of the Advisory board of Iowa State University School of Business. Advisory Board Member, Palm Harbor Academy (private school). Advisory Board Member, Fellowship of Christian Athletes. Mr. Harris is a certified public accountant (inactive status). | |
David F. Larcker
(Born 1950) | | Distinguished Visiting Fellow at the Hoover Institution since 2022. James Irvin Miller Professor of Accounting at the Graduate School of Business (Emeritus), Stanford University, Director of the Corporate Governance Research Initiative and Senior Faculty of The Rock Center for Corporate Governance since 2006. From 2005 to 2008, Professor of Accounting at the Graduate School of Business, Stanford University. Prior thereto, Ernst & Young Professor of Accounting at The Wharton School, University of Pennsylvania from 1985 to 2005. | |
Olivia S. Mitchell
(Born 1953) | Trustee,
since 2006;
Nominating and Governance Committee Chair,
since 2018 | International Foundation of Employee Benefit Plans Professor since 1993, Wharton School of the University of Pennsylvania. Director of Wharton’s Pension Research Council and Boettner Center on Pensions & Retirement Research, and Research Associate at the National Bureau of Economic Research. Previously taught at Cornell University from 1978 to 1993. | |
Timothy J. Penny
(Born 1951) | Trustee,
since 1996;
Chair,
since 2018 | President and Chief Executive Officer of Southern Minnesota Initiative Foundation, a non-profit organization, since 2007. Vice Chair of the Economic Club of Minnesota, since 2007. Co-Chair of the Committee for a Responsible Federal Budget, since 1995. Member of the Board of Trustees of NorthStar Education Finance, Inc., a non-profit organization, from 2007-2022. Senior Fellow of the University of Minnesota Humphrey Institute from 1995 to 2017. | |
1
The Statement of Additional Information includes additional information about the Trustees and is available, without charge, upon request, by calling 1-800-222-8222 or by visiting the website at allspringglobal.com.
Allspring U.S. REIT Portfolio | 15
Other information (unaudited)
| Position held and length of service* | Principal occupations during past five years or longer | Current other public company or investment company directorships |
James G. Polisson
(Born 1959) | | Retired. Chief Marketing Officer, Source (ETF) UK Services, Ltd, from 2015 to 2017. From 2012 to 2015, Principal of The Polisson Group, LLC, a management consulting, corporate advisory and principal investing company. Chief Executive Officer and Managing Director at Russell Investments, Global Exchange Traded Funds from 2010 to 2012. Managing Director of Barclays Global Investors from 1998 to 2010 and Global Chief Marketing Officer for iShares and Barclays Global Investors from 2000 to 2010. Trustee of the San Francisco Mechanics’ Institute, a non- profit organization, from 2013 to 2015. Board member of the Russell Exchange Traded Fund Trust from 2011 to 2012. Director of Barclays Global Investors Holdings Deutschland GmbH from 2006 to 2009. Mr. Polisson is an attorney and has a retired status with the Massachusetts and District of Columbia Bar Associations. | |
Pamela Wheelock
(Born 1959) | Trustee,
since January 2020;
previously Trustee from
January 2018 to
July 2019 | Retired. Executive and Senior Financial leadership positions in the public, private and nonprofit sectors. Interim President and CEO, McKnight Foundation, 2020. Interim Commissioner, Minnesota Department of Human Services, 2019. Chief Operating Officer, Twin Cities Habitat for Humanity, 2017-2019. Vice President for University Services, University of Minnesota, 2012- 2016. Interim President and CEO, Blue Cross and Blue Shield of Minnesota, 2011-2012. Executive Vice-President and Chief Financial Officer, Minnesota Wild, 2002-2008. Commissioner, Minnesota Department of Finance, 1999-2002. Chair of the Board of Directors of Destination Medical Center Corporation. Board member of the Minnesota Wild Foundation. | |
| Length of service dates reflect the Trustee’s commencement of service with the Trust’s predecessor entities, where applicable. |
16 | Allspring U.S. REIT Portfolio
Other information (unaudited)
Officers1
| Position held and
length of service | Principal occupations during past five years or longer |
| | President and Chief Executive Officer of Allspring Funds Management, LLC since 2017 and Head of Global Fund Governance of Allspring Global Investments since 2022. Prior thereto, co-president of Galliard Capital Management, LLC, an affiliate of Allspring Funds Management, LLC, from 2019 to 2022 and Head of Affiliated Managers, Allspring Global Investments, from 2014 to 2019 and Executive Vice President responsible for marketing, investments and product development for Allspring Funds Management, LLC, from 2009 to 2014. |
Jeremy DePalma
(Born 1974) | Treasurer,
since 2012
(for certain funds in
the Fund Complex);
since 2021 (for
the remaining funds in the Complex) | Senior Vice President of Allspring Funds Management, LLC since 2009. Senior Vice President of Evergreen Investment Management Company, LLC from 2008 to 2010 and head of the Fund Reporting and Control Team within Fund Administration from 2005 to 2010. |
Christopher Baker
(Born 1976) | Chief Compliance Officer,
since 2022 | Global Chief Compliance Officer for Allspring Global Investments since 2022. Prior thereto, Chief Compliance Officer for State Street Global Advisors from 2018 to 2021. Senior Compliance Officer for the State Street divisions of Alternative Investment Solutions, Sector Solutions, and Global Marketing from 2015 to 2018. From 2010 to 2015 Vice President, Global Head of Investment and Marketing Compliance for State Street Global Advisors. |
Matthew Prasse
(Born 1983) | Chief Legal Officer,
since 2022;
Secretary,
since 2021 | Senior Counsel of the Allspring Legal Department since 2021. Senior Counsel of the Wells Fargo Legal Department from 2018 to 2021. Previously, Counsel for Barings LLC from 2015 to 2018. Prior to joining Barings, Associate at Morgan, Lewis & Bockius LLP from 2008 to 2015. |
1 For those Officers with tenures at Allspring Global Investments and/or Allspring Funds Management, LLC that began prior to 2021, such tenures include years of service during which these businesses/entities were known as Wells Fargo Asset Management and Wells Fargo Funds Management, LLC, respectively.
Allspring U.S. REIT Portfolio | 17
Other information (unaudited)
Board consideration of investment advisory and sub-advisory agreements:
Allspring Bloomberg US Aggregate ex-Corporate Portfolio, Allspring Emerging Markets Bond Portfolio, Allspring Factor Enhanced Emerging Markets Equity Portfolio, Allspring Factor Enhanced International Equity Portfolio, Allspring Factor Enhanced U.S. Large Cap Equity Portfolio, Allspring Factor Enhanced U.S. Small Cap Equity Portfolio, Allspring High Yield Corporate Bond Portfolio, Allspring Investment Grade Corporate Bond Portfolio, Allspring Strategic Retirement Bond Portfolio, and Allspring U.S. REIT Portfolio
Under the Investment Company Act of 1940 (the “1940 Act”), the Board of Trustees (the “Board”) of Allspring Master Trust (the “Trust”) must determine annually whether to approve the continuation of the Trust’s investment advisory and sub-advisory agreements. In this regard, at a meeting held on May 15-17, 2023 (the “Meeting”), the Board, all the members of which have no direct or indirect interest in the investment advisory and sub-advisory agreements and are not “interested persons” of the Trust, as defined in the 1940 Act (the “Independent Trustees”), reviewed and approved for each of the portfolios of the Trust identified in the table below (individually, a “Portfolio” and collectively, the “Portfolios”): (i) an investment advisory agreement (the “Advisory Agreement”) with Allspring Funds Management, LLC (“Allspring Funds Management”); and (ii) an investment sub-advisory agreement (each, a “Sub-Advisory Agreement” and collectively, the “Sub-Advisory Agreements”) with the Sub-Advisers(s) identified in the table below (each, a “Sub-Adviser” and collectively, the “Sub-Advisers”) for the corresponding Portfolio identified. The Advisory Agreement and the Sub-Advisory Agreements are collectively referred to as the “Advisory Agreements.”
| |
Allspring Bloomberg Barclays US Aggregate ex-Corporate Portfolio | Allspring Global Investments, LLC |
Allspring Emerging Markets Bond Portfolio | Allspring Global Investments, LLC, Allspring Global Investments (UK) Limited |
Allspring Factor Enhanced Emerging Markets Equity Portfolio | Allspring Global Investments, LLC |
Allspring Factor Enhanced International Equity Portfolio | Allspring Global Investments, LLC |
Allspring Factor Enhanced U.S. Large Cap Equity Portfolio | Allspring Global Investments, LLC |
Allspring Factor Enhanced U.S. Small Cap Equity Portfolio | Allspring Global Investments, LLC |
Allspring High Yield Corporate Bond Portfolio | Allspring Global Investments, LLC |
Allspring Investment Grade Corporate Bond Portfolio | Allspring Global Investments, LLC |
Allspring Strategic Retirement Bond Portfolio | Allspring Global Investments, LLC |
Allspring U.S. REIT Portfolio | Allspring Global Investments, LLC |
At the Meeting, the Board considered the factors and reached the conclusions described below relating to the selection of Allspring Funds Management and the Sub-Advisers and the approval of the Advisory Agreements. Prior to the Meeting, including at a Board meeting held in April 2023, the Trustees conferred extensively among themselves and with representatives of Allspring Funds Management about these matters. The Board has adopted a team-based approach, with each team consisting of a sub-set of Trustees, to assist the full Board in the discharge of its duties in reviewing investment performance and other matters throughout the year. The Independent Trustees were assisted in their evaluation of the Advisory Agreements by independent legal counsel, from whom they received separate legal advice and with whom they met separately.
The Board noted that it initially approved the Advisory Agreements at a Board meeting held in May 2021, each for a two-year term, in advance of the sale of Wells Fargo Asset Management to Allspring Global Investments Holdings, LLC,1 a holding company indirectly owned by certain private funds of GTCR LLC and Reverence Capital Partners, L.P. (the “Transaction”). The Trustees also noted that, while they did not specifically consider the continuation of the Advisory Agreements in 2022 as a result of the two-year term that was approved in 2021, the Trustees received and considered certain information at a Board meeting held in April 2022 that was applicable to the Advisory Agreements, including an overview and financial review of the Allspring Global Investments business, information regarding certain ancillary agreements that were approved by the Board at the April 2022 Board meeting, and comparative data regarding Fund fees and expenses.
In providing information to the Board, Allspring Funds Management and the Sub-Advisers were guided by a detailed set of requests for information submitted to them by independent legal counsel on behalf of the Independent Trustees at the start of the Board’s annual contract renewal process earlier in 2023. In considering and approving the Advisory Agreements, the Trustees considered the information they believed relevant, including but not limited to the information discussed below. The Board considered not only the specific information presented in connection with the Meeting, but also the knowledge gained over time through interaction with Allspring Funds Management and the Sub-Advisers about various topics. In this regard, the Board reviewed reports of Allspring Funds Management at each of its quarterly meetings, which included, among other things, portfolio reviews and investment performance reports. In addition, the Board and the teams mentioned above confer with portfolio managers at various times throughout the year. The Board did not identify any particular information or consideration that was all-important or controlling, and each individual Trustee may have attributed different weights to various factors.
1
The trade name for the asset management firm that includes Allspring Funds Management and the Sub-Adviser is “Allspring Global Investments.”
18 | Allspring U.S. REIT Portfolio
Other information (unaudited)
After its deliberations, the Board unanimously determined that the compensation or the absence of compensation payable to Allspring Funds Management and each of the Sub-Advisers under each of the Advisory Agreements was reasonable, and approved the continuation of the Advisory Agreements for a one-year term. The Board considered the approval of the Advisory Agreements for the Portfolios as part of its consideration of agreements for funds across the complex, but its approvals were made on a fund-by-fund basis. The following summarizes a number of important, but not necessarily all, factors considered by the Board in support of its approvals.
Nature, extent and quality of services
The Board received and considered various information regarding the nature, extent, and quality of services provided to the Portfolios by Allspring Funds Management and the Sub-Advisers under the Advisory Agreements. This information included a description of the investment advisory services and Portfolio-level administrative services covered by the Advisory Agreement, as well as, among other things, a summary of the background and experience of senior management of Allspring Global Investments, of which Allspring Funds Management and the Sub-Advisers are a part, and a summary of investments made in the Allspring Global Investments business. The Board also considered information about retention arrangements with respect to key personnel of Allspring Global Investments that were put in place in connection with the Transaction. The Board took into account information about the services that continue to be provided by Wells Fargo & Co. and/or its affiliates (“Wells Fargo”) since the Transaction under a transition services agreement and the anticipated timeline for exiting the transition services agreement. In addition, the Board received and considered information about the full range of services provided to the Fund by Allspring Funds Management and its affiliates.
The Board considered the qualifications, background, tenure, and responsibilities of each of the portfolio managers primarily responsible for the day-to-day portfolio management of the Portfolios. The Board evaluated the ability of Allspring Funds Management and the Sub-Advisers to attract and retain qualified investment professionals, including research, advisory, and supervisory personnel.
The Board further considered the compliance programs and compliance records of Allspring Funds Management and the Sub-Advisers. The Board received and considered information about Allspring Global Investments’ risk management functions, which included information about Allspring Funds Management’s and the Sub-Advisers’ business continuity plans, their approaches to data privacy and cybersecurity, and Allspring Funds Management’s role as administrator of the Portfolios’ liquidity risk management program, and the derivatives risk management program for Allspring Bloomberg Barclays US Aggregate ex-Corporate Portfolio and Allspring Factor Enhanced U.S. Large Cap Equity Portfolio. The Board also received and considered information about Allspring Funds Management’s intermediary and vendor oversight program.
Portfolio investment performance and expenses
The Board considered the investment performance results for each of the Portfolios over various time periods ended December 31, 2022. The Board considered these results in comparison to the investment performance of funds in a universe that was determined by Broadridge Inc. (“Broadridge”) to be similar to each respective Portfolios (each, a “Universe”), and in comparison to each Portfolios’ benchmark index and to other comparative data. Broadridge is an independent provider of investment company data. The Board received a description of the methodology used by Broadridge to select the mutual funds in the performance Universe. The Board noted the short performance history of the Portfolios.
With respect to the investment performance of each Portfolio relative to its respective Universe, the Board noted the following: (i) the investment performance of Allspring Bloomberg US Aggregate ex-Corporate Portfolio was higher than the average investment performance of the Universe for all periods under review; the investment performance of Allspring Bloomberg US Aggregate ex-Corporate Portfolio was higher than the investment performance of its benchmark index, the Bloomberg U.S. Aggregate ex Corporate Index, for the one-year period and was in range of the investment performance of its benchmark index for the three- and five-year periods under review; (ii) the investment performance of Allspring Emerging Markets Bond Portfolio was lower than the average investment performance of the Universe for the one- and three-year periods and was in range of the average investment performance of the Universe for the five-year period; the investment performance of Allspring Emerging Markets Bond Portfolio was higher than the investment performance of its benchmark index, the J.P. Morgan EM Bond Global Diversified Index, for the one-year period and was in range of the investment performance of its benchmark index for the three- and five-year periods under review; (iii) the investment performance of Allspring Factor Enhanced Emerging Markets Equity Portfolio was higher than the average investment performance of the Universe for the one-year period and was lower than the average investment performance of the Universe for the three- and five-year periods; the investment performance of Allspring Factor Enhanced Emerging Markets Equity Portfolio was higher than the investment performance of its benchmark index, the MSCI Emerging Markets Index (Net), for the one-year period and was lower than the investment performance of its benchmark index for the three- and five-year periods under review; (iv) the investment performance of Allspring Factor Enhanced International Equity Portfolio was higher than the average investment performance of the Universe for all periods under review; the investment performance of Allspring Factor Enhanced International Equity Portfolio was higher than the investment performance of its benchmark index, the MSCI World ex US Index (Net), for all periods under review; (v) the investment performance of Allspring Factor Enhanced U.S. Large Cap Equity Portfolio was higher than the average investment performance of the Universe for the one- and five-year periods and was lower than the average investment performance of the Universe for the three-year period; the investment performance of Allspring Factor Enhanced U.S. Large Cap Equity Portfolio was higher than the investment performance of its benchmark index, the Russell 1000® Index, for the one-year period and was lower than the investment performance of its benchmark index for the three- and five-year periods under review; (vi) the investment performance of Allspring Factor Enhanced U.S. Small Cap Equity Portfolio was lower than the average investment performance of the Universe for all periods under review; the investment performance of Allspring Factor Enhanced U.S. Small Cap Equity Portfolio was higher than the
Allspring U.S. REIT Portfolio | 19
Other information (unaudited)
investment performance of its benchmark index, the Russell 2000® Index, for the one-year period and was lower than the investment performance of its benchmark index for the three- and five-year periods under review; (vii) the investment performance of Allspring High Yield Corporate Bond Portfolio was lower than the average investment performance of the Universe for all periods under review; the investment performance of Allspring High Yield Corporate Bond Portfolio was in range of the investment performance of its benchmark index, the Bloomberg U.S. Corporate High Yield 2% Issuer Capped, for the one-year period and was lower than the investment performance of its benchmark index for the three- and five-year periods under review; (viii) the investment performance of Allspring Investment Grade Corporate Bond Portfolio was higher than the average investment performance of the Universe for the one- and five-year periods and in rage of the average investment performance of the Universe for the three-year period; the investment performance of Allspring Investment Grade Corporate Bond Portfolio was higher than the investment performance of its benchmark index, the Bloomberg U.S. Corporate Bond Index, for the one-year period and was in range of the investment performance of its benchmark index for the three- and five-year periods under review; (ix) the investment performance of Allspring Strategic Retirement Bond Portfolio was higher than the average investment performance of the Universe for all periods under review; the investment performance of Allspring Strategic Retirement Bond Portfolio was higher than the investment performance of its benchmark index, the Strategic Retirement Blended Index, for the one- and three-year periods and was in range of the investment performance of its benchmark index for the five-year period; (x) the investment performance of Allspring U.S. REIT Portfolio was lower than the average investment performance of the Universe for the one-year period and was in range of the average investment performance of the Universe for the three- and five-year periods; the investment performance of Allspring U.S. REIT Portfolio was higher than the investment performance of its benchmark index, the Dow Jones U.S. Select REIT Index, for all periods under review.
The Board received information concerning, and discussed factors contributing to, the underperformance of each of Allspring Emerging Markets Bond Portfolio, Allspring Factor Enhanced Emerging Markets Equity Portfolio, Allspring Factor Enhanced U.S. Large Cap Equity Portfolio, Allspring Factor Enhanced U.S. Small Cap Equity Portfolio and Allspring High Yield Corporate Bond Portfolio relative to such Portfolio’s Universe and benchmark index for the periods identified above. The Board took note of the explanations for the relative underperformance during these periods, including with respect to investment decisions and market factors that affected each Portfolio’s investment performance.
The Board also received and considered information regarding the fee rates that are payable to Allspring Funds Management for investment advisory services (as discussed below), which are the only fees charged to the Portfolios, relative to corresponding class-specific expense groups that were determined by Broadridge to be similar to the Portfolios (the “Groups”). The Board received a description of the methodology used by Broadridge to select the mutual funds in the expense Groups and an explanation of how funds comprising expense groups and their expense ratios may vary from year-to-year.
The Board took into account the Portfolios’ investment performance and expense information provided to it among the factors considered in deciding to re-approve the Advisory Agreements.
Investment advisory and sub-advisory fee rates
The Board reviewed and considered the contractual fee rates payable by the Portfolios to Allspring Funds Management under the Advisory Agreement. The Board also reviewed and considered the contractual investment sub-advisory fee rates that are payable by Allspring Funds Management to the Sub-Advisers for investment sub-advisory services.
Among other information reviewed by the Board was a comparison of the Portfolios’ Advisory Rates with the average contractual investment advisory fee rates of funds in the expense Groups at a common asset level as well as transfer agency costs of the Portfolios in the expense Groups. The Board noted that the Advisory Rates of the Portfolios were lower than or in range of the mean rates for the Portfolios’ expense Groups.
The Board also received and considered information about the portions of the total advisory fees that were retained by Allspring Funds Management after payment of the fees to the Sub-Advisers for sub-advisory services. In assessing the reasonableness of these amounts, the Board received and evaluated information about the nature and extent of responsibilities retained and risks assumed by Allspring Funds Management and not delegated to or assumed by the Sub-Advisers, and about Allspring Funds Management’s on-going oversight services. Given the affiliation between Allspring Funds Management and the Sub-Advisers, the Board ascribed limited relevance to the allocation of fees between them.
For all Portfolios, except Allspring Factor Enhanced U.S. Small Cap Equity Portfolio, Allspring Factor Enhanced International Equity Portfolio, Allspring Factor Enhanced Emerging Markets Equity Portfolio, Allspring U.S. REIT Portfolio, Allspring Investment Grade Corporate Bond Portfolio, and Allspring Strategic Retirement Bond Portfolio, the Board also received and considered information about the nature and extent of services offered and fee rates charged by Allspring Funds Management and the Sub-Advisers to other types of clients with investment strategies similar to those of certain Portfolios. In this regard, the Board received information about the significantly greater scope of services, and compliance, reporting and other legal burdens and risks of managing proprietary mutual funds compared with those associated with managing assets of other types of clients, including third-party sub-advised fund clients and non-mutual fund clients such as institutional separate accounts.
Based on its consideration of the factors and information it deemed relevant, including those described here, the Board determined that the compensation payable to Allspring Funds Management under the Advisory Agreement and to the Sub-Advisers under the Sub-Advisory Agreements was reasonable.
20 | Allspring U.S. REIT Portfolio
Other information (unaudited)
Profitability
The Board received and considered information concerning the profitability of Allspring Funds Management, as well as the profitability of Allspring Global Investments, from providing services to the fund complex as a whole. The Board noted that the Sub-Adviser’s profitability information with respect to providing services to the Portfolios and other funds in the complex was subsumed in the Allspring Global Investments profitability analysis.
Allspring Funds Management reported on the methodologies and estimates used in calculating profitability, including a description of the methodology used to allocate certain expenses and differences in how Allspring Global Investments calculates its pre-tax profit metric versus the methodology used when Allspring Funds Management was part of Wells Fargo. It was noted that the impact of such differences had only minor impact on the financial results presented. Among other things, the Board noted that the levels of profitability reported on a fund-by-fund basis varied widely, depending on factors such as the size, type, and age of fund.
Based on its review, the Board did not deem the profits reported by Allspring Funds Management or Allspring Global Investments from services provided to the Portfolios to be at a level that would prevent it from approving the continuation of the Advisory Agreements.
Economies of scale
The Board received and considered information about the potential for Allspring Funds Management to experience economies of scale in the provision of management services to the Portfolios, the difficulties of calculating economies of scale at an individual fund level, and the extent to which potential scale benefits are shared with Portfolio shareholders. The Board noted the existence of breakpoints in the Portfolios’ advisory fee structure, which operate generally to reduce the Portfolios’ expense ratios as the Portfolios grow in size, and the size of the Portfolios in relation to such breakpoints. The Board considered that in addition to advisory fee breakpoints, Allspring Funds Management shares potential economies of scale from its management business in a variety of ways, including through fee waiver and expense reimbursement arrangements, competitive advisory fee rates set at the outset without regard to breakpoints, and investments in the business intended to enhance services available to shareholders.
The Board concluded that Allspring Funds Management’s arrangements with respect to the Portfolios, including contractual breakpoints, constituted a reasonable approach to sharing potential economies of scale with the Portfolios and their shareholders.
Other benefits to Allspring Funds Management and the Sub-Advisers
The Board received and considered information regarding potential “fall-out” or ancillary benefits received by Allspring Funds Management and its affiliates, including the Sub-Advisers, as a result of their relationships with the Portfolios. Ancillary benefits could include, among others, benefits directly attributable to other relationships with the Portfolios and benefits potentially derived from an increase in Allspring Funds Management’s and the Sub-Advisers’ businesses as a result of their relationships with the Portfolios. The Board noted that Allspring Funds Distributor, LLC, an affiliate of Allspring Funds Management, receives distribution-related fees in respect of shares sold or held through it.
The Board also reviewed information about soft dollar credits earned and utilized by the Sub-Advisers and fees earned in the past by Allspring Funds Management and the Sub-Advisers from managing a private investment vehicle for the fund complex’s securities lending collateral.
Based on its consideration of the factors and information it deemed relevant, including those described here, the Board did not find that any ancillary benefits received by Allspring Funds Management and its affiliates, including the Sub-Advisers, were unreasonable.
Conclusion
At the Meeting, after considering the above-described factors and based on its deliberations and its evaluation of the information described above, the Board unanimously determined that the compensation payable to Allspring Funds Management and the Sub-Advisers under each of the Advisory Agreements was reasonable, and approved the continuation of the Advisory Agreements for a one-year term.
Allspring U.S. REIT Portfolio | 21
Other information (unaudited)
Liquidity risk management program
In accordance with Rule 22e-4 under the Investment Company Act of 1940, as amended (the “Liquidity Rule”), Allspring Master Trust (the “Trust”) has adopted and implemented a liquidity risk management program (the “Program”) on behalf of each of its series, including the Portfolio, which is reasonably designed to assess and manage the Portfolio’s liquidity risk. “Liquidity risk” is defined under the Liquidity Rule as the risk that the Portfolio is unable to meet redemption requests without significantly diluting remaining investors’ interests in the Portfolio. The Trust’s Board of Trustees (the “Board”) previously approved the designation of Allspring Funds Management, LLC (“Allspring Funds Management”), the Portfolio’s investment adviser, to administer the Program, and Allspring Funds Management has established a Liquidity Risk Management Council (the “Council”) composed of personnel from multiple departments within Allspring Funds Management and its affiliates to assist Allspring Funds Management in the administration of the Program.
The Program is comprised of various components designed to support the assessment and/or management of liquidity risk, including: (1) the periodic assessment (no less frequently than annually) of certain factors that influence the Portfolio’s liquidity risk; (2) the periodic classification (no less frequently than monthly) of the Portfolio’s investments into one of four liquidity categories that reflect an estimate of their liquidity under current market conditions; (3) a 15% limit on the acquisition of “illiquid investments” (as defined under the Liquidity Rule); (4) to the extent the Portfolio does not invest primarily in “highly liquid investments” (as defined under the Liquidity Rule), the determination of a minimum percentage of the Portfolio’s assets that generally will be invested in highly liquid investments (an “HLIM”); (5) if the Portfolio has established an HLIM, the periodic review (no less frequently than annually) of the HLIM and the adoption of policies and procedures for responding to a shortfall of the Portfolio’s “highly liquid investments” below its HLIM; and (6) periodic reporting to the Board.
At a meeting of the Board held on May 16-17, 2023, the Board received and reviewed a written report (the “Report”) from Allspring Funds Management that, among other things, addressed the operation of the Program and assessed its adequacy and effectiveness for the period from January 1, 2022 through December 31, 2022 (the “Reporting Period”). The Report noted significant liquidity events impacting the Portfolios related to extended foreign market holidays as well as the difficulty of trading and settlement of most Russia-related securities due to sanctions activity. The Report noted that there were no material changes to the Program during the Reporting Period.
Allspring Funds Management determined in the Report that the Program has been implemented and operates effectively to manage each Portfolio’s, including the Portfolio’s, liquidity risk, and Allspring Funds Management continues to believe that the Program has been and continues to be adequately and effectively implemented to monitor and, as applicable, respond to the Portfolio’s liquidity developments.
There can be no assurance that the Program will achieve its objectives under all circumstances in the future.
22 | Allspring U.S. REIT Portfolio
This page is intentionally left blank.
This page is intentionally left blank.
For more information
More information about Allspring Funds is available free upon request. To obtain literature, please write, visit the Portfolio’s website, or call:
Allspring Funds
P.O. Box 219967
Kansas City, MO 64121-9967
Website: allspringglobal.com
Individual investors: 1-800-222-8222
Retail investment professionals: 1-888-877-9275
Institutional investment professionals: 1-800-260-5969
This report and the financial statements contained herein are submitted for the general information of the interest holders of the Portfolio. If this report is used for promotional purposes, distribution of the report must be accompanied or preceded by a current prospectus. Before investing, please consider the investment objectives, risks, charges, and expenses of the investment. For a current prospectus and, if available, a summary prospectus, containing this information, call 1-800-222-8222 or visit the Portfolio’s website at allspringglobal.com. Read the prospectus carefully before you invest or send money.
Allspring Global InvestmentsTM is the trade name for the asset management firms of Allspring Global Investments Holdings, LLC, a holding company indirectly owned by certain private funds of GTCR LLC and Reverence Capital Partners, L.P. These firms include but are not limited to Allspring Global Investments, LLC, and Allspring Funds Management, LLC. Certain products managed by Allspring entities are distributed by Allspring Funds Distributor, LLC (a broker-dealer and Member FINRA/SIPC).
This material is for general informational and educational purposes only and is NOT intended to provide investment advice or a recommendation of any kind - including a recommendation for any specific investment, strategy, or plan.
© 2023 Allspring Global Investments Holdings, LLC. All rights reserved.
ITEM 2. CODE OF ETHICS
Not applicable.
ITEM 3. AUDIT COMMITTEE FINANCIAL EXPERT
Not applicable.
ITEM 4. PRINCIPAL ACCOUNTANT FEES AND SERVICES
Not applicable.
ITEM 5. AUDIT COMMITTEE OF LISTED REGISTRANTS
Not applicable.
ITEM 6. INVESTMENTS
A Portfolio of Investments for the series of Allspring Master Trust is included as part of the report to shareholders filed under Item 1 of this Form.
ITEM 7. DISCLOSURE OF PROXY VOTING POLICIES AND PROCEDURES FOR CLOSED-END MANAGEMENT INVESTMENT COMPANIES
Not applicable.
ITEM 8. PORTFOLIO MANAGERS OF CLOSED-END MANAGEMENT INVESTMENT COMPANIES
Not applicable.
ITEM 9. PURCHASES OF EQUITY SECURITIES BY CLOSED-END MANAGEMENT INVESTMENT COMPANY AND AFFILIATED PURCHASERS
Not applicable.
ITEM 10. SUBMISSION OF MATTERS TO A VOTE OF SECURITY HOLDERS
There have been no material changes to the procedures by which shareholders may recommend nominees to the registrant’s Board of Trustees that have been implemented since the registrant’s last provided disclosure in response to the requirements of this Item.
ITEM 11. CONTROLS AND PROCEDURES
(a) The President and Treasurer have concluded that the Allspring Master Trust disclosure controls and procedures (as defined in Rule 30a-3(c) under the Investment Company Act of 1940) provide reasonable assurances that material information relating to the registrant is made known to them by the appropriate persons, based on their evaluation of these controls and procedures as of a date within 90 days of the filing of this report.
(b) There were no significant changes in the registrant’s internal controls over financial reporting (as defined in Rule 30a-3(d) under the Investment Company Act of 1940) that occurred during the most recent fiscal half-year of the period covered by this report that materially affected, or is reasonably likely to materially affect, the registrant’s internal control over financial reporting.
ITEM 12. DISCLOSURES OF SECURITIES LENDING ACTIVITES FOR CLOSED-END MANAGEMENT INVESTMENT COMPANIES
Not applicable.
ITEM 13. EXHIBITS
SIGNATURES
Pursuant to the requirements of the Securities Exchange Act of 1934 and the Investment Company Act of 1940, the registrant has duly caused this report to be signed on its behalf by the undersigned, thereunto duly authorized.
| | |
| Allspring Master Trust |
| |
| By: | | /s/ Andrew Owen |
| | Andrew Owen |
| | President |
|
| Date: October 26, 2023 |
Pursuant to the requirements of the Securities Exchange Act of 1934 and the Investment Company Act of 1940, this report has been signed below by the following persons on behalf of the registrant and in the capacities and on the date indicated.
| | |
| Allspring Master Trust |
| |
| By: | | /s/ Andrew Owen |
| | Andrew Owen |
| | President |
|
| Date: October 26, 2023 |
| |
| By: | | /s/ Jeremy DePalma |
| | Jeremy DePalma |
| | Treasurer |
|
| Date: October 26, 2023 |