UNITED STATES
SECURITIES AND EXCHANGE COMMISSION
Washington, D.C. 20549
FORM N-CSRS
CERTIFIED SHAREHOLDER REPORT OF REGISTERED
MANAGEMENT INVESTMENT COMPANIES
Investment Company Act file number: 811-09689
Allspring Master Trust
(Exact name of registrant as specified in charter)
525 Market St., San Francisco, CA 94105
(Address of principal executive offices) (Zip code)
Matthew Prasse
Allspring Funds Management, LLC
525 Market St., San Francisco, CA 94105
(Name and address of agent for service)
Registrant’s telephone number, including area code: 800-222-8222
Date of fiscal year end: May 31
Registrant is making a filing for 12 of its series:
Allspring C&B Large Cap Value Portfolio, Allspring Emerging Growth Portfolio, Allspring Index Portfolio, Allspring Small Company Growth Portfolio, Allspring Small Company Value Portfolio, Allspring Disciplined Large Cap Portfolio, Allspring Diversified Large Cap Growth Portfolio, Allspring Disciplined International Developed Markets Portfolio, Allspring Large Company Value Portfolio, Allspring Core Bond Portfolio, Allspring Real Return Portfolio and Allspring Managed Fixed Income Portfolio.
Date of reporting period: November 30, 2021
| ITEM 1. | REPORT TO STOCKHOLDERS |
Semi-Annual Report
November 30, 2021
The views expressed and any forward-looking statements are as of November 30, 2021, unless otherwise noted, and are those of the Fund's portfolio managers and/or Allspring Global Investments. Discussions of individual securities or the markets generally are not intended as individual recommendations. Future events or results may vary significantly from those expressed in any forward-looking statements. The views expressed are subject to change at any time in response to changing circumstances in the market. Allspring Global Investments disclaims any obligation to publicly update or revise any views expressed or forward-looking statements.
Allspring Core Bond Fund | 1
Letter to shareholders (unaudited)
Andrew Owen
President
Allspring Funds
Dear Shareholder:
We are pleased to offer you this semi-annual report for Allspring Core Bond Fund for the six-month period that ended November 30, 2021. Global stocks yielded mixed results as the global economy continued to emerge from the haze of COVID-19. Tailwinds were provided by global stimulus programs, a rapid vaccination rollout, and recovering consumer and corporate sentiment. The bond market had mostly positive returns during the period.
For the six-month period, U.S. stocks, based on the S&P 500 Index,1 gained 9.38%. International stocks, as measured by the MSCI ACWI ex USA Index (Net),2 returned -5.76%, while the MSCI EM Index (Net) (USD),3 trailed its developed market counterparts with a 10.81% loss. Among bond indexes, the Bloomberg U.S. Aggregate Bond Index,4 returned 1.02%, the Bloomberg Global Aggregate ex-USD Index (unhedged),5 returned -4.64%, the Bloomberg Municipal Bond Index6 returned 0.56%, and the ICE BofA U.S. High Yield Index,7 gained 1.09%.
Vaccination rollout drove the stock markets to new highs.
June witnessed the S&P 500 Index reach a new all-time high. 2021 economic growth and inflation forecasts were revised higher to reflect a strong economic recovery and some supply and demand imbalances. Late June saw a deal reached on a U.S. infrastructure package of approximately $1 trillion for road, bridge, and broadband network upgrades over the next eight years. The U.S. Federal Reserve's (Fed) June meeting yielded no change to policy, but its projections pointed to a possible interest rate rise in 2023. This, combined with a rebound in economic activity and investors searching for yield, led to U.S. Treasury yields being down for the month. Many European and Asian countries saw vaccination momentum increase, while the U.K. dealt with a rise in COVID-19 infections, specifically the Delta variant. Meanwhile, crude oil jumped over 10% in June on the back of the pickup in global economic activity and the Organization of the Petroleum Exporting Countries’ (OPEC) slow pace of supply growth.
“2021 economic growth and inflation forecasts were revised higher to reflect a strong economic recovery and some supply and demand imbalances.”
| 1 | The S&P 500 Index consists of 500 stocks chosen for market size, liquidity, and industry group representation. It is a market-value-weighted index with each stock's weight in the index proportionate to its market value. You cannot invest directly in an index. |
| 2 | The Morgan Stanley Capital International (MSCI) All Country World Index (ACWI) ex USA Index (Net) is a free-float-adjusted market-capitalization-weighted index that is designed to measure the equity market performance of developed and emerging markets, excluding the U.S. Source: MSCI. MSCI makes no express or implied warranties or representations and shall have no liability whatsoever with respect to any MSCI data contained herein. The MSCI data may not be further redistributed or used as a basis for other indexes or any securities or financial products. This report is not approved, reviewed, or produced by MSCI. You cannot invest directly in an index. |
| 3 | The MSCI Emerging Markets (EM) Index (Net) (USD) is a free-float-adjusted market-capitalization-weighted index that is designed to measure equity market performance of emerging markets. You cannot invest directly in an index. |
| 4 | The Bloomberg U.S. Aggregate Bond Index is a broad-based benchmark that measures the investment-grade, U.S.-dollar-denominated, fixed-rate taxable bond market, including Treasuries, government-related and corporate securities, mortgage-backed securities (agency fixed-rate and hybrid adjustable-rate mortgage pass-throughs), asset-backed securities, and commercial mortgage-backed securities. You cannot invest directly in an index. |
| 5 | The Bloomberg Global Aggregate ex-USD Index (unhedged) is an unmanaged index that provides a broad-based measure of the global investment-grade fixed-income markets excluding the U.S.-dollar-denominated debt market. You cannot invest directly in an index. |
| 6 | The Bloomberg Municipal Bond Index is an unmanaged index composed of long-term tax-exempt bonds with a minimum credit rating of Baa. You cannot invest directly in an index. |
| 7 | The ICE BofA U.S. High Yield Index is a market-capitalization-weighted index of domestic and Yankee high-yield bonds. The index tracks the performance of high-yield securities traded in the U.S. bond market. You cannot invest directly in an index. Copyright 2022. ICE Data Indices, LLC. All rights reserved. |
2 | Allspring Core Bond Fund
Letter to shareholders (unaudited)
July began the month seeing vaccinations making progress, as several major developed countries eased restrictions, only to be threatened again by the spread of COVID-19’s Delta variant. Inflation continued to climb, aided by the continued supply bottleneck in the face of high demand. As it pertains to the equity area of the market, U.S. equities led the way in positive return territory, followed by international developed markets. In contrast, emerging markets were well in negative territory for the month, hindered by China’s plans for new regulations on a number of sectors, specifically education and technology. The U.S. 10-Year Treasury bond yield continued to decline, as strong demand swallowed up supply. After hitting a multi-year high earlier in the month, oil prices leveled off following an agreement by OPEC to raise oil production starting in August.
The Delta variant of COVID-19 produced outbreaks globally in August, increasing the potential for increased market volatility and bringing into question the ongoing economic recovery. Domestically, the U.S. economy continued to stay strong in the face of the Delta variant, continued inflationary pressures, and worries over Hurricane Ida. Emerging market equities experienced elevated volatility, largely influenced by China’s regulatory stance. Emerging market equities started the month with poor performance but rebounded to end the month in positive territory. Municipal debt experienced its first monthly performance drop since February of this year, slowing a rally that made it one of the best-performing sectors of the bond market. In the commodity segment of the market, crude oil fell sharply during the month on the back of dampened expectations as a result of the Delta variant but was still a leading asset class performer for the year.
Global markets suffered their broadest retreat in a year during September, with the exception of commodities. Concerns over inflation and the interest rate outlook depressed investor confidence and hurt performance. Emerging markets declined on concerns over the continued supply chain disruptions and worries over higher energy and food prices. Meanwhile, the Fed indicated it would slow the pace of asset purchases in the near future. All eyes domestically were fixed on the raising of the debt ceiling, the 2022 budget plan, and the ongoing debate over the infrastructure package. Contrary to most asset classes, commodities thrived in September, driven by sharply higher energy prices.
October’s key themes continued to be elevated inflation pressures and a supply bottleneck, but strong earnings provided a bright spot in the markets. Earnings releases in the U.S. were generally strong and consumer confidence was high. The Fed reaffirmed its plans to taper quantitative easing to a stop by mid-2022. Meanwhile, elevated inflation figures were still being considered transitory by the Fed. Similar to the U.S., the eurozone and many Asian countries saw positive earnings but were facing inflation pressures caused by supply bottlenecks while also experiencing energy price increases amid natural gas shortages. Globally, government bond yields rose as central banks prepared to lower monetary policy accommodation in the face of rising inflationary pressures. As previously referenced, positive commodity performance was driven by sharply higher energy costs.
November was dominated by rising COVID-19 hospitalizations and concerns regarding the Omicron variant. Most major asset classes, both domestically and internationally, declined in November with two exceptions: U.S. investment-grade bonds and Treasury Inflation-Protected Securities. The United Nations Climate Change Conference (COP26) took place during the month with hopes of agreement among countries to limit global warming. While several initiatives were discussed, the conference ultimately ended without the specifics required to instill confidence that the limiting of global warming would succeed. In the U.S., President Biden signed a long-awaited infrastructure bill to upgrade U.S. roads, bridges, and railways. Meanwhile, the Consumer Price Index1, a measure of domestic inflation conditions, jumped to its highest level in 31 years. While the threat of consistently high inflation led the Fed to discuss a faster pace of tapering, the Omicron strain makes that less likely to occur. Commodities came in negative for the month, largely driven by sharp declines in oil prices (and energy costs in general), as well as precious metals.
“ Municipal debt experienced its first monthly performance drop since February of this year, slowing a rally that made it one of the best-performing sectors of the bond market.”
| 1 | The Consumer Price Index (CPI) is a measure of the average change over time in the prices paid by urban consumers for a market basket of consumer goods and services. You cannot invest directly in an index. |
Allspring Core Bond Fund | 3
Letter to shareholders (unaudited)
Don’t let short-term uncertainty derail long-term investment goals.
Periods of investment uncertainty can present challenges, but experience has taught us that maintaining long-term investment goals can be an effective way to plan for the future. To help you create a sound strategy based on your personal goals and risk tolerance, Allspring Funds offers more than 100 mutual funds spanning a wide range of asset classes and investment styles. Although diversification cannot guarantee an investment profit or prevent losses, we believe it can be an effective way to manage investment risk and potentially smooth out overall portfolio performance. We encourage investors to know their investments and to understand that appropriate levels of risk-taking may unlock opportunities.
Information on transaction closing.
On November 1, 2021, GTCR LLC and Reverence Capital Partners, L.P., announced the beginning of Allspring Global Investments™, with the close of the transaction to acquire Wells Fargo Funds Management, LLC; Wells Capital Management LLC; Galliard Capital Management LLC.; Wells Fargo Asset Management (International) Ltd.; Wells Fargo Asset Management Luxembourg S.A.; and Wells Fargo Funds Distributor, LLC, as well as Wells Fargo Bank, N.A.’s business of acting as trustee to its collective investment trusts and all related Wells Fargo Asset Management legal entities. The transaction closed on November 1, 2021, forming Allspring Global Investments, a privately held asset management firm with $587 billion in AUM1 as of September 30, 2021.
Allspring Global Investments™ is a leading independent asset management firm with a full breadth of investment capabilities across diverse asset classes, serving the needs of its institutional and wealth management clients around the world. Allspring operates across 18 offices globally supported by more than 480 investment professionals. Allspring and its investment teams provide a broad range of differentiated investment products and solutions to help its diverse range of clients meet their investment objectives.
As part of this transition, all mutual funds within the Wells Fargo Funds family were rebranded as Allspring Funds. Each individual fund had “Wells Fargo” removed from its fund name and replaced with “Allspring.” The fund name changes went into effect on December 6, 2021.
Allspring Global Investments is the trade name for the asset management firms of Allspring Global Investments Holdings, LLC, a holding company indirectly owned by certain private funds of GTCR LLC and Reverence Capital Partners, L.P.
Thank you for choosing to invest with Allspring Funds. We appreciate your confidence in us and remain committed to helping you meet your financial needs.
Sincerely,
Andrew Owen
President
Allspring Funds
For further information about your Fund, contact your investment professional, visit our website at allspringglobal.com, or call us directly at 1-800-222-8222.
| 1 | As of September 30, 2021, assets under management (AUM) includes $93 billion from Galliard Capital Management, LLC, an investment advisor that is not part of the Allspring trade name/GIPS firm. |
4 | Allspring Core Bond Fund
This page is intentionally left blank.
Performance highlights (unaudited)
| Investment objective | The Fund seeks total return, consisting of income and capital appreciation. |
| Manager | Allspring Funds Management, LLC |
Subadviser for the affiliated master portfolio*
Allspring Global Investments, LLC
| Portfolio managers | Maulik Bhansali, CFA®‡, Jarad Vasquez |
| Average annual total returns (%) as of November 30, 2021 |
| | | Including sales charge | | Excluding sales charge | | Expense ratios1 (%) |
| | Inception date | 1 year | 5 year | 10 year | | 1 year | 5 year | 10 year | | Gross | Net 2 |
| Class A (MBFAX) | 10-31-2001 | -6.06 | 2.44 | 2.52 | | -1.64 | 3.39 | 2.99 | | 0.83 | 0.78 |
| Class C (MBFCX) | 10-31-2001 | -3.39 | 2.62 | 2.22 | | -2.39 | 2.62 | 2.22 | | 1.58 | 1.53 |
| Class R (WTRRX) | 7-9-2010 | – | – | – | | -1.71 | 3.18 | 2.76 | | 1.08 | 1.03 |
| Class R4 (MBFRX)3 | 11-30-2012 | – | – | – | | -1.37 | 3.68 | 3.28 | | 0.60 | 0.52 |
| Class R6 (WTRIX)4 | 11-30-2012 | – | – | – | | -1.23 | 3.83 | 3.42 | | 0.45 | 0.37 |
| Administrator Class (MNTRX) | 6-30-1997 | – | – | – | | -1.55 | 3.47 | 3.07 | | 0.77 | 0.70 |
| Institutional Class (MBFIX) | 10-31-2001 | – | – | – | | -1.27 | 3.77 | 3.37 | | 0.50 | 0.42 |
| Bloomberg U.S. Aggregate Bond Index5 | – | – | – | – | | -1.15 | 3.65 | 3.04 | | – | – |
Figures quoted represent past performance, which is no guarantee of future results, and do not reflect taxes that a shareholder may pay on an investment in a fund. Investment return and principal value of an investment will fluctuate so that an investor’s shares, when redeemed, may be worth more or less than their original cost. Performance shown without sales charges would be lower if sales charges were reflected. Current performance may be lower or higher than the performance data quoted, which assumes the reinvestment of dividends and capital gains. Current month-end performance is available on the Fund’s website, allspringglobal.com.
Index returns do not include transaction costs associated with buying and selling securities, any mutual fund fees or expenses, or any taxes. It is not possible to invest directly in an index.
For Class A shares, the maximum front-end sales charge is 4.50%. For Class C shares, the maximum contingent deferred sales charge is 1.00%. Performance including a contingent deferred sales charge assumes the sales charge for the corresponding time period. Class R, Class R4, Class R6, Administrator Class and Institutional Class shares are sold without a front-end sales charge or contingent deferred sales charge.
| 1 | Reflects the expense ratios as stated in the most recent prospectuses, which include the impact of 0.01% in acquired fund fees and expenses. The expense ratios shown are subject to change and may differ from the annualized expense ratios shown in the financial highlights of this report, which do not include acquired fund fees and expenses. |
| 2 | The manager has contractually committed through September 30, 2022, to waive fees and/or reimburse expenses to the extent necessary to cap total annual fund operating expenses after fee waivers at 0.78% for Class A, 1.53% for Class C, 1.03% for Class R, 0.52% for Class R4, 0.37% for Class R6, 0.70% for Administrator Class, and 0.42% for Institutional Class. Brokerage commissions, stamp duty fees, interest, taxes, acquired fund fees and expenses (if any) from funds in which the affiliated master portfolio invests, and extraordinary expenses are excluded from the expense caps. Net expenses from the affiliated master portfolio are included in the expense caps. Prior to or after the commitment expiration date, the caps may be increased or the commitment to maintain the caps may be terminated only with the approval of the Board of Trustees. Without these caps, the Fund’s returns would have been lower. The expense ratio paid by an investor is the net expense ratio (the total annual fund operating expenses after fee waivers) as stated in the prospectuses. |
| 3 | Historical performance shown for the Class R4 shares prior to their inception reflects the performance of the Institutional Class shares, and includes the higher expenses applicable to Institutional Class shares. If these expenses had not been included, returns for Class R4 shares would be higher. |
| 4 | Historical performance shown for the Class R6 shares prior to their inception reflects the performance of the Institutional Class shares, and includes the higher expenses applicable to the Institutional Class shares. If these expenses had not been included, returns for the Class R6 shares would be higher. |
| 5 | The Bloomberg U.S. Aggregate Bond Index is a broad-based benchmark that measures the investment-grade, U.S. dollar–denominated, fixed-rate taxable bond market, including Treasuries, government-related and corporate securities, mortgage-backed securities (agency fixed-rate and hybrid adjustable-rate mortgage pass-throughs), asset-backed securities, and commercial mortgage-backed securities. You cannot invest directly in an index. |
| * | The Fund is a feeder fund in a master-feeder structure that invests substantially all of its assets in a single affiliated master portfolio of the Allspring Master Trust with a substantially identical investment objective and substantially similar investment strategies. References to the investment activities of the Fund are intended to refer to the investment activities of the affiliated master portfolio in which it invests. |
| ‡ | CFA® and Chartered Financial Analyst® are trademarks owned by CFA Institute. |
6 | Allspring Core Bond Fund
Performance highlights (unaudited)
Bond values fluctuate in response to the financial condition of individual issuers, general market and economic conditions, and changes in interest rates. Changes in market conditions and government policies may lead to periods of heightened volatility in the bond market and reduced liquidity for certain bonds held by the Fund. In general, when interest rates rise, bond values fall and investors may lose principal value. Interest rate changes and their impact on the Fund and its share price can be sudden and unpredictable. The use of derivatives may reduce returns and/or increase volatility. Certain investment strategies tend to increase the total risk of an investment (relative to the broader market). Securities issued by U.S. government agencies or government sponsored entities may not be guaranteed by the U.S. Treasury. This fund is exposed to foreign investment risk and mortgage- and asset-backed securities risk. Consult the Fund’s prospectus for additional information on these and other risks.
Allspring Core Bond Fund | 7
Performance highlights (unaudited)
| Ten largest holdings (%) as of November 30, 20211 |
| FNMA, 2.50%, 12-13-2051 | 3.12 |
| FNMA, 2.50%, 2-11-2051 | 2.84 |
| U.S. Treasury Note, 1.25%, 11-30-2026 | 2.35 |
| U.S. Treasury Note, 0.50%, 11-30-2023 | 1.72 |
| U.S. Treasury Bond, 1.38%, 11-15-2040 | 1.67 |
| U.S. Treasury Note, 1.50%, 9-30-2024 | 1.45 |
| U.S. Treasury Bond, 1.13%, 5-15-2040 | 1.42 |
| U.S. Treasury Bond, 1.75%, 8-15-2041 | 1.41 |
| U.S. Treasury Note, 0.75%, 11-15-2024 | 1.39 |
| U.S. Treasury Note, 0.13%, 12-31-2022 | 1.36 |
| 1 | Each holding represents the Fund’s allocable portion of the affiliated master portfolio security. Figures represent each holding as a percentage of the Fund’s net assets. Holdings are subject to change and may have changed since the date specified. |
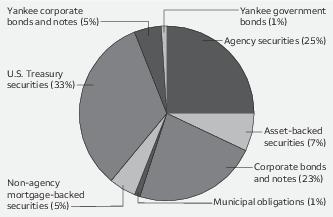
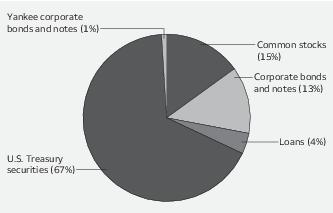
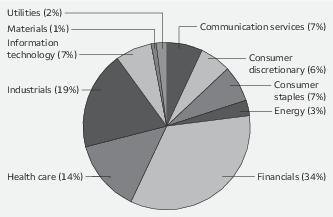
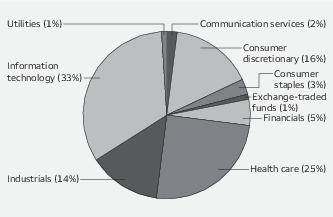
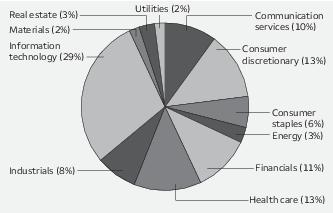
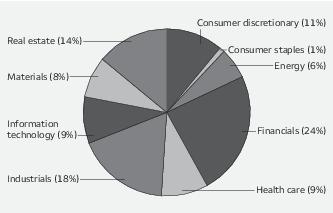
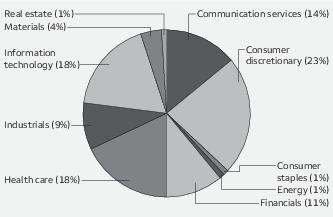
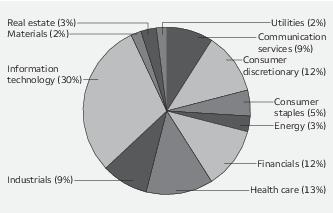
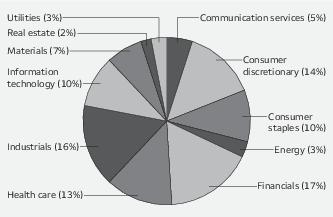
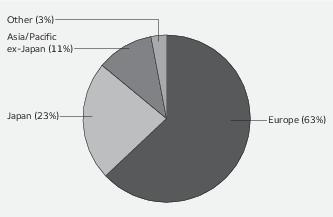
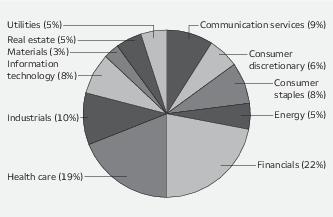
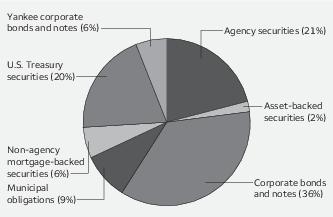
| Portfolio composition as of November 30, 20211 |
| 1 | Figures represent the sector allocation of the affiliated master portfolio as a percentage of the long-term investments of the affiliated master portfolio. These amounts are subject to change and may have changed since the date specified. |
8 | Allspring Core Bond Fund
Fund expenses (unaudited)
As a shareholder of the Fund, you incur two types of costs: (1) transaction costs, including sales charges (loads) on purchase payments and contingent deferred sales charges (if any) on redemptions and (2) ongoing costs, including management fees, distribution (12b-1) and/or shareholder servicing fees, and other Fund expenses. This example is intended to help you understand your ongoing costs (in dollars) of investing in the Fund and to compare these costs with the ongoing costs of investing in other mutual funds.
The example is based on an investment of $1,000 invested at the beginning of the six-month period and held for the entire period from June 1, 2021 to November 30, 2021.
Actual expenses
The “Actual” line of the table below provides information about actual account values and actual expenses. You may use the information in this line, together with the amount you invested, to estimate the expenses that you paid over the period. Simply divide your account value by $1,000 (for example, an $8,600 account value divided by $1,000 = 8.6), then multiply the result by the number in the “Actual” line under the heading entitled “Expenses paid during period” for your applicable class of shares to estimate the expenses you paid on your account during this period.
Hypothetical example for comparison purposes
The “Hypothetical” line of the table below provides information about hypothetical account values and hypothetical expenses based on the Fund’s actual expense ratio and an assumed rate of return of 5% per year before expenses, which is not the Fund’s actual return. The hypothetical account values and expenses may not be used to estimate the actual ending account balance or expenses you paid for the period. You may use this information to compare the ongoing costs of investing in the Fund and other funds. To do so, compare this 5% hypothetical example with the 5% hypothetical examples that appear in the shareholder reports of the other funds.
Please note that the expenses shown in the table are meant to highlight your ongoing costs only and do not reflect any transactional costs, such as sales charges (loads) and contingent deferred sales charges. Therefore, the “Hypothetical” line of the table is useful in comparing ongoing costs only, and will not help you determine the relative total costs of owning different funds. In addition, if these transactional costs were included, your costs would have been higher.
Allspring Core Bond Fund | 9
Fund expenses (unaudited)
| | Beginning
account value
6-1-2021 | Ending
account value
11-30-2021 | Expenses
paid during
the period1,2 | Annualized net
expense ratio2 |
| Class A | | | | |
| Actual | $1,000.00 | $1,006.91 | $3.92 | 0.78% |
| Hypothetical (5% return before expenses) | $1,000.00 | $1,021.16 | $3.95 | 0.78% |
| Class C | | | | |
| Actual | $1,000.00 | $1,003.29 | $7.68 | 1.53% |
| Hypothetical (5% return before expenses) | $1,000.00 | $1,017.40 | $7.74 | 1.53% |
| Class R | | | | |
| Actual | $1,000.00 | $1,006.24 | $4.63 | 0.92% |
| Hypothetical (5% return before expenses) | $1,000.00 | $1,020.46 | $4.66 | 0.92% |
| Class R4 | | | | |
| Actual | $1,000.00 | $1,008.28 | $2.62 | 0.52% |
| Hypothetical (5% return before expenses) | $1,000.00 | $1,022.46 | $2.64 | 0.52% |
| Class R6 | | | | |
| Actual | $1,000.00 | $1,009.04 | $1.86 | 0.37% |
| Hypothetical (5% return before expenses) | $1,000.00 | $1,023.21 | $1.88 | 0.37% |
| Administrator Class | | | | |
| Actual | $1,000.00 | $1,007.38 | $3.52 | 0.70% |
| Hypothetical (5% return before expenses) | $1,000.00 | $1,021.56 | $3.55 | 0.70% |
| Institutional Class | | | | |
| Actual | $1,000.00 | $1,009.56 | $2.12 | 0.42% |
| Hypothetical (5% return before expenses) | $1,000.00 | $1,022.96 | $2.13 | 0.42% |
1 Expenses paid is equal to the annualized net expense ratio of each class multiplied by the average account value over the period, multiplied by the number of days in the most recent fiscal half-year divided by the number of days in the fiscal year (to reflect the one-half-year period).
2 Amounts reflect net expenses allocated from the affiliated Master Portfolio in which the Fund invests.
10 | Allspring Core Bond Fund
Portfolio of investments—November 30, 2021 (unaudited)
| | | | | | Value |
| Investment companies: 100.05% | | | | | |
| Affiliated master portfolio: 100.05% | | | | | |
| Allspring Core Bond Portfolio | | | | | $5,127,213,213 |
| Total Investment companies (Cost $5,114,748,252) | | | | | 5,127,213,213 |
| Total investments in securities (Cost $5,114,748,252) | 100.05% | | | | 5,127,213,213 |
| Other assets and liabilities, net | (0.05) | | | | (2,622,483) |
| Total net assets | 100.00% | | | | $5,124,590,730 |
Transactions with the affiliated Master Portfolio were as follows:
| | % of
ownership,
beginning
of period | % of
ownership,
end of
period | Net realized
gains
(losses) on
securities
transactions
allocated
from
affiliated
Master
Portfolio | Net
change in
unrealized
gains
(losses) on
securities
transactions
allocated
from
affiliated
Master
Portfolio | Interest
allocated
from
affiliated
Master
Portfolio | Affiliated
income
allocated
from
affiliated
Master
Portfolio | Value,
end of
period | |
| Allspring Core Bond Portfolio | 94.49% | 94.18% | $18,478,641 | $2,327,769 | $39,251,978 | $27,584 | $5,127,213,213 | |
The accompanying notes are an integral part of these financial statements.
Allspring Core Bond Fund | 11
Statement of assets and liabilities—November 30, 2021 (unaudited)
| | |
| Assets | |
Investments in affiliated Master Portfolio, at value (cost $5,114,748,252)
| $ 5,127,213,213 |
Receivable for Fund shares sold
| 3,724,000 |
Receivable from manager
| 83,483 |
Prepaid expenses and other assets
| 90,720 |
Total assets
| 5,131,111,416 |
| Liabilities | |
Payable for Fund shares redeemed
| 5,435,197 |
Dividends payable
| 524,312 |
Administration fees payable
| 293,237 |
Distribution fees payable
| 7,101 |
Trustees’ fees and expenses payable
| 655 |
Accrued expenses and other liabilities
| 260,184 |
Total liabilities
| 6,520,686 |
Total net assets
| $5,124,590,730 |
| Net assets consist of | |
Paid-in capital
| $ 5,086,876,433 |
Total distributable earnings
| 37,714,297 |
Total net assets
| $5,124,590,730 |
| Computation of net asset value and offering price per share | |
Net assets – Class A
| $ 367,087,999 |
Shares outstanding – Class A1
| 27,246,997 |
Net asset value per share – Class A
| $13.47 |
Maximum offering price per share – Class A2
| $14.10 |
Net assets – Class C
| $ 10,984,226 |
Shares outstanding �� Class C1
| 823,880 |
Net asset value per share – Class C
| $13.33 |
Net assets – Class R
| $ 1,568,531 |
Shares outstanding – Class R1
| 119,444 |
Net asset value per share – Class R
| $13.13 |
Net assets – Class R4
| $ 1,829,632 |
Shares outstanding – Class R41
| 139,324 |
Net asset value per share – Class R4
| $13.13 |
Net assets – Class R6
| $ 1,765,026,824 |
Shares outstanding – Class R61
| 134,512,852 |
Net asset value per share – Class R6
| $13.12 |
Net assets – Administrator Class
| $ 221,573,196 |
Shares outstanding – Administrator Class1
| 16,868,953 |
Net asset value per share – Administrator Class
| $13.13 |
Net assets – Institutional Class
| $ 2,756,520,322 |
Shares outstanding – Institutional Class1
| 210,149,958 |
Net asset value per share – Institutional Class
| $13.12 |
| 1 | The Fund has an unlimited number of authorized shares. |
| 2 | Maximum offering price is computed as 100/95.50 of net asset value. On investments of $50,000 or more, the offering price is reduced. |
The accompanying notes are an integral part of these financial statements.
12 | Allspring Core Bond Fund
Statement of operations—six months ended November 30, 2021 (unaudited)
| | |
| Investment income | |
Interest allocated from affiliated Master Portfolio (net of foreign withholding taxes of $12,891)
| $ 39,251,978 |
Affiliated income allocated from affiliated Master Portfolio
| 27,584 |
Expenses allocated from affiliated Master Portfolio
| (9,296,250) |
Total investment income
| 29,983,312 |
| Expenses | |
Management fee
| 1,300,081 |
| Administration fees | |
Class A
| 298,204 |
Class C
| 9,627 |
Class R
| 1,349 |
Class R4
| 709 |
Class R6
| 279,155 |
Administrator Class
| 111,419 |
Institutional Class
| 1,109,945 |
| Shareholder servicing fees | |
Class A
| 465,944 |
Class C
| 14,955 |
Class R
| 1,583 |
Class R4
| 884 |
Administrator Class
| 269,367 |
| Distribution fees | |
Class C
| 44,845 |
Class R
| 1,583 |
Custody and accounting fees
| 72,470 |
Professional fees
| 18,191 |
Registration fees
| 13,012 |
Shareholder report expenses
| 6,285 |
Trustees’ fees and expenses
| 9,967 |
Other fees and expenses
| 33,503 |
Total expenses
| 4,063,078 |
| Less: Fee waivers and/or expense reimbursements | |
Fund-level
| (925,746) |
Class A
| (13,227) |
Class C
| (2) |
Class R4
| (301) |
Class R6
| (317,155) |
Administrator Class
| (19,171) |
Institutional Class
| (480,428) |
Net expenses
| 2,307,048 |
Net investment income
| 27,676,264 |
| Realized and unrealized gains (losses) on investments | |
Net realized gains on securities transactions allocated from affiliated Master Portfolio
| 18,478,424 |
Net change in unrealized gains (losses) on securities transactions allocated from affiliated Master Portfolio
| 2,327,986 |
Net realized and unrealized gains (losses) on investments
| 20,806,410 |
Net increase in net assets resulting from operations
| $48,482,674 |
The accompanying notes are an integral part of these financial statements.
Allspring Core Bond Fund | 13
Statement of changes in net assets
| | | | | |
| | Six months ended
November 30, 2021
(unaudited) | Year ended
May 31, 2021 |
| Operations | | | | |
Net investment income
| | $ 27,676,264 | | $ 68,755,092 |
Net realized gains on investments
| | 18,478,424 | | 124,275,417 |
Net change in unrealized gains (losses) on investments
| | 2,327,986 | | (163,776,116) |
Net increase in net assets resulting from operations
| | 48,482,674 | | 29,254,393 |
| Distributions to shareholders from | | | | |
| Net investment income and net realized gains | | | | |
Class A
| | (1,455,491) | | (18,390,567) |
Class C
| | (3,566) | | (826,028) |
Class R
| | (5,356) | | (109,006) |
Class R4
| | (9,201) | | (255,450) |
Class R6
| | (11,071,124) | | (147,643,160) |
Administrator Class
| | (955,924) | | (13,932,917) |
Institutional Class
| | (15,788,554) | | (162,044,711) |
Total distributions to shareholders
| | (29,289,216) | | (343,201,839) |
| Capital share transactions | Shares | | Shares | |
| Proceeds from shares sold | | | | |
Class A
| 1,664,077 | 22,498,128 | 12,273,258 | 169,431,477 |
Class C
| 52,600 | 704,410 | 429,511 | 6,062,121 |
Class R
| 5,278 | 69,540 | 42,683 | 585,880 |
Class R4
| 19,599 | 258,288 | 73,596 | 1,019,265 |
Class R6
| 8,669,906 | 114,360,640 | 41,373,976 | 564,946,588 |
Administrator Class
| 1,944,278 | 25,673,562 | 7,772,437 | 107,461,106 |
Institutional Class
| 31,243,609 | 412,518,270 | 91,169,096 | 1,242,662,922 |
| | | 576,082,838 | | 2,092,169,359 |
| Reinvestment of distributions | | | | |
Class A
| 100,545 | 1,360,968 | 1,173,633 | 16,238,069 |
Class C
| 262 | 3,515 | 58,078 | 794,241 |
Class R
| 281 | 3,707 | 5,020 | 67,665 |
Class R4
| 693 | 9,141 | 18,865 | 254,704 |
Class R6
| 670,307 | 8,837,854 | 8,211,303 | 110,794,663 |
Administrator Class
| 68,245 | 900,859 | 991,907 | 13,386,686 |
Institutional Class
| 1,109,315 | 14,622,137 | 11,300,587 | 152,228,735 |
| | | 25,738,181 | | 293,764,763 |
| Payment for shares redeemed | | | | |
Class A
| (2,137,736) | (28,942,605) | (6,969,911) | (96,545,555) |
Class C
| (236,998) | (3,177,776) | (1,472,599) | (20,765,992) |
Class R
| (17,177) | (225,850) | (150,925) | (2,094,716) |
Class R4
| (16,948) | (224,737) | (285,459) | (3,858,168) |
Class R6
| (26,074,861) | (344,908,039) | (82,522,155) | (1,114,913,998) |
Administrator Class
| (1,550,142) | (20,467,248) | (8,154,991) | (111,662,175) |
Institutional Class
| (32,522,983) | (428,860,630) | (63,368,919) | (856,440,756) |
| | | (826,806,885) | | (2,206,281,360) |
Net increase (decrease) in net assets resulting from capital share transactions
| | (224,985,866) | | 179,652,762 |
Total decrease in net assets
| | (205,792,408) | | (134,294,684) |
| Net assets | | | | |
Beginning of period
| | 5,330,383,138 | | 5,464,677,822 |
End of period
| | $5,124,590,730 | | $ 5,330,383,138 |
The accompanying notes are an integral part of these financial statements.
14 | Allspring Core Bond Fund
Financial highlights
(For a share outstanding throughout each period)
| | | Year ended May 31 |
| Class A | Six months ended
November 30, 2021
(unaudited) | 2021 | 2020 | 2019 | 2018 | 2017 |
Net asset value, beginning of period
| $13.43 | $14.17 | $13.28 | $12.86 | $13.22 | $13.28 |
Net investment income
| 0.05 | 0.12 1 | 0.25 | 0.32 | 0.24 | 0.19 1 |
Net realized and unrealized gains (losses) on investments
| 0.04 | (0.06) | 0.93 | 0.42 | (0.36) | 0.00 |
Total from investment operations
| 0.09 | 0.06 | 1.18 | 0.74 | (0.12) | 0.19 |
| Distributions to shareholders from | | | | | | |
Net investment income
| (0.05) | (0.15) | (0.26) | (0.32) | (0.24) | (0.19) |
Net realized gains
| 0.00 | (0.65) | (0.03) | 0.00 | 0.00 | (0.06) |
Total distributions to shareholders
| (0.05) | (0.80) | (0.29) | (0.32) | (0.24) | (0.25) |
Net asset value, end of period
| $13.47 | $13.43 | $14.17 | $13.28 | $12.86 | $13.22 |
Total return2
| 0.69% | 0.31% | 9.03% | 5.87% | (0.96)% | 1.48% |
| Ratios to average net assets (annualized)* | | | | | | |
Gross expenses
| 0.82% | 0.82% | 0.82% | 0.83% | 0.83% | 0.83% |
Net expenses
| 0.78% | 0.78% | 0.78% | 0.78% | 0.78% | 0.78% |
Net investment income
| 0.72% | 0.87% | 1.85% | 2.50% | 1.79% | 1.40% |
| Supplemental data | | | | | | |
Portfolio turnover rate3
| 199% | 457% | 603% | 577% | 542% | 614% |
Net assets, end of period (000s omitted)
| $367,088 | $370,882 | $299,642 | $302,246 | $320,208 | $360,276 |
| * | Ratios include net expenses allocated from the affiliated Master Portfolio which were as follows: |
| Six months ended November 30, 2021 (unaudited) | 0.35% |
| Year ended May 31, 2021 | 0.35% |
| Year ended May 31, 2020 | 0.35% |
| Year ended May 31, 2019 | 0.35% |
| Year ended May 31, 2018 | 0.35% |
| Year ended May 31, 2017 | 0.35% |
| 1 | Calculated based upon average shares outstanding |
| 2 | Total return calculations do not include any sales charges. Returns for periods of less than one year are not annualized. |
| 3 | Portfolio turnover rate is calculated by multiplying the affiliated Master Portfolio’s percentage of the Fund’s total investment in securities at the end of the period by the affiliated Master Portfolio’s portfolio turnover rate. |
The accompanying notes are an integral part of these financial statements.
Allspring Core Bond Fund | 15
Financial highlights
(For a share outstanding throughout each period)
| | | Year ended May 31 |
| Class C | Six months ended
November 30, 2021
(unaudited) | 2021 | 2020 | 2019 | 2018 | 2017 |
Net asset value, beginning of period
| $13.29 | $14.03 | $13.15 | $12.74 | $13.09 | $13.15 |
Net investment income (loss)
| (0.00) 1 | 0.03 | 0.15 | 0.23 | 0.14 | 0.09 |
Net realized and unrealized gains (losses) on investments
| 0.04 | (0.07) | 0.92 | 0.40 | (0.35) | 0.00 |
Total from investment operations
| 0.04 | (0.04) | 1.07 | 0.63 | (0.21) | 0.09 |
| Distributions to shareholders from | | | | | | |
Net investment income
| (0.00) 2 | (0.05) | (0.16) | (0.22) | (0.14) | (0.09) |
Net realized gains
| 0.00 | (0.65) | (0.03) | 0.00 | 0.00 | (0.06) |
Total distributions to shareholders
| (0.00) 2 | (0.70) | (0.19) | (0.22) | (0.14) | (0.15) |
Net asset value, end of period
| $13.33 | $13.29 | $14.03 | $13.15 | $12.74 | $13.09 |
Total return3
| 0.33% | (0.45)% | 8.22% | 5.04% | (1.65)% | 0.72% |
| Ratios to average net assets (annualized)* | | | | | | |
Gross expenses
| 1.57% | 1.57% | 1.57% | 1.58% | 1.58% | 1.58% |
Net expenses
| 1.53% | 1.53% | 1.53% | 1.53% | 1.53% | 1.53% |
Net investment income (loss)
| (0.04)% | 0.16% | 1.11% | 1.75% | 1.04% | 0.68% |
| Supplemental data | | | | | | |
Portfolio turnover rate4
| 199% | 457% | 603% | 577% | 542% | 614% |
Net assets, end of period (000s omitted)
| $10,984 | $13,399 | $27,971 | $34,494 | $47,843 | $59,049 |
| * | Ratios include net expenses allocated from the affiliated Master Portfolio which were as follows: |
| Six months ended November 30, 2021 (unaudited) | 0.36% |
| Year ended May 31, 2021 | 0.35% |
| Year ended May 31, 2020 | 0.35% |
| Year ended May 31, 2019 | 0.35% |
| Year ended May 31, 2018 | 0.35% |
| Year ended May 31, 2017 | 0.35% |
| 1 | Amount is more than $(0.005) |
| 2 | Amount is less than $0.005. |
| 3 | Total return calculations do not include any sales charges. Returns for periods of less than one year are not annualized. |
| 4 | Portfolio turnover rate is calculated by multiplying the affiliated Master Portfolio’s percentage of the Fund’s total investment in securities at the end of the period by the affiliated Master Portfolio’s portfolio turnover rate. |
The accompanying notes are an integral part of these financial statements.
16 | Allspring Core Bond Fund
Financial highlights
(For a share outstanding throughout each period)
| | | Year ended May 31 |
| Class R | Six months ended
November 30, 2021
(unaudited) | 2021 | 2020 | 2019 | 2018 | 2017 |
Net asset value, beginning of period
| $13.09 | $13.83 | $12.96 | $12.55 | $12.90 | $12.97 |
Net investment income
| 0.04 1 | 0.11 1 | 0.22 1 | 0.28 1 | 0.20 1 | 0.15 1 |
Net realized and unrealized gains (losses) on investments
| 0.04 | (0.06) | 0.90 | 0.41 | (0.35) | (0.01) |
Total from investment operations
| 0.08 | 0.05 | 1.12 | 0.69 | (0.15) | 0.14 |
| Distributions to shareholders from | | | | | | |
Net investment income
| (0.04) | (0.14) | (0.22) | (0.28) | (0.20) | (0.15) |
Net realized gains
| 0.00 | (0.65) | (0.03) | 0.00 | 0.00 | (0.06) |
Total distributions to shareholders
| (0.04) | (0.79) | (0.25) | (0.28) | (0.20) | (0.21) |
Net asset value, end of period
| $13.13 | $13.09 | $13.83 | $12.96 | $12.55 | $12.90 |
Total return2
| 0.62% | 0.22% | 8.80% | 5.61% | (1.19)% | 1.15% |
| Ratios to average net assets (annualized)* | | | | | | |
Gross expenses
| 0.95% | 0.87% | 1.05% | 1.07% | 1.08% | 1.08% |
Net expenses
| 0.92% | 0.86% | 1.02% | 1.03% | 1.03% | 1.03% |
Net investment income
| 0.57% | 0.81% | 1.66% | 2.25% | 1.54% | 1.18% |
| Supplemental data | | | | | | |
Portfolio turnover rate3
| 199% | 457% | 603% | 577% | 542% | 614% |
Net assets, end of period (000s omitted)
| $1,569 | $1,716 | $3,241 | $8,565 | $12,230 | $13,826 |
| * | Ratios include net expenses allocated from the affiliated Master Portfolio which were as follows: |
| Six months ended November 30, 2021 (unaudited) | 0.35% |
| Year ended May 31, 2021 | 0.35% |
| Year ended May 31, 2020 | 0.35% |
| Year ended May 31, 2019 | 0.35% |
| Year ended May 31, 2018 | 0.35% |
| Year ended May 31, 2017 | 0.35% |
| 1 | Calculated based upon average shares outstanding |
| 2 | Returns for periods of less than one year are not annualized. |
| 3 | Portfolio turnover rate is calculated by multiplying the affiliated Master Portfolio’s percentage of the Fund’s total investment in securities at the end of the period by the affiliated Master Portfolio’s portfolio turnover rate. |
The accompanying notes are an integral part of these financial statements.
Allspring Core Bond Fund | 17
Financial highlights
(For a share outstanding throughout each period)
| | | Year ended May 31 |
| Class R4 | Six months ended
November 30, 2021
(unaudited) | 2021 | 2020 | 2019 | 2018 | 2017 |
Net asset value, beginning of period
| $13.09 | $13.83 | $12.95 | $12.55 | $12.89 | $12.95 |
Net investment income
| 0.07 | 0.16 1 | 0.29 1 | 0.35 | 0.26 1 | 0.22 |
Net realized and unrealized gains (losses) on investments
| 0.04 | (0.06) | 0.91 | 0.40 | (0.34) | 0.00 |
Total from investment operations
| 0.11 | 0.10 | 1.20 | 0.75 | (0.08) | 0.22 |
| Distributions to shareholders from | | | | | | |
Net investment income
| (0.07) | (0.19) | (0.29) | (0.35) | (0.26) | (0.22) |
Net realized gains
| 0.00 | (0.65) | (0.03) | 0.00 | 0.00 | (0.06) |
Total distributions to shareholders
| (0.07) | (0.84) | (0.32) | (0.35) | (0.26) | (0.28) |
Net asset value, end of period
| $13.13 | $13.09 | $13.83 | $12.95 | $12.55 | $12.89 |
Total return2
| 0.83% | 0.55% | 9.34% | 6.07% | (0.61)% | 1.74% |
| Ratios to average net assets (annualized)* | | | | | | |
Gross expenses
| 0.59% | 0.59% | 0.59% | 0.60% | 0.60% | 0.60% |
Net expenses
| 0.52% | 0.52% | 0.52% | 0.52% | 0.52% | 0.52% |
Net investment income
| 0.98% | 1.16% | 2.19% | 2.76% | 2.01% | 1.70% |
| Supplemental data | | | | | | |
Portfolio turnover rate3
| 199% | 457% | 603% | 577% | 542% | 614% |
Net assets, end of period (000s omitted)
| $1,830 | $1,780 | $4,549 | $10,805 | $11,680 | $43,205 |
| * | Ratios include net expenses allocated from the affiliated Master Portfolio which were as follows: |
| Six months ended November 30, 2021 (unaudited) | 0.35% |
| Year ended May 31, 2021 | 0.35% |
| Year ended May 31, 2020 | 0.35% |
| Year ended May 31, 2019 | 0.35% |
| Year ended May 31, 2018 | 0.35% |
| Year ended May 31, 2017 | 0.35% |
| 1 | Calculated based upon average shares outstanding |
| 2 | Returns for periods of less than one year are not annualized. |
| 3 | Portfolio turnover rate is calculated by multiplying the affiliated Master Portfolio’s percentage of the Fund’s total investment in securities at the end of the period by the affiliated Master Portfolio’s portfolio turnover rate. |
The accompanying notes are an integral part of these financial statements.
18 | Allspring Core Bond Fund
Financial highlights
(For a share outstanding throughout each period)
| | | Year ended May 31 |
| Class R6 | Six months ended
November 30, 2021
(unaudited) | 2021 | 2020 | 2019 | 2018 | 2017 |
Net asset value, beginning of period
| $13.08 | $13.82 | $12.95 | $12.54 | $12.89 | $12.95 |
Net investment income
| 0.07 | 0.18 1 | 0.30 | 0.37 | 0.28 | 0.24 |
Net realized and unrealized gains (losses) on investments
| 0.05 | (0.06) | 0.91 | 0.41 | (0.35) | 0.00 |
Total from investment operations
| 0.12 | 0.12 | 1.21 | 0.78 | (0.07) | 0.24 |
| Distributions to shareholders from | | | | | | |
Net investment income
| (0.08) | (0.21) | (0.31) | (0.37) | (0.28) | (0.24) |
Net realized gains
| 0.00 | (0.65) | (0.03) | 0.00 | 0.00 | (0.06) |
Total distributions to shareholders
| (0.08) | (0.86) | (0.34) | (0.37) | (0.28) | (0.30) |
Net asset value, end of period
| $13.12 | $13.08 | $13.82 | $12.95 | $12.54 | $12.89 |
Total return2
| 0.90% | 0.70% | 9.42% | 6.31% | (0.54)% | 1.90% |
| Ratios to average net assets (annualized)* | | | | | | |
Gross expenses
| 0.44% | 0.44% | 0.44% | 0.45% | 0.45% | 0.45% |
Net expenses
| 0.37% | 0.37% | 0.37% | 0.37% | 0.37% | 0.37% |
Net investment income
| 1.13% | 1.29% | 2.26% | 2.92% | 2.24% | 1.87% |
| Supplemental data | | | | | | |
Portfolio turnover rate3
| 199% | 457% | 603% | 577% | 542% | 614% |
Net assets, end of period (000s omitted)
| $1,765,027 | $1,978,164 | $2,545,332 | $2,513,644 | $1,360,847 | $797,896 |
| * | Ratios include net expenses allocated from the affiliated Master Portfolio which were as follows: |
| Six months ended November 30, 2021 (unaudited) | 0.35% |
| Year ended May 31, 2021 | 0.35% |
| Year ended May 31, 2020 | 0.35% |
| Year ended May 31, 2019 | 0.35% |
| Year ended May 31, 2018 | 0.35% |
| Year ended May 31, 2017 | 0.35% |
| 1 | Calculated based upon average shares outstanding |
| 2 | Returns for periods of less than one year are not annualized. |
| 3 | Portfolio turnover rate is calculated by multiplying the affiliated Master Portfolio’s percentage of the Fund’s total investment in securities at the end of the period by the affiliated Master Portfolio’s portfolio turnover rate. |
The accompanying notes are an integral part of these financial statements.
Allspring Core Bond Fund | 19
Financial highlights
(For a share outstanding throughout each period)
| | | Year ended May 31 |
| Administrator Class | Six months ended
November 30, 2021
(unaudited) | 2021 | 2020 | 2019 | 2018 | 2017 |
Net asset value, beginning of period
| $13.09 | $13.83 | $12.96 | $12.56 | $12.90 | $12.97 |
Net investment income
| 0.05 | 0.13 | 0.26 | 0.33 1 | 0.24 1 | 0.21 |
Net realized and unrealized gains (losses) on investments
| 0.05 | (0.06) | 0.90 | 0.40 | (0.34) | (0.02) |
Total from investment operations
| 0.10 | 0.07 | 1.16 | 0.73 | (0.10) | 0.19 |
| Distributions to shareholders from | | | | | | |
Net investment income
| (0.06) | (0.16) | (0.26) | (0.33) | (0.24) | (0.20) |
Net realized gains
| 0.00 | (0.65) | (0.03) | 0.00 | 0.00 | (0.06) |
Total distributions to shareholders
| (0.06) | (0.81) | (0.29) | (0.33) | (0.24) | (0.26) |
Net asset value, end of period
| $13.13 | $13.09 | $13.83 | $12.96 | $12.56 | $12.90 |
Total return2
| 0.74% | 0.37% | 9.14% | 5.87% | (0.79)% | 1.48% |
| Ratios to average net assets (annualized)* | | | | | | |
Gross expenses
| 0.75% | 0.76% | 0.76% | 0.76% | 0.77% | 0.77% |
Net expenses
| 0.70% | 0.70% | 0.70% | 0.70% | 0.70% | 0.70% |
Net investment income
| 0.80% | 0.95% | 1.92% | 2.58% | 1.86% | 1.50% |
| Supplemental data | | | | | | |
Portfolio turnover rate3
| 199% | 457% | 603% | 577% | 542% | 614% |
Net assets, end of period (000s omitted)
| $221,573 | $214,796 | $218,522 | $205,825 | $269,057 | $373,042 |
| * | Ratios include net expenses allocated from the affiliated Master Portfolio which were as follows: |
| Six months ended November 30, 2021 (unaudited) | 0.35% |
| Year ended May 31, 2021 | 0.35% |
| Year ended May 31, 2020 | 0.35% |
| Year ended May 31, 2019 | 0.35% |
| Year ended May 31, 2018 | 0.35% |
| Year ended May 31, 2017 | 0.35% |
| 1 | Calculated based upon average shares outstanding |
| 2 | Returns for periods of less than one year are not annualized. |
| 3 | Portfolio turnover rate is calculated by multiplying the affiliated Master Portfolio’s percentage of the Fund’s total investment in securities at the end of the period by the affiliated Master Portfolio’s portfolio turnover rate. |
The accompanying notes are an integral part of these financial statements.
20 | Allspring Core Bond Fund
Financial highlights
(For a share outstanding throughout each period)
| | | Year ended May 31 |
| Institutional Class | Six months ended
November 30, 2021
(unaudited) | 2021 | 2020 | 2019 | 2018 | 2017 |
Net asset value, beginning of period
| $13.07 | $13.82 | $12.94 | $12.54 | $12.88 | $12.95 |
Net investment income
| 0.07 | 0.17 | 0.29 | 0.36 | 0.28 | 0.23 |
Net realized and unrealized gains (losses) on investments
| 0.06 | (0.07) | 0.92 | 0.40 | (0.34) | (0.01) |
Total from investment operations
| 0.13 | 0.10 | 1.21 | 0.76 | (0.06) | 0.22 |
| Distributions to shareholders from | | | | | | |
Net investment income
| (0.08) | (0.20) | (0.30) | (0.36) | (0.28) | (0.23) |
Net realized gains
| 0.00 | (0.65) | (0.03) | 0.00 | 0.00 | (0.06) |
Total distributions to shareholders
| (0.08) | (0.85) | (0.33) | (0.36) | (0.28) | (0.29) |
Net asset value, end of period
| $13.12 | $13.07 | $13.82 | $12.94 | $12.54 | $12.88 |
Total return1
| 0.96% | 0.58% | 9.45% | 6.18% | (0.51)% | 1.77% |
| Ratios to average net assets (annualized)* | | | | | | |
Gross expenses
| 0.49% | 0.49% | 0.49% | 0.50% | 0.50% | 0.50% |
Net expenses
| 0.42% | 0.42% | 0.42% | 0.42% | 0.42% | 0.42% |
Net investment income
| 1.08% | 1.22% | 2.21% | 2.86% | 2.16% | 1.82% |
| Supplemental data | | | | | | |
Portfolio turnover rate2
| 199% | 457% | 603% | 577% | 542% | 614% |
Net assets, end of period (000s omitted)
| $2,756,520 | $2,749,647 | $2,365,421 | $2,343,238 | $3,318,290 | $3,166,348 |
| * | Ratios include net expenses allocated from the affiliated Master Portfolio which were as follows: |
| Six months ended November 30, 2021 (unaudited) | 0.35% |
| Year ended May 31, 2021 | 0.35% |
| Year ended May 31, 2020 | 0.35% |
| Year ended May 31, 2019 | 0.35% |
| Year ended May 31, 2018 | 0.35% |
| Year ended May 31, 2017 | 0.35% |
| 1 | Returns for periods of less than one year are not annualized. |
| 2 | Portfolio turnover rate is calculated by multiplying the affiliated Master Portfolio’s percentage of the Fund’s total investment in securities at the end of the period by the affiliated Master Portfolio’s portfolio turnover rate. |
The accompanying notes are an integral part of these financial statements.
Allspring Core Bond Fund | 21
Notes to financial statements (unaudited)
1. ORGANIZATION
Allspring Funds Trust (the "Trust"), a Delaware statutory trust organized on March 10, 1999, is an open-end management investment company registered under the Investment Company Act of 1940, as amended (the "1940 Act"). As an investment company, the Trust follows the accounting and reporting guidance in Financial Accounting Standards Board ("FASB") Accounting Standards Codification Topic 946, Financial Services – Investment Companies. These financial statements report on the Allspring Core Bond Fund (the "Fund") which is a diversified series of the Trust.
The Fund is a feeder fund in a master-feeder structure that invests substantially all of its assets in a single master portfolio with a substantially identical investment objective and substantially similar investment strategies. The Fund invests in Allspring Core Bond Portfolio, a separate diversified portfolio (the “affiliated Master Portfolio”) of Allspring Master Trust, a registered open-end management investment company. As of November 30, 2021, the Fund owned 94.18% of Allspring Core Bond Portfolio. The affiliated Master Portfolio directly acquires portfolio securities and the Fund acquires an indirect interest in those securities. The Fund accounts for its investment in the affiliated Master Portfolio as a partnership investment and records on a daily basis its share of the affiliated Master Portfolio’s income, expense and realized and unrealized gains and losses. The financial statements of the affiliated Master Portfolio for the six months ended November 30, 2021 are included in this report and should be read in conjunction with the Fund’s financial statements.
On February 23, 2021, Wells Fargo & Company entered into a definitive agreement to sell Wells Fargo Asset Management ("WFAM") to GTCR LLC and Reverence Capital Partners, L.P. WFAM was the trade name used by the asset management businesses of Wells Fargo & Company and included Wells Fargo Funds Management, LLC, Wells Capital Management, LLC, Wells Fargo Asset Management (International) Limited and Wells Fargo Funds Distributor, LLC. Effective on November 1, 2021, the sale transaction of WFAM by Wells Fargo & Company to GTCR LLC and Reverence Capital Partners, L.P. was closed. In connection with the closing of the transaction, WFAM became known as Allspring Global Investments (“Allspring”) and various entities that provide services to the Fund changed their names to "Allspring", including Allspring Funds Management, LLC (formerly Wells Fargo Funds Management, LLC), the investment manager to the Fund, Allspring Global Investments, Inc. (formerly Wells Capital Management, LLC) and Allspring Global Investments (UK) Limited (formerly Wells Fargo Asset Management (International) Limited), both registered investment advisers providing subadvisory services to certain funds, and Allspring Funds Distributor, LLC (formerly Wells Fargo Funds Distributor, LLC), the Fund's principal underwriter.
Consummation of the transaction resulted in the automatic termination of the Fund’s investment management agreement. The Fund’s Board of Trustees approved a new investment management agreement which was submitted and approved by the Fund’s shareholders at a Special Meeting of Shareholders held on August 16, 2021. The new agreement became effective on November 1, 2021.
Effective December 6, 2021, "Wells Fargo" was removed from the Fund's name and replaced it with "Allspring".
2. SIGNIFICANT ACCOUNTING POLICIES
The following significant accounting policies, which are consistently followed in the preparation of the financial statements of the Fund, are in conformity with U.S. generally accepted accounting principles which require management to make estimates and assumptions that affect the reported amounts of assets and liabilities, disclosure of contingent assets and liabilities at the date of the financial statements, and the reported amounts of income and expenses during the reporting period. Actual results could differ from those estimates.
Securities valuation
All investments are valued each business day as of the close of regular trading on the New York Stock Exchange (generally 4 p.m. Eastern Time), although the Fund may deviate from this calculation time under unusual or unexpected circumstances.
Investments in the affiliated Master Portfolio are valued daily based on the Fund’s proportionate share of the affiliated Master Portfolio’s net assets, which are also valued daily. Securities held in the affiliated Master Portfolio are valued as discussed in the Notes to Financial Statements of the affiliated Master Portfolio, which are included elsewhere in this report.
Investments which are not valued using the method discussed above are valued at their fair value, as determined in good faith by the Board of Trustees. The Board of Trustees has established a Valuation Committee comprised of the Trustees and has delegated to it the authority to take any actions regarding the valuation of portfolio securities that the Valuation Committee deems necessary or appropriate, including determining the fair value of portfolio securities, unless the determination has been delegated to the Allspring Global Investments Pricing Committee at Allspring Funds Management, LLC ("Allspring Funds Management"). The Board of Trustees retains the authority to make or ratify any valuation decisions or approve any changes to
22 | Allspring Core Bond Fund
Notes to financial statements (unaudited)
the Valuation Procedures as it deems appropriate. On a quarterly basis, the Board of Trustees receives reports on any valuation actions taken by the Valuation Committee or the Allspring Global Investments Pricing Committee which may include items for ratification.
Investment transactions, income and expenses
Investments in the affiliated Master Portfolio are recorded on a trade date basis. The Fund records daily its proportionate share of the affiliated Master Portfolio’s income, expenses and realized and unrealized gains or losses. The Fund also accrues its own expenses.
Distributions to shareholders
Distributions to shareholders from net investment income are declared daily and paid monthly. Distributions from net realized gains, if any, are recorded on the ex-dividend date and paid at least annually. Such distributions are determined in accordance with income tax regulations and may differ from U.S. generally accepted accounting principles. Dividend sources are estimated at the time of declaration. The tax character of distributions is determined as of the Fund's fiscal year end. Therefore, a portion of the Fund's distributions made prior to the Fund’s fiscal year end may be categorized as a tax return of capital at year end.
Federal and other taxes
The Fund intends to continue to qualify as a regulated investment company by distributing substantially all of its investment company taxable income and any net realized capital gains (after reduction for capital loss carryforwards) sufficient to relieve it from all, or substantially all, federal income taxes. Accordingly, no provision for federal income taxes was required.
The Fund’s income and federal excise tax returns and all financial records supporting those returns for the prior three fiscal years are subject to examination by the federal and Delaware revenue authorities. Management has analyzed the Fund's tax positions taken on federal, state, and foreign tax returns for all open tax years and does not believe that there are any uncertain tax positions that require recognition of a tax liability.
As of November 30, 2021, the aggregate cost of all investments for federal income tax purposes was $5,129,390,625 and the unrealized gains (losses) consisted of:
| Gross unrealized gains | $ 0 |
| Gross unrealized losses | (2,177,412) |
| Net unrealized losses | $(2,177,412) |
Class allocations
The separate classes of shares offered by the Fund differ principally in applicable sales charges, distribution, shareholder servicing, and administration fees. Class specific expenses are charged directly to that share class. Investment income, common fund-level expenses, and realized and unrealized gains (losses) on investments are allocated daily to each class of shares based on the relative proportion of net assets of each class.
3. FAIR VALUATION MEASUREMENTS
At November 30, 2021, the Fund’s investment in the affiliated Master Portfolio was measured at fair value using the net asset value per share (or its equivalent) as a practical expedient. The investment objective and fair value of the affiliated Master Portfolio is as follows:
| Affiliated Master Portfolio | Investment objective | Fair value of affiliated
Master Portfolio |
| Allspring Core Bond Portfolio | Seeks total return, consisting of income and capital appreciation | $5,127,213,213 |
The affiliated Master Portfolio does not have a redemption period notice, can be redeemed daily and does not have any unfunded commitments.
4. TRANSACTIONS WITH AFFILIATES
Management fee
Allspring Funds Management, a wholly owned subsidiary of Allspring Global Investments Holdings, LLC, a holding company indirectly owned by certain private funds of GTCR LLC and Reverence Capital Partners, L.P., is the manager of the Fund and provides advisory and fund-level administrative services under an investment management agreement. Under the investment
Allspring Core Bond Fund | 23
Notes to financial statements (unaudited)
management agreement, Allspring Funds Management is responsible for, among other services, implementing the investment objectives and strategies of the Fund and providing fund-level administrative services in connection with the Fund’s operations. As long as the Fund continues to invest substantially all of its assets in a single affiliated Master Portfolio, the Fund pays Allspring Funds Management an investment management fee only for fund-level administrative services at the following annual rate based on the Fund’s average daily net assets:
| Average daily net assets | Management fee |
| First $5 billion | 0.050% |
| Next $5 billion | 0.040 |
| Over $10 billion | 0.030 |
For the six months ended November 30, 2021, the management fee was equivalent to an annual rate of 0.05% of the Fund’s average daily net assets.
Allspring Funds Management also serves as the adviser to the affiliated Master Portfolio and is entitled to receive a fee from the affiliated Master Portfolio for those services.
Administration fees
Under a class-level administration agreement, Allspring Funds Management provides class-level administrative services to the Fund, which includes paying fees and expenses for services provided by the transfer agent, sub-transfer agents, omnibus account servicers and record-keepers. As compensation for its services under the class-level administration agreement, Allspring Funds Management receives an annual fee which is calculated based on the average daily net assets of each class as follows:
| | Class-level
administration fee |
| Class A | 0.16% |
| Class C | 0.16 |
| Class R | 0.16 |
| Class R4 | 0.08 |
| Class R6 | 0.03 |
| Administrator Class | 0.10 |
| Institutional Class | 0.08 |
Waivers and/or expense reimbursements
Allspring Funds Management has contractually committed to waive and/or reimburse management and administration fees to the extent necessary to maintain certain net operating expense ratios for the Fund. When each class of the Fund has exceeded its expense cap, Allspring Funds Management will waive fees and/or reimburse expenses from fund-level expenses on a proportionate basis and then from class specific expenses. When only certain classes exceed their expense caps, waivers and/or reimbursements are applied against class specific expenses before fund-level expenses. Net expenses from the affiliated Master Portfolio are included in the expense caps. Allspring Funds Management has contractually committed through September 30, 2022 to waive fees and/or reimburse expenses to the extent necessary to cap expenses. Prior to or after the commitment expiration date, the caps may be increased or the commitment to maintain the caps may be terminated only with the approval of the Board of Trustees. The contractual expense caps are as follows:
24 | Allspring Core Bond Fund
Notes to financial statements (unaudited)
| | Expense ratio caps |
| Class A | 0.78% |
| Class C | 1.53 |
| Class R | 1.03 |
| Class R4 | 0.52 |
| Class R6 | 0.37 |
| Administrator Class | 0.70 |
| Institutional Class | 0.42 |
Distribution fees
The Trust has adopted a distribution plan for Class C and Class R shares of the Fund pursuant to Rule 12b-1 under the 1940 Act. Distribution fees are charged to Class C and Class R shares and paid to Allspring Funds Distributor, LLC ("Allspring Funds Distributor"), an affiliate of Allspring Funds Management, the principal underwriter, at an annual rate of 0.75% of the average daily net assets of Class C shares and 0.25% of the average daily net assets of Class R shares.
In addition, Allspring Funds Distributor is entitled to receive the front-end sales charge from the purchase of Class A shares and a contingent deferred sales charge on the redemption of certain Class A shares. Allspring Funds Distributor is also entitled to receive the contingent deferred sales charges from redemptions of Class C shares. For the six months ended November 30, 2021, Allspring Funds Distributor received $1,005 from the sale of Class A shares. No contingent deferred sales charges were incurred by Class A and Class C shares for the six months ended November 30, 2021.
Shareholder servicing fees
The Trust has entered into contracts with one or more shareholder servicing agents, whereby Class A, Class C, Class R, and Administrator Class of the Fund are charged a fee at an annual rate of 0.25% of the average daily net assets of each respective class. Class R4 is charged a fee at an annual rate of 0.10% of its average daily net assets. A portion of these total shareholder servicing fees were paid to affiliates, and to certain entities that were affiliates of the Fund until November 1, 2021.
5. INVESTMENT PORTFOLIO TRANSACTIONS
The Fund seeks to achieve its investment objective by investing substantially all of its assets in the affiliated Master Portfolio. Purchases and sales have been calculated by multiplying the Fund's ownership percentage of the affiliated Master Portfolio by the affiliated Master Portfolio's purchases and sales. Purchases and sales of investments, excluding U.S. government obligations (if any) and short-term securities, for the six months ended November 30, 2021 were as follows:
| Purchases at cost | | Sales proceeds |
U.S.
government | Non-U.S.
government | | U.S.
government | Non-U.S.
government |
| $9,601,517,650 | $1,749,156,683 | | $9,466,666,799 | $1,729,005,700 |
6. BANK BORROWINGS
The Trust (excluding the money market funds), Allspring Master Trust and Allspring Variable Trust are parties to a $350,000,000 revolving credit agreement whereby the Fund is permitted to use bank borrowings for temporary or emergency purposes, such as to fund shareholder redemption requests. Interest under the credit agreement is charged to the Fund based on a borrowing rate equal to the higher of the Federal Funds rate in effect on that day plus 1.25% or the overnight bank funding rate in effect on that day plus 1.25%. In addition, an annual commitment fee equal to 0.25% of the unused balance is allocated to each participating fund.
For the six months ended November 30, 2021, there were no borrowings by the Fund under the agreement.
7. INDEMNIFICATION
Under the Fund's organizational documents, the officers and Trustees have been granted certain indemnification rights against certain liabilities that may arise out of performance of their duties to the Fund. The Fund has entered into a separate agreement with each Trustee that converts indemnification rights currently existing under the Fund’s organizational documents into contractual rights that cannot be changed in the future without the consent of the Trustee. Additionally, in the
Allspring Core Bond Fund | 25
Notes to financial statements (unaudited)
normal course of business, the Fund may enter into contracts with service providers that contain a variety of indemnification clauses. The Fund’s maximum exposure under these arrangements is dependent on future claims that may be made against the Fund and, therefore, cannot be estimated.
8. CORONAVIRUS (COVID-19) PANDEMIC
On March 11, 2020, the World Health Organization announced that it had made the assessment that coronavirus disease 2019 (“COVID-19”) is a pandemic. The impacts of COVID-19 are affecting the entire global economy, individual companies and investment products, the funds, and the market in general. There is significant uncertainty around the extent and duration of business disruptions related to COVID-19 and the impacts may last for an extended period of time. COVID-19 has led to significant uncertainty and volatility in the financial markets.
26 | Allspring Core Bond Fund
Portfolio of investments—November 30, 2021 (unaudited)
| | | Interest
rate | Maturity
date | Principal | Value |
| Agency securities: 26.83% | | | | | | |
| FHLMC ¤ | | 0.00% | 9-15-2029 | $ | 10,190,000 | $ 8,953,596 |
| FHLMC ¤ | | 0.00 | 12-14-2029 | | 6,390,000 | 5,625,225 |
| FHLMC (1 Month LIBOR +0.35%) ± | | 0.44 | 12-15-2048 | | 619,557 | 616,144 |
| FHLMC | | 1.75 | 5-15-2043 | | 2,107,894 | 2,143,204 |
| FHLMC | | 2.00 | 12-1-2050 | | 5,739,596 | 5,767,557 |
| FHLMC | | 2.50 | 1-1-2036 | | 14,929,003 | 15,682,987 |
| FHLMC (12 Month LIBOR +1.64%) ± | | 2.82 | 5-1-2049 | | 2,691,273 | 2,768,131 |
| FHLMC | | 3.00 | 12-1-2031 | | 8,480,464 | 8,941,493 |
| FHLMC | | 3.00 | 1-1-2032 | | 1,331,647 | 1,408,180 |
| FHLMC | | 3.00 | 7-1-2033 | | 3,364,115 | 3,551,264 |
| FHLMC | | 3.00 | 10-15-2047 | | 5,956,989 | 6,112,641 |
| FHLMC | | 3.00 | 5-15-2050 | | 4,434,855 | 4,669,057 |
| FHLMC | | 4.00 | 1-1-2035 | | 120,009 | 130,582 |
| FHLMC | | 4.00 | 1-1-2036 | | 226,474 | 246,911 |
| FHLMC | | 4.00 | 10-1-2036 | | 1,196,279 | 1,300,405 |
| FHLMC | | 4.00 | 3-1-2037 | | 180,622 | 197,795 |
| FHLMC | | 4.00 | 3-1-2037 | | 209,910 | 231,040 |
| FHLMC | | 4.00 | 3-1-2037 | | 214,229 | 231,049 |
| FHLMC | | 4.00 | 4-1-2037 | | 1,690,536 | 1,849,450 |
| FHLMC | | 4.00 | 4-1-2037 | | 1,421,123 | 1,550,820 |
| FHLMC | | 4.00 | 8-1-2038 | | 7,229,497 | 7,781,079 |
| FHLMC | | 4.00 | 11-1-2048 | | 6,777,264 | 7,385,275 |
| FHLMC | | 4.00 | 7-1-2049 | | 10,027,372 | 11,061,857 |
| FHLMC | | 4.50 | 6-1-2039 | | 198,106 | 218,319 |
| FHLMC | | 4.50 | 7-1-2039 | | 255,419 | 287,401 |
| FHLMC | | 5.00 | 5-1-2048 | | 5,344,603 | 6,052,937 |
| FHLMC | | 5.00 | 3-1-2049 | | 8,055,112 | 9,024,774 |
| FHLMC Series 1897 Class K | | 7.00 | 9-15-2026 | | 191 | 209 |
| FHLMC Series 264 Class 30 | | 3.00 | 7-15-2042 | | 7,269,563 | 7,537,618 |
| FHLMC Series 4426 Class QC | | 1.75 | 7-15-2037 | | 3,777,382 | 3,830,855 |
| FHLMC Series 4705 Class A | | 4.50 | 9-15-2042 | | 536,497 | 541,797 |
| FHLMC Series 4763 Class CA | | 3.00 | 9-15-2038 | | 1,043,008 | 1,097,506 |
| FHLMC Series 4767 Class KA | | 3.00 | 3-15-2048 | | 2,895,238 | 3,047,336 |
| FHLMC Series 5091 Class AB | | 1.50 | 3-25-2051 | | 9,176,821 | 9,059,728 |
| FHLMC Series 5119 Class AB | | 1.50 | 8-25-2049 | | 4,756,693 | 4,722,574 |
| FNMA ¤ | | 0.00 | 11-15-2030 | | 18,777,000 | 16,170,060 |
| FNMA | | 1.50 | 1-25-2043 | | 2,654,717 | 2,638,700 |
| FNMA | | 1.50 | 1-25-2043 | | 8,577,150 | 8,582,288 |
| FNMA | | 1.70 | 8-25-2033 | | 10,160,060 | 10,356,077 |
| FNMA | | 1.75 | 5-25-2043 | | 2,971,996 | 3,015,961 |
| FNMA | | 1.75 | 6-25-2046 | | 19,168,168 | 19,153,863 |
| FNMA | | 2.00 | 9-1-2030 | | 1,793,432 | 1,840,237 |
| FNMA | | 2.00 | 5-1-2031 | | 2,721,849 | 2,792,884 |
| FNMA | | 2.00 | 5-1-2031 | | 2,719,050 | 2,790,012 |
| FNMA %% | | 2.00 | 1-16-2036 | | 53,800,000 | 55,063,039 |
| FNMA %% | | 2.00 | 12-16-2036 | | 17,400,000 | 17,841,117 |
| FNMA | | 2.00 | 6-25-2038 | | 10,102,722 | 10,370,920 |
| FNMA | | 2.00 | 4-1-2051 | | 11,188,213 | 11,242,755 |
| FNMA %% | | 2.00 | 12-13-2051 | | 48,200,000 | 48,237,656 |
| FNMA (12 Month LIBOR +1.58%) ± | | 2.34 | 6-1-2045 | | 2,228,251 | 2,312,392 |
| FNMA | | 2.50 | 2-1-2036 | | 10,906,574 | 11,488,668 |
| FNMA | | 2.50 | 3-1-2036 | | 8,760,858 | 9,236,988 |
| FNMA | | 2.50 | 3-1-2036 | | 14,133,381 | 14,887,883 |
| FNMA | | 2.50 | 4-1-2036 | | 3,055,554 | 3,221,560 |
The accompanying notes are an integral part of these financial statements.
Allspring Core Bond Portfolio | 27
Portfolio of investments—November 30, 2021 (unaudited)
| | | Interest
rate | Maturity
date | Principal | Value |
| Agency securities (continued) | | | | | | |
| FNMA | | 2.50% | 5-1-2036 | $ | 10,467,341 | $ 11,036,230 |
| FNMA | | 2.50 | 5-1-2036 | | 10,788,585 | 11,374,813 |
| FNMA | | 2.50 | 11-25-2044 | | 1,867,668 | 1,912,368 |
| FNMA %% | | 2.50 | 2-11-2051 | | 151,700,000 | 154,775,481 |
| FNMA %% | | 2.50 | 12-13-2051 | | 165,400,000 | 169,560,845 |
| FNMA %% | | 2.50 | 1-13-2052 | | 48,800,000 | 49,905,625 |
| FNMA (12 Month LIBOR +1.59%) ± | | 2.70 | 1-1-2046 | | 6,576,910 | 6,827,317 |
| FNMA | | 3.00 | 1-1-2043 | | 5,690,750 | 6,039,109 |
| FNMA | | 3.00 | 5-25-2048 | | 6,945,276 | 7,286,574 |
| FNMA | | 3.00 | 7-25-2049 | | 2,616,320 | 2,699,131 |
| FNMA %% | | 3.00 | 2-14-2052 | | 16,000,000 | 16,571,076 |
| FNMA | | 3.00 | 12-1-2054 | | 24,147,118 | 25,573,127 |
| FNMA | | 3.00 | 2-1-2055 | | 2,371,958 | 2,496,552 |
| FNMA | | 3.00 | 7-1-2060 | | 31,903,510 | 33,985,757 |
| FNMA | | 3.00 | 7-1-2060 | | 24,264,627 | 25,648,346 |
| FNMA | | 4.00 | 9-1-2033 | | 1,977,725 | 2,103,621 |
| FNMA | | 4.00 | 12-1-2036 | | 233,584 | 254,908 |
| FNMA | | 4.00 | 10-1-2037 | | 1,408,911 | 1,520,399 |
| FNMA | | 4.00 | 9-1-2045 | | 784,758 | 868,514 |
| FNMA | | 4.00 | 1-1-2046 | | 5,464,579 | 6,071,735 |
| FNMA | | 4.00 | 2-1-2047 | | 2,797,830 | 3,063,791 |
| FNMA | | 4.00 | 4-1-2047 | | 630,450 | 694,709 |
| FNMA | | 4.00 | 4-1-2047 | | 515,258 | 571,090 |
| FNMA | | 4.00 | 4-1-2047 | | 357,523 | 383,106 |
| FNMA | | 4.00 | 10-1-2047 | | 597,077 | 662,044 |
| FNMA | | 4.00 | 10-1-2047 | | 510,760 | 562,012 |
| FNMA | | 4.00 | 7-1-2048 | | 17,583,829 | 19,249,267 |
| FNMA | | 4.00 | 9-1-2048 | | 3,643,066 | 3,960,132 |
| FNMA | | 4.00 | 10-1-2048 | | 3,050,956 | 3,326,689 |
| FNMA | | 4.00 | 11-1-2048 | | 3,354,954 | 3,665,211 |
| FNMA | | 4.00 | 12-1-2048 | | 2,893,973 | 3,211,854 |
| FNMA | | 4.00 | 2-1-2049 | | 3,235,202 | 3,547,888 |
| FNMA | | 4.00 | 5-1-2049 | | 373,623 | 405,129 |
| FNMA | | 4.00 | 5-1-2049 | | 2,505,981 | 2,764,255 |
| FNMA | | 4.00 | 12-1-2049 | | 2,797,986 | 3,063,293 |
| FNMA | | 4.00 | 8-1-2059 | | 3,308,612 | 3,697,742 |
| FNMA | | 4.50 | 5-1-2034 | | 936,588 | 1,030,866 |
| FNMA | | 4.50 | 6-1-2041 | | 203,633 | 227,473 |
| FNMA | | 4.50 | 3-1-2043 | | 2,627,262 | 2,932,640 |
| FNMA | | 4.50 | 10-1-2045 | | 4,037,123 | 4,506,685 |
| FNMA | | 4.50 | 2-1-2046 | | 93,450 | 103,539 |
| FNMA | | 4.50 | 7-1-2048 | | 4,529,158 | 5,040,979 |
| FNMA | | 4.50 | 8-1-2048 | | 5,884,182 | 6,540,395 |
| FNMA | | 4.50 | 10-1-2048 | | 5,293,655 | 5,850,040 |
| FNMA | | 4.50 | 11-1-2048 | | 1,949,010 | 2,189,231 |
| FNMA | | 4.50 | 1-1-2049 | | 9,832,851 | 10,911,278 |
| FNMA | | 4.50 | 2-1-2049 | | 5,364,842 | 5,931,445 |
| FNMA | | 4.50 | 6-1-2049 | | 4,178,791 | 4,640,225 |
| FNMA | | 4.50 | 7-1-2049 | | 4,325,441 | 4,805,463 |
| FNMA | | 4.50 | 8-1-2049 | | 4,040,222 | 4,470,917 |
| FNMA | | 4.50 | 4-1-2050 | | 2,961,728 | 3,334,690 |
| FNMA | | 5.00 | 7-1-2044 | | 264,878 | 294,496 |
| FNMA | | 5.00 | 10-1-2048 | | 73,566 | 83,287 |
| FNMA | | 5.00 | 12-1-2048 | | 2,932,578 | 3,265,859 |
| FNMA | | 5.00 | 6-1-2049 | | 21,793,142 | 24,416,816 |
The accompanying notes are an integral part of these financial statements.
28 | Allspring Core Bond Portfolio
Portfolio of investments—November 30, 2021 (unaudited)
| | | Interest
rate | Maturity
date | Principal | Value |
| Agency securities (continued) | | | | | | |
| FNMA | | 5.00% | 8-1-2049 | $ | 28,962,408 | $ 32,834,094 |
| FNMA | | 5.00 | 8-1-2049 | | 13,752,926 | 15,488,321 |
| FNMA | | 5.00 | 11-1-2049 | | 4,184,519 | 4,649,873 |
| FNMA | | 5.50 | 12-1-2048 | | 3,585,196 | 4,119,405 |
| FNMA | | 5.50 | 6-1-2049 | | 9,831,120 | 11,311,736 |
| FNMA | | 6.00 | 4-1-2022 | | 165 | 183 |
| FNMA | | 6.00 | 2-1-2029 | | 1,623 | 1,807 |
| FNMA | | 6.00 | 3-1-2033 | | 21,012 | 24,129 |
| FNMA | | 6.00 | 11-1-2033 | | 6,936 | 8,046 |
| FNMA | | 2.50 | 12-1-2035 | | 15,326,330 | 16,158,629 |
| FNMA | | 2.50 | 6-1-2036 | | 9,803,675 | 10,336,323 |
| FNMA Series 2017-13 Class PA | | 3.00 | 8-25-2046 | | 3,173,335 | 3,291,729 |
| FNMA Series 2017-M7 Class A2 ±± | | 2.96 | 2-25-2027 | | 1,760,000 | 1,871,860 |
| FNMA Series 2018-14 Class KC | | 3.00 | 3-25-2048 | | 3,400,706 | 3,576,942 |
| FNMA Series 2018-15 Class AB | | 3.00 | 3-25-2048 | | 1,277,579 | 1,343,202 |
| FNMA Series 2018-8 Class KL | | 2.50 | 3-25-2047 | | 3,435,272 | 3,529,318 |
| FNMA Series 2019-15 Class AB | | 3.50 | 5-25-2053 | | 7,471,551 | 8,030,939 |
| FNMA Series 2020-48 Class AB | | 2.00 | 7-25-2050 | | 5,078,938 | 5,161,914 |
| FNMA Series 2020-48 Class DA | | 2.00 | 7-25-2050 | | 11,869,646 | 11,919,143 |
| FNMA Series 2021-27 Class EC | | 1.50 | 5-25-2051 | | 13,566,722 | 13,460,952 |
| FNMA Series 2021-78 Class ND | | 1.50 | 11-25-2051 | | 7,422,826 | 7,445,170 |
| FNMA Series 414 Class A35 | | 3.50 | 10-25-2042 | | 6,727,788 | 7,236,429 |
| GNMA | | 2.50 | 9-20-2051 | | 32,239,126 | 33,162,520 |
| GNMA | | 3.00 | 10-20-2051 | | 36,257,450 | 37,745,891 |
| GNMA | | 3.50 | 1-20-2048 | | 3,294,371 | 3,520,531 |
| GNMA | | 3.50 | 3-20-2049 | | 2,274,045 | 2,412,162 |
| GNMA | | 4.00 | 6-20-2047 | | 23,567,314 | 25,157,716 |
| GNMA | | 4.00 | 3-20-2048 | | 753,019 | 808,779 |
| GNMA | | 4.00 | 4-20-2048 | | 1,169,956 | 1,252,830 |
| GNMA | | 4.00 | 4-20-2048 | | 1,001,788 | 1,081,828 |
| GNMA | | 4.00 | 4-20-2048 | | 908,364 | 984,533 |
| GNMA | | 4.00 | 5-20-2049 | | 1,396,650 | 1,488,030 |
| GNMA | | 4.00 | 6-20-2049 | | 3,136,784 | 3,334,460 |
| GNMA | | 4.00 | 7-20-2049 | | 3,237,929 | 3,492,790 |
| GNMA | | 4.50 | 8-15-2047 | | 530,234 | 594,250 |
| GNMA | | 4.50 | 6-20-2048 | | 4,044,370 | 4,310,817 |
| GNMA | | 4.50 | 2-20-2049 | | 4,352,885 | 4,821,098 |
| GNMA | | 4.50 | 3-20-2049 | | 361,905 | 390,845 |
| GNMA | | 4.50 | 4-20-2049 | | 473,183 | 505,769 |
| GNMA | | 4.50 | 5-20-2049 | | 971,417 | 1,038,736 |
| GNMA | | 4.50 | 5-20-2049 | | 589,595 | 630,117 |
| GNMA | | 5.00 | 12-20-2039 | | 132,388 | 147,480 |
| GNMA | | 5.00 | 3-20-2048 | | 7,112,242 | 7,808,683 |
| GNMA | | 5.00 | 5-20-2048 | | 3,304,124 | 3,573,719 |
| GNMA | | 5.00 | 6-20-2048 | | 12,454,850 | 13,441,573 |
| GNMA | | 5.00 | 7-20-2048 | | 2,200,250 | 2,377,850 |
| GNMA | | 5.00 | 8-20-2048 | | 3,494,168 | 3,782,650 |
| GNMA | | 5.00 | 12-20-2048 | | 3,482,526 | 3,749,855 |
| GNMA | | 5.00 | 1-20-2049 | | 663,598 | 712,191 |
| GNMA | | 5.00 | 1-20-2049 | | 3,485,138 | 3,802,129 |
| GNMA | | 5.00 | 2-20-2049 | | 483,664 | 533,333 |
| GNMA | | 5.00 | 3-20-2049 | | 955,765 | 1,051,234 |
| GNMA | | 2.50 | 7-20-2051 | | 32,770,585 | 33,709,201 |
| GNMA Series 2012-141 Class WA ±± | | 4.53 | 11-16-2041 | | 999,655 | 1,101,590 |
| GNMA Series 2017-167 Class BQ | | 2.50 | 8-20-2044 | | 3,693,983 | 3,780,589 |
The accompanying notes are an integral part of these financial statements.
Allspring Core Bond Portfolio | 29
Portfolio of investments—November 30, 2021 (unaudited)
| | | Interest
rate | Maturity
date | Principal | Value |
| Agency securities (continued) | | | | | | |
| GNMA Series 2018-11 Class PC | | 2.75% | 12-20-2047 | $ | 4,197,881 | $ 4,281,997 |
| GNMA Series 2019-132 Class NA | | 3.50 | 9-20-2049 | | 3,643,368 | 3,829,004 |
| GNMA Series 2021-23 Class MG | | 1.50 | 2-20-2051 | | 9,719,214 | 9,608,950 |
| Total Agency securities (Cost $1,448,541,174) | | | | | | 1,460,611,794 |
| Asset-backed securities: 8.00% | | | | | | |
| American Express Credit Account Master Trust Series 2021-1 Class A | | 0.90 | 11-16-2026 | | 17,380,000 | 17,296,164 |
| AmeriCredit Automobile Receivables Series 2020-2 Class A2 | | 0.60 | 12-18-2023 | | 1,545,261 | 1,545,937 |
| Avis Budget Rental Car Funding LLC Series 2019-3A Class A1 144A | | 2.36 | 3-20-2026 | | 3,825,000 | 3,928,256 |
| Avis Budget Rental Car Funding LLC Series 2020-1A Class A 144A | | 2.33 | 8-20-2026 | | 1,721,000 | 1,773,160 |
| Avis Budget Rental Car Funding LLC Series 2021 2A Class A 144A | | 1.66 | 2-20-2028 | | 7,680,000 | 7,649,997 |
| Blackstone Secured Lending Fund 144A | | 2.85 | 9-30-2028 | | 4,403,000 | 4,269,921 |
| Captial One Multi-Asset Execution Trust Series 2021-A2 Class A2 | | 1.39 | 7-15-2030 | | 9,776,000 | 9,638,287 |
| College Avenue Student Loan Trust Series 2017-A Class A1 (1 Month LIBOR +1.65%) 144A± | | 1.74 | 11-26-2046 | | 2,097,912 | 2,121,740 |
| College Avenue Student Loan Trust Series 2018-A Class A2 144A | | 4.13 | 12-26-2047 | | 1,654,796 | 1,720,477 |
| College Avenue Student Loan Trust Series 2019- A Class A2 144A | | 3.28 | 12-28-2048 | | 2,725,993 | 2,795,942 |
| College Avenue Student Loan Trust Series 2021-A Class-A2 144A | | 1.60 | 7-25-2051 | | 3,784,522 | 3,718,184 |
| Ford Credit Auto Owner Trust Series 2018-1 Class A 144A | | 3.19 | 7-15-2031 | | 3,524,000 | 3,722,043 |
| Hertz Vehicle Financing LLC Series 2021-2A Class A 144A | | 1.68 | 12-27-2027 | | 6,693,000 | 6,673,309 |
| Hyundai Auto Receivables Trust Series 2021-C Class A4 | | 1.03 | 12-15-2027 | | 2,976,000 | 2,958,831 |
| Mercedes Benz Auto Receivables Series 2021-1 Class A3 | | 0.46 | 6-15-2026 | | 4,523,000 | 4,479,352 |
| Navient Student Loan Trust Series 2014-AA Class A3 (1 Month LIBOR +1.60%) 144A± | | 1.69 | 10-15-2031 | | 2,622,000 | 2,665,341 |
| Navient Student Loan Trust Series 2016-AA Class A2B (1 Month LIBOR +2.15%) 144A± | | 2.24 | 12-15-2045 | | 1,493,457 | 1,532,402 |
| Navient Student Loan Trust Series 2018-CA Class A2 144A | | 3.52 | 6-16-2042 | | 600,350 | 609,929 |
| Navient Student Loan Trust Series 2018-DA Class A2A 144A | | 4.00 | 12-15-2059 | | 4,273,489 | 4,472,579 |
| Navient Student Loan Trust Series 2019-A Class A2A 144A | | 3.42 | 1-15-2043 | | 5,554,014 | 5,666,614 |
| Navient Student Loan Trust Series 2019-BA Class A2A 144A | | 3.39 | 12-15-2059 | | 6,718,960 | 6,928,274 |
| Navient Student Loan Trust Series 2019-CA Class A2 144A | | 3.13 | 2-15-2068 | | 4,449,209 | 4,548,590 |
| Navient Student Loan Trust Series 2019-D Class A2A 144A | | 3.01 | 12-15-2059 | | 8,329,888 | 8,597,376 |
| Navient Student Loan Trust Series 2019-FA Class A2 144A | | 2.60 | 8-15-2068 | | 5,121,173 | 5,217,397 |
| Navient Student Loan Trust Series 2019-GA Class A 144A | | 2.40 | 10-15-2068 | | 2,530,325 | 2,571,523 |
| Navient Student Loan Trust Series 2020-BA ClassA2 144A | | 2.12 | 1-15-2069 | | 3,341,420 | 3,382,152 |
The accompanying notes are an integral part of these financial statements.
30 | Allspring Core Bond Portfolio
Portfolio of investments—November 30, 2021 (unaudited)
| | | Interest
rate | Maturity
date | Principal | Value |
| Asset-backed securities (continued) | | | | | | |
| Navient Student Loan Trust Series 2020-GA Class A 144A | | 1.17% | 9-16-2069 | $ | 5,786,373 | $ 5,766,653 |
| Navient Student Loan Trust Series 2020-HA Class A 144A | | 1.31 | 1-15-2069 | | 3,028,985 | 3,019,714 |
| Navient Student Loan Trust Series 2020-IA Class A1A 144A | | 1.33 | 4-15-2069 | | 11,207,741 | 11,076,852 |
| Navient Student Loan Trust Series 2021 Class A 144A | | 0.97 | 12-16-2069 | | 12,637,555 | 12,459,200 |
| Navient Student Loan Trust Series 2021-3A Class A1A 144A | | 1.77 | 8-25-2070 | | 6,785,000 | 6,735,994 |
| Navient Student Loan Trust Series 2021-A Class A 144A | | 0.84 | 5-15-2069 | | 1,337,846 | 1,321,606 |
| Navient Student Loan Trust Series 2021-BA Class A 144A | | 0.94 | 7-15-2069 | | 1,863,876 | 1,848,411 |
| Navient Student Loan Trust Series 2021-CA Class A 144A | | 1.06 | 10-15-2069 | | 7,712,481 | 7,629,823 |
| Navient Student Loan Trust Series 2021-FA Class A 144A | | 1.11 | 2-18-2070 | | 13,970,326 | 13,776,719 |
| Navient Student Loan Trust Series 2021-GA Class A 144A | | 1.58 | 4-15-2070 | | 6,023,000 | 6,013,240 |
| Nelnet Student Loan Trust Series 2004-4 Class A5 (3 Month LIBOR +0.16%) ± | | 0.28 | 1-25-2037 | | 4,018,026 | 3,961,897 |
| Nelnet Student Loan Trust Series 2004-5 Class A5 (3 Month LIBOR +0.18%) ± | | 0.30 | 10-27-2036 | | 1,985,650 | 1,957,614 |
| Nelnet Student Loan Trust Series 2005-1 Class A5 (3 Month LIBOR +0.11%) ± | | 0.23 | 10-25-2033 | | 16,077,111 | 15,870,933 |
| Nelnet Student Loan Trust Series 2005-2 Class A5 (3 Month LIBOR +0.10%) ± | | 0.23 | 3-23-2037 | | 15,799,914 | 15,558,335 |
| Nelnet Student Loan Trust Series 2005-3 Class A5 (3 Month LIBOR +0.12%) ± | | 0.25 | 12-24-2035 | | 11,898,435 | 11,772,252 |
| Nelnet Student Loan Trust Series 2005-4 Class A4 (3 Month LIBOR +0.18%) ± | | 0.31 | 3-22-2032 | | 2,918,708 | 2,835,351 |
| Santander Drive Auto Receivables Trust Series 2020-1 Class A3 | | 2.03 | 2-15-2024 | | 383,552 | 383,788 |
| Santander Drive Auto Receivables Trust Series 2020-3 Class A3 | | 0.52 | 7-15-2024 | | 1,703,510 | 1,704,047 |
| Santander Drive Auto Receivables Trust Series 2020-4 Class A3 | | 0.48 | 7-15-2024 | | 2,726,237 | 2,726,902 |
| SLM Student Loan Trust Series 2003-1 Class A5C (3 Month LIBOR +0.75%) 144A± | | 0.87 | 12-15-2032 | | 2,868,148 | 2,833,295 |
| SLM Student Loan Trust Series 2003-10A Class A4 (3 Month LIBOR +0.67%) 144A± | | 0.79 | 12-17-2068 | | 8,967,000 | 8,968,245 |
| SLM Student Loan Trust Series 2007-2 Class A4 (3 Month LIBOR +0.06%) ± | | 0.18 | 7-25-2022 | | 14,681,678 | 14,252,985 |
| SLM Student Loan Trust Series 2010-1 Class A (1 Month LIBOR +0.40%) ± | | 0.49 | 3-25-2025 | | 1,330,359 | 1,308,688 |
| SLM Student Loan Trust Series 2012-1 Class A3 (1 Month LIBOR +0.95%) ± | | 1.04 | 9-25-2028 | | 9,936,137 | 9,847,178 |
| SLM Student Loan Trust Series 2012-2 Class A (1 Month LIBOR +0.70%) ± | | 0.79 | 1-25-2029 | | 8,366,299 | 8,229,873 |
| SLM Student Loan Trust Series 2012-6 Class A3 (1 Month LIBOR +0.75%) ± | | 0.84 | 5-26-2026 | | 2,213,352 | 2,173,567 |
| SMB Private Education Loan Trust Series 2015-B Class A2A 144A | | 2.98 | 7-15-2027 | | 73,939 | 74,280 |
| SMB Private Education Loan Trust Series 2016-A Class A2A 144A | | 2.70 | 5-15-2031 | | 4,372,169 | 4,441,051 |
| SMB Private Education Loan Trust Series 2016-B Class A2A 144A | | 2.43 | 2-17-2032 | | 2,162,458 | 2,196,517 |
The accompanying notes are an integral part of these financial statements.
Allspring Core Bond Portfolio | 31
Portfolio of investments—November 30, 2021 (unaudited)
| | | Interest
rate | Maturity
date | Principal | Value |
| Asset-backed securities (continued) | | | | | | |
| SMB Private Education Loan Trust Series 2016-B Class A2B (1 Month LIBOR +1.45%) 144A± | | 1.54% | 2-17-2032 | $ | 1,685,722 | $ 1,706,029 |
| SMB Private Education Loan Trust Series 2016-C Class A2B (1 Month LIBOR +1.10%) 144A± | | 1.19 | 9-15-2034 | | 1,923,249 | 1,932,270 |
| SMB Private Education Loan Trust Series 2018-C Class A2A 144A | | 3.63 | 11-15-2035 | | 2,762,794 | 2,875,385 |
| SMB Private Education Loan Trust Series 2019-A Class A2A 144A | | 3.44 | 7-15-2036 | | 10,300,353 | 10,603,774 |
| SMB Private Education Loan Trust Series 2020-BA Class A1A 144A | | 1.29 | 7-15-2053 | | 6,597,860 | 6,542,611 |
| SMB Private Education Loan Trust Series 2020-PTA Class A2A 144A | | 1.60 | 9-15-2054 | | 6,321,174 | 6,305,307 |
| SMB Private Education Loan Trust Series 2020-PTB Class A2A 144A | | 1.60 | 9-15-2054 | | 19,110,522 | 18,895,198 |
| SMB Private Education Loan Trust Series 2021-A Class APT1 144A | | 1.07 | 1-15-2053 | | 19,780,374 | 19,252,740 |
| SMB Private Education Loan Trust Series 2021-B Class A 144A | | 1.31 | 7-17-2051 | | 8,250,452 | 8,221,564 |
| SMB Private Education Loan Trust Series 2021-D Class A1A 144A | | 1.34 | 3-17-2053 | | 12,179,118 | 12,019,423 |
| SMB Private Education Loan Trust Series 2021-E Class A1A 144A | | 1.68 | 2-15-2051 | | 8,559,000 | 8,510,171 |
| SMB Private Education Loan Trust Series 2053 Class 1 (1 Month LIBOR +0.80%) 144A± | | 0.89 | 1-15-2053 | | 6,986,000 | 6,976,663 |
| SoFi Professional Loan Program LLC Series 2016-A Class A2 144A | | 2.76 | 12-26-2036 | | 861,899 | 866,209 |
| SoFi Professional Loan Program LLC Series 2016-E Class A1 (1 Month LIBOR +0.85%) 144A± | | 0.94 | 7-25-2039 | | 171,525 | 171,711 |
| SoFi Professional Loan Program LLC Series 2017-A Class A1 (1 Month LIBOR +0.70%) 144A± | | 0.79 | 3-26-2040 | | 230,158 | 230,389 |
| SoFi Professional Loan Program LLC Series 2017-D Class A2 144A | | 2.65 | 9-25-2040 | | 209,207 | 212,629 |
| SoFi Professional Loan Program LLC Series 2017-E Class A1 (1 Month LIBOR +0.50%) 144A± | | 0.59 | 11-26-2040 | | 80,406 | 80,427 |
| SoFi Professional Loan Program LLC Series 2017-E Class A2B 144A | | 2.72 | 11-26-2040 | | 770,703 | 780,341 |
| SoFi Professional Loan Program LLC Series 2018-A Class A2B 144A | | 2.95 | 2-25-2042 | | 1,422,065 | 1,444,449 |
| SoFi Professional Loan Program LLC Series 2018-B Class A2FX 144A | | 3.34 | 8-25-2047 | | 3,302,151 | 3,364,454 |
| SoFi Professional Loan Program LLC Series 2020-C Class AFX 144A | | 1.95 | 2-15-2046 | | 2,801,284 | 2,826,627 |
| SoFi Professional Loan Program LLC Series 2021-A Class AFX 144A | | 1.03 | 8-17-2043 | | 2,325,512 | 2,296,863 |
| SoFi Professional Loan Program LLC Series 2021-B Class AFX 144A | | 1.14 | 2-15-2047 | | 5,108,777 | 5,056,399 |
| Toyota Auto Loan Extended Note Series 2021-1A Class A 144A | | 1.07 | 2-27-2034 | | 7,837,000 | 7,717,233 |
| Toyota Auto Receivables Owner Trust Series 2021-D Class A4 | | 1.02 | 3-15-2027 | | 3,197,000 | 3,176,728 |
| Triton Container Finance LLC Series 2020-1A Class A 144A | | 2.11 | 9-20-2045 | | 2,265,596 | 2,249,084 |
| Total Asset-backed securities (Cost $436,765,289) | | | | | | 435,543,465 |
The accompanying notes are an integral part of these financial statements.
32 | Allspring Core Bond Portfolio
Portfolio of investments—November 30, 2021 (unaudited)
| | | Interest
rate | Maturity
date | Principal | Value |
| Corporate bonds and notes: 24.97% | | | | | | |
| Communication services: 2.42% | | | | | | |
| Diversified telecommunication services: 1.60% | | | | | | |
| AT&T Incorporated | | 2.25% | 2-1-2032 | $ | 1,392,000 | $ 1,343,252 |
| AT&T Incorporated | | 3.10 | 2-1-2043 | | 856,000 | 826,069 |
| AT&T Incorporated | | 3.50 | 6-1-2041 | | 1,807,000 | 1,856,518 |
| AT&T Incorporated | | 3.50 | 9-15-2053 | | 7,253,000 | 7,326,374 |
| AT&T Incorporated | | 3.55 | 9-15-2055 | | 1,772,000 | 1,781,279 |
| AT&T Incorporated | | 3.65 | 6-1-2051 | | 1,357,000 | 1,408,940 |
| AT&T Incorporated | | 3.65 | 9-15-2059 | | 3,562,000 | 3,605,568 |
| AT&T Incorporated | | 3.80 | 12-1-2057 | | 3,242,000 | 3,385,686 |
| T-Mobile USA Incorporated | | 2.25 | 2-15-2026 | | 3,916,000 | 3,868,891 |
| T-Mobile USA Incorporated 144A | | 2.25 | 2-15-2026 | | 17,360,000 | 17,151,159 |
| T-Mobile USA Incorporated | | 2.88 | 2-15-2031 | | 1,150,000 | 1,112,637 |
| T-Mobile USA Incorporated 144A | | 3.38 | 4-15-2029 | | 8,464,000 | 8,516,900 |
| T-Mobile USA Incorporated 144A | | 3.50 | 4-15-2031 | | 6,242,000 | 6,344,119 |
| Verizon Communications Incorporated | | 2.55 | 3-21-2031 | | 1,617,000 | 1,634,347 |
| Verizon Communications Incorporated | | 2.65 | 11-20-2040 | | 7,106,000 | 6,784,311 |
| Verizon Communications Incorporated | | 2.88 | 11-20-2050 | | 1,366,000 | 1,330,830 |
| Verizon Communications Incorporated | | 3.40 | 3-22-2041 | | 3,415,000 | 3,629,939 |
| Verizon Communications Incorporated | | 3.55 | 3-22-2051 | | 3,968,000 | 4,350,943 |
| Verizon Communications Incorporated | | 3.70 | 3-22-2061 | | 2,481,000 | 2,740,736 |
| Verizon Communications Incorporated | | 4.33 | 9-21-2028 | | 1,176,000 | 1,339,428 |
| Verizon Communications Incorporated | | 1.68 | 10-30-2030 | | 3,398,000 | 3,207,040 |
| Verizon Communications Incorporated 144A | | 2.36 | 3-15-2032 | | 3,380,000 | 3,345,512 |
| | | | | | | 86,890,478 |
| Entertainment: 0.13% | | | | | | |
| Netflix Incorporated 144A | | 3.63 | 6-15-2025 | | 3,017,000 | 3,182,935 |
| Netflix Incorporated | | 5.88 | 11-15-2028 | | 3,242,000 | 3,880,285 |
| | | | | | | 7,063,220 |
| Media: 0.69% | | | | | | |
| Charter Communications Operating LLC | | 2.25 | 1-15-2029 | | 8,181,000 | 7,928,967 |
| Charter Communications Operating LLC | | 3.50 | 6-1-2041 | | 3,694,000 | 3,617,388 |
| Charter Communications Operating LLC | | 3.50 | 3-1-2042 | | 4,119,000 | 3,985,413 |
| Charter Communications Operating LLC | | 3.90 | 6-1-2052 | | 3,579,000 | 3,616,188 |
| Charter Communications Operating LLC | | 4.40 | 12-1-2061 | | 2,604,000 | 2,713,947 |
| Charter Communications Operating LLC | | 4.46 | 7-23-2022 | | 1,617,000 | 1,645,566 |
| Charter Communications Operating LLC | | 4.80 | 3-1-2050 | | 3,320,000 | 3,739,632 |
| Comcast Corporation | | 1.50 | 2-15-2031 | | 4,392,000 | 4,129,177 |
| Comcast Corporation | | 3.75 | 4-1-2040 | | 2,066,000 | 2,327,671 |
| Discovery Communications LLC | | 4.00 | 9-15-2055 | | 746,000 | 798,639 |
| ViacomCBS Incorporated | | 4.95 | 1-15-2031 | | 942,000 | 1,117,667 |
| ViacomCBS Incorporated | | 4.95 | 5-19-2050 | | 1,643,000 | 2,075,150 |
| | | | | | | 37,695,405 |
| Consumer discretionary: 1.70% | | | | | | |
| Automobiles: 0.16% | | | | | | |
| Ford Motor Company | | 3.63 | 6-17-2031 | | 7,278,000 | 7,423,560 |
| Ford Motor Company | | 4.75 | 1-15-2043 | | 1,402,000 | 1,500,140 |
| | | | | | | 8,923,700 |
The accompanying notes are an integral part of these financial statements.
Allspring Core Bond Portfolio | 33
Portfolio of investments—November 30, 2021 (unaudited)
| | | Interest
rate | Maturity
date | Principal | Value |
| Diversified consumer services: 0.15% | | | | | | |
| Sodexo Incorporated 144A | | 1.63% | 4-16-2026 | $ | 4,630,000 | $ 4,598,308 |
| Yale University | | 0.87 | 4-15-2025 | | 830,000 | 827,116 |
| Yale University | | 1.48 | 4-15-2030 | | 2,594,000 | 2,543,239 |
| | | | | | | 7,968,663 |
| Hotels, restaurants & leisure: 0.41% | | | | | | |
| GLP Capital LP | | 5.30 | 1-15-2029 | | 1,712,000 | 1,953,854 |
| Marriott International Incorporated | | 2.85 | 4-15-2031 | | 4,167,000 | 4,185,166 |
| Marriott International Incorporated | | 3.50 | 10-15-2032 | | 2,550,000 | 2,682,512 |
| Marriott International Incorporated | | 4.63 | 6-15-2030 | | 6,027,000 | 6,783,406 |
| Marriott International Incorporated | | 5.75 | 5-1-2025 | | 1,043,000 | 1,177,142 |
| Starbucks Corporation | | 1.30 | 5-7-2022 | | 2,153,000 | 2,160,666 |
| Starbucks Corporation | | 3.50 | 11-15-2050 | | 3,372,000 | 3,642,359 |
| | | | | | | 22,585,105 |
| Internet & direct marketing retail: 0.59% | | | | | | |
| Amazon.com Incorporated | | 1.00 | 5-12-2026 | | 11,550,000 | 11,413,026 |
| Amazon.com Incorporated | | 1.65 | 5-12-2028 | | 5,204,000 | 5,179,402 |
| Amazon.com Incorporated | | 2.10 | 5-12-2031 | | 8,127,000 | 8,165,477 |
| Amazon.com Incorporated | | 2.70 | 6-3-2060 | | 787,000 | 766,651 |
| Amazon.com Incorporated | | 3.10 | 5-12-2051 | | 4,107,000 | 4,438,652 |
| Amazon.com Incorporated | | 3.25 | 5-12-2061 | | 1,755,000 | 1,937,484 |
| | | | | | | 31,900,692 |
| Specialty retail: 0.30% | | | | | | |
| Advance Auto Parts Company | | 3.90 | 4-15-2030 | | 6,751,000 | 7,407,402 |
| AutoNation Incorporated | | 4.75 | 6-1-2030 | | 1,701,000 | 1,967,655 |
| Home Depot Incorporated | | 2.38 | 3-15-2051 | | 2,705,000 | 2,515,177 |
| Home Depot Incorporated | | 3.13 | 12-15-2049 | | 3,285,000 | 3,512,108 |
| Home Depot Incorporated | | 3.30 | 4-15-2040 | | 700,000 | 757,504 |
| | | | | | | 16,159,846 |
| Textiles, apparel & luxury goods: 0.09% | | | | | | |
| Tapestry Incorporated %% | | 3.05 | 3-15-2032 | | 4,706,000 | 4,756,728 |
| Consumer staples: 0.91% | | | | | | |
| Beverages: 0.50% | | | | | | |
| Anheuser-Busch InBev Worldwide Incorporated | | 3.50 | 6-1-2030 | | 1,694,000 | 1,852,565 |
| Anheuser-Busch InBev Worldwide Incorporated | | 3.75 | 7-15-2042 | | 1,548,000 | 1,692,650 |
| Anheuser-Busch InBev Worldwide Incorporated | | 4.38 | 4-15-2038 | | 5,032,000 | 5,860,858 |
| Anheuser-Busch InBev Worldwide Incorporated | | 4.70 | 2-1-2036 | | 4,790,000 | 5,759,975 |
| Anheuser-Busch InBev Worldwide Incorporated | | 4.90 | 2-1-2046 | | 4,297,000 | 5,454,891 |
| Molson Coors Beverage Company | | 4.20 | 7-15-2046 | | 5,879,000 | 6,510,572 |
| | | | | | | 27,131,511 |
| Food & staples retailing: 0.03% | | | | | | |
| Walmart Incorporated | | 2.50 | 9-22-2041 | | 1,357,000 | 1,389,763 |
| Personal products: 0.09% | | | | | | |
| Estee Lauder Incorporated | | 1.95 | 3-15-2031 | | 5,092,000 | 5,083,406 |
| Tobacco: 0.29% | | | | | | |
| Altria Group Incorporated | | 2.35 | 5-6-2025 | | 736,000 | 756,378 |
| Altria Group Incorporated | | 2.45 | 2-4-2032 | | 1,997,000 | 1,879,932 |
The accompanying notes are an integral part of these financial statements.
34 | Allspring Core Bond Portfolio
Portfolio of investments—November 30, 2021 (unaudited)
| | | Interest
rate | Maturity
date | Principal | Value |
| Tobacco (continued) | | | | | | |
| Altria Group Incorporated | | 3.40% | 2-4-2041 | $ | 3,994,000 | $ 3,696,088 |
| BAT Capital Corporation | | 2.26 | 3-25-2028 | | 908,000 | 887,033 |
| BAT Capital Corporation | | 2.73 | 3-25-2031 | | 7,928,000 | 7,668,013 |
| BAT Capital Corporation | | 4.39 | 8-15-2037 | | 899,000 | 954,603 |
| | | | | | | 15,842,047 |
| Energy: 0.82% | | | | | | |
| Oil, gas & consumable fuels: 0.82% | | | | | | |
| BP Capital Markets America Incorporated | | 2.77 | 11-10-2050 | | 2,550,000 | 2,408,357 |
| BP Capital Markets America Incorporated | | 3.38 | 2-8-2061 | | 3,960,000 | 4,088,655 |
| Devon Energy Corporation | | 4.75 | 5-15-2042 | | 890,000 | 1,017,964 |
| Devon Energy Corporation | | 5.00 | 6-15-2045 | | 3,130,000 | 3,773,341 |
| Diamondback Energy Incorporated | | 4.40 | 3-24-2051 | | 1,444,000 | 1,637,588 |
| Enable Midstream Partners | | 4.15 | 9-15-2029 | | 1,988,000 | 2,140,857 |
| Enable Midstream Partners | | 4.40 | 3-15-2027 | | 3,354,000 | 3,625,458 |
| Enable Midstream Partners | | 4.95 | 5-15-2028 | | 5,689,000 | 6,338,968 |
| Enable Midstream Partners | | 5.00 | 5-15-2044 | | 752,000 | 811,700 |
| Energy Transfer Operating Partners LP | | 5.15 | 3-15-2045 | | 1,712,000 | 1,953,062 |
| Energy Transfer Operating Partners LP | | 5.30 | 4-15-2047 | | 4,461,000 | 5,156,551 |
| Energy Transfer Operating Partners LP | | 6.00 | 6-15-2048 | | 692,000 | 868,616 |
| Energy Transfer Operating Partners LP | | 6.05 | 6-1-2041 | | 788,000 | 966,087 |
| Energy Transfer Operating Partners LP | | 6.10 | 2-15-2042 | | 882,000 | 1,088,032 |
| Energy Transfer Operating Partners LP | | 6.13 | 12-15-2045 | | 1,513,000 | 1,898,332 |
| Marathon Oil Corporation | | 5.20 | 6-1-2045 | | 1,089,000 | 1,286,380 |
| Pioneer Natural Resource | | 1.90 | 8-15-2030 | | 4,539,000 | 4,298,501 |
| Sunoco Logistics Partner LP | | 5.35 | 5-15-2045 | | 1,297,000 | 1,505,752 |
| | | | | | | 44,864,201 |
| Financials: 8.71% | | | | | | |
| Banks: 2.89% | | | | | | |
| Bank of America Corporation (U.S. SOFR +0.41%) ± | | 0.52 | 6-14-2024 | | 4,637,000 | 4,602,203 |
| Bank of America Corporation (U.S. SOFR +1.01%) ± | | 1.20 | 10-24-2026 | | 3,805,000 | 3,725,573 |
| Bank of America Corporation (U.S. SOFR +1.15%) ± | | 1.32 | 6-19-2026 | | 7,642,000 | 7,569,096 |
| Bank of America Corporation (U.S. SOFR +0.91%) ± | | 1.66 | 3-11-2027 | | 17,083,000 | 16,952,385 |
| Bank of America Corporation (U.S. SOFR +0.96%) ± | | 1.73 | 7-22-2027 | | 18,245,000 | 18,080,179 |
| Bank of America Corporation (U.S. SOFR +1.53%) ± | | 1.90 | 7-23-2031 | | 3,363,000 | 3,215,945 |
| Bank of America Corporation (U.S. SOFR +1.37%) ± | | 1.92 | 10-24-2031 | | 2,836,000 | 2,706,670 |
| Bank of America Corporation (3 Month LIBOR +0.99%) ± | | 2.50 | 2-13-2031 | | 4,764,000 | 4,772,295 |
| Bank of America Corporation (U.S. SOFR +2.15%) ± | | 2.59 | 4-29-2031 | | 5,473,000 | 5,518,373 |
| Bank of America Corporation (U.S. SOFR +1.32%) ± | | 2.69 | 4-22-2032 | | 16,711,000 | 16,922,098 |
| Bank of America Corporation (3 Month LIBOR +0.79%) ± | | 3.00 | 12-20-2023 | | 6,735,000 | 6,886,739 |
| Bank of America Corporation (U.S. SOFR +1.65%) ± | | 3.48 | 3-13-2052 | | 1,677,000 | 1,870,494 |
| Bank of America Corporation | | 3.50 | 4-19-2026 | | 866,000 | 932,574 |
| Bank of America Corporation (3 Month LIBOR +1.06%) ± | | 3.56 | 4-23-2027 | | 4,184,000 | 4,464,746 |
| Bank of America Corporation (U.S. SOFR +1.21%) ± | | 2.57 | 10-20-2032 | | 2,818,000 | 2,830,101 |
| JPMorgan Chase & Company (U.S. SOFR +0.70%) ± | | 1.04 | 2-4-2027 | | 16,962,000 | 16,460,234 |
| JPMorgan Chase & Company (U.S. SOFR +0.80%) ± | | 1.05 | 11-19-2026 | | 9,458,000 | 9,196,270 |
| JPMorgan Chase & Company (U.S. SOFR +0.77%) ± | | 1.47 | 9-22-2027 | | 10,130,000 | 9,936,099 |
| JPMorgan Chase & Company (U.S. SOFR +1.02%) ± | | 2.07 | 6-1-2029 | | 8,455,000 | 8,351,501 |
The accompanying notes are an integral part of these financial statements.
Allspring Core Bond Portfolio | 35
Portfolio of investments—November 30, 2021 (unaudited)
| | | Interest
rate | Maturity
date | Principal | Value |
| Banks (continued) | | | | | | |
| JPMorgan Chase & Company (U.S. SOFR +1.85%) ± | | 2.08% | 4-22-2026 | $ | 7,418,000 | $ 7,544,573 |
| JPMorgan Chase & Company (U.S. SOFR +1.89%) ± | | 2.18 | 6-1-2028 | | 5,196,000 | 5,207,590 |
| | | | | | | 157,745,738 |
| Capital markets: 4.07% | | | | | | |
| Ares Capital Corporation | | 3.20 | 11-15-2031 | | 5,265,000 | 5,153,384 |
| Athene Global Funding 144A | | 1.73 | 10-2-2026 | | 5,083,000 | 4,986,993 |
| Athene Global Funding 144A | | 1.99 | 8-19-2028 | | 4,236,000 | 4,108,447 |
| Athene Global Funding 144A | | 2.50 | 3-24-2028 | | 5,931,000 | 5,986,199 |
| Athene Global Funding 144A | | 2.65 | 10-4-2031 | | 5,594,000 | 5,560,990 |
| Bain Capital Specialty Finance | | 2.55 | 10-13-2026 | | 3,470,000 | 3,376,722 |
| Blackstone Private Equity Funds 144A | | 2.35 | 11-22-2024 | | 4,349,000 | 4,349,884 |
| Blackstone Private Equity Funds 144A | | 2.63 | 12-15-2026 | | 15,562,000 | 15,127,684 |
| Blackstone Private Equity Funds 144A | | 3.25 | 3-15-2027 | | 6,088,000 | 6,085,381 |
| Blue Owl Finance LLC 144A | | 4.13 | 10-7-2051 | | 728,000 | 750,717 |
| CNO Global Funding 144A | | 1.75 | 10-7-2026 | | 5,324,000 | 5,276,672 |
| Credit Suisse Group AG | | 1.25 | 8-7-2026 | | 11,017,000 | 10,746,019 |
| F&G Global Funding 144A | | 2.00 | 9-20-2028 | | 6,752,000 | 6,586,550 |
| FS KKR Capital Corporation | | 3.13 | 10-12-2028 | | 921,000 | 906,914 |
| GA Global Funding Trust 144A | | 0.80 | 9-13-2024 | | 5,923,000 | 5,833,871 |
| GA Global Funding Trust 144A | | 1.95 | 9-15-2028 | | 7,924,000 | 7,770,916 |
| GE Capital Funding LLC | | 3.45 | 5-15-2025 | | 1,960,000 | 2,091,260 |
| GE Capital Funding LLC | | 4.40 | 5-15-2030 | | 2,988,000 | 3,550,228 |
| Goldman Sachs Group Incorporated (U.S. SOFR +0.51%) ± | | 0.66 | 9-10-2024 | | 8,490,000 | 8,424,318 |
| Goldman Sachs Group Incorporated (U.S. SOFR +0.49%) ± | | 0.93 | 10-21-2024 | | 16,988,000 | 16,925,309 |
| Goldman Sachs Group Incorporated (U.S. SOFR +1.26%) ± | | 2.65 | 10-21-2032 | | 2,931,000 | 2,937,846 |
| Golub Capital LLC | | 2.50 | 8-24-2026 | | 3,851,000 | 3,794,338 |
| Morgan Stanley (U.S. SOFR +0.51%) ± | | 0.79 | 1-22-2025 | | 20,974,000 | 20,744,174 |
| Morgan Stanley (U.S. SOFR +0.53%) ± | | 0.79 | 5-30-2025 | | 17,680,000 | 17,409,645 |
| Morgan Stanley (U.S. SOFR +0.75%) ± | | 0.86 | 10-21-2025 | | 6,112,000 | 6,011,025 |
| Morgan Stanley (U.S. SOFR +0.72%) ± | | 0.99 | 12-10-2026 | | 8,628,000 | 8,344,521 |
| Morgan Stanley (U.S. SOFR +1.18%) ± | | 2.24 | 7-21-2032 | | 5,032,000 | 4,931,156 |
| Morgan Stanley (U.S. SOFR +0.56%) ± | | 1.16 | 10-21-2025 | | 12,743,000 | 12,641,594 |
| Morgan Stanley (U.S. SOFR +0.86%) ± | | 1.51 | 7-20-2027 | | 6,596,000 | 6,469,802 |
| Owl Rock Capital Corporation | | 2.88 | 6-11-2028 | | 1,772,000 | 1,731,263 |
| Owl Rock Capital Corporation 144A | | 3.13 | 4-13-2027 | | 5,775,000 | 5,659,179 |
| Owl Rock Capital Corporation | | 3.40 | 7-15-2026 | | 7,274,000 | 7,397,596 |
| | | | | | | 221,670,597 |
| Consumer finance: 1.16% | | | | | | |
| American Express Company | | 1.65 | 11-4-2026 | | 4,451,000 | 4,442,988 |
| Bunge Limited Finance Corporation | | 1.63 | 8-17-2025 | | 2,948,000 | 2,949,063 |
| Bunge Limited Finance Corporation | | 2.75 | 5-14-2031 | | 6,311,000 | 6,372,090 |
| Bunge Limited Finance Corporation | | 3.75 | 9-25-2027 | | 8,568,000 | 9,331,961 |
| Ford Motor Credit Company LLC | | 2.70 | 8-10-2026 | | 7,654,000 | 7,598,509 |
| Ford Motor Credit Company LLC | | 4.00 | 11-13-2030 | | 2,630,000 | 2,758,213 |
| Ford Motor Credit Company LLC | | 4.06 | 11-1-2024 | | 1,368,000 | 1,426,824 |
| Hyundai Capital America Company 144A | | 0.80 | 1-8-2024 | | 4,507,000 | 4,469,745 |
| Hyundai Capital America Company 144A | | 1.25 | 9-18-2023 | | 2,637,000 | 2,641,515 |
| Hyundai Capital America Company 144A | | 1.30 | 1-8-2026 | | 5,265,000 | 5,124,205 |
| Hyundai Capital America Company 144A | | 1.80 | 10-15-2025 | | 4,219,000 | 4,212,970 |
| Hyundai Capital America Company 144A | | 2.00 | 6-15-2028 | | 2,559,000 | 2,478,581 |
The accompanying notes are an integral part of these financial statements.
36 | Allspring Core Bond Portfolio
Portfolio of investments—November 30, 2021 (unaudited)
| | | Interest
rate | Maturity
date | Principal | Value |
| Consumer finance (continued) | | | | | | |
| John Deere Capital Corporation | | 0.55% | 7-5-2022 | $ | 5,187,000 | $ 5,196,724 |
| John Deere Capital Corporation | | 1.20 | 4-6-2023 | | 3,994,000 | 4,025,748 |
| | | | | | | 63,029,136 |
| Diversified financial services: 0.16% | | | | | | |
| Jackson Financial Incorporated 144A | | 3.13 | 11-23-2031 | | 4,326,000 | 4,337,659 |
| Jackson Financial Incorporated 144A | | 4.00 | 11-23-2051 | | 2,187,000 | 2,186,847 |
| The Blackstone Group 144A | | 2.85 | 8-5-2051 | | 2,189,000 | 2,155,180 |
| | | | | | | 8,679,686 |
| Insurance: 0.43% | | | | | | |
| Alleghany Corporation | | 3.25 | 8-15-2051 | | 2,559,000 | 2,616,426 |
| American International Group Incorporated | | 3.40 | 6-30-2030 | | 1,657,000 | 1,787,865 |
| American International Group Incorporated | | 4.38 | 6-30-2050 | | 910,000 | 1,147,966 |
| Brighthouse Financial Incorporated | | 3.85 | 12-22-2051 | | 1,681,000 | 1,645,688 |
| Pricoa Global Funding 1 Company 144A | | 1.20 | 9-1-2026 | | 7,746,000 | 7,616,812 |
| SBL Holdings Incorporated 144A | | 5.00 | 2-18-2031 | | 5,870,000 | 6,159,558 |
| Stewart Information Services Corporation | | 3.60 | 11-15-2031 | | 2,286,000 | 2,323,765 |
| | | | | | | 23,298,080 |
| Health care: 2.26% | | | | | | |
| Biotechnology: 0.62% | | | | | | |
| AbbVie Incorporated | | 2.30 | 11-21-2022 | | 5,282,000 | 5,361,640 |
| AbbVie Incorporated | | 4.05 | 11-21-2039 | | 1,962,000 | 2,245,237 |
| AbbVie Incorporated | | 4.25 | 11-21-2049 | | 2,689,000 | 3,234,217 |
| AbbVie Incorporated | | 4.30 | 5-14-2036 | | 1,228,000 | 1,430,441 |
| AbbVie Incorporated | | 4.45 | 5-14-2046 | | 1,245,000 | 1,511,355 |
| Amgen Incorporated | | 1.65 | 8-15-2028 | | 6,813,000 | 6,618,846 |
| Amgen Incorporated | | 3.00 | 1-15-2052 | | 1,876,000 | 1,831,844 |
| Gilead Sciences Incorporated | | 2.60 | 10-1-2040 | | 2,931,000 | 2,800,892 |
| Gilead Sciences Incorporated | | 2.80 | 10-1-2050 | | 1,941,000 | 1,885,633 |
| Gilead Sciences Incorporated | | 4.00 | 9-1-2036 | | 1,513,000 | 1,731,242 |
| Regeneron Pharmaceutical Incorporated | | 1.75 | 9-15-2030 | | 5,619,000 | 5,268,539 |
| | | | | | | 33,919,886 |
| Health care equipment & supplies: 0.04% | | | | | | |
| Danaher Corporation | | 2.60 | 10-1-2050 | | 2,016,000 | 1,964,258 |
| Health care providers & services: 1.03% | | | | | | |
| Centene Corporation | | 2.45 | 7-15-2028 | | 9,216,000 | 9,043,200 |
| Centene Corporation | | 2.50 | 3-1-2031 | | 561,000 | 537,536 |
| Centene Corporation | | 3.00 | 10-15-2030 | | 1,859,000 | 1,856,021 |
| CVS Health Corporation | | 2.70 | 8-21-2040 | | 2,671,000 | 2,556,723 |
| CVS Health Corporation | | 3.00 | 8-15-2026 | | 1,824,000 | 1,922,963 |
| CVS Health Corporation | | 3.70 | 3-9-2023 | | 621,000 | 642,224 |
| CVS Health Corporation | | 4.30 | 3-25-2028 | | 1,323,000 | 1,489,660 |
| CVS Health Corporation | | 4.78 | 3-25-2038 | | 2,663,000 | 3,244,753 |
| CVS Health Corporation | | 5.05 | 3-25-2048 | | 2,958,000 | 3,908,509 |
| HCA Incorporated | | 3.50 | 9-1-2030 | | 2,397,000 | 2,495,217 |
| HCA Incorporated | | 5.38 | 2-1-2025 | | 12,207,000 | 13,313,259 |
| HCA Incorporated | | 5.88 | 2-1-2029 | | 1,532,000 | 1,798,185 |
| Humana Incorporated | | 1.35 | 2-3-2027 | | 3,104,000 | 3,008,957 |
| UnitedHealth Group Incorporated | | 2.30 | 5-15-2031 | | 1,885,000 | 1,908,837 |
The accompanying notes are an integral part of these financial statements.
Allspring Core Bond Portfolio | 37
Portfolio of investments—November 30, 2021 (unaudited)
| | | Interest
rate | Maturity
date | Principal | Value |
| Health care providers & services (continued) | | | | | | |
| UnitedHealth Group Incorporated | | 2.75% | 5-15-2040 | $ | 1,297,000 | $ 1,306,401 |
| UnitedHealth Group Incorporated | | 2.90 | 5-15-2050 | | 3,009,000 | 3,077,037 |
| UnitedHealth Group Incorporated | | 3.05 | 5-15-2041 | | 882,000 | 919,319 |
| UnitedHealth Group Incorporated | | 3.25 | 5-15-2051 | | 2,844,000 | 3,092,587 |
| | | | | | | 56,121,388 |
| Life sciences tools & services: 0.26% | | | | | | |
| Thermo Fisher Scientific Incorporated | | 1.22 | 10-18-2024 | | 6,795,000 | 6,795,865 |
| Thermo Fisher Scientific Incorporated | | 1.75 | 10-15-2028 | | 3,216,000 | 3,161,880 |
| Thermo Fisher Scientific Incorporated | | 2.00 | 10-15-2031 | | 2,862,000 | 2,803,017 |
| Thermo Fisher Scientific Incorporated | | 2.80 | 10-15-2041 | | 1,357,000 | 1,369,565 |
| | | | | | | 14,130,327 |
| Pharmaceuticals: 0.31% | | | | | | |
| Astrazeneca Finance LLC | | 1.75 | 5-28-2028 | | 5,974,000 | 5,926,561 |
| Bristol-Myers Squibb Company | | 2.55 | 11-13-2050 | | 3,563,000 | 3,392,150 |
| Pfizer Incorporated | | 2.55 | 5-28-2040 | | 5,887,000 | 5,863,340 |
| Pfizer Incorporated | | 2.80 | 3-11-2022 | | 1,625,000 | 1,635,704 |
| | | | | | | 16,817,755 |
| Industrials: 1.30% | | | | | | |
| Aerospace & defense: 0.70% | | | | | | |
| Howmet Aerospace Incorporated | | 3.00 | 1-15-2029 | | 5,006,000 | 4,805,760 |
| Northrop Grumman Corporation | | 3.25 | 8-1-2023 | | 4,945,000 | 5,139,771 |
| Northrop Grumman Corporation | | 3.25 | 1-15-2028 | | 3,052,000 | 3,256,361 |
| The Boeing Company | | 2.20 | 2-4-2026 | | 6,415,000 | 6,401,789 |
| The Boeing Company | | 3.25 | 2-1-2028 | | 3,631,000 | 3,770,255 |
| The Boeing Company | | 3.25 | 2-1-2035 | | 2,075,000 | 2,070,214 |
| The Boeing Company | | 3.63 | 2-1-2031 | | 3,648,000 | 3,875,351 |
| The Boeing Company | | 3.75 | 2-1-2050 | | 3,709,000 | 3,845,991 |
| The Boeing Company | | 5.15 | 5-1-2030 | | 1,694,000 | 1,965,027 |
| The Boeing Company | | 5.71 | 5-1-2040 | | 1,031,000 | 1,316,791 |
| The Boeing Company | | 5.81 | 5-1-2050 | | 1,141,000 | 1,538,992 |
| | | | | | | 37,986,302 |
| Airlines: 0.33% | | | | | | |
| Delta Air Lines Incorporated 144A | | 4.50 | 10-20-2025 | | 6,873,000 | 7,205,096 |
| Delta Air Lines Incorporated 144A | | 4.75 | 10-20-2028 | | 9,977,000 | 10,932,138 |
| | | | | | | 18,137,234 |
| Construction & engineering: 0.07% | | | | | | |
| Quanta Services Incorporated | | 0.95 | 10-1-2024 | | 4,107,000 | 4,064,360 |
| Road & rail: 0.11% | | | | | | |
| Union Pacific Corporation | | 2.15 | 2-5-2027 | | 2,680,000 | 2,741,814 |
| Union Pacific Corporation | | 2.40 | 2-5-2030 | | 3,320,000 | 3,400,355 |
| | | | | | | 6,142,169 |
| Transportation infrastructure: 0.09% | | | | | | |
| Burlington Northern Santa Fe LLC %% | | 2.88 | 6-15-2052 | | 1,673,000 | 1,693,576 |
| Crowley Conro LLC | | 4.18 | 8-15-2043 | | 2,551,075 | 2,983,052 |
| | | | | | | 4,676,628 |
The accompanying notes are an integral part of these financial statements.
38 | Allspring Core Bond Portfolio
Portfolio of investments—November 30, 2021 (unaudited)
| | | Interest
rate | Maturity
date | Principal | Value |
| Information technology: 2.66% | | | | | | |
| Electronic equipment, instruments & components: 0.11% | | | | | | |
| Dell International LLC | | 4.90% | 10-1-2026 | $ | 866,000 | $ 978,139 |
| Dell International LLC | | 6.10 | 7-15-2027 | | 1,720,000 | 2,071,460 |
| Dell International LLC | | 8.35 | 7-15-2046 | | 1,816,000 | 3,032,615 |
| | | | | | | 6,082,214 |
| IT services: 0.20% | | | | | | |
| Global Payments Incorporated | | 1.50 | 11-15-2024 | | 2,523,000 | 2,518,798 |
| Global Payments Incorporated | | 2.15 | 1-15-2027 | | 5,043,000 | 5,042,039 |
| Global Payments Incorporated | | 2.90 | 11-15-2031 | | 3,361,000 | 3,401,250 |
| | | | | | | 10,962,087 |
| Semiconductors & semiconductor equipment: 0.90% | | | | | | |
| Analog Devices Incorporated | | 1.70 | 10-1-2028 | | 2,542,000 | 2,539,494 |
| Analog Devices Incorporated | | 2.10 | 10-1-2031 | | 3,380,000 | 3,385,715 |
| Broadcom Incorporated 144A | | 2.45 | 2-15-2031 | | 2,957,000 | 2,845,859 |
| Broadcom Incorporated | | 3.15 | 11-15-2025 | | 2,213,000 | 2,320,293 |
| Broadcom Incorporated 144A | | 3.42 | 4-15-2033 | | 9,060,000 | 9,336,139 |
| Broadcom Incorporated 144A | | 3.47 | 4-15-2034 | | 4,366,000 | 4,498,827 |
| Broadcom Incorporated | | 3.88 | 1-15-2027 | | 1,280,000 | 1,378,384 |
| Broadcom Incorporated | | 4.15 | 11-15-2030 | | 3,009,000 | 3,287,957 |
| Intel Corporation | | 1.60 | 8-12-2028 | | 4,262,000 | 4,200,238 |
| Intel Corporation | | 2.00 | 8-12-2031 | | 6,648,000 | 6,568,027 |
| Intel Corporation | | 2.80 | 8-12-2041 | | 2,723,000 | 2,740,923 |
| Intel Corporation | | 3.20 | 8-12-2061 | | 1,377,000 | 1,429,039 |
| KLA Corporation | | 3.30 | 3-1-2050 | | 2,300,000 | 2,492,869 |
| Texas Instruments Incorporated | | 1.13 | 9-15-2026 | | 1,694,000 | 1,675,279 |
| | | | | | | 48,699,043 |
| Software: 0.77% | | | | | | |
| Oracle Corporation | | 2.30 | 3-25-2028 | | 1,841,000 | 1,851,232 |
| Oracle Corporation | | 2.80 | 4-1-2027 | | 5,170,000 | 5,356,480 |
| Oracle Corporation | | 2.88 | 3-25-2031 | | 1,262,000 | 1,291,595 |
| Oracle Corporation | | 3.65 | 3-25-2041 | | 1,755,000 | 1,825,823 |
| Oracle Corporation | | 3.95 | 3-25-2051 | | 2,429,000 | 2,617,350 |
| VMware Incorporated | | 0.60 | 8-15-2023 | | 8,395,000 | 8,345,368 |
| VMware Incorporated | | 1.00 | 8-15-2024 | | 5,879,000 | 5,837,151 |
| VMware Incorporated | | 1.40 | 8-15-2026 | | 6,717,000 | 6,563,767 |
| VMware Incorporated | | 1.80 | 8-15-2028 | | 3,692,000 | 3,596,620 |
| VMware Incorporated | | 3.90 | 8-21-2027 | | 683,000 | 744,200 |
| VMware Incorporated | | 4.70 | 5-15-2030 | | 3,398,000 | 3,943,082 |
| | | | | | | 41,972,668 |
| Technology hardware, storage & peripherals: 0.68% | | | | | | |
| Apple Incorporated | | 1.40 | 8-5-2028 | | 6,769,000 | 6,612,851 |
| Apple Incorporated | | 1.70 | 8-5-2031 | | 5,075,000 | 4,941,310 |
| Apple Incorporated | | 2.38 | 2-8-2041 | | 1,379,000 | 1,350,834 |
| Apple Incorporated | | 2.55 | 8-20-2060 | | 3,968,000 | 3,770,139 |
| Apple Incorporated | | 2.65 | 5-11-2050 | | 4,176,000 | 4,129,374 |
| Apple Incorporated | | 2.65 | 2-8-2051 | | 4,236,000 | 4,196,247 |
| Apple Incorporated | | 2.70 | 8-5-2051 | | 3,052,000 | 3,052,101 |
The accompanying notes are an integral part of these financial statements.
Allspring Core Bond Portfolio | 39
Portfolio of investments—November 30, 2021 (unaudited)
| | | Interest
rate | Maturity
date | Principal | Value |
| Technology hardware, storage & peripherals (continued) | | | | | | |
| Apple Incorporated | | 2.85% | 8-5-2061 | $ | 3,376,000 | $ 3,401,005 |
| HP Incorporated | | 2.20 | 6-17-2025 | | 5,447,000 | 5,570,177 |
| | | | | | | 37,024,038 |
| Materials: 0.41% | | | | | | |
| Chemicals: 0.41% | | | | | | |
| Dow Chemical Corporation | | 3.60 | 11-15-2050 | | 3,389,000 | 3,716,795 |
| LYB International Finance III Company | | 3.38 | 10-1-2040 | | 5,066,000 | 5,270,306 |
| LYB International Finance III Company | | 3.63 | 4-1-2051 | | 5,023,000 | 5,359,084 |
| Westlake Chemical Corporation | | 3.13 | 8-15-2051 | | 6,060,000 | 5,909,076 |
| Westlake Chemical Corporation | | 3.60 | 8-15-2026 | | 1,850,000 | 1,998,756 |
| | | | | | | 22,254,017 |
| Real estate: 1.56% | | | | | | |
| Equity REITs: 1.30% | | | | | | |
| Agree LP | | 2.00 | 6-15-2028 | | 3,692,000 | 3,647,609 |
| Agree LP | | 2.60 | 6-15-2033 | | 839,000 | 827,181 |
| Brixmor Operating Partnership | | 2.25 | 4-1-2028 | | 1,184,000 | 1,185,984 |
| Brixmor Operating Partnership | | 2.50 | 8-16-2031 | | 2,049,000 | 1,995,034 |
| Crown Castle International Corporation | | 1.05 | 7-15-2026 | | 5,075,000 | 4,899,233 |
| Crown Castle International Corporation | | 2.10 | 4-1-2031 | | 9,380,000 | 8,955,180 |
| Crown Castle International Corporation | | 2.50 | 7-15-2031 | | 3,709,000 | 3,661,668 |
| Crown Castle International Corporation | | 2.90 | 4-1-2041 | | 2,369,000 | 2,283,785 |
| Crown Castle International Corporation | | 4.00 | 3-1-2027 | | 847,000 | 924,127 |
| Federal Realty Investment Trust | | 3.95 | 1-15-2024 | | 2,343,000 | 2,469,539 |
| Healthpeak Properties Incorporated | | 2.13 | 12-1-2028 | | 1,686,000 | 1,684,211 |
| Mid-America Apartments LP | | 3.95 | 3-15-2029 | | 1,703,000 | 1,912,432 |
| Mid-America Apartments LP | | 4.00 | 11-15-2025 | | 2,075,000 | 2,262,357 |
| Mid-America Apartments LP | | 4.30 | 10-15-2023 | | 1,738,000 | 1,828,809 |
| Realty Income Corporation | | 2.20 | 6-15-2028 | | 1,826,000 | 1,842,764 |
| Realty Income Corporation | | 2.85 | 12-15-2032 | | 2,488,000 | 2,595,361 |
| Realty Income Corporation | | 3.40 | 1-15-2028 | | 1,808,000 | 1,943,633 |
| Regency Centers LP | | 2.95 | 9-15-2029 | | 3,683,000 | 3,826,805 |
| Rexford Industrial Realty Trust Company | | 2.15 | 9-1-2031 | | 1,876,000 | 1,793,495 |
| Spirit Realty LP | | 2.10 | 3-15-2028 | | 3,372,000 | 3,306,447 |
| Spirit Realty LP | | 2.70 | 2-15-2032 | | 1,012,000 | 1,009,209 |
| Spirit Realty LP | | 3.40 | 1-15-2030 | | 2,040,000 | 2,135,849 |
| Store Capital Corporation | | 2.70 | 12-1-2031 | | 1,177,000 | 1,159,604 |
| Store Capital Corporation | | 2.75 | 11-18-2030 | | 3,000,000 | 3,016,044 |
| Store Capital Corporation | | 4.50 | 3-15-2028 | | 6,398,000 | 7,102,358 |
| Store Capital Corporation | | 4.63 | 3-15-2029 | | 2,161,000 | 2,442,064 |
| | | | | | | 70,710,782 |
| Real estate management & development: 0.26% | | | | | | |
| American Campus Communities Company | | 2.25 | 1-15-2029 | | 2,542,000 | 2,519,248 |
| Essex Portfolio LP | | 1.70 | 3-1-2028 | | 4,435,000 | 4,329,532 |
| Essex Portfolio LP | | 2.55 | 6-15-2031 | | 1,746,000 | 1,761,124 |
| Extra Space Storage LP | | 2.35 | 3-15-2032 | | 1,522,000 | 1,478,328 |
| Kilroy Realty LP | | 2.65 | 11-15-2033 | | 2,308,000 | 2,253,089 |
| Sun Communities Operating LP | | 2.30 | 11-1-2028 | | 1,694,000 | 1,690,598 |
| | | | | | | 14,031,919 |
The accompanying notes are an integral part of these financial statements.
40 | Allspring Core Bond Portfolio
Portfolio of investments—November 30, 2021 (unaudited)
| | | Interest
rate | Maturity
date | Principal | Value |
| Utilities: 2.22% | | | | | | |
| Electric utilities: 1.54% | | | | | | |
| American Transmission System Incorporated 144A%% | | 2.65% | 1-15-2032 | $ | 1,172,000 | $ 1,183,913 |
| Duke Energy Carolinas LLC | | 2.55 | 4-15-2031 | | 1,712,000 | 1,748,149 |
| Duke Energy Florida LLC %% | | 2.40 | 12-15-2031 | | 2,506,000 | 2,521,872 |
| Duke Energy Progress LLC | | 2.50 | 8-15-2050 | | 2,542,000 | 2,378,167 |
| Duke Energy Progress LLC | | 2.55 | 6-15-2031 | | 6,735,000 | 6,702,416 |
| Duke Energy Progress LLC | | 3.50 | 6-15-2051 | | 1,012,000 | 1,060,894 |
| Entergy Arkansas LLC | | 2.65 | 6-15-2051 | | 2,265,000 | 2,164,302 |
| Eversource Energy | | 1.40 | 8-15-2026 | | 2,559,000 | 2,517,550 |
| FirstEnergy Corporation 144A | | 2.75 | 3-1-2032 | | 2,767,000 | 2,820,262 |
| Interstate Power & Light Company | | 3.10 | 11-30-2051 | | 212,000 | 216,406 |
| Interstate Power & Light Company | | 3.50 | 9-30-2049 | | 1,044,000 | 1,150,705 |
| ITC Holdings Corporation | | 2.70 | 11-15-2022 | | 3,424,000 | 3,484,137 |
| Metropolitan Edison Company 144A | | 4.30 | 1-15-2029 | | 3,787,000 | 4,216,674 |
| Mid-American Energy Company | | 2.70 | 8-1-2052 | | 2,187,000 | 2,189,794 |
| Mississippi Power Company | | 3.10 | 7-30-2051 | | 3,026,000 | 3,061,189 |
| Mississippi Power Company | | 3.95 | 3-30-2028 | | 4,176,000 | 4,580,630 |
| Mississippi Power Company | | 4.25 | 3-15-2042 | | 1,158,000 | 1,366,120 |
| Northern States Power Company | | 3.20 | 4-1-2052 | | 1,703,000 | 1,867,340 |
| NSTAR Electric Company | | 3.10 | 6-1-2051 | | 1,556,000 | 1,682,786 |
| Pacific Gas & Electric Company | | 2.10 | 8-1-2027 | | 3,268,000 | 3,146,310 |
| Pacific Gas & Electric Company | | 3.95 | 12-1-2047 | | 3,781,000 | 3,739,813 |
| Pacific Gas & Electric Company | | 4.20 | 6-1-2041 | | 1,461,000 | 1,488,346 |
| Pacific Gas & Electric Company | | 4.50 | 7-1-2040 | | 865,000 | 905,436 |
| Pacific Gas & Electric Company | | 4.75 | 2-15-2044 | | 847,000 | 881,951 |
| Pacific Gas & Electric Company | | 4.95 | 7-1-2050 | | 3,409,000 | 3,826,576 |
| PacifiCorp Electric Service Company | | 2.90 | 6-15-2052 | | 2,179,000 | 2,168,329 |
| Pennsylvania Electric Company 144A | | 3.25 | 3-15-2028 | | 1,435,000 | 1,486,957 |
| Public Service Company of Colorado | | 1.88 | 6-15-2031 | | 3,882,000 | 3,763,896 |
| Public Service Company of Oklahoma | | 2.20 | 8-15-2031 | | 2,559,000 | 2,493,161 |
| Public Service Company of Oklahoma | | 3.15 | 8-15-2051 | | 1,703,000 | 1,736,703 |
| Public Service Electric and Gas Company | | 1.90 | 8-15-2031 | | 3,380,000 | 3,332,651 |
| Public Service Electric and Gas Company | | 2.05 | 8-1-2050 | | 700,000 | 627,947 |
| Public Service Electric and Gas Company | | 2.70 | 5-1-2050 | | 1,703,000 | 1,734,853 |
| Southern California Edison Company | | 4.13 | 3-1-2048 | | 1,893,000 | 2,154,259 |
| Southwestern Electric Power Company | | 3.25 | 11-1-2051 | | 1,322,000 | 1,331,235 |
| Trans-Allegheny Interstate Line Company 144A | | 3.85 | 6-1-2025 | | 1,193,000 | 1,266,953 |
| Virginia Electric & Power Company | | 2.45 | 12-15-2050 | | 981,000 | 922,041 |
| | | | | | | 83,920,723 |
| Gas utilities: 0.14% | | | | | | |
| Baltimore Gas & Electric Gas Company | | 2.25 | 6-15-2031 | | 2,524,000 | 2,517,296 |
| Piedmont Natural Gas Company | | 2.50 | 3-15-2031 | | 2,542,000 | 2,532,873 |
| Southern Company Gas Capital Corporation | | 1.75 | 1-15-2031 | | 2,663,000 | 2,489,683 |
| | | | | | | 7,539,852 |
Independent power & renewable electricity
producers: 0.06% | | | | | | |
| AES Corporation | | 1.38 | 1-15-2026 | | 3,648,000 | 3,542,810 |
| Multi-utilities: 0.48% | | | | | | |
| Black Hills Corporation | | 3.88 | 10-15-2049 | | 1,522,000 | 1,701,115 |
| Consumers Energy Company | | 2.50 | 5-1-2060 | | 1,435,000 | 1,304,813 |
| Consumers Energy Company | | 2.65 | 8-15-2052 | | 1,859,000 | 1,841,105 |
The accompanying notes are an integral part of these financial statements.
Allspring Core Bond Portfolio | 41
Portfolio of investments—November 30, 2021 (unaudited)
| | | Interest
rate | Maturity
date | Principal | Value |
| Multi-utilities (continued) | | | | | | |
| Dominion Energy Incorporated | | 1.45% | 4-15-2026 | $ | 2,144,000 | $ 2,119,211 |
| Dominion Energy Incorporated | | 3.30 | 4-15-2041 | | 519,000 | 545,938 |
| DTE Energy Company | | 1.05 | 6-1-2025 | | 1,772,000 | 1,741,475 |
| DTE Energy Company | | 2.95 | 3-1-2030 | | 2,265,000 | 2,349,977 |
| DTE Energy Company | | 2.95 | 3-1-2050 | | 2,945,000 | 3,055,225 |
| Public Service Enterprise Group | | 1.60 | 8-15-2030 | | 1,945,000 | 1,815,868 |
| Public Service Enterprise Group | | 2.45 | 11-15-2031 | | 3,060,000 | 3,028,872 |
| WEC Energy Group Incorporated | | 0.80 | 3-15-2024 | | 4,279,000 | 4,244,596 |
| WEC Energy Group Incorporated | | 1.38 | 10-15-2027 | | 2,455,000 | 2,375,876 |
| | | | | | | 26,124,071 |
| Total Corporate bonds and notes (Cost $1,354,188,986) | | | | | | 1,359,502,533 |
| Municipal obligations: 0.44% | | | | | | |
| Nevada: 0.10% | | | | | | |
| Airport revenue: 0.10% | | | | | | |
| Clark County NV Airport Authority Build America Bonds Series C | | 6.82 | 7-1-2045 | | 3,365,000 | 5,352,456 |
| New York: 0.14% | | | | | | |
| Airport revenue: 0.14% | | | | | | |
| Port Authority of New York & New Jersey Consolidated Bonds Series 174 | | 4.46 | 10-1-2062 | | 5,505,000 | 7,539,669 |
| Ohio: 0.06% | | | | | | |
| Education revenue: 0.06% | | | | | | |
| Ohio State University General Receipts Taxable Bonds Series A | | 4.80 | 6-1-2111 | | 1,957,000 | 3,118,824 |
| Texas: 0.14% | | | | | | |
| Education revenue: 0.03% | | | | | | |
| University of Texas Financing System Bond Series B | | 2.44 | 8-15-2049 | | 1,695,000 | 1,711,849 |
| Transportation revenue: 0.11% | | | | | | |
| North Texas Tollway Authority | | 6.72 | 1-1-2049 | | 3,609,000 | 6,198,353 |
| Total Municipal obligations (Cost $17,165,099) | | | | | | 23,921,151 |
| Non-agency mortgage-backed securities: 5.15% | | | | | | |
| 3650R Commercial Mortgage Trust Series 2021-PF1 Class A5 | | 2.52 | 11-15-2054 | | 2,521,000 | 2,571,247 |
| Angel Oak Mortgage Trust Series 2019-2 Class A1 144A±± | | 3.63 | 3-25-2049 | | 539,587 | 542,485 |
| Angel Oak Mortgage Trust Series 2020-2 Class A1 144A±± | | 2.53 | 1-26-2065 | | 2,480,956 | 2,512,394 |
| Angel Oak Mortgage Trust Series 2020-5 Class A1 144A±± | | 1.37 | 5-25-2065 | | 1,107,769 | 1,110,711 |
| Angel Oak Mortgage Trust Series 2021-6 Class A1 144A±± | | 1.46 | 9-25-2066 | | 3,519,998 | 3,494,875 |
| Barclays Commercial Mortgage Series 2018-C2 Class ASB | | 4.24 | 12-15-2051 | | 1,159,000 | 1,279,485 |
| Barclays Commercial Mortgage Series 2019-C3 Class A3 | | 3.32 | 5-15-2052 | | 585,000 | 627,489 |
| Barclays Commercial Mortgage Series 2021-C12 Class A5 | | 2.69 | 11-15-2054 | | 3,383,000 | 3,517,823 |
The accompanying notes are an integral part of these financial statements.
42 | Allspring Core Bond Portfolio
Portfolio of investments—November 30, 2021 (unaudited)
| | | Interest
rate | Maturity
date | Principal | Value |
| Non-agency mortgage-backed securities (continued) | | | | | | |
| Bunker Hill Loan Depositary Trust Series 2019-2 Class A1 144A±± | | 2.88% | 7-25-2049 | $ | 3,123,905 | $ 3,141,899 |
| Bunker Hill Loan Depositary Trust Series 2019-3 Class A1 144A±± | | 2.72 | 11-25-2059 | | 2,519,684 | 2,543,504 |
| BX Trust Series 2021-VOLT Class A (1 Month LIBOR +0.70%) 144A± | | 0.79 | 9-15-2036 | | 10,912,000 | 10,857,283 |
| BX Trust Series 2021-XL2 Class A (1 Month LIBOR +0.69%) 144A± | | 0.78 | 10-15-2038 | | 5,440,000 | 5,413,401 |
| CD Commercial Mortgage Trust Series 2019-CD8 Class A4 | | 2.91 | 8-15-2057 | | 2,221,000 | 2,341,976 |
| CFCRE Commercial Mortgage Trust Series 2017-C8 Class ASB | | 3.37 | 6-15-2050 | | 1,631,000 | 1,715,797 |
| Colt Funding LLC Series 2021-2 Class A1 144A±± | | 0.92 | 8-25-2066 | | 4,504,624 | 4,465,618 |
| Colt Funding LLC Series 2021-4 Class A1 144A±± | | 1.40 | 10-25-2066 | | 4,555,956 | 4,532,934 |
| Commercial Mortgage Trust Pass-Through Certificate Series 2012-CR3 Class A3 | | 2.82 | 10-15-2045 | | 2,478,730 | 2,495,760 |
| Commercial Mortgage Trust Pass-Through Certificate Series 2015-LC21 Class A4 | | 3.71 | 7-10-2048 | | 1,629,000 | 1,743,915 |
| Commercial Mortgage Trust Series 2013-CR10 Class A4 ±± | | 4.21 | 8-10-2046 | | 89,000 | 93,134 |
| Commercial Mortgage Trust Series 2013-CR11 Class A4 | | 4.26 | 8-10-2050 | | 10,048,000 | 10,570,125 |
| Commercial Mortgage Trust Series 2013-CR6 Class A4 | | 3.10 | 3-10-2046 | | 8,286,000 | 8,384,997 |
| Commercial Mortgage Trust Series 2014-UBS4 Class A4 | | 3.42 | 8-10-2047 | | 4,178,000 | 4,314,596 |
| Commercial Mortgage Trust Series 2015-LC23 Class A3 | | 3.52 | 10-10-2048 | | 1,982,000 | 2,091,900 |
| CSAIL Commercial Mortgage Trust Series 2015-C2 Class A4 | | 3.50 | 6-15-2057 | | 2,484,176 | 2,629,302 |
| CSAIL Commercial Mortgage Trust Series 2021-C20 Class A3 | | 2.80 | 3-15-2054 | | 1,257,000 | 1,313,305 |
| EQUS 2021-EQAZ Mortgage Trust (1 Month LIBOR +0.75%) 144A± | | 0.84 | 10-15-2038 | | 4,285,000 | 4,260,944 |
| Florida Power & Light Company 1st Mortgage Bonds | | 2.88 | 12-4-2051 | | 838,000 | 868,317 |
| Goldman Sachs Mortgage Securities Trust Series 2013-GC14 Class A5 | | 4.24 | 8-10-2046 | | 2,275,000 | 2,380,600 |
| Goldman Sachs Mortgage Securities Trust Series 2014-GC18 Class A4 | | 4.07 | 1-10-2047 | | 5,471,323 | 5,743,881 |
| Goldman Sachs Mortgage Securities Trust Series 2020-GC47 Class A5 | | 2.38 | 5-12-2053 | | 3,826,000 | 3,895,964 |
| Goldman Sachs Mortgage Securities Trust Series 2020-GSA2 Class A4 | | 1.72 | 12-12-2053 | | 4,416,000 | 4,270,109 |
| Impact Funding LLC Series 2010-1 Class A1 144A | | 5.31 | 1-25-2051 | | 5,559,138 | 5,800,515 |
| JPMDB Commercial Mortgage Securities Series 2013-C12 Class A5 | | 3.66 | 7-15-2045 | | 3,316,000 | 3,422,545 |
| JPMDB Commercial Mortgage Securities Series 2014-C23 Class A4 | | 3.67 | 9-15-2047 | | 1,659,938 | 1,734,819 |
| JPMorgan Chase Commercial Mortgage Securities Trust Series 2013-C16 Class A4 | | 4.17 | 12-15-2046 | | 4,973,000 | 5,220,356 |
| JPMorgan Chase Commercial Mortgage Securities Trust Series 2015-C28 Class A3 | | 2.91 | 10-15-2048 | | 9,226,619 | 9,391,495 |
| JPMorgan Chase Commercial Mortgage Securities Trust Series 2016-JP3 Class A3 | | 3.39 | 12-15-2049 | | 1,080,000 | 1,155,483 |
| Med Trust Series 2021-MDLN (1 Month LIBOR +0.95%) 144A± | | 1.05 | 11-15-2038 | | 6,906,000 | 6,912,494 |
The accompanying notes are an integral part of these financial statements.
Allspring Core Bond Portfolio | 43
Portfolio of investments—November 30, 2021 (unaudited)
| | | Interest
rate | Maturity
date | Principal | Value |
| Non-agency mortgage-backed securities (continued) | | | | | | |
| Mello Warehouse Securitization Trust Series 2020-2 Class A (1 Month LIBOR +0.80%) 144A± | | 0.89% | 11-25-2053 | $ | 5,688,000 | $ 5,672,704 |
| Mello Warehouse Securitization Trust Series 2021-1 Class A (1 Month LIBOR +0.70%) 144A± | | 0.79 | 2-25-2055 | | 1,606,000 | 1,598,104 |
| Mello Warehouse Securitization Trust Series 2021-2 Class A (1 Month LIBOR +0.75%) 144A± | | 0.84 | 4-25-2055 | | 4,340,000 | 4,322,351 |
| MFRA Trust Series 2021-NQM2 Class A1 144A±± | | 1.03 | 11-25-2064 | | 2,525,946 | 2,510,435 |
| Morgan Stanley Bank of America Merrill Lynch Trust Series 2012-C5 Class A4 | | 3.18 | 8-15-2045 | | 1,105,478 | 1,110,694 |
| Morgan Stanley Bank of America Merrill Lynch Trust Series 2015-C20 Class A4 | | 3.25 | 2-15-2048 | | 800,041 | 839,364 |
| Morgan Stanley Capital International Trust Series 2020-HR8 Class A3 | | 1.79 | 7-15-2053 | | 3,163,000 | 3,077,569 |
| Morgan Stanley Capital International Trust Series 2021-L7 Class A5 | | 2.57 | 10-15-2054 | | 4,228,000 | 4,334,891 |
| MSG III Securitization Trust Series 2021-1 Class A (1 Month LIBOR +0.75%) 144A± | | 0.84 | 6-25-2054 | | 2,680,000 | 2,680,478 |
| New Residential Mortgage Loan Trust Series 2019-NQM4 Class A1 144A±± | | 2.49 | 9-25-2059 | | 1,406,172 | 1,414,493 |
| NewRez WareHouse Securitization Series 2021-1 Class A (1 Month LIBOR +0.75%) 144A± | | 0.84 | 5-25-2055 | | 10,288,000 | 10,259,914 |
| Oncor Electric Delivery Company 1st Mortgage Bonds 144A | | 2.70 | 11-15-2051 | | 1,623,000 | 1,605,572 |
| Peco Energy Company 1st Mortgage Bonds | | 2.85 | 9-15-2051 | | 3,043,000 | 3,050,592 |
| Starwood Mortgage Residential Trust Series 2020-1 Class A1 144A±± | | 2.28 | 2-25-2050 | | 2,636,316 | 2,649,113 |
| Starwood Mortgage Residential Trust Series 2020-INV1 Class A1 144A±± | | 1.03 | 11-25-2055 | | 2,322,745 | 2,311,810 |
| Starwood Mortgage Residential Trust Series 2020-INV3 Class A1 144A±± | | 1.49 | 4-25-2065 | | 2,766,802 | 2,774,236 |
| Starwood Mortgage Residential Trust Series 2021-1 Class A1 144A±± | | 1.22 | 5-25-2065 | | 2,502,874 | 2,497,632 |
| Starwood Mortgage Residential Trust Series 2021-4 Class A1 144A±± | | 1.16 | 8-25-2056 | | 5,310,427 | 5,278,182 |
| Verizon Master Trust Series 2021-1 Class A | | 0.50 | 5-20-2027 | | 8,833,000 | 8,737,293 |
| Verizon Master Trust Series 2021-2 Class A | | 0.99 | 4-20-2028 | | 13,703,000 | 13,657,307 |
| Verus Securitization Trust Series 2019-2 Class A1 144A±± | | 2.91 | 7-25-2059 | | 1,691,143 | 1,701,261 |
| Verus Securitization Trust Series 2019-3 Class A1 144A±± | | 2.69 | 11-25-2059 | | 1,254,049 | 1,270,345 |
| Verus Securitization Trust Series 2019-3 Class A1 144A±± | | 2.78 | 7-25-2059 | | 2,124,367 | 2,133,518 |
| Verus Securitization Trust Series 2019-4 Class A1 144A±± | | 2.64 | 11-25-2059 | | 3,180,803 | 3,220,471 |
| Verus Securitization Trust Series 2020-1 Class A1 144A±± | | 2.42 | 1-25-2060 | | 773,618 | 777,200 |
| Verus Securitization Trust Series 2020-2 Class A1 144A±± | | 2.23 | 5-25-2060 | | 2,917,166 | 2,928,304 |
| Verus Securitization Trust Series 2020-5 Class A1 144A±± | | 1.22 | 5-25-2065 | | 1,022,564 | 1,021,133 |
| Verus Securitization Trust Series 2021-1 Class A1 144A±± | | 0.82 | 1-25-2066 | | 3,332,271 | 3,301,155 |
| Verus Securitization Trust Series 2021-2 Class A1 144A±± | | 1.03 | 2-25-2066 | | 5,889,599 | 5,848,591 |
| Verus Securitization Trust Series 2021-3 Class A1 144A±± | | 1.05 | 6-25-2066 | | 4,014,431 | 3,980,980 |
The accompanying notes are an integral part of these financial statements.
44 | Allspring Core Bond Portfolio
Portfolio of investments—November 30, 2021 (unaudited)
| | | Interest
rate | Maturity
date | Principal | Value |
| Non-agency mortgage-backed securities (continued) | | | | | | |
| Verus Securitization Trust Series 2021-4 Class A1 144A±± | | 0.94% | 7-25-2066 | $ | 4,249,374 | $ 4,202,625 |
| Verus Securitization Trust Series 2021-5 Class A1 144A±± | | 1.01 | 9-25-2066 | | 14,795,617 | 14,585,241 |
| Verus Securitization Trust Series 2021-7 Class A1 144A±± | | 1.83 | 10-25-2066 | | 5,967,000 | 5,964,855 |
| Verus Securitization Trust Series 2021-R1 Class A1 144A±± | | 0.82 | 10-25-2063 | | 3,569,958 | 3,560,415 |
| Verus Securitization Trust Series 2021-R3 Class A1 144A±± | | 1.02 | 4-25-2064 | | 3,419,905 | 3,401,655 |
| Visio Trust Series 2020-1R Class A1 144A | | 1.31 | 11-25-2055 | | 2,635,244 | 2,627,036 |
| Total Non-agency mortgage-backed securities (Cost $281,552,403) | | | | | | 280,270,996 |
| U.S. Treasury securities: 36.34% | | | | | | |
| U.S. Treasury Bond ## | | 1.13 | 5-15-2040 | | 87,097,000 | 77,250,956 |
| U.S. Treasury Bond ## | | 1.13 | 8-15-2040 | | 61,545,000 | 54,414,434 |
| U.S. Treasury Bond ## | | 1.38 | 11-15-2040 | | 98,406,000 | 90,741,096 |
| U.S. Treasury Bond | | 1.38 | 8-15-2050 | | 30,117,000 | 27,179,416 |
| U.S. Treasury Bond | | 1.63 | 11-15-2050 | | 31,350,000 | 30,060,486 |
| U.S. Treasury Bond ## | | 1.75 | 8-15-2041 | | 78,366,000 | 76,933,372 |
| U.S. Treasury Bond | | 1.88 | 2-15-2041 | | 18,046,000 | 18,104,509 |
| U.S. Treasury Bond | | 2.50 | 2-15-2045 | | 15,047,000 | 16,857,930 |
| U.S. Treasury Note | | 0.13 | 5-31-2022 | | 41,032,000 | 41,035,263 |
| U.S. Treasury Note | | 0.13 | 9-30-2022 | | 29,297,000 | 29,275,256 |
| U.S. Treasury Note ## | | 0.13 | 12-31-2022 | | 74,138,000 | 74,007,679 |
| U.S. Treasury Note | | 0.13 | 3-31-2023 | | 480,000 | 478,463 |
| U.S. Treasury Note | | 0.13 | 8-31-2023 | | 1,796,000 | 1,784,915 |
| U.S. Treasury Note | | 0.13 | 1-15-2024 | | 32,633,000 | 32,299,021 |
| U.S. Treasury Note | | 0.25 | 5-15-2024 | | 8,542,000 | 8,446,904 |
| U.S. Treasury Note | | 0.25 | 6-15-2024 | | 20,963,000 | 20,709,151 |
| U.S. Treasury Note | | 0.25 | 8-31-2025 | | 34,276,000 | 33,301,276 |
| U.S. Treasury Note ## | | 0.25 | 10-31-2025 | | 61,838,000 | 59,951,458 |
| U.S. Treasury Note | | 0.38 | 10-31-2023 | | 11,845,000 | 11,812,611 |
| U.S. Treasury Note | | 0.38 | 4-15-2024 | | 45,675,000 | 45,344,927 |
| U.S. Treasury Note ## | | 0.38 | 11-30-2025 | | 69,398,000 | 67,519,375 |
| U.S. Treasury Note | | 0.38 | 12-31-2025 | | 52,737,000 | 51,264,072 |
| U.S. Treasury Note | | 0.38 | 1-31-2026 | | 47,290,000 | 45,911,940 |
| U.S. Treasury Note | | 0.50 | 11-30-2023 | | 93,556,000 | 93,457,327 |
| U.S. Treasury Note ## | | 0.50 | 2-28-2026 | | 73,816,000 | 71,990,784 |
| U.S. Treasury Note | | 0.50 | 8-31-2027 | | 46,306,000 | 44,388,642 |
| U.S. Treasury Note | | 0.75 | 11-15-2024 | | 75,545,000 | 75,367,941 |
| U.S. Treasury Note ## | | 0.75 | 5-31-2026 | | 52,745,000 | 51,894,075 |
| U.S. Treasury Note | | 0.88 | 6-30-2026 | | 14,949,000 | 14,779,656 |
| U.S. Treasury Note | | 0.88 | 9-30-2026 | | 10,563,000 | 10,426,836 |
| U.S. Treasury Note | | 1.13 | 10-31-2026 | | 27,671,000 | 27,632,088 |
| U.S. Treasury Note | | 1.25 | 11-30-2026 | | 127,093,000 | 127,658,960 |
| U.S. Treasury Note | | 1.38 | 10-31-2028 | | 64,396,000 | 64,446,309 |
| U.S. Treasury Note ## | | 1.38 | 11-15-2031 | | 60,339,000 | 59,971,309 |
| U.S. Treasury Note ## | | 1.50 | 9-30-2024 | | 77,635,000 | 79,142,206 |
| U.S. Treasury Note | | 1.50 | 11-30-2024 | | 36,672,000 | 37,386,818 |
| U.S. Treasury Note | | 1.50 | 11-30-2028 | | 18,387,000 | 18,547,886 |
| U.S. Treasury Note | | 1.75 | 2-28-2022 | | 3,579,000 | 3,593,831 |
| U.S. Treasury Note ## | | 1.88 | 2-28-2022 | | 62,004,000 | 62,279,980 |
The accompanying notes are an integral part of these financial statements.
Allspring Core Bond Portfolio | 45
Portfolio of investments—November 30, 2021 (unaudited)
| | | Interest
rate | Maturity
date | Principal | Value |
| U.S. Treasury securities (continued) | | | | | | |
| U.S. Treasury Note | | 1.88% | 11-15-2051 | $ | 21,052,000 | $ 21,466,461 |
| U.S. Treasury Note | | 2.00 | 2-15-2022 | | 45,444,000 | 45,626,585 |
| U.S. Treasury Note | | 2.00 | 11-15-2041 | | 43,597,000 | 44,686,925 |
| U.S. Treasury Note | | 2.00 | 8-15-2051 | | 32,764,000 | 34,310,051 |
| U.S. Treasury Note | | 2.13 | 5-15-2025 | | 42,995,000 | 44,708,082 |
| U.S. Treasury Note | | 2.25 | 5-15-2041 | | 28,155,000 | 29,967,478 |
| Total U.S. Treasury securities (Cost $1,984,224,835) | | | | | | 1,978,414,740 |
| Yankee corporate bonds and notes: 5.45% | | | | | | |
| Consumer staples: 0.13% | | | | | | |
| Beverages: 0.13% | | | | | | |
| Bacardi Limited 144A | | 4.70 | 5-15-2028 | | 1,820,000 | 2,076,974 |
| Bacardi Limited 144A | | 5.30 | 5-15-2048 | | 3,757,000 | 5,039,457 |
| | | | | | | 7,116,431 |
| Energy: 0.45% | | | | | | |
| Oil, gas & consumable fuels: 0.45% | | | | | | |
| Aker BP ASA 144A | | 4.00 | 1-15-2031 | | 2,343,000 | 2,548,858 |
| Galaxy Pipeline Assets Company 144A | | 1.75 | 9-30-2027 | | 5,125,190 | 5,145,439 |
| Galaxy Pipeline Assets Company 144A | | 2.16 | 3-31-2034 | | 3,823,000 | 3,715,485 |
| Galaxy Pipeline Assets Company 144A | | 2.63 | 3-31-2036 | | 2,354,000 | 2,289,962 |
| Galaxy Pipeline Assets Company 144A | | 2.94 | 9-30-2040 | | 1,545,000 | 1,523,459 |
| Oleoducto Central SA 144A | | 4.00 | 7-14-2027 | | 1,879,000 | 1,871,503 |
| Petroleos del Peru 144A | | 5.63 | 6-19-2047 | | 2,568,000 | 2,507,010 |
| Petroleos Mexicanos Company | | 2.38 | 4-15-2025 | | 1,270,150 | 1,302,795 |
| Petroleos Mexicanos Company | | 2.46 | 12-15-2025 | | 3,629,250 | 3,733,658 |
| | | | | | | 24,638,169 |
| Financials: 3.41% | | | | | | |
| Banks: 1.83% | | | | | | |
| ASB Bank Limited 144A | | 2.38 | 10-22-2031 | | 4,265,000 | 4,258,334 |
| Banco de Credito e Inversiones 144A | | 2.88 | 10-14-2031 | | 3,417,000 | 3,389,664 |
| Banco Santander SA (1 Year Treasury Constant Maturity +0.90%) ± | | 1.72 | 9-14-2027 | | 4,400,000 | 4,317,859 |
| Banco Santander SA (1 Year Treasury Constant Maturity +1.60%) ± | | 3.23 | 11-22-2032 | | 4,200,000 | 4,184,712 |
| Barclays plc (1 Year Treasury Constant Maturity +1.05%) ± | | 2.28 | 11-24-2027 | | 8,392,000 | 8,402,086 |
| Barclays plc (1 Year Treasury Constant Maturity +1.30%) ± | | 2.89 | 11-24-2032 | | 2,608,000 | 2,618,414 |
| Barclays plc (1 Year Treasury Constant Maturity +1.30%) ± | | 3.33 | 11-24-2042 | | 1,900,000 | 1,921,874 |
| Mitsubishi UFJ Financial Group (1 Year Treasury Constant Maturity +0.55%) ± | | 0.95 | 7-19-2025 | | 10,076,000 | 9,975,314 |
| Mitsubishi UFJ Financial Group (1 Year Treasury Constant Maturity +0.75%) ± | | 1.54 | 7-20-2027 | | 9,952,000 | 9,807,669 |
| Mitsubishi UFJ Financial Group (1 Year Treasury Constant Maturity +0.67%) ± | | 1.64 | 10-13-2027 | | 8,577,000 | 8,481,190 |
| Mitsubishi UFJ Financial Group (1 Year Treasury Constant Maturity +0.95%) ± | | 2.31 | 7-20-2032 | | 5,205,000 | 5,142,131 |
| Mitsubishi UFJ Financial Group (1 Year Treasury Constant Maturity +0.97%) ± | | 2.49 | 10-13-2032 | | 3,505,000 | 3,517,446 |
The accompanying notes are an integral part of these financial statements.
46 | Allspring Core Bond Portfolio
Portfolio of investments—November 30, 2021 (unaudited)
| | | Interest
rate | Maturity
date | Principal | Value |
| Banks (continued) | | | | | | |
| Sumitomo Mitsui Financial Group Incorporated | | 1.40% | 9-17-2026 | $ | 6,806,000 | $ 6,664,304 |
| Sumitomo Mitsui Financial Group Incorporated | | 1.90 | 9-17-2028 | | 10,599,000 | 10,367,026 |
| Toronto Dominion Bank | | 1.25 | 9-10-2026 | | 8,455,000 | 8,305,898 |
| Westpac Banking Corporation | | 1.95 | 11-20-2028 | | 6,804,000 | 6,771,727 |
| Westpac Banking Corporation (5 Year Treasury Constant Maturity +1.53%) ± | | 3.02 | 11-18-2036 | | 853,000 | 848,026 |
| Westpac Banking Corporation | | 3.13 | 11-18-2041 | | 853,000 | 843,285 |
| | | | | | | 99,816,959 |
| Capital markets: 0.05% | | | | | | |
| Macquarie Group Limited (U.S. SOFR +1.53%) 144A± | | 2.87 | 1-14-2033 | | 2,200,000 | 2,204,574 |
| Nomura Holdings Incorporated | | 2.61 | 7-14-2031 | | 453,000 | 446,495 |
| | | | | | | 2,651,069 |
| Diversified financial services: 1.45% | | | | | | |
| AerCap Ireland Capital Designated Activity Company / AerCap Global Aviation Trust | | 1.15 | 10-29-2023 | | 13,638,000 | 13,596,863 |
| AerCap Ireland Capital Designated Activity Company / AerCap Global Aviation Trust | | 1.65 | 10-29-2024 | | 13,584,000 | 13,559,500 |
| AerCap Ireland Capital Designated Activity Company / AerCap Global Aviation Trust | | 1.75 | 10-29-2024 | | 11,078,000 | 11,061,372 |
| AerCap Ireland Capital Designated Activity Company / AerCap Global Aviation Trust | | 2.45 | 10-29-2026 | | 1,200,000 | 1,203,019 |
| DH Europe Finance II | | 2.05 | 11-15-2022 | | 2,697,000 | 2,734,327 |
| DH Europe Finance II | | 2.20 | 11-15-2024 | | 4,643,000 | 4,767,706 |
| GE Capital International Funding Company | | 4.42 | 11-15-2035 | | 7,287,000 | 8,807,299 |
| Lundin Energy Finance Company 144A | | 2.00 | 7-15-2026 | | 9,848,000 | 9,786,086 |
| Lundin Energy Finance Company 144A | | 3.10 | 7-15-2031 | | 7,856,000 | 7,938,167 |
| Trust Fibrauno 144A | | 5.25 | 1-30-2026 | | 2,605,000 | 2,842,706 |
| Trust Fibrauno 144A | | 6.39 | 1-15-2050 | | 2,091,000 | 2,410,923 |
| | | | | | | 78,707,968 |
| Insurance: 0.08% | | | | | | |
| Enstar Group Limited | | 3.10 | 9-1-2031 | | 4,262,000 | 4,183,940 |
| Health care: 0.51% | | | | | | |
| Health care equipment & supplies: 0.15% | | | | | | |
| Steris plc | | 3.75 | 3-15-2051 | | 7,493,000 | 8,284,439 |
| Pharmaceuticals: 0.36% | | | | | | |
| Astrazeneca plc | | 2.13 | 8-6-2050 | | 847,000 | 755,793 |
| Astrazeneca plc « | | 3.00 | 5-28-2051 | | 1,729,000 | 1,830,359 |
| Shire Acquisitions Investments Ireland Designated Activity Company | | 2.88 | 9-23-2023 | | 3,519,000 | 3,631,234 |
| Takeda Pharmaceutical | | 2.05 | 3-31-2030 | | 6,397,000 | 6,218,222 |
| Takeda Pharmaceutical | | 3.03 | 7-9-2040 | | 1,927,000 | 1,958,668 |
| Takeda Pharmaceutical | | 3.18 | 7-9-2050 | | 1,987,000 | 2,031,861 |
| Takeda Pharmaceutical | | 4.40 | 11-26-2023 | | 2,956,000 | 3,146,093 |
| | | | | | | 19,572,230 |
| Industrials: 0.52% | | | | | | |
| Road & rail: 0.44% | | | | | | |
| Canadian Pacific Railway Company %% | | 1.35 | 12-2-2024 | | 12,601,000 | 12,589,441 |
| Canadian Pacific Railway Company %% | | 1.75 | 12-2-2026 | | 4,201,000 | 4,203,362 |
The accompanying notes are an integral part of these financial statements.
Allspring Core Bond Portfolio | 47
Portfolio of investments—November 30, 2021 (unaudited)
| | | Interest
rate | Maturity
date | Principal | Value |
| Road & rail (continued) | | | | | | |
| Canadian Pacific Railway Company %% | | 2.45% | 12-2-2031 | $ | 3,361,000 | $ 3,402,010 |
| Canadian Pacific Railway Company %% | | 3.00 | 12-2-2041 | | 1,344,000 | 1,368,366 |
| Canadian Pacific Railway Company %% | | 3.10 | 12-2-2051 | | 2,174,000 | 2,235,918 |
| | | | | | | 23,799,097 |
| Transportation infrastructure: 0.08% | | | | | | |
| Adani Ports & Special Company 144A | | 3.00 | 2-16-2031 | | 1,403,360 | 1,364,150 |
| Adani Ports & Special Company 144A | | 4.20 | 8-4-2027 | | 2,984,000 | 3,095,572 |
| | | | | | | 4,459,722 |
| Information technology: 0.21% | | | | | | |
| Semiconductors & semiconductor equipment: 0.21% | | | | | | |
| NXP BV 144A | | 3.15 | 5-1-2027 | | 1,686,000 | 1,768,809 |
| NXP BV 144A | | 3.25 | 5-11-2041 | | 1,850,000 | 1,896,607 |
| NXP BV 144A | | 3.88 | 6-18-2026 | | 7,236,000 | 7,841,245 |
| | | | | | | 11,506,661 |
| Materials: 0.13% | | | | | | |
| Metals & mining: 0.13% | | | | | | |
| Teck Resources Limited | | 5.20 | 3-1-2042 | | 1,997,000 | 2,386,303 |
| Teck Resources Limited | | 6.13 | 10-1-2035 | | 1,729,000 | 2,245,577 |
| Teck Resources Limited | | 6.25 | 7-15-2041 | | 1,945,000 | 2,566,380 |
| | | | | | | 7,198,260 |
| Real estate: 0.05% | | | | | | |
| Equity REITs: 0.05% | | | | | | |
| Scentre Group Trust 144A | | 3.63 | 1-28-2026 | | 2,671,000 | 2,868,782 |
| Utilities: 0.04% | | | | | | |
| Electric utilities: 0.04% | | | | | | |
| Comision Federal de Electricidad 144A | | 3.88 | 7-26-2033 | | 2,339,000 | 2,232,576 |
| Total Yankee corporate bonds and notes (Cost $294,779,852) | | | | | | 297,036,303 |
| Yankee government bonds: 1.21% | | | | | | |
| Abu Dhabi Government International Bond 144A | | 3.00 | 9-15-2051 | | 2,611,000 | 2,596,504 |
| Italy Government International Bond | | 3.88 | 5-6-2051 | | 5,372,000 | 5,860,416 |
| Japan Bank for International Cooperation | | 1.75 | 10-17-2024 | | 4,732,000 | 4,831,498 |
| Republic of Colombia | | 5.20 | 5-15-2049 | | 4,999,000 | 4,653,869 |
| Republic of Paraguay 144A | | 4.95 | 4-28-2031 | | 989,000 | 1,087,910 |
| Republic of Paraguay 144A | | 5.40 | 3-30-2050 | | 2,899,000 | 3,181,681 |
| Republic of Peru | | 2.39 | 1-23-2026 | | 3,536,000 | 3,588,474 |
| Republic of Peru | | 2.78 | 1-23-2031 | | 8,360,000 | 8,280,664 |
| Republic of Peru | | 3.00 | 1-15-2034 | | 5,948,000 | 5,823,092 |
| Republic of Peru | | 3.60 | 1-15-2072 | | 3,742,000 | 3,557,407 |
| United Mexican States | | 3.75 | 4-19-2071 | | 4,678,000 | 4,104,945 |
| United Mexican States | | 4.28 | 8-14-2041 | | 7,811,000 | 8,040,409 |
| United Mexican States | | 4.50 | 4-22-2029 | | 6,226,000 | 6,932,215 |
| United Mexican States | | 4.50 | 1-31-2050 | | 846,000 | 880,111 |
| United Mexican States | | 4.75 | 3-8-2044 | | 2,076,000 | 2,241,312 |
| Total Yankee government bonds (Cost $64,974,953) | | | | | | 65,660,507 |
The accompanying notes are an integral part of these financial statements.
48 | Allspring Core Bond Portfolio
Portfolio of investments—November 30, 2021 (unaudited)
| | | Yield | | Shares | Value |
| Short-term investments: 3.80% | | | | | | |
| Investment companies: 3.80% | | | | | | |
| Allspring Government Money Market Fund Select Class ♠∞## | | 0.03% | | | 206,097,656 | $ 206,097,656 |
| Securities Lending Cash Investments LLC ♠∩∞ | | 0.04 | | | 848,000 | 848,000 |
| Total Short-term investments (Cost $206,945,656) | | | | | | 206,945,656 |
| Total investments in securities (Cost $6,089,138,247) | 112.19% | | | | | 6,107,907,145 |
| Other assets and liabilities, net | (12.19) | | | | | (663,687,022) |
| Total net assets | 100.00% | | | | | $5,444,220,123 |
| ¤ | The security is issued in zero coupon form with no periodic interest payments. |
| ± | Variable rate investment. The rate shown is the rate in effect at period end. |
| ±± | The coupon of the security is adjusted based on the principal and/or interest payments received from the underlying pool of mortgages as well as the credit quality and the actual prepayment speed of the underlying mortgages. The rate shown is the rate in effect at period end. |
| 144A | The security may be resold in transactions exempt from registration, normally to qualified institutional buyers, pursuant to Rule 144A under the Securities Act of 1933. |
| ## | All or a portion of this security is segregated for when-issued securities. |
| « | All or a portion of this security is on loan. |
| ♠ | The issuer of the security is an affiliated person of the Portfolio as defined in the Investment Company Act of 1940. |
| ∩ | The investment is a non-registered investment company purchased with cash collateral received from securities on loan. |
| ∞ | The rate represents the 7-day annualized yield at period end. |
| %% | The security is purchased on a when-issued basis. |
| Abbreviations: |
| FHLMC | Federal Home Loan Mortgage Corporation |
| FNMA | Federal National Mortgage Association |
| GNMA | Government National Mortgage Association |
| LIBOR | London Interbank Offered Rate |
| REIT | Real estate investment trust |
| SOFR | Secured Overnight Financing Rate |
Investments in affiliates
An affiliated investment is an investment in which the Portfolio owns at least 5% of the outstanding voting shares of the issuer or as a result of other relationships, such as the Portfolio and the issuer having the same adviser or investment manager. Transactions with issuers that were either affiliates of the Portfolio at the beginning of the period or the end of the period were as follows:
| | Value,
beginning of
period | Purchases | Sales
proceeds | Net
realized
gains
(losses) | | Net
change in
unrealized
gains
(losses) | | Value,
end of
period | Shares,
end
of period | Income
from
affiliated
securities |
| Short-term investments | | | | | | | | | |
| Allspring Government Money Market Fund Select Class | $270,350,377 | $2,390,887,836 | $(2,455,140,557) | $0 | | $0 | | $ 206,097,656 | 206,097,656 | $ 15,072 |
| Securities Lending Cash Investments LLC | 0 | 358,385,103 | (357,537,103) | 0 | | 0 | | 848,000 | 848,000 | 812 # |
| | | | | $0 | | $0 | | $206,945,656 | | $15,884 |
| # | Amount shown represents income before fees and rebates. |
The accompanying notes are an integral part of these financial statements.
Allspring Core Bond Portfolio | 49
Statement of assets and liabilities—November 30, 2021 (unaudited)
| | |
| Assets | |
Investments in unaffiliated securities (including $831,090 of securities loaned), at value (cost $5,882,192,591)
| $ 5,900,961,489 |
Investments in affiliated securities, at value (cost $206,945,656)
| 206,945,656 |
Cash collateral due from broker
| 1,470,000 |
Receivable for investments sold
| 548,301,448 |
Receivable for interest
| 16,530,349 |
Principal paydown receivable
| 146,038 |
Receivable for securities lending income, net
| 1,766 |
Prepaid expenses and other assets
| 933,354 |
Total assets
| 6,675,290,100 |
| Liabilities | |
Payable for when-issued transactions
| 978,167,971 |
Payable for investments purchased
| 168,299,551 |
Overdraft due to custodian bank
| 82,215,607 |
Advisory fee payable
| 1,538,848 |
Payable upon receipt of securities loaned
| 848,000 |
Total liabilities
| 1,231,069,977 |
Total net assets
| $5,444,220,123 |
The accompanying notes are an integral part of these financial statements.
50 | Allspring Core Bond Portfolio
Statement of operations—six months ended November 30, 2021 (unaudited)
| | |
| Investment income | |
Interest (net of foreign withholding taxes of $13,666)
| $ 41,615,722 |
Income from affiliated securities
| 29,257 |
Total investment income
| 41,644,979 |
| Expenses | |
Advisory fee
| 9,539,461 |
Custody and accounting fees
| 168,764 |
Professional fees
| 60,006 |
Interest holder report expenses
| 10,980 |
Trustees’ fees and expenses
| 9,662 |
Other fees and expenses
| 66,973 |
Total expenses
| 9,855,846 |
Net investment income
| 31,789,133 |
| Realized and unrealized gains (losses) on investments | |
Net realized gains on investments
| 21,098,993 |
Net change in unrealized gains (losses) on investments
| 848,698 |
Net realized and unrealized gains (losses) on investments
| 21,947,691 |
Net increase in net assets resulting from operations
| $53,736,824 |
The accompanying notes are an integral part of these financial statements.
Allspring Core Bond Portfolio | 51
Statement of changes in net assets
| | | |
| | Six months ended
November 30, 2021
(unaudited) | Year ended
May 31, 2021 |
| Operations | | |
Net investment income
| $ 31,789,133 | $ 77,723,644 |
Net realized gains on investments
| 21,098,993 | 129,629,293 |
Net change in unrealized gains (losses) on investments
| 848,698 | (171,533,989) |
Net increase in net assets resulting from operations
| 53,736,824 | 35,818,948 |
| Capital transactions | | |
| Transactions in investors’ beneficial interests | | |
Contributions
| 215,150,579 | 1,103,776,459 |
Withdrawals
| (466,799,980) | (1,259,318,551) |
Net decrease in net assets resulting from capital transactions
| (251,649,401) | (155,542,092) |
Total decrease in net assets
| (197,912,577) | (119,723,144) |
| Net assets | | |
Beginning of period
| 5,642,132,700 | 5,761,855,844 |
End of period
| $5,444,220,123 | $ 5,642,132,700 |
The accompanying notes are an integral part of these financial statements.
52 | Allspring Core Bond Portfolio
| | | Year ended May 31 |
| | Six months ended
November 30, 2021
(unaudited) | 2021 | 2020 | 2019 | 2018 | 2017 |
Total return1
| 0.96% | 0.65% | 9.49% | 6.30% | (0.53)% | 1.89% |
| Ratios to average net assets (annualized) | | | | | | |
Gross expenses
| 0.35% | 0.35% | 0.35% | 0.35% | 0.35% | 0.35% |
Net expenses
| 0.35% | 0.35% | 0.35% | 0.35% | 0.35% | 0.35% |
Net investment income
| 1.14% | 1.30% | 2.28% | 2.93% | 2.23% | 1.87% |
| Supplemental data | | | | | | |
Portfolio turnover rate
| 199% | 457% | 603% | 577% | 542% | 614% |
| 1 | Returns for periods of less than one year are not annualized. |
The accompanying notes are an integral part of these financial statements.
Allspring Core Bond Portfolio | 53
Notes to financial statements (unaudited)
1. ORGANIZATION
Allspring Master Trust (the "Trust"), a Delaware statutory trust organized on March 10, 1999, is an open-end management investment company registered under the Investment Company Act of 1940, as amended (the "1940 Act"). As an investment company, the Trust follows the accounting and reporting guidance in Financial Accounting Standards Board ("FASB") Accounting Standards Codification Topic 946, Financial Services – Investment Companies. These financial statements report on the Allspring Core Bond Portfolio (the "Portfolio") which is a diversified series of the Trust.
Interests in the Portfolio are available solely through private placement transactions that do not involve any "public offering" within the meaning of Section 4(a)(2) of the Securities Act of 1933.
On February 23, 2021, Wells Fargo & Company entered into a definitive agreement to sell Wells Fargo Asset Management ("WFAM") to GTCR LLC and Reverence Capital Partners, L.P. WFAM was the trade name used by the asset management businesses of Wells Fargo & Company and included Wells Fargo Funds Management, LLC, Wells Capital Management, LLC, Wells Fargo Asset Management (International) Limited and Wells Fargo Funds Distributor, LLC. Effective on November 1, 2021, the sale transaction of WFAM by Wells Fargo & Company to GTCR LLC and Reverence Capital Partners, L.P. was closed. In connection with the closing of the transaction, WFAM became known as Allspring Global Investments (“Allspring”) and various entities that provide services to the Portfolio changed their names to "Allspring", including Allspring Funds Management, LLC (formerly Wells Fargo Funds Management, LLC), the adviser to the Portfolio, Allspring Global Investments, Inc. (formerly Wells Capital Management, LLC) and Allspring Global Investments (UK) Limited (formerly Wells Fargo Asset Management (International) Limited), both registered investment advisers providing subadvisory services to certain funds, and Allspring Funds Distributor, LLC (formerly Wells Fargo Funds Distributor, LLC).
Consummation of the transaction resulted in the automatic termination of the Portfolio’s advisory agreement and subadvisory agreement. The Portfolio’s Board of Trustees approved a new advisory agreement and subadvisory agreement which were approved by the Portfolio's interest holders on August 16, 2021. The new agreements became effective on November 1, 2021.
Effective December 6, 2021, "Wells Fargo" was removed from the Portfolio's name and replaced it with "Allspring".
2. SIGNIFICANT ACCOUNTING POLICIES
The following significant accounting policies, which are consistently followed in the preparation of the financial statements of the Portfolio, are in conformity with U.S. generally accepted accounting principles which require management to make estimates and assumptions that affect the reported amounts of assets and liabilities, disclosure of contingent assets and liabilities at the date of the financial statements, and the reported amounts of income and expenses during the reporting period. Actual results could differ from those estimates.
Securities valuation
All investments are valued each business day as of the close of regular trading on the New York Stock Exchange (generally 4 p.m. Eastern Time), although the Portfolio may deviate from this calculation time under unusual or unexpected circumstances.
Debt securities are valued at the evaluated bid price provided by an independent pricing service (e.g. taking into account various factors, including yields, maturities, or credit ratings) or, if a reliable price is not available, the quoted bid price from an independent broker-dealer.
Investments in registered open-end investment companies are valued at net asset value. Interests in non-registered investment companies that are redeemable at net asset value are fair valued normally at net asset value.
Investments which are not valued using any of the methods discussed above are valued at their fair value, as determined in good faith by the Board of Trustees. The Board of Trustees has established a Valuation Committee comprised of the Trustees and has delegated to it the authority to take any actions regarding the valuation of portfolio securities that the Valuation Committee deems necessary or appropriate, including determining the fair value of portfolio securities, unless the determination has been delegated to the Allspring Global Investments Pricing Committee at Allspring Funds Management, LLC ("Allspring Funds Management"). The Board of Trustees retains the authority to make or ratify any valuation decisions or approve any changes to the Valuation Procedures as it deems appropriate. On a quarterly basis, the Board of Trustees receives reports on any valuation actions taken by the Valuation Committee or the Allspring Global Investments Pricing Committee which may include items for ratification.
Securities lending
The Portfolio may lend its securities from time to time in order to earn additional income in the form of fees or interest on securities received as collateral or the investment of any cash received as collateral. When securities are on loan, the Portfolio
54 | Allspring Core Bond Portfolio
Notes to financial statements (unaudited)
receives interest or dividends on those securities. Cash collateral received in connection with its securities lending transactions is invested in Securities Lending Cash Investments, LLC (the "Securities Lending Fund"), an affiliated non-registered investment company. Investments in Securities Lending Fund are valued at the evaluated bid price provided by an independent pricing service. Income earned from investment in the Securities Lending Fund (net of fees and rebates), if any, is included in income from affiliated securities on the Statement of Operations.
In a securities lending transaction, the net asset value of the Portfolio is affected by an increase or decrease in the value of the securities loaned and by an increase or decrease in the value of the instrument in which collateral is invested. The amount of securities lending activity undertaken by the Portfolio fluctuates from time to time. The Portfolio has the right under the lending agreement to recover the securities from the borrower on demand. In the event of default or bankruptcy by the borrower, the Portfolio may be prevented from recovering the loaned securities or gaining access to the collateral or may experience delays or costs in doing so. In such an event, the terms of the agreement allow the unaffiliated securities lending agent to use the collateral to purchase replacement securities on behalf of the Portfolio or pay the Portfolio the market value of the loaned securities. The Portfolio bears the risk of loss with respect to depreciation of its investment of the cash collateral.
When-issued transactions
The Portfolio may purchase securities on a forward commitment or when-issued basis. The Portfolio records a when-issued transaction on the trade date and will segregate assets in an amount at least equal in value to the Portfolio's commitment to purchase when-issued securities. Securities purchased on a when-issued basis are marked-to-market daily and the Portfolio begins earning interest on the settlement date. Losses may arise due to changes in the market value of the underlying securities or if the counterparty does not perform under the contract.
Security transactions and income recognition
Securities transactions are recorded on a trade date basis. Realized gains or losses are recorded on the basis of identified cost.
Interest income is accrued daily and bond discounts are accreted and premiums are amortized daily. To the extent debt obligations are placed on non-accrual status, any related interest income may be reduced by writing off interest receivables when the collection of all or a portion of interest has been determined to be doubtful based on consistently applied procedures and the fair value has decreased. If the issuer subsequently resumes interest payments or when the collectability of interest is reasonably assured, the debt obligation is removed from non-accrual status. Interest income is recorded net of foreign taxes withheld where recovery of such taxes is not assured. Paydown gains and losses are included in interest income.
Federal and other taxes
The Portfolio is not required to pay federal income taxes on its net investment income and net capital gains as it is treated as a partnership for federal income tax purposes. All income, gains and losses of the Portfolio are deemed to have been “passed through” to the interest holders in proportion to their holdings of the Portfolio regardless of whether income and gains have been distributed by the Portfolio.
The Portfolio’s income tax returns and all financial records supporting those returns for the prior three fiscal years are subject to examination by the federal revenue authority. Management has analyzed the Portfolio’s tax positions taken on federal, state, and foreign tax returns for all open tax years and does not believe that there are any uncertain tax positions that require recognition of a tax liability.
As of November 30, 2021, the aggregate cost of all investments for federal income tax purposes was $6,089,138,247 and the unrealized gains (losses) consisted of:
| Gross unrealized gains | $ 65,660,516 |
| Gross unrealized losses | (46,891,618) |
| Net unrealized gains | $ 18,768,898 |
Allspring Core Bond Portfolio | 55
Notes to financial statements (unaudited)
3. FAIR VALUATION MEASUREMENTS
Fair value measurements of investments are determined within a framework that has established a fair value hierarchy based upon the various data inputs utilized in determining the value of the Portfolio’s investments. The three-level hierarchy gives the highest priority to unadjusted quoted prices in active markets for identical assets or liabilities (Level 1) and the lowest priority to unobservable inputs (Level 3). The Portfolio’s investments are classified within the fair value hierarchy based on the lowest level of input that is significant to the fair value measurement. The inputs are summarized into three broad levels as follows:
| ■ | Level 1 – quoted prices in active markets for identical securities |
| ■ | Level 2 – other significant observable inputs (including quoted prices for similar securities, interest rates, prepayment speeds, credit risk, etc.) |
| ■ | Level 3 – significant unobservable inputs (including the Portfolio’s own assumptions in determining the fair value of investments) |
The inputs or methodologies used for valuing investments in securities are not necessarily an indication of the risk associated with investing in those securities.
The following is a summary of the inputs used in valuing the Portfolio’s assets and liabilities as of November 30, 2021:
| | Quoted prices
(Level 1) | Other significant
observable inputs
(Level 2) | Significant
unobservable inputs
(Level 3) | Total |
| Assets | | | | |
| Investments in: | | | | |
| Agency securities | $ 0 | $ 1,460,611,794 | $0 | $ 1,460,611,794 |
| Asset-backed securities | 0 | 435,543,465 | 0 | 435,543,465 |
| Corporate bonds and notes | 0 | 1,359,502,533 | 0 | 1,359,502,533 |
| Municipal obligations | 0 | 23,921,151 | 0 | 23,921,151 |
| Non-agency mortgage-backed securities | 0 | 280,270,996 | 0 | 280,270,996 |
| U.S. Treasury securities | 1,978,414,740 | 0 | 0 | 1,978,414,740 |
| Yankee corporate bonds and notes | 0 | 297,036,303 | 0 | 297,036,303 |
| Yankee government bonds | 0 | 65,660,507 | 0 | 65,660,507 |
| Short-term investments | | | | |
| Investment companies | 206,945,656 | 0 | 0 | 206,945,656 |
| Total assets | $2,185,360,396 | $3,922,546,749 | $0 | $6,107,907,145 |
Additional sector, industry or geographic detail, if any, is included in the Portfolio of Investments.
For the six months ended November 30, 2021, the Portfolio did not have any transfers into/out of Level 3.
4. TRANSACTIONS WITH AFFILIATES
Advisory fee
The Trust has entered into an advisory contract with Allspring Funds Management, a wholly owned subsidiary of Allspring Global Investments Holdings, LLC, a holding company indirectly owned by certain private funds of GTCR LLC and Reverence Capital Partners, L.P. The adviser is responsible for implementing investment policies and guidelines and for supervising the subadviser, who is responsible for day-to-day portfolio management of the Portfolio. Pursuant to the contract, Allspring Funds Management is entitled to receive an advisory fee at the following annual rate based on the Portfolio’s average daily net assets:
56 | Allspring Core Bond Portfolio
Notes to financial statements (unaudited)
| Average daily net assets | Advisory fee |
| First $500 million | 0.400% |
| Next $500 million | 0.375 |
| Next $2 billion | 0.350 |
| Next $2 billion | 0.325 |
| Next $5 billion | 0.300 |
| Over $10 billion | 0.290 |
For the six months ended November 30, 2021, the advisory fee was equivalent to an annual rate of 0.34% of the Portfolio’s average daily net assets.
Allspring Funds Management has retained the services of a subadviser to provide daily portfolio management to the Portfolio. The fee for subadvisory services is borne by Allspring Funds Management. Allspring Global Investments, LLC ("Allspring Investments"), an affiliate of Allspring Funds Management and a wholly owned subsidiary of Allspring Global Investments Holdings, LLC, is the subadviser to the Portfolio and is entitled to receive a fee from Allspring Funds Management at an annual rate starting at 0.20% and declining to 0.10% as the average daily net assets of the Portfolio increase.
Interfund transactions
The Portfolio may purchase or sell portfolio investment securities to certain affiliates pursuant to Rule 17a-7 under the 1940 Act and under procedures adopted by the Board of Trustees. The procedures have been designed to ensure that these interfund transactions, which do not incur broker commissions, are effected at current market prices.
5. INVESTMENT PORTFOLIO TRANSACTIONS
Purchases and sales of investments, excluding short-term securities, for the six months ended November 30, 2021 were as follows:
| Purchases at cost | | Sales proceeds |
U.S.
government | Non-U.S.
government | | U.S.
government | Non-U.S.
government |
| $10,161,411,419 | $1,851,155,342 | | $10,018,697,004 | $1,829,829,294 |
6. SECURITIES LENDING TRANSACTIONS
The Portfolio lends its securities through an unaffiliated securities lending agent and receives collateral in the form of cash or securities with a value at least equal to the value of the securities on loan. The value of the loaned securities is determined at the close of each business day and any increases or decreases in the required collateral are exchanged between the Portfolio and the counterparty on the next business day. Cash collateral received is invested in the Securities Lending Fund which seeks to provide a positive return compared to the daily Federal Funds Open Rate by investing in high-quality, U.S. dollar-denominated short-term money market instruments and is exempt from registration under Section 3(c)(7) of the 1940 Act. Securities Lending Fund is managed by Allspring Funds Management and is subadvised by Allspring Investments. Allspring Funds Management receives an advisory fee starting at 0.05% and declining to 0.01% as the average daily net assets of the Securities Lending Fund increase. All of the fees received by Allspring Funds Management are paid to Allspring Investments for its services as subadviser.
In the event of counterparty default or the failure of a borrower to return a loaned security, the Portfolio has the right to use the collateral to offset any losses incurred. As of November 30, 2021, the Portfolio had securities lending transactions with the following counterparties which are subject to offset:
| Counterparty | Values of
securities on
loaned | Collateral
received1 | Net amount |
| Nomura Securities International Incorporated | $831,090 | $(831,090) | $0 |
1 Collateral received within this table is limited to the collateral for the net transaction with the counterparty.
Allspring Core Bond Portfolio | 57
Notes to financial statements (unaudited)
7. BANK BORROWINGS
The Trust, along with Allspring Variable Trust and Allspring Funds Trust (excluding the money market funds), are parties to a $350,000,000 revolving credit agreement whereby the Portfolio is permitted to use bank borrowings for temporary or emergency purposes, such as to fund interest holders withdrawal requests. Interest under the credit agreement is charged to the Portfolio based on a borrowing rate equal to the higher of the Federal Funds rate in effect on that day plus 1.25% or the overnight bank funding rate in effect on that day plus 1.25%. In addition, an annual commitment fee equal to 0.25% of the unused balance is allocated to each participating fund.
For the six months ended November 30, 2021, there were no borrowings by the Portfolio under the agreement.
8. INDEMNIFICATION
Under the Portfolio's organizational documents, the officers and Trustees have been granted certain indemnification rights against certain liabilities that may arise out of performance of their duties to the Portfolio. The Portfolio has entered into a separate agreement with each Trustee that converts indemnification rights currently existing under the Portfolio’s organizational documents into contractual rights that cannot be changed in the future without the consent of the Trustee. Additionally, in the normal course of business, the Portfolio may enter into contracts with service providers that contain a variety of indemnification clauses. The Portfolio’s maximum exposure under these arrangements is dependent on future claims that may be made against the Portfolio and, therefore, cannot be estimated.
9. CORONAVIRUS (COVID-19) PANDEMIC
On March 11, 2020, the World Health Organization announced that it had made the assessment that coronavirus disease 2019 (“COVID-19”) is a pandemic. The impacts of COVID-19 are affecting the entire global economy, individual companies and investment products, the funds, and the market in general. There is significant uncertainty around the extent and duration of business disruptions related to COVID-19 and the impacts may last for an extended period of time. COVID-19 has led to significant uncertainty and volatility in the financial markets.
58 | Allspring Core Bond Portfolio
Other information (unaudited)
PROXY VOTING INFORMATION
A description of the policies and procedures used to determine how to vote proxies relating to portfolio securities is available without charge, upon request, by calling 1-800-222-8222, visiting our website at allspringglobal.com, or visiting the SEC website at sec.gov. Information regarding how the proxies related to portfolio securities were voted during the most recent 12-month period ended June 30 is available on the website at allspringglobal.com or by visiting the SEC website at sec.gov.
SPECIAL MEETING OF SHAREHOLDERS
On August 16, 2021, a Special Meeting of Shareholders for Allspring Core Bond Fund was held to consider the following proposals. The results of the proposals are indicated below.
Proposal 1 – To consider and approve a new investment management agreement with Wells Fargo Funds Management, LLC*.
| Shares voted “For” | 222,470,589 |
| Shares voted “Against” | 2,536,231 |
| Shares voted “Abstain” | 2,681,236 |
Proposal 2 – To consider and approve a new advisory agreement with Wells Fargo Funds Management, LLC* for Allspring Core Bond Portfolio in which the Fund invests substantially all of its assets.
| Shares voted “For” | 222,578,756 |
| Shares voted “Against” | 2,408,143 |
| Shares voted “Abstain” | 2,701,157 |
Proposal 3 – To consider and approve a new subadvisory agreement with Wells Capital Management, LLC** for Allspring Core Bond Portfolio.
| Shares voted “For” | 222,358,286 |
| Shares voted “Against” | 2,651,918 |
| Shares voted “Abstain” | 2,677,852 |
* Effective November 1, 2021, known as Allspring Funds Management, LLC.
** Effective November 1, 2021, known as Allspring Global Investments, LLC.
QUARTERLY PORTFOLIO HOLDINGS INFORMATION
The Fund and Portfolio file their complete schedule of portfolio holdings with the SEC for the first and third quarters of each fiscal year as an exhibit to their reports on Form N-PORT. Shareholders and Interest holders may view the filed Form N-PORT by visiting the SEC website at sec.gov.
Allspring Core Bond Fund | 59
Other information (unaudited)
BOARD OF TRUSTEES AND OFFICERS
Each of the Trustees and Officers listed in the table below acts in identical capacities for each fund in the Allspring family of funds, which consists of 139 mutual funds comprising the Allspring Funds Trust, Allspring Variable Trust, Allspring Master Trust and four closed-end funds (collectively the “Fund Complex”). This table should be read in conjunction with the Prospectus and the Statement of Additional Information1. The mailing address of each Trustee and Officer is 525 Market Street, 12th Floor, San Francisco, CA 94105. Each Trustee and Officer serves an indefinite term, however, each Trustee serves such term until reaching the mandatory retirement age established by the Trustees.
Independent Trustees
Name and
year of birth | Position held and
length of service* | Principal occupations during past five years or longer | Current other
public company or
investment
company
directorships |
William R. Ebsworth
(Born 1957) | Trustee,
since 2015 | Retired. From 1984 to 2013, equities analyst, portfolio manager, research director and chief investment officer at Fidelity Management and Research Company in Boston, Tokyo, and Hong Kong, and retired in 2013 as Chief Investment Officer of Fidelity Strategic Advisers, Inc. where he led a team of investment professionals managing client assets. Prior thereto, Board member of Hong Kong Securities Clearing Co., Hong Kong Options Clearing Corp., the Thailand International Fund, Ltd., Fidelity Investments Life Insurance Company, and Empire Fidelity Investments Life Insurance Company. Audit Committee Chair and Investment Committee Chair of the Vincent Memorial Hospital Endowment (non-profit organization). Mr. Ebsworth is a CFA® charterholder. | N/A |
Jane A. Freeman
(Born 1953) | Trustee,
since 2015;
Chair Liaison,
since 2018 | Retired. From 2012 to 2014 and 1999 to 2008, Chief Financial Officer of Scientific Learning Corporation. From 2008 to 2012, Ms. Freeman provided consulting services related to strategic business projects. Prior to 1999, Portfolio Manager at Rockefeller & Co. and Scudder, Stevens & Clark. Board member of the Harding Loevner Funds from 1996 to 2014, serving as both Lead Independent Director and chair of the Audit Committee. Board member of the Russell Exchange Traded Funds Trust from 2011 to 2012 and the chair of the Audit Committee. Ms. Freeman is also an inactive Chartered Financial Analyst. | N/A |
Isaiah Harris, Jr.
(Born 1952) | Trustee,
since 2009; Audit
Committee
Chair,
since 2019 | Retired. Chairman of the Board of CIGNA Corporation from 2009 to 2021, and Director from 2005 to 2008. From 2003 to 2011, Director of Deluxe Corporation. Prior thereto, President and CEO of BellSouth Advertising and Publishing Corp. from 2005 to 2007, President and CEO of BellSouth Enterprises from 2004 to 2005 and President of BellSouth Consumer Services from 2000 to 2003. Emeritus member of the Iowa State University Foundation Board of Governors. Emeritus Member of the Advisory Board of Iowa State University School of Business. Advisory Board Member, Palm Harbor Academy (private school). Advisory Board Member, Fellowship of Christian Athletes. Mr. Harris is a certified public accountant (inactive status). | N/A |
Judith M. Johnson**
(Born 1949) | Trustee,
since 2008 | Retired. Prior thereto, Chief Executive Officer and Chief Investment Officer of Minneapolis Employees Retirement Fund from 1996 to 2008. Ms. Johnson is an attorney, certified public accountant and a certified managerial accountant. | N/A |
David F. Larcker
(Born 1950) | Trustee,
since 2009 | James Irvin Miller Professor of Accounting at the Graduate School of Business (Emeritus), Stanford University, Director of the Corporate Governance Research Initiative and Senior Faculty of The Rock Center for Corporate Governance since 2006. From 2005 to 2008, Professor of Accounting at the Graduate School of Business, Stanford University. Prior thereto, Ernst & Young Professor of Accounting at The Wharton School, University of Pennsylvania from 1985 to 2005. | N/A |
60 | Allspring Core Bond Fund
Other information (unaudited)
Name and
year of birth | Position held and
length of service* | Principal occupations during past five years or longer | Current other
public company or
investment
company
directorships |
Olivia S. Mitchell
(Born 1953) | Trustee,
since 2006;
Nominating and
Governance
Committee Chair,
since 2018 | International Foundation of Employee Benefit Plans Professor since 1993, Wharton School of the University of Pennsylvania. Director of Wharton’s Pension Research Council and Boettner Center on Pensions & Retirement Research, and Research Associate at the National Bureau of Economic Research. Previously taught at Cornell University from 1978 to 1993. | N/A |
Timothy J. Penny
(Born 1951) | Trustee,
since 1996;
Chair,
since 2018 | President and Chief Executive Officer of Southern Minnesota Initiative Foundation, a non-profit organization, since 2007. Member of the Board of Trustees of NorthStar Education Finance, Inc., a non-profit organization, since 2007. | N/A |
James G. Polisson
(Born 1959) | Trustee,
since 2018 | Retired. Chief Marketing Officer, Source (ETF) UK Services, Ltd, from 2015 to 2017. From 2012 to 2015, Principal of The Polisson Group, LLC, a management consulting, corporate advisory and principal investing company. Chief Executive Officer and Managing Director at Russell Investments, Global Exchange Traded Funds from 2010 to 2012. Managing Director of Barclays Global Investors from 1998 to 2010 and Global Chief Marketing Officer for iShares and Barclays Global Investors from 2000 to 2010. Trustee of the San Francisco Mechanics’ Institute, a non-profit organization, from 2013 to 2015. Board member of the Russell Exchange Traded Fund Trust from 2011 to 2012. Director of Barclays Global Investors Holdings Deutschland GmbH from 2006 to 2009. Mr. Polisson is an attorney and has a retired status with the Massachusetts and District of Columbia Bar Associations. | N/A |
Pamela Wheelock
(Born 1959) | Trustee,
since January
2020; previously
Trustee from
January 2018 to
July 2019 | Board member of the Destination Medical Center Economic Development Agency, Rochester, Minnesota since 2019. Interim President of the McKnight Foundation from January to September 2020. McKnight Foundation Consultant, November 2020 to February 2021. Acting Commissioner, Minnesota Department of Human Services, July 2019 through September 2019. Consultant (part-time), Minnesota Department of Human Services, October 2019 through December 2019. Chief Operating Officer, Twin Cities Habitat for Humanity from 2017 to 2019. Vice President of University Services, University of Minnesota from 2012 to 2016. Prior thereto, on the Board of Directors, Governance Committee and Finance Committee for the Minnesota Philanthropy Partners (Saint Paul Foundation) from 2012 to 2018, Interim Chief Executive Officer of Blue Cross Blue Shield of Minnesota from 2011 to 2012, Chairman of the Board from 2009 to 2012 and Board Director from 2003 to 2015. Vice President, Leadership and Community Engagement, Bush Foundation, Saint Paul, Minnesota (a private foundation) from 2009 to 2011. Executive Vice President and Chief Financial Officer, Minnesota Sports and Entertainment from 2004 to 2009 and Senior Vice President from 2002 to 2004. Executive Vice President of the Minnesota Wild Foundation from 2004 to 2008. Commissioner of Finance, State of Minnesota, from 1999 to 2002. Currently Board Chair of the Minnesota Wild Foundation since 2010. | N/A |
* Length of service dates reflect the Trustee’s commencement of service with the Trust’s predecessor entities, where applicable.
** Ms. Johnson has resigned from the Board effective December 31, 2021.
Allspring Core Bond Fund | 61
Other information (unaudited)
Officers2
Name and
year of birth | Position held and
length of service | Principal occupations during past five years or longer |
Andrew Owen
(Born 1960) | President,
since 2017 | President, Chief Executive Officer and Director of Allspring Funds Management, LLC since 2017 and co-president of Galliard Capital Management, LLC, an affiliate of Allspring Funds Management, LLC, since 2019. Prior thereto, Head of Affiliated Managers, Allspring Global Investments, from 2014 to 2019 and Executive Vice President responsible for marketing, investments and product development for Allspring Funds Management, LLC, from 2009 to 2014. In addition, Mr. Owen was an Executive Vice President of Wells Fargo & Company from 2014 to 2021. |
Jeremy DePalma
(Born 1974) | Treasurer,
since 2012
(for certain funds in
the Fund Complex);
since 2021 (for
the remaining funds in the
Fund Complex) | Senior Vice President of Allspring Funds Management, LLC since 2009. Senior Vice President of Evergreen Investment Management Company, LLC from 2008 to 2010 and head of the Fund Reporting and Control Team within Fund Administration. |
Kate McKinley
(Born 1977) | Chief Legal Officer,
since 2021 | Chief Legal Officer of Allspring Global Investments since 2021. Prior thereto, held various roles at State Street Global Advisors beginning in 2010, including serving as Senior Vice President and General Counsel from 2019 to 2021, and Chief Operating Officer of the Institutional Client Group from 2016 - 2019. Prior to working at State Street Global Advisors served as Assistant General Counsel for Bank of America Corporation from 2005 to 2010 and as an Associate at WilmerHale from 2002 to 2005. |
Christopher Baker
(Born 1976) | Chief Compliance Officer, since 2022 | Global Chief Compliance Officer for Allspring Global Investments since 2022. Prior thereto, Chief Compliance Officer for State Street Global Advisors from 2018 to 2021. Senior Compliance Officer for the State Street divisions of Alternative Investment Solutions, Sector Solutions, and Global Marketing from 2015 to 2018. From 2010 to 2015 Vice President, Global Head of Investment and Marketing Compliance for State Street Global Advisors. |
Matthew Prasse
(Born 1983) | Secretary,
since 2021 | Senior Counsel of the Allspring Legal Department since 2021. Senior Counsel of the Wells Fargo Legal Department from 2018 to 2021. Previously, Counsel for Barings LLC from 2015 to 2018. Prior to joining Barings, Associate at Morgan, Lewis & Bockius LLP from 2008 to 2015. |
1 The Statement of Additional Information includes additional information about the Trustees and is available, without charge, upon request, by calling 1-800-222-8222 or by visiting the website at allspringglobal.com.
2 For those Officers with tenures at Allspring Global Investments and/or Allspring Funds Management, LLC that began prior to 2021, such tenures include years of service during which these businesses/entities were known as Wells Fargo Asset Management and Wells Fargo Funds Management, LLC, respectively.
62 | Allspring Core Bond Fund
For more information
More information about Allspring Funds is available free upon request. To obtain literature, please write, visit the Fund's website, or call:
Allspring Funds
P.O. Box 219967
Kansas City, MO 64121-9967
Website: allspringglobal.com
Individual investors: 1-800-222-8222
Retail investment professionals: 1-888-877-9275
Institutional investment professionals: 1-866-765-0778
This report and the financial statements contained herein are submitted for the general information of the shareholders of the Fund. If this report is used for promotional purposes, distribution of the report must be accompanied or preceded by a current prospectus. Before investing, please consider the investment objectives, risks, charges, and expenses of the investment. For a current prospectus and, if available, a summary prospectus, containing this information, call
1-800-222-8222 or visit the Fund's website at allspringglobal.com. Read the prospectus carefully before you invest or send money.
Allspring Global InvestmentsTM is the trade name for the asset management firms of Allspring Global Investments Holdings, LLC, a holding company indirectly owned by certain private funds of GTCR LLC and Reverence Capital Partners, L.P. These firms include but are not limited to Allspring Global Investments, LLC, and Allspring Funds Management, LLC. Certain products managed by Allspring entities are distributed by Allspring Funds Distributor, LLC (a broker-dealer and Member FINRA/SIPC).
This material is for general informational and educational purposes only and is NOT intended to provide investment advice or a recommendation of any kind - including a recommendation for any specific investment, strategy, or plan.
© 2022 Allspring Global Investments Holdings, LLC. All rights reserved.
PAR-1221-00199 01-22
SA287/SAR287 11-21
Semi-Annual Report
November 30, 2021
Allspring Real Return Fund
The views expressed and any forward-looking statements are as of November 30, 2021, unless otherwise noted, and are those of the Fund's portfolio managers and/or Allspring Global Investments. Discussions of individual securities or the markets generally are not intended as individual recommendations. Future events or results may vary significantly from those expressed in any forward-looking statements. The views expressed are subject to change at any time in response to changing circumstances in the market. Allspring Global Investments disclaims any obligation to publicly update or revise any views expressed or forward-looking statements.
Allspring Real Return Fund | 1
Letter to shareholders (unaudited)
Andrew Owen
President
Allspring Funds
Dear Shareholder:
We are pleased to offer you this semi-annual report for Allspring Real Return Fund for the six-month period that ended November 30, 2021. Global stocks yielded mixed results as the global economy continued to emerge from the haze of COVID-19. Tailwinds were provided by global stimulus programs, a rapid vaccination rollout, and recovering consumer and corporate sentiment. The bond market had mostly positive returns during the period.
For the six-month period, U.S. stocks, based on the S&P 500 Index,1 gained 9.38%. International stocks, as measured by the MSCI ACWI ex USA Index (Net),2 returned -5.76%, while the MSCI EM Index (Net) (USD),3 trailed its developed market counterparts with a 10.81% loss. Among bond indexes, the Bloomberg U.S. Aggregate Bond Index,4 returned 1.02%, the Bloomberg Global Aggregate ex-USD Index (unhedged),5 returned -4.64%, the Bloomberg Municipal Bond Index6 returned 0.56%, and the ICE BofA U.S. High Yield Index,7 gained 1.09%.
Vaccination rollout drove the stock markets to new highs.
June witnessed the S&P 500 Index reach a new all-time high. 2021 economic growth and inflation forecasts were revised higher to reflect a strong economic recovery and some supply and demand imbalances. Late June saw a deal reached on a U.S. infrastructure package of approximately $1 trillion for road, bridge, and broadband network upgrades over the next eight years. The U.S. Federal Reserve's (Fed) June meeting yielded no change to policy, but its projections pointed to a possible interest rate rise in 2023. This, combined with a rebound in economic activity and investors searching for yield, led to U.S. Treasury yields being down for the month. Many European and Asian countries saw vaccination momentum increase, while the U.K. dealt with a rise in COVID-19 infections, specifically the Delta variant. Meanwhile, crude oil jumped over 10% in June on the back of the pickup in global economic activity and the Organization of the Petroleum Exporting Countries’ (OPEC) slow pace of supply growth.
“2021 economic growth and inflation forecasts were revised higher to reflect a strong economic recovery and some supply and demand imbalances.”
| 1 | The S&P 500 Index consists of 500 stocks chosen for market size, liquidity, and industry group representation. It is a market-value-weighted index with each stock's weight in the index proportionate to its market value. You cannot invest directly in an index. |
| 2 | The Morgan Stanley Capital International (MSCI) All Country World Index (ACWI) ex USA Index (Net) is a free-float-adjusted market-capitalization-weighted index that is designed to measure the equity market performance of developed and emerging markets, excluding the U.S. Source: MSCI. MSCI makes no express or implied warranties or representations and shall have no liability whatsoever with respect to any MSCI data contained herein. The MSCI data may not be further redistributed or used as a basis for other indexes or any securities or financial products. This report is not approved, reviewed, or produced by MSCI. You cannot invest directly in an index. |
| 3 | The MSCI Emerging Markets (EM) Index (Net) (USD) is a free-float-adjusted market-capitalization-weighted index that is designed to measure equity market performance of emerging markets. You cannot invest directly in an index. |
| 4 | The Bloomberg U.S. Aggregate Bond Index is a broad-based benchmark that measures the investment-grade, U.S.-dollar-denominated, fixed-rate taxable bond market, including Treasuries, government-related and corporate securities, mortgage-backed securities (agency fixed-rate and hybrid adjustable-rate mortgage pass-throughs), asset-backed securities, and commercial mortgage-backed securities. You cannot invest directly in an index. |
| 5 | The Bloomberg Global Aggregate ex-USD Index (unhedged) is an unmanaged index that provides a broad-based measure of the global investment-grade fixed-income markets excluding the U.S.-dollar-denominated debt market. You cannot invest directly in an index. |
| 6 | The Bloomberg Municipal Bond Index is an unmanaged index composed of long-term tax-exempt bonds with a minimum credit rating of Baa. You cannot invest directly in an index. |
| 7 | The ICE BofA U.S. High Yield Index is a market-capitalization-weighted index of domestic and Yankee high-yield bonds. The index tracks the performance of high-yield securities traded in the U.S. bond market. You cannot invest directly in an index. Copyright 2022. ICE Data Indices, LLC. All rights reserved. |
2 | Allspring Real Return Fund
Letter to shareholders (unaudited)
July began the month seeing vaccinations making progress, as several major developed countries eased restrictions, only to be threatened again by the spread of COVID-19’s Delta variant. Inflation continued to climb, aided by the continued supply bottleneck in the face of high demand. As it pertains to the equity area of the market, U.S. equities led the way in positive return territory, followed by international developed markets. In contrast, emerging markets were well in negative territory for the month, hindered by China’s plans for new regulations on a number of sectors, specifically education and technology. The U.S. 10-Year Treasury bond yield continued to decline, as strong demand swallowed up supply. After hitting a multi-year high earlier in the month, oil prices leveled off following an agreement by OPEC to raise oil production starting in August.
The Delta variant of COVID-19 produced outbreaks globally in August, increasing the potential for increased market volatility and bringing into question the ongoing economic recovery. Domestically, the U.S. economy continued to stay strong in the face of the Delta variant, continued inflationary pressures, and worries over Hurricane Ida. Emerging market equities experienced elevated volatility, largely influenced by China’s regulatory stance. Emerging market equities started the month with poor performance but rebounded to end the month in positive territory. Municipal debt experienced its first monthly performance drop since February of this year, slowing a rally that made it one of the best-performing sectors of the bond market. In the commodity segment of the market, crude oil fell sharply during the month on the back of dampened expectations as a result of the Delta variant but was still a leading asset class performer for the year.
Global markets suffered their broadest retreat in a year during September, with the exception of commodities. Concerns over inflation and the interest rate outlook depressed investor confidence and hurt performance. Emerging markets declined on concerns over the continued supply chain disruptions and worries over higher energy and food prices. Meanwhile, the Fed indicated it would slow the pace of asset purchases in the near future. All eyes domestically were fixed on the raising of the debt ceiling, the 2022 budget plan, and the ongoing debate over the infrastructure package. Contrary to most asset classes, commodities thrived in September, driven by sharply higher energy prices.
October’s key themes continued to be elevated inflation pressures and a supply bottleneck, but strong earnings provided a bright spot in the markets. Earnings releases in the U.S. were generally strong and consumer confidence was high. The Fed reaffirmed its plans to taper quantitative easing to a stop by mid-2022. Meanwhile, elevated inflation figures were still being considered transitory by the Fed. Similar to the U.S., the eurozone and many Asian countries saw positive earnings but were facing inflation pressures caused by supply bottlenecks while also experiencing energy price increases amid natural gas shortages. Globally, government bond yields rose as central banks prepared to lower monetary policy accommodation in the face of rising inflationary pressures. As previously referenced, positive commodity performance was driven by sharply higher energy costs.
November was dominated by rising COVID-19 hospitalizations and concerns regarding the Omicron variant. Most major asset classes, both domestically and internationally, declined in November with two exceptions: U.S. investment-grade bonds and Treasury Inflation-Protected Securities. The United Nations Climate Change Conference (COP26) took place during the month with hopes of agreement among countries to limit global warming. While several initiatives were discussed, the conference ultimately ended without the specifics required to instill confidence that the limiting of global warming would succeed. In the U.S., President Biden signed a long-awaited infrastructure bill to upgrade U.S. roads, bridges, and railways. Meanwhile, the Consumer Price Index1, a measure of domestic inflation conditions, jumped to its highest level in 31 years. While the threat of consistently high inflation led the Fed to discuss a faster pace of tapering, the Omicron strain makes that less likely to occur. Commodities came in negative for the month, largely driven by sharp declines in oil prices (and energy costs in general), as well as precious metals.
“ Municipal debt experienced its first monthly performance drop since February of this year, slowing a rally that made it one of the best-performing sectors of the bond market.”
| 1 | The Consumer Price Index (CPI) is a measure of the average change over time in the prices paid by urban consumers for a market basket of consumer goods and services. You cannot invest directly in an index. |
Allspring Real Return Fund | 3
Letter to shareholders (unaudited)
Don’t let short-term uncertainty derail long-term investment goals.
Periods of investment uncertainty can present challenges, but experience has taught us that maintaining long-term investment goals can be an effective way to plan for the future. To help you create a sound strategy based on your personal goals and risk tolerance, Allspring Funds offers more than 100 mutual funds spanning a wide range of asset classes and investment styles. Although diversification cannot guarantee an investment profit or prevent losses, we believe it can be an effective way to manage investment risk and potentially smooth out overall portfolio performance. We encourage investors to know their investments and to understand that appropriate levels of risk-taking may unlock opportunities.
Information on transaction closing.
On November 1, 2021, GTCR LLC and Reverence Capital Partners, L.P., announced the beginning of Allspring Global Investments™, with the close of the transaction to acquire Wells Fargo Funds Management, LLC; Wells Capital Management LLC; Galliard Capital Management LLC.; Wells Fargo Asset Management (International) Ltd.; Wells Fargo Asset Management Luxembourg S.A.; and Wells Fargo Funds Distributor, LLC, as well as Wells Fargo Bank, N.A.’s business of acting as trustee to its collective investment trusts and all related Wells Fargo Asset Management legal entities. The transaction closed on November 1, 2021, forming Allspring Global Investments, a privately held asset management firm with $587 billion in AUM1 as of September 30, 2021.
Allspring Global Investments™ is a leading independent asset management firm with a full breadth of investment capabilities across diverse asset classes, serving the needs of its institutional and wealth management clients around the world. Allspring operates across 18 offices globally supported by more than 480 investment professionals. Allspring and its investment teams provide a broad range of differentiated investment products and solutions to help its diverse range of clients meet their investment objectives.
As part of this transition, all mutual funds within the Wells Fargo Funds family were rebranded as Allspring Funds. Each individual fund had “Wells Fargo” removed from its fund name and replaced with “Allspring.” The fund name changes went into effect on December 6, 2021.
Allspring Global Investments is the trade name for the asset management firms of Allspring Global Investments Holdings, LLC, a holding company indirectly owned by certain private funds of GTCR LLC and Reverence Capital Partners, L.P.
Thank you for choosing to invest with Allspring Funds. We appreciate your confidence in us and remain committed to helping you meet your financial needs.
Sincerely,
Andrew Owen
President
Allspring Funds
For further information about your Fund, contact your investment professional, visit our website at allspringglobal.com, or call us directly at 1-800-222-8222.
| 1 | As of September 30, 2021, assets under management (AUM) includes $93 billion from Galliard Capital Management, LLC, an investment advisor that is not part of the Allspring trade name/GIPS firm. |
4 | Allspring Real Return Fund
This page is intentionally left blank.
Performance highlights (unaudited)
| Investment objective | The Fund seeks returns that exceed the rate of inflation over the long-term. |
| Manager | Allspring Funds Management, LLC |
Subadviser for the affiliated master portfolio*
Allspring Global Investments, LLC
| Portfolio managers | Kandarp R. Acharya, CFA®‡, FRM, Petros N. Bocray, CFA®‡, FRM, Michael Bradshaw, CFA®‡, Christian L. Chan, CFA®‡, Garth B. Newport, CFA®‡, Michael Schueller, CFA®‡, Michal Stanczyk† |
| Average annual total returns (%) as of November 30, 2021 |
| | | Including sales charge | | Excluding sales charge | | Expense ratios1 (%) |
| | Inception date | 1 year | 5 year | 10 year | | 1 year | 5 year | 10 year | | Gross | Net 2 |
| Class A (IPBAX) | 2-28-2003 | 2.57 | 3.85 | 2.27 | | 7.40 | 4.81 | 2.74 | | 1.26 | 0.78 |
| Class C (IPBCX) | 2-28-2003 | 5.46 | 4.01 | 1.96 | | 6.46 | 4.01 | 1.96 | | 2.01 | 1.53 |
| Class R6 (IPBJX)3 | 10-31-2016 | – | – | – | | 7.81 | 5.19 | 3.06 | | 0.88 | 0.40 |
| Administrator Class (IPBIX) | 2-28-2003 | – | – | – | | 7.52 | 5.00 | 2.97 | | 1.20 | 0.60 |
| Institutional Class (IPBNX)4 | 10-31-2016 | – | – | – | | 7.66 | 5.14 | 3.03 | | 0.93 | 0.45 |
| Bloomberg U.S. TIPS Index5 | – | – | – | – | | 6.83 | 5.25 | 3.06 | | – | – |
| CPI 6 | – | – | – | – | | 6.81 | 2.86 | 2.08 | | – | – |
Figures quoted represent past performance, which is no guarantee of future results, and do not reflect taxes that a shareholder may pay on an investment in a fund. Investment return and principal value of an investment will fluctuate so that an investor’s shares, when redeemed, may be worth more or less than their original cost. Performance shown without sales charges would be lower if sales charges were reflected. Current performance may be lower or higher than the performance data quoted, which assumes the reinvestment of dividends and capital gains. Current month-end performance is available on the Fund’s website, allspringglobal.com.
Index returns do not include transaction costs associated with buying and selling securities, any mutual fund fees or expenses, or any taxes. It is not possible to invest directly in an index.
For Class A shares, the maximum front-end sales charge is 4.50%. For Class C shares, the maximum contingent deferred sales charge is 1.00%. Performance including a contingent deferred sales charge assumes the sales charge for the corresponding time period. Class R6, Administrator Class and Institutional Class shares are sold without a front-end sales charge or contingent deferred sales charge.
| 1 | Reflects the expense ratios as stated in the most recent prospectuses. The expense ratios shown are subject to change and may differ from the annualized expense ratios shown in the financial highlights of this report. |
| 2 | The manager has contractually committed through September 30, 2022, to waive fees and/or reimburse expenses to the extent necessary to cap total annual fund operating expenses after fee waivers at 0.78% for Class A, 1.53% for Class C, 0.40% for Class R6, 0.60% for Administrator Class, and 0.45% for Institutional Class. Brokerage commissions, stamp duty fees, interest, taxes, acquired fund fees and expenses (if any) from funds in which the affiliated master portfolio invests, and extraordinary expenses are excluded from the expense caps. Net expenses from the affiliated master portfolio are included in the expense caps. Prior to or after the commitment expiration date, the caps may be increased or the commitment to maintain the caps may be terminated only with the approval of the Board of Trustees. Without these caps, the Fund’s returns would have been lower. The expense ratio paid by an investor is the net expense ratio (the total annual fund operating expenses after fee waivers) as stated in the prospectuses. |
| 3 | Historical performance shown for the Class R6 shares prior to their inception reflects the performance of the Administrator Class shares, and is not adjusted to reflect the Class R6 expenses. If these expenses had been included, returns for the Class R6 shares would be higher. |
| 4 | Historical performance shown for the Institutional Class shares prior to their inception reflects the performance of the Administrator Class shares, and includes the higher expenses applicable to the Institutional Class shares. If these expenses had been included, returns for the Institutional Class shares would be higher. |
| 5 | The Bloomberg U.S. Treasury Inflation-Protected Securities (TIPS) Index is an index of inflation-indexed-linked U.S. Treasury securities. You cannot invest directly in an index. |
| 6 | The Consumer Price Index (CPI) for All Urban Consumers in U.S. All Items is published monthly by the U.S. government as an indicator of changes in price levels (or inflation) paid by urban consumers for a representative basket of goods and services. You cannot invest directly in an index. |
| * | The Fund is a feeder fund in a master-feeder structure that invests substantially all of its assets in a single affiliated master portfolio of the Allspring Master Trust with a substantially identical investment objective and substantially similar investment strategies. References to the investment activities of the Fund are intended to refer to the investment activities of the affiliated master portfolio in which it invests. |
| ‡ | CFA® and Chartered Financial Analyst® are trademarks owned by CFA Institute. |
| † | Michal Stanczyk became portfolio manager of the Fund on June 30, 2021. |
6 | Allspring Real Return Fund
Performance highlights (unaudited)
Bond values fluctuate in response to the financial condition of individual issuers, general market and economic conditions, and changes in interest rates. Changes in market conditions and government policies may lead to periods of heightened volatility in the bond market and reduced liquidity for certain bonds held by the Fund. In general, when interest rates rise, bond values fall and investors may lose principal value. Interest rate changes and their impact on the Fund and its share price can be sudden and unpredictable. Stock values fluctuate in response to the activities of individual companies and general market and economic conditions. High-yield securities have a greater risk of default and tend to be more volatile than higher-rated debt securities. Loans are subject to risks similar to those associated with other below-investment-grade bond investments, such as credit risk (for example, risk of issuer default), below-investment-grade bond risk (for example, risk of greater volatility in value), and risk that the loan may become illiquid or difficult to price. The use of derivatives may reduce returns and/or increase volatility. Foreign investments are especially volatile and can rise or fall dramatically due to differences in the political and economic conditions of the host country. These risks are generally intensified in emerging markets. Securities issued by U.S. government agencies or government-sponsored entities may not be guaranteed by the U.S. Treasury. This fund is exposed to mortgage- and asset-backed securities risk and small-company securities risk. Consult the Fund’s prospectus for additional information on these and other risks.
Allspring Real Return Fund | 7
Performance highlights (unaudited)
| Ten largest holdings (%) as of November 30, 20211 |
| TIPS, 0.63%, 1-15-2026 | 2.69 |
| TIPS, 0.13%, 4-15-2026 | 2.69 |
| TIPS, 0.63%, 1-15-2024 | 2.43 |
| TIPS, 0.38%, 7-15-2023 | 2.23 |
| TIPS, 0.25%, 1-15-2025 | 2.21 |
| TIPS, 0.13%, 1-15-2031 | 2.18 |
| TIPS, 0.13%, 1-15-2030 | 2.13 |
| TIPS, 0.25%, 2-15-2050 | 2.04 |
| TIPS, 0.63%, 4-15-2023 | 1.96 |
| TIPS, 0.13%, 7-15-2030 | 1.93 |
| 1 | Each holding represents the Fund’s allocable portion of the affiliated master portfolio security. Figures represent each holding as a percentage of the Fund’s net assets. Holdings are subject to change and may have changed since the date specified. |
| Portfolio allocation as of November 30, 2021 |
| 1 | Figures represent the sector allocation of the affiliated master portfolio as a percentage of the long-term investments of the affiliated master portfolio. These amounts are subject to change and may have changed since the date specified. |
8 | Allspring Real Return Fund
Fund expenses (unaudited)
As a shareholder of the Fund, you incur two types of costs: (1) transaction costs, including sales charges (loads) on purchase payments and contingent deferred sales charges (if any) on redemptions and (2) ongoing costs, including management fees, distribution (12b-1) and/or shareholder servicing fees, and other Fund expenses. This example is intended to help you understand your ongoing costs (in dollars) of investing in the Fund and to compare these costs with the ongoing costs of investing in other mutual funds.
The example is based on an investment of $1,000 invested at the beginning of the six-month period and held for the entire period from June 1, 2021 to November 30, 2021.
Actual expenses
The “Actual” line of the table below provides information about actual account values and actual expenses. You may use the information in this line, together with the amount you invested, to estimate the expenses that you paid over the period. Simply divide your account value by $1,000 (for example, an $8,600 account value divided by $1,000 = 8.6), then multiply the result by the number in the “Actual” line under the heading entitled “Expenses paid during period” for your applicable class of shares to estimate the expenses you paid on your account during this period.
Hypothetical example for comparison purposes
The “Hypothetical” line of the table below provides information about hypothetical account values and hypothetical expenses based on the Fund’s actual expense ratio and an assumed rate of return of 5% per year before expenses, which is not the Fund’s actual return. The hypothetical account values and expenses may not be used to estimate the actual ending account balance or expenses you paid for the period. You may use this information to compare the ongoing costs of investing in the Fund and other funds. To do so, compare this 5% hypothetical example with the 5% hypothetical examples that appear in the shareholder reports of the other funds.
Please note that the expenses shown in the table are meant to highlight your ongoing costs only and do not reflect any transactional costs, such as sales charges (loads) and contingent deferred sales charges. Therefore, the “Hypothetical” line of the table is useful in comparing ongoing costs only, and will not help you determine the relative total costs of owning different funds. In addition, if these transactional costs were included, your costs would have been higher.
| | Beginning
account value
6-1-2021 | Ending
account value
11-30-2021 | Expenses
paid during
the period1,2 | Annualized net
expense ratio2 |
| Class A | | | | |
| Actual | $1,000.00 | $1,036.48 | $3.98 | 0.78% |
| Hypothetical (5% return before expenses) | $1,000.00 | $1,021.16 | $3.95 | 0.78% |
| Class C | | | | |
| Actual | $1,000.00 | $1,031.41 | $7.79 | 1.53% |
| Hypothetical (5% return before expenses) | $1,000.00 | $1,017.40 | $7.74 | 1.53% |
| Class R6 | | | | |
| Actual | $1,000.00 | $1,037.94 | $2.04 | 0.40% |
| Hypothetical (5% return before expenses) | $1,000.00 | $1,023.06 | $2.03 | 0.40% |
| Administrator Class | | | | |
| Actual | $1,000.00 | $1,037.05 | $3.06 | 0.60% |
| Hypothetical (5% return before expenses) | $1,000.00 | $1,022.06 | $3.04 | 0.60% |
| Institutional Class | | | | |
| Actual | $1,000.00 | $1,037.75 | $2.30 | 0.45% |
| Hypothetical (5% return before expenses) | $1,000.00 | $1,022.81 | $2.28 | 0.45% |
1 Expenses paid is equal to the annualized net expense ratio of each class multiplied by the average account value over the period, multiplied by the number of days in the most recent fiscal half-year divided by the number of days in the fiscal year (to reflect the one-half-year period).
2 Amounts reflect net expenses allocated from the affiliated Master Portfolio in which the Fund invests.
Allspring Real Return Fund | 9
Portfolio of investments—November 30, 2021 (unaudited)
| | | | | | Value |
| Investment companies: 99.86% | | | | | |
| Affiliated master portfolio: 99.86% | | | | | |
| Allspring Real Return Portfolio | | | | | $68,552,972 |
| Total Investment companies (Cost $60,296,444) | | | | | 68,552,972 |
| Total investments in securities (Cost $60,296,444) | 99.86% | | | | 68,552,972 |
| Other assets and liabilities, net | 0.14 | | | | 92,976 |
| Total net assets | 100.00% | | | | $68,645,948 |
Transactions with the affiliated Master Portfolio were as follows:
| | % of
ownership,
beginning
of period | % of
ownership,
end of
period | Net realized
gains
(losses) on
securities
transactions
allocated
from
affiliated
Master
Portfolio | Net
change in
unrealized
gains
(losses) on
securities
transactions
allocated
from
affiliated
Master
Portfolio | Interest
allocated
from
affiliated
Master
Portfolio | Dividends
allocated
from
affiliated
Master
Portfolio | Affiliated
income
allocated
from
affiliated
Master
Portfolio | Value,
end of
period | |
| Allspring Real Return Portfolio | 31.19% | 29.30% | $441,247 | $229,603 | $1,553,845 | $102,768 | $185 | $68,552,972 | |
The accompanying notes are an integral part of these financial statements.
10 | Allspring Real Return Fund
Statement of assets and liabilities—November 30, 2021 (unaudited)
| | |
| Assets | |
Investments in affiliated Master Portfolio, at value (cost $60,296,444)
| $ 68,552,972 |
Receivable for Fund shares sold
| 201,892 |
Receivable from manager
| 20,635 |
Prepaid expenses and other assets
| 18,848 |
Total assets
| 68,794,347 |
| Liabilities | |
Payable for Fund shares redeemed
| 112,329 |
Shareholder report expenses payable
| 13,269 |
Professional fees payable
| 9,005 |
Administration fees payable
| 5,297 |
Distribution fee payable
| 998 |
Trustees’ fees and expenses payable
| 966 |
Accrued expenses and other liabilities
| 6,535 |
Total liabilities
| 148,399 |
Total net assets
| $68,645,948 |
| Net assets consist of | |
Paid-in capital
| $ 61,651,275 |
Total distributable earnings
| 6,994,673 |
Total net assets
| $68,645,948 |
| Computation of net asset value and offering price per share | |
Net assets – Class A
| $ 16,554,866 |
Shares outstanding – Class A1
| 1,497,411 |
Net asset value per share – Class A
| $11.06 |
Maximum offering price per share – Class A2
| $11.58 |
Net assets – Class C
| $ 1,655,654 |
Shares outstanding – Class C1
| 152,535 |
Net asset value per share – Class C
| $10.85 |
Net assets – Class R6
| $ 12,528,153 |
Shares outstanding – Class R61
| 1,120,624 |
Net asset value per share – Class R6
| $11.18 |
Net assets – Administrator Class
| $ 13,143,262 |
Shares outstanding – Administrator Class1
| 1,167,432 |
Net asset value per share – Administrator Class
| $11.26 |
Net assets – Institutional Class
| $ 24,764,013 |
Shares outstanding – Institutional Class1
| 2,215,424 |
Net asset value per share – Institutional Class
| $11.18 |
| 1 | The Fund has an unlimited number of authorized shares. |
| 2 | Maximum offering price is computed as 100/95.50 of net asset value. On investments of $50,000 or more, the offering price is reduced. |
The accompanying notes are an integral part of these financial statements.
Allspring Real Return Fund | 11
Statement of operations—six months ended November 30, 2021 (unaudited)
| | |
| Investment income | |
Interest allocated from affiliated Master Portfolio
| $ 1,553,845 |
Dividends allocated from affiliated Master Portfolio (net of foreign withholding taxes of $1,108)
| 102,768 |
Affiliated income allocated from affiliated Master Portfolio
| 185 |
Expenses allocated from affiliated Master Portfolio
| (150,627) |
Waivers allocated from affiliated Master Portfolio
| 26,478 |
Total investment income
| 1,532,649 |
| Expenses | |
Management fee
| 15,934 |
| Administration fees | |
Class A
| 12,264 |
Class C
| 1,060 |
Class R6
| 2,429 |
Administrator Class
| 5,775 |
Institutional Class
| 7,735 |
| Shareholder servicing fees | |
Class A
| 19,136 |
Class C
| 1,650 |
Administrator Class
| 14,118 |
| Distribution fee | |
Class C
| 4,951 |
Custody and accounting fees
| 1,480 |
Professional fees
| 21,786 |
Registration fees
| 5,252 |
Shareholder report expenses
| 24,786 |
Trustees’ fees and expenses
| 9,967 |
Other fees and expenses
| 3,736 |
Total expenses
| 152,059 |
| Less: Fee waivers and/or expense reimbursements | |
Fund-level
| (85,705) |
Class A
| (764) |
Class C
| (66) |
Administrator Class
| (7,486) |
Institutional Class
| (1,928) |
Net expenses
| 56,110 |
Net investment income
| 1,476,539 |
| Realized and unrealized gains (losses) on investments | |
Net realized gains on securities transactions allocated from affiliated Master Portfolio
| 441,247 |
Net change in unrealized gains (losses) on securities transactions allocated from affiliated Master Portfolio
| 229,603 |
Net realized and unrealized gains (losses) on investments
| 670,850 |
Net increase in net assets resulting from operations
| $2,147,389 |
The accompanying notes are an integral part of these financial statements.
12 | Allspring Real Return Fund
Statement of changes in net assets
| | | | | |
| | Six months ended
November 30, 2021
(unaudited) | Year ended
May 31, 2021 |
| Operations | | | | |
Net investment income
| | $ 1,476,539 | | $ 1,568,068 |
Net realized gains on investments
| | 441,247 | | 277,416 |
Net change in unrealized gains (losses) on investments
| | 229,603 | | 3,967,421 |
Net increase in net assets resulting from operations
| | 2,147,389 | | 5,812,905 |
| Distributions to shareholders from | | | | |
| Net investment income and net realized gains | | | | |
Class A
| | (366,281) | | (268,219) |
Class C
| | (26,113) | | (19,136) |
Class R6
| | (404,842) | | (676,727) |
Administrator Class
| | (274,582) | | (261,977) |
Institutional Class
| | (483,883) | | (233,102) |
Total distributions to shareholders
| | (1,555,701) | | (1,459,161) |
| Capital share transactions | Shares | | Shares | |
| Proceeds from shares sold | | | | |
Class A
| 308,952 | 3,413,668 | 476,116 | 5,061,849 |
Class C
| 57,864 | 627,100 | 26,515 | 273,931 |
Class R6
| 113,839 | 1,268,080 | 2,143,575 | 23,199,949 |
Administrator Class
| 343,729 | 3,881,591 | 574,541 | 6,217,286 |
Institutional Class
| 1,293,132 | 14,366,158 | 358,193 | 3,851,836 |
| | | 23,556,597 | | 38,604,851 |
| Reinvestment of distributions | | | | |
Class A
| 26,673 | 293,421 | 18,861 | 202,368 |
Class C
| 2,385 | 25,779 | 1,759 | 18,532 |
Class R6
| 28,069 | 312,206 | 28,247 | 306,213 |
Administrator Class
| 23,378 | 261,635 | 23,163 | 252,526 |
Institutional Class
| 43,432 | 483,175 | 21,437 | 232,476 |
| | | 1,376,216 | | 1,012,115 |
| Payment for shares redeemed | | | | |
Class A
| (102,729) | (1,130,050) | (521,552) | (5,567,275) |
Class C
| (18,964) | (204,924) | (87,496) | (914,008) |
Class R6
| (2,298,530) | (25,365,420) | (659,480) | (7,182,858) |
Administrator Class
| (386,958) | (4,309,374) | (715,288) | (7,756,050) |
Institutional Class
| (97,197) | (1,080,996) | (428,493) | (4,604,300) |
| | | (32,090,764) | | (26,024,491) |
Net increase (decrease) in net assets resulting from capital share transactions
| | (7,157,951) | | 13,592,475 |
Total increase (decrease) in net assets
| | (6,566,263) | | 17,946,219 |
| Net assets | | | | |
Beginning of period
| | 75,212,211 | | 57,265,992 |
End of period
| | $ 68,645,948 | | $ 75,212,211 |
The accompanying notes are an integral part of these financial statements.
Allspring Real Return Fund | 13
Financial highlights
(For a share outstanding throughout each period)
| | | Year ended May 31 |
| Class A | Six months ended
November 30, 2021
(unaudited) | 2021 | 2020 | 2019 | 2018 | 2017 |
Net asset value, beginning of period
| $10.93 | $10.22 | $9.89 | $9.87 | $9.96 | $9.95 |
Net investment income
| 0.24 1 | 0.22 | 0.12 | 0.15 | 0.21 | 0.19 1 |
Net realized and unrealized gains (losses) on investments
| 0.15 | 0.70 | 0.42 | 0.09 | (0.09) | 0.03 |
Total from investment operations
| 0.39 | 0.92 | 0.54 | 0.24 | 0.12 | 0.22 |
| Distributions to shareholders from | | | | | | |
Net investment income
| (0.26) | (0.21) | (0.21) | (0.19) | (0.21) | (0.20) |
Net realized gains
| 0.00 | 0.00 | 0.00 | (0.03) | 0.00 | (0.01) |
Total distributions to shareholders
| (0.26) | (0.21) | (0.21) | (0.22) | (0.21) | (0.21) |
Net asset value, end of period
| $11.06 | $10.93 | $10.22 | $9.89 | $9.87 | $9.96 |
Total return2
| 3.65% | 9.10% | 5.48% | 2.56% | 1.25% | 2.23% |
| Ratios to average net assets (annualized)* | | | | | | |
Gross expenses
| 1.06% | 1.29% | 1.43% | 1.16% | 1.04% | 1.11% |
Net expenses
| 0.78% | 0.78% | 0.78% | 0.77% | 0.80% | 0.85% |
Net investment income
| 4.35% | 2.09% | 1.79% | 1.95% | 2.15% | 1.92% |
| Supplemental data | | | | | | |
Portfolio turnover rate3
| 14% | 20% | 24% | 39% | 29% | 25% |
Net assets, end of period (000s omitted)
| $16,555 | $13,825 | $13,196 | $17,716 | $26,133 | $29,678 |
| * | Ratios include net expenses allocated from the affiliated Master Portfolio which were as follows: |
| Six months ended November 30, 2021 (unaudited) | 0.39% |
| Year ended May 31, 2021 | 0.39% |
| Year ended May 31, 2020 | 0.39% |
| Year ended May 31, 2019 | 0.39% |
| Year ended May 31, 2018 | 0.41% |
| Year ended May 31, 2017 | 0.44% |
| 1 | Calculated based upon average shares outstanding |
| 2 | Total return calculations do not include any sales charges. Returns for periods of less than one year are not annualized. |
| 3 | Portfolio turnover rate is calculated by multiplying the affiliated Master Portfolio’s percentage of the Fund’s total investment in securities at the end of the period by the affiliated Master Portfolio’s portfolio turnover rate. |
The accompanying notes are an integral part of these financial statements.
14 | Allspring Real Return Fund
Financial highlights
(For a share outstanding throughout each period)
| | | Year ended May 31 |
| Class C | Six months ended
November 30, 2021
(unaudited) | 2021 | 2020 | 2019 | 2018 | 2017 |
Net asset value, beginning of period
| $10.74 | $10.06 | $9.73 | $9.73 | $9.82 | $9.77 |
Net investment income
| 0.19 1 | 0.12 1 | 0.11 1 | 0.10 1 | 0.03 | 0.04 |
Net realized and unrealized gains (losses) on investments
| 0.14 | 0.71 | 0.35 | 0.07 | 0.02 | 0.10 |
Total from investment operations
| 0.33 | 0.83 | 0.46 | 0.17 | 0.05 | 0.14 |
| Distributions to shareholders from | | | | | | |
Net investment income
| (0.22) | (0.15) | (0.13) | (0.14) | (0.14) | (0.08) |
Net realized gains
| 0.00 | 0.00 | 0.00 | (0.03) | 0.00 | (0.01) |
Total distributions to shareholders
| (0.22) | (0.15) | (0.13) | (0.17) | (0.14) | (0.09) |
Net asset value, end of period
| $10.85 | $10.74 | $10.06 | $9.73 | $9.73 | $9.82 |
Total return2
| 3.14% | 8.27% | 4.77% | 1.79% | 0.53% | 1.44% |
| Ratios to average net assets (annualized)* | | | | | | |
Gross expenses
| 1.81% | 2.06% | 2.18% | 1.91% | 1.79% | 1.86% |
Net expenses
| 1.53% | 1.53% | 1.53% | 1.52% | 1.56% | 1.60% |
Net investment income
| 3.53% | 1.17% | 1.09% | 1.08% | 1.39% | 1.23% |
| Supplemental data | | | | | | |
Portfolio turnover rate3
| 14% | 20% | 24% | 39% | 29% | 25% |
Net assets, end of period (000s omitted)
| $1,656 | $1,195 | $1,714 | $2,553 | $3,517 | $4,580 |
| * | Ratios include net expenses allocated from the affiliated Master Portfolio which were as follows: |
| Six months ended November 30, 2021 (unaudited) | 0.39% |
| Year ended May 31, 2021 | 0.39% |
| Year ended May 31, 2020 | 0.39% |
| Year ended May 31, 2019 | 0.39% |
| Year ended May 31, 2018 | 0.41% |
| Year ended May 31, 2017 | 0.44% |
| 1 | Calculated based upon average shares outstanding |
| 2 | Total return calculations do not include any sales charges. Returns for periods of less than one year are not annualized. |
| 3 | Portfolio turnover rate is calculated by multiplying the affiliated Master Portfolio’s percentage of the Fund’s total investment in securities at the end of the period by the affiliated Master Portfolio’s portfolio turnover rate. |
The accompanying notes are an integral part of these financial statements.
Allspring Real Return Fund | 15
Financial highlights
(For a share outstanding throughout each period)
| | | Year ended May 31 |
| Class R6 | Six months ended
November 30, 2021
(unaudited) | 2021 | 2020 | 2019 | 2018 | 2017 1 |
Net asset value, beginning of period
| $11.05 | $10.33 | $9.99 | $9.96 | $10.05 | $10.17 |
Net investment income
| 0.29 2 | 0.29 | 0.22 | 0.23 2 | 0.22 | 0.10 |
Net realized and unrealized gains (losses) on investments
| 0.12 | 0.69 | 0.37 | 0.06 | (0.06) | (0.07) |
Total from investment operations
| 0.41 | 0.98 | 0.59 | 0.29 | 0.16 | 0.03 |
| Distributions to shareholders from | | | | | | |
Net investment income
| (0.28) | (0.26) | (0.25) | (0.23) | (0.25) | (0.14) |
Net realized gains
| 0.00 | 0.00 | 0.00 | (0.03) | 0.00 | (0.01) |
Total distributions to shareholders
| (0.28) | (0.26) | (0.25) | (0.26) | (0.25) | (0.15) |
Net asset value, end of period
| $11.18 | $11.05 | $10.33 | $9.99 | $9.96 | $10.05 |
Total return3
| 3.79% | 9.52% | 5.94% | 2.99% | 1.63% | 0.36% |
| Ratios to average net assets (annualized)* | | | | | | |
Gross expenses
| 0.67% | 0.85% | 1.05% | 0.82% | 0.66% | 0.69% |
Net expenses
| 0.40% | 0.40% | 0.40% | 0.39% | 0.42% | 0.47% |
Net investment income
| 5.21% | 2.70% | 2.08% | 2.34% | 2.52% | 1.32% |
| Supplemental data | | | | | | |
Portfolio turnover rate4
| 14% | 20% | 24% | 39% | 29% | 25% |
Net assets, end of period (000s omitted)
| $12,528 | $36,202 | $18,224 | $14,358 | $11,750 | $7,438 |
| * | Ratios include net expenses allocated from the affiliated Master Portfolio which were as follows: |
| Six months ended November 30, 2021 (unaudited) | 0.39% |
| Year ended May 31, 2021 | 0.39% |
| Year ended May 31, 2020 | 0.39% |
| Year ended May 31, 2019 | 0.39% |
| Year ended May 31, 2018 | 0.41% |
| Year ended May 31, 20171 | 0.44% |
| 1 | For the period from October 31, 2016 (commencement of class operations) to May 31, 2017 |
| 2 | Calculated based upon average shares outstanding |
| 3 | Returns for periods of less than one year are not annualized. |
| 4 | Portfolio turnover rate is calculated by multiplying the affiliated Master Portfolio’s percentage of the Fund’s total investment in securities at the end of the period by the affiliated Master Portfolio’s portfolio turnover rate. |
The accompanying notes are an integral part of these financial statements.
16 | Allspring Real Return Fund
Financial highlights
(For a share outstanding throughout each period)
| | | Year ended May 31 |
| Administrator Class | Six months ended
November 30, 2021
(unaudited) | 2021 | 2020 | 2019 | 2018 | 2017 |
Net asset value, beginning of period
| $11.12 | $10.38 | $10.03 | $9.99 | $10.06 | $10.03 |
Net investment income
| 0.26 1 | 0.25 1 | 0.20 1 | 0.21 1 | 0.24 1 | 0.22 1 |
Net realized and unrealized gains (losses) on investments
| 0.15 | 0.71 | 0.36 | 0.06 | (0.09) | 0.02 |
Total from investment operations
| 0.41 | 0.96 | 0.56 | 0.27 | 0.15 | 0.24 |
| Distributions to shareholders from | | | | | | |
Net investment income
| (0.27) | (0.22) | (0.21) | (0.20) | (0.22) | (0.20) |
Net realized gains
| 0.00 | 0.00 | 0.00 | (0.03) | 0.00 | (0.01) |
Total distributions to shareholders
| (0.27) | (0.22) | (0.21) | (0.23) | (0.22) | (0.21) |
Net asset value, end of period
| $11.26 | $11.12 | $10.38 | $10.03 | $9.99 | $10.06 |
Total return2
| 3.70% | 9.31% | 5.67% | 2.78% | 1.50% | 2.46% |
| Ratios to average net assets (annualized)* | | | | | | |
Gross expenses
| 1.00% | 1.23% | 1.37% | 1.10% | 0.97% | 1.04% |
Net expenses
| 0.60% | 0.60% | 0.60% | 0.59% | 0.60% | 0.60% |
Net investment income
| 4.57% | 2.26% | 1.92% | 2.15% | 2.39% | 2.20% |
| Supplemental data | | | | | | |
Portfolio turnover rate3
| 14% | 20% | 24% | 39% | 29% | 25% |
Net assets, end of period (000s omitted)
| $13,143 | $13,203 | $13,544 | $13,562 | $23,331 | $26,100 |
| * | Ratios include net expenses allocated from the affiliated Master Portfolio which were as follows: |
| Six months ended November 30, 2021 (unaudited) | 0.39% |
| Year ended May 31, 2021 | 0.39% |
| Year ended May 31, 2020 | 0.39% |
| Year ended May 31, 2019 | 0.39% |
| Year ended May 31, 2018 | 0.41% |
| Year ended May 31, 2017 | 0.44% |
| 1 | Calculated based upon average shares outstanding |
| 2 | Returns for periods of less than one year are not annualized. |
| 3 | Portfolio turnover rate is calculated by multiplying the affiliated Master Portfolio’s percentage of the Fund’s total investment in securities at the end of the period by the affiliated Master Portfolio’s portfolio turnover rate. |
The accompanying notes are an integral part of these financial statements.
Allspring Real Return Fund | 17
Financial highlights
(For a share outstanding throughout each period)
| | | Year ended May 31 |
| Institutional Class | Six months ended
November 30, 2021
(unaudited) | 2021 | 2020 | 2019 | 2018 | 2017 1 |
Net asset value, beginning of period
| $11.05 | $10.33 | $9.99 | $9.97 | $10.06 | $10.17 |
Net investment income
| 0.29 | 0.26 | 0.21 | 0.22 | 0.24 | 0.14 |
Net realized and unrealized gains (losses) on investments
| 0.12 | 0.71 | 0.37 | 0.05 | (0.08) | (0.10) |
Total from investment operations
| 0.41 | 0.97 | 0.58 | 0.27 | 0.16 | 0.04 |
| Distributions to shareholders from | | | | | | |
Net investment income
| (0.28) | (0.25) | (0.24) | (0.22) | (0.25) | (0.14) |
Net realized gains
| 0.00 | 0.00 | 0.00 | (0.03) | 0.00 | (0.01) |
Total distributions to shareholders
| (0.28) | (0.25) | (0.24) | (0.25) | (0.25) | (0.15) |
Net asset value, end of period
| $11.18 | $11.05 | $10.33 | $9.99 | $9.97 | $10.06 |
Total return2
| 3.78% | 9.46% | 5.88% | 2.84% | 1.57% | 0.41% |
| Ratios to average net assets (annualized)* | | | | | | |
Gross expenses
| 0.74% | 0.95% | 1.10% | 0.84% | 0.71% | 0.76% |
Net expenses
| 0.45% | 0.45% | 0.45% | 0.44% | 0.47% | 0.52% |
Net investment income
| 4.49% | 2.37% | 2.09% | 2.20% | 2.62% | 2.24% |
| Supplemental data | | | | | | |
Portfolio turnover rate3
| 14% | 20% | 24% | 39% | 29% | 25% |
Net assets, end of period (000s omitted)
| $24,764 | $10,787 | $10,587 | $11,094 | $12,110 | $5,229 |
| * | Ratios include net expenses allocated from the affiliated Master Portfolio which were as follows: |
| Six months ended November 30, 2021 (unaudited) | 0.39% |
| Year ended May 31, 2021 | 0.39% |
| Year ended May 31, 2020 | 0.39% |
| Year ended May 31, 2019 | 0.39% |
| Year ended May 31, 2018 | 0.41% |
| Year ended May 31, 20171 | 0.44% |
| 1 | For the period from October 31, 2016 (commencement of class operations) to May 31, 2017 |
| 2 | Returns for periods of less than one year are not annualized. |
| 3 | Portfolio turnover rate is calculated by multiplying the affiliated Master Portfolio’s percentage of the Fund’s total investment in securities at the end of the period by the affiliated Master Portfolio’s portfolio turnover rate. |
The accompanying notes are an integral part of these financial statements.
18 | Allspring Real Return Fund
Notes to financial statements (unaudited)
1. ORGANIZATION
Allspring Funds Trust (the "Trust"), a Delaware statutory trust organized on March 10, 1999, is an open-end management investment company registered under the Investment Company Act of 1940, as amended (the "1940 Act"). As an investment company, the Trust follows the accounting and reporting guidance in Financial Accounting Standards Board ("FASB") Accounting Standards Codification Topic 946, Financial Services – Investment Companies. These financial statements report on the Allspring Real Return Fund (the "Fund") which is a diversified series of the Trust.
The Fund is a feeder fund in a master-feeder structure that invests substantially all of its assets in a single master portfolio with a substantially identical investment objective and substantially similar investment strategies. The Fund invests in Allspring Real Return Portfolio, a separate diversified portfolio (the “affiliated Master Portfolio”) of Allspring Master Trust, a registered open-end management investment company. As of November 30, 2021, the Fund owned 29.30% of Allspring Real Return Portfolio. The affiliated Master Portfolio directly acquires portfolio securities and the Fund acquires an indirect interest in those securities. The Fund accounts for its investment in the affiliated Master Portfolio as a partnership investment and records on a daily basis its share of the affiliated Master Portfolio’s income, expense and realized and unrealized gains and losses. The financial statements of the affiliated Master Portfolio for the six months ended November 30, 2021 are included in this report and should be read in conjunction with the Fund’s financial statements.
On February 23, 2021, Wells Fargo & Company entered into a definitive agreement to sell Wells Fargo Asset Management ("WFAM") to GTCR LLC and Reverence Capital Partners, L.P. WFAM was the trade name used by the asset management businesses of Wells Fargo & Company and included Wells Fargo Funds Management, LLC, Wells Capital Management, LLC, Wells Fargo Asset Management (International) Limited and Wells Fargo Funds Distributor, LLC. Effective on November 1, 2021, the sale transaction of WFAM by Wells Fargo & Company to GTCR LLC and Reverence Capital Partners, L.P. was closed. In connection with the closing of the transaction, WFAM became known as Allspring Global Investments (“Allspring”) and various entities that provide services to the Fund changed their names to "Allspring", including Allspring Funds Management, LLC (formerly Wells Fargo Funds Management, LLC), the investment manager to the Fund, Allspring Global Investments, Inc. (formerly Wells Capital Management, LLC) and Allspring Global Investments (UK) Limited (formerly Wells Fargo Asset Management (International) Limited), both registered investment advisers providing subadvisory services to certain funds, and Allspring Funds Distributor, LLC (formerly Wells Fargo Funds Distributor, LLC), the Fund's principal underwriter.
Consummation of the transaction resulted in the automatic termination of the Fund’s investment management agreement. The Fund’s Board of Trustees approved a new investment management agreement which was submitted and approved by the Fund’s shareholders at a Special Meeting of Shareholders held on August 16, 2021. The new agreement became effective on November 1, 2021.
Effective December 6, 2021, "Wells Fargo" was removed from the Fund's name and replaced it with "Allspring".
2. SIGNIFICANT ACCOUNTING POLICIES
The following significant accounting policies, which are consistently followed in the preparation of the financial statements of the Fund, are in conformity with U.S. generally accepted accounting principles which require management to make estimates and assumptions that affect the reported amounts of assets and liabilities, disclosure of contingent assets and liabilities at the date of the financial statements, and the reported amounts of income and expenses during the reporting period. Actual results could differ from those estimates.
Securities valuation
All investments are valued each business day as of the close of regular trading on the New York Stock Exchange (generally 4 p.m. Eastern Time), although the Fund may deviate from this calculation time under unusual or unexpected circumstances.
Investments in the affiliated Master Portfolio are valued daily based on the Fund’s proportionate share of the affiliated Master Portfolio’s net assets, which are also valued daily. Securities held in the affiliated Master Portfolio are valued as discussed in the Notes to Financial Statements of the affiliated Master Portfolio, which are included elsewhere in this report.
Investments which are not valued using the method discussed above are valued at their fair value, as determined in good faith by the Board of Trustees. The Board of Trustees has established a Valuation Committee comprised of the Trustees and has delegated to it the authority to take any actions regarding the valuation of portfolio securities that the Valuation Committee deems necessary or appropriate, including determining the fair value of portfolio securities, unless the determination has been delegated to the Allspring Global Investments Pricing Committee at Allspring Funds Management, LLC ("Allspring Funds Management"). The Board of Trustees retains the authority to make or ratify any valuation decisions or approve any changes to
Allspring Real Return Fund | 19
Notes to financial statements (unaudited)
the Valuation Procedures as it deems appropriate. On a quarterly basis, the Board of Trustees receives reports on any valuation actions taken by the Valuation Committee or the Allspring Global Investments Pricing Committee which may include items for ratification.
Investment transactions, income and expenses
Investments in the affiliated Master Portfolio are recorded on a trade date basis. The Fund records daily its proportionate share of the affiliated Master Portfolio’s income, expenses and realized and unrealized gains or losses. The Fund also accrues its own expenses.
Distributions to shareholders
Distributions to shareholders are recorded on the ex-dividend date and paid from net investment income monthly and any net realized gains are paid at least annually. Such distributions are determined in accordance with income tax regulations and may differ from U.S. generally accepted accounting principles. Dividend sources are estimated at the time of declaration. The tax character of distributions is determined as of the Fund's fiscal year end. Therefore, a portion of the Fund's distributions made prior to the Fund’s fiscal year end may be categorized as a tax return of capital at year end.
Federal and other taxes
The Fund intends to continue to qualify as a regulated investment company by distributing substantially all of its investment company taxable income and any net realized capital gains (after reduction for capital loss carryforwards) sufficient to relieve it from all, or substantially all, federal income taxes. Accordingly, no provision for federal income taxes was required.
The Fund’s income and federal excise tax returns and all financial records supporting those returns for the prior three fiscal years are subject to examination by the federal and Delaware revenue authorities. Management has analyzed the Fund's tax positions taken on federal, state, and foreign tax returns for all open tax years and does not believe that there are any uncertain tax positions that require recognition of a tax liability.
As of November 30, 2021, the aggregate cost of all investments for federal income tax purposes was $60,395,613 and the unrealized gains (losses) consisted of:
| Gross unrealized gains | $8,157,359 |
| Gross unrealized losses | 0 |
| Net unrealized gains | $8,157,359 |
As of May 31, 2021, the Fund had capital loss carryforwards which consisted of $974,743 in short-term capital losses and $747,945 in long-term capital losses.
Class allocations
The separate classes of shares offered by the Fund differ principally in applicable sales charges, distribution, shareholder servicing, and administration fees. Class specific expenses are charged directly to that share class. Investment income, common fund-level expenses, and realized and unrealized gains (losses) on investments are allocated daily to each class of shares based on the relative proportion of net assets of each class.
3. FAIR VALUATION MEASUREMENTS
At November 30, 2021, the Fund’s investment in the affiliated Master Portfolio was measured at fair value using the net asset value per share (or its equivalent) as a practical expedient. The investment objective and fair value of the affiliated Master Portfolio is as follows:
| Affiliated Master Portfolio | Investment objective | Fair value of affiliated
Master Portfolio |
| Allspring Real Return Portfolio | Seeks returns that exceed the rate of inflation over the long-term | $68,552,972 |
The affiliated Master Portfolio does not have a redemption period notice, can be redeemed daily and does not have any unfunded commitments.
20 | Allspring Real Return Fund
Notes to financial statements (unaudited)
4. TRANSACTIONS WITH AFFILIATES
Management fee
Allspring Funds Management, a wholly owned subsidiary of Allspring Global Investments Holdings, LLC, a holding company indirectly owned by certain private funds of GTCR LLC and Reverence Capital Partners, L.P., is the manager of the Fund and provides advisory and fund-level administrative services under an investment management agreement. Under the investment management agreement, Allspring Funds Management is responsible for, among other services, implementing the investment objectives and strategies of the Fund and providing fund-level administrative services in connection with the Fund’s operations. As long as the Fund continues to invest substantially all of its assets in a single affiliated Master Portfolio, the Fund pays Allspring Funds Management an investment management fee only for fund-level administrative services at the following annual rate based on the Fund’s average daily net assets:
| Average daily net assets | Management fee |
| First $5 billion | 0.050% |
| Next $5 billion | 0.040 |
| Over $10 billion | 0.030 |
For the six months ended November 30, 2021, the management fee was equivalent to an annual rate of 0.05% of the Fund’s average daily net assets.
Allspring Funds Management also serves as the adviser to the affiliated Master Portfolio and is entitled to receive a fee from the affiliated Master Portfolio for those services.
Administration fees
Under a class-level administration agreement, Allspring Funds Management provides class-level administrative services to the Fund, which includes paying fees and expenses for services provided by the transfer agent, sub-transfer agents, omnibus account servicers and record-keepers. As compensation for its services under the class-level administration agreement, Allspring Funds Management receives an annual fee which is calculated based on the average daily net assets of each class as follows:
| | Class-level
administration fee |
| Class A | 0.16% |
| Class C | 0.16 |
| Class R6 | 0.03 |
| Administrator Class | 0.10 |
| Institutional Class | 0.08 |
Waivers and/or expense reimbursements
Allspring Funds Management has contractually committed to waive and/or reimburse management and administration fees to the extent necessary to maintain certain net operating expense ratios for the Fund. When each class of the Fund has exceeded its expense cap, Allspring Funds Management will waive fees and/or reimburse expenses from fund-level expenses on a proportionate basis and then from class specific expenses. When only certain classes exceed their expense caps, waivers and/or reimbursements are applied against class specific expenses before fund-level expenses. Net expenses from the affiliated Master Portfolio are included in the expense caps. Allspring Funds Management has contractually committed through September 30, 2022 to waive fees and/or reimburse expenses to the extent necessary to cap expenses. Prior to or after the commitment expiration date, the caps may be increased or the commitment to maintain the caps may be terminated only with the approval of the Board of Trustees. The contractual expense caps are as follows:
Allspring Real Return Fund | 21
Notes to financial statements (unaudited)
| | Expense ratio caps |
| Class A | 0.78% |
| Class C | 1.53 |
| Class R6 | 0.40 |
| Administrator Class | 0.60 |
| Institutional Class | 0.45 |
Distribution fee
The Trust has adopted a distribution plan for Class C shares of the Fund pursuant to Rule 12b-1 under the 1940 Act. A distribution fee is charged to Class C shares and paid to Allspring Funds Distributor, LLC ("Allspring Funds Distributor"), an affiliate of Allspring Funds Management, the principal underwriter, at an annual rate of 0.75% of the average daily net assets of Class C shares.
In addition, Allspring Funds Distributor is entitled to receive the front-end sales charge from the purchase of Class A shares and a contingent deferred sales charge on the redemption of certain Class A shares. Allspring Funds Distributor is also entitled to receive the contingent deferred sales charges from redemptions of Class C shares. For the six months ended November 30, 2021, Allspring Funds Distributor received $587 from the sale of Class A shares. No contingent deferred sales charges were incurred by Class A and Class C shares for the six months ended November 30, 2021.
Shareholder servicing fees
The Trust has entered into contracts with one or more shareholder servicing agents, whereby Class A, Class C, and Administrator Class of the Fund are charged a fee at an annual rate of 0.25% of the average daily net assets of each respective class. A portion of these total shareholder servicing fees were paid to affiliates, and to certain entities that were affiliates of the Fund until November 1, 2021.
5. INVESTMENT PORTFOLIO TRANSACTIONS
The Fund seeks to achieve its investment objective by investing substantially all of its assets in the affiliated Master Portfolio. Purchases and sales have been calculated by multiplying the Fund's ownership percentage of the affiliated Master Portfolio by the affiliated Master Portfolio's purchases and sales. Purchases and sales of investments, excluding short-term securities, for the six months ended November 30, 2021 were as follows:
| Purchases at cost | | Sales proceeds |
U.S.
government | Non-U.S.
government | | U.S.
government | Non-U.S.
government |
| $3,704,659 | $5,380,772 | | $6,413,035 | $5,213,545 |
6. BANK BORROWINGS
The Trust (excluding the money market funds), Allspring Master Trust and Allspring Variable Trust are parties to a $350,000,000 revolving credit agreement whereby the Fund is permitted to use bank borrowings for temporary or emergency purposes, such as to fund shareholder redemption requests. Interest under the credit agreement is charged to the Fund based on a borrowing rate equal to the higher of the Federal Funds rate in effect on that day plus 1.25% or the overnight bank funding rate in effect on that day plus 1.25%. In addition, an annual commitment fee equal to 0.25% of the unused balance is allocated to each participating fund.
For the six months ended November 30, 2021, there were no borrowings by the Fund under the agreement.
7. INDEMNIFICATION
Under the Fund's organizational documents, the officers and Trustees have been granted certain indemnification rights against certain liabilities that may arise out of performance of their duties to the Fund. The Fund has entered into a separate agreement with each Trustee that converts indemnification rights currently existing under the Fund’s organizational documents into contractual rights that cannot be changed in the future without the consent of the Trustee. Additionally, in the normal course of business, the Fund may enter into contracts with service providers that contain a variety of indemnification clauses. The Fund’s maximum exposure under these arrangements is dependent on future claims that may be made against the Fund and, therefore, cannot be estimated.
22 | Allspring Real Return Fund
Notes to financial statements (unaudited)
8. CORONAVIRUS (COVID-19) PANDEMIC
On March 11, 2020, the World Health Organization announced that it had made the assessment that coronavirus disease 2019 (“COVID-19”) is a pandemic. The impacts of COVID-19 are affecting the entire global economy, individual companies and investment products, the funds, and the market in general. There is significant uncertainty around the extent and duration of business disruptions related to COVID-19 and the impacts may last for an extended period of time. COVID-19 has led to significant uncertainty and volatility in the financial markets.
Allspring Real Return Fund | 23
Portfolio of investments—November 30, 2021 (unaudited)
| | | | | Shares | Value |
| Common stocks: 14.86% | | | | | | |
| Consumer staples: 4.66% | | | | | | |
| Beverages: 0.71% | | | | | | |
| PepsiCo Incorporated | | | | | 10,436 | $ 1,667,464 |
| Food & staples retailing: 1.64% | | | | | | |
| Costco Wholesale Corporation | | | | | 2,807 | 1,514,040 |
| Sysco Corporation | | | | | 9,963 | 697,809 |
| Walmart Incorporated | | | | | 11,526 | 1,620,901 |
| | | | | | | 3,832,750 |
| Food products: 0.59% | | | | | | |
| Mondelez International Incorporated Class A | | | | | 13,399 | 789,737 |
| Nomad Foods Limited † | | | | | 25,058 | 598,636 |
| | | | | | | 1,388,373 |
| Household products: 1.61% | | | | | | |
| Church & Dwight Company Incorporated | | | | | 10,995 | 982,733 |
| The Clorox Company | | | | | 2,291 | 373,089 |
| The Procter & Gamble Company | | | | | 16,664 | 2,409,281 |
| | | | | | | 3,765,103 |
| Tobacco: 0.11% | | | | | | |
| Philip Morris International Incorporated | | | | | 3,064 | 263,320 |
| Energy: 1.18% | | | | | | |
| Oil, gas & consumable fuels: 1.18% | | | | | | |
| Chevron Corporation | | | | | 15,613 | 1,762,239 |
| Phillips 66 | | | | | 14,305 | 989,477 |
| | | | | | | 2,751,716 |
| Materials: 3.53% | | | | | | |
| Chemicals: 1.56% | | | | | | |
| Ashland Global Holdings Incorporated | | | | | 4,915 | 496,759 |
| Ecolab Incorporated | | | | | 2,882 | 638,277 |
| Linde plc | | | | | 5,212 | 1,658,146 |
| The Sherwin-Williams Company | | | | | 1,085 | 359,395 |
| Westlake Chemical Corporation | | | | | 5,185 | 481,790 |
| | | | | | | 3,634,367 |
| Construction materials: 0.23% | | | | | | |
| Martin Marietta Materials Incorporated | | | | | 1,344 | 542,317 |
| Containers & packaging: 0.19% | | | | | | |
| Crown Holdings Incorporated | | | | | 4,258 | 450,496 |
| Metals & mining: 1.55% | | | | | | |
| Agnico-Eagle Mines Limited-U.S. Exchange Traded Shares | | | | | 2,100 | 104,580 |
| Alamos Gold Incorporated Class A | | | | | 11,000 | 84,129 |
| AngloGold Ashanti Limited ADR | | | | | 3,000 | 62,820 |
| Artemis Gold Incorporated † | | | | | 6,000 | 31,328 |
| B2Gold Corporation | | | | | 29,000 | 114,869 |
| Barrick Gold Corporation | | | | | 9,456 | 179,569 |
| Dundee Precious Metals Incorporated | | | | | 7,000 | 44,550 |
The accompanying notes are an integral part of these financial statements.
24 | Allspring Real Return Portfolio
Portfolio of investments—November 30, 2021 (unaudited)
| | | | | Shares | Value |
| Metals & mining (continued) | | | | | | |
| Endeavour Mining plc | | | | | 6,580 | $ 154,372 |
| Evolution Mining Limited | | | | | 22,000 | 62,877 |
| Franco-Nevada Corporation | | | | | 1,200 | 164,559 |
| Gold Fields Limited ADR | | | | | 16,000 | 181,440 |
| Kinross Gold Corporation | | | | | 37,500 | 222,514 |
| Kirkland Lake Gold Limited | | | | | 3,137 | 124,036 |
| Lundin Gold Incorporated † | | | | | 7,100 | 57,858 |
| MAG Silver Corporation † | | | | | 3,000 | 49,928 |
| Marathon Gold Corporation † | | | | | 7,000 | 16,494 |
| Newcrest Mining Limited | | | | | 6,600 | 109,483 |
| Newmont Corporation | | | | | 4,790 | 263,067 |
| Northern Star Resources Limited | | | | | 15,000 | 100,137 |
| Pan American Silver Corporation | | | | | 4,300 | 109,822 |
| Pretium Resources Incorporated † | | | | | 4,000 | 54,108 |
| Royal Gold Incorporated | | | | | 3,712 | 371,311 |
| SilverCrest Metals Incorporated † | | | | | 6,000 | 50,773 |
| Skeena Resources Limited † | | | | | 2,000 | 19,163 |
| SSR Mining Incorporated | | | | | 3,500 | 63,595 |
| SSR Mining Incorporated - U.S. Exchange Traded Shares | | | | | 1,272 | 23,091 |
| Steel Dynamics Incorporated | | | | | 8,889 | 531,562 |
| Torex Gold Resources Incorporated † | | | | | 6,200 | 67,899 |
| Triple Flag Precious Metals Corporation | | | | | 1,000 | 11,484 |
| Wheaton Precious Metals Corporation | | | | | 4,700 | 196,543 |
| | | | | | | 3,627,961 |
| Real estate: 5.49% | | | | | | |
| Equity REITs: 5.49% | | | | | | |
| Alexandria Real Estate Equities Incorporated | | | | | 2,806 | 561,396 |
| American Homes 4 Rent Class A | | | | | 12,675 | 508,141 |
| American Tower Corporation | | | | | 5,496 | 1,442,590 |
| Camden Property Trust | | | | | 2,694 | 445,076 |
| Duke Realty Corporation | | | | | 10,130 | 590,883 |
| Equinix Incorporated | | | | | 1,644 | 1,335,257 |
| Federal Realty Investment Trust | | | | | 2,656 | 325,812 |
| Four Corners Property Trust Incorporated | | | | | 17,549 | 474,174 |
| Gaming and Leisure Properties Incorporated | | | | | 8,807 | 397,372 |
| Healthcare Realty Trust Incorporated | | | | | 10,277 | 321,876 |
| Host Hotels & Resorts Incorporated † | | | | | 16,246 | 255,062 |
| Invitation Homes Incorporated | | | | | 13,941 | 563,774 |
| Life Storage Incorporated | | | | | 4,610 | 609,165 |
| Mid-America Apartment Communities Incorporated | | | | | 2,053 | 423,431 |
| Prologis Incorporated | | | | | 7,527 | 1,134,695 |
| SBA Communications Corporation | | | | | 2,838 | 975,704 |
| Simon Property Group Incorporated | | | | | 2,390 | 365,288 |
| Sun Communities Incorporated | | | | | 4,151 | 782,796 |
| VICI Properties Incorporated | | | | | 26,671 | 725,451 |
| Welltower Incorporated | | | | | 7,754 | 617,373 |
| | | | | | | 12,855,316 |
| Total Common stocks (Cost $23,957,760) | | | | | | 34,779,183 |
The accompanying notes are an integral part of these financial statements.
Allspring Real Return Portfolio | 25
Portfolio of investments—November 30, 2021 (unaudited)
| | | Interest
rate | Maturity
date | Principal | Value |
| Corporate bonds and notes: 12.95% | | | | | | |
| Communication services: 1.46% | | | | | | |
| Diversified telecommunication services: 0.26% | | | | | | |
| CenturyLink Incorporated | | 6.75% | 12-1-2023 | $ | 260,000 | $ 280,033 |
| Level 3 Financing Incorporated | | 5.38 | 5-1-2025 | | 85,000 | 86,788 |
| Lumen Technologies Incorporated | | 7.50 | 4-1-2024 | | 215,000 | 233,275 |
| | | | | | | 600,096 |
| Entertainment: 0.19% | | | | | | |
| Live Nation Entertainment Incorporated 144A | | 4.88 | 11-1-2024 | | 170,000 | 171,161 |
| Live Nation Entertainment Incorporated 144A | | 6.50 | 5-15-2027 | | 255,000 | 276,410 |
| | | | | | | 447,571 |
| Media: 1.01% | | | | | | |
| CCO Holdings LLC 144A | | 5.13 | 5-1-2027 | | 600,000 | 617,571 |
| Cinemark USA Incorporated 144A | | 8.75 | 5-1-2025 | | 335,000 | 355,938 |
| Compression Partners LP | | 6.88 | 9-1-2027 | | 20,000 | 20,512 |
| CSC Holdings LLC 144A | | 5.50 | 4-15-2027 | | 200,000 | 205,343 |
| DISH DBS Corporation | | 5.00 | 3-15-2023 | | 200,000 | 203,200 |
| DISH DBS Corporation | | 5.88 | 7-15-2022 | | 190,000 | 192,375 |
| Nexstar Broadcasting Incorporated 144A | | 5.63 | 7-15-2027 | | 320,000 | 332,000 |
| Townsquare Media Incorporated 144A | | 6.88 | 2-1-2026 | | 415,000 | 435,190 |
| | | | | | | 2,362,129 |
| Consumer discretionary: 1.44% | | | | | | |
| Auto components: 0.15% | | | | | | |
| Allison Transmission Incorporated 144A | | 5.88 | 6-1-2029 | | 40,000 | 42,742 |
| Clarios Global LP 144A | | 6.25 | 5-15-2026 | | 136,000 | 141,333 |
| Clarios Global LP 144A | | 6.75 | 5-15-2025 | | 167,000 | 174,306 |
| | | | | | | 358,381 |
| Automobiles: 0.18% | | | | | | |
| Ford Motor Company | | 4.13 | 8-17-2027 | | 400,000 | 421,968 |
| Hotels, restaurants & leisure: 0.57% | | | | | | |
| Carnival Corporation 144A | | 10.50 | 2-1-2026 | | 285,000 | 324,900 |
| NCL Corporation Limited 144A | | 12.25 | 5-15-2024 | | 358,000 | 423,192 |
| Royal Caribbean Cruises Limited 144A | | 9.13 | 6-15-2023 | | 325,000 | 344,713 |
| Royal Caribbean Cruises Limited 144A | | 11.50 | 6-1-2025 | | 221,000 | 246,720 |
| | | | | | | 1,339,525 |
| Household durables: 0.09% | | | | | | |
| Allied Universal Holdco LLC 144A | | 6.63 | 7-15-2026 | | 205,000 | 210,679 |
| Internet & direct marketing retail: 0.06% | | | | | | |
| QVC Incorporated | | 4.38 | 3-15-2023 | | 140,000 | 145,075 |
| Leisure products: 0.10% | | | | | | |
| SeaWorld Parks & Entertainment Incorporated 144A | | 8.75 | 5-1-2025 | | 210,000 | 223,650 |
| Specialty retail: 0.20% | | | | | | |
| Bath & Body Works Incorporated 144A | | 9.38 | 7-1-2025 | | 259,000 | 314,685 |
| Penske Automotive Group Incorporated | | 3.50 | 9-1-2025 | | 140,000 | 141,575 |
| | | | | | | 456,260 |
The accompanying notes are an integral part of these financial statements.
26 | Allspring Real Return Portfolio
Portfolio of investments—November 30, 2021 (unaudited)
| | | Interest
rate | Maturity
date | Principal | Value |
| Textiles, apparel & luxury goods: 0.09% | | | | | | |
| G-III Apparel Group Limited 144A | | 7.88% | 8-15-2025 | $ | 200,000 | $ 212,750 |
| Consumer staples: 0.26% | | | | | | |
| Food products: 0.26% | | | | | | |
| CHS Incorporated 144A | | 6.63 | 2-15-2025 | | 315,000 | 326,403 |
| Performance Food Group Incorporated 144A | | 6.88 | 5-1-2025 | | 280,000 | 293,300 |
| | | | | | | 619,703 |
| Energy: 2.98% | | | | | | |
| Energy equipment & services: 0.33% | | | | | | |
| Oceaneering International Incorporated | | 4.65 | 11-15-2024 | | 650,000 | 659,750 |
| USA Compression Partners LP | | 6.88 | 4-1-2026 | | 115,000 | 117,013 |
| | | | | | | 776,763 |
| Oil, gas & consumable fuels: 2.65% | | | | | | |
| Antero Midstream Company 144A | | 7.88 | 5-15-2026 | | 105,000 | 112,443 |
| Apache Corporation | | 4.63 | 11-15-2025 | | 70,000 | 74,025 |
| Buckeye Partners LP 144A | | 4.13 | 3-1-2025 | | 35,000 | 35,214 |
| Buckeye Partners LP | | 4.15 | 7-1-2023 | | 200,000 | 204,500 |
| Crestwood Midstream Partners LP | | 5.75 | 4-1-2025 | | 605,000 | 606,788 |
| DCP Midstream Operating LP | | 5.38 | 7-15-2025 | | 455,000 | 485,440 |
| EnLink Midstream Partners LP | | 4.15 | 6-1-2025 | | 870,000 | 890,193 |
| Enviva Partners LP 144A | | 6.50 | 1-15-2026 | | 645,000 | 665,601 |
| EQT Corporation | | 6.63 | 2-1-2025 | | 85,000 | 94,872 |
| Murphy Oil Corporation | | 5.75 | 8-15-2025 | | 655,000 | 665,665 |
| New Fortress Energy Incorporated 144A | | 6.50 | 9-30-2026 | | 220,000 | 207,973 |
| Occidental Petroleum Corporation | | 8.00 | 7-15-2025 | | 305,000 | 347,182 |
| Rockies Express Pipeline LLC 144A | | 3.60 | 5-15-2025 | | 529,000 | 542,172 |
| Southwestern Energy Company | | 4.10 | 3-15-2022 | | 225,000 | 224,420 |
| Southwestern Energy Company | | 6.45 | 1-23-2025 | | 127,000 | 137,801 |
| Southwestern Energy Company | | 7.75 | 10-1-2027 | | 110,000 | 117,890 |
| Tallgrass Energy Partners LP 144A | | 7.50 | 10-1-2025 | | 360,000 | 381,600 |
| Western Gas Partners LP | | 4.65 | 7-1-2026 | | 385,000 | 410,988 |
| | | | | | | 6,204,767 |
| Financials: 1.99% | | | | | | |
| Consumer finance: 0.89% | | | | | | |
| LFS Topco LLC 144A | | 5.88 | 10-15-2026 | | 75,000 | 77,615 |
| Navient Corporation | | 5.88 | 10-25-2024 | | 590,000 | 616,709 |
| Navient Corporation | | 7.25 | 9-25-2023 | | 145,000 | 155,875 |
| OneMain Finance Corporation | | 3.50 | 1-15-2027 | | 110,000 | 106,150 |
| PRA Group Incorporated 144A | | 7.38 | 9-1-2025 | | 200,000 | 212,000 |
| Rocket Mortgage LLC 144A | | 2.88 | 10-15-2026 | | 165,000 | 160,778 |
| Springleaf Finance Corporation | | 6.13 | 3-15-2024 | | 295,000 | 309,750 |
| Springleaf Finance Corporation | | 8.88 | 6-1-2025 | | 414,000 | 444,015 |
| | | | | | | 2,082,892 |
| Diversified financial services: 0.30% | | | | | | |
| Hat Holdings LLC 144A | | 3.38 | 6-15-2026 | | 245,000 | 241,019 |
| United Shore Financial Services LLC 144A | | 5.50 | 11-15-2025 | | 450,000 | 447,750 |
| | | | | | | 688,769 |
The accompanying notes are an integral part of these financial statements.
Allspring Real Return Portfolio | 27
Portfolio of investments—November 30, 2021 (unaudited)
| | | Interest
rate | Maturity
date | Principal | Value |
| Insurance: 0.35% | | | | | | |
| Enact Holdings Incorporated 144A | | 6.50% | 8-15-2025 | $ | 750,000 | $ 815,471 |
| Mortgage REITs: 0.25% | | | | | | |
| Starwood Property Trust Incorporated | | 4.75 | 3-15-2025 | | 495,000 | 513,415 |
| Starwood Property Trust Incorporated | | 5.00 | 12-15-2021 | | 77,000 | 77,042 |
| | | | | | | 590,457 |
| Thrifts & mortgage finance: 0.20% | | | | | | |
| Ladder Capital Finance Holdings LP 144A | | 5.25 | 10-1-2025 | | 475,000 | 477,423 |
| Health care: 0.87% | | | | | | |
| Health care providers & services: 0.87% | | | | | | |
| Magellan Health Incorporated | | 4.90 | 9-22-2024 | | 828,000 | 890,100 |
| Select Medical Corporation 144A | | 6.25 | 8-15-2026 | | 364,000 | 382,167 |
| Tenet Healthcare Corporation 144A | | 4.88 | 1-1-2026 | | 375,000 | 383,438 |
| Tenet Healthcare Corporation 144A | | 7.50 | 4-1-2025 | | 220,000 | 231,334 |
| Vizient Incorporated 144A | | 6.25 | 5-15-2027 | | 150,000 | 156,375 |
| | | | | | | 2,043,414 |
| Industrials: 2.18% | | | | | | |
| Aerospace & defense: 0.51% | | | | | | |
| Spirit AeroSystems Holdings Incorporated 144A | | 5.50 | 1-15-2025 | | 525,000 | 540,750 |
| TransDigm Group Incorporated 144A | | 6.25 | 3-15-2026 | | 305,000 | 316,438 |
| TransDigm Group Incorporated | | 7.50 | 3-15-2027 | | 90,000 | 93,825 |
| TransDigm Group Incorporated 144A | | 8.00 | 12-15-2025 | | 231,000 | 243,416 |
| | | | | | | 1,194,429 |
| Airlines: 0.69% | | | | | | |
| American Airlines Group Incorporated 144A | | 5.00 | 6-1-2022 | | 130,000 | 129,513 |
| American Airlines Group Incorporated 144A | | 5.50 | 4-20-2026 | | 385,000 | 393,181 |
| Hawaiian Airlines Incorporated | | 3.90 | 7-15-2027 | | 192,594 | 190,979 |
| Hawaiian Brand Intellectual Property Limited 144A | | 5.75 | 1-20-2026 | | 340,000 | 347,436 |
| Mileage Plus Holdings LLC 144A | | 6.50 | 6-20-2027 | | 425,000 | 453,688 |
| United Airlines Incorporated 144A | | 4.38 | 4-15-2026 | | 90,000 | 90,358 |
| | | | | | | 1,605,155 |
| Commercial services & supplies: 0.46% | | | | | | |
| CoreCivic Incorporated | | 8.25 | 4-15-2026 | | 425,000 | 437,533 |
| Plastipak Holdings Incorporated 144A | | 6.25 | 10-15-2025 | | 620,000 | 629,734 |
| | | | | | | 1,067,267 |
| Construction & engineering: 0.05% | | | | | | |
| Taylor Morrison Communities Incorporated 144A | | 5.88 | 4-15-2023 | | 110,000 | 113,988 |
| Electronic equipment, instruments & components: 0.02% | | | | | | |
| Wesco Distribution Incorporated 144A | | 7.13 | 6-15-2025 | | 55,000 | 58,098 |
| Machinery: 0.00% | | | | | | |
| Stevens Holding Company Incorporated 144A | | 6.13 | 10-1-2026 | | 10,000 | 10,700 |
| Road & rail: 0.16% | | | | | | |
| Uber Technologies Incorporated 144A | | 7.50 | 5-15-2025 | | 350,000 | 368,813 |
The accompanying notes are an integral part of these financial statements.
28 | Allspring Real Return Portfolio
Portfolio of investments—November 30, 2021 (unaudited)
| | | Interest
rate | Maturity
date | Principal | Value |
| Trading companies & distributors: 0.29% | | | | | | |
| Fortress Transportation & Infrastructure Investors LLC 144A | | 6.50% | 10-1-2025 | $ | 660,000 | $ 672,652 |
| Information technology: 0.36% | | | | | | |
| IT services: 0.32% | | | | | | |
| Sabre GLBL Incorporated 144A | | 9.25 | 4-15-2025 | | 585,000 | 650,813 |
| Square Incorporated 144A | | 2.75 | 6-1-2026 | | 85,000 | 84,587 |
| | | | | | | 735,400 |
| Technology hardware, storage & peripherals: 0.04% | | | | | | |
| NCR Corporation 144A | | 5.75 | 9-1-2027 | | 98,000 | 101,561 |
| Materials: 0.53% | | | | | | |
| Chemicals: 0.20% | | | | | | |
| Kraton Polymers LLC 144A | | 4.25 | 12-15-2025 | | 450,000 | 464,625 |
| Containers & packaging: 0.02% | | | | | | |
| Sealed Air Corporation 144A | | 5.13 | 12-1-2024 | | 50,000 | 53,250 |
| Metals & mining: 0.22% | | | | | | |
| Cleveland-Cliffs Incorporated 144A | | 6.75 | 3-15-2026 | | 195,000 | 205,969 |
| Cleveland-Cliffs Incorporated 144A | | 9.88 | 10-17-2025 | | 274,000 | 308,335 |
| | | | | | | 514,304 |
| Paper & forest products: 0.09% | | | | | | |
| Clearwater Paper Corporation 144A | | 5.38 | 2-1-2025 | | 185,000 | 199,795 |
| Real estate: 0.40% | | | | | | |
| Equity REITs: 0.40% | | | | | | |
| Service Properties Trust Company | | 4.35 | 10-1-2024 | | 500,000 | 487,660 |
| Service Properties Trust Company | | 7.50 | 9-15-2025 | | 420,000 | 445,786 |
| | | | | | | 933,446 |
| Utilities: 0.48% | | | | | | |
| Electric utilities: 0.04% | | | | | | |
| NextEra Energy Operating Partners LP 144A | | 4.25 | 7-15-2024 | | 100,000 | 102,299 |
| Independent power & renewable electricity producers: 0.44% | | | | | | |
| NSG Holdings LLC 144A | | 7.75 | 12-15-2025 | | 196,750 | 209,539 |
| TerraForm Power Operating LLC 144A | | 4.25 | 1-31-2023 | | 600,000 | 604,500 |
| Vistra Operations Company LLC 144A | | 5.63 | 2-15-2027 | | 200,000 | 205,379 |
| | | | | | | 1,019,418 |
| Total Corporate bonds and notes (Cost $30,175,769) | | | | | | 30,292,943 |
| Loans: 4.06% | | | | | | |
| Communication services: 0.54% | | | | | | |
| Entertainment: 0.05% | | | | | | |
| Live Nation Entertainment Incorporated (1 Month LIBOR +1.75%) ± | | 1.88 | 10-17-2026 | | 123,384 | 119,889 |
| Media: 0.40% | | | | | | |
| CSC Holdings LLC (1 Month LIBOR +2.50%) ± | | 2.59 | 4-15-2027 | | 365,114 | 357,943 |
| Hubbard Radio LLC (3 Month LIBOR +4.25%) ౠ| | 5.25 | 3-28-2025 | | 75,000 | 74,906 |
The accompanying notes are an integral part of these financial statements.
Allspring Real Return Portfolio | 29
Portfolio of investments—November 30, 2021 (unaudited)
| | | Interest
rate | Maturity
date | Principal | Value |
| Media (continued) | | | | | | |
| Nexstar Broadcasting Incorporated (1 Month LIBOR +2.50%) ± | | 2.59% | 9-18-2026 | $ | 325,000 | $ 322,504 |
| Virgin Media Bristol LLC (1 Month LIBOR +2.50%) ± | | 2.59 | 1-31-2028 | | 175,000 | 172,594 |
| | | | | | | 927,947 |
| Wireless telecommunication services: 0.09% | | | | | | |
| Consolidated Communications Holdings Incorporated (1 Month LIBOR +3.50%) ± | | 4.25 | 10-2-2027 | | 211,000 | 209,856 |
| Consumer discretionary: 0.77% | | | | | | |
| Auto components: 0.28% | | | | | | |
| Clarios Global LP (1 Month LIBOR +3.25%) ± | | 3.34 | 4-30-2026 | | 297,779 | 293,685 |
| Tenneco Incorporated (3 Month LIBOR +3.00%) ± | | 3.09 | 10-1-2025 | | 358,477 | 351,487 |
| | | | | | | 645,172 |
| Hotels, restaurants & leisure: 0.12% | | | | | | |
| Carnival Corporation (1 Month LIBOR +3.00%) ± | | 3.75 | 6-30-2025 | | 79,224 | 77,956 |
| Wyndham Hotels & Resorts Incorporated (3 Month LIBOR +1.75%) ± | | 1.84 | 5-30-2025 | | 213,400 | 209,452 |
| | | | | | | 287,408 |
| Household durables: 0.10% | | | | | | |
| Wilsonart LLC (1 Month LIBOR +3.50%) ± | | 4.50 | 12-19-2026 | | 228,850 | 227,706 |
| Leisure products: 0.16% | | | | | | |
| SeaWorld Parks & Entertainment Incorporated (1 Month LIBOR +3.00%) ± | | 3.50 | 8-25-2028 | | 374,023 | 371,686 |
| Specialty retail: 0.11% | | | | | | |
| Rent-A-Center Incorporated (1 Month LIBOR +3.25%) ± | | 3.75 | 2-17-2028 | | 199,000 | 196,678 |
| Sally Beauty Holdings Incorporated (3 Month LIBOR +2.25%) ౠ| | 2.35 | 7-5-2024 | | 62,605 | 62,057 |
| | | | | | | 258,735 |
| Energy: 0.26% | | | | | | |
| Oil, gas & consumable fuels: 0.26% | | | | | | |
| AL NGPL Holdings LLC (1 Month LIBOR +3.75%) ± | | 4.75 | 4-14-2028 | | 54,863 | 54,771 |
| Apergy Corporation (1 Month LIBOR +5.00%) ± | | 6.00 | 6-3-2027 | | 322,753 | 326,358 |
| GIP II Blue Holdings LP (1 Month LIBOR +4.50%) ‡<± | | 5.50 | 9-29-2028 | | 220,000 | 216,700 |
| | | | | | | 597,829 |
| Financials: 0.21% | | | | | | |
| Diversified financial services: 0.21% | | | | | | |
| Claros Mortgage Trust Incorporated (U.S. SOFR +4.50%) ‡<± | | 5.00 | 8-9-2026 | | 120,000 | 119,700 |
| Resolute Investment Managers Incorporated (1 Month LIBOR +3.75%) ౠ| | 5.25 | 4-30-2024 | | 94,751 | 94,277 |
| Russell Investments US Institutional Holdco Incorporated (1 Month LIBOR +3.50%) ± | | 4.50 | 5-30-2025 | | 285,000 | 284,407 |
| | | | | | | 498,384 |
The accompanying notes are an integral part of these financial statements.
30 | Allspring Real Return Portfolio
Portfolio of investments—November 30, 2021 (unaudited)
| | | Interest
rate | Maturity
date | Principal | Value |
| Health care: 0.67% | | | | | | |
| Health care equipment & supplies: 0.24% | | | | | | |
| Ortho Clinical Diagnostics SA (3 Month LIBOR +3.00%) ± | | 3.08% | 6-30-2025 | $ | 220,000 | $ 218,570 |
| Surgery Center Holdings Incorporated (1 Month LIBOR +3.75%) ± | | 4.50 | 8-31-2026 | | 347,762 | 346,169 |
| | | | | | | 564,739 |
| Health care providers & services: 0.26% | | | | | | |
| National Mentor Holdings Incorporated (1 Month LIBOR +3.75%) ± | | 3.75 | 3-2-2028 | | 2,836 | 2,799 |
| National Mentor Holdings Incorporated (1 Month LIBOR +3.75%) ± | | 4.50 | 3-2-2028 | | 60,951 | 60,146 |
| National Mentor Holdings Incorporated (1 Month LIBOR +3.75%) ± | | 4.50 | 3-2-2028 | | 1,924 | 1,899 |
| Select Medical Corporation (3 Month LIBOR +2.25%) ± | | 2.35 | 3-6-2025 | | 549,214 | 543,491 |
| | | | | | | 608,335 |
| Health care technology: 0.04% | | | | | | |
| Project Ruby Ultimate Parent Corporation (1 Month LIBOR +3.25%) ± | | 4.00 | 3-3-2028 | | 89,550 | 88,830 |
| Pharmaceuticals: 0.13% | | | | | | |
| Bausch Health Companies Incorporated (3 Month LIBOR +3.00%) ± | | 3.09 | 6-2-2025 | | 314,615 | 311,519 |
| Industrials: 0.81% | | | | | | |
| Aerospace & defense: 0.03% | | | | | | |
| Spirit AeroSystems Incorporated (1 Month LIBOR +3.75%) ± | | 4.25 | 1-15-2025 | | 74,438 | 74,298 |
| Airlines: 0.38% | | | | | | |
| AAdvantage Loyalty IP Limited (1 Month LIBOR +4.75%) ± | | 5.50 | 4-20-2028 | | 365,000 | 374,428 |
| Mileage Plus Holdings LLC (1 Month LIBOR +5.25%) ± | | 6.25 | 6-21-2027 | | 210,000 | 218,795 |
| SkyMiles IP Limited (3 Month LIBOR +3.75%) ± | | 4.75 | 10-20-2027 | | 215,000 | 225,705 |
| United Airlines Incorporated (1 Month LIBOR +3.75%) ± | | 4.50 | 4-21-2028 | | 59,700 | 59,451 |
| | | | | | | 878,379 |
| Building products: 0.09% | | | | | | |
| Advanced Drainage Systems Incorporated (1 Month LIBOR +2.25%) ± | | 2.38 | 7-31-2026 | | 218,000 | 217,183 |
| Commercial services & supplies: 0.15% | | | | | | |
| Aramark Services Incorporated (1 Month LIBOR +1.75%) ± | | 1.84 | 3-11-2025 | | 364,323 | 355,579 |
| Machinery: 0.06% | | | | | | |
| Werner FinCo LP (3 Month LIBOR +4.00%) ౠ| | 5.00 | 7-24-2024 | | 133,953 | 133,619 |
| Road & rail: 0.05% | | | | | | |
| Uber Technologies Incorporated (1 Month LIBOR +3.50%) ± | | 3.59 | 4-4-2025 | | 119,077 | 118,557 |
| Software: 0.05% | | | | | | |
| SS&C Technologies Incorporated (1 Month LIBOR +1.75%) ± | | 1.84 | 4-16-2025 | | 69,783 | 68,748 |
| SS&C Technologies Incorporated (1 Month LIBOR +1.75%) ± | | 1.84 | 4-16-2025 | | 56,648 | 55,807 |
| | | | | | | 124,555 |
The accompanying notes are an integral part of these financial statements.
Allspring Real Return Portfolio | 31
Portfolio of investments—November 30, 2021 (unaudited)
| | | Interest
rate | Maturity
date | Principal | Value |
| Information technology: 0.13% | | | | | | |
| Semiconductors & semiconductor equipment: 0.13% | | | | | | |
| ON Semiconductor Corporation (1 Month LIBOR +2.00%) ± | | 2.09% | 9-19-2026 | $ | 308,700 | $ 307,447 |
| Materials: 0.53% | | | | | | |
| Chemicals: 0.04% | | | | | | |
| Ineos US Finance LLC (3 Month LIBOR +2.00%) ± | | 2.09 | 4-1-2024 | | 107,711 | 106,679 |
| Containers & packaging: 0.31% | | | | | | |
| Flex Acquisition Company Incorporated (3 Month LIBOR +3.00%) ± | | 3.13 | 6-29-2025 | | 179,928 | 177,343 |
| Flex Acquisition Company Incorporated (1 Month LIBOR +3.50%) ± | | 4.00 | 2-23-2028 | | 324,370 | 321,584 |
| Graham Packaging Company Incorporated (1 Month LIBOR +3.00%) ± | | 3.75 | 8-4-2027 | | 218,900 | 217,046 |
| | | | | | | 715,973 |
| Paper & forest products: 0.18% | | | | | | |
| Vertical US Newco Incorporated (1 Month LIBOR +3.50%) <± | | 4.00 | 7-30-2027 | | 423,938 | 422,280 |
| Utilities: 0.14% | | | | | | |
| Electric utilities: 0.14% | | | | | | |
| ExGen Renewables IV LLC (1 Month LIBOR +2.50%) ± | | 3.50 | 12-15-2027 | | 325,000 | 324,594 |
| Total Loans (Cost $9,557,238) | | | | | | 9,497,178 |
| U.S. Treasury securities: 66.15% | | | | | | |
| TIPS | | 0.13 | 1-15-2023 | | 398,081 | 414,672 |
| TIPS | | 0.13 | 7-15-2024 | | 2,633,742 | 2,826,180 |
| TIPS | | 0.13 | 10-15-2024 | | 3,955,559 | 4,248,827 |
| TIPS | | 0.13 | 4-15-2025 | | 3,971,431 | 4,272,314 |
| TIPS | | 0.13 | 10-15-2025 | | 2,093,058 | 2,267,289 |
| TIPS | | 0.13 | 4-15-2026 | | 5,804,690 | 6,293,893 |
| TIPS | | 0.13 | 7-15-2026 | | 3,884,831 | 4,237,500 |
| TIPS | | 0.13 | 1-15-2030 | | 4,477,536 | 4,983,649 |
| TIPS | | 0.13 | 7-15-2030 | | 4,043,806 | 4,528,694 |
| TIPS | | 0.13 | 1-15-2031 | | 4,562,348 | 5,102,047 |
| TIPS | | 0.13 | 7-15-2031 | | 2,788,683 | 3,130,152 |
| TIPS | | 0.13 | 2-15-2051 | | 3,155,292 | 3,784,831 |
| TIPS | | 0.25 | 1-15-2025 | | 4,805,825 | 5,179,308 |
| TIPS | | 0.25 | 7-15-2029 | | 2,203,556 | 2,476,562 |
| TIPS | | 0.25 | 2-15-2050 | | 3,904,708 | 4,783,724 |
| TIPS | | 0.38 | 7-15-2023 | | 4,920,739 | 5,220,115 |
| TIPS | | 0.38 | 7-15-2025 | | 2,694,925 | 2,943,626 |
| TIPS | | 0.38 | 1-15-2027 | | 3,026,054 | 3,345,267 |
| TIPS | | 0.38 | 7-15-2027 | | 3,700,224 | 4,127,846 |
| TIPS | | 0.50 | 4-15-2024 | | 3,387,656 | 3,635,775 |
| TIPS | | 0.50 | 1-15-2028 | | 2,846,643 | 3,202,807 |
| TIPS | | 0.63 | 4-15-2023 | | 4,361,788 | 4,599,215 |
| TIPS | | 0.63 | 1-15-2024 | | 5,319,228 | 5,703,002 |
| TIPS | | 0.63 | 1-15-2026 | | 5,708,211 | 6,305,337 |
| TIPS | | 0.63 | 2-15-2043 | | 2,189,173 | 2,763,147 |
| TIPS | | 0.75 | 7-15-2028 | | 3,726,107 | 4,295,066 |
| TIPS | | 0.75 | 2-15-2042 | | 2,955,749 | 3,790,344 |
| TIPS | | 0.75 | 2-15-2045 | | 1,694,755 | 2,212,251 |
| TIPS | | 0.88 | 1-15-2029 | | 3,063,281 | 3,565,612 |
The accompanying notes are an integral part of these financial statements.
32 | Allspring Real Return Portfolio
Portfolio of investments—November 30, 2021 (unaudited)
| | | Interest
rate | Maturity
date | Principal | Value |
| U.S. Treasury securities (continued) | | | | | | |
| TIPS | | 0.88% | 2-15-2047 | $ | 1,675,984 | $ 2,293,784 |
| TIPS | | 1.00 | 2-15-2046 | | 1,655,354 | 2,291,156 |
| TIPS | | 1.00 | 2-15-2048 | | 1,273,561 | 1,808,489 |
| TIPS | | 1.00 | 2-15-2049 | | 1,455,163 | 2,092,707 |
| TIPS | | 1.38 | 2-15-2044 | | 2,389,087 | 3,458,996 |
| TIPS | | 1.75 | 1-15-2028 | | 2,507,233 | 3,027,631 |
| TIPS | | 2.00 | 1-15-2026 | | 3,109,388 | 3,621,222 |
| TIPS | | 2.13 | 2-15-2040 | | 1,319,781 | 2,046,279 |
| TIPS | | 2.13 | 2-15-2041 | | 1,684,613 | 2,644,710 |
| TIPS | | 2.38 | 1-15-2025 | | 3,201,264 | 3,675,014 |
| TIPS | | 2.38 | 1-15-2027 | | 2,305,386 | 2,801,720 |
| TIPS | | 2.50 | 1-15-2029 | | 2,414,532 | 3,108,332 |
| TIPS | | 3.38 | 4-15-2032 | | 973,520 | 1,446,590 |
| TIPS | | 3.63 | 4-15-2028 | | 1,958,695 | 2,625,455 |
| TIPS | | 3.88 | 4-15-2029 | | 2,569,444 | 3,603,678 |
| Total U.S. Treasury securities (Cost $138,744,059) | | | | | | 154,784,815 |
| Yankee corporate bonds and notes: 1.04% | | | | | | |
| Communication services: 0.03% | | | | | | |
| Media: 0.03% | | | | | | |
| Nielsen Holding and Finance BV 144A | | 5.00 | 2-1-2025 | | 65,000 | 65,813 |
| Consumer discretionary: 0.10% | | | | | | |
| Auto components: 0.10% | | | | | | |
| Adient Global Holdings Limited 144A | | 4.88 | 8-15-2026 | | 220,000 | 220,275 |
| Consumer staples: 0.14% | | | | | | |
| Food products: 0.14% | | | | | | |
| Cooke Omega Investments Incorporated 144A | | 8.50 | 12-15-2022 | | 330,000 | 337,013 |
| Energy: 0.24% | | | | | | |
| Oil, gas & consumable fuels: 0.24% | | | | | | |
| Northriver Midstream Finance LP 144A | | 5.63 | 2-15-2026 | | 535,000 | 551,665 |
| Financials: 0.16% | | | | | | |
| Diversified financial services: 0.16% | | | | | | |
| DAE Funding LLC 144A | | 2.63 | 3-20-2025 | | 370,000 | 371,565 |
| Health care: 0.13% | | | | | | |
| Pharmaceuticals: 0.13% | | | | | | |
| Teva Pharmaceutical Finance Netherlands III BV « | | 6.00 | 4-15-2024 | | 295,000 | 306,725 |
| Industrials: 0.24% | | | | | | |
| Airlines: 0.24% | | | | | | |
| Air Canada Pass-Through Trust Series 2020-1 Class C 144A | | 10.50 | 7-15-2026 | | 180,000 | 221,201 |
| Carlyle Aviation Elevate Merger Subsidiary Limited 144A | | 7.00 | 10-15-2024 | | 355,000 | 347,875 |
| | | | | | | 569,076 |
| Total Yankee corporate bonds and notes (Cost $2,425,529) | | | | | | 2,422,132 |
The accompanying notes are an integral part of these financial statements.
Allspring Real Return Portfolio | 33
Portfolio of investments—November 30, 2021 (unaudited)
| | | Yield | | Shares | Value |
| Short-term investments: 0.89% | | | | | | |
| Investment companies: 0.89% | | | | | | |
| Allspring Government Money Market Fund Select Class ♠∞## | | 0.03% | | | 1,975,721 | $ 1,975,721 |
| Securities Lending Cash Investments LLC ♠∩∞ | | 0.04 | | | 107,000 | 107,000 |
| Total Short-term investments (Cost $2,082,721) | | | | | | 2,082,721 |
| Total investments in securities (Cost $206,943,076) | 99.95% | | | | | 233,858,972 |
| Other assets and liabilities, net | 0.05 | | | | | 123,299 |
| Total net assets | 100.00% | | | | | $233,982,271 |
| † | Non-income-earning security |
| 144A | The security may be resold in transactions exempt from registration, normally to qualified institutional buyers, pursuant to Rule 144A under the Securities Act of 1933. |
| ± | Variable rate investment. The rate shown is the rate in effect at period end. |
| ‡ | Security is valued using significant unobservable inputs. |
| < | All or a portion of the position represents an unfunded loan commitment. The rate represents the current interest rate if the loan is partially funded. |
| ## | All or a portion of this security is segregated for unfunded loans. |
| « | All or a portion of this security is on loan. |
| ♠ | The issuer of the security is an affiliated person of the Portfolio as defined in the Investment Company Act of 1940. |
| ∩ | The investment is a non-registered investment company purchased with cash collateral received from securities on loan. |
| ∞ | The rate represents the 7-day annualized yield at period end. |
| Abbreviations: |
| ADR | American depositary receipt |
| LIBOR | London Interbank Offered Rate |
| REIT | Real estate investment trust |
| SOFR | Secured Overnight Financing Rate |
| TIPS | Treasury inflation-protected securities |
Investments in affiliates
An affiliated investment is an investment in which the Portfolio owns at least 5% of the outstanding voting shares of the issuer or as a result of other relationships, such as the Portfolio and the issuer having the same adviser or investment manager. Transactions with issuers that were either affiliates of the Portfolio at the beginning of the period or the end of the period were as follows:
| | Value,
beginning of
period | Purchases | Sales
proceeds | Net
realized
gains
(losses) | | Net
change in
unrealized
gains
(losses) | | Value,
end of
period | Shares,
end
of period | Income
from
affiliated
securities |
| Short-term investments | | | | | | | | | �� |
| Allspring Government Money Market Fund Select Class | $2,265,095 | $32,953,916 | $(33,243,290) | $0 | | $0 | | $ 1,975,721 | 1,975,721 | $363 |
| Securities Lending Cash Investments LLC | 0 | 1,438,725 | (1,331,725) | 0 | | 0 | | 107,000 | 107,000 | 12 # |
| | | | | $0 | | $0 | | $2,082,721 | | $375 |
| # | Amount shown represents income before fees and rebates. |
The accompanying notes are an integral part of these financial statements.
34 | Allspring Real Return Portfolio
Portfolio of investments—November 30, 2021 (unaudited)
Futures contracts
| Description | Number of
contracts | Expiration
date | Notional
cost | Notional
value | Unrealized
gains | | Unrealized
losses |
| Long | | | | | | | |
| 2-Year U.S. Treasury Notes | 14 | 3-31-2022 | $ 3,057,382 | $ 3,062,281 | $ 4,899 | | $ 0 |
| Short | | | | | | | |
| 10-Year Ultra Futures | (3) | 3-22-2022 | (432,181) | (440,672) | 0 | | (8,491) |
| U.S. Ultra Bond | (36) | 3-22-2022 | (6,953,385) | (7,220,250) | 0 | | (266,865) |
| 5-Year U.S. Treasury Notes | (63) | 3-31-2022 | (7,590,504) | (7,648,102) | 0 | | (57,598) |
| | | | | | $4,899 | | $(332,954) |
The accompanying notes are an integral part of these financial statements.
Allspring Real Return Portfolio | 35
Statement of assets and liabilities—November 30, 2021 (unaudited)
| | |
| Assets | |
Investments in unaffiliated securities (including $104,750 of securities loaned), at value (cost $204,860,355)
| $ 231,776,251 |
Investments in affiliated securities, at value (cost $2,082,721)
| 2,082,721 |
Cash at broker segregated for futures contracts
| 336,000 |
Foreign currency, at value (cost $10,712)
| 10,536 |
Receivable for dividends and interest
| 849,609 |
Receivable for investments sold
| 470,208 |
Receivable for securities lending income, net
| 97 |
Prepaid expenses and other assets
| 38,470 |
Total assets
| 235,563,892 |
| Liabilities | |
Payable for investments purchased
| 1,129,270 |
Overdraft due to custodian bank
| 144,877 |
Payable for daily variation margin on open futures contracts
| 136,820 |
Payable upon receipt of securities loaned
| 107,000 |
Advisory fee payable
| 60,818 |
Accrued expenses and other liabilities
| 2,836 |
Total liabilities
| 1,581,621 |
Total net assets
| $233,982,271 |
The accompanying notes are an integral part of these financial statements.
36 | Allspring Real Return Portfolio
Statement of operations—six months ended November 30, 2021 (unaudited)
| | |
| Investment income | |
Interest
| $ 5,628,064 |
Dividends (net of foreign withholdings taxes of $3,966)
| 365,716 |
Income from affiliated securities
| 667 |
Total investment income
| 5,994,447 |
| Expenses | |
Advisory fee
| 460,143 |
Custody and accounting fees
| 17,869 |
Professional fees
| 36,546 |
Interest holder report expenses
| 10,195 |
Trustees’ fees and expenses
| 9,662 |
Other fees and expenses
| 10,138 |
Total expenses
| 544,553 |
Less: Fee waivers and/or expense reimbursements
| (95,913) |
Net expenses
| 448,640 |
Net investment income
| 5,545,807 |
| Realized and unrealized gains (losses) on investments | |
| Net realized gains (losses) on | |
Unaffiliated securities
| 1,673,367 |
Futures contracts
| (79,187) |
Net realized gains on investments
| 1,594,180 |
| Net change in unrealized gains (losses) on | |
Unaffiliated securities
| 1,571,680 |
Futures contracts
| (336,313) |
Net change in unrealized gains (losses) on investments
| 1,235,367 |
Net realized and unrealized gains (losses) on investments
| 2,829,547 |
Net increase in net assets resulting from operations
| $8,375,354 |
The accompanying notes are an integral part of these financial statements.
Allspring Real Return Portfolio | 37
Statement of changes in net assets
| | | |
| | Six months ended
November 30, 2021
(unaudited) | Year ended
May 31, 2021 |
| Operations | | |
Net investment income
| $ 5,545,807 | $ 5,242,820 |
Net realized gains on investments
| 1,594,180 | 859,659 |
Net change in unrealized gains (losses) on investments
| 1,235,367 | 12,483,180 |
Net increase in net assets resulting from operations
| 8,375,354 | 18,585,659 |
| Capital transactions | | |
| Transactions in investors’ beneficial interests | | |
Contributions
| 27,296,888 | 97,022,259 |
Withdrawals
| (41,031,911) | (38,320,850) |
Net increase (decrease) in net assets resulting from capital transactions
| (13,735,023) | 58,701,409 |
Total increase (decrease) in net assets
| (5,359,669) | 77,287,068 |
| Net assets | | |
Beginning of period
| 239,341,940 | 162,054,872 |
End of period
| $233,982,271 | $239,341,940 |
The accompanying notes are an integral part of these financial statements.
38 | Allspring Real Return Portfolio
| | | Year ended May 31 |
| | Six months ended
November 30, 2021
(unaudited) | 2021 | 2020 | 2019 | 2018 | 2017 |
Total return1
| 3.80% | 9.58% | 5.92% | 2.99% | 1.67% | 2.65% |
| Ratios to average net assets (annualized) | | | | | | |
Gross expenses
| 0.47% | 0.47% | 0.45% | 0.45% | 0.48% | 0.52% |
Net expenses2
| 0.39% | 0.39% | 0.39% | 0.40% | 0.41% | 0.44% |
Net investment income
| 4.82% | 2.57% | 2.16% | 2.29% | 2.40% | 2.36% |
| Supplemental data | | | | | | |
Portfolio turnover rate
| 14% | 20% | 24% | 39% | 29% | 25% |
| 1 | Returns for periods of less than one year are not annualized. |
| 2 | Net expense ratios reflect voluntary waivers. |
The accompanying notes are an integral part of these financial statements.
Allspring Real Return Portfolio | 39
Notes to financial statements (unaudited)
1. ORGANIZATION
Allspring Master Trust (the "Trust"), a Delaware statutory trust organized on March 10, 1999, is an open-end management investment company registered under the Investment Company Act of 1940, as amended (the "1940 Act"). As an investment company, the Trust follows the accounting and reporting guidance in Financial Accounting Standards Board ("FASB") Accounting Standards Codification Topic 946, Financial Services – Investment Companies. These financial statements report on the Allspring Real Return Portfolio (the "Portfolio") which is a diversified series of the Trust.
Interests in the Portfolio are available solely through private placement transactions that do not involve any "public offering" within the meaning of Section 4(a)(2) of the Securities Act of 1933.
On February 23, 2021, Wells Fargo & Company entered into a definitive agreement to sell Wells Fargo Asset Management ("WFAM") to GTCR LLC and Reverence Capital Partners, L.P. WFAM was the trade name used by the asset management businesses of Wells Fargo & Company and included Wells Fargo Funds Management, LLC, Wells Capital Management, LLC, Wells Fargo Asset Management (International) Limited and Wells Fargo Funds Distributor, LLC. Effective on November 1, 2021, the sale transaction of WFAM by Wells Fargo & Company to GTCR LLC and Reverence Capital Partners, L.P. was closed. In connection with the closing of the transaction, WFAM became known as Allspring Global Investments (“Allspring”) and various entities that provide services to the Portfolio changed their names to "Allspring", including Allspring Funds Management, LLC (formerly Wells Fargo Funds Management, LLC), the adviser to the Portfolio, Allspring Global Investments, Inc. (formerly Wells Capital Management, LLC) and Allspring Global Investments (UK) Limited (formerly Wells Fargo Asset Management (International) Limited), both registered investment advisers providing subadvisory services to certain funds, and Allspring Funds Distributor, LLC (formerly Wells Fargo Funds Distributor, LLC).
Consummation of the transaction resulted in the automatic termination of the Portfolio’s advisory agreement and subadvisory agreement. The Portfolio’s Board of Trustees approved a new advisory agreement and subadvisory agreement which were approved by the Portfolio's interest holders on August 16, 2021. The new agreements became effective on November 1, 2021.
Effective December 6, 2021, "Wells Fargo" was removed from the Portfolio's name and replaced it with "Allspring".
2. SIGNIFICANT ACCOUNTING POLICIES
The following significant accounting policies, which are consistently followed in the preparation of the financial statements of the Portfolio, are in conformity with U.S. generally accepted accounting principles which require management to make estimates and assumptions that affect the reported amounts of assets and liabilities, disclosure of contingent assets and liabilities at the date of the financial statements, and the reported amounts of income and expenses during the reporting period. Actual results could differ from those estimates.
Securities valuation
All investments are valued each business day as of the close of regular trading on the New York Stock Exchange (generally 4 p.m. Eastern Time), although the Portfolio may deviate from this calculation time under unusual or unexpected circumstances.
Debt securities are valued at the evaluated bid price provided by an independent pricing service (e.g. taking into account various factors, including yields, maturities, or credit ratings) or, if a reliable price is not available, the quoted bid price from an independent broker-dealer.
Equity securities and futures contracts that are listed on a foreign or domestic exchange or market are valued at the official closing price or, if none, the last sales price. If no sale occurs on the principal exchange or market that day, a fair value price will be determined in accordance with the Portfolio’s Valuation Procedures.
The values of securities denominated in foreign currencies are translated into U.S. dollars at rates provided by an independent foreign currency pricing source at a time each business day specified by the Allspring Global Investments Pricing Committee at Allspring Funds Management, LLC ("Allspring Funds Management").
Many securities markets and exchanges outside the U.S. close prior to the close of the New York Stock Exchange and therefore may not fully reflect trading or events that occur after the close of the principal exchange in which the foreign securities are traded, but before the close of the New York Stock Exchange. If such trading or events are expected to materially affect the value of such securities, then fair value pricing procedures approved by the Board of Trustees of the Portfolio are applied. These procedures take into account multiple factors including movements in U.S. securities markets after foreign exchanges close. Foreign securities that are fair valued under these procedures are categorized as Level 2 and the application of these procedures may result in transfers between Level 1 and Level 2. Depending on market activity, such fair valuations may be
40 | Allspring Real Return Portfolio
Notes to financial statements (unaudited)
frequent. Such fair value pricing may result in net asset values that are higher or lower than net asset values based on the last reported sales price or latest quoted bid price. On November 30, 2021, such fair value pricing was used in pricing certain foreign securities.
Investments in registered open-end investment companies are valued at net asset value. Interests in non-registered investment companies that are redeemable at net asset value are fair valued normally at net asset value.
Investments which are not valued using any of the methods discussed above are valued at their fair value, as determined in good faith by the Board of Trustees. The Board of Trustees has established a Valuation Committee comprised of the Trustees and has delegated to it the authority to take any actions regarding the valuation of portfolio securities that the Valuation Committee deems necessary or appropriate, including determining the fair value of portfolio securities, unless the determination has been delegated to the Allspring Global Investments Pricing Committee. The Board of Trustees retains the authority to make or ratify any valuation decisions or approve any changes to the Valuation Procedures as it deems appropriate. On a quarterly basis, the Board of Trustees receives reports on any valuation actions taken by the Valuation Committee or the Allspring Global Investments Pricing Committee which may include items for ratification.
Foreign currency translation
The accounting records of the Portfolio are maintained in U.S. dollars. The values of other assets and liabilities denominated in foreign currencies are translated into U.S. dollars at rates provided by an independent foreign currency pricing source at a time each business day specified by the Allspring Global Investments Pricing Committee. Purchases and sales of securities, and income and expenses are converted at the rate of exchange on the respective dates of such transactions. Net realized foreign exchange gains or losses arise from sales of foreign currencies, currency gains or losses realized between the trade and settlement dates on securities transactions, and the difference between the amounts of dividends, interest and foreign withholding taxes recorded and the U.S. dollar equivalent of the amounts actually paid or received. Net unrealized foreign exchange gains and losses arise from changes in the fair value of assets and liabilities other than investments in securities resulting from changes in exchange rates. The changes in net assets arising from changes in exchange rates of securities and the changes in net assets resulting from changes in market prices of securities are not separately presented. Such changes are included in net realized and unrealized gains or losses from investments.
Securities lending
The Portfolio may lend its securities from time to time in order to earn additional income in the form of fees or interest on securities received as collateral or the investment of any cash received as collateral. When securities are on loan, the Portfolio receives interest or dividends on those securities. Cash collateral received in connection with its securities lending transactions is invested in Securities Lending Cash Investments, LLC (the "Securities Lending Fund"), an affiliated non-registered investment company. Investments in Securities Lending Fund are valued at the evaluated bid price provided by an independent pricing service. Income earned from investment in the Securities Lending Fund (net of fees and rebates), if any, is included in income from affiliated securities on the Statement of Operations.
In a securities lending transaction, the net asset value of the Portfolio is affected by an increase or decrease in the value of the securities loaned and by an increase or decrease in the value of the instrument in which collateral is invested. The amount of securities lending activity undertaken by the Portfolio fluctuates from time to time. The Portfolio has the right under the lending agreement to recover the securities from the borrower on demand. In the event of default or bankruptcy by the borrower, the Portfolio may be prevented from recovering the loaned securities or gaining access to the collateral or may experience delays or costs in doing so. In such an event, the terms of the agreement allow the unaffiliated securities lending agent to use the collateral to purchase replacement securities on behalf of the Portfolio or pay the Portfolio the market value of the loaned securities. The Portfolio bears the risk of loss with respect to depreciation of its investment of the cash collateral.
When-issued transactions
The Portfolio may purchase securities on a forward commitment or when-issued basis. The Portfolio records a when-issued transaction on the trade date and will segregate assets in an amount at least equal in value to the Portfolio's commitment to purchase when-issued securities. Securities purchased on a when-issued basis are marked-to-market daily and the Portfolio begins earning interest on the settlement date. Losses may arise due to changes in the market value of the underlying securities or if the counterparty does not perform under the contract.
Loans
The Portfolio may invest in direct debt instruments which are interests in amounts owed to lenders by corporate or other borrowers. The loans pay interest at rates which are periodically reset by reference to a base lending rate plus a spread. Investments in loans may be in the form of participations in loans or assignments of all or a portion of loans from third parties. When the Portfolio purchases participations, it generally has no rights to enforce compliance with the terms of the loan
Allspring Real Return Portfolio | 41
Notes to financial statements (unaudited)
agreement with the borrower. As a result, the Portfolio assumes the credit risk of both the borrower and the lender that is selling the participation. When the Portfolio purchases assignments from lenders, it acquires direct rights against the borrower on the loan and may enforce compliance by the borrower with the terms of the loan agreement. Loans may include fully funded term loans or unfunded loan commitments, which are contractual obligations for future funding.
Futures contracts
Futures contracts are agreements between the Portfolio and a counterparty to buy or sell a specific amount of a commodity, financial instrument or currency at a specified price on a specified date. The Portfolio may buy and sell futures contracts in order to gain exposure to, or protect against, changes in interest rates and is subject to interest rate risk. The primary risks associated with the use of futures contracts are the imperfect correlation between changes in market values of securities held by the Portfolio and the prices of futures contracts, and the possibility of an illiquid market. Futures contracts are generally entered into on a regulated futures exchange and cleared through a clearinghouse associated with the exchange. With futures contracts, there is minimal counterparty risk to the Portfolio since futures contracts are exchange traded and the exchange’s clearinghouse, as the counterparty to all exchange traded futures, guarantees the futures contracts against default.
Upon entering into a futures contract, the Portfolio is required to deposit either cash or securities (initial margin) with the broker in an amount equal to a certain percentage of the contract value. Subsequent payments (variation margin) are paid to or from the broker each day equal to the daily changes in the contract value. Such payments are recorded as unrealized gains or losses and, if any, shown as variation margin receivable (payable) in the Statement of Assets and Liabilities. Should the Portfolio fail to make requested variation margin payments, the broker can gain access to the initial margin to satisfy the Portfolio’s payment obligations. When the contracts are closed, a realized gain or loss is recorded in the Statement of Operations.
Inflation-indexed bonds and TIPS
The Portfolio may invest in inflation-indexed bonds, including Treasury inflation-protected securities (TIPS). Inflation-indexed bonds are fixed income securities whose principal value is periodically adjusted according to the rate of inflation. If the index measuring inflation falls, the principal value of inflation-indexed bonds (other than municipal inflation-indexed bonds and certain corporate inflation-indexed bonds) will be adjusted downward, and consequently the interest payable on these securities (calculated with respect to a smaller principal amount) will be reduced. Repayment of the original bond principal upon maturity (as adjusted for inflation) is guaranteed in the case of U.S. Treasury inflation-indexed bonds. For bonds that do not provide a similar guarantee, the adjusted principal value of the bond repaid at maturity may be less than the original principal. The value of inflation-indexed bonds is expected to change in response to changes in real interest rates. Real interest rates are tied to the relationship between nominal interest rates and the rate of inflation. If nominal interest rates increase at a faster rate than inflation, real interest rates may rise, leading to a decrease in value of inflation-indexed bonds. Inflation-indexed bonds, including TIPS, decline in value when real interest rates rise. In certain interest rate environments, such as when real interest rates are rising faster than nominal interest rates, inflation-indexed bonds may experience greater losses than other fixed income securities with similar durations.
Security transactions and income recognition
Securities transactions are recorded on a trade date basis. Realized gains or losses are recorded on the basis of identified cost.
Interest income is accrued daily and bond discounts are accreted and premiums are amortized daily. To the extent debt obligations are placed on non-accrual status, any related interest income may be reduced by writing off interest receivables when the collection of all or a portion of interest has been determined to be doubtful based on consistently applied procedures and the fair value has decreased. If the issuer subsequently resumes interest payments or when the collectability of interest is reasonably assured, the debt obligation is removed from non-accrual status.
Dividend income is recognized on the ex-dividend date, except for certain dividends from foreign securities, which are recorded as soon as the custodian verifies the ex-dividend date.
Income is recorded net of foreign taxes withheld where recovery of such taxes is not assured.
Federal and other taxes
The Portfolio is not required to pay federal income taxes on its net investment income and net capital gains as it is treated as a partnership for federal income tax purposes. All income, gains and losses of the Portfolio are deemed to have been “passed through” to the interest holders in proportion to their holdings of the Portfolio regardless of whether income and gains have been distributed by the Portfolio.
42 | Allspring Real Return Portfolio
Notes to financial statements (unaudited)
The Portfolio’s income tax returns and all financial records supporting those returns for the prior three fiscal years are subject to examination by the federal revenue authority. Management has analyzed the Portfolio’s tax positions taken on federal, state, and foreign tax returns for all open tax years and does not believe that there are any uncertain tax positions that require recognition of a tax liability.
As of November 30, 2021, the aggregate cost of all investments for federal income tax purposes was $207,000,107 and the unrealized gains (losses) consisted of:
| Gross unrealized gains | $27,302,375 |
| Gross unrealized losses | (771,565) |
| Net unrealized gains | $26,530,810 |
3. FAIR VALUATION MEASUREMENTS
Fair value measurements of investments are determined within a framework that has established a fair value hierarchy based upon the various data inputs utilized in determining the value of the Portfolio’s investments. The three-level hierarchy gives the highest priority to unadjusted quoted prices in active markets for identical assets or liabilities (Level 1) and the lowest priority to unobservable inputs (Level 3). The Portfolio’s investments are classified within the fair value hierarchy based on the lowest level of input that is significant to the fair value measurement. The inputs are summarized into three broad levels as follows:
| ■ | Level 1 – quoted prices in active markets for identical securities |
| ■ | Level 2 – other significant observable inputs (including quoted prices for similar securities, interest rates, prepayment speeds, credit risk, etc.) |
| ■ | Level 3 – significant unobservable inputs (including the Portfolio’s own assumptions in determining the fair value of investments) |
The inputs or methodologies used for valuing investments in securities are not necessarily an indication of the risk associated with investing in those securities.
The following is a summary of the inputs used in valuing the Portfolio’s assets and liabilities as of November 30, 2021:
| | Quoted prices
(Level 1) | Other significant
observable inputs
(Level 2) | Significant
unobservable inputs
(Level 3) | Total |
| Assets | | | | |
| Investments in: | | | | |
| Common stocks | | | | |
| Consumer staples | $ 10,917,010 | $ 0 | $ 0 | $ 10,917,010 |
| Energy | 2,751,716 | 0 | 0 | 2,751,716 |
| Materials | 7,982,644 | 272,497 | 0 | 8,255,141 |
| Real estate | 12,855,316 | 0 | 0 | 12,855,316 |
| Corporate bonds and notes | 0 | 30,292,943 | 0 | 30,292,943 |
| Loans | 0 | 8,795,919 | 701,259 | 9,497,178 |
| U.S. Treasury securities | 154,784,815 | 0 | 0 | 154,784,815 |
| Yankee corporate bonds and notes | 0 | 2,422,132 | 0 | 2,422,132 |
| Short-term investments | | | | |
| Investment companies | 2,082,721 | 0 | 0 | 2,082,721 |
| | 191,374,222 | 41,783,491 | 701,259 | 233,858,972 |
| Futures contracts | 4,899 | 0 | 0 | 4,899 |
| Total assets | $191,379,121 | $41,783,491 | $701,259 | $233,863,871 |
| Liabilities | | | | |
| Futures contracts | $ 332,954 | $ 0 | $ 0 | $ 332,954 |
| Total liabilities | $ 332,954 | $ 0 | $ 0 | $ 332,954 |
Allspring Real Return Portfolio | 43
Notes to financial statements (unaudited)
Futures contracts are reported at their cumulative unrealized gains (losses) at measurement date as reported in the table following the Portfolio of Investments. For futures contracts, the current day’s variation margin is reported on the Statement of Assets and Liabilities. All other assets and liabilities are reported at their market value at measurement date.
Additional sector, industry or geographic detail, if any, is included in the Portfolio of Investments.
For the six months ended November 30, 2021, the Portfolio did not have any transfers into/out of Level 3.
4. TRANSACTIONS WITH AFFILIATES
Advisory fee
The Trust has entered into an advisory contract with Allspring Funds Management, a wholly owned subsidiary of Allspring Global Investments Holdings, LLC, a holding company indirectly owned by certain private funds of GTCR LLC and Reverence Capital Partners, L.P. The adviser is responsible for implementing investment policies and guidelines and for supervising the subadviser, who is responsible for day-to-day portfolio management of the Portfolio. Pursuant to the contract, Allspring Funds Management is entitled to receive an advisory fee at the following annual rate based on the Portfolio’s average daily net assets:
| Average daily net assets | Advisory fee |
| First $500 million | 0.400% |
| Next $500 million | 0.375 |
| Next $2 billion | 0.350 |
| Next $2 billion | 0.325 |
| Next $5 billion | 0.300 |
| Over $10 billion | 0.290 |
For the six months ended November 30, 2021, the advisory fee was equivalent to an annual rate of 0.40% of the Portfolio’s average daily net assets.
Allspring Funds Management has retained the services of a subadviser to provide daily portfolio management to the Portfolio. The fee for subadvisory services is borne by Allspring Funds Management. Allspring Global Investments, LLC ("Allspring Investments"), an affiliate of Allspring Funds Management and a wholly owned subsidiary of Allspring Global Investments Holdings, LLC, is the subadviser to the Portfolio and is entitled to receive a fee from Allspring Funds Management at an annual rate starting at 0.28% and declining to 0.18% as the average daily net assets of the Portfolio increase.
Allspring Funds Management has voluntarily waived and/or reimbursed advisory fees to reduce the net operating expense ratio of the Portfolio. These voluntary waivers may be discontinued at any time.
Interfund transactions
The Portfolio may purchase or sell portfolio investment securities to certain affiliates pursuant to Rule 17a-7 under the 1940 Act and under procedures adopted by the Board of Trustees. The procedures have been designed to ensure that these interfund transactions, which do not incur broker commissions, are effected at current market prices.
5. INVESTMENT PORTFOLIO TRANSACTIONS
Purchases and sales of investments, excluding short-term securities, for the six months ended November 30, 2021 were as follows:
| Purchases at cost | | Sales proceeds |
U.S.
government | Non-U.S.
government | | U.S.
government | Non-U.S.
government |
| $12,644,595 | $18,365,436 | | $21,888,716 | $17,794,663 |
As of November 30, 2021, the Portfolio had unfunded loan commitments of $619,772.
6. SECURITIES LENDING TRANSACTIONS
The Portfolio lends its securities through an unaffiliated securities lending agent and receives collateral in the form of cash or securities with a value at least equal to the value of the securities on loan. The value of the loaned securities is determined at
44 | Allspring Real Return Portfolio
Notes to financial statements (unaudited)
the close of each business day and any increases or decreases in the required collateral are exchanged between the Portfolio and the counterparty on the next business day. Cash collateral received is invested in the Securities Lending Fund which seeks to provide a positive return compared to the daily Federal Funds Open Rate by investing in high-quality, U.S. dollar-denominated short-term money market instruments and is exempt from registration under Section 3(c)(7) of the 1940 Act. Securities Lending Fund is managed by Allspring Funds Management and is subadvised by Allspring Investments. Allspring Funds Management receives an advisory fee starting at 0.05% and declining to 0.01% as the average daily net assets of the Securities Lending Fund increase. All of the fees received by Allspring Funds Management are paid to Allspring Investments for its services as subadviser.
In the event of counterparty default or the failure of a borrower to return a loaned security, the Portfolio has the right to use the collateral to offset any losses incurred. As of November 30, 2021, the Portfolio had securities lending transactions with the following counterparties which are subject to offset:
| Counterparty | Value of
securities on
loan | Collateral
received1 | Net amount |
| Credit Suisse Securities (USA) LLC | $104,750 | $(104,750) | $0 |
7. DERIVATIVE TRANSACTIONS
During the six months ended November 30, 2021, the Portfolio entered into futures contracts to speculate on interest rates and to help manage the duration of the portfolio. The Portfolio had an average notional amount of $3,101,463 in long futures contracts and $13,590,014 in short futures contracts during the six months ended November 30, 2021.
The fair value, realized gains or losses and change in unrealized gains or losses, if any, on derivative instruments are reflected in the corresponding financial statement captions.
8. BANK BORROWINGS
The Trust, along with Allspring Variable Trust and Allspring Funds Trust (excluding the money market funds), are parties to a $350,000,000 revolving credit agreement whereby the Portfolio is permitted to use bank borrowings for temporary or emergency purposes, such as to fund interest holders withdrawal requests. Interest under the credit agreement is charged to the Portfolio based on a borrowing rate equal to the higher of the Federal Funds rate in effect on that day plus 1.25% or the overnight bank funding rate in effect on that day plus 1.25%. In addition, an annual commitment fee equal to 0.25% of the unused balance is allocated to each participating fund.
For the six months ended November 30, 2021, there were no borrowings by the Portfolio under the agreement.
9. INDEMNIFICATION
Under the Portfolio's organizational documents, the officers and Trustees have been granted certain indemnification rights against certain liabilities that may arise out of performance of their duties to the Portfolio. The Portfolio has entered into a separate agreement with each Trustee that converts indemnification rights currently existing under the Portfolio’s organizational documents into contractual rights that cannot be changed in the future without the consent of the Trustee. Additionally, in the normal course of business, the Portfolio may enter into contracts with service providers that contain a variety of indemnification clauses. The Portfolio’s maximum exposure under these arrangements is dependent on future claims that may be made against the Portfolio and, therefore, cannot be estimated.
10. CORONAVIRUS (COVID-19) PANDEMIC
On March 11, 2020, the World Health Organization announced that it had made the assessment that coronavirus disease 2019 (“COVID-19”) is a pandemic. The impacts of COVID-19 are affecting the entire global economy, individual companies and investment products, the funds, and the market in general. There is significant uncertainty around the extent and duration of business disruptions related to COVID-19 and the impacts may last for an extended period of time. COVID-19 has led to significant uncertainty and volatility in the financial markets.
Allspring Real Return Portfolio | 45
Other information (unaudited)
PROXY VOTING INFORMATION
A description of the policies and procedures used to determine how to vote proxies relating to portfolio securities is available without charge, upon request, by calling 1-800-222-8222, visiting our website at allspringglobal.com, or visiting the SEC website at sec.gov. Information regarding how the proxies related to portfolio securities were voted during the most recent 12-month period ended June 30 is available on the website at allspringglobal.com or by visiting the SEC website at sec.gov.
SPECIAL MEETING OF SHAREHOLDERS
On August 16, 2021, a Special Meeting of Shareholders for Allspring Real Return Fund was held to consider the following proposals. The results of the proposals are indicated below.
Proposal 1 – To consider and approve a new investment management agreement with Wells Fargo Funds Management, LLC*.
| Shares voted “For” | | 3,422,036 |
| Shares voted “Against” | | 53,145 |
| Shares voted “Abstain” | | 71,955 |
Proposal 2 – To consider and approve a new advisory agreement with Wells Fargo Funds Management, LLC* for Allspring Real Return Portfolio in which the Fund invests substantially all of its assets.
| Shares voted “For” | | 3,423,535 |
| Shares voted “Against” | | 50,485 |
| Shares voted “Abstain” | | 73,116 |
Proposal 3 – To consider and approve a new subadvisory agreement with Wells Capital Management, LLC** for Allspring Real Return Portfolio.
| Shares voted “For” | | 3,401,523 |
| Shares voted “Against” | | 53,736 |
| Shares voted “Abstain” | | 91,877 |
Proposal 4 – To approve the use of a "multi-manager" structure for Allspring Real Return Portfolio whereby Wells Fargo Funds Management, LLC* would be able, subject to Board approval, to select subadvisers and enter into or amend subadvisory agreements with them, without obtaining shareholder approval.
| Shares voted “For” | | 3,397,942 |
| Shares voted “Against” | | 75,245 |
| Shares voted “Abstain” | | 73,949 |
* Effective November 1, 2021, known as Allspring Funds Management, LLC.
** Effective November 1, 2021, known as Allspring Global Investments, LLC.
QUARTERLY PORTFOLIO HOLDINGS INFORMATION
The Fund and Portfolio file their complete schedule of portfolio holdings with the SEC for the first and third quarters of each fiscal year as an exhibit to their reports on Form N-PORT. Shareholders and Interest holders may view the filed Form N-PORT by visiting the SEC website at sec.gov.
46 | Allspring Real Return Fund
Other information (unaudited)
BOARD OF TRUSTEES AND OFFICERS
Each of the Trustees and Officers listed in the table below acts in identical capacities for each fund in the Allspring family of funds, which consists of 139 mutual funds comprising the Allspring Funds Trust, Allspring Variable Trust, Allspring Master Trust and four closed-end funds (collectively the “Fund Complex”). This table should be read in conjunction with the Prospectus and the Statement of Additional Information1. The mailing address of each Trustee and Officer is 525 Market Street, 12th Floor, San Francisco, CA 94105. Each Trustee and Officer serves an indefinite term, however, each Trustee serves such term until reaching the mandatory retirement age established by the Trustees.
Independent Trustees
Name and
year of birth | Position held and
length of service* | Principal occupations during past five years or longer | Current other
public company or
investment
company
directorships |
William R. Ebsworth
(Born 1957) | Trustee,
since 2015 | Retired. From 1984 to 2013, equities analyst, portfolio manager, research director and chief investment officer at Fidelity Management and Research Company in Boston, Tokyo, and Hong Kong, and retired in 2013 as Chief Investment Officer of Fidelity Strategic Advisers, Inc. where he led a team of investment professionals managing client assets. Prior thereto, Board member of Hong Kong Securities Clearing Co., Hong Kong Options Clearing Corp., the Thailand International Fund, Ltd., Fidelity Investments Life Insurance Company, and Empire Fidelity Investments Life Insurance Company. Audit Committee Chair and Investment Committee Chair of the Vincent Memorial Hospital Endowment (non-profit organization). Mr. Ebsworth is a CFA® charterholder. | N/A |
Jane A. Freeman
(Born 1953) | Trustee,
since 2015;
Chair Liaison,
since 2018 | Retired. From 2012 to 2014 and 1999 to 2008, Chief Financial Officer of Scientific Learning Corporation. From 2008 to 2012, Ms. Freeman provided consulting services related to strategic business projects. Prior to 1999, Portfolio Manager at Rockefeller & Co. and Scudder, Stevens & Clark. Board member of the Harding Loevner Funds from 1996 to 2014, serving as both Lead Independent Director and chair of the Audit Committee. Board member of the Russell Exchange Traded Funds Trust from 2011 to 2012 and the chair of the Audit Committee. Ms. Freeman is also an inactive Chartered Financial Analyst. | N/A |
Isaiah Harris, Jr.
(Born 1952) | Trustee,
since 2009; Audit
Committee
Chair,
since 2019 | Retired. Chairman of the Board of CIGNA Corporation from 2009 to 2021, and Director from 2005 to 2008. From 2003 to 2011, Director of Deluxe Corporation. Prior thereto, President and CEO of BellSouth Advertising and Publishing Corp. from 2005 to 2007, President and CEO of BellSouth Enterprises from 2004 to 2005 and President of BellSouth Consumer Services from 2000 to 2003. Emeritus member of the Iowa State University Foundation Board of Governors. Emeritus Member of the Advisory Board of Iowa State University School of Business. Advisory Board Member, Palm Harbor Academy (private school). Advisory Board Member, Fellowship of Christian Athletes. Mr. Harris is a certified public accountant (inactive status). | N/A |
Judith M. Johnson**
(Born 1949) | Trustee,
since 2008 | Retired. Prior thereto, Chief Executive Officer and Chief Investment Officer of Minneapolis Employees Retirement Fund from 1996 to 2008. Ms. Johnson is an attorney, certified public accountant and a certified managerial accountant. | N/A |
David F. Larcker
(Born 1950) | Trustee,
since 2009 | James Irvin Miller Professor of Accounting at the Graduate School of Business (Emeritus), Stanford University, Director of the Corporate Governance Research Initiative and Senior Faculty of The Rock Center for Corporate Governance since 2006. From 2005 to 2008, Professor of Accounting at the Graduate School of Business, Stanford University. Prior thereto, Ernst & Young Professor of Accounting at The Wharton School, University of Pennsylvania from 1985 to 2005. | N/A |
Allspring Real Return Fund | 47
Other information (unaudited)
Name and
year of birth | Position held and
length of service* | Principal occupations during past five years or longer | Current other
public company or
investment
company
directorships |
Olivia S. Mitchell
(Born 1953) | Trustee,
since 2006;
Nominating and
Governance
Committee Chair,
since 2018 | International Foundation of Employee Benefit Plans Professor since 1993, Wharton School of the University of Pennsylvania. Director of Wharton’s Pension Research Council and Boettner Center on Pensions & Retirement Research, and Research Associate at the National Bureau of Economic Research. Previously taught at Cornell University from 1978 to 1993. | N/A |
Timothy J. Penny
(Born 1951) | Trustee,
since 1996;
Chair,
since 2018 | President and Chief Executive Officer of Southern Minnesota Initiative Foundation, a non-profit organization, since 2007. Member of the Board of Trustees of NorthStar Education Finance, Inc., a non-profit organization, since 2007. | N/A |
James G. Polisson
(Born 1959) | Trustee,
since 2018 | Retired. Chief Marketing Officer, Source (ETF) UK Services, Ltd, from 2015 to 2017. From 2012 to 2015, Principal of The Polisson Group, LLC, a management consulting, corporate advisory and principal investing company. Chief Executive Officer and Managing Director at Russell Investments, Global Exchange Traded Funds from 2010 to 2012. Managing Director of Barclays Global Investors from 1998 to 2010 and Global Chief Marketing Officer for iShares and Barclays Global Investors from 2000 to 2010. Trustee of the San Francisco Mechanics’ Institute, a non-profit organization, from 2013 to 2015. Board member of the Russell Exchange Traded Fund Trust from 2011 to 2012. Director of Barclays Global Investors Holdings Deutschland GmbH from 2006 to 2009. Mr. Polisson is an attorney and has a retired status with the Massachusetts and District of Columbia Bar Associations. | N/A |
Pamela Wheelock
(Born 1959) | Trustee,
since January
2020; previously
Trustee from
January 2018 to
July 2019 | Board member of the Destination Medical Center Economic Development Agency, Rochester, Minnesota since 2019. Interim President of the McKnight Foundation from January to September 2020. McKnight Foundation Consultant, November 2020 to February 2021. Acting Commissioner, Minnesota Department of Human Services, July 2019 through September 2019. Consultant (part-time), Minnesota Department of Human Services, October 2019 through December 2019. Chief Operating Officer, Twin Cities Habitat for Humanity from 2017 to 2019. Vice President of University Services, University of Minnesota from 2012 to 2016. Prior thereto, on the Board of Directors, Governance Committee and Finance Committee for the Minnesota Philanthropy Partners (Saint Paul Foundation) from 2012 to 2018, Interim Chief Executive Officer of Blue Cross Blue Shield of Minnesota from 2011 to 2012, Chairman of the Board from 2009 to 2012 and Board Director from 2003 to 2015. Vice President, Leadership and Community Engagement, Bush Foundation, Saint Paul, Minnesota (a private foundation) from 2009 to 2011. Executive Vice President and Chief Financial Officer, Minnesota Sports and Entertainment from 2004 to 2009 and Senior Vice President from 2002 to 2004. Executive Vice President of the Minnesota Wild Foundation from 2004 to 2008. Commissioner of Finance, State of Minnesota, from 1999 to 2002. Currently Board Chair of the Minnesota Wild Foundation since 2010. | N/A |
* Length of service dates reflect the Trustee’s commencement of service with the Trust’s predecessor entities, where applicable.
** Ms. Johnson has resigned from the Board effective December 31, 2021.
48 | Allspring Real Return Fund
Other information (unaudited)
Officers2
Name and
year of birth | Position held and
length of service | Principal occupations during past five years or longer |
Andrew Owen
(Born 1960) | President,
since 2017 | President, Chief Executive Officer and Director of Allspring Funds Management, LLC since 2017 and co-president of Galliard Capital Management, LLC, an affiliate of Allspring Funds Management, LLC, since 2019. Prior thereto, Head of Affiliated Managers, Allspring Global Investments, from 2014 to 2019 and Executive Vice President responsible for marketing, investments and product development for Allspring Funds Management, LLC, from 2009 to 2014. In addition, Mr. Owen was an Executive Vice President of Wells Fargo & Company from 2014 to 2021. |
Jeremy DePalma
(Born 1974) | Treasurer,
since 2012
(for certain funds in
the Fund Complex);
since 2021 (for
the remaining funds in the
Fund Complex) | Senior Vice President of Allspring Funds Management, LLC since 2009. Senior Vice President of Evergreen Investment Management Company, LLC from 2008 to 2010 and head of the Fund Reporting and Control Team within Fund Administration. |
Kate McKinley
(Born 1977) | Chief Legal Officer,
since 2021 | Chief Legal Officer of Allspring Global Investments since 2021. Prior thereto, held various roles at State Street Global Advisors beginning in 2010, including serving as Senior Vice President and General Counsel from 2019 to 2021, and Chief Operating Officer of the Institutional Client Group from 2016 - 2019. Prior to working at State Street Global Advisors served as Assistant General Counsel for Bank of America Corporation from 2005 to 2010 and as an Associate at WilmerHale from 2002 to 2005. |
Christopher Baker
(Born 1976) | Chief Compliance Officer, since 2022 | Global Chief Compliance Officer for Allspring Global Investments since 2022. Prior thereto, Chief Compliance Officer for State Street Global Advisors from 2018 to 2021. Senior Compliance Officer for the State Street divisions of Alternative Investment Solutions, Sector Solutions, and Global Marketing from 2015 to 2018. From 2010 to 2015 Vice President, Global Head of Investment and Marketing Compliance for State Street Global Advisors. |
Matthew Prasse
(Born 1983) | Secretary,
since 2021 | Senior Counsel of the Allspring Legal Department since 2021. Senior Counsel of the Wells Fargo Legal Department from 2018 to 2021. Previously, Counsel for Barings LLC from 2015 to 2018. Prior to joining Barings, Associate at Morgan, Lewis & Bockius LLP from 2008 to 2015. |
1 The Statement of Additional Information includes additional information about the Trustees and is available, without charge, upon request, by calling 1-800-222-8222 or by visiting the website at allspringglobal.com.
2 For those Officers with tenures at Allspring Global Investments and/or Allspring Funds Management, LLC that began prior to 2021, such tenures include years of service during which these businesses/entities were known as Wells Fargo Asset Management and Wells Fargo Funds Management, LLC, respectively.
Allspring Real Return Fund | 49
For more information
More information about Allspring Funds is available free upon request. To obtain literature, please write, visit the Fund's website, or call:
Allspring Funds
P.O. Box 219967
Kansas City, MO 64121-9967
Website: allspringglobal.com
Individual investors: 1-800-222-8222
Retail investment professionals: 1-888-877-9275
Institutional investment professionals: 1-866-765-0778
This report and the financial statements contained herein are submitted for the general information of the shareholders of the Fund. If this report is used for promotional purposes, distribution of the report must be accompanied or preceded by a current prospectus. Before investing, please consider the investment objectives, risks, charges, and expenses of the investment. For a current prospectus and, if available, a summary prospectus, containing this information, call
1-800-222-8222 or visit the Fund's website at allspringglobal.com. Read the prospectus carefully before you invest or send money.
Allspring Global InvestmentsTM is the trade name for the asset management firms of Allspring Global Investments Holdings, LLC, a holding company indirectly owned by certain private funds of GTCR LLC and Reverence Capital Partners, L.P. These firms include but are not limited to Allspring Global Investments, LLC, and Allspring Funds Management, LLC. Certain products managed by Allspring entities are distributed by Allspring Funds Distributor, LLC (a broker-dealer and Member FINRA/SIPC).
This material is for general informational and educational purposes only and is NOT intended to provide investment advice or a recommendation of any kind - including a recommendation for any specific investment, strategy, or plan.
© 2022 Allspring Global Investments Holdings, LLC. All rights reserved.
PAR-1221-00200 01-22
SA288/SAR288 11-21
Semi-Annual Report
November 30, 2021
Allspring
C&B Large Cap Value Fund
The views expressed and any forward-looking statements are as of November 30, 2021, unless otherwise noted, and are those of the Fund's portfolio managers and/or Allspring Global Investments. Discussions of individual securities or the markets generally are not intended as individual recommendations. Future events or results may vary significantly from those expressed in any forward-looking statements. The views expressed are subject to change at any time in response to changing circumstances in the market. Allspring Global Investments disclaims any obligation to publicly update or revise any views expressed or forward-looking statements.
Allspring C&B Large Cap Value Fund | 1
Letter to shareholders (unaudited)
Andrew Owen
President
Allspring Funds
Dear Shareholder:
We are pleased to offer you this semi-annual report for Allspring C&B Large Cap Value Fund for the six-month period that ended November 30, 2021. Global stocks yielded mixed results as the global economy continued to emerge from the haze of COVID-19. Tailwinds were provided by global stimulus programs, a rapid vaccination rollout, and recovering consumer and corporate sentiment. The bond market had mostly positive returns during the period.
For the six-month period, U.S. stocks, based on the S&P 500 Index,1 gained 9.38%. International stocks, as measured by the MSCI ACWI ex USA Index (Net),2 returned -5.76%, while the MSCI EM Index (Net) (USD),3 trailed its developed market counterparts with a 10.81% loss. Among bond indexes, the Bloomberg U.S. Aggregate Bond Index,4 returned 1.02%, the Bloomberg Global Aggregate ex-USD Index (unhedged),5 returned -4.64%, the Bloomberg Municipal Bond Index6 returned 0.56%, and the ICE BofA U.S. High Yield Index,7 gained 1.09%.
Vaccination rollout drove the stock markets to new highs.
June witnessed the S&P 500 Index reach a new all-time high. 2021 economic growth and inflation forecasts were revised higher to reflect a strong economic recovery and some supply and demand imbalances. Late June saw a deal reached on a U.S. infrastructure package of approximately $1 trillion for road, bridge, and broadband network upgrades over the next eight years. The U.S. Federal Reserve's (Fed) June meeting yielded no change to policy, but its projections pointed to a possible interest rate rise in 2023. This, combined with a rebound in economic activity and investors searching for yield, led to U.S. Treasury yields being down for the month. Many European and Asian countries saw vaccination momentum increase, while the U.K. dealt with a rise in COVID-19 infections, specifically the Delta variant. Meanwhile, crude oil jumped over 10% in June on the back of the pickup in global economic activity and the Organization of the Petroleum Exporting Countries’ (OPEC) slow pace of supply growth.
“2021 economic growth and inflation forecasts were revised higher to reflect a strong economic recovery and some supply and demand imbalances.”
| 1 | The S&P 500 Index consists of 500 stocks chosen for market size, liquidity, and industry group representation. It is a market-value-weighted index with each stock's weight in the index proportionate to its market value. You cannot invest directly in an index. |
| 2 | The Morgan Stanley Capital International (MSCI) All Country World Index (ACWI) ex USA Index (Net) is a free-float-adjusted market-capitalization-weighted index that is designed to measure the equity market performance of developed and emerging markets, excluding the U.S. Source: MSCI. MSCI makes no express or implied warranties or representations and shall have no liability whatsoever with respect to any MSCI data contained herein. The MSCI data may not be further redistributed or used as a basis for other indexes or any securities or financial products. This report is not approved, reviewed, or produced by MSCI. You cannot invest directly in an index. |
| 3 | The MSCI Emerging Markets (EM) Index (Net) (USD) is a free-float-adjusted market-capitalization-weighted index that is designed to measure equity market performance of emerging markets. You cannot invest directly in an index. |
| 4 | The Bloomberg U.S. Aggregate Bond Index is a broad-based benchmark that measures the investment-grade, U.S.-dollar-denominated, fixed-rate taxable bond market, including Treasuries, government-related and corporate securities, mortgage-backed securities (agency fixed-rate and hybrid adjustable-rate mortgage pass-throughs), asset-backed securities, and commercial mortgage-backed securities. You cannot invest directly in an index. |
| 5 | The Bloomberg Global Aggregate ex-USD Index (unhedged) is an unmanaged index that provides a broad-based measure of the global investment-grade fixed-income markets excluding the U.S.-dollar-denominated debt market. You cannot invest directly in an index. |
| 6 | The Bloomberg Municipal Bond Index is an unmanaged index composed of long-term tax-exempt bonds with a minimum credit rating of Baa. You cannot invest directly in an index. |
| 7 | The ICE BofA U.S. High Yield Index is a market-capitalization-weighted index of domestic and Yankee high-yield bonds. The index tracks the performance of high-yield securities traded in the U.S. bond market. You cannot invest directly in an index. Copyright 2022. ICE Data Indices, LLC. All rights reserved. |
2 | Allspring C&B Large Cap Value Fund
Letter to shareholders (unaudited)
July began the month seeing vaccinations making progress, as several major developed countries eased restrictions, only to be threatened again by the spread of COVID-19’s Delta variant. Inflation continued to climb, aided by the continued supply bottleneck in the face of high demand. As it pertains to the equity area of the market, U.S. equities led the way in positive return territory, followed by international developed markets. In contrast, emerging markets were well in negative territory for the month, hindered by China’s plans for new regulations on a number of sectors, specifically education and technology. The U.S. 10-Year Treasury bond yield continued to decline, as strong demand swallowed up supply. After hitting a multi-year high earlier in the month, oil prices leveled off following an agreement by OPEC to raise oil production starting in August.
The Delta variant of COVID-19 produced outbreaks globally in August, increasing the potential for increased market volatility and bringing into question the ongoing economic recovery. Domestically, the U.S. economy continued to stay strong in the face of the Delta variant, continued inflationary pressures, and worries over Hurricane Ida. Emerging market equities experienced elevated volatility, largely influenced by China’s regulatory stance. Emerging market equities started the month with poor performance but rebounded to end the month in positive territory. Municipal debt experienced its first monthly performance drop since February of this year, slowing a rally that made it one of the best-performing sectors of the bond market. In the commodity segment of the market, crude oil fell sharply during the month on the back of dampened expectations as a result of the Delta variant but was still a leading asset class performer for the year.
Global markets suffered their broadest retreat in a year during September, with the exception of commodities. Concerns over inflation and the interest rate outlook depressed investor confidence and hurt performance. Emerging markets declined on concerns over the continued supply chain disruptions and worries over higher energy and food prices. Meanwhile, the Fed indicated it would slow the pace of asset purchases in the near future. All eyes domestically were fixed on the raising of the debt ceiling, the 2022 budget plan, and the ongoing debate over the infrastructure package. Contrary to most asset classes, commodities thrived in September, driven by sharply higher energy prices.
October’s key themes continued to be elevated inflation pressures and a supply bottleneck, but strong earnings provided a bright spot in the markets. Earnings releases in the U.S. were generally strong and consumer confidence was high. The Fed reaffirmed its plans to taper quantitative easing to a stop by mid-2022. Meanwhile, elevated inflation figures were still being considered transitory by the Fed. Similar to the U.S., the eurozone and many Asian countries saw positive earnings but were facing inflation pressures caused by supply bottlenecks while also experiencing energy price increases amid natural gas shortages. Globally, government bond yields rose as central banks prepared to lower monetary policy accommodation in the face of rising inflationary pressures. As previously referenced, positive commodity performance was driven by sharply higher energy costs.
November was dominated by rising COVID-19 hospitalizations and concerns regarding the Omicron variant. Most major asset classes, both domestically and internationally, declined in November with two exceptions: U.S. investment-grade bonds and Treasury Inflation-Protected Securities. The United Nations Climate Change Conference (COP26) took place during the month with hopes of agreement among countries to limit global warming. While several initiatives were discussed, the conference ultimately ended without the specifics required to instill confidence that the limiting of global warming would succeed. In the U.S., President Biden signed a long-awaited infrastructure bill to upgrade U.S. roads, bridges, and railways. Meanwhile, the Consumer Price Index1, a measure of domestic inflation conditions, jumped to its highest level in 31 years. While the threat of consistently high inflation led the Fed to discuss a faster pace of tapering, the Omicron strain makes that less likely to occur. Commodities came in negative for the month, largely driven by sharp declines in oil prices (and energy costs in general), as well as precious metals.
“ Municipal debt experienced its first monthly performance drop since February of this year, slowing a rally that made it one of the best-performing sectors of the bond market.”
| 1 | The Consumer Price Index (CPI) is a measure of the average change over time in the prices paid by urban consumers for a market basket of consumer goods and services. You cannot invest directly in an index. |
Allspring C&B Large Cap Value Fund | 3
Letter to shareholders (unaudited)
Don’t let short-term uncertainty derail long-term investment goals.
Periods of investment uncertainty can present challenges, but experience has taught us that maintaining long-term investment goals can be an effective way to plan for the future. To help you create a sound strategy based on your personal goals and risk tolerance, Allspring Funds offers more than 100 mutual funds spanning a wide range of asset classes and investment styles. Although diversification cannot guarantee an investment profit or prevent losses, we believe it can be an effective way to manage investment risk and potentially smooth out overall portfolio performance. We encourage investors to know their investments and to understand that appropriate levels of risk-taking may unlock opportunities.
Information on transaction closing.
On November 1, 2021, GTCR LLC and Reverence Capital Partners, L.P., announced the beginning of Allspring Global Investments™, with the close of the transaction to acquire Wells Fargo Funds Management, LLC; Wells Capital Management LLC; Galliard Capital Management LLC.; Wells Fargo Asset Management (International) Ltd.; Wells Fargo Asset Management Luxembourg S.A.; and Wells Fargo Funds Distributor, LLC, as well as Wells Fargo Bank, N.A.’s business of acting as trustee to its collective investment trusts and all related Wells Fargo Asset Management legal entities. The transaction closed on November 1, 2021, forming Allspring Global Investments, a privately held asset management firm with $587 billion in AUM1 as of September 30, 2021.
Allspring Global Investments™ is a leading independent asset management firm with a full breadth of investment capabilities across diverse asset classes, serving the needs of its institutional and wealth management clients around the world. Allspring operates across 18 offices globally supported by more than 480 investment professionals. Allspring and its investment teams provide a broad range of differentiated investment products and solutions to help its diverse range of clients meet their investment objectives.
As part of this transition, all mutual funds within the Wells Fargo Funds family were rebranded as Allspring Funds. Each individual fund had “Wells Fargo” removed from its fund name and replaced with “Allspring.” The fund name changes went into effect on December 6, 2021.
Allspring Global Investments is the trade name for the asset management firms of Allspring Global Investments Holdings, LLC, a holding company indirectly owned by certain private funds of GTCR LLC and Reverence Capital Partners, L.P.
Thank you for choosing to invest with Allspring Funds. We appreciate your confidence in us and remain committed to helping you meet your financial needs.
Sincerely,
Andrew Owen
President
Allspring Funds
For further information about your Fund, contact your investment professional, visit our website at allspringglobal.com, or call us directly at 1-800-222-8222.
| 1 | As of September 30, 2021, assets under management (AUM) includes $93 billion from Galliard Capital Management, LLC, an investment advisor that is not part of the Allspring trade name/GIPS firm. |
4 | Allspring C&B Large Cap Value Fund
This page is intentionally left blank.
Performance highlights (unaudited)
| Investment objective | The Fund seeks maximum long-term total return (current income and capital appreciation), consistent with minimizing risk to principal. |
| Manager | Allspring Funds Management, LLC |
Subadviser for the affiliated master portfolio*
Cooke & Bieler, L.P.
| Portfolio managers | Andrew B. Armstrong, CFA®‡, Wesley Lim, CFA®‡, Steve Lyons, CFA®‡, Michael M. Meyer, CFA®‡, Edward W. O'Connor, CFA®‡, R. James O'Neil, CFA®‡, Mehul Trivedi, CFA®‡, William Weber, CFA®‡ |
| Average annual total returns (%) as of November 30, 2021 |
| | | Including sales charge | | Excluding sales charge | | Expense ratios1 (%) |
| | Inception date | 1 year | 5 year | 10 year | | 1 year | 5 year | 10 year | | Gross | Net 2 |
| Class A (CBEAX) | 7-26-2004 | 13.29 | 10.05 | 11.50 | | 20.18 | 11.36 | 12.17 | | 1.25 | 1.08 |
| Class C (CBECX) | 7-26-2004 | 18.28 | 10.51 | 11.32 | | 19.28 | 10.51 | 11.32 | | 2.00 | 1.83 |
| Class R6 (CBEJX)3 | 10-31-2016 | – | – | – | | 20.68 | 11.84 | 12.59 | | 0.82 | 0.65 |
| Administrator Class (CBLLX) | 7-26-2004 | – | – | – | | 20.33 | 11.46 | 12.33 | | 1.17 | 1.00 |
| Institutional Class (CBLSX) | 7-26-2004 | – | – | – | | 20.56 | 11.72 | 12.59 | | 0.92 | 0.75 |
| Russell 1000® Value Index4 | – | – | – | – | | 22.25 | 10.36 | 12.50 | | – | – |
Figures quoted represent past performance, which is no guarantee of future results, and do not reflect taxes that a shareholder may pay on an investment in a fund. Investment return and principal value of an investment will fluctuate so that an investor’s shares, when redeemed, may be worth more or less than their original cost. Performance shown without sales charges would be lower if sales charges were reflected. Current performance may be lower or higher than the performance data quoted, which assumes the reinvestment of dividends and capital gains. Current month-end performance is available on the Fund’s website, allspringglobal.com.
Index returns do not include transaction costs associated with buying and selling securities, any mutual fund fees or expenses, or any taxes. It is not possible to invest directly in an index.
For Class A shares, the maximum front-end sales charge is 5.75%. For Class C shares, the maximum contingent deferred sales charge is 1.00%. Performance including a contingent deferred sales charge assumes the sales charge for the corresponding time period. Class R6, Administrator Class and Institutional Class shares are sold without a front-end sales charge or contingent deferred sales charge.
| 1 | Reflects the expense ratios as stated in the most recent prospectuses, which include the impact of 0.01% in acquired fund fees and expenses. The expense ratios shown are subject to change and may differ from the annualized expense ratios shown in the financial highlights of this report, which do not include acquired fund fees and expenses. |
| 2 | The manager has contractually committed through September 30, 2022, to waive fees and/or reimburse expenses to the extent necessary to cap total annual fund operating expenses after fee waivers at 1.08% for Class A, 1.83% for Class C, 0.65% for Class R6, 1.00% for Administrator Class, and 0.75% for Institutional Class. Brokerage commissions, stamp duty fees, interest, taxes, acquired fund fees and expenses (if any) from funds in which the affiliated master portfolio invests, and extraordinary expenses are excluded from the expense caps. Net expenses from the affiliated master portfolio are included in the expense caps. Prior to or after the commitment expiration date, the caps may be increased or the commitment to maintain the caps may be terminated only with the approval of the Board of Trustees. Without these caps, the Fund’s returns would have been lower. The expense ratio paid by an investor is the net expense ratio (the total annual fund operating expenses after fee waivers) as stated in the prospectuses. |
| 3 | Historical performance shown for the Class R6 shares prior to their inception reflects the performance of the Institutional Class shares, and includes the higher expenses applicable to the Institutional Class shares. If these expenses had not been included, returns for the Class R6 shares would be higher. |
| 4 | The Russell 1000® Value Index measures the performance of those Russell 1000 companies with lower price/book ratios and lower forecasted growth values. You cannot invest directly in an index. |
Stock values fluctuate in response to the activities of individual companies and general market and economic conditions. Consult the Fund’s prospectus for additional information on these and other risks.
| * | The Fund is a feeder fund in a master-feeder structure that invests substantially all of its assets in a single affiliated master portfolio of the Allspring Master Trust with a substantially identical investment objective and substantially similar investment strategies. References to the investment activities of the Fund are intended to refer to the investment activities of the affiliated master portfolio in which it invests. |
| ‡ | CFA® and Chartered Financial Analyst® are trademarks owned by CFA Institute. |
6 | Allspring C&B Large Cap Value Fund
Performance highlights (unaudited)
| Ten largest holdings (%) as of November 30, 20211 |
| Arrow Electronics Incorporated | 3.85 |
| Arch Capital Group Limited | 3.25 |
| AerCap Holdings NV | 3.17 |
| Fidelity National Financial Incorporated | 2.93 |
| Leidos Holdings Incorporated | 2.87 |
| Brookfield Asset Management Incorporated Class A | 2.79 |
| State Street Corporation | 2.77 |
| Johnson & Johnson | 2.68 |
| US Bancorp | 2.67 |
| Gildan Activewear Incorporated | 2.56 |
| 1 | Each holding represents the Fund’s allocable portion of the affiliated master portfolio security. Figures represent each holding as a percentage of the Fund’s net assets. Holdings are subject to change and may have changed since the date specified. |
| Sector allocation as of November 30, 20211 |
| 1 | Figures represent the sector allocation of the affiliated master portfolio as a percentage of the long-term investments of the affiliated master portfolio. These amounts are subject to change and may have changed since the date specified. |
Allspring C&B Large Cap Value Fund | 7
Fund expenses (unaudited)
As a shareholder of the Fund, you incur two types of costs: (1) transaction costs, including sales charges (loads) on purchase payments and contingent deferred sales charges (if any) on redemptions and (2) ongoing costs, including management fees, distribution (12b-1) and/or shareholder servicing fees, and other Fund expenses. This example is intended to help you understand your ongoing costs (in dollars) of investing in the Fund and to compare these costs with the ongoing costs of investing in other mutual funds.
The example is based on an investment of $1,000 invested at the beginning of the six-month period and held for the entire period from June 1, 2021 to November 30, 2021.
Actual expenses
The “Actual” line of the table below provides information about actual account values and actual expenses. You may use the information in this line, together with the amount you invested, to estimate the expenses that you paid over the period. Simply divide your account value by $1,000 (for example, an $8,600 account value divided by $1,000 = 8.6), then multiply the result by the number in the “Actual” line under the heading entitled “Expenses paid during period” for your applicable class of shares to estimate the expenses you paid on your account during this period.
Hypothetical example for comparison purposes
The “Hypothetical” line of the table below provides information about hypothetical account values and hypothetical expenses based on the Fund’s actual expense ratio and an assumed rate of return of 5% per year before expenses, which is not the Fund’s actual return. The hypothetical account values and expenses may not be used to estimate the actual ending account balance or expenses you paid for the period. You may use this information to compare the ongoing costs of investing in the Fund and other funds. To do so, compare this 5% hypothetical example with the 5% hypothetical examples that appear in the shareholder reports of the other funds.
Please note that the expenses shown in the table are meant to highlight your ongoing costs only and do not reflect any transactional costs, such as sales charges (loads) and contingent deferred sales charges. Therefore, the “Hypothetical” line of the table is useful in comparing ongoing costs only, and will not help you determine the relative total costs of owning different funds. In addition, if these transactional costs were included, your costs would have been higher.
| | Beginning
account value
6-1-2021 | Ending
account value
11-30-2021 | Expenses
paid during
the period1,2 | Annualized net
expense ratio2 |
| Class A | | | | |
| Actual | $1,000.00 | $ 952.80 | $5.24 | 1.07% |
| Hypothetical (5% return before expenses) | $1,000.00 | $1,019.70 | $5.42 | 1.07% |
| Class C | | | | |
| Actual | $1,000.00 | $ 948.73 | $8.94 | 1.83% |
| Hypothetical (5% return before expenses) | $1,000.00 | $1,015.89 | $9.25 | 1.83% |
| Class R6 | | | | |
| Actual | $1,000.00 | $ 954.76 | $3.19 | 0.65% |
| Hypothetical (5% return before expenses) | $1,000.00 | $1,021.81 | $3.29 | 0.65% |
| Administrator Class | | | | |
| Actual | $1,000.00 | $ 953.49 | $4.85 | 0.99% |
| Hypothetical (5% return before expenses) | $1,000.00 | $1,020.10 | $5.01 | 0.99% |
| Institutional Class | | | | |
| Actual | $1,000.00 | $ 954.18 | $3.67 | 0.75% |
| Hypothetical (5% return before expenses) | $1,000.00 | $1,021.31 | $3.80 | 0.75% |
1 Expenses paid is equal to the annualized net expense ratio of each class multiplied by the average account value over the period, multiplied by the number of days in the most recent fiscal half-year divided by the number of days in the fiscal year (to reflect the one-half-year period).
2 Amounts reflect net expenses allocated from the affiliated Master Portfolio in which the Fund invests.
8 | Allspring C&B Large Cap Value Fund
Portfolio of investments—November 30, 2021 (unaudited)
| | | | | | Value |
| Investment companies: 100.04% | | | | | |
| Affiliated master portfolio: 100.04% | | | | | |
| Allspring C&B Large Cap Value Portfolio | | | | | $289,259,996 |
| Total Investment companies (Cost $212,213,043) | | | | | 289,259,996 |
| Total investments in securities (Cost $212,213,043) | 100.04% | | | | 289,259,996 |
| Other assets and liabilities, net | (0.04) | | | | (110,851) |
| Total net assets | 100.00% | | | | $289,149,145 |
Transactions with the affiliated Master Portfolio were as follows:
| | % of
ownership,
beginning
of period | % of
ownership,
end of
period | Net realized
gains
(losses) on
securities
transactions
allocated
from
affiliated
Master
Portfolio | Net
change in
unrealized
gains
(losses) on
securities
transactions
allocated
from
affiliated
Master
Portfolio | Dividends
allocated
from
affiliated
Master
Portfolio | Affiliated
income
allocated
from
affiliated
Master
Portfolio | Value,
end of
period | |
| Allspring C&B Large Cap Value Portfolio | 76.92% | 79.43% | $19,898,996 | $(35,405,131) | $2,488,992 | $5,637 | $289,259,996 | |
The accompanying notes are an integral part of these financial statements.
Allspring C&B Large Cap Value Fund | 9
Statement of assets and liabilities—November 30, 2021 (unaudited)
| | |
| Assets | |
Investments in affiliated Master Portfolio, at value (cost $212,213,043)
| $ 289,259,996 |
Receivable for Fund shares sold
| 108,005 |
Receivable from manager
| 15,777 |
Prepaid expenses and other assets
| 9,383 |
Total assets
| 289,393,161 |
| Liabilities | |
Payable for Fund shares redeemed
| 148,618 |
Administration fees payable
| 36,042 |
Shareholder servicing fees payable
| 24,040 |
Professional fees payable
| 13,612 |
Distribution fee payable
| 2,871 |
Trustees’ fees and expenses payable
| 1,954 |
Accrued expenses and other liabilities
| 16,879 |
Total liabilities
| 244,016 |
Total net assets
| $289,149,145 |
| Net assets consist of | |
Paid-in capital
| $ 173,051,642 |
Total distributable earnings
| 116,097,503 |
Total net assets
| $289,149,145 |
| Computation of net asset value and offering price per share | |
Net assets – Class A
| $ 99,833,067 |
Shares outstanding – Class A1
| 6,105,806 |
Net asset value per share – Class A
| $16.35 |
Maximum offering price per share – Class A2
| $17.35 |
Net assets – Class C
| $ 4,331,110 |
Shares outstanding – Class C1
| 268,995 |
Net asset value per share – Class C
| $16.10 |
Net assets – Class R6
| $ 45,866,598 |
Shares outstanding – Class R61
| 2,786,660 |
Net asset value per share – Class R6
| $16.46 |
Net assets – Administrator Class
| $ 6,461,626 |
Shares outstanding – Administrator Class1
| 394,124 |
Net asset value per share – Administrator Class
| $16.39 |
Net assets – Institutional Class
| $ 132,656,744 |
Shares outstanding – Institutional Class1
| 8,064,203 |
Net asset value per share – Institutional Class
| $16.45 |
| 1 | The Fund has an unlimited number of authorized shares. |
| 2 | Maximum offering price is computed as 100/94.25 of net asset value. On investments of $50,000 or more, the offering price is reduced. |
The accompanying notes are an integral part of these financial statements.
10 | Allspring C&B Large Cap Value Fund
Statement of operations—six months ended November 30, 2021 (unaudited)
| | |
| Investment income | |
Dividends allocated from affiliated Master Portfolio (net of foreign withholding taxes of $49,461)
| $ 2,488,992 |
Affiliated income allocated from affiliated Master Portfolio
| 5,637 |
Expenses allocated from affiliated Master Portfolio
| (1,053,940) |
Waivers allocated from affiliated Master Portfolio
| 70,182 |
Total investment income
| 1,510,871 |
| Expenses | |
Management fee
| 76,848 |
| Administration fees | |
Class A
| 108,026 |
Class C
| 4,855 |
Class R6
| 7,013 |
Administrator Class
| 3,991 |
Institutional Class
| 95,548 |
| Shareholder servicing fees | |
Class A
| 128,602 |
Class C
| 5,772 |
Administrator Class
| 7,670 |
| Distribution fee | |
Class C
| 17,316 |
Custody and accounting fees
| 3,895 |
Professional fees
| 17,914 |
Registration fees
| 5,170 |
Shareholder report expenses
| 3,920 |
Trustees’ fees and expenses
| 9,967 |
Other fees and expenses
| 3,784 |
Total expenses
| 500,291 |
| Less: Fee waivers and/or expense reimbursements | |
Fund-level
| (150,988) |
Class A
| (5,130) |
Administrator Class
| (306) |
Net expenses
| 343,867 |
Net investment income
| 1,167,004 |
| Realized and unrealized gains (losses) on investments | |
Net realized gains on securities transactions allocated from affiliated Master Portfolio
| 19,898,996 |
Net change in unrealized gains (losses) on securities transactions allocated from affiliated Master Portfolio
| (35,405,131) |
Net realized and unrealized gains (losses) on investments
| (15,506,135) |
Net decrease in net assets resulting from operations
| $(14,339,131) |
The accompanying notes are an integral part of these financial statements.
Allspring C&B Large Cap Value Fund | 11
Statement of changes in net assets
| | | | | |
| | Six months ended
November 30, 2021
(unaudited) | Year ended
May 31, 2021 |
| Operations | | | | |
Net investment income
| | $ 1,167,004 | | $ 2,415,023 |
Net realized gains on investments
| | 19,898,996 | | 25,510,777 |
Net change in unrealized gains (losses) on investments
| | (35,405,131) | | 89,716,793 |
Net increase (decrease) in net assets resulting from operations
| | (14,339,131) | | 117,642,593 |
| Distributions to shareholders from | | | | |
| Net investment income and net realized gains | | | | |
Class A
| | 0 | | (4,170,269) |
Class C
| | 0 | | (154,865) |
Class R6
| | 0 | | (2,183,532) |
Administrator Class
| | 0 | | (299,002) |
Institutional Class
| | 0 | | (6,446,162) |
Total distributions to shareholders
| | 0 | | (13,253,830) |
| Capital share transactions | Shares | | Shares | |
| Proceeds from shares sold | | | | |
Class A
| 467,500 | 7,945,482 | 610,000 | 8,963,843 |
Class C
| 20,902 | 348,411 | 68,098 | 996,267 |
Class R6
| 202,148 | 3,473,235 | 281,375 | 4,009,424 |
Administrator Class
| 51,100 | 882,850 | 19,784 | 279,674 |
Institutional Class
| 585,138 | 9,979,605 | 3,644,970 | 49,931,868 |
| | | 22,629,583 | | 64,181,076 |
| Reinvestment of distributions | | | | |
Class A
| 0 | 0 | 291,093 | 4,115,619 |
Class C
| 0 | 0 | 11,107 | 154,614 |
Class R6
| 0 | 0 | 24,172 | 343,838 |
Administrator Class
| 0 | 0 | 13,379 | 189,677 |
Institutional Class
| 0 | 0 | 451,083 | 6,414,372 |
| | | 0 | | 11,218,120 |
| Payment for shares redeemed | | | | |
Class A
| (323,507) | (5,506,935) | (1,092,566) | (14,863,709) |
Class C
| (30,030) | (505,128) | (115,785) | (1,529,367) |
Class R6
| (158,780) | (2,718,702) | (844,970) | (11,496,464) |
Administrator Class
| (4,568) | (78,012) | (221,462) | (3,119,176) |
Institutional Class
| (1,588,158) | (26,994,852) | (3,426,687) | (47,236,282) |
| | | (35,803,629) | | (78,244,998) |
Net decrease in net assets resulting from capital share transactions
| | (13,174,046) | | (2,845,802) |
Total increase (decrease) in net assets
| | (27,513,177) | | 101,542,961 |
| Net assets | | | | |
Beginning of period
| | 316,662,322 | | 215,119,361 |
End of period
| | $289,149,145 | | $316,662,322 |
The accompanying notes are an integral part of these financial statements.
12 | Allspring C&B Large Cap Value Fund
Financial highlights
(For a share outstanding throughout each period)
| | | Year ended May 31 |
| Class A | Six months ended
November 30, 2021
(unaudited) | 2021 | 2020 | 2019 | 2018 | 2017 |
Net asset value, beginning of period
| $17.16 | $11.49 | $13.01 | $13.91 | $14.54 | $12.55 |
Net investment income
| 0.05 | 0.10 | 0.12 | 0.11 | 0.09 1 | 0.08 |
Net realized and unrealized gains (losses) on investments
| (0.86) | 6.29 | (0.33) | 0.02 | 0.87 | 2.23 |
Total from investment operations
| (0.81) | 6.39 | (0.21) | 0.13 | 0.96 | 2.31 |
| Distributions to shareholders from | | | | | | |
Net investment income
| 0.00 | (0.11) | (0.13) | (0.12) | (0.06) | (0.08) |
Net realized gains
| 0.00 | (0.61) | (1.18) | (0.91) | (1.53) | (0.24) |
Total distributions to shareholders
| 0.00 | (0.72) | (1.31) | (1.03) | (1.59) | (0.32) |
Net asset value, end of period
| $16.35 | $17.16 | $11.49 | $13.01 | $13.91 | $14.54 |
Total return2
| (4.72)% | 56.98% | (3.61)% | 1.33% | 6.29% | 18.62% |
| Ratios to average net assets (annualized)* | | | | | | |
Gross expenses
| 1.18% | 1.24% | 1.27% | 1.23% | 1.21% | 1.24% |
Net expenses
| 1.07% | 1.07% | 1.07% | 1.08% | 1.10% | 1.15% |
Net investment income
| 0.55% | 0.73% | 0.92% | 0.83% | 0.58% | 0.62% |
| Supplemental data | | | | | | |
Portfolio turnover rate3
| 15% | 38% | 33% | 47% | 42% | 89% |
Net assets, end of period (000s omitted)
| $99,833 | $102,332 | $70,680 | $79,172 | $85,707 | $83,016 |
| * | Ratios include net expenses allocated from the affiliated Master Portfolio which were as follows: |
| Six months ended November 30, 2021 (unaudited) | 0.64% |
| Year ended May 31, 2021 | 0.64% |
| Year ended May 31, 2020 | 0.64% |
| Year ended May 31, 2019 | 0.65% |
| Year ended May 31, 2018 | 0.66% |
| Year ended May 31, 2017 | 0.68% |
| 1 | Calculated based upon average shares outstanding |
| 2 | Total return calculations do not include any sales charges. Returns for periods of less than one year are not annualized. |
| 3 | Portfolio turnover rate is calculated by multiplying the affiliated Master Portfolio’s percentage of the Fund’s total investment in securities at the end of the period by the affiliated Master Portfolio’s portfolio turnover rate. |
The accompanying notes are an integral part of these financial statements.
Allspring C&B Large Cap Value Fund | 13
Financial highlights
(For a share outstanding throughout each period)
| | | Year ended May 31 |
| Class C | Six months ended
November 30, 2021
(unaudited) | 2021 | 2020 | 2019 | 2018 | 2017 |
Net asset value, beginning of period
| $16.97 | $11.36 | $12.87 | $13.75 | $14.44 | $12.48 |
Net investment income (loss)
| (0.02) | (0.03) | 0.02 1 | 0.01 1 | (0.02) 1 | (0.02) |
Net realized and unrealized gains (losses) on investments
| (0.85) | 6.25 | (0.35) | 0.03 | 0.86 | 2.22 |
Total from investment operations
| (0.87) | 6.22 | (0.33) | 0.04 | 0.84 | 2.20 |
| Distributions to shareholders from | | | | | | |
Net investment income
| 0.00 | 0.00 | 0.00 | (0.01) | 0.00 | 0.00 |
Net realized gains
| 0.00 | (0.61) | (1.18) | (0.91) | (1.53) | (0.24) |
Total distributions to shareholders
| 0.00 | (0.61) | (1.18) | (0.92) | (1.53) | (0.24) |
Net asset value, end of period
| $16.10 | $16.97 | $11.36 | $12.87 | $13.75 | $14.44 |
Total return2
| (5.13)% | 55.94% | (4.41)% | 0.61% | 5.46% | 17.73% |
| Ratios to average net assets (annualized)* | | | | | | |
Gross expenses
| 1.93% | 1.99% | 2.02% | 1.97% | 1.96% | 1.99% |
Net expenses
| 1.83% | 1.83% | 1.83% | 1.83% | 1.85% | 1.90% |
Net investment income (loss)
| (0.21)% | (0.04)% | 0.16% | 0.07% | (0.16)% | (0.13)% |
| Supplemental data | | | | | | |
Portfolio turnover rate3
| 15% | 38% | 33% | 47% | 42% | 89% |
Net assets, end of period (000s omitted)
| $4,331 | $4,719 | $3,576 | $5,098 | $11,031 | $8,043 |
| * | Ratios include net expenses allocated from the affiliated Master Portfolio which were as follows: |
| Six months ended November 30, 2021 (unaudited) | 0.64% |
| Year ended May 31, 2021 | 0.64% |
| Year ended May 31, 2020 | 0.64% |
| Year ended May 31, 2019 | 0.65% |
| Year ended May 31, 2018 | 0.66% |
| Year ended May 31, 2017 | 0.68% |
| 1 | Calculated based upon average shares outstanding |
| 2 | Total return calculations do not include any sales charges. Returns for periods of less than one year are not annualized. |
| 3 | Portfolio turnover rate is calculated by multiplying the affiliated Master Portfolio’s percentage of the Fund’s total investment in securities at the end of the period by the affiliated Master Portfolio’s portfolio turnover rate. |
The accompanying notes are an integral part of these financial statements.
14 | Allspring C&B Large Cap Value Fund
Financial highlights
(For a share outstanding throughout each period)
| | | Year ended May 31 |
| Class R6 | Six months ended
November 30, 2021
(unaudited) | 2021 | 2020 | 2019 | 2018 | 2017 1 |
Net asset value, beginning of period
| $17.24 | $11.53 | $13.06 | $13.97 | $14.59 | $12.73 |
Net investment income
| 0.08 | 0.16 2 | 0.18 2 | 0.18 2 | 0.18 2 | 0.16 |
Net realized and unrealized gains (losses) on investments
| (0.86) | 6.32 | (0.33) | 0.00 3 | 0.85 | 2.06 |
Total from investment operations
| (0.78) | 6.48 | (0.15) | 0.18 | 1.03 | 2.22 |
| Distributions to shareholders from | | | | | | |
Net investment income
| 0.00 | (0.16) | (0.20) | (0.18) | (0.12) | (0.12) |
Net realized gains
| 0.00 | (0.61) | (1.18) | (0.91) | (1.53) | (0.24) |
Total distributions to shareholders
| 0.00 | (0.77) | (1.38) | (1.09) | (1.65) | (0.36) |
Net asset value, end of period
| $16.46 | $17.24 | $11.53 | $13.06 | $13.97 | $14.59 |
Total return4
| (4.52)% | 57.75% | (3.25)% | 1.74% | 6.76% | 17.65% |
| Ratios to average net assets (annualized)* | | | | | | |
Gross expenses
| 0.75% | 0.82% | 0.84% | 0.79% | 0.77% | 0.81% |
Net expenses
| 0.65% | 0.65% | 0.65% | 0.65% | 0.65% | 0.70% |
Net investment income
| 0.97% | 1.14% | 1.33% | 1.27% | 1.28% | 1.04% |
| Supplemental data | | | | | | |
Portfolio turnover rate5
| 15% | 38% | 33% | 47% | 42% | 89% |
Net assets, end of period (000s omitted)
| $45,867 | $47,301 | $37,859 | $68,366 | $110,665 | $3,532 |
| * | Ratios include net expenses allocated from the affiliated Master Portfolio which were as follows: |
| Six months ended November 30, 2021 (unaudited) | 0.64% |
| Year ended May 31, 2021 | 0.64% |
| Year ended May 31, 2020 | 0.64% |
| Year ended May 31, 2019 | 0.65% |
| Year ended May 31, 2018 | 0.65% |
| Year ended May 31, 20171 | 0.68% |
| 1 | For the period from October 31, 2016 (commencement of class operations) to May 31, 2017 |
| 2 | Calculated based upon average shares outstanding |
| 3 | Amount is less than $0.005. |
| 4 | Returns for periods of less than one year are not annualized. |
| 5 | Portfolio turnover rate is calculated by multiplying the affiliated Master Portfolio’s percentage of the Fund’s total investment in securities at the end of the period by the affiliated Master Portfolio’s portfolio turnover rate. |
The accompanying notes are an integral part of these financial statements.
Allspring C&B Large Cap Value Fund | 15
Financial highlights
(For a share outstanding throughout each period)
| | | Year ended May 31 |
| Administrator Class | Six months ended
November 30, 2021
(unaudited) | 2021 | 2020 | 2019 | 2018 | 2017 |
Net asset value, beginning of period
| $17.20 | $11.51 | $13.03 | $13.92 | $14.56 | $12.54 |
Net investment income
| 0.05 1 | 0.11 1 | 0.13 1 | 0.12 1 | 0.10 1 | 0.10 1 |
Net realized and unrealized gains (losses) on investments
| (0.86) | 6.30 | (0.33) | 0.02 | 0.87 | 2.24 |
Total from investment operations
| (0.81) | 6.41 | (0.20) | 0.14 | 0.97 | 2.34 |
| Distributions to shareholders from | | | | | | |
Net investment income
| 0.00 | (0.11) | (0.14) | (0.12) | (0.08) | (0.08) |
Net realized gains
| 0.00 | (0.61) | (1.18) | (0.91) | (1.53) | (0.24) |
Total distributions to shareholders
| 0.00 | (0.72) | (1.32) | (1.03) | (1.61) | (0.32) |
Net asset value, end of period
| $16.39 | $17.20 | $11.51 | $13.03 | $13.92 | $14.56 |
Total return2
| (4.71)% | 57.12% | (3.56)% | 1.44% | 6.36% | 18.82% |
| Ratios to average net assets (annualized)* | | | | | | |
Gross expenses
| 1.10% | 1.17% | 1.19% | 1.15% | 1.13% | 1.16% |
Net expenses
| 0.99% | 0.99% | 0.99% | 1.00% | 1.00% | 1.00% |
Net investment income
| 0.62% | 0.81% | 1.00% | 0.90% | 0.69% | 0.77% |
| Supplemental data | | | | | | |
Portfolio turnover rate3
| 15% | 38% | 33% | 47% | 42% | 89% |
Net assets, end of period (000s omitted)
| $6,462 | $5,980 | $6,167 | $9,274 | $12,742 | $11,467 |
| * | Ratios include net expenses allocated from the affiliated Master Portfolio which were as follows: |
| Six months ended November 30, 2021 (unaudited) | 0.64% |
| Year ended May 31, 2021 | 0.64% |
| Year ended May 31, 2020 | 0.64% |
| Year ended May 31, 2019 | 0.65% |
| Year ended May 31, 2018 | 0.66% |
| Year ended May 31, 2017 | 0.68% |
| 1 | Calculated based upon average shares outstanding |
| 2 | Returns for periods of less than one year are not annualized. |
| 3 | Portfolio turnover rate is calculated by multiplying the affiliated Master Portfolio’s percentage of the Fund’s total investment in securities at the end of the period by the affiliated Master Portfolio’s portfolio turnover rate. |
The accompanying notes are an integral part of these financial statements.
16 | Allspring C&B Large Cap Value Fund
Financial highlights
(For a share outstanding throughout each period)
| | | Year ended May 31 |
| Institutional Class | Six months ended
November 30, 2021
(unaudited) | 2021 | 2020 | 2019 | 2018 | 2017 |
Net asset value, beginning of period
| $17.24 | $11.53 | $13.05 | $13.96 | $14.58 | $12.58 |
Net investment income
| 0.07 | 0.15 | 0.16 | 0.14 | 0.13 1 | 0.14 |
Net realized and unrealized gains (losses) on investments
| (0.86) | 6.32 | (0.33) | 0.02 | 0.89 | 2.22 |
Total from investment operations
| (0.79) | 6.47 | (0.17) | 0.16 | 1.02 | 2.36 |
| Distributions to shareholders from | | | | | | |
Net investment income
| 0.00 | (0.15) | (0.17) | (0.16) | (0.11) | (0.12) |
Net realized gains
| 0.00 | (0.61) | (1.18) | (0.91) | (1.53) | (0.24) |
Total distributions to shareholders
| 0.00 | (0.76) | (1.35) | (1.07) | (1.64) | (0.36) |
Net asset value, end of period
| $16.45 | $17.24 | $11.53 | $13.05 | $13.96 | $14.58 |
Total return2
| (4.58)% | 57.58% | (3.33)% | 1.64% | 6.68% | 19.05% |
| Ratios to average net assets (annualized)* | | | | | | |
Gross expenses
| 0.85% | 0.91% | 0.94% | 0.90% | 0.88% | 0.91% |
Net expenses
| 0.75% | 0.75% | 0.75% | 0.75% | 0.77% | 0.80% |
Net investment income
| 0.88% | 1.05% | 1.25% | 1.17% | 0.87% | 0.96% |
| Supplemental data | | | | | | |
Portfolio turnover rate3
| 15% | 38% | 33% | 47% | 42% | 89% |
Net assets, end of period (000s omitted)
| $132,657 | $156,330 | $96,838 | $108,613 | $135,082 | $220,257 |
| * | Ratios include net expenses allocated from the affiliated Master Portfolio which were as follows: |
| Six months ended November 30, 2021 (unaudited) | 0.64% |
| Year ended May 31, 2021 | 0.64% |
| Year ended May 31, 2020 | 0.64% |
| Year ended May 31, 2019 | 0.65% |
| Year ended May 31, 2018 | 0.66% |
| Year ended May 31, 2017 | 0.68% |
| 1 | Calculated based upon average shares outstanding |
| 2 | Returns for periods of less than one year are not annualized. |
| 3 | Portfolio turnover rate is calculated by multiplying the affiliated Master Portfolio’s percentage of the Fund’s total investment in securities at the end of the period by the affiliated Master Portfolio’s portfolio turnover rate. |
The accompanying notes are an integral part of these financial statements.
Allspring C&B Large Cap Value Fund | 17
Notes to financial statements (unaudited)
1. ORGANIZATION
Allspring Funds Trust (the "Trust"), a Delaware statutory trust organized on March 10, 1999, is an open-end management investment company registered under the Investment Company Act of 1940, as amended (the "1940 Act"). As an investment company, the Trust follows the accounting and reporting guidance in Financial Accounting Standards Board ("FASB") Accounting Standards Codification Topic 946, Financial Services – Investment Companies. These financial statements report on the Allspring C&B Large Cap Value Fund (the "Fund") which is a diversified series of the Trust.
The Fund is a feeder fund in a master-feeder structure that invests substantially all of its assets in a single master portfolio with a substantially identical investment objective and substantially similar investment strategies. The Fund invests in Allspring C&B Large Cap Value Portfolio, a separate diversified portfolio (the “affiliated Master Portfolio”) of Allspring Master Trust, a registered open-end management investment company. As of November 30, 2021, the Fund owned 79.43% of Allspring C&B Large Cap Value Portfolio. The affiliated Master Portfolio directly acquires portfolio securities and the Fund acquires an indirect interest in those securities. The Fund accounts for its investment in the affiliated Master Portfolio as a partnership investment and records on a daily basis its share of the affiliated Master Portfolio’s income, expense and realized and unrealized gains and losses. The financial statements of the affiliated Master Portfolio for the six months ended November 30, 2021 are included in this report and should be read in conjunction with the Fund’s financial statements.
On February 23, 2021, Wells Fargo & Company entered into a definitive agreement to sell Wells Fargo Asset Management ("WFAM") to GTCR LLC and Reverence Capital Partners, L.P. WFAM was the trade name used by the asset management businesses of Wells Fargo & Company and included Wells Fargo Funds Management, LLC, Wells Capital Management, LLC, Wells Fargo Asset Management (International) Limited and Wells Fargo Funds Distributor, LLC. Effective on November 1, 2021, the sale transaction of WFAM by Wells Fargo & Company to GTCR LLC and Reverence Capital Partners, L.P. was closed. In connection with the closing of the transaction, WFAM became known as Allspring Global Investments (“Allspring”) and various entities that provide services to the Fund changed their names to "Allspring", including Allspring Funds Management, LLC (formerly Wells Fargo Funds Management, LLC), the investment manager to the Fund, Allspring Global Investments, Inc. (formerly Wells Capital Management, LLC) and Allspring Global Investments (UK) Limited (formerly Wells Fargo Asset Management (International) Limited), both registered investment advisers providing subadvisory services to certain funds, and Allspring Funds Distributor, LLC (formerly Wells Fargo Funds Distributor, LLC), the Fund's principal underwriter.
Consummation of the transaction resulted in the automatic termination of the Fund’s investment management agreement. The Fund’s Board of Trustees approved a new investment management agreement which was submitted and approved by the Fund’s shareholders at a Special Meeting of Shareholders held on August 16, 2021. The new agreement became effective on November 1, 2021.
Effective December 6, 2021, "Wells Fargo" was removed from the Fund's name and replaced it with "Allspring".
2. SIGNIFICANT ACCOUNTING POLICIES
The following significant accounting policies, which are consistently followed in the preparation of the financial statements of the Fund, are in conformity with U.S. generally accepted accounting principles which require management to make estimates and assumptions that affect the reported amounts of assets and liabilities, disclosure of contingent assets and liabilities at the date of the financial statements, and the reported amounts of income and expenses during the reporting period. Actual results could differ from those estimates.
Securities valuation
All investments are valued each business day as of the close of regular trading on the New York Stock Exchange (generally 4 p.m. Eastern Time), although the Fund may deviate from this calculation time under unusual or unexpected circumstances.
Investments in the affiliated Master Portfolio are valued daily based on the Fund’s proportionate share of the affiliated Master Portfolio’s net assets, which are also valued daily. Securities held in the affiliated Master Portfolio are valued as discussed in the Notes to Financial Statements of the affiliated Master Portfolio, which are included elsewhere in this report.
Investments which are not valued using the method discussed above are valued at their fair value, as determined in good faith by the Board of Trustees. The Board of Trustees has established a Valuation Committee comprised of the Trustees and has delegated to it the authority to take any actions regarding the valuation of portfolio securities that the Valuation Committee deems necessary or appropriate, including determining the fair value of portfolio securities, unless the determination has been delegated to the Allspring Global Investments Pricing Committee at Allspring Funds Management, LLC ("Allspring Funds Management"). The Board of Trustees retains the authority to make or ratify any valuation decisions or approve any changes to
18 | Allspring C&B Large Cap Value Fund
Notes to financial statements (unaudited)
the Valuation Procedures as it deems appropriate. On a quarterly basis, the Board of Trustees receives reports on any valuation actions taken by the Valuation Committee or the Allspring Global Investments Pricing Committee which may include items for ratification.
Investment transactions, income and expenses
Investments in the affiliated Master Portfolio are recorded on a trade date basis. The Fund records daily its proportionate share of the affiliated Master Portfolio’s income, expenses and realized and unrealized gains or losses. The Fund also accrues its own expenses.
Distributions to shareholders
Distributions to shareholders from net investment income and any net realized gains are recorded on the ex-dividend date and paid at least annually. Such distributions are determined in accordance with income tax regulations and may differ from U.S. generally accepted accounting principles. Dividend sources are estimated at the time of declaration. The tax character of distributions is determined as of the Fund's fiscal year end. Therefore, a portion of the Fund's distributions made prior to the Fund’s fiscal year end may be categorized as a tax return of capital at year end.
Federal and other taxes
The Fund intends to continue to qualify as a regulated investment company by distributing substantially all of its investment company taxable income and any net realized capital gains (after reduction for capital loss carryforwards) sufficient to relieve it from all, or substantially all, federal income taxes. Accordingly, no provision for federal income taxes was required.
The Fund’s income and federal excise tax returns and all financial records supporting those returns for the prior three fiscal years are subject to examination by the federal and Delaware revenue authorities. Management has analyzed the Fund's tax positions taken on federal, state, and foreign tax returns for all open tax years and does not believe that there are any uncertain tax positions that require recognition of a tax liability.
As of November 30, 2021, the aggregate cost of all investments for federal income tax purposes was $214,394,523 and the unrealized gains (losses) consisted of:
| Gross unrealized gains | $74,865,473 |
| Gross unrealized losses | 0 |
| Net unrealized gains | $74,865,473 |
Class allocations
The separate classes of shares offered by the Fund differ principally in applicable sales charges, distribution, shareholder servicing, and administration fees. Class specific expenses are charged directly to that share class. Investment income, common fund-level expenses, and realized and unrealized gains (losses) on investments are allocated daily to each class of shares based on the relative proportion of net assets of each class.
3. FAIR VALUATION MEASUREMENTS
At November 30, 2021, the Fund’s investment in the affiliated Master Portfolio was measured at fair value using the net asset value per share (or its equivalent) as a practical expedient. The investment objective and fair value of the affiliated Master Portfolio is as follows:
| Affiliated Master Portfolio | Investment objective | Fair value of affiliated
Master Portfolio |
| Allspring C&B Large Cap Value Portfolio | Seeks maximum long-term total return (current income and capital appreciation), consistent with minimizing risk to principal | $289,259,996 |
The affiliated Master Portfolio does not have a redemption period notice, can be redeemed daily and does not have any unfunded commitments.
Allspring C&B Large Cap Value Fund | 19
Notes to financial statements (unaudited)
4. TRANSACTIONS WITH AFFILIATES
Management fee
Allspring Funds Management, a wholly owned subsidiary of Allspring Global Investments Holdings, LLC, a holding company indirectly owned by certain private funds of GTCR LLC and Reverence Capital Partners, L.P., is the manager of the Fund and provides advisory and fund-level administrative services under an investment management agreement. Under the investment management agreement, Allspring Funds Management is responsible for, among other services, implementing the investment objectives and strategies of the Fund and providing fund-level administrative services in connection with the Fund’s operations. As long as the Fund continues to invest substantially all of its assets in a single affiliated Master Portfolio, the Fund pays Allspring Funds Management an investment management fee only for fund-level administrative services at the following annual rate based on the Fund’s average daily net assets:
| Average daily net assets | Management fee |
| First $5 billion | 0.050% |
| Next $5 billion | 0.040 |
| Over $10 billion | 0.030 |
For the six months ended November 30, 2021, the management fee was equivalent to an annual rate of 0.05% of the Fund’s average daily net assets.
Allspring Funds Management also serves as the adviser to the affiliated Master Portfolio and is entitled to receive a fee from the affiliated Master Portfolio for those services.
Administration fees
Under a class-level administration agreement, Allspring Funds Management provides class-level administrative services to the Fund, which includes paying fees and expenses for services provided by the transfer agent, sub-transfer agents, omnibus account servicers and record-keepers. As compensation for its services under the class-level administration agreement, Allspring Funds Management receives an annual fee which is calculated based on the average daily net assets of each class as follows:
| | Class-level
administration fee |
| Class A | 0.21% |
| Class C | 0.21 |
| Class R6 | 0.03 |
| Administrator Class | 0.13 |
| Institutional Class | 0.13 |
Waivers and/or expense reimbursements
Allspring Funds Management has contractually committed to waive and/or reimburse management and administration fees to the extent necessary to maintain certain net operating expense ratios for the Fund. When each class of the Fund has exceeded its expense cap, Allspring Funds Management will waive fees and/or reimburse expenses from fund-level expenses on a proportionate basis and then from class specific expenses. When only certain classes exceed their expense caps, waivers and/or reimbursements are applied against class specific expenses before fund-level expenses. Net expenses from the affiliated Master Portfolio are included in the expense caps. Allspring Funds Management has contractually committed through September 30, 2022 to waive fees and/or reimburse expenses to the extent necessary to cap expenses. Prior to or after the commitment expiration date, the caps may be increased or the commitment to maintain the caps may be terminated only with the approval of the Board of Trustees. The contractual expense caps are as follows:
20 | Allspring C&B Large Cap Value Fund
Notes to financial statements (unaudited)
| | Expense ratio caps |
| Class A | 1.08% |
| Class C | 1.83 |
| Class R6 | 0.65 |
| Administrator Class | 1.00 |
| Institutional Class | 0.75 |
Distribution fee
The Trust has adopted a distribution plan for Class C shares of the Fund pursuant to Rule 12b-1 under the 1940 Act. A distribution fee is charged to Class C shares and paid to Allspring Funds Distributor, LLC ("Allspring Funds Distributor"), an affiliate of Allspring Funds Management, the principal underwriter, at an annual rate of 0.75% of the average daily net assets of Class C shares.
In addition, Allspring Funds Distributor is entitled to receive the front-end sales charge from the purchase of Class A shares and a contingent deferred sales charge on the redemption of certain Class A shares. Allspring Funds Distributor is also entitled to receive the contingent deferred sales charges from redemptions of Class C shares. Allspring Funds Distributor received $1,849 in contingent deferred sales charges from Class A shares for the six months ended November 30, 2021. No front-end sales charges were incurred by Class A shares and no contingent deferred sales charges were incurred by Class C shares for the six months ended November 30, 2021.
Shareholder servicing fees
The Trust has entered into contracts with one or more shareholder servicing agents, whereby Class A, Class C, and Administrator Class of the Fund are charged a fee at an annual rate of 0.25% of the average daily net assets of each respective class. A portion of these total shareholder servicing fees were paid to affiliates, and to certain entities that were affiliates of the Fund until November 1, 2021.
5. INVESTMENT PORTFOLIO TRANSACTIONS
The Fund seeks to achieve its investment objective by investing substantially all of its assets in the affiliated Master Portfolio. Purchases and sales have been calculated by multiplying the Fund's ownership percentage of the affiliated Master Portfolio by the affiliated Master Portfolio's purchases and sales. Purchases and sales of investments, excluding U.S. government obligations (if any) and short-term securities, for the six months ended November 30, 2021 were $45,263,645 and $52,850,445, respectively.
6. BANK BORROWINGS
The Trust (excluding the money market funds), Allspring Master Trust and Allspring Variable Trust are parties to a $350,000,000 revolving credit agreement whereby the Fund is permitted to use bank borrowings for temporary or emergency purposes, such as to fund shareholder redemption requests. Interest under the credit agreement is charged to the Fund based on a borrowing rate equal to the higher of the Federal Funds rate in effect on that day plus 1.25% or the overnight bank funding rate in effect on that day plus 1.25%. In addition, an annual commitment fee equal to 0.25% of the unused balance is allocated to each participating fund.
For the six months ended November 30, 2021, there were no borrowings by the Fund under the agreement.
7. CONCENTRATION RISKS
Concentration risks result from exposure to a limited number of sectors. Through its investment in the affiliated Master Portfolio which may invest a substantial portion of its assets in any sector, the Fund may in turn be more affected by changes in that sector than a fund whose investments are not heavily weighted in any sector. As of the end of the period, the affiliated Master Portfolio concentrated its portfolio in investments related to the financials sector.
8. INDEMNIFICATION
Under the Fund's organizational documents, the officers and Trustees have been granted certain indemnification rights against certain liabilities that may arise out of performance of their duties to the Fund. The Fund has entered into a separate agreement with each Trustee that converts indemnification rights currently existing under the Fund’s organizational documents into contractual rights that cannot be changed in the future without the consent of the Trustee. Additionally, in the
Allspring C&B Large Cap Value Fund | 21
Notes to financial statements (unaudited)
normal course of business, the Fund may enter into contracts with service providers that contain a variety of indemnification clauses. The Fund’s maximum exposure under these arrangements is dependent on future claims that may be made against the Fund and, therefore, cannot be estimated.
9. CORONAVIRUS (COVID-19) PANDEMIC
On March 11, 2020, the World Health Organization announced that it had made the assessment that coronavirus disease 2019 (“COVID-19”) is a pandemic. The impacts of COVID-19 are affecting the entire global economy, individual companies and investment products, the funds, and the market in general. There is significant uncertainty around the extent and duration of business disruptions related to COVID-19 and the impacts may last for an extended period of time. COVID-19 has led to significant uncertainty and volatility in the financial markets.
22 | Allspring C&B Large Cap Value Fund
Portfolio of investments—November 30, 2021 (unaudited)
| | | | | Shares | Value |
| Common stocks: 99.37% | | | | | |
| Communication services: 6.59% | | | | | |
| Diversified telecommunication services: 2.39% | | | | | |
| Verizon Communications Incorporated | | | | 173,100 | $ 8,701,737 |
| Entertainment: 2.22% | | | | | |
| Activision Blizzard Incorporated | | | | 138,100 | 8,092,660 |
| Media: 1.98% | | | | | |
| Omnicom Group Incorporated | | | | 106,800 | 7,188,708 |
| Consumer discretionary: 6.15% | | | | | |
| Household durables: 1.81% | | | | | |
| Whirlpool Corporation | | | | 30,300 | 6,597,522 |
| Textiles, apparel & luxury goods: 4.34% | | | | | |
| Gildan Activewear Incorporated | | | | 229,800 | 9,320,688 |
| HanesBrands Incorporated | | | | 401,400 | 6,482,610 |
| | | | | | 15,803,298 |
| Consumer staples: 6.98% | | | | | |
| Food products: 3.10% | | | | | |
| General Mills Incorporated | | | | 121,900 | 7,529,763 |
| Ingredion Incorporated | | | | 40,260 | 3,749,414 |
| | | | | | 11,279,177 |
| Personal products: 2.04% | | | | | |
| Unilever plc ADR | | | | 145,900 | 7,419,015 |
| Tobacco: 1.84% | | | | | |
| Philip Morris International Incorporated | | | | 78,200 | 6,720,508 |
| Energy: 2.83% | | | | | |
| Energy equipment & services: 0.95% | | | | | |
| Schlumberger Limited | | | | 120,700 | 3,461,676 |
| Oil, gas & consumable fuels: 1.88% | | | | | |
| The Williams Companies Incorporated | | | | 255,900 | 6,855,561 |
| Financials: 33.50% | | | | | |
| Banks: 5.83% | | | | | |
| JPMorgan Chase & Company | | | | 40,800 | 6,480,264 |
| PNC Financial Services Group Incorporated | | | | 25,400 | 5,003,800 |
| US Bancorp | | | | 175,900 | 9,734,306 |
| | | | | | 21,218,370 |
| Capital markets: 10.33% | | | | | |
| Brookfield Asset Management Incorporated Class A | | | | 180,900 | 10,161,153 |
| London Stock Exchange Group plc ADR | | | | 399,300 | 8,724,705 |
| State Street Corporation | | | | 113,420 | 10,090,977 |
| The Charles Schwab Corporation | | | | 111,500 | 8,628,985 |
| | | | | | 37,605,820 |
The accompanying notes are an integral part of these financial statements.
Allspring C&B Large Cap Value Portfolio | 23
Portfolio of investments—November 30, 2021 (unaudited)
| | | | | Shares | Value |
| Diversified financial services: 2.43% | | | | | |
| Berkshire Hathaway Incorporated Class B † | | | | 32,050 | $ 8,867,915 |
| Insurance: 14.91% | | | | | |
| Alleghany Corporation † | | | | 10,800 | 6,986,304 |
| Arch Capital Group Limited † | | | | 292,600 | 11,815,188 |
| Chubb Limited | | | | 40,650 | 7,295,456 |
| Fidelity National Financial Incorporated | | | | 218,400 | 10,681,944 |
| Globe Life Incorporated | | | | 61,700 | 5,339,518 |
| Progressive Corporation | | | | 79,597 | 7,397,745 |
| The Allstate Corporation | | | | 44,000 | 4,783,680 |
| | | | | | 54,299,835 |
| Health care: 14.26% | | | | | |
| Health care equipment & supplies: 6.63% | | | | | |
| Becton Dickinson & Company | | | | 38,240 | 9,068,234 |
| Dentsply Sirona Incorporated | | | | 156,670 | 7,636,096 |
| Medtronic plc | | | | 69,600 | 7,426,320 |
| | | | | | 24,130,650 |
| Health care providers & services: 4.95% | | | | | |
| HCA Healthcare Incorporated | | | | 30,050 | 6,778,980 |
| Laboratory Corporation of America Holdings † | | | | 13,850 | 3,951,821 |
| UnitedHealth Group Incorporated | | | | 16,420 | 7,294,092 |
| | | | | | 18,024,893 |
| Pharmaceuticals: 2.68% | | | | | |
| Johnson & Johnson | | | | 62,650 | 9,769,015 |
| Industrials: 18.63% | | | | | |
| Air freight & logistics: 1.41% | | | | | |
| United Parcel Service Incorporated Class B | | | | 25,800 | 5,117,946 |
| Commercial services & supplies: 2.29% | | | | | |
| IAA Incorporated † | | | | 172,940 | 8,353,002 |
| Electrical equipment: 1.46% | | | | | |
| AMETEK Incorporated | | | | 39,000 | 5,323,500 |
| Industrial conglomerates: 1.04% | | | | | |
| 3M Company | | | | 22,150 | 3,766,386 |
| Machinery: 6.39% | | | | | |
| Colfax Corporation † | | | | 156,580 | 7,271,575 |
| PACCAR Incorporated | | | | 62,900 | 5,247,118 |
| Stanley Black & Decker Incorporated | | | | 37,310 | 6,520,296 |
| Woodward Incorporated | | | | 40,050 | 4,237,290 |
| | | | | | 23,276,279 |
| Professional services: 2.87% | | | | | |
| Leidos Holdings Incorporated | | | | 118,970 | 10,458,653 |
| Trading companies & distributors: 3.17% | | | | | |
| AerCap Holdings NV † | | | | 205,800 | 11,533,032 |
The accompanying notes are an integral part of these financial statements.
24 | Allspring C&B Large Cap Value Portfolio
Portfolio of investments—November 30, 2021 (unaudited)
| | | | | Shares | Value |
| Information technology: 7.09% | | | | | |
| Electronic equipment, instruments & components: 5.57% | | | | | |
| Arrow Electronics Incorporated † | | | | 115,070 | $ 13,998,262 |
| TE Connectivity Limited | | | | 40,760 | 6,274,187 |
| | | | | | 20,272,449 |
| IT services: 1.52% | | | | | |
| Amdocs Limited | | | | 79,600 | 5,557,672 |
| Materials: 1.10% | | | | | |
| Metals & mining: 1.10% | | | | | |
| Reliance Steel & Aluminum Company | | | | 26,990 | 4,011,524 |
| Utilities: 2.24% | | | | | |
| Gas utilities: 2.24% | | | | | |
| Atmos Energy Corporation | | | | 90,360 | 8,161,315 |
| Total Common stocks (Cost $257,852,773) | | | | | 361,868,118 |
| | | Yield | | | |
| Short-term investments: 0.81% | | | | | |
| Investment companies: 0.81% | | | | | |
| Allspring Government Money Market Fund Select Class ♠∞ | | 0.03% | | 2,942,989 | 2,942,989 |
| Total Short-term investments (Cost $2,942,989) | | | | | 2,942,989 |
| Total investments in securities (Cost $260,795,762) | 100.18% | | | | 364,811,107 |
| Other assets and liabilities, net | (0.18) | | | | (645,696) |
| Total net assets | 100.00% | | | | $364,165,411 |
| † | Non-income-earning security |
| ♠ | The issuer of the security is an affiliated person of the Portfolio as defined in the Investment Company Act of 1940. |
| ∞ | The rate represents the 7-day annualized yield at period end. |
| Abbreviations: |
| ADR | American depositary receipt |
The accompanying notes are an integral part of these financial statements.
Allspring C&B Large Cap Value Portfolio | 25
Portfolio of investments—November 30, 2021 (unaudited)
Investments in affiliates
An affiliated investment is an investment in which the Portfolio owns at least 5% of the outstanding voting shares of the issuer or as a result of other relationships, such as the Portfolio and the issuer having the same adviser or investment manager. Transactions with issuers that were either affiliates of the Portfolio at the beginning of the period or the end of the period were as follows:
| | Value,
beginning of
period | Purchases | Sales
proceeds | Net
realized
gains
(losses) | | Net
change in
unrealized
gains
(losses) | | Value,
end of
period | Shares,
end
of period | Income
from
affiliated
securities |
| Short-term investments | | | | | | | | | |
| Allspring Government Money Market Fund Select Class | $20,061,602 | $39,632,766 | $(56,751,379) | $0 | | $0 | | $ 2,942,989 | 2,942,989 | $ 1,225 |
| Securities Lending Cash Investments LLC | 0 | 38,169,930 | (38,169,930) | 0 | | 0 | | 0 | 0 | 182 # |
| | | | | $0 | | $0 | | $2,942,989 | | $1,407 |
| # | Amount shown represents income before fees and rebates. |
The accompanying notes are an integral part of these financial statements.
26 | Allspring C&B Large Cap Value Portfolio
Statement of assets and liabilities—November 30, 2021 (unaudited)
| | |
| Assets | |
Investments in unaffiliated securities, at value (cost $257,852,773)
| $ 361,868,118 |
Investments in affiliated securities, at value (cost $2,942,989)
| 2,942,989 |
Receivable for dividends
| 481,735 |
Receivable for securities lending income, net
| 1,432 |
Prepaid expenses and other assets
| 21,934 |
Total assets
| 365,316,208 |
| Liabilities | |
Payable for investments purchased
| 959,827 |
Advisory fee payable
| 190,970 |
Total liabilities
| 1,150,797 |
Total net assets
| $364,165,411 |
The accompanying notes are an integral part of these financial statements.
Allspring C&B Large Cap Value Portfolio | 27
Statement of operations—six months ended November 30, 2021 (unaudited)
| | |
| Investment income | |
Dividends (net of foreign withholdings taxes of $63,238)
| $ 3,166,864 |
Income from affiliated securities
| 7,120 |
Total investment income
| 3,173,984 |
| Expenses | |
Advisory fee
| 1,269,928 |
Custody and accounting fees
| 10,025 |
Professional fees
| 26,762 |
Interest holder report expenses
| 9,318 |
Trustees’ fees and expenses
| 10,582 |
Other fees and expenses
| 12,896 |
Total expenses
| 1,339,511 |
Less: Fee waivers and/or expense reimbursements
| (89,120) |
Net expenses
| 1,250,391 |
Net investment income
| 1,923,593 |
| Realized and unrealized gains (losses) on investments | |
Net realized gains on investments
| 25,173,657 |
Net change in unrealized gains (losses) on investments
| (44,977,471) |
Net realized and unrealized gains (losses) on investments
| (19,803,814) |
Net decrease in net assets resulting from operations
| $(17,880,221) |
The accompanying notes are an integral part of these financial statements.
28 | Allspring C&B Large Cap Value Portfolio
Statement of changes in net assets
| | | |
| | Six months ended
November 30, 2021
(unaudited) | Year ended
May 31, 2021 |
| Operations | | |
Net investment income
| $ 1,923,593 | $ 3,900,892 |
Net realized gains on investments
| 25,173,657 | 33,139,971 |
Net change in unrealized gains (losses) on investments
| (44,977,471) | 117,846,464 |
Net increase (decrease) in net assets resulting from operations
| (17,880,221) | 154,887,327 |
| Capital transactions | | |
| Transactions in investors’ beneficial interests | | |
Contributions
| 9,133,030 | 49,283,346 |
Withdrawals
| (38,486,268) | (79,684,157) |
Net decrease in net assets resulting from capital transactions
| (29,353,238) | (30,400,811) |
Total increase (decrease) in net assets
| (47,233,459) | 124,486,516 |
| Net assets | | |
Beginning of period
| 411,398,870 | 286,912,354 |
End of period
| $364,165,411 | $411,398,870 |
The accompanying notes are an integral part of these financial statements.
Allspring C&B Large Cap Value Portfolio | 29
| | | Year ended May 31 |
| | Six months ended
November 30, 2021
(unaudited) | 2021 | 2020 | 2019 | 2018 | 2017 |
Total return1
| (4.56)% | 57.96% | (3.40)% | 1.80% | 6.65% | 19.17% |
| Ratios to average net assets (annualized) | | | | | | |
Gross expenses
| 0.69% | 0.68% | 0.68% | 0.67% | 0.67% | 0.68% |
Net expenses2
| 0.64% | 0.64% | 0.64% | 0.65% | 0.66% | 0.68% |
Net investment income
| 0.98% | 1.16% | 1.36% | 1.27% | 1.02% | 1.09% |
| Supplemental data | | | | | | |
Portfolio turnover rate
| 15% | 38% | 33% | 47% | 42% | 89% |
| 1 | Returns for periods of less than one year are not annualized. |
| 2 | Net expense ratios reflect voluntary waivers. |
The accompanying notes are an integral part of these financial statements.
30 | Allspring C&B Large Cap Value Portfolio
Notes to financial statements (unaudited)
1. ORGANIZATION
Allspring Master Trust (the "Trust"), a Delaware statutory trust organized on March 10, 1999, is an open-end management investment company registered under the Investment Company Act of 1940, as amended (the "1940 Act"). As an investment company, the Trust follows the accounting and reporting guidance in Financial Accounting Standards Board ("FASB") Accounting Standards Codification Topic 946, Financial Services – Investment Companies. These financial statements report on the Allspring C&B Large Cap Value Portfolio (the "Portfolio") which is a diversified series of the Trust.
Interests in the Portfolio are available solely through private placement transactions that do not involve any "public offering" within the meaning of Section 4(a)(2) of the Securities Act of 1933.
On February 23, 2021, Wells Fargo & Company entered into a definitive agreement to sell Wells Fargo Asset Management ("WFAM") to GTCR LLC and Reverence Capital Partners, L.P. WFAM was the trade name used by the asset management businesses of Wells Fargo & Company and included Wells Fargo Funds Management, LLC, Wells Capital Management, LLC, Wells Fargo Asset Management (International) Limited and Wells Fargo Funds Distributor, LLC. Effective on November 1, 2021, the sale transaction of WFAM by Wells Fargo & Company to GTCR LLC and Reverence Capital Partners, L.P. was closed. In connection with the closing of the transaction, WFAM became known as Allspring Global Investments (“Allspring”) and various entities that provide services to the Portfolio changed their names to "Allspring", including Allspring Funds Management, LLC (formerly Wells Fargo Funds Management, LLC), the adviser to the Portfolio, Allspring Global Investments, Inc. (formerly Wells Capital Management, LLC) and Allspring Global Investments (UK) Limited (formerly Wells Fargo Asset Management (International) Limited), both registered investment advisers providing subadvisory services to certain funds, and Allspring Funds Distributor, LLC (formerly Wells Fargo Funds Distributor, LLC).
Consummation of the transaction resulted in the automatic termination of the Portfolio’s advisory agreement and subadvisory agreement. The Portfolio’s Board of Trustees approved a new advisory agreement and subadvisory agreement which were approved by the Portfolio's interest holders on August 16, 2021. The new agreements became effective on November 1, 2021.
Effective December 6, 2021, "Wells Fargo" was removed from the Portfolio's name and replaced it with "Allspring".
2. SIGNIFICANT ACCOUNTING POLICIES
The following significant accounting policies, which are consistently followed in the preparation of the financial statements of the Portfolio, are in conformity with U.S. generally accepted accounting principles which require management to make estimates and assumptions that affect the reported amounts of assets and liabilities, disclosure of contingent assets and liabilities at the date of the financial statements, and the reported amounts of income and expenses during the reporting period. Actual results could differ from those estimates.
Securities valuation
All investments are valued each business day as of the close of regular trading on the New York Stock Exchange (generally 4 p.m. Eastern Time), although the Portfolio may deviate from this calculation time under unusual or unexpected circumstances.
Equity securities that are listed on a foreign or domestic exchange or market are valued at the official closing price or, if none, the last sales price. If no sale occurs on the principal exchange or market that day, a fair value price will be determined in accordance with the Portfolio’s Valuation Procedures.
Investments in registered open-end investment companies are valued at net asset value. Interests in non-registered investment companies that are redeemable at net asset value are fair valued normally at net asset value.
Investments which are not valued using any of the methods discussed above are valued at their fair value, as determined in good faith by the Board of Trustees. The Board of Trustees has established a Valuation Committee comprised of the Trustees and has delegated to it the authority to take any actions regarding the valuation of portfolio securities that the Valuation Committee deems necessary or appropriate, including determining the fair value of portfolio securities, unless the determination has been delegated to the Allspring Global Investments Pricing Committee at Allspring Funds Management, LLC ("Allspring Funds Management"). The Board of Trustees retains the authority to make or ratify any valuation decisions or approve any changes to the Valuation Procedures as it deems appropriate. On a quarterly basis, the Board of Trustees receives reports on any valuation actions taken by the Valuation Committee or the Allspring Global Investments Pricing Committee which may include items for ratification.
Securities lending
The Portfolio may lend its securities from time to time in order to earn additional income in the form of fees or interest on securities received as collateral or the investment of any cash received as collateral. When securities are on loan, the Portfolio
Allspring C&B Large Cap Value Portfolio | 31
Notes to financial statements (unaudited)
receives interest or dividends on those securities. Cash collateral received in connection with its securities lending transactions is invested in Securities Lending Cash Investments, LLC (the "Securities Lending Fund"), an affiliated non-registered investment company. Investments in Securities Lending Fund are valued at the evaluated bid price provided by an independent pricing service. Income earned from investment in the Securities Lending Fund (net of fees and rebates), if any, is included in income from affiliated securities on the Statement of Operations.
In a securities lending transaction, the net asset value of the Portfolio is affected by an increase or decrease in the value of the securities loaned and by an increase or decrease in the value of the instrument in which collateral is invested. The amount of securities lending activity undertaken by the Portfolio fluctuates from time to time. The Portfolio has the right under the lending agreement to recover the securities from the borrower on demand. In the event of default or bankruptcy by the borrower, the Portfolio may be prevented from recovering the loaned securities or gaining access to the collateral or may experience delays or costs in doing so. In such an event, the terms of the agreement allow the unaffiliated securities lending agent to use the collateral to purchase replacement securities on behalf of the Portfolio or pay the Portfolio the market value of the loaned securities. The Portfolio bears the risk of loss with respect to depreciation of its investment of the cash collateral.
Security transactions and income recognition
Securities transactions are recorded on a trade date basis. Realized gains or losses are recorded on the basis of identified cost.
Dividend income is recognized on the ex-dividend date. Dividend income is recorded net of foreign taxes withheld where recovery of such taxes is not assured.
Federal and other taxes
The Portfolio is not required to pay federal income taxes on its net investment income and net capital gains as it is treated as a partnership for federal income tax purposes. All income, gains and losses of the Portfolio are deemed to have been “passed through” to the interest holders in proportion to their holdings of the Portfolio regardless of whether income and gains have been distributed by the Portfolio.
The Portfolio’s income tax returns and all financial records supporting those returns for the prior three fiscal years are subject to examination by the federal revenue authority. Management has analyzed the Portfolio’s tax positions taken on federal, state, and foreign tax returns for all open tax years and does not believe that there are any uncertain tax positions that require recognition of a tax liability.
As of November 30, 2021, the aggregate cost of all investments for federal income tax purposes was $260,795,762 and the unrealized gains (losses) consisted of:
| Gross unrealized gains | $112,216,210 |
| Gross unrealized losses | (8,200,865) |
| Net unrealized gains | $104,015,345 |
3. FAIR VALUATION MEASUREMENTS
Fair value measurements of investments are determined within a framework that has established a fair value hierarchy based upon the various data inputs utilized in determining the value of the Portfolio’s investments. The three-level hierarchy gives the highest priority to unadjusted quoted prices in active markets for identical assets or liabilities (Level 1) and the lowest priority to unobservable inputs (Level 3). The Portfolio’s investments are classified within the fair value hierarchy based on the lowest level of input that is significant to the fair value measurement. The inputs are summarized into three broad levels as follows:
| ■ | Level 1 – quoted prices in active markets for identical securities |
| ■ | Level 2 – other significant observable inputs (including quoted prices for similar securities, interest rates, prepayment speeds, credit risk, etc.) |
| ■ | Level 3 – significant unobservable inputs (including the Portfolio’s own assumptions in determining the fair value of investments) |
The inputs or methodologies used for valuing investments in securities are not necessarily an indication of the risk associated with investing in those securities.
32 | Allspring C&B Large Cap Value Portfolio
Notes to financial statements (unaudited)
The following is a summary of the inputs used in valuing the Portfolio’s assets and liabilities as of November 30, 2021:
| | Quoted prices
(Level 1) | Other significant
observable inputs
(Level 2) | Significant
unobservable inputs
(Level 3) | Total |
| Assets | | | | |
| Investments in: | | | | |
| Common stocks | | | | |
| Communication services | $ 23,983,105 | $0 | $0 | $ 23,983,105 |
| Consumer discretionary | 22,400,820 | 0 | 0 | 22,400,820 |
| Consumer staples | 25,418,700 | 0 | 0 | 25,418,700 |
| Energy | 10,317,237 | 0 | 0 | 10,317,237 |
| Financials | 121,991,940 | 0 | 0 | 121,991,940 |
| Health care | 51,924,558 | 0 | 0 | 51,924,558 |
| Industrials | 67,828,798 | 0 | 0 | 67,828,798 |
| Information technology | 25,830,121 | 0 | 0 | 25,830,121 |
| Materials | 4,011,524 | 0 | 0 | 4,011,524 |
| Utilities | 8,161,315 | 0 | 0 | 8,161,315 |
| Short-term investments | | | | |
| Investment companies | 2,942,989 | 0 | 0 | 2,942,989 |
| Total assets | $364,811,107 | $0 | $0 | $364,811,107 |
Additional sector, industry or geographic detail, if any, is included in the Portfolio of Investments.
For the six months ended November 30, 2021, the Portfolio did not have any transfers into/out of Level 3.
4. TRANSACTIONS WITH AFFILIATES AND OTHER EXPENSES
Advisory fee
The Trust has entered into an advisory contract with Allspring Funds Management, a wholly owned subsidiary of Allspring Global Investments Holdings, LLC, a holding company indirectly owned by certain private funds of GTCR LLC and Reverence Capital Partners, L.P. The adviser is responsible for implementing investment policies and guidelines and for supervising the subadviser, who is responsible for day-to-day portfolio management of the Portfolio. Pursuant to the contract, Allspring Funds Management is entitled to receive an advisory fee at the following annual rate based on the Portfolio’s average daily net assets:
| Average daily net assets | Advisory fee |
| First $500 million | 0.650% |
| Next $500 million | 0.625 |
| Next $1 billion | 0.600 |
| Next $2 billion | 0.575 |
| Next $4 billion | 0.550 |
| Next $4 billion | 0.525 |
| Next $4 billion | 0.500 |
| Over $16 billion | 0.475 |
For the six months ended November 30, 2021, the advisory fee was equivalent to an annual rate of 0.65% of the Portfolio's average daily net assets.
Allspring Funds Management has retained the services of a subadviser to provide daily portfolio management to the Portfolio. The fee for subadvisory services is borne by Allspring Funds Management. Cooke & Bieler, L.P., which is not an affiliate of Allspring Funds Management, is the subadviser to the Portfolio and is entitled to receive a fee from Allspring Funds Management at an annual rate starting at 0.38% and declining to 0.30% as the average daily net assets of the Portfolio increase.
Allspring C&B Large Cap Value Portfolio | 33
Notes to financial statements (unaudited)
Allspring Funds Management has voluntarily waived and/or reimbursed advisory fees to reduce the net operating expense ratio of the Portfolio. These voluntary waivers may be discontinued at any time.
Interfund transactions
The Portfolio may purchase or sell portfolio investment securities to certain affiliates pursuant to Rule 17a-7 under the 1940 Act and under procedures adopted by the Board of Trustees. The procedures have been designed to ensure that these interfund transactions, which do not incur broker commissions, are effected at current market prices.
5. INVESTMENT PORTFOLIO TRANSACTIONS
Purchases and sales of investments, excluding U.S. government obligations (if any) and short-term securities, for the six months ended November 30, 2021 were $56,984,907 and $66,536,349, respectively.
6. SECURITIES LENDING TRANSACTIONS
The Portfolio lends its securities through an unaffiliated securities lending agent and receives collateral in the form of cash or securities with a value at least equal to the value of the securities on loan. The value of the loaned securities is determined at the close of each business day and any increases or decreases in the required collateral are exchanged between the Portfolio and the counterparty on the next business day. Cash collateral received is invested in the Securities Lending Fund which seeks to provide a positive return compared to the daily Federal Funds Open Rate by investing in high-quality, U.S. dollar-denominated short-term money market instruments and is exempt from registration under Section 3(c)(7) of the 1940 Act. Securities Lending Fund is managed by Allspring Funds Management and is subadvised by Allspring Global Investments, LLC ("Allspring Investments"), an affiliate of Allspring Funds Management and a wholly owned subsidiary of Allspring Global Investments Holdings, LLC. Allspring Funds Management receives an advisory fee starting at 0.05% and declining to 0.01% as the average daily net assets of the Securities Lending Fund increase. All of the fees received by Allspring Funds Management are paid to Allspring Investments for its services as subadviser.
In the event of counterparty default or the failure of a borrower to return a loaned security, the Portfolio has the right to use the collateral to offset any losses incurred. As of November 30, 2021, the Portfolio did not have any securities on loan.
7. BANK BORROWINGS
The Trust, along with Allspring Variable Trust and Allspring Funds Trust (excluding the money market funds), are parties to a $350,000,000 revolving credit agreement whereby the Portfolio is permitted to use bank borrowings for temporary or emergency purposes, such as to fund interest holders withdrawal requests. Interest under the credit agreement is charged to the Portfolio based on a borrowing rate equal to the higher of the Federal Funds rate in effect on that day plus 1.25% or the overnight bank funding rate in effect on that day plus 1.25%. In addition, an annual commitment fee equal to 0.25% of the unused balance is allocated to each participating fund.
For the six months ended November 30, 2021, there were no borrowings by the Portfolio under the agreement.
8. CONCENTRATION RISKS
As of the end of the period, the Portfolio concentrated its portfolio of investments in the financials sector. A fund that invests a substantial portion of its assets in any sector may be more affected by changes in that sector than would be a fund whose investments are not heavily weighted in any sector.
9. INDEMNIFICATION
Under the Portfolio's organizational documents, the officers and Trustees have been granted certain indemnification rights against certain liabilities that may arise out of performance of their duties to the Portfolio. The Portfolio has entered into a separate agreement with each Trustee that converts indemnification rights currently existing under the Portfolio’s organizational documents into contractual rights that cannot be changed in the future without the consent of the Trustee. Additionally, in the normal course of business, the Portfolio may enter into contracts with service providers that contain a variety of indemnification clauses. The Portfolio’s maximum exposure under these arrangements is dependent on future claims that may be made against the Portfolio and, therefore, cannot be estimated.
10. CORONAVIRUS (COVID-19) PANDEMIC
On March 11, 2020, the World Health Organization announced that it had made the assessment that coronavirus disease 2019 (“COVID-19”) is a pandemic. The impacts of COVID-19 are affecting the entire global economy, individual companies and investment products, the funds, and the market in general. There is significant uncertainty around the extent and duration of
34 | Allspring C&B Large Cap Value Portfolio
Notes to financial statements (unaudited)
business disruptions related to COVID-19 and the impacts may last for an extended period of time. COVID-19 has led to significant uncertainty and volatility in the financial markets.
Allspring C&B Large Cap Value Portfolio | 35
Other information (unaudited)
PROXY VOTING INFORMATION
A description of the policies and procedures used to determine how to vote proxies relating to portfolio securities is available without charge, upon request, by calling 1-800-222-8222, visiting our website at allspringglobal.com, or visiting the SEC website at sec.gov. Information regarding how the proxies related to portfolio securities were voted during the most recent 12-month period ended June 30 is available on the website at allspringglobal.com or by visiting the SEC website at sec.gov.
SPECIAL MEETING OF SHAREHOLDERS
On August 16, 2021, a Special Meeting of Shareholders for Allspring C&B Large Cap Value Fund was held to consider the following proposals. The results of the proposals are indicated below.
Proposal 1 – To consider and approve a new investment management agreement with Wells Fargo Funds Management, LLC*.
| Shares voted “For” | | 9,404,683 |
| Shares voted “Against” | | 299,815 |
| Shares voted “Abstain” | | 310,847 |
Proposal 2 – To consider and approve a new advisory agreement with Wells Fargo Funds Management, LLC* for Allspring C&B Large Cap Value Portfolio in which the Fund invests substantially all of its assets.
| Shares voted “For” | | 9,396,637 |
| Shares voted “Against” | | 303,383 |
| Shares voted “Abstain” | | 315,325 |
Proposal 3 – To consider and approve a new subadvisory agreement with Wells Capital Management, LLC** for Allspring C&B Large Cap Value Portfolio.
| Shares voted “For” | | 9,468,456 |
| Shares voted “Against” | | 189,464 |
| Shares voted “Abstain” | | 357,425 |
Proposal 4 – To approve the use of a "multi-manager" structure for Allspring C&B Large Cap Value Portfolio whereby Wells Fargo Funds Management, LLC* would be able, subject to Board approval, to select subadvisers and enter into or amend subadvisory agreements with them, without obtaining shareholder approval.
| Shares voted “For” | | 9,142,103 |
| Shares voted “Against” | | 587,255 |
| Shares voted “Abstain” | | 285,987 |
* Effective November 1, 2021, known as Allspring Funds Management, LLC.
** Effective November 1, 2021, known as Allspring Global Investments, LLC.
QUARTERLY PORTFOLIO HOLDINGS INFORMATION
The Fund and Portfolio file their complete schedule of portfolio holdings with the SEC for the first and third quarters of each fiscal year as an exhibit to their reports on Form N-PORT. Shareholders and Interest holders may view the filed Form N-PORT by visiting the SEC website at sec.gov.
36 | Allspring C&B Large Cap Value Fund
Other information (unaudited)
BOARD OF TRUSTEES AND OFFICERS
Each of the Trustees and Officers listed in the table below acts in identical capacities for each fund in the Allspring family of funds, which consists of 139 mutual funds comprising the Allspring Funds Trust, Allspring Variable Trust, Allspring Master Trust and four closed-end funds (collectively the “Fund Complex”). This table should be read in conjunction with the Prospectus and the Statement of Additional Information1. The mailing address of each Trustee and Officer is 525 Market Street, 12th Floor, San Francisco, CA 94105. Each Trustee and Officer serves an indefinite term, however, each Trustee serves such term until reaching the mandatory retirement age established by the Trustees.
Independent Trustees
Name and
year of birth | Position held and
length of service* | Principal occupations during past five years or longer | Current other
public company or
investment
company
directorships |
William R. Ebsworth
(Born 1957) | Trustee,
since 2015 | Retired. From 1984 to 2013, equities analyst, portfolio manager, research director and chief investment officer at Fidelity Management and Research Company in Boston, Tokyo, and Hong Kong, and retired in 2013 as Chief Investment Officer of Fidelity Strategic Advisers, Inc. where he led a team of investment professionals managing client assets. Prior thereto, Board member of Hong Kong Securities Clearing Co., Hong Kong Options Clearing Corp., the Thailand International Fund, Ltd., Fidelity Investments Life Insurance Company, and Empire Fidelity Investments Life Insurance Company. Audit Committee Chair and Investment Committee Chair of the Vincent Memorial Hospital Endowment (non-profit organization). Mr. Ebsworth is a CFA® charterholder. | N/A |
Jane A. Freeman
(Born 1953) | Trustee,
since 2015;
Chair Liaison,
since 2018 | Retired. From 2012 to 2014 and 1999 to 2008, Chief Financial Officer of Scientific Learning Corporation. From 2008 to 2012, Ms. Freeman provided consulting services related to strategic business projects. Prior to 1999, Portfolio Manager at Rockefeller & Co. and Scudder, Stevens & Clark. Board member of the Harding Loevner Funds from 1996 to 2014, serving as both Lead Independent Director and chair of the Audit Committee. Board member of the Russell Exchange Traded Funds Trust from 2011 to 2012 and the chair of the Audit Committee. Ms. Freeman is also an inactive Chartered Financial Analyst. | N/A |
Isaiah Harris, Jr.
(Born 1952) | Trustee,
since 2009; Audit
Committee
Chair,
since 2019 | Retired. Chairman of the Board of CIGNA Corporation from 2009 to 2021, and Director from 2005 to 2008. From 2003 to 2011, Director of Deluxe Corporation. Prior thereto, President and CEO of BellSouth Advertising and Publishing Corp. from 2005 to 2007, President and CEO of BellSouth Enterprises from 2004 to 2005 and President of BellSouth Consumer Services from 2000 to 2003. Emeritus member of the Iowa State University Foundation Board of Governors. Emeritus Member of the Advisory Board of Iowa State University School of Business. Advisory Board Member, Palm Harbor Academy (private school). Advisory Board Member, Fellowship of Christian Athletes. Mr. Harris is a certified public accountant (inactive status). | N/A |
Judith M. Johnson**
(Born 1949) | Trustee,
since 2008 | Retired. Prior thereto, Chief Executive Officer and Chief Investment Officer of Minneapolis Employees Retirement Fund from 1996 to 2008. Ms. Johnson is an attorney, certified public accountant and a certified managerial accountant. | N/A |
David F. Larcker
(Born 1950) | Trustee,
since 2009 | James Irvin Miller Professor of Accounting at the Graduate School of Business (Emeritus), Stanford University, Director of the Corporate Governance Research Initiative and Senior Faculty of The Rock Center for Corporate Governance since 2006. From 2005 to 2008, Professor of Accounting at the Graduate School of Business, Stanford University. Prior thereto, Ernst & Young Professor of Accounting at The Wharton School, University of Pennsylvania from 1985 to 2005. | N/A |
Allspring C&B Large Cap Value Fund | 37
Other information (unaudited)
Name and
year of birth | Position held and
length of service* | Principal occupations during past five years or longer | Current other
public company or
investment
company
directorships |
Olivia S. Mitchell
(Born 1953) | Trustee,
since 2006;
Nominating and
Governance
Committee Chair,
since 2018 | International Foundation of Employee Benefit Plans Professor since 1993, Wharton School of the University of Pennsylvania. Director of Wharton’s Pension Research Council and Boettner Center on Pensions & Retirement Research, and Research Associate at the National Bureau of Economic Research. Previously taught at Cornell University from 1978 to 1993. | N/A |
Timothy J. Penny
(Born 1951) | Trustee,
since 1996;
Chair,
since 2018 | President and Chief Executive Officer of Southern Minnesota Initiative Foundation, a non-profit organization, since 2007. Member of the Board of Trustees of NorthStar Education Finance, Inc., a non-profit organization, since 2007. | N/A |
James G. Polisson
(Born 1959) | Trustee,
since 2018 | Retired. Chief Marketing Officer, Source (ETF) UK Services, Ltd, from 2015 to 2017. From 2012 to 2015, Principal of The Polisson Group, LLC, a management consulting, corporate advisory and principal investing company. Chief Executive Officer and Managing Director at Russell Investments, Global Exchange Traded Funds from 2010 to 2012. Managing Director of Barclays Global Investors from 1998 to 2010 and Global Chief Marketing Officer for iShares and Barclays Global Investors from 2000 to 2010. Trustee of the San Francisco Mechanics’ Institute, a non-profit organization, from 2013 to 2015. Board member of the Russell Exchange Traded Fund Trust from 2011 to 2012. Director of Barclays Global Investors Holdings Deutschland GmbH from 2006 to 2009. Mr. Polisson is an attorney and has a retired status with the Massachusetts and District of Columbia Bar Associations. | N/A |
Pamela Wheelock
(Born 1959) | Trustee,
since January
2020; previously
Trustee from
January 2018 to
July 2019 | Board member of the Destination Medical Center Economic Development Agency, Rochester, Minnesota since 2019. Interim President of the McKnight Foundation from January to September 2020. McKnight Foundation Consultant, November 2020 to February 2021. Acting Commissioner, Minnesota Department of Human Services, July 2019 through September 2019. Consultant (part-time), Minnesota Department of Human Services, October 2019 through December 2019. Chief Operating Officer, Twin Cities Habitat for Humanity from 2017 to 2019. Vice President of University Services, University of Minnesota from 2012 to 2016. Prior thereto, on the Board of Directors, Governance Committee and Finance Committee for the Minnesota Philanthropy Partners (Saint Paul Foundation) from 2012 to 2018, Interim Chief Executive Officer of Blue Cross Blue Shield of Minnesota from 2011 to 2012, Chairman of the Board from 2009 to 2012 and Board Director from 2003 to 2015. Vice President, Leadership and Community Engagement, Bush Foundation, Saint Paul, Minnesota (a private foundation) from 2009 to 2011. Executive Vice President and Chief Financial Officer, Minnesota Sports and Entertainment from 2004 to 2009 and Senior Vice President from 2002 to 2004. Executive Vice President of the Minnesota Wild Foundation from 2004 to 2008. Commissioner of Finance, State of Minnesota, from 1999 to 2002. Currently Board Chair of the Minnesota Wild Foundation since 2010. | N/A |
* Length of service dates reflect the Trustee’s commencement of service with the Trust’s predecessor entities, where applicable.
** Ms. Johnson has resigned from the Board effective December 31, 2021.
38 | Allspring C&B Large Cap Value Fund
Other information (unaudited)
Officers2
Name and
year of birth | Position held and
length of service | Principal occupations during past five years or longer |
Andrew Owen
(Born 1960) | President,
since 2017 | President, Chief Executive Officer and Director of Allspring Funds Management, LLC since 2017 and co-president of Galliard Capital Management, LLC, an affiliate of Allspring Funds Management, LLC, since 2019. Prior thereto, Head of Affiliated Managers, Allspring Global Investments, from 2014 to 2019 and Executive Vice President responsible for marketing, investments and product development for Allspring Funds Management, LLC, from 2009 to 2014. In addition, Mr. Owen was an Executive Vice President of Wells Fargo & Company from 2014 to 2021. |
Jeremy DePalma
(Born 1974) | Treasurer,
since 2012
(for certain funds in
the Fund Complex);
since 2021 (for
the remaining funds in the
Fund Complex) | Senior Vice President of Allspring Funds Management, LLC since 2009. Senior Vice President of Evergreen Investment Management Company, LLC from 2008 to 2010 and head of the Fund Reporting and Control Team within Fund Administration. |
Kate McKinley
(Born 1977) | Chief Legal Officer,
since 2021 | Chief Legal Officer of Allspring Global Investments since 2021. Prior thereto, held various roles at State Street Global Advisors beginning in 2010, including serving as Senior Vice President and General Counsel from 2019 to 2021, and Chief Operating Officer of the Institutional Client Group from 2016 - 2019. Prior to working at State Street Global Advisors served as Assistant General Counsel for Bank of America Corporation from 2005 to 2010 and as an Associate at WilmerHale from 2002 to 2005. |
Christopher Baker
(Born 1976) | Chief Compliance Officer, since 2022 | Global Chief Compliance Officer for Allspring Global Investments since 2022. Prior thereto, Chief Compliance Officer for State Street Global Advisors from 2018 to 2021. Senior Compliance Officer for the State Street divisions of Alternative Investment Solutions, Sector Solutions, and Global Marketing from 2015 to 2018. From 2010 to 2015 Vice President, Global Head of Investment and Marketing Compliance for State Street Global Advisors. |
Matthew Prasse
(Born 1983) | Secretary,
since 2021 | Senior Counsel of the Allspring Legal Department since 2021. Senior Counsel of the Wells Fargo Legal Department from 2018 to 2021. Previously, Counsel for Barings LLC from 2015 to 2018. Prior to joining Barings, Associate at Morgan, Lewis & Bockius LLP from 2008 to 2015. |
1 The Statement of Additional Information includes additional information about the Trustees and is available, without charge, upon request, by calling 1-800-222-8222 or by visiting the website at allspringglobal.com.
2 For those Officers with tenures at Allspring Global Investments and/or Allspring Funds Management, LLC that began prior to 2021, such tenures include years of service during which these businesses/entities were known as Wells Fargo Asset Management and Wells Fargo Funds Management, LLC, respectively.
Allspring C&B Large Cap Value Fund | 39
For more information
More information about Allspring Funds is available free upon request. To obtain literature, please write, visit the Fund's website, or call:
Allspring Funds
P.O. Box 219967
Kansas City, MO 64121-9967
Website: allspringglobal.com
Individual investors: 1-800-222-8222
Retail investment professionals: 1-888-877-9275
Institutional investment professionals: 1-866-765-0778
This report and the financial statements contained herein are submitted for the general information of the shareholders of the Fund. If this report is used for promotional purposes, distribution of the report must be accompanied or preceded by a current prospectus. Before investing, please consider the investment objectives, risks, charges, and expenses of the investment. For a current prospectus and, if available, a summary prospectus, containing this information, call
1-800-222-8222 or visit the Fund's website at allspringglobal.com. Read the prospectus carefully before you invest or send money.
Allspring Global InvestmentsTM is the trade name for the asset management firms of Allspring Global Investments Holdings, LLC, a holding company indirectly owned by certain private funds of GTCR LLC and Reverence Capital Partners, L.P. These firms include but are not limited to Allspring Global Investments, LLC, and Allspring Funds Management, LLC. Certain products managed by Allspring entities are distributed by Allspring Funds Distributor, LLC (a broker-dealer and Member FINRA/SIPC).
This material is for general informational and educational purposes only and is NOT intended to provide investment advice or a recommendation of any kind - including a recommendation for any specific investment, strategy, or plan.
© 2022 Allspring Global Investments Holdings, LLC. All rights reserved.
PAR-1221-00193 01-22
SA280/SAR280 11-21
Semi-Annual Report
November 30, 2021
Allspring Emerging Growth Fund
The views expressed and any forward-looking statements are as of November 30, 2021, unless otherwise noted, and are those of the Fund's portfolio managers and/or Allspring Global Investments. Discussions of individual securities or the markets generally are not intended as individual recommendations. Future events or results may vary significantly from those expressed in any forward-looking statements. The views expressed are subject to change at any time in response to changing circumstances in the market. Allspring Global Investments disclaims any obligation to publicly update or revise any views expressed or forward-looking statements.
Allspring Emerging Growth Fund | 1
Letter to shareholders (unaudited)
Andrew Owen
President
Allspring Funds
Dear Shareholder:
We are pleased to offer you this semi-annual report for Allspring Emerging Growth Fund for the six-month period that ended November 30, 2021. Global stocks yielded mixed results as the global economy continued to emerge from the haze of COVID-19. Tailwinds were provided by global stimulus programs, a rapid vaccination rollout, and recovering consumer and corporate sentiment. The bond market had mostly positive returns during the period.
For the six-month period, U.S. stocks, based on the S&P 500 Index,1 gained 9.38%. International stocks, as measured by the MSCI ACWI ex USA Index (Net),2 returned -5.76%, while the MSCI EM Index (Net) (USD),3 trailed its developed market counterparts with a 10.81% loss. Among bond indexes, the Bloomberg U.S. Aggregate Bond Index,4 returned 1.02%, the Bloomberg Global Aggregate ex-USD Index (unhedged),5 returned -4.64%, the Bloomberg Municipal Bond Index6 returned 0.56%, and the ICE BofA U.S. High Yield Index,7 gained 1.09%.
Vaccination rollout drove the stock markets to new highs.
June witnessed the S&P 500 Index reach a new all-time high. 2021 economic growth and inflation forecasts were revised higher to reflect a strong economic recovery and some supply and demand imbalances. Late June saw a deal reached on a U.S. infrastructure package of approximately $1 trillion for road, bridge, and broadband network upgrades over the next eight years. The U.S. Federal Reserve's (Fed) June meeting yielded no change to policy, but its projections pointed to a possible interest rate rise in 2023. This, combined with a rebound in economic activity and investors searching for yield, led to U.S. Treasury yields being down for the month. Many European and Asian countries saw vaccination momentum increase, while the U.K. dealt with a rise in COVID-19 infections, specifically the Delta variant. Meanwhile, crude oil jumped over 10% in June on the back of the pickup in global economic activity and the Organization of the Petroleum Exporting Countries’ (OPEC) slow pace of supply growth.
“2021 economic growth and inflation forecasts were revised higher to reflect a strong economic recovery and some supply and demand imbalances.”
| 1 | The S&P 500 Index consists of 500 stocks chosen for market size, liquidity, and industry group representation. It is a market-value-weighted index with each stock's weight in the index proportionate to its market value. You cannot invest directly in an index. |
| 2 | The Morgan Stanley Capital International (MSCI) All Country World Index (ACWI) ex USA Index (Net) is a free-float-adjusted market-capitalization-weighted index that is designed to measure the equity market performance of developed and emerging markets, excluding the U.S. Source: MSCI. MSCI makes no express or implied warranties or representations and shall have no liability whatsoever with respect to any MSCI data contained herein. The MSCI data may not be further redistributed or used as a basis for other indexes or any securities or financial products. This report is not approved, reviewed, or produced by MSCI. You cannot invest directly in an index. |
| 3 | The MSCI Emerging Markets (EM) Index (Net) (USD) is a free-float-adjusted market-capitalization-weighted index that is designed to measure equity market performance of emerging markets. You cannot invest directly in an index. |
| 4 | The Bloomberg U.S. Aggregate Bond Index is a broad-based benchmark that measures the investment-grade, U.S.-dollar-denominated, fixed-rate taxable bond market, including Treasuries, government-related and corporate securities, mortgage-backed securities (agency fixed-rate and hybrid adjustable-rate mortgage pass-throughs), asset-backed securities, and commercial mortgage-backed securities. You cannot invest directly in an index. |
| 5 | The Bloomberg Global Aggregate ex-USD Index (unhedged) is an unmanaged index that provides a broad-based measure of the global investment-grade fixed-income markets excluding the U.S.-dollar-denominated debt market. You cannot invest directly in an index. |
| 6 | The Bloomberg Municipal Bond Index is an unmanaged index composed of long-term tax-exempt bonds with a minimum credit rating of Baa. You cannot invest directly in an index. |
| 7 | The ICE BofA U.S. High Yield Index is a market-capitalization-weighted index of domestic and Yankee high-yield bonds. The index tracks the performance of high-yield securities traded in the U.S. bond market. You cannot invest directly in an index. Copyright 2022. ICE Data Indices, LLC. All rights reserved. |
2 | Allspring Emerging Growth Fund
Letter to shareholders (unaudited)
July began the month seeing vaccinations making progress, as several major developed countries eased restrictions, only to be threatened again by the spread of COVID-19’s Delta variant. Inflation continued to climb, aided by the continued supply bottleneck in the face of high demand. As it pertains to the equity area of the market, U.S. equities led the way in positive return territory, followed by international developed markets. In contrast, emerging markets were well in negative territory for the month, hindered by China’s plans for new regulations on a number of sectors, specifically education and technology. The U.S. 10-Year Treasury bond yield continued to decline, as strong demand swallowed up supply. After hitting a multi-year high earlier in the month, oil prices leveled off following an agreement by OPEC to raise oil production starting in August.
The Delta variant of COVID-19 produced outbreaks globally in August, increasing the potential for increased market volatility and bringing into question the ongoing economic recovery. Domestically, the U.S. economy continued to stay strong in the face of the Delta variant, continued inflationary pressures, and worries over Hurricane Ida. Emerging market equities experienced elevated volatility, largely influenced by China’s regulatory stance. Emerging market equities started the month with poor performance but rebounded to end the month in positive territory. Municipal debt experienced its first monthly performance drop since February of this year, slowing a rally that made it one of the best-performing sectors of the bond market. In the commodity segment of the market, crude oil fell sharply during the month on the back of dampened expectations as a result of the Delta variant but was still a leading asset class performer for the year.
Global markets suffered their broadest retreat in a year during September, with the exception of commodities. Concerns over inflation and the interest rate outlook depressed investor confidence and hurt performance. Emerging markets declined on concerns over the continued supply chain disruptions and worries over higher energy and food prices. Meanwhile, the Fed indicated it would slow the pace of asset purchases in the near future. All eyes domestically were fixed on the raising of the debt ceiling, the 2022 budget plan, and the ongoing debate over the infrastructure package. Contrary to most asset classes, commodities thrived in September, driven by sharply higher energy prices.
October’s key themes continued to be elevated inflation pressures and a supply bottleneck, but strong earnings provided a bright spot in the markets. Earnings releases in the U.S. were generally strong and consumer confidence was high. The Fed reaffirmed its plans to taper quantitative easing to a stop by mid-2022. Meanwhile, elevated inflation figures were still being considered transitory by the Fed. Similar to the U.S., the eurozone and many Asian countries saw positive earnings but were facing inflation pressures caused by supply bottlenecks while also experiencing energy price increases amid natural gas shortages. Globally, government bond yields rose as central banks prepared to lower monetary policy accommodation in the face of rising inflationary pressures. As previously referenced, positive commodity performance was driven by sharply higher energy costs.
November was dominated by rising COVID-19 hospitalizations and concerns regarding the Omicron variant. Most major asset classes, both domestically and internationally, declined in November with two exceptions: U.S. investment-grade bonds and Treasury Inflation-Protected Securities. The United Nations Climate Change Conference (COP26) took place during the month with hopes of agreement among countries to limit global warming. While several initiatives were discussed, the conference ultimately ended without the specifics required to instill confidence that the limiting of global warming would succeed. In the U.S., President Biden signed a long-awaited infrastructure bill to upgrade U.S. roads, bridges, and railways. Meanwhile, the Consumer Price Index1, a measure of domestic inflation conditions, jumped to its highest level in 31 years. While the threat of consistently high inflation led the Fed to discuss a faster pace of tapering, the Omicron strain makes that less likely to occur. Commodities came in negative for the month, largely driven by sharp declines in oil prices (and energy costs in general), as well as precious metals.
“ Municipal debt experienced its first monthly performance drop since February of this year, slowing a rally that made it one of the best-performing sectors of the bond market.”
| 1 | The Consumer Price Index (CPI) is a measure of the average change over time in the prices paid by urban consumers for a market basket of consumer goods and services. You cannot invest directly in an index. |
Allspring Emerging Growth Fund | 3
Letter to shareholders (unaudited)
Don’t let short-term uncertainty derail long-term investment goals.
Periods of investment uncertainty can present challenges, but experience has taught us that maintaining long-term investment goals can be an effective way to plan for the future. To help you create a sound strategy based on your personal goals and risk tolerance, Allspring Funds offers more than 100 mutual funds spanning a wide range of asset classes and investment styles. Although diversification cannot guarantee an investment profit or prevent losses, we believe it can be an effective way to manage investment risk and potentially smooth out overall portfolio performance. We encourage investors to know their investments and to understand that appropriate levels of risk-taking may unlock opportunities.
Information on transaction closing.
On November 1, 2021, GTCR LLC and Reverence Capital Partners, L.P., announced the beginning of Allspring Global Investments™, with the close of the transaction to acquire Wells Fargo Funds Management, LLC; Wells Capital Management LLC; Galliard Capital Management LLC.; Wells Fargo Asset Management (International) Ltd.; Wells Fargo Asset Management Luxembourg S.A.; and Wells Fargo Funds Distributor, LLC, as well as Wells Fargo Bank, N.A.’s business of acting as trustee to its collective investment trusts and all related Wells Fargo Asset Management legal entities. The transaction closed on November 1, 2021, forming Allspring Global Investments, a privately held asset management firm with $587 billion in AUM1 as of September 30, 2021.
Allspring Global Investments™ is a leading independent asset management firm with a full breadth of investment capabilities across diverse asset classes, serving the needs of its institutional and wealth management clients around the world. Allspring operates across 18 offices globally supported by more than 480 investment professionals. Allspring and its investment teams provide a broad range of differentiated investment products and solutions to help its diverse range of clients meet their investment objectives.
As part of this transition, all mutual funds within the Wells Fargo Funds family were rebranded as Allspring Funds. Each individual fund had “Wells Fargo” removed from its fund name and replaced with “Allspring.” The fund name changes went into effect on December 6, 2021.
Allspring Global Investments is the trade name for the asset management firms of Allspring Global Investments Holdings, LLC, a holding company indirectly owned by certain private funds of GTCR LLC and Reverence Capital Partners, L.P.
Thank you for choosing to invest with Allspring Funds. We appreciate your confidence in us and remain committed to helping you meet your financial needs.
Sincerely,
Andrew Owen
President
Allspring Funds
For further information about your Fund, contact your investment professional, visit our website at allspringglobal.com, or call us directly at 1-800-222-8222.
| 1 | As of September 30, 2021, assets under management (AUM) includes $93 billion from Galliard Capital Management, LLC, an investment advisor that is not part of the Allspring trade name/GIPS firm. |
4 | Allspring Emerging Growth Fund
This page is intentionally left blank.
Performance highlights (unaudited)
| Investment objective | The Fund seeks long-term capital appreciation. |
| Manager | Allspring Funds Management, LLC |
Subadviser for the affiliated master portfolio*
Allspring Global Investments, LLC
| Portfolio managers | Robert Gruendyke, CFA®‡, David Nazaret, CFA®‡, Thomas C. Ognar, CFA®‡ |
| Average annual total returns (%) as of November 30, 2021 |
| | | Including sales charge | | Excluding sales charge | | Expense ratios1 (%) |
| | Inception date | 1 year | 5 year | 10 year | | 1 year | 5 year | 10 year | | Gross | Net 2 |
| Class A (WEMAX) | 3-31-2008 | 10.92 | 20.29 | 15.31 | | 17.69 | 21.72 | 16.00 | | 1.35 | 1.28 |
| Class C (WEMCX) | 3-31-2008 | 15.86 | 20.83 | 15.14 | | 16.86 | 20.83 | 15.14 | | 2.10 | 2.03 |
| Class R6 (WEGRX)3 | 7-31-2018 | – | – | – | | 18.19 | 22.28 | 16.54 | | 0.92 | 0.85 |
| Administrator Class (WFGDX) | 1-31-2007 | – | – | – | | 17.82 | 21.84 | 16.16 | | 1.27 | 1.20 |
| Institutional Class (WEMIX) | 3-31-2008 | – | – | – | | 18.20 | 22.20 | 16.50 | | 1.02 | 0.90 |
| Russell 2000® Growth Index4 | – | – | – | – | | 11.95 | 14.74 | 14.06 | | – | – |
Figures quoted represent past performance, which is no guarantee of future results, and do not reflect taxes that a shareholder may pay on an investment in a fund. Investment return and principal value of an investment will fluctuate so that an investor’s shares, when redeemed, may be worth more or less than their original cost. Performance shown without sales charges would be lower if sales charges were reflected. Current performance may be lower or higher than the performance data quoted, which assumes the reinvestment of dividends and capital gains. Current month-end performance is available on the Fund’s website, allspringglobal.com.
Index returns do not include transaction costs associated with buying and selling securities, any mutual fund fees or expenses, or any taxes. It is not possible to invest directly in an index.
For Class A shares, the maximum front-end sales charge is 5.75%. For Class C shares, the maximum contingent deferred sales charge is 1.00%. Performance including a contingent deferred sales charge assumes the sales charge for the corresponding time period. Class R6, Administrator Class and Institutional Class shares are sold without a front-end sales charge or contingent deferred sales charge.
| 1 | Reflects the expense ratios as stated in the most recent prospectuses. The expense ratios shown are subject to change and may differ from the annualized expense ratios shown in the financial highlights of this report. |
| 2 | The manager has contractually committed through September 30, 2022, to waive fees and/or reimburse expenses to the extent necessary to cap total annual fund operating expenses after fee waivers at 1.28% for Class A, 2.03% for Class C, 0.85% for Class R6, 1.20% for Administrator Class, and 0.90% for Institutional Class. Brokerage commissions, stamp duty fees, interest, taxes, acquired fund fees and expenses (if any) from funds in which the affiliated master portfolio invests, and extraordinary expenses are excluded from the expense caps. Net expenses from the affiliated master portfolio are included in the expense caps. Prior to or after the commitment expiration date, the caps may be increased or the commitment to maintain the caps may be terminated only with the approval of the Board of Trustees. Without these caps, the Fund’s returns would have been lower. The expense ratio paid by an investor is the net expense ratio (the total annual fund operating expenses after fee waivers) as stated in the prospectuses. |
| 3 | Historical performance shown for the Class R6 shares prior to their inception reflects the performance of the Institutional Class shares, and includes the higher expenses applicable to the Institutional Class shares. If these expenses had not been included, returns for the Class R6 shares would be higher. |
| 4 | The Russell 2000® Growth Index measures the performance of those Russell 2000 companies with higher price/book ratios and higher forecasted growth values. You cannot invest directly in an index. |
Stock values fluctuate in response to the activities of individual companies and general market and economic conditions. Smaller - company stocks tend to be more volatile and less liquid than those of larger companies. Certain investment strategies tend to increase the total risk of an investment (relative to the broader market). This fund is exposed to foreign investment risk. Consult the Fund’s prospectus for additional information on these and other risks.
| * | The Fund is a feeder fund in a master-feeder structure that invests substantially all of its assets in a single affiliated master portfolio of the Allspring Master Trust with a substantially identical investment objective and substantially similar investment strategies. References to the investment activities of the Fund are intended to refer to the investment activities of the affiliated master portfolio in which it invests. |
| ‡ | CFA® and Chartered Financial Analyst® are trademarks owned by CFA Institute. |
6 | Allspring Emerging Growth Fund
Performance highlights (unaudited)
| Ten largest holdings (%) as of November 30, 20211 |
| ASGN Incorporated | 3.48 |
| Rapid7 Incorporated | 3.30 |
| SPS Commerce Incorporated | 2.87 |
| Shockwave Medical Incorporated | 2.83 |
| Boot Barn Holdings Incorporated | 2.74 |
| Crocs Incorporated | 2.71 |
| Sprout Social Incorporated Class A | 2.63 |
| Codexis Incorporated | 2.53 |
| Workiva Incorporated | 2.51 |
| Novanta Incorporated | 2.31 |
| 1 | Each holding represents the Fund’s allocable portion of the affiliated master portfolio security. Figures represent each holding as a percentage of the Fund’s net assets. Holdings are subject to change and may have changed since the date specified. |
| Sector allocation as of November 30, 20211 |
| 1 | Figures represent the sector allocation of the affiliated master portfolio as a percentage of the long-term investments of the affiliated master portfolio. These amounts are subject to change and may have changed since the date specified. |
Allspring Emerging Growth Fund | 7
Fund expenses (unaudited)
As a shareholder of the Fund, you incur two types of costs: (1) transaction costs, including sales charges (loads) on purchase payments and contingent deferred sales charges (if any) on redemptions and (2) ongoing costs, including management fees, distribution (12b-1) and/or shareholder servicing fees, and other Fund expenses. This example is intended to help you understand your ongoing costs (in dollars) of investing in the Fund and to compare these costs with the ongoing costs of investing in other mutual funds.
The example is based on an investment of $1,000 invested at the beginning of the six-month period and held for the entire period from June 1, 2021 to November 30, 2021.
Actual expenses
The “Actual” line of the table below provides information about actual account values and actual expenses. You may use the information in this line, together with the amount you invested, to estimate the expenses that you paid over the period. Simply divide your account value by $1,000 (for example, an $8,600 account value divided by $1,000 = 8.6), then multiply the result by the number in the “Actual” line under the heading entitled “Expenses paid during period” for your applicable class of shares to estimate the expenses you paid on your account during this period.
Hypothetical example for comparison purposes
The “Hypothetical” line of the table below provides information about hypothetical account values and hypothetical expenses based on the Fund’s actual expense ratio and an assumed rate of return of 5% per year before expenses, which is not the Fund’s actual return. The hypothetical account values and expenses may not be used to estimate the actual ending account balance or expenses you paid for the period. You may use this information to compare the ongoing costs of investing in the Fund and other funds. To do so, compare this 5% hypothetical example with the 5% hypothetical examples that appear in the shareholder reports of the other funds.
Please note that the expenses shown in the table are meant to highlight your ongoing costs only and do not reflect any transactional costs, such as sales charges (loads) and contingent deferred sales charges. Therefore, the “Hypothetical” line of the table is useful in comparing ongoing costs only, and will not help you determine the relative total costs of owning different funds. In addition, if these transactional costs were included, your costs would have been higher.
| | Beginning
account value
6-1-2021 | Ending
account value
11-30-2021 | Expenses
paid during
the period1,2 | Annualized net
expense ratio2 |
| Class A | | | | |
| Actual | $1,000.00 | $1,062.05 | $ 6.56 | 1.27% |
| Hypothetical (5% return before expenses) | $1,000.00 | $1,018.70 | $ 6.43 | 1.27% |
| Class C | | | | |
| Actual | $1,000.00 | $1,058.33 | $10.47 | 2.03% |
| Hypothetical (5% return before expenses) | $1,000.00 | $1,014.89 | $10.25 | 2.03% |
| Class R6 | | | | |
| Actual | $1,000.00 | $1,063.95 | $ 4.40 | 0.85% |
| Hypothetical (5% return before expenses) | $1,000.00 | $1,020.81 | $ 4.31 | 0.85% |
| Administrator Class | | | | |
| Actual | $1,000.00 | $1,062.70 | $ 6.21 | 1.20% |
| Hypothetical (5% return before expenses) | $1,000.00 | $1,019.05 | $ 6.07 | 1.20% |
| Institutional Class | | | | |
| Actual | $1,000.00 | $1,064.23 | $ 4.66 | 0.90% |
| Hypothetical (5% return before expenses) | $1,000.00 | $1,020.56 | $ 4.56 | 0.90% |
1 Expenses paid is equal to the annualized net expense ratio of each class multiplied by the average account value over the period, multiplied by the number of days in the most recent fiscal half-year divided by the number of days in the fiscal year (to reflect the one-half-year period).
2 Amounts reflect net expenses allocated from the affiliated Master Portfolio in which the Fund invests.
8 | Allspring Emerging Growth Fund
Portfolio of investments—November 30, 2021 (unaudited)
| | | | | | Value |
| Investment companies: 99.79% | | | | | |
| Affiliated master portfolio: 99.79% | | | | | |
| Allspring Emerging Growth Portfolio | | | | | $518,157,292 |
| Total Investment companies (Cost $298,639,817) | | | | | 518,157,292 |
| Total investments in securities (Cost $298,639,817) | 99.79% | | | | 518,157,292 |
| Other assets and liabilities, net | 0.21 | | | | 1,076,254 |
| Total net assets | 100.00% | | | | $519,233,546 |
Transactions with the affiliated Master Portfolio were as follows:
| | % of
ownership,
beginning
of period | % of
ownership,
end of
period | Net realized
gains
(losses) on
securities
transactions
allocated
from
affiliated
Master
Portfolio | Net
change in
unrealized
gains
(losses) on
securities
transactions
allocated
from
affiliated
Master
Portfolio | Dividends
allocated
from
affiliated
Master
Portfolio | Securities
lending
income
allocated
from
affiliated
Master
Portfolio | Affiliated
income
allocated
from
affiliated
Master
Portfolio | Value,
end of
period | |
| Allspring Emerging Growth Portfolio | 95.20% | 91.83% | $250,263,414 | $(175,003,562) | $301,687 | $173,697 | $1,021 | $518,157,292 | |
The accompanying notes are an integral part of these financial statements.
Allspring Emerging Growth Fund | 9
Statement of assets and liabilities—November 30, 2021 (unaudited)
| | |
| Assets | |
Investments in affiliated Master Portfolio, at value (cost $298,639,817)
| $ 518,157,292 |
Receivable for Fund shares sold
| 1,716,564 |
Receivable from manager
| 26,962 |
Prepaid expenses and other assets
| 41,068 |
Total assets
| 519,941,886 |
| Liabilities | |
Payable for Fund shares redeemed
| 495,671 |
Administration fees payable
| 74,218 |
Shareholder servicing fees payable
| 56,035 |
Shareholder report expenses payable
| 52,428 |
Trustees’ fees and expenses payable
| 2,931 |
Distribution fee payable
| 1,522 |
Accrued expenses and other liabilities
| 25,535 |
Total liabilities
| 708,340 |
Total net assets
| $519,233,546 |
| Net assets consist of | |
Paid-in capital
| $ (18,156,507) |
Total distributable earnings
| 537,390,053 |
Total net assets
| $519,233,546 |
| Computation of net asset value and offering price per share | |
Net assets – Class A
| $ 218,391,096 |
Shares outstanding – Class A1
| 11,390,777 |
Net asset value per share – Class A
| $19.17 |
Maximum offering price per share – Class A2
| $20.34 |
Net assets – Class C
| $ 2,256,678 |
Shares outstanding – Class C1
| 148,057 |
Net asset value per share – Class C
| $15.24 |
Net assets – Class R6
| $ 22,910,601 |
Shares outstanding – Class R61
| 1,043,065 |
Net asset value per share – Class R6
| $21.96 |
Net assets – Administrator Class
| $ 29,403,311 |
Shares outstanding – Administrator Class1
| 1,458,041 |
Net asset value per share – Administrator Class
| $20.17 |
Net assets – Institutional Class
| $ 246,271,860 |
Shares outstanding – Institutional Class1
| 11,261,818 |
Net asset value per share – Institutional Class
| $21.87 |
| 1 | The Fund has an unlimited number of authorized shares. |
| 2 | Maximum offering price is computed as 100/94.25 of net asset value. On investments of $50,000 or more, the offering price is reduced. |
The accompanying notes are an integral part of these financial statements.
10 | Allspring Emerging Growth Fund
Statement of operations—six months ended November 30, 2021 (unaudited)
| | |
| Investment income | |
Dividends allocated from affiliated Master Portfolio
| $ 301,687 |
Securities lending income allocated from affiliated Master Portfolio
| 173,697 |
Affiliated income allocated from affiliated Master Portfolio
| 1,021 |
Expenses allocated from affiliated Master Portfolio
| (2,976,005) |
Total investment income
| (2,499,600) |
| Expenses | |
Management fee
| 183,374 |
| Administration fees | |
Class A
| 238,896 |
Class C
| 2,514 |
Class R6
| 3,545 |
Administrator Class
| 19,925 |
Institutional Class
| 292,043 |
| Shareholder servicing fees | |
Class A
| 284,400 |
Class C
| 2,993 |
Administrator Class
| 38,250 |
| Distribution fee | |
Class C
| 8,978 |
Custody and accounting fees
| 6,755 |
Professional fees
| 19,390 |
Registration fees
| 32,399 |
Shareholder report expenses
| 4,917 |
Trustees’ fees and expenses
| 9,967 |
Other fees and expenses
| 3,886 |
Total expenses
| 1,152,232 |
| Less: Fee waivers and/or expense reimbursements | |
Fund-level
| (254,514) |
Class A
| (13,888) |
Institutional Class
| (89,614) |
Net expenses
| 794,216 |
Net investment loss
| (3,293,816) |
| Realized and unrealized gains (losses) on investments | |
Net realized gains on securities transactions allocated from affiliated Master Portfolio
| 250,263,414 |
Net change in unrealized gains (losses) on securities transactions allocated from affiliated Master Portfolio
| (175,003,562) |
Net realized and unrealized gains (losses) on investments
| 75,259,852 |
Net increase in net assets resulting from operations
| $ 71,966,036 |
The accompanying notes are an integral part of these financial statements.
Allspring Emerging Growth Fund | 11
Statement of changes in net assets
| | | | | |
| | Six months ended
November 30, 2021
(unaudited) | Year ended
May 31, 2021 |
| Operations | | | | |
Net investment loss
| | $ (3,293,816) | | $ (6,987,906) |
Net realized gains on investments
| | 250,263,414 | | 164,596,232 |
Net change in unrealized gains (losses) on investments
| | (175,003,562) | | 172,105,999 |
Net increase in net assets resulting from operations
| | 71,966,036 | | 329,714,325 |
| Distributions to shareholders from | | | | |
| Net investment income and net realized gains | | | | |
Class A
| | 0 | | (40,824,693) |
Class C
| | 0 | | (488,552) |
Class R6
| | 0 | | (4,264,478) |
Administrator Class
| | 0 | | (5,278,969) |
Institutional Class
| | 0 | | (104,301,425) |
Total distributions to shareholders
| | 0 | | (155,158,117) |
| Capital share transactions | Shares | | Shares | |
| Proceeds from shares sold | | | | |
Class A
| 141,556 | 2,780,841 | 594,602 | 10,958,344 |
Class C
| 13,870 | 215,104 | 67,936 | 1,035,606 |
Class R6
| 197,273 | 4,647,257 | 203,245 | 4,206,281 |
Administrator Class
| 47,460 | 976,328 | 354,817 | 6,842,617 |
Institutional Class
| 2,042,244 | 45,741,214 | 8,415,847 | 166,124,291 |
| | | 54,360,744 | | 189,167,139 |
| Reinvestment of distributions | | | | |
Class A
| 0 | 0 | 2,332,324 | 38,903,166 |
Class C
| 0 | 0 | 36,568 | 488,552 |
Class R6
| 0 | 0 | 68,148 | 1,296,851 |
Administrator Class
| 0 | 0 | 299,668 | 5,253,185 |
Institutional Class
| 0 | 0 | 5,494,647 | 104,178,513 |
| | | 0 | | 150,120,267 |
| Payment for shares redeemed | | | | |
Class A
| (430,719) | (8,463,044) | (1,365,780) | (24,392,486) |
Class C
| (28,082) | (436,029) | (71,196) | (1,109,781) |
Class R6
| (207,156) | (4,825,842) | (409,558) | (8,565,269) |
Administrator Class
| (103,096) | (2,094,375) | (528,979) | (9,983,853) |
Institutional Class
| (22,338,472) | (503,478,220) | (11,301,966) | (220,272,610) |
| | | (519,297,510) | | (264,323,999) |
Net increase (decrease) in net assets resulting from capital share transactions
| | (464,936,766) | | 74,963,407 |
Total increase (decrease) in net assets
| | (392,970,730) | | 249,519,615 |
| Net assets | | | | |
Beginning of period
| | 912,204,276 | | 662,684,661 |
End of period
| | $ 519,233,546 | | $ 912,204,276 |
The accompanying notes are an integral part of these financial statements.
12 | Allspring Emerging Growth Fund
Financial highlights
(For a share outstanding throughout each period)
| | | Year ended May 31 |
| Class A | Six months ended
November 30, 2021
(unaudited) | 2021 | 2020 | 2019 | 2018 | 2017 |
Net asset value, beginning of period
| $18.05 | $14.71 | $13.51 | $17.04 | $14.57 | $12.55 |
Net investment loss
| (0.11) 1 | (0.20) 1 | (0.17) | (0.16) 1 | (0.15) | (0.10) 1 |
Net realized and unrealized gains (losses) on investments
| 1.23 | 7.69 | 2.13 | (0.19) | 4.57 | 2.96 |
Total from investment operations
| 1.12 | 7.49 | 1.96 | (0.35) | 4.42 | 2.86 |
| Distributions to shareholders from | | | | | | |
Net realized gains
| 0.00 | (4.15) | (0.76) | (3.18) | (1.95) | (0.84) |
Net asset value, end of period
| $19.17 | $18.05 | $14.71 | $13.51 | $17.04 | $14.57 |
Total return2
| 6.20% | 53.22% | 14.97% | (0.84)% | 32.91% | 23.39% |
| Ratios to average net assets (annualized)* | | | | | | |
Gross expenses
| 1.35% | 1.35% | 1.36% | 1.35% | 1.36% | 1.36% |
Net expenses
| 1.27% | 1.27% | 1.27% | 1.29% | 1.35% | 1.35% |
Net investment loss
| (1.13)% | (1.12)% | (1.08)% | (1.06)% | (1.01)% | (0.72)% |
| Supplemental data | | | | | | |
Portfolio turnover rate3
| 28% | 48% | 55% | 71% | 47% | 115% |
Net assets, end of period (000s omitted)
| $218,391 | $210,838 | $148,866 | $145,898 | $153,526 | $129,724 |
| * | Ratios include net expenses allocated from the affiliated Master Portfolio which were as follows: |
| Six months ended November 30, 2021 (unaudited) | 0.81% |
| Year ended May 31, 2021 | 0.81% |
| Year ended May 31, 2020 | 0.81% |
| Year ended May 31, 2019 | 0.81% |
| Year ended May 31, 2018 | 0.81% |
| Year ended May 31, 2017 | 0.81% |
| 1 | Calculated based upon average shares outstanding |
| 2 | Total return calculations do not include any sales charges. Returns for periods of less than one year are not annualized. |
| 3 | Portfolio turnover rate is calculated by multiplying the affiliated Master Portfolio’s percentage of the Fund’s total investment in securities at the end of the period by the affiliated Master Portfolio’s portfolio turnover rate. |
The accompanying notes are an integral part of these financial statements.
Allspring Emerging Growth Fund | 13
Financial highlights
(For a share outstanding throughout each period)
| | | Year ended May 31 |
| Class C | Six months ended
November 30, 2021
(unaudited) | 2021 | 2020 | 2019 | 2018 | 2017 |
Net asset value, beginning of period
| $14.41 | $12.40 | $11.58 | $15.19 | $13.28 | $11.58 |
Net investment loss
| (0.15) 1 | (0.28) 1 | (0.21) 1 | (0.25) 1 | (0.25) 1 | (0.19) 1 |
Net realized and unrealized gains (losses) on investments
| 0.98 | 6.44 | 1.79 | (0.18) | 4.11 | 2.73 |
Total from investment operations
| 0.83 | 6.16 | 1.58 | (0.43) | 3.86 | 2.54 |
| Distributions to shareholders from | | | | | | |
Net realized gains
| 0.00 | (4.15) | (0.76) | (3.18) | (1.95) | (0.84) |
Net asset value, end of period
| $15.24 | $14.41 | $12.40 | $11.58 | $15.19 | $13.28 |
Total return2
| 5.76% | 52.19% | 14.16% | (1.55)% | 31.82% | 22.56% |
| Ratios to average net assets (annualized)* | | | | | | |
Gross expenses
| 2.10% | 2.10% | 2.11% | 2.10% | 2.11% | 2.11% |
Net expenses
| 2.03% | 2.03% | 2.03% | 2.04% | 2.10% | 2.10% |
Net investment loss
| (1.89)% | (1.89)% | (1.84)% | (1.78)% | (1.76)% | (1.46)% |
| Supplemental data | | | | | | |
Portfolio turnover rate3
| 28% | 48% | 55% | 71% | 47% | 115% |
Net assets, end of period (000s omitted)
| $2,257 | $2,338 | $1,599 | $1,761 | $4,190 | $3,328 |
| * | Ratios include net expenses allocated from the affiliated Master Portfolio which were as follows: |
| Six months ended November 30, 2021 (unaudited) | 0.81% |
| Year ended May 31, 2021 | 0.81% |
| Year ended May 31, 2020 | 0.81% |
| Year ended May 31, 2019 | 0.81% |
| Year ended May 31, 2018 | 0.81% |
| Year ended May 31, 2017 | 0.81% |
| 1 | Calculated based upon average shares outstanding |
| 2 | Total return calculations do not include any sales charges. Returns for periods of less than one year are not annualized. |
| 3 | Portfolio turnover rate is calculated by multiplying the affiliated Master Portfolio’s percentage of the Fund’s total investment in securities at the end of the period by the affiliated Master Portfolio’s portfolio turnover rate. |
The accompanying notes are an integral part of these financial statements.
14 | Allspring Emerging Growth Fund
Financial highlights
(For a share outstanding throughout each period)
| | | Year ended May 31 |
| Class R6 | Six months ended
November 30, 2021
(unaudited) | 2021 | 2020 | 2019 1 |
Net asset value, beginning of period
| $20.64 | $16.34 | $14.86 | $18.70 |
Net investment loss
| (0.08) | (0.14) | (0.10) 2 | (0.07) 2 |
Net realized and unrealized gains (losses) on investments
| 1.40 | 8.59 | 2.34 | (0.59) |
Total from investment operations
| 1.32 | 8.45 | 2.24 | (0.66) |
| Distributions to shareholders from | | | | |
Net realized gains
| 0.00 | (4.15) | (0.76) | (3.18) |
Net asset value, end of period
| $21.96 | $20.64 | $16.34 | $14.86 |
Total return3
| 6.40% | 53.85% | 15.51% | (2.35)% |
| Ratios to average net assets (annualized)* | | | | |
Gross expenses
| 0.92% | 0.92% | 0.93% | 0.92% |
Net expenses
| 0.85% | 0.85% | 0.85% | 0.85% |
Net investment loss
| (0.71)% | (0.68)% | (0.67)% | (0.51)% |
| Supplemental data | | | | |
Portfolio turnover rate4
| 28% | 48% | 55% | 71% |
Net assets, end of period (000s omitted)
| $22,911 | $21,729 | $19,458 | $22 |
| * | Ratios include net expenses allocated from the affiliated Master Portfolio which were as follows: |
| Six months ended November 30, 2021 (unaudited) | 0.81% |
| Year ended May 31, 2021 | 0.81% |
| Year ended May 31, 2020 | 0.81% |
| Year ended May 31, 20191 | 0.81% |
| 1 | For the period from July 31, 2018 (commencement of class operations) to May 31, 2019 |
| 2 | Calculated based upon average shares outstanding |
| 3 | Returns for periods of less than one year are not annualized. |
| 4 | Portfolio turnover rate is calculated by multiplying the affiliated Master Portfolio’s percentage of the Fund’s total investment in securities at the end of the period by the affiliated Master Portfolio’s portfolio turnover rate. |
The accompanying notes are an integral part of these financial statements.
Allspring Emerging Growth Fund | 15
Financial highlights
(For a share outstanding throughout each period)
| | | Year ended May 31 |
| Administrator Class | Six months ended
November 30, 2021
(unaudited) | 2021 | 2020 | 2019 | 2018 | 2017 |
Net asset value, beginning of period
| $18.98 | $15.31 | $14.02 | $17.54 | $14.93 | $12.82 |
Net investment loss
| (0.11) 1 | (0.20) 1 | (0.14) 1 | (0.15) 1 | (0.14) 1 | (0.07) 1 |
Net realized and unrealized gains (losses) on investments
| 1.30 | 8.02 | 2.19 | (0.19) | 4.70 | 3.02 |
Total from investment operations
| 1.19 | 7.82 | 2.05 | (0.34) | 4.56 | 2.95 |
| Distributions to shareholders from | | | | | | |
Net realized gains
| 0.00 | (4.15) | (0.76) | (3.18) | (1.95) | (0.84) |
Net asset value, end of period
| $20.17 | $18.98 | $15.31 | $14.02 | $17.54 | $14.93 |
Total return2
| 6.27% | 53.31% | 15.07% | (0.75)% | 33.06% | 23.60% |
| Ratios to average net assets (annualized)* | | | | | | |
Gross expenses
| 1.27% | 1.27% | 1.28% | 1.27% | 1.28% | 1.26% |
Net expenses
| 1.20% | 1.20% | 1.20% | 1.20% | 1.20% | 1.20% |
Net investment loss
| (1.06)% | (1.05)% | (1.01)% | (0.94)% | (0.86)% | (0.48)% |
| Supplemental data | | | | | | |
Portfolio turnover rate3
| 28% | 48% | 55% | 71% | 47% | 115% |
Net assets, end of period (000s omitted)
| $29,403 | $28,730 | $21,250 | $23,549 | $52,335 | $50,865 |
| * | Ratios include net expenses allocated from the affiliated Master Portfolio which were as follows: |
| Six months ended November 30, 2021 (unaudited) | 0.81% |
| Year ended May 31, 2021 | 0.81% |
| Year ended May 31, 2020 | 0.81% |
| Year ended May 31, 2019 | 0.81% |
| Year ended May 31, 2018 | 0.81% |
| Year ended May 31, 2017 | 0.81% |
| 1 | Calculated based upon average shares outstanding |
| 2 | Returns for periods of less than one year are not annualized. |
| 3 | Portfolio turnover rate is calculated by multiplying the affiliated Master Portfolio’s percentage of the Fund’s total investment in securities at the end of the period by the affiliated Master Portfolio’s portfolio turnover rate. |
The accompanying notes are an integral part of these financial statements.
16 | Allspring Emerging Growth Fund
Financial highlights
(For a share outstanding throughout each period)
| | | Year ended May 31 |
| Institutional Class | Six months ended
November 30, 2021
(unaudited) | 2021 | 2020 | 2019 | 2018 | 2017 |
Net asset value, beginning of period
| $20.55 | $16.29 | $14.83 | $18.30 | $15.46 | $13.20 |
Net investment loss
| (0.09) 1 | (0.15) | (0.11) 1 | (0.13) | (0.09) | (0.04) 1 |
Net realized and unrealized gains (losses) on investments
| 1.41 | 8.56 | 2.33 | (0.16) | 4.88 | 3.14 |
Total from investment operations
| 1.32 | 8.41 | 2.22 | (0.29) | 4.79 | 3.10 |
| Distributions to shareholders from | | | | | | |
Net realized gains
| 0.00 | (4.15) | (0.76) | (3.18) | (1.95) | (0.84) |
Net asset value, end of period
| $21.87 | $20.55 | $16.29 | $14.83 | $18.30 | $15.46 |
Total return2
| 6.42% | 53.75% | 15.40% | (0.42)% | 33.44% | 24.08% |
| Ratios to average net assets (annualized)* | | | | | | |
Gross expenses
| 1.01% | 1.02% | 1.03% | 1.02% | 1.03% | 1.03% |
Net expenses
| 0.90% | 0.90% | 0.90% | 0.90% | 0.90% | 0.90% |
Net investment loss
| (0.78)% | (0.75)% | (0.71)% | (0.67)% | (0.56)% | (0.24)% |
| Supplemental data | | | | | | |
Portfolio turnover rate3
| 28% | 48% | 55% | 71% | 47% | 115% |
Net assets, end of period (000s omitted)
| $246,272 | $648,569 | $471,512 | $578,073 | $606,729 | $534,846 |
| * | Ratios include net expenses allocated from the affiliated Master Portfolio which were as follows: |
| Six months ended November 30, 2021 (unaudited) | 0.81% |
| Year ended May 31, 2021 | 0.81% |
| Year ended May 31, 2020 | 0.81% |
| Year ended May 31, 2019 | 0.81% |
| Year ended May 31, 2018 | 0.81% |
| Year ended May 31, 2017 | 0.81% |
| 1 | Calculated based upon average shares outstanding |
| 2 | Returns for periods of less than one year are not annualized. |
| 3 | Portfolio turnover rate is calculated by multiplying the affiliated Master Portfolio’s percentage of the Fund’s total investment in securities at the end of the period by the affiliated Master Portfolio’s portfolio turnover rate. |
The accompanying notes are an integral part of these financial statements.
Allspring Emerging Growth Fund | 17
Notes to financial statements (unaudited)
1. ORGANIZATION
Allspring Funds Trust (the "Trust"), a Delaware statutory trust organized on March 10, 1999, is an open-end management investment company registered under the Investment Company Act of 1940, as amended (the "1940 Act"). As an investment company, the Trust follows the accounting and reporting guidance in Financial Accounting Standards Board ("FASB") Accounting Standards Codification Topic 946, Financial Services – Investment Companies. These financial statements report on the Allspring Emerging Growth Fund (the "Fund") which is a diversified series of the Trust.
The Fund is a feeder fund in a master-feeder structure that invests substantially all of its assets in a single master portfolio with a substantially identical investment objective and substantially similar investment strategies. The Fund invests in Allspring Emerging Growth Portfolio, a separate diversified portfolio (the “affiliated Master Portfolio”) of Allspring Master Trust, a registered open-end management investment company. As of November 30, 2021, the Fund owned 91.83% of Allspring Emerging Growth Portfolio. The affiliated Master Portfolio directly acquires portfolio securities and the Fund acquires an indirect interest in those securities. The Fund accounts for its investment in the affiliated Master Portfolio as a partnership investment and records on a daily basis its share of the affiliated Master Portfolio’s income, expense and realized and unrealized gains and losses. The financial statements of the affiliated Master Portfolio for the six months ended November 30, 2021 are included in this report and should be read in conjunction with the Fund’s financial statements.
On February 23, 2021, Wells Fargo & Company entered into a definitive agreement to sell Wells Fargo Asset Management ("WFAM") to GTCR LLC and Reverence Capital Partners, L.P. WFAM was the trade name used by the asset management businesses of Wells Fargo & Company and included Wells Fargo Funds Management, LLC, Wells Capital Management, LLC, Wells Fargo Asset Management (International) Limited and Wells Fargo Funds Distributor, LLC. Effective on November 1, 2021, the sale transaction of WFAM by Wells Fargo & Company to GTCR LLC and Reverence Capital Partners, L.P. was closed. In connection with the closing of the transaction, WFAM became known as Allspring Global Investments (“Allspring”) and various entities that provide services to the Fund changed their names to "Allspring", including Allspring Funds Management, LLC (formerly Wells Fargo Funds Management, LLC), the investment manager to the Fund, Allspring Global Investments, Inc. (formerly Wells Capital Management, LLC) and Allspring Global Investments (UK) Limited (formerly Wells Fargo Asset Management (International) Limited), both registered investment advisers providing subadvisory services to certain funds, and Allspring Funds Distributor, LLC (formerly Wells Fargo Funds Distributor, LLC), the Fund's principal underwriter.
Consummation of the transaction resulted in the automatic termination of the Fund’s investment management agreement. The Fund’s Board of Trustees approved a new investment management agreement which was submitted and approved by the Fund’s shareholders at a Special Meeting of Shareholders held on August 16, 2021. The new agreement became effective on November 1, 2021.
Effective December 6, 2021, "Wells Fargo" was removed from the Fund's name and replaced it with "Allspring".
2. SIGNIFICANT ACCOUNTING POLICIES
The following significant accounting policies, which are consistently followed in the preparation of the financial statements of the Fund, are in conformity with U.S. generally accepted accounting principles which require management to make estimates and assumptions that affect the reported amounts of assets and liabilities, disclosure of contingent assets and liabilities at the date of the financial statements, and the reported amounts of income and expenses during the reporting period. Actual results could differ from those estimates.
Securities valuation
All investments are valued each business day as of the close of regular trading on the New York Stock Exchange (generally 4 p.m. Eastern Time), although the Fund may deviate from this calculation time under unusual or unexpected circumstances.
Investments in the affiliated Master Portfolio are valued daily based on the Fund’s proportionate share of the affiliated Master Portfolio’s net assets, which are also valued daily. Securities held in the affiliated Master Portfolio are valued as discussed in the Notes to Financial Statements of the affiliated Master Portfolio, which are included elsewhere in this report.
Investments which are not valued using the method discussed above are valued at their fair value, as determined in good faith by the Board of Trustees. The Board of Trustees has established a Valuation Committee comprised of the Trustees and has delegated to it the authority to take any actions regarding the valuation of portfolio securities that the Valuation Committee deems necessary or appropriate, including determining the fair value of portfolio securities, unless the determination has been delegated to the Allspring Global Investments Pricing Committee at Allspring Funds Management, LLC ("Allspring Funds Management"). The Board of Trustees retains the authority to make or ratify any valuation decisions or approve any changes to
18 | Allspring Emerging Growth Fund
Notes to financial statements (unaudited)
the Valuation Procedures as it deems appropriate. On a quarterly basis, the Board of Trustees receives reports on any valuation actions taken by the Valuation Committee or the Allspring Global Investments Pricing Committee which may include items for ratification.
Investment transactions, income and expenses
Investments in the affiliated Master Portfolio are recorded on a trade date basis. The Fund records daily its proportionate share of the affiliated Master Portfolio’s income, expenses and realized and unrealized gains or losses. The Fund also accrues its own expenses.
Distributions to shareholders
Distributions to shareholders from net investment income and any net realized gains are recorded on the ex-dividend date and paid at least annually. Such distributions are determined in accordance with income tax regulations and may differ from U.S. generally accepted accounting principles. Dividend sources are estimated at the time of declaration. The tax character of distributions is determined as of the Fund's fiscal year end. Therefore, a portion of the Fund's distributions made prior to the Fund’s fiscal year end may be categorized as a tax return of capital at year end.
Federal and other taxes
The Fund intends to continue to qualify as a regulated investment company by distributing substantially all of its investment company taxable income and any net realized capital gains (after reduction for capital loss carryforwards) sufficient to relieve it from all, or substantially all, federal income taxes. Accordingly, no provision for federal income taxes was required.
The Fund’s income and federal excise tax returns and all financial records supporting those returns for the prior three fiscal years are subject to examination by the federal and Delaware revenue authorities. Management has analyzed the Fund's tax positions taken on federal, state, and foreign tax returns for all open tax years and does not believe that there are any uncertain tax positions that require recognition of a tax liability.
As of November 30, 2021, the aggregate cost of all investments for federal income tax purposes was $299,389,271 and the unrealized gains (losses) consisted of:
| Gross unrealized gains | $219,517,475 |
| Gross unrealized losses | (749,454) |
| Net unrealized gains | $218,768,021 |
As of May 31, 2021, the Fund had a qualified late-year ordinary loss of $2,571,417 which was recognized on the first day of the current fiscal year.
Class allocations
The separate classes of shares offered by the Fund differ principally in applicable sales charges, distribution, shareholder servicing, and administration fees. Class specific expenses are charged directly to that share class. Investment income, common fund-level expenses, and realized and unrealized gains (losses) on investments are allocated daily to each class of shares based on the relative proportion of net assets of each class.
3. FAIR VALUATION MEASUREMENTS
At November 30, 2021, the Fund’s investment in the affiliated Master Portfolio was measured at fair value using the net asset value per share (or its equivalent) as a practical expedient. The investment objective and fair value of the affiliated Master Portfolio is as follows:
| Affiliated Master Portfolio | Investment objective | Fair value of affiliated
Master Portfolio |
| Allspring Emerging Growth Portfolio | Seek long-term capital appreciation | $518,157,292 |
The affiliated Master Portfolio does not have a redemption period notice, can be redeemed daily and does not have any unfunded commitments.
Allspring Emerging Growth Fund | 19
Notes to financial statements (unaudited)
4. TRANSACTIONS WITH AFFILIATES
Management fee
Allspring Funds Management, a wholly owned subsidiary of Allspring Global Investments Holdings, LLC, a holding company indirectly owned by certain private funds of GTCR LLC and Reverence Capital Partners, L.P., is the manager of the Fund and provides advisory and fund-level administrative services under an investment management agreement. Under the investment management agreement, Allspring Funds Management is responsible for, among other services, implementing the investment objectives and strategies of the Fund and providing fund-level administrative services in connection with the Fund’s operations. As long as the Fund continues to invest substantially all of its assets in a single affiliated Master Portfolio, the Fund pays Allspring Funds Management an investment management fee only for fund-level administrative services at the following annual rate based on the Fund’s average daily net assets:
| Average daily net assets | Management fee |
| First $5 billion | 0.050% |
| Next $5 billion | 0.040 |
| Over $10 billion | 0.030 |
For the six months ended November 30, 2021, the management fee was equivalent to an annual rate of 0.05% of the Fund’s average daily net assets.
Allspring Funds Management also serves as the adviser to the affiliated Master Portfolio and is entitled to receive a fee from the affiliated Master Portfolio for those services.
Administration fees
Under a class-level administration agreement, Allspring Funds Management provides class-level administrative services to the Fund, which includes paying fees and expenses for services provided by the transfer agent, sub-transfer agents, omnibus account servicers and record-keepers. As compensation for its services under the class-level administration agreement, Allspring Funds Management receives an annual fee which is calculated based on the average daily net assets of each class as follows:
| | Class-level
administration fee |
| Class A | 0.21% |
| Class C | 0.21 |
| Class R6 | 0.03 |
| Administrator Class | 0.13 |
| Institutional Class | 0.13 |
Waivers and/or expense reimbursements
Allspring Funds Management has contractually committed to waive and/or reimburse management and administration fees to the extent necessary to maintain certain net operating expense ratios for the Fund. When each class of the Fund has exceeded its expense cap, Allspring Funds Management will waive fees and/or reimburse expenses from fund-level expenses on a proportionate basis and then from class specific expenses. When only certain classes exceed their expense caps, waivers and/or reimbursements are applied against class specific expenses before fund-level expenses. Net expenses from the affiliated Master Portfolio are included in the expense caps. Allspring Funds Management has contractually committed through September 30, 2022 to waive fees and/or reimburse expenses to the extent necessary to cap expenses. Prior to or after the commitment expiration date, the caps may be increased or the commitment to maintain the caps may be terminated only with the approval of the Board of Trustees. The contractual expense caps are as follows:
20 | Allspring Emerging Growth Fund
Notes to financial statements (unaudited)
| | Expense ratio caps |
| Class A | 1.28% |
| Class C | 2.03 |
| Class R6 | 0.85 |
| Administrator Class | 1.20 |
| Institutional Class | 0.90 |
Distribution fee
The Trust has adopted a distribution plan for Class C shares of the Fund pursuant to Rule 12b-1 under the 1940 Act. A distribution fee is charged to Class C shares and paid to Allspring Funds Distributor, LLC ("Allspring Funds Distributor"), an affiliate of Allspring Funds Management, the principal underwriter, at an annual rate of 0.75% of the average daily net assets of Class C shares.
In addition, Allspring Funds Distributor is entitled to receive the front-end sales charge from the purchase of Class A shares and a contingent deferred sales charge on the redemption of certain Class A shares. Allspring Funds Distributor is also entitled to receive the contingent deferred sales charges from redemptions of Class C shares. For the six months ended November 30, 2021, Allspring Funds Distributor received $1,423 from the sale of Class A shares and $16 in contingent deferred sales charges from redemptions of Class C shares. No contingent deferred sales charges were incurred by Class A shares for the six months ended November 30, 2021.
Shareholder servicing fees
The Trust has entered into contracts with one or more shareholder servicing agents, whereby Class A, Class C, and Administrator Class of the Fund are charged a fee at an annual rate of 0.25% of the average daily net assets of each respective class. A portion of these total shareholder servicing fees were paid to affiliates, and to certain entities that were affiliates of the Fund until November 1, 2021.
5. INVESTMENT PORTFOLIO TRANSACTIONS
The Fund seeks to achieve its investment objective by investing substantially all of its assets in the affiliated Master Portfolio. Purchases and sales have been calculated by multiplying the Fund's ownership percentage of the affiliated Master Portfolio by the affiliated Master Portfolio's purchases and sales. Purchases and sales of investments, excluding U.S. government obligations (if any) and short-term securities, for the six months ended November 30, 2021 were $192,306,269 and $299,077,981, respectively.
6. BANK BORROWINGS
The Trust (excluding the money market funds), Allspring Master Trust and Allspring Variable Trust are parties to a $350,000,000 revolving credit agreement whereby the Fund is permitted to use bank borrowings for temporary or emergency purposes, such as to fund shareholder redemption requests. Interest under the credit agreement is charged to the Fund based on a borrowing rate equal to the higher of the Federal Funds rate in effect on that day plus 1.25% or the overnight bank funding rate in effect on that day plus 1.25%. In addition, an annual commitment fee equal to 0.25% of the unused balance is allocated to each participating fund.
For the six months ended November 30, 2021, there were no borrowings by the Fund under the agreement.
7. CONCENTRATION RISKS
Concentration risks result from exposure to a limited number of sectors. Through its investment in the affiliated Master Portfolio which may invest a substantial portion of its assets in any sector, the Fund may in turn be more affected by changes in that sector than a fund whose investments are not heavily weighted in any sector. As of the end of the period, the affiliated Master Portfolio concentrated its portfolio in investments related to the health care and information technology sectors.
8. INDEMNIFICATION
Under the Fund's organizational documents, the officers and Trustees have been granted certain indemnification rights against certain liabilities that may arise out of performance of their duties to the Fund. The Fund has entered into a separate agreement with each Trustee that converts indemnification rights currently existing under the Fund’s organizational documents into contractual rights that cannot be changed in the future without the consent of the Trustee. Additionally, in the
Allspring Emerging Growth Fund | 21
Notes to financial statements (unaudited)
normal course of business, the Fund may enter into contracts with service providers that contain a variety of indemnification clauses. The Fund’s maximum exposure under these arrangements is dependent on future claims that may be made against the Fund and, therefore, cannot be estimated.
9. REDEMPTIONS IN-KIND
During the six months ended November 30, 2021, the Fund redeemed assets through in-kind redemptions for shareholders in Institutional Class. The realized gains (losses) recognized by the Fund are reflected on the Statement of Operations and these redemption transactions are reflected on the Statement of Changes in Net Assets. The date of the redemption transaction, value of securities issued from the redemption, cash paid, realized gains (losses) and the percentage of the Fund redeemed by the shareholder was as follows:
| Date | Value of
securities issued | Cash
paid | Realized
gains (losses) | % of the
Fund |
| 8-27-2021 | $348,404,897 | $1,817,058 | $193,594,260 | 39.45% |
10. CORONAVIRUS (COVID-19) PANDEMIC
On March 11, 2020, the World Health Organization announced that it had made the assessment that coronavirus disease 2019 (“COVID-19”) is a pandemic. The impacts of COVID-19 are affecting the entire global economy, individual companies and investment products, the funds, and the market in general. There is significant uncertainty around the extent and duration of business disruptions related to COVID-19 and the impacts may last for an extended period of time. COVID-19 has led to significant uncertainty and volatility in the financial markets.
22 | Allspring Emerging Growth Fund
Portfolio of investments—November 30, 2021 (unaudited)
| | | | | Shares | Value |
| Common stocks: 98.26% | | | | | |
| Communication services: 1.58% | | | | | |
| Interactive media & services: 0.85% | | | | | |
| Eventbrite Incorporated Class A † | | | | 316,060 | $ 4,772,506 |
| Media: 0.73% | | | | | |
| Magnite Incorporated † | | | | 92,350 | 1,628,131 |
| TechTarget Incorporated † | | | | 25,900 | 2,502,717 |
| | | | | | 4,130,848 |
| Consumer discretionary: 15.78% | | | | | |
| Auto components: 2.08% | | | | | |
| Fox Factory Holding Corporation † | | | | 66,718 | 11,727,023 |
| Hotels, restaurants & leisure: 3.96% | | | | | |
| Bally's Corporation † | | | | 89,576 | 3,434,344 |
| F45 Training Holdings Incorporated †« | | | | 122,845 | 1,307,071 |
| Papa John's International Incorporated | | | | 84,665 | 10,322,357 |
| Wingstop Incorporated | | | | 45,378 | 7,287,707 |
| | | | | | 22,351,479 |
| Internet & direct marketing retail: 0.83% | | | | | |
| CarParts.com Incorporated † | | | | 136,120 | 1,683,804 |
| Fiverr International Limited † | | | | 21,156 | 2,996,113 |
| | | | | | 4,679,917 |
| Leisure products: 1.39% | | | | | |
| YETI Holdings Incorporated † | | | | 84,940 | 7,828,070 |
| Specialty retail: 4.02% | | | | | |
| Boot Barn Holdings Incorporated † | | | | 126,450 | 15,469,893 |
| Leslie's Incorporated † | | | | 199,514 | 4,181,813 |
| Lithia Motors Incorporated Class A | | | | 10,442 | 3,042,068 |
| | | | | | 22,693,774 |
| Textiles, apparel & luxury goods: 3.50% | | | | | |
| Crocs Incorporated † | | | | 93,575 | 15,348,172 |
| Deckers Outdoor Corporation † | | | | 10,903 | 4,420,076 |
| | | | | | 19,768,248 |
| Consumer staples: 3.35% | | | | | |
| Beverages: 0.98% | | | | | |
| Celsius Holdings Incorporated † | | | | 81,085 | 5,547,025 |
| Food & staples retailing: 1.10% | | | | | |
| The Chef's Warehouse Incorporated † | | | | 199,595 | 6,201,417 |
| Food products: 1.27% | | | | | |
| Freshpet Incorporated † | | | | 43,318 | 4,679,210 |
| Vital Farms Incorporated † | | | | 145,271 | 2,456,533 |
| | | | | | 7,135,743 |
The accompanying notes are an integral part of these financial statements.
Allspring Emerging Growth Portfolio | 23
Portfolio of investments—November 30, 2021 (unaudited)
| | | | | Shares | Value |
| Financials: 4.89% | | | | | |
| Capital markets: 1.86% | | | | | |
| Assetmark Financial Holdings † | | | | 20,544 | $ 520,996 |
| Bakkt Holdings Incorporated †« | | | | 57,995 | 905,302 |
| Stifel Financial Corporation | | | | 127,866 | 9,079,765 |
| | | | | | 10,506,063 |
| Insurance: 3.03% | | | | | |
| Goosehead Insurance Incorporated Class A | | | | 33,296 | 4,372,431 |
| Kinsale Capital Group Incorporated | | | | 61,193 | 12,728,144 |
| | | | | | 17,100,575 |
| Health care: 24.42% | | | | | |
| Biotechnology: 6.00% | | | | | |
| Arcutis Biotherapeutics Incorporated † | | | | 183,756 | 3,044,837 |
| Biohaven Pharmaceutical Holding Company † | | | | 23,416 | 2,628,212 |
| CareDx Incorporated † | | | | 72,578 | 3,131,015 |
| Cytokinetics Incorporated † | | | | 51,500 | 2,026,010 |
| Fate Therapeutics Incorporated † | | | | 57,367 | 3,155,759 |
| Halozyme Therapeutics Incorporated † | | | | 177,240 | 5,827,651 |
| Natera Incorporated † | | | | 51,868 | 4,743,847 |
| Vericel Corporation † | | | | 250,133 | 9,307,449 |
| | | | | | 33,864,780 |
| Health care equipment & supplies: 9.58% | | | | | |
| Axonics Modulation Technologies Incorporated † | | | | 140,350 | 7,636,444 |
| Figs Incorporated Class A †« | | | | 118,103 | 3,925,744 |
| Nyxoah SA † | | | | 39,070 | 820,470 |
| Orthopediatrics Corporation † | | | | 104,481 | 5,820,637 |
| Outset Medical Incorporated † | | | | 70,511 | 3,342,221 |
| Pulmonx Corporation † | | | | 92,744 | 2,995,631 |
| Shockwave Medical Incorporated † | | | | 88,925 | 16,027,842 |
| SI-BONE Incorporated † | | | | 222,393 | 4,281,065 |
| Silk Road Medical Incorporated † | | | | 39,824 | 1,616,058 |
| Tandem Diabetes Care Incorporated † | | | | 33,510 | 4,306,705 |
| Vapotherm Incorporated † | | | | 149,077 | 3,279,694 |
| | | | | | 54,052,511 |
| Health care providers & services: 1.76% | | | | | |
| Accolade Incorporated † | | | | 76,350 | 1,959,905 |
| Castle Biosciences Incorporated † | | | | 135,756 | 5,610,795 |
| Privia Health Group Incorporated † | | | | 101,327 | 2,340,654 |
| | | | | | 9,911,354 |
| Health care technology: 3.38% | | | | | |
| CVRx Incorporated † | | | | 74,188 | 859,097 |
| Inspire Medical Systems Incorporated † | | | | 41,599 | 9,287,809 |
| Phreesia Incorporated † | | | | 154,098 | 8,888,373 |
| | | | | | 19,035,279 |
| Life sciences tools & services: 3.70% | | | | | |
| Akoya Biosciences Incorporated † | | | | 142,046 | 1,843,757 |
| Alpha Teknova Incorporated † | | | | 59,668 | 1,334,176 |
The accompanying notes are an integral part of these financial statements.
24 | Allspring Emerging Growth Portfolio
Portfolio of investments—November 30, 2021 (unaudited)
| | | | | Shares | Value |
| Life sciences tools & services (continued) | | | | | |
| Codexis Incorporated † | | | | 411,927 | $ 14,297,986 |
| Neogenomics Incorporated † | | | | 99,744 | 3,417,229 |
| | | | | | 20,893,148 |
| Industrials: 14.31% | | | | | |
| Building products: 2.10% | | | | | |
| The AZEK Company Incorporated † | | | | 74,597 | 2,925,694 |
| Zurn Water Solutions Corporation | | | | 254,384 | 8,916,159 |
| | | | | | 11,841,853 |
| Commercial services & supplies: 2.68% | | | | | |
| ACV Auctions Incorporated Class A † | | | | 198,305 | 4,200,100 |
| Casella Waste Systems Incorporated Class A † | | | | 128,941 | 10,931,618 |
| | | | | | 15,131,718 |
| Construction & engineering: 0.66% | | | | | |
| Construction Partners Incorporated Class A † | | | | 107,285 | 3,705,624 |
| Electrical equipment: 1.59% | | | | | |
| Regal-Beloit Corporation | | | | 56,717 | 8,966,958 |
| Professional services: 3.51% | | | | | |
| ASGN Incorporated † | | | | 161,901 | 19,700,110 |
| Legalzoom.com Incorporated †« | | | | 7,111 | 128,069 |
| | | | | | 19,828,179 |
| Road & rail: 1.95% | | | | | |
| Saia Incorporated † | | | | 33,211 | 10,998,819 |
| Trading companies & distributors: 1.82% | | | | | |
| SiteOne Landscape Supply Incorporated † | | | | 42,727 | 10,269,862 |
| Information technology: 33.22% | | | | | |
| Electronic equipment, instruments & components: 2.72% | | | | | |
| Novanta Incorporated † | | | | 81,002 | 13,077,773 |
| Par Technology Corporation †« | | | | 43,520 | 2,279,142 |
| | | | | | 15,356,915 |
| IT services: 4.78% | | | | | |
| BigCommerce Holdings Incorporated Series 1 † | | | | 148,710 | 6,732,102 |
| DigitalOcean Holdings Incorporated † | | | | 53,950 | 5,438,700 |
| Endava plc ADR † | | | | 57,514 | 9,003,242 |
| EVO Payments Incorporated Class A † | | | | 174,617 | 3,717,596 |
| Paymentus Holdings Incorporated A †« | | | | 69,730 | 2,061,219 |
| | | | | | 26,952,859 |
| Semiconductors & semiconductor equipment: 5.73% | | | | | |
| Allegro MicroSystems Incorporated † | | | | 221,212 | 6,908,451 |
| Diodes Incorporated † | | | | 92,586 | 9,846,521 |
| Semtech Corporation † | | | | 116,756 | 10,002,487 |
| Silicon Laboratories Incorporated † | | | | 16,274 | 3,194,098 |
| Skywater Technology Incorporated †« | | | | 128,398 | 2,402,327 |
| | | | | | 32,353,884 |
The accompanying notes are an integral part of these financial statements.
Allspring Emerging Growth Portfolio | 25
Portfolio of investments—November 30, 2021 (unaudited)
| | | | | Shares | Value |
| Software: 19.99% | | | | | |
| 8x8 Incorporated † | | | | 161,185 | $ 3,473,537 |
| Alkami Technology Incorporated † | | | | 175,622 | 5,038,595 |
| CyberArk Software Limited † | | | | 58,860 | 10,173,951 |
| Domo Incorporated Class B † | | | | 58,500 | 4,232,475 |
| Everbridge Incorporated † | | | | 32,551 | 3,691,934 |
| Jamf Holding Corporation † | | | | 176,618 | 5,692,398 |
| Olo Incorporated Class A † | | | | 101,349 | 2,489,131 |
| Paycor HCM Incorporated † | | | | 183,895 | 5,413,869 |
| Q2 Holdings Incorporated † | | | | 86,705 | 6,962,412 |
| Rapid7 Incorporated † | | | | 150,375 | 18,655,523 |
| SimilarWeb Limited †« | | | | 94,700 | 1,643,992 |
| Sprout Social Incorporated Class A † | | | | 133,196 | 14,875,329 |
| SPS Commerce Incorporated † | | | | 115,196 | 16,241,484 |
| Workiva Incorporated † | | | | 101,720 | 14,186,888 |
| | | | | | 112,771,518 |
| Utilities: 0.71% | | | | | |
| Independent power & renewable electricity producers: 0.71% | | | | | |
| Sunnova Energy International Incorporated † | | | | 108,872 | 4,024,998 |
| Total Common stocks (Cost $311,142,999) | | | | | 554,402,947 |
| | | | | | |
| Investment companies: 1.21% | | | | | |
| Exchange-traded funds: 1.21% | | | | | |
| iShares Russell 2000 Growth ETF « | | | | 23,400 | 6,834,906 |
| Total Investment companies (Cost $7,477,816) | | | | | 6,834,906 |
| | | Yield | | | |
| Short-term investments: 3.94% | | | | | |
| Investment companies: 3.94% | | | | | |
| Allspring Government Money Market Fund Select Class ♠∞ | | 0.03% | | 3,624,668 | 3,624,668 |
| Securities Lending Cash Investments LLC ♠∩∞ | | 0.04 | | 18,623,216 | 18,623,216 |
| Total Short-term investments (Cost $22,247,884) | | | | | 22,247,884 |
| Total investments in securities (Cost $340,868,699) | 103.41% | | | | 583,485,737 |
| Other assets and liabilities, net | (3.41) | | | | (19,238,893) |
| Total net assets | 100.00% | | | | $564,246,844 |
| † | Non-income-earning security |
| « | All or a portion of this security is on loan. |
| ♠ | The issuer of the security is an affiliated person of the Portfolio as defined in the Investment Company Act of 1940. |
| ∩ | The investment is a non-registered investment company purchased with cash collateral received from securities on loan. |
| ∞ | The rate represents the 7-day annualized yield at period end. |
| Abbreviations: |
| ADR | American depositary receipt |
The accompanying notes are an integral part of these financial statements.
26 | Allspring Emerging Growth Portfolio
Portfolio of investments—November 30, 2021 (unaudited)
Investments in affiliates
An affiliated investment is an investment in which the Portfolio owns at least 5% of the outstanding voting shares of the issuer or as a result of other relationships, such as the Portfolio and the issuer having the same adviser or investment manager. Transactions with issuers that were either affiliates of the Portfolio at the beginning of the period or the end of the period were as follows:
| | Value,
beginning of
period | Purchases | Sales
proceeds | Net
realized
gains
(losses) | | Net
change in
unrealized
gains
(losses) | | Value,
end of
period | Shares,
end
of period | Income
from
affiliated
securities |
| Short-term investments | | | | | | | | | |
| Allspring Government Money Market Fund Select Class | $9,477,635 | $ 89,180,624 | $ (95,033,591) | $0 | | $0 | | $ 3,624,668 | 3,624,668 | $ 1,093 |
| Securities Lending Cash Investments LLC | 3,883,200 | 119,094,272 | (104,354,256) | 0 | | 0 | | 18,623,216 | 18,623,216 | 1,810 # |
| | | | | $0 | | $0 | | $22,247,884 | | $2,903 |
| # | Amount shown represents income before fees and rebates. |
The accompanying notes are an integral part of these financial statements.
Allspring Emerging Growth Portfolio | 27
Statement of assets and liabilities—November 30, 2021 (unaudited)
| | |
| Assets | |
Investments in unaffiliated securities (including $18,183,893 of securities loaned), at value (cost $318,620,815)
| $ 561,237,853 |
Investments in affiliated securities, at value (cost $22,247,884)
| 22,247,884 |
Receivable for securities lending income, net
| 122,329 |
Receivable for dividends
| 41,491 |
Prepaid expenses and other assets
| 10,929 |
Total assets
| 583,660,486 |
| Liabilities | |
Payable upon receipt of securities loaned
| 18,623,216 |
Advisory fee payable
| 402,497 |
Payable for investments purchased
| 367,610 |
Accrued expenses and other liabilities
| 20,319 |
Total liabilities
| 19,413,642 |
Total net assets
| $564,246,844 |
The accompanying notes are an integral part of these financial statements.
28 | Allspring Emerging Growth Portfolio
Statement of operations—six months ended November 30, 2021 (unaudited)
| | |
| Investment income | |
Dividends
| $ 321,726 |
Securities lending income (including from affiliate), net
| 188,228 |
Income from affiliated securities
| 1,093 |
Total investment income
| 511,047 |
| Expenses | |
Advisory fee
| 3,092,830 |
Custody and accounting fees
| 33,132 |
Professional fees
| 25,304 |
Interest holder report expenses
| 4,748 |
Trustees’ fees and expenses
| 9,662 |
Other fees and expenses
| 11,543 |
Total expenses
| 3,177,219 |
Net investment loss
| (2,666,172) |
| Realized and unrealized gains (losses) on investments | |
Net realized gains on investments
| 271,451,909 |
Net change in unrealized gains (losses) on investments
| (192,758,630) |
Net realized and unrealized gains (losses) on investments
| 78,693,279 |
Net increase in net assets resulting from operations
| $ 76,027,107 |
The accompanying notes are an integral part of these financial statements.
Allspring Emerging Growth Portfolio | 29
Statement of changes in net assets
| | | |
| | Six months ended
November 30, 2021
(unaudited) | Year ended
May 31, 2021 |
| Operations | | |
Net investment loss
| $ (2,666,172) | $ (5,761,179) |
Net realized gains on investments
| 271,451,909 | 181,278,904 |
Net change in unrealized gains (losses) on investments
| (192,758,630) | 176,777,300 |
Net increase in net assets resulting from operations
| 76,027,107 | 352,295,025 |
| Capital transactions | | |
| Transactions in investors’ beneficial interests | | |
Contributions
| 27,581,657 | 97,803,647 |
Withdrawals
| (496,884,083) | (215,997,204) |
Net decrease in net assets resulting from capital transactions
| (469,302,426) | (118,193,557) |
Total increase (decrease) in net assets
| (393,275,319) | 234,101,468 |
| Net assets | | |
Beginning of period
| 957,522,163 | 723,420,695 |
End of period
| $ 564,246,844 | $ 957,522,163 |
The accompanying notes are an integral part of these financial statements.
30 | Allspring Emerging Growth Portfolio
| | | Year ended May 31 |
| | Six months ended
November 30, 2021
(unaudited) | 2021 | 2020 | 2019 | 2018 | 2017 |
Total return1
| 6.47% | 53.94% | 15.49% | (0.28)% | 33.60% | 23.97% |
| Ratios to average net assets (annualized) | | | | | | |
Gross expenses
| 0.81% | 0.81% | 0.81% | 0.81% | 0.81% | 0.81% |
Net expenses
| 0.81% | 0.81% | 0.81% | 0.81% | 0.81% | 0.81% |
Net investment loss
| (0.68)% | (0.66)% | (0.62)% | (0.57)% | (0.47)% | (0.15)% |
| Supplemental data | | | | | | |
Portfolio turnover rate
| 28% | 48% | 55% | 71% | 47% | 115% |
| 1 | Returns for periods of less than one year are not annualized. |
The accompanying notes are an integral part of these financial statements.
Allspring Emerging Growth Portfolio | 31
Notes to financial statements (unaudited)
1. ORGANIZATION
Allspring Master Trust (the "Trust"), a Delaware statutory trust organized on March 10, 1999, is an open-end management investment company registered under the Investment Company Act of 1940, as amended (the "1940 Act"). As an investment company, the Trust follows the accounting and reporting guidance in Financial Accounting Standards Board ("FASB") Accounting Standards Codification Topic 946, Financial Services – Investment Companies. These financial statements report on the Allspring Emerging Growth Portfolio (the "Portfolio") which is a diversified series of the Trust.
Interests in the Portfolio are available solely through private placement transactions that do not involve any "public offering" within the meaning of Section 4(a)(2) of the Securities Act of 1933.
On February 23, 2021, Wells Fargo & Company entered into a definitive agreement to sell Wells Fargo Asset Management ("WFAM") to GTCR LLC and Reverence Capital Partners, L.P. WFAM was the trade name used by the asset management businesses of Wells Fargo & Company and included Wells Fargo Funds Management, LLC, Wells Capital Management, LLC, Wells Fargo Asset Management (International) Limited and Wells Fargo Funds Distributor, LLC. Effective on November 1, 2021, the sale transaction of WFAM by Wells Fargo & Company to GTCR LLC and Reverence Capital Partners, L.P. was closed. In connection with the closing of the transaction, WFAM became known as Allspring Global Investments (“Allspring”) and various entities that provide services to the Portfolio changed their names to "Allspring", including Allspring Funds Management, LLC (formerly Wells Fargo Funds Management, LLC), the adviser to the Portfolio, Allspring Global Investments, Inc. (formerly Wells Capital Management, LLC) and Allspring Global Investments (UK) Limited (formerly Wells Fargo Asset Management (International) Limited), both registered investment advisers providing subadvisory services to certain funds, and Allspring Funds Distributor, LLC (formerly Wells Fargo Funds Distributor, LLC).
Consummation of the transaction resulted in the automatic termination of the Portfolio’s advisory agreement and subadvisory agreement. The Portfolio’s Board of Trustees approved a new advisory agreement and subadvisory agreement which were approved by the Portfolio's interest holders on August 16, 2021. The new agreements became effective on November 1, 2021.
Effective December 6, 2021, "Wells Fargo" was removed from the Portfolio's name and replaced it with "Allspring".
2. SIGNIFICANT ACCOUNTING POLICIES
The following significant accounting policies, which are consistently followed in the preparation of the financial statements of the Portfolio, are in conformity with U.S. generally accepted accounting principles which require management to make estimates and assumptions that affect the reported amounts of assets and liabilities, disclosure of contingent assets and liabilities at the date of the financial statements, and the reported amounts of income and expenses during the reporting period. Actual results could differ from those estimates.
Securities valuation
All investments are valued each business day as of the close of regular trading on the New York Stock Exchange (generally 4 p.m. Eastern Time), although the Portfolio may deviate from this calculation time under unusual or unexpected circumstances.
Equity securities that are listed on a foreign or domestic exchange or market are valued at the official closing price or, if none, the last sales price. If no sale occurs on the principal exchange or market that day, a fair value price will be determined in accordance with the Portfolio’s Valuation Procedures.
Investments in registered open-end investment companies are valued at net asset value. Interests in non-registered investment companies that are redeemable at net asset value are fair valued normally at net asset value.
Investments which are not valued using any of the methods discussed above are valued at their fair value, as determined in good faith by the Board of Trustees. The Board of Trustees has established a Valuation Committee comprised of the Trustees and has delegated to it the authority to take any actions regarding the valuation of portfolio securities that the Valuation Committee deems necessary or appropriate, including determining the fair value of portfolio securities, unless the determination has been delegated to the Allspring Global Investments Pricing Committee at Allspring Funds Management, LLC ("Allspring Funds Management"). The Board of Trustees retains the authority to make or ratify any valuation decisions or approve any changes to the Valuation Procedures as it deems appropriate. On a quarterly basis, the Board of Trustees receives reports on any valuation actions taken by the Valuation Committee or the Allspring Global Investments Pricing Committee which may include items for ratification.
Securities lending
The Portfolio may lend its securities from time to time in order to earn additional income in the form of fees or interest on securities received as collateral or the investment of any cash received as collateral. When securities are on loan, the Portfolio
32 | Allspring Emerging Growth Portfolio
Notes to financial statements (unaudited)
receives interest or dividends on those securities. Cash collateral received in connection with its securities lending transactions is invested in Securities Lending Cash Investments, LLC (the "Securities Lending Fund"), an affiliated non-registered investment company. Investments in Securities Lending Fund are valued at the evaluated bid price provided by an independent pricing service. Income earned from investment in the Securities Lending Fund, if any, is included in securities lending income (including from affiliate) (net of fees and rebates) on the Statement of Operations.
In a securities lending transaction, the net asset value of the Portfolio is affected by an increase or decrease in the value of the securities loaned and by an increase or decrease in the value of the instrument in which collateral is invested. The amount of securities lending activity undertaken by the Portfolio fluctuates from time to time. The Portfolio has the right under the lending agreement to recover the securities from the borrower on demand. In the event of default or bankruptcy by the borrower, the Portfolio may be prevented from recovering the loaned securities or gaining access to the collateral or may experience delays or costs in doing so. In such an event, the terms of the agreement allow the unaffiliated securities lending agent to use the collateral to purchase replacement securities on behalf of the Portfolio or pay the Portfolio the market value of the loaned securities. The Portfolio bears the risk of loss with respect to depreciation of its investment of the cash collateral.
Security transactions and income recognition
Securities transactions are recorded on a trade date basis. Realized gains or losses are recorded on the basis of identified cost.
Dividend income is recognized on the ex-dividend date.
Federal and other taxes
The Portfolio is not required to pay federal income taxes on its net investment income and net capital gains as it is treated as a partnership for federal income tax purposes. All income, gains and losses of the Portfolio are deemed to have been “passed through” to the interest holders in proportion to their holdings of the Portfolio regardless of whether income and gains have been distributed by the Portfolio.
The Portfolio’s income tax returns and all financial records supporting those returns for the prior three fiscal years are subject to examination by the federal revenue authority. Management has analyzed the Portfolio’s tax positions taken on federal, state, and foreign tax returns for all open tax years and does not believe that there are any uncertain tax positions that require recognition of a tax liability.
As of November 30, 2021, the aggregate cost of all investments for federal income tax purposes was $337,347,541 and the unrealized gains (losses) consisted of:
| Gross unrealized gains | $269,154,469 |
| Gross unrealized losses | (23,016,273) |
| Net unrealized gains | $246,138,196 |
3. FAIR VALUATION MEASUREMENTS
Fair value measurements of investments are determined within a framework that has established a fair value hierarchy based upon the various data inputs utilized in determining the value of the Portfolio’s investments. The three-level hierarchy gives the highest priority to unadjusted quoted prices in active markets for identical assets or liabilities (Level 1) and the lowest priority to unobservable inputs (Level 3). The Portfolio’s investments are classified within the fair value hierarchy based on the lowest level of input that is significant to the fair value measurement. The inputs are summarized into three broad levels as follows:
| ■ | Level 1 – quoted prices in active markets for identical securities |
| ■ | Level 2 – other significant observable inputs (including quoted prices for similar securities, interest rates, prepayment speeds, credit risk, etc.) |
| ■ | Level 3 – significant unobservable inputs (including the Portfolio’s own assumptions in determining the fair value of investments) |
The inputs or methodologies used for valuing investments in securities are not necessarily an indication of the risk associated with investing in those securities.
Allspring Emerging Growth Portfolio | 33
Notes to financial statements (unaudited)
The following is a summary of the inputs used in valuing the Portfolio’s assets and liabilities as of November 30, 2021:
| | Quoted prices
(Level 1) | Other significant
observable inputs
(Level 2) | Significant
unobservable inputs
(Level 3) | Total |
| Assets | | | | |
| Investments in: | | | | |
| Common stocks | | | | |
| Communication services | $ 8,903,354 | $0 | $0 | $ 8,903,354 |
| Consumer discretionary | 89,048,511 | 0 | 0 | 89,048,511 |
| Consumer staples | 18,884,185 | 0 | 0 | 18,884,185 |
| Financials | 27,606,638 | 0 | 0 | 27,606,638 |
| Health care | 137,757,072 | 0 | 0 | 137,757,072 |
| Industrials | 80,743,013 | 0 | 0 | 80,743,013 |
| Information technology | 187,435,176 | 0 | 0 | 187,435,176 |
| Utilities | 4,024,998 | 0 | 0 | 4,024,998 |
| Investment companies | 6,834,906 | 0 | 0 | 6,834,906 |
| Short-term investments | | | | |
| Investment companies | 22,247,884 | 0 | 0 | 22,247,884 |
| Total assets | $583,485,737 | $0 | $0 | $583,485,737 |
Additional sector, industry or geographic detail, if any, is included in the Portfolio of Investments.
For the six months ended November 30, 2021, the Portfolio did not have any transfers into/out of Level 3.
4. TRANSACTIONS WITH AFFILIATES
Advisory fee
The Trust has entered into an advisory contract with Allspring Funds Management, a wholly owned subsidiary of Allspring Global Investments Holdings, LLC, a holding company indirectly owned by certain private funds of GTCR LLC and Reverence Capital Partners, L.P. The adviser is responsible for implementing investment policies and guidelines and for supervising the subadviser, who is responsible for day-to-day portfolio management of the Portfolio. Pursuant to the contract, Allspring Funds Management is entitled to receive an advisory fee at the following annual rate based on the Portfolio’s average daily net assets:
| Average daily net assets | Advisory fee |
| First $500 million | 0.800% |
| Next $500 million | 0.775 |
| Next $1 billion | 0.750 |
| Next $1 billion | 0.725 |
| Next $1 billion | 0.700 |
| Over $4 billion | 0.680 |
For the six months ended November 30, 2021, the advisory fee was equivalent to an annual rate of 0.79% of the Portfolio’s average daily net assets.
Allspring Funds Management has retained the services of a subadviser to provide daily portfolio management to the Portfolio. The fee for subadvisory services is borne by Allspring Funds Management. Allspring Global Investments, LLC ("Allspring Investments"), an affiliate of Allspring Funds Management and a wholly owned subsidiary of Allspring Global Investments Holdings, LLC, is the subadviser to the Portfolio and is entitled to receive a fee from Allspring Funds Management at an annual rate starting at 0.55% and declining to 0.40% as the average daily net assets of the Portfolio increase.
Interfund transactions
The Portfolio may purchase or sell portfolio investment securities to certain affiliates pursuant to Rule 17a-7 under the 1940 Act and under procedures adopted by the Board of Trustees. The procedures have been designed to ensure that these interfund transactions, which do not incur broker commissions, are effected at current market prices.
34 | Allspring Emerging Growth Portfolio
Notes to financial statements (unaudited)
5. INVESTMENT PORTFOLIO TRANSACTIONS
Purchases and sales of investments, excluding U.S. government obligations (if any) and short-term securities, for the six months ended November 30, 2021 were $209,411,711 and $325,680,656, respectively.
6. SECURITIES LENDING TRANSACTIONS
The Portfolio lends its securities through an unaffiliated securities lending agent and receives collateral in the form of cash or securities with a value at least equal to the value of the securities on loan. The value of the loaned securities is determined at the close of each business day and any increases or decreases in the required collateral are exchanged between the Portfolio and the counterparty on the next business day. Cash collateral received is invested in the Securities Lending Fund which seeks to provide a positive return compared to the daily Federal Funds Open Rate by investing in high-quality, U.S. dollar-denominated short-term money market instruments and is exempt from registration under Section 3(c)(7) of the 1940 Act. Securities Lending Fund is managed by Allspring Funds Management and is subadvised by Allspring Investments. Allspring Funds Management receives an advisory fee starting at 0.05% and declining to 0.01% as the average daily net assets of the Securities Lending Fund increase. All of the fees received by Allspring Funds Management are paid to Allspring Investments for its services as subadviser.
In the event of counterparty default or the failure of a borrower to return a loaned security, the Portfolio has the right to use the collateral to offset any losses incurred. As of November 30, 2021, the Portfolio had securities lending transactions with the following counterparties which are subject to offset:
| Counterparty | Value of
securities on
loan | Collateral
received1 | Net amount |
| Bank of America Securities Incorporated | $ 438,346 | $ (438,346) | $0 |
| Barclays Capital Incorporated | 258,024 | (258,024) | 0 |
| BNP Paribas Securities Corporation | 2,228,094 | (2,228,094) | 0 |
| Citigroup Global Markets Incorporated | 327,908 | (327,908) | 0 |
| JPMorgan Securities LLC | 7,310,570 | (7,310,570) | 0 |
| Morgan Stanley & Company LLC | 7,494,991 | (7,494,991) | 0 |
| National Financial Services LLC | 125,960 | (125,960) | 0 |
1 Collateral received within this table is limited to the collateral for the net transaction with the counterparty.
7. BANK BORROWINGS
The Trust, along with Allspring Variable Trust and Allspring Funds Trust (excluding the money market funds), are parties to a $350,000,000 revolving credit agreement whereby the Portfolio is permitted to use bank borrowings for temporary or emergency purposes, such as to fund interest holders withdrawal requests. Interest under the credit agreement is charged to the Portfolio based on a borrowing rate equal to the higher of the Federal Funds rate in effect on that day plus 1.25% or the overnight bank funding rate in effect on that day plus 1.25%. In addition, an annual commitment fee equal to 0.25% of the unused balance is allocated to each participating fund.
For the six months ended November 30, 2021, there were no borrowings by the Portfolio under the agreement.
8. CONCENTRATION RISKS
As of the end of the period, the Portfolio concentrated its portfolio of investments in the health care and information technology sectors. A fund that invests a substantial portion of its assets in any sector may be more affected by changes in that sector than would be a fund whose investments are not heavily weighted in any sector.
9. INDEMNIFICATION
Under the Portfolio's organizational documents, the officers and Trustees have been granted certain indemnification rights against certain liabilities that may arise out of performance of their duties to the Portfolio. The Portfolio has entered into a separate agreement with each Trustee that converts indemnification rights currently existing under the Portfolio’s organizational documents into contractual rights that cannot be changed in the future without the consent of the Trustee. Additionally, in the normal course of business, the Portfolio may enter into contracts with service providers that contain a
Allspring Emerging Growth Portfolio | 35
Notes to financial statements (unaudited)
variety of indemnification clauses. The Portfolio’s maximum exposure under these arrangements is dependent on future claims that may be made against the Portfolio and, therefore, cannot be estimated.
10. CORONAVIRUS (COVID-19) PANDEMIC
On March 11, 2020, the World Health Organization announced that it had made the assessment that coronavirus disease 2019 (“COVID-19”) is a pandemic. The impacts of COVID-19 are affecting the entire global economy, individual companies and investment products, the funds, and the market in general. There is significant uncertainty around the extent and duration of business disruptions related to COVID-19 and the impacts may last for an extended period of time. COVID-19 has led to significant uncertainty and volatility in the financial markets.
36 | Allspring Emerging Growth Portfolio
Other information (unaudited)
PROXY VOTING INFORMATION
A description of the policies and procedures used to determine how to vote proxies relating to portfolio securities is available without charge, upon request, by calling 1-800-222-8222, visiting our website at allspringglobal.com, or visiting the SEC website at sec.gov. Information regarding how the proxies related to portfolio securities were voted during the most recent 12-month period ended June 30 is available on the website at allspringglobal.com or by visiting the SEC website at sec.gov.
SPECIAL MEETING OF SHAREHOLDERS
On August 16, 2021, a Special Meeting of Shareholders for Allspring Emerging Growth Fund was held to consider the following proposals. The results of the proposals are indicated below.
Proposal 1 – To consider and approve a new investment management agreement with Wells Fargo Funds Management, LLC*.
| Shares voted “For” | | 29,098,947 |
| Shares voted “Against” | | 399,064 |
| Shares voted “Abstain” | | 634,441 |
Proposal 2 – To consider and approve a new advisory agreement with Wells Fargo Funds Management, LLC* for Allspring Emerging Growth Portfolio in which the Fund invests substantially all of its assets.
| Shares voted “For” | | 29,089,406 |
| Shares voted “Against” | | 387,365 |
| Shares voted “Abstain” | | 655,681 |
Proposal 3 – To consider and approve a new subadvisory agreement with Wells Capital Management, LLC** for Allspring Emerging Growth Portfolio.
| Shares voted “For” | | 29,046,393 |
| Shares voted “Against” | | 447,364 |
| Shares voted “Abstain” | | 638,695 |
* Effective November 1, 2021, known as Allspring Funds Management, LLC.
** Effective November 1, 2021, known as Allspring Global Investments, LLC.
QUARTERLY PORTFOLIO HOLDINGS INFORMATION
The Fund and Portfolio file their complete schedule of portfolio holdings with the SEC for the first and third quarters of each fiscal year as an exhibit to their reports on Form N-PORT. Shareholders and Interest holders may view the filed Form N-PORT by visiting the SEC website at sec.gov.
Allspring Emerging Growth Fund | 37
Other information (unaudited)
BOARD OF TRUSTEES AND OFFICERS
Each of the Trustees and Officers listed in the table below acts in identical capacities for each fund in the Allspring family of funds, which consists of 139 mutual funds comprising the Allspring Funds Trust, Allspring Variable Trust, Allspring Master Trust and four closed-end funds (collectively the “Fund Complex”). This table should be read in conjunction with the Prospectus and the Statement of Additional Information1. The mailing address of each Trustee and Officer is 525 Market Street, 12th Floor, San Francisco, CA 94105. Each Trustee and Officer serves an indefinite term, however, each Trustee serves such term until reaching the mandatory retirement age established by the Trustees.
Independent Trustees
Name and
year of birth | Position held and
length of service* | Principal occupations during past five years or longer | Current other
public company or
investment
company
directorships |
William R. Ebsworth
(Born 1957) | Trustee,
since 2015 | Retired. From 1984 to 2013, equities analyst, portfolio manager, research director and chief investment officer at Fidelity Management and Research Company in Boston, Tokyo, and Hong Kong, and retired in 2013 as Chief Investment Officer of Fidelity Strategic Advisers, Inc. where he led a team of investment professionals managing client assets. Prior thereto, Board member of Hong Kong Securities Clearing Co., Hong Kong Options Clearing Corp., the Thailand International Fund, Ltd., Fidelity Investments Life Insurance Company, and Empire Fidelity Investments Life Insurance Company. Audit Committee Chair and Investment Committee Chair of the Vincent Memorial Hospital Endowment (non-profit organization). Mr. Ebsworth is a CFA® charterholder. | N/A |
Jane A. Freeman
(Born 1953) | Trustee,
since 2015;
Chair Liaison,
since 2018 | Retired. From 2012 to 2014 and 1999 to 2008, Chief Financial Officer of Scientific Learning Corporation. From 2008 to 2012, Ms. Freeman provided consulting services related to strategic business projects. Prior to 1999, Portfolio Manager at Rockefeller & Co. and Scudder, Stevens & Clark. Board member of the Harding Loevner Funds from 1996 to 2014, serving as both Lead Independent Director and chair of the Audit Committee. Board member of the Russell Exchange Traded Funds Trust from 2011 to 2012 and the chair of the Audit Committee. Ms. Freeman is also an inactive Chartered Financial Analyst. | N/A |
Isaiah Harris, Jr.
(Born 1952) | Trustee,
since 2009; Audit
Committee
Chair,
since 2019 | Retired. Chairman of the Board of CIGNA Corporation from 2009 to 2021, and Director from 2005 to 2008. From 2003 to 2011, Director of Deluxe Corporation. Prior thereto, President and CEO of BellSouth Advertising and Publishing Corp. from 2005 to 2007, President and CEO of BellSouth Enterprises from 2004 to 2005 and President of BellSouth Consumer Services from 2000 to 2003. Emeritus member of the Iowa State University Foundation Board of Governors. Emeritus Member of the Advisory Board of Iowa State University School of Business. Advisory Board Member, Palm Harbor Academy (private school). Advisory Board Member, Fellowship of Christian Athletes. Mr. Harris is a certified public accountant (inactive status). | N/A |
Judith M. Johnson**
(Born 1949) | Trustee,
since 2008 | Retired. Prior thereto, Chief Executive Officer and Chief Investment Officer of Minneapolis Employees Retirement Fund from 1996 to 2008. Ms. Johnson is an attorney, certified public accountant and a certified managerial accountant. | N/A |
David F. Larcker
(Born 1950) | Trustee,
since 2009 | James Irvin Miller Professor of Accounting at the Graduate School of Business (Emeritus), Stanford University, Director of the Corporate Governance Research Initiative and Senior Faculty of The Rock Center for Corporate Governance since 2006. From 2005 to 2008, Professor of Accounting at the Graduate School of Business, Stanford University. Prior thereto, Ernst & Young Professor of Accounting at The Wharton School, University of Pennsylvania from 1985 to 2005. | N/A |
38 | Allspring Emerging Growth Fund
Other information (unaudited)
Name and
year of birth | Position held and
length of service* | Principal occupations during past five years or longer | Current other
public company or
investment
company
directorships |
Olivia S. Mitchell
(Born 1953) | Trustee,
since 2006;
Nominating and
Governance
Committee Chair,
since 2018 | International Foundation of Employee Benefit Plans Professor since 1993, Wharton School of the University of Pennsylvania. Director of Wharton’s Pension Research Council and Boettner Center on Pensions & Retirement Research, and Research Associate at the National Bureau of Economic Research. Previously taught at Cornell University from 1978 to 1993. | N/A |
Timothy J. Penny
(Born 1951) | Trustee,
since 1996;
Chair,
since 2018 | President and Chief Executive Officer of Southern Minnesota Initiative Foundation, a non-profit organization, since 2007. Member of the Board of Trustees of NorthStar Education Finance, Inc., a non-profit organization, since 2007. | N/A |
James G. Polisson
(Born 1959) | Trustee,
since 2018 | Retired. Chief Marketing Officer, Source (ETF) UK Services, Ltd, from 2015 to 2017. From 2012 to 2015, Principal of The Polisson Group, LLC, a management consulting, corporate advisory and principal investing company. Chief Executive Officer and Managing Director at Russell Investments, Global Exchange Traded Funds from 2010 to 2012. Managing Director of Barclays Global Investors from 1998 to 2010 and Global Chief Marketing Officer for iShares and Barclays Global Investors from 2000 to 2010. Trustee of the San Francisco Mechanics’ Institute, a non-profit organization, from 2013 to 2015. Board member of the Russell Exchange Traded Fund Trust from 2011 to 2012. Director of Barclays Global Investors Holdings Deutschland GmbH from 2006 to 2009. Mr. Polisson is an attorney and has a retired status with the Massachusetts and District of Columbia Bar Associations. | N/A |
Pamela Wheelock
(Born 1959) | Trustee,
since January
2020; previously
Trustee from
January 2018 to
July 2019 | Board member of the Destination Medical Center Economic Development Agency, Rochester, Minnesota since 2019. Interim President of the McKnight Foundation from January to September 2020. McKnight Foundation Consultant, November 2020 to February 2021. Acting Commissioner, Minnesota Department of Human Services, July 2019 through September 2019. Consultant (part-time), Minnesota Department of Human Services, October 2019 through December 2019. Chief Operating Officer, Twin Cities Habitat for Humanity from 2017 to 2019. Vice President of University Services, University of Minnesota from 2012 to 2016. Prior thereto, on the Board of Directors, Governance Committee and Finance Committee for the Minnesota Philanthropy Partners (Saint Paul Foundation) from 2012 to 2018, Interim Chief Executive Officer of Blue Cross Blue Shield of Minnesota from 2011 to 2012, Chairman of the Board from 2009 to 2012 and Board Director from 2003 to 2015. Vice President, Leadership and Community Engagement, Bush Foundation, Saint Paul, Minnesota (a private foundation) from 2009 to 2011. Executive Vice President and Chief Financial Officer, Minnesota Sports and Entertainment from 2004 to 2009 and Senior Vice President from 2002 to 2004. Executive Vice President of the Minnesota Wild Foundation from 2004 to 2008. Commissioner of Finance, State of Minnesota, from 1999 to 2002. Currently Board Chair of the Minnesota Wild Foundation since 2010. | N/A |
* Length of service dates reflect the Trustee’s commencement of service with the Trust’s predecessor entities, where applicable.
** Ms. Johnson has resigned from the Board effective December 31, 2021.
Allspring Emerging Growth Fund | 39
Other information (unaudited)
Officers2
Name and
year of birth | Position held and
length of service | Principal occupations during past five years or longer |
Andrew Owen
(Born 1960) | President,
since 2017 | President, Chief Executive Officer and Director of Allspring Funds Management, LLC since 2017 and co-president of Galliard Capital Management, LLC, an affiliate of Allspring Funds Management, LLC, since 2019. Prior thereto, Head of Affiliated Managers, Allspring Global Investments, from 2014 to 2019 and Executive Vice President responsible for marketing, investments and product development for Allspring Funds Management, LLC, from 2009 to 2014. In addition, Mr. Owen was an Executive Vice President of Wells Fargo & Company from 2014 to 2021. |
Jeremy DePalma
(Born 1974) | Treasurer,
since 2012
(for certain funds in
the Fund Complex);
since 2021 (for
the remaining funds in the
Fund Complex) | Senior Vice President of Allspring Funds Management, LLC since 2009. Senior Vice President of Evergreen Investment Management Company, LLC from 2008 to 2010 and head of the Fund Reporting and Control Team within Fund Administration. |
Kate McKinley
(Born 1977) | Chief Legal Officer,
since 2021 | Chief Legal Officer of Allspring Global Investments since 2021. Prior thereto, held various roles at State Street Global Advisors beginning in 2010, including serving as Senior Vice President and General Counsel from 2019 to 2021, and Chief Operating Officer of the Institutional Client Group from 2016 - 2019. Prior to working at State Street Global Advisors served as Assistant General Counsel for Bank of America Corporation from 2005 to 2010 and as an Associate at WilmerHale from 2002 to 2005. |
Christopher Baker
(Born 1976) | Chief Compliance Officer, since 2022 | Global Chief Compliance Officer for Allspring Global Investments since 2022. Prior thereto, Chief Compliance Officer for State Street Global Advisors from 2018 to 2021. Senior Compliance Officer for the State Street divisions of Alternative Investment Solutions, Sector Solutions, and Global Marketing from 2015 to 2018. From 2010 to 2015 Vice President, Global Head of Investment and Marketing Compliance for State Street Global Advisors. |
Matthew Prasse
(Born 1983) | Secretary,
since 2021 | Senior Counsel of the Allspring Legal Department since 2021. Senior Counsel of the Wells Fargo Legal Department from 2018 to 2021. Previously, Counsel for Barings LLC from 2015 to 2018. Prior to joining Barings, Associate at Morgan, Lewis & Bockius LLP from 2008 to 2015. |
1 The Statement of Additional Information includes additional information about the Trustees and is available, without charge, upon request, by calling 1-800-222-8222 or by visiting the website at allspringglobal.com.
2 For those Officers with tenures at Allspring Global Investments and/or Allspring Funds Management, LLC that began prior to 2021, such tenures include years of service during which these businesses/entities were known as Wells Fargo Asset Management and Wells Fargo Funds Management, LLC, respectively.
40 | Allspring Emerging Growth Fund
For more information
More information about Allspring Funds is available free upon request. To obtain literature, please write, visit the Fund's website, or call:
Allspring Funds
P.O. Box 219967
Kansas City, MO 64121-9967
Website: allspringglobal.com
Individual investors: 1-800-222-8222
Retail investment professionals: 1-888-877-9275
Institutional investment professionals: 1-866-765-0778
This report and the financial statements contained herein are submitted for the general information of the shareholders of the Fund. If this report is used for promotional purposes, distribution of the report must be accompanied or preceded by a current prospectus. Before investing, please consider the investment objectives, risks, charges, and expenses of the investment. For a current prospectus and, if available, a summary prospectus, containing this information, call
1-800-222-8222 or visit the Fund's website at allspringglobal.com. Read the prospectus carefully before you invest or send money.
Allspring Global InvestmentsTM is the trade name for the asset management firms of Allspring Global Investments Holdings, LLC, a holding company indirectly owned by certain private funds of GTCR LLC and Reverence Capital Partners, L.P. These firms include but are not limited to Allspring Global Investments, LLC, and Allspring Funds Management, LLC. Certain products managed by Allspring entities are distributed by Allspring Funds Distributor, LLC (a broker-dealer and Member FINRA/SIPC).
This material is for general informational and educational purposes only and is NOT intended to provide investment advice or a recommendation of any kind - including a recommendation for any specific investment, strategy, or plan.
© 2022 Allspring Global Investments Holdings, LLC. All rights reserved.
PAR-1221-00195 01-22
SA282/SAR282 11-21
Semi-Annual Report
November 30, 2021
The views expressed and any forward-looking statements are as of November 30, 2021, unless otherwise noted, and are those of the Fund's portfolio managers and/or Allspring Global Investments. Discussions of individual securities or the markets generally are not intended as individual recommendations. Future events or results may vary significantly from those expressed in any forward-looking statements. The views expressed are subject to change at any time in response to changing circumstances in the market. Allspring Global Investments disclaims any obligation to publicly update or revise any views expressed or forward-looking statements.
Letter to shareholders (unaudited)
Andrew Owen
President
Allspring Funds
Dear Shareholder:
We are pleased to offer you this semi-annual report for Allspring Index Fund for the six-month period that ended November 30, 2021. Global stocks yielded mixed results as the global economy continued to emerge from the haze of COVID-19. Tailwinds were provided by global stimulus programs, a rapid vaccination rollout, and recovering consumer and corporate sentiment. The bond market had mostly positive returns during the period.
For the six-month period, U.S. stocks, based on the S&P 500 Index,1 gained 9.38%. International stocks, as measured by the MSCI ACWI ex USA Index (Net),2 returned -5.76%, while the MSCI EM Index (Net) (USD),3 trailed its developed market counterparts with a 10.81% loss. Among bond indexes, the Bloomberg U.S. Aggregate Bond Index,4 returned 1.02%, the Bloomberg Global Aggregate ex-USD Index (unhedged),5 returned -4.64%, the Bloomberg Municipal Bond Index6 returned 0.56%, and the ICE BofA U.S. High Yield Index,7 gained 1.09%.
Vaccination rollout drove the stock markets to new highs.
June witnessed the S&P 500 Index reach a new all-time high. 2021 economic growth and inflation forecasts were revised higher to reflect a strong economic recovery and some supply and demand imbalances. Late June saw a deal reached on a U.S. infrastructure package of approximately $1 trillion for road, bridge, and broadband network upgrades over the next eight years. The U.S. Federal Reserve's (Fed) June meeting yielded no change to policy, but its projections pointed to a possible interest rate rise in 2023. This, combined with a rebound in economic activity and investors searching for yield, led to U.S. Treasury yields being down for the month. Many European and Asian countries saw vaccination momentum increase, while the U.K. dealt with a rise in COVID-19 infections, specifically the Delta variant. Meanwhile, crude oil jumped over 10% in June on the back of the pickup in global economic activity and the Organization of the Petroleum Exporting Countries’ (OPEC) slow pace of supply growth.
“2021 economic growth and inflation forecasts were revised higher to reflect a strong economic recovery and some supply and demand imbalances.”
| 1 | The S&P 500 Index consists of 500 stocks chosen for market size, liquidity, and industry group representation. It is a market-value-weighted index with each stock's weight in the index proportionate to its market value. You cannot invest directly in an index. |
| 2 | The Morgan Stanley Capital International (MSCI) All Country World Index (ACWI) ex USA Index (Net) is a free-float-adjusted market-capitalization-weighted index that is designed to measure the equity market performance of developed and emerging markets, excluding the U.S. Source: MSCI. MSCI makes no express or implied warranties or representations and shall have no liability whatsoever with respect to any MSCI data contained herein. The MSCI data may not be further redistributed or used as a basis for other indexes or any securities or financial products. This report is not approved, reviewed, or produced by MSCI. You cannot invest directly in an index. |
| 3 | The MSCI Emerging Markets (EM) Index (Net) (USD) is a free-float-adjusted market-capitalization-weighted index that is designed to measure equity market performance of emerging markets. You cannot invest directly in an index. |
| 4 | The Bloomberg U.S. Aggregate Bond Index is a broad-based benchmark that measures the investment-grade, U.S.-dollar-denominated, fixed-rate taxable bond market, including Treasuries, government-related and corporate securities, mortgage-backed securities (agency fixed-rate and hybrid adjustable-rate mortgage pass-throughs), asset-backed securities, and commercial mortgage-backed securities. You cannot invest directly in an index. |
| 5 | The Bloomberg Global Aggregate ex-USD Index (unhedged) is an unmanaged index that provides a broad-based measure of the global investment-grade fixed-income markets excluding the U.S.-dollar-denominated debt market. You cannot invest directly in an index. |
| 6 | The Bloomberg Municipal Bond Index is an unmanaged index composed of long-term tax-exempt bonds with a minimum credit rating of Baa. You cannot invest directly in an index. |
| 7 | The ICE BofA U.S. High Yield Index is a market-capitalization-weighted index of domestic and Yankee high-yield bonds. The index tracks the performance of high-yield securities traded in the U.S. bond market. You cannot invest directly in an index. Copyright 2022. ICE Data Indices, LLC. All rights reserved. |
Letter to shareholders (unaudited)
July began the month seeing vaccinations making progress, as several major developed countries eased restrictions, only to be threatened again by the spread of COVID-19’s Delta variant. Inflation continued to climb, aided by the continued supply bottleneck in the face of high demand. As it pertains to the equity area of the market, U.S. equities led the way in positive return territory, followed by international developed markets. In contrast, emerging markets were well in negative territory for the month, hindered by China’s plans for new regulations on a number of sectors, specifically education and technology. The U.S. 10-Year Treasury bond yield continued to decline, as strong demand swallowed up supply. After hitting a multi-year high earlier in the month, oil prices leveled off following an agreement by OPEC to raise oil production starting in August.
The Delta variant of COVID-19 produced outbreaks globally in August, increasing the potential for increased market volatility and bringing into question the ongoing economic recovery. Domestically, the U.S. economy continued to stay strong in the face of the Delta variant, continued inflationary pressures, and worries over Hurricane Ida. Emerging market equities experienced elevated volatility, largely influenced by China’s regulatory stance. Emerging market equities started the month with poor performance but rebounded to end the month in positive territory. Municipal debt experienced its first monthly performance drop since February of this year, slowing a rally that made it one of the best-performing sectors of the bond market. In the commodity segment of the market, crude oil fell sharply during the month on the back of dampened expectations as a result of the Delta variant but was still a leading asset class performer for the year.
Global markets suffered their broadest retreat in a year during September, with the exception of commodities. Concerns over inflation and the interest rate outlook depressed investor confidence and hurt performance. Emerging markets declined on concerns over the continued supply chain disruptions and worries over higher energy and food prices. Meanwhile, the Fed indicated it would slow the pace of asset purchases in the near future. All eyes domestically were fixed on the raising of the debt ceiling, the 2022 budget plan, and the ongoing debate over the infrastructure package. Contrary to most asset classes, commodities thrived in September, driven by sharply higher energy prices.
October’s key themes continued to be elevated inflation pressures and a supply bottleneck, but strong earnings provided a bright spot in the markets. Earnings releases in the U.S. were generally strong and consumer confidence was high. The Fed reaffirmed its plans to taper quantitative easing to a stop by mid-2022. Meanwhile, elevated inflation figures were still being considered transitory by the Fed. Similar to the U.S., the eurozone and many Asian countries saw positive earnings but were facing inflation pressures caused by supply bottlenecks while also experiencing energy price increases amid natural gas shortages. Globally, government bond yields rose as central banks prepared to lower monetary policy accommodation in the face of rising inflationary pressures. As previously referenced, positive commodity performance was driven by sharply higher energy costs.
November was dominated by rising COVID-19 hospitalizations and concerns regarding the Omicron variant. Most major asset classes, both domestically and internationally, declined in November with two exceptions: U.S. investment-grade bonds and Treasury Inflation-Protected Securities. The United Nations Climate Change Conference (COP26) took place during the month with hopes of agreement among countries to limit global warming. While several initiatives were discussed, the conference ultimately ended without the specifics required to instill confidence that the limiting of global warming would succeed. In the U.S., President Biden signed a long-awaited infrastructure bill to upgrade U.S. roads, bridges, and railways. Meanwhile, the Consumer Price Index1, a measure of domestic inflation conditions, jumped to its highest level in 31 years. While the threat of consistently high inflation led the Fed to discuss a faster pace of tapering, the Omicron strain makes that less likely to occur. Commodities came in negative for the month, largely driven by sharp declines in oil prices (and energy costs in general), as well as precious metals.
“ Municipal debt experienced its first monthly performance drop since February of this year, slowing a rally that made it one of the best-performing sectors of the bond market.”
| 1 | The Consumer Price Index (CPI) is a measure of the average change over time in the prices paid by urban consumers for a market basket of consumer goods and services. You cannot invest directly in an index. |
Letter to shareholders (unaudited)
Don’t let short-term uncertainty derail long-term investment goals.
Periods of investment uncertainty can present challenges, but experience has taught us that maintaining long-term investment goals can be an effective way to plan for the future. To help you create a sound strategy based on your personal goals and risk tolerance, Allspring Funds offers more than 100 mutual funds spanning a wide range of asset classes and investment styles. Although diversification cannot guarantee an investment profit or prevent losses, we believe it can be an effective way to manage investment risk and potentially smooth out overall portfolio performance. We encourage investors to know their investments and to understand that appropriate levels of risk-taking may unlock opportunities.
Information on transaction closing.
On November 1, 2021, GTCR LLC and Reverence Capital Partners, L.P., announced the beginning of Allspring Global Investments™, with the close of the transaction to acquire Wells Fargo Funds Management, LLC; Wells Capital Management LLC; Galliard Capital Management LLC.; Wells Fargo Asset Management (International) Ltd.; Wells Fargo Asset Management Luxembourg S.A.; and Wells Fargo Funds Distributor, LLC, as well as Wells Fargo Bank, N.A.’s business of acting as trustee to its collective investment trusts and all related Wells Fargo Asset Management legal entities. The transaction closed on November 1, 2021, forming Allspring Global Investments, a privately held asset management firm with $587 billion in AUM1 as of September 30, 2021.
Allspring Global Investments™ is a leading independent asset management firm with a full breadth of investment capabilities across diverse asset classes, serving the needs of its institutional and wealth management clients around the world. Allspring operates across 18 offices globally supported by more than 480 investment professionals. Allspring and its investment teams provide a broad range of differentiated investment products and solutions to help its diverse range of clients meet their investment objectives.
As part of this transition, all mutual funds within the Wells Fargo Funds family were rebranded as Allspring Funds. Each individual fund had “Wells Fargo” removed from its fund name and replaced with “Allspring.” The fund name changes went into effect on December 6, 2021.
Allspring Global Investments is the trade name for the asset management firms of Allspring Global Investments Holdings, LLC, a holding company indirectly owned by certain private funds of GTCR LLC and Reverence Capital Partners, L.P.
Thank you for choosing to invest with Allspring Funds. We appreciate your confidence in us and remain committed to helping you meet your financial needs.
Sincerely,
Andrew Owen
President
Allspring Funds
For further information about your Fund, contact your investment professional, visit our website at allspringglobal.com, or call us directly at 1-800-222-8222.
| 1 | As of September 30, 2021, assets under management (AUM) includes $93 billion from Galliard Capital Management, LLC, an investment advisor that is not part of the Allspring trade name/GIPS firm. |
This page is intentionally left blank.
Performance highlights (unaudited)
| Investment objective | The Fund seeks to replicate the total returns of the S&P 500 Index, before fees and expenses. |
| Manager | Allspring Funds Management, LLC |
Subadviser for the affiliated master portfolio*
Allspring Global Investments, LLC
| Portfolio managers | John R. Campbell, CFA®‡, David Neal, CFA®‡, Robert M. Wicentowski, CFA®‡ |
| Average annual total returns (%) as of November 30, 2021 |
| | | Including sales charge | | Excluding sales charge | | Expense ratios1 (%) |
| | Inception date | 1 year | 5 year | 10 year | | 1 year | 5 year | 10 year | | Gross | Net 2 |
| Class A (WFILX) | 11-4-1998 | 20.03 | 15.93 | 14.88 | | 27.34 | 17.31 | 15.57 | | 0.66 | 0.45 |
| Class C (WFINX) | 4-30-1999 | 25.39 | 16.46 | 14.72 | | 26.39 | 16.46 | 14.72 | | 1.41 | 1.20 |
| Administrator Class (WFIOX) | 2-14-1985 | – | – | – | | 27.59 | 17.54 | 15.85 | | 0.43 | 0.25 |
| S&P 500 Index3 | – | – | – | – | | 27.92 | 17.90 | 16.16 | | – | – |
Figures quoted represent past performance, which is no guarantee of future results, and do not reflect taxes that a shareholder may pay on an investment in a fund. Investment return and principal value of an investment will fluctuate so that an investor’s shares, when redeemed, may be worth more or less than their original cost. Performance shown without sales charges would be lower if sales charges were reflected. Current performance may be lower or higher than the performance data quoted, which assumes the reinvestment of dividends and capital gains. Current month-end performance is available on the Fund’s website, allspringglobal.com.
Please keep in mind that high double-digit returns were primarily achieved during favorable market conditions. You should not expect that such favorable returns can be consistently achieved. A fund’s performance, especially for short time periods, should not be the sole factor in making your investment decision.
Index returns do not include transaction costs associated with buying and selling securities, any mutual fund fees or expenses, or any taxes. It is not possible to invest directly in an index.
For Class A shares, the maximum front-end sales charge is 5.75%. For Class C shares, the maximum contingent deferred sales charge is 1.00%. Performance including a contingent deferred sales charge assumes the sales charge for the corresponding time period. Administrator Class shares are sold without a front-end sales charge or contingent deferred sales charge.
| 1 | Reflects the expense ratios as stated in the most recent prospectuses. The expense ratios shown are subject to change and may differ from the annualized expense ratios shown in the financial highlights of this report. |
| 2 | The manager has contractually committed through September 30, 2022, to waive fees and/or reimburse expenses to the extent necessary to cap total annual fund operating expenses after fee waivers at 0.45% for Class A, 1.20% for Class C and 0.25% for Administrator Class. Brokerage commissions, stamp duty fees, interest, taxes, acquired fund fees and expenses (if any) from funds in which the affiliated master portfolio invests, and extraordinary expenses are excluded from the expense caps. Net expenses from the affiliated master portfolio are included in the expense caps. Prior to or after the commitment expiration date, the caps may be increased or the commitment to maintain the caps may be terminated only with the approval of the Board of Trustees. Without these caps, the Fund’s returns would have been lower. The expense ratio paid by an investor is the net expense ratio (the total annual fund operating expenses after fee waivers) as stated in the prospectuses. |
| 3 | The S&P 500 Index consists of 500 stocks chosen for market size, liquidity, and industry group representation. It is a market-value weighted index with each stock’s weight in the index proportionate to its market value. You cannot invest directly in an index. |
Stock values fluctuate in response to the activities of individual companies and general market and economic conditions. The use of derivatives may reduce returns and/or increase volatility. Consult the Fund’s prospectus for additional information on these and other risks.
| * | The Fund is a feeder fund in a master-feeder structure that invests substantially all of its assets in a single affiliated master portfolio of the Allspring Master Trust with a substantially identical investment objective and substantially similar investment strategies. References to the investment activities of the Fund are intended to refer to the investment activities of the affiliated master portfolio in which it invests. |
| ‡ | CFA® and Chartered Financial Analyst® are trademarks owned by CFA Institute. |
Performance highlights (unaudited)
| Ten largest holdings (%) as of November 30, 20211 |
| Apple Incorporated | 6.56 |
| Microsoft Corporation | 6.28 |
| Amazon.com Incorporated | 3.86 |
| Tesla Motors Incorporated | 2.35 |
| Alphabet Incorporated Class A | 2.16 |
| NVIDIA Corporation | 2.06 |
| Alphabet Incorporated Class C | 2.03 |
| Facebook Incorporated Class A | 1.95 |
| Berkshire Hathaway Incorporated Class B | 1.30 |
| JPMorgan Chase & Company | 1.20 |
| 1 | Each holding represents the Fund’s allocable portion of the affiliated master portfolio security. Figures represent each holding as a percentage of the Fund’s net assets. Holdings are subject to change and may have changed since the date specified. |
| Sector allocation as of November 30, 20211 |
| 1 | Figures represent the sector allocation of the affiliated master portfolio as a percentage of the long-term investments of the affiliated master portfolio. These amounts are subject to change and may have changed since the date specified. |
Fund expenses (unaudited)
As a shareholder of the Fund, you incur two types of costs: (1) transaction costs, including sales charges (loads) on purchase payments and contingent deferred sales charges (if any) on redemptions and (2) ongoing costs, including management fees, distribution (12b-1) and/or shareholder servicing fees, and other Fund expenses. This example is intended to help you understand your ongoing costs (in dollars) of investing in the Fund and to compare these costs with the ongoing costs of investing in other mutual funds.
The example is based on an investment of $1,000 invested at the beginning of the six-month period and held for the entire period from June 1, 2021 to November 30, 2021.
Actual expenses
The “Actual” line of the table below provides information about actual account values and actual expenses. You may use the information in this line, together with the amount you invested, to estimate the expenses that you paid over the period. Simply divide your account value by $1,000 (for example, an $8,600 account value divided by $1,000 = 8.6), then multiply the result by the number in the “Actual” line under the heading entitled “Expenses paid during period” for your applicable class of shares to estimate the expenses you paid on your account during this period.
Hypothetical example for comparison purposes
The “Hypothetical” line of the table below provides information about hypothetical account values and hypothetical expenses based on the Fund’s actual expense ratio and an assumed rate of return of 5% per year before expenses, which is not the Fund’s actual return. The hypothetical account values and expenses may not be used to estimate the actual ending account balance or expenses you paid for the period. You may use this information to compare the ongoing costs of investing in the Fund and other funds. To do so, compare this 5% hypothetical example with the 5% hypothetical examples that appear in the shareholder reports of the other funds.
Please note that the expenses shown in the table are meant to highlight your ongoing costs only and do not reflect any transactional costs, such as sales charges (loads) and contingent deferred sales charges. Therefore, the “Hypothetical” line of the table is useful in comparing ongoing costs only, and will not help you determine the relative total costs of owning different funds. In addition, if these transactional costs were included, your costs would have been higher.
| | Beginning
account value
6-1-2021 | Ending
account value
11-30-2021 | Expenses
paid during
the period1,2 | Annualized net
expense ratio2 |
| Class A | | | | |
| Actual | $1,000.00 | $1,091.29 | $2.31 | 0.44% |
| Hypothetical (5% return before expenses) | $1,000.00 | $1,022.86 | $2.23 | 0.44% |
| Class C | | | | |
| Actual | $1,000.00 | $1,087.32 | $6.28 | 1.20% |
| Hypothetical (5% return before expenses) | $1,000.00 | $1,019.05 | $6.07 | 1.20% |
| Administrator Class | | | | |
| Actual | $1,000.00 | $1,092.39 | $1.31 | 0.25% |
| Hypothetical (5% return before expenses) | $1,000.00 | $1,023.82 | $1.27 | 0.25% |
1 Expenses paid is equal to the annualized net expense ratio of each class multiplied by the average account value over the period, multiplied by the number of days in the most recent fiscal half-year divided by the number of days in the fiscal year (to reflect the one-half-year period).
2 Amounts reflect net expenses allocated from the affiliated Master Portfolio in which the Fund invests.
Portfolio of investments—November 30, 2021 (unaudited)
| | | | | | Value |
| Investment companies: 100.07% | | | | | |
| Affiliated master portfolio: 100.07% | | | | | |
| Allspring Index Portfolio | | | | | $1,334,494,181 |
| Total Investment companies (Cost $119,011,332) | | | | | 1,334,494,181 |
| Total investments in securities (Cost $119,011,332) | 100.07% | | | | 1,334,494,181 |
| Other assets and liabilities, net | (0.07) | | | | (879,445) |
| Total net assets | 100.00% | | | | $1,333,614,736 |
Transactions with the affiliated Master Portfolio were as follows:
| | % of
ownership,
beginning
of period | % of
ownership,
end of
period | Net realized
gains
(losses) on
securities
transactions
allocated
from
affiliated
Master
Portfolio | Net
change in
unrealized
gains
(losses) on
securities
transactions
allocated
from
affiliated
Master
Portfolio | Dividends
allocated
from
affiliated
Master
Portfolio | Affiliated
income
allocated
from
affiliated
Master
Portfolio | Value,
end of
period | |
| Allspring Index Portfolio | 96.64% | 96.76% | $42,154,925 | $65,680,878 | $8,840,590 | $59,693 | $1,334,494,181 | |
The accompanying notes are an integral part of these financial statements.
Statement of assets and liabilities—November 30, 2021 (unaudited)
| | |
| Assets | |
Investments in affiliated Master Portfolio, at value (cost $119,011,332)
| $ 1,334,494,181 |
Receivable for Fund shares sold
| 467,438 |
Receivable from manager
| 127,545 |
Total assets
| 1,335,089,164 |
| Liabilities | |
Payable for Fund shares redeemed
| 925,681 |
Shareholder servicing fees payable
| 221,439 |
Administration fees payable
| 206,382 |
Distribution fee payable
| 8,119 |
Trustees’ fees and expenses payable
| 2,966 |
Accrued expenses and other liabilities
| 109,841 |
Total liabilities
| 1,474,428 |
Total net assets
| $1,333,614,736 |
| Net assets consist of | |
Paid-in capital
| $ 5,192,136 |
Total distributable earnings
| 1,328,422,600 |
Total net assets
| $1,333,614,736 |
| Computation of net asset value and offering price per share | |
Net assets – Class A
| $ 882,187,192 |
Shares outstanding – Class A1
| 16,113,242 |
Net asset value per share – Class A
| $54.75 |
Maximum offering price per share – Class A2
| $58.09 |
Net assets – Class C
| $ 12,797,618 |
Shares outstanding – Class C1
| 229,938 |
Net asset value per share – Class C
| $55.66 |
Net assets – Administrator Class
| $ 438,629,926 |
Shares outstanding – Administrator Class1
| 7,810,633 |
Net asset value per share – Administrator Class
| $56.16 |
| 1 | The Fund has an unlimited number of authorized shares. |
| 2 | Maximum offering price is computed as 100/94.25 of net asset value. On investments of $50,000 or more, the offering price is reduced. |
The accompanying notes are an integral part of these financial statements.
10 | Allspring Index Fund
Statement of operations—six months ended November 30, 2021 (unaudited)
| | |
| Investment income | |
Dividends allocated from affiliated Master Portfolio (net of foreign withholding taxes of $42,718)
| $ 8,840,590 |
Affiliated income allocated from affiliated Master Portfolio
| 59,693 |
Expenses allocated from affiliated Master Portfolio
| (708,177) |
Total investment income
| 8,192,106 |
| Expenses | |
Management fee
| 329,078 |
| Administration fees | |
Class A
| 914,754 |
Class C
| 13,406 |
Administrator Class
| 281,028 |
| Shareholder servicing fees | |
Class A
| 1,088,993 |
Class C
| 15,888 |
Administrator Class
| 193,104 |
| Distribution fee | |
Class C
| 47,547 |
Custody and accounting fees
| 1,925 |
Professional fees
| 15,714 |
Registration fees
| 3,657 |
Shareholder report expenses
| 5,961 |
Trustees’ fees and expenses
| 9,968 |
Other fees and expenses
| 554 |
Total expenses
| 2,921,577 |
| Less: Fee waivers and/or expense reimbursements | |
Fund-level
| (865,129) |
Class A
| (217,204) |
Class C
| (2,547) |
Administrator Class
| (712) |
Net expenses
| 1,835,985 |
Net investment income
| 6,356,121 |
| Realized and unrealized gains (losses) on investments | |
Net realized gains on securities transactions allocated from affiliated Master Portfolio
| 42,154,925 |
Net change in unrealized gains (losses) on securities transactions allocated from affiliated Master Portfolio
| 65,680,878 |
Net realized and unrealized gains (losses) on investments
| 107,835,803 |
Net increase in net assets resulting from operations
| $114,191,924 |
The accompanying notes are an integral part of these financial statements.
Allspring Index Fund | 11
Statement of changes in net assets
| | | | | |
| | Six months ended
November 30, 2021
(unaudited) | Year ended
May 31, 2021 |
| Operations | | | | |
Net investment income
| | $ 6,356,121 | | $ 13,016,141 |
Net realized gains on investments
| | 42,154,925 | | 101,189,274 |
Net change in unrealized gains (losses) on investments
| | 65,680,878 | | 267,094,800 |
Net increase in net assets resulting from operations
| | 114,191,924 | | 381,300,215 |
| Distributions to shareholders from | | | | |
| Net investment income and net realized gains | | | | |
Class A
| | 0 | | (99,506,178) |
Class C
| | 0 | | (1,661,488) |
Administrator Class
| | 0 | | (50,898,614) |
Total distributions to shareholders
| | 0 | | (152,066,280) |
| Capital share transactions | Shares | | Shares | |
| Proceeds from shares sold | | | | |
Class A
| 184,441 | 9,825,473 | 543,966 | 25,097,626 |
Class C
| 12,256 | 664,186 | 12,993 | 609,026 |
Administrator Class
| 230,505 | 12,543,116 | 1,009,053 | 47,555,074 |
| | | 23,032,775 | | 73,261,726 |
| Reinvestment of distributions | | | | |
Class A
| 0 | 0 | 2,188,868 | 96,461,288 |
Class C
| 0 | 0 | 31,396 | 1,403,441 |
Administrator Class
| 0 | 0 | 1,056,266 | 47,713,951 |
| | | 0 | | 145,578,680 |
| Payment for shares redeemed | | | | |
Class A
| (731,527) | (38,746,447) | (2,068,334) | (95,239,910) |
Class C
| (27,088) | (1,457,586) | (183,902) | (8,615,422) |
Administrator Class
| (478,581) | (25,992,665) | (2,159,572) | (101,444,640) |
| | | (66,196,698) | | (205,299,972) |
Net increase (decrease) in net assets resulting from capital share transactions
| | (43,163,923) | | 13,540,434 |
Total increase in net assets
| | 71,028,001 | | 242,774,369 |
| Net assets | | | | |
Beginning of period
| | 1,262,586,735 | | 1,019,812,366 |
End of period
| | $1,333,614,736 | | $1,262,586,735 |
The accompanying notes are an integral part of these financial statements.
12 | Allspring Index Fund
Financial highlights
(For a share outstanding throughout each period)
| | | Year ended May 31 |
| Class A | Six months ended
November 30, 2021
(unaudited) | 2021 | 2020 | 2019 | 2018 | 2017 |
Net asset value, beginning of period
| $50.17 | $41.27 | $49.48 | $63.35 | $66.85 | $62.85 |
Net investment income
| 0.24 | 0.48 | 0.65 | 0.82 | 0.99 1 | 1.05 |
Net realized and unrealized gains (losses) on investments
| 4.34 | 14.92 | 5.82 | 0.54 | 7.99 | 9.09 |
Total from investment operations
| 4.58 | 15.40 | 6.47 | 1.36 | 8.98 | 10.14 |
| Distributions to shareholders from | | | | | | |
Net investment income
| 0.00 | (0.57) | (0.67) | (0.90) | (1.02) | (1.16) |
Net realized gains
| 0.00 | (5.93) | (14.01) | (14.33) | (11.46) | (4.98) |
Total distributions to shareholders
| 0.00 | (6.50) | (14.68) | (15.23) | (12.48) | (6.14) |
Net asset value, end of period
| $54.75 | $50.17 | $41.27 | $49.48 | $63.35 | $66.85 |
Total return2
| 9.13% | 39.71% | 12.02% | 3.32% | 13.87% | 16.94% |
| Ratios to average net assets (annualized)* | | | | | | |
Gross expenses
| 0.62% | 0.65% | 0.67% | 0.65% | 0.63% | 0.62% |
Net expenses
| 0.44% | 0.44% | 0.44% | 0.45% | 0.45% | 0.45% |
Net investment income
| 0.91% | 1.08% | 1.47% | 1.51% | 1.49% | 1.68% |
| Supplemental data | | | | | | |
Portfolio turnover rate3
| 1% | 4% | 3% | 4% | 3% | 9% |
Net assets, end of period (000s omitted)
| $882,187 | $835,781 | $660,101 | $676,511 | $702,866 | $684,004 |
| * | Ratios include net expenses allocated from the affiliated Master Portfolio which were as follows: |
| Six months ended November 30, 2021 (unaudited) | 0.11% |
| Year ended May 31, 2021 | 0.11% |
| Year ended May 31, 2020 | 0.12% |
| Year ended May 31, 2019 | 0.11% |
| Year ended May 31, 2018 | 0.10% |
| Year ended May 31, 2017 | 0.10% |
| 1 | Calculated based upon average shares outstanding |
| 2 | Total return calculations do not include any sales charges. Returns for periods of less than one year are not annualized. |
| 3 | Portfolio turnover rate is calculated by multiplying the affiliated Master Portfolio’s percentage of the Fund’s total investment in securities at the end of the period by the affiliated Master Portfolio’s portfolio turnover rate. |
The accompanying notes are an integral part of these financial statements.
Allspring Index Fund | 13
Financial highlights
(For a share outstanding throughout each period)
| | | Year ended May 31 |
| Class C | Six months ended
November 30, 2021
(unaudited) | 2021 | 2020 | 2019 | 2018 | 2017 |
Net asset value, beginning of period
| $51.19 | $41.90 | $50.02 | $63.67 | $67.11 | $63.12 |
Net investment income
| 0.17 | 0.16 1 | 0.30 | 0.46 1 | 0.50 1 | 0.66 |
Net realized and unrealized gains (losses) on investments
| 4.30 | 15.21 | 5.84 | 0.52 | 8.00 | 9.02 |
Total from investment operations
| 4.47 | 15.37 | 6.14 | 0.98 | 8.50 | 9.68 |
| Distributions to shareholders from | | | | | | |
Net investment income
| 0.00 | (0.15) | (0.25) | (0.30) | (0.48) | (0.71) |
Net realized gains
| 0.00 | (5.93) | (14.01) | (14.33) | (11.46) | (4.98) |
Total distributions to shareholders
| 0.00 | (6.08) | (14.26) | (14.63) | (11.94) | (5.69) |
Net asset value, end of period
| $55.66 | $51.19 | $41.90 | $50.02 | $63.67 | $67.11 |
Total return2
| 8.73% | 38.83% | 11.17% | 2.54% | 13.02% | 16.07% |
| Ratios to average net assets (annualized)* | | | | | | |
Gross expenses
| 1.37% | 1.40% | 1.42% | 1.39% | 1.38% | 1.37% |
Net expenses
| 1.20% | 1.20% | 1.20% | 1.20% | 1.20% | 1.20% |
Net investment income
| 0.15% | 0.34% | 0.72% | 0.77% | 0.72% | 0.93% |
| Supplemental data | | | | | | |
Portfolio turnover rate3
| 1% | 4% | 3% | 4% | 3% | 9% |
Net assets, end of period (000s omitted)
| $12,798 | $12,530 | $16,103 | $19,146 | $66,117 | $67,691 |
| * | Ratios include net expenses allocated from the affiliated Master Portfolio which were as follows: |
| Six months ended November 30, 2021 (unaudited) | 0.11% |
| Year ended May 31, 2021 | 0.11% |
| Year ended May 31, 2020 | 0.12% |
| Year ended May 31, 2019 | 0.11% |
| Year ended May 31, 2018 | 0.10% |
| Year ended May 31, 2017 | 0.10% |
| 1 | Calculated based upon average shares outstanding |
| 2 | Total return calculations do not include any sales charges. Returns for periods of less than one year are not annualized. |
| 3 | Portfolio turnover rate is calculated by multiplying the affiliated Master Portfolio’s percentage of the Fund’s total investment in securities at the end of the period by the affiliated Master Portfolio’s portfolio turnover rate. |
The accompanying notes are an integral part of these financial statements.
14 | Allspring Index Fund
Financial highlights
(For a share outstanding throughout each period)
| | | Year ended May 31 |
| Administrator Class | Six months ended
November 30, 2021
(unaudited) | 2021 | 2020 | 2019 | 2018 | 2017 |
Net asset value, beginning of period
| $51.41 | $42.15 | $50.24 | $64.04 | $67.43 | $63.33 |
Net investment income
| 0.34 | 0.58 | 0.81 | 1.02 1 | 1.26 | 1.41 |
Net realized and unrealized gains (losses) on investments
| 4.41 | 15.26 | 5.85 | 0.48 | 7.94 | 8.94 |
Total from investment operations
| 4.75 | 15.84 | 6.66 | 1.50 | 9.20 | 10.35 |
| Distributions to shareholders from | | | | | | |
Net investment income
| 0.00 | (0.65) | (0.74) | (0.97) | (1.13) | (1.27) |
Net realized gains
| 0.00 | (5.93) | (14.01) | (14.33) | (11.46) | (4.98) |
Total distributions to shareholders
| 0.00 | (6.58) | (14.75) | (15.30) | (12.59) | (6.25) |
Net asset value, end of period
| $56.16 | $51.41 | $42.15 | $50.24 | $64.04 | $67.43 |
Total return2
| 9.24% | 39.97% | 12.25% | 3.52% | 14.10% | 17.18% |
| Ratios to average net assets (annualized)* | | | | | | |
Gross expenses
| 0.38% | 0.42% | 0.44% | 0.41% | 0.40% | 0.39% |
Net expenses
| 0.25% | 0.25% | 0.25% | 0.25% | 0.25% | 0.25% |
Net investment income
| 1.10% | 1.28% | 1.67% | 1.72% | 1.70% | 1.88% |
| Supplemental data | | | | | | |
Portfolio turnover rate3
| 1% | 4% | 3% | 4% | 3% | 9% |
Net assets, end of period (000s omitted)
| $438,630 | $414,276 | $343,609 | $460,934 | $829,004 | $1,151,522 |
| * | Ratios include net expenses allocated from the affiliated Master Portfolio which were as follows: |
| Six months ended November 30, 2021 (unaudited) | 0.11% |
| Year ended May 31, 2021 | 0.11% |
| Year ended May 31, 2020 | 0.12% |
| Year ended May 31, 2019 | 0.11% |
| Year ended May 31, 2018 | 0.10% |
| Year ended May 31, 2017 | 0.10% |
| 1 | Calculated based upon average shares outstanding |
| 2 | Returns for periods of less than one year are not annualized. |
| 3 | Portfolio turnover rate is calculated by multiplying the affiliated Master Portfolio’s percentage of the Fund’s total investment in securities at the end of the period by the affiliated Master Portfolio’s portfolio turnover rate. |
The accompanying notes are an integral part of these financial statements.
Allspring Index Fund | 15
Notes to financial statements (unaudited)
1. ORGANIZATION
Allspring Funds Trust (the "Trust"), a Delaware statutory trust organized on March 10, 1999, is an open-end management investment company registered under the Investment Company Act of 1940, as amended (the "1940 Act"). As an investment company, the Trust follows the accounting and reporting guidance in Financial Accounting Standards Board ("FASB") Accounting Standards Codification Topic 946, Financial Services – Investment Companies. These financial statements report on the Allspring Index Fund (the "Fund") which is a diversified series of the Trust.
The Fund is a feeder fund in a master-feeder structure that invests substantially all of its assets in a single master portfolio with a substantially identical investment objective and substantially similar investment strategies. The Fund invests in Allspring Index Portfolio, a separate diversified portfolio (the “affiliated Master Portfolio”) of Allspring Master Trust, a registered open-end management investment company. As of November 30, 2021, the Fund owned 96.76% of Allspring Index Portfolio. The affiliated Master Portfolio directly acquires portfolio securities and the Fund acquires an indirect interest in those securities. The Fund accounts for its investment in the affiliated Master Portfolio as a partnership investment and records on a daily basis its share of the affiliated Master Portfolio’s income, expense and realized and unrealized gains and losses. The financial statements of the affiliated Master Portfolio for the six months ended November 30, 2021 are included in this report and should be read in conjunction with the Fund’s financial statements.
On February 23, 2021, Wells Fargo & Company entered into a definitive agreement to sell Wells Fargo Asset Management ("WFAM") to GTCR LLC and Reverence Capital Partners, L.P. WFAM was the trade name used by the asset management businesses of Wells Fargo & Company and included Wells Fargo Funds Management, LLC, Wells Capital Management, LLC, Wells Fargo Asset Management (International) Limited and Wells Fargo Funds Distributor, LLC. Effective on November 1, 2021, the sale transaction of WFAM by Wells Fargo & Company to GTCR LLC and Reverence Capital Partners, L.P. was closed. In connection with the closing of the transaction, WFAM became known as Allspring Global Investments (“Allspring”) and various entities that provide services to the Fund changed their names to "Allspring", including Allspring Funds Management, LLC (formerly Wells Fargo Funds Management, LLC), the investment manager to the Fund, Allspring Global Investments, Inc. (formerly Wells Capital Management, LLC) and Allspring Global Investments (UK) Limited (formerly Wells Fargo Asset Management (International) Limited), both registered investment advisers providing subadvisory services to certain funds, and Allspring Funds Distributor, LLC (formerly Wells Fargo Funds Distributor, LLC), the Fund's principal underwriter.
Consummation of the transaction resulted in the automatic termination of the Fund’s investment management agreement. The Fund’s Board of Trustees approved a new investment management agreement which was submitted and approved by the Fund’s shareholders at a Special Meeting of Shareholders held on September 15, 2021. The new agreement became effective on November 1, 2021.
Effective December 6, 2021, "Wells Fargo" was removed from the Fund's name and replaced it with "Allspring".
2. SIGNIFICANT ACCOUNTING POLICIES
The following significant accounting policies, which are consistently followed in the preparation of the financial statements of the Fund, are in conformity with U.S. generally accepted accounting principles which require management to make estimates and assumptions that affect the reported amounts of assets and liabilities, disclosure of contingent assets and liabilities at the date of the financial statements, and the reported amounts of income and expenses during the reporting period. Actual results could differ from those estimates.
Securities valuation
All investments are valued each business day as of the close of regular trading on the New York Stock Exchange (generally 4 p.m. Eastern Time), although the Fund may deviate from this calculation time under unusual or unexpected circumstances.
Investments in the affiliated Master Portfolio are valued daily based on the Fund’s proportionate share of the affiliated Master Portfolio’s net assets, which are also valued daily. Securities held in the affiliated Master Portfolio are valued as discussed in the Notes to Financial Statements of the affiliated Master Portfolio, which are included elsewhere in this report.
Investments which are not valued using the method discussed above are valued at their fair value, as determined in good faith by the Board of Trustees. The Board of Trustees has established a Valuation Committee comprised of the Trustees and has delegated to it the authority to take any actions regarding the valuation of portfolio securities that the Valuation Committee deems necessary or appropriate, including determining the fair value of portfolio securities, unless the determination has been delegated to the Allspring Global Investments Pricing Committee at Allspring Funds Management, LLC ("Allspring Funds Management"). The Board of Trustees retains the authority to make or ratify any valuation decisions or approve any changes to
16 | Allspring Index Fund
Notes to financial statements (unaudited)
the Valuation Procedures as it deems appropriate. On a quarterly basis, the Board of Trustees receives reports on any valuation actions taken by the Valuation Committee or the Allspring Global Investments Pricing Committee which may include items for ratification.
Investment transactions, income and expenses
Investments in the affiliated Master Portfolio are recorded on a trade date basis. The Fund records daily its proportionate share of the affiliated Master Portfolio’s income, expenses and realized and unrealized gains or losses. The Fund also accrues its own expenses.
Distributions to shareholders
Distributions to shareholders from net investment income and any net realized gains are recorded on the ex-dividend date and paid at least annually. Such distributions are determined in accordance with income tax regulations and may differ from U.S. generally accepted accounting principles. Dividend sources are estimated at the time of declaration. The tax character of distributions is determined as of the Fund's fiscal year end. Therefore, a portion of the Fund's distributions made prior to the Fund’s fiscal year end may be categorized as a tax return of capital at year end.
Federal and other taxes
The Fund intends to continue to qualify as a regulated investment company by distributing substantially all of its investment company taxable income and any net realized capital gains (after reduction for capital loss carryforwards) sufficient to relieve it from all, or substantially all, federal income taxes. Accordingly, no provision for federal income taxes was required.
The Fund’s income and federal excise tax returns and all financial records supporting those returns for the prior three fiscal years are subject to examination by the federal and Delaware revenue authorities. Management has analyzed the Fund's tax positions taken on federal, state, and foreign tax returns for all open tax years and does not believe that there are any uncertain tax positions that require recognition of a tax liability.
As of November 30, 2021, the aggregate cost of all investments for federal income tax purposes was $123,945,872 and the unrealized gains (losses) consisted of:
| Gross unrealized gains | $1,210,548,309 |
| Gross unrealized losses | 0 |
| Net unrealized gains | $1,210,548,309 |
Class allocations
The separate classes of shares offered by the Fund differ principally in applicable sales charges, distribution, shareholder servicing, and administration fees. Class specific expenses are charged directly to that share class. Investment income, common fund-level expenses, and realized and unrealized gains (losses) on investments are allocated daily to each class of shares based on the relative proportion of net assets of each class.
3. FAIR VALUATION MEASUREMENTS
At November 30, 2021, the Fund’s investment in the affiliated Master Portfolio was measured at fair value using the net asset value per share (or its equivalent) as a practical expedient. The investment objective and fair value of the affiliated Master Portfolio is as follows:
| Affiliated Master Portfolio | Investment objective | Fair value of affiliated
Master Portfolio |
| Allspring Index Portfolio | Seeks to replicate the total return of the S&P 500 Index, before fees and expenses | $1,334,494,181 |
The affiliated Master Portfolio does not have a redemption period notice, can be redeemed daily and does not have any unfunded commitments.
4. TRANSACTIONS WITH AFFILIATES
Management fee
Allspring Funds Management, a wholly owned subsidiary of Allspring Global Investments Holdings, LLC, a holding company indirectly owned by certain private funds of GTCR LLC and Reverence Capital Partners, L.P., is the manager of the Fund and
Allspring Index Fund | 17
Notes to financial statements (unaudited)
provides advisory and fund-level administrative services under an investment management agreement. Under the investment management agreement, Allspring Funds Management is responsible for, among other services, implementing the investment objectives and strategies of the Fund and providing fund-level administrative services in connection with the Fund’s operations. As long as the Fund continues to invest substantially all of its assets in a single affiliated Master Portfolio, the Fund pays Allspring Funds Management an investment management fee only for fund-level administrative services at the following annual rate based on the Fund’s average daily net assets:
| Average daily net assets | Management fee |
| First $5 billion | 0.050% |
| Next $5 billion | 0.040 |
| Over $10 billion | 0.030 |
For the six months ended November 30, 2021, the management fee was equivalent to an annual rate of 0.05% of the Fund’s average daily net assets.
Allspring Funds Management also serves as the adviser to the affiliated Master Portfolio and is entitled to receive a fee from the affiliated Master Portfolio for those services.
Administration fees
Under a class-level administration agreement, Allspring Funds Management provides class-level administrative services to the Fund, which includes paying fees and expenses for services provided by the transfer agent, sub-transfer agents, omnibus account servicers and record-keepers. As compensation for its services under the class-level administration agreement, Allspring Funds Management receives an annual fee which is calculated based on the average daily net assets of each class as follows:
| | Class-level
administration fee |
| Class A | 0.21% |
| Class C | 0.21 |
| Administrator Class | 0.13 |
Waivers and/or expense reimbursements
Allspring Funds Management has contractually committed to waive and/or reimburse management and administration fees to the extent necessary to maintain certain net operating expense ratios for the Fund. When each class of the Fund has exceeded its expense cap, Allspring Funds Management will waive fees and/or reimburse expenses from fund-level expenses on a proportionate basis and then from class specific expenses. When only certain classes exceed their expense caps, waivers and/or reimbursements are applied against class specific expenses before fund-level expenses. Net expenses from the affiliated Master Portfolio are included in the expense caps. Allspring Funds Management has contractually committed through September 30, 2022 to waive fees and/or reimburse expenses to the extent necessary to cap expenses. Prior to or after the commitment expiration date, the caps may be increased or the commitment to maintain the caps may be terminated only with the approval of the Board of Trustees. The contractual expense caps are as follows:
| | Expense ratio caps |
| Class A | 0.45% |
| Class C | 1.20 |
| Administrator Class | 0.25 |
Distribution fee
The Trust has adopted a distribution plan for Class C shares of the Fund pursuant to Rule 12b-1 under the 1940 Act. A distribution fee is charged to Class C shares and paid to Allspring Funds Distributor, LLC ("Allspring Funds Distributor"), an affiliate of Allspring Funds Management, the principal underwriter, at an annual rate of 0.75% of the average daily net assets of Class C shares.
18 | Allspring Index Fund
Notes to financial statements (unaudited)
In addition, Allspring Funds Distributor is entitled to receive the front-end sales charge from the purchase of Class A shares and a contingent deferred sales charge on the redemption of certain Class A shares. Allspring Funds Distributor is also entitled to receive the contingent deferred sales charges from redemptions of Class C shares. Allspring Funds Distributor received $1,888 in contingent deferred sales charges from Class A shares for the six months ended November 30, 2021. No front-end sales charges were incurred by Class A shares and no contingent deferred sales charges were incurred by Class C shares for the six months ended November 30, 2021.
Shareholder servicing fees
The Trust has entered into contracts with one or more shareholder servicing agents, whereby Class A and Class C shares of the Fund are charged a fee at an annual rate of 0.25% of the average daily net assets of each respective class. Administrator Class is charged a fee at an annual rate of 0.10% of its average daily net assets. A portion of these total shareholder servicing fees were paid to affiliates, and to certain entities that were affiliates of the Fund until November 1, 2021.
5. INVESTMENT PORTFOLIO TRANSACTIONS
The Fund seeks to achieve its investment objective by investing substantially all of its assets in the affiliated Master Portfolio. Purchases and sales have been calculated by multiplying the Fund's ownership percentage of the affiliated Master Portfolio by the affiliated Master Portfolio's purchases and sales. Purchases and sales of investments, excluding U.S. government obligations (if any) and short-term securities, for the six months ended November 30, 2021 were $60,830,685 and $15,596,103, respectively.
6. BANK BORROWINGS
The Trust (excluding the money market funds), Allspring Master Trust and Allspring Variable Trust are parties to a $350,000,000 revolving credit agreement whereby the Fund is permitted to use bank borrowings for temporary or emergency purposes, such as to fund shareholder redemption requests. Interest under the credit agreement is charged to the Fund based on a borrowing rate equal to the higher of the Federal Funds rate in effect on that day plus 1.25% or the overnight bank funding rate in effect on that day plus 1.25%. In addition, an annual commitment fee equal to 0.25% of the unused balance is allocated to each participating fund.
For the six months ended November 30, 2021, there were no borrowings by the Fund under the agreement.
7. CONCENTRATION RISKS
Concentration risks result from exposure to a limited number of sectors. Through its investment in the affiliated Master Portfolio which may invest a substantial portion of its assets in any sector, the Fund may in turn be more affected by changes in that sector than a fund whose investments are not heavily weighted in any sector. As of the end of the period, the affiliated Master Portfolio concentrated its portfolio in investments related to the information technology sector.
8. INDEMNIFICATION
Under the Fund's organizational documents, the officers and Trustees have been granted certain indemnification rights against certain liabilities that may arise out of performance of their duties to the Fund. The Fund has entered into a separate agreement with each Trustee that converts indemnification rights currently existing under the Fund’s organizational documents into contractual rights that cannot be changed in the future without the consent of the Trustee. Additionally, in the normal course of business, the Fund may enter into contracts with service providers that contain a variety of indemnification clauses. The Fund’s maximum exposure under these arrangements is dependent on future claims that may be made against the Fund and, therefore, cannot be estimated.
9. CORONAVIRUS (COVID-19) PANDEMIC
On March 11, 2020, the World Health Organization announced that it had made the assessment that coronavirus disease 2019 (“COVID-19”) is a pandemic. The impacts of COVID-19 are affecting the entire global economy, individual companies and investment products, the funds, and the market in general. There is significant uncertainty around the extent and duration of business disruptions related to COVID-19 and the impacts may last for an extended period of time. COVID-19 has led to significant uncertainty and volatility in the financial markets.
Allspring Index Fund | 19
Portfolio of investments—November 30, 2021 (unaudited)
| | | | | Shares | Value |
| Common stocks: 97.82% | | | | | |
| Communication services: 10.13% | | | | | |
| Diversified telecommunication services: 0.97% | | | | | |
| AT&T Incorporated | | | | 248,570 | $ 5,674,853 |
| Lumen Technologies Incorporated | | | | 34,629 | 427,322 |
| Verizon Communications Incorporated | | | | 144,133 | 7,245,566 |
| | | | | | 13,347,741 |
| Entertainment: 1.67% | | | | | |
| Activision Blizzard Incorporated | | | | 27,075 | 1,586,595 |
| Electronic Arts Incorporated | | | | 9,907 | 1,230,648 |
| Live Nation Entertainment Incorporated † | | | | 4,587 | 489,204 |
| Netflix Incorporated † | | | | 15,408 | 9,890,395 |
| Take-Two Interactive Software Incorporated † | | | | 4,056 | 672,809 |
| The Walt Disney Company † | | | | 63,261 | 9,166,519 |
| | | | | | 23,036,170 |
| Interactive media & services: 6.31% | | | | | |
| Alphabet Incorporated Class A † | | | | 10,482 | 29,747,383 |
| Alphabet Incorporated Class C † | | | | 9,809 | 27,946,233 |
| Facebook Incorporated Class A † | | | | 82,989 | 26,926,611 |
| Match Group Incorporated † | | | | 9,637 | 1,252,714 |
| Twitter Incorporated † | | | | 27,780 | 1,220,653 |
| | | | | | 87,093,594 |
| Media: 1.02% | | | | | |
| Charter Communications Incorporated Class A † | | | | 4,416 | 2,853,972 |
| Comcast Corporation Class A | | | | 159,457 | 7,969,661 |
| Discovery Incorporated Class A †« | | | | 5,887 | 136,990 |
| Discovery Incorporated Class C † | | | | 10,574 | 240,136 |
| DISH Network Corporation Class A † | | | | 8,666 | 270,813 |
| Fox Corporation Class A | | | | 11,259 | 402,059 |
| Fox Corporation Class B | | | | 5,163 | 173,477 |
| Interpublic Group of Companies Incorporated | | | | 13,703 | 454,803 |
| News Corporation Class A | | | | 13,620 | 294,464 |
| News Corporation Class B | | | | 4,239 | 91,350 |
| Omnicom Group Incorporated | | | | 7,464 | 502,402 |
| ViacomCBS Incorporated Class B | | | | 21,091 | 652,766 |
| | | | | | 14,042,893 |
| Wireless telecommunication services: 0.16% | | | | | |
| T-Mobile US Incorporated † | | | | 20,420 | 2,221,900 |
| Consumer discretionary: 12.88% | | | | | |
| Auto components: 0.14% | | | | | |
| Aptiv plc † | | | | 9,417 | 1,510,016 |
| BorgWarner Incorporated | | | | 8,348 | 361,301 |
| | | | | | 1,871,317 |
| Automobiles: 2.75% | | | | | |
| Ford Motor Company | | | | 136,606 | 2,621,469 |
The accompanying notes are an integral part of these financial statements.
20 | Allspring Index Portfolio
Portfolio of investments—November 30, 2021 (unaudited)
| | | | | Shares | Value |
| Automobiles (continued) | | | | | |
| General Motors Company † | | | | 50,540 | $ 2,924,750 |
| Tesla Motors Incorporated † | | | | 28,249 | 32,338,325 |
| | | | | | 37,884,544 |
| Distributors: 0.14% | | | | | |
| Genuine Parts Company | | | | 4,986 | 636,912 |
| LKQ Corporation | | | | 9,412 | 526,131 |
| Pool Corporation | | | | 1,396 | 773,552 |
| | | | | | 1,936,595 |
| Hotels, restaurants & leisure: 1.82% | | | | | |
| Booking Holdings Incorporated † | | | | 1,429 | 3,003,544 |
| Caesars Entertainment Incorporated † | | | | 7,430 | 669,220 |
| Carnival Corporation † | | | | 27,800 | 489,836 |
| Chipotle Mexican Grill Incorporated † | | | | 978 | 1,607,255 |
| Darden Restaurants Incorporated | | | | 4,537 | 625,879 |
| Domino's Pizza Incorporated | | | | 1,283 | 672,472 |
| Expedia Group Incorporated † | | | | 5,058 | 814,793 |
| Hilton Worldwide Holdings Incorporated † | | | | 9,702 | 1,310,449 |
| Las Vegas Sands Corporation † | | | | 11,969 | 426,336 |
| Marriott International Incorporated Class A † | | | | 9,523 | 1,405,214 |
| McDonald's Corporation | | | | 25,999 | 6,359,355 |
| MGM Resorts International | | | | 13,924 | 551,112 |
| Norwegian Cruise Line Holdings Limited †« | | | | 12,882 | 251,328 |
| Penn National Gaming Incorporated † | | | | 5,782 | 296,212 |
| Royal Caribbean Cruises Limited † | | | | 7,803 | 544,805 |
| Starbucks Corporation | | | | 41,049 | 4,500,612 |
| Wynn Resorts Limited † | | | | 3,665 | 296,902 |
| Yum! Brands Incorporated | | | | 10,293 | 1,264,392 |
| | | | | | 25,089,716 |
| Household durables: 0.37% | | | | | |
| D.R. Horton Incorporated | | | | 11,347 | 1,108,602 |
| Garmin Limited | | | | 5,289 | 706,293 |
| Leggett & Platt Incorporated | | | | 4,641 | 187,450 |
| Lennar Corporation Class A | | | | 9,563 | 1,004,593 |
| Mohawk Industries Incorporated † | | | | 1,947 | 326,843 |
| Newell Rubbermaid Incorporated | | | | 13,181 | 282,996 |
| NVR Incorporated † | | | | 117 | 611,365 |
| PulteGroup Incorporated | | | | 9,035 | 452,021 |
| Whirlpool Corporation | | | | 2,183 | 475,326 |
| | | | | | 5,155,489 |
| Internet & direct marketing retail: 4.05% | | | | | |
| Amazon.com Incorporated † | | | | 15,163 | 53,177,702 |
| eBay Incorporated | | | | 22,631 | 1,526,687 |
| Etsy Incorporated † | | | | 4,407 | 1,210,074 |
| | | | | | 55,914,463 |
| Leisure products: 0.03% | | | | | |
| Hasbro Incorporated | | | | 4,506 | 436,676 |
| Multiline retail: 0.52% | | | | | |
| Dollar General Corporation | | | | 8,223 | 1,819,750 |
The accompanying notes are an integral part of these financial statements.
Allspring Index Portfolio | 21
Portfolio of investments—November 30, 2021 (unaudited)
| | | | | Shares | Value |
| Multiline retail (continued) | | | | | |
| Dollar Tree Incorporated † | | | | 8,075 | $ 1,080,677 |
| Target Corporation | | | | 17,223 | 4,199,656 |
| | | | | | 7,100,083 |
| Specialty retail: 2.36% | | | | | |
| Advance Auto Parts Incorporated | | | | 2,278 | 502,800 |
| AutoZone Incorporated † | | | | 750 | 1,362,803 |
| Bath & Body Works Incorporated | | | | 9,217 | 692,473 |
| Best Buy Company Incorporated | | | | 7,848 | 838,637 |
| CarMax Incorporated † | | | | 5,672 | 801,170 |
| Lowe's Companies Incorporated | | | | 24,609 | 6,019,115 |
| O'Reilly Automotive Incorporated † | | | | 2,400 | 1,531,584 |
| Ross Stores Incorporated | | | | 12,433 | 1,356,316 |
| The Gap Incorporated | | | | 7,493 | 123,859 |
| The Home Depot Incorporated | | | | 37,016 | 14,828,980 |
| The TJX Companies Incorporated | | | | 42,002 | 2,914,939 |
| Tractor Supply Company | | | | 3,981 | 897,039 |
| Ulta Beauty Incorporated † | | | | 1,906 | 731,809 |
| | | | | | 32,601,524 |
| Textiles, apparel & luxury goods: 0.70% | | | | | |
| HanesBrands Incorporated | | | | 12,155 | 196,303 |
| Nike Incorporated Class B | | | | 44,495 | 7,530,334 |
| PVH Corporation | | | | 2,484 | 265,242 |
| Ralph Lauren Corporation | | | | 1,693 | 196,456 |
| Tapestry Incorporated | | | | 9,708 | 389,485 |
| Under Armour Incorporated Class A † | | | | 6,567 | 154,916 |
| Under Armour Incorporated Class C † | | | | 7,255 | 145,608 |
| VF Corporation | | | | 11,345 | 813,777 |
| | | | | | 9,692,121 |
| Consumer staples: 5.46% | | | | | |
| Beverages: 1.30% | | | | | |
| Brown-Forman Corporation Class B | | | | 6,361 | 447,560 |
| Constellation Brands Incorporated Class A | | | | 5,857 | 1,319,758 |
| Molson Coors Brewing Company Class B | | | | 6,559 | 291,482 |
| Monster Beverage Corporation † | | | | 13,073 | 1,095,256 |
| PepsiCo Incorporated | | | | 48,117 | 7,688,134 |
| The Coca-Cola Company | | | | 135,250 | 7,093,863 |
| | | | | | 17,936,053 |
| Food & staples retailing: 1.35% | | | | | |
| Costco Wholesale Corporation | | | | 15,390 | 8,301,058 |
| Sysco Corporation | | | | 17,810 | 1,247,412 |
| The Kroger Company | | | | 23,673 | 983,140 |
| Walgreens Boots Alliance Incorporated | | | | 24,994 | 1,119,731 |
| Walmart Incorporated | | | | 49,752 | 6,996,624 |
| | | | | | 18,647,965 |
| Food products: 0.81% | | | | | |
| Archer Daniels Midland Company | | | | 19,474 | 1,211,478 |
| Campbell Soup Company | | | | 7,069 | 285,093 |
| ConAgra Foods Incorporated | | | | 16,722 | 510,857 |
| General Mills Incorporated | | | | 21,107 | 1,303,779 |
The accompanying notes are an integral part of these financial statements.
22 | Allspring Index Portfolio
Portfolio of investments—November 30, 2021 (unaudited)
| | | | | Shares | Value |
| Food products (continued) | | | | | |
| Hormel Foods Corporation | | | | 9,813 | $ 406,258 |
| Kellogg Company | | | | 8,900 | 544,502 |
| Lamb Weston Holdings Incorporated | | | | 5,052 | 262,300 |
| McCormick & Company Incorporated | | | | 8,675 | 744,489 |
| Mondelez International Incorporated Class A | | | | 48,663 | 2,868,197 |
| The Hershey Company | | | | 5,063 | 898,632 |
| The J.M. Smucker Company | | | | 3,772 | 477,045 |
| The Kraft Heinz Company | | | | 24,716 | 830,705 |
| Tyson Foods Incorporated Class A | | | | 10,264 | 810,445 |
| | | | | | 11,153,780 |
| Household products: 1.26% | | | | | |
| Church & Dwight Company Incorporated | | | | 8,548 | 764,020 |
| Colgate-Palmolive Company | | | | 29,366 | 2,203,037 |
| Kimberly-Clark Corporation | | | | 11,724 | 1,527,754 |
| The Clorox Company | | | | 4,276 | 696,347 |
| The Procter & Gamble Company | | | | 84,508 | 12,218,167 |
| | | | | | 17,409,325 |
| Personal products: 0.20% | | | | | |
| The Estee Lauder Companies Incorporated Class A | | | | 8,073 | 2,680,801 |
| Tobacco: 0.54% | | | | | |
| Altria Group Incorporated | | | | 64,199 | 2,737,445 |
| Philip Morris International Incorporated | | | | 54,259 | 4,663,018 |
| | | | | | 7,400,463 |
| Energy: 2.65% | | | | | |
| Energy equipment & services: 0.20% | | | | | |
| Baker Hughes Incorporated | | | | 28,843 | 673,196 |
| Halliburton Company | | | | 31,002 | 669,333 |
| Schlumberger Limited | | | | 48,685 | 1,396,286 |
| | | | | | 2,738,815 |
| Oil, gas & consumable fuels: 2.45% | | | | | |
| APA Corporation | | | | 13,160 | 339,133 |
| Cabot Oil & Gas Corporation | | | | 28,283 | 567,923 |
| Chevron Corporation | | | | 67,327 | 7,599,198 |
| ConocoPhillips | | | | 46,618 | 3,269,320 |
| Devon Energy Corporation | | | | 21,919 | 921,913 |
| Diamondback Energy Incorporated | | | | 5,925 | 632,375 |
| EOG Resources Incorporated | | | | 20,326 | 1,768,362 |
| Exxon Mobil Corporation | | | | 147,386 | 8,819,578 |
| Hess Corporation | | | | 9,595 | 715,019 |
| Kinder Morgan Incorporated | | | | 67,859 | 1,049,100 |
| Marathon Oil Corporation | | | | 27,447 | 425,154 |
| Marathon Petroleum Corporation | | | | 22,218 | 1,351,965 |
| Occidental Petroleum Corporation | | | | 30,881 | 915,622 |
| ONEOK Incorporated | | | | 15,515 | 928,418 |
| Phillips 66 | | | | 15,248 | 1,054,704 |
| Pioneer Natural Resources Company | | | | 7,899 | 1,408,550 |
| The Williams Companies Incorporated | | | | 42,297 | 1,133,137 |
| Valero Energy Corporation | | | | 14,233 | 952,757 |
| | | | | | 33,852,228 |
The accompanying notes are an integral part of these financial statements.
Allspring Index Portfolio | 23
Portfolio of investments—November 30, 2021 (unaudited)
| | | | | Shares | Value |
| Financials: 10.60% | | | | | |
| Banks: 4.05% | | | | | |
| Bank of America Corporation | | | | 257,799 | $ 11,464,322 |
| Citigroup Incorporated | | | | 70,560 | 4,494,672 |
| Citizens Financial Group Incorporated | | | | 14,834 | 701,203 |
| Comerica Incorporated | | | | 4,662 | 384,755 |
| Fifth Third Bancorp | | | | 24,046 | 1,013,539 |
| First Republic Bank | | | | 6,138 | 1,286,893 |
| Huntington Bancshares Incorporated | | | | 51,404 | 762,835 |
| JPMorgan Chase & Company | | | | 104,029 | 16,522,926 |
| KeyCorp | | | | 33,295 | 747,140 |
| M&T Bank Corporation | | | | 4,480 | 656,813 |
| People's United Financial Incorporated | | | | 14,899 | 253,879 |
| PNC Financial Services Group Incorporated | | | | 14,796 | 2,914,812 |
| Regions Financial Corporation | | | | 33,231 | 756,005 |
| SVB Financial Group † | | | | 2,042 | 1,413,738 |
| Truist Financial Corporation | | | | 46,470 | 2,756,136 |
| US Bancorp | | | | 46,970 | 2,599,320 |
| Wells Fargo & Company | | | | 142,959 | 6,830,581 |
| Zions Bancorporation | | | | 5,642 | 355,897 |
| | | | | | 55,915,466 |
| Capital markets: 2.91% | | | | | |
| Ameriprise Financial Incorporated | | | | 3,960 | 1,146,816 |
| Bank of New York Mellon Corporation | | | | 27,646 | 1,514,724 |
| BlackRock Incorporated | | | | 4,981 | 4,505,862 |
| Cboe Global Markets Incorporated | | | | 3,712 | 478,625 |
| CME Group Incorporated | | | | 12,503 | 2,757,162 |
| Franklin Resources Incorporated | | | | 9,803 | 317,617 |
| Intercontinental Exchange Incorporated | | | | 19,606 | 2,562,896 |
| Invesco Limited | | | | 11,886 | 265,414 |
| MarketAxess Holdings Incorporated | | | | 1,323 | 466,609 |
| Moody's Corporation | | | | 5,640 | 2,203,210 |
| Morgan Stanley | | | | 50,816 | 4,818,373 |
| MSCI Incorporated | | | | 2,870 | 1,806,522 |
| Northern Trust Corporation | | | | 7,255 | 839,404 |
| Raymond James Financial Incorporated | | | | 6,448 | 633,774 |
| S&P Global Incorporated | | | | 8,390 | 3,823,575 |
| State Street Corporation | | | | 12,729 | 1,132,499 |
| T. Rowe Price Group Incorporated | | | | 7,901 | 1,579,805 |
| The Charles Schwab Corporation | | | | 52,263 | 4,044,634 |
| The Goldman Sachs Group Incorporated | | | | 11,736 | 4,471,299 |
| The NASDAQ Incorporated | | | | 4,075 | 828,162 |
| | | | | | 40,196,982 |
| Consumer finance: 0.55% | | | | | |
| American Express Company | | | | 22,402 | 3,411,825 |
| Capital One Financial Corporation | | | | 15,531 | 2,182,571 |
| Discover Financial Services | | | | 10,426 | 1,124,444 |
| Synchrony Financial | | | | 19,833 | 888,320 |
| | | | | | 7,607,160 |
| Diversified financial services: 1.30% | | | | | |
| Berkshire Hathaway Incorporated Class B † | | | | 64,533 | 17,855,636 |
The accompanying notes are an integral part of these financial statements.
24 | Allspring Index Portfolio
Portfolio of investments—November 30, 2021 (unaudited)
| | | | | Shares | Value |
| Insurance: 1.79% | | | | | |
| AFLAC Incorporated | | | | 21,483 | $ 1,163,090 |
| American International Group Incorporated | | | | 29,773 | 1,566,060 |
| Aon plc Class A | | | | 7,859 | 2,324,456 |
| Arthur J. Gallagher & Company | | | | 7,198 | 1,172,554 |
| Assurant Incorporated | | | | 2,048 | 311,501 |
| Brown & Brown Incorporated | | | | 8,137 | 524,104 |
| Chubb Limited | | | | 15,274 | 2,741,225 |
| Cincinnati Financial Corporation | | | | 5,219 | 594,444 |
| Everest Reinsurance Group Limited | | | | 1,388 | 355,855 |
| Globe Life Incorporated | | | | 3,258 | 281,947 |
| Lincoln National Corporation | | | | 6,150 | 407,930 |
| Loews Corporation | | | | 7,076 | 378,283 |
| Marsh & McLennan Companies Incorporated | | | | 17,638 | 2,892,985 |
| MetLife Incorporated | | | | 25,357 | 1,487,442 |
| Principal Financial Group Incorporated | | | | 8,690 | 595,960 |
| Progressive Corporation | | | | 20,372 | 1,893,374 |
| Prudential Financial Incorporated | | | | 13,466 | 1,377,033 |
| The Allstate Corporation | | | | 10,294 | 1,119,164 |
| The Hartford Financial Services Group Incorporated | | | | 12,087 | 798,951 |
| The Travelers Companies Incorporated | | | | 8,686 | 1,276,408 |
| W.R. Berkley Corporation | | | | 4,883 | 374,233 |
| Willis Towers Watson plc | | | | 4,492 | 1,014,473 |
| | | | | | 24,651,472 |
| Health care: 12.44% | | | | | |
| Biotechnology: 1.74% | | | | | |
| AbbVie Incorporated | | | | 61,522 | 7,092,256 |
| Amgen Incorporated | | | | 19,769 | 3,931,659 |
| Biogen Incorporated † | | | | 5,188 | 1,223,019 |
| Gilead Sciences Incorporated | | | | 43,650 | 3,008,795 |
| Incyte Corporation † | | | | 6,535 | 442,550 |
| Moderna Incorporated † | | | | 12,226 | 4,308,809 |
| Regeneron Pharmaceuticals Incorporated † | | | | 3,659 | 2,329,063 |
| Vertex Pharmaceuticals Incorporated † | | | | 9,032 | 1,688,442 |
| | | | | | 24,024,593 |
| Health care equipment & supplies: 2.86% | | | | | |
| Abbott Laboratories | | | | 61,718 | 7,762,273 |
| ABIOMED Incorporated † | | | | 1,580 | 497,352 |
| Align Technology Incorporated † | | | | 2,558 | 1,564,294 |
| Baxter International Incorporated | | | | 17,404 | 1,297,816 |
| Becton Dickinson & Company | | | | 9,998 | 2,370,926 |
| Boston Scientific Corporation † | | | | 49,570 | 1,887,130 |
| Dentsply Sirona Incorporated | | | | 7,609 | 370,863 |
| DexCom Incorporated † | | | | 3,368 | 1,894,803 |
| Edwards Lifesciences Corporation † | | | | 21,700 | 2,328,627 |
| Hologic Incorporated † | | | | 8,825 | 659,492 |
| IDEXX Laboratories Incorporated † | | | | 2,962 | 1,801,103 |
| Intuitive Surgical Incorporated † | | | | 12,418 | 4,027,654 |
| Medtronic plc | | | | 46,786 | 4,992,066 |
| ResMed Incorporated | | | | 5,066 | 1,291,070 |
| STERIS plc | | | | 3,473 | 758,955 |
| Stryker Corporation | | | | 11,684 | 2,764,785 |
| Teleflex Incorporated | | | | 1,629 | 484,497 |
The accompanying notes are an integral part of these financial statements.
Allspring Index Portfolio | 25
Portfolio of investments—November 30, 2021 (unaudited)
| | | | | Shares | Value |
| Health care equipment & supplies (continued) | | | | | |
| The Cooper Companies Incorporated | | | | 1,715 | $ 645,646 |
| West Pharmaceutical Services Incorporated | | | | 2,575 | 1,139,850 |
| Zimmer Biomet Holdings Incorporated | | | | 7,271 | 869,612 |
| | | | | | 39,408,814 |
| Health care providers & services: 2.49% | | | | | |
| AmerisourceBergen Corporation | | | | 5,208 | 602,826 |
| Anthem Incorporated | | | | 8,488 | 3,448,080 |
| Cardinal Health Incorporated | | | | 10,101 | 466,969 |
| Centene Corporation † | | | | 20,298 | 1,449,480 |
| Cigna Corporation | | | | 11,840 | 2,272,096 |
| CVS Health Corporation | | | | 45,939 | 4,091,327 |
| DaVita HealthCare Partners Incorporated † | | | | 2,335 | 220,658 |
| HCA Healthcare Incorporated | | | | 8,582 | 1,936,013 |
| Henry Schein Incorporated † | | | | 4,863 | 345,565 |
| Humana Incorporated | | | | 4,474 | 1,877,783 |
| Laboratory Corporation of America Holdings † | | | | 3,366 | 960,421 |
| McKesson Corporation | | | | 5,385 | 1,167,253 |
| Quest Diagnostics Incorporated | | | | 4,254 | 632,485 |
| UnitedHealth Group Incorporated | | | | 32,826 | 14,581,966 |
| Universal Health Services Incorporated Class B | | | | 2,641 | 313,566 |
| | | | | | 34,366,488 |
| Health care technology: 0.05% | | | | | |
| Cerner Corporation | | | | 10,290 | 724,931 |
| Life sciences tools & services: 1.85% | | | | | |
| Agilent Technologies Incorporated | | | | 10,564 | 1,594,108 |
| Bio-Rad Laboratories Incorporated Class A † | | | | 748 | 563,394 |
| Bio-Techne Corporation | | | | 1,354 | 639,129 |
| Charles River Laboratories International Incorporated † | | | | 1,755 | 642,102 |
| Danaher Corporation | | | | 22,120 | 7,114,677 |
| Illumina Incorporated † | | | | 5,107 | 1,865,740 |
| IQVIA Holdings Incorporated † | | | | 6,671 | 1,728,656 |
| Mettler-Toledo International Incorporated † | | | | 805 | 1,218,875 |
| PerkinElmer Incorporated | | | | 3,903 | 710,970 |
| Thermo Fisher Scientific Incorporated | | | | 13,696 | 8,667,240 |
| Waters Corporation † | | | | 2,136 | 700,758 |
| | | | | | 25,445,649 |
| Pharmaceuticals: 3.45% | | | | | |
| Bristol-Myers Squibb Company | | | | 77,360 | 4,148,817 |
| Catalent Incorporated † | | | | 5,930 | 762,954 |
| Eli Lilly & Company | | | | 27,641 | 6,856,074 |
| Johnson & Johnson | | | | 91,646 | 14,290,361 |
| Merck & Company Incorporated | | | | 88,127 | 6,601,594 |
| Organon & Company | | | | 8,826 | 257,984 |
| Pfizer Incorporated | | | | 195,190 | 10,487,559 |
| Viatris Incorporated | | | | 42,100 | 518,251 |
| Zoetis Incorporated | | | | 16,500 | 3,663,660 |
| | | | | | 47,587,254 |
| Industrials: 7.63% | | | | | |
| Aerospace & defense: 1.30% | | | | | |
| General Dynamics Corporation | | | | 8,077 | 1,526,311 |
The accompanying notes are an integral part of these financial statements.
26 | Allspring Index Portfolio
Portfolio of investments—November 30, 2021 (unaudited)
| | | | | Shares | Value |
| Aerospace & defense (continued) | | | | | |
| Howmet Aerospace Incorporated | | | | 13,439 | $ 378,039 |
| Huntington Ingalls Industries Incorporated | | | | 1,397 | 247,981 |
| L3Harris Technologies Incorporated | | | | 6,996 | 1,462,724 |
| Lockheed Martin Corporation | | | | 8,580 | 2,859,886 |
| Northrop Grumman Corporation | | | | 5,240 | 1,827,712 |
| Raytheon Technologies Corporation | | | | 52,495 | 4,247,895 |
| Textron Incorporated | | | | 7,803 | 552,452 |
| The Boeing Company † | | | | 19,182 | 3,795,159 |
| TransDigm Group Incorporated † | | | | 1,823 | 1,053,785 |
| | | | | | 17,951,944 |
| Air freight & logistics: 0.59% | | | | | |
| C.H. Robinson Worldwide Incorporated | | | | 4,585 | 435,988 |
| Expeditors International of Washington Incorporated | | | | 5,915 | 719,382 |
| FedEx Corporation | | | | 8,563 | 1,972,658 |
| United Parcel Service Incorporated Class B | | | | 25,354 | 5,029,473 |
| | | | | | 8,157,501 |
| Airlines: 0.20% | | | | | |
| Alaska Air Group Incorporated † | | | | 4,360 | 211,765 |
| American Airlines Group Incorporated † | | | | 22,540 | 398,733 |
| Delta Air Lines Incorporated † | | | | 22,278 | 806,464 |
| Southwest Airlines Company † | | | | 20,597 | 914,507 |
| United Airlines Holdings Incorporated † | | | | 11,266 | 476,101 |
| | | | | | 2,807,570 |
| Building products: 0.50% | | | | | |
| A.O. Smith Corporation | | | | 4,637 | 366,555 |
| Allegion plc | | | | 3,123 | 386,128 |
| Carrier Global Corporation | | | | 30,208 | 1,634,857 |
| Fortune Brands Home & Security Incorporated | | | | 4,800 | 482,544 |
| Johnson Controls International plc | | | | 24,795 | 1,853,674 |
| Masco Corporation | | | | 8,605 | 567,070 |
| Trane Technologies plc | | | | 8,272 | 1,543,969 |
| | | | | | 6,834,797 |
| Commercial services & supplies: 0.42% | | | | | |
| Cintas Corporation | | | | 3,047 | 1,286,413 |
| Copart Incorporated † | | | | 7,413 | 1,076,071 |
| Republic Services Incorporated | | | | 7,315 | 967,482 |
| Rollins Incorporated | | | | 7,880 | 262,246 |
| Waste Management Incorporated | | | | 13,487 | 2,166,956 |
| | | | | | 5,759,168 |
| Construction & engineering: 0.04% | | | | | |
| Quanta Services Incorporated | | | | 4,844 | 551,150 |
| Electrical equipment: 0.54% | | | | | |
| AMETEK Incorporated | | | | 8,049 | 1,098,689 |
| Eaton Corporation plc | | | | 13,877 | 2,248,907 |
| Emerson Electric Company | | | | 20,812 | 1,828,126 |
| Generac Holdings Incorporated † | | | | 2,197 | 925,464 |
| Rockwell Automation Incorporated | | | | 4,039 | 1,357,912 |
| | | | | | 7,459,098 |
The accompanying notes are an integral part of these financial statements.
Allspring Index Portfolio | 27
Portfolio of investments—November 30, 2021 (unaudited)
| | | | | Shares | Value |
| Industrial conglomerates: 0.99% | | | | | |
| 3M Company | | | | 20,145 | $ 3,425,456 |
| General Electric Company | | | | 38,214 | 3,629,948 |
| Honeywell International Incorporated | | | | 24,035 | 4,860,838 |
| Roper Technologies Incorporated | | | | 3,670 | 1,703,431 |
| | | | | | 13,619,673 |
| Machinery: 1.48% | | | | | |
| Caterpillar Incorporated | | | | 19,060 | 3,685,251 |
| Cummins Incorporated | | | | 4,999 | 1,048,540 |
| Deere & Company | | | | 9,882 | 3,414,626 |
| Dover Corporation | | | | 5,012 | 821,216 |
| Fortive Corporation | | | | 12,477 | 921,676 |
| IDEX Corporation | | | | 2,646 | 594,265 |
| Illinois Tool Works Incorporated | | | | 9,978 | 2,316,393 |
| Ingersoll Rand Incorporated | | | | 14,106 | 822,944 |
| Otis Worldwide Corporation | | | | 14,858 | 1,194,583 |
| PACCAR Incorporated | | | | 12,086 | 1,008,214 |
| Parker-Hannifin Corporation | | | | 4,493 | 1,357,156 |
| Pentair plc | | | | 5,774 | 425,486 |
| Snap-on Incorporated | | | | 1,879 | 386,905 |
| Stanley Black & Decker Incorporated | | | | 5,673 | 991,413 |
| Wabtec Corporation | | | | 6,581 | 584,195 |
| Xylem Incorporated | | | | 6,272 | 759,602 |
| | | | | | 20,332,465 |
| Professional services: 0.43% | | | | | |
| Equifax Incorporated | | | | 4,242 | 1,182,033 |
| IHS Markit Limited | | | | 13,877 | 1,773,758 |
| Jacobs Engineering Group Incorporated | | | | 4,537 | 646,795 |
| Leidos Holdings Incorporated | | | | 4,928 | 433,220 |
| Nielsen Holdings plc | | | | 12,491 | 239,328 |
| Robert Half International Incorporated | | | | 3,898 | 433,341 |
| Verisk Analytics Incorporated | | | | 5,617 | 1,263,095 |
| | | | | | 5,971,570 |
| Road & rail: 0.94% | | | | | |
| CSX Corporation | | | | 78,487 | 2,720,359 |
| J.B. Hunt Transport Services Incorporated | | | | 2,930 | 560,099 |
| Kansas City Southern | | | | 3,167 | 921,122 |
| Norfolk Southern Corporation | | | | 8,598 | 2,280,791 |
| Old Dominion Freight Line Incorporated | | | | 3,266 | 1,159,985 |
| Union Pacific Corporation | | | | 22,703 | 5,349,735 |
| | | | | | 12,992,091 |
| Trading companies & distributors: 0.20% | | | | | |
| Fastenal Company | | | | 20,009 | 1,183,933 |
| United Rentals Incorporated † | | | | 2,520 | 853,625 |
| W.W. Grainger Incorporated | | | | 1,523 | 733,187 |
| | | | | | 2,770,745 |
| Information technology: 28.71% | | | | | |
| Communications equipment: 0.82% | | | | | |
| Arista Networks Incorporated † | | | | 7,800 | 967,668 |
| Cisco Systems Incorporated | | | | 146,712 | 8,045,686 |
The accompanying notes are an integral part of these financial statements.
28 | Allspring Index Portfolio
Portfolio of investments—November 30, 2021 (unaudited)
| | | | | Shares | Value |
| Communications equipment (continued) | | | | | |
| F5 Networks Incorporated † | | | | 2,100 | $ 477,918 |
| Juniper Networks Incorporated | | | | 11,320 | 352,392 |
| Motorola Solutions Incorporated | | | | 5,895 | 1,492,496 |
| | | | | | 11,336,160 |
| Electronic equipment, instruments & components: 0.67% | | | | | |
| Amphenol Corporation Class A | | | | 20,825 | 1,678,079 |
| CDW Corporation of Delaware | | | | 4,787 | 906,466 |
| Corning Incorporated | | | | 26,759 | 992,491 |
| IPG Photonics Corporation † | | | | 1,248 | 204,909 |
| Keysight Technologies Incorporated † | | | | 6,414 | 1,247,395 |
| TE Connectivity Limited | | | | 11,419 | 1,757,727 |
| Teledyne Technologies Incorporated † | | | | 1,623 | 674,016 |
| Trimble Incorporated † | | | | 8,760 | 752,221 |
| Zebra Technologies Corporation Class A † | | | | 1,859 | 1,094,542 |
| | | | | | 9,307,846 |
| IT services: 4.07% | | | | | |
| Accenture plc Class A | | | | 22,077 | 7,890,320 |
| Akamai Technologies Incorporated † | | | | 5,669 | 638,896 |
| Automatic Data Processing Incorporated | | | | 14,729 | 3,400,779 |
| Broadridge Financial Solutions Incorporated | | | | 4,044 | 681,697 |
| Cognizant Technology Solutions Corporation Class A | | | | 18,298 | 1,426,878 |
| DXC Technology Company † | | | | 8,770 | 263,012 |
| Fidelity National Information Services Incorporated | | | | 21,504 | 2,247,168 |
| Fiserv Incorporated † | | | | 20,748 | 2,002,597 |
| FleetCor Technologies Incorporated † | | | | 2,876 | 595,706 |
| Gartner Incorporated † | | | | 2,912 | 909,272 |
| Global Payments Incorporated | | | | 10,226 | 1,217,303 |
| International Business Machines Corporation | | | | 31,204 | 3,653,988 |
| Jack Henry & Associates Incorporated | | | | 2,586 | 392,115 |
| MasterCard Incorporated Class A | | | | 30,328 | 9,550,894 |
| Paychex Incorporated | | | | 11,149 | 1,328,961 |
| PayPal Holdings Incorporated † | | | | 40,907 | 7,563,295 |
| The Western Union Company | | | | 14,146 | 223,790 |
| VeriSign Incorporated † | | | | 3,388 | 812,815 |
| Visa Incorporated Class A | | | | 58,753 | 11,384,569 |
| | | | | | 56,184,055 |
| Semiconductors & semiconductor equipment: 6.53% | | | | | |
| Advanced Micro Devices Incorporated † | | | | 42,228 | 6,687,648 |
| Analog Devices Incorporated | | | | 18,726 | 3,375,362 |
| Applied Materials Incorporated | | | | 31,819 | 4,683,439 |
| Broadcom Incorporated | | | | 14,283 | 7,908,211 |
| Enphase Energy Incorporated † | | | | 4,687 | 1,171,750 |
| Intel Corporation | | | | 141,239 | 6,948,959 |
| KLA Corporation | | | | 5,317 | 2,170,027 |
| Lam Research Corporation | | | | 4,961 | 3,372,736 |
| Microchip Technology Incorporated | | | | 19,080 | 1,591,844 |
| Micron Technology Incorporated | | | | 39,192 | 3,292,128 |
| Monolithic Power Systems Incorporated | | | | 1,503 | 831,850 |
| NVIDIA Corporation | | | | 86,756 | 28,348,391 |
| NXP Semiconductors NV | | | | 9,230 | 2,061,613 |
| Qorvo Incorporated † | | | | 3,869 | 565,764 |
| Qualcomm Incorporated | | | | 39,270 | 7,090,591 |
The accompanying notes are an integral part of these financial statements.
Allspring Index Portfolio | 29
Portfolio of investments—November 30, 2021 (unaudited)
| | | | | Shares | Value |
| Semiconductors & semiconductor equipment (continued) | | | | | |
| Skyworks Solutions Incorporated | | | | 5,749 | $ 871,893 |
| Teradyne Incorporated | | | | 5,743 | 877,932 |
| Texas Instruments Incorporated | | | | 32,140 | 6,182,772 |
| Xilinx Incorporated | | | | 8,615 | 1,968,097 |
| | | | | | 90,001,007 |
| Software: 9.76% | | | | | |
| Adobe Incorporated † | | | | 16,585 | 11,109,462 |
| ANSYS Incorporated † | | | | 3,038 | 1,189,316 |
| Autodesk Incorporated † | | | | 7,659 | 1,946,841 |
| Cadence Design Systems Incorporated † | | | | 9,636 | 1,710,005 |
| Ceridian HCM Holding Incorporated † | | | | 4,696 | 513,742 |
| Citrix Systems Incorporated | | | | 4,325 | 347,860 |
| Fortinet Incorporated † | | | | 4,719 | 1,567,227 |
| Intuit Incorporated | | | | 9,513 | 6,205,330 |
| Microsoft Corporation | | | | 261,621 | 86,489,286 |
| NortonLifeLock Incorporated | | | | 20,236 | 502,865 |
| Oracle Corporation | | | | 57,348 | 5,203,758 |
| Paycom Software Incorporated † | | | | 1,674 | 732,342 |
| PTC Incorporated † | | | | 3,678 | 403,035 |
| Salesforce.com Incorporated † | | | | 33,823 | 9,638,202 |
| ServiceNow Incorporated † | | | | 6,897 | 4,467,187 |
| Synopsys Incorporated † | | | | 5,312 | 1,811,392 |
| Tyler Technologies Incorporated † | | | | 1,422 | 737,990 |
| | | | | | 134,575,840 |
| Technology hardware, storage & peripherals: 6.86% | | | | | |
| Apple Incorporated | | | | 546,702 | 90,369,841 |
| Hewlett Packard Enterprise Company | | | | 45,464 | 652,408 |
| HP Incorporated | | | | 41,820 | 1,475,410 |
| NetApp Incorporated | | | | 7,799 | 693,175 |
| Seagate Technology Holdings plc | | | | 7,290 | 748,464 |
| Western Digital Corporation † | | | | 10,669 | 617,095 |
| | | | | | 94,556,393 |
| Materials: 2.44% | | | | | |
| Chemicals: 1.69% | | | | | |
| Air Products & Chemicals Incorporated | | | | 7,707 | 2,215,300 |
| Albemarle Corporation | | | | 4,071 | 1,084,881 |
| Celanese Corporation Series A | | | | 3,868 | 585,460 |
| CF Industries Holdings Incorporated | | | | 7,488 | 453,698 |
| Corteva Incorporated | | | | 25,560 | 1,150,200 |
| Dow Incorporated | | | | 25,963 | 1,426,148 |
| DuPont de Nemours Incorporated | | | | 18,210 | 1,346,812 |
| Eastman Chemical Company | | | | 4,727 | 492,979 |
| Ecolab Incorporated | | | | 8,665 | 1,919,038 |
| FMC Corporation | | | | 4,480 | 448,851 |
| International Flavors & Fragrances Incorporated | | | | 8,671 | 1,232,756 |
| Linde plc | | | | 17,978 | 5,719,521 |
| LyondellBasell Industries NV Class A | | | | 9,200 | 801,596 |
| PPG Industries Incorporated | | | | 8,263 | 1,273,907 |
| The Mosaic Company | | | | 12,895 | 441,267 |
| The Sherwin-Williams Company | | | | 8,433 | 2,793,347 |
| | | | | | 23,385,761 |
The accompanying notes are an integral part of these financial statements.
30 | Allspring Index Portfolio
Portfolio of investments—November 30, 2021 (unaudited)
| | | | | Shares | Value |
| Construction materials: 0.13% | | | | | |
| Martin Marietta Materials Incorporated | | | | 2,172 | $ 876,424 |
| Vulcan Materials Company | | | | 4,619 | 885,185 |
| | | | | | 1,761,609 |
| Containers & packaging: 0.29% | | | | | |
| Amcor plc | | | | 53,676 | 607,612 |
| Avery Dennison Corporation | | | | 2,885 | 591,627 |
| Ball Corporation | | | | 11,371 | 1,062,620 |
| International Paper Company | | | | 13,606 | 619,345 |
| Packaging Corporation of America | | | | 3,307 | 431,861 |
| Sealed Air Corporation | | | | 5,218 | 324,142 |
| WestRock Company | | | | 9,295 | 403,310 |
| | | | | | 4,040,517 |
| Metals & mining: 0.33% | | | | | |
| Freeport-McMoRan Incorporated | | | | 51,109 | 1,895,122 |
| Newmont Corporation | | | | 27,821 | 1,527,929 |
| Nucor Corporation | | | | 10,225 | 1,086,509 |
| | | | | | 4,509,560 |
| Real estate: 2.56% | | | | | |
| Equity REITs: 2.48% | | | | | |
| Alexandria Real Estate Equities Incorporated | | | | 4,827 | 965,738 |
| American Tower Corporation | | | | 15,845 | 4,158,996 |
| AvalonBay Communities Incorporated | | | | 4,861 | 1,161,147 |
| Boston Properties Incorporated | | | | 4,948 | 533,592 |
| Crown Castle International Corporation | | | | 15,046 | 2,733,106 |
| Digital Realty Trust Incorporated | | | | 9,838 | 1,650,226 |
| Duke Realty Corporation | | | | 13,171 | 768,264 |
| Equinix Incorporated | | | | 3,125 | 2,538,125 |
| Equity Residential | | | | 11,863 | 1,012,033 |
| Essex Property Trust Incorporated | | | | 2,264 | 768,492 |
| Extra Space Storage Incorporated | | | | 4,658 | 931,600 |
| Federal Realty Investment Trust | | | | 2,437 | 298,947 |
| Healthpeak Properties Incorporated | | | | 18,763 | 616,552 |
| Host Hotels & Resorts Incorporated † | | | | 24,856 | 390,239 |
| Iron Mountain Incorporated | | | | 10,077 | 457,899 |
| Kimco Realty Corporation | | | | 21,359 | 478,869 |
| Mid-America Apartment Communities Incorporated | | | | 4,039 | 833,044 |
| Prologis Incorporated | | | | 25,736 | 3,879,702 |
| Public Storage Incorporated | | | | 5,307 | 1,737,406 |
| Realty Income Corporation | | | | 19,180 | 1,302,706 |
| Regency Centers Corporation | | | | 5,323 | 369,097 |
| SBA Communications Corporation | | | | 3,814 | 1,311,253 |
| Simon Property Group Incorporated | | | | 11,440 | 1,748,490 |
| UDR Incorporated | | | | 9,714 | 551,075 |
| Ventas Incorporated | | | | 13,698 | 642,710 |
| Vornado Realty Trust | | | | 5,535 | 222,175 |
| Welltower Incorporated | | | | 14,711 | 1,171,290 |
| Weyerhaeuser Company | | | | 26,103 | 981,734 |
| | | | | | 34,214,507 |
| Real estate management & development: 0.08% | | | | | |
| CBRE Group Incorporated Class A † | | | | 11,688 | 1,117,022 |
The accompanying notes are an integral part of these financial statements.
Allspring Index Portfolio | 31
Portfolio of investments—November 30, 2021 (unaudited)
| | | | | Shares | Value |
| Utilities: 2.32% | | | | | |
| Electric utilities: 1.50% | | | | | |
| Alliant Energy Corporation | | | | 8,712 | $ 477,330 |
| American Electric Power Company Incorporated | | | | 17,416 | 1,411,567 |
| Duke Energy Corporation | | | | 26,783 | 2,598,219 |
| Edison International | | | | 13,219 | 862,936 |
| Entergy Corporation | | | | 6,996 | 701,979 |
| Evergy Incorporated | | | | 7,983 | 505,324 |
| Eversource Energy | | | | 11,963 | 984,196 |
| Exelon Corporation | | | | 34,042 | 1,795,035 |
| FirstEnergy Corporation | | | | 18,945 | 713,469 |
| NextEra Energy Incorporated | | | | 68,296 | 5,926,727 |
| NRG Energy Incorporated | | | | 8,522 | 306,962 |
| Pinnacle West Capital Corporation | | | | 3,926 | 255,386 |
| PPL Corporation | | | | 26,793 | 745,649 |
| The Southern Company | | | | 36,862 | 2,252,268 |
| Xcel Energy Incorporated | | | | 18,745 | 1,194,619 |
| | | | | | 20,731,666 |
| Gas utilities: 0.03% | | | | | |
| Atmos Energy Corporation | | | | 4,553 | 411,227 |
| Independent power & renewable electricity producers: 0.04% | | | | | |
| AES Corporation | | | | 23,198 | 542,369 |
| Multi-utilities: 0.67% | | | | | |
| Ameren Corporation | | | | 8,952 | 730,394 |
| CenterPoint Energy Incorporated | | | | 20,641 | 534,808 |
| CMS Energy Corporation | | | | 10,084 | 593,443 |
| Consolidated Edison Incorporated | | | | 12,303 | 955,205 |
| Dominion Energy Incorporated | | | | 28,146 | 2,003,995 |
| DTE Energy Company | | | | 6,745 | 730,753 |
| NiSource Incorporated | | | | 13,661 | 334,831 |
| Public Service Enterprise Group Incorporated | | | | 17,601 | 1,099,886 |
| Sempra Energy | | | | 11,117 | 1,332,595 |
| WEC Energy Group Incorporated | | | | 10,981 | 954,578 |
| | | | | | 9,270,488 |
| Water utilities: 0.08% | | | | | |
| American Water Works Company Incorporated | | | | 6,319 | 1,065,194 |
| Total Common stocks (Cost $291,040,100) | | | | | 1,349,247,694 |
| | | Yield | | | |
| Short-term investments: 1.94% | | | | | |
| Investment companies: 1.94% | | | | | |
| Allspring Government Money Market Fund Select Class ♠∞ | | 0.03% | | 26,342,178 | 26,342,178 |
| Securities Lending Cash Investments LLC ♠∩∞ | | 0.04 | | 391,200 | 391,200 |
| Total Short-term investments (Cost $26,733,378) | | | | | 26,733,378 |
| Total investments in securities (Cost $317,773,478) | 99.76% | | | | 1,375,981,072 |
| Other assets and liabilities, net | 0.24 | | | | 3,258,518 |
| Total net assets | 100.00% | | | | $1,379,239,590 |
The accompanying notes are an integral part of these financial statements.
32 | Allspring Index Portfolio
Portfolio of investments—November 30, 2021 (unaudited)
| † | Non-income-earning security |
| « | All or a portion of this security is on loan. |
| ♠ | The issuer of the security is an affiliated person of the Portfolio as defined in the Investment Company Act of 1940. |
| ∩ | The investment is a non-registered investment company purchased with cash collateral received from securities on loan. |
| ∞ | The rate represents the 7-day annualized yield at period end. |
| Abbreviations: |
| REIT | Real estate investment trust |
Investments in affiliates
An affiliated investment is an investment in which the Portfolio owns at least 5% of the outstanding voting shares of the issuer or as a result of other relationships, such as the Portfolio and the issuer having the same adviser or investment manager. Transactions with issuers that were either affiliates of the Portfolio at the beginning of the period or the end of the period were as follows:
| | Value,
beginning of
period | Purchases | Sales
proceeds | Net
realized
gains
(losses) | | Net
change in
unrealized
gains
(losses) | | Value,
end of
period | Shares,
end
of period | Income
from
affiliated
securities |
| Common Stocks | | | | | | | | | |
| Wells Fargo & Company* | $ 6,988,518 | $ 10,147 | $ (311,851) | $ 133,986 | | $ 9,781 | | $ 6,830,581 | 142,959 | $ 24,088 |
| Short-term investments | | | | | | | | | |
| Allspring Government Money Market Fund Select Class | 14,730,757 | 53,766,184 | (42,154,763) | 0 | | 0 | | 26,342,178 | 26,342,178 | 3,051 |
| Securities Lending Cash Investments LLC | 182,600 | 2,440,725 | (2,232,125) | 0 | | 0 | | 391,200 | 391,200 | 28 # |
| | | | | $133,986 | | $9,781 | | $33,563,959 | | $27,167 |
| * | No longer an affiliate of the Fund at the end of the period. |
| # | Amount shown represents income before fees and rebates. |
Futures contracts
| Description | Number of
contracts | Expiration
date | Notional
cost | Notional
value | Unrealized
gains | Unrealized
losses |
| Long | | | | | | |
| E-Mini S&P 500 Index | 131 | 12-17-2021 | $28,732,155 | $29,908,938 | $1,176,783 | $0 |
The accompanying notes are an integral part of these financial statements.
Allspring Index Portfolio | 33
Statement of assets and liabilities—November 30, 2021 (unaudited)
| | |
| Assets | |
Investments in unaffiliated securities (including $381,929 of securities loaned), at value (cost $291,040,100)
| $ 1,349,247,694 |
Investments in affiliated securities, at value (cost $26,733,378)
| 26,733,378 |
Cash at broker segregated for futures contracts
| 2,475,002 |
Receivable for dividends
| 1,717,008 |
Receivable for securities lending income, net
| 92 |
Prepaid expenses and other assets
| 131,410 |
Total assets
| 1,380,304,584 |
| Liabilities | |
Payable for daily variation margin on open futures contracts
| 555,113 |
Payable upon receipt of securities loaned
| 391,200 |
Advisory fee payable
| 107,651 |
Accrued expenses and other liabilities
| 11,030 |
Total liabilities
| 1,064,994 |
Total net assets
| $1,379,239,590 |
The accompanying notes are an integral part of these financial statements.
34 | Allspring Index Portfolio
Statement of operations—six months ended November 30, 2021 (unaudited)
| | |
| Investment income | |
Dividends (net of foreign withholdings taxes of $44,181)
| $ 9,177,426 |
Income from affiliated securities
| 27,718 |
Total investment income
| 9,205,144 |
| Expenses | |
Advisory fee
| 635,983 |
Custody and accounting fees
| 32,431 |
Professional fees
| 31,016 |
Interest holder report expenses
| 5,683 |
Trustees’ fees and expenses
| 9,662 |
Other fees and expenses
| 17,610 |
Total expenses
| 732,385 |
Net investment income
| 8,472,759 |
| Realized and unrealized gains (losses) on investments | |
| Net realized gains on | |
Unaffiliated securities
| 40,085,830 |
Futures contracts
| 3,513,398 |
Net realized gains on investments
| 43,599,228 |
| Net change in unrealized gains (losses) on | |
Unaffiliated securities
| 67,941,119 |
Futures contracts
| (14,982) |
Net change in unrealized gains (losses) on investments
| 67,926,137 |
Net realized and unrealized gains (losses) on investments
| 111,525,365 |
Net increase in net assets resulting from operations
| $119,998,124 |
The accompanying notes are an integral part of these financial statements.
Allspring Index Portfolio | 35
Statement of changes in net assets
| | | |
| | Six months ended
November 30, 2021
(unaudited) | Year ended
May 31, 2021 |
| Operations | | |
Net investment income
| $ 8,472,759 | $ 16,723,882 |
Net realized gains on investments
| 43,599,228 | 104,436,025 |
Net change in unrealized gains (losses) on investments
| 67,926,137 | 276,635,342 |
Net increase in net assets resulting from operations
| 119,998,124 | 397,795,249 |
| Capital transactions | | |
| Transactions in investors’ beneficial interests | | |
Contributions
| 2,126,891 | 13,277,558 |
Withdrawals
| (49,681,149) | (159,782,351) |
Net decrease in net assets resulting from capital transactions
| (47,554,258) | (146,504,793) |
Total increase in net assets
| 72,443,866 | 251,290,456 |
| Net assets | | |
Beginning of period
| 1,306,795,724 | 1,055,505,268 |
End of period
| $1,379,239,590 | $1,306,795,724 |
The accompanying notes are an integral part of these financial statements.
36 | Allspring Index Portfolio
| | | Year ended May 31 |
| | Six months ended
November 30, 2021
(unaudited) | 2021 | 2020 | 2019 | 2018 | 2017 |
Total return1
| 9.31% | 40.16% | 12.74% | 3.67% | 14.27% | 17.36% |
| Ratios to average net assets (annualized) | | | | | | |
Gross expenses
| 0.11% | 0.11% | 0.12% | 0.11% | 0.10% | 0.10% |
Net expenses
| 0.11% | 0.11% | 0.12% | 0.11% | 0.10% | 0.10% |
Net investment income
| 1.24% | 1.41% | 1.80% | 1.86% | 1.84% | 2.03% |
| Supplemental data | | | | | | |
Portfolio turnover rate
| 1% | 4% | 3% | 4% | 3% | 9% |
| 1 | Returns for periods of less than one year are not annualized. |
The accompanying notes are an integral part of these financial statements.
Allspring Index Portfolio | 37
Notes to financial statements (unaudited)
1. ORGANIZATION
Allspring Master Trust (the "Trust"), a Delaware statutory trust organized on March 10, 1999, is an open-end management investment company registered under the Investment Company Act of 1940, as amended (the "1940 Act"). As an investment company, the Trust follows the accounting and reporting guidance in Financial Accounting Standards Board ("FASB") Accounting Standards Codification Topic 946, Financial Services – Investment Companies. These financial statements report on the Allspring Index Portfolio (the "Portfolio") which is a diversified series of the Trust.
Interests in the Portfolio are available solely through private placement transactions that do not involve any "public offering" within the meaning of Section 4(a)(2) of the Securities Act of 1933.
On February 23, 2021, Wells Fargo & Company entered into a definitive agreement to sell Wells Fargo Asset Management ("WFAM") to GTCR LLC and Reverence Capital Partners, L.P. WFAM was the trade name used by the asset management businesses of Wells Fargo & Company and included Wells Fargo Funds Management, LLC, Wells Capital Management, LLC, Wells Fargo Asset Management (International) Limited and Wells Fargo Funds Distributor, LLC. Effective on November 1, 2021, the sale transaction of WFAM by Wells Fargo & Company to GTCR LLC and Reverence Capital Partners, L.P. was closed. In connection with the closing of the transaction, WFAM became known as Allspring Global Investments (“Allspring”) and various entities that provide services to the Portfolio changed their names to "Allspring", including Allspring Funds Management, LLC (formerly Wells Fargo Funds Management, LLC), the adviser to the Portfolio, Allspring Global Investments, Inc. (formerly Wells Capital Management, LLC) and Allspring Global Investments (UK) Limited (formerly Wells Fargo Asset Management (International) Limited), both registered investment advisers providing subadvisory services to certain funds, and Allspring Funds Distributor, LLC (formerly Wells Fargo Funds Distributor, LLC).
Consummation of the transaction resulted in the automatic termination of the Portfolio’s advisory agreement and subadvisory agreement. The Portfolio’s Board of Trustees approved a new advisory agreement and subadvisory agreement which were approved by the Portfolio's interest holders on September 15, 2021. The new agreements became effective on November 1, 2021.
Effective December 6, 2021, "Wells Fargo" was removed from the Portfolio's name and replaced it with "Allspring".
2. SIGNIFICANT ACCOUNTING POLICIES
The following significant accounting policies, which are consistently followed in the preparation of the financial statements of the Portfolio, are in conformity with U.S. generally accepted accounting principles which require management to make estimates and assumptions that affect the reported amounts of assets and liabilities, disclosure of contingent assets and liabilities at the date of the financial statements, and the reported amounts of income and expenses during the reporting period. Actual results could differ from those estimates.
Securities valuation
All investments are valued each business day as of the close of regular trading on the New York Stock Exchange (generally 4 p.m. Eastern Time), although the Portfolio may deviate from this calculation time under unusual or unexpected circumstances.
Equity securities and futures contracts that are listed on a foreign or domestic exchange or market are valued at the official closing price or, if none, the last sales price. If no sale occurs on the principal exchange or market that day, a fair value price will be determined in accordance with the Portfolio’s Valuation Procedures.
Investments in registered open-end investment companies are valued at net asset value. Interests in non-registered investment companies that are redeemable at net asset value are fair valued normally at net asset value.
Investments which are not valued using any of the methods discussed above are valued at their fair value, as determined in good faith by the Board of Trustees. The Board of Trustees has established a Valuation Committee comprised of the Trustees and has delegated to it the authority to take any actions regarding the valuation of portfolio securities that the Valuation Committee deems necessary or appropriate, including determining the fair value of portfolio securities, unless the determination has been delegated to the Allspring Global Investments Pricing Committee at Allspring Funds Management, LLC ("Allspring Funds Management"). The Board of Trustees retains the authority to make or ratify any valuation decisions or approve any changes to the Valuation Procedures as it deems appropriate. On a quarterly basis, the Board of Trustees receives reports on any valuation actions taken by the Valuation Committee or the Allspring Global Investments Pricing Committee which may include items for ratification.
38 | Allspring Index Portfolio
Notes to financial statements (unaudited)
Securities lending
The Portfolio may lend its securities from time to time in order to earn additional income in the form of fees or interest on securities received as collateral or the investment of any cash received as collateral. When securities are on loan, the Portfolio receives interest or dividends on those securities. Cash collateral received in connection with its securities lending transactions is invested in Securities Lending Cash Investments, LLC (the "Securities Lending Fund"), an affiliated non-registered investment company. Investments in Securities Lending Fund are valued at the evaluated bid price provided by an independent pricing service. Income earned from investment in the Securities Lending Fund (net of fees and rebates), if any, is included in income from affiliated securities on the Statement of Operations.
In a securities lending transaction, the net asset value of the Portfolio is affected by an increase or decrease in the value of the securities loaned and by an increase or decrease in the value of the instrument in which collateral is invested. The amount of securities lending activity undertaken by the Portfolio fluctuates from time to time. The Portfolio has the right under the lending agreement to recover the securities from the borrower on demand. In the event of default or bankruptcy by the borrower, the Portfolio may be prevented from recovering the loaned securities or gaining access to the collateral or may experience delays or costs in doing so. In such an event, the terms of the agreement allow the unaffiliated securities lending agent to use the collateral to purchase replacement securities on behalf of the Portfolio or pay the Portfolio the market value of the loaned securities. The Portfolio bears the risk of loss with respect to depreciation of its investment of the cash collateral.
Futures contracts
Futures contracts are agreements between the Portfolio and a counterparty to buy or sell a specific amount of a commodity, financial instrument or currency at a specified price on a specified date. The Portfolio may buy and sell futures contracts in order to gain exposure to, or protect against, changes in security values and is subject to equity price risk. The primary risks associated with the use of futures contracts are the imperfect correlation between changes in market values of securities held by the Portfolio and the prices of futures contracts, and the possibility of an illiquid market. Futures contracts are generally entered into on a regulated futures exchange and cleared through a clearinghouse associated with the exchange. With futures contracts, there is minimal counterparty risk to the Portfolio since futures contracts are exchange traded and the exchange’s clearinghouse, as the counterparty to all exchange traded futures, guarantees the futures contracts against default.
Upon entering into a futures contract, the Portfolio is required to deposit either cash or securities (initial margin) with the broker in an amount equal to a certain percentage of the contract value. Subsequent payments (variation margin) are paid to or from the broker each day equal to the daily changes in the contract value. Such payments are recorded as unrealized gains or losses and, if any, shown as variation margin receivable (payable) in the Statement of Assets and Liabilities. Should the Portfolio fail to make requested variation margin payments, the broker can gain access to the initial margin to satisfy the Portfolio’s payment obligations. When the contracts are closed, a realized gain or loss is recorded in the Statement of Operations.
Security transactions and income recognition
Securities transactions are recorded on a trade date basis. Realized gains or losses are recorded on the basis of identified cost.
Dividend income is recognized on the ex-dividend date.
Income is recorded net of foreign taxes withheld where recovery of such taxes is not assured.
Federal and other taxes
The Portfolio is not required to pay federal income taxes on its net investment income and net capital gains as it is treated as a partnership for federal income tax purposes. All income, gains and losses of the Portfolio are deemed to have been “passed through” to the interest holders in proportion to their holdings of the Portfolio regardless of whether income and gains have been distributed by the Portfolio.
The Portfolio’s income tax returns and all financial records supporting those returns for the prior three fiscal years are subject to examination by the federal revenue authority. Management has analyzed the Portfolio’s tax positions taken on federal, state, and foreign tax returns for all open tax years and does not believe that there are any uncertain tax positions that require recognition of a tax liability.
Allspring Index Portfolio | 39
Notes to financial statements (unaudited)
As of November 30, 2021, the aggregate cost of all investments for federal income tax purposes was $318,400,503 and the unrealized gains (losses) consisted of:
| Gross unrealized gains | $1,063,505,350 |
| Gross unrealized losses | (4,747,998) |
| Net unrealized gains | $1,058,757,352 |
3. FAIR VALUATION MEASUREMENTS
Fair value measurements of investments are determined within a framework that has established a fair value hierarchy based upon the various data inputs utilized in determining the value of the Portfolio’s investments. The three-level hierarchy gives the highest priority to unadjusted quoted prices in active markets for identical assets or liabilities (Level 1) and the lowest priority to unobservable inputs (Level 3). The Portfolio’s investments are classified within the fair value hierarchy based on the lowest level of input that is significant to the fair value measurement. The inputs are summarized into three broad levels as follows:
| ■ | Level 1 – quoted prices in active markets for identical securities |
| ■ | Level 2 – other significant observable inputs (including quoted prices for similar securities, interest rates, prepayment speeds, credit risk, etc.) |
| ■ | Level 3 – significant unobservable inputs (including the Portfolio’s own assumptions in determining the fair value of investments) |
The inputs or methodologies used for valuing investments in securities are not necessarily an indication of the risk associated with investing in those securities.
The following is a summary of the inputs used in valuing the Portfolio’s assets and liabilities as of November 30, 2021:
| | Quoted prices
(Level 1) | Other significant
observable inputs
(Level 2) | Significant
unobservable inputs
(Level 3) | Total |
| Assets | | | | |
| Investments in: | | | | |
| Common stocks | | | | |
| Communication services | $ 139,742,298 | $0 | $0 | $ 139,742,298 |
| Consumer discretionary | 177,682,528 | 0 | 0 | 177,682,528 |
| Consumer staples | 75,228,387 | 0 | 0 | 75,228,387 |
| Energy | 36,591,043 | 0 | 0 | 36,591,043 |
| Financials | 146,226,716 | 0 | 0 | 146,226,716 |
| Health care | 171,557,729 | 0 | 0 | 171,557,729 |
| Industrials | 105,207,772 | 0 | 0 | 105,207,772 |
| Information technology | 395,961,301 | 0 | 0 | 395,961,301 |
| Materials | 33,697,447 | 0 | 0 | 33,697,447 |
| Real estate | 35,331,529 | 0 | 0 | 35,331,529 |
| Utilities | 32,020,944 | 0 | 0 | 32,020,944 |
| Short-term investments | | | | |
| Investment companies | 26,733,378 | 0 | 0 | 26,733,378 |
| Total assets | $1,375,981,072 | $0 | $0 | $1,375,981,072 |
| Liabilities | | | | |
| Futures contracts | $ 1,176,783 | $0 | $0 | $ 1,176,783 |
| Total liabilities | $ 1,176,783 | $0 | $0 | $ 1,176,783 |
Futures contracts are reported at their cumulative unrealized gains (losses) at measurement date as reported in the table following the Portfolio of Investments. For futures contracts, the current day’s variation margin is reported on the Statement of Assets and Liabilities. All other assets and liabilities are reported at their market value at measurement date.
Additional sector, industry or geographic detail, if any, is included in the Portfolio of Investments.
40 | Allspring Index Portfolio
Notes to financial statements (unaudited)
For the six months ended November 30, 2021, the Portfolio did not have any transfers into/out of Level 3.
4. TRANSACTIONS WITH AFFILIATES
Advisory fee
The Trust has entered into an advisory contract with Allspring Funds Management, a wholly owned subsidiary of Allspring Global Investments Holdings, LLC, a holding company indirectly owned by certain private funds of GTCR LLC and Reverence Capital Partners, L.P. The adviser is responsible for implementing investment policies and guidelines and for supervising the subadviser, who is responsible for day-to-day portfolio management of the Portfolio. Pursuant to the contract, Allspring Funds Management is entitled to receive an advisory fee at the following annual rate based on the Portfolio’s average daily net assets:
| Average daily net assets | Advisory fee |
| First $500 million | 0.100% |
| Next $500 million | 0.100 |
| Next $2 billion | 0.075 |
| Next $2 billion | 0.075 |
| Over $5 billion | 0.050 |
For the six months ended November 30, 2021, the advisory fee was equivalent to an annual rate of 0.09% of the Portfolio’s average daily net assets.
Allspring Funds Management has retained the services of a subadviser to provide daily portfolio management to the Portfolio. The fee for subadvisory services is borne by Allspring Funds Management. Allspring Global Investments, LLC ("Allspring Investments"), an affiliate of Allspring Funds Management and a wholly owned subsidiary of Allspring Global Investments Holdings, LLC, is the subadviser to the Portfolio and is entitled to receive a fee from Allspring Funds Management at an annual rate starting at 0.05% and declining to 0.02% as the average daily net assets of the Portfolio increase.
Interfund transactions
The Portfolio may purchase or sell portfolio investment securities to certain affiliates pursuant to Rule 17a-7 under the 1940 Act and under procedures adopted by the Board of Trustees. The procedures have been designed to ensure that these interfund transactions, which do not incur broker commissions, are effected at current market prices.
5. INVESTMENT PORTFOLIO TRANSACTIONS
Purchases and sales of investments, excluding U.S. government obligations (if any) and short-term securities, for the six months ended November 30, 2021 were $16,119,038 and $62,870,329, respectively.
6. SECURITIES LENDING TRANSACTIONS
The Portfolio lends its securities through an unaffiliated securities lending agent and receives collateral in the form of cash or securities with a value at least equal to the value of the securities on loan. The value of the loaned securities is determined at the close of each business day and any increases or decreases in the required collateral are exchanged between the Portfolio and the counterparty on the next business day. Cash collateral received is invested in the Securities Lending Fund which seeks to provide a positive return compared to the daily Federal Funds Open Rate by investing in high-quality, U.S. dollar-denominated short-term money market instruments and is exempt from registration under Section 3(c)(7) of the 1940 Act. Securities Lending Fund is managed by Allspring Funds Management and is subadvised by Allspring Investments. Allspring Funds Management receives an advisory fee starting at 0.05% and declining to 0.01% as the average daily net assets of the Securities Lending Fund increase. All of the fees received by Allspring Funds Management are paid to Allspring Investments for its services as subadviser.
In the event of counterparty default or the failure of a borrower to return a loaned security, the Portfolio has the right to use the collateral to offset any losses incurred. As of November 30, 2021, the Portfolio had securities lending transactions with the following counterparties which are subject to offset:
Allspring Index Portfolio | 41
Notes to financial statements (unaudited)
| Counterparty | Value of
securities on
loan | Collateral
received1 | Net amount |
| BNP Paribas Securities Corporation | $246,684 | $(246,684) | $0 |
| Citigroup Global Markets Incorporated | 135,245 | (135,245) | 0 |
1 Collateral received within this table is limited to the collateral for the net transaction with the counterparty.
7. DERIVATIVE TRANSACTIONS
During the six months ended November 30, 2021, the Portfolio entered into futures contracts to gain market exposure. The Portfolio had an average notional amount of $27,452,601 in long futures contracts during the six months ended November 30, 2021.
The fair value, realized gains or losses and change in unrealized gains or losses, if any, on derivative instruments are reflected in the corresponding financial statement captions.
8. BANK BORROWINGS
The Trust, along with Allspring Variable Trust and Allspring Funds Trust (excluding the money market funds), are parties to a $350,000,000 revolving credit agreement whereby the Portfolio is permitted to use bank borrowings for temporary or emergency purposes, such as to fund interest holders withdrawal requests. Interest under the credit agreement is charged to the Portfolio based on a borrowing rate equal to the higher of the Federal Funds rate in effect on that day plus 1.25% or the overnight bank funding rate in effect on that day plus 1.25%. In addition, an annual commitment fee equal to 0.25% of the unused balance is allocated to each participating fund.
For the six months ended November 30, 2021, there were no borrowings by the Portfolio under the agreement.
9. CONCENTRATION RISKS
As of the end of the period, the Portfolio concentrated its portfolio of investments in the information technology sector. A fund that invests a substantial portion of its assets in any sectors may be more affected by changes in that sectors than would be a fund whose investments are not heavily weighted in any sectors.
10. INDEMNIFICATION
Under the Portfolio's organizational documents, the officers and Trustees have been granted certain indemnification rights against certain liabilities that may arise out of performance of their duties to the Portfolio. The Portfolio has entered into a separate agreement with each Trustee that converts indemnification rights currently existing under the Portfolio’s organizational documents into contractual rights that cannot be changed in the future without the consent of the Trustee. Additionally, in the normal course of business, the Portfolio may enter into contracts with service providers that contain a variety of indemnification clauses. The Portfolio’s maximum exposure under these arrangements is dependent on future claims that may be made against the Portfolio and, therefore, cannot be estimated.
11. CORONAVIRUS (COVID-19) PANDEMIC
On March 11, 2020, the World Health Organization announced that it had made the assessment that coronavirus disease 2019 (“COVID-19”) is a pandemic. The impacts of COVID-19 are affecting the entire global economy, individual companies and investment products, the funds, and the market in general. There is significant uncertainty around the extent and duration of business disruptions related to COVID-19 and the impacts may last for an extended period of time. COVID-19 has led to significant uncertainty and volatility in the financial markets.
42 | Allspring Index Portfolio
Other information (unaudited)
PROXY VOTING INFORMATION
A description of the policies and procedures used to determine how to vote proxies relating to portfolio securities is available without charge, upon request, by calling 1-800-222-8222, visiting our website at allspringglobal.com, or visiting the SEC website at sec.gov. Information regarding how the proxies related to portfolio securities were voted during the most recent 12-month period ended June 30 is available on the website at allspringglobal.com or by visiting the SEC website at sec.gov.
SPECIAL MEETING OF SHAREHOLDERS
On September 15, 2021, a Special Meeting of Shareholders for Allspring Index Fund was held to consider the following proposals. The results of the proposals are indicated below.
Proposal 1 – To consider and approve a new investment management agreement with Wells Fargo Funds Management, LLC*.
| Shares voted “For” | 11,082,401 |
| Shares voted “Against” | 728,519 |
| Shares voted “Abstain” | 1,117,729 |
Proposal 2 – To consider and approve a new advisory agreement with Wells Fargo Funds Management, LLC* for Allspring Index Portfolio in which the Fund invests substantially all of its assets.
| Shares voted “For” | 11,051,440 |
| Shares voted “Against” | 727,175 |
| Shares voted “Abstain” | 1,150,034 |
Proposal 3 – To consider and approve a new subadvisory agreement with Wells Capital Management, LLC** for Allspring Index Portfolio.
| Shares voted “For” | 10,990,940 |
| Shares voted “Against” | 782,586 |
| Shares voted “Abstain” | 1,155,123 |
* Effective November 1, 2021, known as Allspring Funds Management, LLC.
** Effective November 1, 2021, known as Allspring Global Investments, LLC.
QUARTERLY PORTFOLIO HOLDINGS INFORMATION
The Fund and Portfolio file their complete schedule of portfolio holdings with the SEC for the first and third quarters of each fiscal year as an exhibit to their reports on Form N-PORT. Shareholders and Interest holders may view the filed Form N-PORT by visiting the SEC website at sec.gov.
Allspring Index Fund | 43
Other information (unaudited)
BOARD OF TRUSTEES AND OFFICERS
Each of the Trustees and Officers listed in the table below acts in identical capacities for each fund in the Allspring family of funds, which consists of 139 mutual funds comprising the Allspring Funds Trust, Allspring Variable Trust, Allspring Master Trust and four closed-end funds (collectively the “Fund Complex”). This table should be read in conjunction with the Prospectus and the Statement of Additional Information1. The mailing address of each Trustee and Officer is 525 Market Street, 12th Floor, San Francisco, CA 94105. Each Trustee and Officer serves an indefinite term, however, each Trustee serves such term until reaching the mandatory retirement age established by the Trustees.
Independent Trustees
Name and
year of birth | Position held and
length of service* | Principal occupations during past five years or longer | Current other
public company or
investment
company
directorships |
William R. Ebsworth
(Born 1957) | Trustee,
since 2015 | Retired. From 1984 to 2013, equities analyst, portfolio manager, research director and chief investment officer at Fidelity Management and Research Company in Boston, Tokyo, and Hong Kong, and retired in 2013 as Chief Investment Officer of Fidelity Strategic Advisers, Inc. where he led a team of investment professionals managing client assets. Prior thereto, Board member of Hong Kong Securities Clearing Co., Hong Kong Options Clearing Corp., the Thailand International Fund, Ltd., Fidelity Investments Life Insurance Company, and Empire Fidelity Investments Life Insurance Company. Audit Committee Chair and Investment Committee Chair of the Vincent Memorial Hospital Endowment (non-profit organization). Mr. Ebsworth is a CFA® charterholder. | N/A |
Jane A. Freeman
(Born 1953) | Trustee,
since 2015;
Chair Liaison,
since 2018 | Retired. From 2012 to 2014 and 1999 to 2008, Chief Financial Officer of Scientific Learning Corporation. From 2008 to 2012, Ms. Freeman provided consulting services related to strategic business projects. Prior to 1999, Portfolio Manager at Rockefeller & Co. and Scudder, Stevens & Clark. Board member of the Harding Loevner Funds from 1996 to 2014, serving as both Lead Independent Director and chair of the Audit Committee. Board member of the Russell Exchange Traded Funds Trust from 2011 to 2012 and the chair of the Audit Committee. Ms. Freeman is also an inactive Chartered Financial Analyst. | N/A |
Isaiah Harris, Jr.
(Born 1952) | Trustee,
since 2009; Audit
Committee
Chair,
since 2019 | Retired. Chairman of the Board of CIGNA Corporation from 2009 to 2021, and Director from 2005 to 2008. From 2003 to 2011, Director of Deluxe Corporation. Prior thereto, President and CEO of BellSouth Advertising and Publishing Corp. from 2005 to 2007, President and CEO of BellSouth Enterprises from 2004 to 2005 and President of BellSouth Consumer Services from 2000 to 2003. Emeritus member of the Iowa State University Foundation Board of Governors. Emeritus Member of the Advisory Board of Iowa State University School of Business. Advisory Board Member, Palm Harbor Academy (private school). Advisory Board Member, Fellowship of Christian Athletes. Mr. Harris is a certified public accountant (inactive status). | N/A |
Judith M. Johnson**
(Born 1949) | Trustee,
since 2008 | Retired. Prior thereto, Chief Executive Officer and Chief Investment Officer of Minneapolis Employees Retirement Fund from 1996 to 2008. Ms. Johnson is an attorney, certified public accountant and a certified managerial accountant. | N/A |
David F. Larcker
(Born 1950) | Trustee,
since 2009 | James Irvin Miller Professor of Accounting at the Graduate School of Business (Emeritus), Stanford University, Director of the Corporate Governance Research Initiative and Senior Faculty of The Rock Center for Corporate Governance since 2006. From 2005 to 2008, Professor of Accounting at the Graduate School of Business, Stanford University. Prior thereto, Ernst & Young Professor of Accounting at The Wharton School, University of Pennsylvania from 1985 to 2005. | N/A |
44 | Allspring Index Fund
Other information (unaudited)
Name and
year of birth | Position held and
length of service* | Principal occupations during past five years or longer | Current other
public company or
investment
company
directorships |
Olivia S. Mitchell
(Born 1953) | Trustee,
since 2006;
Nominating and
Governance
Committee Chair,
since 2018 | International Foundation of Employee Benefit Plans Professor since 1993, Wharton School of the University of Pennsylvania. Director of Wharton’s Pension Research Council and Boettner Center on Pensions & Retirement Research, and Research Associate at the National Bureau of Economic Research. Previously taught at Cornell University from 1978 to 1993. | N/A |
Timothy J. Penny
(Born 1951) | Trustee,
since 1996;
Chair,
since 2018 | President and Chief Executive Officer of Southern Minnesota Initiative Foundation, a non-profit organization, since 2007. Member of the Board of Trustees of NorthStar Education Finance, Inc., a non-profit organization, since 2007. | N/A |
James G. Polisson
(Born 1959) | Trustee,
since 2018 | Retired. Chief Marketing Officer, Source (ETF) UK Services, Ltd, from 2015 to 2017. From 2012 to 2015, Principal of The Polisson Group, LLC, a management consulting, corporate advisory and principal investing company. Chief Executive Officer and Managing Director at Russell Investments, Global Exchange Traded Funds from 2010 to 2012. Managing Director of Barclays Global Investors from 1998 to 2010 and Global Chief Marketing Officer for iShares and Barclays Global Investors from 2000 to 2010. Trustee of the San Francisco Mechanics’ Institute, a non-profit organization, from 2013 to 2015. Board member of the Russell Exchange Traded Fund Trust from 2011 to 2012. Director of Barclays Global Investors Holdings Deutschland GmbH from 2006 to 2009. Mr. Polisson is an attorney and has a retired status with the Massachusetts and District of Columbia Bar Associations. | N/A |
Pamela Wheelock
(Born 1959) | Trustee,
since January
2020; previously
Trustee from
January 2018 to
July 2019 | Board member of the Destination Medical Center Economic Development Agency, Rochester, Minnesota since 2019. Interim President of the McKnight Foundation from January to September 2020. McKnight Foundation Consultant, November 2020 to February 2021. Acting Commissioner, Minnesota Department of Human Services, July 2019 through September 2019. Consultant (part-time), Minnesota Department of Human Services, October 2019 through December 2019. Chief Operating Officer, Twin Cities Habitat for Humanity from 2017 to 2019. Vice President of University Services, University of Minnesota from 2012 to 2016. Prior thereto, on the Board of Directors, Governance Committee and Finance Committee for the Minnesota Philanthropy Partners (Saint Paul Foundation) from 2012 to 2018, Interim Chief Executive Officer of Blue Cross Blue Shield of Minnesota from 2011 to 2012, Chairman of the Board from 2009 to 2012 and Board Director from 2003 to 2015. Vice President, Leadership and Community Engagement, Bush Foundation, Saint Paul, Minnesota (a private foundation) from 2009 to 2011. Executive Vice President and Chief Financial Officer, Minnesota Sports and Entertainment from 2004 to 2009 and Senior Vice President from 2002 to 2004. Executive Vice President of the Minnesota Wild Foundation from 2004 to 2008. Commissioner of Finance, State of Minnesota, from 1999 to 2002. Currently Board Chair of the Minnesota Wild Foundation since 2010. | N/A |
* Length of service dates reflect the Trustee’s commencement of service with the Trust’s predecessor entities, where applicable.
** Ms. Johnson has resigned from the Board effective December 31, 2021.
Allspring Index Fund | 45
Other information (unaudited)
Officers2
Name and
year of birth | Position held and
length of service | Principal occupations during past five years or longer |
Andrew Owen
(Born 1960) | President,
since 2017 | President, Chief Executive Officer and Director of Allspring Funds Management, LLC since 2017 and co-president of Galliard Capital Management, LLC, an affiliate of Allspring Funds Management, LLC, since 2019. Prior thereto, Head of Affiliated Managers, Allspring Global Investments, from 2014 to 2019 and Executive Vice President responsible for marketing, investments and product development for Allspring Funds Management, LLC, from 2009 to 2014. In addition, Mr. Owen was an Executive Vice President of Wells Fargo & Company from 2014 to 2021. |
Jeremy DePalma
(Born 1974) | Treasurer,
since 2012
(for certain funds in
the Fund Complex);
since 2021 (for
the remaining funds in the
Fund Complex) | Senior Vice President of Allspring Funds Management, LLC since 2009. Senior Vice President of Evergreen Investment Management Company, LLC from 2008 to 2010 and head of the Fund Reporting and Control Team within Fund Administration. |
Kate McKinley
(Born 1977) | Chief Legal Officer,
since 2021 | Chief Legal Officer of Allspring Global Investments since 2021. Prior thereto, held various roles at State Street Global Advisors beginning in 2010, including serving as Senior Vice President and General Counsel from 2019 to 2021, and Chief Operating Officer of the Institutional Client Group from 2016 - 2019. Prior to working at State Street Global Advisors served as Assistant General Counsel for Bank of America Corporation from 2005 to 2010 and as an Associate at WilmerHale from 2002 to 2005. |
Christopher Baker
(Born 1976) | Chief Compliance Officer, since 2022 | Global Chief Compliance Officer for Allspring Global Investments since 2022. Prior thereto, Chief Compliance Officer for State Street Global Advisors from 2018 to 2021. Senior Compliance Officer for the State Street divisions of Alternative Investment Solutions, Sector Solutions, and Global Marketing from 2015 to 2018. From 2010 to 2015 Vice President, Global Head of Investment and Marketing Compliance for State Street Global Advisors. |
Matthew Prasse
(Born 1983) | Secretary,
since 2021 | Senior Counsel of the Allspring Legal Department since 2021. Senior Counsel of the Wells Fargo Legal Department from 2018 to 2021. Previously, Counsel for Barings LLC from 2015 to 2018. Prior to joining Barings, Associate at Morgan, Lewis & Bockius LLP from 2008 to 2015. |
1 The Statement of Additional Information includes additional information about the Trustees and is available, without charge, upon request, by calling 1-800-222-8222 or by visiting the website at allspringglobal.com.
2 For those Officers with tenures at Allspring Global Investments and/or Allspring Funds Management, LLC that began prior to 2021, such tenures include years of service during which these businesses/entities were known as Wells Fargo Asset Management and Wells Fargo Funds Management, LLC, respectively.
46 | Allspring Index Fund
For more information
More information about Allspring Funds is available free upon request. To obtain literature, please write, visit the Fund's website, or call:
Allspring Funds
P.O. Box 219967
Kansas City, MO 64121-9967
Website: allspringglobal.com
Individual investors: 1-800-222-8222
Retail investment professionals: 1-888-877-9275
Institutional investment professionals: 1-866-765-0778
This report and the financial statements contained herein are submitted for the general information of the shareholders of the Fund. If this report is used for promotional purposes, distribution of the report must be accompanied or preceded by a current prospectus. Before investing, please consider the investment objectives, risks, charges, and expenses of the investment. For a current prospectus and, if available, a summary prospectus, containing this information, call
1-800-222-8222 or visit the Fund's website at allspringglobal.com. Read the prospectus carefully before you invest or send money.
Allspring Global InvestmentsTM is the trade name for the asset management firms of Allspring Global Investments Holdings, LLC, a holding company indirectly owned by certain private funds of GTCR LLC and Reverence Capital Partners, L.P. These firms include but are not limited to Allspring Global Investments, LLC, and Allspring Funds Management, LLC. Certain products managed by Allspring entities are distributed by Allspring Funds Distributor, LLC (a broker-dealer and Member FINRA/SIPC).
This material is for general informational and educational purposes only and is NOT intended to provide investment advice or a recommendation of any kind - including a recommendation for any specific investment, strategy, or plan.
© 2022 Allspring Global Investments Holdings, LLC. All rights reserved.
PAR-1221-00196 01-22
SA283/SAR283 11-21
Semi-Annual Report
November 30, 2021
Allspring
Small Company Growth Fund
The views expressed and any forward-looking statements are as of November 30, 2021, unless otherwise noted, and are those of the Fund's portfolio managers and/or Allspring Global Investments. Discussions of individual securities or the markets generally are not intended as individual recommendations. Future events or results may vary significantly from those expressed in any forward-looking statements. The views expressed are subject to change at any time in response to changing circumstances in the market. Allspring Global Investments disclaims any obligation to publicly update or revise any views expressed or forward-looking statements.
Allspring Small Company Growth Fund | 1
Letter to shareholders (unaudited)
Andrew Owen
President
Allspring Funds
Dear Shareholder:
We are pleased to offer you this semi-annual report for Allspring Small Company Growth Fund for the six-month period that ended November 30, 2021. Global stocks yielded mixed results as the global economy continued to emerge from the haze of COVID-19. Tailwinds were provided by global stimulus programs, a rapid vaccination rollout, and recovering consumer and corporate sentiment. The bond market had mostly positive returns during the period.
For the six-month period, U.S. stocks, based on the S&P 500 Index,1 gained 9.38%. International stocks, as measured by the MSCI ACWI ex USA Index (Net),2 returned -5.76%, while the MSCI EM Index (Net) (USD),3 trailed its developed market counterparts with a 10.81% loss. Among bond indexes, the Bloomberg U.S. Aggregate Bond Index,4 returned 1.02%, the Bloomberg Global Aggregate ex-USD Index (unhedged),5 returned -4.64%, the Bloomberg Municipal Bond Index6 returned 0.56%, and the ICE BofA U.S. High Yield Index,7 gained 1.09%.
Vaccination rollout drove the stock markets to new highs.
June witnessed the S&P 500 Index reach a new all-time high. 2021 economic growth and inflation forecasts were revised higher to reflect a strong economic recovery and some supply and demand imbalances. Late June saw a deal reached on a U.S. infrastructure package of approximately $1 trillion for road, bridge, and broadband network upgrades over the next eight years. The U.S. Federal Reserve's (Fed) June meeting yielded no change to policy, but its projections pointed to a possible interest rate rise in 2023. This, combined with a rebound in economic activity and investors searching for yield, led to U.S. Treasury yields being down for the month. Many European and Asian countries saw vaccination momentum increase, while the U.K. dealt with a rise in COVID-19 infections, specifically the Delta variant. Meanwhile, crude oil jumped over 10% in June on the back of the pickup in global economic activity and the Organization of the Petroleum Exporting Countries’ (OPEC) slow pace of supply growth.
“2021 economic growth and inflation forecasts were revised higher to reflect a strong economic recovery and some supply and demand imbalances.”
| 1 | The S&P 500 Index consists of 500 stocks chosen for market size, liquidity, and industry group representation. It is a market-value-weighted index with each stock's weight in the index proportionate to its market value. You cannot invest directly in an index. |
| 2 | The Morgan Stanley Capital International (MSCI) All Country World Index (ACWI) ex USA Index (Net) is a free-float-adjusted market-capitalization-weighted index that is designed to measure the equity market performance of developed and emerging markets, excluding the U.S. Source: MSCI. MSCI makes no express or implied warranties or representations and shall have no liability whatsoever with respect to any MSCI data contained herein. The MSCI data may not be further redistributed or used as a basis for other indexes or any securities or financial products. This report is not approved, reviewed, or produced by MSCI. You cannot invest directly in an index. |
| 3 | The MSCI Emerging Markets (EM) Index (Net) (USD) is a free-float-adjusted market-capitalization-weighted index that is designed to measure equity market performance of emerging markets. You cannot invest directly in an index. |
| 4 | The Bloomberg U.S. Aggregate Bond Index is a broad-based benchmark that measures the investment-grade, U.S.-dollar-denominated, fixed-rate taxable bond market, including Treasuries, government-related and corporate securities, mortgage-backed securities (agency fixed-rate and hybrid adjustable-rate mortgage pass-throughs), asset-backed securities, and commercial mortgage-backed securities. You cannot invest directly in an index. |
| 5 | The Bloomberg Global Aggregate ex-USD Index (unhedged) is an unmanaged index that provides a broad-based measure of the global investment-grade fixed-income markets excluding the U.S.-dollar-denominated debt market. You cannot invest directly in an index. |
| 6 | The Bloomberg Municipal Bond Index is an unmanaged index composed of long-term tax-exempt bonds with a minimum credit rating of Baa. You cannot invest directly in an index. |
| 7 | The ICE BofA U.S. High Yield Index is a market-capitalization-weighted index of domestic and Yankee high-yield bonds. The index tracks the performance of high-yield securities traded in the U.S. bond market. You cannot invest directly in an index. Copyright 2022. ICE Data Indices, LLC. All rights reserved. |
2 | Allspring Small Company Growth Fund
Letter to shareholders (unaudited)
July began the month seeing vaccinations making progress, as several major developed countries eased restrictions, only to be threatened again by the spread of COVID-19’s Delta variant. Inflation continued to climb, aided by the continued supply bottleneck in the face of high demand. As it pertains to the equity area of the market, U.S. equities led the way in positive return territory, followed by international developed markets. In contrast, emerging markets were well in negative territory for the month, hindered by China’s plans for new regulations on a number of sectors, specifically education and technology. The U.S. 10-Year Treasury bond yield continued to decline, as strong demand swallowed up supply. After hitting a multi-year high earlier in the month, oil prices leveled off following an agreement by OPEC to raise oil production starting in August.
The Delta variant of COVID-19 produced outbreaks globally in August, increasing the potential for increased market volatility and bringing into question the ongoing economic recovery. Domestically, the U.S. economy continued to stay strong in the face of the Delta variant, continued inflationary pressures, and worries over Hurricane Ida. Emerging market equities experienced elevated volatility, largely influenced by China’s regulatory stance. Emerging market equities started the month with poor performance but rebounded to end the month in positive territory. Municipal debt experienced its first monthly performance drop since February of this year, slowing a rally that made it one of the best-performing sectors of the bond market. In the commodity segment of the market, crude oil fell sharply during the month on the back of dampened expectations as a result of the Delta variant but was still a leading asset class performer for the year.
Global markets suffered their broadest retreat in a year during September, with the exception of commodities. Concerns over inflation and the interest rate outlook depressed investor confidence and hurt performance. Emerging markets declined on concerns over the continued supply chain disruptions and worries over higher energy and food prices. Meanwhile, the Fed indicated it would slow the pace of asset purchases in the near future. All eyes domestically were fixed on the raising of the debt ceiling, the 2022 budget plan, and the ongoing debate over the infrastructure package. Contrary to most asset classes, commodities thrived in September, driven by sharply higher energy prices.
October’s key themes continued to be elevated inflation pressures and a supply bottleneck, but strong earnings provided a bright spot in the markets. Earnings releases in the U.S. were generally strong and consumer confidence was high. The Fed reaffirmed its plans to taper quantitative easing to a stop by mid-2022. Meanwhile, elevated inflation figures were still being considered transitory by the Fed. Similar to the U.S., the eurozone and many Asian countries saw positive earnings but were facing inflation pressures caused by supply bottlenecks while also experiencing energy price increases amid natural gas shortages. Globally, government bond yields rose as central banks prepared to lower monetary policy accommodation in the face of rising inflationary pressures. As previously referenced, positive commodity performance was driven by sharply higher energy costs.
November was dominated by rising COVID-19 hospitalizations and concerns regarding the Omicron variant. Most major asset classes, both domestically and internationally, declined in November with two exceptions: U.S. investment-grade bonds and Treasury Inflation-Protected Securities. The United Nations Climate Change Conference (COP26) took place during the month with hopes of agreement among countries to limit global warming. While several initiatives were discussed, the conference ultimately ended without the specifics required to instill confidence that the limiting of global warming would succeed. In the U.S., President Biden signed a long-awaited infrastructure bill to upgrade U.S. roads, bridges, and railways. Meanwhile, the Consumer Price Index1, a measure of domestic inflation conditions, jumped to its highest level in 31 years. While the threat of consistently high inflation led the Fed to discuss a faster pace of tapering, the Omicron strain makes that less likely to occur. Commodities came in negative for the month, largely driven by sharp declines in oil prices (and energy costs in general), as well as precious metals.
“ Municipal debt experienced its first monthly performance drop since February of this year, slowing a rally that made it one of the best-performing sectors of the bond market.”
| 1 | The Consumer Price Index (CPI) is a measure of the average change over time in the prices paid by urban consumers for a market basket of consumer goods and services. You cannot invest directly in an index. |
Allspring Small Company Growth Fund | 3
Letter to shareholders (unaudited)
Don’t let short-term uncertainty derail long-term investment goals.
Periods of investment uncertainty can present challenges, but experience has taught us that maintaining long-term investment goals can be an effective way to plan for the future. To help you create a sound strategy based on your personal goals and risk tolerance, Allspring Funds offers more than 100 mutual funds spanning a wide range of asset classes and investment styles. Although diversification cannot guarantee an investment profit or prevent losses, we believe it can be an effective way to manage investment risk and potentially smooth out overall portfolio performance. We encourage investors to know their investments and to understand that appropriate levels of risk-taking may unlock opportunities.
Information on transaction closing.
On November 1, 2021, GTCR LLC and Reverence Capital Partners, L.P., announced the beginning of Allspring Global Investments™, with the close of the transaction to acquire Wells Fargo Funds Management, LLC; Wells Capital Management LLC; Galliard Capital Management LLC.; Wells Fargo Asset Management (International) Ltd.; Wells Fargo Asset Management Luxembourg S.A.; and Wells Fargo Funds Distributor, LLC, as well as Wells Fargo Bank, N.A.’s business of acting as trustee to its collective investment trusts and all related Wells Fargo Asset Management legal entities. The transaction closed on November 1, 2021, forming Allspring Global Investments, a privately held asset management firm with $587 billion in AUM1 as of September 30, 2021.
Allspring Global Investments™ is a leading independent asset management firm with a full breadth of investment capabilities across diverse asset classes, serving the needs of its institutional and wealth management clients around the world. Allspring operates across 18 offices globally supported by more than 480 investment professionals. Allspring and its investment teams provide a broad range of differentiated investment products and solutions to help its diverse range of clients meet their investment objectives.
As part of this transition, all mutual funds within the Wells Fargo Funds family were rebranded as Allspring Funds. Each individual fund had “Wells Fargo” removed from its fund name and replaced with “Allspring.” The fund name changes went into effect on December 6, 2021.
Allspring Global Investments is the trade name for the asset management firms of Allspring Global Investments Holdings, LLC, a holding company indirectly owned by certain private funds of GTCR LLC and Reverence Capital Partners, L.P.
Thank you for choosing to invest with Allspring Funds. We appreciate your confidence in us and remain committed to helping you meet your financial needs.
Sincerely,
Andrew Owen
President
Allspring Funds
For further information about your Fund, contact your investment professional, visit our website at allspringglobal.com, or call us directly at 1-800-222-8222.
| 1 | As of September 30, 2021, assets under management (AUM) includes $93 billion from Galliard Capital Management, LLC, an investment advisor that is not part of the Allspring trade name/GIPS firm. |
4 | Allspring Small Company Growth Fund
This page is intentionally left blank.
Performance highlights (unaudited)
| Investment objective | The Fund seeks long-term capital appreciation. |
| Manager | Allspring Funds Management, LLC |
Subadviser for the affiliated master portfolio*
Peregrine Capital Management, LLC
| Portfolio managers | William A. Grierson, CFA®‡, Daniel J. Hagen, CFA®‡, Paul E. von Kuster, CFA®‡, Ryan H. Smith, CFA®‡, Samuel D. Smith, CFA®‡ |
| Average annual total returns (%) as of November 30, 2021 |
| | | Including sales charge | | Excluding sales charge | | Expense ratios1 (%) |
| | Inception date | 1 year | 5 year | 10 year | | 1 year | 5 year | 10 year | | Gross | Net 2 |
| Class A (WFSAX) | 1-30-2004 | 13.26 | 13.96 | 13.63 | | 20.17 | 15.32 | 14.31 | | 1.34 | 1.29 |
| Class C (WSMCX) | 1-30-2004 | 18.29 | 14.48 | 13.47 | | 19.29 | 14.48 | 13.47 | | 2.09 | 2.04 |
| Class R6 (WSCRX)3 | 10-31-2014 | – | – | – | | 20.69 | 15.82 | 14.82 | | 0.91 | 0.86 |
| Administrator Class (NVSCX) | 11-11-1994 | – | – | – | | 20.29 | 15.45 | 14.49 | | 1.26 | 1.19 |
| Institutional Class (WSCGX) | 3-31-2008 | – | – | – | | 20.59 | 15.74 | 14.77 | | 1.01 | 0.94 |
| Russell 2000® Growth Index4 | – | – | – | – | | 11.95 | 14.74 | 14.06 | | – | – |
Figures quoted represent past performance, which is no guarantee of future results, and do not reflect taxes that a shareholder may pay on an investment in a fund. Investment return and principal value of an investment will fluctuate so that an investor’s shares, when redeemed, may be worth more or less than their original cost. Performance shown without sales charges would be lower if sales charges were reflected. Current performance may be lower or higher than the performance data quoted, which assumes the reinvestment of dividends and capital gains. Current month-end performance is available on the Fund’s website, allspringglobal.com.
Index returns do not include transaction costs associated with buying and selling securities, any mutual fund fees or expenses, or any taxes. It is not possible to invest directly in an index.
For Class A shares, the maximum front-end sales charge is 5.75%. For Class C shares, the maximum contingent deferred sales charge is 1.00%. Performance including a contingent deferred sales charge assumes the sales charge for the corresponding time period. Class R6, Administrator Class and Institutional Class shares are sold without a front-end sales charge or contingent deferred sales charge.
| 1 | Reflects the expense ratios as stated in the most recent prospectuses, which include the impact of 0.01% in acquired fund fees and expenses. The expense ratios shown are subject to change and may differ from the annualized expense ratios shown in the financial highlights of this report, which do not include acquired fund fees and expenses. |
| 2 | The manager has contractually committed through September 30, 2022, to waive fees and/or reimburse expenses to the extent necessary to cap total annual fund operating expenses after fee waivers at 1.29% for Class A, 2.04% for Class C, 0.86% for Class R6, 1.19% for Administrator Class, and 0.94% for Institutional Class. Brokerage commissions, stamp duty fees, interest, taxes, acquired fund fees and expenses (if any) from funds in which the affiliated master portfolio invests, and extraordinary expenses are excluded from the expense caps. Net expenses from the affiliated master portfolio are included in the expense caps. Prior to or after the commitment expiration date, the caps may be increased or the commitment to maintain the caps may be terminated only with the approval of the Board of Trustees. Without these caps, the Fund’s returns would have been lower. The expense ratio paid by an investor is the net expense ratio (the total annual fund operating expenses after fee waivers) as stated in the prospectuses. |
| 3 | Historical performance shown for the Class R6 shares prior to their inception reflects the performance of the Institutional Class shares, and includes the higher expenses applicable to the Institutional Class shares. If these expenses had not been included, returns for the Class R6 shares would be higher. |
| 4 | The Russell 2000® Growth Index measures the performance of those Russell 2000 companies with higher price/book ratios and higher forecasted growth values. You cannot invest directly in an index. |
Stock values fluctuate in response to the activities of individual companies and general market and economic conditions. Smaller-company stocks tend to be more volatile and less liquid than those of larger companies. Certain investment strategies tend to increase the total risk of an investment (relative to the broader market). This fund is exposed to foreign investment risk. Consult the Fund’s prospectus for additional information on these and other risks.
| * | The Fund is a feeder fund in a master-feeder structure that invests substantially all of its assets in a single affiliated master portfolio of the Allspring Master Trust with a substantially identical investment objective and substantially similar investment strategies. References to the investment activities of the Fund are intended to refer to the investment activities of the affiliated master portfolio in which it invests. |
| ‡ | CFA® and Chartered Financial Analyst® are trademarks owned by CFA Institute. |
6 | Allspring Small Company Growth Fund
Performance highlights (unaudited)
| Ten largest holdings (%) as of November 30, 20211 |
| ICON plc ADR | 2.10 |
| Syneos Health Incorporated | 1.72 |
| Avantor Incorporated | 1.57 |
| ASGN Incorporated | 1.57 |
| Omnicell Incorporated | 1.50 |
| Ciena Corporation | 1.44 |
| SS&C Technologies Holdings Incorporated | 1.39 |
| Element Solutions Incorporated | 1.36 |
| Triumph Bancorp Incorporated | 1.34 |
| International Game Technology plc | 1.31 |
| 1 | Each holding represents the Fund’s allocable portion of the affiliated master portfolio security. Figures represent each holding as a percentage of the Fund’s net assets. Holdings are subject to change and may have changed since the date specified. |
| Sector allocation as of November 30, 20211 |
| 1 | Figures represent the sector allocation of the affiliated master portfolio as a percentage of the long-term investments of the affiliated master portfolio. These amounts are subject to change and may have changed since the date specified. |
Allspring Small Company Growth Fund | 7
Fund expenses (unaudited)
As a shareholder of the Fund, you incur two types of costs: (1) transaction costs, including sales charges (loads) on purchase payments and contingent deferred sales charges (if any) on redemptions and (2) ongoing costs, including management fees, distribution (12b-1) and/or shareholder servicing fees, and other Fund expenses. This example is intended to help you understand your ongoing costs (in dollars) of investing in the Fund and to compare these costs with the ongoing costs of investing in other mutual funds.
The example is based on an investment of $1,000 invested at the beginning of the six-month period and held for the entire period from June 1, 2021 to November 30, 2021.
Actual expenses
The “Actual” line of the table below provides information about actual account values and actual expenses. You may use the information in this line, together with the amount you invested, to estimate the expenses that you paid over the period. Simply divide your account value by $1,000 (for example, an $8,600 account value divided by $1,000 = 8.6), then multiply the result by the number in the “Actual” line under the heading entitled “Expenses paid during period” for your applicable class of shares to estimate the expenses you paid on your account during this period.
Hypothetical example for comparison purposes
The “Hypothetical” line of the table below provides information about hypothetical account values and hypothetical expenses based on the Fund’s actual expense ratio and an assumed rate of return of 5% per year before expenses, which is not the Fund’s actual return. The hypothetical account values and expenses may not be used to estimate the actual ending account balance or expenses you paid for the period. You may use this information to compare the ongoing costs of investing in the Fund and other funds. To do so, compare this 5% hypothetical example with the 5% hypothetical examples that appear in the shareholder reports of the other funds.
Please note that the expenses shown in the table are meant to highlight your ongoing costs only and do not reflect any transactional costs, such as sales charges (loads) and contingent deferred sales charges. Therefore, the “Hypothetical” line of the table is useful in comparing ongoing costs only, and will not help you determine the relative total costs of owning different funds. In addition, if these transactional costs were included, your costs would have been higher.
| | Beginning
account value
6-1-2021 | Ending
account value
11-30-2021 | Expenses
paid during
the period1,2 | Annualized net
expense ratio2 |
| Class A | | | | |
| Actual | $1,000.00 | $1,003.74 | $ 6.48 | 1.29% |
| Hypothetical (5% return before expenses) | $1,000.00 | $1,018.60 | $ 6.53 | 1.29% |
| Class C | | | | |
| Actual | $1,000.00 | $1,000.00 | $10.23 | 2.04% |
| Hypothetical (5% return before expenses) | $1,000.00 | $1,014.84 | $10.30 | 2.04% |
| Class R6 | | | | |
| Actual | $1,000.00 | $1,005.89 | $ 4.32 | 0.86% |
| Hypothetical (5% return before expenses) | $1,000.00 | $1,020.76 | $ 4.36 | 0.86% |
| Administrator Class | | | | |
| Actual | $1,000.00 | $1,004.16 | $ 5.98 | 1.19% |
| Hypothetical (5% return before expenses) | $1,000.00 | $1,019.10 | $ 6.02 | 1.19% |
| Institutional Class | | | | |
| Actual | $1,000.00 | $1,005.47 | $ 4.73 | 0.94% |
| Hypothetical (5% return before expenses) | $1,000.00 | $1,020.36 | $ 4.76 | 0.94% |
1 Expenses paid is equal to the annualized net expense ratio of each class multiplied by the average account value over the period, multiplied by the number of days in the most recent fiscal half-year divided by the number of days in the fiscal year (to reflect the one-half-year period).
2 Amounts reflect net expenses allocated from the affiliated Master Portfolio in which the Fund invests.
8 | Allspring Small Company Growth Fund
Portfolio of investments—November 30, 2021 (unaudited)
| | | | | | Value |
| Investment companies: 100.02% | | | | | |
| Affiliated master portfolio: 100.02% | | | | | |
| Allspring Small Company Growth Portfolio | | | | | $992,296,788 |
| Total Investment companies (Cost $658,348,180) | | | | | 992,296,788 |
| Total investments in securities (Cost $658,348,180) | 100.02% | | | | 992,296,788 |
| Other assets and liabilities, net | (0.02) | | | | (219,917) |
| Total net assets | 100.00% | | | | $992,076,871 |
Transactions with the affiliated Master Portfolio were as follows:
| | % of
ownership,
beginning
of period | % of
ownership,
end of
period | Net realized
gains
(losses) on
securities
transactions
allocated
from
affiliated
Master
Portfolio | Net
change in
unrealized
gains
(losses) on
securities
transactions
allocated
from
affiliated
Master
Portfolio | Dividends
allocated
from
affiliated
Master
Portfolio | Affiliated
income
allocated
from
affiliated
Master
Portfolio | Value,
end of
period | |
| Allspring Small Company Growth Portfolio | 97.88% | 97.63% | $207,951,506 | $(196,784,511) | $2,305,653 | $57,441 | $992,296,788 | |
The accompanying notes are an integral part of these financial statements.
Allspring Small Company Growth Fund | 9
Statement of assets and liabilities—November 30, 2021 (unaudited)
| | |
| Assets | |
Investments in affiliated Master Portfolio, at value (cost $658,348,180)
| $ 992,296,788 |
Receivable for Fund shares sold
| 854,874 |
Receivable from manager
| 11,203 |
Total assets
| 993,162,865 |
| Liabilities | |
Payable for Fund shares redeemed
| 888,694 |
Administration fees payable
| 90,413 |
Distribution fee payable
| 4,977 |
Trustees’ fees and expenses payable
| 2,957 |
Accrued expenses and other liabilities
| 98,953 |
Total liabilities
| 1,085,994 |
Total net assets
| $992,076,871 |
| Net assets consist of | |
Paid-in capital
| $ 250,951,240 |
Total distributable earnings
| 741,125,631 |
Total net assets
| $992,076,871 |
| Computation of net asset value and offering price per share | |
Net assets – Class A
| $ 44,503,760 |
Shares outstanding – Class A1
| 721,611 |
Net asset value per share – Class A
| $61.67 |
Maximum offering price per share – Class A2
| $65.43 |
Net assets – Class C
| $ 7,486,418 |
Shares outstanding – Class C1
| 147,814 |
Net asset value per share – Class C
| $50.65 |
Net assets – Class R6
| $ 287,516,242 |
Shares outstanding – Class R61
| 4,206,526 |
Net asset value per share – Class R6
| $68.35 |
Net assets – Administrator Class
| $ 57,493,793 |
Shares outstanding – Administrator Class1
| 881,061 |
Net asset value per share – Administrator Class
| $65.26 |
Net assets – Institutional Class
| $ 595,076,658 |
Shares outstanding – Institutional Class1
| 8,752,197 |
Net asset value per share – Institutional Class
| $67.99 |
| 1 | The Fund has an unlimited number of authorized shares. |
| 2 | Maximum offering price is computed as 100/94.25 of net asset value. On investments of $50,000 or more, the offering price is reduced. |
The accompanying notes are an integral part of these financial statements.
10 | Allspring Small Company Growth Fund
Statement of operations—six months ended November 30, 2021 (unaudited)
| | |
| Investment income | |
Dividends allocated from affiliated Master Portfolio
| $ 2,305,653 |
Affiliated income allocated from affiliated Master Portfolio
| 57,441 |
Expenses allocated from affiliated Master Portfolio
| (4,498,332) |
Total investment income
| (2,135,238) |
| Expenses | |
Management fee
| 279,599 |
| Administration fees | |
Class A
| 47,591 |
Class C
| 9,013 |
Class R6
| 50,338 |
Administrator Class
| 39,434 |
Institutional Class
| 434,351 |
| Shareholder servicing fees | |
Class A
| 56,619 |
Class C
| 10,713 |
Administrator Class
| 75,785 |
| Distribution fee | |
Class C
| 32,045 |
Custody and accounting fees
| 11,488 |
Professional fees
| 19,113 |
Registration fees
| 5,646 |
Shareholder report expenses
| 31,390 |
Trustees’ fees and expenses
| 9,967 |
Other fees and expenses
| 6,102 |
Total expenses
| 1,119,194 |
| Less: Fee waivers and/or expense reimbursements | |
Fund-level
| (220,422) |
Class A
| (301) |
Class C
| (1) |
Administrator Class
| (6,050) |
Institutional Class
| (66,641) |
Net expenses
| 825,779 |
Net investment loss
| (2,961,017) |
| Realized and unrealized gains (losses) on investments | |
Net realized gains on securities transactions allocated from affiliated Master Portfolio
| 207,951,506 |
Net change in unrealized gains (losses) on securities transactions allocated from affiliated Master Portfolio
| (196,784,511) |
Net realized and unrealized gains (losses) on investments
| 11,166,995 |
Net increase in net assets resulting from operations
| $ 8,205,978 |
The accompanying notes are an integral part of these financial statements.
Allspring Small Company Growth Fund | 11
Statement of changes in net assets
| | | | | |
| | Six months ended
November 30, 2021
(unaudited) | Year ended
May 31, 2021 |
| Operations | | | | |
Net investment loss
| | $ (2,961,017) | | $ (6,950,209) |
Net realized gains on investments
| | 207,951,506 | | 376,204,644 |
Net change in unrealized gains (losses) on investments
| | (196,784,511) | | 243,393,279 |
Net increase in net assets resulting from operations
| | 8,205,978 | | 612,647,714 |
| Distributions to shareholders from | | | | |
| Net investment income and net realized gains | | | | |
Class A
| | 0 | | (5,976,918) |
Class C
| | 0 | | (1,628,455) |
Class R6
| | 0 | | (56,097,914) |
Administrator Class
| | 0 | | (8,234,181) |
Institutional Class
| | 0 | | (121,915,798) |
Total distributions to shareholders
| | 0 | | (193,853,266) |
| Capital share transactions | Shares | | Shares | |
| Proceeds from shares sold | | | | |
Class A
| 112,208 | 7,246,853 | 191,250 | 10,831,002 |
Class C
| 1,818 | 92,690 | 11,378 | 530,387 |
Class R6
| 260,962 | 18,211,489 | 1,135,839 | 70,387,361 |
Administrator Class
| 46,330 | 3,113,347 | 140,592 | 8,368,325 |
Institutional Class
| 1,423,197 | 100,258,385 | 2,938,525 | 180,832,983 |
| | | 128,922,764 | | 270,950,058 |
| Reinvestment of distributions | | | | |
Class A
| 0 | 0 | 99,100 | 5,314,718 |
Class C
| 0 | 0 | 34,708 | 1,539,630 |
Class R6
| 0 | 0 | 860,364 | 50,924,923 |
Administrator Class
| 0 | 0 | 144,949 | 8,217,170 |
Institutional Class
| 0 | 0 | 1,402,732 | 82,663,012 |
| | | 0 | | 148,659,453 |
| Payment for shares redeemed | | | | |
Class A
| (110,742) | (7,076,147) | (353,897) | (19,407,294) |
Class C
| (36,322) | (1,896,552) | (98,121) | (4,589,705) |
Class R6
| (2,048,632) | (142,209,326) | (5,125,700) | (309,662,461) |
Administrator Class
| (120,791) | (8,064,265) | (474,181) | (27,971,851) |
Institutional Class
| (4,793,447) | (328,451,405) | (7,943,243) | (491,545,106) |
| | | (487,697,695) | | (853,176,417) |
Net decrease in net assets resulting from capital share transactions
| | (358,774,931) | | (433,566,906) |
Total decrease in net assets
| | (350,568,953) | | (14,772,458) |
| Net assets | | | | |
Beginning of period
| | 1,342,645,824 | | 1,357,418,282 |
End of period
| | $ 992,076,871 | | $1,342,645,824 |
The accompanying notes are an integral part of these financial statements.
12 | Allspring Small Company Growth Fund
Financial highlights
(For a share outstanding throughout each period)
| | | Year ended May 31 |
| Class A | Six months ended
November 30, 2021
(unaudited) | 2021 | 2020 | 2019 | 2018 | 2017 |
Net asset value, beginning of period
| $61.44 | $46.62 | $48.98 | $56.66 | $44.26 | $37.69 |
Net investment loss
| (0.35) | (0.47) 1 | (0.34) 1 | (0.36) | (0.35) 1 | (0.28) 1 |
Net realized and unrealized gains (losses) on investments
| 0.58 | 24.27 | 2.49 | (3.22) | 12.75 | 6.85 |
Total from investment operations
| 0.23 | 23.80 | 2.15 | (3.58) | 12.40 | 6.57 |
| Distributions to shareholders from | | | | | | |
Net realized gains
| 0.00 | (8.98) | (4.51) | (4.10) | 0.00 | 0.00 |
Net asset value, end of period
| $61.67 | $61.44 | $46.62 | $48.98 | $56.66 | $44.26 |
Total return2
| 0.37% | 53.84% | 3.70% | (6.13)% | 28.02% | 17.43% |
| Ratios to average net assets (annualized)* | | | | | | |
Gross expenses
| 1.33% | 1.33% | 1.32% | 1.31% | 1.32% | 1.33% |
Net expenses
| 1.29% | 1.29% | 1.32% | 1.31% | 1.32% | 1.33% |
Net investment loss
| (1.14)% | (0.85)% | (0.69)% | (0.63)% | (0.71)% | (0.68)% |
| Supplemental data | | | | | | |
Portfolio turnover rate3
| 31% | 44% | 41% | 54% | 37% | 82% |
Net assets, end of period (000s omitted)
| $44,504 | $44,249 | $36,534 | $64,182 | $76,065 | $76,087 |
| * | Ratios include net expenses allocated from the affiliated Master Portfolio which were as follows: |
| Six months ended November 30, 2021 (unaudited) | 0.81% |
| Year ended May 31, 2021 | 0.79% |
| Year ended May 31, 2020 | 0.78% |
| Year ended May 31, 2019 | 0.78% |
| Year ended May 31, 2018 | 0.78% |
| Year ended May 31, 2017 | 0.78% |
| 1 | Calculated based upon average shares outstanding |
| 2 | Total return calculations do not include any sales charges. Returns for periods of less than one year are not annualized. |
| 3 | Portfolio turnover rate is calculated by multiplying the affiliated Master Portfolio’s percentage of the Fund’s total investment in securities at the end of the period by the affiliated Master Portfolio’s portfolio turnover rate. |
The accompanying notes are an integral part of these financial statements.
Allspring Small Company Growth Fund | 13
Financial highlights
(For a share outstanding throughout each period)
| | | Year ended May 31 |
| Class C | Six months ended
November 30, 2021
(unaudited) | 2021 | 2020 | 2019 | 2018 | 2017 |
Net asset value, beginning of period
| $50.65 | $39.84 | $42.75 | $50.38 | $39.65 | $34.02 |
Net investment loss
| (0.45) 1 | (0.75) 1 | (0.61) 1 | (0.66) 1 | (0.64) 1 | (0.54) 1 |
Net realized and unrealized gains (losses) on investments
| 0.45 | 20.54 | 2.21 | (2.87) | 11.37 | 6.17 |
Total from investment operations
| 0.00 | 19.79 | 1.60 | (3.53) | 10.73 | 5.63 |
| Distributions to shareholders from | | | | | | |
Net realized gains
| 0.00 | (8.98) | (4.51) | (4.10) | 0.00 | 0.00 |
Net asset value, end of period
| $50.65 | $50.65 | $39.84 | $42.75 | $50.38 | $39.65 |
Total return2
| 0.00% | 52.86% | 2.92% | (6.82)% | 27.06% | 16.55% |
| Ratios to average net assets (annualized)* | | | | | | |
Gross expenses
| 2.08% | 2.08% | 2.07% | 2.06% | 2.07% | 2.08% |
Net expenses
| 2.04% | 2.04% | 2.07% | 2.06% | 2.07% | 2.08% |
Net investment loss
| (1.73)% | (1.60)% | (1.44)% | (1.38)% | (1.47)% | (1.43)% |
| Supplemental data | | | | | | |
Portfolio turnover rate3
| 31% | 44% | 41% | 54% | 37% | 82% |
Net assets, end of period (000s omitted)
| $7,486 | $9,235 | $9,336 | $13,968 | $19,979 | $22,410 |
| * | Ratios include net expenses allocated from the affiliated Master Portfolio which were as follows: |
| Six months ended November 30, 2021 (unaudited) | 0.80% |
| Year ended May 31, 2021 | 0.79% |
| Year ended May 31, 2020 | 0.78% |
| Year ended May 31, 2019 | 0.78% |
| Year ended May 31, 2018 | 0.78% |
| Year ended May 31, 2017 | 0.78% |
| 1 | Calculated based upon average shares outstanding |
| 2 | Total return calculations do not include any sales charges. Returns for periods of less than one year are not annualized. |
| 3 | Portfolio turnover rate is calculated by multiplying the affiliated Master Portfolio’s percentage of the Fund’s total investment in securities at the end of the period by the affiliated Master Portfolio’s portfolio turnover rate. |
The accompanying notes are an integral part of these financial statements.
14 | Allspring Small Company Growth Fund
Financial highlights
(For a share outstanding throughout each period)
| | | Year ended May 31 |
| Class R6 | Six months ended
November 30, 2021
(unaudited) | 2021 | 2020 | 2019 | 2018 | 2017 |
Net asset value, beginning of period
| $67.95 | $50.64 | $52.65 | $60.31 | $46.91 | $39.77 |
Net investment loss
| (0.16) 1 | (0.17) | (0.14) 1 | (0.12) | (0.14) | (0.11) |
Net realized and unrealized gains (losses) on investments
| 0.56 | 26.46 | 2.64 | (3.44) | 13.54 | 7.25 |
Total from investment operations
| 0.40 | 26.29 | 2.50 | (3.56) | 13.40 | 7.14 |
| Distributions to shareholders from | | | | | | |
Net realized gains
| 0.00 | (8.98) | (4.51) | (4.10) | 0.00 | 0.00 |
Net asset value, end of period
| $68.35 | $67.95 | $50.64 | $52.65 | $60.31 | $46.91 |
Total return2
| 0.59% | 54.53% | 4.12% | (5.73)% | 28.59% | 17.95% |
| Ratios to average net assets (annualized)* | | | | | | |
Gross expenses
| 0.90% | 0.90% | 0.90% | 0.88% | 0.89% | 0.90% |
Net expenses
| 0.86% | 0.86% | 0.89% | 0.88% | 0.89% | 0.90% |
Net investment loss
| (0.46)% | (0.41)% | (0.27)% | (0.20)% | (0.29)% | (0.25)% |
| Supplemental data | | | | | | |
Portfolio turnover rate3
| 31% | 44% | 41% | 54% | 37% | 82% |
Net assets, end of period (000s omitted)
| $287,516 | $407,311 | $462,050 | $564,516 | $618,523 | $418,111 |
| * | Ratios include net expenses allocated from the affiliated Master Portfolio which were as follows: |
| Six months ended November 30, 2021 (unaudited) | 0.80% |
| Year ended May 31, 2021 | 0.79% |
| Year ended May 31, 2020 | 0.78% |
| Year ended May 31, 2019 | 0.78% |
| Year ended May 31, 2018 | 0.78% |
| Year ended May 31, 2017 | 0.78% |
| 1 | Calculated based upon average shares outstanding |
| 2 | Returns for periods of less than one year are not annualized. |
| 3 | Portfolio turnover rate is calculated by multiplying the affiliated Master Portfolio’s percentage of the Fund’s total investment in securities at the end of the period by the affiliated Master Portfolio’s portfolio turnover rate. |
The accompanying notes are an integral part of these financial statements.
Allspring Small Company Growth Fund | 15
Financial highlights
(For a share outstanding throughout each period)
| | | Year ended May 31 |
| Administrator Class | Six months ended
November 30, 2021
(unaudited) | 2021 | 2020 | 2019 | 2018 | 2017 |
Net asset value, beginning of period
| $64.98 | $48.87 | $51.10 | $58.85 | $45.91 | $39.05 |
Net investment loss
| (0.34) 1 | (0.44) 1 | (0.29) 1 | (0.29) 1 | (0.30) 1 | (0.24) 1 |
Net realized and unrealized gains (losses) on investments
| 0.62 | 25.53 | 2.57 | (3.36) | 13.24 | 7.10 |
Total from investment operations
| 0.28 | 25.09 | 2.28 | (3.65) | 12.94 | 6.86 |
| Distributions to shareholders from | | | | | | |
Net realized gains
| 0.00 | (8.98) | (4.51) | (4.10) | 0.00 | 0.00 |
Net asset value, end of period
| $65.26 | $64.98 | $48.87 | $51.10 | $58.85 | $45.91 |
Total return2
| 0.42% | 54.02% | 3.80% | (6.02)% | 28.19% | 17.57% |
| Ratios to average net assets (annualized)* | | | | | | |
Gross expenses
| 1.25% | 1.25% | 1.24% | 1.23% | 1.24% | 1.25% |
Net expenses
| 1.19% | 1.19% | 1.20% | 1.20% | 1.20% | 1.20% |
Net investment loss
| (1.00)% | (0.74)% | (0.57)% | (0.51)% | (0.60)% | (0.55)% |
| Supplemental data | | | | | | |
Portfolio turnover rate3
| 31% | 44% | 41% | 54% | 37% | 82% |
Net assets, end of period (000s omitted)
| $57,494 | $62,092 | $55,917 | $87,850 | $114,429 | $130,311 |
| * | Ratios include net expenses allocated from the affiliated Master Portfolio which were as follows: |
| Six months ended November 30, 2021 (unaudited) | 0.80% |
| Year ended May 31, 2021 | 0.79% |
| Year ended May 31, 2020 | 0.78% |
| Year ended May 31, 2019 | 0.78% |
| Year ended May 31, 2018 | 0.78% |
| Year ended May 31, 2017 | 0.78% |
| 1 | Calculated based upon average shares outstanding |
| 2 | Returns for periods of less than one year are not annualized. |
| 3 | Portfolio turnover rate is calculated by multiplying the affiliated Master Portfolio’s percentage of the Fund’s total investment in securities at the end of the period by the affiliated Master Portfolio’s portfolio turnover rate. |
The accompanying notes are an integral part of these financial statements.
16 | Allspring Small Company Growth Fund
Financial highlights
(For a share outstanding throughout each period)
| | | Year ended May 31 |
| Institutional Class | Six months ended
November 30, 2021
(unaudited) | 2021 | 2020 | 2019 | 2018 | 2017 |
Net asset value, beginning of period
| $67.62 | $50.47 | $52.51 | $60.20 | $46.85 | $39.75 |
Net investment loss
| (0.16) 1 | (0.29) | (0.17) 1 | (0.15) | (0.19) | (0.15) |
Net realized and unrealized gains (losses) on investments
| 0.53 | 26.42 | 2.64 | (3.44) | 13.54 | 7.25 |
Total from investment operations
| 0.37 | 26.13 | 2.47 | (3.59) | 13.35 | 7.10 |
| Distributions to shareholders from | | | | | | |
Net realized gains
| 0.00 | (8.98) | (4.51) | (4.10) | 0.00 | 0.00 |
Net asset value, end of period
| $67.99 | $67.62 | $50.47 | $52.51 | $60.20 | $46.85 |
Total return2
| 0.55% | 54.39% | 4.07% | (5.77)% | 28.50% | 17.86% |
| Ratios to average net assets (annualized)* | | | | | | |
Gross expenses
| 1.00% | 1.00% | 1.00% | 0.98% | 0.99% | 1.00% |
Net expenses
| 0.94% | 0.94% | 0.95% | 0.95% | 0.95% | 0.95% |
Net investment loss
| (0.46)% | (0.49)% | (0.32)% | (0.26)% | (0.35)% | (0.31)% |
| Supplemental data | | | | | | |
Portfolio turnover rate3
| 31% | 44% | 41% | 54% | 37% | 82% |
Net assets, end of period (000s omitted)
| $595,077 | $819,760 | $793,581 | $1,047,883 | $1,169,555 | $1,014,847 |
| * | Ratios include net expenses allocated from the affiliated Master Portfolio which were as follows: |
| Six months ended November 30, 2021 (unaudited) | 0.80% |
| Year ended May 31, 2021 | 0.79% |
| Year ended May 31, 2020 | 0.78% |
| Year ended May 31, 2019 | 0.78% |
| Year ended May 31, 2018 | 0.78% |
| Year ended May 31, 2017 | 0.78% |
| 1 | Calculated based upon average shares outstanding |
| 2 | Returns for periods of less than one year are not annualized. |
| 3 | Portfolio turnover rate is calculated by multiplying the affiliated Master Portfolio’s percentage of the Fund’s total investment in securities at the end of the period by the affiliated Master Portfolio’s portfolio turnover rate. |
The accompanying notes are an integral part of these financial statements.
Allspring Small Company Growth Fund | 17
Notes to financial statements (unaudited)
1. ORGANIZATION
Allspring Funds Trust (the "Trust"), a Delaware statutory trust organized on March 10, 1999, is an open-end management investment company registered under the Investment Company Act of 1940, as amended (the "1940 Act"). As an investment company, the Trust follows the accounting and reporting guidance in Financial Accounting Standards Board ("FASB") Accounting Standards Codification Topic 946, Financial Services – Investment Companies. These financial statements report on the Allspring Small Company Growth Fund (the "Fund") which is a diversified series of the Trust.
The Fund is a feeder fund in a master-feeder structure that invests substantially all of its assets in a single master portfolio with a substantially identical investment objective and substantially similar investment strategies. The Fund invests in Allspring Small Company Growth Portfolio, a separate diversified portfolio (the “affiliated Master Portfolio”) of Allspring Master Trust, a registered open-end management investment company. As of November 30, 2021, the Fund owned 97.63% of Allspring Small Company Growth Portfolio. The affiliated Master Portfolio directly acquires portfolio securities and the Fund acquires an indirect interest in those securities. The Fund accounts for its investment in the affiliated Master Portfolio as a partnership investment and records on a daily basis its share of the affiliated Master Portfolio’s income, expense and realized and unrealized gains and losses. The financial statements of the affiliated Master Portfolio for the six months ended November 30, 2021 are included in this report and should be read in conjunction with the Fund’s financial statements.
On February 23, 2021, Wells Fargo & Company entered into a definitive agreement to sell Wells Fargo Asset Management ("WFAM") to GTCR LLC and Reverence Capital Partners, L.P. WFAM was the trade name used by the asset management businesses of Wells Fargo & Company and included Wells Fargo Funds Management, LLC, Wells Capital Management, LLC, Wells Fargo Asset Management (International) Limited and Wells Fargo Funds Distributor, LLC. Effective on November 1, 2021, the sale transaction of WFAM by Wells Fargo & Company to GTCR LLC and Reverence Capital Partners, L.P. was closed. In connection with the closing of the transaction, WFAM became known as Allspring Global Investments (“Allspring”) and various entities that provide services to the Fund changed their names to "Allspring", including Allspring Funds Management, LLC (formerly Wells Fargo Funds Management, LLC), the investment manager to the Fund, Allspring Global Investments, Inc. (formerly Wells Capital Management, LLC) and Allspring Global Investments (UK) Limited (formerly Wells Fargo Asset Management (International) Limited), both registered investment advisers providing subadvisory services to certain funds, and Allspring Funds Distributor, LLC (formerly Wells Fargo Funds Distributor, LLC), the Fund's principal underwriter.
Consummation of the transaction resulted in the automatic termination of the Fund’s investment management agreement. The Fund’s Board of Trustees approved a new investment management agreement which was submitted and approved by the Fund’s shareholders at a Special Meeting of Shareholders held on August 16, 2021. The new agreement became effective on November 1, 2021.
Effective December 6, 2021, "Wells Fargo" was removed from the Fund's name and replaced it with "Allspring".
2. SIGNIFICANT ACCOUNTING POLICIES
The following significant accounting policies, which are consistently followed in the preparation of the financial statements of the Fund, are in conformity with U.S. generally accepted accounting principles which require management to make estimates and assumptions that affect the reported amounts of assets and liabilities, disclosure of contingent assets and liabilities at the date of the financial statements, and the reported amounts of income and expenses during the reporting period. Actual results could differ from those estimates.
Securities valuation
All investments are valued each business day as of the close of regular trading on the New York Stock Exchange (generally 4 p.m. Eastern Time), although the Fund may deviate from this calculation time under unusual or unexpected circumstances.
Investments in the affiliated Master Portfolio are valued daily based on the Fund’s proportionate share of the affiliated Master Portfolio’s net assets, which are also valued daily. Securities held in the affiliated Master Portfolio are valued as discussed in the Notes to Financial Statements of the affiliated Master Portfolio, which are included elsewhere in this report.
Investments which are not valued using the method discussed above are valued at their fair value, as determined in good faith by the Board of Trustees. The Board of Trustees has established a Valuation Committee comprised of the Trustees and has delegated to it the authority to take any actions regarding the valuation of portfolio securities that the Valuation Committee deems necessary or appropriate, including determining the fair value of portfolio securities, unless the determination has been delegated to the Allspring Global Investments Pricing Committee at Allspring Funds Management, LLC ("Allspring Funds Management"). The Board of Trustees retains the authority to make or ratify any valuation decisions or approve any changes to
18 | Allspring Small Company Growth Fund
Notes to financial statements (unaudited)
the Valuation Procedures as it deems appropriate. On a quarterly basis, the Board of Trustees receives reports on any valuation actions taken by the Valuation Committee or the Allspring Global Investments Pricing Committee which may include items for ratification.
Investment transactions, income and expenses
Investments in the affiliated Master Portfolio are recorded on a trade date basis. The Fund records daily its proportionate share of the affiliated Master Portfolio’s income, expenses and realized and unrealized gains or losses. The Fund also accrues its own expenses.
Distributions to shareholders
Distributions to shareholders from net investment income and any net realized gains are recorded on the ex-dividend date and paid at least annually. Such distributions are determined in accordance with income tax regulations and may differ from U.S. generally accepted accounting principles. Dividend sources are estimated at the time of declaration. The tax character of distributions is determined as of the Fund's fiscal year end. Therefore, a portion of the Fund's distributions made prior to the Fund’s fiscal year end may be categorized as a tax return of capital at year end.
Federal and other taxes
The Fund intends to continue to qualify as a regulated investment company by distributing substantially all of its investment company taxable income and any net realized capital gains (after reduction for capital loss carryforwards) sufficient to relieve it from all, or substantially all, federal income taxes. Accordingly, no provision for federal income taxes was required.
The Fund’s income and federal excise tax returns and all financial records supporting those returns for the prior three fiscal years are subject to examination by the federal and Delaware revenue authorities. Management has analyzed the Fund's tax positions taken on federal, state, and foreign tax returns for all open tax years and does not believe that there are any uncertain tax positions that require recognition of a tax liability.
As of November 30, 2021, the aggregate cost of all investments for federal income tax purposes was $669,748,471 and the unrealized gains (losses) consisted of:
| Gross unrealized gains | $322,548,317 |
| Gross unrealized losses | 0 |
| Net unrealized gains | $322,548,317 |
Class allocations
The separate classes of shares offered by the Fund differ principally in applicable sales charges, distribution, shareholder servicing, and administration fees. Class specific expenses are charged directly to that share class. Investment income, common fund-level expenses, and realized and unrealized gains (losses) on investments are allocated daily to each class of shares based on the relative proportion of net assets of each class.
3. FAIR VALUATION MEASUREMENTS
At November 30, 2021, the Fund’s investment in the affiliated Master Portfolio was measured at fair value using the net asset value per share (or its equivalent) as a practical expedient. The investment objective and fair value of the affiliated Master Portfolio is as follows:
| Affiliated Master Portfolio | Investment objective | Fair value of affiliated
Master Portfolio |
| Allspring Small Company Growth Portfolio | Seek long-term capital appreciation | $992,296,788 |
The affiliated Master Portfolio does not have a redemption period notice, can be redeemed daily and does not have any unfunded commitments.
4. TRANSACTIONS WITH AFFILIATES
Management fee
Allspring Funds Management, a wholly owned subsidiary of Allspring Global Investments Holdings, LLC, a holding company indirectly owned by certain private funds of GTCR LLC and Reverence Capital Partners, L.P., is the manager of the Fund and provides advisory and fund-level administrative services under an investment management agreement. Under the investment
Allspring Small Company Growth Fund | 19
Notes to financial statements (unaudited)
management agreement, Allspring Funds Management is responsible for, among other services, implementing the investment objectives and strategies of the Fund and providing fund-level administrative services in connection with the Fund’s operations. As long as the Fund continues to invest substantially all of its assets in a single affiliated Master Portfolio, the Fund pays Allspring Funds Management an investment management fee only for fund-level administrative services at the following annual rate based on the Fund’s average daily net assets:
| Average daily net assets | Management fee |
| First $5 billion | 0.050% |
| Next $5 billion | 0.040 |
| Over $10 billion | 0.030 |
For the six months ended November 30, 2021, the management fee was equivalent to an annual rate of 0.05% of the Fund’s average daily net assets.
Allspring Funds Management also serves as the adviser to the affiliated Master Portfolio and is entitled to receive a fee from the affiliated Master Portfolio for those services.
Administration fees
Under a class-level administration agreement, Allspring Funds Management provides class-level administrative services to the Fund, which includes paying fees and expenses for services provided by the transfer agent, sub-transfer agents, omnibus account servicers and record-keepers. As compensation for its services under the class-level administration agreement, Allspring Funds Management receives an annual fee which is calculated based on the average daily net assets of each class as follows:
| | Class-level
administration fee |
| Class A | 0.21% |
| Class C | 0.21 |
| Class R6 | 0.03 |
| Administrator Class | 0.13 |
| Institutional Class | 0.13 |
Waivers and/or expense reimbursements
Allspring Funds Management has contractually committed to waive and/or reimburse management and administration fees to the extent necessary to maintain certain net operating expense ratios for the Fund. When each class of the Fund has exceeded its expense cap, Allspring Funds Management will waive fees and/or reimburse expenses from fund-level expenses on a proportionate basis and then from class specific expenses. When only certain classes exceed their expense caps, waivers and/or reimbursements are applied against class specific expenses before fund-level expenses. Net expenses from the affiliated Master Portfolio are included in the expense caps. Allspring Funds Management has contractually committed through September 30, 2022 to waive fees and/or reimburse expenses to the extent necessary to cap expenses. Prior to or after the commitment expiration date, the caps may be increased or the commitment to maintain the caps may be terminated only with the approval of the Board of Trustees. The contractual expense caps are as follows:
| | Expense ratio caps |
| Class A | 1.29% |
| Class C | 2.04 |
| Class R6 | 0.86 |
| Administrator Class | 1.19 |
| Institutional Class | 0.94 |
20 | Allspring Small Company Growth Fund
Notes to financial statements (unaudited)
Distribution fee
The Trust has adopted a distribution plan for Class C shares of the Fund pursuant to Rule 12b-1 under the 1940 Act. A distribution fee is charged to Class C shares and paid to Allspring Funds Distributor, LLC ("Allspring Funds Distributor"), an affiliate of Allspring Funds Management, the principal underwriter, at an annual rate of 0.75% of the average daily net assets of Class C shares.
In addition, Allspring Funds Distributor is entitled to receive the front-end sales charge from the purchase of Class A shares and a contingent deferred sales charge on the redemption of certain Class A shares. Allspring Funds Distributor is also entitled to receive the contingent deferred sales charges from redemptions of Class C shares. For the six months ended November 30, 2021, Allspring Funds Distributor received $2,974 from the sale of Class A shares. No contingent deferred sales charges were incurred by Class A and Class C shares for the six months ended November 30, 2021.
Shareholder servicing fees
The Trust has entered into contracts with one or more shareholder servicing agents, whereby Class A, Class C, and Administrator Class of the Fund are charged a fee at an annual rate of 0.25% of the average daily net assets of each respective class. A portion of these total shareholder servicing fees were paid to affiliates, and to certain entities that were affiliates of the Fund until November 1, 2021.
5. INVESTMENT PORTFOLIO TRANSACTIONS
The Fund seeks to achieve its investment objective by investing substantially all of its assets in the affiliated Master Portfolio. Purchases and sales have been calculated by multiplying the Fund's ownership percentage of the affiliated Master Portfolio by the affiliated Master Portfolio's purchases and sales. Purchases and sales of investments, excluding U.S. government obligations (if any) and short-term securities, for the six months ended November 30, 2021 were $335,856,947 and $690,273,783, respectively.
6. BANK BORROWINGS
The Trust (excluding the money market funds), Allspring Master Trust and Allspring Variable Trust are parties to a $350,000,000 revolving credit agreement whereby the Fund is permitted to use bank borrowings for temporary or emergency purposes, such as to fund shareholder redemption requests. Interest under the credit agreement is charged to the Fund based on a borrowing rate equal to the higher of the Federal Funds rate in effect on that day plus 1.25% or the overnight bank funding rate in effect on that day plus 1.25%. In addition, an annual commitment fee equal to 0.25% of the unused balance is allocated to each participating fund.
For the six months ended November 30, 2021, there were no borrowings by the Fund under the agreement.
7. CONCENTRATION RISKS
Concentration risks result from exposure to a limited number of sectors. Through its investment in the affiliated Master Portfolio which may invest a substantial portion of its assets in any sector, the Fund may in turn be more affected by changes in that sector than a fund whose investments are not heavily weighted in any sector. As of the end of the period, the affiliated Master Portfolio concentrated its portfolio in investments related to the health care sector.
8. INDEMNIFICATION
Under the Fund's organizational documents, the officers and Trustees have been granted certain indemnification rights against certain liabilities that may arise out of performance of their duties to the Fund. The Fund has entered into a separate agreement with each Trustee that converts indemnification rights currently existing under the Fund’s organizational documents into contractual rights that cannot be changed in the future without the consent of the Trustee. Additionally, in the normal course of business, the Fund may enter into contracts with service providers that contain a variety of indemnification clauses. The Fund’s maximum exposure under these arrangements is dependent on future claims that may be made against the Fund and, therefore, cannot be estimated.
9. CORONAVIRUS (COVID-19) PANDEMIC
On March 11, 2020, the World Health Organization announced that it had made the assessment that coronavirus disease 2019 (“COVID-19”) is a pandemic. The impacts of COVID-19 are affecting the entire global economy, individual companies and investment products, the funds, and the market in general. There is significant uncertainty around the extent and duration of business disruptions related to COVID-19 and the impacts may last for an extended period of time. COVID-19 has led to significant uncertainty and volatility in the financial markets.
Allspring Small Company Growth Fund | 21
Portfolio of investments—November 30, 2021
| | | | | Shares | Value |
| Common stocks: 96.20% | | | | | |
| Communication services: 1.12% | | | | | |
| Entertainment: 1.12% | | | | | |
| Lions Gate Entertainment Class B † | | | | 350,517 | $ 4,784,557 |
| Zynga Incorporated Class A † | | | | 1,096,312 | 6,610,761 |
| | | | | | 11,395,318 |
| Consumer discretionary: 9.92% | | | | | |
| Auto components: 0.80% | | | | | |
| Fox Factory Holding Corporation † | | | | 46,150 | 8,111,786 |
| Hotels, restaurants & leisure: 2.12% | | | | | |
| International Game Technology plc | | | | 493,551 | 13,335,748 |
| Papa John's International Incorporated | | | | 67,079 | 8,178,272 |
| | | | | | 21,514,020 |
| Household durables: 1.39% | | | | | |
| Skyline Champion Corporation † | | | | 144,173 | 11,281,537 |
| Traeger Incorporated †« | | | | 224,455 | 2,897,714 |
| | | | | | 14,179,251 |
| Leisure products: 1.52% | | | | | |
| Callaway Golf Company † | | | | 263,121 | 7,093,742 |
| Hayward Holdings Incorporated † | | | | 340,434 | 8,333,824 |
| | | | | | 15,427,566 |
| Multiline retail: 0.74% | | | | | |
| Ollie's Bargain Outlet Holdings Incorporated † | | | | 121,944 | 7,547,114 |
| Specialty retail: 3.35% | | | | | |
| American Eagle Outfitters Incorporated | | | | 309,314 | 8,008,139 |
| Burlington Stores Incorporated † | | | | 28,905 | 8,472,923 |
| Five Below Incorporated † | | | | 34,342 | 6,986,536 |
| Monro Muffler Brake Incorporated | | | | 77,147 | 4,321,775 |
| Sleep Number Corporation † | | | | 78,348 | 6,250,603 |
| | | | | | 34,039,976 |
| Consumer staples: 2.91% | | | | | |
| Beverages: 0.20% | | | | | |
| Zevia PBC Class A † | | | | 260,461 | 1,992,527 |
| Food & staples retailing: 1.01% | | | | | |
| Performance Food Group Company † | | | | 253,727 | 10,227,735 |
| Food products: 0.65% | | | | | |
| Lamb Weston Holdings Incorporated | | | | 128,090 | 6,650,433 |
| Personal products: 1.05% | | | | | |
| e.l.f. Beauty Incorporated † | | | | 354,472 | 10,676,697 |
| Financials: 10.67% | | | | | |
| Banks: 1.34% | | | | | |
| Triumph Bancorp Incorporated † | | | | 106,677 | 13,585,316 |
The accompanying notes are an integral part of these financial statements.
22 | Allspring Small Company Growth Portfolio
Portfolio of investments—November 30, 2021
| | | | | Shares | Value |
| Capital markets: 3.98% | | | | | |
| Evercore Partners Incorporated Class A | | | | 63,235 | $ 8,770,695 |
| Focus Financial Partners Class A † | | | | 146,102 | 8,991,117 |
| Open Lending Corporation Class A † | | | | 155,052 | 3,603,408 |
| Stifel Financial Corporation | | | | 162,654 | 11,550,061 |
| VIRTU Financial Incorporated Class A | | | | 267,152 | 7,528,343 |
| | | | | | 40,443,624 |
| Insurance: 4.49% | | | | | |
| BRP Group Incorporated Class A † | | | | 324,660 | 12,025,406 |
| Goosehead Insurance Incorporated Class A | | | | 99,107 | 13,014,731 |
| Palomar Holdings Incorporated † | | | | 134,990 | 9,865,069 |
| Ryan Specialty Group Holdings Incorporated † | | | | 281,651 | 10,778,784 |
| | | | | | 45,683,990 |
| Thrifts & mortgage finance: 0.86% | | | | | |
| Essent Group Limited | | | | 209,688 | 8,718,827 |
| Health care: 24.46% | | | | | |
| Biotechnology: 5.02% | | | | | |
| Amicus Therapeutics Incorporated † | | | | 521,166 | 5,581,688 |
| Arena Pharmaceuticals Incorporated † | | | | 70,353 | 3,833,535 |
| Avid Bioservices Incorporated † | | | | 267,689 | 8,180,576 |
| Blueprint Medicines Corporation † | | | | 72,733 | 6,996,915 |
| Cytokinetics Incorporated † | | | | 141,098 | 5,550,795 |
| Insmed Incorporated † | | | | 208,522 | 5,738,525 |
| Ionis Pharmaceuticals Incorporated † | | | | 82,134 | 2,176,551 |
| Iovance Biotherapeutics Incorporated † | | | | 125,200 | 2,343,744 |
| Mirati Therapeutics Incorporated † | | | | 25,017 | 3,421,575 |
| Neurocrine Biosciences Incorporated † | | | | 57,553 | 4,791,287 |
| Turning Point Therapeutics Incorporated † | | | | 62,473 | 2,377,722 |
| | | | | | 50,992,913 |
| Health care equipment & supplies: 5.81% | | | | | |
| Atricure Incorporated † | | | | 145,688 | 9,236,619 |
| Axonics Modulation Technologies Incorporated † | | | | 179,796 | 9,782,700 |
| Cerus Corporation † | | | | 774,848 | 5,338,703 |
| Conmed Corporation | | | | 77,840 | 10,232,846 |
| Haemonetics Corporation † | | | | 105,737 | 5,419,021 |
| Novocure Limited † | | | | 24,910 | 2,332,572 |
| Silk Road Medical Incorporated † | | | | 213,534 | 8,665,210 |
| Tactile Systems Technology Class I † | | | | 202,424 | 3,947,268 |
| ViewRay Incorporated † | | | | 798,262 | 4,103,067 |
| | | | | | 59,058,006 |
| Health care providers & services: 3.21% | | | | | |
| AMN Healthcare Services Incorporated † | | | | 97,847 | 11,155,536 |
| HealthEquity Incorporated † | | | | 127,837 | 6,990,127 |
| Oak Street Health Incorporated †« | | | | 169,593 | 5,248,903 |
| Privia Health Group Incorporated † | | | | 185,549 | 4,286,182 |
| U.S. Physical Therapy Incorporated | | | | 57,468 | 4,941,099 |
| | | | | | 32,621,847 |
| Health care technology: 3.80% | | | | | |
| Allscripts Healthcare Solutions Incorporated † | | | | 466,763 | 7,762,269 |
The accompanying notes are an integral part of these financial statements.
Allspring Small Company Growth Portfolio | 23
Portfolio of investments—November 30, 2021
| | | | | Shares | Value |
| Health care technology (continued) | | | | | |
| Evolent Health Incorporated Class A † | | | | 284,238 | $ 7,390,188 |
| Omnicell Incorporated † | | | | 86,376 | 15,288,552 |
| Phreesia Incorporated † | | | | 142,655 | 8,228,340 |
| | | | | | 38,669,349 |
| Life sciences tools & services: 5.85% | | | | | |
| Adaptive Biotechnologies Corporation † | | | | 180,587 | 4,711,515 |
| Avantor Incorporated † | | | | 403,584 | 15,933,496 |
| ICON plc ADR † | | | | 78,949 | 21,353,336 |
| Syneos Health Incorporated † | | | | 179,801 | 17,469,465 |
| | | | | | 59,467,812 |
| Pharmaceuticals: 0.77% | | | | | |
| Axsome Therapeutics Incorporated †« | | | | 70,597 | 2,438,420 |
| Pacira Pharmaceuticals Incorporated † | | | | 102,634 | 5,400,601 |
| | | | | | 7,839,021 |
| Industrials: 19.96% | | | | | |
| Aerospace & defense: 1.25% | | | | | |
| Kratos Defense & Security Solutions Incorporated † | | | | 311,605 | 6,141,735 |
| Mercury Systems Incorporated † | | | | 133,107 | 6,515,588 |
| | | | | | 12,657,323 |
| Airlines: 0.68% | | | | | |
| Sun Country Airlines Holding † | | | | 253,323 | 6,948,650 |
| Building products: 3.60% | | | | | |
| A.O. Smith Corporation | | | | 54,654 | 4,320,401 |
| Advanced Drainage Systems Incorporated | | | | 82,336 | 10,185,787 |
| Masonite International Corporation † | | | | 89,533 | 9,580,031 |
| PGT Incorporated † | | | | 258,486 | 5,309,302 |
| The AZEK Company Incorporated † | | | | 183,833 | 7,209,930 |
| | | | | | 36,605,451 |
| Commercial services & supplies: 0.96% | | | | | |
| IAA Incorporated † | | | | 110,774 | 5,350,384 |
| KAR Auction Services Incorporated † | | | | 291,289 | 4,366,422 |
| | | | | | 9,716,806 |
| Construction & engineering: 0.60% | | | | | |
| Dycom Industries Incorporated † | | | | 65,139 | 6,089,194 |
| Electrical equipment: 0.80% | | | | | |
| Atkore International Incorporated † | | | | 76,378 | 8,134,257 |
| Machinery: 3.00% | | | | | |
| Chart Industries Incorporated † | | | | 48,671 | 8,495,523 |
| SPX Corporation † | | | | 191,942 | 11,161,427 |
| Wabash National Corporation | | | | 335,155 | 5,597,089 |
| Woodward Incorporated | | | | 49,877 | 5,276,987 |
| | | | | | 30,531,026 |
| Professional services: 6.10% | | | | | |
| ASGN Incorporated † | | | | 130,768 | 15,911,850 |
The accompanying notes are an integral part of these financial statements.
24 | Allspring Small Company Growth Portfolio
Portfolio of investments—November 30, 2021
| | | | | Shares | Value |
| Professional services (continued) | | | | | |
| Clarivate plc † | | | | 327,721 | $ 7,649,008 |
| FTI Consulting Incorporated † | | | | 59,255 | 8,656,563 |
| ICF International Incorporated | | | | 112,405 | 10,874,060 |
| KBR Incorporated | | | | 252,788 | 11,122,672 |
| Sterling Check Corporation † | | | | 326,298 | 7,756,103 |
| | | | | | 61,970,256 |
| Road & rail: 1.46% | | | | | |
| Knight-Swift Transportation Holdings Incorporated | | | | 142,495 | 8,157,839 |
| Schneider National Incorporated Class B | | | | 271,937 | 6,689,650 |
| | | | | | 14,847,489 |
| Trading companies & distributors: 1.51% | | | | | |
| Boise Cascade Company | | | | 116,366 | 7,544,008 |
| Core & Main Incorporated † | | | | 293,869 | 7,825,731 |
| | | | | | 15,369,739 |
| Information technology: 23.33% | | | | | |
| Communications equipment: 2.51% | | | | | |
| Ciena Corporation † | | | | 242,658 | 14,615,291 |
| Lumentum Holdings Incorporated † | | | | 125,486 | 10,888,420 |
| | | | | | 25,503,711 |
| Electronic equipment, instruments & components: 1.18% | | | | | |
| Itron Incorporated † | | | | 86,082 | 5,329,337 |
| Par Technology Corporation †« | | | | 126,470 | 6,623,234 |
| | | | | | 11,952,571 |
| IT services: 2.48% | | | | | |
| EVO Payments Incorporated Class A † | | | | 286,950 | 6,109,166 |
| LiveRamp Holdings Incorporated † | | | | 169,224 | 7,941,682 |
| Verra Mobility Corporation † | | | | 500,594 | 7,203,548 |
| WEX Incorporated † | | | | 31,284 | 3,954,923 |
| | | | | | 25,209,319 |
| Semiconductors & semiconductor equipment: 5.24% | | | | | |
| CMC Materials Incorporated | | | | 50,490 | 6,705,072 |
| FormFactor Incorporated † | | | | 132,549 | 5,556,454 |
| Onto Innovation Incorporated † | | | | 91,410 | 8,607,166 |
| Silicon Motion Technology Corporation ADR | | | | 128,867 | 8,895,689 |
| Synaptics Incorporated † | | | | 45,319 | 12,790,835 |
| Teradyne Incorporated | | | | 70,232 | 10,736,366 |
| | | | | | 53,291,582 |
| Software: 11.92% | | | | | |
| Black Knight Incorporated † | | | | 155,500 | 11,113,585 |
| Box Incorporated Class A † | | | | 458,831 | 10,741,234 |
| CyberArk Software Limited † | | | | 59,530 | 10,289,761 |
| Doubleverify Holdings Incorporated † | | | | 109,611 | 3,384,788 |
| Jamf Holding Corporation † | | | | 273,923 | 8,828,538 |
| Mimecast Limited † | | | | 111,607 | 9,040,167 |
| Nutanix Incorporated Class A † | | | | 266,966 | 8,868,611 |
| Pagerduty Incorporated † | | | | 282,896 | 10,028,663 |
| PTC Incorporated † | | | | 111,407 | 12,207,979 |
The accompanying notes are an integral part of these financial statements.
Allspring Small Company Growth Portfolio | 25
Portfolio of investments—November 30, 2021
| | | | | Shares | Value |
| Software (continued) | | | | | |
| Sprout Social Incorporated Class A † | | | | 61,373 | $ 6,854,137 |
| SS&C Technologies Holdings Incorporated | | | | 184,502 | 14,083,038 |
| Zendesk Incorporated † | | | | 60,759 | 6,204,101 |
| Zuora Incorporated † | | | | 480,222 | 9,513,198 |
| | | | | | 121,157,800 |
| Materials: 2.79% | | | | | |
| Chemicals: 2.07% | | | | | |
| Element Solutions Incorporated | | | | 603,904 | 13,811,284 |
| Orion Engineered Carbons SA † | | | | 410,126 | 7,197,711 |
| | | | | | 21,008,995 |
| Metals & mining: 0.72% | | | | | |
| Steel Dynamics Incorporated | | | | 122,225 | 7,309,055 |
| Real estate: 1.04% | | | | | |
| Equity REITs: 0.72% | | | | | |
| Ryman Hospitality Properties Incorporated † | | | | 94,547 | 7,317,938 |
| Real estate management & development: 0.32% | | | | | |
| Compass Incorporated Class A †« | | | | 342,861 | 3,277,751 |
| Total Common stocks (Cost $589,401,350) | | | | | 977,742,041 |
| | | | Expiration
date | | |
| Rights: 0.00% | | | | | |
| Communication services: 0.00% | | | | | |
| Media: 0.00% | | | | | |
| Media General Incorporated ♦† | | | 12-31-2021 | 347,897 | 0 |
| Total Rights (Cost $0) | | | | | 0 |
| | | Yield | | | |
| Short-term investments: 5.17% | | | | | |
| Investment companies: 5.17% | | | | | |
| Allspring Government Money Market Fund Select Class ♠∞ | | 0.03% | | 36,582,556 | 36,582,556 |
| Securities Lending Cash Investments LLC ♠∩∞ | | 0.04 | | 15,956,833 | 15,956,833 |
| Total Short-term investments (Cost $52,539,389) | | | | | 52,539,389 |
| Total investments in securities (Cost $641,940,739) | 101.37% | | | | 1,030,281,430 |
| Other assets and liabilities, net | (1.37) | | | | (13,886,763) |
| Total net assets | 100.00% | | | | $1,016,394,667 |
| † | Non-income-earning security |
| ♦ | The security is fair valued in accordance with procedures approved by the Board of Trustees. |
| « | All or a portion of this security is on loan. |
| ♠ | The issuer of the security is an affiliated person of the Portfolio as defined in the Investment Company Act of 1940. |
| ∩ | The investment is a non-registered investment company purchased with cash collateral received from securities on loan. |
| ∞ | The rate represents the 7-day annualized yield at period end. |
The accompanying notes are an integral part of these financial statements.
26 | Allspring Small Company Growth Portfolio
Portfolio of investments—November 30, 2021
| Abbreviations: |
| ADR | American depositary receipt |
| REIT | Real estate investment trust |
Investments in affiliates
An affiliated investment is an investment in which the Portfolio owns at least 5% of the outstanding voting shares of the issuer or as a result of other relationships, such as the Portfolio and the issuer having the same adviser or investment manager. Transactions with issuers that were either affiliates of the Portfolio at the beginning of the period or the end of the period were as follows:
| | Value,
beginning of
period | Purchases | Sales
proceeds | Net
realized
gains
(losses) | | Net
change in
unrealized
gains
(losses) | | Value,
end of
period | Shares,
end
of period | Income
from
affiliated
securities |
| Short-term investments | | | | | | | | | |
| Allspring Government Money Market Fund Select Class | $40,275,255 | $197,459,065 | $(201,151,764) | $0 | | $0 | | $ 36,582,556 | 36,582,556 | $ 4,249 |
| Securities Lending Cash Investments LLC | 21,935,055 | 129,473,795 | (135,452,017) | 0 | | 0 | | 15,956,833 | 15,956,833 | 2,474 # |
| | | | | $0 | | $0 | | $52,539,389 | | $6,723 |
| # | Amount shown represents income before fees and rebates. |
The accompanying notes are an integral part of these financial statements.
Allspring Small Company Growth Portfolio | 27
Statement of assets and liabilities—November 30, 2021 (unaudited)
| | |
| Assets | |
Investments in unaffiliated securities (including $15,508,431 of securities loaned), at value (cost $589,401,350)
| $ 977,742,041 |
Investments in affiliated securities, at value (cost $52,539,389)
| 52,539,389 |
Receivable for investments sold
| 1,970,110 |
Receivable for dividends
| 757,587 |
Receivable for securities lending income, net
| 4,791 |
Prepaid expenses and other assets
| 37,606 |
Total assets
| 1,033,051,524 |
| Liabilities | |
Payable upon receipt of securities loaned
| 15,956,833 |
Advisory fee payable
| 692,880 |
Accrued expenses and other liabilities
| 7,144 |
Total liabilities
| 16,656,857 |
Total net assets
| $1,016,394,667 |
The accompanying notes are an integral part of these financial statements.
28 | Allspring Small Company Growth Portfolio
Statement of operations—six months ended November 30, 2021 (unaudited)
| | |
| Investment income | |
Dividends
| $ 2,347,903 |
Income from affiliated securities
| 58,796 |
Total investment income
| 2,406,699 |
| Expenses | |
Advisory fee
| 4,486,153 |
Custody and accounting fees
| 41,148 |
Professional fees
| 32,306 |
Interest holder report expenses
| 11,742 |
Trustees’ fees and expenses
| 9,662 |
Other fees and expenses
| 24,485 |
Total expenses
| 4,605,496 |
Net investment loss
| (2,198,797) |
| Realized and unrealized gains (losses) on investments | |
Net realized gains on investments
| 212,663,542 |
Net change in unrealized gains (losses) on investments
| (201,183,961) |
Net realized and unrealized gains (losses) on investments
| 11,479,581 |
Net increase in net assets resulting from operations
| $ 9,280,784 |
The accompanying notes are an integral part of these financial statements.
Allspring Small Company Growth Portfolio | 29
Statement of changes in net assets
| | | |
| | Six months ended
November 30, 2021
(unaudited) | Year ended
May 31, 2021 |
| Operations | | |
Net investment loss
| $ (2,198,797) | $ (4,920,462) |
Net realized gains on investments
| 212,663,542 | 383,642,418 |
Net change in unrealized gains (losses) on investments
| (201,183,961) | 248,333,561 |
Net increase in net assets resulting from operations
| 9,280,784 | 627,055,517 |
| Capital transactions | | |
| Transactions in investors’ beneficial interests | | |
Contributions
| 47,121,064 | 27,183,074 |
Withdrawals
| (418,298,101) | (661,328,291) |
Net decrease in net assets resulting from capital transactions
| (371,177,037) | (634,145,217) |
Total decrease in net assets
| (361,896,253) | (7,089,700) |
| Net assets | | |
Beginning of period
| 1,378,290,920 | 1,385,380,620 |
End of period
| $1,016,394,667 | $1,378,290,920 |
The accompanying notes are an integral part of these financial statements.
30 | Allspring Small Company Growth Portfolio
| | | Year ended May 31 |
| | Six months ended
November 30, 2021
(unaudited) | 2021 | 2020 | 2019 | 2018 | 2017 |
Total return1
| 0.62% | 54.64% | 4.08% | (5.64)% | 28.74% | 18.15% |
| Ratios to average net assets (annualized) | | | | | | |
Gross expenses
| 0.80% | 0.79% | 0.78% | 0.78% | 0.78% | 0.79% |
Net expenses
| 0.80% | 0.79% | 0.78% | 0.78% | 0.78% | 0.79% |
Net investment loss
| (0.38)% | (0.34)% | (0.16)% | (0.09)% | (0.18)% | (0.14)% |
| Supplemental data | | | | | | |
Portfolio turnover rate
| 31% | 44% | 41% | 54% | 37% | 82% |
| 1 | Returns for periods of less than one year are not annualized. |
The accompanying notes are an integral part of these financial statements.
Allspring Small Company Growth Portfolio | 31
Notes to financial statements (unaudited)
1. ORGANIZATION
Allspring Master Trust (the "Trust"), a Delaware statutory trust organized on March 10, 1999, is an open-end management investment company registered under the Investment Company Act of 1940, as amended (the "1940 Act"). As an investment company, the Trust follows the accounting and reporting guidance in Financial Accounting Standards Board ("FASB") Accounting Standards Codification Topic 946, Financial Services – Investment Companies. These financial statements report on the Allspring Small Company Growth Portfolio (the "Portfolio") which is a diversified series of the Trust.
Interests in the Portfolio are available solely through private placement transactions that do not involve any "public offering" within the meaning of Section 4(a)(2) of the Securities Act of 1933.
On February 23, 2021, Wells Fargo & Company entered into a definitive agreement to sell Wells Fargo Asset Management ("WFAM") to GTCR LLC and Reverence Capital Partners, L.P. WFAM was the trade name used by the asset management businesses of Wells Fargo & Company and included Wells Fargo Funds Management, LLC, Wells Capital Management, LLC, Wells Fargo Asset Management (International) Limited and Wells Fargo Funds Distributor, LLC. Effective on November 1, 2021, the sale transaction of WFAM by Wells Fargo & Company to GTCR LLC and Reverence Capital Partners, L.P. was closed. In connection with the closing of the transaction, WFAM became known as Allspring Global Investments (“Allspring”) and various entities that provide services to the Portfolio changed their names to "Allspring", including Allspring Funds Management, LLC (formerly Wells Fargo Funds Management, LLC), the adviser to the Portfolio, Allspring Global Investments, Inc. (formerly Wells Capital Management, LLC) and Allspring Global Investments (UK) Limited (formerly Wells Fargo Asset Management (International) Limited), both registered investment advisers providing subadvisory services to certain funds, and Allspring Funds Distributor, LLC (formerly Wells Fargo Funds Distributor, LLC).
Consummation of the transaction resulted in the automatic termination of the Portfolio’s advisory agreement and subadvisory agreement. The Portfolio’s Board of Trustees approved a new advisory agreement and subadvisory agreement which were approved by the Portfolio's interest holders on August 16, 2021. The new agreements became effective on November 1, 2021.
Effective December 6, 2021, "Wells Fargo" was removed from the Portfolio's name and replaced it with "Allspring".
2. SIGNIFICANT ACCOUNTING POLICIES
The following significant accounting policies, which are consistently followed in the preparation of the financial statements of the Portfolio, are in conformity with U.S. generally accepted accounting principles which require management to make estimates and assumptions that affect the reported amounts of assets and liabilities, disclosure of contingent assets and liabilities at the date of the financial statements, and the reported amounts of income and expenses during the reporting period. Actual results could differ from those estimates.
Securities valuation
All investments are valued each business day as of the close of regular trading on the New York Stock Exchange (generally 4 p.m. Eastern Time), although the Portfolio may deviate from this calculation time under unusual or unexpected circumstances.
Equity securities that are listed on a foreign or domestic exchange or market are valued at the official closing price or, if none, the last sales price. If no sale occurs on the principal exchange or market that day, a fair value price will be determined in accordance with the Portfolio’s Valuation Procedures.
Investments in registered open-end investment companies are valued at net asset value. Interests in non-registered investment companies that are redeemable at net asset value are fair valued normally at net asset value.
Investments which are not valued using any of the methods discussed above are valued at their fair value, as determined in good faith by the Board of Trustees. The Board of Trustees has established a Valuation Committee comprised of the Trustees and has delegated to it the authority to take any actions regarding the valuation of portfolio securities that the Valuation Committee deems necessary or appropriate, including determining the fair value of portfolio securities, unless the determination has been delegated to the Allspring Global Investments Pricing Committee at Allspring Funds Management, LLC ("Allspring Funds Management"). The Board of Trustees retains the authority to make or ratify any valuation decisions or approve any changes to the Valuation Procedures as it deems appropriate. On a quarterly basis, the Board of Trustees receives reports on any valuation actions taken by the Valuation Committee or the Allspring Global Investments Pricing Committee which may include items for ratification.
Securities lending
The Portfolio may lend its securities from time to time in order to earn additional income in the form of fees or interest on securities received as collateral or the investment of any cash received as collateral. When securities are on loan, the Portfolio
32 | Allspring Small Company Growth Portfolio
Notes to financial statements (unaudited)
receives interest or dividends on those securities. Cash collateral received in connection with its securities lending transactions is invested in Securities Lending Cash Investments, LLC (the "Securities Lending Fund"), an affiliated non-registered investment company. Investments in Securities Lending Fund are valued at the evaluated bid price provided by an independent pricing service. Income earned from investment in the Securities Lending Fund (net of fees and rebates), if any, is included in income from affiliated securities on the Statement of Operations.
In a securities lending transaction, the net asset value of the Portfolio is affected by an increase or decrease in the value of the securities loaned and by an increase or decrease in the value of the instrument in which collateral is invested. The amount of securities lending activity undertaken by the Portfolio fluctuates from time to time. The Portfolio has the right under the lending agreement to recover the securities from the borrower on demand. In the event of default or bankruptcy by the borrower, the Portfolio may be prevented from recovering the loaned securities or gaining access to the collateral or may experience delays or costs in doing so. In such an event, the terms of the agreement allow the unaffiliated securities lending agent to use the collateral to purchase replacement securities on behalf of the Portfolio or pay the Portfolio the market value of the loaned securities. The Portfolio bears the risk of loss with respect to depreciation of its investment of the cash collateral.
Security transactions and income recognition
Securities transactions are recorded on a trade date basis. Realized gains or losses are recorded on the basis of identified cost.
Dividend income is recognized on the ex-dividend date.
Federal and other taxes
The Portfolio is not required to pay federal income taxes on its net investment income and net capital gains as it is treated as a partnership for federal income tax purposes. All income, gains and losses of the Portfolio are deemed to have been ���passed through” to the interest holders in proportion to their holdings of the Portfolio regardless of whether income and gains have been distributed by the Portfolio.
The Portfolio’s income tax returns and all financial records supporting those returns for the prior three fiscal years are subject to examination by the federal revenue authority. Management has analyzed the Portfolio’s tax positions taken on federal, state, and foreign tax returns for all open tax years and does not believe that there are any uncertain tax positions that require recognition of a tax liability.
As of November 30, 2021, the aggregate cost of all investments for federal income tax purposes was $660,720,595 and the unrealized gains (losses) consisted of:
| Gross unrealized gains | $422,625,083 |
| Gross unrealized losses | (53,064,248) |
| Net unrealized gains | $369,560,835 |
3. FAIR VALUATION MEASUREMENTS
Fair value measurements of investments are determined within a framework that has established a fair value hierarchy based upon the various data inputs utilized in determining the value of the Portfolio’s investments. The three-level hierarchy gives the highest priority to unadjusted quoted prices in active markets for identical assets or liabilities (Level 1) and the lowest priority to unobservable inputs (Level 3). The Portfolio’s investments are classified within the fair value hierarchy based on the lowest level of input that is significant to the fair value measurement. The inputs are summarized into three broad levels as follows:
| ■ | Level 1 – quoted prices in active markets for identical securities |
| ■ | Level 2 – other significant observable inputs (including quoted prices for similar securities, interest rates, prepayment speeds, credit risk, etc.) |
| ■ | Level 3 – significant unobservable inputs (including the Portfolio’s own assumptions in determining the fair value of investments) |
The inputs or methodologies used for valuing investments in securities are not necessarily an indication of the risk associated with investing in those securities.
Allspring Small Company Growth Portfolio | 33
Notes to financial statements (unaudited)
The following is a summary of the inputs used in valuing the Portfolio’s assets and liabilities as of November 30, 2021:
| | Quoted prices
(Level 1) | Other significant
observable inputs
(Level 2) | Significant
unobservable inputs
(Level 3) | Total |
| Assets | | | | |
| Investments in: | | | | |
| Common stocks | | | | |
| Communication services | $ 11,395,318 | $0 | $0 | $ 11,395,318 |
| Consumer discretionary | 100,819,713 | 0 | 0 | 100,819,713 |
| Consumer staples | 29,547,392 | 0 | 0 | 29,547,392 |
| Financials | 108,431,757 | 0 | 0 | 108,431,757 |
| Health care | 248,648,948 | 0 | 0 | 248,648,948 |
| Industrials | 202,870,191 | 0 | 0 | 202,870,191 |
| Information technology | 237,114,983 | 0 | 0 | 237,114,983 |
| Materials | 28,318,050 | 0 | 0 | 28,318,050 |
| Real estate | 10,595,689 | 0 | 0 | 10,595,689 |
| Rights | | | | |
| Communication services | 0 | 0 | 0 | 0 |
| Short-term investments | | | | |
| Investment companies | 52,539,389 | 0 | 0 | 52,539,389 |
| Total assets | $1,030,281,430 | $0 | $0 | $1,030,281,430 |
Additional sector, industry or geographic detail, if any, is included in the Portfolio of Investments.
For the six months ended November 30, 2021, the Portfolio did not have any transfers into/out of Level 3.
4. TRANSACTIONS WITH AFFILIATES AND OTHER EXPENSES
Advisory fee
The Trust has entered into an advisory contract with Allspring Funds Management, a wholly owned subsidiary of Allspring Global Investments Holdings, LLC, a holding company indirectly owned by certain private funds of GTCR LLC and Reverence Capital Partners, L.P. The adviser is responsible for implementing investment policies and guidelines and for supervising the subadviser, who is responsible for day-to-day portfolio management of the Portfolio. Pursuant to the contract, Allspring Funds Management is entitled to receive an advisory fee at the following annual rate based on the Portfolio’s average daily net assets:
| Average daily net assets | Advisory fee |
| First $500 million | 0.800% |
| Next $500 million | 0.775 |
| Next $1 billion | 0.750 |
| Next $1 billion | 0.725 |
| Next $1 billion | 0.700 |
| Over $4 billion | 0.680 |
For the six months ended November 30, 2021, the advisory fee was equivalent to an annual rate of 0.78% of the Portfolio's average daily net assets.
Allspring Funds Management has retained the services of a subadviser to provide daily portfolio management to the Portfolio. The fee for subadvisory services is borne by Allspring Funds Management. Peregrine Capital Management, LLC, which is not an affiliate of Allspring Funds Management, is the subadviser to the Portfolio and is entitled to receive a fee from Allspring Funds Management at an annual rate of 0.38% of the Portfolio's average daily net assets.
34 | Allspring Small Company Growth Portfolio
Notes to financial statements (unaudited)
Interfund transactions
The Portfolio may purchase or sell portfolio investment securities to certain affiliates pursuant to Rule 17a-7 under the 1940 Act and under procedures adopted by the Board of Trustees. The procedures have been designed to ensure that these interfund transactions, which do not incur broker commissions, are effected at current market prices.
5. INVESTMENT PORTFOLIO TRANSACTIONS
Purchases and sales of investments, excluding U.S. government obligations (if any) and short-term securities, for the six months ended November 30, 2021 were $344,013,216 and $707,037,049, respectively.
6. SECURITIES LENDING TRANSACTIONS
The Portfolio lends its securities through an unaffiliated securities lending agent and receives collateral in the form of cash or securities with a value at least equal to the value of the securities on loan. The value of the loaned securities is determined at the close of each business day and any increases or decreases in the required collateral are exchanged between the Portfolio and the counterparty on the next business day. Cash collateral received is invested in the Securities Lending Fund which seeks to provide a positive return compared to the daily Federal Funds Open Rate by investing in high-quality, U.S. dollar-denominated short-term money market instruments and is exempt from registration under Section 3(c)(7) of the 1940 Act. Securities Lending Fund is managed by Allspring Funds Management and is subadvised by Allspring Global Investments, LLC ("Allspring Investments"), an affiliate of Allspring Funds Management and a wholly owned subsidiary of Allspring Global Investments Holdings, LLC. Allspring Funds Management receives an advisory fee starting at 0.05% and declining to 0.01% as the average daily net assets of the Securities Lending Fund increase. All of the fees received by Allspring Funds Management are paid to Allspring Investments for its services as subadviser.
In the event of counterparty default or the failure of a borrower to return a loaned security, the Portfolio has the right to use the collateral to offset any losses incurred. As of November 30, 2021, the Portfolio had securities lending transactions with the following counterparties which are subject to offset:
| Counterparty | Value of
securities on
loan | Collateral
received1 | Net amount |
| BMO Capital Markets Corporation | $5,331,200 | $(5,331,200) | $0 |
| BNP Paribas Securities Corporation | 4,861,195 | (4,861,195) | 0 |
| Credit Suisse Securities (USA) LLC | 2,992,000 | (2,992,000) | 0 |
| Morgan Stanley & Co. LLC | 2,300,780 | (2,300,780) | 0 |
| UBS Securities LLC | 23,256 | (23,256) | 0 |
1 Collateral received within this table is limited to the collateral for the net transaction with the counterparty.
7. BANK BORROWINGS
The Trust, along with Allspring Variable Trust and Allspring Funds Trust (excluding the money market funds), are parties to a $350,000,000 revolving credit agreement whereby the Portfolio is permitted to use bank borrowings for temporary or emergency purposes, such as to fund interest holders withdrawal requests. Interest under the credit agreement is charged to the Portfolio based on a borrowing rate equal to the higher of the Federal Funds rate in effect on that day plus 1.25% or the overnight bank funding rate in effect on that day plus 1.25%. In addition, an annual commitment fee equal to 0.25% of the unused balance is allocated to each participating fund.
For the six months ended November 30, 2021, there were no borrowings by the Portfolio under the agreement.
8. CONCENTRATION RISKS
As of the end of the period, the Portfolio concentrated its portfolio of investments in the health care sector. A fund that invests a substantial portion of its assets in any sector may be more affected by changes in that sector than would be a fund whose investments are not heavily weighted in any sector.
9. INDEMNIFICATION
Under the Portfolio's organizational documents, the officers and Trustees have been granted certain indemnification rights against certain liabilities that may arise out of performance of their duties to the Portfolio. The Portfolio has entered into a
Allspring Small Company Growth Portfolio | 35
Notes to financial statements (unaudited)
separate agreement with each Trustee that converts indemnification rights currently existing under the Portfolio’s organizational documents into contractual rights that cannot be changed in the future without the consent of the Trustee. Additionally, in the normal course of business, the Portfolio may enter into contracts with service providers that contain a variety of indemnification clauses. The Portfolio’s maximum exposure under these arrangements is dependent on future claims that may be made against the Portfolio and, therefore, cannot be estimated.
10. CORONAVIRUS (COVID-19) PANDEMIC
On March 11, 2020, the World Health Organization announced that it had made the assessment that coronavirus disease 2019 (“COVID-19”) is a pandemic. The impacts of COVID-19 are affecting the entire global economy, individual companies and investment products, the funds, and the market in general. There is significant uncertainty around the extent and duration of business disruptions related to COVID-19 and the impacts may last for an extended period of time. COVID-19 has led to significant uncertainty and volatility in the financial markets.
36 | Allspring Small Company Growth Portfolio
Other information (unaudited)
PROXY VOTING INFORMATION
A description of the policies and procedures used to determine how to vote proxies relating to portfolio securities is available without charge, upon request, by calling 1-800-222-8222, visiting our website at allspringglobal.com, or visiting the SEC website at sec.gov. Information regarding how the proxies related to portfolio securities were voted during the most recent 12-month period ended June 30 is available on the website at allspringglobal.com or by visiting the SEC website at sec.gov.
SPECIAL MEETING OF SHAREHOLDERS
On August 16, 2021, a Special Meeting of Shareholders for Allspring Small Company Growth Fund was held to consider the following proposals. The results of the proposals are indicated below.
Proposal 1 – To consider and approve a new investment management agreement with Wells Fargo Funds Management, LLC*.
| Shares voted “For” | 9,908,243 |
| Shares voted “Against” | 99,861 |
| Shares voted “Abstain” | 107,942 |
| Shares voted “Uninstructed” | 216,349 |
Proposal 2 – To consider and approve a new advisory agreement with Wells Fargo Funds Management, LLC* for Allspring Small Company Growth Portfolio in which the Fund invests substantially all of its assets.
| Shares voted “For” | 9,901,468 |
| Shares voted “Against” | 71,819 |
| Shares voted “Abstain” | 142,759 |
| Shares voted “Uninstructed" | 216,349 |
Proposal 3 – To consider and approve a new subadvisory agreement with Wells Capital Management, LLC** for Allspring Small Company Growth Portfolio.
| Shares voted “For” | 9,929,920 |
| Shares voted “Against” | 76,875 |
| Shares voted “Abstain” | 109,251 |
| Shares voted “Uninstructed” | 216,349 |
* Effective November 1, 2021, known as Allspring Funds Management, LLC.
** Effective November 1, 2021, known as Allspring Global Investments, LLC.
QUARTERLY PORTFOLIO HOLDINGS INFORMATION
The Fund and Portfolio file their complete schedule of portfolio holdings with the SEC for the first and third quarters of each fiscal year as an exhibit to their reports on Form N-PORT. Shareholders and Interest holders may view the filed Form N-PORT by visiting the SEC website at sec.gov.
Allspring Small Company Growth Fund | 37
Other information (unaudited)
BOARD OF TRUSTEES AND OFFICERS
Each of the Trustees and Officers listed in the table below acts in identical capacities for each fund in the Allspring family of funds, which consists of 139 mutual funds comprising the Allspring Funds Trust, Allspring Variable Trust, Allspring Master Trust and four closed-end funds (collectively the “Fund Complex”). This table should be read in conjunction with the Prospectus and the Statement of Additional Information1. The mailing address of each Trustee and Officer is 525 Market Street, 12th Floor, San Francisco, CA 94105. Each Trustee and Officer serves an indefinite term, however, each Trustee serves such term until reaching the mandatory retirement age established by the Trustees.
Independent Trustees
Name and
year of birth | Position held and
length of service* | Principal occupations during past five years or longer | Current other
public company or
investment
company
directorships |
William R. Ebsworth
(Born 1957) | Trustee,
since 2015 | Retired. From 1984 to 2013, equities analyst, portfolio manager, research director and chief investment officer at Fidelity Management and Research Company in Boston, Tokyo, and Hong Kong, and retired in 2013 as Chief Investment Officer of Fidelity Strategic Advisers, Inc. where he led a team of investment professionals managing client assets. Prior thereto, Board member of Hong Kong Securities Clearing Co., Hong Kong Options Clearing Corp., the Thailand International Fund, Ltd., Fidelity Investments Life Insurance Company, and Empire Fidelity Investments Life Insurance Company. Audit Committee Chair and Investment Committee Chair of the Vincent Memorial Hospital Endowment (non-profit organization). Mr. Ebsworth is a CFA® charterholder. | N/A |
Jane A. Freeman
(Born 1953) | Trustee,
since 2015;
Chair Liaison,
since 2018 | Retired. From 2012 to 2014 and 1999 to 2008, Chief Financial Officer of Scientific Learning Corporation. From 2008 to 2012, Ms. Freeman provided consulting services related to strategic business projects. Prior to 1999, Portfolio Manager at Rockefeller & Co. and Scudder, Stevens & Clark. Board member of the Harding Loevner Funds from 1996 to 2014, serving as both Lead Independent Director and chair of the Audit Committee. Board member of the Russell Exchange Traded Funds Trust from 2011 to 2012 and the chair of the Audit Committee. Ms. Freeman is also an inactive Chartered Financial Analyst. | N/A |
Isaiah Harris, Jr.
(Born 1952) | Trustee,
since 2009; Audit
Committee
Chair,
since 2019 | Retired. Chairman of the Board of CIGNA Corporation from 2009 to 2021, and Director from 2005 to 2008. From 2003 to 2011, Director of Deluxe Corporation. Prior thereto, President and CEO of BellSouth Advertising and Publishing Corp. from 2005 to 2007, President and CEO of BellSouth Enterprises from 2004 to 2005 and President of BellSouth Consumer Services from 2000 to 2003. Emeritus member of the Iowa State University Foundation Board of Governors. Emeritus Member of the Advisory Board of Iowa State University School of Business. Advisory Board Member, Palm Harbor Academy (private school). Advisory Board Member, Fellowship of Christian Athletes. Mr. Harris is a certified public accountant (inactive status). | N/A |
Judith M. Johnson**
(Born 1949) | Trustee,
since 2008 | Retired. Prior thereto, Chief Executive Officer and Chief Investment Officer of Minneapolis Employees Retirement Fund from 1996 to 2008. Ms. Johnson is an attorney, certified public accountant and a certified managerial accountant. | N/A |
David F. Larcker
(Born 1950) | Trustee,
since 2009 | James Irvin Miller Professor of Accounting at the Graduate School of Business (Emeritus), Stanford University, Director of the Corporate Governance Research Initiative and Senior Faculty of The Rock Center for Corporate Governance since 2006. From 2005 to 2008, Professor of Accounting at the Graduate School of Business, Stanford University. Prior thereto, Ernst & Young Professor of Accounting at The Wharton School, University of Pennsylvania from 1985 to 2005. | N/A |
38 | Allspring Small Company Growth Fund
Other information (unaudited)
Name and
year of birth | Position held and
length of service* | Principal occupations during past five years or longer | Current other
public company or
investment
company
directorships |
Olivia S. Mitchell
(Born 1953) | Trustee,
since 2006;
Nominating and
Governance
Committee Chair,
since 2018 | International Foundation of Employee Benefit Plans Professor since 1993, Wharton School of the University of Pennsylvania. Director of Wharton’s Pension Research Council and Boettner Center on Pensions & Retirement Research, and Research Associate at the National Bureau of Economic Research. Previously taught at Cornell University from 1978 to 1993. | N/A |
Timothy J. Penny
(Born 1951) | Trustee,
since 1996;
Chair,
since 2018 | President and Chief Executive Officer of Southern Minnesota Initiative Foundation, a non-profit organization, since 2007. Member of the Board of Trustees of NorthStar Education Finance, Inc., a non-profit organization, since 2007. | N/A |
James G. Polisson
(Born 1959) | Trustee,
since 2018 | Retired. Chief Marketing Officer, Source (ETF) UK Services, Ltd, from 2015 to 2017. From 2012 to 2015, Principal of The Polisson Group, LLC, a management consulting, corporate advisory and principal investing company. Chief Executive Officer and Managing Director at Russell Investments, Global Exchange Traded Funds from 2010 to 2012. Managing Director of Barclays Global Investors from 1998 to 2010 and Global Chief Marketing Officer for iShares and Barclays Global Investors from 2000 to 2010. Trustee of the San Francisco Mechanics’ Institute, a non-profit organization, from 2013 to 2015. Board member of the Russell Exchange Traded Fund Trust from 2011 to 2012. Director of Barclays Global Investors Holdings Deutschland GmbH from 2006 to 2009. Mr. Polisson is an attorney and has a retired status with the Massachusetts and District of Columbia Bar Associations. | N/A |
Pamela Wheelock
(Born 1959) | Trustee,
since January
2020; previously
Trustee from
January 2018 to
July 2019 | Board member of the Destination Medical Center Economic Development Agency, Rochester, Minnesota since 2019. Interim President of the McKnight Foundation from January to September 2020. McKnight Foundation Consultant, November 2020 to February 2021. Acting Commissioner, Minnesota Department of Human Services, July 2019 through September 2019. Consultant (part-time), Minnesota Department of Human Services, October 2019 through December 2019. Chief Operating Officer, Twin Cities Habitat for Humanity from 2017 to 2019. Vice President of University Services, University of Minnesota from 2012 to 2016. Prior thereto, on the Board of Directors, Governance Committee and Finance Committee for the Minnesota Philanthropy Partners (Saint Paul Foundation) from 2012 to 2018, Interim Chief Executive Officer of Blue Cross Blue Shield of Minnesota from 2011 to 2012, Chairman of the Board from 2009 to 2012 and Board Director from 2003 to 2015. Vice President, Leadership and Community Engagement, Bush Foundation, Saint Paul, Minnesota (a private foundation) from 2009 to 2011. Executive Vice President and Chief Financial Officer, Minnesota Sports and Entertainment from 2004 to 2009 and Senior Vice President from 2002 to 2004. Executive Vice President of the Minnesota Wild Foundation from 2004 to 2008. Commissioner of Finance, State of Minnesota, from 1999 to 2002. Currently Board Chair of the Minnesota Wild Foundation since 2010. | N/A |
* Length of service dates reflect the Trustee’s commencement of service with the Trust’s predecessor entities, where applicable.
** Ms. Johnson has resigned from the Board effective December 31, 2021.
Allspring Small Company Growth Fund | 39
Other information (unaudited)
Officers2
Name and
year of birth | Position held and
length of service | Principal occupations during past five years or longer |
Andrew Owen
(Born 1960) | President,
since 2017 | President, Chief Executive Officer and Director of Allspring Funds Management, LLC since 2017 and co-president of Galliard Capital Management, LLC, an affiliate of Allspring Funds Management, LLC, since 2019. Prior thereto, Head of Affiliated Managers, Allspring Global Investments, from 2014 to 2019 and Executive Vice President responsible for marketing, investments and product development for Allspring Funds Management, LLC, from 2009 to 2014. In addition, Mr. Owen was an Executive Vice President of Wells Fargo & Company from 2014 to 2021. |
Jeremy DePalma
(Born 1974) | Treasurer,
since 2012
(for certain funds in
the Fund Complex);
since 2021 (for
the remaining funds in the
Fund Complex) | Senior Vice President of Allspring Funds Management, LLC since 2009. Senior Vice President of Evergreen Investment Management Company, LLC from 2008 to 2010 and head of the Fund Reporting and Control Team within Fund Administration. |
Kate McKinley
(Born 1977) | Chief Legal Officer,
since 2021 | Chief Legal Officer of Allspring Global Investments since 2021. Prior thereto, held various roles at State Street Global Advisors beginning in 2010, including serving as Senior Vice President and General Counsel from 2019 to 2021, and Chief Operating Officer of the Institutional Client Group from 2016 - 2019. Prior to working at State Street Global Advisors served as Assistant General Counsel for Bank of America Corporation from 2005 to 2010 and as an Associate at WilmerHale from 2002 to 2005. |
Christopher Baker
(Born 1976) | Chief Compliance Officer, since 2022 | Global Chief Compliance Officer for Allspring Global Investments since 2022. Prior thereto, Chief Compliance Officer for State Street Global Advisors from 2018 to 2021. Senior Compliance Officer for the State Street divisions of Alternative Investment Solutions, Sector Solutions, and Global Marketing from 2015 to 2018. From 2010 to 2015 Vice President, Global Head of Investment and Marketing Compliance for State Street Global Advisors. |
Matthew Prasse
(Born 1983) | Secretary,
since 2021 | Senior Counsel of the Allspring Legal Department since 2021. Senior Counsel of the Wells Fargo Legal Department from 2018 to 2021. Previously, Counsel for Barings LLC from 2015 to 2018. Prior to joining Barings, Associate at Morgan, Lewis & Bockius LLP from 2008 to 2015. |
1 The Statement of Additional Information includes additional information about the Trustees and is available, without charge, upon request, by calling 1-800-222-8222 or by visiting the website at allspringglobal.com.
2 For those Officers with tenures at Allspring Global Investments and/or Allspring Funds Management, LLC that began prior to 2021, such tenures include years of service during which these businesses/entities were known as Wells Fargo Asset Management and Wells Fargo Funds Management, LLC, respectively.
40 | Allspring Small Company Growth Fund
For more information
More information about Allspring Funds is available free upon request. To obtain literature, please write, visit the Fund's website, or call:
Allspring Funds
P.O. Box 219967
Kansas City, MO 64121-9967
Website: allspringglobal.com
Individual investors: 1-800-222-8222
Retail investment professionals: 1-888-877-9275
Institutional investment professionals: 1-866-765-0778
This report and the financial statements contained herein are submitted for the general information of the shareholders of the Fund. If this report is used for promotional purposes, distribution of the report must be accompanied or preceded by a current prospectus. Before investing, please consider the investment objectives, risks, charges, and expenses of the investment. For a current prospectus and, if available, a summary prospectus, containing this information, call
1-800-222-8222 or visit the Fund's website at allspringglobal.com. Read the prospectus carefully before you invest or send money.
Allspring Global InvestmentsTM is the trade name for the asset management firms of Allspring Global Investments Holdings, LLC, a holding company indirectly owned by certain private funds of GTCR LLC and Reverence Capital Partners, L.P. These firms include but are not limited to Allspring Global Investments, LLC, and Allspring Funds Management, LLC. Certain products managed by Allspring entities are distributed by Allspring Funds Distributor, LLC (a broker-dealer and Member FINRA/SIPC).
This material is for general informational and educational purposes only and is NOT intended to provide investment advice or a recommendation of any kind - including a recommendation for any specific investment, strategy, or plan.
© 2022 Allspring Global Investments Holdings, LLC. All rights reserved.
PAR-1221-00197 01-22
SA285/SAR285 11-21
Semi-Annual Report
November 30, 2021
Allspring
Small Company Value Fund
The views expressed and any forward-looking statements are as of November 30, 2021, unless otherwise noted, and are those of the Fund's portfolio managers and/or Allspring Global Investments. Discussions of individual securities or the markets generally are not intended as individual recommendations. Future events or results may vary significantly from those expressed in any forward-looking statements. The views expressed are subject to change at any time in response to changing circumstances in the market. Allspring Global Investments disclaims any obligation to publicly update or revise any views expressed or forward-looking statements.
Allspring Small Company Value Fund | 1
Letter to shareholders (unaudited)
Andrew Owen
President
Allspring Funds
Dear Shareholder:
We are pleased to offer you this semi-annual report for Allspring Small Company Value Fund for the six-month period that ended November 30, 2021. Global stocks yielded mixed results as the global economy continued to emerge from the haze of COVID-19. Tailwinds were provided by global stimulus programs, a rapid vaccination rollout, and recovering consumer and corporate sentiment. The bond market had mostly positive returns during the period.
For the six-month period, U.S. stocks, based on the S&P 500 Index,1 gained 9.38%. International stocks, as measured by the MSCI ACWI ex USA Index (Net),2 returned -5.76%, while the MSCI EM Index (Net) (USD),3 trailed its developed market counterparts with a 10.81% loss. Among bond indexes, the Bloomberg U.S. Aggregate Bond Index,4 returned 1.02%, the Bloomberg Global Aggregate ex-USD Index (unhedged),5 returned -4.64%, the Bloomberg Municipal Bond Index6 returned 0.56%, and the ICE BofA U.S. High Yield Index,7 gained 1.09%.
Vaccination rollout drove the stock markets to new highs.
June witnessed the S&P 500 Index reach a new all-time high. 2021 economic growth and inflation forecasts were revised higher to reflect a strong economic recovery and some supply and demand imbalances. Late June saw a deal reached on a U.S. infrastructure package of approximately $1 trillion for road, bridge, and broadband network upgrades over the next eight years. The U.S. Federal Reserve's (Fed) June meeting yielded no change to policy, but its projections pointed to a possible interest rate rise in 2023. This, combined with a rebound in economic activity and investors searching for yield, led to U.S. Treasury yields being down for the month. Many European and Asian countries saw vaccination momentum increase, while the U.K. dealt with a rise in COVID-19 infections, specifically the Delta variant. Meanwhile, crude oil jumped over 10% in June on the back of the pickup in global economic activity and the Organization of the Petroleum Exporting Countries’ (OPEC) slow pace of supply growth.
“2021 economic growth and inflation forecasts were revised higher to reflect a strong economic recovery and some supply and demand imbalances.”
| 1 | The S&P 500 Index consists of 500 stocks chosen for market size, liquidity, and industry group representation. It is a market-value-weighted index with each stock's weight in the index proportionate to its market value. You cannot invest directly in an index. |
| 2 | The Morgan Stanley Capital International (MSCI) All Country World Index (ACWI) ex USA Index (Net) is a free-float-adjusted market-capitalization-weighted index that is designed to measure the equity market performance of developed and emerging markets, excluding the U.S. Source: MSCI. MSCI makes no express or implied warranties or representations and shall have no liability whatsoever with respect to any MSCI data contained herein. The MSCI data may not be further redistributed or used as a basis for other indexes or any securities or financial products. This report is not approved, reviewed, or produced by MSCI. You cannot invest directly in an index. |
| 3 | The MSCI Emerging Markets (EM) Index (Net) (USD) is a free-float-adjusted market-capitalization-weighted index that is designed to measure equity market performance of emerging markets. You cannot invest directly in an index. |
| 4 | The Bloomberg U.S. Aggregate Bond Index is a broad-based benchmark that measures the investment-grade, U.S.-dollar-denominated, fixed-rate taxable bond market, including Treasuries, government-related and corporate securities, mortgage-backed securities (agency fixed-rate and hybrid adjustable-rate mortgage pass-throughs), asset-backed securities, and commercial mortgage-backed securities. You cannot invest directly in an index. |
| 5 | The Bloomberg Global Aggregate ex-USD Index (unhedged) is an unmanaged index that provides a broad-based measure of the global investment-grade fixed-income markets excluding the U.S.-dollar-denominated debt market. You cannot invest directly in an index. |
| 6 | The Bloomberg Municipal Bond Index is an unmanaged index composed of long-term tax-exempt bonds with a minimum credit rating of Baa. You cannot invest directly in an index. |
| 7 | The ICE BofA U.S. High Yield Index is a market-capitalization-weighted index of domestic and Yankee high-yield bonds. The index tracks the performance of high-yield securities traded in the U.S. bond market. You cannot invest directly in an index. Copyright 2022. ICE Data Indices, LLC. All rights reserved. |
2 | Allspring Small Company Value Fund
Letter to shareholders (unaudited)
July began the month seeing vaccinations making progress, as several major developed countries eased restrictions, only to be threatened again by the spread of COVID-19’s Delta variant. Inflation continued to climb, aided by the continued supply bottleneck in the face of high demand. As it pertains to the equity area of the market, U.S. equities led the way in positive return territory, followed by international developed markets. In contrast, emerging markets were well in negative territory for the month, hindered by China’s plans for new regulations on a number of sectors, specifically education and technology. The U.S. 10-Year Treasury bond yield continued to decline, as strong demand swallowed up supply. After hitting a multi-year high earlier in the month, oil prices leveled off following an agreement by OPEC to raise oil production starting in August.
The Delta variant of COVID-19 produced outbreaks globally in August, increasing the potential for increased market volatility and bringing into question the ongoing economic recovery. Domestically, the U.S. economy continued to stay strong in the face of the Delta variant, continued inflationary pressures, and worries over Hurricane Ida. Emerging market equities experienced elevated volatility, largely influenced by China’s regulatory stance. Emerging market equities started the month with poor performance but rebounded to end the month in positive territory. Municipal debt experienced its first monthly performance drop since February of this year, slowing a rally that made it one of the best-performing sectors of the bond market. In the commodity segment of the market, crude oil fell sharply during the month on the back of dampened expectations as a result of the Delta variant but was still a leading asset class performer for the year.
Global markets suffered their broadest retreat in a year during September, with the exception of commodities. Concerns over inflation and the interest rate outlook depressed investor confidence and hurt performance. Emerging markets declined on concerns over the continued supply chain disruptions and worries over higher energy and food prices. Meanwhile, the Fed indicated it would slow the pace of asset purchases in the near future. All eyes domestically were fixed on the raising of the debt ceiling, the 2022 budget plan, and the ongoing debate over the infrastructure package. Contrary to most asset classes, commodities thrived in September, driven by sharply higher energy prices.
October’s key themes continued to be elevated inflation pressures and a supply bottleneck, but strong earnings provided a bright spot in the markets. Earnings releases in the U.S. were generally strong and consumer confidence was high. The Fed reaffirmed its plans to taper quantitative easing to a stop by mid-2022. Meanwhile, elevated inflation figures were still being considered transitory by the Fed. Similar to the U.S., the eurozone and many Asian countries saw positive earnings but were facing inflation pressures caused by supply bottlenecks while also experiencing energy price increases amid natural gas shortages. Globally, government bond yields rose as central banks prepared to lower monetary policy accommodation in the face of rising inflationary pressures. As previously referenced, positive commodity performance was driven by sharply higher energy costs.
November was dominated by rising COVID-19 hospitalizations and concerns regarding the Omicron variant. Most major asset classes, both domestically and internationally, declined in November with two exceptions: U.S. investment-grade bonds and Treasury Inflation-Protected Securities. The United Nations Climate Change Conference (COP26) took place during the month with hopes of agreement among countries to limit global warming. While several initiatives were discussed, the conference ultimately ended without the specifics required to instill confidence that the limiting of global warming would succeed. In the U.S., President Biden signed a long-awaited infrastructure bill to upgrade U.S. roads, bridges, and railways. Meanwhile, the Consumer Price Index1, a measure of domestic inflation conditions, jumped to its highest level in 31 years. While the threat of consistently high inflation led the Fed to discuss a faster pace of tapering, the Omicron strain makes that less likely to occur. Commodities came in negative for the month, largely driven by sharp declines in oil prices (and energy costs in general), as well as precious metals.
“ Municipal debt experienced its first monthly performance drop since February of this year, slowing a rally that made it one of the best-performing sectors of the bond market.”
| 1 | The Consumer Price Index (CPI) is a measure of the average change over time in the prices paid by urban consumers for a market basket of consumer goods and services. You cannot invest directly in an index. |
Allspring Small Company Value Fund | 3
Letter to shareholders (unaudited)
Don’t let short-term uncertainty derail long-term investment goals.
Periods of investment uncertainty can present challenges, but experience has taught us that maintaining long-term investment goals can be an effective way to plan for the future. To help you create a sound strategy based on your personal goals and risk tolerance, Allspring Funds offers more than 100 mutual funds spanning a wide range of asset classes and investment styles. Although diversification cannot guarantee an investment profit or prevent losses, we believe it can be an effective way to manage investment risk and potentially smooth out overall portfolio performance. We encourage investors to know their investments and to understand that appropriate levels of risk-taking may unlock opportunities.
Information on transaction closing.
On November 1, 2021, GTCR LLC and Reverence Capital Partners, L.P., announced the beginning of Allspring Global Investments™, with the close of the transaction to acquire Wells Fargo Funds Management, LLC; Wells Capital Management LLC; Galliard Capital Management LLC.; Wells Fargo Asset Management (International) Ltd.; Wells Fargo Asset Management Luxembourg S.A.; and Wells Fargo Funds Distributor, LLC, as well as Wells Fargo Bank, N.A.’s business of acting as trustee to its collective investment trusts and all related Wells Fargo Asset Management legal entities. The transaction closed on November 1, 2021, forming Allspring Global Investments, a privately held asset management firm with $587 billion in AUM1 as of September 30, 2021.
Allspring Global Investments™ is a leading independent asset management firm with a full breadth of investment capabilities across diverse asset classes, serving the needs of its institutional and wealth management clients around the world. Allspring operates across 18 offices globally supported by more than 480 investment professionals. Allspring and its investment teams provide a broad range of differentiated investment products and solutions to help its diverse range of clients meet their investment objectives.
As part of this transition, all mutual funds within the Wells Fargo Funds family were rebranded as Allspring Funds. Each individual fund had “Wells Fargo” removed from its fund name and replaced with “Allspring.” The fund name changes went into effect on December 6, 2021.
Allspring Global Investments is the trade name for the asset management firms of Allspring Global Investments Holdings, LLC, a holding company indirectly owned by certain private funds of GTCR LLC and Reverence Capital Partners, L.P.
Thank you for choosing to invest with Allspring Funds. We appreciate your confidence in us and remain committed to helping you meet your financial needs.
Sincerely,
Andrew Owen
President
Allspring Funds
For further information about your Fund, contact your investment professional, visit our website at allspringglobal.com, or call us directly at 1-800-222-8222.
| 1 | As of September 30, 2021, assets under management (AUM) includes $93 billion from Galliard Capital Management, LLC, an investment advisor that is not part of the Allspring trade name/GIPS firm. |
4 | Allspring Small Company Value Fund
This page is intentionally left blank.
Performance highlights (unaudited)
| Investment objective | The Fund seeks long-term capital appreciation. |
| Manager | Allspring Funds Management, LLC |
Subadviser for the affiliated master portfolio*
Allspring Global Investments, LLC
| Portfolio managers | Jeff Goverman, Garth R. Nisbet, CFA®‡, Craig Pieringer, CFA®‡ |
| Average annual total returns (%) as of November 30, 2021 |
| | | Including sales charge | | Excluding sales charge | | Expense ratios1 (%) |
| | Inception date | 1 year | 5 year | 10 year | | 1 year | 5 year | 10 year | | Gross | Net 2 |
| Class A (SCVAX) | 1-31-2002 | 32.34 | 8.94 | 11.13 | | 40.41 | 10.24 | 11.79 | | 1.35 | 1.15 |
| Class C (SCVFX) | 8-30-2002 | 38.38 | 9.45 | 10.97 | | 39.38 | 9.45 | 10.97 | | 2.10 | 1.90 |
| Class R6 (SCVJX)3 | 10-31-2016 | – | – | – | | 40.92 | 10.70 | 12.16 | | 0.92 | 0.75 |
| Administrator Class (SCVIX) | 1-31-2002 | – | – | – | | 40.50 | 10.35 | 11.96 | | 1.27 | 1.05 |
| Institutional Class (SCVNX) | 7-30-2010 | – | – | – | | 40.77 | 10.58 | 12.19 | | 1.02 | 0.85 |
| Russell 2000® Value Index4 | – | – | – | – | | 33.01 | 9.08 | 11.76 | | – | – |
Figures quoted represent past performance, which is no guarantee of future results, and do not reflect taxes that a shareholder may pay on an investment in a fund. Investment return and principal value of an investment will fluctuate so that an investor’s shares, when redeemed, may be worth more or less than their original cost. Performance shown without sales charges would be lower if sales charges were reflected. Current performance may be lower or higher than the performance data quoted, which assumes the reinvestment of dividends and capital gains. Current month-end performance is available on the Fund’s website, allspringglobal.com.
Please keep in mind that high double-digit returns were primarily achieved during favorable market conditions. You should not expect that such favorable returns can be consistently achieved. A fund’s performance, especially for short time periods, should not be the sole factor in making your investment decision.
Index returns do not include transaction costs associated with buying and selling securities, any mutual fund fees or expenses, or any taxes. It is not possible to invest directly in an index.
For Class A shares, the maximum front-end sales charge is 5.75%. For Class C shares, the maximum contingent deferred sales charge is 1.00%. Performance including a contingent deferred sales charge assumes the sales charge for the corresponding time period. Class R6, Administrator Class and Institutional Class shares are sold without a front-end sales charge or contingent deferred sales charge.
| 1 | Reflects the expense ratios as stated in the most recent prospectuses, which include the impact of 0.03% in acquired fund fees and expenses. The expense ratios shown are subject to change and may differ from the annualized expense ratios shown in the financial highlights of this report, which do not include acquired fund fees and expenses. |
| 2 | The manager has contractually committed through September 30, 2022, to waive fees and/or reimburse expenses to the extent necessary to cap total annual fund operating expenses after fee waivers at 1.15% for Class A, 1.90% for Class C, 0.75% for Class R6, 1.05% for Administrator Class, and 0.85% for Institutional Class. Brokerage commissions, stamp duty fees, interest, taxes, acquired fund fees and expenses (if any) from funds in which the affiliated master portfolio invests, and extraordinary expenses are excluded from the expense caps. Net expenses from the affiliated master portfolio are included in the expense caps. Prior to or after the commitment expiration date, the caps may be increased or the commitment to maintain the caps may be terminated only with the approval of the Board of Trustees. Without these caps, the Fund’s returns would have been lower. The expense ratio paid by an investor is the net expense ratio (the total annual fund operating expenses after fee waivers) as stated in the prospectuses. |
| 3 | Historical performance shown for the Class R6 shares prior to their inception reflects the performance of the Institutional Class shares, and includes the higher expenses applicable to the Institutional Class shares. If these expenses had not been included, returns for the Class R6 shares would be higher. |
| 4 | The Russell 2000® Value Index measures the performance of those Russell 2000 companies with lower price/book ratios and lower forecasted growth values. You cannot invest directly in an index. |
Stock values fluctuate in response to the activities of individual companies and general market and economic conditions. Smaller - company stocks tend to be more volatile and less liquid than those of larger companies. Certain investment strategies tend to increase the total risk of an investment (relative to the broader market). Consult the Fund’s prospectus for additional information on these and other risks.
| * | The Fund is a feeder fund in a master-feeder structure that invests substantially all of its assets in a single affiliated master portfolio of the Allspring Master Trust with a substantially identical investment objective and substantially similar investment strategies. References to the investment activities of the Fund are intended to refer to the investment activities of the affiliated master portfolio in which it invests. |
| ‡ | CFA® and Chartered Financial Analyst® are trademarks owned by CFA Institute. |
6 | Allspring Small Company Value Fund
Performance highlights (unaudited)
| Ten largest holdings (%) as of November 30, 20211 |
| Lexington Corporate Properties Trust | 1.52 |
| Piper Jaffray Companies Incorporated | 1.45 |
| STAG Industrial Incorporated | 1.40 |
| Arcbest Corporation | 1.37 |
| Customers Bancorp Incorporated | 1.35 |
| Comfort Systems Incorporated | 1.35 |
| Centerspace REIT | 1.33 |
| Regal-Beloit Corporation | 1.31 |
| Diamondback Energy Incorporated | 1.23 |
| Kadant Incorporated | 1.22 |
| 1 | Each holding represents the Fund’s allocable portion of the affiliated master portfolio security. Figures represent each holding as a percentage of the Fund’s net assets. Holdings are subject to change and may have changed since the date specified. |
| Sector allocation as of November 30, 20211 |
| 1 | Figures represent the sector allocation of the affiliated master portfolio as a percentage of the long-term investments of the affiliated master portfolio. These amounts are subject to change and may have changed since the date specified. |
Allspring Small Company Value Fund | 7
Fund expenses (unaudited)
As a shareholder of the Fund, you incur two types of costs: (1) transaction costs, including sales charges (loads) on purchase payments and contingent deferred sales charges (if any) on redemptions and (2) ongoing costs, including management fees, distribution (12b-1) and/or shareholder servicing fees, and other Fund expenses. This example is intended to help you understand your ongoing costs (in dollars) of investing in the Fund and to compare these costs with the ongoing costs of investing in other mutual funds.
The example is based on an investment of $1,000 invested at the beginning of the six-month period and held for the entire period from June 1, 2021 to November 30, 2021.
Actual expenses
The “Actual” line of the table below provides information about actual account values and actual expenses. You may use the information in this line, together with the amount you invested, to estimate the expenses that you paid over the period. Simply divide your account value by $1,000 (for example, an $8,600 account value divided by $1,000 = 8.6), then multiply the result by the number in the “Actual” line under the heading entitled “Expenses paid during period” for your applicable class of shares to estimate the expenses you paid on your account during this period.
Hypothetical example for comparison purposes
The “Hypothetical” line of the table below provides information about hypothetical account values and hypothetical expenses based on the Fund’s actual expense ratio and an assumed rate of return of 5% per year before expenses, which is not the Fund’s actual return. The hypothetical account values and expenses may not be used to estimate the actual ending account balance or expenses you paid for the period. You may use this information to compare the ongoing costs of investing in the Fund and other funds. To do so, compare this 5% hypothetical example with the 5% hypothetical examples that appear in the shareholder reports of the other funds.
Please note that the expenses shown in the table are meant to highlight your ongoing costs only and do not reflect any transactional costs, such as sales charges (loads) and contingent deferred sales charges. Therefore, the “Hypothetical” line of the table is useful in comparing ongoing costs only, and will not help you determine the relative total costs of owning different funds. In addition, if these transactional costs were included, your costs would have been higher.
| | Beginning
account value
6-1-2021 | Ending
account value
11-30-2021 | Expenses
paid during
the period1,2 | Annualized net
expense ratio2 |
| Class A | | | | |
| Actual | $1,000.00 | $1,002.96 | $5.72 | 1.14% |
| Hypothetical (5% return before expenses) | $1,000.00 | $1,019.35 | $5.77 | 1.14% |
| Class C | | | | |
| Actual | $1,000.00 | $ 999.39 | $9.52 | 1.90% |
| Hypothetical (5% return before expenses) | $1,000.00 | $1,015.54 | $9.60 | 1.90% |
| Class R6 | | | | |
| Actual | $1,000.00 | $1,004.96 | $3.77 | 0.75% |
| Hypothetical (5% return before expenses) | $1,000.00 | $1,021.31 | $3.80 | 0.75% |
| Administrator Class | | | | |
| Actual | $1,000.00 | $1,003.69 | $5.27 | 1.05% |
| Hypothetical (5% return before expenses) | $1,000.00 | $1,019.80 | $5.32 | 1.05% |
| Institutional Class | | | | |
| Actual | $1,000.00 | $1,004.46 | $4.27 | 0.85% |
| Hypothetical (5% return before expenses) | $1,000.00 | $1,020.81 | $4.31 | 0.85% |
1 Expenses paid is equal to the annualized net expense ratio of each class multiplied by the average account value over the period, multiplied by the number of days in the most recent fiscal half-year divided by the number of days in the fiscal year (to reflect the one-half-year period).
2 Amounts reflect net expenses allocated from the affiliated Master Portfolio in which the Fund invests.
8 | Allspring Small Company Value Fund
Portfolio of investments—November 30, 2021 (unaudited)
| | | | | | Value |
| Investment companies: 100.03% | | | | | |
| Affiliated master portfolio: 100.03% | | | | | |
| Allspring Small Company Value Portfolio | | | | | $519,434,761 |
| Total Investment companies (Cost $389,487,298) | | | | | 519,434,761 |
| Total investments in securities (Cost $389,487,298) | 100.03% | | | | 519,434,761 |
| Other assets and liabilities, net | (0.03) | | | | (132,163) |
| Total net assets | 100.00% | | | | $519,302,598 |
Transactions with the affiliated Master Portfolio were as follows:
| | % of
ownership,
beginning
of period | % of
ownership,
end of
period | Net realized
gains
(losses) on
securities
transactions
allocated
from
affiliated
Master
Portfolio | Net
change in
unrealized
gains
(losses) on
securities
transactions
allocated
from
affiliated
Master
Portfolio | Dividends
allocated
from
affiliated
Master
Portfolio | Value,
end of
period | |
| Allspring Small Company Value Portfolio | 85.41% | 86.18% | $42,393,871 | $(42,498,214) | $4,390,601 | $519,434,761 | |
The accompanying notes are an integral part of these financial statements.
Allspring Small Company Value Fund | 9
Statement of assets and liabilities—November 30, 2021 (unaudited)
| | |
| Assets | |
Investments in affiliated Master Portfolio, at value (cost $389,487,298)
| $ 519,434,761 |
Receivable for Fund shares sold
| 429,458 |
Receivable from manager
| 54,399 |
Prepaid expenses and other assets
| 156,754 |
Total assets
| 520,075,372 |
| Liabilities | |
Payable for Fund shares redeemed
| 566,586 |
Shareholder servicing fees payable
| 95,401 |
Administration fees payable
| 86,708 |
Trustees’ fees and expenses payable
| 3,289 |
Distribution fee payable
| 1,920 |
Accrued expenses and other liabilities
| 18,870 |
Total liabilities
| 772,774 |
Total net assets
| $519,302,598 |
| Net assets consist of | |
Paid-in capital
| $ 365,413,164 |
Total distributable earnings
| 153,889,434 |
Total net assets
| $519,302,598 |
| Computation of net asset value and offering price per share | |
Net assets – Class A
| $ 398,911,801 |
Shares outstanding – Class A1
| 10,713,356 |
Net asset value per share – Class A
| $37.23 |
Maximum offering price per share – Class A2
| $39.50 |
Net assets – Class C
| $ 3,161,072 |
Shares outstanding – Class C1
| 96,768 |
Net asset value per share – Class C
| $32.67 |
Net assets – Class R6
| $ 10,277,090 |
Shares outstanding – Class R61
| 266,765 |
Net asset value per share – Class R6
| $38.52 |
Net assets – Administrator Class
| $ 31,705,708 |
Shares outstanding – Administrator Class1
| 831,660 |
Net asset value per share – Administrator Class
| $38.12 |
Net assets – Institutional Class
| $ 75,246,927 |
Shares outstanding – Institutional Class1
| 1,964,451 |
Net asset value per share – Institutional Class
| $38.30 |
| 1 | The Fund has an unlimited number of authorized shares. |
| 2 | Maximum offering price is computed as 100/94.25 of net asset value. On investments of $50,000 or more, the offering price is reduced. |
The accompanying notes are an integral part of these financial statements.
10 | Allspring Small Company Value Fund
Statement of operations—six months ended November 30, 2021 (unaudited)
| | |
| Investment income | |
Dividends allocated from affiliated Master Portfolio (net of foreign withholding taxes of $4,059)
| $ 4,390,601 |
Affiliated income allocated from affiliated Master Portfolio
| 15,819 |
Expenses allocated from affiliated Master Portfolio
| (2,170,028) |
Waivers allocated from affiliated Master Portfolio
| 225,979 |
Total investment income
| 2,462,371 |
| Expenses | |
Management fee
| 131,417 |
| Administration fees | |
Class A
| 428,092 |
Class C
| 3,264 |
Class R6
| 1,403 |
Administrator Class
| 20,869 |
Institutional Class
| 47,705 |
| Shareholder servicing fees | |
Class A
| 509,633 |
Class C
| 3,872 |
Administrator Class
| 40,122 |
| Distribution fee | |
Class C
| 11,614 |
Custody and accounting fees
| 8,715 |
Professional fees
| 26,004 |
Registration fees
| 25,565 |
Shareholder report expenses
| 42,496 |
Trustees’ fees and expenses
| 9,968 |
Other fees and expenses
| 64,983 |
Total expenses
| 1,375,722 |
| Less: Fee waivers and/or expense reimbursements | |
Fund-level
| (364,200) |
Class A
| (81,319) |
Class C
| (310) |
Administrator Class
| (8,005) |
Net expenses
| 921,888 |
Net investment income
| 1,540,483 |
| Realized and unrealized gains (losses) on investments | |
Net realized gains on securities transactions allocated from affiliated Master Portfolio
| 42,393,871 |
Net change in unrealized gains (losses) on securities transactions allocated from affiliated Master Portfolio
| (42,498,214) |
Net realized and unrealized gains (losses) on investments
| (104,343) |
Net increase in net assets resulting from operations
| $ 1,436,140 |
The accompanying notes are an integral part of these financial statements.
Allspring Small Company Value Fund | 11
Statement of changes in net assets
| | | | | |
| | Six months ended
November 30, 2021
(unaudited) | Year ended
May 31, 2021 |
| Operations | | | | |
Net investment income
| | $ 1,540,483 | | $ 1,435,966 |
Net realized gains on investments
| | 42,393,871 | | 29,216,420 |
Net change in unrealized gains (losses) on investments
| | (42,498,214) | | 204,433,580 |
Net increase in net assets resulting from operations
| | 1,436,140 | | 235,085,966 |
| Distributions to shareholders from | | | | |
| Net investment income and net realized gains | | | | |
Class A
| | 0 | | (1,293,657) |
Class R6
| | 0 | | (57,563) |
Administrator Class
| | 0 | | (111,552) |
Institutional Class
| | 0 | | (291,793) |
Total distributions to shareholders
| | 0 | | (1,754,565) |
| Capital share transactions | Shares | | Shares | |
| Proceeds from shares sold | | | | |
Class A
| 312,261 | 11,772,002 | 941,668 | 26,856,731 |
Class C
| 13,959 | 480,144 | 13,195 | 384,992 |
Class R6
| 54,301 | 2,140,644 | 191,063 | 5,140,970 |
Administrator Class
| 227,179 | 8,736,857 | 324,601 | 9,607,503 |
Institutional Class
| 391,586 | 15,018,881 | 788,867 | 24,838,642 |
| | | 38,148,528 | | 66,828,838 |
| Reinvestment of distributions | | | | |
Class A
| 0 | 0 | 44,468 | 1,263,434 |
Class R6
| 0 | 0 | 1,957 | 57,318 |
Administrator Class
| 0 | 0 | 3,678 | 106,887 |
Institutional Class
| 0 | 0 | 9,851 | 287,148 |
| | | 0 | | 1,714,787 |
| Payment for shares redeemed | | | | |
Class A
| (753,906) | (27,978,319) | (2,387,672) | (63,689,654) |
Class C
| (20,839) | (681,310) | (149,932) | (3,213,714) |
Class R6
| (22,561) | (852,223) | (258,998) | (7,165,322) |
Administrator Class
| (256,984) | (9,916,812) | (194,898) | (5,830,131) |
Institutional Class
| (318,867) | (12,106,154) | (472,719) | (13,399,558) |
| | | (51,534,818) | | (93,298,379) |
Net decrease in net assets resulting from capital share transactions
| | (13,386,290) | | (24,754,754) |
Total increase (decrease) in net assets
| | (11,950,150) | | 208,576,647 |
| Net assets | | | | |
Beginning of period
| | 531,252,748 | | 322,676,101 |
End of period
| | $519,302,598 | | $531,252,748 |
The accompanying notes are an integral part of these financial statements.
12 | Allspring Small Company Value Fund
Financial highlights
(For a share outstanding throughout each period)
| | | Year ended May 31 |
| Class A | Six months ended
November 30, 2021
(unaudited) | 2021 | 2020 | 2019 | 2018 | 2017 |
Net asset value, beginning of period
| $37.11 | $20.91 | $24.22 | $28.60 | $24.01 | $20.22 |
Net investment income
| 0.10 | 0.09 | 0.18 1 | 0.09 | 0.09 | 0.05 |
Net realized and unrealized gains (losses) on investments
| 0.02 | 16.22 | (3.35) | (4.31) | 4.58 | 3.75 |
Total from investment operations
| 0.12 | 16.31 | (3.17) | (4.22) | 4.67 | 3.80 |
| Distributions to shareholders from | | | | | | |
Net investment income
| 0.00 | (0.11) | (0.14) | (0.16) | (0.08) | (0.01) |
Net asset value, end of period
| $37.23 | $37.11 | $20.91 | $24.22 | $28.60 | $24.01 |
Total return2
| 0.32% | 77.80% | (13.25)% | (14.72)% | 19.48% | 18.86% |
| Ratios to average net assets (annualized)* | | | | | | |
Gross expenses
| 1.32% | 1.32% | 1.32% | 1.49% | 1.47% | 1.47% |
Net expenses
| 1.14% | 1.14% | 1.13% | 1.15% | 1.33% | 1.35% |
Net investment income
| 0.54% | 0.33% | 0.74% | 0.38% | 0.46% | 0.20% |
| Supplemental data | | | | | | |
Portfolio turnover rate3
| 31% | 62% | 78% | 168% | 144% | 110% |
Net assets, end of period (000s omitted)
| $398,912 | $414,013 | $262,574 | $11,902 | $15,665 | $16,280 |
| * | Ratios include net expenses allocated from the affiliated Master Portfolio which were as follows: |
| Six months ended November 30, 2021 (unaudited) | 0.74% |
| Year ended May 31, 2021 | 0.74% |
| Year ended May 31, 2020 | 0.74% |
| Year ended May 31, 2019 | 0.75% |
| Year ended May 31, 2018 | 0.84% |
| Year ended May 31, 2017 | 0.84% |
| 1 | Calculated based upon average shares outstanding |
| 2 | Total return calculations do not include any sales charges. Returns for periods of less than one year are not annualized. |
| 3 | Portfolio turnover rate is calculated by multiplying the affiliated Master Portfolio’s percentage of the Fund’s total investment in securities at the end of the period by the affiliated Master Portfolio’s portfolio turnover rate. |
The accompanying notes are an integral part of these financial statements.
Allspring Small Company Value Fund | 13
Financial highlights
(For a share outstanding throughout each period)
| | | Year ended May 31 |
| Class C | Six months ended
November 30, 2021
(unaudited) | 2021 | 2020 | 2019 | 2018 | 2017 |
Net asset value, beginning of period
| $32.69 | $18.43 | $21.48 | $25.38 | $21.40 | $18.15 |
Net investment income (loss)
| (0.04) 1 | (0.07) 1 | 0.01 1 | (0.08) 1 | (0.07) 1 | (0.11) 1 |
Net realized and unrealized gains (losses) on investments
| 0.02 | 14.33 | (3.00) | (3.82) | 4.05 | 3.36 |
Total from investment operations
| (0.02) | 14.26 | (2.99) | (3.90) | 3.98 | 3.25 |
| Distributions to shareholders from | | | | | | |
Net investment income
| 0.00 | 0.00 | (0.06) | 0.00 | 0.00 | 0.00 |
Net asset value, end of period
| $32.67 | $32.69 | $18.43 | $21.48 | $25.38 | $21.40 |
Total return2
| (0.06)% | 76.80% | (13.98)% | (15.37)% | 18.60% | 17.97% |
| Ratios to average net assets (annualized)* | | | | | | |
Gross expenses
| 2.06% | 2.06% | 2.08% | 2.22% | 2.21% | 2.22% |
Net expenses
| 1.90% | 1.90% | 1.90% | 1.90% | 2.08% | 2.10% |
Net investment income (loss)
| (0.24)% | (0.29)% | 0.02% | (0.35)% | (0.29)% | (0.54)% |
| Supplemental data | | | | | | |
Portfolio turnover rate3
| 31% | 62% | 78% | 168% | 144% | 110% |
Net assets, end of period (000s omitted)
| $3,161 | $3,388 | $4,431 | $1,099 | $1,980 | $1,962 |
| * | Ratios include net expenses allocated from the affiliated Master Portfolio which were as follows: |
| Six months ended November 30, 2021 (unaudited) | 0.74% |
| Year ended May 31, 2021 | 0.74% |
| Year ended May 31, 2020 | 0.74% |
| Year ended May 31, 2019 | 0.75% |
| Year ended May 31, 2018 | 0.84% |
| Year ended May 31, 2017 | 0.84% |
| 1 | Calculated based upon average shares outstanding |
| 2 | Total return calculations do not include any sales charges. Returns for periods of less than one year are not annualized. |
| 3 | Portfolio turnover rate is calculated by multiplying the affiliated Master Portfolio’s percentage of the Fund’s total investment in securities at the end of the period by the affiliated Master Portfolio’s portfolio turnover rate. |
The accompanying notes are an integral part of these financial statements.
14 | Allspring Small Company Value Fund
Financial highlights
(For a share outstanding throughout each period)
| | | Year ended May 31 |
| Class R6 | Six months ended
November 30, 2021
(unaudited) | 2021 | 2020 | 2019 | 2018 | 2017 1 |
Net asset value, beginning of period
| $38.33 | $21.56 | $24.92 | $29.44 | $24.69 | $21.37 |
Net investment income
| 0.18 2 | 0.20 | 0.31 | 0.21 2 | 0.29 2 | 0.08 |
Net realized and unrealized gains (losses) on investments
| 0.01 | 16.78 | (3.50) | (4.45) | 4.65 | 3.33 |
Total from investment operations
| 0.19 | 16.98 | (3.19) | (4.24) | 4.94 | 3.41 |
| Distributions to shareholders from | | | | | | |
Net investment income
| 0.00 | (0.21) | (0.17) | (0.28) | (0.19) | (0.09) |
Net asset value, end of period
| $38.52 | $38.33 | $21.56 | $24.92 | $29.44 | $24.69 |
Total return3
| 0.50% | 78.63% | (12.97)% | (14.38)% | 20.03% | 15.95% |
| Ratios to average net assets (annualized)* | | | | | | |
Gross expenses
| 0.89% | 0.89% | 0.90% | 1.09% | 1.03% | 1.02% |
Net expenses
| 0.75% | 0.75% | 0.75% | 0.75% | 0.88% | 0.90% |
Net investment income
| 0.94% | 0.73% | 1.22% | 0.77% | 1.04% | 0.58% |
| Supplemental data | | | | | | |
Portfolio turnover rate4
| 31% | 62% | 78% | 168% | 144% | 110% |
Net assets, end of period (000s omitted)
| $10,277 | $9,007 | $6,491 | $731 | $322 | $29 |
| * | Ratios include net expenses allocated from the affiliated Master Portfolio which were as follows: |
| Six months ended November 30, 2021 (unaudited) | 0.74% |
| Year ended May 31, 2021 | 0.74% |
| Year ended May 31, 2020 | 0.74% |
| Year ended May 31, 2019 | 0.75% |
| Year ended May 31, 2018 | 0.84% |
| Year ended May 31, 20171 | 0.83% |
| 1 | For the period from October 31, 2016 (commencement of class operations) to May 31, 2017 |
| 2 | Calculated based upon average shares outstanding |
| 3 | Returns for periods of less than one year are not annualized. |
| 4 | Portfolio turnover rate is calculated by multiplying the affiliated Master Portfolio’s percentage of the Fund’s total investment in securities at the end of the period by the affiliated Master Portfolio’s portfolio turnover rate. |
The accompanying notes are an integral part of these financial statements.
Allspring Small Company Value Fund | 15
Financial highlights
(For a share outstanding throughout each period)
| | | Year ended May 31 |
| Administrator Class | Six months ended
November 30, 2021
(unaudited) | 2021 | 2020 | 2019 | 2018 | 2017 |
Net asset value, beginning of period
| $37.98 | $21.40 | $24.80 | $29.23 | $24.53 | $20.66 |
Net investment income
| 0.12 1 | 0.10 1 | 0.21 1 | 0.14 1 | 0.20 | 0.08 1 |
Net realized and unrealized gains (losses) on investments
| 0.02 | 16.62 | (3.43) | (4.43) | 4.63 | 3.83 |
Total from investment operations
| 0.14 | 16.72 | (3.22) | (4.29) | 4.83 | 3.91 |
| Distributions to shareholders from | | | | | | |
Net investment income
| 0.00 | (0.14) | (0.18) | (0.14) | (0.13) | (0.04) |
Net asset value, end of period
| $38.12 | $37.98 | $21.40 | $24.80 | $29.23 | $24.53 |
Total return2
| 0.37% | 77.91% | (13.18)% | (14.65)% | 19.71% | 19.00% |
| Ratios to average net assets (annualized)* | | | | | | |
Gross expenses
| 1.24% | 1.24% | 1.32% | 1.35% | 1.38% | 1.39% |
Net expenses
| 1.05% | 1.05% | 1.05% | 1.05% | 1.19% | 1.20% |
Net investment income
| 0.63% | 0.35% | 0.82% | 0.49% | 0.59% | 0.36% |
| Supplemental data | | | | | | |
Portfolio turnover rate3
| 31% | 62% | 78% | 168% | 144% | 110% |
Net assets, end of period (000s omitted)
| $31,706 | $32,721 | $15,581 | $13,905 | $60,379 | $57,591 |
| * | Ratios include net expenses allocated from the affiliated Master Portfolio which were as follows: |
| Six months ended November 30, 2021 (unaudited) | 0.74% |
| Year ended May 31, 2021 | 0.74% |
| Year ended May 31, 2020 | 0.74% |
| Year ended May 31, 2019 | 0.75% |
| Year ended May 31, 2018 | 0.84% |
| Year ended May 31, 2017 | 0.84% |
| 1 | Calculated based upon average shares outstanding |
| 2 | Returns for periods of less than one year are not annualized. |
| 3 | Portfolio turnover rate is calculated by multiplying the affiliated Master Portfolio’s percentage of the Fund’s total investment in securities at the end of the period by the affiliated Master Portfolio’s portfolio turnover rate. |
The accompanying notes are an integral part of these financial statements.
16 | Allspring Small Company Value Fund
Financial highlights
(For a share outstanding throughout each period)
| | | Year ended May 31 |
| Institutional Class | Six months ended
November 30, 2021
(unaudited) | 2021 | 2020 | 2019 | 2018 | 2017 |
Net asset value, beginning of period
| $38.13 | $21.46 | $24.86 | $29.40 | $24.68 | $20.77 |
Net investment income
| 0.16 1 | 0.15 1 | 0.25 | 0.19 1 | 0.21 | 0.11 |
Net realized and unrealized gains (losses) on investments
| 0.01 | 16.70 | (3.43) | (4.45) | 4.69 | 3.89 |
Total from investment operations
| 0.17 | 16.85 | (3.18) | (4.26) | 4.90 | 4.00 |
| Distributions to shareholders from | | | | | | |
Net investment income
| 0.00 | (0.18) | (0.22) | (0.28) | (0.18) | (0.09) |
Net asset value, end of period
| $38.30 | $38.13 | $21.46 | $24.86 | $29.40 | $24.68 |
Total return2
| 0.45% | 78.39% | (13.03)% | (14.46)% | 19.90% | 13.70% |
| Ratios to average net assets (annualized)* | | | | | | |
Gross expenses
| 0.99% | 0.99% | 1.07% | 1.14% | 1.14% | 1.14% |
Net expenses
| 0.85% | 0.85% | 0.85% | 0.85% | 0.99% | 1.00% |
Net investment income
| 0.83% | 0.52% | 1.04% | 0.68% | 0.78% | 0.55% |
| Supplemental data | | | | | | |
Portfolio turnover rate3
| 31% | 62% | 78% | 168% | 144% | 110% |
Net assets, end of period (000s omitted)
| $75,247 | $72,123 | $33,600 | $33,116 | $60,973 | $52,072 |
| * | Ratios include net expenses allocated from the affiliated Master Portfolio which were as follows: |
| Six months ended November 30, 2021 (unaudited) | 0.74% |
| Year ended May 31, 2021 | 0.74% |
| Year ended May 31, 2020 | 0.74% |
| Year ended May 31, 2019 | 0.75% |
| Year ended May 31, 2018 | 0.84% |
| Year ended May 31, 2017 | 0.84% |
| 1 | Calculated based upon average shares outstanding |
| 2 | Returns for periods of less than one year are not annualized. |
| 3 | Portfolio turnover rate is calculated by multiplying the affiliated Master Portfolio’s percentage of the Fund’s total investment in securities at the end of the period by the affiliated Master Portfolio’s portfolio turnover rate. |
The accompanying notes are an integral part of these financial statements.
Allspring Small Company Value Fund | 17
Notes to financial statements (unaudited)
1. ORGANIZATION
Allspring Funds Trust (the "Trust"), a Delaware statutory trust organized on March 10, 1999, is an open-end management investment company registered under the Investment Company Act of 1940, as amended (the "1940 Act"). As an investment company, the Trust follows the accounting and reporting guidance in Financial Accounting Standards Board ("FASB") Accounting Standards Codification Topic 946, Financial Services – Investment Companies. These financial statements report on the Allspring Small Company Value Fund (the "Fund") which is a diversified series of the Trust.
The Fund is a feeder fund in a master-feeder structure that invests substantially all of its assets in a single master portfolio with a substantially identical investment objective and substantially similar investment strategies. The Fund invests in Allspring Small Company Value Portfolio, a separate diversified portfolio (the “affiliated Master Portfolio”) of Allspring Master Trust, a registered open-end management investment company. As of November 30, 2021, the Fund owned 86.18% of Allspring Small Company Value Portfolio. The affiliated Master Portfolio directly acquires portfolio securities and the Fund acquires an indirect interest in those securities. The Fund accounts for its investment in the affiliated Master Portfolio as a partnership investment and records on a daily basis its share of the affiliated Master Portfolio’s income, expense and realized and unrealized gains and losses. The financial statements of the affiliated Master Portfolio for the six months ended November 30, 2021 are included in this report and should be read in conjunction with the Fund’s financial statements.
On February 23, 2021, Wells Fargo & Company entered into a definitive agreement to sell Wells Fargo Asset Management ("WFAM") to GTCR LLC and Reverence Capital Partners, L.P. WFAM was the trade name used by the asset management businesses of Wells Fargo & Company and included Wells Fargo Funds Management, LLC, Wells Capital Management, LLC, Wells Fargo Asset Management (International) Limited and Wells Fargo Funds Distributor, LLC. Effective on November 1, 2021, the sale transaction of WFAM by Wells Fargo & Company to GTCR LLC and Reverence Capital Partners, L.P. was closed. In connection with the closing of the transaction, WFAM became known as Allspring Global Investments (“Allspring”) and various entities that provide services to the Fund changed their names to "Allspring", including Allspring Funds Management, LLC (formerly Wells Fargo Funds Management, LLC), the investment manager to the Fund, Allspring Global Investments, Inc. (formerly Wells Capital Management, LLC) and Allspring Global Investments (UK) Limited (formerly Wells Fargo Asset Management (International) Limited), both registered investment advisers providing subadvisory services to certain funds, and Allspring Funds Distributor, LLC (formerly Wells Fargo Funds Distributor, LLC), the Fund's principal underwriter.
Consummation of the transaction resulted in the automatic termination of the Fund’s investment management agreement. The Fund’s Board of Trustees approved a new investment management agreement which was submitted and approved by the Fund’s shareholders at a Special Meeting of Shareholders held on October 29, 2021. The new agreement became effective on November 1, 2021.
Effective December 6, 2021, "Wells Fargo" was removed from the Fund's name and replaced it with "Allspring".
2. SIGNIFICANT ACCOUNTING POLICIES
The following significant accounting policies, which are consistently followed in the preparation of the financial statements of the Fund, are in conformity with U.S. generally accepted accounting principles which require management to make estimates and assumptions that affect the reported amounts of assets and liabilities, disclosure of contingent assets and liabilities at the date of the financial statements, and the reported amounts of income and expenses during the reporting period. Actual results could differ from those estimates.
Securities valuation
All investments are valued each business day as of the close of regular trading on the New York Stock Exchange (generally 4 p.m. Eastern Time), although the Fund may deviate from this calculation time under unusual or unexpected circumstances.
Investments in the affiliated Master Portfolio are valued daily based on the Fund’s proportionate share of the affiliated Master Portfolio’s net assets, which are also valued daily. Securities held in the affiliated Master Portfolio are valued as discussed in the Notes to Financial Statements of the affiliated Master Portfolio, which are included elsewhere in this report.
Investments which are not valued using the method discussed above are valued at their fair value, as determined in good faith by the Board of Trustees. The Board of Trustees has established a Valuation Committee comprised of the Trustees and has delegated to it the authority to take any actions regarding the valuation of portfolio securities that the Valuation Committee deems necessary or appropriate, including determining the fair value of portfolio securities, unless the determination has been delegated to the Allspring Global Investments Pricing Committee at Allspring Funds Management, LLC ("Allspring Funds Management"). The Board of Trustees retains the authority to make or ratify any valuation decisions or approve any changes to
18 | Allspring Small Company Value Fund
Notes to financial statements (unaudited)
the Valuation Procedures as it deems appropriate. On a quarterly basis, the Board of Trustees receives reports on any valuation actions taken by the Valuation Committee or the Allspring Global Investments Pricing Committee which may include items for ratification.
Investment transactions, income and expenses
Investments in the affiliated Master Portfolio are recorded on a trade date basis. The Fund records daily its proportionate share of the affiliated Master Portfolio’s income, expenses and realized and unrealized gains or losses. The Fund also accrues its own expenses.
Distributions to shareholders
Distributions to shareholders from net investment income and any net realized gains are recorded on the ex-dividend date and paid at least annually. Such distributions are determined in accordance with income tax regulations and may differ from U.S. generally accepted accounting principles. Dividend sources are estimated at the time of declaration. The tax character of distributions is determined as of the Fund's fiscal year end. Therefore, a portion of the Fund's distributions made prior to the Fund’s fiscal year end may be categorized as a tax return of capital at year end.
Federal and other taxes
The Fund intends to continue to qualify as a regulated investment company by distributing substantially all of its investment company taxable income and any net realized capital gains (after reduction for capital loss carryforwards) sufficient to relieve it from all, or substantially all, federal income taxes. Accordingly, no provision for federal income taxes was required.
The Fund’s income and federal excise tax returns and all financial records supporting those returns for the prior three fiscal years are subject to examination by the federal and Delaware revenue authorities. Management has analyzed the Fund's tax positions taken on federal, state, and foreign tax returns for all open tax years and does not believe that there are any uncertain tax positions that require recognition of a tax liability.
As of November 30, 2021, the aggregate cost of all investments for federal income tax purposes was $404,550,724 and the unrealized gains (losses) consisted of:
| Gross unrealized gains | $114,884,037 |
| Gross unrealized losses | 0 |
| Net unrealized gains | $114,884,037 |
As of May 31, 2021, the Fund had capital loss carryforwards which consisted of $5,786,220 in short-term capital losses.
As of May 31, 2021, the Fund had a qualified late-year ordinary loss of $475,078 which was recognized on the first day of the current fiscal year.
Class allocations
The separate classes of shares offered by the Fund differ principally in applicable sales charges, distribution, shareholder servicing, and administration fees. Class specific expenses are charged directly to that share class. Investment income, common fund-level expenses, and realized and unrealized gains (losses) on investments are allocated daily to each class of shares based on the relative proportion of net assets of each class.
3. FAIR VALUATION MEASUREMENTS
At November 30, 2021, the Fund’s investment in the affiliated Master Portfolio was measured at fair value using the net asset value per share (or its equivalent) as a practical expedient. The investment objective and fair value of the affiliated Master Portfolio is as follows:
| Affiliated Master Portfolio | Investment objective | Fair value of affiliated
Master Portfolio |
| Allspring Small Company Value Portfolio | Seek long-term capital appreciation | $519,434,761 |
The affiliated Master Portfolio does not have a redemption period notice, can be redeemed daily and does not have any unfunded commitments.
Allspring Small Company Value Fund | 19
Notes to financial statements (unaudited)
4. TRANSACTIONS WITH AFFILIATES
Management fee
Allspring Funds Management, a wholly owned subsidiary of Allspring Global Investments Holdings, LLC, a holding company indirectly owned by certain private funds of GTCR LLC and Reverence Capital Partners, L.P., is the manager of the Fund and provides advisory and fund-level administrative services under an investment management agreement. Under the investment management agreement, Allspring Funds Management is responsible for, among other services, implementing the investment objectives and strategies of the Fund and providing fund-level administrative services in connection with the Fund’s operations. As long as the Fund continues to invest substantially all of its assets in a single affiliated Master Portfolio, the Fund pays Allspring Funds Management an investment management fee only for fund-level administrative services at the following annual rate based on the Fund’s average daily net assets:
| Average daily net assets | Management fee |
| First $5 billion | 0.050% |
| Next $5 billion | 0.040 |
| Over $10 billion | 0.030 |
For the six months ended November 30, 2021, the management fee was equivalent to an annual rate of 0.05% of the Fund’s average daily net assets.
Allspring Funds Management also serves as the adviser to the affiliated Master Portfolio and is entitled to receive a fee from the affiliated Master Portfolio for those services.
Administration fees
Under a class-level administration agreement, Allspring Funds Management provides class-level administrative services to the Fund, which includes paying fees and expenses for services provided by the transfer agent, sub-transfer agents, omnibus account servicers and record-keepers. As compensation for its services under the class-level administration agreement, Allspring Funds Management receives an annual fee which is calculated based on the average daily net assets of each class as follows:
| | Class-level
administration fee |
| Class A | 0.21% |
| Class C | 0.21 |
| Class R6 | 0.03 |
| Administrator Class | 0.13 |
| Institutional Class | 0.13 |
Waivers and/or expense reimbursements
Allspring Funds Management has contractually committed to waive and/or reimburse management and administration fees to the extent necessary to maintain certain net operating expense ratios for the Fund. When each class of the Fund has exceeded its expense cap, Allspring Funds Management will waive fees and/or reimburse expenses from fund-level expenses on a proportionate basis and then from class specific expenses. When only certain classes exceed their expense caps, waivers and/or reimbursements are applied against class specific expenses before fund-level expenses. Net expenses from the affiliated Master Portfolio are included in the expense caps. Allspring Funds Management has contractually committed through September 30, 2022 to waive fees and/or reimburse expenses to the extent necessary to cap expenses. Prior to or after the commitment expiration date, the caps may be increased or the commitment to maintain the caps may be terminated only with the approval of the Board of Trustees. The contractual expense caps are as follows:
20 | Allspring Small Company Value Fund
Notes to financial statements (unaudited)
| | Expense ratio caps |
| Class A | 1.15% |
| Class C | 1.90 |
| Class R6 | 0.75 |
| Administrator Class | 1.05 |
| Institutional Class | 0.85 |
Distribution fee
The Trust has adopted a distribution plan for Class C shares of the Fund pursuant to Rule 12b-1 under the 1940 Act. A distribution fee is charged to Class C shares and paid to Allspring Funds Distributor, LLC ("Allspring Funds Distributor"), an affiliate of Allspring Funds Management, the principal underwriter, at an annual rate of 0.75% of the average daily net assets of Class C shares.
In addition, Allspring Funds Distributor is entitled to receive the front-end sales charge from the purchase of Class A shares and a contingent deferred sales charge on the redemption of certain Class A shares. Allspring Funds Distributor is also entitled to receive the contingent deferred sales charges from redemptions of Class C shares. Allspring Funds Distributor received $1,160 in contingent deferred sales charges from Class A shares for the six months ended November 30, 2021. No front-end sales charges were incurred by Class A shares and no contingent deferred sales charges were incurred by Class C shares for the six months ended November 30, 2021.
Shareholder servicing fees
The Trust has entered into contracts with one or more shareholder servicing agents, whereby Class A, Class C, and Administrator Class of the Fund are charged a fee at an annual rate of 0.25% of the average daily net assets of each respective class. A portion of these total shareholder servicing fees were paid to affiliates, and to certain entities that were affiliates of the Fund until November 1, 2021.
5. INVESTMENT PORTFOLIO TRANSACTIONS
The Fund seeks to achieve its investment objective by investing substantially all of its assets in the affiliated Master Portfolio. Purchases and sales have been calculated by multiplying the Fund's ownership percentage of the affiliated Master Portfolio by the affiliated Master Portfolio's purchases and sales. Purchases and sales of investments, excluding U.S. government obligations (if any) and short-term securities, for the six months ended November 30, 2021 were $344,013,216 and $707,037,049, respectively.
6. BANK BORROWINGS
The Trust (excluding the money market funds), Allspring Master Trust and Allspring Variable Trust are parties to a $350,000,000 revolving credit agreement whereby the Fund is permitted to use bank borrowings for temporary or emergency purposes, such as to fund shareholder redemption requests. Interest under the credit agreement is charged to the Fund based on a borrowing rate equal to the higher of the Federal Funds rate in effect on that day plus 1.25% or the overnight bank funding rate in effect on that day plus 1.25%. In addition, an annual commitment fee equal to 0.25% of the unused balance is allocated to each participating fund.
For the six months ended November 30, 2021, there were no borrowings by the Fund under the agreement.
7. INDEMNIFICATION
Under the Fund's organizational documents, the officers and Trustees have been granted certain indemnification rights against certain liabilities that may arise out of performance of their duties to the Fund. The Fund has entered into a separate agreement with each Trustee that converts indemnification rights currently existing under the Fund’s organizational documents into contractual rights that cannot be changed in the future without the consent of the Trustee. Additionally, in the normal course of business, the Fund may enter into contracts with service providers that contain a variety of indemnification clauses. The Fund’s maximum exposure under these arrangements is dependent on future claims that may be made against the Fund and, therefore, cannot be estimated.
Allspring Small Company Value Fund | 21
Notes to financial statements (unaudited)
8. CORONAVIRUS (COVID-19) PANDEMIC
On March 11, 2020, the World Health Organization announced that it had made the assessment that coronavirus disease 2019 (“COVID-19”) is a pandemic. The impacts of COVID-19 are affecting the entire global economy, individual companies and investment products, the funds, and the market in general. There is significant uncertainty around the extent and duration of business disruptions related to COVID-19 and the impacts may last for an extended period of time. COVID-19 has led to significant uncertainty and volatility in the financial markets.
22 | Allspring Small Company Value Fund
Portfolio of investments—November 30, 2021
| | | | | Shares | Value |
| Common stocks: 98.78% | | | | | |
| Consumer discretionary: 10.98% | | | | | |
| Auto components: 2.01% | | | | | |
| Dana Incorporated | | | | 185,423 | $ 3,986,595 |
| Patrick Industries Incorporated | | | | 62,974 | 5,023,436 |
| Standard Motor Products Incorporated | | | | 61,670 | 3,085,967 |
| | | | | | 12,095,998 |
| Diversified consumer services: 0.10% | | | | | |
| H&R Block Incorporated | | | | 26,653 | 631,143 |
| Hotels, restaurants & leisure: 1.12% | | | | | |
| Dine Brands Global Incorporated † | | | | 59,747 | 4,291,030 |
| Wyndham Hotels & Resorts Incorporated | | | | 30,734 | 2,442,738 |
| | | | | | 6,733,768 |
| Household durables: 1.11% | | | | | |
| GoPro Incorporated Class A † | | | | 162,832 | 1,628,320 |
| Green Brick Partners Incorporated † | | | | 59,778 | 1,491,461 |
| Hooker Furniture Corporation | | | | 110,503 | 2,623,341 |
| iRobot Corporation †« | | | | 12,399 | 941,208 |
| | | | | | 6,684,330 |
| Leisure products: 1.66% | | | | | |
| Johnson Outdoors Incorporated Class A | | | | 48,169 | 5,011,503 |
| Malibu Boats Incorporated Class A † | | | | 71,663 | 4,978,429 |
| | | | | | 9,989,932 |
| Multiline retail: 0.61% | | | | | |
| Big Lots Stores Incorporated | | | | 66,028 | 2,864,295 |
| Nordstrom Incorporated † | | | | 40,029 | 847,414 |
| | | | | | 3,711,709 |
| Specialty retail: 3.35% | | | | | |
| American Eagle Outfitters Incorporated | | | | 154,831 | 4,008,575 |
| Bed Bath & Beyond Incorporated † | | | | 145,629 | 2,669,380 |
| Destination XL Group Incorporated † | | | | 212,841 | 1,521,813 |
| Dick's Sporting Goods Incorporated | | | | 50,586 | 5,946,890 |
| Shoe Carnival Incorporated | | | | 154,269 | 6,031,918 |
| | | | | | 20,178,576 |
| Textiles, apparel & luxury goods: 1.02% | | | | | |
| Lakeland Industries Incorporated † | | | | 133,606 | 2,557,219 |
| Rocky Brands Incorporated | | | | 101,002 | 3,588,601 |
| | | | | | 6,145,820 |
| Consumer staples: 0.52% | | | | | |
| Food & staples retailing: 0.52% | | | | | |
| Grocery Outlet Holding Corporation † | | | | 108,801 | 3,150,877 |
The accompanying notes are an integral part of these financial statements.
Allspring Small Company Value Portfolio | 23
Portfolio of investments—November 30, 2021
| | | | | Shares | Value |
| Energy: 5.51% | | | | | |
| Energy equipment & services: 2.01% | | | | | |
| Helmerich & Payne Incorporated | | | | 269,602 | $ 6,052,565 |
| Patterson-UTI Energy Incorporated | | | | 862,030 | 6,085,932 |
| | | | | | 12,138,497 |
| Oil, gas & consumable fuels: 3.50% | | | | | |
| Diamondback Energy Incorporated | | | | 69,492 | 7,416,881 |
| Marathon Oil Corporation | | | | 199,647 | 3,092,532 |
| Southwestern Energy Company † | | | | 1,226,449 | 5,494,492 |
| W&T Offshore Incorporated † | | | | 1,478,501 | 5,086,043 |
| | | | | | 21,089,948 |
| Financials: 24.19% | | | | | |
| Banks: 15.87% | | | | | |
| Ameris Bancorp | | | | 137,774 | 6,705,461 |
| Atlantic Union Bankshares Corporation | | | | 185,517 | 6,031,158 |
| Banc of California Incorporated | | | | 244,261 | 4,785,073 |
| Banner Corporation | | | | 107,261 | 6,143,910 |
| Customers Bancorp Incorporated † | | | | 141,619 | 8,162,919 |
| FB Financial Corporation | | | | 131,094 | 5,623,933 |
| First Foundation Incorporated | | | | 249,848 | 6,351,136 |
| First Interstate BancSystem Class A | | | | 129,617 | 5,288,374 |
| Great Southern Bancorp Incorporated | | | | 78,989 | 4,394,158 |
| Heritage Financial Corporation | | | | 196,785 | 4,610,673 |
| Independent Bank Corporation | | | | 174,631 | 3,937,929 |
| OceanFirst Financial Corporation | | | | 230,443 | 4,749,430 |
| OFG Bancorp | | | | 210,933 | 5,083,485 |
| Synovus Financial Corporation | | | | 160,839 | 7,284,398 |
| Umpqua Holdings Corporation | | | | 321,639 | 6,130,439 |
| Univest Corporation of Pennsylvania | | | | 176,019 | 4,852,844 |
| Western Alliance Bancorp | | | | 50,223 | 5,513,481 |
| | | | | | 95,648,801 |
| Capital markets: 1.75% | | | | | |
| Piper Jaffray Companies Incorporated | | | | 52,764 | 8,745,633 |
| Sculptor Capital Management Incorporated | | | | 98,228 | 1,779,891 |
| | | | | | 10,525,524 |
| Diversified financial services: 0.31% | | | | | |
| A-Mark Precious Metals Incorporated | | | | 27,108 | 1,877,229 |
| Insurance: 1.97% | | | | | |
| American Equity Investment Life Holding Company | | | | 178,086 | 5,989,032 |
| Horace Mann Educators Corporation | | | | 87,102 | 3,228,871 |
| United Fire Group Incorporated | | | | 128,297 | 2,683,973 |
| | | | | | 11,901,876 |
| Mortgage REITs: 1.61% | | | | | |
| AGNC Investment Corporation | | | | 314,682 | 4,811,488 |
| Annaly Capital Management Incorporated | | | | 605,674 | 4,905,959 |
| | | | | | 9,717,447 |
The accompanying notes are an integral part of these financial statements.
24 | Allspring Small Company Value Portfolio
Portfolio of investments—November 30, 2021
| | | | | Shares | Value |
| Thrifts & mortgage finance: 2.68% | | | | | |
| Axos Financial Incorporated † | | | | 119,886 | $ 6,786,746 |
| Homestreet Incorporated | | | | 46,391 | 2,290,324 |
| Walker & Dunlop Incorporated | | | | 50,172 | 7,058,699 |
| | | | | | 16,135,769 |
| Health care: 9.25% | | | | | |
| Biotechnology: 1.22% | | | | | |
| Chemocentryx Incorporated † | | | | 56,425 | 2,047,099 |
| Eagle Pharmaceuticals Incorporated † | | | | 74,287 | 3,542,004 |
| Global Blood Therapeutics Incorporated † | | | | 52,656 | 1,488,059 |
| Immunovant Incorporated † | | | | 33,453 | 257,588 |
| | | | | | 7,334,750 |
| Health care equipment & supplies: 2.84% | | | | | |
| AngioDynamics Incorporated † | | | | 233,206 | 6,005,055 |
| ICU Medical Incorporated † | | | | 20,101 | 4,547,047 |
| Integer Holdings Corporation † | | | | 46,099 | 3,675,934 |
| Merit Medical Systems Incorporated † | | | | 46,065 | 2,895,646 |
| | | | | | 17,123,682 |
| Health care providers & services: 4.48% | | | | | |
| Addus Homecare Corporation † | | | | 43,148 | 3,763,369 |
| AMN Healthcare Services Incorporated † | | | | 36,444 | 4,154,980 |
| Brookdale Senior Living Incorporated † | | | | 436,407 | 2,557,345 |
| LHC Group Incorporated † | | | | 13,979 | 1,603,671 |
| Option Care Health Incorporated † | | | | 97,171 | 2,459,398 |
| Premier Incorporated Class A | | | | 152,891 | 5,667,669 |
| The Ensign Group Incorporated | | | | 56,055 | 4,278,678 |
| U.S. Physical Therapy Incorporated | | | | 29,107 | 2,502,620 |
| | | | | | 26,987,730 |
| Health care technology: 0.53% | | | | | |
| Computer Programs & Systems Incorporated † | | | | 108,137 | 3,186,797 |
| Pharmaceuticals: 0.18% | | | | | |
| Phibro Animal Health Corporation Class A | | | | 57,372 | 1,123,917 |
| Industrials: 17.44% | | | | | |
| Air freight & logistics: 0.54% | | | | | |
| Radiant Logistics Incorporated † | | | | 429,422 | 3,237,842 |
| Airlines: 0.56% | | | | | |
| Alaska Air Group Incorporated † | | | | 69,986 | 3,399,220 |
| Building products: 1.68% | | | | | |
| CSW Industrials Incorporated | | | | 29,475 | 3,542,895 |
| Zurn Water Solutions Corporation | | | | 187,454 | 6,570,263 |
| | | | | | 10,113,158 |
| Commercial services & supplies: 0.92% | | | | | |
| ABM Industries Incorporated | | | | 81,687 | 3,675,915 |
| Herman Miller Incorporated | | | | 48,741 | 1,849,234 |
| | | | | | 5,525,149 |
The accompanying notes are an integral part of these financial statements.
Allspring Small Company Value Portfolio | 25
Portfolio of investments—November 30, 2021
| | | | | Shares | Value |
| Construction & engineering: 4.40% | | | | | |
| Comfort Systems Incorporated | | | | 85,830 | $ 8,142,692 |
| Great Lakes Dredge & Dock Company † | | | | 335,945 | 4,965,267 |
| MYR Group Incorporated † | | | | 64,139 | 7,100,829 |
| Northwest Pipe Company † | | | | 51,280 | 1,475,838 |
| Sterling Construction Company Incorporated † | | | | 187,625 | 4,835,096 |
| | | | | | 26,519,722 |
| Electrical equipment: 1.77% | | | | | |
| Atkore International Incorporated † | | | | 25,982 | 2,767,083 |
| Regal-Beloit Corporation | | | | 49,957 | 7,898,202 |
| | | | | | 10,665,285 |
| Machinery: 4.91% | | | | | |
| Columbus McKinnon Corporation | | | | 82,180 | 3,650,436 |
| Federal Signal Corporation | | | | 118,104 | 5,011,153 |
| Hillenbrand Incorporated | | | | 109,047 | 4,863,496 |
| Kadant Incorporated | | | | 31,339 | 7,347,742 |
| Miller Industries Incorporated | | | | 85,709 | 2,803,541 |
| The Shyft Group Incorporated | | | | 121,569 | 5,909,469 |
| | | | | | 29,585,837 |
| Professional services: 1.29% | | | | | |
| CBIZ Incorporated † | | | | 155,416 | 5,599,638 |
| Kelly Services Incorporated Class A | | | | 66,528 | 1,121,662 |
| Mastech Digital Incorporated † | | | | 59,937 | 1,057,888 |
| | | | | | 7,779,188 |
| Road & rail: 1.37% | | | | | |
| Arcbest Corporation | | | | 80,264 | 8,273,613 |
| Information technology: 8.84% | | | | | |
| Electronic equipment, instruments & components: 3.58% | | | | | |
| ePlus Incorporated † | | | | 35,429 | 3,737,405 |
| Insight Enterprises Incorporated † | | | | 62,713 | 6,184,756 |
| Methode Electronics Incorporated | | | | 126,641 | 5,631,725 |
| PC Connection Incorporated | | | | 56,476 | 2,475,908 |
| Sanmina Corporation † | | | | 96,667 | 3,532,212 |
| | | | | | 21,562,006 |
| IT services: 1.22% | | | | | |
| BM Technologies Incorporated † | | | | 43,806 | 527,862 |
| Conduent Incorporated † | | | | 421,028 | 2,121,981 |
| TTEC Holdings Incorporated | | | | 30,797 | 2,598,959 |
| Unisys Corporation † | | | | 117,853 | 2,140,210 |
| | | | | | 7,389,012 |
| Semiconductors & semiconductor equipment: 3.48% | | | | | |
| Cirrus Logic Incorporated † | | | | 43,629 | 3,498,173 |
| Diodes Incorporated † | | | | 42,685 | 4,539,550 |
| FormFactor Incorporated † | | | | 99,387 | 4,166,303 |
| Ichor Holdings Limited † | | | | 82,206 | 3,936,845 |
| Onto Innovation Incorporated † | | | | 51,132 | 4,814,589 |
| | | | | | 20,955,460 |
The accompanying notes are an integral part of these financial statements.
26 | Allspring Small Company Value Portfolio
Portfolio of investments—November 30, 2021
| | | | | Shares | Value |
| Software: 0.56% | | | | | |
| NCR Corporation † | | | | 86,974 | $ 3,383,289 |
| Materials: 7.78% | | | | | |
| Chemicals: 4.90% | | | | | |
| Advansix Incorporated | | | | 158,131 | 7,161,753 |
| Hawkins Incorporated | | | | 142,578 | 4,730,738 |
| Ingevity Corporation † | | | | 55,475 | 3,989,207 |
| Intrepid Potash Incorporated † | | | | 63,961 | 2,628,797 |
| Minerals Technologies Incorporated | | | | 93,180 | 6,119,131 |
| Stepan Company | | | | 43,568 | 4,910,549 |
| | | | | | 29,540,175 |
| Construction materials: 0.99% | | | | | |
| Eagle Materials Incorporated | | | | 38,727 | 5,972,478 |
| Containers & packaging: 0.69% | | | | | |
| UFP Technologies Incorporated † | | | | 61,632 | 4,121,332 |
| Metals & mining: 1.20% | | | | | |
| Schnitzer Steel Industries Incorporated Class A | | | | 150,462 | 7,237,222 |
| Real estate: 14.27% | | | | | |
| Equity REITs: 14.27% | | | | | |
| Agree Realty Corporation | | | | 87,241 | 5,894,002 |
| American Campus Communities Incorporated | | | | 130,902 | 6,772,869 |
| Armada Hoffler Properties Incorporated | | | | 349,124 | 4,870,280 |
| Centerspace REIT | | | | 78,347 | 8,006,280 |
| Global Medical REIT Incorporated | | | | 354,449 | 5,791,697 |
| Independence Realty Trust Incorporated | | | | 213,284 | 5,225,458 |
| Lexington Corporate Properties Trust | | | | 610,486 | 9,187,814 |
| Monmouth Real Estate Investment Corporation | | | | 306,663 | 6,369,391 |
| One Liberty Properties Incorporated | | | | 154,638 | 5,030,374 |
| Outfront Media Incorporated | | | | 186,999 | 4,673,105 |
| PotlatchDeltic Corporation | | | | 63,912 | 3,460,196 |
| Retail Opportunity Investment Corporation | | | | 245,845 | 4,317,038 |
| RLJ Lodging Trust | | | | 265,964 | 3,348,487 |
| STAG Industrial Incorporated | | | | 193,220 | 8,420,528 |
| Summit Hotel Properties Incorporated † | | | | 522,702 | 4,678,183 |
| | | | | | 86,045,702 |
| Total Common stocks (Cost $424,609,907) | | | | | 595,419,810 |
| | | | Expiration
date | | |
| Warrants: 0.00% | | | | | |
| Energy: 0.00% | | | | | |
| Energy equipment & services: 0.00% | | | | | |
| Parker Drilling Company † | | | 9-16-2024 | 8,457 | 0 |
| Total Warrants (Cost $0) | | | | | 0 |
The accompanying notes are an integral part of these financial statements.
Allspring Small Company Value Portfolio | 27
Portfolio of investments—November 30, 2021
| | | Yield | | Shares | Value |
| Short-term investments: 1.30% | | | | | |
| Investment companies: 1.30% | | | | | |
| Allspring Government Money Market Fund Select Class ♠∞ | | 0.03% | | 6,987,351 | $ 6,987,351 |
| Securities Lending Cash Investments LLC ♠∩∞ | | 0.04 | | 826,529 | 826,529 |
| Total Short-term investments (Cost $7,813,880) | | | | | 7,813,880 |
| Total investments in securities (Cost $432,423,787) | 100.08% | | | | 603,233,690 |
| Other assets and liabilities, net | (0.08) | | | | (466,551) |
| Total net assets | 100.00% | | | | $602,767,139 |
| † | Non-income-earning security |
| « | All or a portion of this security is on loan. |
| ♠ | The issuer of the security is an affiliated person of the Portfolio as defined in the Investment Company Act of 1940. |
| ∩ | The investment is a non-registered investment company purchased with cash collateral received from securities on loan. |
| ∞ | The rate represents the 7-day annualized yield at period end. |
| Abbreviations: |
| REIT | Real estate investment trust |
Investments in affiliates
An affiliated investment is an investment in which the Portfolio owns at least 5% of the outstanding voting shares of the issuer or as a result of other relationships, such as the Portfolio and the issuer having the same adviser or investment manager. Transactions with issuers that were either affiliates of the Portfolio at the beginning of the period or the end of the period were as follows:
| | Value,
beginning of
period | Purchases | Sales
proceeds | Net
realized
gains
(losses) | | Net
change in
unrealized
gains
(losses) | | Value,
end of
period | Shares,
end
of period | Income
from
affiliated
securities |
| Short-term investments | | | | | | | | | |
| Allspring Government Money Market Fund Select Class | $5,823,369 | $37,179,672 | $(36,015,690) | $0 | | $0 | | $ 6,987,351 | 6,987,351 | $ 716 |
| Securities Lending Cash Investments LLC | 1,657,815 | 56,114,366 | (56,945,652) | 0 | | 0 | | 826,529 | 826,529 | 422 # |
| | | | | $0 | | $0 | | $7,813,880 | | $1,138 |
| # | Amount shown represents income before fees and rebates. |
The accompanying notes are an integral part of these financial statements.
28 | Allspring Small Company Value Portfolio
Statement of assets and liabilities—November 30, 2021 (unaudited)
| | |
| Assets | |
Investments in unaffiliated securities (including $810,154 of securities loaned), at value (cost $424,609,907)
| $ 595,419,810 |
Investments in affiliated securities, at value (cost $7,813,880)
| 7,813,880 |
Receivable for dividends
| 671,160 |
Receivable for securities lending income, net
| 3,496 |
Prepaid expenses and other assets
| 70,687 |
Total assets
| 603,979,033 |
| Liabilities | |
Payable upon receipt of securities loaned
| 826,529 |
Advisory fee payable
| 375,695 |
Accrued expenses and other liabilities
| 9,670 |
Total liabilities
| 1,211,894 |
Total net assets
| $602,767,139 |
The accompanying notes are an integral part of these financial statements.
Allspring Small Company Value Portfolio | 29
Statement of operations—six months ended November 30, 2021 (unaudited)
| | |
| Investment income | |
Dividends (net of foreign withholdings taxes of $4,745)
| $ 5,122,978 |
Income from affiliated securities
| 18,460 |
Total investment income
| 5,141,438 |
| Expenses | |
Advisory fee
| 2,439,356 |
Custody and accounting fees
| 26,850 |
Professional fees
| 31,126 |
Interest holder report expenses
| 16,545 |
Trustees’ fees and expenses
| 9,662 |
Other fees and expenses
| 9,597 |
Total expenses
| 2,533,136 |
Less: Fee waivers and/or expense reimbursements
| (263,786) |
Net expenses
| 2,269,350 |
Net investment income
| 2,872,088 |
| Realized and unrealized gains (losses) on investments | |
Net realized gains on investments
| 47,589,144 |
Net change in unrealized gains (losses) on investments
| (49,453,171) |
Net realized and unrealized gains (losses) on investments
| (1,864,027) |
Net increase in net assets resulting from operations
| $ 1,008,061 |
The accompanying notes are an integral part of these financial statements.
30 | Allspring Small Company Value Portfolio
Statement of changes in net assets
| | | |
| | Six months ended
November 30, 2021
(unaudited) | Year ended
May 31, 2021 |
| Operations | | |
Net investment income
| $ 2,872,088 | $ 3,476,701 |
Net realized gains on investments
| 47,589,144 | 37,164,709 |
Net change in unrealized gains (losses) on investments
| (49,453,171) | 242,793,164 |
Net increase in net assets resulting from operations
| 1,008,061 | 283,434,574 |
| Capital transactions | | |
| Transactions in investors’ beneficial interests | | |
Contributions
| 15,809,544 | 44,706,834 |
Withdrawals
| (34,073,132) | (109,788,132) |
Net decrease in net assets resulting from capital transactions
| (18,263,588) | (65,081,298) |
Total increase (decrease) in net assets
| (17,255,527) | 218,353,276 |
| Net assets | | |
Beginning of period
| 620,022,666 | 401,669,390 |
End of period
| $602,767,139 | $ 620,022,666 |
The accompanying notes are an integral part of these financial statements.
Allspring Small Company Value Portfolio | 31
| | | Year ended May 31 |
| | Six months ended
November 30, 2021
(unaudited) | 2021 | 2020 | 2019 | 2018 | 2017 |
Total return1
| 0.23% | 78.76% | (13.74)% | (14.51)% | 20.10% | 19.44% |
| Ratios to average net assets (annualized) | | | | | | |
Gross expenses
| 0.83% | 0.83% | 0.82% | 0.86% | 0.85% | 0.84% |
Net expenses2
| 0.74% | 0.74% | 0.74% | 0.75% | 0.84% | 0.84% |
Net investment income
| 0.94% | 0.71% | 1.15% | 0.80% | 0.87% | 0.72% |
| Supplemental data | | | | | | |
Portfolio turnover rate
| 34% | 62% | 78% | 168% | 144% | 110% |
| 1 | Returns for periods of less than one year are not annualized. |
| 2 | Net expense ratios reflect voluntary waivers. |
The accompanying notes are an integral part of these financial statements.
32 | Allspring Small Company Value Portfolio
Notes to financial statements (unaudited)
1. ORGANIZATION
Allspring Master Trust (the "Trust"), a Delaware statutory trust organized on March 10, 1999, is an open-end management investment company registered under the Investment Company Act of 1940, as amended (the "1940 Act"). As an investment company, the Trust follows the accounting and reporting guidance in Financial Accounting Standards Board ("FASB") Accounting Standards Codification Topic 946, Financial Services – Investment Companies. These financial statements report on the Allspring Small Company Value Portfolio (the "Portfolio") which is a diversified series of the Trust.
Interests in the Portfolio are available solely through private placement transactions that do not involve any "public offering" within the meaning of Section 4(a)(2) of the Securities Act of 1933.
On February 23, 2021, Wells Fargo & Company entered into a definitive agreement to sell Wells Fargo Asset Management ("WFAM") to GTCR LLC and Reverence Capital Partners, L.P. WFAM was the trade name used by the asset management businesses of Wells Fargo & Company and included Wells Fargo Funds Management, LLC, Wells Capital Management, LLC, Wells Fargo Asset Management (International) Limited and Wells Fargo Funds Distributor, LLC. Effective on November 1, 2021, the sale transaction of WFAM by Wells Fargo & Company to GTCR LLC and Reverence Capital Partners, L.P. was closed. In connection with the closing of the transaction, WFAM became known as Allspring Global Investments (“Allspring”) and various entities that provide services to the Portfolio changed their names to "Allspring", including Allspring Funds Management, LLC (formerly Wells Fargo Funds Management, LLC), the adviser to the Portfolio, Allspring Global Investments, Inc. (formerly Wells Capital Management, LLC) and Allspring Global Investments (UK) Limited (formerly Wells Fargo Asset Management (International) Limited), both registered investment advisers providing subadvisory services to certain funds, and Allspring Funds Distributor, LLC (formerly Wells Fargo Funds Distributor, LLC).
Consummation of the transaction resulted in the automatic termination of the Portfolio’s advisory agreement and subadvisory agreement. The Portfolio’s Board of Trustees approved a new advisory agreement and subadvisory agreement which were approved by the Portfolio's interest holders on October 29, 2021. The new agreements became effective on November 1, 2021.
Effective December 6, 2021, "Wells Fargo" was removed from the Portfolio's name and replaced it with "Allspring".
2. SIGNIFICANT ACCOUNTING POLICIES
The following significant accounting policies, which are consistently followed in the preparation of the financial statements of the Portfolio, are in conformity with U.S. generally accepted accounting principles which require management to make estimates and assumptions that affect the reported amounts of assets and liabilities, disclosure of contingent assets and liabilities at the date of the financial statements, and the reported amounts of income and expenses during the reporting period. Actual results could differ from those estimates.
Securities valuation
All investments are valued each business day as of the close of regular trading on the New York Stock Exchange (generally 4 p.m. Eastern Time), although the Portfolio may deviate from this calculation time under unusual or unexpected circumstances.
Equity securities that are listed on a foreign or domestic exchange or market are valued at the official closing price or, if none, the last sales price. If no sale occurs on the principal exchange or market that day, a fair value price will be determined in accordance with the Portfolio’s Valuation Procedures.
Investments in registered open-end investment companies are valued at net asset value. Interests in non-registered investment companies that are redeemable at net asset value are fair valued normally at net asset value.
Investments which are not valued using any of the methods discussed above are valued at their fair value, as determined in good faith by the Board of Trustees. The Board of Trustees has established a Valuation Committee comprised of the Trustees and has delegated to it the authority to take any actions regarding the valuation of portfolio securities that the Valuation Committee deems necessary or appropriate, including determining the fair value of portfolio securities, unless the determination has been delegated to the Allspring Global Investments Pricing Committee at Allspring Funds Management, LLC ("Allspring Funds Management"). The Board of Trustees retains the authority to make or ratify any valuation decisions or approve any changes to the Valuation Procedures as it deems appropriate. On a quarterly basis, the Board of Trustees receives reports on any valuation actions taken by the Valuation Committee or the Allspring Global Investments Pricing Committee which may include items for ratification.
Allspring Small Company Value Portfolio | 33
Notes to financial statements (unaudited)
Securities lending
The Portfolio may lend its securities from time to time in order to earn additional income in the form of fees or interest on securities received as collateral or the investment of any cash received as collateral. When securities are on loan, the Portfolio receives interest or dividends on those securities. Cash collateral received in connection with its securities lending transactions is invested in Securities Lending Cash Investments, LLC (the "Securities Lending Fund"), an affiliated non-registered investment company. Investments in Securities Lending Fund are valued at the evaluated bid price provided by an independent pricing service. Income earned from investment in the Securities Lending Fund (net of fees and rebates), if any, is included in income from affiliated securities on the Statement of Operations.
In a securities lending transaction, the net asset value of the Portfolio is affected by an increase or decrease in the value of the securities loaned and by an increase or decrease in the value of the instrument in which collateral is invested. The amount of securities lending activity undertaken by the Portfolio fluctuates from time to time. The Portfolio has the right under the lending agreement to recover the securities from the borrower on demand. In the event of default or bankruptcy by the borrower, the Portfolio may be prevented from recovering the loaned securities or gaining access to the collateral or may experience delays or costs in doing so. In such an event, the terms of the agreement allow the unaffiliated securities lending agent to use the collateral to purchase replacement securities on behalf of the Portfolio or pay the Portfolio the market value of the loaned securities. The Portfolio bears the risk of loss with respect to depreciation of its investment of the cash collateral.
Security transactions and income recognition
Securities transactions are recorded on a trade date basis. Realized gains or losses are recorded on the basis of identified cost.
Dividend income is recognized on the ex-dividend date. Dividend income is recorded net of foreign taxes withheld where recovery of such taxes is not assured.
Federal and other taxes
The Portfolio is not required to pay federal income taxes on its net investment income and net capital gains as it is treated as a partnership for federal income tax purposes. All income, gains and losses of the Portfolio are deemed to have been “passed through” to the interest holders in proportion to their holdings of the Portfolio regardless of whether income and gains have been distributed by the Portfolio.
The Portfolio’s income tax returns and all financial records supporting those returns for the prior three fiscal years are subject to examination by the federal revenue authority. Management has analyzed the Portfolio’s tax positions taken on federal, state, and foreign tax returns for all open tax years and does not believe that there are any uncertain tax positions that require recognition of a tax liability.
As of November 30, 2021, the aggregate cost of all investments for federal income tax purposes was $444,267,393 and the unrealized gains (losses) consisted of:
| Gross unrealized gains | $179,281,201 |
| Gross unrealized losses | (20,314,904) |
| Net unrealized gains | $158,966,297 |
3. FAIR VALUATION MEASUREMENTS
Fair value measurements of investments are determined within a framework that has established a fair value hierarchy based upon the various data inputs utilized in determining the value of the Portfolio’s investments. The three-level hierarchy gives the highest priority to unadjusted quoted prices in active markets for identical assets or liabilities (Level 1) and the lowest priority to unobservable inputs (Level 3). The Portfolio’s investments are classified within the fair value hierarchy based on the lowest level of input that is significant to the fair value measurement. The inputs are summarized into three broad levels as follows:
| ■ | Level 1 – quoted prices in active markets for identical securities |
| ■ | Level 2 – other significant observable inputs (including quoted prices for similar securities, interest rates, prepayment speeds, credit risk, etc.) |
| ■ | Level 3 – significant unobservable inputs (including the Portfolio’s own assumptions in determining the fair value of investments) |
The inputs or methodologies used for valuing investments in securities are not necessarily an indication of the risk associated with investing in those securities.
34 | Allspring Small Company Value Portfolio
Notes to financial statements (unaudited)
The following is a summary of the inputs used in valuing the Portfolio’s assets and liabilities as of November 30, 2021:
| | Quoted prices
(Level 1) | Other significant
observable inputs
(Level 2) | Significant
unobservable inputs
(Level 3) | Total |
| Assets | | | | |
| Investments in: | | | | |
| Common stocks | | | | |
| Consumer discretionary | $ 66,171,276 | $0 | $0 | $ 66,171,276 |
| Consumer staples | 3,150,877 | 0 | 0 | 3,150,877 |
| Energy | 33,228,445 | 0 | 0 | 33,228,445 |
| Financials | 145,806,646 | 0 | 0 | 145,806,646 |
| Health care | 55,756,876 | 0 | 0 | 55,756,876 |
| Industrials | 105,099,014 | 0 | 0 | 105,099,014 |
| Information technology | 53,289,767 | 0 | 0 | 53,289,767 |
| Materials | 46,871,207 | 0 | 0 | 46,871,207 |
| Real estate | 86,045,702 | 0 | 0 | 86,045,702 |
| Warrants | | | | |
| Energy | 0 | 0 | 0 | 0 |
| Short-term investments | | | | |
| Investment companies | 7,813,880 | 0 | 0 | 7,813,880 |
| Total assets | $603,233,690 | $0 | $0 | $603,233,690 |
Additional sector, industry or geographic detail, if any, is included in the Portfolio of Investments.
For the six months ended November 30, 2021, the Portfolio did not have any transfers into/out of Level 3.
4. TRANSACTIONS WITH AFFILIATES
Advisory fee
The Trust has entered into an advisory contract with Allspring Funds Management, a wholly owned subsidiary of Allspring Global Investments Holdings, LLC, a holding company indirectly owned by certain private funds of GTCR LLC and Reverence Capital Partners, L.P. The adviser is responsible for implementing investment policies and guidelines and for supervising the subadviser, who is responsible for day-to-day portfolio management of the Portfolio. Pursuant to the contract, Allspring Funds Management is entitled to receive an advisory fee at the following annual rate based on the Portfolio’s average daily net assets:
| Average daily net assets | Advisory fee |
| First $500 million | 0.800% |
| Next $500 million | 0.775 |
| Next $1 billion | 0.750 |
| Next $1 billion | 0.725 |
| Next $1 billion | 0.700 |
| Over $4 billion | 0.680 |
For the six months ended November 30, 2021, the advisory fee was equivalent to an annual rate of 0.80% of the Portfolio’s average daily net assets.
Allspring Funds Management has retained the services of a subadviser to provide daily portfolio management to the Portfolio. The fee for subadvisory services is borne by Allspring Funds Management. Allspring Global Investments, LLC ("Allspring Investments"), an affiliate of Allspring Funds Management and a wholly owned subsidiary of Allspring Global Investments Holdings, LLC, is the subadviser to the Portfolio and is entitled to receive a fee from Allspring Funds Management at an annual rate starting at 0.55% and declining to 0.40% as the average daily net assets of the Portfolio increase.
Allspring Funds Management has voluntarily waived and/or reimbursed advisory fees to reduce the net operating expense ratio of the Portfolio. These voluntary waivers may be discontinued at any time.
Allspring Small Company Value Portfolio | 35
Notes to financial statements (unaudited)
Interfund transactions
The Portfolio may purchase or sell portfolio investment securities to certain affiliates pursuant to Rule 17a-7 under the 1940 Act and under procedures adopted by the Board of Trustees. The procedures have been designed to ensure that these interfund transactions, which do not incur broker commissions, are effected at current market prices.
5. INVESTMENT PORTFOLIO TRANSACTIONS
Purchases and sales of investments, excluding U.S. government obligations (if any) and short-term securities, for the six months ended November 30, 2021 were $203,923,315 and $220,463,861, respectively.
6. SECURITIES LENDING TRANSACTIONS
The Portfolio lends its securities through an unaffiliated securities lending agent and receives collateral in the form of cash or securities with a value at least equal to the value of the securities on loan. The value of the loaned securities is determined at the close of each business day and any increases or decreases in the required collateral are exchanged between the Portfolio and the counterparty on the next business day. Cash collateral received is invested in the Securities Lending Fund which seeks to provide a positive return compared to the daily Federal Funds Open Rate by investing in high-quality, U.S. dollar-denominated short-term money market instruments and is exempt from registration under Section 3(c)(7) of the 1940 Act. Securities Lending Fund is managed by Allspring Funds Management and is subadvised by Allspring Investments. Allspring Funds Management receives an advisory fee starting at 0.05% and declining to 0.01% as the average daily net assets of the Securities Lending Fund increase. All of the fees received by Allspring Funds Management are paid to Allspring Investments for its services as subadviser.
In the event of counterparty default or the failure of a borrower to return a loaned security, the Portfolio has the right to use the collateral to offset any losses incurred. As of November 30, 2021, the Portfolio had securities lending transactions with the following counterparties which are subject to offset:
| Counterparty | Value of
securities on
loan | Collateral
received1 | Net amount |
| National Financial Services LLC | $810,154 | $(810,154) | $0 |
1 Collateral received within this table is limited to the collateral for the net transaction with the counterparty.
7. BANK BORROWINGS
The Trust, along with Allspring Variable Trust and Allspring Funds Trust (excluding the money market funds), are parties to a $350,000,000 revolving credit agreement whereby the Portfolio is permitted to use bank borrowings for temporary or emergency purposes, such as to fund interest holders withdrawal requests. Interest under the credit agreement is charged to the Portfolio based on a borrowing rate equal to the higher of the Federal Funds rate in effect on that day plus 1.25% or the overnight bank funding rate in effect on that day plus 1.25%. In addition, an annual commitment fee equal to 0.25% of the unused balance is allocated to each participating fund.
For the six months ended November 30, 2021, there were no borrowings by the Portfolio under the agreement.
8. INDEMNIFICATION
Under the Portfolio's organizational documents, the officers and Trustees have been granted certain indemnification rights against certain liabilities that may arise out of performance of their duties to the Portfolio. The Portfolio has entered into a separate agreement with each Trustee that converts indemnification rights currently existing under the Portfolio’s organizational documents into contractual rights that cannot be changed in the future without the consent of the Trustee. Additionally, in the normal course of business, the Portfolio may enter into contracts with service providers that contain a variety of indemnification clauses. The Portfolio’s maximum exposure under these arrangements is dependent on future claims that may be made against the Portfolio and, therefore, cannot be estimated.
9. CORONAVIRUS (COVID-19) PANDEMIC
On March 11, 2020, the World Health Organization announced that it had made the assessment that coronavirus disease 2019 (“COVID-19”) is a pandemic. The impacts of COVID-19 are affecting the entire global economy, individual companies and investment products, the funds, and the market in general. There is significant uncertainty around the extent and duration of
36 | Allspring Small Company Value Portfolio
Notes to financial statements (unaudited)
business disruptions related to COVID-19 and the impacts may last for an extended period of time. COVID-19 has led to significant uncertainty and volatility in the financial markets.
Allspring Small Company Value Portfolio | 37
Other information (unaudited)
PROXY VOTING INFORMATION
A description of the policies and procedures used to determine how to vote proxies relating to portfolio securities is available without charge, upon request, by calling 1-800-222-8222, visiting our website at allspringglobal.com, or visiting the SEC website at sec.gov. Information regarding how the proxies related to portfolio securities were voted during the most recent 12-month period ended June 30 is available on the website at allspringglobal.com or by visiting the SEC website at sec.gov.
SPECIAL MEETING OF SHAREHOLDERS
On October 29, 2021, a Special Meeting of Shareholders for Allspring Small Company Value Fund was held to consider the following proposals. The results of the proposals are indicated below.
Proposal 1 – To consider and approve a new investment management agreement with Wells Fargo Funds Management, LLC*.
| Shares voted “For” | | 4,908,036 |
| Shares voted “Against” | | 660,279 |
| Shares voted “Abstain” | | 1,372,226 |
| Shares voted “Uninstructed” | | 243,892 |
Proposal 2 – To consider and approve a new advisory agreement with Wells Fargo Funds Management, LLC* for Allspring Small Company Value Portfolio in which the Fund invests substantially all of its assets.
| Shares voted “For” | | 4,893,380 |
| Shares voted “Against” | | 678,697 |
| Shares voted “Abstain” | | 1,368,464 |
| Shares voted “Uninstructed” | | 243,892 |
Proposal 3 – To consider and approve a new subadvisory agreement with Wells Capital Management, LLC** for Allspring Small Company Value Portfolio.
| Shares voted “For” | | 4,872,860 |
| Shares voted “Against” | | 699,122 |
| Shares voted “Abstain” | | 1,368,559 |
| Shares voted “Uninstructed” | | 243,892 |
QUARTERLY PORTFOLIO HOLDINGS INFORMATION
The Fund and Portfolio file their complete schedule of portfolio holdings with the SEC for the first and third quarters of each fiscal year as an exhibit to their reports on Form N-PORT. Shareholders and Interest holders may view the filed Form N-PORT by visiting the SEC website at sec.gov.
38 | Allspring Small Company Value Fund
Other information (unaudited)
BOARD OF TRUSTEES AND OFFICERS
Each of the Trustees and Officers listed in the table below acts in identical capacities for each fund in the Allspring family of funds, which consists of 139 mutual funds comprising the Allspring Funds Trust, Allspring Variable Trust, Allspring Master Trust and four closed-end funds (collectively the “Fund Complex”). This table should be read in conjunction with the Prospectus and the Statement of Additional Information1. The mailing address of each Trustee and Officer is 525 Market Street, 12th Floor, San Francisco, CA 94105. Each Trustee and Officer serves an indefinite term, however, each Trustee serves such term until reaching the mandatory retirement age established by the Trustees.
Independent Trustees
Name and
year of birth | Position held and
length of service* | Principal occupations during past five years or longer | Current other
public company or
investment
company
directorships |
William R. Ebsworth
(Born 1957) | Trustee,
since 2015 | Retired. From 1984 to 2013, equities analyst, portfolio manager, research director and chief investment officer at Fidelity Management and Research Company in Boston, Tokyo, and Hong Kong, and retired in 2013 as Chief Investment Officer of Fidelity Strategic Advisers, Inc. where he led a team of investment professionals managing client assets. Prior thereto, Board member of Hong Kong Securities Clearing Co., Hong Kong Options Clearing Corp., the Thailand International Fund, Ltd., Fidelity Investments Life Insurance Company, and Empire Fidelity Investments Life Insurance Company. Audit Committee Chair and Investment Committee Chair of the Vincent Memorial Hospital Endowment (non-profit organization). Mr. Ebsworth is a CFA® charterholder. | N/A |
Jane A. Freeman
(Born 1953) | Trustee,
since 2015;
Chair Liaison,
since 2018 | Retired. From 2012 to 2014 and 1999 to 2008, Chief Financial Officer of Scientific Learning Corporation. From 2008 to 2012, Ms. Freeman provided consulting services related to strategic business projects. Prior to 1999, Portfolio Manager at Rockefeller & Co. and Scudder, Stevens & Clark. Board member of the Harding Loevner Funds from 1996 to 2014, serving as both Lead Independent Director and chair of the Audit Committee. Board member of the Russell Exchange Traded Funds Trust from 2011 to 2012 and the chair of the Audit Committee. Ms. Freeman is also an inactive Chartered Financial Analyst. | N/A |
Isaiah Harris, Jr.
(Born 1952) | Trustee,
since 2009; Audit
Committee
Chair,
since 2019 | Retired. Chairman of the Board of CIGNA Corporation from 2009 to 2021, and Director from 2005 to 2008. From 2003 to 2011, Director of Deluxe Corporation. Prior thereto, President and CEO of BellSouth Advertising and Publishing Corp. from 2005 to 2007, President and CEO of BellSouth Enterprises from 2004 to 2005 and President of BellSouth Consumer Services from 2000 to 2003. Emeritus member of the Iowa State University Foundation Board of Governors. Emeritus Member of the Advisory Board of Iowa State University School of Business. Advisory Board Member, Palm Harbor Academy (private school). Advisory Board Member, Fellowship of Christian Athletes. Mr. Harris is a certified public accountant (inactive status). | N/A |
Judith M. Johnson**
(Born 1949) | Trustee,
since 2008 | Retired. Prior thereto, Chief Executive Officer and Chief Investment Officer of Minneapolis Employees Retirement Fund from 1996 to 2008. Ms. Johnson is an attorney, certified public accountant and a certified managerial accountant. | N/A |
David F. Larcker
(Born 1950) | Trustee,
since 2009 | James Irvin Miller Professor of Accounting at the Graduate School of Business (Emeritus), Stanford University, Director of the Corporate Governance Research Initiative and Senior Faculty of The Rock Center for Corporate Governance since 2006. From 2005 to 2008, Professor of Accounting at the Graduate School of Business, Stanford University. Prior thereto, Ernst & Young Professor of Accounting at The Wharton School, University of Pennsylvania from 1985 to 2005. | N/A |
Allspring Small Company Value Fund | 39
Other information (unaudited)
Name and
year of birth | Position held and
length of service* | Principal occupations during past five years or longer | Current other
public company or
investment
company
directorships |
Olivia S. Mitchell
(Born 1953) | Trustee,
since 2006;
Nominating and
Governance
Committee Chair,
since 2018 | International Foundation of Employee Benefit Plans Professor since 1993, Wharton School of the University of Pennsylvania. Director of Wharton’s Pension Research Council and Boettner Center on Pensions & Retirement Research, and Research Associate at the National Bureau of Economic Research. Previously taught at Cornell University from 1978 to 1993. | N/A |
Timothy J. Penny
(Born 1951) | Trustee,
since 1996;
Chair,
since 2018 | President and Chief Executive Officer of Southern Minnesota Initiative Foundation, a non-profit organization, since 2007. Member of the Board of Trustees of NorthStar Education Finance, Inc., a non-profit organization, since 2007. | N/A |
James G. Polisson
(Born 1959) | Trustee,
since 2018 | Retired. Chief Marketing Officer, Source (ETF) UK Services, Ltd, from 2015 to 2017. From 2012 to 2015, Principal of The Polisson Group, LLC, a management consulting, corporate advisory and principal investing company. Chief Executive Officer and Managing Director at Russell Investments, Global Exchange Traded Funds from 2010 to 2012. Managing Director of Barclays Global Investors from 1998 to 2010 and Global Chief Marketing Officer for iShares and Barclays Global Investors from 2000 to 2010. Trustee of the San Francisco Mechanics’ Institute, a non-profit organization, from 2013 to 2015. Board member of the Russell Exchange Traded Fund Trust from 2011 to 2012. Director of Barclays Global Investors Holdings Deutschland GmbH from 2006 to 2009. Mr. Polisson is an attorney and has a retired status with the Massachusetts and District of Columbia Bar Associations. | N/A |
Pamela Wheelock
(Born 1959) | Trustee,
since January
2020; previously
Trustee from
January 2018 to
July 2019 | Board member of the Destination Medical Center Economic Development Agency, Rochester, Minnesota since 2019. Interim President of the McKnight Foundation from January to September 2020. McKnight Foundation Consultant, November 2020 to February 2021. Acting Commissioner, Minnesota Department of Human Services, July 2019 through September 2019. Consultant (part-time), Minnesota Department of Human Services, October 2019 through December 2019. Chief Operating Officer, Twin Cities Habitat for Humanity from 2017 to 2019. Vice President of University Services, University of Minnesota from 2012 to 2016. Prior thereto, on the Board of Directors, Governance Committee and Finance Committee for the Minnesota Philanthropy Partners (Saint Paul Foundation) from 2012 to 2018, Interim Chief Executive Officer of Blue Cross Blue Shield of Minnesota from 2011 to 2012, Chairman of the Board from 2009 to 2012 and Board Director from 2003 to 2015. Vice President, Leadership and Community Engagement, Bush Foundation, Saint Paul, Minnesota (a private foundation) from 2009 to 2011. Executive Vice President and Chief Financial Officer, Minnesota Sports and Entertainment from 2004 to 2009 and Senior Vice President from 2002 to 2004. Executive Vice President of the Minnesota Wild Foundation from 2004 to 2008. Commissioner of Finance, State of Minnesota, from 1999 to 2002. Currently Board Chair of the Minnesota Wild Foundation since 2010. | N/A |
* Length of service dates reflect the Trustee’s commencement of service with the Trust’s predecessor entities, where applicable.
** Ms. Johnson has resigned from the Board effective December 31, 2021.
40 | Allspring Small Company Value Fund
Other information (unaudited)
Officers2
Name and
year of birth | Position held and
length of service | Principal occupations during past five years or longer |
Andrew Owen
(Born 1960) | President,
since 2017 | President, Chief Executive Officer and Director of Allspring Funds Management, LLC since 2017 and co-president of Galliard Capital Management, LLC, an affiliate of Allspring Funds Management, LLC, since 2019. Prior thereto, Head of Affiliated Managers, Allspring Global Investments, from 2014 to 2019 and Executive Vice President responsible for marketing, investments and product development for Allspring Funds Management, LLC, from 2009 to 2014. In addition, Mr. Owen was an Executive Vice President of Wells Fargo & Company from 2014 to 2021. |
Jeremy DePalma
(Born 1974) | Treasurer,
since 2012
(for certain funds in
the Fund Complex);
since 2021 (for
the remaining funds in the
Fund Complex) | Senior Vice President of Allspring Funds Management, LLC since 2009. Senior Vice President of Evergreen Investment Management Company, LLC from 2008 to 2010 and head of the Fund Reporting and Control Team within Fund Administration. |
Kate McKinley
(Born 1977) | Chief Legal Officer,
since 2021 | Chief Legal Officer of Allspring Global Investments since 2021. Prior thereto, held various roles at State Street Global Advisors beginning in 2010, including serving as Senior Vice President and General Counsel from 2019 to 2021, and Chief Operating Officer of the Institutional Client Group from 2016 - 2019. Prior to working at State Street Global Advisors served as Assistant General Counsel for Bank of America Corporation from 2005 to 2010 and as an Associate at WilmerHale from 2002 to 2005. |
Christopher Baker
(Born 1976) | Chief Compliance Officer, since 2022 | Global Chief Compliance Officer for Allspring Global Investments since 2022. Prior thereto, Chief Compliance Officer for State Street Global Advisors from 2018 to 2021. Senior Compliance Officer for the State Street divisions of Alternative Investment Solutions, Sector Solutions, and Global Marketing from 2015 to 2018. From 2010 to 2015 Vice President, Global Head of Investment and Marketing Compliance for State Street Global Advisors. |
Matthew Prasse
(Born 1983) | Secretary,
since 2021 | Senior Counsel of the Allspring Legal Department since 2021. Senior Counsel of the Wells Fargo Legal Department from 2018 to 2021. Previously, Counsel for Barings LLC from 2015 to 2018. Prior to joining Barings, Associate at Morgan, Lewis & Bockius LLP from 2008 to 2015. |
1 The Statement of Additional Information includes additional information about the Trustees and is available, without charge, upon request, by calling 1-800-222-8222 or by visiting the website at allspringglobal.com.
2 For those Officers with tenures at Allspring Global Investments and/or Allspring Funds Management, LLC that began prior to 2021, such tenures include years of service during which these businesses/entities were known as Wells Fargo Asset Management and Wells Fargo Funds Management, LLC, respectively.
Allspring Small Company Value Fund | 41
For more information
More information about Allspring Funds is available free upon request. To obtain literature, please write, visit the Fund's website, or call:
Allspring Funds
P.O. Box 219967
Kansas City, MO 64121-9967
Website: allspringglobal.com
Individual investors: 1-800-222-8222
Retail investment professionals: 1-888-877-9275
Institutional investment professionals: 1-866-765-0778
This report and the financial statements contained herein are submitted for the general information of the shareholders of the Fund. If this report is used for promotional purposes, distribution of the report must be accompanied or preceded by a current prospectus. Before investing, please consider the investment objectives, risks, charges, and expenses of the investment. For a current prospectus and, if available, a summary prospectus, containing this information, call
1-800-222-8222 or visit the Fund's website at allspringglobal.com. Read the prospectus carefully before you invest or send money.
Allspring Global InvestmentsTM is the trade name for the asset management firms of Allspring Global Investments Holdings, LLC, a holding company indirectly owned by certain private funds of GTCR LLC and Reverence Capital Partners, L.P. These firms include but are not limited to Allspring Global Investments, LLC, and Allspring Funds Management, LLC. Certain products managed by Allspring entities are distributed by Allspring Funds Distributor, LLC (a broker-dealer and Member FINRA/SIPC).
This material is for general informational and educational purposes only and is NOT intended to provide investment advice or a recommendation of any kind - including a recommendation for any specific investment, strategy, or plan.
© 2022 Allspring Global Investments Holdings, LLC. All rights reserved.
PAR-1221-00198 01-22
SA286/SAR286 11-21
Semi-Annual Report
November 30, 2021
Allspring Diversified Large Cap
Growth Portfolio
Allspring Diversified Large Cap Growth Portfolio | 1
Portfolio information (unaudited)
| Investment objective | The Portfolio seeks long-term capital appreciation. |
| Manager | Allspring Funds Management, LLC |
| Subadviser | Allspring Global Investments, LLC |
| Portfolio managers | John R. Campbell, CFA®‡, Joseph M. Eberhardy, CFA®‡, CPA, Vince Fioramonti, CFA®‡, Thomas C. Ognar, CFA®‡ |
| Ten largest holdings (%) as of November 30, 20211 |
| Microsoft Corporation | 9.35 |
| Amazon.com Incorporated | 6.19 |
| Alphabet Incorporated Class A | 4.33 |
| Apple Incorporated | 3.91 |
| Alphabet Incorporated Class C | 2.64 |
| MasterCard Incorporated Class A | 2.19 |
| Linde plc | 1.74 |
| NVIDIA Corporation | 1.51 |
| ServiceNow Incorporated | 1.48 |
| Facebook Incorporated Class A | 1.34 |
| 1 | Figures represent the percentage of the Portfolio's net assets. Holdings are subject to change and may have changed since the date specified. |
| Sector allocation as of November 30, 20211 |
| 1 | Figures represent the percentage of the Portfolio's long-term investments. These amounts are subject to change and may have changed since the date specified. |
| ‡ | CFA® and Chartered Financial Analyst® are trademarks owned by CFA Institute. |
2 | Allspring Diversified Large Cap Growth Portfolio
Portfolio of investments—November 30, 2021 (unaudited)
| | | | | Shares | Value |
| Common stocks: 99.09% | | | | | |
| Communication services: 10.51% | | | | | |
| Entertainment: 0.83% | | | | | |
| Activision Blizzard Incorporated | | | | 16,967 | $ 994,266 |
| Live Nation Entertainment Incorporated † | | | | 9,735 | 1,038,238 |
| Roku Incorporated † | | | | 400 | 91,044 |
| | | | | | 2,123,548 |
| Interactive media & services: 9.38% | | | | | |
| Alphabet Incorporated Class A † | | | | 3,885 | 11,025,436 |
| Alphabet Incorporated Class C † | | | | 2,359 | 6,720,886 |
| Bumble Incorporated Class A † | | | | 4,835 | 165,647 |
| Facebook Incorporated Class A † | | | | 10,509 | 3,409,750 |
| Snap Incorporated Class A † | | | | 37,741 | 1,796,849 |
| ZoomInfo Technologies Incorporated † | | | | 12,563 | 775,137 |
| | | | | | 23,893,705 |
| Media: 0.30% | | | | | |
| Discovery Incorporated Class A †« | | | | 32,711 | 761,185 |
| Consumer discretionary: 16.97% | | | | | |
| Auto components: 0.67% | | | | | |
| Aptiv plc † | | | | 4,120 | 660,642 |
| Lear Corporation | | | | 6,265 | 1,051,204 |
| | | | | | 1,711,846 |
| Hotels, restaurants & leisure: 1.67% | | | | | |
| Airbnb Incorporated Class A † | | | | 13,772 | 2,376,221 |
| Chipotle Mexican Grill Incorporated † | | | | 1,144 | 1,880,061 |
| | | | | | 4,256,282 |
| Household durables: 0.96% | | | | | |
| PulteGroup Incorporated | | | | 25,223 | 1,261,907 |
| Whirlpool Corporation | | | | 5,431 | 1,182,546 |
| | | | | | 2,444,453 |
| Internet & direct marketing retail: 6.57% | | | | | |
| Amazon.com Incorporated † | | | | 4,500 | 15,781,815 |
| MercadoLibre Incorporated † | | | | 810 | 962,612 |
| | | | | | 16,744,427 |
| Leisure products: 0.70% | | | | | |
| The Brunswick Corporation | | | | 12,183 | 1,144,106 |
| YETI Holdings Incorporated † | | | | 6,910 | 636,826 |
| | | | | | 1,780,932 |
| Multiline retail: 0.59% | | | | | |
| Target Corporation | | | | 6,164 | 1,503,030 |
| Specialty retail: 3.59% | | | | | |
| Five Below Incorporated † | | | | 2,355 | 479,101 |
| Floor & Decor Holdings Incorporated Class A † | | | | 13,781 | 1,776,509 |
| O'Reilly Automotive Incorporated † | | | | 2,328 | 1,485,636 |
| Petco Health & Wellness Company † | | | | 8,150 | 156,236 |
The accompanying notes are an integral part of these financial statements.
Allspring Diversified Large Cap Growth Portfolio | 3
Portfolio of investments—November 30, 2021 (unaudited)
| | | | | Shares | Value |
| Specialty retail (continued) | | | | | |
| RH † | | | | 1,680 | $ 979,742 |
| The Home Depot Incorporated | | | | 5,303 | 2,124,435 |
| The TJX Companies Incorporated | | | | 30,751 | 2,134,119 |
| | | | | | 9,135,778 |
| Textiles, apparel & luxury goods: 2.22% | | | | | |
| Crocs Incorporated † | | | | 3,560 | 583,911 |
| Deckers Outdoor Corporation † | | | | 3,480 | 1,410,792 |
| lululemon athletica Incorporated † | | | | 5,909 | 2,685,109 |
| Nike Incorporated Class B | | | | 5,716 | 967,376 |
| | | | | | 5,647,188 |
| Consumer staples: 1.00% | | | | | |
| Food & staples retailing: 0.74% | | | | | |
| Costco Wholesale Corporation | | | | 3,498 | 1,886,751 |
| Personal products: 0.26% | | | | | |
| The Estee Lauder Companies Incorporated Class A | | | | 1,962 | 651,521 |
| Energy: 1.06% | | | | | |
| Oil, gas & consumable fuels: 1.06% | | | | | |
| Chevron Corporation | | | | 9,166 | 1,034,566 |
| ConocoPhillips | | | | 23,683 | 1,660,889 |
| | | | | | 2,695,455 |
| Financials: 8.25% | | | | | |
| Banks: 1.76% | | | | | |
| Citigroup Incorporated | | | | 20,892 | 1,330,820 |
| Citizens Financial Group Incorporated | | | | 29,529 | 1,395,836 |
| JPMorgan Chase & Company | | | | 11,005 | 1,747,924 |
| | | | | | 4,474,580 |
| Capital markets: 5.89% | | | | | |
| BlackRock Incorporated | | | | 1,777 | 1,607,492 |
| Evercore Partners Incorporated Class A | | | | 11,178 | 1,550,389 |
| LPL Financial Holdings Incorporated | | | | 9,100 | 1,434,251 |
| MarketAxess Holdings Incorporated | | | | 7,049 | 2,486,112 |
| MSCI Incorporated | | | | 2,300 | 1,447,735 |
| The Charles Schwab Corporation | | | | 28,177 | 2,180,618 |
| The Goldman Sachs Group Incorporated | | | | 4,073 | 1,551,772 |
| Tradeweb Markets Incorporated Class A | | | | 28,673 | 2,752,608 |
| | | | | | 15,010,977 |
| Insurance: 0.60% | | | | | |
| Fidelity National Financial Incorporated | | | | 31,398 | 1,535,676 |
| Health care: 13.19% | | | | | |
| Biotechnology: 2.82% | | | | | |
| AbbVie Incorporated | | | | 8,508 | 980,803 |
| Alnylam Pharmaceuticals Incorporated † | | | | 1,311 | 240,962 |
| Biohaven Pharmaceutical Holding Company † | | | | 5,725 | 642,574 |
| Horizon Therapeutics plc † | | | | 15,374 | 1,595,206 |
| Natera Incorporated † | | | | 9,475 | 866,584 |
The accompanying notes are an integral part of these financial statements.
4 | Allspring Diversified Large Cap Growth Portfolio
Portfolio of investments—November 30, 2021 (unaudited)
| | | | | Shares | Value |
| Biotechnology (continued) | | | | | |
| Regeneron Pharmaceuticals Incorporated † | | | | 1,908 | $ 1,214,499 |
| Seagen Incorporated † | | | | 1,974 | 315,840 |
| United Therapeutics Corporation † | | | | 7,061 | 1,338,060 |
| | | | | | 7,194,528 |
| Health care equipment & supplies: 3.82% | | | | | |
| Abbott Laboratories | | | | 13,240 | 1,665,195 |
| Boston Scientific Corporation † | | | | 26,979 | 1,027,091 |
| Edwards Lifesciences Corporation † | | | | 22,022 | 2,363,181 |
| Hologic Incorporated † | | | | 14,528 | 1,085,677 |
| IDEXX Laboratories Incorporated † | | | | 1,190 | 723,603 |
| Insulet Corporation † | | | | 5,905 | 1,703,238 |
| Intuitive Surgical Incorporated † | | | | 675 | 218,930 |
| Stryker Corporation | | | | 4,013 | 949,596 |
| | | | | | 9,736,511 |
| Health care providers & services: 1.66% | | | | | |
| Anthem Incorporated | | | | 3,467 | 1,408,399 |
| CVS Health Corporation | | | | 15,384 | 1,370,099 |
| Laboratory Corporation of America Holdings † | | | | 5,101 | 1,455,468 |
| | | | | | 4,233,966 |
| Health care technology: 0.54% | | | | | |
| Veeva Systems Incorporated Class A † | | | | 4,835 | 1,366,274 |
| Life sciences tools & services: 2.13% | | | | | |
| Agilent Technologies Incorporated | | | | 7,308 | 1,102,777 |
| Bio-Techne Corporation | | | | 2,390 | 1,128,152 |
| Danaher Corporation | | | | 4,701 | 1,512,030 |
| Maravai LifeSciences Holdings Class A † | | | | 5,960 | 273,802 |
| Repligen Corporation † | | | | 4,915 | 1,408,148 |
| | | | | | 5,424,909 |
| Pharmaceuticals: 2.22% | | | | | |
| Bristol-Myers Squibb Company | | | | 15,988 | 857,436 |
| Pfizer Incorporated | | | | 31,436 | 1,689,056 |
| Zoetis Incorporated | | | | 13,979 | 3,103,897 |
| | | | | | 5,650,389 |
| Industrials: 6.90% | | | | | |
| Aerospace & defense: 0.28% | | | | | |
| HEICO Corporation | | | | 5,100 | 706,452 |
| Air freight & logistics: 0.53% | | | | | |
| United Parcel Service Incorporated Class B | | | | 6,850 | 1,358,835 |
| Building products: 1.85% | | | | | |
| Advanced Drainage Systems Incorporated | | | | 6,785 | 839,372 |
| Johnson Controls International plc | | | | 23,348 | 1,745,496 |
| Masco Corporation | | | | 21,447 | 1,413,357 |
| The AZEK Company Incorporated † | | | | 18,618 | 730,198 |
| | | | | | 4,728,423 |
| Commercial services & supplies: 0.78% | | | | | |
| Copart Incorporated † | | | | 13,682 | 1,986,079 |
The accompanying notes are an integral part of these financial statements.
Allspring Diversified Large Cap Growth Portfolio | 5
Portfolio of investments—November 30, 2021 (unaudited)
| | | | | Shares | Value |
| Construction & engineering: 0.56% | | | | | |
| EMCOR Group Incorporated | | | | 11,923 | $ 1,422,891 |
| Electrical equipment: 1.02% | | | | | |
| Generac Holdings Incorporated † | | | | 6,163 | 2,596,102 |
| Machinery: 0.44% | | | | | |
| Cummins Incorporated | | | | 5,333 | 1,118,597 |
| Road & rail: 1.44% | | | | | |
| J.B. Hunt Transport Services Incorporated | | | | 8,257 | 1,578,408 |
| Norfolk Southern Corporation | | | | 5,343 | 1,417,338 |
| TFI International Incorporated | | | | 6,555 | 666,971 |
| | | | | | 3,662,717 |
| Information technology: 37.68% | | | | | |
| Electronic equipment, instruments & components: 1.09% | | | | | |
| CDW Corporation of Delaware | | | | 7,108 | 1,345,971 |
| Zebra Technologies Corporation Class A † | | | | 2,407 | 1,417,193 |
| | | | | | 2,763,164 |
| IT services: 7.24% | | | | | |
| Cloudflare Incorporated Class A † | | | | 8,962 | 1,687,007 |
| Cognizant Technology Solutions Corporation Class A | | | | 15,119 | 1,178,980 |
| MasterCard Incorporated Class A | | | | 17,726 | 5,582,271 |
| MongoDB Incorporated † | | | | 5,270 | 2,624,987 |
| PayPal Holdings Incorporated † | | | | 4,512 | 834,224 |
| Shopify Incorporated Class A † | | | | 950 | 1,445,701 |
| Snowflake Incorporated Class A † | | | | 1,524 | 518,389 |
| Square Incorporated Class A † | | | | 13,631 | 2,839,746 |
| Twilio Incorporated Class A † | | | | 4,320 | 1,236,168 |
| Visa Incorporated Class A | | | | 2,508 | 485,975 |
| | | | | | 18,433,448 |
| Semiconductors & semiconductor equipment: 7.47% | | | | | |
| Allegro MicroSystems Incorporated † | | | | 18,379 | 573,976 |
| Applied Materials Incorporated | | | | 12,257 | 1,804,108 |
| ASML Holding NV | | | | 1,544 | 1,222,091 |
| Enphase Energy Incorporated † | | | | 6,380 | 1,595,000 |
| Intel Corporation | | | | 20,775 | 1,022,130 |
| Microchip Technology Incorporated | | | | 40,690 | 3,394,767 |
| Monolithic Power Systems Incorporated | | | | 3,390 | 1,876,229 |
| NVIDIA Corporation | | | | 11,805 | 3,857,402 |
| NXP Semiconductors NV | | | | 5,205 | 1,162,589 |
| Qorvo Incorporated † | | | | 8,431 | 1,232,865 |
| Qualcomm Incorporated | | | | 4,965 | 896,480 |
| Wolfspeed Incorporated † | | | | 3,280 | 402,194 |
| | | | | | 19,039,831 |
| Software: 17.97% | | | | | |
| Adobe Incorporated † | | | | 3,065 | 2,053,090 |
| Atlassian Corporation plc Class A † | | | | 2,585 | 972,787 |
| Avalara Incorporated † | | | | 4,920 | 687,226 |
| Bill.com Holdings Incorporated † | | | | 2,180 | 612,253 |
| Crowdstrike Holdings Incorporated Class A † | | | | 4,332 | 940,650 |
| Dynatrace Incorporated † | | | | 43,905 | 2,759,429 |
The accompanying notes are an integral part of these financial statements.
6 | Allspring Diversified Large Cap Growth Portfolio
Portfolio of investments—November 30, 2021 (unaudited)
| | | | | Shares | Value |
| Software (continued) | | | | | |
| Elastic NV † | | | | 6,661 | $ 1,035,519 |
| Five9 Incorporated † | | | | 2,240 | 318,819 |
| Fortinet Incorporated † | | | | 5,052 | 1,677,820 |
| HubSpot Incorporated † | | | | 2,204 | 1,778,430 |
| Microsoft Corporation | | | | 72,027 | 23,811,406 |
| Oracle Corporation | | | | 16,009 | 1,452,657 |
| Procore Technologies Incorporated † | | | | 487 | 41,278 |
| RingCentral Incorporated Class A † | | | | 2,314 | 499,778 |
| ServiceNow Incorporated † | | | | 5,825 | 3,772,853 |
| Unity Software Incorporated † | | | | 12,898 | 2,223,486 |
| Workday Incorporated Class A † | | | | 2,435 | 667,750 |
| Zendesk Incorporated † | | | | 4,705 | 480,428 |
| | | | | | 45,785,659 |
| Technology hardware, storage & peripherals: 3.91% | | | | | |
| Apple Incorporated | | | | 60,207 | 9,952,217 |
| Materials: 2.92% | | | | | |
| Chemicals: 1.74% | | | | | |
| Linde plc | | | | 13,957 | 4,440,280 |
| Metals & mining: 1.18% | | | | | |
| Nucor Corporation | | | | 14,886 | 1,581,786 |
| Reliance Steel & Aluminum Company | | | | 9,486 | 1,409,904 |
| | | | | | 2,991,690 |
| Real estate: 0.61% | | | | | |
| Equity REITs: 0.61% | | | | | |
| Weyerhaeuser Company | | | | 41,653 | 1,566,569 |
| Total Common stocks (Cost $135,283,186) | | | | | 252,416,865 |
| | | Yield | | | |
| Short-term investments: 1.09% | | | | | |
| Investment companies: 1.09% | | | | | |
| Allspring Government Money Market Fund Select Class ♠∞ | | 0.03% | | 1,960,965 | 1,960,965 |
| Securities Lending Cash Investments LLC ♠∩∞ | | 0.04 | | 811,595 | 811,595 |
| Total Short-term investments (Cost $2,772,560) | | | | | 2,772,560 |
| Total investments in securities (Cost $138,055,746) | 100.18% | | | | 255,189,425 |
| Other assets and liabilities, net | (0.18) | | | | (466,669) |
| Total net assets | 100.00% | | | | $254,722,756 |
| † | Non-income-earning security |
| « | All or a portion of this security is on loan. |
| ♠ | The issuer of the security is an affiliated person of the Portfolio as defined in the Investment Company Act of 1940. |
| ∩ | The investment is a non-registered investment company purchased with cash collateral received from securities on loan. |
| ∞ | The rate represents the 7-day annualized yield at period end. |
| Abbreviations: |
| REIT | Real estate investment trust |
The accompanying notes are an integral part of these financial statements.
Allspring Diversified Large Cap Growth Portfolio | 7
Portfolio of investments—November 30, 2021 (unaudited)
Investments in affiliates
An affiliated investment is an investment in which the Portfolio owns at least 5% of the outstanding voting shares of the issuer or as a result of other relationships, such as the Portfolio and the issuer having the same adviser or investment manager. Transactions with issuers that were either affiliates of the Portfolio at the beginning of the period or the end of the period were as follows:
| | Value,
beginning of
period | Purchases | Sales
proceeds | Net
realized
gains
(losses) | | Net
change in
unrealized
gains
(losses) | | Value,
end of
period | Shares,
end
of period | Income
from
affiliated
securities |
| Short-term investments | | | | | | | | | |
| Allspring Government Money Market Fund Select Class | $1,367,980 | $27,646,495 | $(27,053,510) | $0 | | $0 | | $ 1,960,965 | 1,960,965 | $235 |
| Securities Lending Cash Investments LLC | 1,198,950 | 4,165,465 | (4,552,820) | 0 | | 0 | | 811,595 | 811,595 | 136 # |
| | | | | $0 | | $0 | | $2,772,560 | | $371 |
| # | Amount shown represents income before fees and rebates. |
The accompanying notes are an integral part of these financial statements.
8 | Allspring Diversified Large Cap Growth Portfolio
Statement of assets and liabilities—November 30, 2021 (unaudited)
| | |
| Assets | |
Investments in unaffiliated securities (including $791,798 of securities loaned), at value (cost $135,283,186)
| $ 252,416,865 |
Investments in affiliated securities, at value (cost $2,772,560)
| 2,772,560 |
Receivable for investments sold
| 759,199 |
Receivable for dividends
| 173,722 |
Receivable for securities lending income, net
| 274 |
Total assets
| 256,122,620 |
| Liabilities | |
Payable upon receipt of securities loaned
| 810,683 |
Payable for investments purchased
| 415,244 |
Advisory fee payable
| 120,594 |
Accrued expenses and other liabilities
| 53,343 |
Total liabilities
| 1,399,864 |
Total net assets
| $254,722,756 |
The accompanying notes are an integral part of these financial statements.
Allspring Diversified Large Cap Growth Portfolio | 9
Statement of operations—six months ended November 30, 2021 (unaudited)
| | |
| Investment income | |
Dividends (net of foreign withholdings taxes of $2,811)
| $ 846,167 |
Income from affiliated securities
| 3,614 |
Total investment income
| 849,781 |
| Expenses | |
Advisory fee
| 886,137 |
Custody and accounting fees
| 18,094 |
Professional fees
| 21,774 |
Interest holder report expenses
| 6,035 |
Trustees’ fees and expenses
| 9,662 |
Interest expense
| 1,073 |
Other fees and expenses
| 2,743 |
Total expenses
| 945,518 |
Less: Fee waivers and/or expense reimbursements
| (126,472) |
Net expenses
| 819,046 |
Net investment income
| 30,735 |
| Realized and unrealized gains (losses) on investments | |
Net realized gains on investments
| 30,021,724 |
Net change in unrealized gains (losses) on investments
| (4,202,120) |
Net realized and unrealized gains (losses) on investments
| 25,819,604 |
Net increase in net assets resulting from operations
| $25,850,339 |
The accompanying notes are an integral part of these financial statements.
10 | Allspring Diversified Large Cap Growth Portfolio
Statement of changes in net assets
| | | |
| | Six months ended
November 30, 2021
(unaudited) | Year ended
May 31, 2021 |
| Operations | | |
Net investment income
| $ 30,735 | $ 354,603 |
Net realized gains on investments
| 30,021,724 | 30,420,160 |
Net change in unrealized gains (losses) on investments
| (4,202,120) | 42,384,795 |
Net increase in net assets resulting from operations
| 25,850,339 | 73,159,558 |
| Capital transactions | | |
| Transactions in investors’ beneficial interests | | |
Contributions
| 613,707 | 41,984,976 |
Withdrawals
| (57,078,234) | (56,173,469) |
Net decrease in net assets resulting from capital transactions
| (56,464,527) | (14,188,493) |
Total increase (decrease) in net assets
| (30,614,188) | 58,971,065 |
| Net assets | | |
Beginning of period
| 285,336,944 | 226,365,879 |
End of period
| $254,722,756 | $285,336,944 |
The accompanying notes are an integral part of these financial statements.
Allspring Diversified Large Cap Growth Portfolio | 11
| | | Year ended May 31 |
| | Six months ended
November 30, 2021
(unaudited) | 2021 | 2020 | 2019 | 2018 | 2017 |
Total return
| 9.17% | 35.78% | 16.10% | 3.79% | 24.12% | 15.36% |
| Ratios to average net assets (annualized) | | | | | | |
Gross expenses
| 0.69% | 0.70% | 0.71% | 0.70% | 0.80% | 0.78% |
Net expenses1
| 0.60% | 0.60% | 0.62% | 0.62% | 0.62% | 0.62% |
Net investment income
| 0.01% | 0.14% | 0.46% | 0.68% | 0.53% | 0.51% |
| Supplemental data | | | | | | |
Portfolio turnover rate
| 22% | 58% | 43% | 100% | 37% | 98% |
| 1 | Net expense ratios reflect voluntary waivers. |
The accompanying notes are an integral part of these financial statements.
12 | Allspring Diversified Large Cap Growth Portfolio
Notes to financial statements (unaudited)
1. ORGANIZATION
Allspring Master Trust (the "Trust"), a Delaware statutory trust organized on March 10, 1999, is an open-end management investment company registered under the Investment Company Act of 1940, as amended (the "1940 Act"). As an investment company, the Trust follows the accounting and reporting guidance in Financial Accounting Standards Board ("FASB") Accounting Standards Codification Topic 946, Financial Services – Investment Companies. These financial statements report on the Allspring Diversified Large Cap Growth Portfolio (the "Portfolio") which is a diversified series of the Trust.
Interests in the Portfolio are available solely through private placement transactions that do not involve any "public offering" within the meaning of Section 4(a)(2) of the Securities Act of 1933.
On February 23, 2021, Wells Fargo & Company entered into a definitive agreement to sell Wells Fargo Asset Management ("WFAM") to GTCR LLC and Reverence Capital Partners, L.P. WFAM was the trade name used by the asset management businesses of Wells Fargo & Company and included Wells Fargo Funds Management, LLC, Wells Capital Management, LLC, Wells Fargo Asset Management (International) Limited and Wells Fargo Funds Distributor, LLC. Effective on November 1, 2021, the sale transaction of WFAM by Wells Fargo & Company to GTCR LLC and Reverence Capital Partners, L.P. was closed. In connection with the closing of the transaction, WFAM became known as Allspring Global Investments (“Allspring”) and various entities that provide services to the Portfolio changed their names to "Allspring", including Allspring Funds Management, LLC (formerly Wells Fargo Funds Management, LLC), the adviser to the Portfolio, Allspring Global Investments, Inc. (formerly Wells Capital Management, LLC) and Allspring Global Investments (UK) Limited (formerly Wells Fargo Asset Management (International) Limited), both registered investment advisers providing subadvisory services to certain funds, and Allspring Funds Distributor, LLC (formerly Wells Fargo Funds Distributor, LLC).
Consummation of the transaction resulted in the automatic termination of the Portfolio’s advisory agreement and subadvisory agreement. The Portfolio’s Board of Trustees approved a new advisory agreement and subadvisory agreement which were approved by the Portfolio's interest holders on August 16, 2021. The new agreements became effective on November 1, 2021.
Effective December 6, 2021, "Wells Fargo" was removed from the Portfolio's name and replaced it with "Allspring".
2. SIGNIFICANT ACCOUNTING POLICIES
The following significant accounting policies, which are consistently followed in the preparation of the financial statements of the Portfolio, are in conformity with U.S. generally accepted accounting principles which require management to make estimates and assumptions that affect the reported amounts of assets and liabilities, disclosure of contingent assets and liabilities at the date of the financial statements, and the reported amounts of income and expenses during the reporting period. Actual results could differ from those estimates.
Securities valuation
All investments are valued each business day as of the close of regular trading on the New York Stock Exchange (generally 4 p.m. Eastern Time), although the Portfolio may deviate from this calculation time under unusual or unexpected circumstances.
Equity securities that are listed on a foreign or domestic exchange or market are valued at the official closing price or, if none, the last sales price. If no sale occurs on the principal exchange or market that day, a fair value price will be determined in accordance with the Portfolio’s Valuation Procedures.
Investments in registered open-end investment companies are valued at net asset value. Interests in non-registered investment companies that are redeemable at net asset value are fair valued normally at net asset value.
Investments which are not valued using any of the methods discussed above are valued at their fair value, as determined in good faith by the Board of Trustees. The Board of Trustees has established a Valuation Committee comprised of the Trustees and has delegated to it the authority to take any actions regarding the valuation of portfolio securities that the Valuation Committee deems necessary or appropriate, including determining the fair value of portfolio securities, unless the determination has been delegated to the Allspring Global Investments Pricing Committee at Allspring Funds Management, LLC ("Allspring Funds Management"). The Board of Trustees retains the authority to make or ratify any valuation decisions or approve any changes to the Valuation Procedures as it deems appropriate. On a quarterly basis, the Board of Trustees receives reports on any valuation actions taken by the Valuation Committee or the Allspring Global Investments Pricing Committee which may include items for ratification.
Securities lending
The Portfolio may lend its securities from time to time in order to earn additional income in the form of fees or interest on securities received as collateral or the investment of any cash received as collateral. When securities are on loan, the Portfolio
Allspring Diversified Large Cap Growth Portfolio | 13
Notes to financial statements (unaudited)
receives interest or dividends on those securities. Cash collateral received in connection with its securities lending transactions is invested in Securities Lending Cash Investments, LLC (the "Securities Lending Fund"), an affiliated non-registered investment company. Investments in Securities Lending Fund are valued at the evaluated bid price provided by an independent pricing service. Income earned from investment in the Securities Lending Fund (net of fees and rebates), if any, is included in income from affiliated securities on the Statement of Operations.
In a securities lending transaction, the net asset value of the Portfolio is affected by an increase or decrease in the value of the securities loaned and by an increase or decrease in the value of the instrument in which collateral is invested. The amount of securities lending activity undertaken by the Portfolio fluctuates from time to time. The Portfolio has the right under the lending agreement to recover the securities from the borrower on demand. In the event of default or bankruptcy by the borrower, the Portfolio may be prevented from recovering the loaned securities or gaining access to the collateral or may experience delays or costs in doing so. In such an event, the terms of the agreement allow the unaffiliated securities lending agent to use the collateral to purchase replacement securities on behalf of the Portfolio or pay the Portfolio the market value of the loaned securities. The Portfolio bears the risk of loss with respect to depreciation of its investment of the cash collateral.
Security transactions and income recognition
Securities transactions are recorded on a trade date basis. Realized gains or losses are recorded on the basis of identified cost.
Dividend income is recognized on the ex-dividend date. Dividend income is recorded net of foreign taxes withheld where recovery of such taxes is not assured.
Federal and other taxes
The Portfolio is not required to pay federal income taxes on its net investment income and net capital gains as it is treated as a partnership for federal income tax purposes. All income, gains and losses of the Portfolio are deemed to have been “passed through” to the interest holders in proportion to their holdings of the Portfolio regardless of whether income and gains have been distributed by the Portfolio.
The Portfolio’s income tax returns and all financial records supporting those returns for the prior three fiscal years are subject to examination by the federal revenue authority. Management has analyzed the Portfolio’s tax positions taken on federal, state, and foreign tax returns for all open tax years and does not believe that there are any uncertain tax positions that require recognition of a tax liability.
As of November 30, 2021, the aggregate cost of all investments for federal income tax purposes was $136,593,812 and the unrealized gains (losses) consisted of:
| Gross unrealized gains | $120,760,641 |
| Gross unrealized losses | (2,165,028) |
| Net unrealized gains | $118,595,613 |
3. FAIR VALUATION MEASUREMENTS
Fair value measurements of investments are determined within a framework that has established a fair value hierarchy based upon the various data inputs utilized in determining the value of the Portfolio’s investments. The three-level hierarchy gives the highest priority to unadjusted quoted prices in active markets for identical assets or liabilities (Level 1) and the lowest priority to unobservable inputs (Level 3). The Portfolio’s investments are classified within the fair value hierarchy based on the lowest level of input that is significant to the fair value measurement. The inputs are summarized into three broad levels as follows:
| ■ | Level 1 – quoted prices in active markets for identical securities |
| ■ | Level 2 – other significant observable inputs (including quoted prices for similar securities, interest rates, prepayment speeds, credit risk, etc.) |
| ■ | Level 3 – significant unobservable inputs (including the Portfolio’s own assumptions in determining the fair value of investments) |
The inputs or methodologies used for valuing investments in securities are not necessarily an indication of the risk associated with investing in those securities.
14 | Allspring Diversified Large Cap Growth Portfolio
Notes to financial statements (unaudited)
The following is a summary of the inputs used in valuing the Portfolio’s assets and liabilities as of November 30, 2021:
| | Quoted prices
(Level 1) | Other significant
observable inputs
(Level 2) | Significant
unobservable inputs
(Level 3) | Total |
| Assets | | | | |
| Investments in: | | | | |
| Common stocks | | | | |
| Communication services | $ 26,778,438 | $0 | $0 | $ 26,778,438 |
| Consumer discretionary | 43,223,936 | 0 | 0 | 43,223,936 |
| Consumer staples | 2,538,272 | 0 | 0 | 2,538,272 |
| Energy | 2,695,455 | 0 | 0 | 2,695,455 |
| Financials | 21,021,233 | 0 | 0 | 21,021,233 |
| Health care | 33,606,577 | 0 | 0 | 33,606,577 |
| Industrials | 17,580,096 | 0 | 0 | 17,580,096 |
| Information technology | 95,974,319 | 0 | 0 | 95,974,319 |
| Materials | 7,431,970 | 0 | 0 | 7,431,970 |
| Real estate | 1,566,569 | 0 | 0 | 1,566,569 |
| Short-term investments | | | | |
| Investment companies | 2,772,560 | 0 | 0 | 2,772,560 |
| Total assets | $255,189,425 | $0 | $0 | $255,189,425 |
Additional sector, industry or geographic detail, if any, is included in the Portfolio of Investments.
For the six months ended November 30, 2021, the Portfolio did not have any transfers into/out of Level 3.
4. TRANSACTIONS WITH AFFILIATES
Advisory fee
The Trust has entered into an advisory contract with Allspring Funds Management, a wholly owned subsidiary of Allspring Global Investments Holdings, LLC, a holding company indirectly owned by certain private funds of GTCR LLC and Reverence Capital Partners, L.P. The adviser is responsible for implementing investment policies and guidelines and for supervising the subadviser, who is responsible for day-to-day portfolio management of the Portfolio. Pursuant to the contract, Allspring Funds Management is entitled to receive an advisory fee at the following annual rate based on the Portfolio’s average daily net assets:
| Average daily net assets | Advisory fee |
| First $500 million | 0.650% |
| Next $500 million | 0.625 |
| Next $1 billion | 0.600 |
| Next $2 billion | 0.575 |
| Next $4 billion | 0.550 |
| Next $4 billion | 0.525 |
| Next $4 billion | 0.500 |
| Over $16 billion | 0.475 |
For the six months ended November 30, 2021, the advisory fee was equivalent to an annual rate of 0.65% of the Portfolio’s average daily net assets.
Allspring Funds Management has retained the services of a subadviser to provide daily portfolio management to the Portfolio. The fee for subadvisory services is borne by Allspring Funds Management. Allspring Global Investments, LLC ("Allspring Investments"), an affiliate of Allspring Funds Management and a wholly owned subsidiary of Allspring Global Investments Holdings, LLC, is the subadviser to the Portfolio and is entitled to receive a fee from Allspring Funds Management at an annual
Allspring Diversified Large Cap Growth Portfolio | 15
Notes to financial statements (unaudited)
rate starting at 0.35% and declining to 0.30% as the average daily net assets of the asset sleeve managed by the Golden Capital team increase and an annual rate starting at 0.30% and declining to 0.20% as the average daily net assets of all other asset sleeves increase.
Allspring Funds Management has voluntarily waived and/or reimbursed advisory fees to reduce the net operating expense ratio of the Portfolio. These voluntary waivers may be discontinued at any time.
Interfund transactions
The Portfolio may purchase or sell portfolio investment securities to certain affiliates pursuant to Rule 17a-7 under the 1940 Act and under procedures adopted by the Board of Trustees. The procedures have been designed to ensure that these interfund transactions, which do not incur broker commissions, are effected at current market prices.
5. INVESTMENT PORTFOLIO TRANSACTIONS
Purchases and sales of investments, excluding U.S. government obligations (if any) and short-term securities, for the six months ended November 30, 2021 were $58,760,647 and $115,689,815, respectively.
6. SECURITIES LENDING TRANSACTIONS
The Portfolio lends its securities through an unaffiliated securities lending agent and receives collateral in the form of cash or securities with a value at least equal to the value of the securities on loan. The value of the loaned securities is determined at the close of each business day and any increases or decreases in the required collateral are exchanged between the Portfolio and the counterparty on the next business day. Cash collateral received is invested in the Securities Lending Fund which seeks to provide a positive return compared to the daily Federal Funds Open Rate by investing in high-quality, U.S. dollar-denominated short-term money market instruments and is exempt from registration under Section 3(c)(7) of the 1940 Act. Securities Lending Fund is managed by Allspring Funds Management and is subadvised by Allspring Investments. Allspring Funds Management receives an advisory fee starting at 0.05% and declining to 0.01% as the average daily net assets of the Securities Lending Fund increase. All of the fees received by Allspring Funds Management are paid to Allspring Investments for its services as subadviser.
In the event of counterparty default or the failure of a borrower to return a loaned security, the Portfolio has the right to use the collateral to offset any losses incurred. As of November 30, 2021, the Portfolio had securities lending transactions with the following counterparties which are subject to offset:
| Counterparty | Value of
securities on
loan | Collateral
received1 | Net amount |
| BNP Paribas Securities Corporation | $553,275 | $(553,275) | $0 |
| JPMorgan Securities LLC | 238,523 | (238,523) | 0 |
1 Collateral received within this table is limited to the collateral for the net transaction with the counterparty.
7. BANK BORROWINGS
The Trust, along with Allspring Variable Trust and Allspring Funds Trust (excluding the money market funds), are parties to a $350,000,000 revolving credit agreement whereby the Portfolio is permitted to use bank borrowings for temporary or emergency purposes, such as to fund interest holders withdrawal requests. Interest under the credit agreement is charged to the Portfolio based on a borrowing rate equal to the higher of the Federal Funds rate in effect on that day plus 1.25% or the overnight bank funding rate in effect on that day plus 1.25%. In addition, an annual commitment fee equal to 0.25% of the unused balance is allocated to each participating fund.
During the six months ended November 30, 2021, the Portfolio had average borrowings outstanding of $78,321 (on an annualized basis) at an average rate of 1.37% and paid interest in the amount of $1,073.
8. INDEMNIFICATION
Under the Portfolio's organizational documents, the officers and Trustees have been granted certain indemnification rights against certain liabilities that may arise out of performance of their duties to the Portfolio. The Portfolio has entered into a separate agreement with each Trustee that converts indemnification rights currently existing under the Portfolio’s organizational documents into contractual rights that cannot be changed in the future without the consent of the Trustee. Additionally, in the normal course of business, the Portfolio may enter into contracts with service providers that contain a
16 | Allspring Diversified Large Cap Growth Portfolio
Notes to financial statements (unaudited)
variety of indemnification clauses. The Portfolio’s maximum exposure under these arrangements is dependent on future claims that may be made against the Portfolio and, therefore, cannot be estimated.
9. CORONAVIRUS (COVID-19) PANDEMIC
On March 11, 2020, the World Health Organization announced that it had made the assessment that coronavirus disease 2019 (“COVID-19”) is a pandemic. The impacts of COVID-19 are affecting the entire global economy, individual companies and investment products, the funds, and the market in general. There is significant uncertainty around the extent and duration of business disruptions related to COVID-19 and the impacts may last for an extended period of time. COVID-19 has led to significant uncertainty and volatility in the financial markets.
Allspring Diversified Large Cap Growth Portfolio | 17
Other information (unaudited)
PROXY VOTING INFORMATION
A description of the policies and procedures used to determine how to vote proxies relating to portfolio securities is available without charge, upon request, by calling 1-800-222-8222, visiting our website at allspringglobal.com, or visiting the SEC website at sec.gov. Information regarding how the proxies related to portfolio securities were voted during the most recent 12-month period ended June 30 is available on the website at allspringglobal.com or by visiting the SEC website at sec.gov.
QUARTERLY PORTFOLIO HOLDINGS INFORMATION
The Portfolio files its complete schedule of portfolio holdings with the SEC for the first and third quarters of each fiscal year as an exhibit to its reports on Form N-PORT. Interest holders may view the filed Form N-PORT by visiting the SEC website at sec.gov.
18 | Allspring Diversified Large Cap Growth Portfolio
Other information (unaudited)
BOARD OF TRUSTEES AND OFFICERS
Each of the Trustees and Officers listed in the table below acts in identical capacities for each fund in the Allspring family of funds, which consists of 139 mutual funds comprising the Allspring Funds Trust, Allspring Variable Trust, Allspring Master Trust and four closed-end funds (collectively the “Fund Complex”). This table should be read in conjunction with the Prospectus and the Statement of Additional Information. The mailing address of each Trustee and Officer is 525 Market Street, 12th Floor, San Francisco, CA 94105. Each Trustee and Officer serves an indefinite term, however, each Trustee serves such term until reaching the mandatory retirement age established by the Trustees.
Independent Trustees
Name and
year of birth | Position held and
length of service* | Principal occupations during past five years or longer | Current other
public company or
investment
company
directorships |
William R. Ebsworth
(Born 1957) | Trustee,
since 2015 | Retired. From 1984 to 2013, equities analyst, portfolio manager, research director and chief investment officer at Fidelity Management and Research Company in Boston, Tokyo, and Hong Kong, and retired in 2013 as Chief Investment Officer of Fidelity Strategic Advisers, Inc. where he led a team of investment professionals managing client assets. Prior thereto, Board member of Hong Kong Securities Clearing Co., Hong Kong Options Clearing Corp., the Thailand International Fund, Ltd., Fidelity Investments Life Insurance Company, and Empire Fidelity Investments Life Insurance Company. Audit Committee Chair and Investment Committee Chair of the Vincent Memorial Hospital Endowment (non-profit organization). Mr. Ebsworth is a CFA® charterholder. | N/A |
Jane A. Freeman
(Born 1953) | Trustee,
since 2015;
Chair Liaison,
since 2018 | Retired. From 2012 to 2014 and 1999 to 2008, Chief Financial Officer of Scientific Learning Corporation. From 2008 to 2012, Ms. Freeman provided consulting services related to strategic business projects. Prior to 1999, Portfolio Manager at Rockefeller & Co. and Scudder, Stevens & Clark. Board member of the Harding Loevner Funds from 1996 to 2014, serving as both Lead Independent Director and chair of the Audit Committee. Board member of the Russell Exchange Traded Funds Trust from 2011 to 2012 and the chair of the Audit Committee. Ms. Freeman is also an inactive Chartered Financial Analyst. | N/A |
Isaiah Harris, Jr.
(Born 1952) | Trustee,
since 2009; Audit
Committee
Chair,
since 2019 | Retired. Chairman of the Board of CIGNA Corporation from 2009 to 2021, and Director from 2005 to 2008. From 2003 to 2011, Director of Deluxe Corporation. Prior thereto, President and CEO of BellSouth Advertising and Publishing Corp. from 2005 to 2007, President and CEO of BellSouth Enterprises from 2004 to 2005 and President of BellSouth Consumer Services from 2000 to 2003. Emeritus member of the Iowa State University Foundation Board of Governors. Emeritus Member of the Advisory Board of Iowa State University School of Business. Advisory Board Member, Palm Harbor Academy (private school). Advisory Board Member, Fellowship of Christian Athletes. Mr. Harris is a certified public accountant (inactive status). | N/A |
Judith M. Johnson**
(Born 1949) | Trustee,
since 2008 | Retired. Prior thereto, Chief Executive Officer and Chief Investment Officer of Minneapolis Employees Retirement Fund from 1996 to 2008. Ms. Johnson is an attorney, certified public accountant and a certified managerial accountant. | N/A |
David F. Larcker
(Born 1950) | Trustee,
since 2009 | James Irvin Miller Professor of Accounting at the Graduate School of Business (Emeritus), Stanford University, Director of the Corporate Governance Research Initiative and Senior Faculty of The Rock Center for Corporate Governance since 2006. From 2005 to 2008, Professor of Accounting at the Graduate School of Business, Stanford University. Prior thereto, Ernst & Young Professor of Accounting at The Wharton School, University of Pennsylvania from 1985 to 2005. | N/A |
Allspring Diversified Large Cap Growth Portfolio | 19
Other information (unaudited)
Name and
year of birth | Position held and
length of service* | Principal occupations during past five years or longer | Current other
public company or
investment
company
directorships |
Olivia S. Mitchell
(Born 1953) | Trustee,
since 2006;
Nominating and
Governance
Committee Chair,
since 2018 | International Foundation of Employee Benefit Plans Professor since 1993, Wharton School of the University of Pennsylvania. Director of Wharton’s Pension Research Council and Boettner Center on Pensions & Retirement Research, and Research Associate at the National Bureau of Economic Research. Previously taught at Cornell University from 1978 to 1993. | N/A |
Timothy J. Penny
(Born 1951) | Trustee,
since 1996;
Chair,
since 2018 | President and Chief Executive Officer of Southern Minnesota Initiative Foundation, a non-profit organization, since 2007. Member of the Board of Trustees of NorthStar Education Finance, Inc., a non-profit organization, since 2007. | N/A |
James G. Polisson
(Born 1959) | Trustee,
since 2018 | Retired. Chief Marketing Officer, Source (ETF) UK Services, Ltd, from 2015 to 2017. From 2012 to 2015, Principal of The Polisson Group, LLC, a management consulting, corporate advisory and principal investing company. Chief Executive Officer and Managing Director at Russell Investments, Global Exchange Traded Funds from 2010 to 2012. Managing Director of Barclays Global Investors from 1998 to 2010 and Global Chief Marketing Officer for iShares and Barclays Global Investors from 2000 to 2010. Trustee of the San Francisco Mechanics’ Institute, a non-profit organization, from 2013 to 2015. Board member of the Russell Exchange Traded Fund Trust from 2011 to 2012. Director of Barclays Global Investors Holdings Deutschland GmbH from 2006 to 2009. Mr. Polisson is an attorney and has a retired status with the Massachusetts and District of Columbia Bar Associations. | N/A |
Pamela Wheelock
(Born 1959) | Trustee,
since January
2020; previously
Trustee from
January 2018 to
July 2019 | Board member of the Destination Medical Center Economic Development Agency, Rochester, Minnesota since 2019. Interim President of the McKnight Foundation from January to September 2020. McKnight Foundation Consultant, November 2020 to February 2021. Acting Commissioner, Minnesota Department of Human Services, July 2019 through September 2019. Consultant (part-time), Minnesota Department of Human Services, October 2019 through December 2019. Chief Operating Officer, Twin Cities Habitat for Humanity from 2017 to 2019. Vice President of University Services, University of Minnesota from 2012 to 2016. Prior thereto, on the Board of Directors, Governance Committee and Finance Committee for the Minnesota Philanthropy Partners (Saint Paul Foundation) from 2012 to 2018, Interim Chief Executive Officer of Blue Cross Blue Shield of Minnesota from 2011 to 2012, Chairman of the Board from 2009 to 2012 and Board Director from 2003 to 2015. Vice President, Leadership and Community Engagement, Bush Foundation, Saint Paul, Minnesota (a private foundation) from 2009 to 2011. Executive Vice President and Chief Financial Officer, Minnesota Sports and Entertainment from 2004 to 2009 and Senior Vice President from 2002 to 2004. Executive Vice President of the Minnesota Wild Foundation from 2004 to 2008. Commissioner of Finance, State of Minnesota, from 1999 to 2002. Currently Board Chair of the Minnesota Wild Foundation since 2010. | N/A |
* Length of service dates reflect the Trustee’s commencement of service with the Trust’s predecessor entities, where applicable.
** Ms. Johnson has resigned from the Board effective December 31, 2021.
20 | Allspring Diversified Large Cap Growth Portfolio
Other information (unaudited)
Officers1
Name and
year of birth | Position held and
length of service | Principal occupations during past five years or longer |
Andrew Owen
(Born 1960) | President,
since 2017 | President, Chief Executive Officer and Director of Allspring Funds Management, LLC since 2017 and co-president of Galliard Capital Management, LLC, an affiliate of Allspring Funds Management, LLC, since 2019. Prior thereto, Head of Affiliated Managers, Allspring Global Investments, from 2014 to 2019 and Executive Vice President responsible for marketing, investments and product development for Allspring Funds Management, LLC, from 2009 to 2014. In addition, Mr. Owen was an Executive Vice President of Wells Fargo & Company from 2014 to 2021. |
Jeremy DePalma
(Born 1974) | Treasurer,
since 2012
(for certain funds in
the Fund Complex);
since 2021 (for
the remaining funds in the
Fund Complex) | Senior Vice President of Allspring Funds Management, LLC since 2009. Senior Vice President of Evergreen Investment Management Company, LLC from 2008 to 2010 and head of the Fund Reporting and Control Team within Fund Administration. |
Kate McKinley
(Born 1977) | Chief Legal Officer,
since 2021 | Chief Legal Officer of Allspring Global Investments since 2021. Prior thereto, held various roles at State Street Global Advisors beginning in 2010, including serving as Senior Vice President and General Counsel from 2019 to 2021, and Chief Operating Officer of the Institutional Client Group from 2016 - 2019. Prior to working at State Street Global Advisors served as Assistant General Counsel for Bank of America Corporation from 2005 to 2010 and as an Associate at WilmerHale from 2002 to 2005. |
Christopher Baker
(Born 1976) | Chief Compliance Officer, since 2022 | Global Chief Compliance Officer for Allspring Global Investments since 2022. Prior thereto, Chief Compliance Officer for State Street Global Advisors from 2018 to 2021. Senior Compliance Officer for the State Street divisions of Alternative Investment Solutions, Sector Solutions, and Global Marketing from 2015 to 2018. From 2010 to 2015 Vice President, Global Head of Investment and Marketing Compliance for State Street Global Advisors. |
Matthew Prasse
(Born 1983) | Secretary,
since 2021 | Senior Counsel of the Allspring Legal Department since 2021. Senior Counsel of the Wells Fargo Legal Department from 2018 to 2021. Previously, Counsel for Barings LLC from 2015 to 2018. Prior to joining Barings, Associate at Morgan, Lewis & Bockius LLP from 2008 to 2015. |
1 For those Officers with tenures at Allspring Global Investments and/or Allspring Funds Management, LLC that began prior to 2021, such tenures include years of service during which these businesses/entities were known as Wells Fargo Asset Management and Wells Fargo Funds Management, LLC, respectively.
Allspring Diversified Large Cap Growth Portfolio | 21
For more information
More information about Allspring Funds is available free upon request. To obtain literature, please write, visit the Portfolio's website, or call:
Allspring Funds
P.O. Box 219967
Kansas City, MO 64121-9967
Website: allspringglobal.com
Individual investors: 1-800-222-8222
Retail investment professionals: 1-888-877-9275
Institutional investment professionals: 1-866-765-0778
This report and the financial statements contained herein are submitted for the general information of the interest holders of the Portfolio. If this report is used for promotional purposes, distribution of the report must be accompanied or preceded by a current prospectus. Before investing, please consider the investment objectives, risks, charges, and expenses of the investment. For a current prospectus and, if available, a summary prospectus, containing this information, call
1-800-222-8222 or visit the Portfolio's website at allspringglobal.com. Read the prospectus carefully before you invest or send money.
Allspring Global InvestmentsTM is the trade name for the asset management firms of Allspring Global Investments Holdings, LLC, a holding company indirectly owned by certain private funds of GTCR LLC and Reverence Capital Partners, L.P. These firms include but are not limited to Allspring Global Investments, LLC, and Allspring Funds Management, LLC. Certain products managed by Allspring entities are distributed by Allspring Funds Distributor, LLC (a broker-dealer and Member FINRA/SIPC).
This material is for general informational and educational purposes only and is NOT intended to provide investment advice or a recommendation of any kind - including a recommendation for any specific investment, strategy, or plan.
© 2022 Allspring Global Investments Holdings, LLC. All rights reserved.
Semi-Annual Report
November 30, 2021
Allspring
Disciplined Large Cap Portfolio
Allspring Disciplined Large Cap Portfolio | 1
Portfolio information (unaudited)
| Investment objective | The Portfolio seeks long-term capital appreciation. |
| Manager | Allspring Funds Management, LLC |
| Subadviser | Allspring Global Investments, LLC |
| Portfolio managers | Justin P. Carr, CFA®‡, Robert M. Wicentowski, CFA®‡ |
| Ten largest holdings (%) as of November 30, 20211 |
| Apple Incorporated | 6.19 |
| Microsoft Corporation | 6.05 |
| Amazon.com Incorporated | 3.40 |
| Alphabet Incorporated Class C | 2.21 |
| NVIDIA Corporation | 2.08 |
| Alphabet Incorporated Class A | 2.06 |
| Tesla Motors Incorporated | 1.96 |
| Facebook Incorporated Class A | 1.86 |
| JPMorgan Chase & Company | 1.38 |
| Berkshire Hathaway Incorporated Class B | 1.27 |
| 1 | Figures represent the percentage of the Portfolio's net assets. Holdings are subject to change and may have changed since the date specified. |
| Sector allocation as of November 30, 20211 |
| 1 | Figures represent the percentage of the Portfolio's long-term investments. These amounts are subject to change and may have changed since the date specified. |
| ‡ | CFA® and Chartered Financial Analyst® are trademarks owned by CFA Institute. |
2 | Allspring Disciplined Large Cap Portfolio
Portfolio of investments—November 30, 2021 (unaudited)
| | | | | Shares | Value |
| Common stocks: 98.10% | | | | | |
| Communication services: 8.97% | | | | | |
| Diversified telecommunication services: 0.97% | | | | | |
| AT&T Incorporated | | | | 70,720 | $ 1,614,538 |
| Verizon Communications Incorporated | | | | 40,692 | 2,045,587 |
| | | | | | 3,660,125 |
| Entertainment: 1.19% | | | | | |
| Activision Blizzard Incorporated | | | | 13,250 | 776,450 |
| Netflix Incorporated † | | | | 3,151 | 2,022,627 |
| Roku Incorporated † | | | | 1,886 | 429,272 |
| The Walt Disney Company † | | | | 8,621 | 1,249,183 |
| | | | | | 4,477,532 |
| Interactive media & services: 6.13% | | | | | |
| Alphabet Incorporated Class A † | | | | 2,739 | 7,773,145 |
| Alphabet Incorporated Class C † | | | | 2,915 | 8,304,952 |
| Facebook Incorporated Class A † | | | | 21,553 | 6,993,086 |
| | | | | | 23,071,183 |
| Media: 0.68% | | | | | |
| Comcast Corporation Class A | | | | 30,222 | 1,510,496 |
| Interpublic Group of Companies Incorporated | | | | 14,237 | 472,526 |
| Omnicom Group Incorporated | | | | 8,316 | 559,750 |
| | | | | | 2,542,772 |
| Consumer discretionary: 12.12% | | | | | |
| Automobiles: 2.25% | | | | | |
| General Motors Company † | | | | 18,676 | 1,080,780 |
| Tesla Motors Incorporated † | | | | 6,461 | 7,396,294 |
| | | | | | 8,477,074 |
| Diversified consumer services: 0.30% | | | | | |
| Service Corporation International | | | | 17,097 | 1,131,138 |
| Hotels, restaurants & leisure: 1.41% | | | | | |
| Boyd Gaming Corporation † | | | | 12,612 | 739,189 |
| Chipotle Mexican Grill Incorporated † | | | | 447 | 734,604 |
| Darden Restaurants Incorporated | | | | 2,504 | 345,427 |
| McDonald's Corporation | | | | 7,576 | 1,853,090 |
| Royal Caribbean Cruises Limited † | | | | 3,438 | 240,041 |
| Starbucks Corporation | | | | 12,484 | 1,368,746 |
| | | | | | 5,281,097 |
| Household durables: 0.72% | | | | | |
| D.R. Horton Incorporated | | | | 14,235 | 1,390,760 |
| Lennar Corporation Class A | | | | 5,096 | 535,335 |
| PulteGroup Incorporated | | | | 15,732 | 787,072 |
| | | | | | 2,713,167 |
The accompanying notes are an integral part of these financial statements.
Allspring Disciplined Large Cap Portfolio | 3
Portfolio of investments—November 30, 2021 (unaudited)
| | | | | Shares | Value |
| Internet & direct marketing retail: 3.54% | | | | | |
| Amazon.com Incorporated † | | | | 3,649 | $ 12,797,298 |
| Etsy Incorporated † | | | | 1,849 | 507,698 |
| | | | | | 13,304,996 |
| Leisure products: 0.24% | | | | | |
| Polaris Industries Incorporated | | | | 3,755 | 419,771 |
| The Brunswick Corporation | | | | 5,245 | 492,558 |
| | | | | | 912,329 |
| Multiline retail: 0.56% | | | | | |
| Target Corporation | | | | 8,680 | 2,116,531 |
| Specialty retail: 2.51% | | | | | |
| AutoNation Incorporated † | | | | 3,567 | 441,773 |
| AutoZone Incorporated † | | | | 493 | 895,816 |
| Best Buy Company Incorporated | | | | 8,830 | 943,574 |
| Dick's Sporting Goods Incorporated | | | | 5,854 | 688,196 |
| Lowe's Companies Incorporated | | | | 8,183 | 2,001,480 |
| The Home Depot Incorporated | | | | 10,188 | 4,081,415 |
| The TJX Companies Incorporated | | | | 5,603 | 388,848 |
| | | | | | 9,441,102 |
| Textiles, apparel & luxury goods: 0.59% | | | | | |
| lululemon athletica Incorporated † | | | | 1,501 | 682,069 |
| Nike Incorporated Class B | | | | 9,148 | 1,548,208 |
| | | | | | 2,230,277 |
| Consumer staples: 5.17% | | | | | |
| Beverages: 0.46% | | | | | |
| Monster Beverage Corporation † | | | | 6,300 | 527,814 |
| PepsiCo Incorporated | | | | 2,375 | 379,478 |
| The Coca-Cola Company | | | | 15,637 | 820,161 |
| | | | | | 1,727,453 |
| Food & staples retailing: 1.95% | | | | | |
| Costco Wholesale Corporation | | | | 6,706 | 3,617,082 |
| The Kroger Company | | | | 9,237 | 383,613 |
| Walmart Incorporated | | | | 23,760 | 3,341,369 |
| | | | | | 7,342,064 |
| Food products: 0.99% | | | | | |
| Archer Daniels Midland Company | | | | 8,515 | 529,718 |
| Bunge Limited | | | | 7,753 | 671,177 |
| Pilgrim's Pride Corporation † | | | | 20,175 | 566,514 |
| Tyson Foods Incorporated Class A | | | | 25,129 | 1,984,186 |
| | | | | | 3,751,595 |
| Household products: 1.12% | | | | | |
| The Procter & Gamble Company | | | | 29,107 | 4,208,290 |
| Personal products: 0.26% | | | | | |
| The Estee Lauder Companies Incorporated Class A | | | | 2,913 | 967,320 |
The accompanying notes are an integral part of these financial statements.
4 | Allspring Disciplined Large Cap Portfolio
Portfolio of investments—November 30, 2021 (unaudited)
| | | | | Shares | Value |
| Tobacco: 0.39% | | | | | |
| Altria Group Incorporated | | | | 8,103 | $ 345,512 |
| Philip Morris International Incorporated | | | | 13,111 | 1,126,759 |
| | | | | | 1,472,271 |
| Energy: 2.63% | | | | | |
| Energy equipment & services: 0.10% | | | | | |
| Baker Hughes Incorporated | | | | 16,145 | 376,824 |
| Oil, gas & consumable fuels: 2.53% | | | | | |
| Cabot Oil & Gas Corporation | | | | 21,204 | 425,776 |
| Chevron Corporation | | | | 18,953 | 2,139,225 |
| ConocoPhillips | | | | 17,228 | 1,208,200 |
| Diamondback Energy Incorporated | | | | 17,043 | 1,818,999 |
| EOG Resources Incorporated | | | | 13,388 | 1,164,756 |
| Exxon Mobil Corporation | | | | 45,889 | 2,745,998 |
| | | | | | 9,502,954 |
| Financials: 11.36% | | | | | |
| Banks: 4.06% | | | | | |
| Bank of America Corporation | | | | 64,882 | 2,885,303 |
| Bank OZK | | | | 11,740 | 524,895 |
| Citigroup Incorporated | | | | 25,090 | 1,598,233 |
| JPMorgan Chase & Company | | | | 32,699 | 5,193,582 |
| Regions Financial Corporation | | | | 78,312 | 1,781,598 |
| Signature Bank | | | | 4,468 | 1,350,676 |
| US Bancorp | | | | 34,768 | 1,924,061 |
| | | | | | 15,258,348 |
| Capital markets: 2.99% | | | | | |
| Bank of New York Mellon Corporation | | | | 21,952 | 1,202,750 |
| BlackRock Incorporated | | | | 510 | 461,351 |
| Jefferies Financial Group Incorporated | | | | 38,599 | 1,450,550 |
| KKR & Company Incorporated Class A | | | | 20,779 | 1,546,997 |
| Morgan Stanley | | | | 8,543 | 810,047 |
| Northern Trust Corporation | | | | 11,316 | 1,309,261 |
| S&P Global Incorporated | | | | 1,336 | 608,855 |
| T. Rowe Price Group Incorporated | | | | 1,776 | 355,111 |
| The Blackstone Group Incorporated Class A | | | | 5,851 | 827,624 |
| The Carlyle Group Incorporated | | | | 6,981 | 381,791 |
| The Goldman Sachs Group Incorporated | | | | 6,064 | 2,310,323 |
| | | | | | 11,264,660 |
| Consumer finance: 0.39% | | | | | |
| Capital One Financial Corporation | | | | 5,774 | 811,420 |
| SLM Corporation | | | | 19,317 | 343,456 |
| Synchrony Financial | | | | 6,551 | 293,419 |
| | | | | | 1,448,295 |
| Diversified financial services: 1.63% | | | | | |
| Berkshire Hathaway Incorporated Class B † | | | | 17,315 | 4,790,887 |
| Equitable Holdings Incorporated | | | | 43,210 | 1,359,387 |
| | | | | | 6,150,274 |
The accompanying notes are an integral part of these financial statements.
Allspring Disciplined Large Cap Portfolio | 5
Portfolio of investments—November 30, 2021 (unaudited)
| | | | | Shares | Value |
| Insurance: 2.29% | | | | | |
| Arch Capital Group Limited † | | | | 26,382 | $ 1,065,305 |
| Athene Holding Limited Class A † | | | | 19,151 | 1,568,850 |
| Axis Capital Holdings Limited | | | | 13,828 | 686,975 |
| Everest Reinsurance Group Limited | | | | 4,362 | 1,118,330 |
| Lincoln National Corporation | | | | 14,934 | 990,572 |
| MetLife Incorporated | | | | 30,906 | 1,812,946 |
| Old Republic International Corporation | | | | 37,018 | 886,951 |
| Reinsurance Group of America Incorporated | | | | 5,274 | 500,555 |
| | | | | | 8,630,484 |
| Health care: 12.86% | | | | | |
| Biotechnology: 2.04% | | | | | |
| AbbVie Incorporated | | | | 13,289 | 1,531,956 |
| Amgen Incorporated | | | | 5,805 | 1,154,498 |
| Exelixis Incorporated † | | | | 50,988 | 856,089 |
| Horizon Therapeutics plc † | | | | 3,207 | 332,758 |
| Moderna Incorporated † | | | | 2,419 | 852,528 |
| United Therapeutics Corporation † | | | | 8,430 | 1,597,485 |
| Vertex Pharmaceuticals Incorporated † | | | | 7,253 | 1,355,876 |
| | | | | | 7,681,190 |
| Health care equipment & supplies: 2.46% | | | | | |
| Abbott Laboratories | | | | 19,488 | 2,451,006 |
| Baxter International Incorporated | | | | 8,825 | 658,080 |
| Edwards Lifesciences Corporation † | | | | 13,808 | 1,481,736 |
| Globus Medical Incorporated Class A † | | | | 8,351 | 522,940 |
| Intuitive Surgical Incorporated † | | | | 5,162 | 1,674,243 |
| Medtronic plc | | | | 23,236 | 2,479,281 |
| | | | | | 9,267,286 |
| Health care providers & services: 2.86% | | | | | |
| AmerisourceBergen Corporation | | | | 14,867 | 1,720,855 |
| Anthem Incorporated | | | | 3,043 | 1,236,158 |
| CVS Health Corporation | | | | 15,647 | 1,393,522 |
| McKesson Corporation | | | | 9,544 | 2,068,757 |
| Molina Healthcare Incorporated † | | | | 4,932 | 1,406,508 |
| UnitedHealth Group Incorporated | | | | 6,575 | 2,920,747 |
| | | | | | 10,746,547 |
| Health care technology: 0.42% | | | | | |
| Veeva Systems Incorporated Class A † | | | | 5,522 | 1,560,407 |
| Life sciences tools & services: 1.77% | | | | | |
| Avantor Incorporated † | | | | 9,393 | 370,836 |
| Danaher Corporation | | | | 8,032 | 2,583,412 |
| Maravai LifeSciences Holdings Class A † | | | | 23,011 | 1,057,125 |
| Thermo Fisher Scientific Incorporated | | | | 4,184 | 2,647,761 |
| | | | | | 6,659,134 |
| Pharmaceuticals: 3.31% | | | | | |
| Bristol-Myers Squibb Company | | | | 36,249 | 1,944,034 |
| Eli Lilly & Company | | | | 1,532 | 379,997 |
| Johnson & Johnson | | | | 28,799 | 4,490,628 |
| Merck & Company Incorporated | | | | 20,287 | 1,519,699 |
The accompanying notes are an integral part of these financial statements.
6 | Allspring Disciplined Large Cap Portfolio
Portfolio of investments—November 30, 2021 (unaudited)
| | | | | Shares | Value |
| Pharmaceuticals (continued) | | | | | |
| Nektar Therapeutics † | | | | 16,159 | $ 181,950 |
| Pfizer Incorporated | | | | 65,938 | 3,542,849 |
| Royalty Pharma plc Class A | | | | 10,366 | 412,256 |
| | | | | | 12,471,413 |
| Industrials: 8.41% | | | | | |
| Aerospace & defense: 0.65% | | | | | |
| General Dynamics Corporation | | | | 2,616 | 494,346 |
| Lockheed Martin Corporation | | | | 5,824 | 1,941,256 |
| | | | | | 2,435,602 |
| Air freight & logistics: 1.23% | | | | | |
| Expeditors International of Washington Incorporated | | | | 12,279 | 1,493,372 |
| FedEx Corporation | | | | 5,884 | 1,355,497 |
| United Parcel Service Incorporated Class B | | | | 8,946 | 1,774,618 |
| | | | | | 4,623,487 |
| Airlines: 0.16% | | | | | |
| Delta Air Lines Incorporated † | | | | 16,096 | 582,675 |
| Building products: 1.26% | | | | | |
| Carrier Global Corporation | | | | 27,019 | 1,462,268 |
| Lennox International Incorporated | | | | 1,707 | 527,497 |
| Masco Corporation | | | | 23,570 | 1,553,263 |
| Owens Corning Incorporated | | | | 13,979 | 1,185,978 |
| | | | | | 4,729,006 |
| Commercial services & supplies: 0.66% | | | | | |
| Copart Incorporated † | | | | 6,994 | 1,015,249 |
| Waste Management Incorporated | | | | 9,242 | 1,484,912 |
| | | | | | 2,500,161 |
| Construction & engineering: 0.74% | | | | | |
| MasTec Incorporated † | | | | 10,168 | 937,185 |
| Quanta Services Incorporated | | | | 16,307 | 1,855,410 |
| | | | | | 2,792,595 |
| Electrical equipment: 0.87% | | | | | |
| AMETEK Incorporated | | | | 3,720 | 507,780 |
| Eaton Corporation plc | | | | 9,068 | 1,469,560 |
| Generac Holdings Incorporated † | | | | 1,390 | 585,524 |
| Regal-Beloit Corporation | | | | 4,502 | 711,766 |
| | | | | | 3,274,630 |
| Industrial conglomerates: 0.15% | | | | | |
| Honeywell International Incorporated | | | | 2,876 | 581,642 |
| Machinery: 1.90% | | | | | |
| AGCO Corporation | | | | 8,292 | 913,867 |
| Crane Company | | | | 3,856 | 372,258 |
| Cummins Incorporated | | | | 7,087 | 1,486,498 |
| Deere & Company | | | | 1,466 | 506,562 |
| Nordson Corporation | | | | 1,481 | 376,455 |
| Oshkosh Corporation | | | | 5,729 | 616,440 |
The accompanying notes are an integral part of these financial statements.
Allspring Disciplined Large Cap Portfolio | 7
Portfolio of investments—November 30, 2021 (unaudited)
| | | | | Shares | Value |
| Machinery (continued) | | | | | |
| Parker-Hannifin Corporation | | | | 3,266 | $ 986,528 |
| Snap-on Incorporated | | | | 3,944 | 812,109 |
| Stanley Black & Decker Incorporated | | | | 1,982 | 346,374 |
| The Toro Company | | | | 7,273 | 731,373 |
| | | | | | 7,148,464 |
| Professional services: 0.11% | | | | | |
| Manpower Incorporated | | | | 4,572 | 409,788 |
| Road & rail: 0.52% | | | | | |
| Landstar System Incorporated | | | | 4,262 | 718,360 |
| Schneider National Incorporated Class B | | | | 49,837 | 1,225,990 |
| | | | | | 1,944,350 |
| Trading companies & distributors: 0.16% | | | | | |
| W.W. Grainger Incorporated | | | | 1,281 | 616,686 |
| Information technology: 29.38% | | | | | |
| Communications equipment: 0.78% | | | | | |
| Cisco Systems Incorporated | | | | 53,654 | 2,942,385 |
| Electronic equipment, instruments & components: 0.83% | | | | | |
| Keysight Technologies Incorporated † | | | | 3,472 | 675,235 |
| SYNNEX Corporation | | | | 11,282 | 1,167,236 |
| Vontier Corporation | | | | 10,671 | 336,243 |
| Zebra Technologies Corporation Class A † | | | | 1,584 | 932,628 |
| | | | | | 3,111,342 |
| IT services: 3.57% | | | | | |
| Accenture plc Class A | | | | 8,313 | 2,971,066 |
| Amdocs Limited | | | | 9,593 | 669,783 |
| Cognizant Technology Solutions Corporation Class A | | | | 13,468 | 1,050,235 |
| EPAM Systems Incorporated † | | | | 802 | 488,057 |
| International Business Machines Corporation | | | | 3,179 | 372,261 |
| Kyndryl Holdings Incorporated † | | | | 635 | 10,033 |
| MasterCard Incorporated Class A | | | | 8,212 | 2,586,123 |
| PayPal Holdings Incorporated † | | | | 8,561 | 1,582,843 |
| Visa Incorporated Class A | | | | 19,095 | 3,700,038 |
| | | | | | 13,430,439 |
| Semiconductors & semiconductor equipment: 6.15% | | | | | |
| Applied Materials Incorporated | | | | 18,970 | 2,792,194 |
| Broadcom Incorporated | | | | 5,722 | 3,168,157 |
| Enphase Energy Incorporated † | | | | 1,766 | 441,500 |
| Intel Corporation | | | | 34,935 | 1,718,802 |
| KLA Corporation | | | | 2,327 | 949,719 |
| Lam Research Corporation | | | | 2,143 | 1,456,919 |
| Micron Technology Incorporated | | | | 7,610 | 639,240 |
| NVIDIA Corporation | | | | 23,984 | 7,837,012 |
| Qorvo Incorporated † | | | | 5,596 | 818,303 |
| Qualcomm Incorporated | | | | 18,450 | 3,331,332 |
| | | | | | 23,153,178 |
| Software: 11.55% | | | | | |
| Adobe Incorporated † | | | | 5,223 | 3,498,627 |
The accompanying notes are an integral part of these financial statements.
8 | Allspring Disciplined Large Cap Portfolio
Portfolio of investments—November 30, 2021 (unaudited)
| | | | | Shares | Value |
| Software (continued) | | | | | |
| Atlassian Corporation plc Class A † | | | | 2,173 | $ 817,743 |
| Cadence Design Systems Incorporated † | | | | 6,618 | 1,174,430 |
| DocuSign Incorporated † | | | | 1,888 | 465,128 |
| Dolby Laboratories Incorporated Class A | | | | 13,684 | 1,141,382 |
| Dropbox Incorporated Class A † | | | | 21,342 | 525,227 |
| Fortinet Incorporated † | | | | 4,972 | 1,651,251 |
| HubSpot Incorporated † | | | | 721 | 581,782 |
| Intuit Incorporated | | | | 4,218 | 2,751,401 |
| Microsoft Corporation | | | | 68,902 | 22,778,312 |
| Oracle Corporation | | | | 25,112 | 2,278,663 |
| Paycom Software Incorporated † | | | | 678 | 296,611 |
| Salesforce.com Incorporated † | | | | 8,042 | 2,291,648 |
| ServiceNow Incorporated † | | | | 1,095 | 709,232 |
| Synopsys Incorporated † | | | | 2,743 | 935,363 |
| The Trade Desk Incorporated † | | | | 7,767 | 803,263 |
| VMware Incorporated Class A | | | | 2,721 | 317,650 |
| Zoom Video Communications Incorporated † | | | | 2,096 | 443,115 |
| | | | | | 43,460,828 |
| Technology hardware, storage & peripherals: 6.50% | | | | | |
| Apple Incorporated | | | | 140,885 | 23,288,291 |
| Dell Technologies Incorporated | | | | 6,176 | 348,759 |
| HP Incorporated | | | | 23,469 | 827,986 |
| | | | | | 24,465,036 |
| Materials: 2.33% | | | | | |
| Chemicals: 0.88% | | | | | |
| Dow Incorporated | | | | 7,939 | 436,089 |
| Eastman Chemical Company | | | | 4,096 | 427,172 |
| LyondellBasell Industries NV Class A | | | | 7,845 | 683,535 |
| Olin Corporation | | | | 10,598 | 576,001 |
| The Chemours Company | | | | 21,655 | 643,154 |
| Westlake Chemical Corporation | | | | 5,974 | 555,104 |
| | | | | | 3,321,055 |
| Containers & packaging: 0.53% | | | | | |
| Avery Dennison Corporation | | | | 1,728 | 354,361 |
| Berry Global Group Incorporated † | | | | 14,009 | 967,321 |
| Packaging Corporation of America | | | | 5,247 | 685,206 |
| | | | | | 2,006,888 |
| Metals & mining: 0.92% | | | | | |
| Freeport-McMoRan Incorporated | | | | 14,767 | 547,560 |
| Newmont Corporation | | | | 11,222 | 616,312 |
| Nucor Corporation | | | | 12,290 | 1,305,935 |
| Reliance Steel & Aluminum Company | | | | 6,635 | 986,160 |
| | | | | | 3,455,967 |
| Real estate: 3.19% | | | | | |
| Equity REITs: 3.19% | | | | | |
| Alexandria Real Estate Equities Incorporated | | | | 5,176 | 1,035,562 |
| American Tower Corporation | | | | 6,729 | 1,766,228 |
| AvalonBay Communities Incorporated | | | | 4,664 | 1,114,090 |
The accompanying notes are an integral part of these financial statements.
Allspring Disciplined Large Cap Portfolio | 9
Portfolio of investments—November 30, 2021 (unaudited)
| | | | | Shares | Value |
| Equity REITs (continued) | | | | | |
| Essex Property Trust Incorporated | | | | 2,859 | $ 970,459 |
| Gaming and Leisure Properties Incorporated | | | | 18,910 | 853,219 |
| Invitation Homes Incorporated | | | | 22,699 | 917,948 |
| National Retail Properties Incorporated | | | | 7,152 | 315,403 |
| Prologis Incorporated | | | | 14,916 | 2,248,587 |
| Public Storage Incorporated | | | | 2,823 | 924,194 |
| SBA Communications Corporation | | | | 3,113 | 1,070,249 |
| Spirit Realty Capital Incorporated REIT | | | | 7,600 | 338,656 |
| Store Capital Corporation | | | | 13,564 | 446,798 |
| | | | | | 12,001,393 |
| Utilities: 1.68% | | | | | |
| Electric utilities: 0.91% | | | | | |
| Exelon Corporation | | | | 15,046 | 793,376 |
| NRG Energy Incorporated | | | | 24,135 | 869,343 |
| PPL Corporation | | | | 24,459 | 680,694 |
| The Southern Company | | | | 17,554 | 1,072,549 |
| | | | | | 3,415,962 |
| Independent power & renewable electricity producers: 0.39% | | | | | |
| AES Corporation | | | | 62,618 | 1,464,009 |
| Multi-utilities: 0.38% | | | | | |
| DTE Energy Company | | | | 7,236 | 783,948 |
| Sempra Energy | | | | 5,375 | 644,301 |
| | | | | | 1,428,249 |
| Total Common stocks (Cost $235,172,456) | | | | | 369,141,949 |
| | | Yield | | | |
| Short-term investments: 1.65% | | | | | |
| Investment companies: 1.65% | | | | | |
| Allspring Government Money Market Fund Select Class ♠∞ | | 0.03% | | 6,190,773 | 6,190,773 |
| Total Short-term investments (Cost $6,190,773) | | | | | 6,190,773 |
| Total investments in securities (Cost $241,363,229) | 99.75% | | | | 375,332,722 |
| Other assets and liabilities, net | 0.25 | | | | 940,858 |
| Total net assets | 100.00% | | | | $376,273,580 |
| † | Non-income-earning security |
| ♠ | The issuer of the security is an affiliated person of the Portfolio as defined in the Investment Company Act of 1940. |
| ∞ | The rate represents the 7-day annualized yield at period end. |
| Abbreviations: |
| REIT | Real estate investment trust |
The accompanying notes are an integral part of these financial statements.
10 | Allspring Disciplined Large Cap Portfolio
Portfolio of investments—November 30, 2021 (unaudited)
Investments in affiliates
An affiliated investment is an investment in which the Portfolio owns at least 5% of the outstanding voting shares of the issuer or as a result of other relationships, such as the Portfolio and the issuer having the same adviser or investment manager. Transactions with issuers that were either affiliates of the Portfolio at the beginning of the period or the end of the period were as follows:
| | Value,
beginning of
period | Purchases | Sales
proceeds | Net
realized
gains
(losses) | | Net
change in
unrealized
gains
(losses) | | Value,
end of
period | Shares,
end
of period | Income
from
affiliated
securities |
| Short-term investments | | | | | | | | | |
| Allspring Government Money Market Fund Select Class | $5,124,422 | $84,770,090 | $(83,703,739) | $0 | | $0 | | $ 6,190,773 | 6,190,773 | $750 |
| Securities Lending Cash Investments LLC | 202,520 | 39,955 | (242,475) | 0 | | 0 | | 0 | 0 | 7 # |
| | | | | $0 | | $0 | | $6,190,773 | | $757 |
| # | Amount shown represents income before fees and rebates. |
Futures contracts
| Description | Number of
contracts | Expiration
date | Notional
cost | Notional
value | Unrealized
gains | Unrealized
losses |
| Long | | | | | | |
| E-Mini S&P 500 Index | 27 | 12-17-2021 | $6,338,912 | $6,164,437 | $0 | $(174,475) |
The accompanying notes are an integral part of these financial statements.
Allspring Disciplined Large Cap Portfolio | 11
Statement of assets and liabilities—November 30, 2021 (unaudited)
| | |
| Assets | |
Investments in unaffiliated securities, at value (cost $235,172,456)
| $ 369,141,949 |
Investments in affiliated securities, at value (cost $6,190,773)
| 6,190,773 |
Cash at broker segregated for futures contracts
| 693,000 |
Receivable for dividends
| 432,588 |
Prepaid expenses and other assets
| 29,593 |
Total assets
| 376,487,903 |
| Liabilities | |
Payable for daily variation margin on open futures contracts
| 114,412 |
Advisory fee payable
| 79,986 |
Professional fees payable
| 16,203 |
Accrued expenses and other liabilities
| 3,722 |
Total liabilities
| 214,323 |
Total net assets
| $376,273,580 |
The accompanying notes are an integral part of these financial statements.
12 | Allspring Disciplined Large Cap Portfolio
Statement of operations—six months ended November 30, 2021 (unaudited)
| | |
| Investment income | |
Dividends (net of foreign withholdings taxes of $14,991)
| $ 2,549,365 |
Income from affiliated securities
| 1,001 |
Total investment income
| 2,550,366 |
| Expenses | |
Advisory fee
| 460,733 |
Custody and accounting fees
| 22,800 |
Professional fees
| 29,830 |
Interest holder report expenses
| 12,839 |
Trustees’ fees and expenses
| 9,662 |
Other fees and expenses
| 5,391 |
Total expenses
| 541,255 |
Net investment income
| 2,009,111 |
| Realized and unrealized gains (losses) on investments | |
| Net realized gains on | |
Unaffiliated securities
| 14,051,567 |
Futures contracts
| 636,710 |
Net realized gains on investments
| 14,688,277 |
| Net change in unrealized gains (losses) on | |
Unaffiliated securities
| 16,355,573 |
Futures contracts
| (149,164) |
Net change in unrealized gains (losses) on investments
| 16,206,409 |
Net realized and unrealized gains (losses) on investments
| 30,894,686 |
Net increase in net assets resulting from operations
| $32,903,797 |
The accompanying notes are an integral part of these financial statements.
Allspring Disciplined Large Cap Portfolio | 13
Statement of changes in net assets
| | | |
| | Six months ended
November 30, 2021
(unaudited) | Year ended
May 31, 2021 |
| Operations | | |
Net investment income
| $ 2,009,111 | $ 4,374,651 |
Net realized gains on investments
| 14,688,277 | 21,928,585 |
Net change in unrealized gains (losses) on investments
| 16,206,409 | 84,159,527 |
Net increase in net assets resulting from operations
| 32,903,797 | 110,462,763 |
| Capital transactions | | |
| Transactions in investors’ beneficial interests | | |
Contributions
| 54,824,967 | 87,991,362 |
Withdrawals
| (40,864,797) | (122,800,676) |
Net increase (decrease) in net assets resulting from capital transactions
| 13,960,170 | (34,809,314) |
Total increase in net assets
| 46,863,967 | 75,653,449 |
| Net assets | | |
Beginning of period
| 329,409,613 | 253,756,164 |
End of period
| $376,273,580 | $ 329,409,613 |
The accompanying notes are an integral part of these financial statements.
14 | Allspring Disciplined Large Cap Portfolio
| | | Year ended May 31 |
| | Six months ended
November 30, 2021
(unaudited) | 2021 | 2020 | 2019 1 |
Total return2
| 9.57% | 41.79% | 11.56% | (2.40)% |
| Ratios to average net assets (annualized) | | | | |
Gross expenses
| 0.29% | 0.29% | 0.29% | 0.28% |
Net expenses
| 0.29% | 0.29% | 0.29% | 0.28% |
Net investment income
| 1.09% | 1.36% | 1.82% | 1.84% |
| Supplemental data | | | | |
Portfolio turnover rate
| 25% | 53% | 81% | 92% |
| 1 | For the period from June 12, 2018 (commencement of operations) to May 31, 2019. |
| 2 | Returns for periods of less than one year are not annualized. |
The accompanying notes are an integral part of these financial statements.
Allspring Disciplined Large Cap Portfolio | 15
Notes to financial statements (unaudited)
1. ORGANIZATION
Allspring Master Trust (the "Trust"), a Delaware statutory trust organized on March 10, 1999, is an open-end management investment company registered under the Investment Company Act of 1940, as amended (the "1940 Act"). As an investment company, the Trust follows the accounting and reporting guidance in Financial Accounting Standards Board ("FASB") Accounting Standards Codification Topic 946, Financial Services – Investment Companies. These financial statements report on the Allspring Disciplined Large Cap Portfolio (the "Portfolio") which is a diversified series of the Trust.
Interests in the Portfolio are available solely through private placement transactions that do not involve any "public offering" within the meaning of Section 4(a)(2) of the Securities Act of 1933.
On February 23, 2021, Wells Fargo & Company entered into a definitive agreement to sell Wells Fargo Asset Management ("WFAM") to GTCR LLC and Reverence Capital Partners, L.P. WFAM was the trade name used by the asset management businesses of Wells Fargo & Company and included Wells Fargo Funds Management, LLC, Wells Capital Management, LLC, Wells Fargo Asset Management (International) Limited and Wells Fargo Funds Distributor, LLC. Effective on November 1, 2021, the sale transaction of WFAM by Wells Fargo & Company to GTCR LLC and Reverence Capital Partners, L.P. was closed. In connection with the closing of the transaction, WFAM became known as Allspring Global Investments (“Allspring”) and various entities that provide services to the Portfolio changed their names to "Allspring", including Allspring Funds Management, LLC (formerly Wells Fargo Funds Management, LLC), the adviser to the Portfolio, Allspring Global Investments, Inc. (formerly Wells Capital Management, LLC) and Allspring Global Investments (UK) Limited (formerly Wells Fargo Asset Management (International) Limited), both registered investment advisers providing subadvisory services to certain funds, and Allspring Funds Distributor, LLC (formerly Wells Fargo Funds Distributor, LLC).
Consummation of the transaction resulted in the automatic termination of the Portfolio’s advisory agreement and subadvisory agreement. The Portfolio’s Board of Trustees approved a new advisory agreement and subadvisory agreement which were approved by the Portfolio's interest holders on August 16, 2021. The new agreements became effective on November 1, 2021.
Effective December 6, 2021, "Wells Fargo" was removed from the Portfolio's name and replaced it with "Allspring".
2. SIGNIFICANT ACCOUNTING POLICIES
The following significant accounting policies, which are consistently followed in the preparation of the financial statements of the Portfolio, are in conformity with U.S. generally accepted accounting principles which require management to make estimates and assumptions that affect the reported amounts of assets and liabilities, disclosure of contingent assets and liabilities at the date of the financial statements, and the reported amounts of income and expenses during the reporting period. Actual results could differ from those estimates.
Securities valuation
All investments are valued each business day as of the close of regular trading on the New York Stock Exchange (generally 4 p.m. Eastern Time), although the Portfolio may deviate from this calculation time under unusual or unexpected circumstances.
Equity securities and futures contracts that are listed on a foreign or domestic exchange or market are valued at the official closing price or, if none, the last sales price. If no sale occurs on the principal exchange or market that day, a fair value price will be determined in accordance with the Portfolio’s Valuation Procedures.
Debt securities are valued at the evaluated bid price provided by an independent pricing service (e.g. taking into account various factors, including yields, maturities, or credit ratings) or, if a reliable price is not available, the quoted bid price from an independent broker-dealer.
Investments in registered open-end investment companies are valued at net asset value. Interests in non-registered investment companies that are redeemable at net asset value are fair valued normally at net asset value.
Investments which are not valued using any of the methods discussed above are valued at their fair value, as determined in good faith by the Board of Trustees. The Board of Trustees has established a Valuation Committee comprised of the Trustees and has delegated to it the authority to take any actions regarding the valuation of portfolio securities that the Valuation Committee deems necessary or appropriate, including determining the fair value of portfolio securities, unless the determination has been delegated to the Allspring Global Investments Pricing Committee at Allspring Funds Management, LLC ("Allspring Funds Management"). The Board of Trustees retains the authority to make or ratify any valuation decisions or approve any changes to the Valuation Procedures as it deems appropriate. On a quarterly basis, the Board of Trustees receives reports on any valuation actions taken by the Valuation Committee or the Allspring Global Investments Pricing Committee which may include items for ratification.
16 | Allspring Disciplined Large Cap Portfolio
Notes to financial statements (unaudited)
Securities lending
The Portfolio may lend its securities from time to time in order to earn additional income in the form of fees or interest on securities received as collateral or the investment of any cash received as collateral. When securities are on loan, the Portfolio receives interest or dividends on those securities. Cash collateral received in connection with its securities lending transactions is invested in Securities Lending Cash Investments, LLC (the "Securities Lending Fund"), an affiliated non-registered investment company. Investments in Securities Lending Fund are valued at the evaluated bid price provided by an independent pricing service. Income earned from investment in the Securities Lending Fund (net of fees and rebates), if any, is included in income from affiliated securities on the Statement of Operations.
In a securities lending transaction, the net asset value of the Portfolio is affected by an increase or decrease in the value of the securities loaned and by an increase or decrease in the value of the instrument in which collateral is invested. The amount of securities lending activity undertaken by the Portfolio fluctuates from time to time. The Portfolio has the right under the lending agreement to recover the securities from the borrower on demand. In the event of default or bankruptcy by the borrower, the Portfolio may be prevented from recovering the loaned securities or gaining access to the collateral or may experience delays or costs in doing so. In such an event, the terms of the agreement allow the unaffiliated securities lending agent to use the collateral to purchase replacement securities on behalf of the Portfolio or pay the Portfolio the market value of the loaned securities. The Portfolio bears the risk of loss with respect to depreciation of its investment of the cash collateral.
Futures contracts
Futures contracts are agreements between the Portfolio and a counterparty to buy or sell a specific amount of a commodity, financial instrument or currency at a specified price on a specified date. The Portfolio may buy and sell futures contracts in order to gain exposure to, or protect against, changes in security values and is subject to equity price risk. The primary risks associated with the use of futures contracts are the imperfect correlation between changes in market values of securities held by the Portfolio and the prices of futures contracts, and the possibility of an illiquid market. Futures contracts are generally entered into on a regulated futures exchange and cleared through a clearinghouse associated with the exchange. With futures contracts, there is minimal counterparty risk to the Portfolio since futures contracts are exchange traded and the exchange’s clearinghouse, as the counterparty to all exchange traded futures, guarantees the futures contracts against default.
Upon entering into a futures contract, the Portfolio is required to deposit either cash or securities (initial margin) with the broker in an amount equal to a certain percentage of the contract value. Subsequent payments (variation margin) are paid to or from the broker each day equal to the daily changes in the contract value. Such payments are recorded as unrealized gains or losses and, if any, shown as variation margin receivable (payable) in the Statement of Assets and Liabilities. Should the Portfolio fail to make requested variation margin payments, the broker can gain access to the initial margin to satisfy the Portfolio’s payment obligations. When the contracts are closed, a realized gain or loss is recorded in the Statement of Operations.
Security transactions and income recognition
Securities transactions are recorded on a trade date basis. Realized gains or losses are recorded on the basis of identified cost.
Dividend income is recognized on the ex-dividend date.
Interest income is accrued daily and bond discounts are accreted and premiums are amortized daily. To the extent debt obligations are placed on non-accrual status, any related interest income may be reduced by writing off interest receivables when the collection of all or a portion of interest has been determined to be doubtful based on consistently applied procedures and the fair value has decreased. If the issuer subsequently resumes interest payments or when the collectability of interest is reasonably assured, the debt obligation is removed from non-accrual status.
Income is recorded net of foreign taxes withheld where recovery of such taxes is not assured.
Federal and other taxes
The Portfolio is not required to pay federal income taxes on its net investment income and net capital gains as it is treated as a partnership for federal income tax purposes. All income, gains and losses of the Portfolio are deemed to have been “passed through” to the interest holders in proportion to their holdings of the Portfolio regardless of whether income and gains have been distributed by the Portfolio.
The Portfolio’s income tax returns and all financial records supporting those returns for the prior three fiscal years are subject to examination by the federal revenue authority. Management has analyzed the Portfolio’s tax positions taken on federal, state, and foreign tax returns for all open tax years and does not believe that there are any uncertain tax positions that require recognition of a tax liability.
Allspring Disciplined Large Cap Portfolio | 17
Notes to financial statements (unaudited)
As of November 30, 2021, the aggregate cost of all investments for federal income tax purposes was $248,012,253 and the unrealized gains (losses) consisted of:
| Gross unrealized gains | $137,718,810 |
| Gross unrealized losses | (10,572,816) |
| Net unrealized gains | $127,145,994 |
3. FAIR VALUATION MEASUREMENTS
Fair value measurements of investments are determined within a framework that has established a fair value hierarchy based upon the various data inputs utilized in determining the value of the Portfolio’s investments. The three-level hierarchy gives the highest priority to unadjusted quoted prices in active markets for identical assets or liabilities (Level 1) and the lowest priority to unobservable inputs (Level 3). The Portfolio’s investments are classified within the fair value hierarchy based on the lowest level of input that is significant to the fair value measurement. The inputs are summarized into three broad levels as follows:
| ■ | Level 1 – quoted prices in active markets for identical securities |
| ■ | Level 2 – other significant observable inputs (including quoted prices for similar securities, interest rates, prepayment speeds, credit risk, etc.) |
| ■ | Level 3 – significant unobservable inputs (including the Portfolio’s own assumptions in determining the fair value of investments) |
The inputs or methodologies used for valuing investments in securities are not necessarily an indication of the risk associated with investing in those securities.
The following is a summary of the inputs used in valuing the Portfolio’s assets and liabilities as of November 30, 2021:
| | Quoted prices
(Level 1) | Other significant
observable inputs
(Level 2) | Significant
unobservable inputs
(Level 3) | Total |
| Assets | | | | |
| Investments in: | | | | |
| Common stocks | | | | |
| Communication services | $ 33,751,612 | $0 | $0 | $ 33,751,612 |
| Consumer discretionary | 45,607,711 | 0 | 0 | 45,607,711 |
| Consumer staples | 19,468,993 | 0 | 0 | 19,468,993 |
| Energy | 9,879,778 | 0 | 0 | 9,879,778 |
| Financials | 42,752,061 | 0 | 0 | 42,752,061 |
| Health care | 48,385,977 | 0 | 0 | 48,385,977 |
| Industrials | 31,639,086 | 0 | 0 | 31,639,086 |
| Information technology | 110,563,208 | 0 | 0 | 110,563,208 |
| Materials | 8,783,910 | 0 | 0 | 8,783,910 |
| Real estate | 12,001,393 | 0 | 0 | 12,001,393 |
| Utilities | 6,308,220 | 0 | 0 | 6,308,220 |
| Short-term investments | | | | |
| Investment companies | 6,190,773 | 0 | 0 | 6,190,773 |
| Total assets | $375,332,722 | $0 | $0 | $375,332,722 |
| Liabilities | | | | |
| Futures contracts | $ 174,475 | $0 | $0 | $ 174,475 |
| Total liabilities | $ 174,475 | $0 | $0 | $ 174,475 |
Futures contracts are reported at their cumulative unrealized gains (losses) at measurement date as reported in the table following the Portfolio of Investments. For futures contracts, the current day’s variation margin is reported on the Statement of Assets and Liabilities. All other assets and liabilities are reported at their market value at measurement date.
Additional sector, industry or geographic detail, if any, is included in the Portfolio of Investments.
18 | Allspring Disciplined Large Cap Portfolio
Notes to financial statements (unaudited)
For the six months ended November 30, 2021, the Portfolio did not have any transfers into/out of Level 3.
4. TRANSACTIONS WITH AFFILIATES
Advisory fee
The Trust has entered into an advisory contract with Allspring Funds Management, a wholly owned subsidiary of Allspring Global Investments Holdings, LLC, a holding company indirectly owned by certain private funds of GTCR LLC and Reverence Capital Partners, L.P. The adviser is responsible for implementing investment policies and guidelines and for supervising the subadviser, who is responsible for day-to-day portfolio management of the Portfolio. Pursuant to the contract, Allspring Funds Management is entitled to receive an advisory fee at the following annual rate based on the Portfolio’s average daily net assets:
| Average daily net assets | Advisory fee |
| First $1 billion | 0.250% |
| Next $4 billion | 0.225 |
| Over $5 billion | 0.200 |
For the six months ended November 30, 2021, the advisory fee was equivalent to an annual rate of 0.25% of the Portfolio’s average daily net assets.
Allspring Funds Management has retained the services of a subadviser to provide daily portfolio management to the Portfolio. The fee for subadvisory services is borne by Allspring Funds Management. Allspring Global Investments, LLC ("Allspring Investments"), an affiliate of Allspring Funds Management and a wholly owned subsidiary of Allspring Global Investments Holdings, LLC, is the subadviser to the Portfolio and is entitled to receive a fee from Allspring Funds Management at an annual rate starting at 0.20% and declining to 0.15% as the average daily net assets of the Portfolio increase.
Interfund transactions
The Portfolio may purchase or sell portfolio investment securities to certain affiliates pursuant to Rule 17a-7 under the 1940 Act and under procedures adopted by the Board of Trustees. The procedures have been designed to ensure that these interfund transactions, which do not incur broker commissions, are effected at current market prices.
5. INVESTMENT PORTFOLIO TRANSACTIONS
Purchases and sales of investments, excluding U.S. government obligations (if any) and short-term securities, for the six months ended November 30, 2021 were $105,371,736 and $89,799,630, respectively.
6. SECURITIES LENDING TRANSACTIONS
The Portfolio lends its securities through an unaffiliated securities lending agent and receives collateral in the form of cash or securities with a value at least equal to the value of the securities on loan. The value of the loaned securities is determined at the close of each business day and any increases or decreases in the required collateral are exchanged between the Portfolio and the counterparty on the next business day. Cash collateral received is invested in the Securities Lending Fund which seeks to provide a positive return compared to the daily Federal Funds Open Rate by investing in high-quality, U.S. dollar-denominated short-term money market instruments and is exempt from registration under Section 3(c)(7) of the 1940 Act. Securities Lending Fund is managed by Allspring Funds Management and is subadvised by Allspring Investments. Allspring Funds Management receives an advisory fee starting at 0.05% and declining to 0.01% as the average daily net assets of the Securities Lending Fund increase. All of the fees received by Allspring Funds Management are paid to Allspring Investments for its services as subadviser.
In the event of counterparty default or the failure of a borrower to return a loaned security, the Portfolio has the right to use the collateral to offset any losses incurred. As of November 30, 2021, the Portfolio did not have any securities on loan.
7. DERIVATIVE TRANSACTIONS
During the six months ended November 30, 2021, the Portfolio entered into futures contracts to gain market exposure. The Portfolio had an average notional amount of $5,768,218 in long futures contracts during the six months ended November 30, 2021.
The fair value, realized gains or losses and change in unrealized gains or losses, if any, on derivative instruments are reflected in the corresponding financial statement captions.
Allspring Disciplined Large Cap Portfolio | 19
Notes to financial statements (unaudited)
8. BANK BORROWINGS
The Trust, along with Allspring Variable Trust and Allspring Funds Trust (excluding the money market funds), are parties to a $350,000,000 revolving credit agreement whereby the Portfolio is permitted to use bank borrowings for temporary or emergency purposes, such as to fund interest holders withdrawal requests. Interest under the credit agreement is charged to the Portfolio based on a borrowing rate equal to the higher of the Federal Funds rate in effect on that day plus 1.25% or the overnight bank funding rate in effect on that day plus 1.25%. In addition, an annual commitment fee equal to 0.25% of the unused balance is allocated to each participating fund.
For the six months ended November 30, 2021, there were no borrowings by the Portfolio under the agreement.
9. CONCENTRATION RISKS
As of the end of the period, the Portfolio concentrated its portfolio of investments in the information technology sector. A fund that invests a substantial portion of its assets in any sector may be more affected by changes in that sector than would be a fund whose investments are not heavily weighted in any sector.
10. INDEMNIFICATION
Under the Portfolio's organizational documents, the officers and Trustees have been granted certain indemnification rights against certain liabilities that may arise out of performance of their duties to the Portfolio. The Portfolio has entered into a separate agreement with each Trustee that converts indemnification rights currently existing under the Portfolio’s organizational documents into contractual rights that cannot be changed in the future without the consent of the Trustee. Additionally, in the normal course of business, the Portfolio may enter into contracts with service providers that contain a variety of indemnification clauses. The Portfolio’s maximum exposure under these arrangements is dependent on future claims that may be made against the Portfolio and, therefore, cannot be estimated.
11. CORONAVIRUS (COVID-19) PANDEMIC
On March 11, 2020, the World Health Organization announced that it had made the assessment that coronavirus disease 2019 (“COVID-19”) is a pandemic. The impacts of COVID-19 are affecting the entire global economy, individual companies and investment products, the funds, and the market in general. There is significant uncertainty around the extent and duration of business disruptions related to COVID-19 and the impacts may last for an extended period of time. COVID-19 has led to significant uncertainty and volatility in the financial markets.
20 | Allspring Disciplined Large Cap Portfolio
Other information (unaudited)
PROXY VOTING INFORMATION
A description of the policies and procedures used to determine how to vote proxies relating to portfolio securities is available without charge, upon request, by calling 1-800-222-8222, visiting our website at allspringglobal.com, or visiting the SEC website at sec.gov. Information regarding how the proxies related to portfolio securities were voted during the most recent 12-month period ended June 30 is available on the website at allspringglobal.com or by visiting the SEC website at sec.gov.
QUARTERLY PORTFOLIO HOLDINGS INFORMATION
The Portfolio files its complete schedule of portfolio holdings with the SEC for the first and third quarters of each fiscal year as an exhibit to its reports on Form N-PORT. Interest holders may view the filed Form N-PORT by visiting the SEC website at sec.gov.
Allspring Disciplined Large Cap Portfolio | 21
Other information (unaudited)
BOARD OF TRUSTEES AND OFFICERS
Each of the Trustees and Officers listed in the table below acts in identical capacities for each fund in the Allspring family of funds, which consists of 139 mutual funds comprising the Allspring Funds Trust, Allspring Variable Trust, Allspring Master Trust and four closed-end funds (collectively the “Fund Complex”). This table should be read in conjunction with the Prospectus and the Statement of Additional Information. The mailing address of each Trustee and Officer is 525 Market Street, 12th Floor, San Francisco, CA 94105. Each Trustee and Officer serves an indefinite term, however, each Trustee serves such term until reaching the mandatory retirement age established by the Trustees.
Independent Trustees
Name and
year of birth | Position held and
length of service* | Principal occupations during past five years or longer | Current other
public company or
investment
company
directorships |
William R. Ebsworth
(Born 1957) | Trustee,
since 2015 | Retired. From 1984 to 2013, equities analyst, portfolio manager, research director and chief investment officer at Fidelity Management and Research Company in Boston, Tokyo, and Hong Kong, and retired in 2013 as Chief Investment Officer of Fidelity Strategic Advisers, Inc. where he led a team of investment professionals managing client assets. Prior thereto, Board member of Hong Kong Securities Clearing Co., Hong Kong Options Clearing Corp., the Thailand International Fund, Ltd., Fidelity Investments Life Insurance Company, and Empire Fidelity Investments Life Insurance Company. Audit Committee Chair and Investment Committee Chair of the Vincent Memorial Hospital Endowment (non-profit organization). Mr. Ebsworth is a CFA® charterholder. | N/A |
Jane A. Freeman
(Born 1953) | Trustee,
since 2015;
Chair Liaison,
since 2018 | Retired. From 2012 to 2014 and 1999 to 2008, Chief Financial Officer of Scientific Learning Corporation. From 2008 to 2012, Ms. Freeman provided consulting services related to strategic business projects. Prior to 1999, Portfolio Manager at Rockefeller & Co. and Scudder, Stevens & Clark. Board member of the Harding Loevner Funds from 1996 to 2014, serving as both Lead Independent Director and chair of the Audit Committee. Board member of the Russell Exchange Traded Funds Trust from 2011 to 2012 and the chair of the Audit Committee. Ms. Freeman is also an inactive Chartered Financial Analyst. | N/A |
Isaiah Harris, Jr.
(Born 1952) | Trustee,
since 2009; Audit
Committee
Chair,
since 2019 | Retired. Chairman of the Board of CIGNA Corporation from 2009 to 2021, and Director from 2005 to 2008. From 2003 to 2011, Director of Deluxe Corporation. Prior thereto, President and CEO of BellSouth Advertising and Publishing Corp. from 2005 to 2007, President and CEO of BellSouth Enterprises from 2004 to 2005 and President of BellSouth Consumer Services from 2000 to 2003. Emeritus member of the Iowa State University Foundation Board of Governors. Emeritus Member of the Advisory Board of Iowa State University School of Business. Advisory Board Member, Palm Harbor Academy (private school). Advisory Board Member, Fellowship of Christian Athletes. Mr. Harris is a certified public accountant (inactive status). | N/A |
Judith M. Johnson**
(Born 1949) | Trustee,
since 2008 | Retired. Prior thereto, Chief Executive Officer and Chief Investment Officer of Minneapolis Employees Retirement Fund from 1996 to 2008. Ms. Johnson is an attorney, certified public accountant and a certified managerial accountant. | N/A |
David F. Larcker
(Born 1950) | Trustee,
since 2009 | James Irvin Miller Professor of Accounting at the Graduate School of Business (Emeritus), Stanford University, Director of the Corporate Governance Research Initiative and Senior Faculty of The Rock Center for Corporate Governance since 2006. From 2005 to 2008, Professor of Accounting at the Graduate School of Business, Stanford University. Prior thereto, Ernst & Young Professor of Accounting at The Wharton School, University of Pennsylvania from 1985 to 2005. | N/A |
22 | Allspring Disciplined Large Cap Portfolio
Other information (unaudited)
Name and
year of birth | Position held and
length of service* | Principal occupations during past five years or longer | Current other
public company or
investment
company
directorships |
Olivia S. Mitchell
(Born 1953) | Trustee,
since 2006;
Nominating and
Governance
Committee Chair,
since 2018 | International Foundation of Employee Benefit Plans Professor since 1993, Wharton School of the University of Pennsylvania. Director of Wharton’s Pension Research Council and Boettner Center on Pensions & Retirement Research, and Research Associate at the National Bureau of Economic Research. Previously taught at Cornell University from 1978 to 1993. | N/A |
Timothy J. Penny
(Born 1951) | Trustee,
since 1996;
Chair,
since 2018 | President and Chief Executive Officer of Southern Minnesota Initiative Foundation, a non-profit organization, since 2007. Member of the Board of Trustees of NorthStar Education Finance, Inc., a non-profit organization, since 2007. | N/A |
James G. Polisson
(Born 1959) | Trustee,
since 2018 | Retired. Chief Marketing Officer, Source (ETF) UK Services, Ltd, from 2015 to 2017. From 2012 to 2015, Principal of The Polisson Group, LLC, a management consulting, corporate advisory and principal investing company. Chief Executive Officer and Managing Director at Russell Investments, Global Exchange Traded Funds from 2010 to 2012. Managing Director of Barclays Global Investors from 1998 to 2010 and Global Chief Marketing Officer for iShares and Barclays Global Investors from 2000 to 2010. Trustee of the San Francisco Mechanics’ Institute, a non-profit organization, from 2013 to 2015. Board member of the Russell Exchange Traded Fund Trust from 2011 to 2012. Director of Barclays Global Investors Holdings Deutschland GmbH from 2006 to 2009. Mr. Polisson is an attorney and has a retired status with the Massachusetts and District of Columbia Bar Associations. | N/A |
Pamela Wheelock
(Born 1959) | Trustee,
since January
2020; previously
Trustee from
January 2018 to
July 2019 | Board member of the Destination Medical Center Economic Development Agency, Rochester, Minnesota since 2019. Interim President of the McKnight Foundation from January to September 2020. McKnight Foundation Consultant, November 2020 to February 2021. Acting Commissioner, Minnesota Department of Human Services, July 2019 through September 2019. Consultant (part-time), Minnesota Department of Human Services, October 2019 through December 2019. Chief Operating Officer, Twin Cities Habitat for Humanity from 2017 to 2019. Vice President of University Services, University of Minnesota from 2012 to 2016. Prior thereto, on the Board of Directors, Governance Committee and Finance Committee for the Minnesota Philanthropy Partners (Saint Paul Foundation) from 2012 to 2018, Interim Chief Executive Officer of Blue Cross Blue Shield of Minnesota from 2011 to 2012, Chairman of the Board from 2009 to 2012 and Board Director from 2003 to 2015. Vice President, Leadership and Community Engagement, Bush Foundation, Saint Paul, Minnesota (a private foundation) from 2009 to 2011. Executive Vice President and Chief Financial Officer, Minnesota Sports and Entertainment from 2004 to 2009 and Senior Vice President from 2002 to 2004. Executive Vice President of the Minnesota Wild Foundation from 2004 to 2008. Commissioner of Finance, State of Minnesota, from 1999 to 2002. Currently Board Chair of the Minnesota Wild Foundation since 2010. | N/A |
* Length of service dates reflect the Trustee’s commencement of service with the Trust’s predecessor entities, where applicable.
** Ms. Johnson has resigned from the Board effective December 31, 2021.
Allspring Disciplined Large Cap Portfolio | 23
Other information (unaudited)
Officers1
Name and
year of birth | Position held and
length of service | Principal occupations during past five years or longer |
Andrew Owen
(Born 1960) | President,
since 2017 | President, Chief Executive Officer and Director of Allspring Funds Management, LLC since 2017 and co-president of Galliard Capital Management, LLC, an affiliate of Allspring Funds Management, LLC, since 2019. Prior thereto, Head of Affiliated Managers, Allspring Global Investments, from 2014 to 2019 and Executive Vice President responsible for marketing, investments and product development for Allspring Funds Management, LLC, from 2009 to 2014. In addition, Mr. Owen was an Executive Vice President of Wells Fargo & Company from 2014 to 2021. |
Jeremy DePalma
(Born 1974) | Treasurer,
since 2012
(for certain funds in
the Fund Complex);
since 2021 (for
the remaining funds in the
Fund Complex) | Senior Vice President of Allspring Funds Management, LLC since 2009. Senior Vice President of Evergreen Investment Management Company, LLC from 2008 to 2010 and head of the Fund Reporting and Control Team within Fund Administration. |
Kate McKinley
(Born 1977) | Chief Legal Officer,
since 2021 | Chief Legal Officer of Allspring Global Investments since 2021. Prior thereto, held various roles at State Street Global Advisors beginning in 2010, including serving as Senior Vice President and General Counsel from 2019 to 2021, and Chief Operating Officer of the Institutional Client Group from 2016 - 2019. Prior to working at State Street Global Advisors served as Assistant General Counsel for Bank of America Corporation from 2005 to 2010 and as an Associate at WilmerHale from 2002 to 2005. |
Christopher Baker
(Born 1976) | Chief Compliance Officer, since 2022 | Global Chief Compliance Officer for Allspring Global Investments since 2022. Prior thereto, Chief Compliance Officer for State Street Global Advisors from 2018 to 2021. Senior Compliance Officer for the State Street divisions of Alternative Investment Solutions, Sector Solutions, and Global Marketing from 2015 to 2018. From 2010 to 2015 Vice President, Global Head of Investment and Marketing Compliance for State Street Global Advisors. |
Matthew Prasse
(Born 1983) | Secretary,
since 2021 | Senior Counsel of the Allspring Legal Department since 2021. Senior Counsel of the Wells Fargo Legal Department from 2018 to 2021. Previously, Counsel for Barings LLC from 2015 to 2018. Prior to joining Barings, Associate at Morgan, Lewis & Bockius LLP from 2008 to 2015. |
1 For those Officers with tenures at Allspring Global Investments and/or Allspring Funds Management, LLC that began prior to 2021, such tenures include years of service during which these businesses/entities were known as Wells Fargo Asset Management and Wells Fargo Funds Management, LLC, respectively.
24 | Allspring Disciplined Large Cap Portfolio
For more information
More information about Allspring Funds is available free upon request. To obtain literature, please write, visit the Portfolio's website, or call:
Allspring Funds
P.O. Box 219967
Kansas City, MO 64121-9967
Website: allspringglobal.com
Individual investors: 1-800-222-8222
Retail investment professionals: 1-888-877-9275
Institutional investment professionals: 1-866-765-0778
This report and the financial statements contained herein are submitted for the general information of the interest holders of the Portfolio. If this report is used for promotional purposes, distribution of the report must be accompanied or preceded by a current prospectus. Before investing, please consider the investment objectives, risks, charges, and expenses of the investment. For a current prospectus and, if available, a summary prospectus, containing this information, call
1-800-222-8222 or visit the Portfolio's website at allspringglobal.com. Read the prospectus carefully before you invest or send money.
Allspring Global InvestmentsTM is the trade name for the asset management firms of Allspring Global Investments Holdings, LLC, a holding company indirectly owned by certain private funds of GTCR LLC and Reverence Capital Partners, L.P. These firms include but are not limited to Allspring Global Investments, LLC, and Allspring Funds Management, LLC. Certain products managed by Allspring entities are distributed by Allspring Funds Distributor, LLC (a broker-dealer and Member FINRA/SIPC).
This material is for general informational and educational purposes only and is NOT intended to provide investment advice or a recommendation of any kind - including a recommendation for any specific investment, strategy, or plan.
© 2022 Allspring Global Investments Holdings, LLC. All rights reserved.
Semi-Annual Report
November 30, 2021
Allspring Disciplined International
Developed Markets Portfolio
Allspring Disciplined International Developed Markets Portfolio | 1
Portfolio information (unaudited)
| Investment objective | The Portfolio seeks long-term capital appreciation. |
| Manager | Allspring Funds Management, LLC |
| Subadviser | Allspring Global Investments, LLC |
| Portfolio managers | Justin P. Carr, CFA®‡, Vince Fioramonti, CFA®‡ |
| Ten largest holdings (%) as of November 30, 20211 |
| Nestle SA | 2.10 |
| ASML Holding NV | 2.04 |
| Roche Holding AG | 1.79 |
| LVMH Moët Hennessy Louis Vuitton SE | 1.45 |
| Novo Nordisk AS Class B | 1.18 |
| AstraZeneca plc | 1.09 |
| Toyota Motor Corporation | 1.03 |
| Novartis AG | 0.92 |
| Siemens AG | 0.88 |
| SAP SE | 0.81 |
| 1 | Figures represent the percentage of the Portfolio's net assets. Holdings are subject to change and may have changed since the date specified. |
| Sector allocation as of November 30, 20211 |
| 1 | Figures represent the percentage of the Portfolio's long-term investments. These amounts are subject to change and may have changed since the date specified. |
| Geographic allocation as of November 30, 20211 |
| 1 | Figures represent the percentage of the Portfolio's long-term investments. These amounts are subject to change and may have changed since the date specified. |
| ‡ | CFA® and Chartered Financial Analyst® are trademarks owned by CFA Institute. |
2 | Allspring Disciplined International Developed Markets Portfolio
Portfolio of investments—November 30, 2021 (unaudited)
| | | | | | Shares | Value |
| Common stocks: 96.02% | | | | | | |
| Australia: 6.32% | | | | | | |
| Afterpay Limited (Information technology, IT services) † | | | | | 2,289 | $ 175,293 |
| Aristocrat Leisure Limited (Consumer discretionary, Hotels, restaurants & leisure) | | | | | 8,342 | 259,271 |
| Aurizon Holdings Limited (Industrials, Road & rail) | | | | | 91,692 | 219,279 |
| Australia & New Zealand Banking Group Limited (Financials, Banks) | | | | | 41,072 | 776,346 |
| BHP Billiton Limited (Materials, Metals & mining) | | | | | 32,443 | 908,851 |
| Brambles Limited (Industrials, Commercial services & supplies) | | | | | 42,605 | 301,843 |
| Coles Group Limited (Consumer staples, Food & staples retailing) | | | | | 20,042 | 255,932 |
| Commonwealth Bank of Australia (Financials, Banks) | | | | | 17,479 | 1,153,985 |
| CSL Limited (Health care, Biotechnology) | | | | | 5,336 | 1,160,246 |
| Fortescue Metals Group Limited (Materials, Metals & mining) | | | | | 20,150 | 241,976 |
| Goodman Group (Real estate, Equity REITs) | | | | | 22,849 | 398,811 |
| Macquarie Group Limited (Financials, Capital markets) | | | | | 4,072 | 567,076 |
| National Australia Bank Limited (Financials, Banks) | | | | | 38,852 | 750,739 |
| Newcrest Mining Limited (Materials, Metals & mining) | | | | | 13,047 | 216,429 |
| Reece Limited (Industrials, Trading companies & distributors) | | | | | 5,802 | 95,889 |
| Rio Tinto Limited (Materials, Metals & mining) | | | | | 5,240 | 347,688 |
| Scentre Group (Real estate, Equity REITs) | | | | | 77,615 | 169,870 |
| Sonic Healthcare Limited (Health care, Health care providers & services) | | | | | 8,339 | 252,150 |
| Stockland Corporation Limited (Real estate, Equity REITs) | | | | | 78,659 | 242,843 |
| Suncorp Group Limited (Financials, Insurance) | | | | | 27,287 | 209,075 |
| The GPT Group (Real estate, Equity REITs) | | | | | 61,351 | 228,915 |
| Transurban Group (Industrials, Transportation infrastructure) | | | | | 27,723 | 267,611 |
| Wesfarmers Limited (Consumer discretionary, Multiline retail) | | | | | 16,771 | 676,029 |
| Westpac Banking Corporation (Financials, Banks) | | | | | 42,331 | 613,287 |
| Woodside Petroleum Limited (Energy, Oil, gas & consumable fuels) | | | | | 29,984 | 454,926 |
| Woolworths Group Limited (Consumer staples, Food & staples retailing) | | | | | 13,167 | 381,213 |
| | | | | | | 11,325,573 |
| Austria: 0.27% | | | | | | |
| Erste Bank Der Oesterreichischen Sparkassen AG (Financials, Banks) | | | | | 5,763 | 252,495 |
| Voestalpine AG (Materials, Metals & mining) | | | | | 6,837 | 230,732 |
| | | | | | | 483,227 |
| Belgium: 0.57% | | | | | | |
| Anheuser-Busch InBev SA (Consumer staples, Beverages) | | | | | 7,205 | 402,055 |
| Colruyt SA (Consumer staples, Food & staples retailing) | | | | | 3,319 | 155,811 |
| KBC Group NV (Financials, Banks) | | | | | 3,969 | 333,159 |
| Umicore SA (Materials, Chemicals) | | | | | 2,766 | 135,254 |
| | | | | | | 1,026,279 |
| Denmark: 2.81% | | | | | | |
| A.P. Moller - Maersk AS Class B (Industrials, Marine) | | | | | 192 | 549,494 |
| Carlsberg AS Class B (Consumer staples, Beverages) | | | | | 1,341 | 208,256 |
| Coloplast AS Class B (Health care, Health care equipment & supplies) | | | | | 1,340 | 218,883 |
| Danske Bank AS (Financials, Banks) | | | | | 12,904 | 213,348 |
| DSV Panalpina AS (Industrials, Air freight & logistics) | | | | | 2,778 | 604,842 |
| Genmab AS (Health care, Biotechnology) † | | | | | 1,232 | 477,451 |
| GN Store Nord AS (Health care, Health care equipment & supplies) | | | | | 5,289 | 304,594 |
| Novo Nordisk AS Class B (Health care, Pharmaceuticals) | | | | | 19,734 | 2,112,524 |
The accompanying notes are an integral part of these financial statements.
Allspring Disciplined International Developed Markets Portfolio | 3
Portfolio of investments—November 30, 2021 (unaudited)
| | | | | | Shares | Value |
| Denmark: (continued) | | | | | | |
| Vestas Wind System AS Class A (Industrials, Electrical equipment) | | | | | 6,082 | $ 204,214 |
| William Demant Holding (Health care, Health care equipment & supplies) † | | | | | 2,851 | 136,730 |
| | | | | | | 5,030,336 |
| Finland: 1.37% | | | | | | |
| Elisa Oyj (Communication services, Diversified telecommunication services) | | | | | 2,821 | 169,393 |
| Fortum Oyj (Utilities, Electric utilities) | | | | | 10,946 | 314,721 |
| Kesko Oyj Class B (Consumer staples, Food & staples retailing) | | | | | 6,877 | 215,919 |
| Kone Oyj Class B (Industrials, Machinery) | | | | | 3,560 | 233,873 |
| Neste Oil Oyj (Energy, Oil, gas & consumable fuels) | | | | | 2,145 | 101,452 |
| Nokia Oyj (Information technology, Communications equipment) † | | | | | 75,940 | 425,617 |
| Nordea Bank AB (Financials, Banks) | | | | | 44,735 | 529,795 |
| Sampo Oyj Class A (Financials, Insurance) | | | | | 4,739 | 232,530 |
| Stora Enso Oyj (Materials, Paper & forest products) | | | | | 14,050 | 237,856 |
| | | | | | | 2,461,156 |
| France: 11.32% | | | | | | |
| Air Liquide SA (Materials, Chemicals) | | | | | 3,817 | 630,349 |
| Amundi SA (Financials, Capital markets) 144A | | | | | 2,098 | 174,540 |
| Arkema SA (Materials, Chemicals) | | | | | 1,687 | 221,202 |
| AXA SA (Financials, Insurance) | | | | | 24,504 | 673,567 |
| BNP Paribas SA (Financials, Banks) | | | | | 15,670 | 973,885 |
| Bolloré SA (Industrials, Air freight & logistics) | | | | | 36,958 | 198,298 |
| Bouygues SA (Industrials, Construction & engineering) | | | | | 6,845 | 231,190 |
| Capgemini SE (Information technology, IT services) | | | | | 2,147 | 495,681 |
| Carrefour SA (Consumer staples, Food & staples retailing) | | | | | 12,426 | 205,530 |
| CNP Assurances SA (Financials, Insurance) | | | | | 16,801 | 409,593 |
| Compagnie de Saint-Gobain SA (Industrials, Building products) | | | | | 8,411 | 533,507 |
| Compagnie Generale des Etablissements Michelin SCA (Consumer discretionary, Auto components) | | | | | 2,921 | 431,053 |
| Credit Agricole SA (Financials, Banks) | | | | | 23,808 | 324,187 |
| Danone SA (Consumer staples, Food products) | | | | | 6,861 | 403,520 |
| Edenred Group (Information technology, IT services) | | | | | 7,097 | 317,473 |
| Eiffage SA (Industrials, Construction & engineering) | | | | | 4,245 | 395,366 |
| Engie SA (Utilities, Multi-utilities) | | | | | 24,197 | 350,049 |
| Essilor International (Compagnie Generale d'Optique) (Consumer discretionary, Textiles, apparel & luxury goods) | | | | | 3,339 | 669,162 |
| Hermes International SA (Consumer discretionary, Textiles, apparel & luxury goods) | | | | | 358 | 671,825 |
| Kering SA (Consumer discretionary, Textiles, apparel & luxury goods) | | | | | 754 | 580,648 |
| La Francaise Des Jeux SA (Consumer discretionary, Hotels, restaurants & leisure) 144A | | | | | 3,608 | 167,106 |
| Legrand SA (Industrials, Electrical equipment) | | | | | 4,569 | 501,927 |
| L'Oréal SA (Consumer staples, Personal products) | | | | | 2,626 | 1,185,738 |
| LVMH Moët Hennessy Louis Vuitton SE (Consumer discretionary, Textiles, apparel & luxury goods) | | | | | 3,336 | 2,594,054 |
| Orange SA (Communication services, Diversified telecommunication services) | | | | | 26,571 | 285,658 |
| Pernod-Ricard SA (Consumer staples, Beverages) | | | | | 2,589 | 594,071 |
| Publicis Groupe SA (Communication services, Media) | | | | | 5,753 | 372,270 |
| Safran SA (Industrials, Aerospace & defense) | | | | | 3,370 | 376,408 |
| Sanofi SA (Health care, Pharmaceuticals) | | | | | 11,295 | 1,073,729 |
| Sartorius Stedim Biotech SA (Health care, Life sciences tools & services) | | | | | 542 | 319,983 |
| Schneider Electric SE (Industrials, Electrical equipment) | | | | | 6,788 | 1,204,693 |
| Societe Generale SA (Financials, Banks) | | | | | 8,589 | 267,267 |
The accompanying notes are an integral part of these financial statements.
4 | Allspring Disciplined International Developed Markets Portfolio
Portfolio of investments—November 30, 2021 (unaudited)
| | | | | | Shares | Value |
| France: (continued) | | | | | | |
| Teleperformance SE (Industrials, Professional services) | | | | | 1,012 | $ 416,269 |
| Thales SA (Industrials, Aerospace & defense) | | | | | 2,175 | 178,450 |
| Total SA (Energy, Oil, gas & consumable fuels) | | | | | 25,410 | 1,169,184 |
| Vinci SA (Industrials, Construction & engineering) « | | | | | 6,055 | 572,874 |
| Vivendi SE (Communication services, Entertainment) | | | | | 10,532 | 134,124 |
| | | | | | | 20,304,430 |
| Germany: 8.27% | | | | | | |
| adidas AG (Consumer discretionary, Textiles, apparel & luxury goods) | | | | | 1,738 | 502,660 |
| Allianz AG (Financials, Insurance) | | | | | 4,602 | 998,759 |
| BASF SE (Materials, Chemicals) | | | | | 11,421 | 748,030 |
| Bayer AG (Health care, Pharmaceuticals) | | | | | 5,186 | 261,569 |
| Bayerische Motoren Werke AG (Consumer discretionary, Automobiles) | | | | | 5,483 | 525,564 |
| Bechtle AG (Information technology, IT services) | | | | | 3,003 | 216,485 |
| Beiersdorf AG (Consumer staples, Personal products) | | | | | 2,372 | 235,924 |
| Brenntag AG (Industrials, Trading companies & distributors) | | | | | 2,569 | 220,036 |
| Continental AG (Consumer discretionary, Auto components) | | | | | 1,545 | 165,245 |
| Covestro AG (Materials, Chemicals) 144A | | | | | 4,730 | 266,762 |
| Daimler AG (Consumer discretionary, Automobiles) | | | | | 11,524 | 1,079,257 |
| Delivery Hero SE (Consumer discretionary, Internet & direct marketing retail) 144A† | | | | | 1,406 | 186,592 |
| Deutsche Bank AG (Financials, Capital markets) † | | | | | 20,650 | 247,838 |
| Deutsche Boerse AG (Financials, Capital markets) | | | | | 3,531 | 554,448 |
| Deutsche Post AG (Industrials, Air freight & logistics) | | | | | 13,801 | 815,108 |
| Deutsche Telekom AG (Communication services, Diversified telecommunication services) | | | | | 36,547 | 643,691 |
| E.ON SE (Utilities, Multi-utilities) | | | | | 34,038 | 419,905 |
| Heidelbergcement AG (Materials, Construction materials) | | | | | 3,933 | 261,668 |
| Hellofresh SE (Consumer discretionary, Internet & direct marketing retail) † | | | | | 2,753 | 279,208 |
| Infineon Technologies AG (Information technology, Semiconductors & semiconductor equipment) | | | | | 11,317 | 511,681 |
| LANXESS AG (Materials, Chemicals) | | | | | 1,044 | 60,460 |
| LEG Immobilien AG (Real estate, Real estate management & development) | | | | | 1,963 | 274,664 |
| Merck KGaA (Health care, Pharmaceuticals) | | | | | 2,192 | 541,764 |
| Muenchener Rueckversicherungs Gesellschaft AG (Financials, Insurance) | | | | | 1,462 | 393,109 |
| RWE AG (Utilities, Multi-utilities) | | | | | 11,382 | 438,321 |
| SAP SE (Information technology, Software) | | | | | 11,266 | 1,443,752 |
| Siemens AG (Industrials, Industrial conglomerates) | | | | | 9,859 | 1,571,679 |
| Siemens Healthineers AG (Health care, Health care equipment & supplies) 144A | | | | | 3,663 | 266,053 |
| Uniper SE (Utilities, Independent power & renewable electricity producers) | | | | | 4,578 | 198,758 |
| Vonovia SE (Real estate, Real estate management & development) | | | | | 5,571 | 309,168 |
| Zalando SE (Consumer discretionary, Internet & direct marketing retail) 144A† | | | | | 2,128 | 193,528 |
| | | | | | | 14,831,686 |
| Hong Kong: 2.85% | | | | | | |
| AIA Group Limited (Financials, Insurance) | | | | | 117,800 | 1,240,133 |
| BOC Hong Kong (Holdings) Limited (Financials, Banks) | | | | | 85,500 | 258,450 |
| CK Asset Holdings Limited (Real estate, Real estate management & development) | | | | | 43,000 | 245,961 |
| Galaxy Entertainment Group Limited (Consumer discretionary, Hotels, restaurants & leisure) † | | | | | 31,000 | 168,529 |
| Henderson Land Development Company Limited (Real estate, Real estate management & development) | | | | | 43,000 | 175,832 |
The accompanying notes are an integral part of these financial statements.
Allspring Disciplined International Developed Markets Portfolio | 5
Portfolio of investments—November 30, 2021 (unaudited)
| | | | | | Shares | Value |
| Hong Kong: (continued) | | | | | | |
| Hong Kong Exchanges & Clearing Limited (Financials, Capital markets) | | | | | 12,700 | $ 698,391 |
| Hong Kong Land Holdings Limited (Real estate, Real estate management & development) | | | | | 60,740 | 327,457 |
| New World Development Company Limited (Real estate, Real estate management & development) | | | | | 92,000 | 363,258 |
| Sino Land Company (Real estate, Real estate management & development) | | | | | 178,000 | 211,918 |
| SITC International Holdings Incorporated (Industrials, Marine) | | | | | 41,000 | 163,688 |
| Sun Hung Kai Properties Limited (Real estate, Real estate management & development) | | | | | 22,000 | 267,887 |
| Swire Pacific Limited Class A (Real estate, Real estate management & development) | | | | | 49,000 | 270,535 |
| Techtronic Industries Company Limited (Industrials, Machinery) | | | | | 19,000 | 390,767 |
| WH Group Limited (Consumer staples, Food products) 144A | | | | | 331,500 | 208,579 |
| Xinyi Glass Holdings Limited (Consumer discretionary, Auto components) | | | | | 48,000 | 117,087 |
| | | | | | | 5,108,472 |
| Ireland: 0.69% | | | | | | |
| CRH plc (Materials, Construction materials) | | | | | 8,823 | 428,927 |
| DCC plc (Industrials, Industrial conglomerates) | | | | | 5,899 | 434,494 |
| Flutter Entertainment plc (Consumer discretionary, Hotels, restaurants & leisure) † | | | | | 1,407 | 192,688 |
| James Hardie Industries CDI (Materials, Construction materials) | | | | | 4,457 | 174,689 |
| | | | | | | 1,230,798 |
| Israel: 0.48% | | | | | | |
| Bank Leumi Le-Israel (Financials, Banks) | | | | | 21,886 | 210,600 |
| Check Point Software Technologies Limited (Information technology, Software) † | | | | | 2,367 | 263,471 |
| Nice Systems Limited ADR (Information technology, Software) † | | | | | 952 | 276,546 |
| Wix.com Limited (Information technology, IT services) † | | | | | 656 | 100,237 |
| | | | | | | 850,854 |
| Italy: 1.71% | | | | | | |
| Assicurazioni Generali SpA (Financials, Insurance) | | | | | 23,168 | 464,110 |
| Enel SpA (Utilities, Electric utilities) | | | | | 86,703 | 656,980 |
| Eni SpA (Energy, Oil, gas & consumable fuels) | | | | | 30,199 | 397,956 |
| FinecoBank SpA (Financials, Banks) | | | | | 20,481 | 358,704 |
| Intesa Sanpaolo SpA (Financials, Banks) | | | | | 103,079 | 246,824 |
| Moncler SpA (Consumer discretionary, Textiles, apparel & luxury goods) | | | | | 1,761 | 127,138 |
| Poste Italiane SpA (Financials, Insurance) 144A | | | | | 31,806 | 399,986 |
| Snam SpA (Utilities, Gas utilities) | | | | | 35,997 | 202,855 |
| UniCredit SpA (Financials, Banks) | | | | | 17,381 | 209,855 |
| | | | | | | 3,064,408 |
| Japan: 23.10% | | | | | | |
| Advantest Corporation (Information technology, Semiconductors & semiconductor equipment) | | | | | 3,400 | 296,822 |
| Astellas Pharma Incorporated (Health care, Pharmaceuticals) | | | | | 23,500 | 368,488 |
| Bridgestone Corporation (Consumer discretionary, Auto components) | | | | | 8,400 | 336,828 |
| Brother Industries Limited (Information technology, Technology hardware, storage & peripherals) | | | | | 20,700 | 355,263 |
| Canon Incorporated (Information technology, Technology hardware, storage & peripherals) | | | | | 16,400 | 360,681 |
| Capcom Company Limited (Communication services, Entertainment) | | | | | 8,000 | 199,123 |
| Chugai Pharmaceutical Company Limited (Health care, Pharmaceuticals) | | | | | 7,800 | 252,671 |
The accompanying notes are an integral part of these financial statements.
6 | Allspring Disciplined International Developed Markets Portfolio
Portfolio of investments—November 30, 2021 (unaudited)
| | | | | | Shares | Value |
| Japan: (continued) | | | | | | |
| CyberAgent Incorporated (Communication services, Media) | | | | | 9,900 | $ 182,210 |
| Dai Nippon Printing Company Limited (Industrials, Commercial services & supplies) | | | | | 9,300 | 218,272 |
| Dai-ichi Life Holdings Incorporated (Financials, Insurance) | | | | | 17,900 | 358,619 |
| Daiichi Sankyo Company Limited (Health care, Pharmaceuticals) | | | | | 17,400 | 432,496 |
| Daikin Industries Limited (Industrials, Building products) | | | | | 2,500 | 509,060 |
| Daiwa House Industry Company Limited (Real estate, Real estate management & development) | | | | | 6,900 | 200,377 |
| DENSO Corporation (Consumer discretionary, Auto components) | | | | | 4,200 | 307,252 |
| Dentsu Incorporated (Communication services, Media) | | | | | 6,400 | 202,685 |
| Disco Corporation (Information technology, Semiconductors & semiconductor equipment) | | | | | 900 | 257,627 |
| Eisai Company Limited (Health care, Pharmaceuticals) | | | | | 2,800 | 169,219 |
| ENEOS Holdings Incorporated (Energy, Oil, gas & consumable fuels) | | | | | 51,000 | 189,326 |
| FANUC Corporation (Industrials, Machinery) | | | | | 2,300 | 450,897 |
| Fast Retailing Company Limited (Consumer discretionary, Specialty retail) | | | | | 600 | 355,214 |
| FUJIFILM Holdings Incorporated (Information technology, Technology hardware, storage & peripherals) | | | | | 5,100 | 401,171 |
| Fujitsu Limited (Information technology, IT services) | | | | | 3,300 | 545,436 |
| Hitachi Limited (Industrials, Industrial conglomerates) | | | | | 9,200 | 538,919 |
| Honda Motor Company Limited (Consumer discretionary, Automobiles) | | | | | 24,000 | 657,234 |
| Hoya Corporation (Health care, Health care equipment & supplies) | | | | | 4,600 | 728,118 |
| Iida Group Holdings Company Limited (Consumer discretionary, Household durables) | | | | | 13,200 | 272,585 |
| Inpex Holdings Incorporated (Energy, Oil, gas & consumable fuels) | | | | | 28,000 | 229,113 |
| Isuzu Motors Limited (Consumer discretionary, Automobiles) | | | | | 13,700 | 183,616 |
| Itochu Corporation (Industrials, Trading companies & distributors) | | | | | 18,400 | 526,205 |
| Itochu Techno-Solutions Corporation (Information technology, IT services) | | | | | 6,700 | 217,963 |
| Japan Post Holdings Company Limited (Financials, Insurance) | | | | | 15,000 | 231,713 |
| Japan Post Holdings Company Limited (Financials, Insurance) | | | | | 44,300 | 333,861 |
| Japan Post Holdings Company Limited (Financials, Insurance) | | | | | 39,300 | 321,101 |
| Kao Corporation (Consumer staples, Personal products) | | | | | 5,000 | 255,058 |
| KDDI Corporation (Communication services, Wireless telecommunication services) | | | | | 17,000 | 493,258 |
| Keyence Corporation (Information technology, Electronic equipment, instruments & components) | | | | | 2,000 | 1,235,162 |
| Kirin Holdings Company Limited (Consumer staples, Beverages) | | | | | 10,900 | 173,666 |
| Komatsu Limited (Industrials, Machinery) | | | | | 11,100 | 251,116 |
| Konami Holdings Corporation (Communication services, Entertainment) | | | | | 4,700 | 240,267 |
| Kubota Corporation (Industrials, Machinery) | | | | | 13,500 | 280,908 |
| Lawson Incorporated (Consumer staples, Food & staples retailing) | | | | | 7,800 | 382,431 |
| M3 Incorporated (Health care, Health care technology) | | | | | 6,100 | 327,926 |
| Marubeni Corporation (Industrials, Trading companies & distributors) | | | | | 41,600 | 372,003 |
| MediPal Holdings Corporation (Health care, Health care providers & services) | | | | | 11,500 | 206,687 |
| Mitsubishi Corporation (Industrials, Trading companies & distributors) | | | | | 18,500 | 550,087 |
| Mitsubishi Electric Corporation (Industrials, Electrical equipment) | | | | | 25,700 | 321,115 |
| Mitsubishi Estate Company Limited (Real estate, Real estate management & development) | | | | | 14,400 | 197,912 |
| Mitsubishi UFJ Financial Group Incorporated (Financials, Banks) | | | | | 62,200 | 328,502 |
| Mitsui & Company Limited (Industrials, Trading companies & distributors) | | | | | 26,200 | 589,065 |
| Mitsui Chemicals Incorporated (Materials, Chemicals) | | | | | 6,800 | 181,131 |
| Mitsui Fudosan Company Limited (Real estate, Real estate management & development) | | | | | 7,900 | 162,386 |
| Murata Manufacturing Company Limited (Information technology, Electronic equipment, instruments & components) | | | | | 7,800 | 572,239 |
| NEC Corporation (Information technology, IT services) | | | | | 7,800 | 351,915 |
The accompanying notes are an integral part of these financial statements.
Allspring Disciplined International Developed Markets Portfolio | 7
Portfolio of investments—November 30, 2021 (unaudited)
| | | | | | Shares | Value |
| Japan: (continued) | | | | | | |
| Nexon Company Limited (Communication services, Entertainment) | | | | | 13,100 | $ 260,070 |
| Nidec Corporation (Industrials, Electrical equipment) | | | | | 4,700 | 538,185 |
| Nintendo Company Limited (Communication services, Entertainment) | | | | | 1,900 | 837,934 |
| Nissan Motor Company Limited (Consumer discretionary, Automobiles) † | | | | | 58,500 | 289,261 |
| Nitori Holdings Company Limited (Consumer discretionary, Specialty retail) | | | | | 900 | 142,637 |
| Nitto Denko Corporation (Materials, Chemicals) | | | | | 6,000 | 415,974 |
| Nomura Holdings Incorporated (Financials, Capital markets) | | | | | 34,000 | 142,466 |
| Nomura Research Institute Limited (Information technology, IT services) | | | | | 5,700 | 243,687 |
| NTT Data Corporation (Information technology, IT services) | | | | | 14,100 | 297,564 |
| OBIC Company Limited (Information technology, IT services) | | | | | 1,800 | 331,043 |
| Olympus Corporation (Health care, Health care equipment & supplies) | | | | | 17,100 | 382,070 |
| Omron Corporation (Information technology, Electronic equipment, instruments & components) | | | | | 3,500 | 336,282 |
| Ono Pharmaceutical Company Limited (Health care, Pharmaceuticals) | | | | | 10,200 | 224,979 |
| ORIX Corporation (Financials, Diversified financial services) | | | | | 13,400 | 264,026 |
| Osaka Gas Company Limited (Utilities, Gas utilities) | | | | | 25,200 | 404,815 |
| Otsuka Corporation (Information technology, IT services) | | | | | 3,900 | 178,231 |
| Otsuka Holdings Company Limited (Health care, Pharmaceuticals) | | | | | 10,100 | 365,818 |
| Panasonic Corporation (Consumer discretionary, Household durables) | | | | | 34,000 | 370,686 |
| Rakuten Incorporated (Consumer discretionary, Internet & direct marketing retail) | | | | | 22,600 | 230,660 |
| Recruit Holdings Company Limited (Industrials, Professional services) | | | | | 14,600 | 886,507 |
| Rinnai Corporation (Consumer discretionary, Household durables) | | | | | 3,200 | 302,753 |
| Rohm Company Limited (Information technology, Semiconductors & semiconductor equipment) | | | | | 3,100 | 287,879 |
| Secom Company Limited (Industrials, Commercial services & supplies) | | | | | 4,400 | 297,846 |
| Seiko Epson Corporation (Information technology, Technology hardware, storage & peripherals) | | | | | 11,500 | 185,420 |
| Sekisui House Limited (Consumer discretionary, Household durables) | | | | | 9,000 | 174,913 |
| Seven & I Holdings Company Limited (Consumer staples, Food & staples retailing) | | | | | 9,000 | 362,497 |
| SG Holdings Company Limited (Industrials, Air freight & logistics) | | | | | 8,300 | 183,195 |
| Sharp Corporation (Consumer discretionary, Household durables) | | | | | 14,100 | 157,295 |
| Shimano Incorporated (Consumer discretionary, Leisure products) | | | | | 1,300 | 359,562 |
| Shin-Etsu Chemical Company Limited (Materials, Chemicals) | | | | | 3,600 | 599,640 |
| SMC Corporation (Industrials, Machinery) | | | | | 700 | 446,909 |
| SoftBank Corporation (Communication services, Wireless telecommunication services) | | | | | 38,600 | 531,312 |
| SoftBank Group Corporation (Communication services, Wireless telecommunication services) | | | | | 14,600 | 767,260 |
| Sompo Holdings Incorporated (Financials, Insurance) | | | | | 5,600 | 229,981 |
| Sony Corporation (Consumer discretionary, Household durables) | | | | | 11,700 | 1,427,502 |
| Square Enix Company Limited (Communication services, Entertainment) | | | | | 3,600 | 188,354 |
| Sumitomo Chemical Company Limited (Materials, Chemicals) | | | | | 70,900 | 325,222 |
| Sumitomo Corporation (Industrials, Trading companies & distributors) | | | | | 30,500 | 415,266 |
| Sumitomo Metal Mining Company Limited (Materials, Metals & mining) | | | | | 2,700 | 99,796 |
| Suntory Beverage & Food Limited (Consumer staples, Beverages) | | | | | 7,000 | 246,938 |
| Suzuki Motor Corporation (Consumer discretionary, Automobiles) | | | | | 5,100 | 205,875 |
| Sysmex Corporation (Health care, Health care equipment & supplies) | | | | | 1,100 | 136,821 |
| T&D Holdings Incorporated (Financials, Insurance) | | | | | 19,100 | 224,485 |
| Taisho Pharmaceutical (Health care, Pharmaceuticals) | | | | | 4,000 | 196,652 |
| Takeda Pharmaceutical Company Limited (Health care, Pharmaceuticals) | | | | | 19,100 | 510,981 |
| TDK Corporation (Information technology, Electronic equipment, instruments & components) | | | | | 9,100 | 359,991 |
| Terumo Corporation (Health care, Health care equipment & supplies) | | | | | 6,800 | 276,924 |
| Tokio Marine Holdings Incorporated (Financials, Insurance) | | | | | 7,500 | 376,645 |
The accompanying notes are an integral part of these financial statements.
8 | Allspring Disciplined International Developed Markets Portfolio
Portfolio of investments—November 30, 2021 (unaudited)
| | | | | | Shares | Value |
| Japan: (continued) | | | | | | |
| Tokyo Electron Limited (Information technology, Semiconductors & semiconductor equipment) | | | | | 2,000 | $ 1,050,939 |
| Tokyo Gas Company Limited (Utilities, Gas utilities) | | | | | 10,600 | 181,342 |
| Toppan Printing Company Limited (Industrials, Commercial services & supplies) | | | | | 12,800 | 194,023 |
| Toray Industries Incorporated (Materials, Chemicals) | | | | | 37,900 | 219,138 |
| Tosoh Corporation (Materials, Chemicals) | | | | | 17,700 | 253,044 |
| Toyo Suisan Kaisha Limited (Consumer staples, Food products) | | | | | 3,900 | 157,812 |
| Toyota Motor Corporation (Consumer discretionary, Automobiles) | | | | | 104,000 | 1,844,882 |
| Toyota Tsusho Corporation (Industrials, Trading companies & distributors) | | | | | 5,600 | 242,504 |
| Trend Micro Incorporated (Information technology, Software) | | | | | 5,200 | 299,849 |
| Unicharm Corporation (Consumer staples, Household products) | | | | | 6,100 | 264,229 |
| USS Company Limited (Consumer discretionary, Specialty retail) | | | | | 9,300 | 136,436 |
| Yahoo! Japan Corporation (Communication services, Interactive media & services) | | | | | 47,900 | 317,022 |
| Yamada Denki Company Limited (Consumer discretionary, Specialty retail) | | | | | 50,800 | 177,513 |
| Yamaha Motor Company Limited (Consumer discretionary, Automobiles) | | | | | 6,600 | 165,980 |
| Yamato Holdings Company Limited (Industrials, Air freight & logistics) | | | | | 10,200 | 225,156 |
| | | | | | | 41,413,677 |
| Luxembourg: 0.37% | | | | | | |
| ArcelorMittal SA (Materials, Metals & mining) | | | | | 10,711 | 290,781 |
| Eurofins Scientific SE (Health care, Life sciences tools & services) | | | | | 2,942 | 376,369 |
| | | | | | | 667,150 |
| Netherlands: 5.54% | | | | | | |
| Adyen NV (Information technology, IT services) 144A† | | | | | 205 | 567,816 |
| Airbus SE (Industrials, Aerospace & defense) † | | | | | 5,812 | 648,736 |
| Akzo Nobel NV (Materials, Chemicals) | | | | | 1,943 | 204,455 |
| ASML Holding NV (Information technology, Semiconductors & semiconductor equipment) | | | | | 4,652 | 3,651,264 |
| CNH Industrial NV (Industrials, Machinery) | | | | | 22,875 | 375,474 |
| ING Groep NV (Financials, Banks) | | | | | 48,979 | 676,569 |
| Koninklijke Ahold Delhaize NV (Consumer staples, Food & staples retailing) | | | | | 19,921 | 670,337 |
| Koninklijke Philips NV (Health care, Health care equipment & supplies) | | | | | 11,160 | 393,282 |
| NN Group NV (Financials, Insurance) | | | | | 8,354 | 415,106 |
| Prosus NV (Consumer discretionary, Internet & direct marketing retail) | | | | | 9,041 | 726,561 |
| Qiagen NV (Health care, Life sciences tools & services) † | | | | | 4,197 | 231,895 |
| Randstad Holdings NV (Industrials, Professional services) | | | | | 3,336 | 210,505 |
| Stellantis NV (Consumer discretionary, Automobiles) | | | | | 16,375 | 279,419 |
| STMicroelectronics NV (Information technology, Semiconductors & semiconductor equipment) | | | | | 8,664 | 421,952 |
| Universal Music Group NV (Communication services, Entertainment) | | | | | 7,006 | 201,101 |
| Wolters Kluwer NV (Communication services, Media) | | | | | 2,326 | 261,584 |
| | | | | | | 9,936,056 |
| New Zealand: 0.15% | | | | | | |
| Fisher & Paykel Healthcare Corporation (Health care, Health care equipment & supplies) | | | | | 11,692 | 264,538 |
| Norway: 0.43% | | | | | | |
| DNB Bank ASA (Financials, Banks) | | | | | 10,746 | 234,531 |
| Equinor ASA (Energy, Oil, gas & consumable fuels) | | | | | 21,657 | 541,879 |
| | | | | | | 776,410 |
The accompanying notes are an integral part of these financial statements.
Allspring Disciplined International Developed Markets Portfolio | 9
Portfolio of investments—November 30, 2021 (unaudited)
| | | | | | Shares | Value |
| Singapore: 0.68% | | | | | | |
| DBS Group Holdings Limited (Financials, Banks) | | | | | 21,200 | $ 461,791 |
| Genting Singapore Limited (Consumer discretionary, Hotels, restaurants & leisure) | | | | | 252,500 | 142,314 |
| Oversea-Chinese Banking Corporation Limited (Financials, Banks) | | | | | 42,400 | 339,802 |
| Wilmar International Limited (Consumer staples, Food products) | | | | | 93,200 | 279,524 |
| | | | | | | 1,223,431 |
| Spain: 2.31% | | | | | | |
| Banco Bilbao Vizcaya Argentaria SA (Financials, Banks) | | | | | 86,240 | 457,212 |
| Banco Santander Central Hispano SA (Financials, Banks) | | | | | 177,780 | 552,763 |
| CaixaBank SA (Financials, Banks) | | | | | 126,667 | 327,038 |
| Cellnex Telecom SA (Communication services, Diversified telecommunication services) 144A | | | | | 4,052 | 238,970 |
| Enagás SA (Utilities, Gas utilities) | | | | | 11,100 | 253,256 |
| Endesa SA (Utilities, Electric utilities) | | | | | 11,260 | 253,292 |
| Iberdrola SA (Utilities, Electric utilities) | | | | | 68,265 | 766,762 |
| Industria de Diseno Textil SA (Consumer discretionary, Specialty retail) | | | | | 11,494 | 363,333 |
| Red Eléctrica Corporacion SA (Utilities, Electric utilities) | | | | | 11,934 | 253,669 |
| Repsol SA (Energy, Oil, gas & consumable fuels) | | | | | 22,258 | 245,950 |
| Telefónica SA (Communication services, Diversified telecommunication services) | | | | | 96,060 | 435,828 |
| | | | | | | 4,148,073 |
| Sweden: 3.00% | | | | | | |
| Alfa Laval AB (Industrials, Machinery) | | | | | 5,520 | 212,992 |
| Assa Abloy AB Class B (Industrials, Building products) | | | | | 12,534 | 351,198 |
| Atlas Copco AB Class A (Industrials, Machinery) | | | | | 10,598 | 648,373 |
| Electrolux AB (Industrials, Electronic equipment, instruments & components) | | | | | 11,377 | 255,437 |
| Epiroc AB Class A (Industrials, Machinery) | | | | | 9,928 | 240,354 |
| Ericsson LM Class B (Information technology, Communications equipment) | | | | | 32,131 | 322,996 |
| Evolution Gaming Group (Consumer discretionary, Hotels, restaurants & leisure) 144A | | | | | 2,463 | 258,609 |
| Hennes & Mauritz AB Class B (Consumer discretionary, Specialty retail) | | | | | 4,817 | 84,912 |
| Hexagon AB Class B (Information technology, Electronic equipment, instruments & components) | | | | | 28,199 | 410,089 |
| Husqvarna AB Class B (Industrials, Machinery) | | | | | 23,609 | 332,380 |
| Industrivarden AB Class A (Financials, Diversified financial services) | | | | | 478 | 14,191 |
| Investor AB (Financials, Diversified financial services) | | | | | 15,366 | 357,053 |
| Kinnevik AB (Financials, Diversified financial services) | | | | | 6,801 | 242,478 |
| Sandvik AB (Industrials, Machinery) | | | | | 15,921 | 393,077 |
| Skanska AB Class B (Industrials, Construction & engineering) | | | | | 10,140 | 233,313 |
| Svenska Handelsbanken AB Class A (Financials, Banks) | | | | | 31,129 | 329,344 |
| Swedbank AB Class A (Financials, Banks) | | | | | 11,086 | 223,214 |
| Swedish Match AB (Consumer staples, Tobacco) | | | | | 28,224 | 205,918 |
| Volvo AB Class B (Industrials, Machinery) | | | | | 12,268 | 264,125 |
| | | | | | | 5,380,053 |
| Switzerland: 10.51% | | | | | | |
| ABB Limited (Industrials, Electrical equipment) | | | | | 17,459 | 603,781 |
| Adecco SA (Industrials, Professional services) | | | | | 2,961 | 137,223 |
| Alcon Incorporated (Health care, Health care equipment & supplies) | | | | | 3,908 | 308,688 |
| Barry Callebaut AG (Consumer staples, Food products) | | | | | 141 | 333,581 |
| Chocoladefabriken Lindt & Sprungli AG (Consumer staples, Food products) | | | | | 33 | 406,546 |
| Compagnie Financière Richemont SA (Consumer discretionary, Textiles, apparel & luxury goods) | | | | | 5,423 | 807,026 |
The accompanying notes are an integral part of these financial statements.
10 | Allspring Disciplined International Developed Markets Portfolio
Portfolio of investments—November 30, 2021 (unaudited)
| | | | | | Shares | Value |
| Switzerland: (continued) | | | | | | |
| Geberit AG (Industrials, Building products) | | | | | 672 | $ 513,079 |
| Givaudan SA (Materials, Chemicals) | | | | | 54 | 263,992 |
| Julius Bär Gruppe AG (Financials, Capital markets) | | | | | 5,236 | 324,967 |
| Kuehne & Nagel International AG (Industrials, Marine) | | | | | 1,119 | 319,887 |
| LafargeHolcim Limited (Materials, Construction materials) | | | | | 8,321 | 400,855 |
| Logitech International SA (Information technology, Technology hardware, storage & peripherals) | | | | | 3,258 | 259,838 |
| Lonza Group AG (Health care, Life sciences tools & services) | | | | | 570 | 459,618 |
| Nestle SA (Consumer staples, Food products) | | | | | 29,451 | 3,774,786 |
| Novartis AG (Health care, Pharmaceuticals) | | | | | 20,650 | 1,645,923 |
| Partners Group Holding AG (Financials, Capital markets) | | | | | 330 | 569,530 |
| Roche Holding AG (Health care, Pharmaceuticals) | | | | | 8,205 | 3,203,315 |
| Roche Holding AG (Health care, Pharmaceuticals) | | | | | 753 | 312,229 |
| Schindler Holding AG (Industrials, Machinery) | | | | | 1,054 | 261,594 |
| Sika AG (Materials, Chemicals) | | | | | 1,687 | 658,775 |
| Sonova Holding AG (Health care, Health care equipment & supplies) | | | | | 972 | 365,296 |
| Straumann Holding AG (Health care, Health care equipment & supplies) | | | | | 100 | 212,595 |
| Swiss Life Holding AG (Financials, Insurance) | | | | | 506 | 290,414 |
| Swisscom AG (Communication services, Diversified telecommunication services) | | | | | 532 | 295,532 |
| The Swatch Group AG Class B (Consumer discretionary, Textiles, apparel & luxury goods) | | | | | 2,122 | 623,251 |
| UBS Group AG (Financials, Capital markets) | | | | | 50,649 | 875,796 |
| Zurich Insurance Group AG (Financials, Insurance) | | | | | 1,501 | 617,075 |
| | | | | | | 18,845,192 |
| United Kingdom: 13.26% | | | | | | |
| Admiral Group plc (Financials, Insurance) | | | | | 6,556 | 257,744 |
| Anglo American plc (Materials, Metals & mining) | | | | | 15,833 | 582,810 |
| Ashtead Group plc (Industrials, Trading companies & distributors) | | | | | 6,377 | 513,017 |
| AstraZeneca plc (Health care, Pharmaceuticals) | | | | | 17,800 | 1,951,499 |
| Aviva plc (Financials, Insurance) | | | | | 52,818 | 269,565 |
| BAE Systems plc (Industrials, Aerospace & defense) | | | | | 39,622 | 288,561 |
| Barclays plc (Financials, Banks) | | | | | 130,732 | 319,206 |
| Barratt Developments plc (Consumer discretionary, Household durables) | | | | | 24,676 | 228,521 |
| Berkeley Group Holdings (Consumer discretionary, Household durables) | | | | | 3,382 | 192,522 |
| BHP Group plc (Materials, Metals & mining) | | | | | 22,040 | 602,266 |
| BP plc (Energy, Oil, gas & consumable fuels) | | | | | 225,318 | 977,593 |
| British American Tobacco plc (Consumer staples, Tobacco) | | | | | 31,496 | 1,054,083 |
| BT Group plc (Communication services, Diversified telecommunication services) † | | | | | 111,678 | 235,093 |
| Bunzl plc (Industrials, Trading companies & distributors) | | | | | 9,440 | 359,182 |
| Burberry Group plc (Consumer discretionary, Textiles, apparel & luxury goods) | | | | | 7,488 | 175,870 |
| Compass Group plc (Consumer discretionary, Hotels, restaurants & leisure) † | | | | | 20,409 | 398,136 |
| Diageo plc (Consumer staples, Beverages) | | | | | 26,806 | 1,352,851 |
| Experian Group Limited plc (Industrials, Professional services) | | | | | 8,463 | 379,954 |
| Ferguson plc (Industrials, Trading companies & distributors) | | | | | 3,141 | 478,147 |
| GlaxoSmithKline plc (Health care, Pharmaceuticals) | | | | | 41,354 | 839,614 |
| Glencore plc (Materials, Metals & mining) | | | | | 105,113 | 499,055 |
| GVC Holdings plc (Consumer discretionary, Hotels, restaurants & leisure) † | | | | | 7,756 | 172,394 |
| Hargreaves Lansdown plc (Financials, Capital markets) | | | | | 8,749 | 155,288 |
| HSBC Holdings plc (Financials, Banks) | | | | | 219,857 | 1,215,017 |
| Imperial Tobacco Group plc (Consumer staples, Tobacco) | | | | | 18,002 | 367,902 |
| Johnson Matthey plc (Materials, Chemicals) | | | | | 4,009 | 111,378 |
| Kingfisher plc (Consumer discretionary, Specialty retail) | | | | | 49,372 | 207,472 |
The accompanying notes are an integral part of these financial statements.
Allspring Disciplined International Developed Markets Portfolio | 11
Portfolio of investments—November 30, 2021 (unaudited)
| | | | | | Shares | Value |
| United Kingdom: (continued) | | | | | | |
| Lloyds Banking Group plc (Financials, Banks) | | | | | 711,760 | $ 441,962 |
| London Stock Exchange Group plc (Financials, Capital markets) | | | | | 3,050 | 264,224 |
| National Grid plc (Utilities, Multi-utilities) | | | | | 28,800 | 382,149 |
| Persimmon plc (Consumer discretionary, Household durables) | | | | | 5,066 | 184,102 |
| Phoenix Group Holdings plc (Financials, Insurance) | | | | | 21,023 | 178,517 |
| Prudential plc (Financials, Insurance) | | | | | 29,066 | 490,961 |
| RELX plc (Industrials, Professional services) | | | | | 13,306 | 412,761 |
| Rentokil Initial plc (Industrials, Commercial services & supplies) | | | | | 19,374 | 157,775 |
| Rio Tinto plc (Materials, Metals & mining) | | | | | 11,445 | 701,626 |
| Rolls-Royce Holdings plc (Industrials, Aerospace & defense) † | | | | | 73,316 | 119,604 |
| Royal Dutch Shell plc Class A (Energy, Oil, gas & consumable fuels) | | | | | 51,326 | 1,073,707 |
| Royal Dutch Shell plc Class B (Energy, Oil, gas & consumable fuels) | | | | | 32,512 | 681,319 |
| Schroders plc (Financials, Capital markets) | | | | | 6,156 | 280,737 |
| Segro plc (Real estate, Equity REITs) | | | | | 13,967 | 261,032 |
| Smith & Nephew plc (Health care, Health care equipment & supplies) | | | | | 11,422 | 183,567 |
| Smiths Group plc (Industrials, Industrial conglomerates) | | | | | 10,216 | 195,118 |
| SSE plc (Utilities, Electric utilities) | | | | | 24,088 | 495,222 |
| Standard Chartered plc (Financials, Banks) | | | | | 43,017 | 236,727 |
| Unilever plc (Consumer staples, Personal products) | | | | | 14,887 | 766,758 |
| Unilever plc (London Exchange) (Consumer staples, Personal products) | | | | | 20,951 | 1,070,030 |
| Vodafone Group plc (Communication services, Wireless telecommunication services) | | | | | 354,400 | 513,815 |
| WPP plc (Communication services, Media) | | | | | 36,335 | 504,334 |
| | | | | | | 23,780,787 |
| United States: 0.01% | | | | | | |
| Jackson Financial Incorporated Class A (Financials, Diversified financial services) | | | | | 726 | 23,472 |
| Total Common stocks (Cost $142,232,468) | | | | | | 172,176,058 |
| | | Dividend
yield | | | | |
| Preferred stocks: 0.74% | | | | | | |
| Germany: 0.74% | | | | | | |
| Fuchs Petrolub SE (Materials, Chemicals) | | 2.46% | | | 3,710 | 166,618 |
| Henkel AG & Company KGaA (Consumer staples, Household products) | | 2.82 | | | 3,081 | 243,092 |
| Sartorius AG Vorzug (Health care, Health care equipment & supplies) | | 0.12 | | | 379 | 260,726 |
| Volkswagen AG ADR (Consumer discretionary, Automobiles) | | 2.57 | | | 3,565 | 651,308 |
| | | | | | | 1,321,744 |
| Total Preferred stocks (Cost $1,359,367) | | | | | | 1,321,744 |
| | | Yield | | | | |
| Short-term investments: 2.59% | | | | | | |
| Investment companies: 2.59% | | | | | | |
| Allspring Government Money Market Fund Select Class ♠∞ | | 0.03 | | | 4,080,632 | 4,080,632 |
| Securities Lending Cash Investments LLC ♠∩∞ | | 0.04 | | | 567,720 | 567,720 |
| Total Short-term investments (Cost $4,648,352) | | | | | | 4,648,352 |
| Total investments in securities (Cost $148,240,187) | 99.35% | | | | | 178,146,154 |
| Other assets and liabilities, net | 0.65 | | | | | 1,166,192 |
| Total net assets | 100.00% | | | | | $179,312,346 |
The accompanying notes are an integral part of these financial statements.
12 | Allspring Disciplined International Developed Markets Portfolio
Portfolio of investments—November 30, 2021 (unaudited)
| † | Non-income-earning security |
| 144A | The security may be resold in transactions exempt from registration, normally to qualified institutional buyers, pursuant to Rule 144A under the Securities Act of 1933. |
| « | All or a portion of this security is on loan. |
| ♠ | The issuer of the security is an affiliated person of the Portfolio as defined in the Investment Company Act of 1940. |
| ∩ | The investment is a non-registered investment company purchased with cash collateral received from securities on loan. |
| ∞ | The rate represents the 7-day annualized yield at period end. |
| Abbreviations: |
| ADR | American depositary receipt |
| REIT | Real estate investment trust |
Investments in affiliates
An affiliated investment is an investment in which the Portfolio owns at least 5% of the outstanding voting shares of the issuer or as a result of other relationships, such as the Portfolio and the issuer having the same adviser or investment manager. Transactions with issuers that were either affiliates of the Portfolio at the beginning of the period or the end of the period were as follows:
| | Value,
beginning of
period | Purchases | Sales
proceeds | Net
realized
gains
(losses) | | Net
change in
unrealized
gains
(losses) | | Value,
end of
period | Shares,
end
of period | Income
from
affiliated
securities |
| Short-term investments | | | | | | | | | |
| Allspring Government Money Market Fund Select Class | $1,648,018 | $19,126,269 | $(16,693,655) | $0 | | $0 | | $ 4,080,632 | 4,080,632 | $460 |
| Securities Lending Cash Investments LLC | 2,186,481 | 6,592,679 | (8,211,440) | 0 | | 0 | | 567,720 | 567,720 | 90 # |
| | | | | $0 | | $0 | | $4,648,352 | | $550 |
| # | Amount shown represents income before fees and rebates. |
Futures contracts
| Description | Number of
contracts | Expiration
date | Notional
cost | Notional
value | Unrealized
gains | Unrealized
losses |
| Long | | | | | | |
| MSCI EAFE Index | 38 | 12-17-2021 | $4,434,976 | $4,247,450 | $0 | $(187,526) |
The accompanying notes are an integral part of these financial statements.
Allspring Disciplined International Developed Markets Portfolio | 13
Statement of assets and liabilities—November 30, 2021 (unaudited)
| | |
| Assets | |
Investments in unaffiliated securities (including $540,563 of securities loaned), at value (cost $143,591,835)
| $ 173,497,802 |
Investments in affiliated securities, at value (cost $4,648,352)
| 4,648,352 |
Cash at broker segregated for futures contracts
| 540,573 |
Foreign currency, at value (cost $142,950)
| 143,912 |
Receivable for dividends
| 1,070,472 |
Receivable for investments sold
| 19,697 |
Receivable for securities lending income, net
| 572 |
Prepaid expenses and other assets
| 26,508 |
Total assets
| 179,947,888 |
| Liabilities | |
Payable upon receipt of securities loaned
| 567,720 |
Advisory fee payable
| 38,741 |
Payable for daily variation margin on open futures contracts
| 29,081 |
Total liabilities
| 635,542 |
Total net assets
| $179,312,346 |
The accompanying notes are an integral part of these financial statements.
14 | Allspring Disciplined International Developed Markets Portfolio
Statement of operations—six months ended November 30, 2021 (unaudited)
| | |
| Investment income | |
Dividends (net of foreign withholdings taxes of $302,588)
| $ 2,325,024 |
Income from affiliated securities
| 90,040 |
Total investment income
| 2,415,064 |
| Expenses | |
Advisory fee
| 240,666 |
Custody and accounting fees
| 76,735 |
Professional fees
| 27,194 |
Interest holder report expenses
| 14,208 |
Trustees’ fees and expenses
| 9,662 |
Other fees and expenses
| 30,887 |
Total expenses
| 399,352 |
Net investment income
| 2,015,712 |
| Realized and unrealized gains (losses) on investments | |
| Net realized gains on | |
Unaffiliated securities
| 5,640,971 |
Futures contracts
| 372,286 |
Net realized gains on investments
| 6,013,257 |
| Net change in unrealized gains (losses) on | |
Unaffiliated securities
| (15,271,526) |
Futures contracts
| (245,595) |
Net change in unrealized gains (losses) on investments
| (15,517,121) |
Net realized and unrealized gains (losses) on investments
| (9,503,864) |
Net decrease in net assets resulting from operations
| $ (7,488,152) |
The accompanying notes are an integral part of these financial statements.
Allspring Disciplined International Developed Markets Portfolio | 15
Statement of changes in net assets
| | | |
| | Six months ended
November 30, 2021
(unaudited) | Year ended
May 31, 2021 |
| Operations | | |
Net investment income
| $ 2,015,712 | $ 4,321,572 |
Net realized gains on investments
| 6,013,257 | 41,094,177 |
Net change in unrealized gains (losses) on investments
| (15,517,121) | 19,528,673 |
Net increase (decrease) in net assets resulting from operations
| (7,488,152) | 64,944,422 |
| Capital transactions | | |
| Transactions in investors’ beneficial interests | | |
Contributions
| 705,589 | 3,259,460 |
Withdrawals
| (18,542,249) | (42,716,944) |
Net decrease in net assets resulting from capital transactions
| (17,836,660) | (39,457,484) |
Total increase (decrease) in net assets
| (25,324,812) | 25,486,938 |
| Net assets | | |
Beginning of period
| 204,637,158 | 179,150,220 |
End of period
| $179,312,346 | $204,637,158 |
The accompanying notes are an integral part of these financial statements.
16 | Allspring Disciplined International Developed Markets Portfolio
| | | Year ended May 31 |
| | Six months ended
November 30, 2021
(unaudited) | 2021 | 2020 | 2019 | 2018 | 2017 |
Total return1
| (4.44)% | 39.97% | 1.76% | (0.14)% | 9.46% | 10.31% |
| Ratios to average net assets (annualized) | | | | | | |
Gross expenses
| 0.41% | 0.43% | 0.91% | 0.89% | 1.10% | 0.98% |
Net expenses2
| 0.41% | 0.43% | 0.91% | 0.89% | 1.06% | 0.98% |
Net investment income
| 2.09% | 2.23% | 0.34% | 1.24% | 0.70% | 1.25% |
| Supplemental data | | | | | | |
Portfolio turnover rate
| 12% | 127% | 53% | 100% | 71% | 121% |
| 1 | Returns for periods of less than one year are not annualized. |
| 2 | Net expense ratios reflect voluntary waivers. |
The accompanying notes are an integral part of these financial statements.
Allspring Disciplined International Developed Markets Portfolio | 17
Notes to financial statements (unaudited)
1. ORGANIZATION
Allspring Master Trust (the "Trust"), a Delaware statutory trust organized on March 10, 1999, is an open-end management investment company registered under the Investment Company Act of 1940, as amended (the "1940 Act"). As an investment company, the Trust follows the accounting and reporting guidance in Financial Accounting Standards Board ("FASB") Accounting Standards Codification Topic 946, Financial Services – Investment Companies. These financial statements report on the Allspring Disciplined International Developed Markets Portfolio (the "Portfolio") which is a diversified series of the Trust.
Interests in the Portfolio are available solely through private placement transactions that do not involve any "public offering" within the meaning of Section 4(a)(2) of the Securities Act of 1933.
On February 23, 2021, Wells Fargo & Company entered into a definitive agreement to sell Wells Fargo Asset Management ("WFAM") to GTCR LLC and Reverence Capital Partners, L.P. WFAM was the trade name used by the asset management businesses of Wells Fargo & Company and included Wells Fargo Funds Management, LLC, Wells Capital Management, LLC, Wells Fargo Asset Management (International) Limited and Wells Fargo Funds Distributor, LLC. Effective on November 1, 2021, the sale transaction of WFAM by Wells Fargo & Company to GTCR LLC and Reverence Capital Partners, L.P. was closed. In connection with the closing of the transaction, WFAM became known as Allspring Global Investments (“Allspring”) and various entities that provide services to the Portfolio changed their names to "Allspring", including Allspring Funds Management, LLC (formerly Wells Fargo Funds Management, LLC), the adviser to the Portfolio, Allspring Global Investments, Inc. (formerly Wells Capital Management, LLC) and Allspring Global Investments (UK) Limited (formerly Wells Fargo Asset Management (International) Limited), both registered investment advisers providing subadvisory services to certain funds, and Allspring Funds Distributor, LLC (formerly Wells Fargo Funds Distributor, LLC).
Consummation of the transaction resulted in the automatic termination of the Portfolio’s advisory agreement and subadvisory agreement. The Portfolio’s Board of Trustees approved a new advisory agreement and subadvisory agreement which were approved by the Portfolio's interest holders on August 16, 2021. The new agreements became effective on November 1, 2021.
Effective December 6, 2021, "Wells Fargo" was removed from the Portfolio's name and replaced it with "Allspring".
2. SIGNIFICANT ACCOUNTING POLICIES
The following significant accounting policies, which are consistently followed in the preparation of the financial statements of the Portfolio, are in conformity with U.S. generally accepted accounting principles which require management to make estimates and assumptions that affect the reported amounts of assets and liabilities, disclosure of contingent assets and liabilities at the date of the financial statements, and the reported amounts of income and expenses during the reporting period. Actual results could differ from those estimates.
Securities valuation
All investments are valued each business day as of the close of regular trading on the New York Stock Exchange (generally 4 p.m. Eastern Time), although the Portfolio may deviate from this calculation time under unusual or unexpected circumstances.
Equity securities and futures contracts that are listed on a foreign or domestic exchange or market are valued at the official closing price or, if none, the last sales price. If no sale occurs on the principal exchange or market that day, a fair value price will be determined in accordance with the Portfolio’s Valuation Procedures.
The values of securities denominated in foreign currencies are translated into U.S. dollars at rates provided by an independent foreign currency pricing source at a time each business day specified by the Allspring Global Investments Pricing Committee at Allspring Funds Management, LLC ("Allspring Funds Management").
Many securities markets and exchanges outside the U.S. close prior to the close of the New York Stock Exchange and therefore may not fully reflect trading or events that occur after the close of the principal exchange in which the foreign securities are traded, but before the close of the New York Stock Exchange. If such trading or events are expected to materially affect the value of such securities, then fair value pricing procedures approved by the Board of Trustees of the Portfolio are applied. These procedures take into account multiple factors including movements in U.S. securities markets after foreign exchanges close. Foreign securities that are fair valued under these procedures are categorized as Level 2 and the application of these procedures may result in transfers between Level 1 and Level 2. Depending on market activity, such fair valuations may be frequent. Such fair value pricing may result in net asset values that are higher or lower than net asset values based on the last reported sales price or latest quoted bid price. On November 30, 2021, such fair value pricing was used in pricing certain foreign securities.
18 | Allspring Disciplined International Developed Markets Portfolio
Notes to financial statements (unaudited)
Investments in registered open-end investment companies are valued at net asset value. Interests in non-registered investment companies that are redeemable at net asset value are fair valued normally at net asset value.
Investments which are not valued using any of the methods discussed above are valued at their fair value, as determined in good faith by the Board of Trustees. The Board of Trustees has established a Valuation Committee comprised of the Trustees and has delegated to it the authority to take any actions regarding the valuation of portfolio securities that the Valuation Committee deems necessary or appropriate, including determining the fair value of portfolio securities, unless the determination has been delegated to the Allspring Global Investments Pricing Committee. The Board of Trustees retains the authority to make or ratify any valuation decisions or approve any changes to the Valuation Procedures as it deems appropriate. On a quarterly basis, the Board of Trustees receives reports on any valuation actions taken by the Valuation Committee or the Allspring Global Investments Pricing Committee which may include items for ratification.
Foreign currency translation
The accounting records of the Portfolio are maintained in U.S. dollars. The values of other assets and liabilities denominated in foreign currencies are translated into U.S. dollars at rates provided by an independent foreign currency pricing source at a time each business day specified by the Allspring Global Investments Pricing Committee. Purchases and sales of securities, and income and expenses are converted at the rate of exchange on the respective dates of such transactions. Net realized foreign exchange gains or losses arise from sales of foreign currencies, currency gains or losses realized between the trade and settlement dates on securities transactions, and the difference between the amounts of dividends, interest and foreign withholding taxes recorded and the U.S. dollar equivalent of the amounts actually paid or received. Net unrealized foreign exchange gains and losses arise from changes in the fair value of assets and liabilities other than investments in securities resulting from changes in exchange rates. The changes in net assets arising from changes in exchange rates of securities and the changes in net assets resulting from changes in market prices of securities are not separately presented. Such changes are included in net realized and unrealized gains or losses from investments.
Securities lending
The Portfolio may lend its securities from time to time in order to earn additional income in the form of fees or interest on securities received as collateral or the investment of any cash received as collateral. When securities are on loan, the Portfolio receives interest or dividends on those securities. Cash collateral received in connection with its securities lending transactions is invested in Securities Lending Cash Investments, LLC (the "Securities Lending Fund"), an affiliated non-registered investment company. Investments in Securities Lending Fund are valued at the evaluated bid price provided by an independent pricing service. Income earned from investment in the Securities Lending Fund (net of fees and rebates), if any, is included in income from affiliated securities on the Statement of Operations.
In a securities lending transaction, the net asset value of the Portfolio is affected by an increase or decrease in the value of the securities loaned and by an increase or decrease in the value of the instrument in which collateral is invested. The amount of securities lending activity undertaken by the Portfolio fluctuates from time to time. The Portfolio has the right under the lending agreement to recover the securities from the borrower on demand. In the event of default or bankruptcy by the borrower, the Portfolio may be prevented from recovering the loaned securities or gaining access to the collateral or may experience delays or costs in doing so. In such an event, the terms of the agreement allow the unaffiliated securities lending agent to use the collateral to purchase replacement securities on behalf of the Portfolio or pay the Portfolio the market value of the loaned securities. The Portfolio bears the risk of loss with respect to depreciation of its investment of the cash collateral.
Futures contracts
Futures contracts are agreements between the Portfolio and a counterparty to buy or sell a specific amount of a commodity, financial instrument or currency at a specified price on a specified date. The Portfolio may buy and sell futures contracts in order to gain exposure to, or protect against, changes in security values and is subject to equity price risk. The primary risks associated with the use of futures contracts are the imperfect correlation between changes in market values of securities held by the Portfolio and the prices of futures contracts, and the possibility of an illiquid market. Futures contracts are generally entered into on a regulated futures exchange and cleared through a clearinghouse associated with the exchange. With futures contracts, there is minimal counterparty risk to the Portfolio since futures contracts are exchange traded and the exchange’s clearinghouse, as the counterparty to all exchange traded futures, guarantees the futures contracts against default.
Upon entering into a futures contract, the Portfolio is required to deposit either cash or securities (initial margin) with the broker in an amount equal to a certain percentage of the contract value. Subsequent payments (variation margin) are paid to or from the broker each day equal to the daily changes in the contract value. Such payments are recorded as unrealized gains or losses and, if any, shown as variation margin receivable (payable) in the Statement of Assets and Liabilities. Should the Portfolio
Allspring Disciplined International Developed Markets Portfolio | 19
Notes to financial statements (unaudited)
fail to make requested variation margin payments, the broker can gain access to the initial margin to satisfy the Portfolio’s payment obligations. When the contracts are closed, a realized gain or loss is recorded in the Statement of Operations.
Security transactions and income recognition
Securities transactions are recorded on a trade date basis. Realized gains or losses are recorded on the basis of identified cost.
Dividend income is recognized on the ex-dividend date, except for certain dividends from foreign securities, which are recorded as soon as the custodian verifies the ex-dividend date. Dividend income is recorded net of foreign taxes withheld where recovery of such taxes is not assured.
Federal and other taxes
The Portfolio is not required to pay federal income taxes on its net investment income and net capital gains as it is treated as a partnership for federal income tax purposes. All income, gains and losses of the Portfolio are deemed to have been “passed through” to the interest holders in proportion to their holdings of the Portfolio regardless of whether income and gains have been distributed by the Portfolio.
The Portfolio’s income tax returns and all financial records supporting those returns for the prior three fiscal years are subject to examination by the federal revenue authority. Management has analyzed the Portfolio’s tax positions taken on federal, state, and foreign tax returns for all open tax years and does not believe that there are any uncertain tax positions that require recognition of a tax liability.
As of November 30, 2021, the aggregate cost of all investments for federal income tax purposes was $147,993,024 and the unrealized gains (losses) consisted of:
| Gross unrealized gains | $35,655,791 |
| Gross unrealized losses | (5,690,187) |
| Net unrealized gains | $29,965,604 |
3. FAIR VALUATION MEASUREMENTS
Fair value measurements of investments are determined within a framework that has established a fair value hierarchy based upon the various data inputs utilized in determining the value of the Portfolio’s investments. The three-level hierarchy gives the highest priority to unadjusted quoted prices in active markets for identical assets or liabilities (Level 1) and the lowest priority to unobservable inputs (Level 3). The Portfolio’s investments are classified within the fair value hierarchy based on the lowest level of input that is significant to the fair value measurement. The inputs are summarized into three broad levels as follows:
| ■ | Level 1 – quoted prices in active markets for identical securities |
| ■ | Level 2 – other significant observable inputs (including quoted prices for similar securities, interest rates, prepayment speeds, credit risk, etc.) |
| ■ | Level 3 – significant unobservable inputs (including the Portfolio’s own assumptions in determining the fair value of investments) |
The inputs or methodologies used for valuing investments in securities are not necessarily an indication of the risk associated with investing in those securities.
20 | Allspring Disciplined International Developed Markets Portfolio
Notes to financial statements (unaudited)
The following is a summary of the inputs used in valuing the Portfolio’s assets and liabilities as of November 30, 2021:
| | Quoted prices
(Level 1) | Other significant
observable inputs
(Level 2) | Significant
unobservable inputs
(Level 3) | Total |
| Assets | | | | |
| Investments in: | | | | |
| Common stocks | | | | |
| Australia | $ 0 | $ 11,325,573 | $0 | $ 11,325,573 |
| Austria | 0 | 483,227 | 0 | 483,227 |
| Belgium | 0 | 1,026,279 | 0 | 1,026,279 |
| Denmark | 0 | 5,030,336 | 0 | 5,030,336 |
| Finland | 0 | 2,461,156 | 0 | 2,461,156 |
| France | 0 | 20,304,430 | 0 | 20,304,430 |
| Germany | 0 | 14,831,686 | 0 | 14,831,686 |
| Hong Kong | 0 | 5,108,472 | 0 | 5,108,472 |
| Ireland | 0 | 1,230,798 | 0 | 1,230,798 |
| Israel | 363,708 | 487,146 | 0 | 850,854 |
| Italy | 0 | 3,064,408 | 0 | 3,064,408 |
| Japan | 0 | 41,413,677 | 0 | 41,413,677 |
| Luxembourg | 0 | 667,150 | 0 | 667,150 |
| Netherlands | 201,101 | 9,734,955 | 0 | 9,936,056 |
| New Zealand | 0 | 264,538 | 0 | 264,538 |
| Norway | 0 | 776,410 | 0 | 776,410 |
| Singapore | 0 | 1,223,431 | 0 | 1,223,431 |
| Spain | 1,020,054 | 3,128,019 | 0 | 4,148,073 |
| Sweden | 0 | 5,380,053 | 0 | 5,380,053 |
| Switzerland | 406,546 | 18,438,646 | 0 | 18,845,192 |
| United Kingdom | 766,758 | 23,014,029 | 0 | 23,780,787 |
| United States | 23,472 | 0 | 0 | 23,472 |
| Preferred stocks | | | | |
| Germany | 166,618 | 1,155,126 | 0 | 1,321,744 |
| Short-term investments | | | | |
| Investment companies | 4,648,352 | 0 | 0 | 4,648,352 |
| Total assets | $7,596,609 | $170,549,545 | $0 | $178,146,154 |
| Liabilities | | | | |
| Futures contracts | $ 187,526 | $ 0 | $0 | $ 187,526 |
| Total liabilities | $ 187,526 | $ 0 | $0 | $ 187,526 |
Futures contracts are reported at their cumulative unrealized gains (losses) at measurement date as reported in the table following the Portfolio of Investments. For futures contracts, the current day’s variation margin is reported on the Statement of Assets and Liabilities. All other assets and liabilities are reported at their market value at measurement date.
Additional sector, industry or geographic detail, if any, is included in the Portfolio of Investments.
For the six months ended November 30, 2021, the Portfolio did not have any transfers into/out of Level 3.
4. TRANSACTIONS WITH AFFILIATES
Advisory fee
The Trust has entered into an advisory contract with Allspring Funds Management, a wholly owned subsidiary of Allspring Global Investments Holdings, LLC, a holding company indirectly owned by certain private funds of GTCR LLC and Reverence Capital Partners, L.P. The adviser is responsible for implementing investment policies and guidelines and for supervising the subadviser, who is responsible for day-to-day portfolio management of the Portfolio. Pursuant to the contract, Allspring Funds Management is entitled to receive an advisory fee at the following annual rate based on the Portfolio’s average daily net assets:
Allspring Disciplined International Developed Markets Portfolio | 21
Notes to financial statements (unaudited)
| Average daily net assets | Advisory fee |
| First $1 billion | 0.250% |
| Next $4 billion | 0.225 |
| Over $5 billion | 0.200 |
For the six months ended November 30, 2021, the advisory fee was equivalent to an annual rate of 0.25% of the Portfolio’s average daily net assets.
Allspring Funds Management has retained the services of a subadviser to provide daily portfolio management to the Portfolio. The fee for subadvisory services is borne by Allspring Funds Management. Allspring Global Investments, LLC ("Allspring Investments"), an affiliate of Allspring Funds Management and a wholly owned subsidiary of Allspring Global Investments Holdings, LLC, is the subadviser to the Portfolio and is entitled to receive a fee from Allspring Funds Management at an annual rate starting at 0.20% and declining to 0.15% as the average daily net assets of the Portfolio increase.
Interfund transactions
The Portfolio may purchase or sell portfolio investment securities to certain affiliates pursuant to Rule 17a-7 under the 1940 Act and under procedures adopted by the Board of Trustees. The procedures have been designed to ensure that these interfund transactions, which do not incur broker commissions, are effected at current market prices.
5. INVESTMENT PORTFOLIO TRANSACTIONS
Purchases and sales of investments, excluding U.S. government obligations (if any) and short-term securities, for the six months ended November 30, 2021 were $22,029,202 and $40,218,180, respectively.
6. SECURITIES LENDING TRANSACTIONS
The Portfolio lends its securities through an unaffiliated securities lending agent and receives collateral in the form of cash or securities with a value at least equal to the value of the securities on loan. The value of the loaned securities is determined at the close of each business day and any increases or decreases in the required collateral are exchanged between the Portfolio and the counterparty on the next business day. Cash collateral received is invested in the Securities Lending Fund which seeks to provide a positive return compared to the daily Federal Funds Open Rate by investing in high-quality, U.S. dollar-denominated short-term money market instruments and is exempt from registration under Section 3(c)(7) of the 1940 Act. Securities Lending Fund is managed by Allspring Funds Management and is subadvised by Allspring Investments. Allspring Funds Management receives an advisory fee starting at 0.05% and declining to 0.01% as the average daily net assets of the Securities Lending Fund increase. All of the fees received by Allspring Funds Management are paid to Allspring Investments for its services as subadviser.
In the event of counterparty default or the failure of a borrower to return a loaned security, the Portfolio has the right to use the collateral to offset any losses incurred. As of November 30, 2021, the Portfolio had securities lending transactions with the following counterparties which are subject to offset:
| Counterparty | Value of
securities on
loan | Collateral
received1 | Net amount |
| UBS Securities LLC | $540,563 | $(540,563) | $0 |
1 Collateral received within this table is limited to the collateral for the net transaction with the counterparty.
7. DERIVATIVE TRANSACTIONS
During the six months ended November 30, 2021, the Portfolio entered into futures contracts to gain market exposure. The Portfolio had an average notional amount of $4,216,139 in long futures contracts during the six months ended November 30, 2021.
The fair value, realized gains or losses and change in unrealized gains or losses, if any, on derivative instruments are reflected in the corresponding financial statement captions.
22 | Allspring Disciplined International Developed Markets Portfolio
Notes to financial statements (unaudited)
8. BANK BORROWINGS
The Trust, along with Allspring Variable Trust and Allspring Funds Trust (excluding the money market funds), are parties to a $350,000,000 revolving credit agreement whereby the Portfolio is permitted to use bank borrowings for temporary or emergency purposes, such as to fund interest holders withdrawal requests. Interest under the credit agreement is charged to the Portfolio based on a borrowing rate equal to the higher of the Federal Funds rate in effect on that day plus 1.25% or the overnight bank funding rate in effect on that day plus 1.25%. In addition, an annual commitment fee equal to 0.25% of the unused balance is allocated to each participating fund.
For the six months ended November 30, 2021, there were no borrowings by the Portfolio under the agreement.
9. CONCENTRATION RISKS
As of the end of the period, the Portfolio concentrated its portfolio of investments in Europe. A fund that invests a substantial portion of its assets in any country or geographic region will be more vulnerable than a fund that invests its assets more broadly to the economic, financial, political or other developments affecting that country or region. Such developments may have a significant impact on the Portfolio’s investment performance causing such performance to be more volatile than the investment performance of a more geographically diversified fund.
10. INDEMNIFICATION
Under the Portfolio's organizational documents, the officers and Trustees have been granted certain indemnification rights against certain liabilities that may arise out of performance of their duties to the Portfolio. The Portfolio has entered into a separate agreement with each Trustee that converts indemnification rights currently existing under the Portfolio’s organizational documents into contractual rights that cannot be changed in the future without the consent of the Trustee. Additionally, in the normal course of business, the Portfolio may enter into contracts with service providers that contain a variety of indemnification clauses. The Portfolio’s maximum exposure under these arrangements is dependent on future claims that may be made against the Portfolio and, therefore, cannot be estimated.
11. CORONAVIRUS (COVID-19) PANDEMIC
On March 11, 2020, the World Health Organization announced that it had made the assessment that coronavirus disease 2019 (“COVID-19”) is a pandemic. The impacts of COVID-19 are affecting the entire global economy, individual companies and investment products, the funds, and the market in general. There is significant uncertainty around the extent and duration of business disruptions related to COVID-19 and the impacts may last for an extended period of time. COVID-19 has led to significant uncertainty and volatility in the financial markets.
Allspring Disciplined International Developed Markets Portfolio | 23
Other information (unaudited)
PROXY VOTING INFORMATION
A description of the policies and procedures used to determine how to vote proxies relating to portfolio securities is available without charge, upon request, by calling 1-800-222-8222, visiting our website at allspringglobal.com, or visiting the SEC website at sec.gov. Information regarding how the proxies related to portfolio securities were voted during the most recent 12-month period ended June 30 is available on the website at allspringglobal.com or by visiting the SEC website at sec.gov.
QUARTERLY PORTFOLIO HOLDINGS INFORMATION
The Portfolio files its complete schedule of portfolio holdings with the SEC for the first and third quarters of each fiscal year as an exhibit to its reports on Form N-PORT. Interest holders may view the filed Form N-PORT by visiting the SEC website at sec.gov.
24 | Allspring Disciplined International Developed Markets Portfolio
Other information (unaudited)
BOARD OF TRUSTEES AND OFFICERS
Each of the Trustees and Officers listed in the table below acts in identical capacities for each fund in the Allspring family of funds, which consists of 139 mutual funds comprising the Allspring Funds Trust, Allspring Variable Trust, Allspring Master Trust and four closed-end funds (collectively the “Fund Complex”). This table should be read in conjunction with the Prospectus and the Statement of Additional Information. The mailing address of each Trustee and Officer is 525 Market Street, 12th Floor, San Francisco, CA 94105. Each Trustee and Officer serves an indefinite term, however, each Trustee serves such term until reaching the mandatory retirement age established by the Trustees.
Independent Trustees
Name and
year of birth | Position held and
length of service* | Principal occupations during past five years or longer | Current other
public company or
investment
company
directorships |
William R. Ebsworth
(Born 1957) | Trustee,
since 2015 | Retired. From 1984 to 2013, equities analyst, portfolio manager, research director and chief investment officer at Fidelity Management and Research Company in Boston, Tokyo, and Hong Kong, and retired in 2013 as Chief Investment Officer of Fidelity Strategic Advisers, Inc. where he led a team of investment professionals managing client assets. Prior thereto, Board member of Hong Kong Securities Clearing Co., Hong Kong Options Clearing Corp., the Thailand International Fund, Ltd., Fidelity Investments Life Insurance Company, and Empire Fidelity Investments Life Insurance Company. Audit Committee Chair and Investment Committee Chair of the Vincent Memorial Hospital Endowment (non-profit organization). Mr. Ebsworth is a CFA® charterholder. | N/A |
Jane A. Freeman
(Born 1953) | Trustee,
since 2015;
Chair Liaison,
since 2018 | Retired. From 2012 to 2014 and 1999 to 2008, Chief Financial Officer of Scientific Learning Corporation. From 2008 to 2012, Ms. Freeman provided consulting services related to strategic business projects. Prior to 1999, Portfolio Manager at Rockefeller & Co. and Scudder, Stevens & Clark. Board member of the Harding Loevner Funds from 1996 to 2014, serving as both Lead Independent Director and chair of the Audit Committee. Board member of the Russell Exchange Traded Funds Trust from 2011 to 2012 and the chair of the Audit Committee. Ms. Freeman is also an inactive Chartered Financial Analyst. | N/A |
Isaiah Harris, Jr.
(Born 1952) | Trustee,
since 2009; Audit
Committee
Chair,
since 2019 | Retired. Chairman of the Board of CIGNA Corporation from 2009 to 2021, and Director from 2005 to 2008. From 2003 to 2011, Director of Deluxe Corporation. Prior thereto, President and CEO of BellSouth Advertising and Publishing Corp. from 2005 to 2007, President and CEO of BellSouth Enterprises from 2004 to 2005 and President of BellSouth Consumer Services from 2000 to 2003. Emeritus member of the Iowa State University Foundation Board of Governors. Emeritus Member of the Advisory Board of Iowa State University School of Business. Advisory Board Member, Palm Harbor Academy (private school). Advisory Board Member, Fellowship of Christian Athletes. Mr. Harris is a certified public accountant (inactive status). | N/A |
Judith M. Johnson**
(Born 1949) | Trustee,
since 2008 | Retired. Prior thereto, Chief Executive Officer and Chief Investment Officer of Minneapolis Employees Retirement Fund from 1996 to 2008. Ms. Johnson is an attorney, certified public accountant and a certified managerial accountant. | N/A |
David F. Larcker
(Born 1950) | Trustee,
since 2009 | James Irvin Miller Professor of Accounting at the Graduate School of Business (Emeritus), Stanford University, Director of the Corporate Governance Research Initiative and Senior Faculty of The Rock Center for Corporate Governance since 2006. From 2005 to 2008, Professor of Accounting at the Graduate School of Business, Stanford University. Prior thereto, Ernst & Young Professor of Accounting at The Wharton School, University of Pennsylvania from 1985 to 2005. | N/A |
Allspring Disciplined International Developed Markets Portfolio | 25
Other information (unaudited)
Name and
year of birth | Position held and
length of service* | Principal occupations during past five years or longer | Current other
public company or
investment
company
directorships |
Olivia S. Mitchell
(Born 1953) | Trustee,
since 2006;
Nominating and
Governance
Committee Chair,
since 2018 | International Foundation of Employee Benefit Plans Professor since 1993, Wharton School of the University of Pennsylvania. Director of Wharton’s Pension Research Council and Boettner Center on Pensions & Retirement Research, and Research Associate at the National Bureau of Economic Research. Previously taught at Cornell University from 1978 to 1993. | N/A |
Timothy J. Penny
(Born 1951) | Trustee,
since 1996;
Chair,
since 2018 | President and Chief Executive Officer of Southern Minnesota Initiative Foundation, a non-profit organization, since 2007. Member of the Board of Trustees of NorthStar Education Finance, Inc., a non-profit organization, since 2007. | N/A |
James G. Polisson
(Born 1959) | Trustee,
since 2018 | Retired. Chief Marketing Officer, Source (ETF) UK Services, Ltd, from 2015 to 2017. From 2012 to 2015, Principal of The Polisson Group, LLC, a management consulting, corporate advisory and principal investing company. Chief Executive Officer and Managing Director at Russell Investments, Global Exchange Traded Funds from 2010 to 2012. Managing Director of Barclays Global Investors from 1998 to 2010 and Global Chief Marketing Officer for iShares and Barclays Global Investors from 2000 to 2010. Trustee of the San Francisco Mechanics’ Institute, a non-profit organization, from 2013 to 2015. Board member of the Russell Exchange Traded Fund Trust from 2011 to 2012. Director of Barclays Global Investors Holdings Deutschland GmbH from 2006 to 2009. Mr. Polisson is an attorney and has a retired status with the Massachusetts and District of Columbia Bar Associations. | N/A |
Pamela Wheelock
(Born 1959) | Trustee,
since January
2020; previously
Trustee from
January 2018 to
July 2019 | Board member of the Destination Medical Center Economic Development Agency, Rochester, Minnesota since 2019. Interim President of the McKnight Foundation from January to September 2020. McKnight Foundation Consultant, November 2020 to February 2021. Acting Commissioner, Minnesota Department of Human Services, July 2019 through September 2019. Consultant (part-time), Minnesota Department of Human Services, October 2019 through December 2019. Chief Operating Officer, Twin Cities Habitat for Humanity from 2017 to 2019. Vice President of University Services, University of Minnesota from 2012 to 2016. Prior thereto, on the Board of Directors, Governance Committee and Finance Committee for the Minnesota Philanthropy Partners (Saint Paul Foundation) from 2012 to 2018, Interim Chief Executive Officer of Blue Cross Blue Shield of Minnesota from 2011 to 2012, Chairman of the Board from 2009 to 2012 and Board Director from 2003 to 2015. Vice President, Leadership and Community Engagement, Bush Foundation, Saint Paul, Minnesota (a private foundation) from 2009 to 2011. Executive Vice President and Chief Financial Officer, Minnesota Sports and Entertainment from 2004 to 2009 and Senior Vice President from 2002 to 2004. Executive Vice President of the Minnesota Wild Foundation from 2004 to 2008. Commissioner of Finance, State of Minnesota, from 1999 to 2002. Currently Board Chair of the Minnesota Wild Foundation since 2010. | N/A |
* Length of service dates reflect the Trustee’s commencement of service with the Trust’s predecessor entities, where applicable.
** Ms. Johnson has resigned from the Board effective December 31, 2021.
26 | Allspring Disciplined International Developed Markets Portfolio
Other information (unaudited)
Officers1
Name and
year of birth | Position held and
length of service | Principal occupations during past five years or longer |
Andrew Owen
(Born 1960) | President,
since 2017 | President, Chief Executive Officer and Director of Allspring Funds Management, LLC since 2017 and co-president of Galliard Capital Management, LLC, an affiliate of Allspring Funds Management, LLC, since 2019. Prior thereto, Head of Affiliated Managers, Allspring Global Investments, from 2014 to 2019 and Executive Vice President responsible for marketing, investments and product development for Allspring Funds Management, LLC, from 2009 to 2014. In addition, Mr. Owen was an Executive Vice President of Wells Fargo & Company from 2014 to 2021. |
Jeremy DePalma
(Born 1974) | Treasurer,
since 2012
(for certain funds in
the Fund Complex);
since 2021 (for
the remaining funds in the
Fund Complex) | Senior Vice President of Allspring Funds Management, LLC since 2009. Senior Vice President of Evergreen Investment Management Company, LLC from 2008 to 2010 and head of the Fund Reporting and Control Team within Fund Administration. |
Kate McKinley
(Born 1977) | Chief Legal Officer,
since 2021 | Chief Legal Officer of Allspring Global Investments since 2021. Prior thereto, held various roles at State Street Global Advisors beginning in 2010, including serving as Senior Vice President and General Counsel from 2019 to 2021, and Chief Operating Officer of the Institutional Client Group from 2016 - 2019. Prior to working at State Street Global Advisors served as Assistant General Counsel for Bank of America Corporation from 2005 to 2010 and as an Associate at WilmerHale from 2002 to 2005. |
Christopher Baker
(Born 1976) | Chief Compliance Officer, since 2022 | Global Chief Compliance Officer for Allspring Global Investments since 2022. Prior thereto, Chief Compliance Officer for State Street Global Advisors from 2018 to 2021. Senior Compliance Officer for the State Street divisions of Alternative Investment Solutions, Sector Solutions, and Global Marketing from 2015 to 2018. From 2010 to 2015 Vice President, Global Head of Investment and Marketing Compliance for State Street Global Advisors. |
Matthew Prasse
(Born 1983) | Secretary,
since 2021 | Senior Counsel of the Allspring Legal Department since 2021. Senior Counsel of the Wells Fargo Legal Department from 2018 to 2021. Previously, Counsel for Barings LLC from 2015 to 2018. Prior to joining Barings, Associate at Morgan, Lewis & Bockius LLP from 2008 to 2015. |
1 For those Officers with tenures at Allspring Global Investments and/or Allspring Funds Management, LLC that began prior to 2021, such tenures include years of service during which these businesses/entities were known as Wells Fargo Asset Management and Wells Fargo Funds Management, LLC, respectively.
Allspring Disciplined International Developed Markets Portfolio | 27
For more information
More information about Allspring Funds is available free upon request. To obtain literature, please write, visit the Portfolio's website, or call:
Allspring Funds
P.O. Box 219967
Kansas City, MO 64121-9967
Website: allspringglobal.com
Individual investors: 1-800-222-8222
Retail investment professionals: 1-888-877-9275
Institutional investment professionals: 1-866-765-0778
This report and the financial statements contained herein are submitted for the general information of the interest holders of the Portfolio. If this report is used for promotional purposes, distribution of the report must be accompanied or preceded by a current prospectus. Before investing, please consider the investment objectives, risks, charges, and expenses of the investment. For a current prospectus and, if available, a summary prospectus, containing this information, call
1-800-222-8222 or visit the Portfolio's website at allspringglobal.com. Read the prospectus carefully before you invest or send money.
Allspring Global InvestmentsTM is the trade name for the asset management firms of Allspring Global Investments Holdings, LLC, a holding company indirectly owned by certain private funds of GTCR LLC and Reverence Capital Partners, L.P. These firms include but are not limited to Allspring Global Investments, LLC, and Allspring Funds Management, LLC. Certain products managed by Allspring entities are distributed by Allspring Funds Distributor, LLC (a broker-dealer and Member FINRA/SIPC).
This material is for general informational and educational purposes only and is NOT intended to provide investment advice or a recommendation of any kind - including a recommendation for any specific investment, strategy, or plan.
© 2022 Allspring Global Investments Holdings, LLC. All rights reserved.
Semi-Annual Report
November 30, 2021
Allspring
Large Company Value Portfolio
Allspring Large Company Value Portfolio | 1
Portfolio information (unaudited)
| Investment objective | The Portfolio seeks long-term capital appreciation. |
| Manager | Allspring Funds Management, LLC |
| Subadviser | Allspring Global Investments, LLC |
| Portfolio managers | Dennis Bein, CFA®‡, Ryan Brown, CFA®‡, Harindra de Silva, Ph.D., CFA®‡ |
| Ten largest holdings (%) as of November 30, 20211 |
| Berkshire Hathaway Incorporated Class B | 4.55 |
| JPMorgan Chase & Company | 3.59 |
| Pfizer Incorporated | 2.98 |
| Johnson & Johnson | 2.87 |
| Marsh & McLennan Companies Incorporated | 2.46 |
| Target Corporation | 2.30 |
| The Procter & Gamble Company | 2.12 |
| Colgate-Palmolive Company | 1.93 |
| Dolby Laboratories Incorporated Class A | 1.92 |
| Mueller Industries Incorporated | 1.91 |
| 1 | Figures represent the percentage of the Portfolio's net assets. Holdings are subject to change and may have changed since the date specified. |
| Sector allocation as of November 30, 20211 |
| 1 | Figures represent the percentage of the Portfolio's long-term investments. These amounts are subject to change and may have changed since the date specified. |
| ‡ | CFA® and Chartered Financial Analyst® are trademarks owned by CFA Institute. |
2 | Allspring Large Company Value Portfolio
Portfolio of investments—November 30, 2021 (unaudited)
| | | | | Shares | Value |
| Common stocks: 98.44% | | | | | |
| Communication services: 9.11% | | | | | |
| Diversified telecommunication services: 1.82% | | | | | |
| AT&T Incorporated | | | | 55,810 | $ 1,274,142 |
| Verizon Communications Incorporated | | | | 64,904 | 3,262,724 |
| | | | | | 4,536,866 |
| Entertainment: 1.01% | | | | | |
| Activision Blizzard Incorporated | | | | 42,880 | 2,512,768 |
| Interactive media & services: 3.41% | | | | | |
| Alphabet Incorporated Class A † | | | | 1,396 | 3,961,778 |
| Alphabet Incorporated Class C † | | | | 1,602 | 4,564,162 |
| | | | | | 8,525,940 |
| Media: 2.68% | | | | | |
| Comcast Corporation Class A | | | | 56,149 | 2,806,327 |
| Interpublic Group of Companies Incorporated | | | | 117,015 | 3,883,728 |
| | | | | | 6,690,055 |
| Wireless telecommunication services: 0.19% | | | | | |
| T-Mobile US Incorporated † | | | | 4,433 | 482,355 |
| Consumer discretionary: 5.63% | | | | | |
| Auto components: 1.37% | | | | | |
| Aptiv plc † | | | | 21,290 | 3,413,852 |
| Automobiles: 0.30% | | | | | |
| Ford Motor Company | | | | 16,696 | 320,396 |
| Winnebago Industries Incorporated | | | | 5,828 | 420,898 |
| | | | | | 741,294 |
| Hotels, restaurants & leisure: 0.49% | | | | | |
| Chipotle Mexican Grill Incorporated † | | | | 744 | 1,222,697 |
| Multiline retail: 2.52% | | | | | |
| Macy's Incorporated | | | | 19,827 | 565,070 |
| Target Corporation | | | | 23,520 | 5,735,117 |
| | | | | | 6,300,187 |
| Textiles, apparel & luxury goods: 0.95% | | | | | |
| lululemon athletica Incorporated † | | | | 5,230 | 2,376,564 |
| Consumer staples: 7.90% | | | | | |
| Food & staples retailing: 2.40% | | | | | |
| Costco Wholesale Corporation | | | | 3,744 | 2,019,439 |
| Walmart Incorporated | | | | 28,278 | 3,976,735 |
| | | | | | 5,996,174 |
| Food products: 1.21% | | | | | |
| Bunge Limited | | | | 2,674 | 231,488 |
The accompanying notes are an integral part of these financial statements.
Allspring Large Company Value Portfolio | 3
Portfolio of investments—November 30, 2021 (unaudited)
| | | | | Shares | Value |
| Food products (continued) | | | | | |
| Mondelez International Incorporated Class A | | | | 18,930 | $ 1,115,734 |
| The Simply Good Foods Company † | | | | 45,623 | 1,686,682 |
| | | | | | 3,033,904 |
| Household products: 4.16% | | | | | |
| Colgate-Palmolive Company | | | | 64,358 | 4,828,137 |
| Kimberly-Clark Corporation | | | | 2,025 | 263,878 |
| The Procter & Gamble Company | | | | 36,617 | 5,294,086 |
| | | | | | 10,386,101 |
| Personal products: 0.13% | | | | | |
| The Estee Lauder Companies Incorporated Class A | | | | 948 | 314,802 |
| Energy: 4.91% | | | | | |
| Oil, gas & consumable fuels: 4.91% | | | | | |
| Chevron Corporation | | | | 16,425 | 1,853,890 |
| ConocoPhillips | | | | 39,883 | 2,796,995 |
| EOG Resources Incorporated | | | | 21,831 | 1,899,297 |
| Exxon Mobil Corporation | | | | 48,305 | 2,890,571 |
| Marathon Petroleum Corporation | | | | 46,194 | 2,810,905 |
| | | | | | 12,251,658 |
| Financials: 21.33% | | | | | |
| Banks: 6.65% | | | | | |
| Bank of America Corporation | | | | 36,692 | 1,631,693 |
| Citigroup Incorporated | | | | 34,556 | 2,201,217 |
| Hancock Holding Company | | | | 33,865 | 1,618,070 |
| JPMorgan Chase & Company | | | | 56,411 | 8,959,759 |
| PNC Financial Services Group Incorporated | | | | 5,136 | 1,011,792 |
| Truist Financial Corporation | | | | 20,022 | 1,187,505 |
| | | | | | 16,610,036 |
| Capital markets: 3.80% | | | | | |
| Bank of New York Mellon Corporation | | | | 10,039 | 550,037 |
| BlackRock Incorporated | | | | 102 | 92,270 |
| Intercontinental Exchange Incorporated | | | | 7,012 | 916,609 |
| KKR & Company Incorporated Class A | | | | 29,770 | 2,216,377 |
| Moody's Corporation | | | | 1,813 | 708,230 |
| Piper Jaffray Companies Incorporated | | | | 11,035 | 1,829,051 |
| S&P Global Incorporated | | | | 285 | 129,883 |
| The Goldman Sachs Group Incorporated | | | | 8,022 | 3,056,302 |
| | | | | | 9,498,759 |
| Consumer finance: 1.60% | | | | | |
| American Express Company | | | | 6,422 | 978,071 |
| Capital One Financial Corporation | | | | 21,451 | 3,014,509 |
| | | | | | 3,992,580 |
| Diversified financial services: 4.55% | | | | | |
| Berkshire Hathaway Incorporated Class B † | | | | 41,056 | 11,359,781 |
| Insurance: 4.73% | | | | | |
| Enstar Group Limited † | | | | 122 | 27,218 |
| Marsh & McLennan Companies Incorporated | | | | 37,350 | 6,126,147 |
The accompanying notes are an integral part of these financial statements.
4 | Allspring Large Company Value Portfolio
Portfolio of investments—November 30, 2021 (unaudited)
| | | | | Shares | Value |
| Insurance (continued) | | | | | |
| MetLife Incorporated | | | | 25,495 | $ 1,495,537 |
| Old Republic International Corporation | | | | 25,160 | 602,834 |
| Progressive Corporation | | | | 7,215 | 670,562 |
| W.R. Berkley Corporation | | | | 37,545 | 2,877,449 |
| | | | | | 11,799,747 |
| Health care: 18.60% | | | | | |
| Biotechnology: 3.46% | | | | | |
| AbbVie Incorporated | | | | 25,353 | 2,922,694 |
| Horizon Therapeutics plc † | | | | 16,325 | 1,693,882 |
| United Therapeutics Corporation † | | | | 4,447 | 842,707 |
| Vertex Pharmaceuticals Incorporated † | | | | 16,922 | 3,163,399 |
| | | | | | 8,622,682 |
| Health care equipment & supplies: 1.62% | | | | | |
| Abbott Laboratories | | | | 18,064 | 2,271,909 |
| Medtronic plc | | | | 16,595 | 1,770,687 |
| | | | | | 4,042,596 |
| Health care providers & services: 3.34% | | | | | |
| Anthem Incorporated | | | | 9,939 | 4,037,520 |
| Cigna Corporation | | | | 21,799 | 4,183,228 |
| Humana Incorporated | | | | 284 | 119,198 |
| | | | | | 8,339,946 |
| Life sciences tools & services: 2.51% | | | | | |
| Danaher Corporation | | | | 2,469 | 794,129 |
| IQVIA Holdings Incorporated † | | | | 7,736 | 2,004,630 |
| Medpace Holdings Incorporated † | | | | 11,103 | 2,302,873 |
| Thermo Fisher Scientific Incorporated | | | | 1,853 | 1,172,634 |
| | | | | | 6,274,266 |
| Pharmaceuticals: 7.67% | | | | | |
| Johnson & Johnson | | | | 45,985 | 7,170,441 |
| Merck & Company Incorporated | | | | 60,812 | 4,555,427 |
| Pfizer Incorporated | | | | 138,329 | 7,432,417 |
| | | | | | 19,158,285 |
| Industrials: 9.58% | | | | | |
| Aerospace & defense: 1.54% | | | | | |
| General Dynamics Corporation | | | | 20,374 | 3,850,075 |
| Air freight & logistics: 0.73% | | | | | |
| Expeditors International of Washington Incorporated | | | | 11,661 | 1,418,211 |
| FedEx Corporation | | | | 1,727 | 397,849 |
| | | | | | 1,816,060 |
| Airlines: 0.38% | | | | | |
| SkyWest Incorporated † | | | | 24,009 | 940,433 |
| Commercial services & supplies: 0.42% | | | | | |
| Clean Harbors Incorporated † | | | | 10,418 | 1,056,802 |
The accompanying notes are an integral part of these financial statements.
Allspring Large Company Value Portfolio | 5
Portfolio of investments—November 30, 2021 (unaudited)
| | | | | Shares | Value |
| Electrical equipment: 3.05% | | | | | |
| Emerson Electric Company | | | | 39,455 | $ 3,465,727 |
| Encore Wire Corporation | | | | 29,538 | 4,148,907 |
| | | | | | 7,614,634 |
| Machinery: 2.82% | | | | | |
| Caterpillar Incorporated | | | | 3,232 | 624,907 |
| Deere & Company | | | | 4,765 | 1,646,498 |
| Mueller Industries Incorporated | | | | 86,342 | 4,777,303 |
| | | | | | 7,048,708 |
| Professional services: 0.25% | | | | | |
| IHS Markit Limited | | | | 2,483 | 317,377 |
| Korn Ferry International | | | | 4,331 | 315,037 |
| | | | | | 632,414 |
| Trading companies & distributors: 0.39% | | | | | |
| Boise Cascade Company | | | | 15,037 | 974,849 |
| Information technology: 8.32% | | | | | |
| Electronic equipment, instruments & components: 1.44% | | | | | |
| Amphenol Corporation Class A | | | | 14,740 | 1,187,749 |
| Vishay Intertechnology Incorporated | | | | 118,022 | 2,404,108 |
| | | | | | 3,591,857 |
| IT services: 2.48% | | | | | |
| Accenture plc Class A | | | | 5,726 | 2,046,472 |
| Fidelity National Information Services Incorporated | | | | 4,981 | 520,515 |
| Genpact Limited | | | | 14,458 | 697,888 |
| Global Payments Incorporated | | | | 9,677 | 1,151,950 |
| Twilio Incorporated Class A † | | | | 6,185 | 1,769,838 |
| | | | | | 6,186,663 |
| Semiconductors & semiconductor equipment: 0.79% | | | | | |
| Diodes Incorporated † | | | | 3,297 | 350,636 |
| Intel Corporation | | | | 12,779 | 628,727 |
| Micron Technology Incorporated | | | | 11,838 | 994,392 |
| | | | | | 1,973,755 |
| Software: 3.61% | | | | | |
| Autodesk Incorporated † | | | | 2,333 | 593,025 |
| Cadence Design Systems Incorporated † | | | | 5,110 | 906,821 |
| Dolby Laboratories Incorporated Class A | | | | 57,422 | 4,789,569 |
| InterDigital Incorporated | | | | 5,848 | 397,138 |
| Intuit Incorporated | | | | 2,624 | 1,711,635 |
| Microsoft Corporation | | | | 1,265 | 418,196 |
| Synopsys Incorporated † | | | | 635 | 216,535 |
| | | | | | 9,032,919 |
| Materials: 2.63% | | | | | |
| Chemicals: 0.89% | | | | | |
| CF Industries Holdings Incorporated | | | | 24,130 | 1,462,037 |
| Dow Incorporated | | | | 13,822 | 759,242 |
| | | | | | 2,221,279 |
The accompanying notes are an integral part of these financial statements.
6 | Allspring Large Company Value Portfolio
Portfolio of investments—November 30, 2021 (unaudited)
| | | | | Shares | Value |
| Metals & mining: 1.74% | | | | | |
| Freeport-McMoRan Incorporated | | | | 112,048 | $ 4,154,740 |
| Newmont Corporation | | | | 3,604 | 197,932 |
| | | | | | 4,352,672 |
| Real estate: 5.32% | | | | | |
| Equity REITs: 3.14% | | | | | |
| Gaming and Leisure Properties Incorporated | | | | 24,552 | 1,107,786 |
| Invitation Homes Incorporated | | | | 31,787 | 1,285,466 |
| Life Storage Incorporated | | | | 19,256 | 2,544,488 |
| Orion Office Incorporated † | | | | 112 | 1,990 |
| Public Storage Incorporated | | | | 6,662 | 2,181,006 |
| Realty Income Corporation | | | | 1,123 | 76,274 |
| Simon Property Group Incorporated | | | | 4,131 | 631,382 |
| | | | | | 7,828,392 |
| Real estate management & development: 2.18% | | | | | |
| CBRE Group Incorporated Class A † | | | | 12,307 | 1,176,180 |
| Jones Lang LaSalle Incorporated † | | | | 15,599 | 3,664,361 |
| Kennedy Wilson Holdings Incorporated | | | | 28,122 | 609,966 |
| | | | | | 5,450,507 |
| Utilities: 5.11% | | | | | |
| Electric utilities: 2.77% | | | | | |
| American Electric Power Company Incorporated | | | | 39,814 | 3,226,925 |
| Exelon Corporation | | | | 53,968 | 2,845,733 |
| The Southern Company | | | | 14,017 | 856,439 |
| | | | | | 6,929,097 |
| Independent power & renewable electricity producers: 1.81% | | | | | |
| Vistra Energy Corporation | | | | 227,250 | 4,517,730 |
| Multi-utilities: 0.53% | | | | | |
| Dominion Energy Incorporated | | | | 10,061 | 716,343 |
| MDU Resources Group Incorporated | | | | 22,280 | 606,684 |
| | | | | | 1,323,027 |
| Total Common stocks (Cost $240,526,885) | | | | | 245,825,768 |
| | | Yield | | | |
| Short-term investments: 0.72% | | | | | |
| Investment companies: 0.72% | | | | | |
| Allspring Government Money Market Fund Select Class ♠∞ | | 0.03% | | 1,789,222 | 1,789,222 |
| Total Short-term investments (Cost $1,789,222) | | | | | 1,789,222 |
| Total investments in securities (Cost $242,316,107) | 99.16% | | | | 247,614,990 |
| Other assets and liabilities, net | 0.84 | | | | 2,091,391 |
| Total net assets | 100.00% | | | | $249,706,381 |
| † | Non-income-earning security |
| ♠ | The issuer of the security is an affiliated person of the Portfolio as defined in the Investment Company Act of 1940. |
| ∞ | The rate represents the 7-day annualized yield at period end. |
The accompanying notes are an integral part of these financial statements.
Allspring Large Company Value Portfolio | 7
Portfolio of investments—November 30, 2021 (unaudited)
| Abbreviations: |
| REIT | Real estate investment trust |
Investments in affiliates
An affiliated investment is an investment in which the Portfolio owns at least 5% of the outstanding voting shares of the issuer or as a result of other relationships, such as the Portfolio and the issuer having the same adviser or investment manager. Transactions with issuers that were either affiliates of the Portfolio at the beginning of the period or the end of the period were as follows:
| | Value,
beginning of
period | Purchases | Sales
proceeds | Net
realized
gains
(losses) | Net
change in
unrealized
gains
(losses) | Value,
end of
period | Shares,
end
of period | Income
from
affiliated
securities |
| Short-term investments | | | | | | | |
| Allspring Government Money Market Fund Select Class | $3,849,497 | $15,640,880 | $(17,701,155) | $0 | $0 | $1,789,222 | 1,789,222 | $386 |
Futures contracts
| Description | Number of
contracts | Expiration
date | Notional
cost | Notional
value | Unrealized
gains | Unrealized
losses |
| Long | | | | | | |
| E-Mini S&P 500 Index | 17 | 12-17-2021 | $3,829,515 | $3,881,313 | $51,798 | $0 |
The accompanying notes are an integral part of these financial statements.
8 | Allspring Large Company Value Portfolio
Statement of assets and liabilities—November 30, 2021 (unaudited)
| | |
| Assets | |
Investments in unaffiliated securities, at value (cost $240,526,885)
| $ 245,825,768 |
Investments in affiliated securities, at value (cost $1,789,222)
| 1,789,222 |
Cash
| 1,201,000 |
Cash at broker segregated for futures contracts
| 535,000 |
Receivable for dividends
| 486,871 |
Prepaid expenses and other assets
| 13,975 |
Total assets
| 249,851,836 |
| Liabilities | |
Advisory fee payable
| 73,422 |
Payable for daily variation margin on open futures contracts
| 72,033 |
Total liabilities
| 145,455 |
Total net assets
| $249,706,381 |
The accompanying notes are an integral part of these financial statements.
Allspring Large Company Value Portfolio | 9
Statement of operations—six months ended November 30, 2021 (unaudited)
| | |
| Investment income | |
Dividends (net of foreign withholdings taxes of $20,057)
| $ 2,660,606 |
Income from affiliated securities
| 386 |
Total investment income
| 2,660,992 |
| Expenses | |
Advisory fee
| 467,706 |
Custody and accounting fees
| 14,593 |
Professional fees
| 28,749 |
Interest holder report expenses
| 13,484 |
Trustees’ fees and expenses
| 9,662 |
Other fees and expenses
| 6,382 |
Total expenses
| 540,576 |
Less: Fee waivers and/or expense reimbursements
| (7,924) |
Net expenses
| 532,652 |
Net investment income
| 2,128,340 |
| Realized and unrealized gains (losses) on investments | |
| Net realized gains on | |
Unaffiliated securities
| 13,543,003 |
Futures contracts
| 824,378 |
Net realized gains on investments
| 14,367,381 |
| Net change in unrealized gains (losses) on | |
Unaffiliated securities
| (16,158,423) |
Futures contracts
| (8,644) |
Net change in unrealized gains (losses) on investments
| (16,167,067) |
Net realized and unrealized gains (losses) on investments
| (1,799,686) |
Net increase in net assets resulting from operations
| $ 328,654 |
The accompanying notes are an integral part of these financial statements.
10 | Allspring Large Company Value Portfolio
Statement of changes in net assets
| | | |
| | Six months ended
November 30, 2021
(unaudited) | Year ended
May 31, 2021 |
| Operations | | |
Net investment income
| $ 2,128,340 | $ 3,775,447 |
Net realized gains on investments
| 14,367,381 | 101,388,910 |
Net change in unrealized gains (losses) on investments
| (16,167,067) | (3,681,890) |
Net increase in net assets resulting from operations
| 328,654 | 101,482,467 |
| Capital transactions | | |
| Transactions in investors’ beneficial interests | | |
Contributions
| 209,299 | 42,173,014 |
Withdrawals
| (40,446,281) | (76,489,354) |
Net decrease in net assets resulting from capital transactions
| (40,236,982) | (34,316,340) |
Total increase (decrease) in net assets
| (39,908,328) | 67,166,127 |
| Net assets | | |
Beginning of period
| 289,614,709 | 222,448,582 |
End of period
| $249,706,381 | $289,614,709 |
The accompanying notes are an integral part of these financial statements.
Allspring Large Company Value Portfolio | 11
| | | Year ended May 31 |
| | Six months ended
November 30, 2021
(unaudited) | 2021 | 2020 | 2019 | 2018 | 2017 |
Total return1
| 0.12% | 51.44% | (0.09)% | (0.94)% | 9.80% | 13.22% |
| Ratios to average net assets (annualized) | | | | | | |
Gross expenses
| 0.40% | 0.40% | 0.39% | 0.39% | 0.49% | 0.68% |
Net expenses2
| 0.40% | 0.40% | 0.39% | 0.39% | 0.42% | 0.66% |
Net investment income
| 1.59% | 1.55% | 2.05% | 2.29% | 1.56% | 1.45% |
| Supplemental data | | | | | | |
Portfolio turnover rate
| 217% | 482% | 335% | 246% | 244% | 203% |
| 1 | Returns for periods of less than one year are not annualized. |
| 2 | Net expense ratios reflect voluntary waivers. |
The accompanying notes are an integral part of these financial statements.
12 | Allspring Large Company Value Portfolio
Notes to financial statements (unaudited)
1. ORGANIZATION
Allspring Master Trust (the "Trust"), a Delaware statutory trust organized on March 10, 1999, is an open-end management investment company registered under the Investment Company Act of 1940, as amended (the "1940 Act"). As an investment company, the Trust follows the accounting and reporting guidance in Financial Accounting Standards Board ("FASB") Accounting Standards Codification Topic 946, Financial Services – Investment Companies. These financial statements report on the Allspring Large Company Value Portfolio (the "Portfolio") which is a diversified series of the Trust.
Interests in the Portfolio are available solely through private placement transactions that do not involve any "public offering" within the meaning of Section 4(a)(2) of the Securities Act of 1933.
On February 23, 2021, Wells Fargo & Company entered into a definitive agreement to sell Wells Fargo Asset Management ("WFAM") to GTCR LLC and Reverence Capital Partners, L.P. WFAM was the trade name used by the asset management businesses of Wells Fargo & Company and included Wells Fargo Funds Management, LLC, Wells Capital Management, LLC, Wells Fargo Asset Management (International) Limited and Wells Fargo Funds Distributor, LLC. Effective on November 1, 2021, the sale transaction of WFAM by Wells Fargo & Company to GTCR LLC and Reverence Capital Partners, L.P. was closed. In connection with the closing of the transaction, WFAM became known as Allspring Global Investments (“Allspring”) and various entities that provide services to the Portfolio changed their names to "Allspring", including Allspring Funds Management, LLC (formerly Wells Fargo Funds Management, LLC), the adviser to the Portfolio, Allspring Global Investments, Inc. (formerly Wells Capital Management, LLC) and Allspring Global Investments (UK) Limited (formerly Wells Fargo Asset Management (International) Limited), both registered investment advisers providing subadvisory services to certain funds, and Allspring Funds Distributor, LLC (formerly Wells Fargo Funds Distributor, LLC).
Consummation of the transaction resulted in the automatic termination of the Portfolio’s advisory agreement and subadvisory agreement. The Portfolio’s Board of Trustees approved a new advisory agreement and subadvisory agreement which were approved by the Portfolio's interest holders on August 16, 2021. The new agreements became effective on November 1, 2021.
Effective December 6, 2021, "Wells Fargo" was removed from the Portfolio's name and replaced it with "Allspring".
2. SIGNIFICANT ACCOUNTING POLICIES
The following significant accounting policies, which are consistently followed in the preparation of the financial statements of the Portfolio, are in conformity with U.S. generally accepted accounting principles which require management to make estimates and assumptions that affect the reported amounts of assets and liabilities, disclosure of contingent assets and liabilities at the date of the financial statements, and the reported amounts of income and expenses during the reporting period. Actual results could differ from those estimates.
Securities valuation
All investments are valued each business day as of the close of regular trading on the New York Stock Exchange (generally 4 p.m. Eastern Time), although the Portfolio may deviate from this calculation time under unusual or unexpected circumstances.
Equity securities and futures contracts that are listed on a foreign or domestic exchange or market are valued at the official closing price or, if none, the last sales price. If no sale occurs on the principal exchange or market that day, a fair value price will be determined in accordance with the Portfolio’s Valuation Procedures.
Investments in registered open-end investment companies are valued at net asset value. Interests in non-registered investment companies that are redeemable at net asset value are fair valued normally at net asset value.
Investments which are not valued using any of the methods discussed above are valued at their fair value, as determined in good faith by the Board of Trustees. The Board of Trustees has established a Valuation Committee comprised of the Trustees and has delegated to it the authority to take any actions regarding the valuation of portfolio securities that the Valuation Committee deems necessary or appropriate, including determining the fair value of portfolio securities, unless the determination has been delegated to the Allspring Global Investments Pricing Committee at Allspring Funds Management, LLC ("Allspring Funds Management"). The Board of Trustees retains the authority to make or ratify any valuation decisions or approve any changes to the Valuation Procedures as it deems appropriate. On a quarterly basis, the Board of Trustees receives reports on any valuation actions taken by the Valuation Committee or the Allspring Global Investments Pricing Committee which may include items for ratification.
Allspring Large Company Value Portfolio | 13
Notes to financial statements (unaudited)
Securities lending
The Portfolio may lend its securities from time to time in order to earn additional income in the form of fees or interest on securities received as collateral or the investment of any cash received as collateral. When securities are on loan, the Portfolio receives interest or dividends on those securities. Cash collateral received in connection with its securities lending transactions is invested in Securities Lending Cash Investments, LLC (the "Securities Lending Fund"), an affiliated non-registered investment company. Investments in Securities Lending Fund are valued at the evaluated bid price provided by an independent pricing service. Income earned from investment in the Securities Lending Fund (net of fees and rebates), if any, is included in income from affiliated securities on the Statement of Operations.
In a securities lending transaction, the net asset value of the Portfolio is affected by an increase or decrease in the value of the securities loaned and by an increase or decrease in the value of the instrument in which collateral is invested. The amount of securities lending activity undertaken by the Portfolio fluctuates from time to time. The Portfolio has the right under the lending agreement to recover the securities from the borrower on demand. In the event of default or bankruptcy by the borrower, the Portfolio may be prevented from recovering the loaned securities or gaining access to the collateral or may experience delays or costs in doing so. In such an event, the terms of the agreement allow the unaffiliated securities lending agent to use the collateral to purchase replacement securities on behalf of the Portfolio or pay the Portfolio the market value of the loaned securities. The Portfolio bears the risk of loss with respect to depreciation of its investment of the cash collateral.
Futures contracts
Futures contracts are agreements between the Portfolio and a counterparty to buy or sell a specific amount of a commodity, financial instrument or currency at a specified price on a specified date. The Portfolio may buy and sell futures contracts in order to gain exposure to, or protect against, changes in security values and is subject to equity price risk. The primary risks associated with the use of futures contracts are the imperfect correlation between changes in market values of securities held by the Portfolio and the prices of futures contracts, and the possibility of an illiquid market. Futures contracts are generally entered into on a regulated futures exchange and cleared through a clearinghouse associated with the exchange. With futures contracts, there is minimal counterparty risk to the Portfolio since futures contracts are exchange traded and the exchange’s clearinghouse, as the counterparty to all exchange traded futures, guarantees the futures contracts against default.
Upon entering into a futures contract, the Portfolio is required to deposit either cash or securities (initial margin) with the broker in an amount equal to a certain percentage of the contract value. Subsequent payments (variation margin) are paid to or from the broker each day equal to the daily changes in the contract value. Such payments are recorded as unrealized gains or losses and, if any, shown as variation margin receivable (payable) in the Statement of Assets and Liabilities. Should the Portfolio fail to make requested variation margin payments, the broker can gain access to the initial margin to satisfy the Portfolio’s payment obligations. When the contracts are closed, a realized gain or loss is recorded in the Statement of Operations.
Security transactions and income recognition
Securities transactions are recorded on a trade date basis. Realized gains or losses are recorded on the basis of identified cost.
Dividend income is recognized on the ex-dividend date. Dividend income is recorded net of foreign taxes withheld where recovery of such taxes is not assured.
Federal and other taxes
The Portfolio is not required to pay federal income taxes on its net investment income and net capital gains as it is treated as a partnership for federal income tax purposes. All income, gains and losses of the Portfolio are deemed to have been “passed through” to the interest holders in proportion to their holdings of the Portfolio regardless of whether income and gains have been distributed by the Portfolio.
The Portfolio’s income tax returns and all financial records supporting those returns for the prior three fiscal years are subject to examination by the federal revenue authority. Management has analyzed the Portfolio’s tax positions taken on federal, state, and foreign tax returns for all open tax years and does not believe that there are any uncertain tax positions that require recognition of a tax liability.
14 | Allspring Large Company Value Portfolio
Notes to financial statements (unaudited)
As of November 30, 2021, the aggregate cost of all investments for federal income tax purposes was $242,376,549 and the unrealized gains (losses) consisted of:
| Gross unrealized gains | $14,361,858 |
| Gross unrealized losses | (9,071,619) |
| Net unrealized gains | $ 5,290,239 |
3. FAIR VALUATION MEASUREMENTS
Fair value measurements of investments are determined within a framework that has established a fair value hierarchy based upon the various data inputs utilized in determining the value of the Portfolio’s investments. The three-level hierarchy gives the highest priority to unadjusted quoted prices in active markets for identical assets or liabilities (Level 1) and the lowest priority to unobservable inputs (Level 3). The Portfolio’s investments are classified within the fair value hierarchy based on the lowest level of input that is significant to the fair value measurement. The inputs are summarized into three broad levels as follows:
| ■ | Level 1 – quoted prices in active markets for identical securities |
| ■ | Level 2 – other significant observable inputs (including quoted prices for similar securities, interest rates, prepayment speeds, credit risk, etc.) |
| ■ | Level 3 – significant unobservable inputs (including the Portfolio’s own assumptions in determining the fair value of investments) |
The inputs or methodologies used for valuing investments in securities are not necessarily an indication of the risk associated with investing in those securities.
The following is a summary of the inputs used in valuing the Portfolio’s assets and liabilities as of November 30, 2021:
| | Quoted prices
(Level 1) | Other significant
observable inputs
(Level 2) | Significant
unobservable inputs
(Level 3) | Total |
| Assets | | | | |
| Investments in: | | | | |
| Common stocks | | | | |
| Communication services | $ 22,747,984 | $0 | $0 | $ 22,747,984 |
| Consumer discretionary | 14,054,594 | 0 | 0 | 14,054,594 |
| Consumer staples | 19,730,981 | 0 | 0 | 19,730,981 |
| Energy | 12,251,658 | 0 | 0 | 12,251,658 |
| Financials | 53,260,903 | 0 | 0 | 53,260,903 |
| Health care | 46,437,775 | 0 | 0 | 46,437,775 |
| Industrials | 23,933,975 | 0 | 0 | 23,933,975 |
| Information technology | 20,785,194 | 0 | 0 | 20,785,194 |
| Materials | 6,573,951 | 0 | 0 | 6,573,951 |
| Real estate | 13,278,899 | 0 | 0 | 13,278,899 |
| Utilities | 12,769,854 | 0 | 0 | 12,769,854 |
| Short-term investments | | | | |
| Investment companies | 1,789,222 | 0 | 0 | 1,789,222 |
| Total assets | $247,614,990 | $0 | $0 | $247,614,990 |
| Liabilities | | | | |
| Futures contracts | $ 51,798 | $0 | $0 | $ 51,798 |
| Total liabilities | $ 51,798 | $0 | $0 | $ 51,798 |
Futures contracts are reported at their cumulative unrealized gains (losses) at measurement date as reported in the table following the Portfolio of Investments. For futures contracts, the current day’s variation margin is reported on the Statement of Assets and Liabilities. All other assets and liabilities are reported at their market value at measurement date.
Allspring Large Company Value Portfolio | 15
Notes to financial statements (unaudited)
Additional sector, industry or geographic detail, if any, is included in the Portfolio of Investments.
For the six months ended November 30, 2021, the Portfolio did not have any transfers into/out of Level 3.
4. TRANSACTIONS WITH AFFILIATES
Advisory fee
The Trust has entered into an advisory contract with Allspring Funds Management, a wholly owned subsidiary of Allspring Global Investments Holdings, LLC, a holding company indirectly owned by certain private funds of GTCR LLC and Reverence Capital Partners, L.P. The adviser is responsible for implementing investment policies and guidelines and for supervising the subadviser, who is responsible for day-to-day portfolio management of the Portfolio. Pursuant to the contract, Allspring Funds Management is entitled to receive an advisory fee at the following annual rate based on the Portfolio’s average daily net assets:
| Average daily net assets | Advisory fee |
| First $1 billion | 0.350% |
| Next $4 billion | 0.325 |
| Over $5 billion | 0.300 |
For the six months ended November 30, 2021, the advisory fee was equivalent to an annual rate of 0.35% of the Portfolio’s average daily net assets.
Allspring Funds Management has retained the services of a subadviser to provide daily portfolio management to the Portfolio. The fee for subadvisory services is borne by Allspring Funds Management. Allspring Global Investments, LLC ("Allspring Investments"), an affiliate of Allspring Funds Management and a wholly owned subsidiary of Allspring Global Investments Holdings, LLC, is the subadviser to the Portfolio and is entitled to receive a fee from Allspring Funds Management at an annual rate starting at 0.25% and declining to 0.15% as the average daily net assets of the Portfolio increase.
Allspring Funds Management has voluntarily waived and/or reimbursed advisory fees to reduce the net operating expense ratio of the Portfolio. These voluntary waivers may be discontinued at any time.
Interfund transactions
The Portfolio may purchase or sell portfolio investment securities to certain affiliates pursuant to Rule 17a-7 under the 1940 Act and under procedures adopted by the Board of Trustees. The procedures have been designed to ensure that these interfund transactions, which do not incur broker commissions, are effected at current market prices.
5. INVESTMENT PORTFOLIO TRANSACTIONS
Purchases and sales of investments, excluding U.S. government obligations (if any) and short-term securities, for the six months ended November 30, 2021 were $562,583,957 and $597,659,608, respectively.
6. SECURITIES LENDING TRANSACTIONS
The Portfolio lends its securities through an unaffiliated securities lending agent and receives collateral in the form of cash or securities with a value at least equal to the value of the securities on loan. The value of the loaned securities is determined at the close of each business day and any increases or decreases in the required collateral are exchanged between the Portfolio and the counterparty on the next business day. Cash collateral received is invested in the Securities Lending Fund which seeks to provide a positive return compared to the daily Federal Funds Open Rate by investing in high-quality, U.S. dollar-denominated short-term money market instruments and is exempt from registration under Section 3(c)(7) of the 1940 Act. Securities Lending Fund is managed by Allspring Funds Management and is subadvised by Allspring Investments. Allspring Funds Management receives an advisory fee starting at 0.05% and declining to 0.01% as the average daily net assets of the Securities Lending Fund increase. All of the fees received by Allspring Funds Management are paid to Allspring Investments for its services as subadviser.
In the event of counterparty default or the failure of a borrower to return a loaned security, the Portfolio has the right to use the collateral to offset any losses incurred. As of November 30, 2021, the Portfolio did not have any securities on loan.
16 | Allspring Large Company Value Portfolio
Notes to financial statements (unaudited)
7. DERIVATIVE TRANSACTIONS
During the six months ended November 30, 2021, the Portfolio entered into futures contracts to gain market exposure. The Portfolio had an average notional amount of $5,524,634 in long futures contracts during the six months ended November 30, 2021.
The fair value, realized gains or losses and change in unrealized gains or losses, if any, on derivative instruments are reflected in the corresponding financial statement captions.
8. BANK BORROWINGS
The Trust, along with Allspring Variable Trust and Allspring Funds Trust (excluding the money market funds), are parties to a $350,000,000 revolving credit agreement whereby the Portfolio is permitted to use bank borrowings for temporary or emergency purposes, such as to fund interest holders withdrawal requests. Interest under the credit agreement is charged to the Portfolio based on a borrowing rate equal to the higher of the Federal Funds rate in effect on that day plus 1.25% or the overnight bank funding rate in effect on that day plus 1.25%. In addition, an annual commitment fee equal to 0.25% of the unused balance is allocated to each participating fund.
For the six months ended November 30, 2021, there were no borrowings by the Portfolio under the agreement.
9. INDEMNIFICATION
Under the Portfolio's organizational documents, the officers and Trustees have been granted certain indemnification rights against certain liabilities that may arise out of performance of their duties to the Portfolio. The Portfolio has entered into a separate agreement with each Trustee that converts indemnification rights currently existing under the Portfolio’s organizational documents into contractual rights that cannot be changed in the future without the consent of the Trustee. Additionally, in the normal course of business, the Portfolio may enter into contracts with service providers that contain a variety of indemnification clauses. The Portfolio’s maximum exposure under these arrangements is dependent on future claims that may be made against the Portfolio and, therefore, cannot be estimated.
10. CORONAVIRUS (COVID-19) PANDEMIC
On March 11, 2020, the World Health Organization announced that it had made the assessment that coronavirus disease 2019 (“COVID-19”) is a pandemic. The impacts of COVID-19 are affecting the entire global economy, individual companies and investment products, the funds, and the market in general. There is significant uncertainty around the extent and duration of business disruptions related to COVID-19 and the impacts may last for an extended period of time. COVID-19 has led to significant uncertainty and volatility in the financial markets.
Allspring Large Company Value Portfolio | 17
Other information (unaudited)
PROXY VOTING INFORMATION
A description of the policies and procedures used to determine how to vote proxies relating to portfolio securities is available without charge, upon request, by calling 1-800-222-8222, visiting our website at allspringglobal.com, or visiting the SEC website at sec.gov. Information regarding how the proxies related to portfolio securities were voted during the most recent 12-month period ended June 30 is available on the website at allspringglobal.com or by visiting the SEC website at sec.gov.
QUARTERLY PORTFOLIO HOLDINGS INFORMATION
The Portfolio files its complete schedule of portfolio holdings with the SEC for the first and third quarters of each fiscal year as an exhibit to its reports on Form N-PORT. Interest holders may view the filed Form N-PORT by visiting the SEC website at sec.gov.
18 | Allspring Large Company Value Portfolio
Other information (unaudited)
BOARD OF TRUSTEES AND OFFICERS
Each of the Trustees and Officers listed in the table below acts in identical capacities for each fund in the Allspring family of funds, which consists of 139 mutual funds comprising the Allspring Funds Trust, Allspring Variable Trust, Allspring Master Trust and four closed-end funds (collectively the “Fund Complex”). This table should be read in conjunction with the Prospectus and the Statement of Additional Information. The mailing address of each Trustee and Officer is 525 Market Street, 12th Floor, San Francisco, CA 94105. Each Trustee and Officer serves an indefinite term, however, each Trustee serves such term until reaching the mandatory retirement age established by the Trustees.
Independent Trustees
Name and
year of birth | Position held and
length of service* | Principal occupations during past five years or longer | Current other
public company or
investment
company
directorships |
William R. Ebsworth
(Born 1957) | Trustee,
since 2015 | Retired. From 1984 to 2013, equities analyst, portfolio manager, research director and chief investment officer at Fidelity Management and Research Company in Boston, Tokyo, and Hong Kong, and retired in 2013 as Chief Investment Officer of Fidelity Strategic Advisers, Inc. where he led a team of investment professionals managing client assets. Prior thereto, Board member of Hong Kong Securities Clearing Co., Hong Kong Options Clearing Corp., the Thailand International Fund, Ltd., Fidelity Investments Life Insurance Company, and Empire Fidelity Investments Life Insurance Company. Audit Committee Chair and Investment Committee Chair of the Vincent Memorial Hospital Endowment (non-profit organization). Mr. Ebsworth is a CFA® charterholder. | N/A |
Jane A. Freeman
(Born 1953) | Trustee,
since 2015;
Chair Liaison,
since 2018 | Retired. From 2012 to 2014 and 1999 to 2008, Chief Financial Officer of Scientific Learning Corporation. From 2008 to 2012, Ms. Freeman provided consulting services related to strategic business projects. Prior to 1999, Portfolio Manager at Rockefeller & Co. and Scudder, Stevens & Clark. Board member of the Harding Loevner Funds from 1996 to 2014, serving as both Lead Independent Director and chair of the Audit Committee. Board member of the Russell Exchange Traded Funds Trust from 2011 to 2012 and the chair of the Audit Committee. Ms. Freeman is also an inactive Chartered Financial Analyst. | N/A |
Isaiah Harris, Jr.
(Born 1952) | Trustee,
since 2009; Audit
Committee
Chair,
since 2019 | Retired. Chairman of the Board of CIGNA Corporation from 2009 to 2021, and Director from 2005 to 2008. From 2003 to 2011, Director of Deluxe Corporation. Prior thereto, President and CEO of BellSouth Advertising and Publishing Corp. from 2005 to 2007, President and CEO of BellSouth Enterprises from 2004 to 2005 and President of BellSouth Consumer Services from 2000 to 2003. Emeritus member of the Iowa State University Foundation Board of Governors. Emeritus Member of the Advisory Board of Iowa State University School of Business. Advisory Board Member, Palm Harbor Academy (private school). Advisory Board Member, Fellowship of Christian Athletes. Mr. Harris is a certified public accountant (inactive status). | N/A |
Judith M. Johnson**
(Born 1949) | Trustee,
since 2008 | Retired. Prior thereto, Chief Executive Officer and Chief Investment Officer of Minneapolis Employees Retirement Fund from 1996 to 2008. Ms. Johnson is an attorney, certified public accountant and a certified managerial accountant. | N/A |
David F. Larcker
(Born 1950) | Trustee,
since 2009 | James Irvin Miller Professor of Accounting at the Graduate School of Business (Emeritus), Stanford University, Director of the Corporate Governance Research Initiative and Senior Faculty of The Rock Center for Corporate Governance since 2006. From 2005 to 2008, Professor of Accounting at the Graduate School of Business, Stanford University. Prior thereto, Ernst & Young Professor of Accounting at The Wharton School, University of Pennsylvania from 1985 to 2005. | N/A |
Allspring Large Company Value Portfolio | 19
Other information (unaudited)
Name and
year of birth | Position held and
length of service* | Principal occupations during past five years or longer | Current other
public company or
investment
company
directorships |
Olivia S. Mitchell
(Born 1953) | Trustee,
since 2006;
Nominating and
Governance
Committee Chair,
since 2018 | International Foundation of Employee Benefit Plans Professor since 1993, Wharton School of the University of Pennsylvania. Director of Wharton’s Pension Research Council and Boettner Center on Pensions & Retirement Research, and Research Associate at the National Bureau of Economic Research. Previously taught at Cornell University from 1978 to 1993. | N/A |
Timothy J. Penny
(Born 1951) | Trustee,
since 1996;
Chair,
since 2018 | President and Chief Executive Officer of Southern Minnesota Initiative Foundation, a non-profit organization, since 2007. Member of the Board of Trustees of NorthStar Education Finance, Inc., a non-profit organization, since 2007. | N/A |
James G. Polisson
(Born 1959) | Trustee,
since 2018 | Retired. Chief Marketing Officer, Source (ETF) UK Services, Ltd, from 2015 to 2017. From 2012 to 2015, Principal of The Polisson Group, LLC, a management consulting, corporate advisory and principal investing company. Chief Executive Officer and Managing Director at Russell Investments, Global Exchange Traded Funds from 2010 to 2012. Managing Director of Barclays Global Investors from 1998 to 2010 and Global Chief Marketing Officer for iShares and Barclays Global Investors from 2000 to 2010. Trustee of the San Francisco Mechanics’ Institute, a non-profit organization, from 2013 to 2015. Board member of the Russell Exchange Traded Fund Trust from 2011 to 2012. Director of Barclays Global Investors Holdings Deutschland GmbH from 2006 to 2009. Mr. Polisson is an attorney and has a retired status with the Massachusetts and District of Columbia Bar Associations. | N/A |
Pamela Wheelock
(Born 1959) | Trustee,
since January
2020; previously
Trustee from
January 2018 to
July 2019 | Board member of the Destination Medical Center Economic Development Agency, Rochester, Minnesota since 2019. Interim President of the McKnight Foundation from January to September 2020. McKnight Foundation Consultant, November 2020 to February 2021. Acting Commissioner, Minnesota Department of Human Services, July 2019 through September 2019. Consultant (part-time), Minnesota Department of Human Services, October 2019 through December 2019. Chief Operating Officer, Twin Cities Habitat for Humanity from 2017 to 2019. Vice President of University Services, University of Minnesota from 2012 to 2016. Prior thereto, on the Board of Directors, Governance Committee and Finance Committee for the Minnesota Philanthropy Partners (Saint Paul Foundation) from 2012 to 2018, Interim Chief Executive Officer of Blue Cross Blue Shield of Minnesota from 2011 to 2012, Chairman of the Board from 2009 to 2012 and Board Director from 2003 to 2015. Vice President, Leadership and Community Engagement, Bush Foundation, Saint Paul, Minnesota (a private foundation) from 2009 to 2011. Executive Vice President and Chief Financial Officer, Minnesota Sports and Entertainment from 2004 to 2009 and Senior Vice President from 2002 to 2004. Executive Vice President of the Minnesota Wild Foundation from 2004 to 2008. Commissioner of Finance, State of Minnesota, from 1999 to 2002. Currently Board Chair of the Minnesota Wild Foundation since 2010. | N/A |
* Length of service dates reflect the Trustee’s commencement of service with the Trust’s predecessor entities, where applicable.
** Ms. Johnson has resigned from the Board effective December 31, 2021.
20 | Allspring Large Company Value Portfolio
Other information (unaudited)
Officers1
Name and
year of birth | Position held and
length of service | Principal occupations during past five years or longer |
Andrew Owen
(Born 1960) | President,
since 2017 | President, Chief Executive Officer and Director of Allspring Funds Management, LLC since 2017 and co-president of Galliard Capital Management, LLC, an affiliate of Allspring Funds Management, LLC, since 2019. Prior thereto, Head of Affiliated Managers, Allspring Global Investments, from 2014 to 2019 and Executive Vice President responsible for marketing, investments and product development for Allspring Funds Management, LLC, from 2009 to 2014. In addition, Mr. Owen was an Executive Vice President of Wells Fargo & Company from 2014 to 2021. |
Jeremy DePalma
(Born 1974) | Treasurer,
since 2012
(for certain funds in
the Fund Complex);
since 2021 (for
the remaining funds in the
Fund Complex) | Senior Vice President of Allspring Funds Management, LLC since 2009. Senior Vice President of Evergreen Investment Management Company, LLC from 2008 to 2010 and head of the Fund Reporting and Control Team within Fund Administration. |
Kate McKinley
(Born 1977) | Chief Legal Officer,
since 2021 | Chief Legal Officer of Allspring Global Investments since 2021. Prior thereto, held various roles at State Street Global Advisors beginning in 2010, including serving as Senior Vice President and General Counsel from 2019 to 2021, and Chief Operating Officer of the Institutional Client Group from 2016 - 2019. Prior to working at State Street Global Advisors served as Assistant General Counsel for Bank of America Corporation from 2005 to 2010 and as an Associate at WilmerHale from 2002 to 2005. |
Christopher Baker
(Born 1976) | Chief Compliance Officer, since 2022 | Global Chief Compliance Officer for Allspring Global Investments since 2022. Prior thereto, Chief Compliance Officer for State Street Global Advisors from 2018 to 2021. Senior Compliance Officer for the State Street divisions of Alternative Investment Solutions, Sector Solutions, and Global Marketing from 2015 to 2018. From 2010 to 2015 Vice President, Global Head of Investment and Marketing Compliance for State Street Global Advisors. |
Matthew Prasse
(Born 1983) | Secretary,
since 2021 | Senior Counsel of the Allspring Legal Department since 2021. Senior Counsel of the Wells Fargo Legal Department from 2018 to 2021. Previously, Counsel for Barings LLC from 2015 to 2018. Prior to joining Barings, Associate at Morgan, Lewis & Bockius LLP from 2008 to 2015. |
1 For those Officers with tenures at Allspring Global Investments and/or Allspring Funds Management, LLC that began prior to 2021, such tenures include years of service during which these businesses/entities were known as Wells Fargo Asset Management and Wells Fargo Funds Management, LLC, respectively.
Allspring Large Company Value Portfolio | 21
For more information
More information about Allspring Funds is available free upon request. To obtain literature, please write, visit the Portfolio's website, or call:
Allspring Funds
P.O. Box 219967
Kansas City, MO 64121-9967
Website: allspringglobal.com
Individual investors: 1-800-222-8222
Retail investment professionals: 1-888-877-9275
Institutional investment professionals: 1-866-765-0778
This report and the financial statements contained herein are submitted for the general information of the interest holders of the Portfolio. If this report is used for promotional purposes, distribution of the report must be accompanied or preceded by a current prospectus. Before investing, please consider the investment objectives, risks, charges, and expenses of the investment. For a current prospectus and, if available, a summary prospectus, containing this information, call
1-800-222-8222 or visit the Portfolio's website at allspringglobal.com. Read the prospectus carefully before you invest or send money.
Allspring Global InvestmentsTM is the trade name for the asset management firms of Allspring Global Investments Holdings, LLC, a holding company indirectly owned by certain private funds of GTCR LLC and Reverence Capital Partners, L.P. These firms include but are not limited to Allspring Global Investments, LLC, and Allspring Funds Management, LLC. Certain products managed by Allspring entities are distributed by Allspring Funds Distributor, LLC (a broker-dealer and Member FINRA/SIPC).
This material is for general informational and educational purposes only and is NOT intended to provide investment advice or a recommendation of any kind - including a recommendation for any specific investment, strategy, or plan.
© 2022 Allspring Global Investments Holdings, LLC. All rights reserved.
Semi-Annual Report
November 30, 2021
Allspring
Managed Fixed Income Portfolio
Allspring Managed Fixed Income Portfolio | 1
Portfolio information (unaudited)
| Investment objective | The Portfolio seeks consistent fixed-income returns. |
| Manager | Allspring Funds Management, LLC |
| Subadviser | Galliard Capital Management, Inc. |
| Portfolio managers | Andrea Johnson, CFA®‡, Brandon Kanz, CFA®‡ |
| Ten largest holdings (%) as of November 30, 20211 |
| U.S. Treasury Bond, 2.38%, 11-15-2049 | 2.24 |
| FNMA, 2.50%, 12-13-2051 | 2.06 |
| FNMA, 4.50%, 1-1-2051 | 1.97 |
| FNMA, 4.00%, 8-1-2051 | 1.75 |
| U.S. Treasury Note, 0.63%, 10-15-2024 | 1.47 |
| FNMA, 3.97%, 6-1-2025 | 1.44 |
| U.S. Treasury Note, 0.13%, 12-31-2022 | 1.27 |
| U.S. Treasury Bond, 1.38%, 11-15-2040 | 1.25 |
| U.S. Treasury Bond, 1.63%, 11-15-2050 | 1.22 |
| U.S. Treasury Bond, 1.88%, 2-15-2041 | 1.19 |
| 1 | Figures represent the percentage of the Portfolio's net assets. Holdings are subject to change and may have changed since the date specified. |
| Portfolio allocation as of November 30, 20211 |
| 1 | Figures represent the percentage of the Portfolio's long-term investments. These amounts are subject to change and may have changed since the date specified. |
| ‡ | CFA® and Chartered Financial Analyst® are trademarks owned by CFA Institute. |
2 | Allspring Managed Fixed Income Portfolio
Portfolio of investments—November 30, 2021 (unaudited)
| | | Interest
rate | Maturity
date | Principal | Value |
| Agency securities: 21.01% | | | | | | |
| FHLMC | | 2.00% | 12-1-2051 | $ | 970,000 | $ 976,684 |
| FHLMC | | 2.00 | 12-1-2051 | | 1,660,000 | 1,669,380 |
| FHLMC | | 2.00 | 11-25-2059 | | 1,101,096 | 1,104,188 |
| FHLMC | | 3.00 | 7-1-2046 | | 359,016 | 379,730 |
| FHLMC | | 3.00 | 7-1-2046 | | 404,443 | 426,235 |
| FHLMC | | 3.00 | 11-1-2049 | | 1,640,902 | 1,718,935 |
| FHLMC | | 3.50 | 4-1-2043 | | 460,397 | 495,416 |
| FHLMC | | 3.50 | 5-1-2044 | | 282,511 | 305,189 |
| FHLMC | | 3.50 | 6-1-2046 | | 194,226 | 207,686 |
| FHLMC | | 3.50 | 2-1-2047 | | 1,154,889 | 1,235,496 |
| FHLMC | | 3.50 | 4-1-2047 | | 224,330 | 240,709 |
| FHLMC | | 3.50 | 12-1-2047 | | 856,166 | 918,649 |
| FHLMC | | 3.50 | 3-1-2048 | | 917,695 | 979,577 |
| FHLMC | | 3.50 | 8-1-2049 | | 259,577 | 272,631 |
| FHLMC | | 4.00 | 4-1-2044 | | 340,572 | 375,309 |
| FHLMC | | 4.00 | 8-1-2044 | | 193,959 | 213,476 |
| FHLMC | | 4.00 | 6-1-2048 | | 1,004,083 | 1,089,741 |
| FHLMC | | 4.50 | 8-1-2048 | | 1,279,694 | 1,382,396 |
| FHLMC | | 4.50 | 11-1-2048 | | 1,293,966 | 1,411,902 |
| FHLMC | | 4.50 | 11-1-2048 | | 2,378,747 | 2,589,799 |
| FHLMC Series 2018-3 Class MA ±± | | 3.50 | 8-25-2057 | | 3,678,718 | 3,832,028 |
| FHLMC Series 2019-3 Class M55D | | 4.00 | 10-25-2058 | | 722,303 | 779,430 |
| FHLMC Structured Pass-Through Securities Series T-20 Class A6 øø | | 7.99 | 9-25-2029 | | 7,583 | 8,022 |
| FHLMC Structured Pass-Through Securities Series T-58 Class 4A | | 7.50 | 9-25-2043 | | 569,221 | 657,749 |
| FNMA | | 1.47 | 11-1-2029 | | 2,020,000 | 1,994,101 |
| FNMA %% | | 2.00 | 1-13-2052 | | 2,284,000 | 2,280,788 |
| FNMA ±± | | 2.50 | 5-1-2023 | | 141,563 | 143,357 |
| FNMA | | 2.50 | 8-1-2031 | | 186,594 | 194,849 |
| FNMA | | 2.50 | 2-1-2035 | | 757,360 | 793,246 |
| FNMA | | 2.50 | 2-1-2035 | | 938,834 | 980,021 |
| FNMA %% | | 2.50 | 12-13-2051 | | 10,210,000 | 10,466,845 |
| FNMA | | 2.73 | 1-1-2023 | | 514,160 | 525,402 |
| FNMA | | 2.73 | 9-1-2023 | | 532,635 | 548,733 |
| FNMA | | 3.00 | 12-1-2032 | | 24,772 | 26,242 |
| FNMA | | 3.00 | 7-1-2046 | | 265,135 | 280,360 |
| FNMA | | 3.00 | 4-1-2047 | | 1,101,740 | 1,155,291 |
| FNMA | | 3.00 | 12-1-2049 | | 1,523,503 | 1,596,721 |
| FNMA | | 3.00 | 12-1-2049 | | 1,343,945 | 1,409,169 |
| FNMA | | 3.07 | 2-1-2026 | | 353,444 | 374,649 |
| FNMA ±± | | 3.08 | 11-1-2022 | | 183,346 | 184,240 |
| FNMA ±± | | 3.08 | 9-1-2025 | | 2,958,819 | 3,112,949 |
| FNMA | | 3.08 | 1-1-2026 | | 473,679 | 503,734 |
| FNMA ±± | | 3.34 | 11-1-2026 | | 2,101,220 | 2,257,440 |
| FNMA | | 3.35 | 1-1-2028 | | 268,033 | 293,873 |
| FNMA ±± | | 3.37 | 12-1-2027 | | 1,041,852 | 1,133,236 |
| FNMA | | 3.50 | 10-1-2032 | | 397,305 | 425,905 |
| FNMA | | 3.50 | 11-1-2042 | | 156,440 | 168,917 |
| FNMA | | 3.50 | 11-1-2042 | | 162,031 | 174,963 |
| FNMA | | 3.50 | 2-1-2043 | | 81,734 | 88,263 |
| FNMA | | 3.50 | 11-1-2045 | | 716,294 | 768,802 |
| FNMA | | 3.50 | 4-1-2046 | | 94,948 | 101,838 |
| FNMA | | 3.50 | 7-1-2046 | | 230,775 | 246,285 |
The accompanying notes are an integral part of these financial statements.
Allspring Managed Fixed Income Portfolio | 3
Portfolio of investments—November 30, 2021 (unaudited)
| | | Interest
rate | Maturity
date | Principal | Value |
| Agency securities (continued) | | | | | | |
| FNMA | | 3.50% | 11-1-2046 | $ | 327,704 | $ 350,729 |
| FNMA | | 3.50 | 8-1-2047 | | 1,570,238 | 1,677,514 |
| FNMA | | 3.97 | 6-1-2025 | | 6,766,295 | 7,329,115 |
| FNMA | | 4.00 | 11-1-2040 | | 147,071 | 160,225 |
| FNMA | | 4.00 | 4-1-2041 | | 207,885 | 226,476 |
| FNMA | | 4.00 | 8-1-2046 | | 225,953 | 249,045 |
| FNMA | | 4.00 | 3-1-2049 | | 630,006 | 680,620 |
| FNMA | | 4.00 | 8-1-2051 | | 7,986,165 | 8,889,448 |
| FNMA | | 4.00 | 7-1-2056 | | 350,546 | 388,187 |
| FNMA | | 4.50 | 8-1-2048 | | 1,005,022 | 1,086,540 |
| FNMA | | 4.50 | 1-1-2051 | | 9,013,338 | 10,035,791 |
| FNMA | | 4.50 | 6-1-2056 | | 285,760 | 321,028 |
| FNMA | | 4.50 | 6-1-2056 | | 258,588 | 290,501 |
| FNMA | | 4.50 | 6-1-2056 | | 372,412 | 418,374 |
| FNMA | | 5.00 | 9-1-2033 | | 72,465 | 82,021 |
| FNMA | | 5.50 | 2-1-2036 | | 31,963 | 33,217 |
| FNMA Series 2002-90 Class A2 | | 6.50 | 11-25-2042 | | 246,995 | 282,315 |
| FNMA Series 2002-T4 Class A2 | | 7.00 | 12-25-2041 | | 89,296 | 103,330 |
| FNMA Series 2002-W4 Class A4 | | 6.25 | 5-25-2042 | | 839,329 | 959,770 |
| FNMA Series 2003-W4 Class 3A ±± | | 5.39 | 10-25-2042 | | 145,474 | 165,686 |
| FNMA Series 2004-T2 Class 1A1 | | 6.00 | 11-25-2043 | | 300,067 | 340,964 |
| FNMA Series 2004-T3 Class A1 | | 6.00 | 2-25-2044 | | 487,051 | 551,505 |
| FNMA Series 2004-W01 Class 2A2 | | 7.00 | 12-25-2033 | | 77,774 | 90,111 |
| FNMA Series 2004-W11 Class 1A3 | | 7.00 | 5-25-2044 | | 496,123 | 558,984 |
| FNMA Series 2004-W8 Class 3A | | 7.50 | 6-25-2044 | | 115,511 | 135,531 |
| GNMA | | 6.50 | 10-15-2023 | | 3,565 | 3,948 |
| GNMA | | 6.50 | 11-15-2023 | | 1,852 | 2,051 |
| GNMA | | 6.50 | 12-15-2023 | | 2,776 | 3,074 |
| GNMA | | 6.50 | 1-15-2024 | | 3,814 | 4,224 |
| GNMA | | 7.00 | 8-15-2027 | | 26,496 | 29,285 |
| SBA Series 2006-20B Class 1 | | 5.35 | 2-1-2026 | | 86,737 | 91,751 |
| SBA Series 2006-20H Class 1 | | 5.70 | 8-1-2026 | | 47,821 | 51,456 |
| SBA Series 2007-20J Class 1 | | 5.57 | 10-1-2027 | | 143,615 | 155,347 |
| SBA Series 2013-20A Class 1 | | 2.13 | 1-1-2033 | | 188,580 | 191,394 |
| SBA Series 2013-20J Class 1 | | 3.37 | 10-1-2033 | | 190,584 | 202,156 |
| SBA Series 2014-10A Class 1 | | 3.19 | 3-10-2024 | | 69,588 | 70,709 |
| SBA Series 2014-10B Class 1 | | 3.02 | 9-10-2024 | | 96,962 | 97,699 |
| SBA Series 2014-20A Class 1 | | 3.46 | 1-1-2034 | | 197,637 | 209,958 |
| SBA Series 2015-10B Class 1 | | 2.83 | 9-10-2025 | | 152,033 | 155,330 |
| SBA Series 2015-20C Class 1 | | 2.72 | 3-1-2035 | | 241,642 | 250,070 |
| SBA Series 2015-20E Class 1 | | 2.77 | 5-1-2035 | | 352,633 | 366,563 |
| SBA Series 2015-20F Class 1 | | 2.98 | 6-1-2035 | | 282,270 | 295,609 |
| SBA Series 2017-10A Class 1 | | 2.85 | 3-10-2027 | | 285,509 | 295,420 |
| SBA Series 2017-20F Class 1 | | 2.81 | 6-1-2037 | | 208,011 | 218,473 |
| SBA Series 2018-10B Class 1 | | 3.55 | 9-10-2028 | | 3,547,548 | 3,769,753 |
| SBA Series 2018-20E Class 1 | | 3.50 | 5-1-2038 | | 1,704,521 | 1,842,791 |
| SBA Series 2018-20G Class 1 | | 3.54 | 7-1-2038 | | 2,149,998 | 2,328,032 |
| SBA Series 2018-20H Class 1 | | 3.58 | 8-1-2038 | | 2,895,010 | 3,140,829 |
| SBA Series 2018-20K Class 1 | | 3.87 | 11-1-2038 | | 1,970,322 | 2,174,661 |
| Total Agency securities (Cost $101,703,789) | | | | | | 106,858,186 |
| Asset-backed securities: 1.84% | | | | | | |
| ECMC Group Student Loan Trust Series 16-1A Class A (1 Month LIBOR +1.35%) 144A± | | 1.44 | 7-26-2066 | | 286,257 | 294,362 |
The accompanying notes are an integral part of these financial statements.
4 | Allspring Managed Fixed Income Portfolio
Portfolio of investments—November 30, 2021 (unaudited)
| | | Interest
rate | Maturity
date | Principal | Value |
| Asset-backed securities (continued) | | | | | | |
| ECMC Group Student Loan Trust Series 2018-2A Class A (1 Month LIBOR +0.80%) 144A± | | 0.89% | 9-25-2068 | $ | 2,111,776 | $ 2,126,004 |
| Ford Credit Auto Owner Trust Series 2018-2 Class A 144A | | 3.47 | 1-15-2030 | | 3,200,000 | 3,338,482 |
| Ford Credit Auto Owner Trust Series 2021-1 Class A 144A | | 1.37 | 10-17-2033 | | 1,225,000 | 1,217,565 |
| MMAF Equipment Finance LLC Series 2017-AA Class A5 144A | | 2.68 | 7-16-2027 | | 571,721 | 576,923 |
| SLM Student Loan Trust Series 2003-10A Class A4 (3 Month LIBOR +0.67%) 144A± | | 0.79 | 12-17-2068 | | 1,310,000 | 1,310,182 |
| South Carolina Student Loan Corporation Series 2014-1 Class B (1 Month LIBOR +1.50%) ± | | 1.59 | 8-1-2035 | | 500,000 | 512,062 |
| Total Asset-backed securities (Cost $9,186,135) | | | | | | 9,375,580 |
| Corporate bonds and notes: 34.81% | | | | | | |
| Communication services: 1.77% | | | | | | |
| Diversified telecommunication services: 1.01% | | | | | | |
| AT&T Incorporated | | 2.25 | 2-1-2032 | | 460,000 | 443,891 |
| AT&T Incorporated | | 2.75 | 6-1-2031 | | 535,000 | 543,578 |
| AT&T Incorporated | | 4.75 | 5-15-2046 | | 1,280,000 | 1,558,159 |
| AT&T Incorporated | | 5.25 | 3-1-2037 | | 60,000 | 74,759 |
| Verizon Communications Incorporated | | 2.10 | 3-22-2028 | | 500,000 | 498,698 |
| Verizon Communications Incorporated | | 4.81 | 3-15-2039 | | 1,228,000 | 1,533,997 |
| Verizon Communications Incorporated 144A | | 2.36 | 3-15-2032 | | 470,000 | 465,204 |
| | | | | | | 5,118,286 |
| Entertainment: 0.11% | | | | | | |
| Walt Disney Company | | 2.65 | 1-13-2031 | | 540,000 | 560,562 |
| Media: 0.48% | | | | | | |
| CCO Holdings LLC 144A | | 4.50 | 8-15-2030 | | 381,000 | 384,027 |
| CCO Holdings LLC 144A | | 5.13 | 5-1-2027 | | 925,000 | 952,089 |
| Comcast Corporation | | 1.95 | 1-15-2031 | | 550,000 | 537,436 |
| Lamar Media Corporation | | 4.88 | 1-15-2029 | | 550,000 | 570,625 |
| | | | | | | 2,444,177 |
| Wireless telecommunication services: 0.17% | | | | | | |
| T-Mobile USA Incorporated | | 3.38 | 4-15-2029 | | 875,000 | 880,469 |
| Consumer discretionary: 3.67% | | | | | | |
| Auto components: 0.22% | | | | | | |
| Allison Transmission Incorporated 144A | | 4.75 | 10-1-2027 | | 1,075,000 | 1,109,938 |
| Automobiles: 0.15% | | | | | | |
| General Motors Company | | 4.88 | 10-2-2023 | | 400,000 | 425,318 |
| Volkswagen Group of America Incorporated 144A | | 2.85 | 9-26-2024 | | 300,000 | 311,665 |
| | | | | | | 736,983 |
| Diversified consumer services: 2.59% | | | | | | |
| Duke University | | 3.20 | 10-1-2038 | | 1,175,000 | 1,279,909 |
| Johns Hopkins University | | 2.81 | 1-1-2060 | | 280,000 | 289,162 |
| Massachusetts Institute of Technology | | 3.96 | 7-1-2038 | | 1,780,000 | 2,130,562 |
| Massachusetts Institute of Technology | | 4.68 | 7-1-2114 | | 120,000 | 187,804 |
| Massachusetts Institute of Technology | | 7.25 | 11-2-2096 | | 500,000 | 1,054,201 |
| Northwestern University | | 3.66 | 12-1-2057 | | 105,000 | 133,422 |
The accompanying notes are an integral part of these financial statements.
Allspring Managed Fixed Income Portfolio | 5
Portfolio of investments—November 30, 2021 (unaudited)
| | | Interest
rate | Maturity
date | Principal | Value |
| Diversified consumer services (continued) | | | | | | |
| Northwestern University | | 3.69% | 12-1-2038 | $ | 1,915,000 | $ 2,173,341 |
| President and Fellows of Harvard College | | 3.62 | 10-1-2037 | | 275,000 | 322,929 |
| President and Fellows of Harvard College | | 4.88 | 10-15-2040 | | 183,000 | 249,737 |
| President and Fellows of Harvard College | | 5.63 | 10-1-2038 | | 525,000 | 755,230 |
| Princeton University | | 5.70 | 3-1-2039 | | 1,640,000 | 2,378,501 |
| Service Corporation International | | 4.63 | 12-15-2027 | | 450,000 | 468,468 |
| Service Corporation International | | 7.50 | 4-1-2027 | | 345,000 | 413,138 |
| University of Southern California | | 3.03 | 10-1-2039 | | 1,250,000 | 1,339,949 |
| | | | | | | 13,176,353 |
| Hotels, restaurants & leisure: 0.16% | | | | | | |
| Cedar Fair LP | | 5.38 | 6-1-2024 | | 795,000 | 803,355 |
| Specialty retail: 0.08% | | | | | | |
| Lowe's Companies Incorporated | | 1.70 | 9-15-2028 | | 420,000 | 410,071 |
| Textiles, apparel & luxury goods: 0.47% | | | | | | |
| HanesBrands Incorporated 144A | | 4.63 | 5-15-2024 | | 200,000 | 208,000 |
| HanesBrands Incorporated 144A | | 4.88 | 5-15-2026 | | 1,250,000 | 1,334,625 |
| The William Carter Company 144A | | 5.63 | 3-15-2027 | | 185,000 | 190,465 |
| Wolverine World Wide Company 144A | | 4.00 | 8-15-2029 | | 700,000 | 679,000 |
| | | | | | | 2,412,090 |
| Consumer staples: 0.41% | | | | | | |
| Beverages: 0.21% | | | | | | |
| Anheuser-Busch InBev Worldwide Incorporated | | 4.70 | 2-1-2036 | | 870,000 | 1,046,175 |
| Food products: 0.11% | | | | | | |
| 7 Eleven Incorporated 144A | | 0.95 | 2-10-2026 | | 220,000 | 212,232 |
| Ingredion Incorporated | | 2.90 | 6-1-2030 | | 320,000 | 334,577 |
| | | | | | | 546,809 |
| Household products: 0.09% | | | | | | |
| Central Garden & Pet Company | | 5.13 | 2-1-2028 | | 460,000 | 477,586 |
| Energy: 4.53% | | | | | | |
| Energy equipment & services: 0.48% | | | | | | |
| Baker Hughes LLC | | 3.34 | 12-15-2027 | | 1,500,000 | 1,602,173 |
| Halliburton Company | | 2.92 | 3-1-2030 | | 820,000 | 839,267 |
| | | | | | | 2,441,440 |
| Oil, gas & consumable fuels: 4.05% | | | | | | |
| Antero Resources Corporation | | 5.00 | 3-1-2025 | | 1,360,000 | 1,366,800 |
| Antero Resources Corporation 144A | | 5.38 | 3-1-2030 | | 245,000 | 252,656 |
| Apache Corporation | | 4.38 | 10-15-2028 | | 100,000 | 105,401 |
| Buckeye Partners LP | | 3.95 | 12-1-2026 | | 247,000 | 242,284 |
| Coterra Energy Incorporated 144A | | 3.90 | 5-15-2027 | | 500,000 | 542,107 |
| Devon Energy Corporation 144A | | 4.50 | 1-15-2030 | | 450,000 | 483,270 |
| Enable Midstream Partners | | 4.95 | 5-15-2028 | | 790,000 | 880,258 |
| EnLink Midstream Partners LP | | 4.85 | 7-15-2026 | | 430,000 | 440,999 |
| Enterprise Products Operating LLC | | 4.15 | 10-16-2028 | | 260,000 | 293,013 |
| Florida Gas Transmission Company 144A | | 4.35 | 7-15-2025 | | 1,521,000 | 1,653,620 |
| Gray Oak Pipeline LLC 144A | | 2.60 | 10-15-2025 | | 860,000 | 874,627 |
| Gulfstream Natural Gas System LLC 144A | | 6.19 | 11-1-2025 | | 210,000 | 243,816 |
The accompanying notes are an integral part of these financial statements.
6 | Allspring Managed Fixed Income Portfolio
Portfolio of investments—November 30, 2021 (unaudited)
| | | Interest
rate | Maturity
date | Principal | Value |
| Oil, gas & consumable fuels (continued) | | | | | | |
| Hess Corporation | | 4.30% | 4-1-2027 | $ | 460,000 | $ 499,565 |
| HollyFrontier Corporation | | 4.50 | 10-1-2030 | | 910,000 | 980,139 |
| Magellan Midstream Partners LP | | 5.00 | 3-1-2026 | | 170,000 | 190,545 |
| Marathon Petroleum Corporation | | 5.13 | 12-15-2026 | | 1,500,000 | 1,704,461 |
| MPLX LP | | 4.13 | 3-1-2027 | | 1,500,000 | 1,631,608 |
| Newfield Exploration Company | | 5.38 | 1-1-2026 | | 959,000 | 1,056,942 |
| Newfield Exploration Company | | 5.63 | 7-1-2024 | | 249,000 | 270,958 |
| NuStar Logistics LP | | 6.00 | 6-1-2026 | | 600,000 | 635,250 |
| Occidental Petroleum Corporation | | 3.20 | 8-15-2026 | | 1,070,000 | 1,051,275 |
| Plains All American Pipeline LP | | 4.70 | 6-15-2044 | | 600,000 | 636,477 |
| Plains All American Pipeline LP | | 4.90 | 2-15-2045 | | 80,000 | 88,704 |
| Range Resources Corporation | | 4.88 | 5-15-2025 | | 200,000 | 204,042 |
| Range Resources Corporation | | 5.00 | 3-15-2023 | | 753,000 | 763,339 |
| Transcontinental Gas Pipe Line Company LLC | | 3.25 | 5-15-2030 | | 790,000 | 832,778 |
| Transcontinental Gas Pipe Line Company LLC | | 7.85 | 2-1-2026 | | 1,200,000 | 1,472,322 |
| Western Midstream Operating LP | | 5.30 | 2-1-2030 | | 1,100,000 | 1,183,930 |
| | | | | | | 20,581,186 |
| Financials: 5.97% | | | | | | |
| Banks: 2.84% | | | | | | |
| Bank of America Corporation (U.S. SOFR +1.15%) ± | | 1.32 | 6-19-2026 | | 790,000 | 782,463 |
| Bank of America Corporation (U.S. SOFR +0.96%) ± | | 1.73 | 7-22-2027 | | 1,400,000 | 1,387,353 |
| Bank of America Corporation (U.S. SOFR +1.37%) ± | | 1.92 | 10-24-2031 | | 540,000 | 515,374 |
| Bank of America Corporation (3 Month LIBOR +1.51%) ± | | 3.71 | 4-24-2028 | | 1,440,000 | 1,554,866 |
| Bank of America Corporation (U.S. SOFR +1.21%) ± | | 2.57 | 10-20-2032 | | 170,000 | 170,730 |
| Citigroup Incorporated (U.S. SOFR +0.77%) ± | | 1.12 | 1-28-2027 | | 330,000 | 320,397 |
| Citigroup Incorporated (U.S. SOFR +1.18%) ± | | 2.52 | 11-3-2032 | | 450,000 | 449,771 |
| Citigroup Incorporated (U.S. SOFR +2.11%) ± | | 2.57 | 6-3-2031 | | 370,000 | 372,067 |
| Citigroup Incorporated | | 3.40 | 5-1-2026 | | 1,000,000 | 1,075,600 |
| Citigroup Incorporated (3 Month LIBOR +1.39%) ± | | 3.67 | 7-24-2028 | | 900,000 | 968,158 |
| Citigroup Incorporated | | 4.40 | 6-10-2025 | | 65,000 | 70,593 |
| JPMorgan Chase & Company (U.S. SOFR +0.77%) ± | | 1.47 | 9-22-2027 | | 660,000 | 647,367 |
| JPMorgan Chase & Company (U.S. SOFR +1.89%) ± | | 2.18 | 6-1-2028 | | 310,000 | 310,691 |
| JPMorgan Chase & Company (U.S. SOFR +1.25%) ± | | 2.58 | 4-22-2032 | | 110,000 | 110,927 |
| JPMorgan Chase & Company | | 3.20 | 6-15-2026 | | 500,000 | 530,810 |
| JPMorgan Chase & Company (3 Month LIBOR +1.34%) ± | | 3.78 | 2-1-2028 | | 1,100,000 | 1,191,969 |
| JPMorgan Chase & Company (3 Month LIBOR +1.26%) ± | | 4.20 | 7-23-2029 | | 600,000 | 670,689 |
| JPMorgan Chase & Company (3 Month LIBOR +1.33%) ± | | 4.45 | 12-5-2029 | | 470,000 | 534,080 |
| KeyCorp | | 2.25 | 4-6-2027 | | 690,000 | 705,219 |
| National Capital Commerce Incorporated (3 Month LIBOR +0.98%) ± | | 1.11 | 4-1-2027 | | 400,000 | 395,448 |
| PNC Bank | | 4.05 | 7-26-2028 | | 1,000,000 | 1,130,014 |
| Regions Financial Corporation | | 1.80 | 8-12-2028 | | 540,000 | 529,276 |
| | | | | | | 14,423,862 |
| Capital markets: 1.07% | | | | | | |
| Goldman Sachs Capital II (3 Month LIBOR +0.77%) ± | | 4.00 | 12-29-2049 | | 6,000 | 5,850 |
| Goldman Sachs Group Incorporated | | 3.75 | 2-25-2026 | | 1,500,000 | 1,615,548 |
| Goldman Sachs Group Incorporated | | 4.25 | 10-21-2025 | | 120,000 | 130,492 |
| Goldman Sachs Group Incorporated (3 Month LIBOR +1.30%) ± | | 4.22 | 5-1-2029 | | 570,000 | 632,022 |
| Morgan Stanley | | 3.88 | 1-27-2026 | | 1,000,000 | 1,085,067 |
| Morgan Stanley | | 3.95 | 4-23-2027 | | 1,000,000 | 1,092,651 |
The accompanying notes are an integral part of these financial statements.
Allspring Managed Fixed Income Portfolio | 7
Portfolio of investments—November 30, 2021 (unaudited)
| | | Interest
rate | Maturity
date | Principal | Value |
| Capital markets (continued) | | | | | | |
| Morgan Stanley (U.S. SOFR +0.86%) ± | | 1.51% | 7-20-2027 | $ | 300,000 | $ 294,260 |
| MSCI Incorporated 144A | | 4.00 | 11-15-2029 | | 590,000 | 611,388 |
| | | | | | | 5,467,278 |
| Consumer finance: 1.62% | | | | | | |
| American Express Company | | 1.65 | 11-4-2026 | | 780,000 | 778,596 |
| American Honda Finance Corporation | | 1.30 | 9-9-2026 | | 680,000 | 669,979 |
| BMW US Capital LLC Company 144A | | 3.15 | 4-18-2024 | | 945,000 | 990,278 |
| Capital One Financial Corporation | | 3.30 | 10-30-2024 | | 1,500,000 | 1,581,361 |
| Daimler Finance North America LLC 144A | | 2.70 | 6-14-2024 | | 740,000 | 767,451 |
| Daimler Finance North America LLC 144A | | 3.35 | 2-22-2023 | | 1,490,000 | 1,536,813 |
| Ford Motor Credit Company LLC | | 5.58 | 3-18-2024 | | 1,130,000 | 1,205,484 |
| General Motors Finance Company | | 2.40 | 10-15-2028 | | 380,000 | 376,377 |
| Toyota Motor Credit Corporation | | 1.13 | 6-18-2026 | | 340,000 | 333,779 |
| | | | | | | 8,240,118 |
| Insurance: 0.41% | | | | | | |
| Minnesota Life Insurance Company 144A« | | 8.25 | 9-15-2025 | | 650,000 | 793,666 |
| NLV Financial Corporation 144A | | 7.50 | 8-15-2033 | | 565,000 | 763,489 |
| Northwestern Mutual Life 144A | | 3.45 | 3-30-2051 | | 470,000 | 520,766 |
| | | | | | | 2,077,921 |
| Mortgage REITs: 0.03% | | | | | | |
| Ventas Realty LP | | 3.50 | 2-1-2025 | | 150,000 | 158,864 |
| Health care: 3.62% | | | | | | |
| Biotechnology: 0.28% | | | | | | |
| AbbVie Incorporated | | 4.55 | 3-15-2035 | | 1,200,000 | 1,432,617 |
| Health care equipment & supplies: 0.84% | | | | | | |
| Baxter International Incorporated 144A%% | | 1.92 | 2-1-2027 | | 260,000 | 259,890 |
| Baxter International Incorporated 144A%% | | 2.27 | 12-1-2028 | | 1,130,000 | 1,136,190 |
| Hill-Rom Holdings Incorporated 144A | | 4.38 | 9-15-2027 | | 810,000 | 840,251 |
| Hologic Incorporated 144A | | 3.25 | 2-15-2029 | | 505,000 | 495,531 |
| Hologic Incorporated 144A | | 4.63 | 2-1-2028 | | 575,000 | 596,563 |
| Teleflex Incorporated 144A | | 4.25 | 6-1-2028 | | 800,000 | 808,000 |
| Teleflex Incorporated | | 4.63 | 11-15-2027 | | 150,000 | 154,313 |
| | | | | | | 4,290,738 |
| Health care providers & services: 1.63% | | | | | | |
| Advocate Health Corporation | | 4.27 | 8-15-2048 | | 290,000 | 373,179 |
| BayCare Health System Incorporated | | 3.83 | 11-15-2050 | | 145,000 | 178,969 |
| Cleveland Clinic Foundation | | 4.86 | 1-1-2114 | | 347,000 | 544,758 |
| CVS Health Corporation | | 1.75 | 8-21-2030 | | 200,000 | 190,197 |
| CVS Health Corporation | | 4.30 | 3-25-2028 | | 285,000 | 320,902 |
| CVS Health Corporation | | 5.05 | 3-25-2048 | | 130,000 | 171,774 |
| Kaiser Foundation Hospitals | | 3.27 | 11-1-2049 | | 160,000 | 177,004 |
| Mayo Clinic | | 4.13 | 11-15-2052 | | 650,000 | 842,359 |
| MEDNAX Incorporated 144A | | 6.25 | 1-15-2027 | | 342,000 | 356,945 |
| Memorial Health Services | | 3.45 | 11-1-2049 | | 590,000 | 671,189 |
| Memorial Sloan Kettering Cancer Center | | 4.20 | 7-1-2055 | | 185,000 | 241,386 |
| Northwestern Memorial Hospital | | 2.63 | 7-15-2051 | | 480,000 | 476,831 |
| NYU Hospitals Center | | 3.38 | 7-1-2055 | | 690,000 | 750,146 |
| OhioHealth Corporation | | 2.83 | 11-15-2041 | | 730,000 | 755,288 |
The accompanying notes are an integral part of these financial statements.
8 | Allspring Managed Fixed Income Portfolio
Portfolio of investments—November 30, 2021 (unaudited)
| | | Interest
rate | Maturity
date | Principal | Value |
| Health care providers & services (continued) | | | | | | |
| OhioHealth Corporation | | 3.04% | 11-15-2050 | $ | 260,000 | $ 276,539 |
| Stanford Health Care | | 3.80 | 11-15-2048 | | 145,000 | 176,056 |
| Texas Health Resources | | 4.33 | 11-15-2055 | | 687,000 | 926,151 |
| The New York-Presbyterian Hospital | | 3.56 | 8-1-2036 | | 750,000 | 834,858 |
| | | | | | | 8,264,531 |
| Health care technology: 0.09% | | | | | | |
| IQVIA Incorporated 144A | | 5.00 | 10-15-2026 | | 445,000 | 455,013 |
| Life sciences tools & services: 0.42% | | | | | | |
| Agilent Technologies Incorporated | | 2.75 | 9-15-2029 | | 600,000 | 622,059 |
| Charles River Laboratories Incorporated 144A | | 4.25 | 5-1-2028 | | 745,000 | 755,218 |
| Perkinelmer Incorporated | | 1.90 | 9-15-2028 | | 490,000 | 478,180 |
| Thermo Fisher Scientific Incorporated | | 1.75 | 10-15-2028 | | 280,000 | 275,288 |
| | | | | | | 2,130,745 |
| Pharmaceuticals: 0.36% | | | | | | |
| Astrazeneca Finance LLC | | 1.20 | 5-28-2026 | | 250,000 | 246,774 |
| Bayer US Finance LLC 144A | | 3.38 | 10-8-2024 | | 240,000 | 251,611 |
| Bayer US Finance LLC 144A | | 4.38 | 12-15-2028 | | 1,170,000 | 1,313,804 |
| | | | | | | 1,812,189 |
| Industrials: 3.10% | | | | | | |
| Aerospace & defense: 1.05% | | | | | | |
| BAE Systems Holdings Incorporated 144A | | 3.80 | 10-7-2024 | | 1,345,000 | 1,433,441 |
| Hexcel Corporation | | 4.20 | 2-15-2027 | | 1,302,000 | 1,387,889 |
| Moog Incorporated 144A | | 4.25 | 12-15-2027 | | 700,000 | 710,973 |
| Raytheon Technologies Corporation | | 2.25 | 7-1-2030 | | 360,000 | 359,485 |
| Raytheon Technologies Corporation | | 2.38 | 3-15-2032 | | 250,000 | 250,138 |
| The Boeing Company | | 2.70 | 2-1-2027 | | 840,000 | 856,283 |
| The Boeing Company | | 5.15 | 5-1-2030 | | 155,000 | 179,799 |
| The Boeing Company | | 5.71 | 5-1-2040 | | 110,000 | 140,492 |
| | | | | | | 5,318,500 |
| Air freight & logistics: 0.06% | | | | | | |
| Fedex Corporation | | 3.90 | 2-1-2035 | | 280,000 | 313,270 |
| Building products: 0.34% | | | | | | |
| Fortune Brands Home | | 3.25 | 9-15-2029 | | 460,000 | 494,594 |
| Lennox International Incorporated | | 1.70 | 8-1-2027 | | 530,000 | 524,199 |
| Masco Corporation | | 6.50 | 8-15-2032 | | 150,000 | 199,165 |
| Masonite International Company 144A | | 5.38 | 2-1-2028 | | 510,000 | 531,038 |
| | | | | | | 1,748,996 |
| Chemicals: 0.14% | | | | | | |
| Axalta Coating Systems LLC 144A | | 4.75 | 6-15-2027 | | 670,000 | 692,412 |
| Commercial services & supplies: 0.28% | | | | | | |
| Clean Harbors Incorporated 144A | | 4.88 | 7-15-2027 | | 425,000 | 436,688 |
| Stericycle Incorporated 144A | | 3.88 | 1-15-2029 | | 1,010,000 | 984,750 |
| | | | | | | 1,421,438 |
The accompanying notes are an integral part of these financial statements.
Allspring Managed Fixed Income Portfolio | 9
Portfolio of investments—November 30, 2021 (unaudited)
| | | Interest
rate | Maturity
date | Principal | Value |
| Electrical equipment: 0.16% | | | | | | |
| Carrier Global Corporation | | 2.49% | 2-15-2027 | $ | 780,000 | $ 797,764 |
| Machinery: 0.34% | | | | | | |
| Mueller Water Products Incorporated 144A | | 4.00 | 6-15-2029 | | 700,000 | 700,000 |
| Oshkosh Corporation | | 3.10 | 3-1-2030 | | 490,000 | 516,201 |
| Oshkosh Corporation | | 4.60 | 5-15-2028 | | 200,000 | 227,942 |
| Vessel Management Services Incorporated | | 3.43 | 8-15-2036 | | 255,000 | 281,329 |
| | | | | | | 1,725,472 |
| Professional services: 0.10% | | | | | | |
| Equifax Incorporated | | 2.35 | 9-15-2031 | | 180,000 | 177,145 |
| Relx Capital Incorporated | | 3.00 | 5-22-2030 | | 70,000 | 73,744 |
| Relx Capital Incorporated | | 4.00 | 3-18-2029 | | 240,000 | 266,812 |
| | | | | | | 517,701 |
| Road & rail: 0.33% | | | | | | |
| Norfolk Southern Corporation | | 5.10 | 12-31-2049 | | 760,000 | 1,025,357 |
| Ryder System Incorporated | | 3.65 | 3-18-2024 | | 620,000 | 654,770 |
| | | | | | | 1,680,127 |
| Transportation infrastructure: 0.30% | | | | | | |
| Crowley Conro LLC | | 4.18 | 8-15-2043 | | 1,315,076 | 1,537,759 |
| Information technology: 2.20% | | | | | | |
| Electronic equipment, instruments & components: 0.29% | | | | | | |
| Amphenol Corporation | | 2.20 | 9-15-2031 | | 480,000 | 471,672 |
| Jabil Incorporated | | 3.95 | 1-12-2028 | | 900,000 | 986,905 |
| | | | | | | 1,458,577 |
| IT services: 0.18% | | | | | | |
| Gartner Incorporated 144A | | 4.50 | 7-1-2028 | | 580,000 | 602,794 |
| Verisign Incorporated | | 4.75 | 7-15-2027 | | 300,000 | 311,658 |
| | | | | | | 914,452 |
| Semiconductors & semiconductor equipment: 0.77% | | | | | | |
| KLA Tencor Corporation | | 4.10 | 3-15-2029 | | 150,000 | 170,491 |
| Maxim Integrated Products Incorporated | | 3.45 | 6-15-2027 | | 1,550,000 | 1,685,879 |
| Microchip Technology Incorporated | | 4.33 | 6-1-2023 | | 1,500,000 | 1,570,554 |
| ON Semiconductor Corporation 144A | | 3.88 | 9-1-2028 | | 500,000 | 508,695 |
| | | | | | | 3,935,619 |
| Software: 0.58% | | | | | | |
| CDK Global Incorporated 144A | | 5.25 | 5-15-2029 | | 475,000 | 502,313 |
| Fair Isaac Corporation 144A | | 4.00 | 6-15-2028 | | 725,000 | 723,188 |
| Fair Isaac Corporation 144A | | 5.25 | 5-15-2026 | | 705,000 | 774,619 |
| Oracle Corporation | | 2.30 | 3-25-2028 | | 970,000 | 975,391 |
| | | | | | | 2,975,511 |
| Technology hardware, storage & peripherals: 0.38% | | | | | | |
| Apple Incorporated | | 1.40 | 8-5-2028 | | 560,000 | 547,082 |
| Hewlett Packard Enterprise Company | | 4.90 | 10-15-2025 | | 375,000 | 416,775 |
The accompanying notes are an integral part of these financial statements.
10 | Allspring Managed Fixed Income Portfolio
Portfolio of investments—November 30, 2021 (unaudited)
| | | Interest
rate | Maturity
date | Principal | Value |
| Technology hardware, storage & peripherals (continued) | | | | | | |
| HP Incorporated 144A | | 1.45% | 6-17-2026 | $ | 350,000 | $ 344,659 |
| TSMC Arizona Corporation | | 1.75 | 10-25-2026 | | 600,000 | 602,421 |
| | | | | | | 1,910,937 |
| Materials: 3.89% | | | | | | |
| Chemicals: 2.37% | | | | | | |
| Albemarle Corporation | | 4.15 | 12-1-2024 | | 1,390,000 | 1,496,968 |
| Ashland LLC 144A | | 3.38 | 9-1-2031 | | 875,000 | 855,313 |
| DuPont de Nemours Incorporated | | 4.49 | 11-15-2025 | | 430,000 | 475,624 |
| DuPont de Nemours Incorporated | | 4.73 | 11-15-2028 | | 930,000 | 1,083,621 |
| FMC Corporation | | 3.20 | 10-1-2026 | | 1,120,000 | 1,190,752 |
| Ingevity Corporation 144A | | 4.50 | 2-1-2026 | | 2,015,000 | 2,032,631 |
| Mosaic Company | | 4.05 | 11-15-2027 | | 1,090,000 | 1,198,662 |
| PPG Industries Incorporated | | 2.55 | 6-15-2030 | | 770,000 | 790,713 |
| RPM International Incorporated | | 4.55 | 3-1-2029 | | 420,000 | 478,108 |
| Scotts Miracle-Gro Company | | 4.50 | 10-15-2029 | | 120,000 | 123,900 |
| Scotts Miracle-Gro Company | | 5.25 | 12-15-2026 | | 800,000 | 820,000 |
| The Sherwin-Williams Company | | 2.95 | 8-15-2029 | | 450,000 | 473,343 |
| The Sherwin-Williams Company | | 3.30 | 2-1-2025 | | 100,000 | 104,740 |
| Valvoline Incorporated 144A | | 4.25 | 2-15-2030 | | 720,000 | 713,808 |
| WR Grace Holding LLC 144A | | 5.63 | 10-1-2024 | | 200,000 | 212,821 |
| | | | | | | 12,051,004 |
| Construction materials: 0.10% | | | | | | |
| CRH America Finance Incorporated 144A | | 3.40 | 5-9-2027 | | 200,000 | 214,913 |
| Martin Marietta Materials Incorporated | | 2.50 | 3-15-2030 | | 280,000 | 282,281 |
| | | | | | | 497,194 |
| Containers & packaging: 1.02% | | | | | | |
| Graphic Packaging International Company 144A | | 3.50 | 3-15-2028 | | 275,000 | 272,250 |
| Graphic Packaging International Company 144A | | 3.50 | 3-1-2029 | | 420,000 | 413,364 |
| Graphic Packaging International Company | | 4.13 | 8-15-2024 | | 355,000 | 375,413 |
| Packaging Corporation of America | | 3.00 | 12-15-2029 | | 480,000 | 505,078 |
| Sealed Air Corporation 144A | | 5.50 | 9-15-2025 | | 450,000 | 490,500 |
| Silgan Holdings Incorporated | | 4.13 | 2-1-2028 | | 760,000 | 769,500 |
| Westrock Company | | 3.00 | 9-15-2024 | | 1,680,000 | 1,758,324 |
| WRKCo Incorporated | | 3.90 | 6-1-2028 | | 560,000 | 618,322 |
| | | | | | | 5,202,751 |
| Metals & mining: 0.25% | | | | | | |
| Freeport-McMoRan Incorporated | | 4.13 | 3-1-2028 | | 840,000 | 863,100 |
| Freeport-McMoRan Incorporated | | 4.55 | 11-14-2024 | | 385,000 | 411,769 |
| | | | | | | 1,274,869 |
| Paper & forest products: 0.15% | | | | | | |
| Clearwater Paper Corporation 144A | | 4.75 | 8-15-2028 | | 775,000 | 782,750 |
| Real estate: 2.64% | | | | | | |
| Equity REITs: 2.64% | | | | | | |
| Alexandria Real Estate Equities Incorporated | | 3.95 | 1-15-2027 | | 240,000 | 261,910 |
| Alexandria Real Estate Equities Incorporated | | 4.30 | 1-15-2026 | | 1,500,000 | 1,656,899 |
| Boston Properties LP | | 2.75 | 10-1-2026 | | 780,000 | 812,109 |
The accompanying notes are an integral part of these financial statements.
Allspring Managed Fixed Income Portfolio | 11
Portfolio of investments—November 30, 2021 (unaudited)
| | | Interest
rate | Maturity
date | Principal | Value |
| Equity REITs (continued) | | | | | | |
| Boston Properties LP | | 3.20% | 1-15-2025 | $ | 250,000 | $ 262,439 |
| CubeSmart LP | | 2.25 | 12-15-2028 | | 160,000 | 160,590 |
| Digital Realty Trust LP | | 4.45 | 7-15-2028 | | 510,000 | 579,393 |
| Duke Realty LP | | 3.25 | 6-30-2026 | | 1,500,000 | 1,603,624 |
| Duke Realty LP | | 4.00 | 9-15-2028 | | 230,000 | 257,099 |
| HCP Incorporated | | 3.50 | 7-15-2029 | | 560,000 | 610,020 |
| Healthcare Trust of America Incorporated | | 3.50 | 8-1-2026 | | 255,000 | 273,800 |
| Healthpeak Properties Incorporated | | 2.13 | 12-1-2028 | | 40,000 | 39,958 |
| Healthpeak Properties Incorporated | | 2.88 | 1-15-2031 | | 190,000 | 197,204 |
| Host Hotels & Resorts Incorporated | | 3.88 | 4-1-2024 | | 265,000 | 278,388 |
| Kimco Realty Corporation | | 3.30 | 2-1-2025 | | 1,500,000 | 1,585,180 |
| Mid-America Apartments LP | | 3.60 | 6-1-2027 | | 845,000 | 916,711 |
| Mid-America Apartments LP | | 4.20 | 6-15-2028 | | 160,000 | 180,660 |
| National Retail Properties Incorporated | | 4.30 | 10-15-2028 | | 370,000 | 418,330 |
| Simon Property Group LP | | 1.38 | 1-15-2027 | | 750,000 | 734,417 |
| Ventas Realty LP | | 3.85 | 4-1-2027 | | 1,500,000 | 1,635,739 |
| Welltower Incorporated | | 2.05 | 1-15-2029 | | 190,000 | 187,063 |
| Welltower Incorporated | | 2.70 | 2-15-2027 | | 460,000 | 478,284 |
| Welltower Incorporated | | 2.75 | 1-15-2032 | | 320,000 | 322,784 |
| | | | | | | 13,452,601 |
| Utilities: 3.01% | | | | | | |
| Electric utilities: 2.46% | | | | | | |
| American Transmission System Incorporated 144A%% | | 2.65 | 1-15-2032 | | 380,000 | 383,862 |
| Dominion Energy South Carolina Incorporated | | 2.30 | 12-1-2031 | | 450,000 | 452,900 |
| Duke Energy Carolinas LLC | | 6.05 | 4-15-2038 | | 830,000 | 1,168,043 |
| Duke Energy Florida LLC %% | | 2.40 | 12-15-2031 | | 200,000 | 201,267 |
| Duke Energy Progress LLC | | 2.00 | 8-15-2031 | | 620,000 | 608,211 |
| Evergy Metro Incorporated | | 2.25 | 6-1-2030 | | 350,000 | 352,877 |
| FirstEnergy Corporation | | 4.40 | 7-15-2027 | | 365,000 | 390,259 |
| ITC Holdings Corporation | | 3.65 | 6-15-2024 | | 120,000 | 126,029 |
| MidAmerican Energy Holdings Company | | 5.80 | 10-15-2036 | | 900,000 | 1,236,584 |
| Monongahela Power Company 144A | | 4.10 | 4-15-2024 | | 1,660,000 | 1,756,485 |
| NextEra Energy Operating Partners LP 144A | | 4.25 | 9-15-2024 | | 6,000 | 6,266 |
| NextEra Energy Operating Partners LP 144A | | 4.50 | 9-15-2027 | | 500,000 | 529,065 |
| Northern States Power Company of Minnesota | | 5.35 | 11-1-2039 | | 1,580,000 | 2,173,457 |
| Public Service Electric & Gas Company | | 5.70 | 12-1-2036 | | 590,000 | 798,899 |
| Rochester Gas & Electric Corporation 144A | | 3.10 | 6-1-2027 | | 1,790,000 | 1,898,910 |
| Southern California Edison Company | | 6.00 | 1-15-2034 | | 188,000 | 244,700 |
| Trans-Allegheny Interstate Line Company 144A | | 3.85 | 6-1-2025 | | 200,000 | 212,398 |
| | | | | | | 12,540,212 |
| Gas utilities: 0.39% | | | | | | |
| AmeriGas Partners LP | | 5.50 | 5-20-2025 | | 450,000 | 481,500 |
| AmeriGas Partners LP | | 5.88 | 8-20-2026 | | 500,000 | 545,630 |
| Boardwalk Pipelines Company | | 5.95 | 6-1-2026 | | 550,000 | 635,780 |
| CenterPoint Energy Incorporated | | 1.75 | 10-1-2030 | | 330,000 | 309,868 |
| | | | | | | 1,972,778 |
| Multi-utilities: 0.16% | | | | | | |
| Black Hills Corporation | | 4.35 | 5-1-2033 | | 710,000 | 815,099 |
| Total Corporate bonds and notes (Cost $165,354,019) | | | | | | 177,037,149 |
The accompanying notes are an integral part of these financial statements.
12 | Allspring Managed Fixed Income Portfolio
Portfolio of investments—November 30, 2021 (unaudited)
| | | Interest
rate | Maturity
date | Principal | Value |
| Municipal obligations: 9.02% | | | | | | |
| Alabama: 0.17% | | | | | | |
| Miscellaneous revenue: 0.17% | | | | | | |
| Alabama Federal Aid Highway Finance Authority Series B | | 2.65% | 9-1-2037 | $ | 835,000 | $ 841,933 |
| Arizona: 0.09% | | | | | | |
| Miscellaneous revenue: 0.09% | | | | | | |
| Yuma AZ Pledged Revenue Obligations Series 2021 | | 2.10 | 7-15-2030 | | 430,000 | 436,856 |
| California: 1.61% | | | | | | |
| GO revenue: 1.52% | | | | | | |
| Alameda County CA Series A | | 3.70 | 8-1-2031 | | 275,000 | 307,983 |
| Campbell Union High School District | | 2.31 | 8-1-2035 | | 660,000 | 662,504 |
| Coast Community College District | | 2.89 | 8-1-2035 | | 1,165,000 | 1,250,873 |
| Desert Community College District %% | | 2.78 | 8-1-2035 | | 450,000 | 457,642 |
| Oxnard Union High School District | | 1.87 | 8-1-2030 | | 800,000 | 788,051 |
| Palomar Community College District | | 2.32 | 8-1-2034 | | 500,000 | 505,144 |
| San Diego Community College District Series B | | 2.88 | 8-1-2033 | | 1,935,000 | 2,063,814 |
| San Ramon Valley Unified School District | | 1.91 | 8-1-2030 | | 740,000 | 741,347 |
| Solano California Community College District Series B | | 1.76 | 8-1-2030 | | 950,000 | 944,687 |
| | | | | | | 7,722,045 |
| Tax revenue: 0.09% | | | | | | |
| San Jose CA RDA Senior Taxable Refunding Bonds Series A-T | | 3.38 | 8-1-2034 | | 455,000 | 487,729 |
| Florida: 0.25% | | | | | | |
| Water & sewer revenue: 0.25% | | | | | | |
| Florida Water Pollution Control Financing Corporation Series A | | 2.60 | 1-15-2030 | | 1,175,000 | 1,254,711 |
| Georgia: 0.11% | | | | | | |
| GO revenue: 0.11% | | | | | | |
| Cherokee County GA School System Build America Bonds | | 5.87 | 8-1-2028 | | 500,000 | 580,900 |
| Hawaii: 0.37% | | | | | | |
| GO revenue: 0.37% | | | | | | |
| Hawaii State Taxable Series FZ | | 1.60 | 8-1-2031 | | 770,000 | 748,790 |
| Hawaii State Taxable Series GD | | 2.52 | 10-1-2035 | | 1,110,000 | 1,137,457 |
| | | | | | | 1,886,247 |
| Idaho: 0.04% | | | | | | |
| Miscellaneous revenue: 0.04% | | | | | | |
| Idaho Building Authority State Office Campus Project Series B | | 3.28 | 9-1-2028 | | 170,000 | 185,507 |
| Illinois: 0.03% | | | | | | |
| GO revenue: 0.03% | | | | | | |
| Lake County IL Community Consolidated School District Series A | | 3.40 | 11-1-2027 | | 150,000 | 167,627 |
The accompanying notes are an integral part of these financial statements.
Allspring Managed Fixed Income Portfolio | 13
Portfolio of investments—November 30, 2021 (unaudited)
| | | Interest
rate | Maturity
date | Principal | Value |
| Indiana: 0.34% | | | | | | |
| Health revenue: 0.27% | | | | | | |
| Indiana Finance Authority Community Foundation | | 3.63% | 3-1-2039 | $ | 1,235,000 | $ 1,382,466 |
| Miscellaneous revenue: 0.07% | | | | | | |
| Indianapolis IN Local Public Improvement Bonds Series A-2 | | 6.00 | 1-15-2040 | | 235,000 | 335,826 |
| Massachusetts: 0.28% | | | | | | |
| GO revenue: 0.07% | | | | | | |
| Boston MA Qualified School Construction Bonds Series C | | 4.40 | 4-1-2026 | | 370,000 | 371,093 |
| Tax revenue: 0.21% | | | | | | |
| Massachusetts State Taxable Consolidated Loan Series E | | 5.46 | 12-1-2039 | | 750,000 | 1,033,190 |
| Michigan: 0.20% | | | | | | |
| Health revenue: 0.20% | | | | | | |
| Michigan Finance Authority Trinity Health Credit Group Series T | | 3.08 | 12-1-2034 | | 930,000 | 1,002,965 |
| Mississippi: 0.33% | | | | | | |
| Education revenue: 0.06% | | | | | | |
| Mississippi Higher Education Assistance Corporation Series 2014-1 Class A1 (1 Month LIBOR +0.68%) ± | | 0.77 | 10-25-2035 | | 284,120 | 284,800 |
| Miscellaneous revenue: 0.27% | | | | | | |
| Mississippi Series E %% | | 2.49 | 10-1-2035 | | 1,350,000 | 1,386,917 |
| New Jersey: 0.12% | | | | | | |
| Miscellaneous revenue: 0.12% | | | | | | |
| Hudson County NJ Improvement Authority Hudson County Lease Project | | 7.40 | 12-1-2025 | | 540,000 | 606,173 |
| New York: 0.30% | | | | | | |
| GO revenue: 0.10% | | | | | | |
| New York Refunding Bond Series B | | 2.65 | 2-15-2030 | | 500,000 | 527,416 |
| Miscellaneous revenue: 0.20% | | | | | | |
| New York Dormitory Authority Personal Income Taxable General Purpose Series C | | 1.54 | 3-15-2027 | | 660,000 | 659,498 |
| New York State Taxable Bonds Series 2010C | | 5.62 | 3-1-2040 | | 250,000 | 354,769 |
| | | | | | | 1,014,267 |
| North Carolina: 0.44% | | | | | | |
| Education revenue: 0.44% | | | | | | |
| North Carolina Education Assistance Authority Student Loan (3 Month LIBOR +0.90%) ± | | 1.02 | 7-25-2041 | | 1,300,518 | 1,301,790 |
| North Carolina Education Assistance Authority Student Loan Series A-3 (3 Month LIBOR +0.90%) ± | | 1.02 | 10-25-2041 | | 380,320 | 380,709 |
| University of North Carolina Chapel Hill Refunding Bonds Series C | | 3.33 | 12-1-2036 | | 500,000 | 575,282 |
| | | | | | | 2,257,781 |
| Ohio: 0.54% | | | | | | |
| Education revenue: 0.27% | | | | | | |
| Ohio State University Build America Bonds | | 4.91 | 6-1-2040 | | 1,000,000 | 1,397,525 |
The accompanying notes are an integral part of these financial statements.
14 | Allspring Managed Fixed Income Portfolio
Portfolio of investments—November 30, 2021 (unaudited)
| | | Interest
rate | Maturity
date | Principal | Value |
| Health revenue: 0.16% | | | | | | |
| Ohio Hospital Facility Refunding Bond Cleveland Clinic | | 3.28% | 1-1-2042 | $ | 725,000 | $ 797,858 |
| Miscellaneous revenue: 0.11% | | | | | | |
| Jobsohio Beverage System Ohio Statewide Senior Lien Liquor Profits Series A | | 2.83 | 1-1-2038 | | 515,000 | 545,810 |
| Oklahoma: 0.16% | | | | | | |
| Water & sewer revenue: 0.16% | | | | | | |
| Oklahoma Water Resources Board Refunding Bond Series 2019 | | 2.56 | 4-1-2031 | | 770,000 | 812,438 |
| Pennsylvania: 0.76% | | | | | | |
| Education revenue: 0.53% | | | | | | |
| Pennsylvania HEFAR Refunding Taxable Bonds Series B | | 2.94 | 8-15-2039 | | 1,000,000 | 1,082,985 |
| Pennsylvania Higher Education Authority Class A (1 Month LIBOR +1.15%) 144A± | | 1.24 | 9-25-2065 | | 786,445 | 800,144 |
| University of Pittsburgh Series A | | 3.65 | 9-15-2036 | | 715,000 | 837,303 |
| | | | | | | 2,720,432 |
| GO revenue: 0.23% | | | | | | |
| Northampton County PA Series C | | 2.54 | 10-1-2028 | | 1,100,000 | 1,160,148 |
| Rhode Island: 0.35% | | | | | | |
| Education revenue: 0.35% | | | | | | |
| Rhode Island Student Loan Authority Class A-1 (1 Month LIBOR +0.90%) ± | | 0.98 | 7-1-2031 | | 1,794,949 | 1,797,651 |
| South Carolina: 0.08% | | | | | | |
| GO revenue: 0.08% | | | | | | |
| Richland County SC School District #1 Refunding Bond Series 2020B | | 1.78 | 3-1-2028 | | 385,000 | 392,015 |
| Texas: 0.92% | | | | | | |
| Education revenue: 0.25% | | | | | | |
| University of Texas Build America Bonds Series A | | 5.26 | 7-1-2039 | | 550,000 | 786,587 |
| University of Texas Build America Bonds Series C | | 4.79 | 8-15-2046 | | 120,000 | 164,304 |
| University of Texas Build America Bonds Series D | | 5.13 | 8-15-2042 | | 215,000 | 298,349 |
| | | | | | | 1,249,240 |
| GO revenue: 0.47% | | | | | | |
| Hidalgo County TX Refunding Bonds Series 2018C | | 4.04 | 8-15-2030 | | 1,270,000 | 1,449,038 |
| Houston TX Pension Obligation Bonds Series 2017 | | 3.73 | 3-1-2030 | | 110,000 | 122,564 |
| Stafford TX Municipal School District Refunding Bond Series B | | 3.08 | 8-15-2041 | | 750,000 | 823,715 |
| | | | | | | 2,395,317 |
| Miscellaneous revenue: 0.14% | | | | | | |
| Texas Transportation Commission Series 2020 | | 1.53 | 10-1-2029 | | 710,000 | 703,220 |
| Tax revenue: 0.06% | | | | | | |
| Texas Transportation Commission Highway Fund Series B | | 5.18 | 4-1-2030 | | 250,000 | 305,176 |
The accompanying notes are an integral part of these financial statements.
Allspring Managed Fixed Income Portfolio | 15
Portfolio of investments—November 30, 2021 (unaudited)
| | | Interest
rate | Maturity
date | Principal | Value |
| Utah: 0.45% | | | | | | |
| Education revenue: 0.45% | | | | | | |
| State Board of Regents of Utah Series 1-A (1 Month LIBOR +0.75%) ± | | 0.84% | 9-25-2056 | $ | 2,291,541 | $ 2,290,040 |
| Vermont: 0.02% | | | | | | |
| Housing revenue: 0.02% | | | | | | |
| Vermont Housing Finance Agency | | 3.80 | 11-1-2037 | | 110,000 | 122,714 |
| Virginia: 0.19% | | | | | | |
| Education revenue: 0.17% | | | | | | |
| University of Virginia Build America Bonds | | 6.20 | 9-1-2039 | | 315,000 | 490,539 |
| University of Virginia Revenue Bond Series C | | 4.18 | 9-1-2117 | | 265,000 | 379,704 |
| | | | | | | 870,243 |
| Housing revenue: 0.02% | | | | | | |
| Virginia Housing Development Authority | | 3.10 | 6-25-2041 | | 92,221 | 94,210 |
| Washington: 0.49% | | | | | | |
| GO revenue: 0.49% | | | | | | |
| King County WA Build America Bonds Series B | | 6.05 | 12-1-2030 | | 350,000 | 451,441 |
| King County WA Public Hospital District | | 2.70 | 12-1-2035 | | 915,000 | 939,859 |
| Washington Series T | | 3.45 | 8-1-2029 | | 1,000,000 | 1,120,015 |
| | | | | | | 2,511,315 |
| West Virginia: 0.09% | | | | | | |
| Tax revenue: 0.09% | | | | | | |
| Ohio County WV Special District Excise Tax Series A | | 8.25 | 3-1-2035 | | 415,000 | 451,607 |
| Wisconsin: 0.29% | | | | | | |
| GO revenue: 0.15% | | | | | | |
| Wisconsin State Refunding Bond Series 1 | | 2.50 | 5-1-2032 | | 750,000 | 794,062 |
| Miscellaneous revenue: 0.14% | | | | | | |
| Wisconsin State Refunding Bond Taxable Series 4 | | 2.10 | 5-1-2035 | | 690,000 | 694,453 |
| Total Municipal obligations (Cost $43,470,316) | | | | | | 45,871,923 |
| Non-agency mortgage-backed securities: 6.14% | | | | | | |
| Commercial Mortgage Pass-Through Certificate Series 2012-CR2 Class A4 | | 3.15 | 8-15-2045 | | 550,000 | 553,411 |
| Commercial Mortgage Pass-Through Certificate Series 2012-UBS5 Class A3 | | 3.55 | 9-10-2047 | | 334,387 | 344,619 |
| Commercial Mortgage Pass-Through Certificate Series 2013-CR12 Class ASB | | 3.62 | 10-10-2046 | | 223,987 | 229,559 |
| Commercial Mortgage Pass-Through Certificate Series 2013-CR13 Class A4 ±± | | 4.19 | 11-10-2046 | | 600,000 | 632,254 |
| Commercial Mortgage Pass-Through Certificate Series 2014-CR17 Class A5 | | 3.98 | 5-10-2047 | | 1,795,000 | 1,903,260 |
| Commercial Mortgage Pass-Through Certificate Series 2014-CR21 Class A3 | | 3.53 | 12-10-2047 | | 2,649,561 | 2,764,907 |
| Commercial Mortgage Pass-Through Certificate Series 2014-UBS5 Class A4 | | 3.84 | 9-10-2047 | | 620,000 | 657,147 |
| Goldman Sachs Mortgage Securities Trust Series 2012-GCJ7 Class A4 | | 3.38 | 5-10-2045 | | 85,821 | 85,824 |
The accompanying notes are an integral part of these financial statements.
16 | Allspring Managed Fixed Income Portfolio
Portfolio of investments—November 30, 2021 (unaudited)
| | | Interest
rate | Maturity
date | Principal | Value |
| Non-agency mortgage-backed securities (continued) | | | | | | |
| Goldman Sachs Mortgage Securities Trust Series 2013-GC14 Class A5 | | 4.24% | 8-10-2046 | $ | 615,000 | $ 643,547 |
| Goldman Sachs Mortgage Securities Trust Series 2013-GC16 Class A4 | | 4.27 | 11-10-2046 | | 350,000 | 367,899 |
| Goldman Sachs Mortgage Securities Trust Series 2014-GC26 Class A5 | | 3.63 | 11-10-2047 | | 2,565,000 | 2,713,673 |
| JPMorgan Chase Commercial Mortgage Securities Trust Series 2014-C19 Class A4 | | 4.00 | 4-15-2047 | | 450,000 | 472,961 |
| JPMorgan Chase Commercial Mortgage Securities Trust Series 2014-C20 Class A5 | | 3.80 | 7-15-2047 | | 4,065,000 | 4,269,676 |
| JPMorgan Chase Commercial Mortgage Securities Trust Series 2014-GC26 Class A4 | | 3.49 | 1-15-2048 | | 1,338,000 | 1,412,153 |
| Morgan Stanley Bank of America Merrill Lynch Trust Series 2014-C15 Class ASB | | 3.65 | 4-15-2047 | | 234,057 | 240,808 |
| Morgan Stanley Bank of America Merrill Lynch Trust Series 2014-C19 Class A4 | | 3.53 | 12-15-2047 | | 1,790,000 | 1,886,262 |
| Small Business Investment Company Series 2021-10A Class 1 | | 1.67 | 3-10-2031 | | 586,643 | 592,218 |
| Small Business Investment Company Series 2021-10B Class 1 | | 1.30 | 9-10-2031 | | 1,665,000 | 1,662,638 |
| Towd Point Mortgage Trust Series 2016-2 Class A1A 144A±± | | 2.75 | 8-25-2055 | | 32,103 | 32,213 |
| Towd Point Mortgage Trust Series 2016-3 Class A1 144A±± | | 2.25 | 4-25-2056 | | 21,122 | 21,141 |
| Towd Point Mortgage Trust Series 2018-3 Class A1 144A±± | | 3.75 | 5-25-2058 | | 1,432,932 | 1,477,695 |
| Towd Point Mortgage Trust Series 2019-4 Class A1 144A±± | | 2.90 | 10-25-2059 | | 1,671,753 | 1,707,156 |
| WFRBS Commercial Mortgage Trust Series 2013-C17 Class A4 | | 4.02 | 12-15-2046 | | 4,370,000 | 4,569,667 |
| WFRBS Commercial Mortgage Trust Series 2014-C20 Class A5 | | 4.00 | 5-15-2047 | | 1,876,047 | 1,973,291 |
| Total Non-agency mortgage-backed securities (Cost $30,079,824) | | | | | | 31,213,979 |
| U.S. Treasury securities: 19.51% | | | | | | |
| U.S. Treasury Bond | | 1.13 | 5-15-2040 | | 930,000 | 824,866 |
| U.S. Treasury Bond | | 1.13 | 8-15-2040 | | 6,120,000 | 5,410,941 |
| U.S. Treasury Bond | | 1.25 | 5-15-2050 | | 2,255,000 | 1,972,156 |
| U.S. Treasury Bond | | 1.38 | 11-15-2040 | | 6,905,000 | 6,367,165 |
| U.S. Treasury Bond | | 1.38 | 8-15-2050 | | 3,718,000 | 3,355,350 |
| U.S. Treasury Bond | | 1.63 | 11-15-2050 | | 6,467,000 | 6,200,994 |
| U.S. Treasury Bond | | 1.88 | 2-15-2041 | | 6,005,000 | 6,024,469 |
| U.S. Treasury Bond | | 1.88 | 2-15-2051 | | 2,244,000 | 2,281,517 |
| U.S. Treasury Bond | | 2.38 | 11-15-2049 | | 10,063,000 | 11,363,328 |
| U.S. Treasury Bond | | 4.25 | 5-15-2039 | | 1,890,000 | 2,627,469 |
| U.S. Treasury Bond | | 4.50 | 5-15-2038 | | 1,540,000 | 2,187,101 |
| U.S. Treasury Note | | 0.13 | 12-31-2022 | | 6,475,000 | 6,463,618 |
| U.S. Treasury Note | | 0.13 | 1-31-2023 | | 4,800,000 | 4,789,125 |
| U.S. Treasury Note | | 0.13 | 5-31-2023 | | 5,000,000 | 4,978,125 |
| U.S. Treasury Note | | 0.13 | 7-31-2023 | | 5,000,000 | 4,972,070 |
| U.S. Treasury Note | | 0.25 | 11-15-2023 | | 4,575,000 | 4,548,193 |
| U.S. Treasury Note | | 0.25 | 3-15-2024 | | 4,825,000 | 4,780,708 |
| U.S. Treasury Note | | 0.63 | 10-15-2024 | | 7,525,000 | 7,487,375 |
| U.S. Treasury Note | | 1.13 | 10-31-2026 | | 2,550,000 | 2,546,414 |
The accompanying notes are an integral part of these financial statements.
Allspring Managed Fixed Income Portfolio | 17
Portfolio of investments—November 30, 2021 (unaudited)
| | | Interest
rate | Maturity
date | Principal | Value |
| U.S. Treasury securities (continued) | | | | | | |
| U.S. Treasury Note | | 1.25% | 5-31-2028 | $ | 3,750,000 | $ 3,731,982 |
| U.S. Treasury Note | | 2.00 | 8-15-2051 | | 495,000 | 518,358 |
| U.S. Treasury Note | | 2.25 | 5-15-2041 | | 3,219,000 | 3,426,223 |
| U.S. Treasury Note | | 2.38 | 5-15-2051 | | 2,070,000 | 2,347,833 |
| Total U.S. Treasury securities (Cost $99,913,796) | | | | | | 99,205,380 |
| Yankee corporate bonds and notes: 5.62% | | | | | | |
| Consumer staples: 0.12% | | | | | | |
| Food products: 0.12% | | | | | | |
| Mondelez International Holdings Company 144A | | 1.25 | 9-24-2026 | | 620,000 | 606,664 |
| Energy: 0.37% | | | | | | |
| Oil, gas & consumable fuels: 0.37% | | | | | | |
| BP Capital Markets plc | | 3.28 | 9-19-2027 | | 155,000 | 165,700 |
| Cenovus Energy Incorporated | | 4.25 | 4-15-2027 | | 550,000 | 599,345 |
| Petroleos Mexicanos | | 2.29 | 2-15-2024 | | 68,750 | 69,891 |
| Petroleos Mexicanos | | 2.83 | 2-15-2024 | | 143,750 | 147,066 |
| Petroleos Mexicanos | | 6.38 | 1-23-2045 | | 1,080,000 | 871,992 |
| | | | | | | 1,853,994 |
| Financials: 3.21% | | | | | | |
| Banks: 2.28% | | | | | | |
| Bank of Montreal | | 1.25 | 9-15-2026 | | 765,000 | 749,922 |
| Bank of Nova Scotia | | 1.30 | 9-15-2026 | | 1,040,000 | 1,020,580 |
| Bank of Nova Scotia | | 4.50 | 12-16-2025 | | 80,000 | 88,425 |
| BNP Paribas SA (3 Month LIBOR +1.11%) 144A± | | 2.82 | 11-19-2025 | | 820,000 | 846,251 |
| BNP Paribas SA 144A | | 4.40 | 8-14-2028 | | 520,000 | 588,436 |
| Cooperatieve Rabobank UA (1 Year Treasury Constant Maturity +1.00%) 144A± | | 1.34 | 6-24-2026 | | 530,000 | 525,178 |
| HSBC Holdings plc (U.S. SOFR +1.41%) ± | | 2.87 | 11-22-2032 | | 270,000 | 270,356 |
| HSBC Holdings plc (3 Month LIBOR +1.35%) ± | | 4.29 | 9-12-2026 | | 950,000 | 1,028,792 |
| HSBC Holdings plc (3 Month LIBOR +1.53%) ± | | 4.58 | 6-19-2029 | | 1,500,000 | 1,680,461 |
| Mitsubishi UFJ Financial Group (1 Year Treasury Constant Maturity +0.75%) ± | | 1.54 | 7-20-2027 | | 1,050,000 | 1,034,772 |
| Mitsubishi UFJ Financial Group (1 Year Treasury Constant Maturity +0.97%) ± | | 2.49 | 10-13-2032 | | 260,000 | 260,923 |
| Royal Bank of Canada | | 1.15 | 7-14-2026 | | 500,000 | 490,216 |
| Royal Bank of Canada | | 1.40 | 11-2-2026 | | 830,000 | 817,821 |
| Sumitomo Mitsui Financial Group Incorporated | | 1.47 | 7-8-2025 | | 430,000 | 429,087 |
| Sumitomo Mitsui Financial Group Incorporated | | 1.90 | 9-17-2028 | | 660,000 | 645,555 |
| Toronto Dominion Bank | | 1.25 | 9-10-2026 | | 1,130,000 | 1,110,073 |
| | | | | | | 11,586,848 |
| Capital markets: 0.48% | | | | | | |
| Credit Suisse Group AG (3 Month LIBOR +1.41%) 144A± | | 3.87 | 1-12-2029 | | 1,500,000 | 1,606,590 |
| NXP BV 144A | | 2.65 | 2-15-2032 | | 870,000 | 873,754 |
| | | | | | | 2,480,344 |
The accompanying notes are an integral part of these financial statements.
18 | Allspring Managed Fixed Income Portfolio
Portfolio of investments—November 30, 2021 (unaudited)
| | | Interest
rate | Maturity
date | Principal | Value |
| Consumer finance: 0.45% | | | | | | |
| NTT Finance Corporation 144A | | 1.16% | 4-3-2026 | $ | 630,000 | $ 618,793 |
| UBS Group Funding Switzerland 144A | | 4.25 | 3-23-2028 | | 1,500,000 | 1,659,280 |
| | | | | | | 2,278,073 |
| Health care: 0.07% | | | | | | |
| Pharmaceuticals: 0.07% | | | | | | |
| Teva Pharmaceutical Finance BV | | 3.15 | 10-1-2026 | | 350,000 | 327,688 |
| Industrials: 0.84% | | | | | | |
| Aerospace & defense: 0.24% | | | | | | |
| Embraer Netherlands Finance BV | | 5.05 | 6-15-2025 | | 1,200,000 | 1,230,000 |
| Electrical equipment: 0.24% | | | | | | |
| Sensata Technologies BV 144A | | 4.00 | 4-15-2029 | | 935,000 | 948,090 |
| Sensata Technologies BV 144A | | 5.63 | 11-1-2024 | | 265,000 | 288,850 |
| | | | | | | 1,236,940 |
| Machinery: 0.25% | | | | | | |
| CNH Industrial NV | | 4.50 | 8-15-2023 | | 600,000 | 633,116 |
| Siemens Finance 144A | | 1.70 | 3-11-2028 | | 660,000 | 650,682 |
| | | | | | | 1,283,798 |
| Road & rail: 0.11% | | | | | | |
| Canadian Pacific Railway Company %% | | 2.45 | 12-2-2031 | | 520,000 | 526,345 |
| Information technology: 0.42% | | | | | | |
| Software: 0.21% | | | | | | |
| Experian Finance plc 144A | | 4.25 | 2-1-2029 | | 510,000 | 571,574 |
| OpenText Corporation 144A | | 3.88 | 2-15-2028 | | 520,000 | 514,800 |
| | | | | | | 1,086,374 |
| Technology hardware, storage & peripherals: 0.21% | | | | | | |
| Seagate HDD 144A | | 3.13 | 7-15-2029 | | 375,000 | 357,000 |
| TSMC Global Limited 144A | | 1.25 | 4-23-2026 | | 700,000 | 688,919 |
| | | | | | | 1,045,919 |
| Materials: 0.59% | | | | | | |
| Chemicals: 0.04% | | | | | | |
| Nutrien Limited | | 2.95 | 5-13-2030 | | 180,000 | 188,822 |
| Metals & mining: 0.55% | | | | | | |
| Anglo American Capital plc 144A | | 4.75 | 4-10-2027 | | 1,000,000 | 1,113,657 |
| Vale Overseas Limited | | 6.25 | 8-10-2026 | | 1,500,000 | 1,707,300 |
| | | | | | | 2,820,957 |
| Total Yankee corporate bonds and notes (Cost $27,626,159) | | | | | | 28,552,766 |
The accompanying notes are an integral part of these financial statements.
Allspring Managed Fixed Income Portfolio | 19
Portfolio of investments—November 30, 2021 (unaudited)
| | | Yield | | Shares | Value |
| Short-term investments: 3.86% | | | | | | |
| Investment companies: 3.86% | | | | | | |
| Allspring Government Money Market Fund Select Class ♠∞## | | 0.03% | | | 19,639,478 | $ 19,639,478 |
| Securities Lending Cash Investments LLC ♠∩∞ | | 0.04 | | | 6,313 | 6,313 |
| Total Short-term investments (Cost $19,645,791) | | | | | | 19,645,791 |
| Total investments in securities (Cost $496,979,829) | 101.81% | | | | | 517,760,754 |
| Other assets and liabilities, net | (1.81) | | | | | (9,200,893) |
| Total net assets | 100.00% | | | | | $508,559,861 |
| ±± | The coupon of the security is adjusted based on the principal and/or interest payments received from the underlying pool of mortgages as well as the credit quality and the actual prepayment speed of the underlying mortgages. The rate shown is the rate in effect at period end. |
| øø | The interest rate is determined and reset by the issuer periodically depending upon the terms of the security. The rate shown is the rate in effect at period end. |
| 144A | The security may be resold in transactions exempt from registration, normally to qualified institutional buyers, pursuant to Rule 144A under the Securities Act of 1933. |
| ± | Variable rate investment. The rate shown is the rate in effect at period end. |
| ## | All or a portion of this security is segregated for when-issued securities. |
| « | All or a portion of this security is on loan. |
| ♠ | The issuer of the security is an affiliated person of the Portfolio as defined in the Investment Company Act of 1940. |
| ∩ | The investment is a non-registered investment company purchased with cash collateral received from securities on loan. |
| ∞ | The rate represents the 7-day annualized yield at period end. |
| %% | The security is purchased on a when-issued basis. |
| Abbreviations: |
| FHLMC | Federal Home Loan Mortgage Corporation |
| FNMA | Federal National Mortgage Association |
| GNMA | Government National Mortgage Association |
| GO | General obligation |
| HEFAR | Higher Education Facilities Authority Revenue |
| LIBOR | London Interbank Offered Rate |
| RDA | Redevelopment Authority |
| REIT | Real estate investment trust |
| SBA | Small Business Authority |
| SOFR | Secured Overnight Financing Rate |
Investments in affiliates
An affiliated investment is an investment in which the Portfolio owns at least 5% of the outstanding voting shares of the issuer or as a result of other relationships, such as the Portfolio and the issuer having the same adviser or investment manager. Transactions with issuers that were either affiliates of the Portfolio at the beginning of the period or the end of the period were as follows:
| | Value,
beginning of
period | Purchases | Sales
proceeds | Net
realized
gains
(losses) | | Net
change in
unrealized
gains
(losses) | | Value,
end of
period | Shares,
end
of period | Income
from
affiliated
securities |
| Short-term investments | | | | | | | | | |
| Allspring Government Money Market Fund Select Class | $23,036,815 | $74,317,263 | $(77,714,600) | $0 | | $0 | | $ 19,639,478 | 19,639,478 | $ 2,846 |
| Securities Lending Cash Investments LLC | 127,000 | 3,138 | (123,825) | 0 | | 0 | | 6,313 | 6,313 | 4 # |
| | | | | $0 | | $0 | | $19,645,791 | | $2,850 |
| # | Amount shown represents income before fees and rebates. |
The accompanying notes are an integral part of these financial statements.
20 | Allspring Managed Fixed Income Portfolio
Statement of assets and liabilities—November 30, 2021 (unaudited)
| | |
| Assets | |
Investments in unaffiliated securities (including $6,186 of securities loaned), at value (cost $477,334,038)
| $ 498,114,963 |
Investments in affiliated securities, at value (cost $19,645,791)
| 19,645,791 |
Cash
| 3,977,878 |
Receivable for investments sold
| 8,666,464 |
Receivable for interest
| 2,910,447 |
Receivable for securities lending income, net
| 12 |
Prepaid expenses and other assets
| 34,844 |
Total assets
| 533,350,399 |
| Liabilities | |
Payable for when-issued transactions
| 24,639,565 |
Advisory fee payable
| 144,660 |
Payable upon receipt of securities loaned
| 6,313 |
Total liabilities
| 24,790,538 |
Total net assets
| $508,559,861 |
The accompanying notes are an integral part of these financial statements.
Allspring Managed Fixed Income Portfolio | 21
Statement of operations—six months ended November 30, 2021 (unaudited)
| | |
| Investment income | |
Interest
| $ 7,154,746 |
Income from affiliated securities
| 3,289 |
Total investment income
| 7,158,035 |
| Expenses | |
Advisory fee
| 1,016,148 |
Custody and accounting fees
| 21,146 |
Professional fees
| 36,552 |
Interest holder report expenses
| 19,274 |
Trustees’ fees and expenses
| 9,662 |
Other fees and expenses
| 18,459 |
Total expenses
| 1,121,241 |
Less: Fee waivers and/or expense reimbursements
| (132,639) |
Net expenses
| 988,602 |
Net investment income
| 6,169,433 |
| Realized and unrealized gains (losses) on investments | |
Net realized gains on investments
| 1,543,621 |
Net change in unrealized gains (losses) on investments
| (778,025) |
Net realized and unrealized gains (losses) on investments
| 765,596 |
Net increase in net assets resulting from operations
| $6,935,029 |
The accompanying notes are an integral part of these financial statements.
22 | Allspring Managed Fixed Income Portfolio
Statement of changes in net assets
| | | |
| | Six months ended
November 30, 2021
(unaudited) | Year ended
May 31, 2021 |
| Operations | | |
Net investment income
| $ 6,169,433 | $ 11,781,229 |
Net realized gains on investments
| 1,543,621 | 3,530,420 |
Net change in unrealized gains (losses) on investments
| (778,025) | (3,700,898) |
Net increase in net assets resulting from operations
| 6,935,029 | 11,610,751 |
| Capital transactions | | |
| Transactions in investors’ beneficial interests | | |
Contributions
| 31,192,718 | 59,804,501 |
Withdrawals
| (25,743,207) | (37,488,593) |
Net increase in net assets resulting from capital transactions
| 5,449,511 | 22,315,908 |
Total increase in net assets
| 12,384,540 | 33,926,659 |
| Net assets | | |
Beginning of period
| 496,175,321 | 462,248,662 |
End of period
| $508,559,861 | $496,175,321 |
The accompanying notes are an integral part of these financial statements.
Allspring Managed Fixed Income Portfolio | 23
| | | Year ended May 31 |
| | Six months ended
November 30, 2021
(unaudited) | 2021 | 2020 | 2019 | 2018 | 2017 |
Total return1
| 1.30% | 2.52% | 7.51% | 7.22% | 0.05% | 3.13% |
| Ratios to average net assets (annualized) | | | | | | |
Gross expenses
| 0.44% | 0.44% | 0.42% | 0.41% | 0.49% | 0.48% |
Net expenses2
| 0.39% | 0.39% | 0.39% | 0.39% | 0.39% | 0.39% |
Net investment income
| 2.43% | 2.49% | 3.10% | 3.24% | 3.09% | 2.99% |
| Supplemental data | | | | | | |
Portfolio turnover rate
| 31% | 31% | 40% | 232% | 23% | 47% |
| 1 | Returns for periods of less than one year are not annualized. |
| 2 | Net expense ratios reflect voluntary waivers. |
The accompanying notes are an integral part of these financial statements.
24 | Allspring Managed Fixed Income Portfolio
Notes to financial statements (unaudited)
1. ORGANIZATION
Allspring Master Trust (the "Trust"), a Delaware statutory trust organized on March 10, 1999, is an open-end management investment company registered under the Investment Company Act of 1940, as amended (the "1940 Act"). As an investment company, the Trust follows the accounting and reporting guidance in Financial Accounting Standards Board ("FASB") Accounting Standards Codification Topic 946, Financial Services – Investment Companies. These financial statements report on the Allspring Managed Fixed Income Portfolio (the "Portfolio") which is a diversified series of the Trust.
Interests in the Portfolio are available solely through private placement transactions that do not involve any "public offering" within the meaning of Section 4(a)(2) of the Securities Act of 1933.
On February 23, 2021, Wells Fargo & Company entered into a definitive agreement to sell Wells Fargo Asset Management ("WFAM") to GTCR LLC and Reverence Capital Partners, L.P. WFAM was the trade name used by the asset management businesses of Wells Fargo & Company and included Wells Fargo Funds Management, LLC, Wells Capital Management, LLC, Wells Fargo Asset Management (International) Limited and Wells Fargo Funds Distributor, LLC. Effective on November 1, 2021, the sale transaction of WFAM by Wells Fargo & Company to GTCR LLC and Reverence Capital Partners, L.P. was closed. In connection with the closing of the transaction, WFAM became known as Allspring Global Investments (“Allspring”) and various entities that provide services to the Portfolio changed their names to "Allspring", including Allspring Funds Management, LLC (formerly Wells Fargo Funds Management, LLC), the adviser to the Portfolio, Allspring Global Investments, Inc. (formerly Wells Capital Management, LLC) and Allspring Global Investments (UK) Limited (formerly Wells Fargo Asset Management (International) Limited), both registered investment advisers providing subadvisory services to certain funds, and Allspring Funds Distributor, LLC (formerly Wells Fargo Funds Distributor, LLC).
Consummation of the transaction resulted in the automatic termination of the Portfolio’s advisory agreement and subadvisory agreement. The Portfolio’s Board of Trustees approved a new advisory agreement and subadvisory agreement which were approved by the Portfolio's interest holders on August 16, 2021. The new agreements became effective on November 1, 2021.
Effective December 6, 2021, "Wells Fargo" was removed from the Portfolio's name and replaced it with "Allspring".
2. SIGNIFICANT ACCOUNTING POLICIES
The following significant accounting policies, which are consistently followed in the preparation of the financial statements of the Portfolio, are in conformity with U.S. generally accepted accounting principles which require management to make estimates and assumptions that affect the reported amounts of assets and liabilities, disclosure of contingent assets and liabilities at the date of the financial statements, and the reported amounts of income and expenses during the reporting period. Actual results could differ from those estimates.
Securities valuation
All investments are valued each business day as of the close of regular trading on the New York Stock Exchange (generally 4 p.m. Eastern Time), although the Portfolio may deviate from this calculation time under unusual or unexpected circumstances.
Debt securities are valued at the evaluated bid price provided by an independent pricing service (e.g. taking into account various factors, including yields, maturities, or credit ratings) or, if a reliable price is not available, the quoted bid price from an independent broker-dealer.
Investments in registered open-end investment companies are valued at net asset value. Interests in non-registered investment companies that are redeemable at net asset value are fair valued normally at net asset value.
Investments which are not valued using any of the methods discussed above are valued at their fair value, as determined in good faith by the Board of Trustees. The Board of Trustees has established a Valuation Committee comprised of the Trustees and has delegated to it the authority to take any actions regarding the valuation of portfolio securities that the Valuation Committee deems necessary or appropriate, including determining the fair value of portfolio securities, unless the determination has been delegated to the Allspring Global Investments Pricing Committee at Allspring Funds Management, LLC ("Allspring Funds Management"). The Board of Trustees retains the authority to make or ratify any valuation decisions or approve any changes to the Valuation Procedures as it deems appropriate. On a quarterly basis, the Board of Trustees receives reports on any valuation actions taken by the Valuation Committee or the Allspring Global Investments Pricing Committee which may include items for ratification.
Securities lending
The Portfolio may lend its securities from time to time in order to earn additional income in the form of fees or interest on securities received as collateral or the investment of any cash received as collateral. When securities are on loan, the Portfolio
Allspring Managed Fixed Income Portfolio | 25
Notes to financial statements (unaudited)
receives interest or dividends on those securities. Cash collateral received in connection with its securities lending transactions is invested in Securities Lending Cash Investments, LLC (the "Securities Lending Fund"), an affiliated non-registered investment company. Investments in Securities Lending Fund are valued at the evaluated bid price provided by an independent pricing service. Income earned from investment in the Securities Lending Fund (net of fees and rebates), if any, is included in income from affiliated securities on the Statement of Operations.
In a securities lending transaction, the net asset value of the Portfolio is affected by an increase or decrease in the value of the securities loaned and by an increase or decrease in the value of the instrument in which collateral is invested. The amount of securities lending activity undertaken by the Portfolio fluctuates from time to time. The Portfolio has the right under the lending agreement to recover the securities from the borrower on demand. In the event of default or bankruptcy by the borrower, the Portfolio may be prevented from recovering the loaned securities or gaining access to the collateral or may experience delays or costs in doing so. In such an event, the terms of the agreement allow the unaffiliated securities lending agent to use the collateral to purchase replacement securities on behalf of the Portfolio or pay the Portfolio the market value of the loaned securities. The Portfolio bears the risk of loss with respect to depreciation of its investment of the cash collateral.
When-issued transactions
The Portfolio may purchase securities on a forward commitment or when-issued basis. The Portfolio records a when-issued transaction on the trade date and will segregate assets in an amount at least equal in value to the Portfolio's commitment to purchase when-issued securities. Securities purchased on a when-issued basis are marked-to-market daily and the Portfolio begins earning interest on the settlement date. Losses may arise due to changes in the market value of the underlying securities or if the counterparty does not perform under the contract.
Security transactions and income recognition
Securities transactions are recorded on a trade date basis. Realized gains or losses are recorded on the basis of identified cost.
Interest income is accrued daily and bond discounts are accreted and premiums are amortized daily. To the extent debt obligations are placed on non-accrual status, any related interest income may be reduced by writing off interest receivables when the collection of all or a portion of interest has been determined to be doubtful based on consistently applied procedures and the fair value has decreased. If the issuer subsequently resumes interest payments or when the collectability of interest is reasonably assured, the debt obligation is removed from non-accrual status. Paydown gains and losses are included in interest income.
Federal and other taxes
The Portfolio is not required to pay federal income taxes on its net investment income and net capital gains as it is treated as a partnership for federal income tax purposes. All income, gains and losses of the Portfolio are deemed to have been “passed through” to the interest holders in proportion to their holdings of the Portfolio regardless of whether income and gains have been distributed by the Portfolio.
The Portfolio’s income tax returns and all financial records supporting those returns for the prior three fiscal years are subject to examination by the federal revenue authority. Management has analyzed the Portfolio’s tax positions taken on federal, state, and foreign tax returns for all open tax years and does not believe that there are any uncertain tax positions that require recognition of a tax liability.
As of November 30, 2021, the aggregate cost of all investments for federal income tax purposes was $496,832,480 and the unrealized gains (losses) consisted of:
| Gross unrealized gains | $24,735,884 |
| Gross unrealized losses | (3,807,610) |
| Net unrealized gains | $20,928,274 |
26 | Allspring Managed Fixed Income Portfolio
Notes to financial statements (unaudited)
3. FAIR VALUATION MEASUREMENTS
Fair value measurements of investments are determined within a framework that has established a fair value hierarchy based upon the various data inputs utilized in determining the value of the Portfolio’s investments. The three-level hierarchy gives the highest priority to unadjusted quoted prices in active markets for identical assets or liabilities (Level 1) and the lowest priority to unobservable inputs (Level 3). The Portfolio’s investments are classified within the fair value hierarchy based on the lowest level of input that is significant to the fair value measurement. The inputs are summarized into three broad levels as follows:
| ■ | Level 1 – quoted prices in active markets for identical securities |
| ■ | Level 2 – other significant observable inputs (including quoted prices for similar securities, interest rates, prepayment speeds, credit risk, etc.) |
| ■ | Level 3 – significant unobservable inputs (including the Portfolio’s own assumptions in determining the fair value of investments) |
The inputs or methodologies used for valuing investments in securities are not necessarily an indication of the risk associated with investing in those securities.
The following is a summary of the inputs used in valuing the Portfolio’s assets and liabilities as of November 30, 2021:
| | Quoted prices
(Level 1) | Other significant
observable inputs
(Level 2) | Significant
unobservable inputs
(Level 3) | Total |
| Assets | | | | |
| Investments in: | | | | |
| Agency securities | $ 0 | $ 106,858,186 | $0 | $ 106,858,186 |
| Asset-backed securities | 0 | 9,375,580 | 0 | 9,375,580 |
| Corporate bonds and notes | 0 | 177,037,149 | 0 | 177,037,149 |
| Municipal obligations | 0 | 45,871,923 | 0 | 45,871,923 |
| Non-agency mortgage-backed securities | 0 | 31,213,979 | 0 | 31,213,979 |
| U.S. Treasury securities | 99,205,380 | 0 | 0 | 99,205,380 |
| Yankee corporate bonds and notes | 0 | 28,552,766 | 0 | 28,552,766 |
| Short-term investments | | | | |
| Investment companies | 19,645,791 | 0 | 0 | 19,645,791 |
| Total assets | $118,851,171 | $398,909,583 | $0 | $517,760,754 |
Additional sector, industry or geographic detail, if any, is included in the Portfolio of Investments.
For the six months ended November 30, 2021, the Portfolio did not have any transfers into/out of Level 3.
4. TRANSACTIONS WITH AFFILIATES
Advisory fee
The Trust has entered into an advisory contract with Allspring Funds Management, a wholly owned subsidiary of Allspring Global Investments Holdings, LLC, a holding company indirectly owned by certain private funds of GTCR LLC and Reverence Capital Partners, L.P. The adviser is responsible for implementing investment policies and guidelines and for supervising the subadviser, who is responsible for day-to-day portfolio management of the Portfolio. Pursuant to the contract, Allspring Funds Management is entitled to receive an advisory fee at the following annual rate based on the Portfolio’s average daily net assets:
Allspring Managed Fixed Income Portfolio | 27
Notes to financial statements (unaudited)
| Average daily net assets | Advisory fee |
| First $500 million | 0.400% |
| Next $500 million | 0.375 |
| Next $2 billion | 0.350 |
| Next $2 billion | 0.325 |
| Next $5 billion | 0.300 |
| Over $10 billion | 0.290 |
For the six months ended November 30, 2021, the advisory fee was equivalent to an annual rate of 0.40% of the Portfolio’s average daily net assets.
Allspring Funds Management has retained the services of a subadviser to provide daily portfolio management to the Portfolio. The fee for subadvisory services is borne by Allspring Funds Management. Galliard Capital Management, Inc., an affiliate of Allspring Funds Management and a wholly owned subsidiary of Allspring Global Investments Holdings, LLC, is the subadviser to the Portfolio and is entitled to receive a fee from Allspring Funds Management at an annual rate starting at 0.20% and declining to 0.10% as the average daily net assets of the Portfolio increase.
Allspring Funds Management has voluntarily waived and/or reimbursed advisory fees to reduce the net operating expense ratio of the Portfolio. These voluntary waivers may be discontinued at any time.
Interfund transactions
The Portfolio may purchase or sell portfolio investment securities to certain affiliates pursuant to Rule 17a-7 under the 1940 Act and under procedures adopted by the Board of Trustees. The procedures have been designed to ensure that these interfund transactions, which do not incur broker commissions, are effected at current market prices.
5. INVESTMENT PORTFOLIO TRANSACTIONS
Purchases and sales of investments, excluding short-term securities, for the six months ended November 30, 2021 were as follows:
| Purchases at cost | | Sales proceeds |
U.S.
government | Non-U.S.
government | | U.S.
government | Non-U.S.
government |
| $136,938,322 | $54,296,622 | | $132,817,798 | $19,964,549 |
6. SECURITIES LENDING TRANSACTIONS
The Portfolio lends its securities through an unaffiliated securities lending agent and receives collateral in the form of cash or securities with a value at least equal to the value of the securities on loan. The value of the loaned securities is determined at the close of each business day and any increases or decreases in the required collateral are exchanged between the Portfolio and the counterparty on the next business day. Cash collateral received is invested in the Securities Lending Fund which seeks to provide a positive return compared to the daily Federal Funds Open Rate by investing in high-quality, U.S. dollar-denominated short-term money market instruments and is exempt from registration under Section 3(c)(7) of the 1940 Act. Securities Lending Fund is managed by Allspring Funds Management and is subadvised by Allspring Global Investments, LLC ("Allspring Investments"), an affiliate of Allspring Funds Management and a wholly owned subsidiary of Allspring Global Investments Holdings, LLC. Allspring Funds Management receives an advisory fee starting at 0.05% and declining to 0.01% as the average daily net assets of the Securities Lending Fund increase. All of the fees received by Allspring Funds Management are paid to Allspring Investments for its services as subadviser.
In the event of counterparty default or the failure of a borrower to return a loaned security, the Portfolio has the right to use the collateral to offset any losses incurred. As of November 30, 2021, the Portfolio had securities lending transactions with the following counterparties which are subject to offset:
28 | Allspring Managed Fixed Income Portfolio
Notes to financial statements (unaudited)
| Counterparty | Value of
securities on
loan | Collateral
received1 | Net amount |
| Morgan Stanley & Company LLC | $6,186 | $(6,186) | $0 |
1 Collateral received within this table is limited to the collateral for the net transaction with the counterparty.
7. BANK BORROWINGS
The Trust, along with Allspring Variable Trust and Allspring Funds Trust (excluding the money market funds), are parties to a $350,000,000 revolving credit agreement whereby the Portfolio is permitted to use bank borrowings for temporary or emergency purposes, such as to fund interest holders withdrawal requests. Interest under the credit agreement is charged to the Portfolio based on a borrowing rate equal to the higher of the Federal Funds rate in effect on that day plus 1.25% or the overnight bank funding rate in effect on that day plus 1.25%. In addition, an annual commitment fee equal to 0.25% of the unused balance is allocated to each participating fund.
For the six months ended November 30, 2021, there were no borrowings by the Portfolio under the agreement.
8. INDEMNIFICATION
Under the Portfolio's organizational documents, the officers and Trustees have been granted certain indemnification rights against certain liabilities that may arise out of performance of their duties to the Portfolio. The Portfolio has entered into a separate agreement with each Trustee that converts indemnification rights currently existing under the Portfolio’s organizational documents into contractual rights that cannot be changed in the future without the consent of the Trustee. Additionally, in the normal course of business, the Portfolio may enter into contracts with service providers that contain a variety of indemnification clauses. The Portfolio’s maximum exposure under these arrangements is dependent on future claims that may be made against the Portfolio and, therefore, cannot be estimated.
9. CORONAVIRUS (COVID-19) PANDEMIC
On March 11, 2020, the World Health Organization announced that it had made the assessment that coronavirus disease 2019 (“COVID-19”) is a pandemic. The impacts of COVID-19 are affecting the entire global economy, individual companies and investment products, the funds, and the market in general. There is significant uncertainty around the extent and duration of business disruptions related to COVID-19 and the impacts may last for an extended period of time. COVID-19 has led to significant uncertainty and volatility in the financial markets.
Allspring Managed Fixed Income Portfolio | 29
Other information (unaudited)
PROXY VOTING INFORMATION
A description of the policies and procedures used to determine how to vote proxies relating to portfolio securities is available without charge, upon request, by calling 1-800-222-8222, visiting our website at allspringglobal.com, or visiting the SEC website at sec.gov. Information regarding how the proxies related to portfolio securities were voted during the most recent 12-month period ended June 30 is available on the website at allspringglobal.com or by visiting the SEC website at sec.gov.
QUARTERLY PORTFOLIO HOLDINGS INFORMATION
The Portfolio files its complete schedule of portfolio holdings with the SEC for the first and third quarters of each fiscal year as an exhibit to its reports on Form N-PORT. Interest holders may view the filed Form N-PORT by visiting the SEC website at sec.gov.
30 | Allspring Managed Fixed Income Portfolio
Other information (unaudited)
BOARD OF TRUSTEES AND OFFICERS
Each of the Trustees and Officers listed in the table below acts in identical capacities for each fund in the Allspring family of funds, which consists of 139 mutual funds comprising the Allspring Funds Trust, Allspring Variable Trust, Allspring Master Trust and four closed-end funds (collectively the “Fund Complex”). This table should be read in conjunction with the Prospectus and the Statement of Additional Information. The mailing address of each Trustee and Officer is 525 Market Street, 12th Floor, San Francisco, CA 94105. Each Trustee and Officer serves an indefinite term, however, each Trustee serves such term until reaching the mandatory retirement age established by the Trustees.
Independent Trustees
Name and
year of birth | Position held and
length of service* | Principal occupations during past five years or longer | Current other
public company or
investment
company
directorships |
William R. Ebsworth
(Born 1957) | Trustee,
since 2015 | Retired. From 1984 to 2013, equities analyst, portfolio manager, research director and chief investment officer at Fidelity Management and Research Company in Boston, Tokyo, and Hong Kong, and retired in 2013 as Chief Investment Officer of Fidelity Strategic Advisers, Inc. where he led a team of investment professionals managing client assets. Prior thereto, Board member of Hong Kong Securities Clearing Co., Hong Kong Options Clearing Corp., the Thailand International Fund, Ltd., Fidelity Investments Life Insurance Company, and Empire Fidelity Investments Life Insurance Company. Audit Committee Chair and Investment Committee Chair of the Vincent Memorial Hospital Endowment (non-profit organization). Mr. Ebsworth is a CFA® charterholder. | N/A |
Jane A. Freeman
(Born 1953) | Trustee,
since 2015;
Chair Liaison,
since 2018 | Retired. From 2012 to 2014 and 1999 to 2008, Chief Financial Officer of Scientific Learning Corporation. From 2008 to 2012, Ms. Freeman provided consulting services related to strategic business projects. Prior to 1999, Portfolio Manager at Rockefeller & Co. and Scudder, Stevens & Clark. Board member of the Harding Loevner Funds from 1996 to 2014, serving as both Lead Independent Director and chair of the Audit Committee. Board member of the Russell Exchange Traded Funds Trust from 2011 to 2012 and the chair of the Audit Committee. Ms. Freeman is also an inactive Chartered Financial Analyst. | N/A |
Isaiah Harris, Jr.
(Born 1952) | Trustee,
since 2009; Audit
Committee
Chair,
since 2019 | Retired. Chairman of the Board of CIGNA Corporation from 2009 to 2021, and Director from 2005 to 2008. From 2003 to 2011, Director of Deluxe Corporation. Prior thereto, President and CEO of BellSouth Advertising and Publishing Corp. from 2005 to 2007, President and CEO of BellSouth Enterprises from 2004 to 2005 and President of BellSouth Consumer Services from 2000 to 2003. Emeritus member of the Iowa State University Foundation Board of Governors. Emeritus Member of the Advisory Board of Iowa State University School of Business. Advisory Board Member, Palm Harbor Academy (private school). Advisory Board Member, Fellowship of Christian Athletes. Mr. Harris is a certified public accountant (inactive status). | N/A |
Judith M. Johnson**
(Born 1949) | Trustee,
since 2008 | Retired. Prior thereto, Chief Executive Officer and Chief Investment Officer of Minneapolis Employees Retirement Fund from 1996 to 2008. Ms. Johnson is an attorney, certified public accountant and a certified managerial accountant. | N/A |
David F. Larcker
(Born 1950) | Trustee,
since 2009 | James Irvin Miller Professor of Accounting at the Graduate School of Business (Emeritus), Stanford University, Director of the Corporate Governance Research Initiative and Senior Faculty of The Rock Center for Corporate Governance since 2006. From 2005 to 2008, Professor of Accounting at the Graduate School of Business, Stanford University. Prior thereto, Ernst & Young Professor of Accounting at The Wharton School, University of Pennsylvania from 1985 to 2005. | N/A |
Allspring Managed Fixed Income Portfolio | 31
Other information (unaudited)
Name and
year of birth | Position held and
length of service* | Principal occupations during past five years or longer | Current other
public company or
investment
company
directorships |
Olivia S. Mitchell
(Born 1953) | Trustee,
since 2006;
Nominating and
Governance
Committee Chair,
since 2018 | International Foundation of Employee Benefit Plans Professor since 1993, Wharton School of the University of Pennsylvania. Director of Wharton’s Pension Research Council and Boettner Center on Pensions & Retirement Research, and Research Associate at the National Bureau of Economic Research. Previously taught at Cornell University from 1978 to 1993. | N/A |
Timothy J. Penny
(Born 1951) | Trustee,
since 1996;
Chair,
since 2018 | President and Chief Executive Officer of Southern Minnesota Initiative Foundation, a non-profit organization, since 2007. Member of the Board of Trustees of NorthStar Education Finance, Inc., a non-profit organization, since 2007. | N/A |
James G. Polisson
(Born 1959) | Trustee,
since 2018 | Retired. Chief Marketing Officer, Source (ETF) UK Services, Ltd, from 2015 to 2017. From 2012 to 2015, Principal of The Polisson Group, LLC, a management consulting, corporate advisory and principal investing company. Chief Executive Officer and Managing Director at Russell Investments, Global Exchange Traded Funds from 2010 to 2012. Managing Director of Barclays Global Investors from 1998 to 2010 and Global Chief Marketing Officer for iShares and Barclays Global Investors from 2000 to 2010. Trustee of the San Francisco Mechanics’ Institute, a non-profit organization, from 2013 to 2015. Board member of the Russell Exchange Traded Fund Trust from 2011 to 2012. Director of Barclays Global Investors Holdings Deutschland GmbH from 2006 to 2009. Mr. Polisson is an attorney and has a retired status with the Massachusetts and District of Columbia Bar Associations. | N/A |
Pamela Wheelock
(Born 1959) | Trustee,
since January
2020; previously
Trustee from
January 2018 to
July 2019 | Board member of the Destination Medical Center Economic Development Agency, Rochester, Minnesota since 2019. Interim President of the McKnight Foundation from January to September 2020. McKnight Foundation Consultant, November 2020 to February 2021. Acting Commissioner, Minnesota Department of Human Services, July 2019 through September 2019. Consultant (part-time), Minnesota Department of Human Services, October 2019 through December 2019. Chief Operating Officer, Twin Cities Habitat for Humanity from 2017 to 2019. Vice President of University Services, University of Minnesota from 2012 to 2016. Prior thereto, on the Board of Directors, Governance Committee and Finance Committee for the Minnesota Philanthropy Partners (Saint Paul Foundation) from 2012 to 2018, Interim Chief Executive Officer of Blue Cross Blue Shield of Minnesota from 2011 to 2012, Chairman of the Board from 2009 to 2012 and Board Director from 2003 to 2015. Vice President, Leadership and Community Engagement, Bush Foundation, Saint Paul, Minnesota (a private foundation) from 2009 to 2011. Executive Vice President and Chief Financial Officer, Minnesota Sports and Entertainment from 2004 to 2009 and Senior Vice President from 2002 to 2004. Executive Vice President of the Minnesota Wild Foundation from 2004 to 2008. Commissioner of Finance, State of Minnesota, from 1999 to 2002. Currently Board Chair of the Minnesota Wild Foundation since 2010. | N/A |
* Length of service dates reflect the Trustee’s commencement of service with the Trust’s predecessor entities, where applicable.
** Ms. Johnson has resigned from the Board effective December 31, 2021.
32 | Allspring Managed Fixed Income Portfolio
Other information (unaudited)
Officers1
Name and
year of birth | Position held and
length of service | Principal occupations during past five years or longer |
Andrew Owen
(Born 1960) | President,
since 2017 | President, Chief Executive Officer and Director of Allspring Funds Management, LLC since 2017 and co-president of Galliard Capital Management, LLC, an affiliate of Allspring Funds Management, LLC, since 2019. Prior thereto, Head of Affiliated Managers, Allspring Global Investments, from 2014 to 2019 and Executive Vice President responsible for marketing, investments and product development for Allspring Funds Management, LLC, from 2009 to 2014. In addition, Mr. Owen was an Executive Vice President of Wells Fargo & Company from 2014 to 2021. |
Jeremy DePalma
(Born 1974) | Treasurer,
since 2012
(for certain funds in
the Fund Complex);
since 2021 (for
the remaining funds in the
Fund Complex) | Senior Vice President of Allspring Funds Management, LLC since 2009. Senior Vice President of Evergreen Investment Management Company, LLC from 2008 to 2010 and head of the Fund Reporting and Control Team within Fund Administration. |
Kate McKinley
(Born 1977) | Chief Legal Officer,
since 2021 | Chief Legal Officer of Allspring Global Investments since 2021. Prior thereto, held various roles at State Street Global Advisors beginning in 2010, including serving as Senior Vice President and General Counsel from 2019 to 2021, and Chief Operating Officer of the Institutional Client Group from 2016 - 2019. Prior to working at State Street Global Advisors served as Assistant General Counsel for Bank of America Corporation from 2005 to 2010 and as an Associate at WilmerHale from 2002 to 2005. |
Christopher Baker
(Born 1976) | Chief Compliance Officer, since 2022 | Global Chief Compliance Officer for Allspring Global Investments since 2022. Prior thereto, Chief Compliance Officer for State Street Global Advisors from 2018 to 2021. Senior Compliance Officer for the State Street divisions of Alternative Investment Solutions, Sector Solutions, and Global Marketing from 2015 to 2018. From 2010 to 2015 Vice President, Global Head of Investment and Marketing Compliance for State Street Global Advisors. |
Matthew Prasse
(Born 1983) | Secretary,
since 2021 | Senior Counsel of the Allspring Legal Department since 2021. Senior Counsel of the Wells Fargo Legal Department from 2018 to 2021. Previously, Counsel for Barings LLC from 2015 to 2018. Prior to joining Barings, Associate at Morgan, Lewis & Bockius LLP from 2008 to 2015. |
1 For those Officers with tenures at Allspring Global Investments and/or Allspring Funds Management, LLC that began prior to 2021, such tenures include years of service during which these businesses/entities were known as Wells Fargo Asset Management and Wells Fargo Funds Management, LLC, respectively.
Allspring Managed Fixed Income Portfolio | 33
For more information
More information about Allspring Funds is available free upon request. To obtain literature, please write, visit the Portfolio's website, or call:
Allspring Funds
P.O. Box 219967
Kansas City, MO 64121-9967
Website: allspringglobal.com
Individual investors: 1-800-222-8222
Retail investment professionals: 1-888-877-9275
Institutional investment professionals: 1-866-765-0778
This report and the financial statements contained herein are submitted for the general information of the interest holders of the Portfolio. If this report is used for promotional purposes, distribution of the report must be accompanied or preceded by a current prospectus. Before investing, please consider the investment objectives, risks, charges, and expenses of the investment. For a current prospectus and, if available, a summary prospectus, containing this information, call
1-800-222-8222 or visit the Portfolio's website at allspringglobal.com. Read the prospectus carefully before you invest or send money.
Allspring Global InvestmentsTM is the trade name for the asset management firms of Allspring Global Investments Holdings, LLC, a holding company indirectly owned by certain private funds of GTCR LLC and Reverence Capital Partners, L.P. These firms include but are not limited to Allspring Global Investments, LLC, and Allspring Funds Management, LLC. Certain products managed by Allspring entities are distributed by Allspring Funds Distributor, LLC (a broker-dealer and Member FINRA/SIPC).
This material is for general informational and educational purposes only and is NOT intended to provide investment advice or a recommendation of any kind - including a recommendation for any specific investment, strategy, or plan.
© 2022 Allspring Global Investments Holdings, LLC. All rights reserved.
Not applicable.
| ITEM 3. | AUDIT COMMITTEE FINANCIAL EXPERT |
Not applicable.
| ITEM 4. | PRINCIPAL ACCOUNTANT FEES AND SERVICES |
Not applicable.
| ITEM 5. | AUDIT COMMITTEE OF LISTED REGISTRANTS |
Not applicable.
A Portfolio of Investments for each series of Allspring Master Trust is included as part of the report to shareholders filed under Item 1 of this Form.
| ITEM 7. | DISCLOSURE OF PROXY VOTING POLICIES AND PROCEDURES FOR CLOSED-END MANAGEMENT INVESTMENT COMPANIES |
Not applicable.
| ITEM 8. | PORTFOLIO MANAGERS OF CLOSED-END MANAGEMENT INVESTMENT COMPANIES |
Not applicable.
| ITEM 9. | PURCHASES OF EQUITY SECURITIES BY CLOSED-END MANAGEMEENT INVESTMENT COMPANY AND AFFILIATED PURCHASERS |
Not applicable.
| ITEM 10. | SUBMISSION OF MATTERS TO A VOTE OF SECURITY HOLDERS |
There have been no material changes to the procedures by which shareholders may recommend nominees to the registrant’s Board of Trustees that have been implemented since the registrant’s last provided disclosure in response to the requirements of this Item.
| ITEM 11. | CONTROLS AND PROCEDURES |
(a) The President and Treasurer have concluded that the Allspring Master Trust disclosure controls and procedures (as defined in Rule 30a-3(c) under the Investment Company Act of 1940) provide reasonable
assurances that material information relating to the registrant is made known to them by the appropriate persons, based on their evaluation of these controls and procedures as of a date within 90 days of the filing of this report.
(b) There were no significant changes in the registrant’s internal controls over financial reporting (as defined in Rule 30a-3(d) under the Investment Company Act of 1940) that occurred during the most recent fiscal half-year of the period covered by this report that materially affected, or is reasonably likely to materially affect, the registrant’s internal control over financial reporting.
| ITEM 12. | DISCLOSURES OF SECURITIES LENDING ACTIVITES FOR CLOSED-END MANAGEMENT INVESTMENT COMPANIES |
Not applicable.
SIGNATURES
Pursuant to the requirements of the Securities Exchange Act of 1934 and the Investment Company Act of 1940, the registrant has duly caused this report to be signed on its behalf by the undersigned, thereunto duly authorized.
| | |
| Allspring Master Trust |
| |
| By: | | /s/ Andrew Owen |
| |
| | Andrew Owen |
| | President |
| |
| Date: | | January 27, 2022 |
Pursuant to the requirements of the Securities Exchange Act of 1934 and the Investment Company Act of 1940, this report has been signed below by the following persons on behalf of the registrant and in the capacities and on the date indicated.
| | |
| Allspring Master Trust |
| |
| By: | | /s/ Andrew Owen |
| |
| | Andrew Owen |
| | President |
| |
| Date: | | January 27, 2022 |
| |
| By: | | /s/ Jeremy DePalma |
| |
| | Jeremy DePalma |
| | Treasurer |
| |
| Date: | | January 27, 2022 |