UNITED STATES
SECURITIES AND EXCHANGE COMMISSION
Washington, D.C. 20549
FORM N-CSRS
CERTIFIED SHAREHOLDER REPORT OF REGISTERED
MANAGEMENT INVESTMENT COMPANIES
Investment Company Act file number: 811-09689
Allspring Master Trust
(Exact name of registrant as specified in charter)
1415 Vantage Park Drive, 3rd Floor, Charlotte, NC 28203
(Address of principal executive offices) (Zip code)
Matthew Prasse
Allspring Funds Management, LLC
1415 Vantage Park Drive, 3rd Floor, Charlotte, NC 28203
(Name and address of agent for service)
Registrant’s telephone number, including area code: 800-222-8222
Date of fiscal year end: May 31
Registrant is making a filing for 11 of its series: Allspring C&B Large Cap Value Portfolio, Allspring Core Bond Portfolio, Allspring Disciplined International Developed Markets Portfolio, Allspring Diversified Large Cap Growth Portfolio, Allspring Disciplined Large Cap Portfolio, Allspring Emerging Growth Portfolio, Allspring Large Company Value Portfolio, Allspring Managed Fixed Income Portfolio, Allspring Real Return Portfolio, Allspring Small Company Growth Portfolio and Allspring Small Company Value Portfolio.
Date of reporting period: November 30, 2023
ITEM 1. REPORT TO STOCKHOLDERS
Allspring C&B Large Cap Value Fund
Semi-Annual Report
November 30, 2023
The views expressed and any forward-looking statements are as of November 30, 2023, unless otherwise noted, and are those of the Fund’s portfolio managers and/or Allspring Global Investments. Discussions of individual securities or the markets generally are not intended as individual recommendations. Future events or results may vary significantly from those expressed in any forward-looking statements. The views expressed are subject to change at any time in response to changing circumstances in the market. Allspring Global Investments disclaims any obligation to publicly update or revise any views expressed or forward-looking statements.
Allspring C&B Large Cap Value Fund | 1
Letter to shareholders (unaudited)
Andrew Owen
President
Allspring Funds
Dear Shareholder:
We are pleased to offer you this semi-annual report for the Allspring C&B Large Cap Value Fund for the six-month period that ended November 30, 2023. Globally, stocks and bonds experienced high levels of volatility during the period. The market was focused on the impact of ongoing aggressive central bank rate hikes on persistently high inflation. As inflation finally gradually declined, anticipation rose over an end to the central bank monetary tightening cycle. For the six-month period, domestic U.S. and global stocks and bonds had positive overall results, with U.S. stocks leading the way. After suffering deep and broad losses through 2022, bonds now benefit from a base of higher yields that can help generate higher income.
For the period, U.S. stocks, based on the S&P 500 Index,1 returned 10.17%. International stocks, as measured by the MSCI ACWI ex USA Index (Net),2 gained 5.07% while the MSCI EM Index (Net) (USD)3 returned 4.60%. Among bond indexes, the Bloomberg U.S. Aggregate Bond Index4 returned -0.80%, the Bloomberg Global Aggregate ex-USD Index (unhedged)5 gained 0.63%, the Bloomberg Municipal Bond Index6 returned 2.29%, and the ICE BofA U.S. High Yield Index7 returned 5.53%.
Affected by high inflation and central bank rate hikes, markets were volatile.
The six-month period began in June with the Federal Reserve’s (Fed’s) first pause on interest rate hikes since March 2022, when it began its aggressive campaign to rein in inflation. However, the Core Consumer Price Index (CPI)8, while continuing to decline, remained stubbornly high in June at 4.8%—well above the Fed’s 2.0% target rate. With the U.S. unemployment rate still at 3.6%, near a historical low, and U.S. payrolls continuing to grow in June, expectations of more Fed rate hikes were reinforced. However, U.S. and global stocks had strong returns in June.
July was a good month for stocks, while bonds had more muted but positive monthly returns overall. More volatile sectors and regions tended to do well, as investors grew more optimistic regarding economic prospects. With strong second quarter gross domestic product growth—initially estimated at 2.4%—and U.S. annual inflation easing steadily to 3.2% in July, hopes for a soft economic landing grew. The Fed, the European Central Bank (ECB), and the Bank of England (BoE) all raised their respective key interest rates by 0.25% in July. In the Fed’s case, speculation grew that it could be very close to the end of its tightening cycle. Meanwhile, China’s economy showed signs of stagnation, renewing concerns of global fallout.
1
The S&P 500 Index consists of 500 stocks chosen for market size, liquidity, and industry group representation. It is a market-value-weighted index with each stock’s weight in the index proportionate to its market value. You cannot invest directly in an index.
2
The Morgan Stanley Capital International (MSCI) All Country World Index (ACWI) ex USA Index (Net) is a free-float-adjusted market-capitalization-weighted index that is designed to measure the equity market performance of developed and emerging markets, excluding the U.S. Source: MSCI. MSCI makes no express or implied warranties or representations and shall have no liability whatsoever with respect to any MSCI data contained herein. The MSCI data may not be further redistributed or used as a basis for other indexes or any securities or financial products. This report is not approved, reviewed, or produced by MSCI. You cannot invest directly in an index.
3
The MSCI Emerging Markets (EM) Index (Net) (USD) is a free-float-adjusted market-capitalization-weighted index that is designed to measure the equity market performance of emerging markets. You cannot invest directly in an index.
4
The Bloomberg U.S. Aggregate Bond Index is a broad-based benchmark that measures the investment-grade, U.S.-dollar-denominated, fixed-rate taxable bond market, including Treasuries, government-related and corporate securities, mortgage-backed securities (agency fixed-rate and hybrid adjustable-rate mortgage pass-throughs), asset-backed securities, and commercial mortgage-backed securities. You cannot invest directly in an index.
5
The Bloomberg Global Aggregate ex-USD Index (unhedged) is an unmanaged index that provides a broad-based measure of the global investment-grade fixed income markets excluding the U.S.-dollar-denominated debt market. You cannot invest directly in an index.
6
The Bloomberg Municipal Bond Index is an unmanaged index composed of long-term tax-exempt bonds with a minimum credit rating of Baa. You cannot invest directly in an index.
7
The ICE BofA U.S. High Yield Index is a market-capitalization-weighted index of domestic and Yankee high yield bonds. The index tracks the performance of high yield securities traded in the U.S. bond market. You cannot invest directly in an index. Copyright 2024. ICE Data Indices, LLC. All rights reserved.
8
The Core Consumer Price Index (CPI) is a measure of the average change over time in the prices paid by urban consumers for a market basket of consumer goods and services excluding energy and food prices. You cannot invest directly in an index.
2 | Allspring C&B Large Cap Value Fund
Letter to shareholders (unaudited)
“ With strong
second-quarter gross
domestic product
growth—initially
estimated at 2.4%—and
U.S. annual inflation easing steadily to 3.2%
in July, hopes for a soft
economic landing grew. ”
Stocks retreated in August while monthly bond returns were flat overall. Increased global market volatility reflected unease over the Chinese property market being stressed along with weak Chinese economic data. However, speculation grew over a possible end to the Fed’s campaign of interest rate increases or at least a pause in September. U.S. economic data generally remained solid, with resilient job market data and inflation ticking up slightly in August, as the annual CPI1 rose 3.7%. However, the three-month trend for Core CPI stood at an annualized 2.4%.
Stocks and bonds both had negative overall returns in September as investors reluctantly recited the new chorus of “higher for longer,” led by the Fed’s determination not to lower interest rates until it knows it has vanquished its pesky opponent—higher-than-targeted inflation. As of September, the two primary gauges of U.S. inflation—the annual Core Personal Consumption Expenditures Price Index2 and the CPI—both stood at roughly 4%, twice as high as the Fed’s oft-stated 2% target. The month ended with the prospect of yet another U.S. government shutdown, averted at least temporarily.
October was a tough month for financial markets overall. Key global indexes were pushed down by rising geopolitical tensions—particularly the Israel-Hamas conflict, and concerns over the Fed’s “higher for longer” monetary policy. The U.S. 10-year Treasury yield rose above 5% for the first time since 2007. Commodity prices did well as oil prices rallied in response to the prospect of oil supply disruptions from the Middle East. U.S. annualized third quarter GDP was estimated at a healthier-than-anticipated 4.9%. China’s GDP indicated surprisingly strong industrial production and retail sales, offset by ongoing weakness in its real estate sector.
In November, the market mood turned positive as cooling inflation inspired confidence that central banks could hold off on further rate hikes. Overall annual inflation in the U.S. fell to 3.1% in November while 12-month inflation in the U.K. and eurozone eased to 4.6% and 2.4%, respectively—far below their peak levels of mid-2022. Third quarter annualized U.S. GDP growth was raised to an estimated 5.2% while U.S. job totals rose by just below 200,000 in November, indicating a slight cooling of the labor market. All of this fresh evidence added to confidence for a U.S. soft economic landing, leading to a more buoyant mood heading into winter as the Federal Open Market Committee held rates steady at its November meeting.
1
The CPI is a measure of the average change over time in the prices paid by urban consumers for a market basket of consumer goods and services. You cannot invest directly in an index.
2
The Core Personal Consumption Expenditures Price Index (PCE) is a measure of prices that people living in the United States, or those buying on their behalf, pay for goods and services. It is sometimes called the core PCE price index, because two categories that can have price swings – food and energy – are left out to make underlying inflation easier to see. You cannot invest directly in an index.
Allspring C&B Large Cap Value Fund | 3
Letter to shareholders (unaudited)
For further information about your fund, contact your investment professional, visit our website at allspringglobal.com, or call us directly at 1-800-222-8222.
Don’t let short-term uncertainty derail long-term investment goals.
Periods of investment uncertainty can present challenges, but experience has taught us that maintaining long-term investment goals can be an effective way to plan for the future. To help you create a sound strategy based on your personal goals and risk tolerance, Allspring Funds offers more than 100 mutual funds spanning a wide range of asset classes and investment styles. Although diversification cannot guarantee an investment profit or prevent losses, we believe it can be an effective way to manage investment risk and potentially smooth out overall portfolio performance. We encourage investors to know their investments and to understand that appropriate levels of risk-taking may unlock opportunities.
Thank you for choosing to invest with Allspring Funds. We appreciate your confidence in us and remain committed to helping you meet your financial needs.
Sincerely,
Andrew Owen
President
Allspring Funds
4 | Allspring C&B Large Cap Value Fund
Letter to shareholders (unaudited)
|
At a meeting held November 13-15, 2023, the Board of Trustees approved a number of changes to the Allspring C&B Large Cap Value Fund (the “Fund”) and the Allspring C&B Large Cap Value Portfolio, the master portfolio in which the Fund invests substantially all of its assets, including: |
• changing the Fund’s name to the Allspring Large Cap Value Fund and the master portfolio’s name to the Allspring Large Cap Value Portfolio; |
• modifying the Fund’s and the master portfolio’s principal investment strategy to allow it to invest up to 20% of its total assets in equity securities of foreign issuers through ADRs and similar investments; and |
• switching the master portfolio’s sub-adviser from Cooke & Bieler, L.P. to Allspring Global Investments, LLC. |
These changes as expected to become effective on or about March 4, 2024. |
Allspring C&B Large Cap Value Fund | 5
Performance highlights (unaudited)
Performance highlights
| The Fund seeks maximum long-term total return (current income and capital appreciation), consistent with minimizing risk to principal. |
| Allspring Funds Management, LLC |
Subadviser for the affiliated master portfolio* | |
| Andrew B. Armstrong, CFA, Wesley Lim, CFA, Steve Lyons, CFA, Michael M. Meyer, CFA, Edward W. O’Connor, CFA, R. James O’Neil, CFA, Mehul Trivedi, CFA, William Weber, CFA |
Average annual total returns (%) as of November 30, 2023 |
| | | | |
| | | | | | | | | |
| | | | | | | | | |
| | | | | | | | | |
| | | | | | | | | |
Administrator Class (CBLLX) | | | | | | | | | |
Institutional Class (CBLSX) | | | | | | | | | |
| | | | | | | | | |
Russell 1000® Value Index5 | | | | | | | | | |
Figures quoted represent past performance, which is no guarantee of future results, and do not reflect taxes that a shareholder may pay on an investment in a fund. Investment return and principal value of an investment will fluctuate so that an investor’s shares, when redeemed, may be worth more or less than their original cost. Performance shown without sales charges would be lower if sales charges were reflected. Current performance may be lower or higher than the performance data quoted, which assumes the reinvestment of dividends and capital gains. Current month-end performance is available on the Fund’s website, allspringglobal.com.
Index returns do not include transaction costs associated with buying and selling securities, any mutual fund fees or expenses, or any taxes. It is not possible to invest directly in an index.
For Class A shares, the maximum front-end sales charge is 5.75%. For Class C shares, the maximum contingent deferred sales charge is 1.00%. Performance including a contingent deferred sales charge assumes the sales charge for the corresponding time period. Class R6, Administrator Class and Institutional Class shares are sold without a front-end sales charge or contingent deferred sales charge.
|
| Reflects the expense ratios as stated in the most recent prospectuses. The expense ratios shown are subject to change and may differ from the annualized expense ratios shown in the Financial Highlights of this report. |
| The manager has contractually committed through September 30, 2024, to waive fees and/or reimburse expenses to the extent necessary to cap total annual fund operating expenses after fee waivers at 1.07% for Class A, 1.82% for Class C, 0.65% for Class R6, 1.00% for Administrator Class and 0.75% for Institutional Class. Brokerage commissions, stamp duty fees, interest, taxes, acquired fund fees and expenses (if any) from funds in which the affiliated master portfolio invests, and extraordinary expenses are excluded from the expense caps. Net expenses from the affiliated master portfolio are included in the expense caps. Prior to or after the commitment expiration date, the caps may be increased or the commitment to maintain the caps may be terminated only with the approval of the Board of Trustees. Without these caps, the Fund’s returns would have been lower. The expense ratio paid by an investor is the net expense ratio (the total annual fund operating expenses after fee waivers) as stated in the prospectuses. |
| Historical performance shown for the Class R6 shares prior to their inception reflects the performance of the Institutional Class shares, and includes the higher expenses applicable to the Institutional Class shares. If these expenses had not been included, returns for the Class R6 shares would be higher. |
| The Russell 3000® Index measures the performance of the 3,000 largest U.S. companies based on total market capitalization, which represents approximately 98% of the investable U.S. equity market. You cannot invest directly in an index. |
| The Russell 1000® Value Index measures the performance of those Russell 1000 companies with lower price/book ratios and lower forecasted growth values. You cannot invest directly in an index. |
Stock values fluctuate in response to the activities of individual companies and general market and economic conditions. Consult the Fund’s prospectus for additional information on these and other risks.
| The Fund is a feeder fund in a master-feeder structure that invests substantially all of its assets in a single affiliated master portfolio of the Allspring Master Trust with a substantially identical investment objective and substantially similar investment strategies. References to the investment activities of the Fund are intended to refer to the investment activities of the affiliated master portfolio in which it invests. |
CFA® and Chartered Financial Analyst® are trademarks owned by CFA Institute. |
6 | Allspring C&B Large Cap Value Fund
Performance highlights (unaudited)
Ten largest holdings (%) as of November 30, 20231 |
| |
| |
| |
| |
London Stock Exchange Group PLC | |
| |
| |
| |
Fidelity National Financial, Inc. | |
| |
| Each holding represents the Fund’s allocable portion of the affiliated master portfolio security. Figures represent each holding as a percentage of the Fund’s net assets. Holdings are subject to change and may have changed since the date specified. |
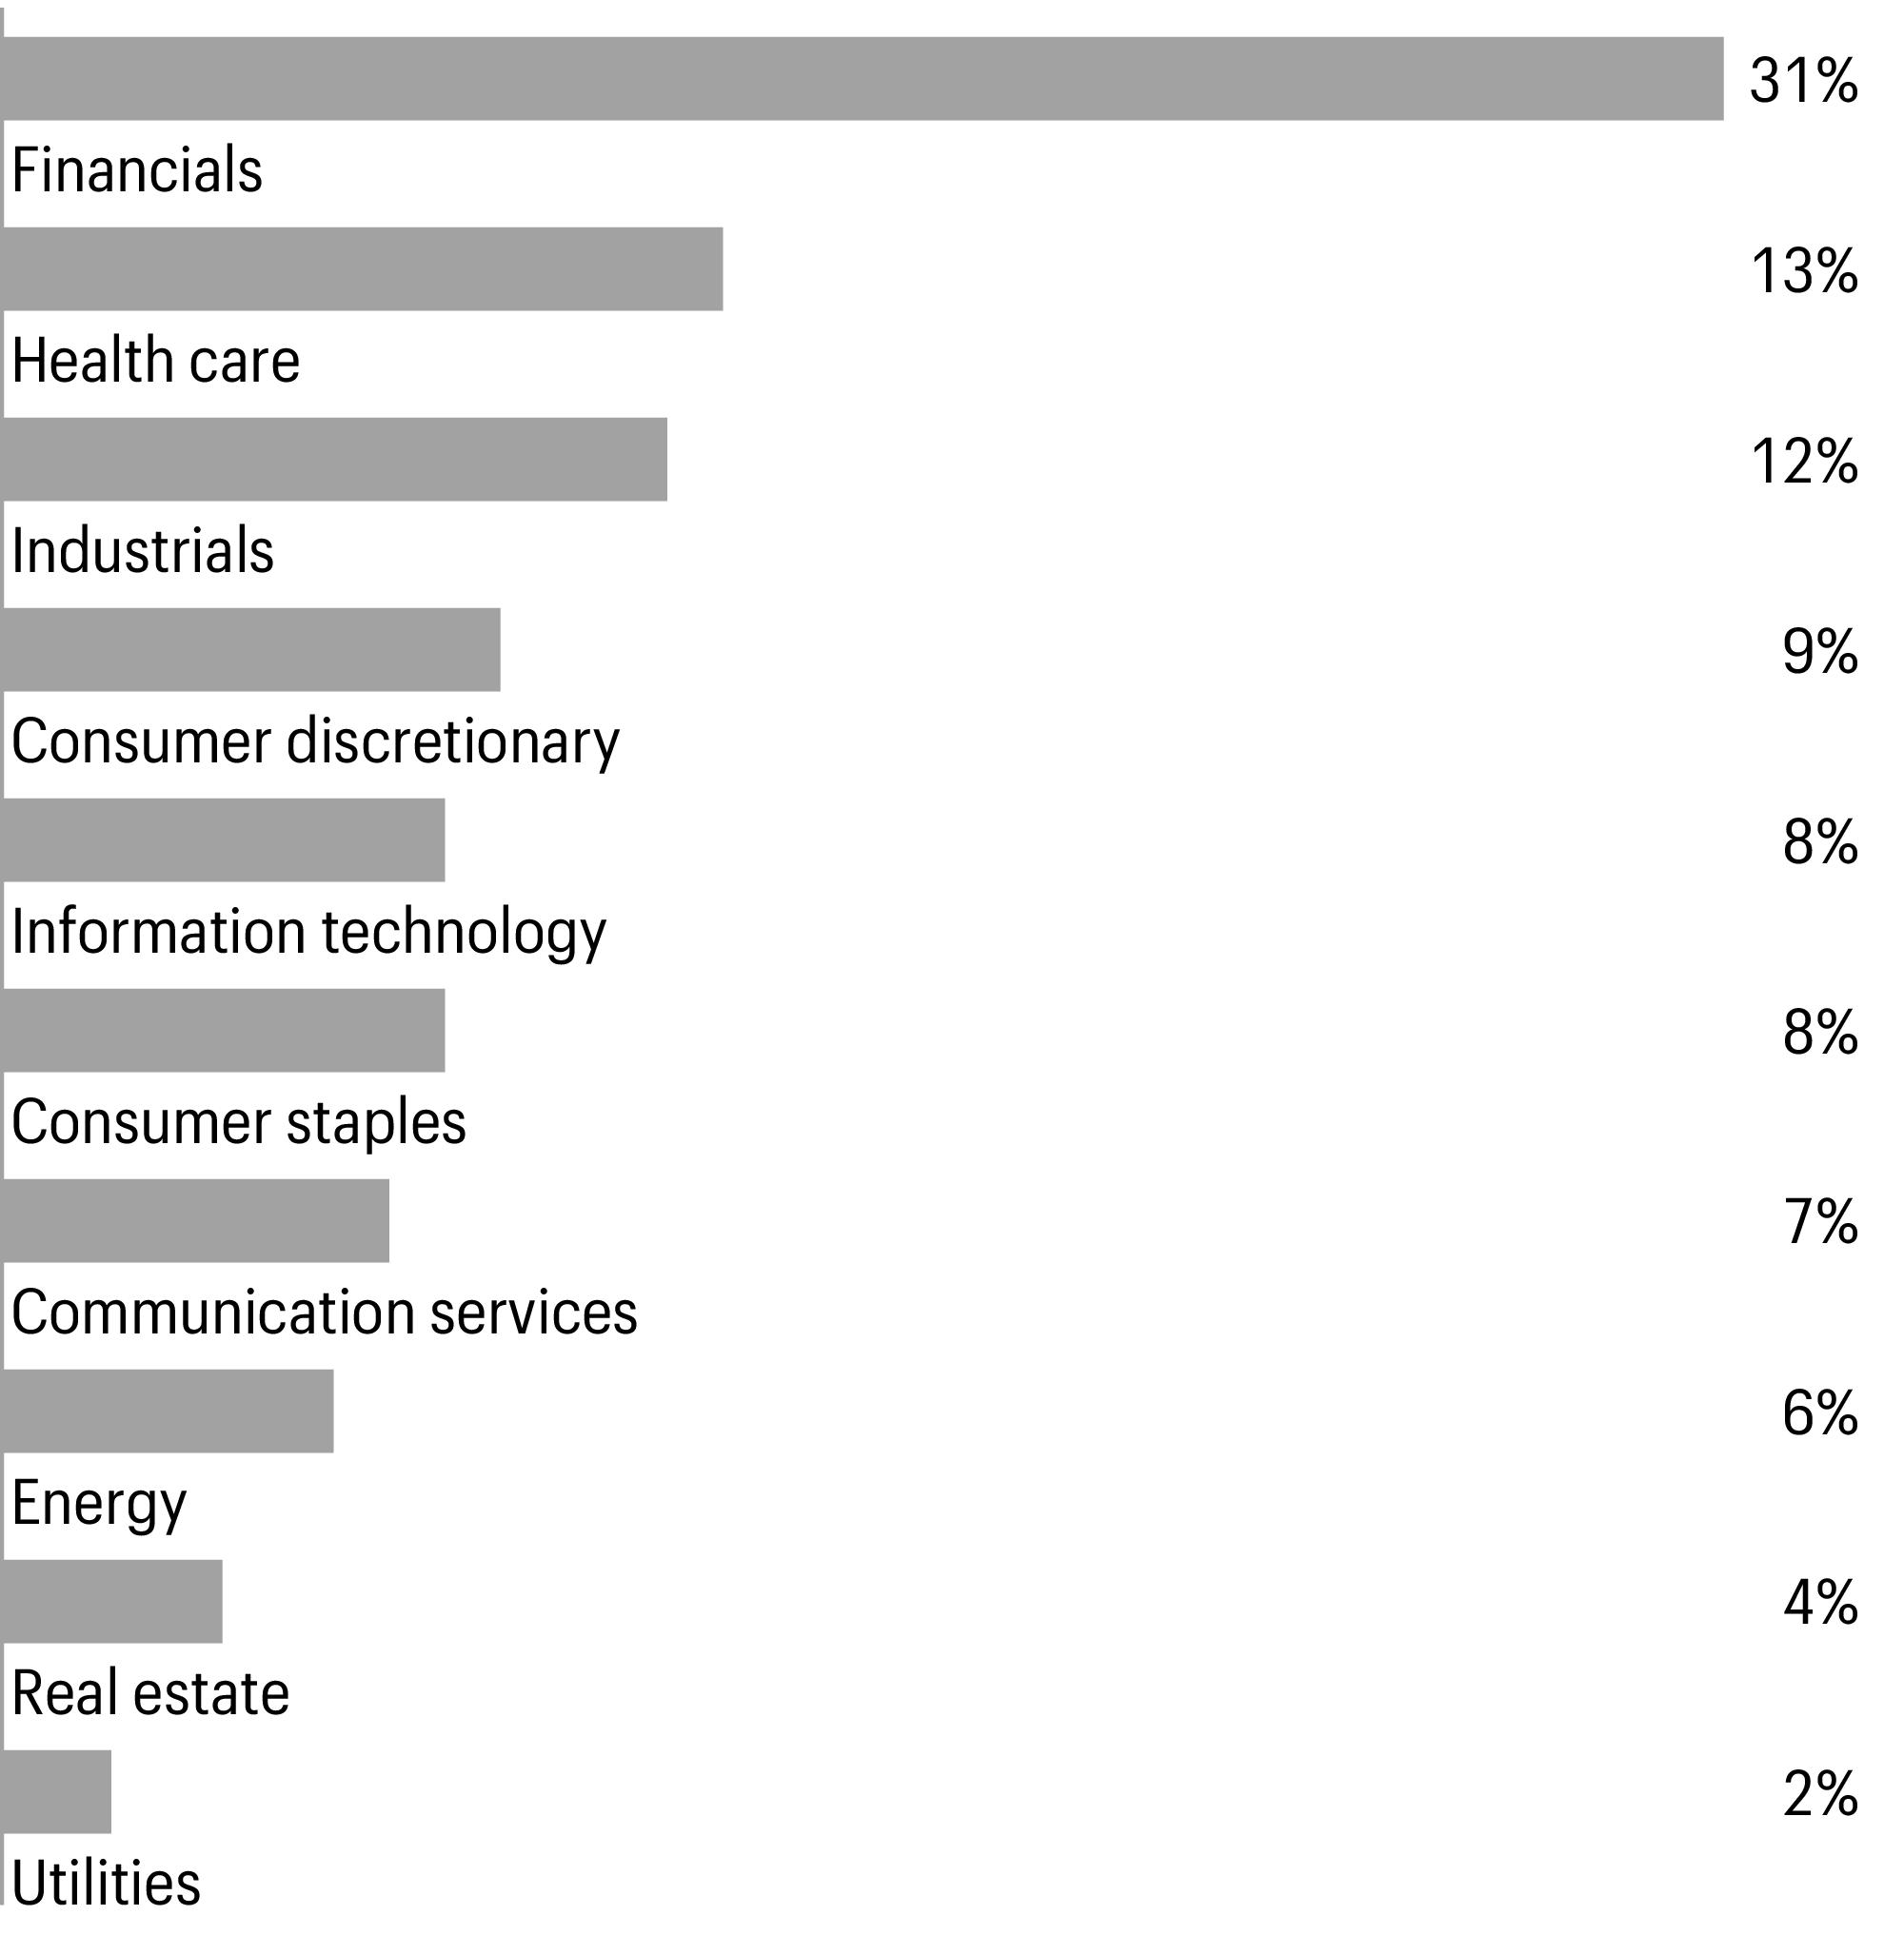
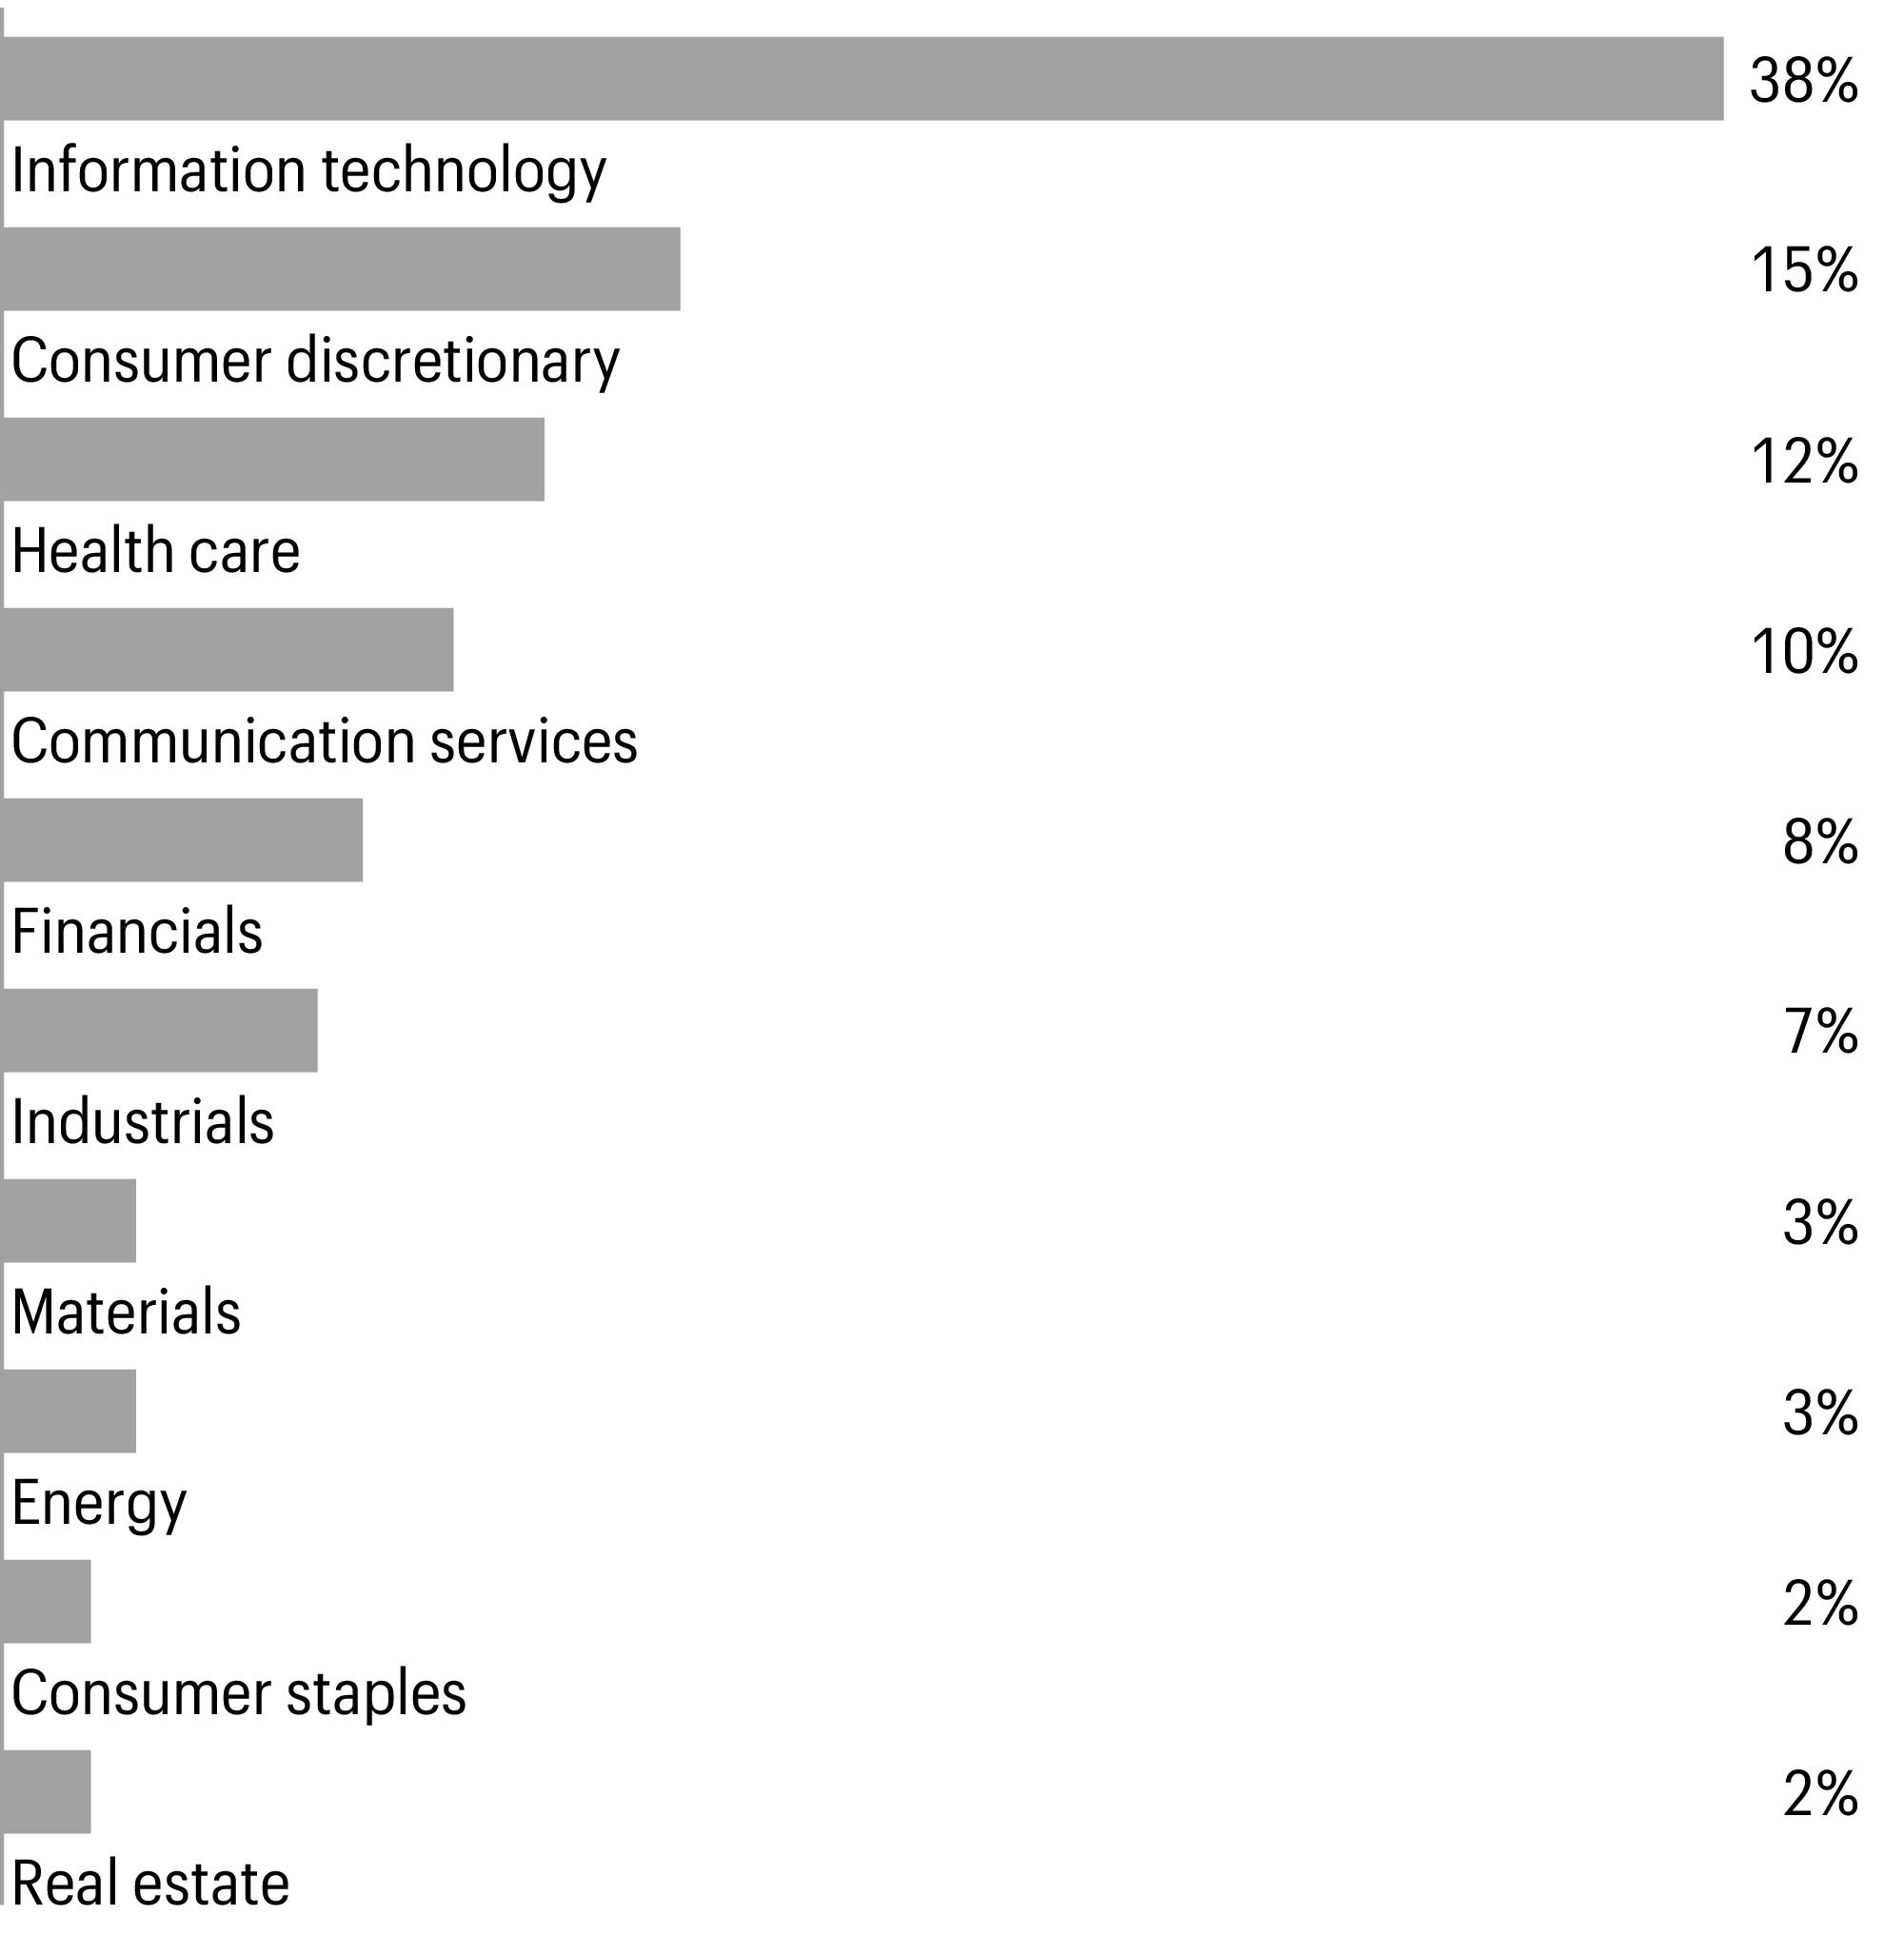
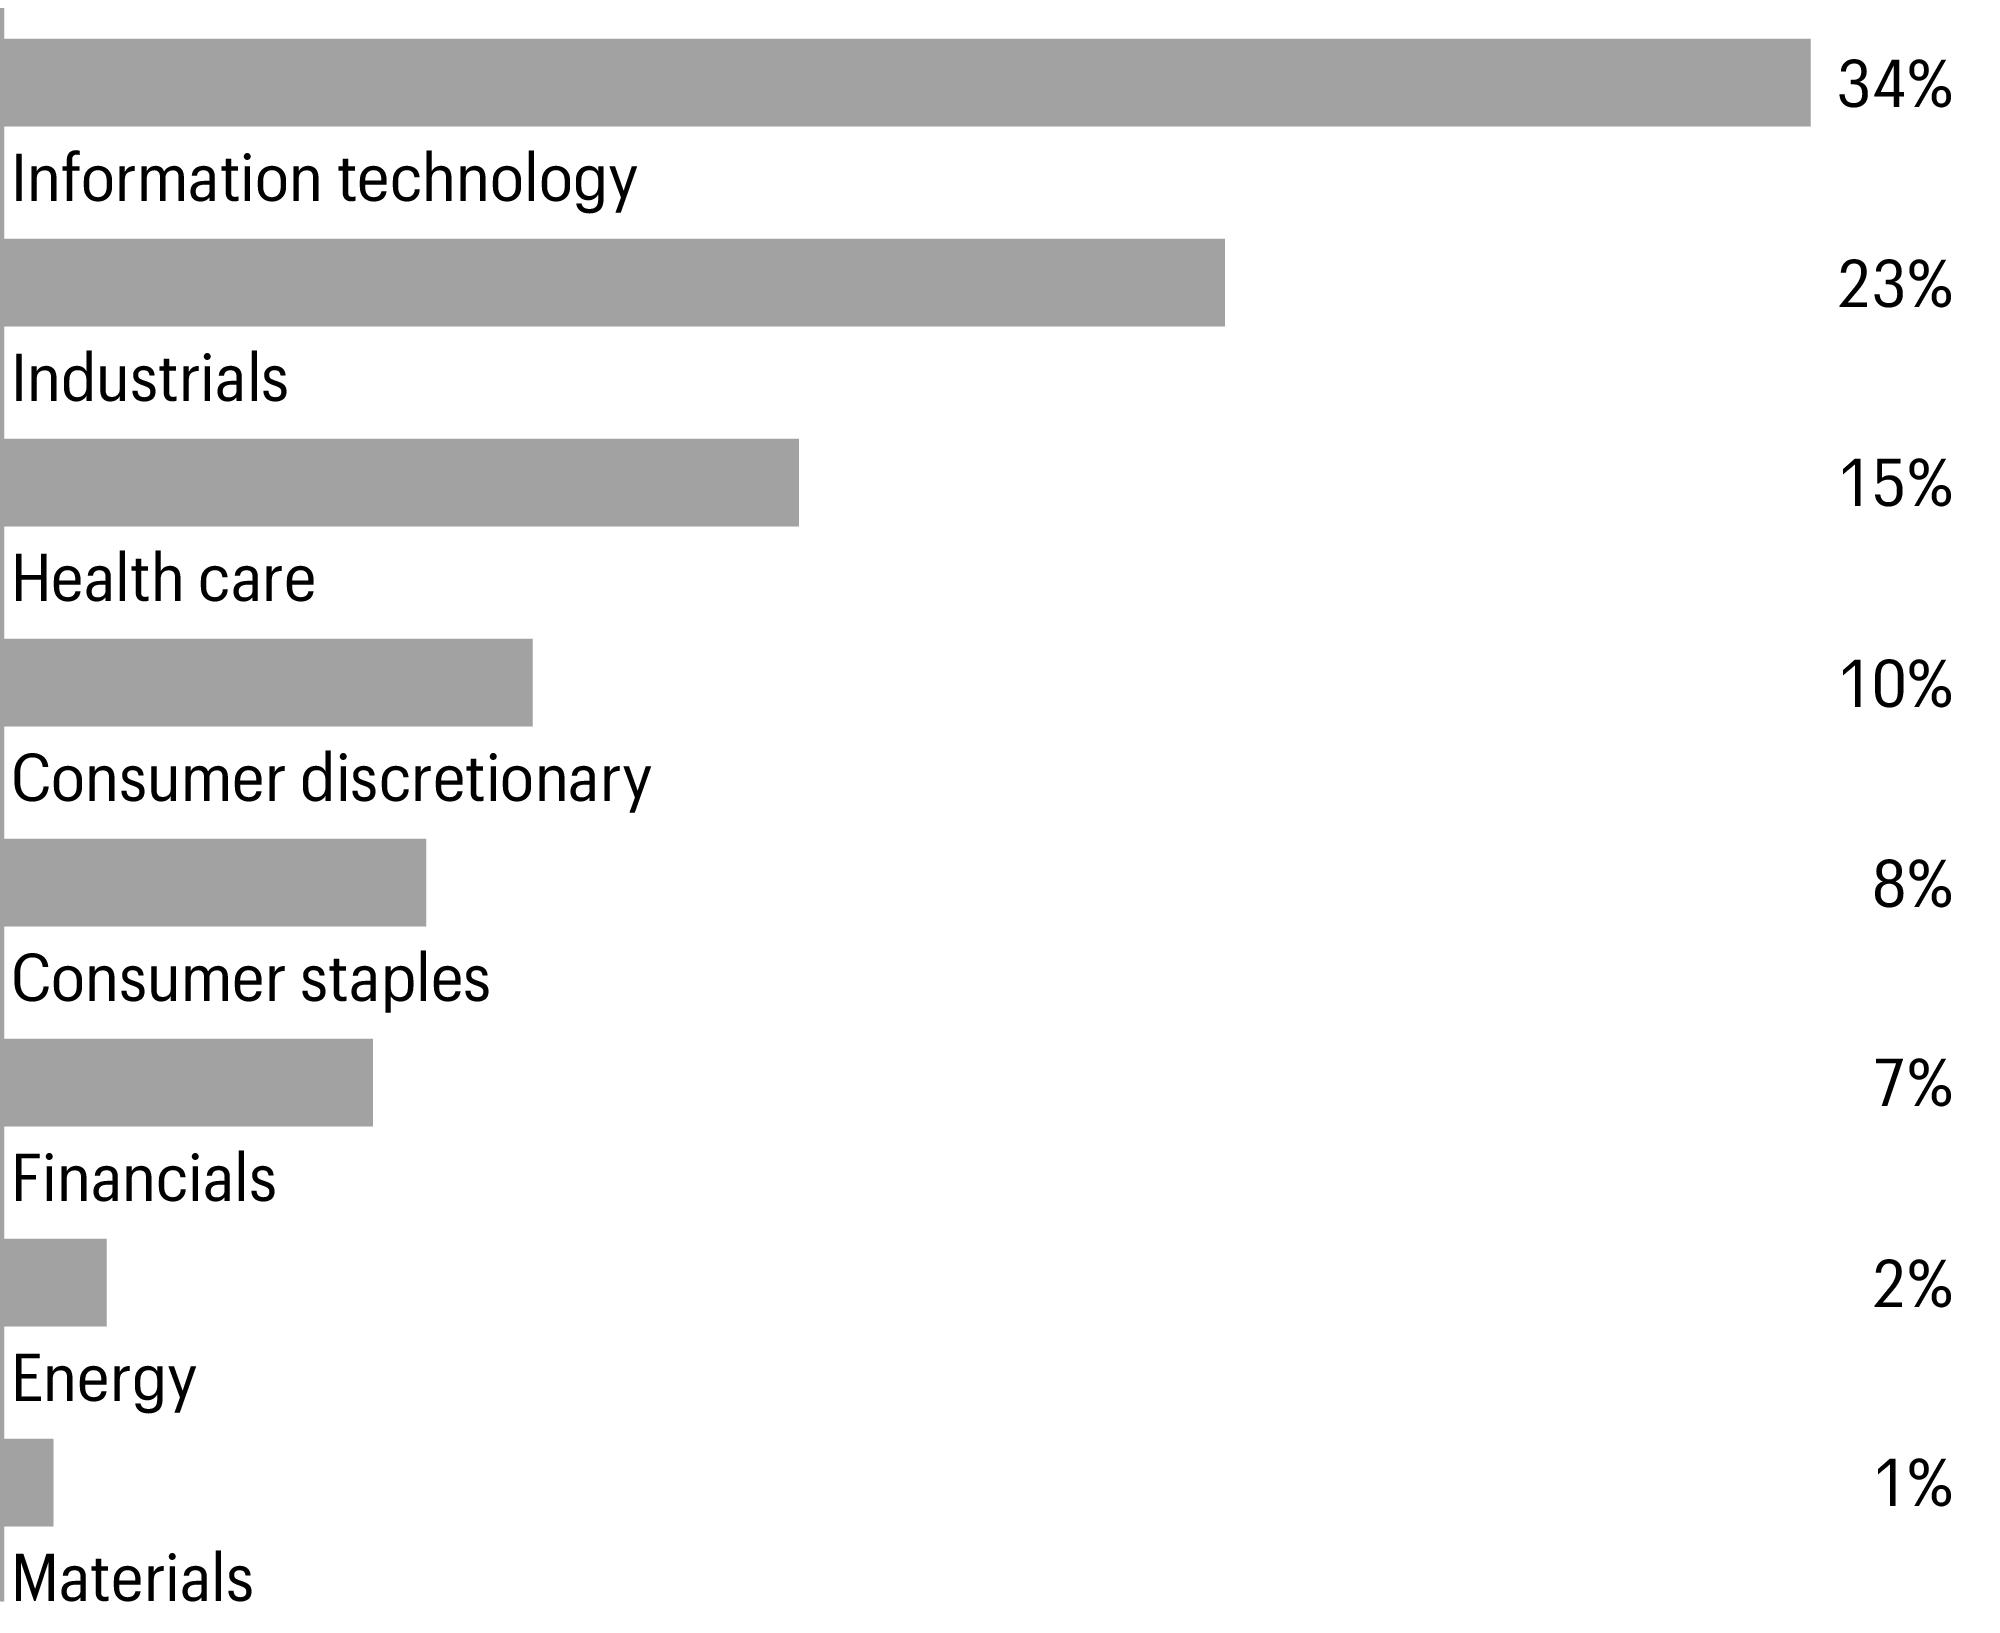
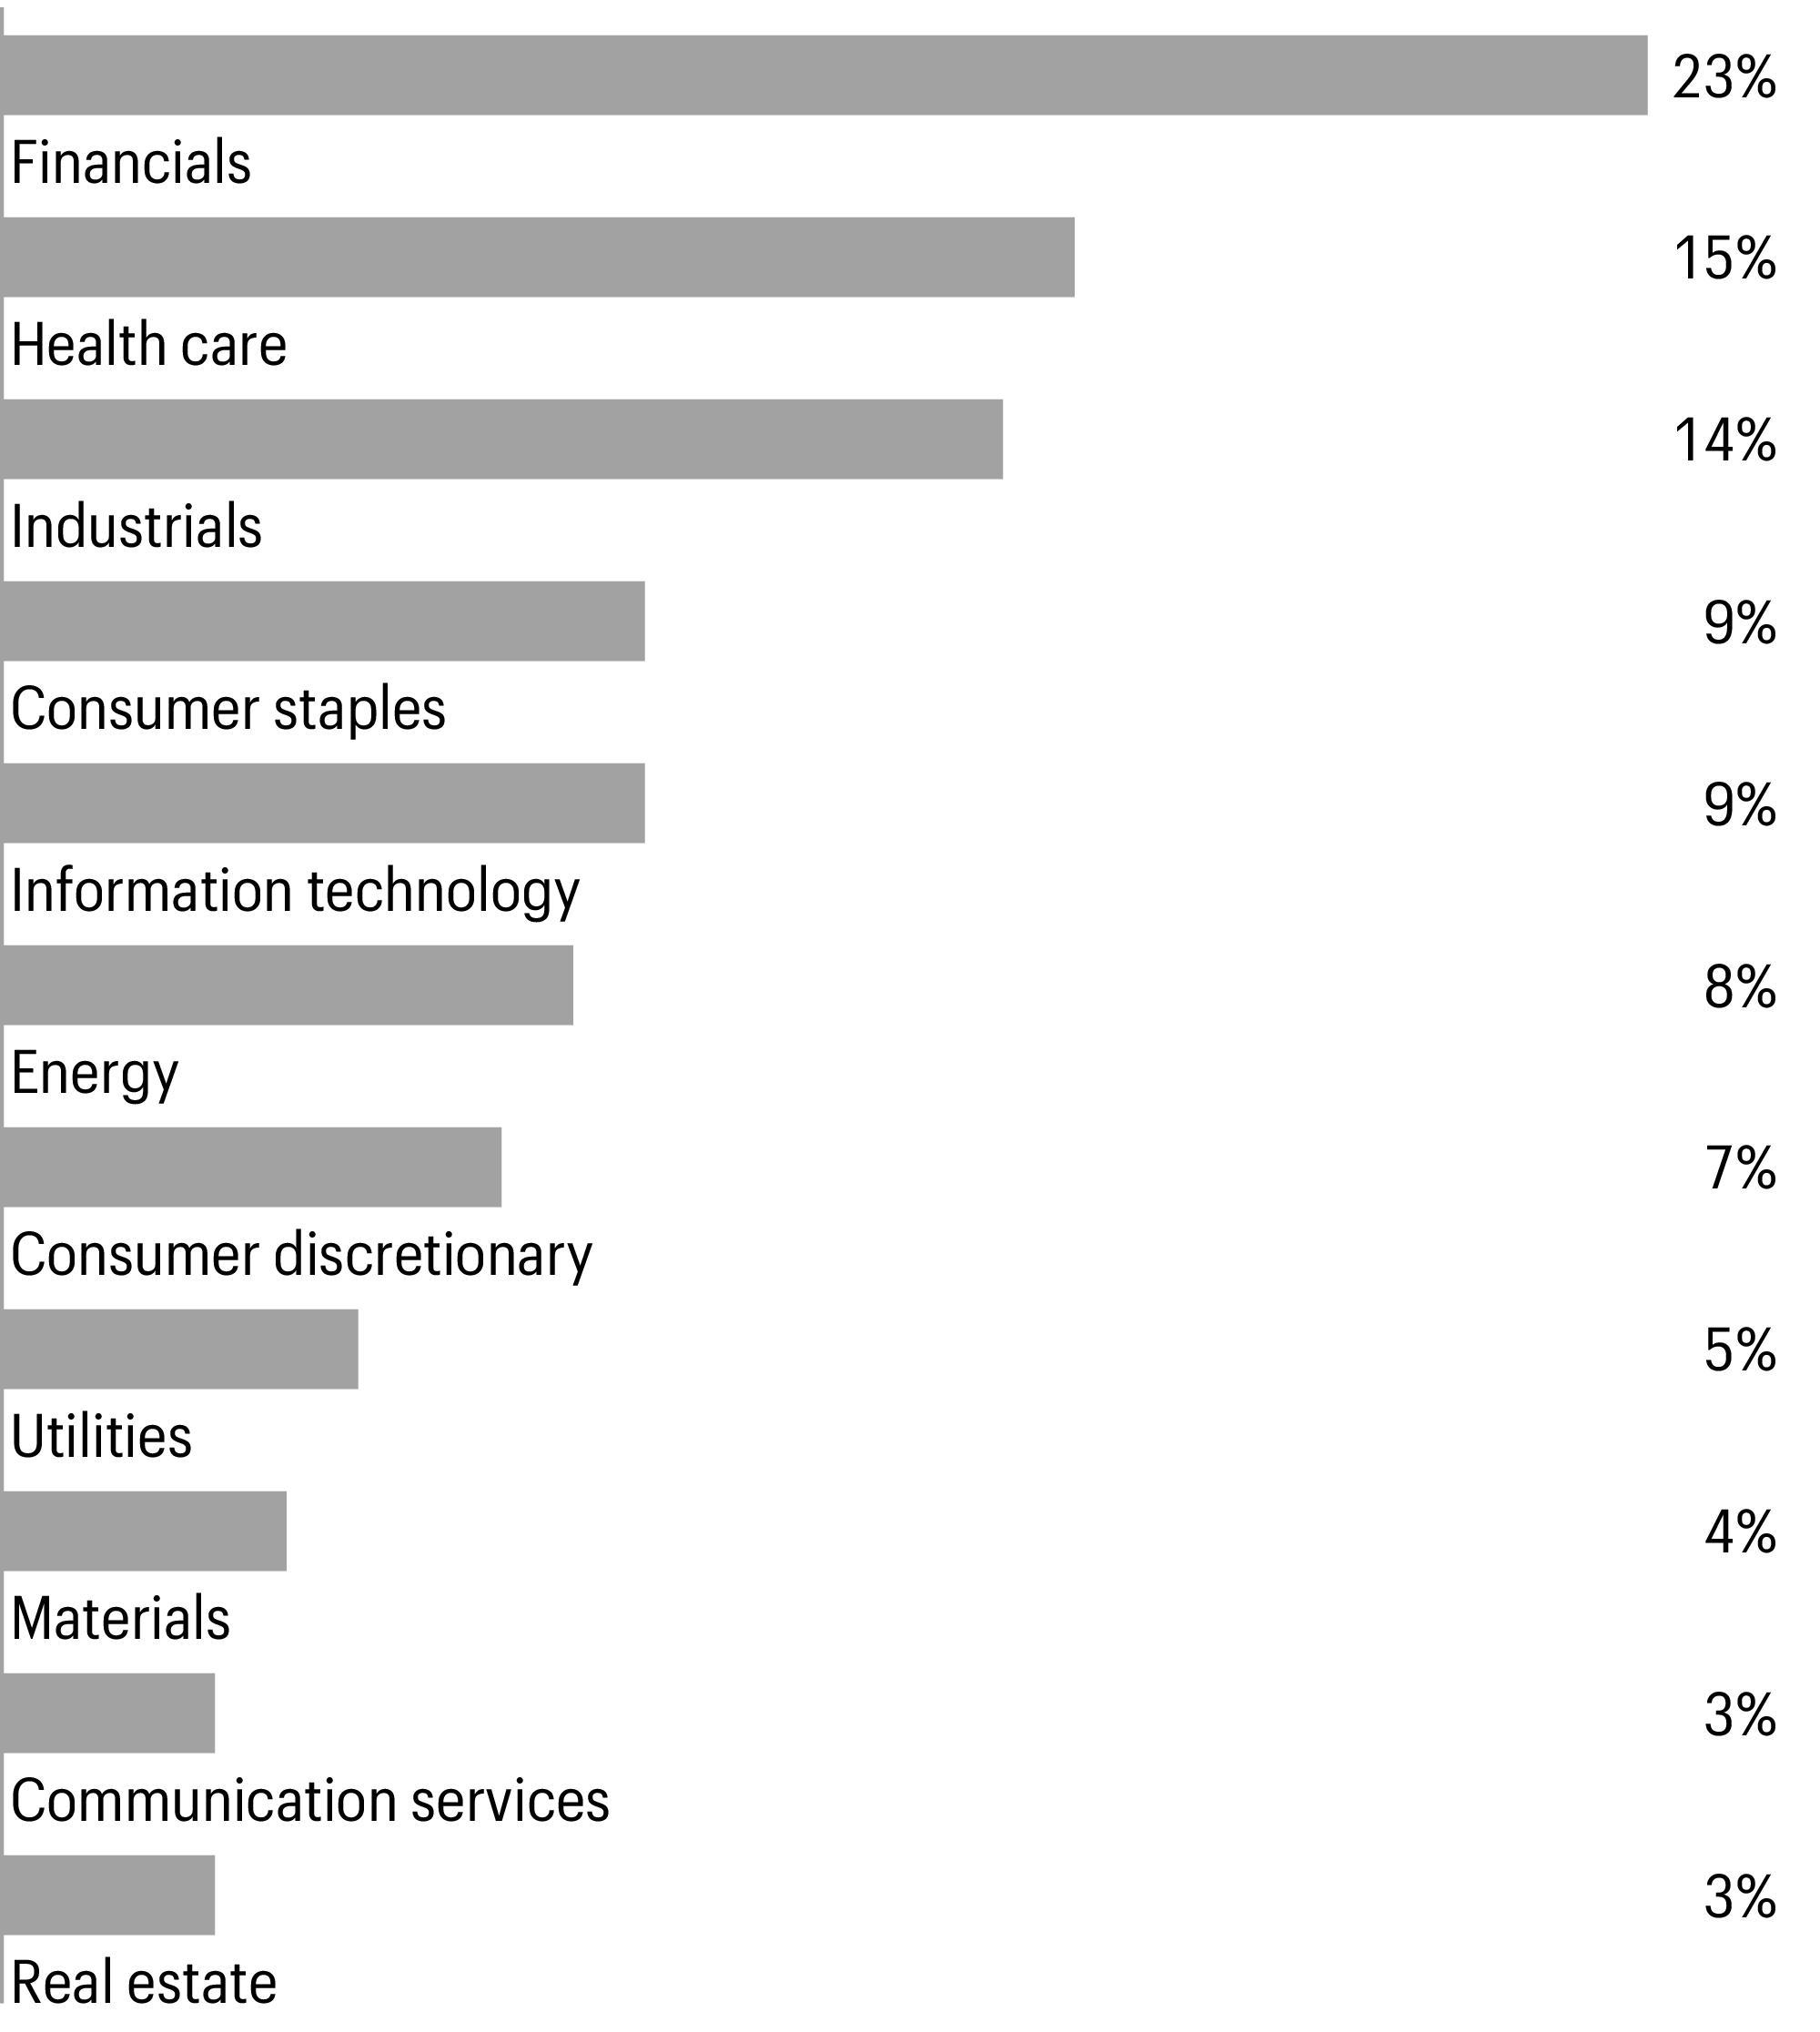
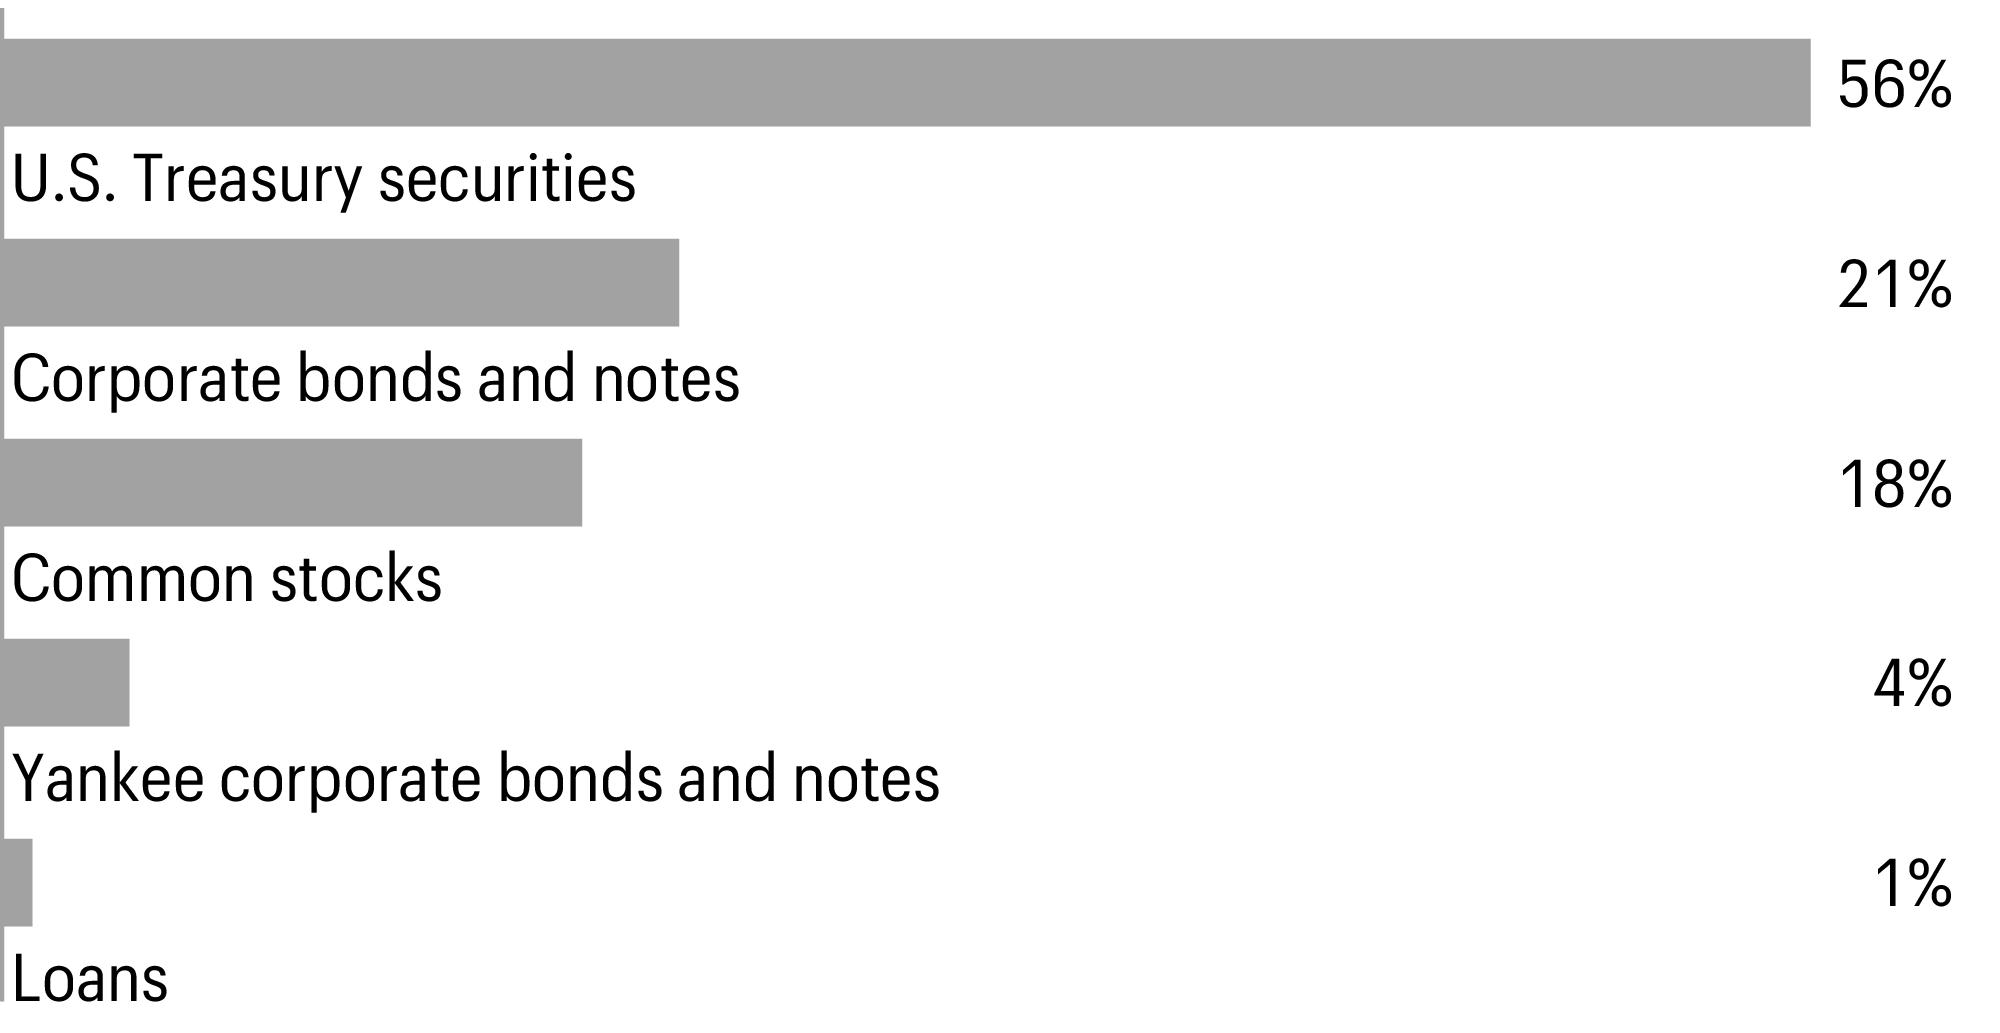
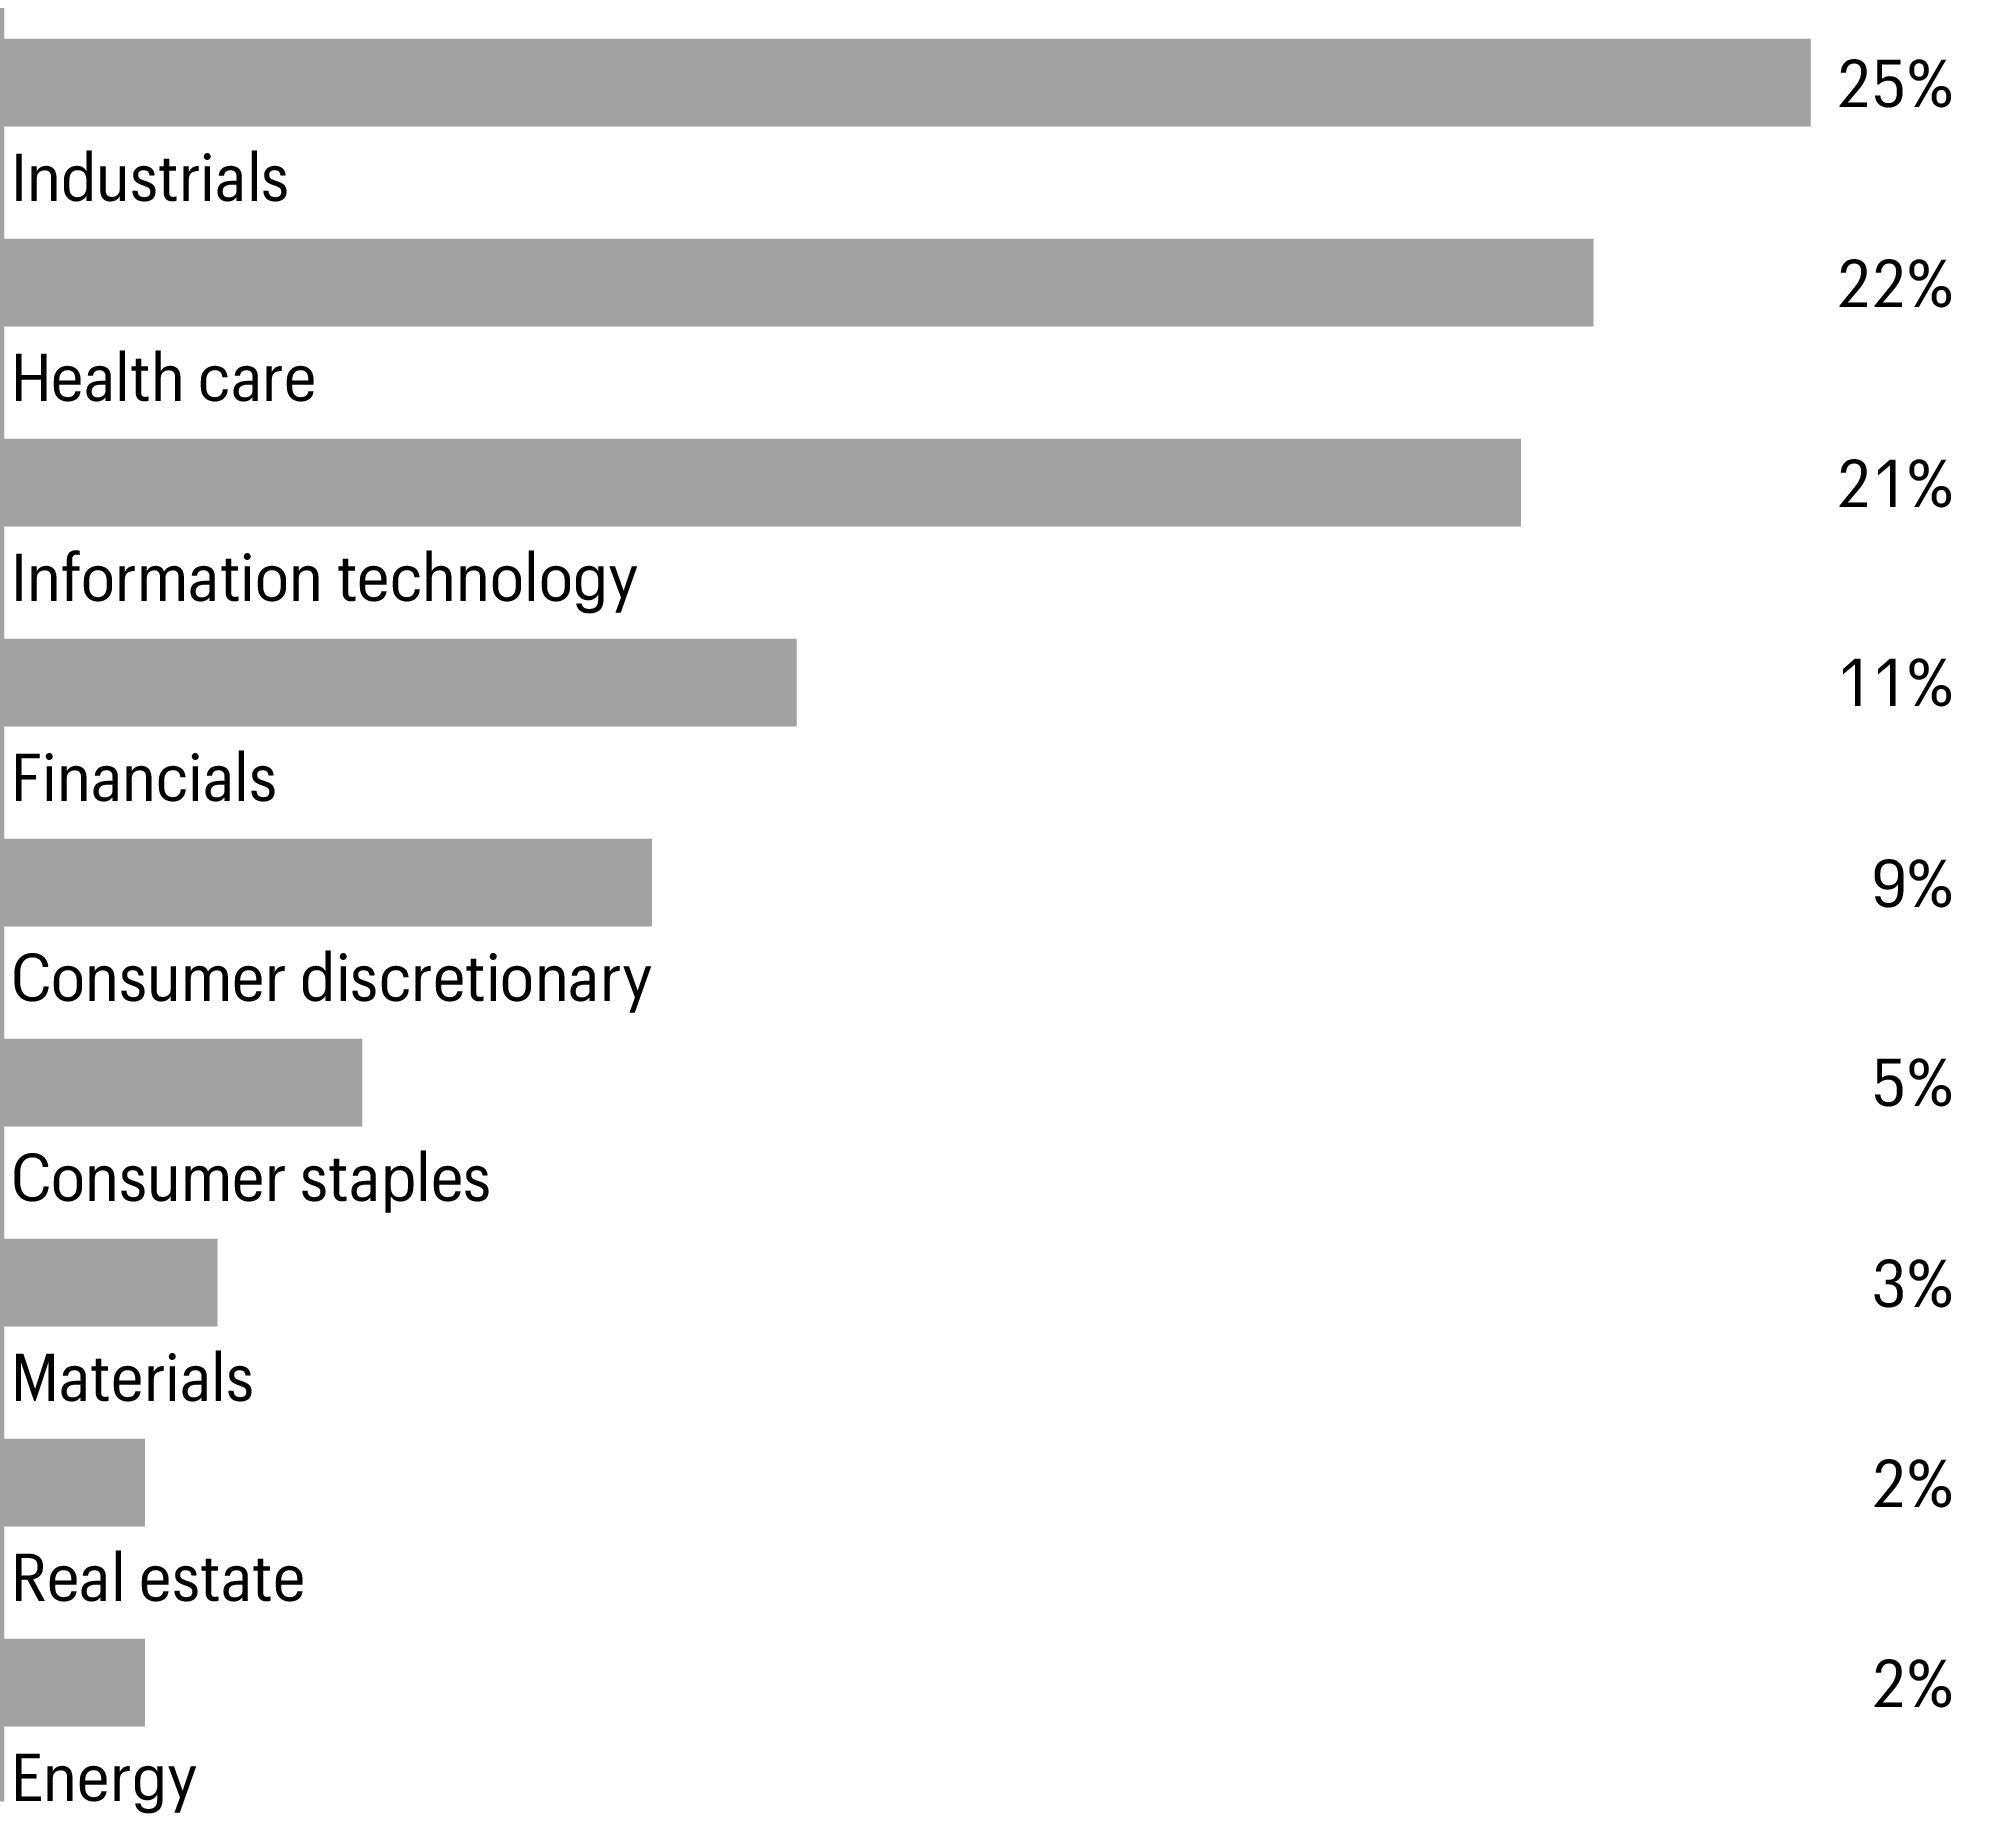
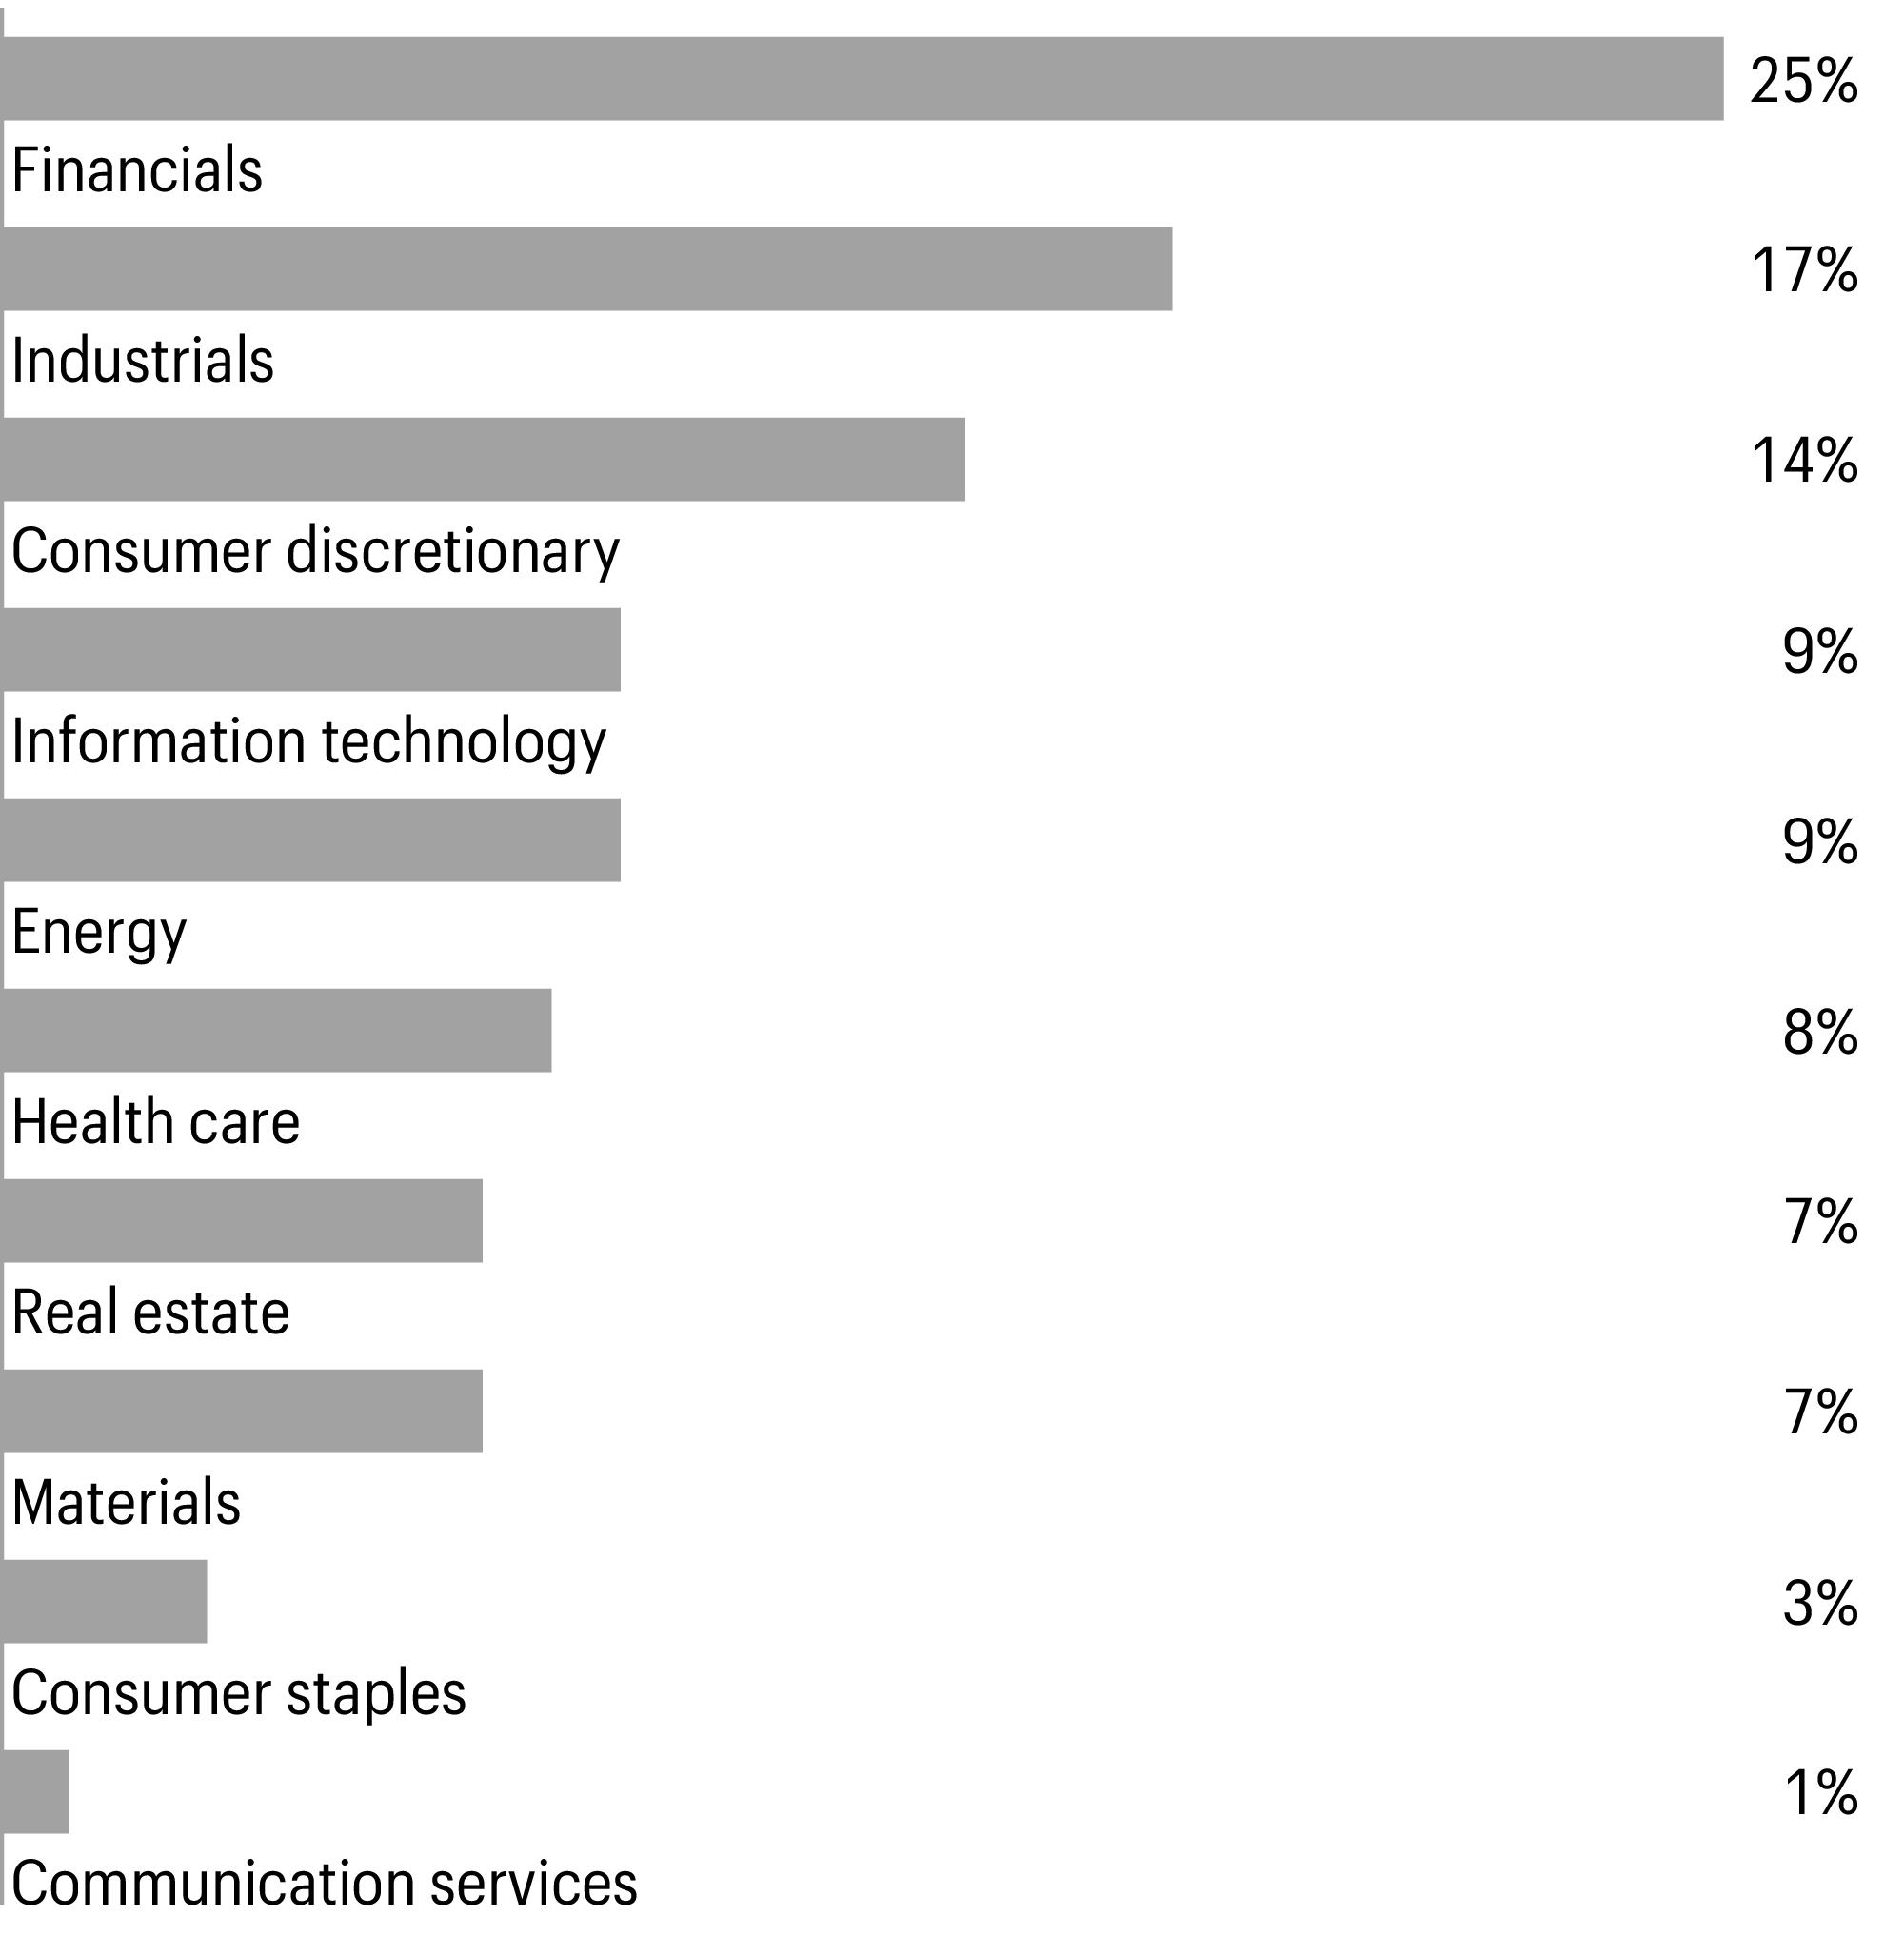
Sector allocation as of November 30, 20231 |
| Figures represent the sector allocation of the affiliated master portfolio as a percentage of the long-term investments of the affiliated master portfolio. These amounts are subject to change and may have changed since the date specified. |
Allspring C&B Large Cap Value Fund | 7
Fund expenses (unaudited)
Fund expenses
As a shareholder of the Fund, you incur two types of costs: (1) transaction costs, including sales charges (loads) on purchase payments and contingent deferred sales charges (if any) on redemptions and (2) ongoing costs, including management fees, distribution (12b-1) and/or shareholder servicing fees, and other Fund expenses. This example is intended to help you understand your ongoing costs (in dollars) of investing in the Fund and to compare these costs with the ongoing costs of investing in other mutual funds.
The example is based on an investment of $1,000 invested at the beginning of the six-month period and held for the entire period from June 1, 2023 to November 30, 2023.
Actual expenses
The “Actual” line of the table below provides information about actual account values and actual expenses. You may use the information in this line, together with the amount you invested, to estimate the expenses that you paid over the period. Simply divide your account value by $1,000 (for example, an $8,600 account value divided by $1,000= 8.6), then multiply the result by the number in the “Actual” line under the heading entitled “Expenses paid during period” for your applicable class of shares to estimate the expenses you paid on your account during this period.
Hypothetical example for comparison purposes
The “Hypothetical” line of the table below provides information about hypothetical account values and hypothetical expenses based on the Fund’s actual expense ratio and an assumed rate of return of 5% per year before expenses, which is not the Fund’s actual return. The hypothetical account values and expenses may not be used to estimate the actual ending account balance or expenses you paid for the period. You may use this information to compare the ongoing costs of investing in the Fund and other funds. To do so, compare this 5% hypothetical example with the 5% hypothetical examples that appear in the shareholder reports of the other funds.
Please note that the expenses shown in the table are meant to highlight your ongoing costs only and do not reflect any transactional costs, such as sales charges (loads) and contingent deferred sales charges. Therefore, the “Hypothetical” line of the table is useful in comparing ongoing costs only, and will not help you determine the relative total costs of owning different funds. In addition, if these transactional costs were included, your costs would have been higher.
| Beginning
account value
6-1-2023 | Ending
account value
11-30-2023 | | |
| | | | |
| | | | |
Hypothetical (5% return before expenses) | | | | |
| | | | |
| | | | |
Hypothetical (5% return before expenses) | | | | |
| | | | |
| | | | |
Hypothetical (5% return before expenses) | | | | |
| | | | |
| | | | |
Hypothetical (5% return before expenses) | | | | |
| | | | |
| | | | |
Hypothetical (5% return before expenses) | | | | |
| Expenses paid is equal to the annualized net expense ratio of each class multiplied by the average account value over the period, multiplied by 183 divided by 366 (to reflect the one-half-year period). |
| Amounts reflect net expenses allocated from the affiliated Master Portfolio in which the Fund invests. |
8 | Allspring C&B Large Cap Value Fund
Portfolio of investments—November 30, 2023 (unaudited)
| | | | | |
Investment companies: 100.32% | | | | | | |
Affiliated master portfolio: 100.32% | | | | | | |
Allspring C&B Large Cap Value Portfolio | | | | | | |
Total investment companies (Cost $173,417,379) | | | | | | |
Total investments in securities (Cost $173,417,379) | | | | | | |
Other assets and liabilities, net | | | | | | |
| | | | | | |
Transactions with the affiliated Master Portfolio were as follows:
| % of
ownership,
beginning
of period | % of
ownership,
end of
period | Net realized
gains
(losses) on
investments
allocated
from
affiliated
Master
Portfolio | Net
change in
unrealized
gains
(losses) on
investments
allocated
from
affiliated
Master
Portfolio | Dividends
allocated
from
affiliated
Master
Portfolio | Interest
allocated
from
affiliated
Master
Portfolio | Affiliated
Income
Allocated
from
affiliated
Master
Portfolio | |
Allspring C&B Large Cap Value Portfolio | | | | | | | | |
The accompanying notes are an integral part of these financial statements.
Allspring C&B Large Cap Value Fund | 9
Statement of assets and liabilities—November 30, 2023 (unaudited)
Financial statements
Statement of assets and liabilities
| |
Investments in affiliated Master Portfolio, at value (cost $173,417,379) | |
Receivable for Fund shares sold | |
| |
Prepaid expenses and other assets | |
| |
| |
Payable for Fund shares redeemed | |
Administration fees payable | |
| |
Trustees’ fees and expenses payable | |
Accrued expenses and other liabilities | |
| |
| |
| |
| |
Total distributable earnings | |
| |
Computation of net asset value and offering price per share | |
| |
Shares outstanding–Class A1 | |
Net asset value per share–Class A | |
Maximum offering price per share – Class A2 | |
| |
Shares outstanding–Class C1 | |
Net asset value per share–Class C | |
| |
Shares outstanding–Class R61 | |
Net asset value per share–Class R6 | |
Net assets–Administrator Class | |
Shares outstanding–Administrator Class1 | |
Net asset value per share–Administrator Class | |
Net assets–Institutional Class | |
Shares outstanding–Institutional Class1 | |
Net asset value per share–Institutional Class | |
1 The Fund has an unlimited number of authorized shares.
2 Maximum offering price is computed as 100/94.25 of net asset value. On investments of $50,000 or more, the offering price is reduced.
The accompanying notes are an integral part of these financial statements.
10 | Allspring C&B Large Cap Value Fund
Statement of operations—six months ended November 30, 2023 (unaudited)
Statement of operations
| |
Dividends allocated from affiliated Master Portfolio (net of foreign withholding taxes of $63,505) | |
Affiliated income allocated from affiliated Master Portfolio | |
Interest allocated from affiliated Master Portfolio | |
Expenses allocated from affiliated Master Portfolio | |
Waivers allocated from affiliated Master Portfolio | |
| |
| |
| |
| |
| |
| |
| |
| |
| |
Shareholder servicing fees | |
| |
| |
| |
| |
| |
Custody and accounting fees | |
| |
| |
Shareholder report expenses | |
Trustees’ fees and expenses | |
| |
| |
Less: Fee waivers and/or expense reimbursements | |
| |
| |
| |
Realized and unrealized gains (losses) on investments | |
Net realized gains on investments allocated from affiliated Master Portfolio | |
Net change in unrealized gains (losses) on investments allocated from affiliated Master Portfolio | |
Net realized and unrealized gains (losses) on investments | |
Net increase in net assets resulting from operations | |
The accompanying notes are an integral part of these financial statements.
Allspring C&B Large Cap Value Fund | 11
Statement of changes in net assets
Statement of changes in net assets
|
Six months ended
November 30, 2023 (unaudited) | |
| | | | |
| | | | |
Net realized gains on investments | | | | |
Net change in unrealized gains (losses) on investments | | | | |
Net increase (decrease) in net assets resulting from operations | | | | |
Distributions to shareholders from | | | | |
Net investment income and net realized gains | | | | |
| | | | |
| | | | |
| | | | |
| | | | |
| | | | |
Total distributions to shareholders | | | | |
Capital share transactions | | | | |
Proceeds from shares sold | | | | |
| | | | |
| | | | |
| | | | |
| | | | |
| | | | |
| | | | |
Reinvestment of distributions | | | | |
| | | | |
| | | | |
| | | | |
| | | | |
| | | | |
| | | | |
Payment for shares redeemed | | | | |
| | | | |
| | | | |
| | | | |
| | | | |
| | | | |
| | | | |
Net decrease in net assets resulting from capital share transactions | | | | |
Total increase (decrease) in net assets | | | | |
| | | | |
| | | | |
| | | | |
The accompanying notes are an integral part of these financial statements.
12 | Allspring C&B Large Cap Value Fund
Financial highlights
(For a share outstanding throughout each period)
| Six months ended
November 30, 2023
(unaudited) | |
| | | | | |
Net asset value, beginning of period | | | | | | |
| | | | | | |
Net realized and unrealized gains (losses) on investments | | | | | | |
Total from investment operations | | | | | | |
Distributions to shareholders from | | | | | | |
| | | | | | |
| | | | | | |
Total distributions to shareholders | | | | | | |
Net asset value, end of period | | | | | | |
| | | | | | |
Ratios to average net assets (annualized)* | | | | | | |
| | | | | | |
| | | | | | |
| | | | | | |
| | | | | | |
| | | | | | |
Net assets, end of period (000s omitted) | | | | | | |
| Ratios include net expenses allocated from the affiliated Master Portfolio which were as follows: |
Six months ended November 30, 2023 (unaudited) | |
| |
| |
| |
| |
| |
| Calculated based upon average shares outstanding |
| Total return calculations do not include any sales charges. Returns for periods of less than one year are not annualized. |
| Portfolio turnover rate is calculated by multiplying the affiliated Master Portfolio’s percentage of the Fund’s total investment in securities at the end of the period by the affiliated Master Portfolio’s portfolio turnover rate. |
The accompanying notes are an integral part of these financial statements.
Allspring C&B Large Cap Value Fund | 13
(For a share outstanding throughout each period)
| Six months ended
November 30, 2023
(unaudited) | |
| | | | | |
Net asset value, beginning of period | | | | | | |
Net investment income (loss) | | | | | | |
Net realized and unrealized gains (losses) on investments | | | | | | |
Total from investment operations | | | | | | |
Distributions to shareholders from | | | | | | |
| | | | | | |
| | | | | | |
Total distributions to shareholders | | | | | | |
Net asset value, end of period | | | | | | |
| | | | | | |
Ratios to average net assets (annualized)* | | | | | | |
| | | | | | |
| | | | | | |
Net investment income (loss) | | | | | | |
| | | | | | |
| | | | | | |
Net assets, end of period (000s omitted) | | | | | | |
| Ratios include net expenses allocated from the affiliated Master Portfolio which were as follows: |
Six months ended November 30, 2023 (unaudited) | |
| |
| |
| |
| |
| |
| Calculated based upon average shares outstanding |
| Total return calculations do not include any sales charges. Returns for periods of less than one year are not annualized. |
| Portfolio turnover rate is calculated by multiplying the affiliated Master Portfolio’s percentage of the Fund’s total investment in securities at the end of the period by the affiliated Master Portfolio’s portfolio turnover rate. |
The accompanying notes are an integral part of these financial statements.
14 | Allspring C&B Large Cap Value Fund
(For a share outstanding throughout each period)
| Six months ended
November 30, 2023
(unaudited) | |
| | | | | |
Net asset value, beginning of period | | | | | | |
| | | | | | |
Net realized and unrealized gains (losses) on investments | | | | | | |
Total from investment operations | | | | | | |
Distributions to shareholders from | | | | | | |
| | | | | | |
| | | | | | |
Total distributions to shareholders | | | | | | |
Net asset value, end of period | | | | | | |
| | | | | | |
Ratios to average net assets (annualized)* | | | | | | |
| | | | | | |
| | | | | | |
| | | | | | |
| | | | | | |
| | | | | | |
Net assets, end of period (000s omitted) | | | | | | |
| Ratios include net expenses allocated from the affiliated Master Portfolio which were as follows: |
Six months ended November 30, 2023 (unaudited) | |
| |
| |
| |
| |
| |
| Calculated based upon average shares outstanding |
| Amount is less than $0.005. |
| Returns for periods of less than one year are not annualized. |
| Portfolio turnover rate is calculated by multiplying the affiliated Master Portfolio’s percentage of the Fund’s total investment in securities at the end of the period by the affiliated Master Portfolio’s portfolio turnover rate. |
The accompanying notes are an integral part of these financial statements.
Allspring C&B Large Cap Value Fund | 15
(For a share outstanding throughout each period)
| Six months ended
November 30, 2023
(unaudited) | |
| | | | | |
Net asset value, beginning of period | | | | | | |
| | | | | | |
Net realized and unrealized gains (losses) on investments | | | | | | |
Total from investment operations | | | | | | |
Distributions to shareholders from | | | | | | |
| | | | | | |
| | | | | | |
Total distributions to shareholders | | | | | | |
Net asset value, end of period | | | | | | |
| | | | | | |
Ratios to average net assets (annualized)* | | | | | | |
| | | | | | |
| | | | | | |
| | | | | | |
| | | | | | |
| | | | | | |
Net assets, end of period (000s omitted) | | | | | | |
| Ratios include net expenses allocated from the affiliated Master Portfolio which were as follows: |
Six months ended November 30, 2023 (unaudited) | |
| |
| |
| |
| |
| |
| Calculated based upon average shares outstanding |
| Returns for periods of less than one year are not annualized. |
| Portfolio turnover rate is calculated by multiplying the affiliated Master Portfolio’s percentage of the Fund’s total investment in securities at the end of the period by the affiliated Master Portfolio’s portfolio turnover rate. |
The accompanying notes are an integral part of these financial statements.
16 | Allspring C&B Large Cap Value Fund
(For a share outstanding throughout each period)
| Six months ended
November 30, 2023
(unaudited) | |
| | | | | |
Net asset value, beginning of period | | | | | | |
| | | | | | |
Net realized and unrealized gains (losses) on investments | | | | | | |
Total from investment operations | | | | | | |
Distributions to shareholders from | | | | | | |
| | | | | | |
| | | | | | |
Total distributions to shareholders | | | | | | |
Net asset value, end of period | | | | | | |
| | | | | | |
Ratios to average net assets (annualized)* | | | | | | |
| | | | | | |
| | | | | | |
| | | | | | |
| | | | | | |
| | | | | | |
Net assets, end of period (000s omitted) | | | | | | |
| Ratios include net expenses allocated from the affiliated Master Portfolio which were as follows: |
Six months ended November 30, 2023 (unaudited) | |
| |
| |
| |
| |
| |
| Calculated based upon average shares outstanding |
| Returns for periods of less than one year are not annualized. |
| Portfolio turnover rate is calculated by multiplying the affiliated Master Portfolio’s percentage of the Fund’s total investment in securities at the end of the period by the affiliated Master Portfolio’s portfolio turnover rate. |
The accompanying notes are an integral part of these financial statements.
Allspring C&B Large Cap Value Fund | 17
Notes to financial statements (unaudited)
Notes to financial statements
Allspring Funds Trust (the “Trust”), a Delaware statutory trust organized on March 10, 1999, is an open-end management investment company registered under the Investment Company Act of 1940, as amended (the “1940 Act”). As an investment company, the Trust follows the accounting and reporting guidance in Financial Accounting Standards Board (“FASB”) Accounting Standards Codification Topic 946, Financial Services – Investment Companies. These financial statements report on the Allspring C&B Large Cap Value Fund (the “Fund”) which is a diversified series of the Trust.
The Fund is a feeder fund in a master-feeder structure that invests substantially all of its assets in a single master portfolio with a substantially identical investment objective and substantially similar investment strategies. The Fund invests in Allspring C&B Large Cap Value Portfolio, a separate diversified portfolio (the “affiliated Master Portfolio”) of Allspring Master Trust, a registered open-end management investment company. As of November 30, 2023, the Fund owned 79.04% of Allspring C&B Large Cap Value Portfolio. The affiliated Master Portfolio directly acquires portfolio securities and the Fund acquires an indirect interest in those securities. The Fund accounts for its investment in the affiliated Master Portfolio as a partnership investment and records on a daily basis its share of the affiliated Master Portfolio’s income, expense and realized and unrealized gains and losses. The financial statements of the affiliated Master Portfolio for the six months ended November 30, 2023 are included in this report and should be read in conjunction with the Fund’s financial statements.
2.
SIGNIFICANT ACCOUNTING POLICIES
The following significant accounting policies, which are consistently followed in the preparation of the financial statements of the Fund, are in conformity with U.S. generally accepted accounting principles which require management to make estimates and assumptions that affect the reported amounts of assets and liabilities, disclosure of contingent assets and liabilities at the date of the financial statements, and the reported amounts of income and expenses during the reporting period. Actual results could differ from those estimates.
Securities valuation
All investments are valued each business day as of the close of regular trading on the New York Stock Exchange (generally 4 p.m. Eastern Time), although the Fund may deviate from this calculation time under unusual or unexpected circumstances.
Investments in the affiliated Master Portfolio are valued daily based on the Fund’s proportionate share of the affiliated Master Portfolio’s net assets, which are also valued daily.
Investments which are not valued using the method discussed above are valued at their fair value, as determined in good faith by Allspring Funds Management, LLC (“Allspring Funds Management”), which was named the valuation designee by the Board of Trustees. As the valuation designee, Allspring Funds Management is responsible for day-to-day valuation activities for the Allspring Funds. In connection with these responsibilities, Allspring Funds Management has established a Valuation Committee and has delegated to it the authority to take any actions regarding the valuation of portfolio securities that the Valuation Committee deems necessary or appropriate, including determining the fair value of portfolio securities. On a quarterly basis, the Board of Trustees receives reports of valuation actions taken by the Valuation Committee. On at least an annual basis, the Board of Trustees receives an assessment of the adequacy and effectiveness of Allspring Funds Management’s process for determining the fair value of the portfolio of investments.
Investment transactions, income and expenses
Investments in the affiliated Master Portfolio are recorded on a trade date basis. The Fund records daily its proportionate share of the affiliated Master Portfolio’s income, expenses and realized and unrealized gains or losses. The Fund also accrues its own expenses.
Distributions to shareholders
Distributions to shareholders from net investment income and any net realized gains are recorded on the ex-dividend date and paid at least annually. Such distributions are determined in accordance with income tax regulations and may differ from U.S. generally accepted accounting principles. Dividend sources are estimated at the time of declaration. The tax character of distributions is determined as of the Fund’s fiscal year end. Therefore, a portion of the Fund’s distributions made prior to the Fund’s fiscal year end may be categorized as a tax return of capital at year end.
Federal and other taxes
The Fund intends to continue to qualify as a regulated investment company by distributing substantially all of its investment company taxable income and any net realized capital gains (after reduction for capital loss carryforwards) sufficient to relieve it from all, or substantially all, federal income taxes. Accordingly, no provision for federal income taxes was required.
The Fund’s income and federal excise tax returns and all financial records supporting those returns for the prior three fiscal years are subject to examination by the federal and Delaware revenue authorities. Management has analyzed the Fund’s tax positions taken on federal, state, and foreign tax returns, as applicable, for all open tax years and does not believe that there are any uncertain tax positions that require recognition of a tax liability.
18 | Allspring C&B Large Cap Value Fund
Notes to financial statements (unaudited)
As of November 30, 2023, the aggregate cost of all investments for federal income tax purposes was $176,402,690 and the unrealized gains (losses) consisted of:
Class allocations
The separate classes of shares offered by the Fund differ principally in applicable sales charges, distribution, shareholder servicing, and administration fees. Class specific expenses are charged directly to that share class. Investment income, common fund-level expenses, and realized and unrealized gains (losses) on investments are allocated daily to each class of shares based on the relative proportion of net assets of each class.
3.
FAIR VALUATION MEASUREMENTS
At November 30, 2023, the Fund’s investment in the affiliated Master Portfolio was measured at fair value using the net asset value per share (or its equivalent) as a practical expedient. The investment objective and fair value of the affiliated Master Portfolio is as follows:
Affiliated Master Portfolio | | Fair value of affiliated
Master Portfolio |
Allspring C&B Large Cap Value Portfolio | Seeks maximum long-term total return (current income and capital appreciation), consistent with minimizing risk to principal | |
The affiliated Master Portfolio does not have a redemption period notice, can be redeemed daily and does not have any unfunded commitments.
4.
TRANSACTIONS WITH AFFILIATES
Management fee
Allspring Funds Management, a wholly owned subsidiary of Allspring Global Investments Holdings, LLC, a holding company indirectly owned by certain private funds of GTCR LLC and Reverence Capital Partners, L.P., is the manager of the Fund and provides advisory and fund-level administrative services under an investment management agreement. Under the investment management agreement, Allspring Funds Management is responsible for, among other services, implementing the investment objectives and strategies of the Fund and providing fund-level administrative services in connection with the Fund’s operations. As long as the Fund continues to invest substantially all of its assets in a single affiliated Master Portfolio, the Fund pays Allspring Funds Management an investment management fee only for fund-level administrative services at the following annual rate based on the Fund’s average daily net assets:
For the six months ended November 30, 2023, the management fee was equivalent to an annual rate of 0.05% of the Fund’s average daily net assets.
Allspring Funds Management also serves as the adviser to the affiliated Master Portfolio and is entitled to receive a fee from the affiliated Master Portfolio for those services.
Administration fees
Under a class-level administration agreement, Allspring Funds Management provides class-level administrative services to the Fund, which includes paying fees and expenses for services provided by the transfer agent, sub-transfer agents, omnibus account servicers and record-keepers. As compensation for its services under the class-level administration agreement, Allspring Funds Management receives an annual fee which is calculated based on the average daily net assets of each class as follows:
| Class-level
administration fee |
| |
| |
| |
| |
| |
Prior to June 30, 2023, the class-level administration fee for Class A and Class C was 0.21% of its respective average daily net assets.
Allspring C&B Large Cap Value Fund | 19
Notes to financial statements (unaudited)
Waivers and/or expense reimbursements
Allspring Funds Management has contractually committed to waive and/or reimburse management and administration fees to the extent necessary to maintain certain net operating expense ratios for the Fund. When each class of the Fund has exceeded its expense cap, Allspring Funds Management will waive fees and/or reimburse expenses from fund-level expenses on a proportionate basis and then from class specific expenses. When only certain classes exceed their expense caps, waivers and/or reimbursements are applied against class specific expenses before fund-level expenses. Net expenses from the affiliated Master Portfolio are included in the expense caps. Allspring Funds Management has contractually committed through September 30, 2024 to waive fees and/or reimburse expenses to the extent necessary to cap the Fund’s expenses. Prior to or after the commitment expiration date, the caps may be increased or the commitment to maintain the cap may be terminated only with the approval of the Board of Trustees. As of November 30, 2023, the contractual expense caps are as follows:
Prior to June 30, 2023, the Fund’s expenses were capped at 1.08% for Class A shares and 1.83% for Class C shares.
Distribution fee
The Trust has adopted a distribution plan for Class C shares pursuant to Rule 12b-1 under the 1940 Act. A distribution fee is charged to Class C shares and paid to Allspring Funds Distributor, LLC (“Allspring Funds Distributor”), the principal underwriter, an affiliate of Allspring Funds Management, at an annual rate up to 0.75% of the average daily net assets of Class C shares.
In addition, Allspring Funds Distributor is entitled to receive the front-end sales charge from the purchase of Class A shares and a contingent deferred sales charge on the redemption of certain Class A shares. Allspring Funds Distributor is also entitled to receive the contingent deferred sales charges from redemptions of Class C shares. For the six months ended November 30, 2023, Allspring Funds Distributor received $213 from the sale of Class A shares. No contingent deferred sales charges were incurred by Class A and Class C shares for the six months ended November 30, 2023.
Shareholder servicing fees
The Trust has entered into contracts with one or more shareholder servicing agents, whereby Class A, Class C, and Administrator Class are charged a fee at an annual rate up to 0.25% of the average daily net assets of each respective class. A portion of these total shareholder servicing fees were paid to affiliates of the Fund.
5.
INVESTMENT PORTFOLIO TRANSACTIONS
The Fund seeks to achieve its investment objective by investing substantially all of its assets in the affiliated Master Portfolio. Purchases and sales have been calculated by multiplying the Fund’s ownership percentage of the affiliated Master Portfolio at the end of the period by the affiliated Master Portfolio’s purchases and sales. Purchases and sales of investments, excluding U.S. government obligations (if any) and short-term securities, for the six months ended November 30, 2023 were $20,904,904 and $33,194,622, respectively.
The Trust (excluding the money market funds), Allspring Master Trust and Allspring Variable Trust are parties to a $350,000,000 revolving credit agreement whereby the Fund is permitted to use bank borrowings for temporary or emergency purposes, such as to fund shareholder redemption requests. Interest under the credit agreement is charged to the Fund based on borrowing rate equal to the higher of the Federal Funds rate or the overnight bank funding rate in effect on that day plus a spread. In addition, an annual commitment fee based on the unused balance is allocated to each participating fund.
For the six months ended November 30, 2023, there were no borrowings by the Fund under the agreement.
Concentration risks result from exposure to a limited number of sectors. Through its investment in the affiliated Master Portfolio which may invest a substantial portion of its assets in any sectors, the Fund may in turn be more affected by changes in that sectors than a fund whose investments are not heavily weighted in any sectors. As of the end of the period, the Master Portfolio concentrated its portfolio in investments related to the financials sector.
Under the Fund’s organizational documents, the officers and Trustees have been granted certain indemnification rights against certain liabilities that may arise out of performance of their duties to the Fund. The Fund has entered into a separate agreement with each Trustee that converts indemnification rights currently existing under the Fund’s organizational documents into contractual rights that cannot be changed in the future without
20 | Allspring C&B Large Cap Value Fund
Notes to financial statements (unaudited)
the consent of the Trustee. Additionally, in the normal course of business, the Fund may enter into contracts with service providers that contain a variety of indemnification clauses. The Fund’s maximum exposure under these arrangements is dependent on future claims that may be made against the Fund and, therefore, cannot be estimated.
Allspring C&B Large Cap Value Fund | 21
Portfolio of investments—November 30, 2023 (unaudited)
| | | | | |
| | | | | | |
Communication services: 6.73% | | | | | | |
Diversified telecommunication services: 1.80% | | | | | | |
Verizon Communications, Inc. | | | | | | |
| | | | | | |
Warner Music Group Corp. Class A | | | | | | |
| | | | | | |
| | | | | | |
Consumer discretionary: 9.09% | | | | | | |
| | | | | | |
| | | | | | |
Household durables: 0.98% | | | | | | |
| | | | | | |
| | | | | | |
| | | | | | |
| | | | | | |
| | | | | | |
Textiles, apparel & luxury goods: 3.13% | | | | | | |
| | | | | | |
| | | | | | |
| | | | | | |
| | | | | | |
| | | | | | |
| | | | | | |
| | | | | | |
| | | | | | |
Personal care products: 2.78% | | | | | | |
| | | | | | |
| | | | | | |
| | | | | | |
| | | | | | |
Philip Morris International, Inc. | | | | | | |
| | | | | | |
Oil, gas & consumable fuels: 5.91% | | | | | | |
| | | | | | |
| | | | | | |
| | | | | | |
| | | | | | |
The accompanying notes are an integral part of these financial statements.
22 | Allspring C&B Large Cap Value Portfolio
Portfolio of investments—November 30, 2023 (unaudited)
| | | | | |
| | | | | | |
| | | | | | |
| | | | | | |
| | | | | | |
PNC Financial Services Group, Inc. | | | | | | |
| | | | | | |
| | | | | | |
| | | | | | |
| | | | | | |
| | | | | | |
London Stock Exchange Group PLC ADR | | | | | | |
| | | | | | |
| | | | | | |
| | | | | | |
Discover Financial Services | | | | | | |
Financial services: 1.86% | | | | | | |
Berkshire Hathaway, Inc. Class B† | | | | | | |
| | | | | | |
| | | | | | |
| | | | | | |
Fidelity National Financial, Inc. | | | | | | |
| | | | | | |
| | | | | | |
| | | | | | |
Health care equipment & supplies: 6.37% | | | | | | |
| | | | | | |
| | | | | | |
| | | | | | |
| | | | | | |
Health care providers & services: 4.15% | | | | | | |
| | | | | | |
Laboratory Corp. of America Holdings | | | | | | |
| | | | | | |
| | | | | | |
| | | | | | |
| | | | | | |
Aerospace & defense: 1.37% | | | | | | |
| | | | | | |
Commercial services & supplies: 1.97% | | | | | | |
| | | | | | |
The accompanying notes are an integral part of these financial statements.
Allspring C&B Large Cap Value Portfolio | 23
Portfolio of investments—November 30, 2023 (unaudited)
| | | | | |
Electrical equipment: 1.58% | | | | | | |
| | | | | | |
| | | | | | |
Stanley Black & Decker, Inc. | | | | | | |
Trading companies & distributors: 4.88% | | | | | | |
| | | | | | |
| | | | | | |
| | | | | | |
Information technology: 7.59% | | | | | | |
Electronic equipment, instruments & components: 4.49% | | | | | | |
| | | | | | |
| | | | | | |
| | | | | | |
| | | | | | |
| | | | | | |
| | | | | | |
Real estate management & development: 1.98% | | | | | | |
CBRE Group, Inc. Class A† | | | | | | |
Specialized REITs : 1.67% | | | | | | |
| | | | | | |
| | | | | | |
| | | | | | |
| | | | | | |
Total common stocks (Cost $200,272,495) | | | | | | |
| | | | | |
Short-term investments: 3.88% | | | | | | |
Investment companies: 3.88% | | | | | | |
Allspring Government Money Market Fund Select Class♠∞ | | | | | | |
Total short-term investments (Cost $10,122,147) | | | | | | |
Total investments in securities (Cost $210,394,642) | | | | | | |
Other assets and liabilities, net | | | | | | |
| | | | | | |
| Non-income-earning security |
| The issuer of the security is an affiliated person of the Portfolio as defined in the Investment Company Act of 1940. |
| The rate represents the 7-day annualized yield at period end. |
|
| American depositary receipt |
| Real estate investment trust |
The accompanying notes are an integral part of these financial statements.
24 | Allspring C&B Large Cap Value Portfolio
Portfolio of investments—November 30, 2023 (unaudited)
Investments in affiliates
An affiliated investment is an investment in which the Portfolio owns at least 5% of the outstanding voting shares of the issuer or as a result of other relationships, such as the Portfolio and the issuer having the same adviser or investment manager. Transactions with issuers that were affiliates of the Portfolio at the end of the period were as follows:
| | | | | Net
change in
unrealized
gains
(losses) | | | Income
from
affiliated
securities |
| | | | | | | | |
Allspring Government Money Market Fund Select Class | | | | | | | | |
The accompanying notes are an integral part of these financial statements.
Allspring C&B Large Cap Value Portfolio | 25
Statement of assets and liabilities—November 30, 2023 (unaudited)
Financial statements
Statement of assets and liabilities
| |
Investments in unaffiliated securities, at value (cost $200,272,495) | |
Investments in affiliated securities, at value (cost $10,122,147) | |
| |
Receivable for investments sold | |
Prepaid expenses and other assets | |
| |
| |
| |
Professional fees payable | |
Custody and accounting fees payable | |
Trustees’ fees and expenses payable | |
Accrued expenses and other liabilities | |
| |
| |
The accompanying notes are an integral part of these financial statements.
26 | Allspring C&B Large Cap Value Portfolio
Statement of operations—six months ended November 30, 2023 (unaudited)
Statement of operations
| |
Dividends (net of foreign withholdings taxes of $80,175) | |
Income from affiliated securities | |
| |
| |
| |
| |
Custody and accounting fees | |
| |
Interest holder report expenses | |
Trustees’ fees and expenses | |
| |
| |
Less: Fee waivers and/or expense reimbursements | |
| |
| |
Realized and unrealized gains (losses) on investments | |
Net realized gains on investments | |
Net change in unrealized gains (losses) on investments | |
Net realized and unrealized gains (losses) on investments | |
Net increase in net assets resulting from operations | |
The accompanying notes are an integral part of these financial statements.
Allspring C&B Large Cap Value Portfolio | 27
Statement of changes in net assets
Statement of changes in net assets
|
Six months ended
November 30, 2023 (unaudited) | |
| | | | |
| | | | |
Net realized gains on investments | | | | |
Net change in unrealized gains (losses) on investments | | | | |
Net increase (decrease) in net assets resulting from operations | | | | |
| | | | |
Transactions in investors’ beneficial interests | | | | |
| | | | |
| | | | |
Net decrease in net assets resulting from capital transactions | | | | |
Total increase (decrease) in net assets | | | | |
| | | | |
| | | | |
| | | | |
The accompanying notes are an integral part of these financial statements.
28 | Allspring C&B Large Cap Value Portfolio
| Six months ended
November 30, 2023
(unaudited) | |
| | | | | |
| | | | | | |
Ratios to average net assets (annualized) | | | | | | |
| | | | | | |
| | | | | | |
| | | | | | |
| | | | | | |
| | | | | | |
| Returns for periods of less than one year are not annualized. |
| Net expense ratios reflect voluntary waivers, if any. |
The accompanying notes are an integral part of these financial statements.
Allspring C&B Large Cap Value Portfolio | 29
Notes to financial statements (unaudited)
Notes to financial statements
Allspring Master Trust (the “Trust”), a Delaware statutory trust organized on March 10, 1999, is an open-end management investment company registered under the Investment Company Act of 1940, as amended (the “1940 Act”). As an investment company, the Trust follows the accounting and reporting guidance in Financial Accounting Standards Board (“FASB”) Accounting Standards Codification Topic 946, Financial Services – Investment Companies. These financial statements report on the Allspring C&B Large Cap Value Portfolio (the “Portfolio”) which is a diversified series of the Trust.
Interests in the Portfolio are available solely through private placement transactions that do not involve any “public offering” within the meaning of Section 4(a)(2) of the Securities Act of 1933.
2.
SIGNIFICANT ACCOUNTING POLICIES
The following significant accounting policies, which are consistently followed in the preparation of the financial statements of the Portfolio, are in conformity with U.S. generally accepted accounting principles which require management to make estimates and assumptions that affect the reported amounts of assets and liabilities, disclosure of contingent assets and liabilities at the date of the financial statements, and the reported amounts of income and expenses during the reporting period. Actual results could differ from those estimates.
Securities valuation
All investments are valued each business day as of the close of regular trading on the New York Stock Exchange (generally 4 p.m. Eastern Time), although the Portfolio may deviate from this calculation time under unusual or unexpected circumstances.
Equity securities and exchange-traded funds that are listed on a foreign or domestic exchange or market are valued at the official closing price or, if none, the last sales price.
Investments in registered open-end investment companies (other than those listed on a foreign or domestic exchange or market) are valued at net asset value.
Investments which are not valued using the methods discussed above are valued at their fair value, as determined in good faith by Allspring Funds Management, LLC (“Allspring Funds Management”), which was named the valuation designee by the Board of Trustees. As the valuation designee, Allspring Funds Management is responsible for day-to-day valuation activities for the Allspring Funds. In connection with these responsibilities, Allspring Funds Management has established a Valuation Committee and has delegated to it the authority to take any actions regarding the valuation of portfolio securities that the Valuation Committee deems necessary or appropriate, including determining the fair value of portfolio securities. On a quarterly basis, the Board of Trustees receives reports of valuation actions taken by the Valuation Committee. On at least an annual basis, the Board of Trustees receives an assessment of the adequacy and effectiveness of Allspring Funds Management’s process for determining the fair value of the portfolio of investments.
Security transactions and income recognition
Securities transactions are recorded on a trade date basis. Realized gains or losses are recorded on the basis of identified cost.
Dividend income is recognized on the ex-dividend date. Dividend income is recorded net of foreign taxes withheld where recovery of such taxes is not assured.
Interest earned on cash balances held at the custodian is recorded as interest income.
Distributions received from REIT investments may be characterized as ordinary income, capital gains, or a return of capital to the Portfolio based on information provided by the REIT. The proper characterization of REIT distributions is generally not known until after the end of each calendar year. As such, estimates may be used in reporting the character of income and distributions for financial statement purposes.
Federal and other taxes
The Portfolio is not required to pay federal income taxes on its net investment income and net capital gains as it is treated as a partnership for federal income tax purposes. All income, gains and losses of the Portfolio are deemed to have been “passed through” to the interest holders in proportion to their holdings of the Portfolio regardless of whether income and gains have been distributed by the Portfolio.
The Portfolio’s income tax returns and all financial records supporting those returns for the prior three fiscal years are subject to examination by the federal revenue authority. Management has analyzed the Portfolio’s tax positions taken on federal, state, and foreign tax returns, as applicable, for all open tax years and does not believe that there are any uncertain tax positions that require recognition of a tax liability.
As of November 30, 2023, the aggregate cost of all investments for federal income tax purposes was $210,817,277 and the unrealized gains (losses) consisted of:
30 | Allspring C&B Large Cap Value Portfolio
Notes to financial statements (unaudited)
3.
FAIR VALUATION MEASUREMENTS
Fair value measurements of investments are determined within a framework that has established a fair value hierarchy based upon the various data inputs utilized in determining the value of the Portfolio’s investments. The three-level hierarchy gives the highest priority to unadjusted quoted prices in active markets for identical assets or liabilities (Level 1) and the lowest priority to unobservable inputs (Level 3). The Portfolio’s investments are classified within the fair value hierarchy based on the lowest level of input that is significant to the fair value measurement. The inputs are summarized into three broad levels as follows:
•Level 1—quoted prices in active markets for identical securities
•Level 2—other significant observable inputs (including quoted prices for similar securities, interest rates, prepayment speeds, credit risk, etc.)
•Level 3—significant unobservable inputs (including the Portfolio’s own assumptions in determining the fair value of investments)
The inputs or methodologies used for valuing investments in securities are not necessarily an indication of the risk associated with investing in those securities.
The following is a summary of the inputs used in valuing the Portfolio’s assets and liabilities as of November 30, 2023:
| | Other significant
observable inputs
(Level 2) | Significant
unobservable inputs
(Level 3) | |
| | | | |
| | | | |
| | | | |
| | | | |
| | | | |
| | | | |
| | | | |
| | | | |
| | | | |
| | | | |
| | | | |
| | | | |
| | | | |
| | | | |
| | | | |
| | | | |
Additional sector, industry or geographic detail, if any, is included in the Portfolio of Investments.
At November 30, 2023, the Portfolio did not have any transfers into/out of Level 3.
4.
TRANSACTIONS WITH AFFILIATES AND OTHER EXPENSES
Advisory fee
The Trust has entered into an advisory contract with Allspring Funds Management, a wholly owned subsidiary of Allspring Global Investments Holdings, LLC, a holding company indirectly owned by certain private funds of GTCR LLC and Reverence Capital Partners, L.P. The adviser is responsible for implementing investment policies and guidelines and for supervising the subadviser, who is responsible for day-to-day portfolio management of the Portfolio. Pursuant to the contract, Allspring Funds Management is entitled to receive an advisory fee at the following annual rate based on the Portfolio’s average daily net assets:
Allspring C&B Large Cap Value Portfolio | 31
Notes to financial statements (unaudited)
For the six months ended November 30, 2023, the advisory fee was equivalent to an annual rate of 0.65% of the Portfolio’s average daily net assets.
Allspring Funds Management has retained the services of a subadviser to provide daily portfolio management to the Portfolio. The fee for subadvisory services is borne by Allspring Funds Management. Cooke & Bieler, L.P., which is not an affiliate of Allspring Funds Management, is the subadviser to the Portfolio and is entitled to receive a fee from Allspring Funds Management at an annual rate starting at 0.38% and declining to 0.30% as the average daily net assets of the Fund increase.
Allspring Funds Management has voluntarily waived and/or reimbursed advisory fees to reduce the net operating expense ratio of the Portfolio. These voluntary waivers may be discontinued at any time.
Interfund transactions
The Portfolio may purchase or sell portfolio investment securities to certain affiliates pursuant to Rule 17a-7 under the 1940 Act and under procedures adopted by the Board of Trustees. The procedures have been designed to ensure that these interfund transactions, which do not incur broker commissions, are effected at current market prices. Pursuant to these procedures, the Portfolio did not have any interfund transactions during the six months ended November 30, 2023.
5.
INVESTMENT PORTFOLIO TRANSACTIONS
Purchases and sales of investments, excluding U.S. government obligations (if any) and short-term securities, for the six months ended November 30, 2023 were $26,351,366 and $41,883,302, respectively.
The Trust, along with Allspring Variable Trust and Allspring Funds Trust (excluding the money market funds), are parties to a $350,000,000 revolving credit agreement whereby the Portfolio is permitted to use bank borrowings for temporary or emergency purposes, such as to fund interest holders withdrawal requests. Interest under the credit agreement is charged to the Portfolio based on borrowing rate equal to the higher of the Federal Funds rate or the overnight bank funding rate in effect on that day plus a spread. In addition, an annual commitment fee based on the unused balance is allocated to each participating fund.
For the six months ended November 30, 2023, there were no borrowings by the Portfolio under the agreement.
As of the end of the period, the Portfolio concentrated its portfolio of investments in the financials sector. A fund that invests a substantial portion of its assets in any sector may be more affected by changes in that sector than would be a fund whose investments are not heavily weighted in any sector.
Under the Portfolio’s organizational documents, the officers and Trustees have been granted certain indemnification rights against certain liabilities that may arise out of performance of their duties to the Portfolio. The Portfolio has entered into a separate agreement with each Trustee that converts indemnification rights currently existing under the Portfolio’s organizational documents into contractual rights that cannot be changed in the future without the consent of the Trustee. Additionally, in the normal course of business, the Portfolio may enter into contracts with service providers that contain a variety of indemnification clauses. The Portfolio’s maximum exposure under these arrangements is dependent on future claims that may be made against the Portfolio and, therefore, cannot be estimated.
32 | Allspring C&B Large Cap Value Portfolio
Other information (unaudited)
Other information
Proxy voting information
A description of the policies and procedures used to determine how to vote proxies relating to portfolio securities is available without charge, upon request, by calling 1-866-259-3305, visiting our website at allspringglobal.com, or visiting the SEC website at sec.gov. Information regarding how the proxies related to portfolio securities were voted during the most recent 12-month period ended June 30 is available on the website at allspringglobal.com or by visiting the SEC website at sec.gov.
Quarterly portfolio holdings information
The Fund and Portfolio file their complete schedule of portfolio holdings with the SEC for the first and third quarters of each fiscal year as an exhibit to their reports on Form N-PORT. Shareholders and Interest holders may view the filed Form N-PORT by visiting the SEC website at sec.gov.
Allspring C&B Large Cap Value Fund | 33
Other information (unaudited)
Board of trustees and officers
Each of the Trustees and Officers listed in the table below acts in identical capacities for each fund in the Allspring family of funds, which consists of 126 mutual funds comprising the Allspring Funds Trust, Allspring Variable Trust, Allspring Master Trust and four closed-end funds (collectively the “Fund Complex”). This table should be read in conjunction with the Prospectus and the Statement of Additional Information†. The mailing address of each Trustee and Officer is 1415 Vantage Park Drive, 3rd Floor, Charlotte, NC 28203. Each Trustee and Officer serves an indefinite term, however, each Trustee serves such term until reaching the mandatory retirement age established by the Trustees.
Independent Trustees
| | Principal occupations during past five years or longer | Current other
public company or
investment
company
directorships |
William R. Ebsworth
(Born 1957) | | Retired. From 1984 to 2013, equities analyst, portfolio manager, research director and chief investment officer at Fidelity Management and Research Company in Boston, Tokyo, and Hong Kong, and retired in 2013 as Chief Investment Officer of Fidelity Strategic Advisers, Inc. where he led a team of investment professionals managing client assets. Prior thereto, Board member of Hong Kong Securities Clearing Co., Hong Kong Options Clearing Corp., the Thailand International Fund, Ltd., Fidelity Investments Life Insurance Company, and Empire Fidelity Investments Life Insurance Company. Serves on the Investment Company Institute’s Board of Governors since 2022 and Executive Committee since 2023 as well as the Vice Chairman of the Governing Council of the Independent Directors Council since 2023. Audit Committee Chair and Investment Committee Chair of the Vincent Memorial Hospital Foundation (non-profit organization). Mr. Ebsworth is a CFA charterholder. | |
Jane A. Freeman
(Born 1953) | Trustee,
since 2015;
Chair Liaison,
| Retired. From 2012 to 2014 and 1999 to 2008, Chief Financial Officer of Scientific Learning Corporation. From 2008 to 2012, Ms. Freeman provided consulting services related to strategic business projects. Prior to 1999, Portfolio Manager at Rockefeller & Co. and Scudder, Stevens & Clark. Board member of the Harding Loevner Funds from 1996 to 2014, serving as both Lead Independent Director and chair of the Audit Committee. Board member of the Russell Exchange Traded Funds Trust from 2011 to 2012 and the chair of the Audit Committee. Ms. Freeman is also an inactive Chartered Financial Analyst. | |
Isaiah Harris, Jr.
(Born 1952) | Trustee,
since 2009;
Audit Committee Chair,
since 2019 | Retired. Member of the Advisory Board of CEF of East Central Florida. Chairman of the Board of CIGNA Corporation from 2009 to 2021, and Director from 2005 to 2008. From 2003 to 2011, Director of Deluxe Corporation. Prior thereto, President and CEO of BellSouth Advertising and Publishing Corp. from 2005 to 2007, President and CEO of BellSouth Enterprises from 2004 to 2005 and President of BellSouth Consumer Services from 2000 to 2003. Emeritus member of the Iowa State University Foundation Board of Governors. Emeritus Member of the Advisory board of Iowa State University School of Business. Advisory Board Member, Palm Harbor Academy (private school). Advisory Board Member, Fellowship of Christian Athletes. Mr. Harris is a certified public accountant (inactive status). | |
David F. Larcker
(Born 1950) | | Distinguished Visiting Fellow at the Hoover Institution since 2022. James Irvin Miller Professor of Accounting at the Graduate School of Business (Emeritus), Stanford University, Director of the Corporate Governance Research Initiative and Senior Faculty of The Rock Center for Corporate Governance since 2006. From 2005 to 2008, Professor of Accounting at the Graduate School of Business, Stanford University. Prior thereto, Ernst & Young Professor of Accounting at The Wharton School, University of Pennsylvania from 1985 to 2005. | |
Olivia S. Mitchell
(Born 1953) | | International Foundation of Employee Benefit Plans Professor since 1993, Wharton School of the University of Pennsylvania. Director of Wharton’s Pension Research Council and Boettner Center on Pensions & Retirement Research, and Research Associate at the National Bureau of Economic Research. Previously taught at Cornell University from 1978 to 1993. | |
Timothy J. Penny
(Born 1951) | Trustee,
since 1996;
Chair,
since 2018 | President and Chief Executive Officer of Southern Minnesota Initiative Foundation, a non-profit organization, since 2007. Vice Chair of the Economic Club of Minnesota, since 2007. Co-Chair of the Committee for a Responsible Federal Budget, since 1995. Member of the Board of Trustees of NorthStar Education Finance, Inc., a non-profit organization, from 2007-2022. Senior Fellow of the University of Minnesota Humphrey Institute from 1995 to 2017. | |
* Length of service dates reflect the Trustee’s commencement of service with the Trust’s predecessor entities, where applicable.
# Ms. Freeman will serve as Chair Liaison through June 2024, at which time Ms. Wheelock will assume the role.
†
The Statement of Additional Information includes additional information about the Trustees and is available, without charge, upon request, by calling 1-800-222-8222 or by visiting the website at allspringglobal.com.
34 | Allspring C&B Large Cap Value Fund
Other information (unaudited)
| Position held and length of service* | Principal occupations during past five years or longer | Current other public company or investment company directorships |
James G. Polisson
(Born 1959) | Trustee,
since 2018; Nominating and Governance Committee Chair, since 2024 | Retired. Chief Marketing Officer, Source (ETF) UK Services, Ltd, from 2015 to 2017. From 2012 to 2015, Principal of The Polisson Group, LLC, a management consulting, corporate advisory and principal investing company. Chief Executive Officer and Managing Director at Russell Investments, Global Exchange Traded Funds from 2010 to 2012. Managing Director of Barclays Global Investors from 1998 to 2010 and Global Chief Marketing Officer for iShares and Barclays Global Investors from 2000 to 2010. Trustee of the San Francisco Mechanics’ Institute, a non- profit organization, from 2013 to 2015. Board member of the Russell Exchange Traded Fund Trust from 2011 to 2012. Director of Barclays Global Investors Holdings Deutschland GmbH from 2006 to 2009. Mr. Polisson is an attorney and has a retired status with the Massachusetts and District of Columbia Bar Associations. | |
Pamela Wheelock
(Born 1959) | Trustee,
since January 2020;
previously Trustee from
January 2018 to
| Retired. Executive and Senior Financial leadership positions in the public, private and nonprofit sectors. Interim President and CEO, McKnight Foundation, 2020. Interim Commissioner, Minnesota Department of Human Services, 2019. Chief Operating Officer, Twin Cities Habitat for Humanity, 2017-2019. Vice President for University Services, University of Minnesota, 2012- 2016. Interim President and CEO, Blue Cross and Blue Shield of Minnesota, 2011-2012. Executive Vice-President and Chief Financial Officer, Minnesota Wild, 2002-2008. Commissioner, Minnesota Department of Finance, 1999-2002. Chair of the Board of Directors of Destination Medical Center Corporation. Board member of the Minnesota Wild Foundation. | |
* Length of service dates reflect the Trustee’s commencement of service with the Trust’s predecessor entities, where applicable.
# Ms. Freeman will serve as Chair Liaison through June 2024, at which time Ms. Wheelock will assume the role.
Allspring C&B Large Cap Value Fund | 35
Other information (unaudited)
Officers1
| Position held and
length of service | Principal occupations during past five years or longer |
| | President and Chief Executive Officer of Allspring Funds Management, LLC since 2017 and Head of Global Fund Governance of Allspring Global Investments since 2022. Prior thereto, co-president of Galliard Capital Management, LLC, an affiliate of Allspring Funds Management, LLC, from 2019 to 2022 and Head of Affiliated Managers, Allspring Global Investments, from 2014 to 2019 and Executive Vice President responsible for marketing, investments and product development for Allspring Funds Management, LLC, from 2009 to 2014. |
Jeremy DePalma
(Born 1974) | Treasurer,
since 2012
(for certain funds in
the Fund Complex);
since 2021 (for
the remaining funds in the Complex) | Senior Vice President of Allspring Funds Management, LLC since 2009. Senior Vice President of Evergreen Investment Management Company, LLC from 2008 to 2010 and head of the Fund Reporting and Control Team within Fund Administration from 2005 to 2010. |
Christopher Baker
(Born 1976) | Chief Compliance Officer,
since 2022 | Global Chief Compliance Officer for Allspring Global Investments since 2022. Prior thereto, Chief Compliance Officer for State Street Global Advisors from 2018 to 2021. Senior Compliance Officer for the State Street divisions of Alternative Investment Solutions, Sector Solutions, and Global Marketing from 2015 to 2018. From 2010 to 2015 Vice President, Global Head of Investment and Marketing Compliance for State Street Global Advisors. |
Matthew Prasse
(Born 1983) | Chief Legal Officer,
since 2022;
Secretary,
since 2021 | Senior Counsel of the Allspring Legal Department since 2021. Senior Counsel of the Wells Fargo Legal Department from 2018 to 2021. Previously, Counsel for Barings LLC from 2015 to 2018. Prior to joining Barings, Associate at Morgan, Lewis & Bockius LLP from 2008 to 2015. |
1 For those Officers with tenures at Allspring Global Investments and/or Allspring Funds Management, LLC that began prior to 2021, such tenures include years of service during which these businesses/entities were known as Wells Fargo Asset Management and Wells Fargo Funds Management, LLC, respectively.
36 | Allspring C&B Large Cap Value Fund
For more information
More information about Allspring Funds is available free upon request. To obtain literature, please write, visit the Fund’s website, or call:
Allspring Funds
P.O. Box 219967
Kansas City, MO 64121-9967
Website: allspringglobal.com
Individual investors: 1-800-222-8222
Retail investment professionals: 1-888-877-9275
Institutional investment professionals: 1-800-260-5969
This report and the financial statements contained herein are submitted for the general information of the shareholders of the Fund. If this report is used for promotional purposes, distribution of the report must be accompanied or preceded by a current prospectus. Before investing, please consider the investment objectives, risks, charges, and expenses of the investment. For a current prospectus and, if available, a summary prospectus, containing this information, call 1-800-222-8222 or visit the Fund’s website at allspringglobal.com. Read the prospectus carefully before you invest or send money.
Allspring Global InvestmentsTM is the trade name for the asset management firms of Allspring Global Investments Holdings, LLC, a holding company indirectly owned by certain private funds of GTCR LLC and Reverence Capital Partners, L.P. These firms include but are not limited to Allspring Global Investments, LLC, and Allspring Funds Management, LLC. Certain products managed by Allspring entities are distributed by Allspring Funds Distributor, LLC (a broker-dealer and Member FINRA/SIPC).
This material is for general informational and educational purposes only and is NOT intended to provide investment advice or a recommendation of any kind - including a recommendation for any specific investment, strategy, or plan.
© 2024 Allspring Global Investments Holdings, LLC. All rights reserved.
ALL-12052023-siyxhwho 01-24
SAR1863 11-23
Semi-Annual Report
November 30, 2023
The views expressed and any forward-looking statements are as of November 30, 2023, unless otherwise noted, and are those of the Fund’s portfolio managers and/or Allspring Global Investments. Discussions of individual securities or the markets generally are not intended as individual recommendations. Future events or results may vary significantly from those expressed in any forward-looking statements. The views expressed are subject to change at any time in response to changing circumstances in the market. Allspring Global Investments disclaims any obligation to publicly update or revise any views expressed or forward-looking statements.
Allspring Core Bond Fund | 1
Letter to shareholders (unaudited)
Andrew Owen
President
Allspring Funds
Dear Shareholder:
We are pleased to offer you this semi-annual report for the Allspring Core Bond Fund for the six-month period that ended November 30, 2023. Globally, stocks and bonds experienced high levels of volatility during the period. The market was focused on the impact of ongoing aggressive central bank rate hikes on persistently high inflation. As inflation finally gradually declined, anticipation rose over an end to the central bank monetary tightening cycle. For the six-month period, domestic U.S. and global stocks and bonds had positive overall results, with U.S. stocks leading the way. After suffering deep and broad losses through 2022, bonds now benefit from a base of higher yields that can help generate higher income.
For the period, U.S. stocks, based on the S&P 500 Index,1 returned 10.17%. International stocks, as measured by the MSCI ACWI ex USA Index (Net),2 gained 5.07% while the MSCI EM Index (Net) (USD)3 returned 4.60%. Among bond indexes, the Bloomberg U.S. Aggregate Bond Index4 returned -0.80%, the Bloomberg Global Aggregate ex-USD Index (unhedged)5 gained 0.63%, the Bloomberg Municipal Bond Index6 returned 2.29%, and the ICE BofA U.S. High Yield Index7 returned 5.53%.
Affected by high inflation and central bank rate hikes, markets were volatile.
The six-month period began in June with the Federal Reserve’s (Fed’s) first pause on interest rate hikes since March 2022, when it began its aggressive campaign to rein in inflation. However, the Core Consumer Price Index (CPI)8, while continuing to decline, remained stubbornly high in June at 4.8%—well above the Fed’s 2.0% target rate. With the U.S. unemployment rate still at 3.6%, near a historical low, and U.S. payrolls continuing to grow in June, expectations of more Fed rate hikes were reinforced. However, U.S. and global stocks had strong returns in June.
July was a good month for stocks, while bonds had more muted but positive monthly returns overall. More volatile sectors and regions tended to do well, as investors grew more optimistic regarding economic prospects. With strong second quarter gross domestic product growth—initially estimated at 2.4%—and U.S. annual inflation easing steadily to 3.2% in July, hopes for a soft economic landing grew. The Fed, the European Central Bank (ECB), and the Bank of England (BoE) all raised their respective key interest rates by 0.25% in July. In the Fed’s case, speculation grew that it could be very close to the end of its tightening cycle. Meanwhile, China’s economy showed signs of stagnation, renewing concerns of global fallout.
“ With strong
second-quarter gross
domestic product
growth—initially
estimated at 2.4%—and
U.S. annual inflation easing steadily to 3.2%
in July, hopes for a soft
economic landing grew. ”
1
The S&P 500 Index consists of 500 stocks chosen for market size, liquidity, and industry group representation. It is a market-value-weighted index with each stock’s weight in the index proportionate to its market value. You cannot invest directly in an index.
2
The Morgan Stanley Capital International (MSCI) All Country World Index (ACWI) ex USA Index (Net) is a free-float-adjusted market-capitalization-weighted index that is designed to measure the equity market performance of developed and emerging markets, excluding the U.S. Source: MSCI. MSCI makes no express or implied warranties or representations and shall have no liability whatsoever with respect to any MSCI data contained herein. The MSCI data may not be further redistributed or used as a basis for other indexes or any securities or financial products. This report is not approved, reviewed, or produced by MSCI. You cannot invest directly in an index.
3
The MSCI Emerging Markets (EM) Index (Net) (USD) is a free-float-adjusted market-capitalization-weighted index that is designed to measure the equity market performance of emerging markets. You cannot invest directly in an index.
4
The Bloomberg U.S. Aggregate Bond Index is a broad-based benchmark that measures the investment-grade, U.S.-dollar-denominated, fixed-rate taxable bond market, including Treasuries, government-related and corporate securities, mortgage-backed securities (agency fixed-rate and hybrid adjustable-rate mortgage pass-throughs), asset-backed securities, and commercial mortgage-backed securities. You cannot invest directly in an index.
5
The Bloomberg Global Aggregate ex-USD Index (unhedged) is an unmanaged index that provides a broad-based measure of the global investment-grade fixed income markets excluding the U.S.-dollar-denominated debt market. You cannot invest directly in an index.
6
The Bloomberg Municipal Bond Index is an unmanaged index composed of long-term tax-exempt bonds with a minimum credit rating of Baa. You cannot invest directly in an index.
7
The ICE BofA U.S. High Yield Index is a market-capitalization-weighted index of domestic and Yankee high yield bonds. The index tracks the performance of high yield securities traded in the U.S. bond market. You cannot invest directly in an index. Copyright 2024. ICE Data Indices, LLC. All rights reserved.
8
The Core Consumer Price Index (CPI) is a measure of the average change over time in the prices paid by urban consumers for a market basket of consumer goods and services excluding energy and food prices. You cannot invest directly in an index.
2 | Allspring Core Bond Fund
Letter to shareholders (unaudited)
Stocks retreated in August while monthly bond returns were flat overall. Increased global market volatility reflected unease over the Chinese property market being stressed along with weak Chinese economic data. However, speculation grew over a possible end to the Fed’s campaign of interest rate increases or at least a pause in September. U.S. economic data generally remained solid, with resilient job market data and inflation ticking up slightly in August, as the annual CPI1 rose 3.7%. However, the three-month trend for Core CPI stood at an annualized 2.4%.
Stocks and bonds both had negative overall returns in September as investors reluctantly recited the new chorus of “higher for longer,” led by the Fed’s determination not to lower interest rates until it knows it has vanquished its pesky opponent—higher-than-targeted inflation. As of September, the two primary gauges of U.S. inflation—the annual Core Personal Consumption Expenditures Price Index2 and the CPI—both stood at roughly 4%, twice as high as the Fed’s oft-stated 2% target. The month ended with the prospect of yet another U.S. government shutdown, averted at least temporarily.
October was a tough month for financial markets overall. Key global indexes were pushed down by rising geopolitical tensions—particularly the Israel-Hamas conflict, and concerns over the Fed’s “higher for longer” monetary policy. The U.S. 10-year Treasury yield rose above 5% for the first time since 2007. Commodity prices did well as oil prices rallied in response to the prospect of oil supply disruptions from the Middle East. U.S. annualized third quarter GDP was estimated at a healthier-than-anticipated 4.9%. China’s GDP indicated surprisingly strong industrial production and retail sales, offset by ongoing weakness in its real estate sector.
In November, the market mood turned positive as cooling inflation inspired confidence that central banks could hold off on further rate hikes. Overall annual inflation in the U.S. fell to 3.1% in November while 12-month inflation in the U.K. and eurozone eased to 4.6% and 2.4%, respectively—far below their peak levels of mid-2022. Third quarter annualized U.S. GDP growth was raised to an estimated 5.2% while U.S. job totals rose by just below 200,000 in November, indicating a slight cooling of the labor market. All of this fresh evidence added to confidence for a U.S. soft economic landing, leading to a more buoyant mood heading into winter as the Federal Open Market Committee held rates steady at its November meeting.
1
The CPI is a measure of the average change over time in the prices paid by urban consumers for a market basket of consumer goods and services. You cannot invest directly in an index.
2
The Core Personal Consumption Expenditures Price Index (PCE) is a measure of prices that people living in the United States, or those buying on their behalf, pay for goods and services. It is sometimes called the core PCE price index, because two categories that can have price swings – food and energy – are left out to make underlying inflation easier to see. You cannot invest directly in an index.
Allspring Core Bond Fund | 3
Letter to shareholders (unaudited)
For further information about your fund, contact your investment professional, visit our website at allspringglobal.com, or call us directly at 1-800-222-8222.
Don’t let short-term uncertainty derail long-term investment goals.
Periods of investment uncertainty can present challenges, but experience has taught us that maintaining long-term investment goals can be an effective way to plan for the future. To help you create a sound strategy based on your personal goals and risk tolerance, Allspring Funds offers more than 100 mutual funds spanning a wide range of asset classes and investment styles. Although diversification cannot guarantee an investment profit or prevent losses, we believe it can be an effective way to manage investment risk and potentially smooth out overall portfolio performance. We encourage investors to know their investments and to understand that appropriate levels of risk-taking may unlock opportunities.
Thank you for choosing to invest with Allspring Funds. We appreciate your confidence in us and remain committed to helping you meet your financial needs.
Sincerely,
Andrew Owen
President
Allspring Funds
4 | Allspring Core Bond Fund
Letter to shareholders (unaudited)
|
Beginning in July 2024, the Fund will be required by the Securities and Exchange Commission to send shareholders a paper copy of a new tailored shareholder report in place of the full shareholder report that you are now receiving. The tailored shareholder report will contain concise information about the Fund, including certain expense and performance information and fund statistics. If you wish to receive this new tailored shareholder report electronically, please follow the instructions on the back cover of this report. |
Other information that is currently included in the shareholder report, such as the Fund’s financial statements, will be available online and upon request, free of charge, in paper or electronic format. |
Allspring Core Bond Fund | 5
Performance highlights (unaudited)
Performance highlights
| The Fund seeks total return, consisting of income and capital appreciation. |
| Allspring Funds Management, LLC |
Subadviser for the affiliated master portfolio* | Allspring Global Investments, LLC |
| Maulik Bhansali, CFA, Jarad Vasquez |
Average annual total returns (%) as of November 30, 2023 |
| | | | |
| | | | | | | | | |
| | | | | | | | | |
| | | | | | | | | |
| | | | | | | | | |
Administrator Class (MNTRX) | | | | | | | | | |
Institutional Class (MBFIX) | | | | | | | | | |
Bloomberg U.S. Aggregate Bond Index3 | | | | | | | | | |
Figures quoted represent past performance, which is no guarantee of future results, and do not reflect taxes that a shareholder may pay on an investment in a fund. Investment return and principal value of an investment will fluctuate so that an investor’s shares, when redeemed, may be worth more or less than their original cost. Performance shown without sales charges would be lower if sales charges were reflected. Current performance may be lower or higher than the performance data quoted, which assumes the reinvestment of dividends and capital gains. Current month-end performance is available on the Fund’s website, allspringglobal.com.
Index returns do not include transaction costs associated with buying and selling securities, any mutual fund fees or expenses, or any taxes. It is not possible to invest directly in an index.
For Class A shares, the maximum front-end sales charge is 4.50%. For Class C shares, the maximum contingent deferred sales charge is 1.00%. Performance including a contingent deferred sales charge assumes the sales charge for the corresponding time period. Class R6, Administrator Class and Institutional Class shares are sold without a front-end sales charge or contingent deferred sales charge.
|
| Reflects the expense ratios as stated in the most recent prospectuses. The expense ratios shown are subject to change and may differ from the annualized expense ratios shown in the Financial Highlights of this report. |
| The manager has contractually committed through September 30, 2024, to waive fees and/or reimburse expenses to the extent necessary to cap total annual fund operating expenses after fee waivers at 0.70% for Class A, 1.45% for Class C, 0.33% for Class R6, 0.65% for Administrator Class and 0.38% for Institutional Class. Brokerage commissions, stamp duty fees, interest, taxes, acquired fund fees and expenses (if any) from funds in which the affiliated master portfolio invests, and extraordinary expenses are excluded from the expense caps. Net expenses from the affiliated master portfolio are included in the expense caps. Prior to or after the commitment expiration date, the caps may be increased or the commitment to maintain the caps may be terminated only with the approval of the Board of Trustees. Without these caps, the Fund’s returns would have been lower. The expense ratio paid by an investor is the net expense ratio (the total annual fund operating expenses after fee waivers) as stated in the prospectuses. |
| The Bloomberg U.S. Aggregate Bond Index is a broad-based benchmark that measures the investment-grade, U.S.–dollar–denominated, fixed-rate taxable bond market, including Treasuries, government-related and corporate securities, mortgage-backed securities (agency fixed-rate and hybrid adjustable-rate mortgage pass-throughs), asset-backed securities, and commercial mortgage-backed securities. You cannot invest directly in an index. |
Bond values fluctuate in response to the financial condition of individual issuers, general market and economic conditions, and changes in interest rates. Changes in market conditions and government policies may lead to periods of heightened volatility in the bond market and reduced liquidity for certain bonds held by the Fund. In general, when interest rates rise, bond values fall and investors may lose principal value. Interest rate changes and their impact on the Fund and its share price can be sudden and unpredictable. The use of derivatives may reduce returns and/or increase volatility. Certain investment strategies tend to increase the total risk of an investment (relative to the broader market). Securities issued by U.S. government agencies or government sponsored entities may not be guaranteed by the U.S. Treasury. This fund is exposed to foreign investment risk and mortgage-and asset-backed securities risk. Consult the Fund’s prospectus for additional information on these and other risks.
| The Fund is a feeder fund in a master-feeder structure that invests substantially all of its assets in a single affiliated master portfolio of the Allspring Master Trust with a substantially identical investment objective and substantially similar investment strategies. References to the investment activities of the Fund are intended to refer to the investment activities of the affiliated master portfolio in which it invests. |
CFA® and Chartered Financial Analyst® are trademarks owned by CFA Institute. |
6 | Allspring Core Bond Fund
Performance highlights (unaudited)
Ten largest holdings (%) as of November 30, 20231 |
U.S. Treasury Notes, 4.88%, 10-31-2028 | |
| |
U.S. Treasury Notes, 4.63%, 11-15-2026 | |
U.S. Treasury Bonds, 1.38%, 11-15-2040 | |
U.S. Treasury Notes, 3.25%, 6-30-2029 | |
| |
U.S. Treasury Bonds, 1.13%, 8-15-2040 | |
U.S. Treasury Notes, 5.00%, 9-30-2025 | |
U.S. Treasury Notes, 4.38%, 11-30-2028 | |
U.S. Treasury Notes, 4.50%, 11-15-2033 | |
| Each holding represents the Fund’s allocable portion of the affiliated master portfolio security. Figures represent each holding as a percentage of the Fund’s net assets. Holdings are subject to change and may have changed since the date specified. |
Portfolio allocation as of November 30, 20231 |
| Figures represent the portfolio allocation of the affiliated master portfolio as a percentage of the long-term investments of the affiliated master portfolio. Allocations are subject to change and may have changed since the date specified. |
Allspring Core Bond Fund | 7
Fund expenses (unaudited)
Fund expenses
As a shareholder of the Fund, you incur two types of costs: (1) transaction costs, including sales charges (loads) on purchase payments and contingent deferred sales charges (if any) on redemptions and (2) ongoing costs, including management fees, distribution (12b-1) and/or shareholder servicing fees, and other Fund expenses. This example is intended to help you understand your ongoing costs (in dollars) of investing in the Fund and to compare these costs with the ongoing costs of investing in other mutual funds.
The example is based on an investment of $1,000 invested at the beginning of the six-month period and held for the entire period from June 1, 2023 to November 30, 2023.
Actual expenses
The “Actual” line of the table below provides information about actual account values and actual expenses. You may use the information in this line, together with the amount you invested, to estimate the expenses that you paid over the period. Simply divide your account value by $1,000 (for example, an $8,600 account value divided by $1,000= 8.6), then multiply the result by the number in the “Actual” line under the heading entitled “Expenses paid during period” for your applicable class of shares to estimate the expenses you paid on your account during this period.
Hypothetical example for comparison purposes
The “Hypothetical” line of the table below provides information about hypothetical account values and hypothetical expenses based on the Fund’s actual expense ratio and an assumed rate of return of 5% per year before expenses, which is not the Fund’s actual return. The hypothetical account values and expenses may not be used to estimate the actual ending account balance or expenses you paid for the period. You may use this information to compare the ongoing costs of investing in the Fund and other funds. To do so, compare this 5% hypothetical example with the 5% hypothetical examples that appear in the shareholder reports of the other funds.
Please note that the expenses shown in the table are meant to highlight your ongoing costs only and do not reflect any transactional costs, such as sales charges (loads) and contingent deferred sales charges. Therefore, the “Hypothetical” line of the table is useful in comparing ongoing costs only, and will not help you determine the relative total costs of owning different funds. In addition, if these transactional costs were included, your costs would have been higher.
| Beginning
account value
6-1-2023 | Ending
account value
11-30-2023 | | |
| | | | |
| | | | |
Hypothetical (5% return before expenses) | | | | |
| | | | |
| | | | |
Hypothetical (5% return before expenses) | | | | |
| | | | |
| | | | |
Hypothetical (5% return before expenses) | | | | |
| | | | |
| | | | |
Hypothetical (5% return before expenses) | | | | |
| | | | |
| | | | |
Hypothetical (5% return before expenses) | | | | |
| Expenses paid is equal to the annualized net expense ratio of each class multiplied by the average account value over the period, multiplied by 183 divided by 366 (to reflect the one-half-year period). |
| Amounts reflect net expenses allocated from the affiliated Master Portfolio in which the Fund invests. |
8 | Allspring Core Bond Fund
Portfolio of investments—November 30, 2023 (unaudited)
| | | | | |
Investment companies: 100.00% | | | | | | |
Affiliated master portfolio: 100.00% | | | | | | |
Allspring Core Bond Portfolio | | | | | | |
Total investment companies (Cost $4,801,528,971) | | | | | | |
Total investments in securities (Cost $4,801,528,971) | | | | | | |
Other assets and liabilities, net | | | | | | |
| | | | | | |
Transactions with the affiliated Master Portfolio were as follows:
| % of
ownership,
beginning
of period | % of
ownership,
end of
period | Net realized
gains
(losses) on
investments
allocated
from
affiliated
Master
Portfolio | Net
change in
unrealized
gains
(losses) on
investments
allocated
from
affiliated
Master
Portfolio | Affiliated
Income
Allocated
from
affiliated
Master
Portfolio | Interest
allocated
from
affiliated
Master
Portfolio | |
Allspring Core Bond Portfolio | | | | | | | |
The accompanying notes are an integral part of these financial statements.
Allspring Core Bond Fund | 9
Statement of assets and liabilities—November 30, 2023 (unaudited)
Financial statements
Statement of assets and liabilities
| |
Investments in affiliated Master Portfolio, at value (cost $4,801,528,971) | |
Receivable for Fund shares sold | |
| |
Prepaid expenses and other assets | |
| |
| |
Payable for Fund shares redeemed | |
| |
Administration fees payable | |
Distribution fees payable | |
Trustees’ fees and expenses payable | |
Accrued expenses and other liabilities | |
| |
| |
| |
| |
| |
| |
Computation of net asset value and offering price per share | |
| |
Shares outstanding–Class A1 | |
Net asset value per share–Class A | |
Maximum offering price per share – Class A2 | |
| |
Shares outstanding–Class C1 | |
Net asset value per share–Class C | |
| |
Shares outstanding–Class R61 | |
Net asset value per share–Class R6 | |
Net assets–Administrator Class | |
Shares outstanding–Administrator Class1 | |
Net asset value per share–Administrator Class | |
Net assets–Institutional Class | |
Shares outstanding–Institutional Class1 | |
Net asset value per share–Institutional Class | |
1 The Fund has an unlimited number of authorized shares.
2 Maximum offering price is computed as 100/95.50 of net asset value. On investments of $50,000 or more, the offering price is reduced.
The accompanying notes are an integral part of these financial statements.
10 | Allspring Core Bond Fund
Statement of operations—six months ended November 30, 2023 (unaudited)
Statement of operations
| |
Interest allocated from affiliated Master Portfolio | |
Affiliated income allocated from affiliated Master Portfolio | |
Expenses allocated from affiliated Master Portfolio | |
Waivers allocated from affiliated Master Portfolio | |
| |
| |
| |
| |
| |
| |
| |
| |
| |
| |
| |
Shareholder servicing fees | |
| |
| |
| |
| |
| |
| |
| |
| |
Custody and accounting fees | |
| |
| |
Shareholder report expenses | |
Trustees’ fees and expenses | |
| |
| |
Less: Fee waivers and/or expense reimbursements | |
| |
| |
| |
Realized and unrealized gains (losses) on investments | |
Net realized losses on investments allocated from affiliated Master Portfolio | |
Net change in unrealized gains (losses) on investments allocated from affiliated Master Portfolio | |
Net realized and unrealized gains (losses) on investments | |
Net decrease in net assets resulting from operations | |
1 For the period from June 1, 2023 to June 16, 2023. Effective at the close of business on June 16, 2023, Class R and Class R4 shares each became Class A and Institutional Class shares of the Fund, respectively, in a tax-free conversion. Shareholders of Class R and Class R4 shares received Class A and Institutional Class shares, respectively, at a value equal to the value of their respective shares immediately prior to the conversion. Class R and Class R4 shares are no longer offered by the Fund.
The accompanying notes are an integral part of these financial statements.
Allspring Core Bond Fund | 11
Statement of changes in net assets
Statement of changes in net assets
|
Six months ended
November 30, 2023 (unaudited) | |
| | | | |
| | | | |
Net realized losses on investments | | | | |
Net change in unrealized gains (losses) on investments | | | | |
Net decrease in net assets resulting from operations | | | | |
Distributions to shareholders from | | | | |
Net investment income and net realized gains | | | | |
| | | | |
| | | | |
| | | | |
| | | | |
| | | | |
| | | | |
| | | | |
Total distributions to shareholders | | | | |
Capital share transactions | | | | |
Proceeds from shares sold | | | | |
| | | | |
| | | | |
| | | | |
| | | | |
| | | | |
| | | | |
| | | | |
| | | | |
Reinvestment of distributions | | | | |
| | | | |
| | | | |
| | | | |
| | | | |
| | | | |
| | | | |
| | | | |
| | | | |
1 For the period from June 1, 2023 to June 16, 2023
The accompanying notes are an integral part of these financial statements.
12 | Allspring Core Bond Fund
Statement of changes in net assets
| Six months ended November 30, 2023 (unaudited) | |
| | | | |
Payment for shares redeemed | | | | |
| | | | |
| | | | |
| | | | |
| | | | |
| | | | |
| | | | |
| | | | |
| | | | |
| | | | |
| | | | |
| | | | |
| | | | |
| | | | |
| | | | |
Net increase in net assets resulting from capital share transactions | | | | |
Total increase (decrease) in net assets | | | | |
| | | | |
| | | | |
| | | | |
1 For the period from June 1, 2023 to June 16, 2023
2 Effective at the close of business on June 16, 2023, Class R and Class R4 shares each became Class A and Institutional Class shares of the Fund, respectively, in a tax-free conversion. Shareholders of Class R and Class R4 shares received Class A and Institutional Class shares, respectively, at a value equal to the value of their respective shares immediately prior to the conversion. Class R and Class R4 shares are no longer offered by the Fund.
The accompanying notes are an integral part of these financial statements.
Allspring Core Bond Fund | 13
Financial highlights
(For a share outstanding throughout each period)
| Six months ended
November 30, 2023
(unaudited) | |
| | | | | |
Net asset value, beginning of period | | | | | | |
| | | | | | |
Net realized and unrealized gains (losses) on investments | | | | | | |
Total from investment operations | | | | | | |
Distributions to shareholders from | | | | | | |
| | | | | | |
| | | | | | |
Total distributions to shareholders | | | | | | |
Net asset value, end of period | | | | | | |
| | | | | | |
Ratios to average net assets (annualized)* | | | | | | |
| | | | | | |
| | | | | | |
| | | | | | |
| | | | | | |
| | | | | | |
Net assets, end of period (000s omitted) | | | | | | |
| Ratios include net expenses allocated from the affiliated Master Portfolio which were as follows: |
Six months ended November 30, 2023 (unaudited) | |
| |
| |
| |
| |
| |
| Calculated based upon average shares outstanding |
| Total return calculations do not include any sales charges. Returns for periods of less than one year are not annualized. |
| Portfolio turnover rate is calculated by multiplying the affiliated Master Portfolio’s percentage of the Fund’s total investment in securities at the end of the period by the affiliated Master Portfolio’s portfolio turnover rate. |
The accompanying notes are an integral part of these financial statements.
14 | Allspring Core Bond Fund
(For a share outstanding throughout each period)
| Six months ended
November 30, 2023
(unaudited) | |
| | | | | |
Net asset value, beginning of period | | | | | | |
| | | | | | |
Net realized and unrealized gains (losses) on investments | | | | | | |
Total from investment operations | | | | | | |
Distributions to shareholders from | | | | | | |
| | | | | | |
| | | | | | |
Total distributions to shareholders | | | | | | |
Net asset value, end of period | | | | | | |
| | | | | | |
Ratios to average net assets (annualized)* | | | | | | |
| | | | | | |
| | | | | | |
| | | | | | |
| | | | | | |
| | | | | | |
Net assets, end of period (000s omitted) | | | | | | |
| Ratios include net expenses allocated from the affiliated Master Portfolio which were as follows: |
Six months ended November 30, 2023 (unaudited) | |
| |
| |
| |
| |
| |
| Calculated based upon average shares outstanding |
| Total return calculations do not include any sales charges. Returns for periods of less than one year are not annualized. |
| Portfolio turnover rate is calculated by multiplying the affiliated Master Portfolio’s percentage of the Fund’s total investment in securities at the end of the period by the affiliated Master Portfolio’s portfolio turnover rate. |
The accompanying notes are an integral part of these financial statements.
Allspring Core Bond Fund | 15
(For a share outstanding throughout each period)
| Six months ended
November 30, 2023
(unaudited) | |
| | | | | |
Net asset value, beginning of period | | | | | | |
| | | | | | |
Net realized and unrealized gains (losses) on investments | | | | | | |
Total from investment operations | | | | | | |
Distributions to shareholders from | | | | | | |
| | | | | | |
| | | | | | |
Total distributions to shareholders | | | | | | |
Net asset value, end of period | | | | | | |
| | | | | | |
Ratios to average net assets (annualized)* | | | | | | |
| | | | | | |
| | | | | | |
| | | | | | |
| | | | | | |
| | | | | | |
Net assets, end of period (000s omitted) | | | | | | |
| Ratios include net expenses allocated from the affiliated Master Portfolio which were as follows: |
Six months ended November 30, 2023 (unaudited) | |
| |
| |
| |
| |
| |
| Calculated based upon average shares outstanding |
| Returns for periods of less than one year are not annualized. |
| Portfolio turnover rate is calculated by multiplying the affiliated Master Portfolio’s percentage of the Fund’s total investment in securities at the end of the period by the affiliated Master Portfolio’s portfolio turnover rate. |
The accompanying notes are an integral part of these financial statements.
16 | Allspring Core Bond Fund
(For a share outstanding throughout each period)
| Six months ended
November 30, 2023
(unaudited) | |
| | | | | |
Net asset value, beginning of period | | | | | | |
| | | | | | |
Net realized and unrealized gains (losses) on investments | | | | | | |
Total from investment operations | | | | | | |
Distributions to shareholders from | | | | | | |
| | | | | | |
| | | | | | |
Total distributions to shareholders | | | | | | |
Net asset value, end of period | | | | | | |
| | | | | | |
Ratios to average net assets (annualized)* | | | | | | |
| | | | | | |
| | | | | | |
| | | | | | |
| | | | | | |
| | | | | | |
Net assets, end of period (000s omitted) | | | | | | |
| Ratios include net expenses allocated from the affiliated Master Portfolio which were as follows: |
Six months ended November 30, 2023 (unaudited) | |
| |
| |
| |
| |
| |
| Calculated based upon average shares outstanding |
| Returns for periods of less than one year are not annualized. |
| Portfolio turnover rate is calculated by multiplying the affiliated Master Portfolio’s percentage of the Fund’s total investment in securities at the end of the period by the affiliated Master Portfolio’s portfolio turnover rate. |
The accompanying notes are an integral part of these financial statements.
Allspring Core Bond Fund | 17
(For a share outstanding throughout each period)
| Six months ended
November 30, 2023
(unaudited) | |
| | | | | |
Net asset value, beginning of period | | | | | | |
| | | | | | |
Net realized and unrealized gains (losses) on investments | | | | | | |
Total from investment operations | | | | | | |
Distributions to shareholders from | | | | | | |
| | | | | | |
| | | | | | |
Total distributions to shareholders | | | | | | |
Net asset value, end of period | | | | | | |
| | | | | | |
Ratios to average net assets (annualized)* | | | | | | |
| | | | | | |
| | | | | | |
| | | | | | |
| | | | | | |
| | | | | | |
Net assets, end of period (000s omitted) | | | | | | |
| Ratios include net expenses allocated from the affiliated Master Portfolio which were as follows: |
Six months ended November 30, 2023 (unaudited) | |
| |
| |
| |
| |
| |
| Calculated based upon average shares outstanding |
| Returns for periods of less than one year are not annualized. |
| Portfolio turnover rate is calculated by multiplying the affiliated Master Portfolio’s percentage of the Fund’s total investment in securities at the end of the period by the affiliated Master Portfolio’s portfolio turnover rate. |
The accompanying notes are an integral part of these financial statements.
18 | Allspring Core Bond Fund
Notes to financial statements (unaudited)
Notes to financial statements
Allspring Funds Trust (the “Trust”), a Delaware statutory trust organized on March 10, 1999, is an open-end management investment company registered under the Investment Company Act of 1940, as amended (the “1940 Act”). As an investment company, the Trust follows the accounting and reporting guidance in Financial Accounting Standards Board (“FASB”) Accounting Standards Codification Topic 946, Financial Services – Investment Companies. These financial statements report on the Allspring Core Bond Fund (the “Fund”) which is a diversified series of the Trust.
The Fund is a feeder fund in a master-feeder structure that invests substantially all of its assets in a single master portfolio with a substantially identical investment objective and substantially similar investment strategies. The Fund invests in Allspring Core Bond Portfolio, a separate diversified portfolio (the “affiliated Master Portfolio”) of Allspring Master Trust, a registered open-end management investment company. As of November 30, 2023, the Fund owned 96.45% of Allspring Core Bond Portfolio. The affiliated Master Portfolio directly acquires portfolio securities and the Fund acquires an indirect interest in those securities. The Fund accounts for its investment in the affiliated Master Portfolio as a partnership investment and records on a daily basis its share of the affiliated Master Portfolio’s income, expense and realized and unrealized gains and losses. The financial statements of the affiliated Master Portfolio for the six months ended November 30, 2023 are included in this report and should be read in conjunction with the Fund’s financial statements.
Effective at the close of business on June 16, 2023, Class R and Class R4 shares each became Class A and Institutional Class shares, respectively, of the Fund in a tax-free conversion. Shareholders of Class R and Class R4 shares received Class A and Institutional Class shares, respectively, at a value equal to the value of their respective shares immediately prior to the conversion. Class R and Class R4 shares are no longer offered by the Fund.
2.
SIGNIFICANT ACCOUNTING POLICIES
The following significant accounting policies, which are consistently followed in the preparation of the financial statements of the Fund, are in conformity with U.S. generally accepted accounting principles which require management to make estimates and assumptions that affect the reported amounts of assets and liabilities, disclosure of contingent assets and liabilities at the date of the financial statements, and the reported amounts of income and expenses during the reporting period. Actual results could differ from those estimates.
Securities valuation
All investments are valued each business day as of the close of regular trading on the New York Stock Exchange (generally 4 p.m. Eastern Time), although the Fund may deviate from this calculation time under unusual or unexpected circumstances.
Investments in the affiliated Master Portfolio are valued daily based on the Fund’s proportionate share of the affiliated Master Portfolio’s net assets, which are also valued daily.
Investments which are not valued using the method discussed above are valued at their fair value, as determined in good faith by Allspring Funds Management, LLC (“Allspring Funds Management”), which was named the valuation designee by the Board of Trustees. As the valuation designee, Allspring Funds Management is responsible for day-to-day valuation activities for the Allspring Funds. In connection with these responsibilities, Allspring Funds Management has established a Valuation Committee and has delegated to it the authority to take any actions regarding the valuation of portfolio securities that the Valuation Committee deems necessary or appropriate, including determining the fair value of portfolio securities. On a quarterly basis, the Board of Trustees receives reports of valuation actions taken by the Valuation Committee. On at least an annual basis, the Board of Trustees receives an assessment of the adequacy and effectiveness of Allspring Funds Management’s process for determining the fair value of the portfolio of investments.
Investment transactions, income and expenses
Investments in the affiliated Master Portfolio are recorded on a trade date basis. The Fund records daily its proportionate share of the affiliated Master Portfolio’s income, expenses and realized and unrealized gains or losses. The Fund also accrues its own expenses.
Distributions to shareholders
Distributions to shareholders from net investment income are declared daily and paid monthly. Distributions from net realized gains, if any, are recorded on the ex-dividend date and paid at least annually. Such distributions are determined in accordance with income tax regulations and may differ from U.S. generally accepted accounting principles. Dividend sources are estimated at the time of declaration. The tax character of distributions is determined as of the Fund’s fiscal year end. Therefore, a portion of the Fund’s distributions made prior to the Fund’s fiscal year end may be categorized as a tax return of capital at year end.
Federal and other taxes
The Fund intends to continue to qualify as a regulated investment company by distributing substantially all of its investment company taxable income and any net realized capital gains (after reduction for capital loss carryforwards) sufficient to relieve it from all, or substantially all, federal income taxes. Accordingly, no provision for federal income taxes was required.
Allspring Core Bond Fund | 19
Notes to financial statements (unaudited)
The Fund’s income and federal excise tax returns and all financial records supporting those returns for the prior three fiscal years are subject to examination by the federal and Delaware revenue authorities. Management has analyzed the Fund’s tax positions taken on federal, state, and foreign tax returns, as applicable, for all open tax years and does not believe that there are any uncertain tax positions that require recognition of a tax liability.
As of November 30, 2023, the aggregate cost of all investments for federal income tax purposes was $4,819,896,858 and the unrealized gains (losses) consisted of:
As of May 31, 2023, the Fund had capital loss carryforwards which consist of $289,890,334 in short-term capital losses and $202,741,889 in long-term capital losses.
Class allocations
The separate classes of shares offered by the Fund differ principally in applicable sales charges, distribution, shareholder servicing, and administration fees. Class specific expenses are charged directly to that share class. Investment income, common fund-level expenses, and realized and unrealized gains (losses) on investments are allocated daily to each class of shares based on the relative proportion of net assets of each class.
3.
FAIR VALUATION MEASUREMENTS
At November 30, 2023, the affiliated Master Portfolio was measured at fair value using the net asset value per share (or its equivalent) as a practical expedient. The investment objective and fair value of the affiliated Master Portfolio is as follows:
Affiliated Master Portfolio | | Fair value of affiliated
Master Portfolio |
Allspring Core Bond Portfolio | Seeks total return, consisting of income and capital appreciation | |
The affiliated Master Portfolio does not have a redemption period notice, can be redeemed daily and does not have any unfunded commitments.
4.
TRANSACTIONS WITH AFFILIATES
Management fee
Allspring Funds Management, a wholly owned subsidiary of Allspring Global Investments Holdings, LLC, a holding company indirectly owned by certain private funds of GTCR LLC and Reverence Capital Partners, L.P., is the manager of the Fund and provides advisory and fund-level administrative services under an investment management agreement. Under the investment management agreement, Allspring Funds Management is responsible for, among other services, implementing the investment objectives and strategies of the Fund and providing fund-level administrative services in connection with the Fund’s operations. As long as the Fund continues to invest substantially all of its assets in a single affiliated Master Portfolio, the Fund pays Allspring Funds Management an investment management fee only for fund-level administrative services at the following annual rate based on the Fund’s average daily net assets:
For the six months ended November 30, 2023, the management fee was equivalent to an annual rate of 0.05% of the Fund’s average daily net assets.
Allspring Funds Management also serves as the adviser to the affiliated Master Portfolio and is entitled to receive a fee from the affiliated Master Portfolio for those services.
Administration fees
Under a class-level administration agreement, Allspring Funds Management provides class-level administrative services to the Fund, which includes paying fees and expenses for services provided by the transfer agent, sub-transfer agents, omnibus account servicers and record-keepers. As
20 | Allspring Core Bond Fund
Notes to financial statements (unaudited)
compensation for its services under the class-level administration agreement, Allspring Funds Management receives an annual fee which is calculated based on the average daily net assets of each class as follows:
| Class-level
administration fee |
| |
| |
| |
| |
| |
| |
| |
Prior to June 30, 2023, the class-level administration fee for Class A and Class C was 0.16% of its respective average daily net assets.
Waivers and/or expense reimbursements
Allspring Funds Management has contractually committed to waive and/or reimburse management and administration fees to the extent necessary to maintain certain net operating expense ratios for the Fund. When each class of the Fund has exceeded its expense cap, Allspring Funds Management will waive fees and/or reimburse expenses from fund-level expenses on a proportionate basis and then from class specific expenses. When only certain classes exceed their expense caps, waivers and/or reimbursements are applied against class specific expenses before fund-level expenses. Net expenses from the affiliated Master Portfolio are included in the expense caps. Allspring Funds Management has contractually committed through September 30, 2024 to waive fees and/or reimburse expenses to the extent necessary to cap the Fund’s expenses. Prior to or after the commitment expiration date, the caps may be increased or the commitment to maintain the cap may be terminated only with the approval of the Board of Trustees. As of November 30, 2023, the contractual expense caps are as follows:
Prior to June 30, 2023, the Fund’s expenses were capped at 0.71% for Class A shares and 1.46% for Class C shares.
Distribution fees
The Trust has adopted a distribution plan for Class C and Class R shares pursuant to Rule 12b-1 under the 1940 Act. Distribution fees are charged to Class C and Class R shares and paid to Allspring Funds Distributor, LLC (“Allspring Funds Distributor”), the principal underwriter, an affiliate of Allspring Funds Management, at an annual rate up to 0.75% of the average daily net assets of Class C shares and up to 0.25% of the average daily net assets of Class R shares.
In addition, Allspring Funds Distributor is entitled to receive the front-end sales charge from the purchase of Class A shares and a contingent deferred sales charge on the redemption of certain Class A shares. Allspring Funds Distributor is also entitled to receive the contingent deferred sales charges from redemptions of Class C shares. For the six months ended November 30, 2023, Allspring Funds Distributor received $1,523 from the sale of Class A shares. No contingent deferred sales charges were incurred by Class A and Class C shares for the six months ended November 30, 2023.
Shareholder servicing fees
The Trust has entered into contracts with one or more shareholder servicing agents, whereby Class A, Class C, Class R, and Administrator Class are charged a fee at an annual rate up to 0.25% of the average daily net assets of each respective class. Class R4 is charged a fee at an annual rate up to 0.10% of its average daily net assets. A portion of these total shareholder servicing fees were paid to affiliates of the Fund.
5.
INVESTMENT PORTFOLIO TRANSACTIONS
The Fund seeks to achieve its investment objective by investing substantially all of its assets in a single affiliated Master Portfolio. Purchases and sales have been calculated by multiplying the Fund’s ownership percentage of the affiliated Master Portfolio at the end of the period by the affiliated Master
Allspring Core Bond Fund | 21
Notes to financial statements (unaudited)
Portfolio’s purchases and sales. Purchases and sales of investments, excluding short-term securities, for the six months ended November 30, 2023 were as follows:
The Trust (excluding the money market funds), Allspring Master Trust and Allspring Variable Trust are parties to a $350,000,000 revolving credit agreement whereby the Fund is permitted to use bank borrowings for temporary or emergency purposes, such as to fund shareholder redemption requests. Interest under the credit agreement is charged to the Fund based on borrowing rate equal to the higher of the Federal Funds rate or the overnight bank funding rate in effect on that day plus a spread. In addition, an annual commitment fee based on the unused balance is allocated to each participating fund.
For the six months ended November 30, 2023, there were no borrowings by the Fund under the agreement.
Under the Fund’s organizational documents, the officers and Trustees have been granted certain indemnification rights against certain liabilities that may arise out of performance of their duties to the Fund. The Fund has entered into a separate agreement with each Trustee that converts indemnification rights currently existing under the Fund’s organizational documents into contractual rights that cannot be changed in the future without the consent of the Trustee. Additionally, in the normal course of business, the Fund may enter into contracts with service providers that contain a variety of indemnification clauses. The Fund’s maximum exposure under these arrangements is dependent on future claims that may be made against the Fund and, therefore, cannot be estimated.
22 | Allspring Core Bond Fund
Portfolio of investments—November 30, 2023 (unaudited)
| | | | | |
Agency securities: 43.89% | | | | | | |
| | | | | | |
| | | | | | |
| | | | | | |
| | | | | | |
| | | | | | |
| | | | | | |
| | | | | | |
| | | | | | |
| | | | | | |
| | | | | | |
| | | | | | |
| | | | | | |
| | | | | | |
| | | | | | |
| | | | | | |
| | | | | | |
| | | | | | |
| | | | | | |
| | | | | | |
| | | | | | |
| | | | | | |
| | | | | | |
| | | | | | |
| | | | | | |
| | | | | | |
| | | | | | |
| | | | | | |
| | | | | | |
| | | | | | |
| | | | | | |
| | | | | | |
| | | | | | |
| | | | | | |
| | | | | | |
| | | | | | |
| | | | | | |
| | | | | | |
FHLMC STRIPS Series 264 Class 30 | | | | | | |
FHLMC STRIPS Series 271 Class F5 (30 Day Average U.S. SOFR+0.61%)± | | | | | | |
FHLMC STRIPS Series 272 Class F1 (30 Day Average U.S. SOFR+0.61%)± | | | | | | |
FHLMC STRIPS Series 280 Class F1 (30 Day Average U.S. SOFR+0.61%)± | | | | | | |
FHLMC (30 Day Average U.S. SOFR+2.13%)± | | | | | | |
FHLMC (30 Day Average U.S. SOFR+2.13%)± | | | | | | |
FHLMC (30 Day Average U.S. SOFR+2.14%)± | | | | | | |
FHLMC (30 Day Average U.S. SOFR+2.22%)± | | | | | | |
The accompanying notes are an integral part of these financial statements.
Allspring Core Bond Portfolio | 23
Portfolio of investments—November 30, 2023 (unaudited)
| | | | | |
Agency securities(continued) | | | | | | |
FHLMC (30 Day Average U.S. SOFR+2.30%)± | | | | | | |
FHLMC (30 Day Average U.S. SOFR+2.30%)± | | | | | | |
FHLMC (30 Day Average U.S. SOFR+2.38%)± | | | | | | |
| | | | | | |
| | | | | | |
| | | | | | |
| | | | | | |
| | | | | | |
| | | | | | |
| | | | | | |
| | | | | | |
| | | | | | |
| | | | | | |
| | | | | | |
| | | | | | |
| | | | | | |
| | | | | | |
| | | | | | |
| | | | | | |
| | | | | | |
FHLMC Series 1897 Class K | | | | | | |
FHLMC Series 2015-8 Class AP | | | | | | |
FHLMC Series 2017-78 Class FC (30 Day Average U.S. SOFR+0.46%)± | | | | | | |
FHLMC Series 3924 Class NC | | | | | | |
FHLMC Series 4047 Class CX | | | | | | |
FHLMC Series 4091 Class BX | | | | | | |
FHLMC Series 4091 Class EX | | | | | | |
FHLMC Series 4117 Class HB | | | | | | |
FHLMC Series 4122 Class FP (30 Day Average U.S. SOFR+0.51%)± | | | | | | |
FHLMC Series 4205 Class PA | | | | | | |
FHLMC Series 4240 Class FA (30 Day Average U.S. SOFR+0.61%)± | | | | | | |
FHLMC Series 4248 Class FT (30 Day Average U.S. SOFR+0.61%)± | | | | | | |
FHLMC Series 4286 Class VF (30 Day Average U.S. SOFR+0.56%)± | | | | | | |
FHLMC Series 4446 Class CP | | | | | | |
FHLMC Series 4582 Class HA | | | | | | |
FHLMC Series 4614 Class FG (30 Day Average U.S. SOFR+0.61%)± | | | | | | |
FHLMC Series 4628 Class KF (30 Day Average U.S. SOFR+0.61%)± | | | | | | |
FHLMC Series 4631 Class FA (30 Day Average U.S. SOFR+0.61%)± | | | | | | |
FHLMC Series 4719 Class LM | | | | | | |
FHLMC Series 4719 Class LA | | | | | | |
FHLMC Series 4742 Class PA | | | | | | |
FHLMC Series 4793 Class FD (30 Day Average U.S. SOFR+0.41%)± | | | | | | |
FHLMC Series 4826 Class KF (30 Day Average U.S. SOFR+0.41%)± | | | | | | |
FHLMC Series 4857 Class JA | | | | | | |
The accompanying notes are an integral part of these financial statements.
24 | Allspring Core Bond Portfolio
Portfolio of investments—November 30, 2023 (unaudited)
| | | | | |
Agency securities(continued) | | | | | | |
FHLMC Series 4880 Class DA | | | | | | |
FHLMC Series 4903 Class NF (30 Day Average U.S. SOFR+0.51%)± | | | | | | |
FHLMC Series 4927 Class BG | | | | | | |
FHLMC Series 4937 Class MD | | | | | | |
FHLMC Series 4941 Class GA | | | | | | |
FHLMC Series 4957 Class MY | | | | | | |
FHLMC Series 4979 Class UC | | | | | | |
FHLMC Series 4990 Class FN (30 Day Average U.S. SOFR+0.46%)± | | | | | | |
FHLMC Series 4993 Class KF (30 Day Average U.S. SOFR+0.56%)± | | | | | | |
FHLMC Series 5004 Class FM (30 Day Average U.S. SOFR+0.46%)± | | | | | | |
FHLMC Series 5020 Class ET | | | | | | |
FHLMC Series 5091 Class AB | | | | | | |
FHLMC Series 5092 Class HE | | | | | | |
FHLMC Series 5116 Class PB | | | | | | |
FHLMC Series 5118 Class CA | | | | | | |
FHLMC Series 5119 Class AB | | | | | | |
FHLMC Series 5119 Class QF (30 Day Average U.S. SOFR+0.20%)± | | | | | | |
FHLMC Series 5143 Class GA | | | | | | |
FHLMC Series 5156 Class DC | | | | | | |
FHLMC Series 5159 Class UA | | | | | | |
FHLMC Series 5178 Class TP | | | | | | |
FHLMC Series 5182 Class D | | | | | | |
FHLMC Series 5182 Class M | | | | | | |
FHLMC Series 5184 Class AB | | | | | | |
FHLMC Series 5194 Class G | | | | | | |
FHLMC Series 5201 Class CA | | | | | | |
FHLMC Series 5202 Class BH | | | | | | |
FHLMC Series 5202 Class LA | | | | | | |
FHLMC Series 5203 Class G | | | | | | |
FHLMC Series 5206 Class CD | | | | | | |
FHLMC Series 5207 Class PA | | | | | | |
FHLMC Series 5209 Class EA | | | | | | |
FHLMC Series 5209 Class EJ | | | | | | |
FHLMC Series 5210 Class DC | | | | | | |
FHLMC Series 5217 Class CD | | | | | | |
FHLMC Series 5220 Class QK | | | | | | |
FHLMC Series 5228 Class TN | | | | | | |
FHLMC Series 5300 Class C | | | | | | |
FHLMC Series 5335 Class FB (30 Day Average U.S. SOFR+0.81%)± | | | | | | |
FHLMC Series 5338 Class FH (30 Day Average U.S. SOFR+0.41%)± | | | | | | |
| | | | | | |
| | | | | | |
The accompanying notes are an integral part of these financial statements.
Allspring Core Bond Portfolio | 25
Portfolio of investments—November 30, 2023 (unaudited)
| | | | | |
Agency securities(continued) | | | | | | |
| | | | | | |
| | | | | | |
| | | | | | |
| | | | | | |
| | | | | | |
| | | | | | |
| | | | | | |
| | | | | | |
| | | | | | |
| | | | | | |
| | | | | | |
| | | | | | |
| | | | | | |
| | | | | | |
| | | | | | |
| | | | | | |
| | | | | | |
| | | | | | |
| | | | | | |
| | | | | | |
| | | | | | |
| | | | | | |
| | | | | | |
| | | | | | |
| | | | | | |
| | | | | | |
| | | | | | |
| | | | | | |
| | | | | | |
| | | | | | |
| | | | | | |
| | | | | | |
| | | | | | |
| | | | | | |
| | | | | | |
| | | | | | |
| | | | | | |
| | | | | | |
| | | | | | |
| | | | | | |
| | | | | | |
| | | | | | |
| | | | | | |
| | | | | | |
| | | | | | |
| | | | | | |
| | | | | | |
| | | | | | |
The accompanying notes are an integral part of these financial statements.
26 | Allspring Core Bond Portfolio
Portfolio of investments—November 30, 2023 (unaudited)
| | | | | |
Agency securities(continued) | | | | | | |
| | | | | | |
| | | | | | |
| | | | | | |
| | | | | | |
| | | | | | |
| | | | | | |
| | | | | | |
| | | | | | |
| | | | | | |
| | | | | | |
| | | | | | |
| | | | | | |
| | | | | | |
| | | | | | |
| | | | | | |
| | | | | | |
| | | | | | |
| | | | | | |
| | | | | | |
| | | | | | |
| | | | | | |
| | | | | | |
| | | | | | |
| | | | | | |
| | | | | | |
| | | | | | |
| | | | | | |
| | | | | | |
| | | | | | |
| | | | | | |
| | | | | | |
| | | | | | |
| | | | | | |
| | | | | | |
| | | | | | |
| | | | | | |
| | | | | | |
| | | | | | |
| | | | | | |
| | | | | | |
| | | | | | |
| | | | | | |
| | | | | | |
| | | | | | |
| | | | | | |
| | | | | | |
| | | | | | |
| | | | | | |
The accompanying notes are an integral part of these financial statements.
Allspring Core Bond Portfolio | 27
Portfolio of investments—November 30, 2023 (unaudited)
| | | | | |
Agency securities(continued) | | | | | | |
| | | | | | |
| | | | | | |
| | | | | | |
| | | | | | |
| | | | | | |
| | | | | | |
| | | | | | |
| | | | | | |
| | | | | | |
| | | | | | |
| | | | | | |
| | | | | | |
| | | | | | |
| | | | | | |
| | | | | | |
FNMA Interest STRIPS Series 414 Class A35 | | | | | | |
| | | | | | |
FNMA (30 Day Average U.S. SOFR+2.12%)± | | | | | | |
FNMA (30 Day Average U.S. SOFR+2.12%)± | | | | | | |
FNMA (30 Day Average U.S. SOFR+2.12%)± | | | | | | |
FNMA (30 Day Average U.S. SOFR+2.12%)± | | | | | | |
FNMA (30 Day Average U.S. SOFR+2.13%)± | | | | | | |
FNMA (30 Day Average U.S. SOFR+2.13%)± | | | | | | |
FNMA (30 Day Average U.S. SOFR+2.13%)± | | | | | | |
FNMA (30 Day Average U.S. SOFR+2.13%)± | | | | | | |
FNMA (30 Day Average U.S. SOFR+2.13%)± | | | | | | |
FNMA (30 Day Average U.S. SOFR+2.13%)± | | | | | | |
FNMA (30 Day Average U.S. SOFR+2.37%)± | | | | | | |
FNMA (30 Day Average U.S. SOFR+2.37%)± | | | | | | |
| | | | | | |
| | | | | | |
| | | | | | |
| | | | | | |
| | | | | | |
| | | | | | |
| | | | | | |
| | | | | | |
FNMA Series 2012-111 Class FC (30 Day Average U.S. SOFR+0.51%)± | | | | | | |
FNMA Series 2012-133 Class JF (30 Day Average U.S. SOFR+0.46%)± | | | | | | |
FNMA Series 2012-151 Class NX | | | | | | |
FNMA Series 2013-11 Class AP | | | | | | |
FNMA Series 2013-15 Class FA (30 Day Average U.S. SOFR+0.46%)± | | | | | | |
FNMA Series 2013-43 Class BP | | | | | | |
FNMA Series 2014-25 Class EL | | | | | | |
FNMA Series 2014-74 Class PC | | | | | | |
The accompanying notes are an integral part of these financial statements.
28 | Allspring Core Bond Portfolio
Portfolio of investments—November 30, 2023 (unaudited)
| | | | | |
Agency securities(continued) | | | | | | |
FNMA Series 2015-20 Class EF (30 Day Average U.S. SOFR+0.46%)± | | | | | | |
FNMA Series 2015-26 Class GF (30 Day Average U.S. SOFR+0.41%)± | | | | | | |
FNMA Series 2015-32 Class FA (30 Day Average U.S. SOFR+0.41%)± | | | | | | |
FNMA Series 2015-48 Class FB (30 Day Average U.S. SOFR+0.41%)± | | | | | | |
FNMA Series 2015-84 Class PA | | | | | | |
FNMA Series 2016-19 Class FD (30 Day Average U.S. SOFR+0.51%)± | | | | | | |
FNMA Series 2016-48 Class MA | | | | | | |
FNMA Series 2016-57 Class PC | | | | | | |
FNMA Series 2017-13 Class PA | | | | | | |
FNMA Series 2017-30 Class FA (30 Day Average U.S. SOFR+0.46%)± | | | | | | |
FNMA Series 2018-14 Class KC | | | | | | |
FNMA Series 2018-38 Class MA | | | | | | |
FNMA Series 2018-55 Class GA | | | | | | |
FNMA Series 2018-64 Class A | | | | | | |
FNMA Series 2018-8 Class KL | | | | | | |
FNMA Series 2018-85 Class EA | | | | | | |
FNMA Series 2019-15 Class FA (30 Day Average U.S. SOFR+0.61%)± | | | | | | |
FNMA Series 2019-25 Class PA | | | | | | |
FNMA Series 2019-41 Class FG (30 Day Average U.S. SOFR+0.61%)± | | | | | | |
FNMA Series 2019-43 Class FC (30 Day Average U.S. SOFR+0.51%)± | | | | | | |
FNMA Series 2019-67 Class FB (30 Day Average U.S. SOFR+0.56%)± | | | | | | |
FNMA Series 2020-34 Class F (30 Day Average U.S. SOFR+0.56%)± | | | | | | |
FNMA Series 2020-37 Class DA | | | | | | |
FNMA Series 2020-45 Class JL | | | | | | |
FNMA Series 2020-48 Class AB | | | | | | |
FNMA Series 2020-48 Class DA | | | | | | |
FNMA Series 2020-59 Class NC | | | | | | |
FNMA Series 2021-22 Class MN | | | | | | |
FNMA Series 2021-27 Class EC | | | | | | |
FNMA Series 2021-33 Class AV | | | | | | |
FNMA Series 2021-42 Class AC | | | | | | |
FNMA Series 2021-42 Class DC | | | | | | |
FNMA Series 2021-73 Class DJ | | | | | | |
FNMA Series 2021-73 Class A | | | | | | |
FNMA Series 2021-76 Class KB | | | | | | |
FNMA Series 2021-78 Class ND | | | | | | |
FNMA Series 2021-78 Class PA | | | | | | |
The accompanying notes are an integral part of these financial statements.
Allspring Core Bond Portfolio | 29
Portfolio of investments—November 30, 2023 (unaudited)
| | | | | |
Agency securities(continued) | | | | | | |
FNMA Series 2021-86 Class MA | | | | | | |
FNMA Series 2021-91 Class AB | | | | | | |
FNMA Series 2021-95 Class MA | | | | | | |
FNMA Series 2021-96 Class AH | | | | | | |
FNMA Series 2022-11 Class A | | | | | | |
FNMA Series 2022-11 Class D | | | | | | |
FNMA Series 2022-18 Class DL | | | | | | |
FNMA Series 2022-28 Class CA | | | | | | |
FNMA Series 2022-3 Class N | | | | | | |
FNMA Series 2022-4 Class MH | | | | | | |
FNMA Series 2022-9 Class DJ | | | | | | |
FNMA Series 2023-37 Class FG (30 Day Average U.S. SOFR+0.41%)± | | | | | | |
FNMA Series 2023-37 Class FH (30 Day Average U.S. SOFR+0.51%)± | | | | | | |
FNMA Series 2023-38 Class FC (30 Day Average U.S. SOFR+0.66%)± | | | | | | |
| | | | | | |
| | | | | | |
| | | | | | |
| | | | | | |
| | | | | | |
| | | | | | |
| | | | | | |
| | | | | | |
| | | | | | |
| | | | | | |
| | | | | | |
| | | | | | |
| | | | | | |
| | | | | | |
| | | | | | |
| | | | | | |
| | | | | | |
| | | | | | |
| | | | | | |
| | | | | | |
| | | | | | |
| | | | | | |
| | | | | | |
| | | | | | |
| | | | | | |
| | | | | | |
GNMA Series 2010-163 Class NC | | | | | | |
GNMA Series 2012-141 Class WA±± | | | | | | |
GNMA Series 2013-152 Class HA | | | | | | |
GNMA Series 2014-181 Class L | | | | | | |
GNMA Series 2015-144 Class CA | | | | | | |
The accompanying notes are an integral part of these financial statements.
30 | Allspring Core Bond Portfolio
Portfolio of investments—November 30, 2023 (unaudited)
| | | | | |
Agency securities(continued) | | | | | | |
GNMA Series 2015-161 Class GF (U.S. SOFR 1 Month+0.41%)± | | | | | | |
GNMA Series 2016-93 Class AB | | | | | | |
GNMA Series 2017-139 Class GA | | | | | | |
GNMA Series 2017-167 Class BQ | | | | | | |
GNMA Series 2018-65 Class DC | | | | | | |
GNMA Series 2020-133 Class GA | | | | | | |
GNMA Series 2020-138 Class LE | | | | | | |
GNMA Series 2021-227 Class E | | | | | | |
GNMA Series 2021-27 Class BD | | | | | | |
GNMA Series 2021-27 Class CW±± | | | | | | |
GNMA Series 2021-27 Class NT | | | | | | |
GNMA Series 2021-27 Class Q | | | | | | |
GNMA Series 2021-8 Class CY | | | | | | |
GNMA Series 2022-107 Class C | | | | | | |
GNMA Series 2022-153 Class KA | | | | | | |
GNMA Series 2022-191 Class B | | | | | | |
GNMA Series 2022-191 Class BY | | | | | | |
GNMA Series 2022-197 Class LF (30 Day Average U.S. SOFR+0.70%)± | | | | | | |
GNMA Series 2022-205 Class A | | | | | | |
GNMA Series 2022-31 Class GH | | | | | | |
GNMA Series 2022-34 Class DN | | | | | | |
GNMA Series 2022-5 Class BA | | | | | | |
GNMA Series 2022-50 Class DC | | | | | | |
GNMA Series 2022-66 Class CG | | | | | | |
GNMA Series 2022-84 Class A | | | | | | |
Total agency securities (Cost $2,161,187,406) | | | | | | |
Asset-backed securities: 6.74% | | | | | | |
Ally Auto Receivables Trust Series 2022-3 Class A4 | | | | | | |
American Express Credit Account Master Trust Series 2023-1 Class A | | | | | | |
AmeriCredit Automobile Receivables Trust Series 2022-2 Class A3 | | | | | | |
AmeriCredit Automobile Receivables Trust Series 2023-1 Class A3 | | | | | | |
AmeriCredit Automobile Receivables Trust Series 2023-2 Class A3 | | | | | | |
BMW Vehicle Lease Trust Series 2023-1 Class A4 | | | | | | |
Capital One Prime Auto Receivables Trust Series 2023-1 Class A3 | | | | | | |
Chase Auto Owner Trust Series 2022-AA Class A4144A | | | | | | |
College Avenue Student Loans LLC Series 2017-A Class A1 (U.S. SOFR 1 Month+1.76%)144A± | | | | | | |
College Avenue Student Loans LLC Series 2018-A Class A2144A | | | | | | |
College Avenue Student Loans LLC Series 2019-A Class A2144A | | | | | | |
Discover Card Execution Note Trust Series 2022-A3 Class A3 | | | | | | |
Discover Card Execution Note Trust Series 2023-A1 Class A | | | | | | |
Discover Card Execution Note Trust Series 2023-A2 Class A | | | | | | |
Ford Credit Auto Owner Trust Series 2022-1 Class A144A | | | | | | |
Ford Credit Auto Owner Trust Series 2022-D Class A4 | | | | | | |
Ford Credit Auto Owner Trust Series 2023-A Class A3 | | | | | | |
The accompanying notes are an integral part of these financial statements.
Allspring Core Bond Portfolio | 31
Portfolio of investments—November 30, 2023 (unaudited)
| | | | | |
Asset-backed securities(continued) | | | | | | |
GM Financial Automobile Leasing Trust Series 2023-2 Class A4 | | | | | | |
GM Financial Automobile Leasing Trust Series 2023-3 Class A4 | | | | | | |
GM Financial Consumer Automobile Receivables Trust Series 2022-4 Class A3 | | | | | | |
Hertz Vehicle Financing III LLC Series 2023-4A Class A144A | | | | | | |
Hertz Vehicle Financing LLC Series 2022-4A Class A144A | | | | | | |
Hertz Vehicle Financing LLC Series 2023-2A Class A144A | | | | | | |
Hyundai Auto Lease Securitization Trust Series 2023-B Class A4144A | | | | | | |
Hyundai Auto Lease Securitization Trust Series 2023-C Class A4144A | | | | | | |
Hyundai Auto Receivables Trust Series 2021-C Class A4 | | | | | | |
Hyundai Auto Receivables Trust Series 2022-A Class A3 | | | | | | |
Hyundai Auto Receivables Trust Series 2022-A Class A4 | | | | | | |
Hyundai Auto Receivables Trust Series 2023-A Class A4 | | | | | | |
Hyundai Auto Receivables Trust Series 2023-B Class A3 | | | | | | |
Mercedes-Benz Auto Receivables Trust Series 2022-1 Class A4 | | | | | | |
Mercedes-Benz Auto Receivables Trust Series 2023-1 Class A4 | | | | | | |
Navient Private Education Loan Trust Series 2014-AA Class A3 (U.S. SOFR 1 Month+1.71%)144A± | | | | | | |
Navient Private Education Loan Trust Series 2016-AA Class A2B (U.S. SOFR 1 Month+2.26%)144A± | | | | | | |
Navient Private Education Refinance Loan Trust Series 2018-CA Class A2144A | | | | | | |
Navient Private Education Refinance Loan Trust Series 2018-DA Class A2A144A | | | | | | |
Navient Private Education Refinance Loan Trust Series 2019-A Class A2A144A | | | | | | |
Navient Private Education Refinance Loan Trust Series 2019-CA Class A2144A | | | | | | |
Navient Private Education Refinance Loan Trust Series 2019-D Class A2A144A | | | | | | |
Navient Private Education Refinance Loan Trust Series 2019-FA Class A2144A | | | | | | |
Navient Private Education Refinance Loan Trust Series 2020-GA Class A144A | | | | | | |
Navient Private Education Refinance Loan Trust Series 2021-BA Class A144A | | | | | | |
Navient Private Education Refinance Loan Trust Series 2021-CA Class A144A | | | | | | |
Navient Private Education Refinance Loan Trust Series 2021-EA Class A144A | | | | | | |
Navient Private Education Refinance Loan Trust Series 2021-FA Class A144A | | | | | | |
Navient Private Education Refinance Loan Trust Series 2022-A Class A144A | | | | | | |
Navient Student Loan Trust Series 2021-3A Class A1A144A | | | | | | |
Nelnet Student Loan Trust Series 2004-3 Class A5 (90 Day Average U.S. SOFR+0.44%)± | | | | | | |
The accompanying notes are an integral part of these financial statements.
32 | Allspring Core Bond Portfolio
Portfolio of investments—November 30, 2023 (unaudited)
| | | | | |
Asset-backed securities(continued) | | | | | | |
Nelnet Student Loan Trust Series 2004-4 Class A5 (90 Day Average U.S. SOFR+0.42%)± | | | | | | |
Nelnet Student Loan Trust Series 2005-1 Class A5 (90 Day Average U.S. SOFR+0.37%)± | | | | | | |
Nelnet Student Loan Trust Series 2005-2 Class A5 (90 Day Average U.S. SOFR+0.36%)± | | | | | | |
Nelnet Student Loan Trust Series 2005-3 Class A5 (90 Day Average U.S. SOFR+0.38%)± | | | | | | |
Nelnet Student Loan Trust Series 2005-4 Class A4 (90 Day Average U.S. SOFR+0.44%)± | | | | | | |
Nissan Auto Lease Trust Series 2023-B Class A4 | | | | | | |
Nissan Auto Receivables Owner Trust Series 2022-B Class A4 | | | | | | |
PenFed Auto Receivables Owner Trust Series 2022-A Class A3144A | | | | | | |
PenFed Auto Receivables Owner Trust Series 2022-A Class A4144A | | | | | | |
Santander Drive Auto Receivables Trust Series 2022-2 Class A3 | | | | | | |
Santander Drive Auto Receivables Trust Series 2022-3 Class A3 | | | | | | |
Santander Drive Auto Receivables Trust Series 2022-4 Class A3 | | | | | | |
Santander Drive Auto Receivables Trust Series 2022-5 Class A3 | | | | | | |
Santander Drive Auto Receivables Trust Series 2022-6 Class A3 | | | | | | |
Santander Drive Auto Receivables Trust Series 2022-7 Class A3 | | | | | | |
SMB Private Education Loan Trust Series 2016-B Class A2A144A | | | | | | |
SMB Private Education Loan Trust Series 2016-C Class A2B (U.S. SOFR 1 Month+1.21%)144A± | | | | | | |
SMB Private Education Loan Trust Series 2020-B Class A1A144A | | | | | | |
SMB Private Education Loan Trust Series 2020-PTB Class A2A144A | | | | | | |
SMB Private Education Loan Trust Series 2021-A Class APT1144A | | | | | | |
SMB Private Education Loan Trust Series 2021-B Class A144A | | | | | | |
SMB Private Education Loan Trust Series 2021-E Class A1A144A | | | | | | |
SoFi Professional Loan Program LLC Series 2017-D Class A2FX144A | | | | | | |
SoFi Professional Loan Program LLC Series 2020-C Class AFX144A | | | | | | |
SoFi Professional Loan Program LLC Series 2021-B Class AFX144A | | | | | | |
Synchrony Card Funding LLC Series 2023-A1 Class A | | | | | | |
T-Mobile U.S. Trust Series 2022-1A Class A144A | | | | | | |
Toyota Auto Receivables Owner Trust Series 2022-D Class A4 | | | | | | |
Toyota Auto Receivables Owner Trust Series 2023-A Class A4 | | | | | | |
Toyota Auto Receivables Owner Trust Series 2023-B Class A3 | | | | | | |
Toyota Auto Receivables Owner Trust Series 2023-C Class A3 | | | | | | |
Verizon Master Trust Series 2022-2 Class A | | | | | | |
Verizon Master Trust Series 2022-4 Class A | | | | | | |
Verizon Master Trust Series 2022-6 Class A | | | | | | |
Verizon Master Trust Series 2023-1 Class A | | | | | | |
Verizon Master Trust Series 2023-2 Class A | | | | | | |
Verizon Master Trust Series 2023-4 Class A1A | | | | | | |
The accompanying notes are an integral part of these financial statements.
Allspring Core Bond Portfolio | 33
Portfolio of investments—November 30, 2023 (unaudited)
| | | | | |
Asset-backed securities(continued) | | | | | | |
Volkswagen Auto Loan Enhanced Trust Series 2023-1 Class A3 | | | | | | |
World Omni Select Auto Trust Series 2023-A Class A2A | | | | | | |
Total asset-backed securities (Cost $332,162,960) | | | | | | |
Corporate bonds and notes: 18.34% | | | | | | |
| | | | | | |
| | | | | | |
Celanese U.S. Holdings LLC | | | | | | |
| | | | | | |
| | | | | | |
| | | | | | |
| | | | | | |
| | | | | | |
| | | | | | |
| | | | | | |
| | | | | | |
Charter Communications Operating LLC/Charter Communications Operating Capital | | | | | | |
Charter Communications Operating LLC/Charter Communications Operating Capital | | | | | | |
Charter Communications Operating LLC/Charter Communications Operating Capital | | | | | | |
| | | | | | |
| | | | | | |
| | | | | | |
Discovery Communications LLC | | | | | | |
| | | | | | |
| | | | | | |
Telecommunications: 1.07% | | | | | | |
| | | | | | |
| | | | | | |
| | | | | | |
| | | | | | |
| | | | | | |
| | | | | | |
| | | | | | |
| | | | | | |
| | | | | | |
| | | | | | |
| | | | | | |
| | | | | | |
| | | | | | |
| | | | | | |
The accompanying notes are an integral part of these financial statements.
34 | Allspring Core Bond Portfolio
Portfolio of investments—November 30, 2023 (unaudited)
| | | | | |
Telecommunications(continued) | | | | | | |
Verizon Communications, Inc. | | | | | | |
Verizon Communications, Inc. | | | | | | |
| | | | | | |
Consumer, cyclical: 1.71% | | | | | | |
| | | | | | |
Delta Air Lines, Inc./SkyMiles IP Ltd.144A | | | | | | |
| | | | | | |
| | | | | | |
| | | | | | |
| | | | | | |
| | | | | | |
Auto manufacturers: 0.64% | | | | | | |
Ford Motor Credit Co. LLC | | | | | | |
Hyundai Capital America144A | | | | | | |
Hyundai Capital America144A | | | | | | |
Hyundai Capital America144A | | | | | | |
Hyundai Capital America144A | | | | | | |
Hyundai Capital America144A | | | | | | |
Hyundai Capital America144A | | | | | | |
Hyundai Capital America144A | | | | | | |
| | | | | | |
| | | | | | |
Warnermedia Holdings, Inc. | | | | | | |
Warnermedia Holdings, Inc. | | | | | | |
Warnermedia Holdings, Inc. | | | | | | |
| | | | | | |
| | | | | | |
Harley-Davidson Financial Services, Inc. Series CO144A | | | | | | |
| | | | | | |
Marriott International, Inc. | | | | | | |
Marriott International, Inc. Series II | | | | | | |
| | | | | | |
| | | | | | |
| | | | | | |
| | | | | | |
| | | | | | |
| | | | | | |
| | | | | | |
| | | | | | |
| | | | | | |
O’Reilly Automotive, Inc. | | | | | | |
The accompanying notes are an integral part of these financial statements.
Allspring Core Bond Portfolio | 35
Portfolio of investments—November 30, 2023 (unaudited)
| | | | | |
| | | | | | |
| | | | | | |
| | | | | | |
| | | | | | |
Consumer, non-cyclical: 2.96% | | | | | | |
| | | | | | |
| | | | | | |
| | | | | | |
| | | | | | |
Philip Morris International, Inc. | | | | | | |
Philip Morris International, Inc. | | | | | | |
Philip Morris International, Inc. | | | | | | |
Philip Morris International, Inc. | | | | | | |
Philip Morris International, Inc. | | | | | | |
Philip Morris International, Inc. | | | | | | |
Philip Morris International, Inc. | | | | | | |
Philip Morris International, Inc. | | | | | | |
| | | | | | |
| | | | | | |
Anheuser-Busch Cos. LLC/Anheuser-Busch InBev Worldwide, Inc. | | | | | | |
Anheuser-Busch InBev Worldwide, Inc. | | | | | | |
Anheuser-Busch InBev Worldwide, Inc. | | | | | | |
Constellation Brands, Inc. | | | | | | |
| | | | | | |
| | | | | | |
| | | | | | |
| | | | | | |
| | | | | | |
| | | | | | |
| | | | | | |
| | | | | | |
Commercial services: 0.06% | | | | | | |
| | | | | | |
Cosmetics/Personal Care: 0.12% | | | | | | |
| | | | | | |
| | | | | | |
| | | | | | |
| | | | | | |
| | | | | | |
JBS USA LUX SA/JBS USA Food Co./JBS Luxembourg SARL144A | | | | | | |
JBS USA LUX SA/JBS USA Food Co./JBS Luxembourg SARL144A | | | | | | |
| | | | | | |
The accompanying notes are an integral part of these financial statements.
36 | Allspring Core Bond Portfolio
Portfolio of investments—November 30, 2023 (unaudited)
| | | | | |
Healthcare-products: 0.10% | | | | | | |
| | | | | | |
| | | | | | |
| | | | | | |
Healthcare-services: 0.41% | | | | | | |
| | | | | | |
| | | | | | |
| | | | | | |
| | | | | | |
| | | | | | |
| | | | | | |
| | | | | | |
| | | | | | |
| | | | | | |
| | | | | | |
| | | | | | |
| | | | | | |
| | | | | | |
| | | | | | |
| | | | | | |
| | | | | | |
| | | | | | |
| | | | | | |
| | | | | | |
| | | | | | |
| | | | | | |
BP Capital Markets America, Inc. | | | | | | |
BP Capital Markets America, Inc. | | | | | | |
| | | | | | |
| | | | | | |
| | | | | | |
| | | | | | |
| | | | | | |
| | | | | | |
| | | | | | |
| | | | | | |
| | | | | | |
| | | | | | |
| | | | | | |
| | | | | | |
| | | | | | |
| | | | | | |
| | | | | | |
The accompanying notes are an integral part of these financial statements.
Allspring Core Bond Portfolio | 37
Portfolio of investments—November 30, 2023 (unaudited)
| | | | | |
| | | | | | |
| | | | | | |
| | | | | | |
| | | | | | |
| | | | | | |
| | | | | | |
Bank of America Corp. (U.S. SOFR+0.96%)± | | | | | | |
Bank of America Corp. (U.S. SOFR+1.34%)± | | | | | | |
Bank of America Corp. (U.S. SOFR+1.57%)± | | | | | | |
Bank of America Corp. (U.S. SOFR+1.84%)± | | | | | | |
Bank of America Corp. (U.S. SOFR+1.91%)± | | | | | | |
Bank of America Corp. (U.S. SOFR 3 Month+1.30%)± | | | | | | |
| | | | | | |
Citigroup, Inc. (U.S. SOFR+2.66%)± | | | | | | |
| | | | | | |
M&T Bank Corp. (U.S. SOFR+2.80%)± | | | | | | |
Morgan Stanley (U.S. SOFR+1.59%)± | | | | | | |
Morgan Stanley (U.S. SOFR+1.63%)± | | | | | | |
Morgan Stanley (U.S. SOFR+1.73%)± | | | | | | |
Morgan Stanley (U.S. SOFR+1.87%)± | | | | | | |
Morgan Stanley (U.S. SOFR+2.56%)± | | | | | | |
Santander Holdings USA, Inc. (U.S. SOFR+3.28%)± | | | | | | |
Truist Financial Corp. (U.S. SOFR+2.45%)± | | | | | | |
Wells Fargo & Co. (U.S. SOFR+1.74%)± | | | | | | |
Wells Fargo & Co. (U.S. SOFR+1.79%)± | | | | | | |
Wells Fargo & Co. (U.S. SOFR+2.06%)± | | | | | | |
Wells Fargo & Co. (U.S. SOFR+2.10%)± | | | | | | |
Wells Fargo & Co. (U.S. SOFR+2.13%)± | | | | | | |
| | | | | | |
Diversified financial services: 0.58% | | | | | | |
American Express Co. (U.S. SOFR+0.97%)± | | | | | | |
American Express Co. (U.S. SOFR+1.28%)± | | | | | | |
American Express Co. (U.S. SOFR+1.94%)± | | | | | | |
Capital One Financial Corp. (U.S. SOFR+2.44%)± | | | | | | |
Capital One Financial Corp. (U.S. SOFR+3.07%)± | | | | | | |
Charles Schwab Corp. (U.S. SOFR+2.01%)± | | | | | | |
| | | | | | |
| | | | | | |
| | | | | | |
| | | | | | |
| | | | | | |
| | | | | | |
| | | | | | |
| | | | | | |
| | | | | | |
| | | | | | |
The accompanying notes are an integral part of these financial statements.
38 | Allspring Core Bond Portfolio
Portfolio of investments—November 30, 2023 (unaudited)
| | | | | |
| | | | | | |
| | | | | | |
| | | | | | |
Brixmor Operating Partnership LP | | | | | | |
| | | | | | |
| | | | | | |
| | | | | | |
| | | | | | |
| | | | | | |
| | | | | | |
| | | | | | |
| | | | | | |
| | | | | | |
Federal Realty Investment Trust | | | | | | |
Invitation Homes Operating Partnership LP | | | | | | |
Invitation Homes Operating Partnership LP | | | | | | |
| | | | | | |
| | | | | | |
| | | | | | |
| | | | | | |
| | | | | | |
| | | | | | |
| | | | | | |
| | | | | | |
| | | | | | |
| | | | | | |
Sun Communities Operating LP | | | | | | |
| | | | | | |
| | | | | | |
| | | | | | |
| | | | | | |
| | | | | | |
| | | | | | |
| | | | | | |
| | | | | | |
| | | | | | |
| | | | | | |
| | | | | | |
| | | | | | |
| | | | | | |
| | | | | | |
Building materials: 0.11% | | | | | | |
| | | | | | |
| | | | | | |
| | | | | | |
The accompanying notes are an integral part of these financial statements.
Allspring Core Bond Portfolio | 39
Portfolio of investments—November 30, 2023 (unaudited)
| | | | | |
Environmental control: 0.16% | | | | | | |
| | | | | | |
| | | | | | |
| | | | | | |
| | | | | | |
Machinery-diversified: 0.39% | | | | | | |
| | | | | | |
| | | | | | |
| | | | | | |
John Deere Capital Corp. Series I | | | | | | |
| | | | | | |
| | | | | | |
Burlington Northern Santa Fe LLC | | | | | | |
| | | | | | |
| | | | | | |
| | | | | | |
| | | | | | |
| | | | | | |
| | | | | | |
| | | | | | |
| | | | | | |
| | | | | | |
| | | | | | |
| | | | | | |
| | | | | | |
| | | | | | |
| | | | | | |
| | | | | | |
| | | | | | |
| | | | | | |
| | | | | | |
| | | | | | |
| | | | | | |
| | | | | | |
| | | | | | |
| | | | | | |
| | | | | | |
| | | | | | |
| | | | | | |
| | | | | | |
| | | | | | |
| | | | | | |
| | | | | | |
| | | | | | |
| | | | | | |
The accompanying notes are an integral part of these financial statements.
40 | Allspring Core Bond Portfolio
Portfolio of investments—November 30, 2023 (unaudited)
| | | | | |
| | | | | | |
| | | | | | |
| | | | | | |
| | | | | | |
| | | | | | |
| | | | | | |
| | | | | | |
| | | | | | |
| | | | | | |
| | | | | | |
| | | | | | |
| | | | | | |
| | | | | | |
| | | | | | |
| | | | | | |
| | | | | | |
| | | | | | |
American Transmission Systems, Inc.144A | | | | | | |
Baltimore Gas & Electric Co. | | | | | | |
Baltimore Gas & Electric Co. | | | | | | |
CenterPoint Energy Houston Electric LLC | | | | | | |
CenterPoint Energy Houston Electric LLC Series AH | | | | | | |
Consolidated Edison Co. of New York, Inc. | | | | | | |
Consolidated Edison Co. of New York, Inc. | | | | | | |
Consolidated Edison Co. of New York, Inc. | | | | | | |
| | | | | | |
| | | | | | |
DTE Electric Co. Series B | | | | | | |
Duke Energy Carolinas LLC | | | | | | |
Duke Energy Carolinas LLC | | | | | | |
Duke Energy Carolinas LLC | | | | | | |
Duke Energy Carolinas LLC | | | | | | |
Duke Energy Carolinas LLC | | | | | | |
Duke Energy Carolinas LLC | | | | | | |
| | | | | | |
| | | | | | |
| | | | | | |
| | | | | | |
| | | | | | |
| | | | | | |
| | | | | | |
| | | | | | |
| | | | | | |
Jersey Central Power & Light Co.144A | | | | | | |
Metropolitan Edison Co.144A | | | | | | |
Metropolitan Edison Co.144A | | | | | | |
| | | | | | |
Mississippi Power Co. Series 12-A | | | | | | |
The accompanying notes are an integral part of these financial statements.
Allspring Core Bond Portfolio | 41
Portfolio of investments—November 30, 2023 (unaudited)
| | | | | |
| | | | | | |
Mississippi Power Co. Series B | | | | | | |
| | | | | | |
Pacific Gas & Electric Co. | | | | | | |
Pacific Gas & Electric Co. | | | | | | |
Pacific Gas & Electric Co. | | | | | | |
Pacific Gas & Electric Co. | | | | | | |
Pacific Gas & Electric Co. | | | | | | |
Pacific Gas & Electric Co. | | | | | | |
| | | | | | |
| | | | | | |
Pennsylvania Electric Co.144A | | | | | | |
Pennsylvania Electric Co.144A | | | | | | |
Public Service Co. of Oklahoma Series K | | | | | | |
Public Service Electric & Gas Co. | | | | | | |
Public Service Electric & Gas Co. | | | | | | |
Public Service Electric & Gas Co. | | | | | | |
Public Service Enterprise Group, Inc. | | | | | | |
Public Service Enterprise Group, Inc. | | | | | | |
Southern California Edison Co. Series C | | | | | | |
Virginia Electric & Power Co. | | | | | | |
Virginia Electric & Power Co. | | | | | | |
| | | | | | |
Total corporate bonds and notes (Cost $904,831,236) | | | | | | |
Municipal obligations: 0.33% | | | | | | |
| | | | | | |
| | | | | | |
County of Clark Department of Aviation Series C | | | | | | |
| | | | | | |
| | | | | | |
Port Authority of New York & New Jersey | | | | | | |
| | | | | | |
| | | | | | |
Ohio State University Series A | | | | | | |
| | | | | | |
| | | | | | |
Board of Regents of the University of Texas System Series B | | | | | | |
Transportation revenue: 0.09% | | | | | | |
North Texas Tollway Authority Series B | | | | | | |
| | | | | | |
Total municipal obligations (Cost $17,128,023) | | | | | | |
The accompanying notes are an integral part of these financial statements.
42 | Allspring Core Bond Portfolio
Portfolio of investments—November 30, 2023 (unaudited)
| | | | | |
Non-agency mortgage-backed securities: 2.17% | | | | | | |
Angel Oak Mortgage Trust Series 2020-2 Class A1A144A±± | | | | | | |
Angel Oak Mortgage Trust Series 2020-5 Class A1144A±± | | | | | | |
Angel Oak Mortgage Trust Series 2021-6 Class A1144A±± | | | | | | |
BBCMS Mortgage Trust Series 2018-C2 Class ASB | | | | | | |
Bunker Hill Loan Depositary Trust Series 2019-2 Class A1144A | | | | | | |
Bunker Hill Loan Depositary Trust Series 2019-3 Class A1144A | | | | | | |
BX Commercial Mortgage Trust Series 2021-VOLT Class A (U.S. SOFR 1 Month+0.81%)144A± | | | | | | |
BX Commercial Mortgage Trust Series 2021-XL2 Class A (U.S. SOFR 1 Month+0.80%)144A± | | | | | | |
CFCRE Commercial Mortgage Trust Series 2017-C8 Class ASB | | | | | | |
COLT Mortgage Loan Trust Series 2021-2 Class A1144A±± | | | | | | |
COLT Mortgage Loan Trust Series 2021-4 Class A1144A±± | | | | | | |
COMM Mortgage Trust Series 2014-UBS4 Class A4 | | | | | | |
COMM Mortgage Trust Series 2015-LC23 Class A3 | | | | | | |
EQUS Mortgage Trust Series 2021-EQAZ Class A (U.S. SOFR 1 Month+0.87%)144A± | | | | | | |
GS Mortgage Securities Trust Series 2014-GC18 Class A4 | | | | | | |
GS Mortgage Securities Trust Series 2015-GC32 Class A3 | | | | | | |
GS Mortgage Securities Trust Series 2020-GSA2 Class A4 | | | | | | |
Impact Funding Affordable Multifamily Housing Mortgage Loan Trust Series 2010-1 Class A1144A | | | | | | |
JP Morgan Chase Commercial Mortgage Securities Trust Series 2016-JP4 Class A3 | | | | | | |
JPMBB Commercial Mortgage Securities Trust Series 2013-C17 Class A4 | | | | | | |
JPMBB Commercial Mortgage Securities Trust Series 2014-C23 Class A4 | | | | | | |
JPMBB Commercial Mortgage Securities Trust Series 2015-C28 Class A3 | | | | | | |
JPMBB Commercial Mortgage Securities Trust Series 2015-C30 Class A5 | | | | | | |
Med Trust Series 2021-MDLN Class A (U.S. SOFR 1 Month+1.06%)144A± | | | | | | |
MFA Trust Series 2021-NQM2 Class A1144A±± | | | | | | |
Morgan Stanley Capital I Trust Series 2020-HR8 Class A3 | | | | | | |
New Residential Mortgage Loan Trust Series 2019-NQM4 Class A1144A±± | | | | | | |
NewRez Warehouse Securitization Trust Series 2021-1 Class A (U.S. SOFR 1 Month+0.86%)144A± | | | | | | |
STAR Trust Series 2021-1 Class A1144A±± | | | | | | |
Starwood Mortgage Residential Trust Series 2020-1 Class A1144A±± | | | | | | |
Starwood Mortgage Residential Trust Series 2020-3 Class A1144A±± | | | | | | |
Starwood Mortgage Residential Trust Series 2020-INV1 Class A1144A±± | | | | | | |
Starwood Mortgage Residential Trust Series 2021-4 Class A1144A±± | | | | | | |
The accompanying notes are an integral part of these financial statements.
Allspring Core Bond Portfolio | 43
Portfolio of investments—November 30, 2023 (unaudited)
| | | | | |
Non-agency mortgage-backed securities(continued) | | | | | | |
Verus Securitization Trust Series 2019-4 Class A1144A | | | | | | |
Verus Securitization Trust Series 2019-INV3 Class A1144A±± | | | | | | |
Verus Securitization Trust Series 2020-2 Class A1144A±± | | | | | | |
Verus Securitization Trust Series 2021-1 Class A1144A±± | | | | | | |
Verus Securitization Trust Series 2021-2 Class A1144A±± | | | | | | |
Verus Securitization Trust Series 2021-3 Class A1144A±± | | | | | | |
Verus Securitization Trust Series 2021-4 Class A1144A±± | | | | | | |
Verus Securitization Trust Series 2021-5 Class A1144A±± | | | | | | |
Verus Securitization Trust Series 2021-7 Class A1144A±± | | | | | | |
Verus Securitization Trust Series 2021-8 Class A1144A±± | | | | | | |
Verus Securitization Trust Series 2021-R1 Class A1144A±± | | | | | | |
Verus Securitization Trust Series 2021-R3 Class A1144A±± | | | | | | |
Visio Trust Series 2020-1R Class A1144A | | | | | | |
Total non-agency mortgage-backed securities (Cost $115,245,013) | | | | | | |
U.S. Treasury securities: 27.24% | | | | | | |
| | | | | | |
| | | | | | |
| | | | | | |
| | | | | | |
| | | | | | |
| | | | | | |
| | | | | | |
| | | | | | |
| | | | | | |
| | | | | | |
| | | | | | |
| | | | | | |
| | | | | | |
| | | | | | |
| | | | | | |
| | | | | | |
| | | | | | |
| | | | | | |
| | | | | | |
| | | | | | |
| | | | | | |
| | | | | | |
| | | | | | |
| | | | | | |
| | | | | | |
| | | | | | |
| | | | | | |
| | | | | | |
| | | | | | |
| | | | | | |
| | | | | | |
| | | | | | |
The accompanying notes are an integral part of these financial statements.
44 | Allspring Core Bond Portfolio
Portfolio of investments—November 30, 2023 (unaudited)
| | | | | |
U.S. Treasury securities(continued) | | | | | | |
| | | | | | |
| | | | | | |
| | | | | | |
| | | | | | |
| | | | | | |
| | | | | | |
| | | | | | |
| | | | | | |
| | | | | | |
| | | | | | |
| | | | | | |
Total U.S. Treasury securities (Cost $1,381,397,420) | | | | | | |
Yankee corporate bonds and notes: 3.87% | | | | | | |
| | | | | | |
| | | | | | |
Anglo American Capital PLC144A | | | | | | |
Glencore Finance Canada Ltd.144A | | | | | | |
Glencore Finance Canada Ltd.144A | | | | | | |
Glencore Finance Canada Ltd.144A | | | | | | |
| | | | | | |
Consumer, non-cyclical: 0.56% | | | | | | |
Commercial services: 0.02% | | | | | | |
Adani International Container Terminal Pvt Ltd.144A | | | | | | |
Healthcare-products: 0.09% | | | | | | |
DH Europe Finance II Sarl | | | | | | |
| | | | | | |
Pfizer Investment Enterprises Pte. Ltd. | | | | | | |
Pfizer Investment Enterprises Pte. Ltd. | | | | | | |
Pfizer Investment Enterprises Pte. Ltd. | | | | | | |
| | | | | | |
| | | | | | |
| | | | | | |
| | | | | | |
| | | | | | |
| | | | | | |
| | | | | | |
| | | | | | |
| | | | | | |
| | | | | | |
| | | | | | |
| | | | | | |
Galaxy Pipeline Assets Bidco Ltd.144A | | | | | | |
The accompanying notes are an integral part of these financial statements.
Allspring Core Bond Portfolio | 45
Portfolio of investments—November 30, 2023 (unaudited)
| | | | | |
| | | | | | |
Galaxy Pipeline Assets Bidco Ltd.144A | | | | | | |
Galaxy Pipeline Assets Bidco Ltd.144A | | | | | | |
| | | | | | |
| | | | | | |
| | | | | | |
Banco Bilbao Vizcaya Argentaria SA (1 Year Treasury Constant Maturity+3.30%)± | | | | | | |
| | | | | | |
| | | | | | |
Banco Santander SA (1 Year Treasury Constant Maturity+1.65%)± | | | | | | |
Barclays PLC (U.S. SOFR+2.22%)± | | | | | | |
Barclays PLC (U.S. SOFR+2.62%)± | | | | | | |
Barclays PLC (U.S. SOFR+2.98%)± | | | | | | |
BNP Paribas SA (1 Year Treasury Constant Maturity+1.50%)144A± | | | | | | |
BNP Paribas SA (U.S. SOFR+1.87%)144A±%% | | | | | | |
BPCE SA (U.S. SOFR+1.98%)144A± | | | | | | |
BPCE SA (U.S. SOFR+2.27%)144A± | | | | | | |
BPCE SA (U.S. SOFR+2.59%)144A± | | | | | | |
Canadian Imperial Bank of Commerce | | | | | | |
Cooperatieve Rabobank UA (1 Year Treasury Constant Maturity+1.40%)144A± | | | | | | |
Credit Suisse Group AG144A | | | | | | |
Credit Suisse Group AG (U.S. SOFR+3.73%)144A± | | | | | | |
Deutsche Bank AG (U.S. SOFR+2.26%)± | | | | | | |
HSBC Holdings PLC (U.S. SOFR+3.02%)± | | | | | | |
HSBC Holdings PLC (U.S. SOFR 3 Month+1.80%)± | | | | | | |
HSBC Holdings PLC (U.S. SOFR 3 Month+1.87%)± | | | | | | |
ING Groep NV (U.S. SOFR+1.56%)± | | | | | | |
ING Groep NV (U.S. SOFR+2.09%)± | | | | | | |
| | | | | | |
UBS Group AG (1 Year Treasury Constant Maturity+2.00%)144A± | | | | | | |
| | | | | | |
| | | | | | |
| | | | | | |
| | | | | | |
| | | | | | |
Canadian Pacific Railway Co. | | | | | | |
Canadian Pacific Railway Co. | | | | | | |
| | | | | | |
| | | | | | |
| | | | | | |
NXP BV/NXP Funding LLC/NXP USA, Inc. | | | | | | |
The accompanying notes are an integral part of these financial statements.
46 | Allspring Core Bond Portfolio
Portfolio of investments—November 30, 2023 (unaudited)
| | | | | |
Semiconductors(continued) | | | | | | |
NXP BV/NXP Funding LLC/NXP USA, Inc. | | | | | | |
NXP BV/NXP Funding LLC/NXP USA, Inc. | | | | | | |
| | | | | | |
| | | | | | |
| | | | | | |
Israel Electric Corp. Ltd.144A | | | | | | |
Total yankee corporate bonds and notes (Cost $187,452,827) | | | | | | |
Yankee government bonds: 0.68% | | | | | | |
| | | | | | |
Export Finance & Insurance Corp.144A | | | | | | |
| | | | | | |
| | | | | | |
| | | | | | |
| | | | | | |
| | | | | | |
| | | | | | |
| | | | | | |
| | | | | | |
| | | | | | |
| | | | | | |
| | | | | | |
| | | | | | |
| | | | | | |
| | | | | | |
| | | | | | |
| | | | | | |
| | | | | | |
| | | | | | |
Total yankee government bonds (Cost $33,714,507) | | | | | | |
| | | | | |
Short-term investments: 5.17% | | | | | | |
Investment companies: 5.17% | | | | | | |
Allspring Government Money Market Fund Select Class♠∞## | | | | | | |
Total short-term investments (Cost $245,852,568) | | | | | | |
Total investments in securities (Cost $5,378,971,960) | | | | | | |
Other assets and liabilities, net | | | | | | |
| | | | | | |
The accompanying notes are an integral part of these financial statements.
Allspring Core Bond Portfolio | 47
Portfolio of investments—November 30, 2023 (unaudited)
| The security is issued in zero coupon form with no periodic interest payments. |
| Variable rate investment. The rate shown is the rate in effect at period end. |
| The security is purchased on a when-issued basis. |
| The coupon of the security is adjusted based on the principal and/or interest payments received from the underlying pool of mortgages as well as the credit quality and the actual prepayment speed of the underlying mortgages. The rate shown is the rate in effect at period end. |
| The security may be resold in transactions exempt from registration, normally to qualified institutional buyers, pursuant to Rule 144A under the Securities Act of 1933. |
| All or a portion of this security is segregated as collateral for when-issued securities. |
| The issuer of the security is an affiliated person of the Portfolio as defined in the Investment Company Act of 1940. |
| The rate represents the 7-day annualized yield at period end. |
|
| |
| Federal Home Loan Mortgage Corporation |
| Federal National Mortgage Association |
| Government National Mortgage Association |
| Real estate investment trust |
| Refinitiv USD IBOR Consumer Cash Fallbacks Term 1-year |
| Secured Overnight Financing Rate |
| Separate trading of registered interest and principal securities |
Investments in affiliates
An affiliated investment is an investment in which the Portfolio owns at least 5% of the outstanding voting shares of the issuer or as a result of other relationships, such as the Portfolio and the issuer having the same adviser or investment manager. Transactions with issuers that were affiliates of the Portfolio at the end of the period were as follows:
| | | | | Net
change in
unrealized
gains
(losses) | | | Income
from
affiliated
securities |
| | | | | | | | |
Allspring Government Money Market Fund Select Class | | | | | | | | |
The accompanying notes are an integral part of these financial statements.
48 | Allspring Core Bond Portfolio
Statement of assets and liabilities—November 30, 2023 (unaudited)
Financial statements
Statement of assets and liabilities
| |
Investments in unaffiliated securities, at value (cost $5,133,119,392) | |
Investments in affiliated securities, at value (cost $245,852,568) | |
| |
Receivable for investments sold | |
| |
Principal paydown receivable | |
Prepaid expenses and other assets | |
| |
| |
Payable for when-issued transactions | |
Payable for investments purchased | |
| |
| |
Trustees’ fees and expenses payable | |
Accrued expenses and other liabilities | |
| |
| |
The accompanying notes are an integral part of these financial statements.
Allspring Core Bond Portfolio | 49
Statement of operations—six months ended November 30, 2023 (unaudited)
Statement of operations
| |
Interest (net of foreign withholding taxes of $3,604) | |
Income from affiliated securities | |
| |
| |
| |
Custody and accounting fees | |
| |
Interest holder report expenses | |
Trustees’ fees and expenses | |
| |
| |
Less: Fee waivers and/or expense reimbursements | |
| |
| |
Realized and unrealized gains (losses) on investments | |
Net realized gains (losses) on | |
| |
| |
Net realized losses on investments | |
Net change in unrealized gains (losses) on | |
| |
| |
Net change in unrealized gains (losses) on investments | |
Net realized and unrealized gains (losses) on investments | |
Net decrease in net assets resulting from operations | |
The accompanying notes are an integral part of these financial statements.
50 | Allspring Core Bond Portfolio
Statement of changes in net assets
Statement of changes in net assets
|
Six months ended
November 30, 2023 (unaudited) | |
| | | | |
| | | | |
Net realized losses on investments | | | | |
Net change in unrealized gains (losses) on investments | | | | |
Net decrease in net assets resulting from operations | | | | |
| | | | |
Transactions in investors’ beneficial interests | | | | |
| | | | |
| | | | |
Net increase (decrease) in net assets resulting from capital transactions | | | | |
Total increase (decrease) in net assets | | | | |
| | | | |
| | | | |
| | | | |
The accompanying notes are an integral part of these financial statements.
Allspring Core Bond Portfolio | 51
| Six months ended
November 30, 2023
(unaudited) | |
| | | | | |
| | | | | | |
Ratios to average net assets (annualized) | | | | | | |
| | | | | | |
| | | | | | |
| | | | | | |
| | | | | | |
| | | | | | |
| Returns for periods of less than one year are not annualized. |
| Net expense ratios reflect voluntary waivers, if any. |
The accompanying notes are an integral part of these financial statements.
52 | Allspring Core Bond Portfolio
Notes to financial statements (unaudited)
Notes to financial statements
Allspring Master Trust (the “Trust”), a Delaware statutory trust organized on March 10, 1999, is an open-end management investment company registered under the Investment Company Act of 1940, as amended (the “1940 Act”). As an investment company, the Trust follows the accounting and reporting guidance in Financial Accounting Standards Board (“FASB”) Accounting Standards Codification Topic 946, Financial Services – Investment Companies. These financial statements report on the Allspring Core Bond Portfolio (the “Portfolio”) which is a diversified series of the Trust.
Interests in the Portfolio are available solely through private placement transactions that do not involve any “public offering” within the meaning of Section 4(a)(2) of the Securities Act of 1933.
2.
SIGNIFICANT ACCOUNTING POLICIES
The following significant accounting policies, which are consistently followed in the preparation of the financial statements of the Portfolio, are in conformity with U.S. generally accepted accounting principles which require management to make estimates and assumptions that affect the reported amounts of assets and liabilities, disclosure of contingent assets and liabilities at the date of the financial statements, and the reported amounts of income and expenses during the reporting period. Actual results could differ from those estimates.
Securities valuation
All investments are valued each business day as of the close of regular trading on the New York Stock Exchange (generally 4 p.m. Eastern Time), although the Portfolio may deviate from this calculation time under unusual or unexpected circumstances.
Debt securities are valued at the evaluated bid price provided by an independent pricing service (e.g. taking into account various factors, including yields, maturities, or credit ratings) or, if a reliable price is not available, the quoted bid price from an independent broker-dealer.
The values of securities denominated in foreign currencies are translated into U.S. dollars at rates provided by an independent foreign currency pricing source at a time each business day specified by the Valuation Committee at Allspring Funds Management, LLC (“Allspring Funds Management”).
Investments in registered open-end investment companies (other than those listed on a foreign or domestic exchange or market) are valued at net asset value.
Investments which are not valued using the methods discussed above are valued at their fair value, as determined in good faith by Allspring Funds Management, which was named the valuation designee by the Board of Trustees. As the valuation designee, Allspring Funds Management is responsible for day-to-day valuation activities for the Allspring Funds. In connection with these responsibilities, Allspring Funds Management has established a Valuation Committee and has delegated to it the authority to take any actions regarding the valuation of portfolio securities that the Valuation Committee deems necessary or appropriate, including determining the fair value of portfolio securities. On a quarterly basis, the Board of Trustees receives reports of valuation actions taken by the Valuation Committee. On at least an annual basis, the Board of Trustees receives an assessment of the adequacy and effectiveness of Allspring Funds Management’s process for determining the fair value of the portfolio of investments.
Foreign currency translation
The accounting records of the Portfolio are maintained in U.S. dollars. The values of other assets and liabilities denominated in foreign currencies are translated into U.S. dollars at rates provided by an independent foreign currency pricing source at a time each business day specified by the Valuation Committee. Purchases and sales of securities, and income and expenses are converted at the rate of exchange on the respective dates of such transactions. Net realized foreign exchange gains or losses arise from sales of foreign currencies, currency gains or losses realized between the trade and settlement dates on securities transactions, and the difference between the amounts of dividends, interest and foreign withholding taxes recorded and the U.S. dollar equivalent of the amounts actually paid or received. Net unrealized foreign exchange gains and losses arise from changes in the fair value of assets and liabilities other than investments in securities resulting from changes in exchange rates. The changes in net assets arising from changes in exchange rates of securities and the changes in net assets resulting from changes in market prices of securities are not separately presented. Such changes are included in net realized and unrealized gains or losses from investments.
When-issued transactions
The Portfolio may purchase securities on a forward commitment or when-issued basis. The Portfolio records a when-issued transaction on the trade date and will segregate assets in an amount at least equal in value to the Portfolio’s commitment to purchase when-issued securities. Securities purchased on a when-issued basis are marked-to-market daily and the Portfolio begins earning interest on the settlement date. Losses may arise due to changes in the market value of the underlying securities or if the counterparty does not perform under the contract.
TBA sale commitments
The Portfolio may enter into To Be Announced (“TBA”) sale commitments to hedge its portfolio positions or to sell mortgage-backed securities it owns under delayed delivery arrangements. Proceeds of TBA sale commitments are not received until the contractual settlement date. During the time a TBA sale commitment is outstanding, equivalent deliverable securities or offsetting TBA purchase commitments, which are deliverable on or before the sale commitment date, are held as “cover” for the transaction. Unsettled TBA sale commitments are valued at the current market value of the underlying
Allspring Core Bond Portfolio | 53
Notes to financial statements (unaudited)
securities, according to the procedures described under “Securities valuation”. The contract is marked-to-market daily and the change in market value is recorded by the Portfolio as an unrealized gain or loss. If the TBA sale commitment is closed through the acquisition of an offsetting purchase commitment, the Portfolio realizes a gain or loss. If the Portfolio delivers securities under the commitment, the Portfolio realizes a gain or a loss from the sale of the securities based upon the unit price established at the date the commitment was entered into.
Mortgage dollar roll transactions
The Portfolio may engage in mortgage dollar roll transactions through TBA mortgage-backed securities issued by Government National Mortgage Association (GNMA), Federal National Mortgage Association (FNMA) and Federal Home Loan Mortgage Corporation (FHLMC). In a mortgage dollar roll transaction, the Portfolio sells a mortgage-backed security to a financial institution, such as a bank or broker-dealer and simultaneously agrees to repurchase a substantially similar security from the institution at a later date at an agreed upon price. The mortgage-backed securities that are repurchased will bear the same interest rate as those sold, but generally will be collateralized by different pools of mortgages with different pre-payment histories. During the roll period, the Portfolio foregoes principal and interest paid on the securities. The Portfolio is compensated by the difference between the current sales price and the forward price for the future purchase as well as by the earnings on the cash proceeds of the initial sale. Mortgage dollar rolls may be renewed without physical delivery of the securities subject to the contract. The Portfolio accounts for TBA dollar roll transactions as purchases and sales which, as a result, may increase its portfolio turnover rate.
Security transactions and income recognition
Securities transactions are recorded on a trade date basis. Realized gains or losses are recorded on the basis of identified cost.
Interest income is accrued daily and bond discounts are accreted and premiums are amortized daily. To the extent debt obligations are placed on non-accrual status, any related interest income may be reduced by writing off interest receivables when the collection of all or a portion of interest has been determined to be doubtful based on consistently applied procedures and the fair value has decreased. If the issuer subsequently resumes interest payments or when the collectability of interest is reasonably assured, the debt obligation is removed from non-accrual status. Interest income is recorded net of foreign taxes withheld where recovery of such taxes is not assured. Paydown gains and losses are included in interest income.
Interest earned on cash balances held at the custodian is recorded as interest income.
Federal and other taxes
The Portfolio is not required to pay federal income taxes on its net investment income and net capital gains as it is treated as a partnership for federal income tax purposes. All income, gains and losses of the Portfolio are deemed to have been “passed through” to the interest holders in proportion to their holdings of the Portfolio regardless of whether income and gains have been distributed by the Portfolio.
The Portfolio’s income tax returns and all financial records supporting those returns for the prior three fiscal years are subject to examination by the federal revenue authority. Management has analyzed the Portfolio’s tax positions taken on federal, state, and foreign tax returns, as applicable, for all open tax years and does not believe that there are any uncertain tax positions that require recognition of a tax liability.
As of November 30, 2023, the aggregate cost of all investments for federal income tax purposes was $5,383,059,132 and the unrealized gains (losses) consisted of:
3.
FAIR VALUATION MEASUREMENTS
Fair value measurements of investments are determined within a framework that has established a fair value hierarchy based upon the various data inputs utilized in determining the value of the Portfolio’s investments. The three-level hierarchy gives the highest priority to unadjusted quoted prices in active markets for identical assets or liabilities (Level 1) and the lowest priority to unobservable inputs (Level 3). The Portfolio’s investments are classified within the fair value hierarchy based on the lowest level of input that is significant to the fair value measurement. The inputs are summarized into three broad levels as follows:
•Level 1—quoted prices in active markets for identical securities
•Level 2—other significant observable inputs (including quoted prices for similar securities, interest rates, prepayment speeds, credit risk, etc.)
•Level 3—significant unobservable inputs (including the Portfolio’s own assumptions in determining the fair value of investments)
The inputs or methodologies used for valuing investments in securities are not necessarily an indication of the risk associated with investing in those securities.
54 | Allspring Core Bond Portfolio
Notes to financial statements (unaudited)
The following is a summary of the inputs used in valuing the Portfolio’s assets and liabilities as of November 30, 2023:
| | Other significant
observable inputs
(Level 2) | Significant
unobservable inputs
(Level 3) | |
| | | | |
| | | | |
| | | | |
| | | | |
Corporate bonds and notes | | | | |
| | | | |
Non-agency mortgage-backed securities | | | | |
| | | | |
Yankee corporate bonds and notes | | | | |
| | | | |
| | | | |
| | | | |
| | | | |
Additional sector, industry or geographic detail, if any, is included in the Portfolio of Investments.
At November 30, 2023, the Portfolio did not have any transfers into/out of Level 3.
4.
TRANSACTIONS WITH AFFILIATES
Advisory fee
The Trust has entered into an advisory contract with Allspring Funds Management, a wholly owned subsidiary of Allspring Global Investments Holdings, LLC, a holding company indirectly owned by certain private funds of GTCR LLC and Reverence Capital Partners, L.P. The adviser is responsible for implementing investment policies and guidelines and for supervising the subadviser, who is responsible for day-to-day portfolio management of the Portfolio. Pursuant to the contract, Allspring Funds Management is entitled to receive an advisory fee at the following annual rate based on the Portfolio’s average daily net assets:
For the six months ended November 30, 2023, the advisory fee was equivalent to an annual rate of 0.35% of the Portfolio’s average daily net assets.
Allspring Funds Management has retained the services of a subadviser to provide daily portfolio management to the Portfolio. The fee for subadvisory services is borne by Allspring Funds Management. Allspring Global Investments, LLC, an affiliate of Allspring Funds Management and a wholly owned subsidiary of Allspring Global Investments Holdings, LLC, is the subadviser to the Portfolio and is entitled to receive a fee from Allspring Funds Management at an annual rate starting at 0.20% and declining to 0.10% as the average daily net assets of the Portfolio increase.
Allspring Funds Management has voluntarily waived and/or reimbursed advisory fees to reduce the net operating expense ratio of the Portfolio. These voluntary waivers may be discontinued at any time.
Interfund transactions
The Portfolio may purchase or sell portfolio investment securities to certain affiliates pursuant to Rule 17a-7 under the 1940 Act and under procedures adopted by the Board of Trustees. The procedures have been designed to ensure that these interfund transactions, which do not incur broker commissions, are effected at current market prices. Pursuant to these procedures, the Portfolio did not have any interfund transactions during the six months ended November 30, 2023.
Allspring Core Bond Portfolio | 55
Notes to financial statements (unaudited)
5.
INVESTMENT PORTFOLIO TRANSACTIONS
Purchases and sales of investments, excluding short-term securities, for the six months ended November 30, 2023 were as follows:
The Trust, along with Allspring Variable Trust and Allspring Funds Trust (excluding the money market funds), are parties to a $350,000,000 revolving credit agreement whereby the Portfolio is permitted to use bank borrowings for temporary or emergency purposes, such as to fund interest holders withdrawal requests. Interest under the credit agreement is charged to the Portfolio based on borrowing rate equal to the higher of the Federal Funds rate or the overnight bank funding rate in effect on that day plus a spread. In addition, an annual commitment fee based on the unused balance is allocated to each participating fund.
For the six months ended November 30, 2023, there were no borrowings by the Portfolio under the agreement.
Under the Portfolio’s organizational documents, the officers and Trustees have been granted certain indemnification rights against certain liabilities that may arise out of performance of their duties to the Portfolio. The Portfolio has entered into a separate agreement with each Trustee that converts indemnification rights currently existing under the Portfolio’s organizational documents into contractual rights that cannot be changed in the future without the consent of the Trustee. Additionally, in the normal course of business, the Portfolio may enter into contracts with service providers that contain a variety of indemnification clauses. The Portfolio’s maximum exposure under these arrangements is dependent on future claims that may be made against the Portfolio and, therefore, cannot be estimated.
56 | Allspring Core Bond Portfolio
Other information (unaudited)
Other information
Proxy voting information
A description of the policies and procedures used to determine how to vote proxies relating to portfolio securities is available without charge, upon request, by calling 1-866-259-3305, visiting our website at allspringglobal.com, or visiting the SEC website at sec.gov. Information regarding how the proxies related to portfolio securities were voted during the most recent 12-month period ended June 30 is available on the website at allspringglobal.com or by visiting the SEC website at sec.gov.
Quarterly portfolio holdings information
The Fund and Portfolio file their complete schedule of portfolio holdings with the SEC for the first and third quarters of each fiscal year as an exhibit to their reports on Form N-PORT. Shareholders and Interest holders may view the filed Form N-PORT by visiting the SEC website at sec.gov.
Allspring Core Bond Fund | 57
Other information (unaudited)
Board of trustees and officers
Each of the Trustees and Officers listed in the table below acts in identical capacities for each fund in the Allspring family of funds, which consists of 126 mutual funds comprising the Allspring Funds Trust, Allspring Variable Trust, Allspring Master Trust and four closed-end funds (collectively the “Fund Complex”). This table should be read in conjunction with the Prospectus and the Statement of Additional Information†. The mailing address of each Trustee and Officer is 1415 Vantage Park Drive, 3rd Floor, Charlotte, NC 28203. Each Trustee and Officer serves an indefinite term, however, each Trustee serves such term until reaching the mandatory retirement age established by the Trustees.
Independent Trustees
| | Principal occupations during past five years or longer | Current other
public company or
investment
company
directorships |
William R. Ebsworth
(Born 1957) | | Retired. From 1984 to 2013, equities analyst, portfolio manager, research director and chief investment officer at Fidelity Management and Research Company in Boston, Tokyo, and Hong Kong, and retired in 2013 as Chief Investment Officer of Fidelity Strategic Advisers, Inc. where he led a team of investment professionals managing client assets. Prior thereto, Board member of Hong Kong Securities Clearing Co., Hong Kong Options Clearing Corp., the Thailand International Fund, Ltd., Fidelity Investments Life Insurance Company, and Empire Fidelity Investments Life Insurance Company. Serves on the Investment Company Institute’s Board of Governors since 2022 and Executive Committee since 2023 as well as the Vice Chairman of the Governing Council of the Independent Directors Council since 2023. Audit Committee Chair and Investment Committee Chair of the Vincent Memorial Hospital Foundation (non-profit organization). Mr. Ebsworth is a CFA charterholder. | |
Jane A. Freeman
(Born 1953) | Trustee,
since 2015;
Chair Liaison,
| Retired. From 2012 to 2014 and 1999 to 2008, Chief Financial Officer of Scientific Learning Corporation. From 2008 to 2012, Ms. Freeman provided consulting services related to strategic business projects. Prior to 1999, Portfolio Manager at Rockefeller & Co. and Scudder, Stevens & Clark. Board member of the Harding Loevner Funds from 1996 to 2014, serving as both Lead Independent Director and chair of the Audit Committee. Board member of the Russell Exchange Traded Funds Trust from 2011 to 2012 and the chair of the Audit Committee. Ms. Freeman is also an inactive Chartered Financial Analyst. | |
Isaiah Harris, Jr.
(Born 1952) | Trustee,
since 2009;
Audit Committee Chair,
since 2019 | Retired. Member of the Advisory Board of CEF of East Central Florida. Chairman of the Board of CIGNA Corporation from 2009 to 2021, and Director from 2005 to 2008. From 2003 to 2011, Director of Deluxe Corporation. Prior thereto, President and CEO of BellSouth Advertising and Publishing Corp. from 2005 to 2007, President and CEO of BellSouth Enterprises from 2004 to 2005 and President of BellSouth Consumer Services from 2000 to 2003. Emeritus member of the Iowa State University Foundation Board of Governors. Emeritus Member of the Advisory board of Iowa State University School of Business. Advisory Board Member, Palm Harbor Academy (private school). Advisory Board Member, Fellowship of Christian Athletes. Mr. Harris is a certified public accountant (inactive status). | |
David F. Larcker
(Born 1950) | | Distinguished Visiting Fellow at the Hoover Institution since 2022. James Irvin Miller Professor of Accounting at the Graduate School of Business (Emeritus), Stanford University, Director of the Corporate Governance Research Initiative and Senior Faculty of The Rock Center for Corporate Governance since 2006. From 2005 to 2008, Professor of Accounting at the Graduate School of Business, Stanford University. Prior thereto, Ernst & Young Professor of Accounting at The Wharton School, University of Pennsylvania from 1985 to 2005. | |
Olivia S. Mitchell
(Born 1953) | | International Foundation of Employee Benefit Plans Professor since 1993, Wharton School of the University of Pennsylvania. Director of Wharton’s Pension Research Council and Boettner Center on Pensions & Retirement Research, and Research Associate at the National Bureau of Economic Research. Previously taught at Cornell University from 1978 to 1993. | |
Timothy J. Penny
(Born 1951) | Trustee,
since 1996;
Chair,
since 2018 | President and Chief Executive Officer of Southern Minnesota Initiative Foundation, a non-profit organization, since 2007. Vice Chair of the Economic Club of Minnesota, since 2007. Co-Chair of the Committee for a Responsible Federal Budget, since 1995. Member of the Board of Trustees of NorthStar Education Finance, Inc., a non-profit organization, from 2007-2022. Senior Fellow of the University of Minnesota Humphrey Institute from 1995 to 2017. | |
* Length of service dates reflect the Trustee’s commencement of service with the Trust’s predecessor entities, where applicable.
# Ms. Freeman will serve as Chair Liaison through June 2024, at which time Ms. Wheelock will assume the role.
†
The Statement of Additional Information includes additional information about the Trustees and is available, without charge, upon request, by calling 1-800-222-8222 or by visiting the website at allspringglobal.com.
58 | Allspring Core Bond Fund
Other information (unaudited)
| Position held and length of service* | Principal occupations during past five years or longer | Current other public company or investment company directorships |
James G. Polisson
(Born 1959) | Trustee,
since 2018; Nominating and Governance Committee Chair, since 2024 | Retired. Chief Marketing Officer, Source (ETF) UK Services, Ltd, from 2015 to 2017. From 2012 to 2015, Principal of The Polisson Group, LLC, a management consulting, corporate advisory and principal investing company. Chief Executive Officer and Managing Director at Russell Investments, Global Exchange Traded Funds from 2010 to 2012. Managing Director of Barclays Global Investors from 1998 to 2010 and Global Chief Marketing Officer for iShares and Barclays Global Investors from 2000 to 2010. Trustee of the San Francisco Mechanics’ Institute, a non- profit organization, from 2013 to 2015. Board member of the Russell Exchange Traded Fund Trust from 2011 to 2012. Director of Barclays Global Investors Holdings Deutschland GmbH from 2006 to 2009. Mr. Polisson is an attorney and has a retired status with the Massachusetts and District of Columbia Bar Associations. | |
Pamela Wheelock
(Born 1959) | Trustee,
since January 2020;
previously Trustee from
January 2018 to
| Retired. Executive and Senior Financial leadership positions in the public, private and nonprofit sectors. Interim President and CEO, McKnight Foundation, 2020. Interim Commissioner, Minnesota Department of Human Services, 2019. Chief Operating Officer, Twin Cities Habitat for Humanity, 2017-2019. Vice President for University Services, University of Minnesota, 2012- 2016. Interim President and CEO, Blue Cross and Blue Shield of Minnesota, 2011-2012. Executive Vice-President and Chief Financial Officer, Minnesota Wild, 2002-2008. Commissioner, Minnesota Department of Finance, 1999-2002. Chair of the Board of Directors of Destination Medical Center Corporation. Board member of the Minnesota Wild Foundation. | |
* Length of service dates reflect the Trustee’s commencement of service with the Trust’s predecessor entities, where applicable.
# Ms. Freeman will serve as Chair Liaison through June 2024, at which time Ms. Wheelock will assume the role.
Allspring Core Bond Fund | 59
Other information (unaudited)
Officers1
| Position held and
length of service | Principal occupations during past five years or longer |
| | President and Chief Executive Officer of Allspring Funds Management, LLC since 2017 and Head of Global Fund Governance of Allspring Global Investments since 2022. Prior thereto, co-president of Galliard Capital Management, LLC, an affiliate of Allspring Funds Management, LLC, from 2019 to 2022 and Head of Affiliated Managers, Allspring Global Investments, from 2014 to 2019 and Executive Vice President responsible for marketing, investments and product development for Allspring Funds Management, LLC, from 2009 to 2014. |
Jeremy DePalma
(Born 1974) | Treasurer,
since 2012
(for certain funds in
the Fund Complex);
since 2021 (for
the remaining funds in the Complex) | Senior Vice President of Allspring Funds Management, LLC since 2009. Senior Vice President of Evergreen Investment Management Company, LLC from 2008 to 2010 and head of the Fund Reporting and Control Team within Fund Administration from 2005 to 2010. |
Christopher Baker
(Born 1976) | Chief Compliance Officer,
since 2022 | Global Chief Compliance Officer for Allspring Global Investments since 2022. Prior thereto, Chief Compliance Officer for State Street Global Advisors from 2018 to 2021. Senior Compliance Officer for the State Street divisions of Alternative Investment Solutions, Sector Solutions, and Global Marketing from 2015 to 2018. From 2010 to 2015 Vice President, Global Head of Investment and Marketing Compliance for State Street Global Advisors. |
Matthew Prasse
(Born 1983) | Chief Legal Officer,
since 2022;
Secretary,
since 2021 | Senior Counsel of the Allspring Legal Department since 2021. Senior Counsel of the Wells Fargo Legal Department from 2018 to 2021. Previously, Counsel for Barings LLC from 2015 to 2018. Prior to joining Barings, Associate at Morgan, Lewis & Bockius LLP from 2008 to 2015. |
1 For those Officers with tenures at Allspring Global Investments and/or Allspring Funds Management, LLC that began prior to 2021, such tenures include years of service during which these businesses/entities were known as Wells Fargo Asset Management and Wells Fargo Funds Management, LLC, respectively.
60 | Allspring Core Bond Fund
For more information
More information about Allspring Funds is available free upon request. To obtain literature, please write, visit the Fund’s website, or call:
Allspring Funds
P.O. Box 219967
Kansas City, MO 64121-9967
Website: allspringglobal.com
Individual investors: 1-800-222-8222
Retail investment professionals: 1-888-877-9275
Institutional investment professionals: 1-800-260-5969
This report and the financial statements contained herein are submitted for the general information of the shareholders of the Fund. If this report is used for promotional purposes, distribution of the report must be accompanied or preceded by a current prospectus. Before investing, please consider the investment objectives, risks, charges, and expenses of the investment. For a current prospectus and, if available, a summary prospectus, containing this information, call 1-800-222-8222 or visit the Fund’s website at allspringglobal.com. Read the prospectus carefully before you invest or send money.
Allspring Global InvestmentsTM is the trade name for the asset management firms of Allspring Global Investments Holdings, LLC, a holding company indirectly owned by certain private funds of GTCR LLC and Reverence Capital Partners, L.P. These firms include but are not limited to Allspring Global Investments, LLC, and Allspring Funds Management, LLC. Certain products managed by Allspring entities are distributed by Allspring Funds Distributor, LLC (a broker-dealer and Member FINRA/SIPC).
This material is for general informational and educational purposes only and is NOT intended to provide investment advice or a recommendation of any kind - including a recommendation for any specific investment, strategy, or plan.
© 2024 Allspring Global Investments Holdings, LLC. All rights reserved.
ALL-12052023-dqy1jwiz 01-24
SAR0940 11-23
Allspring Disciplined International Developed Markets Portfolio
Semi-Annual Report
November 30, 2023
Allspring Disciplined International Developed Markets Portfolio | 1
Performance highlights (unaudited)
Performance highlights
| The Portfolio seeks long-term capital appreciation. |
| Allspring Funds Management, LLC |
| Allspring Global Investments, LLC |
| Justin P. Carr, CFA, Vince Fioramonti, CFA |
Average annual total returns (%) as of November 30, 2023 |
| | | | |
| | | | |
Allspring Disciplined International Developed Markets Portfolio | | | | |
MSCI ACWI ex USA Index (Net)1 | | | | |
| | | | |
Figures quoted represent past performance, which is no guarantee of future results, and do not reflect taxes that an investor may pay on an investment in a fund. Investment return and principal value of an investment will fluctuate so that an investor’s shares, when redeemed, may be worth more or less than their original cost. Current performance may be lower or higher than the performance data quoted.
Index returns do not include transaction costs associated with buying and selling securities, any mutual fund fees or expenses, or any taxes. It is not possible to invest directly in an index.
Shares are sold without a front-end sales charge or contingent deferred sales charge.
|
| The Morgan Stanley Capital International (MSCI) All Country World Index (ACWI) ex USA Index (Net) is a free-float-adjusted market-capitalization-weighted index that is designed to measure the equity market performance of developed and emerging markets, excluding the U.S. Source: MSCI. MSCI makes no express or implied warranties or representations and shall have no liability whatsoever with respect to any MSCI data contained herein. The MSCI data may not be further redistributed or used as a basis for other indexes or any securities or financial products. This report is not approved, reviewed, or produced by MSCI. You cannot invest directly in an index. |
| The MSCI Europe, Australasia, Far East (EAFE) Index (Net) is a free-float-adjusted market capitalization-weighted index that is designed to measure the equity market performance of developed markets, excluding the U.S. and Canada. You cannot invest directly in an index. |
CFA® and Chartered Financial Analyst® are trademarks owned by CFA Institute. |
2 | Allspring Disciplined International Developed Markets Portfolio
Performance highlights (unaudited)
Ten largest holdings (%) as of November 30, 20231 |
| |
| |
| |
| |
| |
LVMH Moet Hennessy Louis Vuitton SE | |
| |
| |
| |
| |
| Figures represent the percentage of the Portfolio’s net assets. Holdings are subject to change and may have changed since the date specified. |
Sector allocation as of November 30, 20231 |
| Figures represent the percentage of the Portfolio’s long-term investments. Allocations are subject to change and may have changed since the date specified. |
Geographic allocation as of November 30, 20231 |
| Figures represent the percentage of the Portfolio’s long-term investments. Allocations are subject to change and may have changed since the date specified. |
Allspring Disciplined International Developed Markets Portfolio | 3
Portfolio expenses (unaudited)
Portfolio expenses
As an investor of beneficial interest of the Portfolio, you incur ongoing costs, including advisory fees and other Portfolio expenses. This example is intended to help you understand your ongoing costs (in dollars) of investing in the Portfolio and to compare these costs with the ongoing costs of investing in other mutual funds.
The example is based on an investment of $1,000 invested at the beginning of the six-month period and held for the entire period from June 1, 2023 to November 30, 2023.
Actual expenses
The “Actual” line of the table below provides information about actual account values and actual expenses. You may use the information in this line, together with the amount you invested, to estimate the expenses that you paid over the period. Simply divide your account value by $1,000 (for example, an $8,600 account value divided by $1,000= 8.6), then multiply the result by the number in the “Actual” line under the heading entitled “Expenses paid during period” for your applicable class of shares to estimate the expenses you paid on your account during this period.
Hypothetical example for comparison purposes
The “Hypothetical” line of the table below provides information about hypothetical account values and hypothetical expenses based on the Portfolio’s actual expense ratio and an assumed rate of return of 5% per year before expenses, which is not the Portfolio’s actual return. The hypothetical account values and expenses may not be used to estimate the actual ending account balance or expenses you paid for the period. You may use this information to compare the ongoing costs of investing in the Portfolio and other funds. To do so, compare this 5% hypothetical example with the 5% hypothetical examples that appear in the shareholder reports of the other funds.
Please note that the expenses shown in the table are meant to highlight your ongoing costs only. Therefore, the “Hypothetical” line of the table is useful in comparing ongoing costs only, and will not help you determine the relative total costs of owning different funds.
| Beginning
account value
6-1-2023 | Ending
account value
11-30-2023 | | Annualized net
expense ratio |
| | | | |
Hypothetical (5% return before expenses) | | | | |
| Expenses paid is equal to the annualized net expense ratio multiplied by the average account value over the period, multiplied by 183 divided by 366 (to reflect the one-half-year period). |
4 | Allspring Disciplined International Developed Markets Portfolio
Portfolio of investments—November 30, 2023 (unaudited)
| | | | | |
| | | | | | |
| | | | | | |
ANZ Group Holdings Ltd. (Financials, Banks) | | | | | | |
Aristocrat Leisure Ltd. (Consumer discretionary, Hotels, restaurants & leisure) | | | | | | |
BHP Group Ltd. (Materials, Metals & mining) | | | | | | |
BHP Group Ltd. Class DI (Materials, Metals & mining) | | | | | | |
BlueScope Steel Ltd. (Materials, Metals & mining) | | | | | | |
Brambles Ltd. (Industrials, Commercial services & supplies) | | | | | | |
Cochlear Ltd. (Health care, Health care equipment & supplies) | | | | | | |
Coles Group Ltd. (Consumer staples, Consumer staples distribution & retail) | | | | | | |
Commonwealth Bank of Australia (Financials, Banks) | | | | | | |
CSL Ltd. (Health care, Biotechnology) | | | | | | |
Dexus (Real estate, Office REITs) | | | | | | |
Fortescue Ltd. (Materials, Metals & mining) | | | | | | |
Glencore PLC (Materials, Metals & mining) | | | | | | |
IGO Ltd. (Materials, Metals & mining) | | | | | | |
Macquarie Group Ltd. (Financials, Capital markets) | | | | | | |
National Australia Bank Ltd. (Financials, Banks) | | | | | | |
Northern Star Resources Ltd. (Materials, Metals & mining) | | | | | | |
Origin Energy Ltd. (Utilities, Electric utilities) | | | | | | |
Pilbara Minerals Ltd. (Materials, Metals & mining) | | | | | | |
QBE Insurance Group Ltd. (Financials, Insurance) | | | | | | |
Rio Tinto Ltd. (Materials, Metals & mining) | | | | | | |
Santos Ltd. (Energy, Oil, gas & consumable fuels) | | | | | | |
Scentre Group (Real estate, Retail REITs) | | | | | | |
Sonic Healthcare Ltd. (Health care, Health care providers & services) | | | | | | |
Stockland (Real estate, Diversified REITs) | | | | | | |
Suncorp Group Ltd. (Financials, Insurance) | | | | | | |
Vicinity Ltd. (Real estate, Retail REITs) | | | | | | |
Wesfarmers Ltd. (Consumer discretionary, Broadline retail) | | | | | | |
Westpac Banking Corp. (Financials, Banks) | | | | | | |
Woodside Energy Group Ltd. (Energy, Oil, gas & consumable fuels) | | | | | | |
Woolworths Group Ltd. (Consumer staples, Consumer staples distribution & retail) | | | | | | |
| | | | | | |
| | | | | | |
Erste Group Bank AG (Financials, Banks) | | | | | | |
OMV AG (Energy, Oil, gas & consumable fuels) | | | | | | |
Verbund AG (Utilities, Electric utilities) | | | | | | |
| | | | | | |
| | | | | | |
Anheuser-Busch InBev SA (Consumer staples, Beverages) | | | | | | |
KBC Group NV (Financials, Banks) | | | | | | |
Umicore SA (Materials, Chemicals) | | | | | | |
| | | | | | |
| | | | | | |
AP Moller - Maersk AS Class A (Industrials, Marine transportation) | | | | | | |
Carlsberg AS Class B (Consumer staples, Beverages) | | | | | | |
The accompanying notes are an integral part of these financial statements.
Allspring Disciplined International Developed Markets Portfolio | 5
Portfolio of investments—November 30, 2023 (unaudited)
| | | | | |
| | | | | | |
Demant AS (Health care, Health care equipment & supplies)† | | | | | | |
DSV AS (Industrials, Air freight & logistics) | | | | | | |
Genmab AS (Health care, Biotechnology)† | | | | | | |
Novo Nordisk AS Class B (Health care, Pharmaceuticals) | | | | | | |
Pandora AS (Consumer discretionary, Textiles, apparel & luxury goods) | | | | | | |
| | | | | | |
| | | | | | |
Elisa Oyj (Communication services, Diversified telecommunication services) | | | | | | |
Kone Oyj Class B (Industrials, Machinery) | | | | | | |
Metso Oyj (Industrials, Machinery) | | | | | | |
Nordea Bank Abp (Financials, Banks) | | | | | | |
Wartsila Oyj Abp (Industrials, Machinery) | | | | | | |
| | | | | | |
| | | | | | |
Accor SA (Consumer discretionary, Hotels, restaurants & leisure) | | | | | | |
Air Liquide SA (Materials, Chemicals) | | | | | | |
AXA SA (Financials, Insurance) | | | | | | |
BNP Paribas SA (Financials, Banks) | | | | | | |
Capgemini SE (Information technology, IT services) | | | | | | |
Carrefour SA (Consumer staples, Consumer staples distribution & retail) | | | | | | |
CIE de Saint-Gobain SA (Industrials, Building products) | | | | | | |
Cie Generale des Etablissements Michelin SCA (Consumer discretionary, Automobile components) | | | | | | |
Credit Agricole Corporate & Investment Bank SA (Financials, Banks) | | | | | | |
Danone SA (Consumer staples, Food products) | | | | | | |
Dassault Aviation SA (Industrials, Aerospace & defense) | | | | | | |
Dassault Systemes SE (Information technology, Software) | | | | | | |
Edenred SE (Financials, Financial services) | | | | | | |
Eiffage SA (Industrials, Construction & engineering) | | | | | | |
Engie SA (Utilities, Multi-utilities) | | | | | | |
EssilorLuxottica SA (Health care, Health care equipment & supplies) | | | | | | |
Hermes International SCA (Consumer discretionary, Textiles, apparel & luxury goods) | | | | | | |
Ipsen SA (Health care, Pharmaceuticals) | | | | | | |
Legrand SA (Industrials, Electrical equipment) | | | | | | |
L’Oreal SA (Consumer staples, Personal care products) | | | | | | |
LVMH Moet Hennessy Louis Vuitton SE (Consumer discretionary, Textiles, apparel & luxury goods) | | | | | | |
Orange SA (Communication services, Diversified telecommunication services) | | | | | | |
Pernod Ricard SA (Consumer staples, Beverages) | | | | | | |
Publicis Groupe SA (Communication services, Media) | | | | | | |
Renault SA (Consumer discretionary, Automobiles) | | | | | | |
Safran SA (Industrials, Aerospace & defense) | | | | | | |
Sanofi SA (Health care, Pharmaceuticals) | | | | | | |
Schneider Electric SE (Industrials, Electrical equipment) | | | | | | |
Societe Generale SA (Financials, Banks) | | | | | | |
Teleperformance SE (Industrials, Professional services) | | | | | | |
Thales SA (Industrials, Aerospace & defense) | | | | | | |
The accompanying notes are an integral part of these financial statements.
6 | Allspring Disciplined International Developed Markets Portfolio
Portfolio of investments—November 30, 2023 (unaudited)
| | | | | |
| | | | | | |
TotalEnergies SE (Energy, Oil, gas & consumable fuels) | | | | | | |
Veolia Environnement SA (Utilities, Multi-utilities) | | | | | | |
Vinci SA (Industrials, Construction & engineering) | | | | | | |
| | | | | | |
| | | | | | |
adidas AG (Consumer discretionary, Textiles, apparel & luxury goods) | | | | | | |
Allianz SE (Financials, Insurance) | | | | | | |
BASF SE (Materials, Chemicals) | | | | | | |
Bayer AG (Health care, Pharmaceuticals) | | | | | | |
Bayerische Motoren Werke AG (Consumer discretionary, Automobiles) | | | | | | |
Beiersdorf AG (Consumer staples, Personal care products) | | | | | | |
Brenntag SE (Industrials, Trading companies & distributors) | | | | | | |
Daimler Truck Holding AG (Industrials, Machinery) | | | | | | |
Deutsche Bank AG (Financials, Capital markets) | | | | | | |
Deutsche Boerse AG (Financials, Capital markets) | | | | | | |
Deutsche Post AG (Industrials, Air freight & logistics) | | | | | | |
Deutsche Telekom AG (Communication services, Diversified telecommunication services) | | | | | | |
E.ON SE (Utilities, Multi-utilities) | | | | | | |
Fresenius Medical Care AG & Co. KGaA (Health care, Health care providers & services) | | | | | | |
GEA Group AG (Industrials, Machinery) | | | | | | |
Henkel AG & Co. KGaA (Consumer staples, Household products) | | | | | | |
Infineon Technologies AG (Information technology, Semiconductors & semiconductor equipment) | | | | | | |
Mercedes-Benz Group AG (Consumer discretionary, Automobiles) | | | | | | |
Merck KGaA (Health care, Pharmaceuticals) | | | | | | |
Muenchener Rueckversicherungs-Gesellschaft AG in Muenchen (Financials, Insurance) | | | | | | |
Puma SE (Consumer discretionary, Textiles, apparel & luxury goods) | | | | | | |
Rational AG (Industrials, Machinery) | | | | | | |
RWE AG (Utilities, Independent power and renewable electricity producers) | | | | | | |
SAP SE (Information technology, Software) | | | | | | |
Siemens AG (Industrials, Industrial conglomerates) | | | | | | |
Siemens Healthineers AG (Health care, Health care equipment & supplies)144A | | | | | | |
Talanx AG (Financials, Insurance)† | | | | | | |
Telefonica Deutschland Holding AG (Communication services, Diversified telecommunication services) | | | | | | |
Zalando SE (Consumer discretionary, Specialty retail)144A† | | | | | | |
| | | | | | |
| | | | | | |
AIA Group Ltd. (Financials, Insurance) | | | | | | |
BOC Hong Kong Holdings Ltd. (Financials, Banks) | | | | | | |
CK Asset Holdings Ltd. (Real estate, Real estate management & development) | | | | | | |
Henderson Land Development Co. Ltd. (Real estate, Real estate management & development) | | | | | | |
Hong Kong Exchanges & Clearing Ltd. (Financials, Capital markets) | | | | | | |
Hongkong Land Holdings Ltd. (Real estate, Real estate management & development) | | | | | | |
The accompanying notes are an integral part of these financial statements.
Allspring Disciplined International Developed Markets Portfolio | 7
Portfolio of investments—November 30, 2023 (unaudited)
| | | | | |
| | | | | | |
Jardine Matheson Holdings Ltd. (Industrials, Industrial conglomerates) | | | | | | |
New World Development Co. Ltd. (Real estate, Real estate management & development) | | | | | | |
Sino Land Co. Ltd. (Real estate, Real estate management & development) | | | | | | |
Sun Hung Kai Properties Ltd. (Real estate, Real estate management & development) | | | | | | |
WH Group Ltd. (Consumer staples, Food products)144A | | | | | | |
| | | | | | |
| | | | | | |
CRH PLC (Materials, Construction materials) | | | | | | |
DCC PLC (Industrials, Industrial conglomerates) | | | | | | |
James Hardie Industries PLC (Materials, Construction materials)† | | | | | | |
Kingspan Group PLC (Industrials, Building products)† | | | | | | |
| | | | | | |
| | | | | | |
Check Point Software Technologies Ltd. (Information technology, Software)† | | | | | | |
Global-E Online Ltd. (Consumer discretionary, Broadline retail)† | | | | | | |
Israel Discount Bank Ltd. Class A (Financials, Banks) | | | | | | |
Monday.com Ltd. (Information technology, Software)† | | | | | | |
Nice Ltd. (Information technology, Software)† | | | | | | |
Teva Pharmaceutical Industries Ltd. ADR (Health care, Pharmaceuticals)† | | | | | | |
Wix.com Ltd. (Information technology, IT services)† | | | | | | |
| | | | | | |
| | | | | | |
Assicurazioni Generali SpA (Financials, Insurance) | | | | | | |
ENEL SpA (Utilities, Electric utilities) | | | | | | |
ENI SpA (Energy, Oil, gas & consumable fuels) | | | | | | |
Intesa Sanpaolo SpA (Financials, Banks) | | | | | | |
Moncler SpA (Consumer discretionary, Textiles, apparel & luxury goods) | | | | | | |
Prysmian SpA (Industrials, Electrical equipment) | | | | | | |
Terna - Rete Elettrica Nazionale (Utilities, Electric utilities) | | | | | | |
UniCredit SpA (Financials, Banks) | | | | | | |
| | | | | | |
| | | | | | |
Advantest Corp. (Information technology, Semiconductors & semiconductor equipment) | | | | | | |
Aeon Co. Ltd. (Consumer staples, Consumer staples distribution & retail) | | | | | | |
ANA Holdings, Inc. (Industrials, Passenger airlines)† | | | | | | |
Astellas Pharma, Inc. (Health care, Pharmaceuticals) | | | | | | |
BayCurrent Consulting, Inc. (Industrials, Professional services) | | | | | | |
Bridgestone Corp. (Consumer discretionary, Automobile components) | | | | | | |
Brother Industries Ltd. (Information technology, Technology hardware, storage & peripherals) | | | | | | |
Canon, Inc. (Information technology, Technology hardware, storage & peripherals) | | | | | | |
Capcom Co. Ltd. (Communication services, Entertainment) | | | | | | |
Central Japan Railway Co. (Industrials, Ground transportation) | | | | | | |
The accompanying notes are an integral part of these financial statements.
8 | Allspring Disciplined International Developed Markets Portfolio
Portfolio of investments—November 30, 2023 (unaudited)
| | | | | |
| | | | | | |
Chubu Electric Power Co., Inc. (Utilities, Electric utilities) | | | | | | |
Chugai Pharmaceutical Co. Ltd. (Health care, Pharmaceuticals) | | | | | | |
Dai-ichi Life Holdings, Inc. (Financials, Insurance) | | | | | | |
Daiichi Sankyo Co. Ltd. (Health care, Pharmaceuticals) | | | | | | |
Daikin Industries Ltd. (Industrials, Building products) | | | | | | |
Daito Trust Construction Co. Ltd. (Real estate, Real estate management & development) | | | | | | |
Daiwa House Industry Co. Ltd. (Real estate, Real estate management & development) | | | | | | |
Disco Corp. (Information technology, Semiconductors & semiconductor equipment) | | | | | | |
Fast Retailing Co. Ltd. (Consumer discretionary, Specialty retail) | | | | | | |
FUJIFILM Holdings Corp. (Information technology, Technology hardware, storage & peripherals) | | | | | | |
GMO Payment Gateway, Inc. (Financials, Financial services) | | | | | | |
Hitachi Ltd. (Industrials, Industrial conglomerates) | | | | | | |
Honda Motor Co. Ltd. (Consumer discretionary, Automobiles) | | | | | | |
Hoya Corp. (Health care, Health care equipment & supplies) | | | | | | |
INPEX Corp. (Energy, Oil, gas & consumable fuels) | | | | | | |
Isuzu Motors Ltd. (Consumer discretionary, Automobiles) | | | | | | |
ITOCHU Corp. (Industrials, Trading companies & distributors) | | | | | | |
Japan Airlines Co. Ltd. (Industrials, Passenger airlines) | | | | | | |
Japan Metropolitan Fund Invest (Real estate, Retail REITs) | | | | | | |
Japan Post Insurance Co. Ltd. (Financials, Insurance) | | | | | | |
Japan Tobacco, Inc. (Consumer staples, Tobacco) | | | | | | |
Keyence Corp. (Information technology, Electronic equipment, instruments & components) | | | | | | |
Kintetsu Group Holdings Co. Ltd. (Industrials, Ground transportation) | | | | | | |
Kobayashi Pharmaceutical Co. Ltd. (Consumer staples, Personal care products) | | | | | | |
Kobe Bussan Co. Ltd. (Consumer staples, Consumer staples distribution & retail) | | | | | | |
Komatsu Ltd. (Industrials, Machinery) | | | | | | |
LY Corp. (Communication services, Interactive media & services) | | | | | | |
M3, Inc. (Health care, Health care technology) | | | | | | |
Marubeni Corp. (Industrials, Trading companies & distributors) | | | | | | |
Mazda Motor Corp. (Consumer discretionary, Automobiles) | | | | | | |
Mitsubishi Corp. (Industrials, Trading companies & distributors) | | | | | | |
Mitsubishi Heavy Industries Ltd. (Industrials, Machinery) | | | | | | |
Mitsubishi UFJ Financial Group, Inc. (Financials, Banks) | | | | | | |
Mitsui & Co. Ltd. (Industrials, Trading companies & distributors) | | | | | | |
Mitsui OSK Lines Ltd. (Industrials, Marine transportation) | | | | | | |
MS&AD Insurance Group Holdings, Inc. (Financials, Insurance) | | | | | | |
NEC Corp. (Information technology, IT services) | | | | | | |
Nexon Co. Ltd. (Communication services, Entertainment) | | | | | | |
Nintendo Co. Ltd. (Communication services, Entertainment) | | | | | | |
Nippon Paint Holdings Co. Ltd. (Materials, Chemicals) | | | | | | |
Nippon Steel Corp. (Materials, Metals & mining) | | | | | | |
Nippon Telegraph & Telephone Corp. (Communication services, Diversified telecommunication services) | | | | | | |
Nissan Motor Co. Ltd. (Consumer discretionary, Automobiles) | | | | | | |
Nitto Denko Corp. (Materials, Chemicals) | | | | | | |
Nomura Research Institute Ltd. (Information technology, IT services) | | | | | | |
The accompanying notes are an integral part of these financial statements.
Allspring Disciplined International Developed Markets Portfolio | 9
Portfolio of investments—November 30, 2023 (unaudited)
| | | | | |
| | | | | | |
Obic Co. Ltd. (Information technology, IT services) | | | | | | |
Odakyu Electric Railway Co. Ltd. (Industrials, Ground transportation) | | | | | | |
Olympus Corp. (Health care, Health care equipment & supplies) | | | | | | |
Omron Corp. (Information technology, Electronic equipment, instruments & components) | | | | | | |
Ono Pharmaceutical Co. Ltd. (Health care, Pharmaceuticals) | | | | | | |
Open House Group Co. Ltd. (Consumer discretionary, Household durables) | | | | | | |
Oriental Land Co. Ltd. (Consumer discretionary, Hotels, restaurants & leisure) | | | | | | |
Otsuka Corp. (Information technology, IT services) | | | | | | |
Otsuka Holdings Co. Ltd. (Health care, Pharmaceuticals) | | | | | | |
Pan Pacific International Holdings Corp. (Consumer discretionary, Broadline retail) | | | | | | |
Panasonic Holdings Corp. (Consumer discretionary, Household durables) | | | | | | |
Persol Holdings Co. Ltd. (Industrials, Professional services) | | | | | | |
Recruit Holdings Co. Ltd. (Industrials, Professional services) | | | | | | |
Renesas Electronics Corp. (Information technology, Semiconductors & semiconductor equipment)† | | | | | | |
Seiko Epson Corp. (Information technology, Technology hardware, storage & peripherals) | | | | | | |
Sekisui House Ltd. (Consumer discretionary, Household durables) | | | | | | |
Seven & i Holdings Co. Ltd. (Consumer staples, Consumer staples distribution & retail) | | | | | | |
Shimano, Inc. (Consumer discretionary, Leisure products) | | | | | | |
Shin-Etsu Chemical Co. Ltd. (Materials, Chemicals) | | | | | | |
Shionogi & Co. Ltd. (Health care, Pharmaceuticals) | | | | | | |
SoftBank Group Corp. (Communication services, Wireless telecommunication services) | | | | | | |
Sompo Holdings, Inc. (Financials, Insurance) | | | | | | |
Sony Group Corp. (Consumer discretionary, Household durables) | | | | | | |
Subaru Corp. (Consumer discretionary, Automobiles) | | | | | | |
SUMCO Corp. (Information technology, Semiconductors & semiconductor equipment) | | | | | | |
Sumitomo Corp. (Industrials, Trading companies & distributors) | | | | | | |
Sumitomo Mitsui Financial Group, Inc. (Financials, Banks) | | | | | | |
Suzuki Motor Corp. (Consumer discretionary, Automobiles) | | | | | | |
Sysmex Corp. (Health care, Health care equipment & supplies) | | | | | | |
Takeda Pharmaceutical Co. Ltd. (Health care, Pharmaceuticals) | | | | | | |
Terumo Corp. (Health care, Health care equipment & supplies) | | | | | | |
Toho Co. Ltd. (Communication services, Entertainment) | | | | | | |
Tokio Marine Holdings, Inc. (Financials, Insurance) | | | | | | |
Tokyo Electron Ltd. (Information technology, Semiconductors & semiconductor equipment) | | | | | | |
Tokyo Gas Co. Ltd. (Utilities, Gas utilities) | | | | | | |
Toyota Motor Corp. (Consumer discretionary, Automobiles) | | | | | | |
Toyota Tsusho Corp. (Industrials, Trading companies & distributors) | | | | | | |
Trend Micro, Inc. (Information technology, Software) | | | | | | |
Unicharm Corp. (Consumer staples, Household products) | | | | | | |
Yakult Honsha Co. Ltd. (Consumer staples, Food products) | | | | | | |
Yokogawa Electric Corp. (Information technology, Electronic equipment, instruments & components) | | | | | | |
| | | | | | |
The accompanying notes are an integral part of these financial statements.
10 | Allspring Disciplined International Developed Markets Portfolio
Portfolio of investments—November 30, 2023 (unaudited)
| | | | | |
| | | | | | |
ArcelorMittal SA (Materials, Metals & mining)† | | | | | | |
Eurofins Scientific SE (Health care, Life sciences tools & services) | | | | | | |
| | | | | | |
| | | | | | |
ABN AMRO Bank NV (Financials, Banks)144A | | | | | | |
Adyen NV (Financials, Financial services)144A† | | | | | | |
Aegon Ltd. (Financials, Insurance) | | | | | | |
Airbus SE (Industrials, Aerospace & defense) | | | | | | |
ASM International NV (Information technology, Semiconductors & semiconductor equipment) | | | | | | |
ASML Holding NV (Information technology, Semiconductors & semiconductor equipment)† | | | | | | |
Ferrari NV (Consumer discretionary, Automobiles) | | | | | | |
IMCD NV (Industrials, Trading companies & distributors) | | | | | | |
ING Groep NV (Financials, Banks) | | | | | | |
Koninklijke Ahold Delhaize NV (Consumer staples, Consumer staples distribution & retail) | | | | | | |
Koninklijke Philips NV (Health care, Health care equipment & supplies)† | | | | | | |
NN Group NV (Financials, Insurance) | | | | | | |
Prosus NV (Consumer discretionary, Broadline retail)† | | | | | | |
QIAGEN NV (Health care, Life sciences tools & services)† | | | | | | |
Randstad NV (Industrials, Professional services) | | | | | | |
Stellantis NV (Consumer discretionary, Automobiles) | | | | | | |
STMicroelectronics NV (Information technology, Semiconductors & semiconductor equipment) | | | | | | |
Wolters Kluwer NV (Industrials, Professional services) | | | | | | |
| | | | | | |
| | | | | | |
Spark New Zealand Ltd. (Communication services, Diversified telecommunication services) | | | | | | |
Xero Ltd. (Information technology, Software)† | | | | | | |
| | | | | | |
| | | | | | |
DNB Bank ASA (Financials, Banks) | | | | | | |
Equinor ASA (Energy, Oil, gas & consumable fuels) | | | | | | |
Gjensidige Forsikring ASA (Financials, Insurance) | | | | | | |
Norsk Hydro ASA (Materials, Metals & mining) | | | | | | |
Orkla ASA (Consumer staples, Food products) | | | | | | |
| | | | | | |
| | | | | | |
Galp Energia SGPS SA (Energy, Oil, gas & consumable fuels) | | | | | | |
Jeronimo Martins SGPS SA (Consumer staples, Consumer staples distribution & retail) | | | | | | |
| | | | | | |
The accompanying notes are an integral part of these financial statements.
Allspring Disciplined International Developed Markets Portfolio | 11
Portfolio of investments—November 30, 2023 (unaudited)
| | | | | |
| | | | | | |
DBS Group Holdings Ltd. (Financials, Banks) | | | | | | |
Genting Singapore Ltd. (Consumer discretionary, Hotels, restaurants & leisure) | | | | | | |
Jardine Cycle & Carriage Ltd. (Industrials, Industrial conglomerates) | | | | | | |
Oversea-Chinese Banking Corp. Ltd. (Financials, Banks) | | | | | | |
Sea Ltd. ADR (Communication services, Entertainment)† | | | | | | |
Singapore Airlines Ltd. (Industrials, Passenger airlines) | | | | | | |
United Overseas Bank Ltd. (Financials, Banks) | | | | | | |
| | | | | | |
| | | | | | |
Amadeus IT Group SA (Consumer discretionary, Hotels, restaurants & leisure) | | | | | | |
Banco Bilbao Vizcaya Argentaria SA (Financials, Banks) | | | | | | |
Banco Santander SA (Financials, Banks) | | | | | | |
CaixaBank SA (Financials, Banks) | | | | | | |
Enagas SA (Utilities, Gas utilities) | | | | | | |
Iberdrola SA (Utilities, Electric utilities) | | | | | | |
Industria de Diseno Textil SA (Consumer discretionary, Specialty retail) | | | | | | |
Naturgy Energy Group SA (Utilities, Gas utilities) | | | | | | |
Redeia Corp. SA (Utilities, Electric utilities) | | | | | | |
Repsol SA (Energy, Oil, gas & consumable fuels) | | | | | | |
Telefonica SA (Communication services, Diversified telecommunication services) | | | | | | |
| | | | | | |
| | | | | | |
Assa Abloy AB Class B (Industrials, Building products) | | | | | | |
Atlas Copco AB Class A (Industrials, Machinery) | | | | | | |
Epiroc AB Class A (Industrials, Machinery) | | | | | | |
Essity AB Class B (Consumer staples, Household products) | | | | | | |
Evolution AB (Consumer discretionary, Hotels, restaurants & leisure)144A | | | | | | |
Fastighets AB Balder Class B (Real estate, Real estate management & development)† | | | | | | |
Getinge AB Class B (Health care, Health care equipment & supplies) | | | | | | |
Hexagon AB Class B (Information technology, Electronic equipment, instruments & components) | | | | | | |
Holmen AB Class B (Materials, Paper & forest products) | | | | | | |
Indutrade AB (Industrials, Machinery) | | | | | | |
Investor AB Class B (Financials, Financial services) | | | | | | |
Lifco AB Class B (Industrials, Industrial conglomerates) | | | | | | |
Nibe Industrier AB Class B (Industrials, Building products) | | | | | | |
Sandvik AB (Industrials, Machinery) | | | | | | |
Skandinaviska Enskilda Banken AB Class A (Financials, Banks) | | | | | | |
Svenska Handelsbanken AB Class A (Financials, Banks) | | | | | | |
Swedbank AB Class A (Financials, Banks) | | | | | | |
Volvo AB Class B (Industrials, Machinery) | | | | | | |
Volvo Car AB Class B (Consumer discretionary, Automobiles)† | | | | | | |
| | | | | | |
| | | | | | |
ABB Ltd. (Industrials, Electrical equipment) | | | | | | |
Alcon, Inc. (Health care, Health care equipment & supplies) | | | | | | |
The accompanying notes are an integral part of these financial statements.
12 | Allspring Disciplined International Developed Markets Portfolio
Portfolio of investments—November 30, 2023 (unaudited)
| | | | | |
| | | | | | |
Avolta AG (Consumer discretionary, Specialty retail)† | | | | | | |
Chocoladefabriken Lindt & Spruengli AG (Consumer staples, Food products) | | | | | | |
CIE Financiere Richemont SA Class A (Consumer discretionary, Textiles, apparel & luxury goods) | | | | | | |
Coca-Cola HBC AG (Consumer staples, Beverages)† | | | | | | |
DSM-Firmenich AG (Materials, Chemicals) | | | | | | |
EMS-Chemie Holding AG (Materials, Chemicals) | | | | | | |
Givaudan SA (Materials, Chemicals) | | | | | | |
Holcim AG (Materials, Construction materials) | | | | | | |
Julius Baer Group Ltd. (Financials, Capital markets) | | | | | | |
Logitech International SA (Information technology, Technology hardware, storage & peripherals) | | | | | | |
Lonza Group AG (Health care, Life sciences tools & services) | | | | | | |
Nestle SA (Consumer staples, Food products) | | | | | | |
Novartis AG (Health care, Pharmaceuticals) | | | | | | |
Partners Group Holding AG (Financials, Capital markets) | | | | | | |
Roche Holding AG (Health care, Pharmaceuticals) | | | | | | |
Roche Holding AG (Health care, Pharmaceuticals) | | | | | | |
Sandoz Group AG (Health care, Pharmaceuticals)† | | | | | | |
Schindler Holding AG (Industrials, Machinery) | | | | | | |
Sika AG (Materials, Chemicals) | | | | | | |
Sonova Holding AG (Health care, Health care equipment & supplies) | | | | | | |
Straumann Holding AG (Health care, Health care equipment & supplies) | | | | | | |
Swatch Group AG (Consumer discretionary, Textiles, apparel & luxury goods) | | | | | | |
Swiss Re AG (Financials, Insurance) | | | | | | |
Swisscom AG (Communication services, Diversified telecommunication services) | | | | | | |
UBS Group AG (Financials, Capital markets) | | | | | | |
| | | | | | |
| | | | | | |
3i Group PLC (Financials, Capital markets) | | | | | | |
Anglo American PLC (Materials, Metals & mining) | | | | | | |
Ashtead Group PLC (Industrials, Trading companies & distributors) | | | | | | |
Associated British Foods PLC (Consumer staples, Food products) | | | | | | |
AstraZeneca PLC (Health care, Pharmaceuticals) | | | | | | |
BAE Systems PLC (Industrials, Aerospace & defense) | | | | | | |
Barratt Developments PLC (Consumer discretionary, Household durables) | | | | | | |
BP PLC (Energy, Oil, gas & consumable fuels) | | | | | | |
British American Tobacco PLC (Consumer staples, Tobacco) | | | | | | |
British Land Co. PLC (Real estate, Diversified REITs) | | | | | | |
Bunzl PLC (Industrials, Trading companies & distributors) | | | | | | |
Centrica PLC (Utilities, Multi-utilities) | | | | | | |
Coca-Cola Europacific Partners PLC (Consumer staples, Beverages) | | | | | | |
Compass Group PLC (Consumer discretionary, Hotels, restaurants & leisure) | | | | | | |
Diageo PLC (Consumer staples, Beverages) | | | | | | |
GSK PLC (Health care, Pharmaceuticals) | | | | | | |
Hargreaves Lansdown PLC (Financials, Capital markets) | | | | | | |
Hikma Pharmaceuticals PLC (Health care, Pharmaceuticals) | | | | | | |
HSBC Holdings PLC (Financials, Banks) | | | | | | |
The accompanying notes are an integral part of these financial statements.
Allspring Disciplined International Developed Markets Portfolio | 13
Portfolio of investments—November 30, 2023 (unaudited)
| | | | | |
United Kingdom(continued) | | | | | | |
Imperial Brands PLC (Consumer staples, Tobacco) | | | | | | |
Informa PLC (Communication services, Media) | | | | | | |
J Sainsbury PLC (Consumer staples, Consumer staples distribution & retail) | | | | | | |
JD Sports Fashion PLC (Consumer discretionary, Specialty retail) | | | | | | |
Land Securities Group PLC (Real estate, Diversified REITs) | | | | | | |
London Stock Exchange Group PLC (Financials, Capital markets) | | | | | | |
Mondi PLC (Materials, Paper & forest products) | | | | | | |
National Grid PLC (Utilities, Multi-utilities) | | | | | | |
Prudential PLC (Financials, Insurance) | | | | | | |
Reckitt Benckiser Group PLC (Consumer staples, Household products) | | | | | | |
RELX PLC (Industrials, Professional services) | | | | | | |
Rio Tinto PLC (Materials, Metals & mining) | | | | | | |
Rolls-Royce Holdings PLC (Industrials, Aerospace & defense)† | | | | | | |
Sage Group PLC (Information technology, Software) | | | | | | |
Schroders PLC (Financials, Capital markets) | | | | | | |
Shell PLC (Energy, Oil, gas & consumable fuels) | | | | | | |
Smith & Nephew PLC (Health care, Health care equipment & supplies) | | | | | | |
Smiths Group PLC (Industrials, Industrial conglomerates) | | | | | | |
SSE PLC (Utilities, Electric utilities) | | | | | | |
St. James’s Place plc (Financials, Capital markets) | | | | | | |
Standard Chartered PLC (Financials, Banks) | | | | | | |
Tesco PLC (Consumer staples, Consumer staples distribution & retail) | | | | | | |
Unilever PLC (Consumer staples, Personal care products) | | | | | | |
Unilever PLC London Stock Exchange (Consumer staples, Personal care products) | | | | | | |
Vodafone Group PLC (Communication services, Wireless telecommunication services) | | | | | | |
Whitbread PLC (Consumer discretionary, Hotels, restaurants & leisure) | | | | | | |
WPP PLC (Communication services, Media) | | | | | | |
| | | | | | |
| | | | | | |
Experian PLC (Industrials, Professional services) | | | | | | |
Newmont Corp. (Materials, Metals & mining) | | | | | | |
| | | | | | |
Total common stocks (Cost $99,459,766) | | | | | | |
| | | | | |
Short-term investments: 2.98% | | | | | | |
Investment companies: 2.98% | | | | | | |
Allspring Government Money Market Fund Select Class♠∞ | | | | | | |
Total short-term investments (Cost $3,839,053) | | | | | | |
Total investments in securities (Cost $103,298,819) | | | | | | |
Other assets and liabilities, net | | | | | | |
| | | | | | |
The accompanying notes are an integral part of these financial statements.
14 | Allspring Disciplined International Developed Markets Portfolio
Portfolio of investments—November 30, 2023 (unaudited)
| Non-income-earning security |
| The security may be resold in transactions exempt from registration, normally to qualified institutional buyers, pursuant to Rule 144A under the Securities Act of 1933. |
| The issuer of the security is an affiliated person of the Portfolio as defined in the Investment Company Act of 1940. |
| The rate represents the 7-day annualized yield at period end. |
|
| American depositary receipt |
| Real estate investment trust |
Investments in affiliates
An affiliated investment is an investment in which the Portfolio owns at least 5% of the outstanding voting shares of the issuer or as a result of other relationships, such as the Portfolio and the issuer having the same adviser or investment manager. Transactions with issuers that were affiliates of the Portfolio at the end of the period were as follows:
| | | | | Net
change in
unrealized
gains
(losses) | | | Income
from
affiliated
securities |
| | | | | | | | |
Allspring Government Money Market Fund Select Class | | | | | | | | |
Futures contracts
The accompanying notes are an integral part of these financial statements.
Allspring Disciplined International Developed Markets Portfolio | 15
Statement of assets and liabilities—November 30, 2023 (unaudited)
Financial statements
Statement of assets and liabilities
| |
Investments in unaffiliated securities, at value (cost $99,459,766) | |
Investments in affiliated securities, at value (cost $3,839,053) | |
Cash at broker segregated for futures contracts | |
Foreign currency, at value (cost $118,909) | |
| |
Prepaid expenses and other assets | |
| |
| |
Custody and accounting fees payable | |
| |
Professional fees payable | |
| |
Payable for daily variation margin on open futures contracts | |
Trustees’ fees and expenses payable | |
Accrued expenses and other liabilities | |
| |
| |
The accompanying notes are an integral part of these financial statements.
16 | Allspring Disciplined International Developed Markets Portfolio
Statement of operations—six months ended November 30, 2023 (unaudited)
Statement of operations
| |
Dividends (net of foreign withholdings taxes of $136,814) | |
Income from affiliated securities | |
| |
| |
| |
| |
Custody and accounting fees | |
| |
Interest holder report expenses | |
Trustees’ fees and expenses | |
| |
| |
| |
Realized and unrealized gains (losses) on investments | |
Net realized gains (losses) on | |
| |
Foreign currency and foreign currency translations | |
| |
Net realized gains on investments | |
Net change in unrealized gains (losses) on | |
| |
Foreign currency and foreign currency translations | |
| |
Net change in unrealized gains (losses) on investments | |
Net realized and unrealized gains (losses) on investments | |
Net increase in net assets resulting from operations | |
The accompanying notes are an integral part of these financial statements.
Allspring Disciplined International Developed Markets Portfolio | 17
Statement of changes in net assets
Statement of changes in net assets
|
Six months ended
November 30, 2023 (unaudited) | |
| | | | |
| | | | |
Net realized gains (losses) on investments | | | | |
Net change in unrealized gains (losses) on investments | | | | |
Net increase in net assets resulting from operations | | | | |
Capital share transactions | | | | |
Transactions in investors’ beneficial interests | | | | |
| | | | |
| | | | |
Net decrease in net assets resulting from capital share transactions | | | | |
Total increase (decrease) in net assets | | | | |
| | | | |
| | | | |
| | | | |
The accompanying notes are an integral part of these financial statements.
18 | Allspring Disciplined International Developed Markets Portfolio
| Six months ended
November 30, 2023
(unaudited) | |
| | | | | |
| | | | | | |
Ratios to average net assets (annualized) | | | | | | |
| | | | | | |
| | | | | | |
| | | | | | |
| | | | | | |
| | | | | | |
| Returns for periods of less than one year are not annualized. |
| Net expense ratios reflect voluntary waivers, if any. |
The accompanying notes are an integral part of these financial statements.
Allspring Disciplined International Developed Markets Portfolio | 19
Notes to financial statements (unaudited)
Notes to financial statements
Allspring Master Trust (the “Trust”), a Delaware statutory trust organized on March 10, 1999, is an open-end management investment company registered under the Investment Company Act of 1940, as amended (the “1940 Act”). As an investment company, the Trust follows the accounting and reporting guidance in Financial Accounting Standards Board (“FASB”) Accounting Standards Codification Topic 946, Financial Services – Investment Companies. These financial statements report on the Allspring Disciplined International Developed Markets Portfolio (the “Portfolio”) which is a diversified series of the Trust.
Interests in the Portfolio are available solely through private placement transactions that do not involve any “public offering” within the meaning of Section 4(a)(2) of the Securities Act of 1933.
2.
SIGNIFICANT ACCOUNTING POLICIES
The following significant accounting policies, which are consistently followed in the preparation of the financial statements of the Portfolio, are in conformity with U.S. generally accepted accounting principles which require management to make estimates and assumptions that affect the reported amounts of assets and liabilities, disclosure of contingent assets and liabilities at the date of the financial statements, and the reported amounts of income and expenses during the reporting period. Actual results could differ from those estimates.
Securities valuation
All investments are valued each business day as of the close of regular trading on the New York Stock Exchange (generally 4 p.m. Eastern Time), although the Portfolio may deviate from this calculation time under unusual or unexpected circumstances.
Equity securities, exchange-traded funds and futures contracts that are listed on a foreign or domestic exchange or market are valued at the official closing price or, if none, the last sales price.
The values of securities denominated in foreign currencies are translated into U.S. dollars at rates provided by an independent foreign currency pricing source at a time each business day specified by the Valuation Committee at Allspring Funds Management, LLC (“Allspring Funds Management”).
Many securities markets and exchanges outside the U.S. close prior to the close of the New York Stock Exchange and therefore may not fully reflect trading or events that occur after the close of the principal exchange in which the foreign securities are traded, but before the close of the New York Stock Exchange. If such trading or events are expected to materially affect the value of such securities, then fair value pricing procedures implemented by Allspring Funds Management are applied. These procedures take into account multiple factors including movements in U.S. securities markets after foreign exchanges close. Foreign securities that are fair valued under these procedures are categorized as Level 2 and the application of these procedures may result in transfers between Level 1 and Level 2. Depending on market activity, such fair valuations may be frequent. Such fair value pricing may result in net asset values that are higher or lower than net asset values based on the last reported sales price or latest quoted bid price. On November 30, 2023, such fair value pricing was not used in pricing foreign securities.
Investments in registered open-end investment companies (other than those listed on a foreign or domestic exchange or market) are valued at net asset value.
Investments which are not valued using the methods discussed above are valued at their fair value, as determined in good faith by Allspring Funds Management, which was named the valuation designee by the Board of Trustees. As the valuation designee, Allspring Funds Management is responsible for day-to-day valuation activities for the Allspring Funds. In connection with these responsibilities, Allspring Funds Management has established a Valuation Committee and has delegated to it the authority to take any actions regarding the valuation of portfolio securities that the Valuation Committee deems necessary or appropriate, including determining the fair value of portfolio securities. On a quarterly basis, the Board of Trustees receives reports of valuation actions taken by the Valuation Committee. On at least an annual basis, the Board of Trustees receives an assessment of the adequacy and effectiveness of Allspring Funds Management’s process for determining the fair value of the portfolio of investments.
Foreign currency translation
The accounting records of the Portfolio are maintained in U.S. dollars. The values of other assets and liabilities denominated in foreign currencies are translated into U.S. dollars at rates provided by an independent foreign currency pricing source at a time each business day specified by the Valuation Committee. Purchases and sales of securities, and income and expenses are converted at the rate of exchange on the respective dates of such transactions. Net realized foreign exchange gains or losses arise from sales of foreign currencies, currency gains or losses realized between the trade and settlement dates on securities transactions, and the difference between the amounts of dividends, interest and foreign withholding taxes recorded and the U.S. dollar equivalent of the amounts actually paid or received. Net unrealized foreign exchange gains and losses arise from changes in the fair value of assets and liabilities other than investments in securities resulting from changes in exchange rates. The changes in net assets arising from changes in exchange rates of securities and the changes in net assets resulting from changes in market prices of securities are not separately presented. Such changes are included in net realized and unrealized gains or losses from investments.
20 | Allspring Disciplined International Developed Markets Portfolio
Notes to financial statements (unaudited)
Futures contracts
Futures contracts are agreements between the Portfolio and a counterparty to buy or sell a specific amount of a commodity, financial instrument or currency at a specified price and on a specified date. The Portfolio may buy and sell futures contracts in order to gain exposure to, or protect against, changes in security values and is subject to equity price risk. The primary risks associated with the use of futures contracts are the imperfect correlation between changes in market values of securities held by the Portfolio and the prices of futures contracts, and the possibility of an illiquid market. Futures contracts are generally entered into on a regulated futures exchange and cleared through a clearinghouse associated with the exchange. With futures contracts, there is minimal counterparty risk to the Portfolio since futures contracts are exchange-traded and the exchange’s clearinghouse, as the counterparty to all exchange-traded futures, guarantees the futures contracts against default.
Upon entering into a futures contracts, the Portfolio is required to deposit either cash or securities (initial margin) with the broker in an amount equal to a certain percentage of the contract value. Subsequent payments (variation margin) are paid to or received from the broker each day equal to the daily changes in the contract value. Such payments are recorded as unrealized gains or losses and, if any, shown as variation margin receivable (payable) in the Statement of Assets and Liabilities. Should the Portfolio fail to make requested variation margin payments, the broker can gain access to the initial margin to satisfy the Portfolio’s payment obligations. When the contracts are closed, a realized gain or loss is recorded in the Statement of Operations.
Security transactions and income recognition
Securities transactions are recorded on a trade date basis. Realized gains or losses are recorded on the basis of identified cost.
Dividend income is recognized on the ex-dividend date, except for certain dividends from foreign securities, which are recorded as soon as the custodian verifies the ex-dividend date. Dividend income is recorded net of foreign taxes withheld where recovery of such taxes is not assured.
Interest earned on cash balances held at the custodian is recorded as interest income.
Distributions received from REIT investments may be characterized as ordinary income, capital gains, or a return of capital to the Portfolio based on information provided by the REIT. The proper characterization of REIT distributions is generally not known until after the end of each calendar year. As such, estimates may be used in reporting the character of income and distributions for financial statement purposes.
Federal and other taxes
The Portfolio is not required to pay federal income taxes on its net investment income and net capital gains as it is treated as a partnership for federal income tax purposes. All income, gains and losses of the Portfolio are deemed to have been “passed through” to the interest holders in proportion to their holdings of the Portfolio regardless of whether income and gains have been distributed by the Portfolio.
The Portfolio’s income tax returns and all financial records supporting those returns for the prior three fiscal years are subject to examination by the federal revenue authority. Management has analyzed the Portfolio’s tax positions taken on federal, state, and foreign tax returns, as applicable, for all open tax years and does not believe that there are any uncertain tax positions that require recognition of a tax liability.
As of November 30, 2023, the aggregate cost of all investments for federal income tax purposes was $103,755,499 and the unrealized gains (losses) consisted of:
3.
FAIR VALUATION MEASUREMENTS
Fair value measurements of investments are determined within a framework that has established a fair value hierarchy based upon the various data inputs utilized in determining the value of the Portfolio’s investments. The three-level hierarchy gives the highest priority to unadjusted quoted prices in active markets for identical assets or liabilities (Level 1) and the lowest priority to unobservable inputs (Level 3). The Portfolio’s investments are classified within the fair value hierarchy based on the lowest level of input that is significant to the fair value measurement. The inputs are summarized into three broad levels as follows:
•Level 1—quoted prices in active markets for identical securities
•Level 2—other significant observable inputs (including quoted prices for similar securities, interest rates, prepayment speeds, credit risk, etc.)
•Level 3—significant unobservable inputs (including the Portfolio’s own assumptions in determining the fair value of investments)
The inputs or methodologies used for valuing investments in securities are not necessarily an indication of the risk associated with investing in those securities.
Allspring Disciplined International Developed Markets Portfolio | 21
Notes to financial statements (unaudited)
The following is a summary of the inputs used in valuing the Portfolio’s assets and liabilities as of November 30, 2023:
| | Other significant
observable inputs
(Level 2) | Significant
unobservable inputs
(Level 3) | |
| | | | |
| | | | |
| | | | |
| | | | |
| | | | |
| | | | |
| | | | |
| | | | |
| | | | |
| | | | |
| | | | |
| | | | |
| | | | |
| | | | |
| | | | |
| | | | |
| | | | |
| | | | |
| | | | |
| | | | |
| | | | |
| | | | |
| | | | |
| | | | |
| | | | |
| | | | |
| | | | |
| | | | |
| | | | |
| | | | |
| | | | |
Futures contracts are reported at their cumulative unrealized gains (losses) at measurement date as reported in the tables following the Portfolio of Investments. For futures contracts, the current day’s variation margin is reported on the Statement of Assets and Liabilities. All other assets and liabilities are reported at their market value at measurement date.
Additional sector, industry or geographic detail, if any, is included in the Portfolio of Investments.
At November 30, 2023, the Portfolio did not have any transfers into/out of Level 3.
4.
TRANSACTIONS WITH AFFILIATES
Advisory fee
The Trust has entered into an advisory contract with Allspring Funds Management, a wholly owned subsidiary of Allspring Global Investments Holdings, LLC, a holding company indirectly owned by certain private funds of GTCR LLC and Reverence Capital Partners, L.P. The adviser is responsible for implementing investment policies and guidelines and for supervising the subadviser, who is responsible for day-to-day portfolio management of the Portfolio. Pursuant to the contract, Allspring Funds Management is entitled to receive an advisory fee at the following annual rate based on the Portfolio’s average daily net assets:
For the six months ended November 30, 2023, the advisory fee was equivalent to an annual rate of 0.25% of the Portfolio’s average daily net assets.
22 | Allspring Disciplined International Developed Markets Portfolio
Notes to financial statements (unaudited)
Allspring Funds Management has retained the services of a subadviser to provide daily portfolio management to the Portfolio. The fee for subadvisory services is borne by Allspring Funds Management. Allspring Global Investments, LLC, an affiliate of Allspring Funds Management and a wholly owned subsidiary of Allspring Global Investments Holdings, LLC, is the subadviser to the Portfolio and is entitled to receive a fee from Allspring Funds Management at an annual rate starting at 0.20% and declining to 0.15% as the average daily net assets of the Portfolio increase.
Interfund transactions
The Portfolio may purchase or sell portfolio investment securities to certain affiliates pursuant to Rule 17a-7 under the 1940 Act and under procedures adopted by the Board of Trustees. The procedures have been designed to ensure that these interfund transactions, which do not incur broker commissions, are effected at current market prices. Pursuant to these procedures, the Portfolio did not have any interfund transactions during the six months ended November 30, 2023.
5.
INVESTMENT PORTFOLIO TRANSACTIONS
Purchases and sales of investments, excluding U.S. government obligations (if any) and short-term securities, for the six months ended November 30, 2023 were $27,048,076 and $31,499,694, respectively.
6.
DERIVATIVE TRANSACTIONS
During the six months ended November 30, 2023, the Portfolio entered into futures contracts to gain market exposure. The Portfolio had an average notional amount of $2,856,152 in long futures contracts during the six months ended November 30, 2023.
The fair value, realized gains or losses and change in unrealized gains or losses, if any, on derivative instruments are reflected in the corresponding financial statement captions.
The Trust, along with Allspring Variable Trust and Allspring Funds Trust (excluding the money market funds), are parties to a $350,000,000 revolving credit agreement whereby the Portfolio is permitted to use bank borrowings for temporary or emergency purposes, such as to fund interest holders withdrawal requests. Interest under the credit agreement is charged to the Portfolio based on borrowing rate equal to the higher of the Federal Funds rate or the overnight bank funding rate in effect on that day plus a spread. In addition, an annual commitment fee based on the unused balance is allocated to each participating fund.
For the six months ended November 30, 2023, there were no borrowings by the Portfolio under the agreement.
As of the end of the period, the Portfolio concentrated its portfolio of investments in Europe. A fund that invests a substantial portion of its assets in any country or geographic region will be more vulnerable than a fund that invests its assets more broadly to the economic, financial, political or other developments affecting that country or region. Such developments may have a significant impact on the Portfolio’s investment performance causing such performance to be more volatile than the investment performance of a more geographically diversified fund.
Under the Portfolio’s organizational documents, the officers and Trustees have been granted certain indemnification rights against certain liabilities that may arise out of performance of their duties to the Portfolio. The Portfolio has entered into a separate agreement with each Trustee that converts indemnification rights currently existing under the Portfolio’s organizational documents into contractual rights that cannot be changed in the future without the consent of the Trustee. Additionally, in the normal course of business, the Portfolio may enter into contracts with service providers that contain a variety of indemnification clauses. The Portfolio’s maximum exposure under these arrangements is dependent on future claims that may be made against the Portfolio and, therefore, cannot be estimated.
Allspring Disciplined International Developed Markets Portfolio | 23
Other information (unaudited)
Other information
Proxy voting information
A description of the policies and procedures used to determine how to vote proxies relating to portfolio securities is available without charge, upon request, by calling 1-866-259-3305, visiting our website at allspringglobal.com, or visiting the SEC website at sec.gov. Information regarding how the proxies related to portfolio securities were voted during the most recent 12-month period ended June 30 is available on the website at allspringglobal.com or by visiting the SEC website at sec.gov.
Quarterly portfolio holdings information
The Portfolio files its complete schedule of portfolio holdings with the SEC for the first and third quarters of each fiscal year as an exhibit to its reports on Form N-PORT. Interest holders may view the filed Form N-PORT by visiting the SEC website at sec.gov.
24 | Allspring Disciplined International Developed Markets Portfolio
Other information (unaudited)
Board of trustees and officers
Each of the Trustees and Officers listed in the table below acts in identical capacities for each fund in the Allspring family of funds, which consists of 126 mutual funds comprising the Allspring Funds Trust, Allspring Variable Trust, Allspring Master Trust and four closed-end funds (collectively the “Fund Complex”). This table should be read in conjunction with the Prospectus and the Statement of Additional Information†. The mailing address of each Trustee and Officer is 1415 Vantage Park Drive, 3rd Floor, Charlotte, NC 28203. Each Trustee and Officer serves an indefinite term, however, each Trustee serves such term until reaching the mandatory retirement age established by the Trustees.
Independent Trustees
| | Principal occupations during past five years or longer | Current other
public company or
investment
company
directorships |
William R. Ebsworth
(Born 1957) | | Retired. From 1984 to 2013, equities analyst, portfolio manager, research director and chief investment officer at Fidelity Management and Research Company in Boston, Tokyo, and Hong Kong, and retired in 2013 as Chief Investment Officer of Fidelity Strategic Advisers, Inc. where he led a team of investment professionals managing client assets. Prior thereto, Board member of Hong Kong Securities Clearing Co., Hong Kong Options Clearing Corp., the Thailand International Fund, Ltd., Fidelity Investments Life Insurance Company, and Empire Fidelity Investments Life Insurance Company. Serves on the Investment Company Institute’s Board of Governors since 2022 and Executive Committee since 2023 as well as the Vice Chairman of the Governing Council of the Independent Directors Council since 2023. Audit Committee Chair and Investment Committee Chair of the Vincent Memorial Hospital Foundation (non-profit organization). Mr. Ebsworth is a CFA charterholder. | |
Jane A. Freeman
(Born 1953) | Trustee,
since 2015;
Chair Liaison,
| Retired. From 2012 to 2014 and 1999 to 2008, Chief Financial Officer of Scientific Learning Corporation. From 2008 to 2012, Ms. Freeman provided consulting services related to strategic business projects. Prior to 1999, Portfolio Manager at Rockefeller & Co. and Scudder, Stevens & Clark. Board member of the Harding Loevner Funds from 1996 to 2014, serving as both Lead Independent Director and chair of the Audit Committee. Board member of the Russell Exchange Traded Funds Trust from 2011 to 2012 and the chair of the Audit Committee. Ms. Freeman is also an inactive Chartered Financial Analyst. | |
Isaiah Harris, Jr.
(Born 1952) | Trustee,
since 2009;
Audit Committee Chair,
since 2019 | Retired. Member of the Advisory Board of CEF of East Central Florida. Chairman of the Board of CIGNA Corporation from 2009 to 2021, and Director from 2005 to 2008. From 2003 to 2011, Director of Deluxe Corporation. Prior thereto, President and CEO of BellSouth Advertising and Publishing Corp. from 2005 to 2007, President and CEO of BellSouth Enterprises from 2004 to 2005 and President of BellSouth Consumer Services from 2000 to 2003. Emeritus member of the Iowa State University Foundation Board of Governors. Emeritus Member of the Advisory board of Iowa State University School of Business. Advisory Board Member, Palm Harbor Academy (private school). Advisory Board Member, Fellowship of Christian Athletes. Mr. Harris is a certified public accountant (inactive status). | |
David F. Larcker
(Born 1950) | | Distinguished Visiting Fellow at the Hoover Institution since 2022. James Irvin Miller Professor of Accounting at the Graduate School of Business (Emeritus), Stanford University, Director of the Corporate Governance Research Initiative and Senior Faculty of The Rock Center for Corporate Governance since 2006. From 2005 to 2008, Professor of Accounting at the Graduate School of Business, Stanford University. Prior thereto, Ernst & Young Professor of Accounting at The Wharton School, University of Pennsylvania from 1985 to 2005. | |
Olivia S. Mitchell
(Born 1953) | | International Foundation of Employee Benefit Plans Professor since 1993, Wharton School of the University of Pennsylvania. Director of Wharton’s Pension Research Council and Boettner Center on Pensions & Retirement Research, and Research Associate at the National Bureau of Economic Research. Previously taught at Cornell University from 1978 to 1993. | |
Timothy J. Penny
(Born 1951) | Trustee,
since 1996;
Chair,
since 2018 | President and Chief Executive Officer of Southern Minnesota Initiative Foundation, a non-profit organization, since 2007. Vice Chair of the Economic Club of Minnesota, since 2007. Co-Chair of the Committee for a Responsible Federal Budget, since 1995. Member of the Board of Trustees of NorthStar Education Finance, Inc., a non-profit organization, from 2007-2022. Senior Fellow of the University of Minnesota Humphrey Institute from 1995 to 2017. | |
* Length of service dates reflect the Trustee’s commencement of service with the Trust’s predecessor entities, where applicable.
# Ms. Freeman will serve as Chair Liaison through June 2024, at which time Ms. Wheelock will assume the role.
†
The Statement of Additional Information includes additional information about the Trustees and is available, without charge, upon request, by calling 1-800-222-8222 or by visiting the website at allspringglobal.com.
Allspring Disciplined International Developed Markets Portfolio | 25
Other information (unaudited)
| Position held and length of service* | Principal occupations during past five years or longer | Current other public company or investment company directorships |
James G. Polisson
(Born 1959) | Trustee,
since 2018; Nominating and Governance Committee Chair, since 2024 | Retired. Chief Marketing Officer, Source (ETF) UK Services, Ltd, from 2015 to 2017. From 2012 to 2015, Principal of The Polisson Group, LLC, a management consulting, corporate advisory and principal investing company. Chief Executive Officer and Managing Director at Russell Investments, Global Exchange Traded Funds from 2010 to 2012. Managing Director of Barclays Global Investors from 1998 to 2010 and Global Chief Marketing Officer for iShares and Barclays Global Investors from 2000 to 2010. Trustee of the San Francisco Mechanics’ Institute, a non- profit organization, from 2013 to 2015. Board member of the Russell Exchange Traded Fund Trust from 2011 to 2012. Director of Barclays Global Investors Holdings Deutschland GmbH from 2006 to 2009. Mr. Polisson is an attorney and has a retired status with the Massachusetts and District of Columbia Bar Associations. | |
Pamela Wheelock
(Born 1959) | Trustee,
since January 2020;
previously Trustee from
January 2018 to
| Retired. Executive and Senior Financial leadership positions in the public, private and nonprofit sectors. Interim President and CEO, McKnight Foundation, 2020. Interim Commissioner, Minnesota Department of Human Services, 2019. Chief Operating Officer, Twin Cities Habitat for Humanity, 2017-2019. Vice President for University Services, University of Minnesota, 2012- 2016. Interim President and CEO, Blue Cross and Blue Shield of Minnesota, 2011-2012. Executive Vice-President and Chief Financial Officer, Minnesota Wild, 2002-2008. Commissioner, Minnesota Department of Finance, 1999-2002. Chair of the Board of Directors of Destination Medical Center Corporation. Board member of the Minnesota Wild Foundation. | |
* Length of service dates reflect the Trustee’s commencement of service with the Trust’s predecessor entities, where applicable.
# Ms. Freeman will serve as Chair Liaison through June 2024, at which time Ms. Wheelock will assume the role.
26 | Allspring Disciplined International Developed Markets Portfolio
Other information (unaudited)
Officers1
| Position held and
length of service | Principal occupations during past five years or longer |
| | President and Chief Executive Officer of Allspring Funds Management, LLC since 2017 and Head of Global Fund Governance of Allspring Global Investments since 2022. Prior thereto, co-president of Galliard Capital Management, LLC, an affiliate of Allspring Funds Management, LLC, from 2019 to 2022 and Head of Affiliated Managers, Allspring Global Investments, from 2014 to 2019 and Executive Vice President responsible for marketing, investments and product development for Allspring Funds Management, LLC, from 2009 to 2014. |
Jeremy DePalma
(Born 1974) | Treasurer,
since 2012
(for certain funds in
the Fund Complex);
since 2021 (for
the remaining funds in the Complex) | Senior Vice President of Allspring Funds Management, LLC since 2009. Senior Vice President of Evergreen Investment Management Company, LLC from 2008 to 2010 and head of the Fund Reporting and Control Team within Fund Administration from 2005 to 2010. |
Christopher Baker
(Born 1976) | Chief Compliance Officer,
since 2022 | Global Chief Compliance Officer for Allspring Global Investments since 2022. Prior thereto, Chief Compliance Officer for State Street Global Advisors from 2018 to 2021. Senior Compliance Officer for the State Street divisions of Alternative Investment Solutions, Sector Solutions, and Global Marketing from 2015 to 2018. From 2010 to 2015 Vice President, Global Head of Investment and Marketing Compliance for State Street Global Advisors. |
Matthew Prasse
(Born 1983) | Chief Legal Officer,
since 2022;
Secretary,
since 2021 | Senior Counsel of the Allspring Legal Department since 2021. Senior Counsel of the Wells Fargo Legal Department from 2018 to 2021. Previously, Counsel for Barings LLC from 2015 to 2018. Prior to joining Barings, Associate at Morgan, Lewis & Bockius LLP from 2008 to 2015. |
1 For those Officers with tenures at Allspring Global Investments and/or Allspring Funds Management, LLC that began prior to 2021, such tenures include years of service during which these businesses/entities were known as Wells Fargo Asset Management and Wells Fargo Funds Management, LLC, respectively.
Allspring Disciplined International Developed Markets Portfolio | 27
This page is intentionally left blank.
For more information
More information about Allspring Funds is available free upon request. To obtain literature, please write, visit the Portfolio’s website, or call:
Allspring Funds
P.O. Box 219967
Kansas City, MO 64121-9967
Website: allspringglobal.com
Individual investors: 1-800-222-8222
Retail investment professionals: 1-888-877-9275
Institutional investment professionals: 1-800-260-5969
This report and the financial statements contained herein are submitted for the general information of the interest holders of the Portfolio. If this report is used for promotional purposes, distribution of the report must be accompanied or preceded by a current prospectus. Before investing, please consider the investment objectives, risks, charges, and expenses of the investment. For a current prospectus and, if available, a summary prospectus, containing this information, call 1-800-222-8222 or visit the Portfolio’s website at allspringglobal.com. Read the prospectus carefully before you invest or send money.
Allspring Global InvestmentsTM is the trade name for the asset management firms of Allspring Global Investments Holdings, LLC, a holding company indirectly owned by certain private funds of GTCR LLC and Reverence Capital Partners, L.P. These firms include but are not limited to Allspring Global Investments, LLC, and Allspring Funds Management, LLC. Certain products managed by Allspring entities are distributed by Allspring Funds Distributor, LLC (a broker-dealer and Member FINRA/SIPC).
This material is for general informational and educational purposes only and is NOT intended to provide investment advice or a recommendation of any kind - including a recommendation for any specific investment, strategy, or plan.
© 2024 Allspring Global Investments Holdings, LLC. All rights reserved.
Allspring Disciplined Large Cap Portfolio
Semi-Annual Report
November 30, 2023
Allspring Disciplined Large Cap Portfolio | 1
Performance highlights (unaudited)
Performance highlights
| The Portfolio seeks long-term capital appreciation. |
| Allspring Funds Management, LLC |
| Allspring Global Investments, LLC |
| Justin P. Carr, CFA, Robert M. Wicentowski, CFA |
Average annual total returns (%) as of November 30, 2023 |
| | | | |
| | | | |
Allspring Disciplined Large Cap Portfolio | | | | |
| | | | |
| | | | |
Figures quoted represent past performance, which is no guarantee of future results, and do not reflect taxes that an investor may pay on an investment in a fund. Investment return and principal value of an investment will fluctuate so that an investor’s shares, when redeemed, may be worth more or less than their original cost. Current performance may be lower or higher than the performance data quoted.
Index returns do not include transaction costs associated with buying and selling securities, any mutual fund fees or expenses, or any taxes. It is not possible to invest directly in an index.
Shares are sold without a front-end sales charge or contingent deferred sales charge.
|
| Based on the Portfolio’s inception date. |
| The Russell 3000® Index measures the performance of the 3,000 largest U.S. companies based on total market capitalization, which represents approximately 98% of the investable U.S. equity market. You cannot invest directly in an index. |
| The Russell 1000® Index measures the performance of the 1,000 largest companies in the Russell 3000® Index, which represents approximately 92% of the total market capitalization of the Russell 3000® Index. You cannot invest directly in an index. |
CFA® and Chartered Financial Analyst® are trademarks owned by CFA Institute. |
2 | Allspring Disciplined Large Cap Portfolio
Performance highlights (unaudited)
Ten largest holdings (%) as of November 30, 20231 |
| |
| |
| |
| |
Meta Platforms, Inc. Class A | |
| |
| |
Berkshire Hathaway, Inc. Class B | |
| |
| |
| Figures represent the percentage of the Portfolio’s net assets. Holdings are subject to change and may have changed since the date specified. |
Sector allocation as of November 30, 20231 |
| Figures represent the percentage of the Portfolio’s long-term investments. Allocations are subject to change and may have changed since the date specified. |
Allspring Disciplined Large Cap Portfolio | 3
Portfolio expenses (unaudited)
Portfolio expenses
As an investor of beneficial interest of the Portfolio, you incur ongoing costs, including advisory fees and other Portfolio expenses. This example is intended to help you understand your ongoing costs (in dollars) of investing in the Portfolio and to compare these costs with the ongoing costs of investing in other mutual funds.
The example is based on an investment of $1,000 invested at the beginning of the six-month period and held for the entire period from June 1, 2023 to November 30, 2023.
Actual expenses
The “Actual” line of the table below provides information about actual account values and actual expenses. You may use the information in this line, together with the amount you invested, to estimate the expenses that you paid over the period. Simply divide your account value by $1,000 (for example, an $8,600 account value divided by $1,000= 8.6), then multiply the result by the number in the “Actual” line under the heading entitled “Expenses paid during period” for your applicable class of shares to estimate the expenses you paid on your account during this period.
Hypothetical example for comparison purposes
The “Hypothetical” line of the table below provides information about hypothetical account values and hypothetical expenses based on the Portfolio’s actual expense ratio and an assumed rate of return of 5% per year before expenses, which is not the Portfolio’s actual return. The hypothetical account values and expenses may not be used to estimate the actual ending account balance or expenses you paid for the period. You may use this information to compare the ongoing costs of investing in the Portfolio and other funds. To do so, compare this 5% hypothetical example with the 5% hypothetical examples that appear in the shareholder reports of the other funds.
Please note that the expenses shown in the table are meant to highlight your ongoing costs only. Therefore, the “Hypothetical” line of the table is useful in comparing ongoing costs only, and will not help you determine the relative total costs of owning different funds.
| Beginning
account value
6-1-2023 | Ending
account value
11-30-2023 | | Annualized net
expense ratio |
| | | | |
Hypothetical (5% return before expenses) | | | | |
| Expenses paid is equal to the annualized net expense ratio multiplied by the average account value over the period, multiplied by 183 divided by 366 (to reflect the one-half-year period). |
4 | Allspring Disciplined Large Cap Portfolio
Portfolio of investments—November 30, 2023 (unaudited)
| | | | | |
| | | | | | |
Communication services: 8.75% | | | | | | |
Diversified telecommunication services: 0.55% | | | | | | |
| | | | | | |
Verizon Communications, Inc. | | | | | | |
| | | | | | |
| | | | | | |
Live Nation Entertainment, Inc.† | | | | | | |
| | | | | | |
| | | | | | |
| | | | | | |
Interactive media & services: 6.30% | | | | | | |
| | | | | | |
| | | | | | |
Meta Platforms, Inc. Class A† | | | | | | |
| | | | | | |
| | | | | | |
| | | | | | |
| | | | | | |
Trade Desk, Inc. Class A† | | | | | | |
| | | | | | |
Consumer discretionary: 10.16% | | | | | | |
| | | | | | |
| | | | | | |
| | | | | | |
| | | | | | |
| | | | | | |
| | | | | | |
| | | | | | |
| | | | | | |
| | | | | | |
Hotels, restaurants & leisure: 1.69% | | | | | | |
| | | | | | |
| | | | | | |
| | | | | | |
| | | | | | |
Penn Entertainment, Inc.† | | | | | | |
Royal Caribbean Cruises Ltd.† | | | | | | |
| | | | | | |
Household durables: 0.93% | | | | | | |
| | | | | | |
The accompanying notes are an integral part of these financial statements.
Allspring Disciplined Large Cap Portfolio | 5
Portfolio of investments—November 30, 2023 (unaudited)
| | | | | |
Household durables(continued) | | | | | | |
| | | | | | |
| | | | | | |
| | | | | | |
| | | | | | |
| | | | | | |
O’Reilly Automotive, Inc.† | | | | | | |
| | | | | | |
| | | | | | |
| | | | | | |
Textiles, apparel & luxury goods: 0.71% | | | | | | |
| | | | | | |
lululemon athletica, Inc.† | | | | | | |
| | | | | | |
| | | | | | |
| | | | | | |
| | | | | | |
| | | | | | |
| | | | | | |
| | | | | | |
Consumer staples distribution & retail: 2.41% | | | | | | |
| | | | | | |
| | | | | | |
| | | | | | |
| | | | | | |
| | | | | | |
| | | | | | |
Archer-Daniels-Midland Co. | | | | | | |
| | | | | | |
| | | | | | |
| | | | | | |
Household products: 1.08% | | | | | | |
| | | | | | |
| | | | | | |
| | | | | | |
| | | | | | |
| | | | | | |
| | | | | | |
Philip Morris International, Inc. | | | | | | |
| | | | | | |
The accompanying notes are an integral part of these financial statements.
6 | Allspring Disciplined Large Cap Portfolio
Portfolio of investments—November 30, 2023 (unaudited)
| | | | | |
| | | | | | |
Energy equipment & services: 0.35% | | | | | | |
| | | | | | |
Oil, gas & consumable fuels: 3.57% | | | | | | |
| | | | | | |
| | | | | | |
| | | | | | |
| | | | | | |
| | | | | | |
| | | | | | |
| | | | | | |
| | | | | | |
| | | | | | |
| | | | | | |
| | | | | | |
| | | | | | |
| | | | | | |
| | | | | | |
| | | | | | |
New York Community Bancorp, Inc. | | | | | | |
| | | | | | |
| | | | | | |
| | | | | | |
Ameriprise Financial, Inc. | | | | | | |
Bank of New York Mellon Corp. | | | | | | |
| | | | | | |
Coinbase Global, Inc. Class A† | | | | | | |
Goldman Sachs Group, Inc. | | | | | | |
Interactive Brokers Group, Inc. Class A | | | | | | |
Jefferies Financial Group, Inc. | | | | | | |
| | | | | | |
| | | | | | |
| | | | | | |
| | | | | | |
Capital One Financial Corp. | | | | | | |
| | | | | | |
| | | | | | |
Financial services: 5.45% | | | | | | |
Apollo Global Management, Inc. | | | | | | |
Berkshire Hathaway, Inc. Class B† | | | | | | |
| | | | | | |
Corebridge Financial, Inc. | | | | | | |
| | | | | | |
FleetCor Technologies, Inc.† | | | | | | |
| | | | | | |
The accompanying notes are an integral part of these financial statements.
Allspring Disciplined Large Cap Portfolio | 7
Portfolio of investments—November 30, 2023 (unaudited)
| | | | | |
Financial services(continued) | | | | | | |
| | | | | | |
| | | | | | |
| | | | | | |
| | | | | | |
| | | | | | |
| | | | | | |
| | | | | | |
Cincinnati Financial Corp. | | | | | | |
| | | | | | |
F&G Annuities & Life, Inc. | | | | | | |
Hartford Financial Services Group, Inc. | | | | | | |
| | | | | | |
| | | | | | |
Reinsurance Group of America, Inc. | | | | | | |
| | | | | | |
| | | | | | |
| | | | | | |
| | | | | | |
| | | | | | |
| | | | | | |
| | | | | | |
| | | | | | |
| | | | | | |
| | | | | | |
| | | | | | |
United Therapeutics Corp.† | | | | | | |
Vertex Pharmaceuticals, Inc.† | | | | | | |
| | | | | | |
Health care equipment & supplies: 2.83% | | | | | | |
| | | | | | |
| | | | | | |
| | | | | | |
Edwards Lifesciences Corp.† | | | | | | |
Intuitive Surgical, Inc.† | | | | | | |
| | | | | | |
| | | | | | |
| | | | | | |
Zimmer Biomet Holdings, Inc. | | | | | | |
| | | | | | |
Health care providers & services: 3.43% | | | | | | |
| | | | | | |
| | | | | | |
| | | | | | |
| | | | | | |
| | | | | | |
The accompanying notes are an integral part of these financial statements.
8 | Allspring Disciplined Large Cap Portfolio
Portfolio of investments—November 30, 2023 (unaudited)
| | | | | |
Health care providers & services(continued) | | | | | | |
| | | | | | |
| | | | | | |
| | | | | | |
Health care technology: 0.13% | | | | | | |
Veeva Systems, Inc. Class A† | | | | | | |
Life sciences tools & services: 0.40% | | | | | | |
| | | | | | |
Thermo Fisher Scientific, Inc. | | | | | | |
| | | | | | |
| | | | | | |
| | | | | | |
| | | | | | |
| | | | | | |
| | | | | | |
| | | | | | |
| | | | | | |
| | | | | | |
| | | | | | |
| | | | | | |
Aerospace & defense: 1.40% | | | | | | |
| | | | | | |
| | | | | | |
| | | | | | |
| | | | | | |
| | | | | | |
Air freight & logistics: 0.80% | | | | | | |
Expeditors International of Washington, Inc. | | | | | | |
United Parcel Service, Inc. Class B | | | | | | |
| | | | | | |
| | | | | | |
Builders FirstSource, Inc.† | | | | | | |
| | | | | | |
| | | | | | |
| | | | | | |
| | | | | | |
Commercial services & supplies: 0.58% | | | | | | |
| | | | | | |
| | | | | | |
| | | | | | |
Construction & engineering: 0.47% | | | | | | |
| | | | | | |
The accompanying notes are an integral part of these financial statements.
Allspring Disciplined Large Cap Portfolio | 9
Portfolio of investments—November 30, 2023 (unaudited)
| | | | | |
Electrical equipment: 0.86% | | | | | | |
| | | | | | |
| | | | | | |
| | | | | | |
Rockwell Automation, Inc. | | | | | | |
| | | | | | |
Ground transportation: 0.27% | | | | | | |
| | | | | | |
Industrial conglomerates: 0.26% | | | | | | |
| | | | | | |
Honeywell International, Inc. | | | | | | |
| | | | | | |
| | | | | | |
| | | | | | |
Allison Transmission Holdings, Inc. | | | | | | |
| | | | | | |
| | | | | | |
| | | | | | |
| | | | | | |
| | | | | | |
| | | | | | |
Passenger airlines: 0.41% | | | | | | |
United Airlines Holdings, Inc.† | | | | | | |
Professional services: 0.58% | | | | | | |
Automatic Data Processing, Inc. | | | | | | |
| | | | | | |
| | | | | | |
| | | | | | |
Trading companies & distributors: 0.39% | | | | | | |
MSC Industrial Direct Co., Inc. Class A | | | | | | |
| | | | | | |
| | | | | | |
Information technology: 28.02% | | | | | | |
Communications equipment: 1.21% | | | | | | |
| | | | | | |
| | | | | | |
| | | | | | |
| | | | | | |
Electronic equipment, instruments & components: 0.38% | | | | | | |
| | | | | | |
| | | | | | |
| | | | | | |
The accompanying notes are an integral part of these financial statements.
10 | Allspring Disciplined Large Cap Portfolio
Portfolio of investments—November 30, 2023 (unaudited)
| | | | | |
| | | | | | |
| | | | | | |
| | | | | | |
| | | | | | |
| | | | | | |
Semiconductors & semiconductor equipment: 7.10% | | | | | | |
Advanced Micro Devices, Inc.† | | | | | | |
| | | | | | |
| | | | | | |
| | | | | | |
| | | | | | |
| | | | | | |
| | | | | | |
| | | | | | |
Microchip Technology, Inc. | | | | | | |
| | | | | | |
| | | | | | |
| | | | | | |
| | | | | | |
| | | | | | |
| | | | | | |
| | | | | | |
Cadence Design Systems, Inc.† | | | | | | |
Crowdstrike Holdings, Inc. Class A† | | | | | | |
| | | | | | |
| | | | | | |
| | | | | | |
| | | | | | |
Manhattan Associates, Inc.† | | | | | | |
| | | | | | |
| | | | | | |
| | | | | | |
Palantir Technologies, Inc. Class A† | | | | | | |
RingCentral, Inc. Class A† | | | | | | |
| | | | | | |
| | | | | | |
| | | | | | |
Zoom Video Communications, Inc. Class A† | | | | | | |
| | | | | | |
Technology hardware, storage & peripherals: 6.56% | | | | | | |
| | | | | | |
| | | | | | |
| | | | | | |
| | | | | | |
CF Industries Holdings, Inc. | | | | | | |
LyondellBasell Industries NV Class A | | | | | | |
The accompanying notes are an integral part of these financial statements.
Allspring Disciplined Large Cap Portfolio | 11
Portfolio of investments—November 30, 2023 (unaudited)
| | | | | |
| | | | | | |
| | | | | | |
| | | | | | |
| | | | | | |
| | | | | | |
Containers & packaging: 0.15% | | | | | | |
Graphic Packaging Holding Co. | | | | | | |
Packaging Corp. of America | | | | | | |
| | | | | | |
| | | | | | |
| | | | | | |
| | | | | | |
Reliance Steel & Aluminum Co. | | | | | | |
| | | | | | |
| | | | | | |
| | | | | | |
Hotel & resort REITs: 0.18% | | | | | | |
Host Hotels & Resorts, Inc. | | | | | | |
| | | | | | |
| | | | | | |
Residential REITs : 0.28% | | | | | | |
AvalonBay Communities, Inc. | | | | | | |
| | | | | | |
| | | | | | |
| | | | | | |
| | | | | | |
Simon Property Group, Inc. | | | | | | |
| | | | | | |
Specialized REITs : 0.92% | | | | | | |
| | | | | | |
Extra Space Storage, Inc. | | | | | | |
| | | | | | |
| | | | | | |
| | | | | | |
| | | | | | |
Electric utilities: 0.77% | | | | | | |
American Electric Power Co., Inc. | | | | | | |
| | | | | | |
| | | | | | |
| | | | | | |
| | | | | | |
The accompanying notes are an integral part of these financial statements.
12 | Allspring Disciplined Large Cap Portfolio
Portfolio of investments—November 30, 2023 (unaudited)
| | | | | |
| | | | | | |
| | | | | | |
Independent power and renewable electricity producers: 0.33% | | | | | | |
Brookfield Renewable Corp. Class A | | | | | | |
| | | | | | |
| | | | | | |
| | | | | | |
Consolidated Edison, Inc. | | | | | | |
Public Service Enterprise Group, Inc. | | | | | | |
| | | | | | |
Total common stocks (Cost $132,414,364) | | | | | | |
| | | | | |
Short-term investments: 1.74% | | | | | | |
Investment companies: 1.74% | | | | | | |
Allspring Government Money Market Fund Select Class♠∞ | | | | | | |
Total short-term investments (Cost $3,682,291) | | | | | | |
Total investments in securities (Cost $136,096,655) | | | | | | |
Other assets and liabilities, net | | | | | | |
| | | | | | |
| Non-income-earning security |
| The issuer of the security is an affiliated person of the Portfolio as defined in the Investment Company Act of 1940. |
| The rate represents the 7-day annualized yield at period end. |
|
| Real estate investment trust |
Investments in affiliates
An affiliated investment is an investment in which the Portfolio owns at least 5% of the outstanding voting shares of the issuer or as a result of other relationships, such as the Portfolio and the issuer having the same adviser or investment manager. Transactions with issuers that were affiliates of the Portfolio at the end of the period were as follows:
| | | | | Net
change in
unrealized
gains
(losses) | | | Income
from
affiliated
securities |
| | | | | | | | |
Allspring Government Money Market Fund Select Class | | | | | | | | |
Futures contracts
The accompanying notes are an integral part of these financial statements.
Allspring Disciplined Large Cap Portfolio | 13
Statement of assets and liabilities—November 30, 2023 (unaudited)
Financial statements
Statement of assets and liabilities
| |
Investments in unaffiliated securities, at value (cost $132,414,364) | |
Investments in affiliated securities, at value (cost $3,682,291) | |
| |
Cash at broker segregated for futures contracts | |
| |
Receivable for daily variation margin on open futures contracts | |
Prepaid expenses and other assets | |
| |
| |
| |
Professional fees payable | |
Custody and accounting fees payable | |
Interest holder report expenses payable | |
Trustees’ fees and expenses payable | |
Accrued expenses and other liabilities | |
| |
| |
The accompanying notes are an integral part of these financial statements.
14 | Allspring Disciplined Large Cap Portfolio
Statement of operations—six months ended November 30, 2023 (unaudited)
Statement of operations
| |
Dividends (net of foreign withholdings taxes of $5,538) | |
Income from affiliated securities | |
| |
| |
| |
| |
Custody and accounting fees | |
| |
Interest holder report expenses | |
Trustees’ fees and expenses | |
| |
| |
| |
Realized and unrealized gains (losses) on investments | |
| |
| |
| |
Net realized gains on investments | |
Net change in unrealized gains (losses) on | |
| |
| |
Net change in unrealized gains (losses) on investments | |
Net realized and unrealized gains (losses) on investments | |
Net increase in net assets resulting from operations | |
The accompanying notes are an integral part of these financial statements.
Allspring Disciplined Large Cap Portfolio | 15
Statement of changes in net assets
Statement of changes in net assets
|
Six months ended
November 30, 2023 (unaudited) | |
| | | | |
| | | | |
Net realized gains on investments | | | | |
Net change in unrealized gains (losses) on investments | | | | |
Net increase in net assets resulting from operations | | | | |
Capital share transactions | | | | |
Transactions in investors’ beneficial interests | | | | |
| | | | |
| | | | |
Net decrease in net assets resulting from capital share transactions | | | | |
Total decrease in net assets | | | | |
| | | | |
| | | | |
| | | | |
The accompanying notes are an integral part of these financial statements.
16 | Allspring Disciplined Large Cap Portfolio
| Six months ended
November 30, 2023
(unaudited) | |
| | | | | |
| | | | | | |
Ratios to average net assets (annualized) | | | | | | |
| | | | | | |
| | | | | | |
| | | | | | |
| | | | | | |
| For the period from June 12, 2018 (commencement of operations) to May 31, 2019 |
| Returns for periods of less than one year are not annualized. |
The accompanying notes are an integral part of these financial statements.
Allspring Disciplined Large Cap Portfolio | 17
Notes to financial statements (unaudited)
Notes to financial statements
Allspring Master Trust (the “Trust”), a Delaware statutory trust organized on March 10, 1999, is an open-end management investment company registered under the Investment Company Act of 1940, as amended (the “1940 Act”). As an investment company, the Trust follows the accounting and reporting guidance in Financial Accounting Standards Board (“FASB”) Accounting Standards Codification Topic 946, Financial Services – Investment Companies. These financial statements report on the Allspring Disciplined Large Cap Portfolio (the “Portfolio”) which is a diversified series of the Trust.
Interests in the Portfolio are available solely through private placement transactions that do not involve any “public offering” within the meaning of Section 4(a)(2) of the Securities Act of 1933.
2.
SIGNIFICANT ACCOUNTING POLICIES
The following significant accounting policies, which are consistently followed in the preparation of the financial statements of the Portfolio, are in conformity with U.S. generally accepted accounting principles which require management to make estimates and assumptions that affect the reported amounts of assets and liabilities, disclosure of contingent assets and liabilities at the date of the financial statements, and the reported amounts of income and expenses during the reporting period. Actual results could differ from those estimates.
Securities valuation
All investments are valued each business day as of the close of regular trading on the New York Stock Exchange (generally 4 p.m. Eastern Time), although the Portfolio may deviate from this calculation time under unusual or unexpected circumstances.
Equity securities, exchange-traded funds and futures contracts that are listed on a foreign or domestic exchange or market are valued at the official closing price or, if none, the last sales price.
Investments in registered open-end investment companies (other than those listed on a foreign or domestic exchange or market) are valued at net asset value.
Investments which are not valued using the methods discussed above are valued at their fair value, as determined in good faith by Allspring Funds Management, LLC (“Allspring Funds Management”), which was named the valuation designee by the Board of Trustees. As the valuation designee, Allspring Funds Management is responsible for day-to-day valuation activities for the Allspring Funds. In connection with these responsibilities, Allspring Funds Management has established a Valuation Committee and has delegated to it the authority to take any actions regarding the valuation of portfolio securities that the Valuation Committee deems necessary or appropriate, including determining the fair value of portfolio securities. On a quarterly basis, the Board of Trustees receives reports of valuation actions taken by the Valuation Committee. On at least an annual basis, the Board of Trustees receives an assessment of the adequacy and effectiveness of Allspring Funds Management’s process for determining the fair value of the portfolio of investments.
Futures contracts
Futures contracts are agreements between the Portfolio and a counterparty to buy or sell a specific amount of a commodity, financial instrument or currency at a specified price and on a specified date. The Portfolio may buy and sell futures contracts in order to gain exposure to, or protect against, changes in security values and is subject to equity price risk. The primary risks associated with the use of futures contracts are the imperfect correlation between changes in market values of securities held by the Portfolio and the prices of futures contracts, and the possibility of an illiquid market. Futures contracts are generally entered into on a regulated futures exchange and cleared through a clearinghouse associated with the exchange. With futures contracts, there is minimal counterparty risk to the Portfolio since futures contracts are exchange-traded and the exchange’s clearinghouse, as the counterparty to all exchange-traded futures, guarantees the futures contracts against default.
Upon entering into a futures contracts, the Portfolio is required to deposit either cash or securities (initial margin) with the broker in an amount equal to a certain percentage of the contract value. Subsequent payments (variation margin) are paid to or received from the broker each day equal to the daily changes in the contract value. Such payments are recorded as unrealized gains or losses and, if any, shown as variation margin receivable (payable) in the Statement of Assets and Liabilities. Should the Portfolio fail to make requested variation margin payments, the broker can gain access to the initial margin to satisfy the Portfolio’s payment obligations. When the contracts are closed, a realized gain or loss is recorded in the Statement of Operations.
Security transactions and income recognition
Securities transactions are recorded on a trade date basis. Realized gains or losses are recorded on the basis of identified cost.
Dividend income is recognized on the ex-dividend date. Dividend income is recorded net of foreign taxes withheld where recovery of such taxes is not assured.
Interest earned on cash balances held at the custodian is recorded as interest income.
Distributions received from REIT investments may be characterized as ordinary income, capital gains, or a return of capital to the Portfolio based on information provided by the REIT. The proper characterization of REIT distributions is generally not known until after the end of each calendar year. As such, estimates may be used in reporting the character of income and distributions for financial statement purposes.
18 | Allspring Disciplined Large Cap Portfolio
Notes to financial statements (unaudited)
Federal and other taxes
The Portfolio is not required to pay federal income taxes on its net investment income and net capital gains as it is treated as a partnership for federal income tax purposes. All income, gains and losses of the Portfolio are deemed to have been “passed through” to the interest holders in proportion to their holdings of the Portfolio regardless of whether income and gains have been distributed by the Portfolio.
The Portfolio’s income tax returns and all financial records supporting those returns for the prior three fiscal years are subject to examination by the federal revenue authority. Management has analyzed the Portfolio’s tax positions taken on federal, state, and foreign tax returns, as applicable, for all open tax years and does not believe that there are any uncertain tax positions that require recognition of a tax liability.
As of November 30, 2023, the aggregate cost of all investments for federal income tax purposes was $136,742,623 and the unrealized gains (losses) consisted of:
3.
FAIR VALUATION MEASUREMENTS
Fair value measurements of investments are determined within a framework that has established a fair value hierarchy based upon the various data inputs utilized in determining the value of the Portfolio’s investments. The three-level hierarchy gives the highest priority to unadjusted quoted prices in active markets for identical assets or liabilities (Level 1) and the lowest priority to unobservable inputs (Level 3). The Portfolio’s investments are classified within the fair value hierarchy based on the lowest level of input that is significant to the fair value measurement. The inputs are summarized into three broad levels as follows:
•Level 1—quoted prices in active markets for identical securities
•Level 2—other significant observable inputs (including quoted prices for similar securities, interest rates, prepayment speeds, credit risk, etc.)
•Level 3—significant unobservable inputs (including the Portfolio’s own assumptions in determining the fair value of investments)
The inputs or methodologies used for valuing investments in securities are not necessarily an indication of the risk associated with investing in those securities.
The following is a summary of the inputs used in valuing the Portfolio’s assets and liabilities as of November 30, 2023:
| | Other significant
observable inputs
(Level 2) | Significant
unobservable inputs
(Level 3) | |
| | | | |
| | | | |
| | | | |
| | | | |
| | | | |
| | | | |
| | | | |
| | | | |
| | | | |
| | | | |
| | | | |
| | | | |
| | | | |
| | | | |
| | | | |
| | | | |
| | | | |
| | | | |
| | | | |
Futures contracts are reported at their cumulative unrealized gains (losses) at measurement date as reported in the table following the Portfolio of Investments. For futures contracts, the current day’s variation margin is reported on the Statement of Assets and Liabilities. All other assets and liabilities are reported at their market value at measurement date.
Additional sector, industry or geographic detail, if any, is included in the Portfolio of Investments.
Allspring Disciplined Large Cap Portfolio | 19
Notes to financial statements (unaudited)
At November 30, 2023, the Portfolio did not have any transfers into/out of Level 3.
4.
TRANSACTIONS WITH AFFILIATES
Advisory fee
The Trust has entered into an advisory contract with Allspring Funds Management, a wholly owned subsidiary of Allspring Global Investments Holdings, LLC, a holding company indirectly owned by certain private funds of GTCR LLC and Reverence Capital Partners, L.P. The adviser is responsible for implementing investment policies and guidelines and for supervising the subadviser, who is responsible for day-to-day portfolio management of the Portfolio. Pursuant to the contract, Allspring Funds Management is entitled to receive an advisory fee at the following annual rate based on the Portfolio’s average daily net assets:
For the six months ended November 30, 2023, the advisory fee was equivalent to an annual rate of 0.25% of the Portfolio’s average daily net assets.
Allspring Funds Management has retained the services of a subadviser to provide daily portfolio management to the Portfolio. The fee for subadvisory services is borne by Allspring Funds Management. Allspring Global Investments, LLC, an affiliate of Allspring Funds Management and a wholly owned subsidiary of Allspring Global Investments Holdings, LLC, is the subadviser to the Portfolio and is entitled to receive a fee from Allspring Funds Management at an annual rate starting at 0.20% and declining to 0.15% as the average daily net assets of the Portfolio increase.
Interfund transactions
The Portfolio may purchase or sell portfolio investment securities to certain affiliates pursuant to Rule 17a-7 under the 1940 Act and under procedures adopted by the Board of Trustees. The procedures have been designed to ensure that these interfund transactions, which do not incur broker commissions, are effected at current market prices. Pursuant to these procedures, the Portfolio did not have any interfund transactions during the six months ended November 30, 2023.
5.
INVESTMENT PORTFOLIO TRANSACTIONS
Purchases and sales of investments, excluding U.S. government obligations (if any) and short-term securities, for the six months ended November 30, 2023 were $33,939,484 and $60,293,278, respectively.
6.
DERIVATIVE TRANSACTIONS
During the six months ended November 30, 2023, the Portfolio entered into futures contracts to gain market exposure. The Portfolio had an average notional amount of $3,377,842 in long futures contracts during the six months ended November 30, 2023.
The fair value, realized gains or losses and change in unrealized gains or losses, if any, on derivative instruments are reflected in the corresponding financial statement captions.
The Trust, along with Allspring Variable Trust and Allspring Funds Trust (excluding the money market funds), are parties to a $350,000,000 revolving credit agreement whereby the Portfolio is permitted to use bank borrowings for temporary or emergency purposes, such as to fund interest holders withdrawal requests. Interest under the credit agreement is charged to the Portfolio based on borrowing rate equal to the higher of the Federal Funds rate or the overnight bank funding rate in effect on that day plus a spread. In addition, an annual commitment fee based on the unused balance is allocated to each participating fund.
For the six months ended November 30, 2023, there were no borrowings by the Portfolio under the agreement.
As of the end of the period, the Portfolio concentrated its portfolio of investments in the information technology sector. A fund that invests a substantial portion of its assets in any sector may be more affected by changes in that sector than would be a fund whose investments are not heavily weighted in any sector.
Under the Portfolio’s organizational documents, the officers and Trustees have been granted certain indemnification rights against certain liabilities that may arise out of performance of their duties to the Portfolio. The Portfolio has entered into a separate agreement with each Trustee that converts indemnification rights currently existing under the Portfolio’s organizational documents into contractual rights that cannot be changed in the future
20 | Allspring Disciplined Large Cap Portfolio
Notes to financial statements (unaudited)
without the consent of the Trustee. Additionally, in the normal course of business, the Portfolio may enter into contracts with service providers that contain a variety of indemnification clauses. The Portfolio’s maximum exposure under these arrangements is dependent on future claims that may be made against the Portfolio and, therefore, cannot be estimated.
Allspring Disciplined Large Cap Portfolio | 21
Other information (unaudited)
Other information
Proxy voting information
A description of the policies and procedures used to determine how to vote proxies relating to portfolio securities is available without charge, upon request, by calling 1-866-259-3305, visiting our website at allspringglobal.com, or visiting the SEC website at sec.gov. Information regarding how the proxies related to portfolio securities were voted during the most recent 12-month period ended June 30 is available on the website at allspringglobal.com or by visiting the SEC website at sec.gov.
Quarterly portfolio holdings information
The Portfolio files its complete schedule of portfolio holdings with the SEC for the first and third quarters of each fiscal year as an exhibit to its reports on Form N-PORT. Interest holders may view the filed Form N-PORT by visiting the SEC website at sec.gov.
22 | Allspring Disciplined Large Cap Portfolio
Other information (unaudited)
Board of trustees and officers
Each of the Trustees and Officers listed in the table below acts in identical capacities for each fund in the Allspring family of funds, which consists of 126 mutual funds comprising the Allspring Funds Trust, Allspring Variable Trust, Allspring Master Trust and four closed-end funds (collectively the “Fund Complex”). This table should be read in conjunction with the Prospectus and the Statement of Additional Information†. The mailing address of each Trustee and Officer is 1415 Vantage Park Drive, 3rd Floor, Charlotte, NC 28203. Each Trustee and Officer serves an indefinite term, however, each Trustee serves such term until reaching the mandatory retirement age established by the Trustees.
Independent Trustees
| | Principal occupations during past five years or longer | Current other
public company or
investment
company
directorships |
William R. Ebsworth
(Born 1957) | | Retired. From 1984 to 2013, equities analyst, portfolio manager, research director and chief investment officer at Fidelity Management and Research Company in Boston, Tokyo, and Hong Kong, and retired in 2013 as Chief Investment Officer of Fidelity Strategic Advisers, Inc. where he led a team of investment professionals managing client assets. Prior thereto, Board member of Hong Kong Securities Clearing Co., Hong Kong Options Clearing Corp., the Thailand International Fund, Ltd., Fidelity Investments Life Insurance Company, and Empire Fidelity Investments Life Insurance Company. Serves on the Investment Company Institute’s Board of Governors since 2022 and Executive Committee since 2023 as well as the Vice Chairman of the Governing Council of the Independent Directors Council since 2023. Audit Committee Chair and Investment Committee Chair of the Vincent Memorial Hospital Foundation (non-profit organization). Mr. Ebsworth is a CFA charterholder. | |
Jane A. Freeman
(Born 1953) | Trustee,
since 2015;
Chair Liaison,
| Retired. From 2012 to 2014 and 1999 to 2008, Chief Financial Officer of Scientific Learning Corporation. From 2008 to 2012, Ms. Freeman provided consulting services related to strategic business projects. Prior to 1999, Portfolio Manager at Rockefeller & Co. and Scudder, Stevens & Clark. Board member of the Harding Loevner Funds from 1996 to 2014, serving as both Lead Independent Director and chair of the Audit Committee. Board member of the Russell Exchange Traded Funds Trust from 2011 to 2012 and the chair of the Audit Committee. Ms. Freeman is also an inactive Chartered Financial Analyst. | |
Isaiah Harris, Jr.
(Born 1952) | Trustee,
since 2009;
Audit Committee Chair,
since 2019 | Retired. Member of the Advisory Board of CEF of East Central Florida. Chairman of the Board of CIGNA Corporation from 2009 to 2021, and Director from 2005 to 2008. From 2003 to 2011, Director of Deluxe Corporation. Prior thereto, President and CEO of BellSouth Advertising and Publishing Corp. from 2005 to 2007, President and CEO of BellSouth Enterprises from 2004 to 2005 and President of BellSouth Consumer Services from 2000 to 2003. Emeritus member of the Iowa State University Foundation Board of Governors. Emeritus Member of the Advisory board of Iowa State University School of Business. Advisory Board Member, Palm Harbor Academy (private school). Advisory Board Member, Fellowship of Christian Athletes. Mr. Harris is a certified public accountant (inactive status). | |
David F. Larcker
(Born 1950) | | Distinguished Visiting Fellow at the Hoover Institution since 2022. James Irvin Miller Professor of Accounting at the Graduate School of Business (Emeritus), Stanford University, Director of the Corporate Governance Research Initiative and Senior Faculty of The Rock Center for Corporate Governance since 2006. From 2005 to 2008, Professor of Accounting at the Graduate School of Business, Stanford University. Prior thereto, Ernst & Young Professor of Accounting at The Wharton School, University of Pennsylvania from 1985 to 2005. | |
Olivia S. Mitchell
(Born 1953) | | International Foundation of Employee Benefit Plans Professor since 1993, Wharton School of the University of Pennsylvania. Director of Wharton’s Pension Research Council and Boettner Center on Pensions & Retirement Research, and Research Associate at the National Bureau of Economic Research. Previously taught at Cornell University from 1978 to 1993. | |
Timothy J. Penny
(Born 1951) | Trustee,
since 1996;
Chair,
since 2018 | President and Chief Executive Officer of Southern Minnesota Initiative Foundation, a non-profit organization, since 2007. Vice Chair of the Economic Club of Minnesota, since 2007. Co-Chair of the Committee for a Responsible Federal Budget, since 1995. Member of the Board of Trustees of NorthStar Education Finance, Inc., a non-profit organization, from 2007-2022. Senior Fellow of the University of Minnesota Humphrey Institute from 1995 to 2017. | |
* Length of service dates reflect the Trustee’s commencement of service with the Trust’s predecessor entities, where applicable.
# Ms. Freeman will serve as Chair Liaison through June 2024, at which time Ms. Wheelock will assume the role.
†
The Statement of Additional Information includes additional information about the Trustees and is available, without charge, upon request, by calling 1-800-222-8222 or by visiting the website at allspringglobal.com.
Allspring Disciplined Large Cap Portfolio | 23
Other information (unaudited)
| Position held and length of service* | Principal occupations during past five years or longer | Current other public company or investment company directorships |
James G. Polisson
(Born 1959) | Trustee,
since 2018; Nominating and Governance Committee Chair, since 2024 | Retired. Chief Marketing Officer, Source (ETF) UK Services, Ltd, from 2015 to 2017. From 2012 to 2015, Principal of The Polisson Group, LLC, a management consulting, corporate advisory and principal investing company. Chief Executive Officer and Managing Director at Russell Investments, Global Exchange Traded Funds from 2010 to 2012. Managing Director of Barclays Global Investors from 1998 to 2010 and Global Chief Marketing Officer for iShares and Barclays Global Investors from 2000 to 2010. Trustee of the San Francisco Mechanics’ Institute, a non- profit organization, from 2013 to 2015. Board member of the Russell Exchange Traded Fund Trust from 2011 to 2012. Director of Barclays Global Investors Holdings Deutschland GmbH from 2006 to 2009. Mr. Polisson is an attorney and has a retired status with the Massachusetts and District of Columbia Bar Associations. | |
Pamela Wheelock
(Born 1959) | Trustee,
since January 2020;
previously Trustee from
January 2018 to
| Retired. Executive and Senior Financial leadership positions in the public, private and nonprofit sectors. Interim President and CEO, McKnight Foundation, 2020. Interim Commissioner, Minnesota Department of Human Services, 2019. Chief Operating Officer, Twin Cities Habitat for Humanity, 2017-2019. Vice President for University Services, University of Minnesota, 2012- 2016. Interim President and CEO, Blue Cross and Blue Shield of Minnesota, 2011-2012. Executive Vice-President and Chief Financial Officer, Minnesota Wild, 2002-2008. Commissioner, Minnesota Department of Finance, 1999-2002. Chair of the Board of Directors of Destination Medical Center Corporation. Board member of the Minnesota Wild Foundation. | |
* Length of service dates reflect the Trustee’s commencement of service with the Trust’s predecessor entities, where applicable.
# Ms. Freeman will serve as Chair Liaison through June 2024, at which time Ms. Wheelock will assume the role.
24 | Allspring Disciplined Large Cap Portfolio
Other information (unaudited)
Officers1
| Position held and
length of service | Principal occupations during past five years or longer |
| | President and Chief Executive Officer of Allspring Funds Management, LLC since 2017 and Head of Global Fund Governance of Allspring Global Investments since 2022. Prior thereto, co-president of Galliard Capital Management, LLC, an affiliate of Allspring Funds Management, LLC, from 2019 to 2022 and Head of Affiliated Managers, Allspring Global Investments, from 2014 to 2019 and Executive Vice President responsible for marketing, investments and product development for Allspring Funds Management, LLC, from 2009 to 2014. |
Jeremy DePalma
(Born 1974) | Treasurer,
since 2012
(for certain funds in
the Fund Complex);
since 2021 (for
the remaining funds in the Complex) | Senior Vice President of Allspring Funds Management, LLC since 2009. Senior Vice President of Evergreen Investment Management Company, LLC from 2008 to 2010 and head of the Fund Reporting and Control Team within Fund Administration from 2005 to 2010. |
Christopher Baker
(Born 1976) | Chief Compliance Officer,
since 2022 | Global Chief Compliance Officer for Allspring Global Investments since 2022. Prior thereto, Chief Compliance Officer for State Street Global Advisors from 2018 to 2021. Senior Compliance Officer for the State Street divisions of Alternative Investment Solutions, Sector Solutions, and Global Marketing from 2015 to 2018. From 2010 to 2015 Vice President, Global Head of Investment and Marketing Compliance for State Street Global Advisors. |
Matthew Prasse
(Born 1983) | Chief Legal Officer,
since 2022;
Secretary,
since 2021 | Senior Counsel of the Allspring Legal Department since 2021. Senior Counsel of the Wells Fargo Legal Department from 2018 to 2021. Previously, Counsel for Barings LLC from 2015 to 2018. Prior to joining Barings, Associate at Morgan, Lewis & Bockius LLP from 2008 to 2015. |
1 For those Officers with tenures at Allspring Global Investments and/or Allspring Funds Management, LLC that began prior to 2021, such tenures include years of service during which these businesses/entities were known as Wells Fargo Asset Management and Wells Fargo Funds Management, LLC, respectively.
Allspring Disciplined Large Cap Portfolio | 25
For more information
More information about Allspring Funds is available free upon request. To obtain literature, please write, visit the Portfolio’s website, or call:
Allspring Funds
P.O. Box 219967
Kansas City, MO 64121-9967
Website: allspringglobal.com
Individual investors: 1-800-222-8222
Retail investment professionals: 1-888-877-9275
Institutional investment professionals: 1-800-260-5969
This report and the financial statements contained herein are submitted for the general information of the interest holders of the Portfolio. If this report is used for promotional purposes, distribution of the report must be accompanied or preceded by a current prospectus. Before investing, please consider the investment objectives, risks, charges, and expenses of the investment. For a current prospectus and, if available, a summary prospectus, containing this information, call 1-800-222-8222 or visit the Portfolio’s website at allspringglobal.com. Read the prospectus carefully before you invest or send money.
Allspring Global InvestmentsTM is the trade name for the asset management firms of Allspring Global Investments Holdings, LLC, a holding company indirectly owned by certain private funds of GTCR LLC and Reverence Capital Partners, L.P. These firms include but are not limited to Allspring Global Investments, LLC, and Allspring Funds Management, LLC. Certain products managed by Allspring entities are distributed by Allspring Funds Distributor, LLC (a broker-dealer and Member FINRA/SIPC).
This material is for general informational and educational purposes only and is NOT intended to provide investment advice or a recommendation of any kind - including a recommendation for any specific investment, strategy, or plan.
© 2024 Allspring Global Investments Holdings, LLC. All rights reserved.
Allspring Diversified Large Cap Growth Portfolio
Semi-Annual Report
November 30, 2023
Allspring Diversified Large Cap Growth Portfolio | 1
Performance highlights (unaudited)
Performance highlights
| The Portfolio seeks long-term capital appreciation. |
| Allspring Funds Management, LLC |
| Allspring Global Investments, LLC |
| John R. Campbell, CFA, Vince Fioramonti, CFA, Robert Gruendyke, CFA, David Nazaret, CFA†, Thomas C. Ognar, CFA |
Average annual total returns (%) as of November 30, 2023 |
| | | | |
| | | | |
Allspring Diversified Large Cap Growth Portfolio | | | | |
| | | | |
Russell 1000® Growth Index2 | | | | |
Figures quoted represent past performance, which is no guarantee of future results, and do not reflect taxes that an investor may pay on an investment in a fund. Investment return and principal value of an investment will fluctuate so that an investor’s shares, when redeemed, may be worth more or less than their original cost. Current performance may be lower or higher than the performance data quoted.
Index returns do not include transaction costs associated with buying and selling securities, any mutual fund fees or expenses, or any taxes. It is not possible to invest directly in an index.
Shares are sold without a front-end sales charge or contingent deferred sales charge.
|
| The Russell 3000® Index measures the performance of the 3,000 largest U.S. companies based on total market capitalization, which represents approximately 98% of the investable U.S. equity market. You cannot invest directly in an index. |
| The Russell 1000® Growth Index measures the performance of those Russell 1000 companies with higher price/book ratios and higher forecasted growth values. You cannot invest directly in an index. |
| Mr. Nazaret became a portfolio manager of the Portfolio on June 30, 2023. |
CFA® and Chartered Financial Analyst® are trademarks owned by CFA Institute. |
2 | Allspring Diversified Large Cap Growth Portfolio
Performance highlights (unaudited)
Ten largest holdings (%) as of November 30, 20231 |
| |
| |
| |
| |
| |
Meta Platforms, Inc. Class A | |
| |
| |
| |
| |
| Figures represent the percentage of the Portfolio’s net assets. Holdings are subject to change and may have changed since the date specified. |
Sector allocation as of November 30, 20231 |
| Figures represent the percentage of the Portfolio’s long-term investments. Allocations are subject to change and may have changed since the date specified. |
Allspring Diversified Large Cap Growth Portfolio | 3
Portfolio expenses (unaudited)
Portfolio expenses
As an investor of beneficial interest of the Portfolio, you incur ongoing costs, including advisory fees and other Portfolio expenses. This example is intended to help you understand your ongoing costs (in dollars) of investing in the Portfolio and to compare these costs with the ongoing costs of investing in other mutual funds.
The example is based on an investment of $1,000 invested at the beginning of the six-month period and held for the entire period from June 1, 2023 to November 30, 2023.
Actual expenses
The “Actual” line of the table below provides information about actual account values and actual expenses. You may use the information in this line, together with the amount you invested, to estimate the expenses that you paid over the period. Simply divide your account value by $1,000 (for example, an $8,600 account value divided by $1,000= 8.6), then multiply the result by the number in the “Actual” line under the heading entitled “Expenses paid during period” for your applicable class of shares to estimate the expenses you paid on your account during this period.
Hypothetical example for comparison purposes
The “Hypothetical” line of the table below provides information about hypothetical account values and hypothetical expenses based on the Portfolio’s actual expense ratio and an assumed rate of return of 5% per year before expenses, which is not the Portfolio’s actual return. The hypothetical account values and expenses may not be used to estimate the actual ending account balance or expenses you paid for the period. You may use this information to compare the ongoing costs of investing in the Portfolio and other funds. To do so, compare this 5% hypothetical example with the 5% hypothetical examples that appear in the shareholder reports of the other funds.
Please note that the expenses shown in the table are meant to highlight your ongoing costs only. Therefore, the “Hypothetical” line of the table is useful in comparing ongoing costs only, and will not help you determine the relative total costs of owning different funds.
| Beginning
account value
6-1-2023 | Ending
account value
11-30-2023 | | Annualized net
expense ratio |
| | | | |
Hypothetical (5% return before expenses) | | | | |
| Expenses paid is equal to the annualized net expense ratio multiplied by the average account value over the period, multiplied by 183 divided by 366 (to reflect the one-half-year period). |
4 | Allspring Diversified Large Cap Growth Portfolio
Portfolio of investments—November 30, 2023 (unaudited)
| | | | | |
| | | | | | |
Communication services: 9.55% | | | | | | |
| | | | | | |
Live Nation Entertainment, Inc.† | | | | | | |
| | | | | | |
Take-Two Interactive Software, Inc.† | | | | | | |
| | | | | | |
Interactive media & services: 7.61% | | | | | | |
| | | | | | |
| | | | | | |
Meta Platforms, Inc. Class A† | | | | | | |
| | | | | | |
| | | | | | |
| | | | | | |
Trade Desk, Inc. Class A† | | | | | | |
| | | | | | |
Consumer discretionary: 15.16% | | | | | | |
| | | | | | |
| | | | | | |
| | | | | | |
| | | | | | |
Hotels, restaurants & leisure: 2.47% | | | | | | |
| | | | | | |
| | | | | | |
Chipotle Mexican Grill, Inc.† | | | | | | |
Hilton Worldwide Holdings, Inc. | | | | | | |
Royal Caribbean Cruises Ltd.† | | | | | | |
| | | | | | |
| | | | | | |
Household durables: 1.43% | | | | | | |
| | | | | | |
| | | | | | |
| | | | | | |
| | | | | | |
| | | | | | |
| | | | | | |
O’Reilly Automotive, Inc.† | | | | | | |
| | | | | | |
| | | | | | |
| | | | | | |
| | | | | | |
Textiles, apparel & luxury goods: 1.64% | | | | | | |
| | | | | | |
The accompanying notes are an integral part of these financial statements.
Allspring Diversified Large Cap Growth Portfolio | 5
Portfolio of investments—November 30, 2023 (unaudited)
| | | | | |
Textiles, apparel & luxury goods(continued) | | | | | | |
lululemon athletica, Inc.† | | | | | | |
| | | | | | |
| | | | | | |
| | | | | | |
| | | | | | |
| | | | | | |
Constellation Brands, Inc. Class A | | | | | | |
| | | | | | |
Consumer staples distribution & retail : 0.90% | | | | | | |
| | | | | | |
| | | | | | |
Archer-Daniels-Midland Co. | | | | | | |
Personal care products: 0.24% | | | | | | |
| | | | | | |
| | | | | | |
Energy equipment & services: 0.63% | | | | | | |
| | | | | | |
Oil, gas & consumable fuels: 1.92% | | | | | | |
| | | | | | |
| | | | | | |
| | | | | | |
| | | | | | |
| | | | | | |
| | | | | | |
| | | | | | |
Citizens Financial Group, Inc. | | | | | | |
First Citizens BancShares, Inc. Class A | | | | | | |
| | | | | | |
| | | | | | |
| | | | | | |
| | | | | | |
Goldman Sachs Group, Inc. | | | | | | |
| | | | | | |
| | | | | | |
Tradeweb Markets, Inc. Class A | | | | | | |
Virtu Financial, Inc. Class A | | | | | | |
| | | | | | |
Financial services: 3.03% | | | | | | |
| | | | | | |
| | | | | | |
| | | | | | |
The accompanying notes are an integral part of these financial statements.
6 | Allspring Diversified Large Cap Growth Portfolio
Portfolio of investments—November 30, 2023 (unaudited)
| | | | | |
| | | | | | |
Kinsale Capital Group, Inc. | | | | | | |
| | | | | | |
| | | | | | |
| | | | | | |
| | | | | | |
| | | | | | |
| | | | | | |
Karuna Therapeutics, Inc.† | | | | | | |
Regeneron Pharmaceuticals, Inc.† | | | | | | |
Sarepta Therapeutics, Inc.† | | | | | | |
| | | | | | |
United Therapeutics Corp.† | | | | | | |
Vertex Pharmaceuticals, Inc.† | | | | | | |
| | | | | | |
Health care equipment & supplies: 3.42% | | | | | | |
| | | | | | |
| | | | | | |
Edwards Lifesciences Corp.† | | | | | | |
Intuitive Surgical, Inc.† | | | | | | |
| | | | | | |
| | | | | | |
| | | | | | |
| | | | | | |
Health care providers & services: 1.47% | | | | | | |
| | | | | | |
| | | | | | |
| | | | | | |
Health care technology: 0.59% | | | | | | |
Veeva Systems, Inc. Class A† | | | | | | |
| | | | | | |
| | | | | | |
| | | | | | |
| | | | | | |
| | | | | | |
| | | | | | |
| | | | | | |
Aerospace & defense: 0.59% | | | | | | |
| | | | | | |
| | | | | | |
| | | | | | |
Commercial services & supplies: 1.70% | | | | | | |
| | | | | | |
The accompanying notes are an integral part of these financial statements.
Allspring Diversified Large Cap Growth Portfolio | 7
Portfolio of investments—November 30, 2023 (unaudited)
| | | | | |
Construction & engineering: 1.06% | | | | | | |
| | | | | | |
| | | | | | |
| | | | | | |
Electrical equipment: 1.07% | | | | | | |
| | | | | | |
| | | | | | |
| | | | | | |
Ground transportation: 1.22% | | | | | | |
| | | | | | |
| | | | | | |
| | | | | | |
| | | | | | |
| | | | | | |
Professional services: 0.37% | | | | | | |
| | | | | | |
Information technology: 37.71% | | | | | | |
Communications equipment: 1.65% | | | | | | |
| | | | | | |
| | | | | | |
| | | | | | |
| | | | | | |
| | | | | | |
| | | | | | |
Semiconductors & semiconductor equipment: 9.35% | | | | | | |
Advanced Micro Devices, Inc.† | | | | | | |
Allegro MicroSystems, Inc.† | | | | | | |
| | | | | | |
| | | | | | |
| | | | | | |
| | | | | | |
Microchip Technology, Inc. | | | | | | |
Monolithic Power Systems, Inc. | | | | | | |
| | | | | | |
| | | | | | |
| | | | | | |
| | | | | | |
| | | | | | |
Cadence Design Systems, Inc.† | | | | | | |
Crowdstrike Holdings, Inc. Class A† | | | | | | |
| | | | | | |
| | | | | | |
| | | | | | |
The accompanying notes are an integral part of these financial statements.
8 | Allspring Diversified Large Cap Growth Portfolio
Portfolio of investments—November 30, 2023 (unaudited)
| | | | | |
| | | | | | |
| | | | | | |
| | | | | | |
| | | | | | |
Palo Alto Networks, Inc.† | | | | | | |
| | | | | | |
| | | | | | |
Tyler Technologies, Inc.† | | | | | | |
| | | | | | |
| | | | | | |
| | | | | | |
Technology hardware, storage & peripherals: 5.74% | | | | | | |
| | | | | | |
| | | | | | |
| | | | | | |
CF Industries Holdings, Inc. | | | | | | |
| | | | | | |
| | | | | | |
| | | | | | |
| | | | | | |
Reliance Steel & Aluminum Co. | | | | | | |
| | | | | | |
| | | | | | |
Real estate management & development: 0.19% | | | | | | |
| | | | | | |
| | | | | | |
Simon Property Group, Inc. | | | | | | |
Specialized REITs : 0.75% | | | | | | |
| | | | | | |
| | | | | | |
| | | | | | |
Total common stocks (Cost $65,327,489) | | | | | | |
| | | | | |
Short-term investments: 0.99% | | | | | | |
Investment companies: 0.99% | | | | | | |
Allspring Government Money Market Fund Select Class♠∞ | | | | | | |
Total short-term investments (Cost $1,236,010) | | | | | | |
Total investments in securities (Cost $66,563,499) | | | | | | |
Other assets and liabilities, net | | | | | | |
| | | | | | |
The accompanying notes are an integral part of these financial statements.
Allspring Diversified Large Cap Growth Portfolio | 9
Portfolio of investments—November 30, 2023 (unaudited)
| Non-income-earning security |
| The issuer of the security is an affiliated person of the Portfolio as defined in the Investment Company Act of 1940. |
| The rate represents the 7-day annualized yield at period end. |
|
| American depositary receipt |
| Real estate investment trust |
Investments in affiliates
An affiliated investment is an investment in which the Portfolio owns at least 5% of the outstanding voting shares of the issuer or as a result of other relationships, such as the Portfolio and the issuer having the same adviser or investment manager. Transactions with issuers that were affiliates of the Portfolio at the end of the period were as follows:
| | | | | Net
change in
unrealized
gains
(losses) | | | Income
from
affiliated
securities |
| | | | | | | | |
Allspring Government Money Market Fund Select Class | | | | | | | | |
Futures contracts
The accompanying notes are an integral part of these financial statements.
10 | Allspring Diversified Large Cap Growth Portfolio
Statement of assets and liabilities—November 30, 2023 (unaudited)
Financial statements
Statement of assets and liabilities
| |
Investments in unaffiliated securities, at value (cost $65,327,489) | |
Investments in affiliated securities, at value (cost $1,236,010) | |
| |
Cash at broker segregated for futures contracts | |
| |
Receivable for investments sold | |
Receivable for daily variation margin on open futures contracts | |
Prepaid expenses and other assets | |
| |
| |
Payable for investments purchased | |
| |
Professional fees payable | |
Custody and accounting fees payable | |
Trustees’ fees and expenses payable | |
Accrued expenses and other liabilities | |
| |
| |
The accompanying notes are an integral part of these financial statements.
Allspring Diversified Large Cap Growth Portfolio | 11
Statement of operations—six months ended November 30, 2023 (unaudited)
Statement of operations
| |
Dividends (net of foreign withholdings taxes of $2,173) | |
Income from affiliated securities | |
| |
| |
| |
| |
Custody and accounting fees | |
| |
Interest holder report expenses | |
Trustees’ fees and expenses | |
| |
| |
Less: Fee waivers and/or expense reimbursements | |
| |
| |
Realized and unrealized gains (losses) on investments | |
| |
| |
| |
Net realized gains on investments | |
Net change in unrealized gains (losses) on | |
| |
| |
Net change in unrealized gains (losses) on investments | |
Net realized and unrealized gains (losses) on investments | |
Net increase in net assets resulting from operations | |
The accompanying notes are an integral part of these financial statements.
12 | Allspring Diversified Large Cap Growth Portfolio
Statement of changes in net assets
Statement of changes in net assets
|
Six months ended
November 30, 2023 (unaudited) | |
| | | | |
| | | | |
Net realized gains on investments | | | | |
Net change in unrealized gains (losses) on investments | | | | |
Net increase in net assets resulting from operations | | | | |
Capital share transactions | | | | |
Transactions in investors’ beneficial interests | | | | |
| | | | |
| | | | |
Net decrease in net assets resulting from capital share transactions | | | | |
Total decrease in net assets | | | | |
| | | | |
| | | | |
| | | | |
The accompanying notes are an integral part of these financial statements.
Allspring Diversified Large Cap Growth Portfolio | 13
| Six months ended
November 30, 2023
(unaudited) | |
| | | | | |
| | | | | | |
Ratios to average net assets (annualized) | | | | | | |
| | | | | | |
| | | | | | |
| | | | | | |
| | | | | | |
| | | | | | |
| Returns for periods of less than one year are not annualized. |
| Net expense ratios reflect voluntary waivers, if any. |
The accompanying notes are an integral part of these financial statements.
14 | Allspring Diversified Large Cap Growth Portfolio
Notes to financial statements (unaudited)
Notes to financial statements
Allspring Master Trust (the “Trust”), a Delaware statutory trust organized on March 10, 1999, is an open-end management investment company registered under the Investment Company Act of 1940, as amended (the “1940 Act”). As an investment company, the Trust follows the accounting and reporting guidance in Financial Accounting Standards Board (“FASB”) Accounting Standards Codification Topic 946, Financial Services – Investment Companies. These financial statements report on the Allspring Diversified Large Cap Growth Portfolio (the “Portfolio”) which is a diversified series of the Trust.
Interests in the Portfolio are available solely through private placement transactions that do not involve any “public offering” within the meaning of Section 4(a)(2) of the Securities Act of 1933.
2.
SIGNIFICANT ACCOUNTING POLICIES
The following significant accounting policies, which are consistently followed in the preparation of the financial statements of the Portfolio, are in conformity with U.S. generally accepted accounting principles which require management to make estimates and assumptions that affect the reported amounts of assets and liabilities, disclosure of contingent assets and liabilities at the date of the financial statements, and the reported amounts of income and expenses during the reporting period. Actual results could differ from those estimates.
Securities valuation
All investments are valued each business day as of the close of regular trading on the New York Stock Exchange (generally 4 p.m. Eastern Time), although the Portfolio may deviate from this calculation time under unusual or unexpected circumstances.
Equity securities, exchange-traded funds and futures contracts that are listed on a foreign or domestic exchange or market are valued at the official closing price or, if none, the last sales price.
Investments in registered open-end investment companies (other than those listed on a foreign or domestic exchange or market) are valued at net asset value.
Investments which are not valued using the methods discussed above are valued at their fair value, as determined in good faith by Allspring Funds Management, LLC (“Allspring Funds Management”), which was named the valuation designee by the Board of Trustees. As the valuation designee, Allspring Funds Management is responsible for day-to-day valuation activities for the Allspring Funds. In connection with these responsibilities, Allspring Funds Management has established a Valuation Committee and has delegated to it the authority to take any actions regarding the valuation of portfolio securities that the Valuation Committee deems necessary or appropriate, including determining the fair value of portfolio securities. On a quarterly basis, the Board of Trustees receives reports of valuation actions taken by the Valuation Committee. On at least an annual basis, the Board of Trustees receives an assessment of the adequacy and effectiveness of Allspring Funds Management’s process for determining the fair value of the portfolio of investments.
Foreign currency translation
The accounting records of the Portfolio are maintained in U.S. dollars. The values of other assets and liabilities denominated in foreign currencies are translated into U.S. dollars at rates provided by an independent foreign currency pricing source at a time each business day specified by the Valuation Committee. Purchases and sales of securities, and income and expenses are converted at the rate of exchange on the respective dates of such transactions. Net realized foreign exchange gains or losses arise from sales of foreign currencies, currency gains or losses realized between the trade and settlement dates on securities transactions, and the difference between the amounts of dividends, interest and foreign withholding taxes recorded and the U.S. dollar equivalent of the amounts actually paid or received. Net unrealized foreign exchange gains and losses arise from changes in the fair value of assets and liabilities other than investments in securities resulting from changes in exchange rates. The changes in net assets arising from changes in exchange rates of securities and the changes in net assets resulting from changes in market prices of securities are not separately presented. Such changes are included in net realized and unrealized gains or losses from investments.
Futures contracts
Futures contracts are agreements between the Portfolio and a counterparty to buy or sell a specific amount of a commodity, financial instrument or currency at a specified price and on a specified date. The Portfolio may buy and sell futures contracts in order to gain exposure to, or protect against, changes in security values and is subject to equity price risk. The primary risks associated with the use of futures contracts are the imperfect correlation between changes in market values of securities held by the Portfolio and the prices of futures contracts, and the possibility of an illiquid market. Futures contracts are generally entered into on a regulated futures exchange and cleared through a clearinghouse associated with the exchange. With futures contracts, there is minimal counterparty risk to the Portfolio since futures contracts are exchange-traded and the exchange’s clearinghouse, as the counterparty to all exchange-traded futures, guarantees the futures contracts against default.
Upon entering into a futures contracts, the Portfolio is required to deposit either cash or securities (initial margin) with the broker in an amount equal to a certain percentage of the contract value. Subsequent payments (variation margin) are paid to or received from the broker each day equal to the daily changes in the contract value. Such payments are recorded as unrealized gains or losses and, if any, shown as variation margin receivable (payable) in the Statement of Assets and Liabilities. Should the Portfolio fail to make requested variation margin payments, the broker can gain access to the initial margin to satisfy the Portfolio’s payment obligations. When the contracts are closed, a realized gain or loss is recorded in the Statement of Operations.
Allspring Diversified Large Cap Growth Portfolio | 15
Notes to financial statements (unaudited)
Security transactions and income recognition
Securities transactions are recorded on a trade date basis. Realized gains or losses are recorded on the basis of identified cost.
Dividend income is recognized on the ex-dividend date. Dividend income is recorded net of foreign taxes withheld where recovery of such taxes is not assured.
Interest earned on cash balances held at the custodian is recorded as interest income.
Distributions received from REIT investments may be characterized as ordinary income, capital gains, or a return of capital to the Portfolio based on information provided by the REIT. The proper characterization of REIT distributions is generally not known until after the end of each calendar year. As such, estimates may be used in reporting the character of income and distributions for financial statement purposes.
Federal and other taxes
The Portfolio is not required to pay federal income taxes on its net investment income and net capital gains as it is treated as a partnership for federal income tax purposes. All income, gains and losses of the Portfolio are deemed to have been “passed through” to the interest holders in proportion to their holdings of the Portfolio regardless of whether income and gains have been distributed by the Portfolio.
The Portfolio’s income tax returns and all financial records supporting those returns for the prior three fiscal years are subject to examination by the federal revenue authority. Management has analyzed the Portfolio’s tax positions taken on federal, state, and foreign tax returns, as applicable, for all open tax years and does not believe that there are any uncertain tax positions that require recognition of a tax liability.
As of November 30, 2023, the aggregate cost of all investments for federal income tax purposes was $67,040,447 and the unrealized gains (losses) consisted of:
3.
FAIR VALUATION MEASUREMENTS
Fair value measurements of investments are determined within a framework that has established a fair value hierarchy based upon the various data inputs utilized in determining the value of the Portfolio’s investments. The three-level hierarchy gives the highest priority to unadjusted quoted prices in active markets for identical assets or liabilities (Level 1) and the lowest priority to unobservable inputs (Level 3). The Portfolio’s investments are classified within the fair value hierarchy based on the lowest level of input that is significant to the fair value measurement. The inputs are summarized into three broad levels as follows:
•Level 1—quoted prices in active markets for identical securities
•Level 2—other significant observable inputs (including quoted prices for similar securities, interest rates, prepayment speeds, credit risk, etc.)
•Level 3—significant unobservable inputs (including the Portfolio’s own assumptions in determining the fair value of investments)
The inputs or methodologies used for valuing investments in securities are not necessarily an indication of the risk associated with investing in those securities.
16 | Allspring Diversified Large Cap Growth Portfolio
Notes to financial statements (unaudited)
The following is a summary of the inputs used in valuing the Portfolio’s assets and liabilities as of November 30, 2023:
| | Other significant
observable inputs
(Level 2) | Significant
unobservable inputs
(Level 3) | |
| | | | |
| | | | |
| | | | |
| | | | |
| | | | |
| | | | |
| | | | |
| | | | |
| | | | |
| | | | |
| | | | |
| | | | |
| | | | |
| | | | |
| | | | |
| | | | |
| | | | |
| | | | |
Futures contracts are reported at their cumulative unrealized gains (losses) at measurement date as reported in the tables following the Portfolio of Investments. For futures contracts, the current day’s variation margin is reported on the Statement of Assets and Liabilities. All other assets and liabilities are reported at their market value at measurement date.
Additional sector, industry or geographic detail, if any, is included in the Portfolio of Investments.
At November 30, 2023, the Portfolio did not have any transfers into/out of Level 3.
4.
TRANSACTIONS WITH AFFILIATES
Advisory fee
The Trust has entered into an advisory contract with Allspring Funds Management, a wholly owned subsidiary of Allspring Global Investments Holdings, LLC, a holding company indirectly owned by certain private funds of GTCR LLC and Reverence Capital Partners, L.P. The adviser is responsible for implementing investment policies and guidelines and for supervising the subadviser, who is responsible for day-to-day portfolio management of the Portfolio. Pursuant to the contract, Allspring Funds Management is entitled to receive an advisory fee at the following annual rate based on the Portfolio’s average daily net assets:
For the six months ended November 30, 2023, the advisory fee was equivalent to an annual rate of 0.65% of the Portfolio’s average daily net assets.
Allspring Funds Management has retained the services of a subadviser to provide daily portfolio management to the Portfolio. The fee for subadvisory services is borne by Allspring Funds Management. Allspring Global Investments, LLC, an affiliate of Allspring Funds Management and a wholly owned subsidiary of Allspring Global Investments Holdings, LLC, is the subadviser to the Portfolio and is entitled to receive a fee from Allspring Funds Management at an annual rate starting at 0.30% and declining to 0.20% as the average daily net assets of the Portfolio increase.
Allspring Funds Management has voluntarily waived and/or reimbursed advisory fees to reduce the net operating expense ratio of the Portfolio. These voluntary waivers may be discontinued at any time.
Allspring Diversified Large Cap Growth Portfolio | 17
Notes to financial statements (unaudited)
Interfund transactions
The Portfolio may purchase or sell portfolio investment securities to certain affiliates pursuant to Rule 17a-7 under the 1940 Act and under procedures adopted by the Board of Trustees. The procedures have been designed to ensure that these interfund transactions, which do not incur broker commissions, are effected at current market prices. Pursuant to these procedures, the Portfolio did not have any interfund transactions during the six months ended November 30, 2023.
5.
INVESTMENT PORTFOLIO TRANSACTIONS
Purchases and sales of investments, excluding U.S. government obligations (if any) and short-term securities, for the six months ended November 30, 2023 were $31,604,251 and $97,869,409, respectively.
6.
DERIVATIVE TRANSACTIONS
During the six months ended November 30, 2023, the Portfolio entered into futures contracts to gain market exposure. The Portfolio had an average notional amount of $886,217 in long futures contracts during the six months ended November 30, 2023.
The fair value, realized gains or losses and change in unrealized gains or losses, if any, on derivative instruments are reflected in the corresponding financial statement captions.
The Trust, along with Allspring Variable Trust and Allspring Funds Trust (excluding the money market funds), are parties to a $350,000,000 revolving credit agreement whereby the Portfolio is permitted to use bank borrowings for temporary or emergency purposes, such as to fund interest holders withdrawal requests. Interest under the credit agreement is charged to the Portfolio based on borrowing rate equal to the higher of the Federal Funds rate or the overnight bank funding rate in effect on that day plus a spread. In addition, an annual commitment fee based on the unused balance is allocated to each participating fund.
For the six months ended November 30, 2023, there were no borrowings by the Portfolio under the agreement.
As of the end of the period, the Portfolio concentrated its portfolio of investments in the information technology sector. A fund that invests a substantial portion of its assets in any sector may be more affected by changes in that sector than would be a fund whose investments are not heavily weighted in any sector.
Under the Portfolio’s organizational documents, the officers and Trustees have been granted certain indemnification rights against certain liabilities that may arise out of performance of their duties to the Portfolio. The Portfolio has entered into a separate agreement with each Trustee that converts indemnification rights currently existing under the Portfolio’s organizational documents into contractual rights that cannot be changed in the future without the consent of the Trustee. Additionally, in the normal course of business, the Portfolio may enter into contracts with service providers that contain a variety of indemnification clauses. The Portfolio’s maximum exposure under these arrangements is dependent on future claims that may be made against the Portfolio and, therefore, cannot be estimated.
18 | Allspring Diversified Large Cap Growth Portfolio
Other information (unaudited)
Other information
Proxy voting information
A description of the policies and procedures used to determine how to vote proxies relating to portfolio securities is available without charge, upon request, by calling 1-866-259-3305, visiting our website at allspringglobal.com, or visiting the SEC website at sec.gov. Information regarding how the proxies related to portfolio securities were voted during the most recent 12-month period ended June 30 is available on the website at allspringglobal.com or by visiting the SEC website at sec.gov.
Quarterly portfolio holdings information
The Portfolio files its complete schedule of portfolio holdings with the SEC for the first and third quarters of each fiscal year as an exhibit to its reports on Form N-PORT. Interest holders may view the filed Form N-PORT by visiting the SEC website at sec.gov.
Allspring Diversified Large Cap Growth Portfolio | 19
Other information (unaudited)
Board of trustees and officers
Each of the Trustees and Officers listed in the table below acts in identical capacities for each fund in the Allspring family of funds, which consists of 126 mutual funds comprising the Allspring Funds Trust, Allspring Variable Trust, Allspring Master Trust and four closed-end funds (collectively the “Fund Complex”). This table should be read in conjunction with the Prospectus and the Statement of Additional Information†. The mailing address of each Trustee and Officer is 1415 Vantage Park Drive, 3rd Floor, Charlotte, NC 28203. Each Trustee and Officer serves an indefinite term, however, each Trustee serves such term until reaching the mandatory retirement age established by the Trustees.
Independent Trustees
| | Principal occupations during past five years or longer | Current other
public company or
investment
company
directorships |
William R. Ebsworth
(Born 1957) | | Retired. From 1984 to 2013, equities analyst, portfolio manager, research director and chief investment officer at Fidelity Management and Research Company in Boston, Tokyo, and Hong Kong, and retired in 2013 as Chief Investment Officer of Fidelity Strategic Advisers, Inc. where he led a team of investment professionals managing client assets. Prior thereto, Board member of Hong Kong Securities Clearing Co., Hong Kong Options Clearing Corp., the Thailand International Fund, Ltd., Fidelity Investments Life Insurance Company, and Empire Fidelity Investments Life Insurance Company. Serves on the Investment Company Institute’s Board of Governors since 2022 and Executive Committee since 2023 as well as the Vice Chairman of the Governing Council of the Independent Directors Council since 2023. Audit Committee Chair and Investment Committee Chair of the Vincent Memorial Hospital Foundation (non-profit organization). Mr. Ebsworth is a CFA charterholder. | |
Jane A. Freeman
(Born 1953) | Trustee,
since 2015;
Chair Liaison,
| Retired. From 2012 to 2014 and 1999 to 2008, Chief Financial Officer of Scientific Learning Corporation. From 2008 to 2012, Ms. Freeman provided consulting services related to strategic business projects. Prior to 1999, Portfolio Manager at Rockefeller & Co. and Scudder, Stevens & Clark. Board member of the Harding Loevner Funds from 1996 to 2014, serving as both Lead Independent Director and chair of the Audit Committee. Board member of the Russell Exchange Traded Funds Trust from 2011 to 2012 and the chair of the Audit Committee. Ms. Freeman is also an inactive Chartered Financial Analyst. | |
Isaiah Harris, Jr.
(Born 1952) | Trustee,
since 2009;
Audit Committee Chair,
since 2019 | Retired. Member of the Advisory Board of CEF of East Central Florida. Chairman of the Board of CIGNA Corporation from 2009 to 2021, and Director from 2005 to 2008. From 2003 to 2011, Director of Deluxe Corporation. Prior thereto, President and CEO of BellSouth Advertising and Publishing Corp. from 2005 to 2007, President and CEO of BellSouth Enterprises from 2004 to 2005 and President of BellSouth Consumer Services from 2000 to 2003. Emeritus member of the Iowa State University Foundation Board of Governors. Emeritus Member of the Advisory board of Iowa State University School of Business. Advisory Board Member, Palm Harbor Academy (private school). Advisory Board Member, Fellowship of Christian Athletes. Mr. Harris is a certified public accountant (inactive status). | |
David F. Larcker
(Born 1950) | | Distinguished Visiting Fellow at the Hoover Institution since 2022. James Irvin Miller Professor of Accounting at the Graduate School of Business (Emeritus), Stanford University, Director of the Corporate Governance Research Initiative and Senior Faculty of The Rock Center for Corporate Governance since 2006. From 2005 to 2008, Professor of Accounting at the Graduate School of Business, Stanford University. Prior thereto, Ernst & Young Professor of Accounting at The Wharton School, University of Pennsylvania from 1985 to 2005. | |
Olivia S. Mitchell
(Born 1953) | | International Foundation of Employee Benefit Plans Professor since 1993, Wharton School of the University of Pennsylvania. Director of Wharton’s Pension Research Council and Boettner Center on Pensions & Retirement Research, and Research Associate at the National Bureau of Economic Research. Previously taught at Cornell University from 1978 to 1993. | |
Timothy J. Penny
(Born 1951) | Trustee,
since 1996;
Chair,
since 2018 | President and Chief Executive Officer of Southern Minnesota Initiative Foundation, a non-profit organization, since 2007. Vice Chair of the Economic Club of Minnesota, since 2007. Co-Chair of the Committee for a Responsible Federal Budget, since 1995. Member of the Board of Trustees of NorthStar Education Finance, Inc., a non-profit organization, from 2007-2022. Senior Fellow of the University of Minnesota Humphrey Institute from 1995 to 2017. | |
* Length of service dates reflect the Trustee’s commencement of service with the Trust’s predecessor entities, where applicable.
# Ms. Freeman will serve as Chair Liaison through June 2024, at which time Ms. Wheelock will assume the role.
†
The Statement of Additional Information includes additional information about the Trustees and is available, without charge, upon request, by calling 1-800-222-8222 or by visiting the website at allspringglobal.com.
20 | Allspring Diversified Large Cap Growth Portfolio
Other information (unaudited)
| Position held and length of service* | Principal occupations during past five years or longer | Current other public company or investment company directorships |
James G. Polisson
(Born 1959) | Trustee,
since 2018; Nominating and Governance Committee Chair, since 2024 | Retired. Chief Marketing Officer, Source (ETF) UK Services, Ltd, from 2015 to 2017. From 2012 to 2015, Principal of The Polisson Group, LLC, a management consulting, corporate advisory and principal investing company. Chief Executive Officer and Managing Director at Russell Investments, Global Exchange Traded Funds from 2010 to 2012. Managing Director of Barclays Global Investors from 1998 to 2010 and Global Chief Marketing Officer for iShares and Barclays Global Investors from 2000 to 2010. Trustee of the San Francisco Mechanics’ Institute, a non- profit organization, from 2013 to 2015. Board member of the Russell Exchange Traded Fund Trust from 2011 to 2012. Director of Barclays Global Investors Holdings Deutschland GmbH from 2006 to 2009. Mr. Polisson is an attorney and has a retired status with the Massachusetts and District of Columbia Bar Associations. | |
Pamela Wheelock
(Born 1959) | Trustee,
since January 2020;
previously Trustee from
January 2018 to
| Retired. Executive and Senior Financial leadership positions in the public, private and nonprofit sectors. Interim President and CEO, McKnight Foundation, 2020. Interim Commissioner, Minnesota Department of Human Services, 2019. Chief Operating Officer, Twin Cities Habitat for Humanity, 2017-2019. Vice President for University Services, University of Minnesota, 2012- 2016. Interim President and CEO, Blue Cross and Blue Shield of Minnesota, 2011-2012. Executive Vice-President and Chief Financial Officer, Minnesota Wild, 2002-2008. Commissioner, Minnesota Department of Finance, 1999-2002. Chair of the Board of Directors of Destination Medical Center Corporation. Board member of the Minnesota Wild Foundation. | |
* Length of service dates reflect the Trustee’s commencement of service with the Trust’s predecessor entities, where applicable.
# Ms. Freeman will serve as Chair Liaison through June 2024, at which time Ms. Wheelock will assume the role.
Allspring Diversified Large Cap Growth Portfolio | 21
Other information (unaudited)
Officers1
| Position held and
length of service | Principal occupations during past five years or longer |
| | President and Chief Executive Officer of Allspring Funds Management, LLC since 2017 and Head of Global Fund Governance of Allspring Global Investments since 2022. Prior thereto, co-president of Galliard Capital Management, LLC, an affiliate of Allspring Funds Management, LLC, from 2019 to 2022 and Head of Affiliated Managers, Allspring Global Investments, from 2014 to 2019 and Executive Vice President responsible for marketing, investments and product development for Allspring Funds Management, LLC, from 2009 to 2014. |
Jeremy DePalma
(Born 1974) | Treasurer,
since 2012
(for certain funds in
the Fund Complex);
since 2021 (for
the remaining funds in the Complex) | Senior Vice President of Allspring Funds Management, LLC since 2009. Senior Vice President of Evergreen Investment Management Company, LLC from 2008 to 2010 and head of the Fund Reporting and Control Team within Fund Administration from 2005 to 2010. |
Christopher Baker
(Born 1976) | Chief Compliance Officer,
since 2022 | Global Chief Compliance Officer for Allspring Global Investments since 2022. Prior thereto, Chief Compliance Officer for State Street Global Advisors from 2018 to 2021. Senior Compliance Officer for the State Street divisions of Alternative Investment Solutions, Sector Solutions, and Global Marketing from 2015 to 2018. From 2010 to 2015 Vice President, Global Head of Investment and Marketing Compliance for State Street Global Advisors. |
Matthew Prasse
(Born 1983) | Chief Legal Officer,
since 2022;
Secretary,
since 2021 | Senior Counsel of the Allspring Legal Department since 2021. Senior Counsel of the Wells Fargo Legal Department from 2018 to 2021. Previously, Counsel for Barings LLC from 2015 to 2018. Prior to joining Barings, Associate at Morgan, Lewis & Bockius LLP from 2008 to 2015. |
1 For those Officers with tenures at Allspring Global Investments and/or Allspring Funds Management, LLC that began prior to 2021, such tenures include years of service during which these businesses/entities were known as Wells Fargo Asset Management and Wells Fargo Funds Management, LLC, respectively.
22 | Allspring Diversified Large Cap Growth Portfolio
This page is intentionally left blank.
This page is intentionally left blank.
For more information
More information about Allspring Funds is available free upon request. To obtain literature, please write, visit the Portfolio’s website, or call:
Allspring Funds
P.O. Box 219967
Kansas City, MO 64121-9967
Website: allspringglobal.com
Individual investors: 1-800-222-8222
Retail investment professionals: 1-888-877-9275
Institutional investment professionals: 1-800-260-5969
This report and the financial statements contained herein are submitted for the general information of the interest holders of the Portfolio. If this report is used for promotional purposes, distribution of the report must be accompanied or preceded by a current prospectus. Before investing, please consider the investment objectives, risks, charges, and expenses of the investment. For a current prospectus and, if available, a summary prospectus, containing this information, call 1-800-222-8222 or visit the Portfolio’s website at allspringglobal.com. Read the prospectus carefully before you invest or send money.
Allspring Global InvestmentsTM is the trade name for the asset management firms of Allspring Global Investments Holdings, LLC, a holding company indirectly owned by certain private funds of GTCR LLC and Reverence Capital Partners, L.P. These firms include but are not limited to Allspring Global Investments, LLC, and Allspring Funds Management, LLC. Certain products managed by Allspring entities are distributed by Allspring Funds Distributor, LLC (a broker-dealer and Member FINRA/SIPC).
This material is for general informational and educational purposes only and is NOT intended to provide investment advice or a recommendation of any kind - including a recommendation for any specific investment, strategy, or plan.
© 2024 Allspring Global Investments Holdings, LLC. All rights reserved.
Allspring Emerging Growth Fund
Semi-Annual Report
November 30, 2023
The views expressed and any forward-looking statements are as of November 30, 2023, unless otherwise noted, and are those of the Fund’s portfolio managers and/or Allspring Global Investments. Discussions of individual securities or the markets generally are not intended as individual recommendations. Future events or results may vary significantly from those expressed in any forward-looking statements. The views expressed are subject to change at any time in response to changing circumstances in the market. Allspring Global Investments disclaims any obligation to publicly update or revise any views expressed or forward-looking statements.
Allspring Emerging Growth Fund | 1
Letter to shareholders (unaudited)
Andrew Owen
President
Allspring Funds
Dear Shareholder:
We are pleased to offer you this semi-annual report for the Allspring Emerging Growth Fund for the six-month period that ended November 30, 2023. Globally, stocks and bonds experienced high levels of volatility during the period. The market was focused on the impact of ongoing aggressive central bank rate hikes on persistently high inflation. As inflation finally gradually declined, anticipation rose over an end to the central bank monetary tightening cycle. For the six-month period, domestic U.S. and global stocks and bonds had positive overall results, with U.S. stocks leading the way. After suffering deep and broad losses through 2022, bonds now benefit from a base of higher yields that can help generate higher income.
For the period, U.S. stocks, based on the S&P 500 Index,1 returned 10.17%. International stocks, as measured by the MSCI ACWI ex USA Index (Net),2 gained 5.07% while the MSCI EM Index (Net) (USD)3 returned 4.60%. Among bond indexes, the Bloomberg U.S. Aggregate Bond Index4 returned -0.80%, the Bloomberg Global Aggregate ex-USD Index (unhedged)5 gained 0.63%, the Bloomberg Municipal Bond Index6 returned 2.29%, and the ICE BofA U.S. High Yield Index7 returned 5.53%.
Affected by high inflation and central bank rate hikes, markets were volatile.
The six-month period began in June with the Federal Reserve’s (Fed’s) first pause on interest rate hikes since March 2022, when it began its aggressive campaign to rein in inflation. However, the Core Consumer Price Index (CPI)8, while continuing to decline, remained stubbornly high in June at 4.8%—well above the Fed’s 2.0% target rate. With the U.S. unemployment rate still at 3.6%, near a historical low, and U.S. payrolls continuing to grow in June, expectations of more Fed rate hikes were reinforced. However, U.S. and global stocks had strong returns in June.
July was a good month for stocks, while bonds had more muted but positive monthly returns overall. More volatile sectors and regions tended to do well, as investors grew more optimistic regarding economic prospects. With strong second quarter gross domestic product growth—initially estimated at 2.4%—and U.S. annual inflation easing steadily to 3.2% in July, hopes for a soft economic landing grew. The Fed, the European Central Bank (ECB), and the Bank of England (BoE) all raised their respective key interest rates by 0.25% in July. In the Fed’s case, speculation grew that it could be very close to the end of its tightening cycle. Meanwhile, China’s economy showed signs of stagnation, renewing concerns of global fallout.
1
The S&P 500 Index consists of 500 stocks chosen for market size, liquidity, and industry group representation. It is a market-value-weighted index with each stock’s weight in the index proportionate to its market value. You cannot invest directly in an index.
2
The Morgan Stanley Capital International (MSCI) All Country World Index (ACWI) ex USA Index (Net) is a free-float-adjusted market-capitalization-weighted index that is designed to measure the equity market performance of developed and emerging markets, excluding the U.S. Source: MSCI. MSCI makes no express or implied warranties or representations and shall have no liability whatsoever with respect to any MSCI data contained herein. The MSCI data may not be further redistributed or used as a basis for other indexes or any securities or financial products. This report is not approved, reviewed, or produced by MSCI. You cannot invest directly in an index.
3
The MSCI Emerging Markets (EM) Index (Net) (USD) is a free-float-adjusted market-capitalization-weighted index that is designed to measure the equity market performance of emerging markets. You cannot invest directly in an index.
4
The Bloomberg U.S. Aggregate Bond Index is a broad-based benchmark that measures the investment-grade, U.S.-dollar-denominated, fixed-rate taxable bond market, including Treasuries, government-related and corporate securities, mortgage-backed securities (agency fixed-rate and hybrid adjustable-rate mortgage pass-throughs), asset-backed securities, and commercial mortgage-backed securities. You cannot invest directly in an index.
5
The Bloomberg Global Aggregate ex-USD Index (unhedged) is an unmanaged index that provides a broad-based measure of the global investment-grade fixed income markets excluding the U.S.-dollar-denominated debt market. You cannot invest directly in an index.
6
The Bloomberg Municipal Bond Index is an unmanaged index composed of long-term tax-exempt bonds with a minimum credit rating of Baa. You cannot invest directly in an index.
7
The ICE BofA U.S. High Yield Index is a market-capitalization-weighted index of domestic and Yankee high yield bonds. The index tracks the performance of high yield securities traded in the U.S. bond market. You cannot invest directly in an index. Copyright 2024. ICE Data Indices, LLC. All rights reserved.
8
The Core Consumer Price Index (CPI) is a measure of the average change over time in the prices paid by urban consumers for a market basket of consumer goods and services excluding energy and food prices. You cannot invest directly in an index.
2 | Allspring Emerging Growth Fund
Letter to shareholders (unaudited)
“ With strong
second-quarter gross
domestic product
growth—initially
estimated at 2.4%—and
U.S. annual inflation easing steadily to 3.2%
in July, hopes for a soft
economic landing grew. ”
Stocks retreated in August while monthly bond returns were flat overall. Increased global market volatility reflected unease over the Chinese property market being stressed along with weak Chinese economic data. However, speculation grew over a possible end to the Fed’s campaign of interest rate increases or at least a pause in September. U.S. economic data generally remained solid, with resilient job market data and inflation ticking up slightly in August, as the annual CPI1 rose 3.7%. However, the three-month trend for Core CPI stood at an annualized 2.4%.
Stocks and bonds both had negative overall returns in September as investors reluctantly recited the new chorus of “higher for longer,” led by the Fed’s determination not to lower interest rates until it knows it has vanquished its pesky opponent—higher-than-targeted inflation. As of September, the two primary gauges of U.S. inflation—the annual Core Personal Consumption Expenditures Price Index2 and the CPI—both stood at roughly 4%, twice as high as the Fed’s oft-stated 2% target. The month ended with the prospect of yet another U.S. government shutdown, averted at least temporarily.
October was a tough month for financial markets overall. Key global indexes were pushed down by rising geopolitical tensions—particularly the Israel-Hamas conflict, and concerns over the Fed’s “higher for longer” monetary policy. The U.S. 10-year Treasury yield rose above 5% for the first time since 2007. Commodity prices did well as oil prices rallied in response to the prospect of oil supply disruptions from the Middle East. U.S. annualized third quarter GDP was estimated at a healthier-than-anticipated 4.9%. China’s GDP indicated surprisingly strong industrial production and retail sales, offset by ongoing weakness in its real estate sector.
In November, the market mood turned positive as cooling inflation inspired confidence that central banks could hold off on further rate hikes. Overall annual inflation in the U.S. fell to 3.1% in November while 12-month inflation in the U.K. and eurozone eased to 4.6% and 2.4%, respectively—far below their peak levels of mid-2022. Third quarter annualized U.S. GDP growth was raised to an estimated 5.2% while U.S. job totals rose by just below 200,000 in November, indicating a slight cooling of the labor market. All of this fresh evidence added to confidence for a U.S. soft economic landing, leading to a more buoyant mood heading into winter as the Federal Open Market Committee held rates steady at its November meeting.
1
The CPI is a measure of the average change over time in the prices paid by urban consumers for a market basket of consumer goods and services. You cannot invest directly in an index.
2
The Core Personal Consumption Expenditures Price Index (PCE) is a measure of prices that people living in the United States, or those buying on their behalf, pay for goods and services. It is sometimes called the core PCE price index, because two categories that can have price swings – food and energy – are left out to make underlying inflation easier to see. You cannot invest directly in an index.
Allspring Emerging Growth Fund | 3
Letter to shareholders (unaudited)
For further information about your fund, contact your investment professional, visit our website at allspringglobal.com, or call us directly at 1-800-222-8222.
Don’t let short-term uncertainty derail long-term investment goals.
Periods of investment uncertainty can present challenges, but experience has taught us that maintaining long-term investment goals can be an effective way to plan for the future. To help you create a sound strategy based on your personal goals and risk tolerance, Allspring Funds offers more than 100 mutual funds spanning a wide range of asset classes and investment styles. Although diversification cannot guarantee an investment profit or prevent losses, we believe it can be an effective way to manage investment risk and potentially smooth out overall portfolio performance. We encourage investors to know their investments and to understand that appropriate levels of risk-taking may unlock opportunities.
Thank you for choosing to invest with Allspring Funds. We appreciate your confidence in us and remain committed to helping you meet your financial needs.
Sincerely,
Andrew Owen
President
Allspring Funds
4 | Allspring Emerging Growth Fund
Letter to shareholders (unaudited)
|
Beginning in July 2024, the Fund will be required by the Securities and Exchange Commission to send shareholders a paper copy of a new tailored shareholder report in place of the full shareholder report that you are now receiving. The tailored shareholder report will contain concise information about the Fund, including certain expense and performance information and fund statistics. If you wish to receive this new tailored shareholder report electronically, please follow the instructions on the back cover of this report. |
Other information that is currently included in the shareholder report, such as the Fund’s financial statements, will be available online and upon request, free of charge, in paper or electronic format. |
Allspring Emerging Growth Fund | 5
Performance highlights (unaudited)
Performance highlights
| The Fund seeks long-term capital appreciation. |
| Allspring Funds Management, LLC |
Subadviser for the affiliated master portfolio* | Allspring Global Investments, LLC |
| Robert Gruendyke, CFA, David Nazaret, CFA, Thomas C. Ognar, CFA |
Average annual total returns (%) as of November 30, 2023 |
| | | | |
| | | | | | | | | |
| | | | | | | | | |
| | | | | | | | | |
| | | | | | | | | |
Administrator Class (WFGDX) | | | | | | | | | |
Institutional Class (WEMIX) | | | | | | | | | |
| | | | | | | | | |
Russell 2000ョ Growth Index5 | | | | | | | | | |
Figures quoted represent past performance, which is no guarantee of future results, and do not reflect taxes that a shareholder may pay on an investment in a fund. Investment return and principal value of an investment will fluctuate so that an investor’s shares, when redeemed, may be worth more or less than their original cost. Performance shown without sales charges would be lower if sales charges were reflected. Current performance may be lower or higher than the performance data quoted, which assumes the reinvestment of dividends and capital gains. Current month-end performance is available on the Fund’s website, allspringglobal.com.
Index returns do not include transaction costs associated with buying and selling securities, any mutual fund fees or expenses, or any taxes. It is not possible to invest directly in an index.
For Class A shares, the maximum front-end sales charge is 5.75%. For Class C shares, the maximum contingent deferred sales charge is 1.00%. Performance including a contingent deferred sales charge assumes the sales charge for the corresponding time period. Class R6, Administrator Class and Institutional Class shares are sold without a front-end sales charge or contingent deferred sales charge.
|
| Reflects the expense ratios as stated in the most recent prospectuses. The expense ratios shown are subject to change and may differ from the annualized expense ratios shown in the Financial Highlights of this report. |
| The manager has contractually committed through September 30, 2024, to waive fees and/or reimburse expenses to the extent necessary to cap total annual fund operating expenses after fee waivers at 1.27% for Class A, 2.02% for Class C, 0.85% for Class R6, 1.20% for Administrator Class and 0.90% for Institutional Class. Brokerage commissions, stamp duty fees, interest, taxes, acquired fund fees and expenses (if any) from funds in which the affiliated master portfolio invests, and extraordinary expenses are excluded from the expense caps. Net expenses from the affiliated master portfolio are included in the expense caps. Prior to or after the commitment expiration date, the caps may be increased or the commitment to maintain the caps may be terminated only with the approval of the Board of Trustees. Without these caps, the Fund’s returns would have been lower. The expense ratio paid by an investor is the net expense ratio (the total annual fund operating expenses after fee waivers) as stated in the prospectuses. |
| Historical performance shown for the Class R6 shares prior to their inception reflects the performance of the Institutional Class shares, and includes the higher expenses applicable to the Institutional Class shares. If these expenses had not been included, returns for the Class R6 shares would be higher. |
| The Russell 3000® Index measures the performance of the 3,000 largest U.S. companies based on total market capitalization, which represents approximately 98% of the investable U.S. equity market. You cannot invest directly in an index. |
| The Russell 2000® Growth Index measures the performance of those Russell 2000 companies with higher price/book ratios and higher forecasted growth values. You cannot invest directly in an index. |
Stock values fluctuate in response to the activities of individual companies and general market and economic conditions. Smaller-company stocks tend to be more volatile and less liquid than those of larger companies. Certain investment strategies tend to increase the total risk of an investment (relative to the broader market). This fund is exposed to foreign investment risk. Consult the Fund’s prospectus for additional information on these and other risks.
| The Fund is a feeder fund in a master-feeder structure that invests substantially all of its assets in a single affiliated master portfolio of the Allspring Master Trust with a substantially identical investment objective and substantially similar investment strategies. References to the investment activities of the Fund are intended to refer to the investment activities of the affiliated master portfolio in which it invests. |
CFA® and Chartered Financial Analyst® are trademarks owned by CFA Institute. |
6 | Allspring Emerging Growth Fund
Performance highlights (unaudited)
Ten largest holdings (%) as of November 30, 20231 |
| |
| |
Kinsale Capital Group, Inc. | |
| |
| |
Casella Waste Systems, Inc. Class A | |
| |
| |
Applied Industrial Technologies, Inc. | |
| |
| Each holding represents the Fund’s allocable portion of the affiliated master portfolio security. Figures represent each holding as a percentage of the Fund’s net assets. Holdings are subject to change and may have changed since the date specified. |
Sector allocation as of November 30, 20231 |
| Figures represent the sector allocation of the affiliated master portfolio as a percentage of the long-term investments of the affiliated master portfolio. Allocations are subject to change and may have changed since the date specified. |
Allspring Emerging Growth Fund | 7
Fund expenses (unaudited)
Fund expenses
As a shareholder of the Fund, you incur two types of costs: (1) transaction costs, including sales charges (loads) on purchase payments and contingent deferred sales charges (if any) on redemptions and (2) ongoing costs, including management fees, distribution (12b-1) and/or shareholder servicing fees, and other Fund expenses. This example is intended to help you understand your ongoing costs (in dollars) of investing in the Fund and to compare these costs with the ongoing costs of investing in other mutual funds.
The example is based on an investment of $1,000 invested at the beginning of the six-month period and held for the entire period from June 1, 2023 to November 30, 2023.
Actual expenses
The “Actual” line of the table below provides information about actual account values and actual expenses. You may use the information in this line, together with the amount you invested, to estimate the expenses that you paid over the period. Simply divide your account value by $1,000 (for example, an $8,600 account value divided by $1,000= 8.6), then multiply the result by the number in the “Actual” line under the heading entitled “Expenses paid during period” for your applicable class of shares to estimate the expenses you paid on your account during this period.
Hypothetical example for comparison purposes
The “Hypothetical” line of the table below provides information about hypothetical account values and hypothetical expenses based on the Fund’s actual expense ratio and an assumed rate of return of 5% per year before expenses, which is not the Fund’s actual return. The hypothetical account values and expenses may not be used to estimate the actual ending account balance or expenses you paid for the period. You may use this information to compare the ongoing costs of investing in the Fund and other funds. To do so, compare this 5% hypothetical example with the 5% hypothetical examples that appear in the shareholder reports of the other funds.
Please note that the expenses shown in the table are meant to highlight your ongoing costs only and do not reflect any transactional costs, such as sales charges (loads) and contingent deferred sales charges. Therefore, the “Hypothetical” line of the table is useful in comparing ongoing costs only, and will not help you determine the relative total costs of owning different funds. In addition, if these transactional costs were included, your costs would have been higher.
| Beginning
account value
6-1-2023 | Ending
account value
11-30-2023 | | |
| | | | |
| | | | |
Hypothetical (5% return before expenses) | | | | |
| | | | |
| | | | |
Hypothetical (5% return before expenses) | | | | |
| | | | |
| | | | |
Hypothetical (5% return before expenses) | | | | |
| | | | |
| | | | |
Hypothetical (5% return before expenses) | | | | |
| | | | |
| | | | |
Hypothetical (5% return before expenses) | | | | |
| Expenses paid is equal to the annualized net expense ratio of each class multiplied by the average account value over the period, multiplied by 183 divided by 366 (to reflect the one-half-year period). |
| Amounts reflect net expenses allocated from the affiliated Master Portfolio in which the Fund invests. |
8 | Allspring Emerging Growth Fund
Portfolio of investments—November 30, 2023 (unaudited)
| | | | | |
Investment companies: 100.11% | | | | | | |
Affiliated master portfolio: 100.11% | | | | | | |
Allspring Emerging Growth Portfolio | | | | | | |
Total investment companies (Cost $197,863,556) | | | | | | |
Total investments in securities (Cost $197,863,556) | | | | | | |
Other assets and liabilities, net | | | | | | |
| | | | | | |
Transactions with the affiliated Master Portfolio were as follows:
| % of
ownership,
beginning
of period | % of
ownership,
end of
period | Net realized
gains
(losses) on
investments
allocated
from
affiliated
Master
Portfolio | Net
change in
unrealized
gains
(losses) on
investments
allocated
from
affiliated
Master
Portfolio | Dividends
allocated
from
affiliated
Master
Portfolio | Interest
allocated
from
affiliated
Master
Portfolio | Affiliated
Income
Allocated
from
affiliated
Master
Portfolio | |
Allspring Emerging Growth Portfolio | | | | | | | | |
The accompanying notes are an integral part of these financial statements.
Allspring Emerging Growth Fund | 9
Statement of assets and liabilities—November 30, 2023 (unaudited)
Financial statements
Statement of assets and liabilities
| |
Investments in affiliated Master Portfolio, at value (cost $197,863,556) | |
Receivable for Fund shares sold | |
| |
Prepaid expenses and other assets | |
| |
| |
Payable for Fund shares redeemed | |
Administration fees payable | |
Shareholder servicing fee payable | |
Trustees’ fees and expenses payable | |
| |
Accrued expenses and other liabilities | |
| |
| |
| |
| |
Total distributable earnings | |
| |
Computation of net asset value and offering price per share | |
| |
Shares outstanding–Class A1 | |
Net asset value per share–Class A | |
Maximum offering price per share – Class A2 | |
| |
Shares outstanding–Class C1 | |
Net asset value per share–Class C | |
| |
Shares outstanding–Class R61 | |
Net asset value per share–Class R6 | |
Net assets–Administrator Class | |
Shares outstanding–Administrator Class1 | |
Net asset value per share–Administrator Class | |
Net assets–Institutional Class | |
Shares outstanding–Institutional Class1 | |
Net asset value per share–Institutional Class | |
1 The Fund has an unlimited number of authorized shares.
2 Maximum offering price is computed as 100/94.25 of net asset value. On investments of $50,000 or more, the offering price is reduced.
The accompanying notes are an integral part of these financial statements.
10 | Allspring Emerging Growth Fund
Statement of operations—six months ended November 30, 2023 (unaudited)
Statement of operations
| |
Dividends allocated from affiliated Master Portfolio | |
Affiliated income allocated from affiliated Master Portfolio | |
Interest allocated from affiliated Master Portfolio | |
Expenses allocated from affiliated Master Portfolio | |
Waivers allocated from affiliated Master Portfolio | |
| |
| |
| |
| |
| |
| |
| |
| |
| |
Shareholder servicing fees | |
| |
| |
| |
| |
| |
Custody and accounting fees | |
| |
| |
Shareholder report expenses | |
Trustees’ fees and expenses | |
| |
| |
Less: Fee waivers and/or expense reimbursements | |
| |
| |
| |
| |
Realized and unrealized gains (losses) on investments | |
Net realized losses on investments allocated from affiliated Master Portfolio | |
Net change in unrealized gains (losses) on investments allocated from affiliated Master Portfolio | |
Net realized and unrealized gains (losses) on investments | |
Net decrease in net assets resulting from operations | |
The accompanying notes are an integral part of these financial statements.
Allspring Emerging Growth Fund | 11
Statement of changes in net assets
Statement of changes in net assets
|
Six months ended
November 30, 2023 (unaudited) | |
| | | | |
| | | | |
Net realized losses on investments | | | | |
Net change in unrealized gains (losses) on investments | | | | |
Net decrease in net assets resulting from operations | | | | |
Capital share transactions | | | | |
Proceeds from shares sold | | | | |
| | | | |
| | | | |
| | | | |
| | | | |
| | | | |
| | | | |
Payment for shares redeemed | | | | |
| | | | |
| | | | |
| | | | |
| | | | |
| | | | |
| | | | |
Net decrease in net assets resulting from capital share transactions | | | | |
Total decrease in net assets | | | | |
| | | | |
| | | | |
| | | | |
The accompanying notes are an integral part of these financial statements.
12 | Allspring Emerging Growth Fund
Financial highlights
(For a share outstanding throughout each period)
| Six months ended
November 30, 2023
(unaudited) | |
| | | | | |
Net asset value, beginning of period | | | | | | |
| | | | | | |
Net realized and unrealized gains (losses) on investments | | | | | | |
Total from investment operations | | | | | | |
Distributions to shareholders from | | | | | | |
| | | | | | |
Net asset value, end of period | | | | | | |
| | | | | | |
Ratios to average net assets (annualized)* | | | | | | |
| | | | | | |
| | | | | | |
| | | | | | |
| | | | | | |
| | | | | | |
Net assets, end of period (000s omitted) | | | | | | |
| Ratios include net expenses allocated from the affiliated Master Portfolio which were as follows: |
Six months ended November 30, 2023 (unaudited) | |
| |
| |
| |
| |
| |
| Calculated based upon average shares outstanding |
| Total return calculations do not include any sales charges. Returns for periods of less than one year are not annualized. |
| Portfolio turnover rate is calculated by multiplying the affiliated Master Portfolio’s percentage of the Fund’s total investment in securities at the end of the period by the affiliated Master Portfolio’s portfolio turnover rate. |
The accompanying notes are an integral part of these financial statements.
Allspring Emerging Growth Fund | 13
(For a share outstanding throughout each period)
| Six months ended
November 30, 2023
(unaudited) | |
| | | | | |
Net asset value, beginning of period | | | | | | |
| | | | | | |
Net realized and unrealized gains (losses) on investments | | | | | | |
Total from investment operations | | | | | | |
Distributions to shareholders from | | | | | | |
| | | | | | |
Net asset value, end of period | | | | | | |
| | | | | | |
Ratios to average net assets (annualized)* | | | | | | |
| | | | | | |
| | | | | | |
| | | | | | |
| | | | | | |
| | | | | | |
Net assets, end of period (000s omitted) | | | | | | |
| Ratios include net expenses allocated from the affiliated Master Portfolio which were as follows: |
Six months ended November 30, 2023 (unaudited) | |
| |
| |
| |
| |
| |
| Calculated based upon average shares outstanding |
| Total return calculations do not include any sales charges. Returns for periods of less than one year are not annualized. |
| Portfolio turnover rate is calculated by multiplying the affiliated Master Portfolio’s percentage of the Fund’s total investment in securities at the end of the period by the affiliated Master Portfolio’s portfolio turnover rate. |
The accompanying notes are an integral part of these financial statements.
14 | Allspring Emerging Growth Fund
(For a share outstanding throughout each period)
| Six months ended
November 30, 2023
(unaudited) | |
| | | | | |
Net asset value, beginning of period | | | | | | |
| | | | | | |
Net realized and unrealized gains (losses) on investments | | | | | | |
Total from investment operations | | | | | | |
Distributions to shareholders from | | | | | | |
| | | | | | |
Net asset value, end of period | | | | | | |
| | | | | | |
Ratios to average net assets (annualized)* | | | | | | |
| | | | | | |
| | | | | | |
| | | | | | |
| | | | | | |
| | | | | | |
Net assets, end of period (000s omitted) | | | | | | |
| Ratios include net expenses allocated from the affiliated Master Portfolio which were as follows: |
Six months ended November 30, 2023 (unaudited) | |
| |
| |
| |
| |
| |
| For the period from July 31, 2018 (commencement of class operations) to May 31, 2019. |
| Calculated based upon average shares outstanding |
| Returns for periods of less than one year are not annualized. |
| Portfolio turnover rate is calculated by multiplying the affiliated Master Portfolio’s percentage of the Fund’s total investment in securities at the end of the period by the affiliated Master Portfolio’s portfolio turnover rate. |
The accompanying notes are an integral part of these financial statements.
Allspring Emerging Growth Fund | 15
(For a share outstanding throughout each period)
| Six months ended
November 30, 2023
(unaudited) | |
| | | | | |
Net asset value, beginning of period | | | | | | |
| | | | | | |
Net realized and unrealized gains (losses) on investments | | | | | | |
Total from investment operations | | | | | | |
Distributions to shareholders from | | | | | | |
| | | | | | |
Net asset value, end of period | | | | | | |
| | | | | | |
Ratios to average net assets (annualized)* | | | | | | |
| | | | | | |
| | | | | | |
| | | | | | |
| | | | | | |
| | | | | | |
Net assets, end of period (000s omitted) | | | | | | |
| Ratios include net expenses allocated from the affiliated Master Portfolio which were as follows: |
Six months ended November 30, 2023 (unaudited) | |
| |
| |
| |
| |
| |
| Calculated based upon average shares outstanding |
| Returns for periods of less than one year are not annualized. |
| Portfolio turnover rate is calculated by multiplying the affiliated Master Portfolio’s percentage of the Fund’s total investment in securities at the end of the period by the affiliated Master Portfolio’s portfolio turnover rate. |
The accompanying notes are an integral part of these financial statements.
16 | Allspring Emerging Growth Fund
(For a share outstanding throughout each period)
| Six months ended
November 30, 2023
(unaudited) | |
| | | | | |
Net asset value, beginning of period | | | | | | |
| | | | | | |
Net realized and unrealized gains (losses) on investments | | | | | | |
Total from investment operations | | | | | | |
Distributions to shareholders from | | | | | | |
| | | | | | |
Net asset value, end of period | | | | | | |
| | | | | | |
Ratios to average net assets (annualized)* | | | | | | |
| | | | | | |
| | | | | | |
| | | | | | |
| | | | | | |
| | | | | | |
Net assets, end of period (000s omitted) | | | | | | |
| Ratios include net expenses allocated from the affiliated Master Portfolio which were as follows: |
Six months ended November 30, 2023 (unaudited) | |
| |
| |
| |
| |
| |
| Calculated based upon average shares outstanding |
| Returns for periods of less than one year are not annualized. |
| Portfolio turnover rate is calculated by multiplying the affiliated Master Portfolio’s percentage of the Fund’s total investment in securities at the end of the period by the affiliated Master Portfolio’s portfolio turnover rate. |
The accompanying notes are an integral part of these financial statements.
Allspring Emerging Growth Fund | 17
Notes to financial statements (unaudited)
Notes to financial statements
Allspring Funds Trust (the “Trust”), a Delaware statutory trust organized on March 10, 1999, is an open-end management investment company registered under the Investment Company Act of 1940, as amended (the “1940 Act”). As an investment company, the Trust follows the accounting and reporting guidance in Financial Accounting Standards Board (“FASB”) Accounting Standards Codification Topic 946, Financial Services – Investment Companies. These financial statements report on the Allspring Emerging Growth Fund (the “Fund”) which is a diversified series of the Trust.
The Fund is a feeder fund in a master-feeder structure that invests substantially all of its assets in a single master portfolio with a substantially identical investment objective and substantially similar investment strategies. The Fund invests in Allspring Emerging Growth Portfolio, a separate diversified portfolio (the “affiliated Master Portfolio”) of Allspring Master Trust, a registered open-end management investment company. As of November 30, 2023, the Fund owned 88.62% of Allspring Emerging Growth Portfolio. The affiliated Master Portfolio directly acquires portfolio securities and the Fund acquires an indirect interest in those securities. The Fund accounts for its investment in the affiliated Master Portfolio as a partnership investment and records on a daily basis its share of the affiliated Master Portfolio’s income, expense and realized and unrealized gains and losses. The financial statements of the affiliated Master Portfolio for the six months ended November 30, 2023 are included in this report and should be read in conjunction with the Fund’s financial statements.
2.
SIGNIFICANT ACCOUNTING POLICIES
The following significant accounting policies, which are consistently followed in the preparation of the financial statements of the Fund, are in conformity with U.S. generally accepted accounting principles which require management to make estimates and assumptions that affect the reported amounts of assets and liabilities, disclosure of contingent assets and liabilities at the date of the financial statements, and the reported amounts of income and expenses during the reporting period. Actual results could differ from those estimates.
Securities valuation
All investments are valued each business day as of the close of regular trading on the New York Stock Exchange (generally 4 p.m. Eastern Time), although the Fund may deviate from this calculation time under unusual or unexpected circumstances.
Investments in the affiliated Master Portfolio are valued daily based on the Fund’s proportionate share of the affiliated Master Portfolio’s net assets, which are also valued daily.
Investments which are not valued using the method discussed above are valued at their fair value, as determined in good faith by Allspring Funds Management, LLC (“Allspring Funds Management”), which was named the valuation designee by the Board of Trustees. As the valuation designee, Allspring Funds Management is responsible for day-to-day valuation activities for the Allspring Funds. In connection with these responsibilities, Allspring Funds Management has established a Valuation Committee and has delegated to it the authority to take any actions regarding the valuation of portfolio securities that the Valuation Committee deems necessary or appropriate, including determining the fair value of portfolio securities. On a quarterly basis, the Board of Trustees receives reports of valuation actions taken by the Valuation Committee. On at least an annual basis, the Board of Trustees receives an assessment of the adequacy and effectiveness of Allspring Funds Management’s process for determining the fair value of the portfolio of investments.
Investment transactions, income and expenses
Investments in the affiliated Master Portfolio are recorded on a trade date basis. The Fund records daily its proportionate share of the affiliated Master Portfolio’s income, expenses and realized and unrealized gains or losses. The Fund also accrues its own expenses.
Distributions to shareholders
Distributions to shareholders from net investment income and any net realized gains are recorded on the ex-dividend date and paid at least annually. Such distributions are determined in accordance with income tax regulations and may differ from U.S. generally accepted accounting principles. Dividend sources are estimated at the time of declaration. The tax character of distributions is determined as of the Fund’s fiscal year end. Therefore, a portion of the Fund’s distributions made prior to the Fund’s fiscal year end may be categorized as a tax return of capital at year end.
Federal and other taxes
The Fund intends to continue to qualify as a regulated investment company by distributing substantially all of its investment company taxable income and any net realized capital gains (after reduction for capital loss carryforwards) sufficient to relieve it from all, or substantially all, federal income taxes. Accordingly, no provision for federal income taxes was required.
The Fund’s income and federal excise tax returns and all financial records supporting those returns for the prior three fiscal years are subject to examination by the federal and Delaware revenue authorities. Management has analyzed the Fund’s tax positions taken on federal, state, and foreign tax returns, as applicable, for all open tax years and does not believe that there are any uncertain tax positions that require recognition of a tax liability.
18 | Allspring Emerging Growth Fund
Notes to financial statements (unaudited)
As of November 30, 2023, the aggregate cost of all investments for federal income tax purposes was $128,625,556 and the unrealized gains (losses) consisted of:
As of May 31, 2023, the Fund had capital loss carryforwards which consisted of $16,623,151 in short-term capital losses and a qualified late-year ordinary loss of $951,457 which was recognized on the first day of the current fiscal year.
Class allocations
The separate classes of shares offered by the Fund differ principally in applicable sales charges, distribution, shareholder servicing, and administration fees. Class specific expenses are charged directly to that share class. Investment income, common fund-level expenses, and realized and unrealized gains (losses) on investments are allocated daily to each class of shares based on the relative proportion of net assets of each class.
3.
FAIR VALUATION MEASUREMENTS
At November 30, 2023, the Fund’s investment in the affiliated Master Portfolio was measured at fair value using the net asset value per share (or its equivalent) as a practical expedient. The investment objective and fair value of the affiliated Master Portfolio is as follows:
Affiliated Master Portfolio | | Fair value of affiliated
Master Portfolio |
Allspring Emerging Growth Portfolio | Seek long-term capital appreciation | |
The affiliated Master Portfolio does not have a redemption period notice, can be redeemed daily and does not have any unfunded commitments.
4.
TRANSACTIONS WITH AFFILIATES
Management fee
Allspring Funds Management, a wholly owned subsidiary of Allspring Global Investments Holdings, LLC, a holding company indirectly owned by certain private funds of GTCR LLC and Reverence Capital Partners, L.P., is the manager of the Fund and provides advisory and fund-level administrative services under an investment management agreement. Under the investment management agreement, Allspring Funds Management is responsible for, among other services, implementing the investment objectives and strategies of the Fund and providing fund-level administrative services in connection with the Fund’s operations. As long as the Fund continues to invest substantially all of its assets in a single affiliated Master Portfolio, the Fund pays Allspring Funds Management an investment management fee only for fund-level administrative services at the following annual rate based on the Fund’s average daily net assets:
For the six months ended November 30, 2023, the management fee was equivalent to an annual rate of 0.05% of the Fund’s average daily net assets.
Allspring Funds Management also serves as the adviser to the affiliated Master Portfolio and is entitled to receive a fee from the affiliated Master Portfolio for those services.
Administration fees
Under a class-level administration agreement, Allspring Funds Management provides class-level administrative services to the Fund, which includes paying fees and expenses for services provided by the transfer agent, sub-transfer agents, omnibus account servicers and record-keepers. As compensation for its services under the class-level administration agreement, Allspring Funds Management receives an annual fee which is calculated based on the average daily net assets of each class as follows:
| Class-level
administration fee |
| |
| |
| |
| |
| |
Prior to June 30, 2023, the class-level administration fee for Class A and Class C was 0.21% of its respective average daily net assets.
Allspring Emerging Growth Fund | 19
Notes to financial statements (unaudited)
Waivers and/or expense reimbursements
Allspring Funds Management has contractually committed to waive and/or reimburse management and administration fees to the extent necessary to maintain certain net operating expense ratios for the Fund. When each class of the Fund has exceeded its expense cap, Allspring Funds Management will waive fees and/or reimburse expenses from fund-level expenses on a proportionate basis and then from class specific expenses. When only certain classes exceed their expense caps, waivers and/or reimbursements are applied against class specific expenses before fund-level expenses. Net expenses from the affiliated Master Portfolio are included in the expense caps. Allspring Funds Management has contractually committed through September 30, 2024 to waive fees and/or reimburse expenses to the extent necessary to cap the Fund’s expenses. Prior to or after the commitment expiration date, the caps may be increased or the commitment to maintain the cap may be terminated only with the approval of the Board of Trustees. As of November 30, 2023, the contractual expense caps are as follows:
Prior to June 30, 2023, the Fund’s expenses were capped at 1.28% for Class A shares and 2.03% for Class C shares.
Distribution fee
The Trust has adopted a distribution plan for Class C shares pursuant to Rule 12b-1 under the 1940 Act. A distribution fee is charged to Class C shares and paid to Allspring Funds Distributor, LLC (“Allspring Funds Distributor”), the principal underwriter, an affiliate of Allspring Funds Management, at an annual rate up to 0.75% of the average daily net assets of Class C shares.
In addition, Allspring Funds Distributor is entitled to receive the front-end sales charge from the purchase of Class A shares and a contingent deferred sales charge on the redemption of certain Class A shares. Allspring Funds Distributor is also entitled to receive the contingent deferred sales charges from redemptions of Class C shares. For the six months ended November 30, 2023, Allspring Funds Distributor received $1,142 from the sale of Class A shares. No contingent deferred sales charges were incurred by Class A and Class C shares for the six months ended November 30, 2023.
Shareholder servicing fees
The Trust has entered into contracts with one or more shareholder servicing agents, whereby Class A, Class C, and Administrator Class are charged a fee at an annual rate up to 0.25% of the average daily net assets of each respective class. A portion of these total shareholder servicing fees were paid to affiliates of the Fund.
5.
INVESTMENT PORTFOLIO TRANSACTIONS
The Fund seeks to achieve its investment objective by investing substantially all of its assets in the affiliated Master Portfolio. Purchases and sales have been calculated by multiplying the Fund’s ownership percentage of the affiliated Master Portfolio at the end of the period by the affiliated Master Portfolio’s purchases and sales. Purchases and sales of investments, excluding U.S. government obligations (if any) and short-term securities, for the six months ended November 30, 2023 were $164,604,072 and $166,609,730, respectively.
The Trust (excluding the money market funds), Allspring Master Trust and Allspring Variable Trust are parties to a $350,000,000 revolving credit agreement whereby the Fund is permitted to use bank borrowings for temporary or emergency purposes, such as to fund shareholder redemption requests. Interest under the credit agreement is charged to the Fund based on borrowing rate equal to the higher of the Federal Funds rate or the overnight bank funding rate in effect on that day plus a spread. In addition, an annual commitment fee based on the unused balance is allocated to each participating fund.
For the six months ended November 30, 2023, there were no borrowings by the Fund under the agreement.
Concentration risks result from exposure to a limited number of sectors. Through its investment in the affiliated Master Portfolio which may invest a substantial portion of its assets in any sectors, the Fund may in turn be more affected by changes in that sectors than a fund whose investments are not heavily weighted in any sectors. As of the end of the period, the Master Portfolio concentrated its portfolio in investments related to the information technology sector.
Under the Fund’s organizational documents, the officers and Trustees have been granted certain indemnification rights against certain liabilities that may arise out of performance of their duties to the Fund. The Fund has entered into a separate agreement with each Trustee that converts
20 | Allspring Emerging Growth Fund
Notes to financial statements (unaudited)
indemnification rights currently existing under the Fund’s organizational documents into contractual rights that cannot be changed in the future without the consent of the Trustee. Additionally, in the normal course of business, the Fund may enter into contracts with service providers that contain a variety of indemnification clauses. The Fund’s maximum exposure under these arrangements is dependent on future claims that may be made against the Fund and, therefore, cannot be estimated.
Allspring Emerging Growth Fund | 21
Portfolio of investments—November 30, 2023 (unaudited)
| | | | | |
| | | | | | |
Communication services: 0.55% | | | | | | |
| | | | | | |
Madison Square Garden Entertainment Corp.† | | | | | | |
| | | | | | |
| | | | | | |
Consumer discretionary: 9.63% | | | | | | |
Automobile components: 1.01% | | | | | | |
Fox Factory Holding Corp.† | | | | | | |
Modine Manufacturing Co.† | | | | | | |
| | | | | | |
| | | | | | |
Diversified consumer services: 3.67% | | | | | | |
Bright Horizons Family Solutions, Inc.† | | | | | | |
| | | | | | |
| | | | | | |
| | | | | | |
| | | | | | |
Hotels, restaurants & leisure: 2.57% | | | | | | |
Dutch Bros, Inc. Class A† | | | | | | |
First Watch Restaurant Group, Inc.† | | | | | | |
Hilton Grand Vacations, Inc.† | | | | | | |
| | | | | | |
| | | | | | |
| | | | | | |
American Eagle Outfitters, Inc. | | | | | | |
Boot Barn Holdings, Inc.† | | | | | | |
| | | | | | |
| | | | | | |
| | | | | | |
| | | | | | |
| | | | | | |
| | | | | | |
| | | | | | |
Consumer staples distribution & retail : 0.40% | | | | | | |
| | | | | | |
| | | | | | |
| | | | | | |
| | | | | | |
| | | | | | |
The accompanying notes are an integral part of these financial statements.
22 | Allspring Emerging Growth Portfolio
Portfolio of investments—November 30, 2023 (unaudited)
| | | | | |
Personal care products: 4.65% | | | | | | |
| | | | | | |
| | | | | | |
| | | | | | |
| | | | | | |
Energy equipment & services: 0.48% | | | | | | |
| | | | | | |
Oil, gas & consumable fuels: 1.32% | | | | | | |
| | | | | | |
| | | | | | |
| | | | | | |
| | | | | | |
Financial services: 0.53% | | | | | | |
| | | | | | |
| | | | | | |
Goosehead Insurance, Inc. Class A† | | | | | | |
Kinsale Capital Group, Inc. | | | | | | |
Skyward Specialty Insurance Group, Inc.† | | | | | | |
| | | | | | |
| | | | | | |
| | | | | | |
Apellis Pharmaceuticals, Inc.† | | | | | | |
Immunocore Holdings PLC ADR† | | | | | | |
| | | | | | |
| | | | | | |
| | | | | | |
Health care equipment & supplies: 7.22% | | | | | | |
| | | | | | |
| | | | | | |
PROCEPT BioRobotics Corp.† | | | | | | |
| | | | | | |
| | | | | | |
| | | | | | |
| | | | | | |
| | | | | | |
Health care providers & services: 3.41% | | | | | | |
| | | | | | |
| | | | | | |
| | | | | | |
| | | | | | |
The accompanying notes are an integral part of these financial statements.
Allspring Emerging Growth Portfolio | 23
Portfolio of investments—November 30, 2023 (unaudited)
| | | | | |
| | | | | | |
Structure Therapeutics, Inc. ADR† | | | | | | |
Tarsus Pharmaceuticals, Inc.† | | | | | | |
| | | | | | |
| | | | | | |
Aerospace & defense: 1.33% | | | | | | |
| | | | | | |
| | | | | | |
| | | | | | |
| | | | | | |
| | | | | | |
Zurn Elkay Water Solutions Corp. Class C | | | | | | |
| | | | | | |
Commercial services & supplies: 3.37% | | | | | | |
Casella Waste Systems, Inc. Class A† | | | | | | |
| | | | | | |
| | | | | | |
Construction & engineering: 2.57% | | | | | | |
Comfort Systems USA, Inc. | | | | | | |
Construction Partners, Inc. Class A† | | | | | | |
| | | | | | |
Electrical equipment: 1.14% | | | | | | |
NEXTracker, Inc. Class A† | | | | | | |
Shoals Technologies Group, Inc. Class A† | | | | | | |
| | | | | | |
Ground transportation: 2.53% | | | | | | |
| | | | | | |
| | | | | | |
| | | | | | |
| | | | | | |
| | | | | | |
| | | | | | |
| | | | | | |
| | | | | | |
Professional services: 2.26% | | | | | | |
| | | | | | |
| | | | | | |
| | | | | | |
The accompanying notes are an integral part of these financial statements.
24 | Allspring Emerging Growth Portfolio
Portfolio of investments—November 30, 2023 (unaudited)
| | | | | |
Trading companies & distributors: 3.44% | | | | | | |
Applied Industrial Technologies, Inc. | | | | | | |
SiteOne Landscape Supply, Inc.† | | | | | | |
| | | | | | |
Information technology: 34.23% | | | | | | |
Communications equipment: 1.18% | | | | | | |
| | | | | | |
| | | | | | |
| | | | | | |
Electronic equipment, instruments & components: 1.72% | | | | | | |
| | | | | | |
| | | | | | |
| | | | | | |
| | | | | | |
| | | | | | |
| | | | | | |
| | | | | | |
Semiconductors & semiconductor equipment: 6.50% | | | | | | |
ACM Research, Inc. Class A† | | | | | | |
Allegro MicroSystems, Inc.† | | | | | | |
Credo Technology Group Holding Ltd.† | | | | | | |
| | | | | | |
| | | | | | |
| | | | | | |
Silicon Laboratories, Inc.† | | | | | | |
| | | | | | |
| | | | | | |
| | | | | | |
| | | | | | |
| | | | | | |
| | | | | | |
Clearwater Analytics Holdings, Inc. Class A† | | | | | | |
| | | | | | |
Descartes Systems Group, Inc.† | | | | | | |
DoubleVerify Holdings, Inc.† | | | | | | |
| | | | | | |
| | | | | | |
| | | | | | |
PowerSchool Holdings, Inc. Class A† | | | | | | |
| | | | | | |
Sprout Social, Inc. Class A† | | | | | | |
| | | | | | |
| | | | | | |
| | | | | | |
| | | | | | |
The accompanying notes are an integral part of these financial statements.
Allspring Emerging Growth Portfolio | 25
Portfolio of investments—November 30, 2023 (unaudited)
| | | | | |
| | | | | | |
| | | | | | |
| | | | | | |
Total common stocks (Cost $234,344,662) | | | | | | |
| | | | | |
Short-term investments: 0.95% | | | | | | |
Investment companies: 0.95% | | | | | | |
Allspring Government Money Market Fund Select Class♠∞ | | | | | | |
Total short-term investments (Cost $2,855,919) | | | | | | |
Total investments in securities (Cost $237,200,581) | | | | | | |
Other assets and liabilities, net | | | | | | |
| | | | | | |
| Non-income-earning security |
| The issuer of the security is an affiliated person of the Portfolio as defined in the Investment Company Act of 1940. |
| The rate represents the 7-day annualized yield at period end. |
|
| American depositary receipt |
Investments in affiliates
An affiliated investment is an investment in which the Portfolio owns at least 5% of the outstanding voting shares of the issuer or as a result of other relationships, such as the Portfolio and the issuer having the same adviser or investment manager. Transactions with issuers that were affiliates of the Portfolio at the end of the period were as follows:
| | | | | Net
change in
unrealized
gains
(losses) | | | Income
from
affiliated
securities |
| | | | | | | | |
Allspring Government Money Market Fund Select Class | | | | | | | | |
The accompanying notes are an integral part of these financial statements.
26 | Allspring Emerging Growth Portfolio
Statement of assets and liabilities—November 30, 2023 (unaudited)
Financial statements
Statement of assets and liabilities
| |
Investments in unaffiliated securities, at value (cost $234,344,662) | |
Investments in affiliated securities, at value (cost $2,855,919) | |
Receivable for investments sold | |
| |
Prepaid expenses and other assets | |
| |
| |
Payable for investments purchased | |
| |
Trustees’ fees and expenses payable | |
Accrued expenses and other liabilities | |
| |
| |
The accompanying notes are an integral part of these financial statements.
Allspring Emerging Growth Portfolio | 27
Statement of operations—six months ended November 30, 2023 (unaudited)
Statement of operations
| |
| |
Income from affiliated securities | |
| |
| |
| |
| |
Custody and accounting fees | |
| |
Interest holder report expenses | |
Trustees’ fees and expenses | |
| |
| |
Less: Fee waivers and/or expense reimbursements | |
| |
| |
Realized and unrealized gains (losses) on investments | |
Net realized losses on investments | |
Net change in unrealized gains (losses) on investments | |
Net realized and unrealized gains (losses) on investments | |
Net decrease in net assets resulting from operations | |
The accompanying notes are an integral part of these financial statements.
28 | Allspring Emerging Growth Portfolio
Statement of changes in net assets
Statement of changes in net assets
|
Six months ended
November 30, 2023 (unaudited) | |
| | | | |
| | | | |
Net realized gains (losses) on investments | | | | |
Net change in unrealized gains (losses) on investments | | | | |
Net decrease in net assets resulting from operations | | | | |
| | | | |
Transactions in investors’ beneficial interests | | | | |
| | | | |
| | | | |
Net decrease in net assets resulting from capital transactions | | | | |
Total decrease in net assets | | | | |
| | | | |
| | | | |
| | | | |
The accompanying notes are an integral part of these financial statements.
Allspring Emerging Growth Portfolio | 29
| Six months ended
November 30, 2023
(unaudited) | |
| | | | | |
| | | | | | |
Ratios to average net assets (annualized) | | | | | | |
| | | | | | |
| | | | | | |
| | | | | | |
| | | | | | |
| | | | | | |
| Returns for periods of less than one year are not annualized. |
| Net expense ratios reflect voluntary waivers, if any. |
The accompanying notes are an integral part of these financial statements.
30 | Allspring Emerging Growth Portfolio
Notes to financial statements (unaudited)
Notes to financial statements
Allspring Master Trust (the “Trust”), a Delaware statutory trust organized on March 10, 1999, is an open-end management investment company registered under the Investment Company Act of 1940, as amended (the “1940 Act”). As an investment company, the Trust follows the accounting and reporting guidance in Financial Accounting Standards Board (“FASB”) Accounting Standards Codification Topic 946, Financial Services – Investment Companies. These financial statements report on the Allspring Emerging Growth Portfolio (the “Portfolio”) which is a diversified series of the Trust.
Interests in the Portfolio are available solely through private placement transactions that do not involve any “public offering” within the meaning of Section 4(a)(2) of the Securities Act of 1933.
2.
SIGNIFICANT ACCOUNTING POLICIES
The following significant accounting policies, which are consistently followed in the preparation of the financial statements of the Portfolio, are in conformity with U.S. generally accepted accounting principles which require management to make estimates and assumptions that affect the reported amounts of assets and liabilities, disclosure of contingent assets and liabilities at the date of the financial statements, and the reported amounts of income and expenses during the reporting period. Actual results could differ from those estimates.
Securities valuation
All investments are valued each business day as of the close of regular trading on the New York Stock Exchange (generally 4 p.m. Eastern Time), although the Portfolio may deviate from this calculation time under unusual or unexpected circumstances.
Equity securities and exchange-traded funds that are listed on a foreign or domestic exchange or market are valued at the official closing price or, if none, the last sales price.
Investments in registered open-end investment companies (other than those listed on a foreign or domestic exchange or market) are valued at net asset value.
Investments which are not valued using the methods discussed above are valued at their fair value, as determined in good faith by Allspring Funds Management, LLC (“Allspring Funds Management”), which was named the valuation designee by the Board of Trustees. As the valuation designee, Allspring Funds Management is responsible for day-to-day valuation activities for the Allspring Funds. In connection with these responsibilities, Allspring Funds Management has established a Valuation Committee and has delegated to it the authority to take any actions regarding the valuation of portfolio securities that the Valuation Committee deems necessary or appropriate, including determining the fair value of portfolio securities. On a quarterly basis, the Board of Trustees receives reports of valuation actions taken by the Valuation Committee. On at least an annual basis, the Board of Trustees receives an assessment of the adequacy and effectiveness of Allspring Funds Management’s process for determining the fair value of the portfolio of investments.
Security transactions and income recognition
Securities transactions are recorded on a trade date basis. Realized gains or losses are recorded on the basis of identified cost.
Dividend income is recognized on the ex-dividend date.
Interest earned on cash balances held at the custodian is recorded as interest income.
Federal and other taxes
The Portfolio is not required to pay federal income taxes on its net investment income and net capital gains as it is treated as a partnership for federal income tax purposes. All income, gains and losses of the Portfolio are deemed to have been “passed through” to the interest holders in proportion to their holdings of the Portfolio regardless of whether income and gains have been distributed by the Portfolio.
The Portfolio’s income tax returns and all financial records supporting those returns for the prior three fiscal years are subject to examination by the federal revenue authority. Management has analyzed the Portfolio’s tax positions taken on federal, state, and foreign tax returns, as applicable, for all open tax years and does not believe that there are any uncertain tax positions that require recognition of a tax liability.
As of November 30, 2023, the aggregate cost of all investments for federal income tax purposes was $237,532,999 and the unrealized gains (losses) consisted of:
Allspring Emerging Growth Portfolio | 31
Notes to financial statements (unaudited)
3.
FAIR VALUATION MEASUREMENTS
Fair value measurements of investments are determined within a framework that has established a fair value hierarchy based upon the various data inputs utilized in determining the value of the Portfolio’s investments. The three-level hierarchy gives the highest priority to unadjusted quoted prices in active markets for identical assets or liabilities (Level 1) and the lowest priority to unobservable inputs (Level 3). The Portfolio’s investments are classified within the fair value hierarchy based on the lowest level of input that is significant to the fair value measurement. The inputs are summarized into three broad levels as follows:
•Level 1—quoted prices in active markets for identical securities
•Level 2—other significant observable inputs (including quoted prices for similar securities, interest rates, prepayment speeds, credit risk, etc.)
•Level 3—significant unobservable inputs (including the Portfolio’s own assumptions in determining the fair value of investments)
The inputs or methodologies used for valuing investments in securities are not necessarily an indication of the risk associated with investing in those securities.
The following is a summary of the inputs used in valuing the Portfolio’s assets and liabilities as of November 30, 2023:
| | Other significant
observable inputs
(Level 2) | Significant
unobservable inputs
(Level 3) | |
| | | | |
| | | | |
| | | | |
| | | | |
| | | | |
| | | | |
| | | | |
| | | | |
| | | | |
| | | | |
| | | | |
| | | | |
| | | | |
| | | | |
| | | | |
Additional sector, industry or geographic detail, if any, is included in the Portfolio of Investments.
At November 30, 2023, the Portfolio did not have any transfers into/out of Level 3.
4.
TRANSACTIONS WITH AFFILIATES
Advisory fee
The Trust has entered into an advisory contract with Allspring Funds Management, a wholly owned subsidiary of Allspring Global Investments Holdings, LLC, a holding company indirectly owned by certain private funds of GTCR LLC and Reverence Capital Partners, L.P. The adviser is responsible for implementing investment policies and guidelines and for supervising the subadviser, who is responsible for day-to-day portfolio management of the Portfolio. Pursuant to the contract, Allspring Funds Management is entitled to receive an advisory fee at the following annual rate based on the Portfolio’s average daily net assets:
For the six months ended November 30, 2023, the advisory fee was equivalent to an annual rate of 0.80% of the Portfolio’s average daily net assets.
Allspring Funds Management has retained the services of a subadviser to provide daily portfolio management to the Portfolio. The fee for subadvisory services is borne by Allspring Funds Management. Allspring Global Investments, LLC, an affiliate of Allspring Funds Management and a wholly owned
32 | Allspring Emerging Growth Portfolio
Notes to financial statements (unaudited)
subsidiary of Allspring Global Investments Holdings, LLC, is the subadviser to the Portfolio and is entitled to receive a fee from Allspring Funds Management at an annual rate starting at 0.55% and declining to 0.40% as the average daily net assets of the Portfolio increase.
Allspring Funds Management has voluntarily waived and/or reimbursed advisory fees to reduce the net operating expense ratio of the Portfolio. These voluntary waivers may be discontinued at any time.
Interfund transactions
The Portfolio may purchase or sell portfolio investment securities to certain affiliates pursuant to Rule 17a-7 under the 1940 Act and under procedures adopted by the Board of Trustees. The procedures have been designed to ensure that these interfund transactions, which do not incur broker commissions, are effected at current market prices. Pursuant to these procedures, the Portfolio did not have any interfund transactions during the six months ended November 30, 2023.
5.
INVESTMENT PORTFOLIO TRANSACTIONS
Purchases and sales of investments, excluding U.S. government obligations (if any) and short-term securities, for the six months ended November 30, 2023 were $183,948,895 and $186,262,037, respectively.
The Trust, along with Allspring Variable Trust and Allspring Funds Trust (excluding the money market funds), are parties to a $350,000,000 revolving credit agreement whereby the Portfolio is permitted to use bank borrowings for temporary or emergency purposes, such as to fund interest holders withdrawal requests. Interest under the credit agreement is charged to the Portfolio based on borrowing rate equal to the higher of the Federal Funds rate or the overnight bank funding rate in effect on that day plus a spread. In addition, an annual commitment fee based on the unused balance is allocated to each participating fund.
For the six months ended November 30, 2023, there were no borrowings by the Portfolio under the agreement.
As of the end of the period, the Portfolio concentrated its portfolio of investments in information technology sector. A fund that invests a substantial portion of its assets in any sector may be more affected by changes in that sector than would be a fund whose investments are not heavily weighted in any sector.
Under the Portfolio’s organizational documents, the officers and Trustees have been granted certain indemnification rights against certain liabilities that may arise out of performance of their duties to the Portfolio. The Portfolio has entered into a separate agreement with each Trustee that converts indemnification rights currently existing under the Portfolio’s organizational documents into contractual rights that cannot be changed in the future without the consent of the Trustee. Additionally, in the normal course of business, the Portfolio may enter into contracts with service providers that contain a variety of indemnification clauses. The Portfolio’s maximum exposure under these arrangements is dependent on future claims that may be made against the Portfolio and, therefore, cannot be estimated.
Allspring Emerging Growth Portfolio | 33
Other information (unaudited)
Other information
Proxy voting information
A description of the policies and procedures used to determine how to vote proxies relating to portfolio securities is available without charge, upon request, by calling 1-866-259-3305, visiting our website at allspringglobal.com, or visiting the SEC website at sec.gov. Information regarding how the proxies related to portfolio securities were voted during the most recent 12-month period ended June 30 is available on the website at allspringglobal.com or by visiting the SEC website at sec.gov.
Quarterly portfolio holdings information
The Fund and Portfolio file their complete schedule of portfolio holdings with the SEC for the first and third quarters of each fiscal year as an exhibit to their reports on Form N-PORT. Shareholders and Interest holders may view the filed Form N-PORT by visiting the SEC website at sec.gov.
34 | Allspring Emerging Growth Fund
Other information (unaudited)
Board of trustees and officers
Each of the Trustees and Officers listed in the table below acts in identical capacities for each fund in the Allspring family of funds, which consists of 126 mutual funds comprising the Allspring Funds Trust, Allspring Variable Trust, Allspring Master Trust and four closed-end funds (collectively the “Fund Complex”). This table should be read in conjunction with the Prospectus and the Statement of Additional Information†. The mailing address of each Trustee and Officer is 1415 Vantage Park Drive, 3rd Floor, Charlotte, NC 28203. Each Trustee and Officer serves an indefinite term, however, each Trustee serves such term until reaching the mandatory retirement age established by the Trustees.
Independent Trustees
| | Principal occupations during past five years or longer | Current other
public company or
investment
company
directorships |
William R. Ebsworth
(Born 1957) | | Retired. From 1984 to 2013, equities analyst, portfolio manager, research director and chief investment officer at Fidelity Management and Research Company in Boston, Tokyo, and Hong Kong, and retired in 2013 as Chief Investment Officer of Fidelity Strategic Advisers, Inc. where he led a team of investment professionals managing client assets. Prior thereto, Board member of Hong Kong Securities Clearing Co., Hong Kong Options Clearing Corp., the Thailand International Fund, Ltd., Fidelity Investments Life Insurance Company, and Empire Fidelity Investments Life Insurance Company. Serves on the Investment Company Institute’s Board of Governors since 2022 and Executive Committee since 2023 as well as the Vice Chairman of the Governing Council of the Independent Directors Council since 2023. Audit Committee Chair and Investment Committee Chair of the Vincent Memorial Hospital Foundation (non-profit organization). Mr. Ebsworth is a CFA charterholder. | |
Jane A. Freeman
(Born 1953) | Trustee,
since 2015;
Chair Liaison,
| Retired. From 2012 to 2014 and 1999 to 2008, Chief Financial Officer of Scientific Learning Corporation. From 2008 to 2012, Ms. Freeman provided consulting services related to strategic business projects. Prior to 1999, Portfolio Manager at Rockefeller & Co. and Scudder, Stevens & Clark. Board member of the Harding Loevner Funds from 1996 to 2014, serving as both Lead Independent Director and chair of the Audit Committee. Board member of the Russell Exchange Traded Funds Trust from 2011 to 2012 and the chair of the Audit Committee. Ms. Freeman is also an inactive Chartered Financial Analyst. | |
Isaiah Harris, Jr.
(Born 1952) | Trustee,
since 2009;
Audit Committee Chair,
since 2019 | Retired. Member of the Advisory Board of CEF of East Central Florida. Chairman of the Board of CIGNA Corporation from 2009 to 2021, and Director from 2005 to 2008. From 2003 to 2011, Director of Deluxe Corporation. Prior thereto, President and CEO of BellSouth Advertising and Publishing Corp. from 2005 to 2007, President and CEO of BellSouth Enterprises from 2004 to 2005 and President of BellSouth Consumer Services from 2000 to 2003. Emeritus member of the Iowa State University Foundation Board of Governors. Emeritus Member of the Advisory board of Iowa State University School of Business. Advisory Board Member, Palm Harbor Academy (private school). Advisory Board Member, Fellowship of Christian Athletes. Mr. Harris is a certified public accountant (inactive status). | |
David F. Larcker
(Born 1950) | | Distinguished Visiting Fellow at the Hoover Institution since 2022. James Irvin Miller Professor of Accounting at the Graduate School of Business (Emeritus), Stanford University, Director of the Corporate Governance Research Initiative and Senior Faculty of The Rock Center for Corporate Governance since 2006. From 2005 to 2008, Professor of Accounting at the Graduate School of Business, Stanford University. Prior thereto, Ernst & Young Professor of Accounting at The Wharton School, University of Pennsylvania from 1985 to 2005. | |
Olivia S. Mitchell
(Born 1953) | | International Foundation of Employee Benefit Plans Professor since 1993, Wharton School of the University of Pennsylvania. Director of Wharton’s Pension Research Council and Boettner Center on Pensions & Retirement Research, and Research Associate at the National Bureau of Economic Research. Previously taught at Cornell University from 1978 to 1993. | |
Timothy J. Penny
(Born 1951) | Trustee,
since 1996;
Chair,
since 2018 | President and Chief Executive Officer of Southern Minnesota Initiative Foundation, a non-profit organization, since 2007. Vice Chair of the Economic Club of Minnesota, since 2007. Co-Chair of the Committee for a Responsible Federal Budget, since 1995. Member of the Board of Trustees of NorthStar Education Finance, Inc., a non-profit organization, from 2007-2022. Senior Fellow of the University of Minnesota Humphrey Institute from 1995 to 2017. | |
* Length of service dates reflect the Trustee’s commencement of service with the Trust’s predecessor entities, where applicable.
# Ms. Freeman will serve as Chair Liaison through June 2024, at which time Ms. Wheelock will assume the role.
†
The Statement of Additional Information includes additional information about the Trustees and is available, without charge, upon request, by calling 1-800-222-8222 or by visiting the website at allspringglobal.com.
Allspring Emerging Growth Fund | 35
Other information (unaudited)
| Position held and length of service* | Principal occupations during past five years or longer | Current other public company or investment company directorships |
James G. Polisson
(Born 1959) | Trustee,
since 2018; Nominating and Governance Committee Chair, since 2024 | Retired. Chief Marketing Officer, Source (ETF) UK Services, Ltd, from 2015 to 2017. From 2012 to 2015, Principal of The Polisson Group, LLC, a management consulting, corporate advisory and principal investing company. Chief Executive Officer and Managing Director at Russell Investments, Global Exchange Traded Funds from 2010 to 2012. Managing Director of Barclays Global Investors from 1998 to 2010 and Global Chief Marketing Officer for iShares and Barclays Global Investors from 2000 to 2010. Trustee of the San Francisco Mechanics’ Institute, a non- profit organization, from 2013 to 2015. Board member of the Russell Exchange Traded Fund Trust from 2011 to 2012. Director of Barclays Global Investors Holdings Deutschland GmbH from 2006 to 2009. Mr. Polisson is an attorney and has a retired status with the Massachusetts and District of Columbia Bar Associations. | |
Pamela Wheelock
(Born 1959) | Trustee,
since January 2020;
previously Trustee from
January 2018 to
| Retired. Executive and Senior Financial leadership positions in the public, private and nonprofit sectors. Interim President and CEO, McKnight Foundation, 2020. Interim Commissioner, Minnesota Department of Human Services, 2019. Chief Operating Officer, Twin Cities Habitat for Humanity, 2017-2019. Vice President for University Services, University of Minnesota, 2012- 2016. Interim President and CEO, Blue Cross and Blue Shield of Minnesota, 2011-2012. Executive Vice-President and Chief Financial Officer, Minnesota Wild, 2002-2008. Commissioner, Minnesota Department of Finance, 1999-2002. Chair of the Board of Directors of Destination Medical Center Corporation. Board member of the Minnesota Wild Foundation. | |
* Length of service dates reflect the Trustee’s commencement of service with the Trust’s predecessor entities, where applicable.
# Ms. Freeman will serve as Chair Liaison through June 2024, at which time Ms. Wheelock will assume the role.
36 | Allspring Emerging Growth Fund
Other information (unaudited)
Officers1
| Position held and
length of service | Principal occupations during past five years or longer |
| | President and Chief Executive Officer of Allspring Funds Management, LLC since 2017 and Head of Global Fund Governance of Allspring Global Investments since 2022. Prior thereto, co-president of Galliard Capital Management, LLC, an affiliate of Allspring Funds Management, LLC, from 2019 to 2022 and Head of Affiliated Managers, Allspring Global Investments, from 2014 to 2019 and Executive Vice President responsible for marketing, investments and product development for Allspring Funds Management, LLC, from 2009 to 2014. |
Jeremy DePalma
(Born 1974) | Treasurer,
since 2012
(for certain funds in
the Fund Complex);
since 2021 (for
the remaining funds in the Complex) | Senior Vice President of Allspring Funds Management, LLC since 2009. Senior Vice President of Evergreen Investment Management Company, LLC from 2008 to 2010 and head of the Fund Reporting and Control Team within Fund Administration from 2005 to 2010. |
Christopher Baker
(Born 1976) | Chief Compliance Officer,
since 2022 | Global Chief Compliance Officer for Allspring Global Investments since 2022. Prior thereto, Chief Compliance Officer for State Street Global Advisors from 2018 to 2021. Senior Compliance Officer for the State Street divisions of Alternative Investment Solutions, Sector Solutions, and Global Marketing from 2015 to 2018. From 2010 to 2015 Vice President, Global Head of Investment and Marketing Compliance for State Street Global Advisors. |
Matthew Prasse
(Born 1983) | Chief Legal Officer,
since 2022;
Secretary,
since 2021 | Senior Counsel of the Allspring Legal Department since 2021. Senior Counsel of the Wells Fargo Legal Department from 2018 to 2021. Previously, Counsel for Barings LLC from 2015 to 2018. Prior to joining Barings, Associate at Morgan, Lewis & Bockius LLP from 2008 to 2015. |
1 For those Officers with tenures at Allspring Global Investments and/or Allspring Funds Management, LLC that began prior to 2021, such tenures include years of service during which these businesses/entities were known as Wells Fargo Asset Management and Wells Fargo Funds Management, LLC, respectively.
Allspring Emerging Growth Fund | 37
For more information
More information about Allspring Funds is available free upon request. To obtain literature, please write, visit the Fund’s website, or call:
Allspring Funds
P.O. Box 219967
Kansas City, MO 64121-9967
Website: allspringglobal.com
Individual investors: 1-800-222-8222
Retail investment professionals: 1-888-877-9275
Institutional investment professionals: 1-800-260-5969
This report and the financial statements contained herein are submitted for the general information of the shareholders of the Fund. If this report is used for promotional purposes, distribution of the report must be accompanied or preceded by a current prospectus. Before investing, please consider the investment objectives, risks, charges, and expenses of the investment. For a current prospectus and, if available, a summary prospectus, containing this information, call 1-800-222-8222 or visit the Fund’s website at allspringglobal.com. Read the prospectus carefully before you invest or send money.
Allspring Global InvestmentsTM is the trade name for the asset management firms of Allspring Global Investments Holdings, LLC, a holding company indirectly owned by certain private funds of GTCR LLC and Reverence Capital Partners, L.P. These firms include but are not limited to Allspring Global Investments, LLC, and Allspring Funds Management, LLC. Certain products managed by Allspring entities are distributed by Allspring Funds Distributor, LLC (a broker-dealer and Member FINRA/SIPC).
This material is for general informational and educational purposes only and is NOT intended to provide investment advice or a recommendation of any kind - including a recommendation for any specific investment, strategy, or plan.
© 2024 Allspring Global Investments Holdings, LLC. All rights reserved.
ALL-12052023-dvyfbies 01-24
SAR3326 11-23
Allspring Large Company Value Portfolio
Semi-Annual Report
November 30, 2023
Allspring Large Company Value Portfolio | 1
Performance highlights (unaudited)
Performance highlights
| The Portfolio seeks long-term capital appreciation. |
| Allspring Funds Management, LLC |
| Allspring Global Investments, LLC |
| Ryan Brown, CFA, Harindra de Silva, Ph.D., CFA |
Average annual total returns (%) as of November 30, 2023 |
| | | | |
| | | | |
Allspring Large Company Value Portfolio | | | | |
| | | | |
Russell 1000® Value Index2 | | | | |
Figures quoted represent past performance, which is no guarantee of future results, and do not reflect taxes that an investor may pay on an investment in a fund. Investment return and principal value of an investment will fluctuate so that an investor’s shares, when redeemed, may be worth more or less than their original cost. Current performance may be lower or higher than the performance data quoted.
Index returns do not include transaction costs associated with buying and selling securities, any mutual fund fees or expenses, or any taxes. It is not possible to invest directly in an index.
Shares are sold without a front-end sales charge or contingent deferred sales charge.
|
| The Russell 3000® Index measures the performance of the 3,000 largest U.S. companies based on total market capitalization, which represents approximately 98% of the investable U.S. equity market. You cannot invest directly in an index. |
| The Russell 1000® Value Index measures the performance of those Russell 1000 companies with lower price/book ratios and lower forecasted growth values. You cannot invest directly in an index. |
CFA® and Chartered Financial Analyst® are trademarks owned by CFA Institute. |
2 | Allspring Large Company Value Portfolio
Performance highlights (unaudited)
Ten largest holdings (%) as of November 30, 20231 |
Berkshire Hathaway, Inc. Class B | |
| |
| |
| |
| |
| |
| |
| |
| |
| |
| Figures represent the percentage of the Portfolio’s net assets. Holdings are subject to change and may have changed since the date specified. |
Sector allocation as of November 30, 20231 |
| Figures represent the percentage of the Portfolio’s long-term investments. Allocations are subject to change and may have changed since the date specified. |
Allspring Large Company Value Portfolio | 3
Portfolio expenses (unaudited)
Portfolio expenses
As an investor of beneficial interest of the Portfolio, you incur ongoing costs, including advisory fees and other Portfolio expenses. This example is intended to help you understand your ongoing costs (in dollars) of investing in the Portfolio and to compare these costs with the ongoing costs of investing in other mutual funds.
The example is based on an investment of $1,000 invested at the beginning of the six-month period and held for the entire period from June 1, 2023 to November 30, 2023.
Actual expenses
The “Actual” line of the table below provides information about actual account values and actual expenses. You may use the information in this line, together with the amount you invested, to estimate the expenses that you paid over the period. Simply divide your account value by $1,000 (for example, an $8,600 account value divided by $1,000= 8.6), then multiply the result by the number in the “Actual” line under the heading entitled “Expenses paid during period” for your applicable class of shares to estimate the expenses you paid on your account during this period.
Hypothetical example for comparison purposes
The “Hypothetical” line of the table below provides information about hypothetical account values and hypothetical expenses based on the Portfolio’s actual expense ratio and an assumed rate of return of 5% per year before expenses, which is not the Portfolio’s actual return. The hypothetical account values and expenses may not be used to estimate the actual ending account balance or expenses you paid for the period. You may use this information to compare the ongoing costs of investing in the Portfolio and other funds. To do so, compare this 5% hypothetical example with the 5% hypothetical examples that appear in the shareholder reports of the other funds.
Please note that the expenses shown in the table are meant to highlight your ongoing costs only. Therefore, the “Hypothetical” line of the table is useful in comparing ongoing costs only, and will not help you determine the relative total costs of owning different funds.
| Beginning
account value
6-1-2023 | Ending
account value
11-30-2023 | | Annualized net
expense ratio |
| | | | |
Hypothetical (5% return before expenses) | | | | |
| Expenses paid is equal to the annualized net expense ratio multiplied by the average account value over the period, multiplied by 183 divided by 366 (to reflect the one-half-year period). |
4 | Allspring Large Company Value Portfolio
Portfolio of investments—November 30, 2023 (unaudited)
| | | | | |
| | | | | | |
Communication services: 2.77% | | | | | | |
Diversified telecommunication services: 2.10% | | | | | | |
| | | | | | |
Verizon Communications, Inc. | | | | | | |
| | | | | | |
| | | | | | |
| | | | | | |
Interactive media & services: 0.10% | | | | | | |
| | | | | | |
Wireless telecommunication services: 0.07% | | | | | | |
| | | | | | |
Consumer discretionary: 6.34% | | | | | | |
| | | | | | |
| | | | | | |
| | | | | | |
| | | | | | |
Hotels, restaurants & leisure: 1.95% | | | | | | |
| | | | | | |
Chipotle Mexican Grill, Inc.† | | | | | | |
Marriott International, Inc. Class A | | | | | | |
Marriott Vacations Worldwide Corp. | | | | | | |
Royal Caribbean Cruises Ltd.† | | | | | | |
| | | | | | |
| | | | | | |
Household durables: 0.78% | | | | | | |
| | | | | | |
Taylor Morrison Home Corp.† | | | | | | |
| | | | | | |
| | | | | | |
| | | | | | |
| | | | | | |
| | | | | | |
| | | | | | |
| | | | | | |
| | | | | | |
| | | | | | |
| | | | | | |
Coca-Cola Consolidated, Inc. | | | | | | |
The accompanying notes are an integral part of these financial statements.
Allspring Large Company Value Portfolio | 5
Portfolio of investments—November 30, 2023 (unaudited)
| | | | | |
Consumer staples distribution & retail: 3.23% | | | | | | |
| | | | | | |
| | | | | | |
| | | | | | |
| | | | | | |
| | | | | | |
| | | | | | |
Archer-Daniels-Midland Co. | | | | | | |
| | | | | | |
Mondelez International, Inc. Class A | | | | | | |
| | | | | | |
Household products: 0.60% | | | | | | |
| | | | | | |
| | | | | | |
| | | | | | |
| | | | | | |
| | | | | | |
| | | | | | |
| | | | | | |
| | | | | | |
Energy equipment & services: 0.25% | | | | | | |
| | | | | | |
Oil, gas & consumable fuels: 7.52% | | | | | | |
| | | | | | |
| | | | | | |
| | | | | | |
| | | | | | |
| | | | | | |
| | | | | | |
| | | | | | |
| | | | | | |
| | | | | | |
| | | | | | |
| | | | | | |
| | | | | | |
| | | | | | |
Bank of NT Butterfield & Son Ltd. | | | | | | |
| | | | | | |
| | | | | | |
| | | | | | |
| | | | | | |
| | | | | | |
Affiliated Managers Group, Inc. | | | | | | |
The accompanying notes are an integral part of these financial statements.
6 | Allspring Large Company Value Portfolio
Portfolio of investments—November 30, 2023 (unaudited)
| | | | | |
Capital markets(continued) | | | | | | |
| | | | | | |
| | | | | | |
Coinbase Global, Inc. Class A† | | | | | | |
Goldman Sachs Group, Inc. | | | | | | |
Intercontinental Exchange, Inc. | | | | | | |
| | | | | | |
| | | | | | |
| | | | | | |
| | | | | | |
| | | | | | |
| | | | | | |
Discover Financial Services | | | | | | |
| | | | | | |
| | | | | | |
| | | | | | |
| | | | | | |
Financial services: 6.30% | | | | | | |
Berkshire Hathaway, Inc. Class B† | | | | | | |
| | | | | | |
Jackson Financial, Inc. Class A | | | | | | |
| | | | | | |
| | | | | | |
| | | | | | |
| | | | | | |
| | | | | | |
| | | | | | |
American Financial Group, Inc. | | | | | | |
| | | | | | |
| | | | | | |
| | | | | | |
| | | | | | |
Mortgage real estate investment trusts (REITs): 0.30% | | | | | | |
| | | | | | |
| | | | | | |
| | | | | | |
Acadia Pharmaceuticals, Inc.† | | | | | | |
| | | | | | |
| | | | | | |
Catalyst Pharmaceuticals, Inc.† | | | | | | |
| | | | | | |
| | | | | | |
Regeneron Pharmaceuticals, Inc.† | | | | | | |
| | | | | | |
The accompanying notes are an integral part of these financial statements.
Allspring Large Company Value Portfolio | 7
Portfolio of investments—November 30, 2023 (unaudited)
| | | | | |
Health care equipment & supplies: 1.53% | | | | | | |
| | | | | | |
Intuitive Surgical, Inc.† | | | | | | |
| | | | | | |
| | | | | | |
Health care providers & services: 4.85% | | | | | | |
| | | | | | |
| | | | | | |
| | | | | | |
| | | | | | |
| | | | | | |
Life sciences tools & services: 0.29% | | | | | | |
| | | | | | |
| | | | | | |
Amphastar Pharmaceuticals, Inc.† | | | | | | |
| | | | | | |
| | | | | | |
| | | | | | |
| | | | | | |
| | | | | | |
| | | | | | |
Aerospace & defense: 4.37% | | | | | | |
| | | | | | |
| | | | | | |
| | | | | | |
| | | | | | |
| | | | | | |
Air freight & logistics: 0.31% | | | | | | |
| | | | | | |
| | | | | | |
| | | | | | |
| | | | | | |
| | | | | | |
| | | | | | |
Construction & engineering: 0.12% | | | | | | |
| | | | | | |
Electrical equipment: 0.98% | | | | | | |
| | | | | | |
Industrial conglomerates: 3.39% | | | | | | |
| | | | | | |
| | | | | | |
| | | | | | |
The accompanying notes are an integral part of these financial statements.
8 | Allspring Large Company Value Portfolio
Portfolio of investments—November 30, 2023 (unaudited)
| | | | | |
| | | | | | |
| | | | | | |
| | | | | | |
| | | | | | |
| | | | | | |
Passenger airlines: 1.88% | | | | | | |
| | | | | | |
United Airlines Holdings, Inc.† | | | | | | |
| | | | | | |
Trading companies & distributors: 0.08% | | | | | | |
| | | | | | |
Information technology: 9.15% | | | | | | |
Communications equipment: 0.98% | | | | | | |
| | | | | | |
| | | | | | |
| | | | | | |
Cognizant Technology Solutions Corp. Class A | | | | | | |
| | | | | | |
| | | | | | |
Semiconductors & semiconductor equipment: 5.81% | | | | | | |
Advanced Micro Devices, Inc.† | | | | | | |
| | | | | | |
Axcelis Technologies, Inc.† | | | | | | |
| | | | | | |
| | | | | | |
| | | | | | |
| | | | | | |
Microchip Technology, Inc. | | | | | | |
| | | | | | |
| | | | | | |
| | | | | | |
| | | | | | |
| | | | | | |
| | | | | | |
Cadence Design Systems, Inc.† | | | | | | |
| | | | | | |
| | | | | | |
| | | | | | |
| | | | | | |
| | | | | | |
Technology hardware, storage & peripherals: 0.12% | | | | | | |
Super Micro Computer, Inc.† | | | | | | |
The accompanying notes are an integral part of these financial statements.
Allspring Large Company Value Portfolio | 9
Portfolio of investments—November 30, 2023 (unaudited)
| | | | | |
| | | | | | |
| | | | | | |
Air Products & Chemicals, Inc. | | | | | | |
| | | | | | |
| | | | | | |
| | | | | | |
| | | | | | |
| | | | | | |
Alpha Metallurgical Resources, Inc. | | | | | | |
| | | | | | |
| | | | | | |
| | | | | | |
| | | | | | |
| | | | | | |
| | | | | | |
| | | | | | |
Hotel & resort REITs: 0.08% | | | | | | |
Park Hotels & Resorts, Inc. | | | | | | |
| | | | | | |
| | | | | | |
Real estate management & development: 0.11% | | | | | | |
DigitalBridge Group, Inc. | | | | | | |
Specialized REITs : 0.02% | | | | | | |
| | | | | | |
| | | | | | |
Electric utilities: 4.78% | | | | | | |
| | | | | | |
| | | | | | |
| | | | | | |
Total common stocks (Cost $165,330,415) | | | | | | |
| | | | | |
Short-term investments: 2.80% | | | | | | |
Investment companies: 2.80% | | | | | | |
Allspring Government Money Market Fund Select Class♠∞ | | | | | | |
Total short-term investments (Cost $4,928,849) | | | | | | |
Total investments in securities (Cost $170,259,264) | | | | | | |
Other assets and liabilities, net | | | | | | |
| | | | | | |
| Non-income-earning security |
| The issuer of the security is an affiliated person of the Portfolio as defined in the Investment Company Act of 1940. |
| The rate represents the 7-day annualized yield at period end. |
The accompanying notes are an integral part of these financial statements.
10 | Allspring Large Company Value Portfolio
Portfolio of investments—November 30, 2023 (unaudited)
|
| Real estate investment trust |
Investments in affiliates
An affiliated investment is an investment in which the Portfolio owns at least 5% of the outstanding voting shares of the issuer or as a result of other relationships, such as the Portfolio and the issuer having the same adviser or investment manager. Transactions with issuers that were affiliates of the Portfolio at the end of the period were as follows:
| | | | | Net
change in
unrealized
gains
(losses) | | | Income
from
affiliated
securities |
| | | | | | | | |
Allspring Government Money Market Fund Select Class | | | | | | | | |
Futures contracts
The accompanying notes are an integral part of these financial statements.
Allspring Large Company Value Portfolio | 11
Statement of assets and liabilities—November 30, 2023 (unaudited)
Financial statements
Statement of assets and liabilities
| |
Investments in unaffiliated securities, at value (cost $165,330,415) | |
Investments in affiliated securities, at value (cost $4,928,849) | |
| |
Cash at broker segregated for futures contracts | |
| |
Receivable for daily variation margin on open futures contracts | |
Prepaid expenses and other assets | |
| |
| |
| |
Professional fees payable | |
Custody and accounting fees payable | |
Interest holder report expenses payable | |
Trustees’ fees and expenses payable | |
Accrued expenses and other liabilities | |
| |
| |
The accompanying notes are an integral part of these financial statements.
12 | Allspring Large Company Value Portfolio
Statement of operations—six months ended November 30, 2023 (unaudited)
Statement of operations
| |
Dividends (net of foreign withholdings taxes of $4,387) | |
Income from affiliated securities | |
| |
| |
| |
| |
Custody and accounting fees | |
| |
Interest holder report expenses | |
Trustees’ fees and expenses | |
| |
| |
Less: Fee waivers and/or expense reimbursements | |
| |
| |
Realized and unrealized gains (losses) on investments | |
| |
| |
| |
Net realized gains on investments | |
Net change in unrealized gains (losses) on | |
| |
| |
Net change in unrealized gains (losses) on investments | |
Net realized and unrealized gains (losses) on investments | |
Net increase in net assets resulting from operations | |
The accompanying notes are an integral part of these financial statements.
Allspring Large Company Value Portfolio | 13
Statement of changes in net assets
Statement of changes in net assets
|
Six months ended
November 30, 2023 (unaudited) | |
| | | | |
| | | | |
Net realized gains (losses) on investments | | | | |
Net change in unrealized gains (losses) on investments | | | | |
Net increase (decrease) in net assets resulting from operations | | | | |
| | | | |
Transactions in investors’ beneficial interests | | | | |
| | | | |
| | | | |
Net decrease in net assets resulting from capital transactions | | | | |
Total decrease in net assets | | | | |
| | | | |
| | | | |
| | | | |
The accompanying notes are an integral part of these financial statements.
14 | Allspring Large Company Value Portfolio
| Six months ended
November 30, 2023
(unaudited) | |
| | | | | |
| | | | | | |
Ratios to average net assets (annualized) | | | | | | |
| | | | | | |
| | | | | | |
| | | | | | |
| | | | | | |
| | | | | | |
| Returns for periods of less than one year are not annualized. |
| Net expense ratios reflect voluntary waivers, if any. |
The accompanying notes are an integral part of these financial statements.
Allspring Large Company Value Portfolio | 15
Notes to financial statements (unaudited)
Notes to financial statements
Allspring Master Trust (the “Trust”), a Delaware statutory trust organized on March 10, 1999, is an open-end management investment company registered under the Investment Company Act of 1940, as amended (the “1940 Act”). As an investment company, the Trust follows the accounting and reporting guidance in Financial Accounting Standards Board (“FASB”) Accounting Standards Codification Topic 946, Financial Services – Investment Companies. These financial statements report on the Allspring Large Company Value Portfolio (the “Portfolio”) which is a diversified series of the Trust.
Interests in the Portfolio are available solely through private placement transactions that do not involve any “public offering” within the meaning of Section 4(a)(2) of the Securities Act of 1933.
2.
SIGNIFICANT ACCOUNTING POLICIES
The following significant accounting policies, which are consistently followed in the preparation of the financial statements of the Portfolio, are in conformity with U.S. generally accepted accounting principles which require management to make estimates and assumptions that affect the reported amounts of assets and liabilities, disclosure of contingent assets and liabilities at the date of the financial statements, and the reported amounts of income and expenses during the reporting period. Actual results could differ from those estimates.
Securities valuation
All investments are valued each business day as of the close of regular trading on the New York Stock Exchange (generally 4 p.m. Eastern Time), although the Portfolio may deviate from this calculation time under unusual or unexpected circumstances.
Equity securities, exchange-traded funds and futures contracts that are listed on a foreign or domestic exchange or market are valued at the official closing price or, if none, the last sales price.
Investments in registered open-end investment companies (other than those listed on a foreign or domestic exchange or market) are valued at net asset value.
Investments which are not valued using the methods discussed above are valued at their fair value, as determined in good faith by Allspring Funds Management, LLC (“Allspring Funds Management”), which was named the valuation designee by the Board of Trustees. As the valuation designee, Allspring Funds Management is responsible for day-to-day valuation activities for the Allspring Funds. In connection with these responsibilities, Allspring Funds Management has established a Valuation Committee and has delegated to it the authority to take any actions regarding the valuation of portfolio securities that the Valuation Committee deems necessary or appropriate, including determining the fair value of portfolio securities. On a quarterly basis, the Board of Trustees receives reports of valuation actions taken by the Valuation Committee. On at least an annual basis, the Board of Trustees receives an assessment of the adequacy and effectiveness of Allspring Funds Management’s process for determining the fair value of the portfolio of investments.
Foreign currency translation
The accounting records of the Portfolio are maintained in U.S. dollars. The values of other assets and liabilities denominated in foreign currencies are translated into U.S. dollars at rates provided by an independent foreign currency pricing source at a time each business day specified by the Valuation Committee. Purchases and sales of securities, and income and expenses are converted at the rate of exchange on the respective dates of such transactions. Net realized foreign exchange gains or losses arise from sales of foreign currencies, currency gains or losses realized between the trade and settlement dates on securities transactions, and the difference between the amounts of dividends, interest and foreign withholding taxes recorded and the U.S. dollar equivalent of the amounts actually paid or received. Net unrealized foreign exchange gains and losses arise from changes in the fair value of assets and liabilities other than investments in securities resulting from changes in exchange rates. The changes in net assets arising from changes in exchange rates of securities and the changes in net assets resulting from changes in market prices of securities are not separately presented. Such changes are included in net realized and unrealized gains or losses from investments.
Futures contracts
Futures contracts are agreements between the Portfolio and a counterparty to buy or sell a specific amount of a commodity, financial instrument or currency at a specified price and on a specified date. The Portfolio may buy and sell futures contracts in order to gain exposure to, or protect against, changes in security values and is subject to equity price risk. The primary risks associated with the use of futures contracts are the imperfect correlation between changes in market values of securities held by the Portfolio and the prices of futures contracts, and the possibility of an illiquid market. Futures contracts are generally entered into on a regulated futures exchange and cleared through a clearinghouse associated with the exchange. With futures contracts, there is minimal counterparty risk to the Portfolio since futures contracts are exchange-traded and the exchange’s clearinghouse, as the counterparty to all exchange-traded futures, guarantees the futures contracts against default.
Upon entering into a futures contracts, the Portfolio is required to deposit either cash or securities (initial margin) with the broker in an amount equal to a certain percentage of the contract value. Subsequent payments (variation margin) are paid to or received from the broker each day equal to the daily changes in the contract value. Such payments are recorded as unrealized gains or losses and, if any, shown as variation margin receivable (payable) in the Statement of Assets and Liabilities. Should the Portfolio fail to make requested variation margin payments, the broker can gain access to the initial margin to satisfy the Portfolio’s payment obligations. When the contracts are closed, a realized gain or loss is recorded in the Statement of Operations.
16 | Allspring Large Company Value Portfolio
Notes to financial statements (unaudited)
Security transactions and income recognition
Securities transactions are recorded on a trade date basis. Realized gains or losses are recorded on the basis of identified cost.
Dividend income is recognized on the ex-dividend date. Dividend income is recorded net of foreign taxes withheld where recovery of such taxes is not assured.
Interest earned on cash balances held at the custodian is recorded as interest income.
Distributions received from REIT investments may be characterized as ordinary income, capital gains, or a return of capital to the Portfolio based on information provided by the REIT. The proper characterization of REIT distributions is generally not known until after the end of each calendar year. As such, estimates may be used in reporting the character of income and distributions for financial statement purposes.
Federal and other taxes
The Portfolio is not required to pay federal income taxes on its net investment income and net capital gains as it is treated as a partnership for federal income tax purposes. All income, gains and losses of the Portfolio are deemed to have been “passed through” to the interest holders in proportion to their holdings of the Portfolio regardless of whether income and gains have been distributed by the Portfolio.
The Portfolio’s income tax returns and all financial records supporting those returns for the prior three fiscal years are subject to examination by the federal revenue authority. Management has analyzed the Portfolio’s tax positions taken on federal, state, and foreign tax returns, as applicable, for all open tax years and does not believe that there are any uncertain tax positions that require recognition of a tax liability.
As of November 30, 2023, the aggregate cost of all investments for federal income tax purposes was $171,533,648 and the unrealized gains (losses) consisted of:
3.
FAIR VALUATION MEASUREMENTS
Fair value measurements of investments are determined within a framework that has established a fair value hierarchy based upon the various data inputs utilized in determining the value of the Portfolio’s investments. The three-level hierarchy gives the highest priority to unadjusted quoted prices in active markets for identical assets or liabilities (Level 1) and the lowest priority to unobservable inputs (Level 3). The Portfolio’s investments are classified within the fair value hierarchy based on the lowest level of input that is significant to the fair value measurement. The inputs are summarized into three broad levels as follows:
•Level 1—quoted prices in active markets for identical securities
•Level 2—other significant observable inputs (including quoted prices for similar securities, interest rates, prepayment speeds, credit risk, etc.)
•Level 3—significant unobservable inputs (including the Portfolio’s own assumptions in determining the fair value of investments)
The inputs or methodologies used for valuing investments in securities are not necessarily an indication of the risk associated with investing in those securities.
Allspring Large Company Value Portfolio | 17
Notes to financial statements (unaudited)
The following is a summary of the inputs used in valuing the Portfolio’s assets and liabilities as of November 30, 2023:
| | Other significant
observable inputs
(Level 2) | Significant
unobservable inputs
(Level 3) | |
| | | | |
| | | | |
| | | | |
| | | | |
| | | | |
| | | | |
| | | | |
| | | | |
| | | | |
| | | | |
| | | | |
| | | | |
| | | | |
| | | | |
| | | | |
| | | | |
| | | | |
| | | | |
| | | | |
Futures contracts are reported at their cumulative unrealized gains (losses) at measurement date as reported in the table following the Portfolio of Investments. For futures contracts, the current day’s variation margin is reported on the Statement of Assets and Liabilities. All other assets and liabilities are reported at their market value at measurement date.
Additional sector, industry or geographic detail, if any, is included in the Portfolio of Investments.
At November 30, 2023, the Portfolio did not have any transfers into/out of Level 3.
4.
TRANSACTIONS WITH AFFILIATES
Advisory fee
The Trust has entered into an advisory contract with Allspring Funds Management, a wholly owned subsidiary of Allspring Global Investments Holdings, LLC, a holding company indirectly owned by certain private funds of GTCR LLC and Reverence Capital Partners, L.P. The adviser is responsible for implementing investment policies and guidelines and for supervising the subadviser, who is responsible for day-to-day portfolio management of the Portfolio. Pursuant to the contract, Allspring Funds Management is entitled to receive an advisory fee at the following annual rate based on the Portfolio’s average daily net assets:
For the six months ended November 30, 2023, the advisory fee was equivalent to an annual rate of 0.35% of the Portfolio’s average daily net assets.
Allspring Funds Management has retained the services of a subadviser to provide daily portfolio management to the Portfolio. The fee for subadvisory services is borne by Allspring Funds Management. Allspring Global Investments, LLC, an affiliate of Allspring Funds Management and a wholly owned subsidiary of Allspring Global Investments Holdings, LLC, is the subadviser to the Portfolio and is entitled to receive a fee from Allspring Funds Management at an annual rate starting at 0.25% and declining to 0.15% as the average daily net assets of the Portfolio increase.
Allspring Funds Management has voluntarily waived and/or reimbursed advisory fees to reduce the net operating expense ratio of the Portfolio. These voluntary waivers may be discontinued at any time.
18 | Allspring Large Company Value Portfolio
Notes to financial statements (unaudited)
Interfund transactions
The Portfolio may purchase or sell portfolio investment securities to certain affiliates pursuant to Rule 17a-7 under the 1940 Act and under procedures adopted by the Board of Trustees. The procedures have been designed to ensure that these interfund transactions, which do not incur broker commissions, are effected at current market prices. Pursuant to these procedures, the Portfolio did not have any interfund transactions during the six months ended November 30, 2023.
5.
INVESTMENT PORTFOLIO TRANSACTIONS
Purchases and sales of investments, excluding U.S. government obligations (if any) and short-term securities, for the six months ended November 30, 2023 were $343,846,142 and $354,109,539, respectively.
6.
DERIVATIVE TRANSACTIONS
During the six months ended November 30, 2023, the Portfolio entered into futures contracts to gain market exposure. The Portfolio had an average notional amount of $4,035,660 in long futures contracts during the six months ended November 30, 2023.
The fair value, realized gains or losses and change in unrealized gains or losses, if any, on derivative instruments are reflected in the corresponding financial statement captions.
The Trust, along with Allspring Variable Trust and Allspring Funds Trust (excluding the money market funds), are parties to a $350,000,000 revolving credit agreement whereby the Portfolio is permitted to use bank borrowings for temporary or emergency purposes, such as to fund interest holders withdrawal requests. Interest under the credit agreement is charged to the Portfolio based on borrowing rate equal to the higher of the Federal Funds rate or the overnight bank funding rate in effect on that day plus a spread. In addition, an annual commitment fee based on the unused balance is allocated to each participating fund.
For the six months ended November 30, 2023, there were no borrowings by the Portfolio under the agreement.
Under the Portfolio’s organizational documents, the officers and Trustees have been granted certain indemnification rights against certain liabilities that may arise out of performance of their duties to the Portfolio. The Portfolio has entered into a separate agreement with each Trustee that converts indemnification rights currently existing under the Portfolio’s organizational documents into contractual rights that cannot be changed in the future without the consent of the Trustee. Additionally, in the normal course of business, the Portfolio may enter into contracts with service providers that contain a variety of indemnification clauses. The Portfolio’s maximum exposure under these arrangements is dependent on future claims that may be made against the Portfolio and, therefore, cannot be estimated.
Allspring Large Company Value Portfolio | 19
Other information (unaudited)
Other information
Proxy voting information
A description of the policies and procedures used to determine how to vote proxies relating to portfolio securities is available without charge, upon request, by calling 1-866-259-3305, visiting our website at allspringglobal.com, or visiting the SEC website at sec.gov. Information regarding how the proxies related to portfolio securities were voted during the most recent 12-month period ended June 30 is available on the website at allspringglobal.com or by visiting the SEC website at sec.gov.
Quarterly portfolio holdings information
The Portfolio files its complete schedule of portfolio holdings with the SEC for the first and third quarters of each fiscal year as an exhibit to its reports on Form N-PORT. Interest holders may view the filed Form N-PORT by visiting the SEC website at sec.gov.
20 | Allspring Large Company Value Portfolio
Other information (unaudited)
Board of trustees and officers
Each of the Trustees and Officers listed in the table below acts in identical capacities for each fund in the Allspring family of funds, which consists of 126 mutual funds comprising the Allspring Funds Trust, Allspring Variable Trust, Allspring Master Trust and four closed-end funds (collectively the “Fund Complex”). This table should be read in conjunction with the Prospectus and the Statement of Additional Information†. The mailing address of each Trustee and Officer is 1415 Vantage Park Drive, 3rd Floor, Charlotte, NC 28203. Each Trustee and Officer serves an indefinite term, however, each Trustee serves such term until reaching the mandatory retirement age established by the Trustees.
Independent Trustees
| | Principal occupations during past five years or longer | Current other
public company or
investment
company
directorships |
William R. Ebsworth
(Born 1957) | | Retired. From 1984 to 2013, equities analyst, portfolio manager, research director and chief investment officer at Fidelity Management and Research Company in Boston, Tokyo, and Hong Kong, and retired in 2013 as Chief Investment Officer of Fidelity Strategic Advisers, Inc. where he led a team of investment professionals managing client assets. Prior thereto, Board member of Hong Kong Securities Clearing Co., Hong Kong Options Clearing Corp., the Thailand International Fund, Ltd., Fidelity Investments Life Insurance Company, and Empire Fidelity Investments Life Insurance Company. Serves on the Investment Company Institute’s Board of Governors since 2022 and Executive Committee since 2023 as well as the Vice Chairman of the Governing Council of the Independent Directors Council since 2023. Audit Committee Chair and Investment Committee Chair of the Vincent Memorial Hospital Foundation (non-profit organization). Mr. Ebsworth is a CFA charterholder. | |
Jane A. Freeman
(Born 1953) | Trustee,
since 2015;
Chair Liaison,
| Retired. From 2012 to 2014 and 1999 to 2008, Chief Financial Officer of Scientific Learning Corporation. From 2008 to 2012, Ms. Freeman provided consulting services related to strategic business projects. Prior to 1999, Portfolio Manager at Rockefeller & Co. and Scudder, Stevens & Clark. Board member of the Harding Loevner Funds from 1996 to 2014, serving as both Lead Independent Director and chair of the Audit Committee. Board member of the Russell Exchange Traded Funds Trust from 2011 to 2012 and the chair of the Audit Committee. Ms. Freeman is also an inactive Chartered Financial Analyst. | |
Isaiah Harris, Jr.
(Born 1952) | Trustee,
since 2009;
Audit Committee Chair,
since 2019 | Retired. Member of the Advisory Board of CEF of East Central Florida. Chairman of the Board of CIGNA Corporation from 2009 to 2021, and Director from 2005 to 2008. From 2003 to 2011, Director of Deluxe Corporation. Prior thereto, President and CEO of BellSouth Advertising and Publishing Corp. from 2005 to 2007, President and CEO of BellSouth Enterprises from 2004 to 2005 and President of BellSouth Consumer Services from 2000 to 2003. Emeritus member of the Iowa State University Foundation Board of Governors. Emeritus Member of the Advisory board of Iowa State University School of Business. Advisory Board Member, Palm Harbor Academy (private school). Advisory Board Member, Fellowship of Christian Athletes. Mr. Harris is a certified public accountant (inactive status). | |
David F. Larcker
(Born 1950) | | Distinguished Visiting Fellow at the Hoover Institution since 2022. James Irvin Miller Professor of Accounting at the Graduate School of Business (Emeritus), Stanford University, Director of the Corporate Governance Research Initiative and Senior Faculty of The Rock Center for Corporate Governance since 2006. From 2005 to 2008, Professor of Accounting at the Graduate School of Business, Stanford University. Prior thereto, Ernst & Young Professor of Accounting at The Wharton School, University of Pennsylvania from 1985 to 2005. | |
Olivia S. Mitchell
(Born 1953) | | International Foundation of Employee Benefit Plans Professor since 1993, Wharton School of the University of Pennsylvania. Director of Wharton’s Pension Research Council and Boettner Center on Pensions & Retirement Research, and Research Associate at the National Bureau of Economic Research. Previously taught at Cornell University from 1978 to 1993. | |
Timothy J. Penny
(Born 1951) | Trustee,
since 1996;
Chair,
since 2018 | President and Chief Executive Officer of Southern Minnesota Initiative Foundation, a non-profit organization, since 2007. Vice Chair of the Economic Club of Minnesota, since 2007. Co-Chair of the Committee for a Responsible Federal Budget, since 1995. Member of the Board of Trustees of NorthStar Education Finance, Inc., a non-profit organization, from 2007-2022. Senior Fellow of the University of Minnesota Humphrey Institute from 1995 to 2017. | |
* Length of service dates reflect the Trustee’s commencement of service with the Trust’s predecessor entities, where applicable.
# Ms. Freeman will serve as Chair Liaison through June 2024, at which time Ms. Wheelock will assume the role.
†
The Statement of Additional Information includes additional information about the Trustees and is available, without charge, upon request, by calling 1-800-222-8222 or by visiting the website at allspringglobal.com.
Allspring Large Company Value Portfolio | 21
Other information (unaudited)
| Position held and length of service* | Principal occupations during past five years or longer | Current other public company or investment company directorships |
James G. Polisson
(Born 1959) | Trustee,
since 2018; Nominating and Governance Committee Chair, since 2024 | Retired. Chief Marketing Officer, Source (ETF) UK Services, Ltd, from 2015 to 2017. From 2012 to 2015, Principal of The Polisson Group, LLC, a management consulting, corporate advisory and principal investing company. Chief Executive Officer and Managing Director at Russell Investments, Global Exchange Traded Funds from 2010 to 2012. Managing Director of Barclays Global Investors from 1998 to 2010 and Global Chief Marketing Officer for iShares and Barclays Global Investors from 2000 to 2010. Trustee of the San Francisco Mechanics’ Institute, a non- profit organization, from 2013 to 2015. Board member of the Russell Exchange Traded Fund Trust from 2011 to 2012. Director of Barclays Global Investors Holdings Deutschland GmbH from 2006 to 2009. Mr. Polisson is an attorney and has a retired status with the Massachusetts and District of Columbia Bar Associations. | |
Pamela Wheelock
(Born 1959) | Trustee,
since January 2020;
previously Trustee from
January 2018 to
| Retired. Executive and Senior Financial leadership positions in the public, private and nonprofit sectors. Interim President and CEO, McKnight Foundation, 2020. Interim Commissioner, Minnesota Department of Human Services, 2019. Chief Operating Officer, Twin Cities Habitat for Humanity, 2017-2019. Vice President for University Services, University of Minnesota, 2012- 2016. Interim President and CEO, Blue Cross and Blue Shield of Minnesota, 2011-2012. Executive Vice-President and Chief Financial Officer, Minnesota Wild, 2002-2008. Commissioner, Minnesota Department of Finance, 1999-2002. Chair of the Board of Directors of Destination Medical Center Corporation. Board member of the Minnesota Wild Foundation. | |
* Length of service dates reflect the Trustee’s commencement of service with the Trust’s predecessor entities, where applicable.
# Ms. Freeman will serve as Chair Liaison through June 2024, at which time Ms. Wheelock will assume the role.
22 | Allspring Large Company Value Portfolio
Other information (unaudited)
Officers1
| Position held and
length of service | Principal occupations during past five years or longer |
| | President and Chief Executive Officer of Allspring Funds Management, LLC since 2017 and Head of Global Fund Governance of Allspring Global Investments since 2022. Prior thereto, co-president of Galliard Capital Management, LLC, an affiliate of Allspring Funds Management, LLC, from 2019 to 2022 and Head of Affiliated Managers, Allspring Global Investments, from 2014 to 2019 and Executive Vice President responsible for marketing, investments and product development for Allspring Funds Management, LLC, from 2009 to 2014. |
Jeremy DePalma
(Born 1974) | Treasurer,
since 2012
(for certain funds in
the Fund Complex);
since 2021 (for
the remaining funds in the Complex) | Senior Vice President of Allspring Funds Management, LLC since 2009. Senior Vice President of Evergreen Investment Management Company, LLC from 2008 to 2010 and head of the Fund Reporting and Control Team within Fund Administration from 2005 to 2010. |
Christopher Baker
(Born 1976) | Chief Compliance Officer,
since 2022 | Global Chief Compliance Officer for Allspring Global Investments since 2022. Prior thereto, Chief Compliance Officer for State Street Global Advisors from 2018 to 2021. Senior Compliance Officer for the State Street divisions of Alternative Investment Solutions, Sector Solutions, and Global Marketing from 2015 to 2018. From 2010 to 2015 Vice President, Global Head of Investment and Marketing Compliance for State Street Global Advisors. |
Matthew Prasse
(Born 1983) | Chief Legal Officer,
since 2022;
Secretary,
since 2021 | Senior Counsel of the Allspring Legal Department since 2021. Senior Counsel of the Wells Fargo Legal Department from 2018 to 2021. Previously, Counsel for Barings LLC from 2015 to 2018. Prior to joining Barings, Associate at Morgan, Lewis & Bockius LLP from 2008 to 2015. |
1 For those Officers with tenures at Allspring Global Investments and/or Allspring Funds Management, LLC that began prior to 2021, such tenures include years of service during which these businesses/entities were known as Wells Fargo Asset Management and Wells Fargo Funds Management, LLC, respectively.
Allspring Large Company Value Portfolio | 23
Other information (unaudited)
Board consideration of investment management and sub-advisory agreements:
Under the Investment Company Act of 1940 (the “1940 Act”), the Board of Trustees (the “Board”) of Allspring Master Trust (the “Trust”) must determine annually whether to approve the continuation of the Trust’s investment advisory and sub-advisory agreements. In this regard, at a Board meeting held on May 15-17, 2023 (the “Meeting”), the Board, all the members of which have no direct or indirect interest in the investment advisory and sub-advisory agreements and are not “interested persons” of the Trust, as defined in the 1940 Act (the “Independent Trustees”), reviewed and approved for the Allspring Large Company Value Portfolio (the “Portfolio”): (i) an investment advisory agreement (the “Advisory Agreement”) with Allspring Funds Management, LLC (“Allspring Funds Management”); and (ii) an investment sub-advisory agreement (the “Sub-Advisory Agreement”) with Allspring Global Investments, LLC (the “Sub-Adviser”), an affiliate of Allspring Funds Management. The Advisory Agreement and the Sub-Advisory Agreement are collectively referred to as the “Advisory Agreements.”
At the Meeting, the Board considered the factors and reached the conclusions described below relating to the selection of Allspring Funds Management and the Sub-Adviser and the approval of the Advisory Agreements. Prior to the Meeting, including at Board meetings held earlier in 2023, and at the Meeting, the Trustees conferred extensively among themselves and with representatives of Allspring Funds Management about these matters. The Board has adopted a team-based approach, with each team consisting of a sub-set of Trustees, to assist the full Board in the discharge of its duties in reviewing investment performance and other matters throughout the year. The Independent Trustees were assisted in their evaluation of the Advisory Agreements by independent legal counsel, from whom they received separate legal advice and with whom they met separately.
The Board noted that it initially approved the Advisory Agreements at a Board meeting held in May 2021, each for a two-year term, in advance of the sale of Wells Fargo Asset Management to Allspring Global Investments Holdings, LLC,† a holding company indirectly owned by certain private funds of GTCR LLC and Reverence Capital Partners, L.P. (the “Transaction”). The Trustees also noted that, while they did not specifically consider the continuation of the Advisory Agreements in 2022 as a result of the two-year term that was approved in 2021, the Trustees received and considered certain information at a Board meeting held in April 2022 that was applicable to the Advisory Agreements, including an overview and financial review of the Allspring Global Investments business, information regarding certain ancillary agreements that were approved by the Board at the April 2022 Board meeting, and comparative data regarding Fund fees and expenses.
In providing information to the Board, Allspring Funds Management and the Sub-Adviser were guided by a detailed set of requests for information submitted to them by independent legal counsel on behalf of the Independent Trustees at the start of the Board’s annual contract renewal process earlier in 2023. In considering and approving the Advisory Agreements, the Trustees considered the information they believed relevant, including but not limited to the information discussed below. The Board considered not only the specific information presented in connection with the Meeting, but also the knowledge gained over time through interactions with Allspring Funds Management and the Sub-Adviser about various topics. In this regard, the Board reviewed reports of Allspring Funds Management at each of its quarterly meetings, which included, among other things, portfolio reviews and investment performance reports. In addition, the Board and the teams mentioned above confer with portfolio managers at various times throughout the year. The Board did not identify any particular information or consideration that was all-important or controlling, and each individual Trustee may have attributed different weights to various factors.
After its deliberations, the Board unanimously determined that the compensation payable to Allspring Funds Management and the Sub-Adviser under each of the Advisory Agreements was reasonable, and approved the continuation of the Advisory Agreements for a one-year term. The Board considered the approval of the Advisory Agreements for the Portfolio as part of its consideration of agreements for funds across the complex, but its approvals were made on a portfolio-by-portfolio basis. The following summarizes a number of important, but not necessarily all, factors considered by the Board in support of its approvals.
Nature, extent, and quality of services
The Board received and considered various information regarding the nature, extent, and quality of services provided to the Portfolio by Allspring Funds Management and the Sub-Adviser under the Advisory Agreements. This information included a description of the investment advisory services and Portfolio-level administrative services covered by the Advisory Agreement, as well as, among other things, a summary of the background and experience of senior management of Allspring Global Investments, of which Allspring Funds Management and the Sub-Adviser are a part, and a summary of investments made in the Allspring Global Investments business. The Board also considered information about retention arrangements with respect to key personnel of Allspring Global Investments that were put in place in connection with the Transaction. The Board took into account information about the services that continue to be provided by Wells Fargo & Co. and/or its affiliates (“Wells Fargo”) since the Transaction under a transition services agreement and the anticipated timeline for exiting the transition services agreement. In addition, the Board received and considered information about the full range of services provided to the Portfolio by Allspring Funds Management and its affiliates.
†
The trade name for the asset management firm that includes Allspring Funds Management and the Sub-Adviser is “Allspring Global Investments.”
24 | Allspring Large Company Value Portfolio
Other information (unaudited)
The Board considered the qualifications, background, tenure, and responsibilities of each of the portfolio managers primarily responsible for the day-to-day portfolio management of the Portfolio. The Board evaluated the ability of Allspring Funds Management and the Sub-Adviser to attract and retain qualified investment professionals, including research, advisory, and supervisory personnel.
The Board further considered the compliance programs and compliance records of Allspring Funds Management and the Sub-Adviser. The Board received and considered information about Allspring Global Investments’ risk management functions, which included information about Allspring Funds Management’s and the Sub-Adviser’s business continuity plans, and their approaches to data privacy and cybersecurity, and Allspring Funds Management’s role as administrator of the Portfolio’s liquidity risk management program. The Board also received and considered information about Allspring Funds Management’s intermediary and vendor oversight program.
Portfolio investment performance and expenses
The Board noted that it had considered the investment performance results for the Portfolio over various time periods ended December 31, 2022 at a meeting held in February 2023. The Board considered these results in comparison to the investment performance of funds in a universe that was determined by Broadridge Inc. (“Broadridge”) to be similar to the Portfolio (the “Universe”), and in comparison to the Portfolio’s benchmark index and to other comparative data. Broadridge is an independent provider of investment company data. At the Meeting, the Board received a description of the methodology used by Broadridge to select the mutual funds in the performance Universe. The Board noted that the investment performance of the Portfolio was higher than the average investment performance of the Universe for the three-, five- and ten-year periods under review, but lower than the average investment performance of the Universe for the one-year period. The Board also noted that the investment performance of the Portfolio was equal to or higher than the investment performance of its benchmark index, the Russell 1000® Value Index, for the three-, five- and ten-year periods under review, but lower than the investment performance of its benchmark index for the one-year under review. The Board noted the Portfolio’s better long-term performance history.
The Board also received and considered information regarding the fee rates that are payable to Allspring Funds Management for investment advisory services (as discussed below), which are the only fees charged at the Portfolio level, relative to corresponding class-specific expense groups that were determined by Broadridge to be similar to the Portfolio (the “Groups”). The Board received a description of the methodology used by Broadridge to select the mutual funds in the expense Groups and an explanation of how funds comprising expense groups and their expense ratios may vary from year-to-year.
The Board took into account the Portfolio’s investment performance and expense information provided to it among the factors considered in deciding to re-approve the Advisory Agreements.
Investment advisory and sub-advisory fee rates
The Board reviewed and considered the contractual fee rates payable by the Portfolio to Allspring Funds Management under the Advisory Agreement (the “Advisory Agreement Rate”). The Board also reviewed and considered the contractual investment sub-advisory fee rates that are payable by Allspring Funds Management to the Sub-Adviser for investment sub-advisory services.
The Board reviewed a comparison of the Advisory Agreement Rate of the Portfolio with those of other funds in the Portfolio’s expense Group at a common asset level. The Board noted that the Portfolio’s Advisory Agreement Rate was equal to the median rate for the Portfolio’s expense Group.
The Board also received and considered information about the portion of the total advisory fee that was retained by Allspring Funds Management after payment of the fee to the Sub-Adviser for sub-advisory services. In assessing the reasonableness of this amount, the Board received and evaluated information about the nature and extent of responsibilities retained and risks assumed by Allspring Funds Management and not delegated to or assumed by the Sub-Adviser, and about Allspring Funds Management’s on-going oversight services. Given the affiliation between Allspring Funds Management and the Sub-Adviser, the Board ascribed limited relevance to the allocation of fees between them.
Based on its consideration of the factors and information it deemed relevant, including those described here, the Board determined that the compensation payable to Allspring Funds Management under the Advisory Agreement and to the Sub-Adviser under the Sub-Advisory Agreement was reasonable.
Profitability
The Board received and considered information concerning the profitability of Allspring Funds Management, as well as the profitability of Allspring Global Investments, from providing services to the fund complex as a whole. The Board noted that the Sub-Adviser’s profitability information with respect to providing services to the Portfolio and other funds in the complex was subsumed in the Allspring Global Investments profitability analysis.
Allspring Funds Management reported on the methodologies and estimates used in calculating profitability, including a description of the methodology used to allocate certain expenses and differences in how Allspring Global Investments calculates its pre-tax profit metric versus the methodology used
Allspring Large Company Value Portfolio | 25
Other information (unaudited)
when Allspring Funds Management was part of Wells Fargo. It was noted that the impact of such differences had only minor impact on the financial results presented. Among other things, the Board noted that the levels of profitability reported on a fund-by-fund basis varied widely, depending on factors such as the size, type, and age of fund.
Based on its review, the Board did not deem the profits reported by Allspring Funds Management or Allspring Global Investments from services provided to the Portfolio to be at a level that would prevent it from approving the continuation of the Advisory Agreements.
Economies of scale
The Board received and considered information about the potential for Allspring Funds Management to experience economies of scale in the provision of management services to the Portfolio, the difficulties of calculating economies of scale at an individual fund level, and the extent to which potential scale benefits are shared with Portfolio shareholders. The Board noted the existence of breakpoints in the Portfolio’s advisory fee structure, which operate generally to reduce the Portfolio’s expense ratios as the Portfolio grows in size, and the size of the Portfolio in relation to such breakpoints. The Board considered that in addition to management fee breakpoints, Allspring Funds Management shares potential economies of scale from its management business in a variety of ways, including through fee waiver and expense reimbursement arrangements, competitive management fee rates set at the outset without regard to breakpoints, and investments in the business intended to enhance services available to shareholders.
The Board concluded that Allspring Funds Management’s arrangements with respect to the Portfolio, including contractual breakpoints, constituted a reasonable approach to sharing potential economies of scale with the Portfolio and its shareholders.
Other benefits to Allspring Funds Management and the Sub-Adviser
The Board received and considered information regarding potential “fall-out” or ancillary benefits received by Allspring Funds Management and its affiliates, including the Sub-Adviser, as a result of their relationships with the Portfolio. Ancillary benefits could include, among others, benefits directly attributable to other relationships with the Portfolio and benefits potentially derived from an increase in Allspring Funds Management’s and the Sub-Adviser’s business as a result of their relationships with the Portfolio. The Board noted that Allspring Funds Distributor, LLC, an affiliate of Allspring Funds Management, receives distribution-related fees in respect of shares sold or held through it.
The Board also reviewed information about soft dollar credits earned and utilized by the Sub-Adviser and fees earned in the past by Allspring Funds Management and the Sub-Adviser from managing a private investment vehicle for the fund complex’s securities lending collateral.
Based on its consideration of the factors and information it deemed relevant, including those described here, the Board did not find that any ancillary benefits received by Allspring Funds Management and its affiliates, including the Sub-Adviser, were unreasonable.
Conclusion
At the Meeting, after considering the above-described factors and based on its deliberations and its evaluation of the information described above, the Board unanimously determined that the compensation payable to Allspring Funds Management and the Sub-Adviser under each of the Advisory Agreements was reasonable, and approved the continuation of the Advisory Agreements for a one-year term.
26 | Allspring Large Company Value Portfolio
This page is intentionally left blank.
This page is intentionally left blank.
For more information
More information about Allspring Funds is available free upon request. To obtain literature, please write, visit the Portfolio’s website, or call:
Allspring Funds
P.O. Box 219967
Kansas City, MO 64121-9967
Website: allspringglobal.com
Individual investors: 1-800-222-8222
Retail investment professionals: 1-888-877-9275
Institutional investment professionals: 1-800-260-5969
This report and the financial statements contained herein are submitted for the general information of the interest holders of the Portfolio. If this report is used for promotional purposes, distribution of the report must be accompanied or preceded by a current prospectus. Before investing, please consider the investment objectives, risks, charges, and expenses of the investment. For a current prospectus and, if available, a summary prospectus, containing this information, call 1-800-222-8222 or visit the Portfolio’s website at allspringglobal.com. Read the prospectus carefully before you invest or send money.
Allspring Global InvestmentsTM is the trade name for the asset management firms of Allspring Global Investments Holdings, LLC, a holding company indirectly owned by certain private funds of GTCR LLC and Reverence Capital Partners, L.P. These firms include but are not limited to Allspring Global Investments, LLC, and Allspring Funds Management, LLC. Certain products managed by Allspring entities are distributed by Allspring Funds Distributor, LLC (a broker-dealer and Member FINRA/SIPC).
This material is for general informational and educational purposes only and is NOT intended to provide investment advice or a recommendation of any kind - including a recommendation for any specific investment, strategy, or plan.
© 2024 Allspring Global Investments Holdings, LLC. All rights reserved.
Allspring Managed Fixed Income Portfolio
Semi-Annual Report
November 30, 2023
Allspring Managed Fixed Income Portfolio | 1
Performance highlights (unaudited)
Performance highlights
| The Portfolio seeks consistent fixed-income returns. |
| Allspring Funds Management, LLC |
| Galliard Capital Management, LLC |
| Andrea Johnson, CFA, Brandon Kanz, CFA |
Average annual total returns (%) as of November 30, 2023 |
| | | | |
| | | | |
Allspring Managed Fixed Income Portfolio | | | | |
Bloomberg U.S. Aggregate Bond Index1 | | | | |
Figures quoted represent past performance, which is no guarantee of future results, and do not reflect taxes that an investor may pay on an investment in a fund. Investment return and principal value of an investment will fluctuate so that an investor’s shares, when redeemed, may be worth more or less than their original cost. Current performance may be lower or higher than the performance data quoted.
Index returns do not include transaction costs associated with buying and selling securities, any mutual fund fees or expenses, or any taxes. It is not possible to invest directly in an index.
Shares are sold without a front-end sales charge or contingent deferred sales charge.
|
| The Bloomberg U.S. Aggregate Bond Index is a broad-based benchmark that measures the investment-grade, U.S.–dollar–denominated, fixed-rate taxable bond market, including Treasuries, government-related and corporate securities, mortgage-backed securities (agency fixed-rate and hybrid adjustable-rate mortgage pass-throughs), asset-backed securities, and commercial mortgage-backed securities. You cannot invest directly in an index. |
CFA® and Chartered Financial Analyst® are trademarks owned by CFA Institute. |
2 | Allspring Managed Fixed Income Portfolio
Performance highlights (unaudited)
Ten largest holdings (%) as of November 30, 20231 |
| |
U.S. Treasury Bonds, 2.38%, 11-15-2049 | |
| |
| |
U.S. Treasury Notes, 4.63%, 11-15-2026 | |
| |
U.S. Treasury Bonds, 1.38%, 11-15-2040 | |
JP Morgan Chase Commercial Mortgage Securities Trust, 3.80%, 7-15-2047 | |
U.S. Treasury Bonds, 4.38%, 8-15-2043 | |
U.S. Treasury Notes, 5.00%, 10-31-2025 | |
| Figures represent the percentage of the Portfolio’s net assets. Holdings are subject to change and may have changed since the date specified. |
Portfolio allocation as of November 30, 20231 |
| Figures represent the percentage of the Portfolio’s long-term investments. Allocations are subject to change and may have changed since the date specified. |
Allspring Managed Fixed Income Portfolio | 3
Portfolio expenses (unaudited)
Portfolio expenses
As an investor of beneficial interest of the Portfolio, you incur ongoing costs, including advisory fees and other Portfolio expenses. This example is intended to help you understand your ongoing costs (in dollars) of investing in the Portfolio and to compare these costs with the ongoing costs of investing in other mutual funds.
The example is based on an investment of $1,000 invested at the beginning of the six-month period and held for the entire period from June 1, 2023 to November 30, 2023.
Actual expenses
The “Actual” line of the table below provides information about actual account values and actual expenses. You may use the information in this line, together with the amount you invested, to estimate the expenses that you paid over the period. Simply divide your account value by $1,000 (for example, an $8,600 account value divided by $1,000= 8.6), then multiply the result by the number in the “Actual” line under the heading entitled “Expenses paid during period” for your applicable class of shares to estimate the expenses you paid on your account during this period.
Hypothetical example for comparison purposes
The “Hypothetical” line of the table below provides information about hypothetical account values and hypothetical expenses based on the Portfolio’s actual expense ratio and an assumed rate of return of 5% per year before expenses, which is not the Portfolio’s actual return. The hypothetical account values and expenses may not be used to estimate the actual ending account balance or expenses you paid for the period. You may use this information to compare the ongoing costs of investing in the Portfolio and other funds. To do so, compare this 5% hypothetical example with the 5% hypothetical examples that appear in the shareholder reports of the other funds.
Please note that the expenses shown in the table are meant to highlight your ongoing costs only. Therefore, the “Hypothetical” line of the table is useful in comparing ongoing costs only, and will not help you determine the relative total costs of owning different funds.
| Beginning
account value
6-1-2023 | Ending
account value
11-30-2023 | | Annualized net
expense ratio |
| | | | |
Hypothetical (5% return before expenses) | | | | |
| Expenses paid is equal to the annualized net expense ratio multiplied by the average account value over the period, multiplied by 183 divided by 366 (to reflect the one-half-year period). |
4 | Allspring Managed Fixed Income Portfolio
Portfolio of investments—November 30, 2023 (unaudited)
| | | | | |
Agency securities: 19.79% | | | | | | |
| | | | | | |
| | | | | | |
| | | | | | |
| | | | | | |
| | | | | | |
| | | | | | |
| | | | | | |
| | | | | | |
| | | | | | |
| | | | | | |
| | | | | | |
| | | | | | |
| | | | | | |
| | | | | | |
| | | | | | |
| | | | | | |
| | | | | | |
| | | | | | |
| | | | | | |
FHLMC Structured Pass-Through Certificates Series T-20 Class A6 | | | | | | |
FHLMC Structured Pass-Through Certificates Series T-58 Class 4A | | | | | | |
| | | | | | |
| | | | | | |
| | | | | | |
| | | | | | |
| | | | | | |
| | | | | | |
| | | | | | |
| | | | | | |
| | | | | | |
| | | | | | |
| | | | | | |
| | | | | | |
| | | | | | |
| | | | | | |
| | | | | | |
| | | | | | |
| | | | | | |
| | | | | | |
| | | | | | |
| | | | | | |
| | | | | | |
| | | | | | |
| | | | | | |
| | | | | | |
| | | | | | |
| | | | | | |
| | | | | | |
The accompanying notes are an integral part of these financial statements.
Allspring Managed Fixed Income Portfolio | 5
Portfolio of investments—November 30, 2023 (unaudited)
| | | | | |
Agency securities(continued) | | | | | | |
| | | | | | |
| | | | | | |
| | | | | | |
| | | | | | |
| | | | | | |
| | | | | | |
| | | | | | |
| | | | | | |
| | | | | | |
| | | | | | |
| | | | | | |
| | | | | | |
| | | | | | |
| | | | | | |
FNMA Series 2002-90 Class A2 | | | | | | |
FNMA Series 2002-T4 Class A2 | | | | | | |
FNMA Series 2002-W4 Class A4 | | | | | | |
FNMA Series 2003-W4 Class 3A±± | | | | | | |
FNMA Series 2004-T2 Class 1A1 | | | | | | |
FNMA Series 2004-T3 Class 1A1 | | | | | | |
FNMA Series 2004-W1 Class 2A2 | | | | | | |
FNMA Series 2004-W11 Class 1A3 | | | | | | |
FNMA Series 2004-W8 Class 3A | | | | | | |
| | | | | | |
Total agency securities (Cost $78,063,273) | | | | | | |
Asset-backed securities: 8.38% | | | | | | |
ECMC Group Student Loan Trust Series 2016-1A Class A (30 Day Average U.S. SOFR+1.46%)144A± | | | | | | |
ECMC Group Student Loan Trust Series 2018-2A Class A (30 Day Average U.S. SOFR+0.91%)144A± | | | | | | |
Fifth Third Auto Trust Series 2023-1 Class A3 | | | | | | |
Ford Credit Auto Owner Trust Series 2021-1 Class A144A | | | | | | |
Ford Credit Auto Owner Trust Series 2023-2 Class A144A | | | | | | |
Louisiana Local Government Environmental Facilities & CDA Series 2022-ELL Class A3 | | | | | | |
Mississippi Higher Education Assistance Corp. Series 2014-1 Class A1 (30 Day Average U.S. SOFR+0.79%)± | | | | | | |
PFS Financing Corp. Series 2023-C Class A144A | | | | | | |
PHEAA Student Loan Trust Series 2016-1A Class A (30 Day Average U.S. SOFR+1.26%)144A± | | | | | | |
Rhode Island Student Loan Authority Series 2012-1 Class A1 (30 Day Average U.S. SOFR+1.01%)± | | | | | | |
SBA Small Business Investment Cos. Series 2014-10A Class 1 | | | | | | |
SBA Small Business Investment Cos. Series 2014-10B Class 1 | | | | | | |
SBA Small Business Investment Cos. Series 2015-10B Class 1 | | | | | | |
SBA Small Business Investment Cos. Series 2017-10A Class 1 | | | | | | |
SBA Small Business Investment Cos. Series 2018-10B Class 1 | | | | | | |
The accompanying notes are an integral part of these financial statements.
6 | Allspring Managed Fixed Income Portfolio
Portfolio of investments—November 30, 2023 (unaudited)
| | | | | |
Asset-backed securities(continued) | | | | | | |
SBA Small Business Investment Cos. Series 2021-10A Class 1 | | | | | | |
SBA Small Business Investment Cos. Series 2021-10B Class 1 | | | | | | |
SBA Small Business Investment Cos. Series 2022-10A Class 1 | | | | | | |
SLM Student Loan Trust Series 2003-10A Class A4 (90 Day Average U.S. SOFR+0.93%)144A± | | | | | | |
South Carolina Student Loan Corp. Series 2014-1 Class B (30 Day Average U.S. SOFR+1.61%)± | | | | | | |
U.S. Small Business Administration Series 2006-20B Class 1 | | | | | | |
U.S. Small Business Administration Series 2006-20H Class 1 | | | | | | |
U.S. Small Business Administration Series 2007-20J Class 1 | | | | | | |
U.S. Small Business Administration Series 2013-20A Class 1 | | | | | | |
U.S. Small Business Administration Series 2013-20J Class 1 | | | | | | |
U.S. Small Business Administration Series 2014-20A Class 1 | | | | | | |
U.S. Small Business Administration Series 2015-20C Class 1 | | | | | | |
U.S. Small Business Administration Series 2015-20E Class 1 | | | | | | |
U.S. Small Business Administration Series 2015-20F Class 1 | | | | | | |
U.S. Small Business Administration Series 2017-20F Class 1 | | | | | | |
U.S. Small Business Administration Series 2018-20E Class 1 | | | | | | |
U.S. Small Business Administration Series 2018-20G Class 1 | | | | | | |
U.S. Small Business Administration Series 2018-20H Class 1 | | | | | | |
U.S. Small Business Administration Series 2018-20K Class 1 | | | | | | |
U.S. Small Business Administration Series 2022-25G Class 1 | | | | | | |
U.S. Small Business Administration Series 2022-25L Class 1 | | | | | | |
U.S. Small Business Administration Series 2023-25A Class 1 | | | | | | |
U.S. Small Business Administration Series 2023-25D Class 1 | | | | | | |
Total asset-backed securities (Cost $31,244,520) | | | | | | |
Corporate bonds and notes: 36.99% | | | | | | |
| | | | | | |
| | | | | | |
| | | | | | |
| | | | | | |
Axalta Coating Systems LLC/Axalta Coating Systems Dutch Holding B BV144A | | | | | | |
Celanese U.S. Holdings LLC | | | | | | |
| | | | | | |
| | | | | | |
| | | | | | |
| | | | | | |
| | | | | | |
| | | | | | |
| | | | | | |
| | | | | | |
| | | | | | |
| | | | | | |
| | | | | | |
| | | | | | |
The accompanying notes are an integral part of these financial statements.
Allspring Managed Fixed Income Portfolio | 7
Portfolio of investments—November 30, 2023 (unaudited)
| | | | | |
| | | | | | |
| | | | | | |
| | | | | | |
| | | | | | |
| | | | | | |
| | | | | | |
CCO Holdings LLC/CCO Holdings Capital Corp.144A | | | | | | |
CCO Holdings LLC/CCO Holdings Capital Corp.144A | | | | | | |
Charter Communications Operating LLC/Charter Communications Operating Capital | | | | | | |
| | | | | | |
| | | | | | |
Telecommunications: 1.24% | | | | | | |
| | | | | | |
| | | | | | |
| | | | | | |
| | | | | | |
| | | | | | |
Verizon Communications, Inc. | | | | | | |
Verizon Communications, Inc. | | | | | | |
| | | | | | |
Consumer, cyclical: 2.74% | | | | | | |
| | | | | | |
| | | | | | |
| | | | | | |
Wolverine World Wide, Inc.144A | | | | | | |
| | | | | | |
Auto manufacturers: 1.44% | | | | | | |
Allison Transmission, Inc.144A | | | | | | |
Daimler Truck Finance North America LLC144A | | | | | | |
Daimler Truck Finance North America LLC144A | | | | | | |
Daimler Truck Finance North America LLC144A | | | | | | |
Ford Motor Credit Co. LLC | | | | | | |
| | | | | | |
General Motors Financial Co., Inc. | | | | | | |
General Motors Financial Co., Inc. | | | | | | |
Nissan Motor Acceptance Co. LLC144A | | | | | | |
Volkswagen Group of America Finance LLC144A | | | | | | |
| | | | | | |
| | | | | | |
Warnermedia Holdings, Inc. | | | | | | |
The accompanying notes are an integral part of these financial statements.
8 | Allspring Managed Fixed Income Portfolio
Portfolio of investments—November 30, 2023 (unaudited)
| | | | | |
| | | | | | |
| | | | | | |
| | | | | | |
| | | | | | |
| | | | | | |
| | | | | | |
| | | | | | |
| | | | | | |
| | | | | | |
| | | | | | |
Consumer, non-cyclical: 5.84% | | | | | | |
| | | | | | |
Darling Ingredients, Inc.144A | | | | | | |
Commercial services: 2.45% | | | | | | |
| | | | | | |
| | | | | | |
| | | | | | |
| | | | | | |
Johns Hopkins University Series A | | | | | | |
Massachusetts Institute of Technology | | | | | | |
Massachusetts Institute of Technology | | | | | | |
| | | | | | |
President & Fellows of Harvard College | | | | | | |
President & Fellows of Harvard College | | | | | | |
President & Fellows of Harvard College | | | | | | |
Service Corp. International | | | | | | |
Service Corp. International | | | | | | |
Trustees of Princeton University | | | | | | |
University of Notre Dame du Lac Series 2010 | | | | | | |
University of Southern California | | | | | | |
| | | | | | |
| | | | | | |
| | | | | | |
| | | | | | |
| | | | | | |
Healthcare-products: 1.25% | | | | | | |
Agilent Technologies, Inc. | | | | | | |
Baxter International, Inc. | | | | | | |
Baxter International, Inc. | | | | | | |
GE HealthCare Technologies, Inc. | | | | | | |
GE HealthCare Technologies, Inc. | | | | | | |
| | | | | | |
| | | | | | |
| | | | | | |
The accompanying notes are an integral part of these financial statements.
Allspring Managed Fixed Income Portfolio | 9
Portfolio of investments—November 30, 2023 (unaudited)
| | | | | |
Healthcare-products(continued) | | | | | | |
| | | | | | |
| | | | | | |
| | | | | | |
Healthcare-services: 1.04% | | | | | | |
Ascension Health Series B | | | | | | |
BayCare Health System, Inc. Series 2020 | | | | | | |
Charles River Laboratories International, Inc.144A | | | | | | |
Cleveland Clinic Foundation | | | | | | |
Kaiser Foundation Hospitals Series 2021 | | | | | | |
| | | | | | |
Memorial Sloan-Kettering Cancer Center Series 2015 | | | | | | |
Nationwide Children’s Hospital, Inc. | | | | | | |
Northwestern Memorial Healthcare Obligated Group Series 2021 | | | | | | |
| | | | | | |
Pediatrix Medical Group, Inc.144A | | | | | | |
Presbyterian Healthcare Services | | | | | | |
Providence St. Joseph Health Obligated Group | | | | | | |
| | | | | | |
Household products/wares: 0.12% | | | | | | |
| | | | | | |
| | | | | | |
Bayer U.S. Finance II LLC144A | | | | | | |
Bayer U.S. Finance LLC144A | | | | | | |
| | | | | | |
| | | | | | |
| | | | | | |
| | | | | | |
| | | | | | |
| | | | | | |
| | | | | | |
Antero Resources Corp.144A | | | | | | |
| | | | | | |
| | | | | | |
BP Capital Markets America, Inc. | | | | | | |
| | | | | | |
| | | | | | |
| | | | | | |
Patterson-UTI Energy, Inc. | | | | | | |
Permian Resources Operating LLC144A | | | | | | |
Range Resources Corp.144A | | | | | | |
| | | | | | |
Sunoco LP/Sunoco Finance Corp. | | | | | | |
| | | | | | |
The accompanying notes are an integral part of these financial statements.
10 | Allspring Managed Fixed Income Portfolio
Portfolio of investments—November 30, 2023 (unaudited)
| | | | | |
Oil & gas services: 0.21% | | | | | | |
| | | | | | |
| | | | | | |
| | | | | | |
| | | | | | |
Cheniere Energy Partners LP | | | | | | |
| | | | | | |
Florida Gas Transmission Co. LLC144A | | | | | | |
Gray Oak Pipeline LLC144A | | | | | | |
Gulfstream Natural Gas System LLC144A | | | | | | |
Magellan Midstream Partners LP | | | | | | |
| | | | | | |
| | | | | | |
Plains All American Pipeline LP/PAA Finance Corp. | | | | | | |
Plains All American Pipeline LP/PAA Finance Corp. | | | | | | |
Sabine Pass Liquefaction LLC | | | | | | |
Transcontinental Gas Pipe Line Co. LLC | | | | | | |
| | | | | | |
| | | | | | |
| | | | | | |
| | | | | | |
| | | | | | |
Bank of America Corp. (U.S. SOFR+0.96%)± | | | | | | |
Bank of America Corp. (U.S. SOFR+1.21%)± | | | | | | |
Bank of America Corp. (U.S. SOFR+1.37%)± | | | | | | |
Bank of America Corp. (U.S. SOFR+2.16%)± | | | | | | |
Bank of America Corp. (U.S. SOFR 3 Month+1.77%)± | | | | | | |
Bank of New York Mellon Corp. (U.S. SOFR+1.42%)± | | | | | | |
Bank of New York Mellon Corp. (U.S. SOFR+1.60%)± | | | | | | |
Bank of New York Mellon Corp. (U.S. SOFR+1.76%)± | | | | | | |
Bank of New York Mellon Corp. (U.S. SOFR+1.80%)± | | | | | | |
Citigroup, Inc. (U.S. SOFR+0.77%)± | | | | | | |
Citigroup, Inc. (U.S. SOFR+1.18%)± | | | | | | |
Citigroup, Inc. (U.S. SOFR+1.28%)± | | | | | | |
Citigroup, Inc. (U.S. SOFR+1.35%)± | | | | | | |
Citigroup, Inc. (U.S. SOFR+2.09%)± | | | | | | |
Citigroup, Inc. (U.S. SOFR+2.11%)± | | | | | | |
Citigroup, Inc. (U.S. SOFR 3 Month+1.65%)± | | | | | | |
Citizens Bank NA (U.S. SOFR+2.00%)± | | | | | | |
Fifth Third Bancorp (U.S. SOFR+2.13%)± | | | | | | |
Fifth Third Bancorp (U.S. SOFR+2.19%)± | | | | | | |
Goldman Sachs Group, Inc. (U.S. SOFR+0.91%)± | | | | | | |
Goldman Sachs Group, Inc. (U.S. SOFR+1.11%)± | | | | | | |
Goldman Sachs Group, Inc. (U.S. SOFR+1.85%)± | | | | | | |
Goldman Sachs Group, Inc. (U.S. SOFR 3 Month+1.56%)± | | | | | | |
Huntington Bancshares, Inc. (U.S. SOFR+2.05%)± | | | | | | |
| | | | | | |
The accompanying notes are an integral part of these financial statements.
Allspring Managed Fixed Income Portfolio | 11
Portfolio of investments—November 30, 2023 (unaudited)
| | | | | |
| | | | | | |
JPMorgan Chase & Co. (U.S. SOFR+1.26%)± | | | | | | |
JPMorgan Chase & Co. (U.S. SOFR+1.89%)± | | | | | | |
JPMorgan Chase & Co. (U.S. SOFR 3 Month+1.25%)± | | | | | | |
JPMorgan Chase & Co. (U.S. SOFR 3 Month+1.52%)± | | | | | | |
JPMorgan Chase & Co. (U.S. SOFR 3 Month+1.59%)± | | | | | | |
JPMorgan Chase & Co. (U.S. SOFR 3 Month+1.60%)± | | | | | | |
| | | | | | |
| | | | | | |
KeyCorp (U.S. SOFR+2.06%)± | | | | | | |
M&T Bank Corp. (U.S. SOFR+1.85%)± | | | | | | |
Morgan Stanley (U.S. SOFR+0.86%)± | | | | | | |
Morgan Stanley (U.S. SOFR+1.00%)± | | | | | | |
Morgan Stanley (U.S. SOFR+1.59%)± | | | | | | |
Morgan Stanley (U.S. SOFR+1.63%)± | | | | | | |
Morgan Stanley (U.S. SOFR+2.08%)± | | | | | | |
| | | | | | |
PNC Financial Services Group, Inc. (U.S. SOFR+1.93%)± | | | | | | |
PNC Financial Services Group, Inc. (U.S. SOFR+2.14%)± | | | | | | |
| | | | | | |
State Street Corp. (U.S. SOFR+1.00%)± | | | | | | |
State Street Corp. (U.S. SOFR+1.61%)± | | | | | | |
State Street Corp. (U.S. SOFR+1.73%)± | | | | | | |
Truist Financial Corp. (U.S. SOFR+1.37%)± | | | | | | |
Truist Financial Corp. (U.S. SOFR+2.30%)± | | | | | | |
Truist Financial Corp. (U.S. SOFR 3 Month+1.24%)± | | | | | | |
U.S. Bancorp (U.S. SOFR+1.66%)± | | | | | | |
U.S. Bancorp (U.S. SOFR+2.09%)± | | | | | | |
Wells Fargo & Co. (U.S. SOFR+1.50%)± | | | | | | |
Wells Fargo & Co. (U.S. SOFR+1.51%)± | | | | | | |
Wells Fargo & Co. (U.S. SOFR+2.02%)± | | | | | | |
Wells Fargo & Co. (U.S. SOFR+2.10%)± | | | | | | |
| | | | | | |
Diversified financial services: 0.60% | | | | | | |
American Express Co. (U.S. SOFR+1.28%)± | | | | | | |
American Express Co. (U.S. SOFR+1.76%)± | | | | | | |
American Express Co. (U.S. SOFR+1.94%)± | | | | | | |
Capital One Financial Corp. (U.S. SOFR+1.79%)± | | | | | | |
Capital One Financial Corp. (U.S. SOFR+2.37%)± | | | | | | |
Charles Schwab Corp. (U.S. SOFR+1.88%)± | | | | | | |
Charles Schwab Corp. (U.S. SOFR+2.21%)± | | | | | | |
| | | | | | |
| | | | | | |
Aon Corp./Aon Global Holdings PLC | | | | | | |
Marsh & McLennan Cos., Inc. | | | | | | |
Metropolitan Life Global Funding I144A | | | | | | |
| | | | | | |
The accompanying notes are an integral part of these financial statements.
12 | Allspring Managed Fixed Income Portfolio
Portfolio of investments—November 30, 2023 (unaudited)
| | | | | |
| | | | | | |
Northwestern Mutual Life Insurance Co.144A | | | | | | |
Pacific Life Global Funding II144A | | | | | | |
| | | | | | |
| | | | | | |
Alexandria Real Estate Equities, Inc. | | | | | | |
Alexandria Real Estate Equities, Inc. | | | | | | |
| | | | | | |
| | | | | | |
| | | | | | |
| | | | | | |
| | | | | | |
| | | | | | |
| | | | | | |
| | | | | | |
| | | | | | |
| | | | | | |
Mid-America Apartments LP | | | | | | |
| | | | | | |
| | | | | | |
| | | | | | |
| | | | | | |
| | | | | | |
| | | | | | |
| | | | | | |
| | | | | | |
| | | | | | |
| | | | | | |
| | | | | | |
| | | | | | |
| | | | | | |
| | | | | | |
L3Harris Technologies, Inc. | | | | | | |
| | | | | | |
Raytheon Technologies Corp. | | | | | | |
Raytheon Technologies Corp. | | | | | | |
| | | | | | |
| | | | | | |
Building materials: 0.63% | | | | | | |
| | | | | | |
CRH America Finance, Inc.144A | | | | | | |
Fortune Brands Innovations, Inc. | | | | | | |
Lennox International, Inc. | | | | | | |
Martin Marietta Materials, Inc. Series CB | | | | | | |
| | | | | | |
| | | | | | |
The accompanying notes are an integral part of these financial statements.
Allspring Managed Fixed Income Portfolio | 13
Portfolio of investments—November 30, 2023 (unaudited)
| | | | | |
| | | | | | |
| | | | | | |
| | | | | | |
| | | | | | |
Environmental control: 0.40% | | | | | | |
| | | | | | |
| | | | | | |
| | | | | | |
| | | | | | |
Hand/machine tools: 0.05% | | | | | | |
Stanley Black & Decker, Inc. | | | | | | |
Machinery-construction & mining: 0.18% | | | | | | |
| | | | | | |
| | | | | | |
| | | | | | |
Machinery-diversified: 0.36% | | | | | | |
GrafTech Finance, Inc.144A | | | | | | |
GrafTech Global Enterprises, Inc.144A | | | | | | |
Mueller Water Products, Inc.144A | | | | | | |
| | | | | | |
Packaging & containers: 1.19% | | | | | | |
| | | | | | |
Clearwater Paper Corp.144A | | | | | | |
Graphic Packaging International LLC144A | | | | | | |
Graphic Packaging International LLC144A | | | | | | |
Packaging Corp. of America | | | | | | |
Sealed Air Corp./Sealed Air Corp. U.S.144A | | | | | | |
| | | | | | |
| | | | | | |
| | | | | | |
| | | | | | |
| | | | | | |
| | | | | | |
| | | | | | |
| | | | | | |
| | | | | | |
| | | | | | |
| | | | | | |
| | | | | | |
| | | | | | |
Hewlett Packard Enterprise Co. | | | | | | |
The accompanying notes are an integral part of these financial statements.
14 | Allspring Managed Fixed Income Portfolio
Portfolio of investments—November 30, 2023 (unaudited)
| | | | | |
| | | | | | |
| | | | | | |
| | | | | | |
| | | | | | |
| | | | | | |
Microchip Technology, Inc. | | | | | | |
| | | | | | |
ON Semiconductor Corp.144A | | | | | | |
| | | | | | |
| | | | | | |
| | | | | | |
| | | | | | |
| | | | | | |
Fidelity National Information Services, Inc. | | | | | | |
| | | | | | |
| | | | | | |
| | | | | | |
| | | | | | |
Take-Two Interactive Software, Inc. | | | | | | |
| | | | | | |
| | | | | | |
| | | | | | |
| | | | | | |
American Transmission Systems, Inc.144A | | | | | | |
| | | | | | |
Commonwealth Edison Co. Series 133 | | | | | | |
Connecticut Light & Power Co. | | | | | | |
Dominion Energy South Carolina, Inc. | | | | | | |
Dominion Energy South Carolina, Inc. Series A | | | | | | |
| | | | | | |
DTE Electric Securitization Funding II LLC Series A-2 | | | | | | |
Duke Energy Carolinas LLC | | | | | | |
Duke Energy Carolinas LLC | | | | | | |
| | | | | | |
Evergy Kansas Central, Inc. | | | | | | |
Evergy Metro, Inc. Series 2020 | | | | | | |
Evergy Missouri West, Inc.144A | | | | | | |
Florida Power & Light Co. | | | | | | |
Indianapolis Power & Light Co.144A | | | | | | |
Kentucky Utilities Co. Series KENT | | | | | | |
Louisville Gas & Electric Co. Series LOU | | | | | | |
| | | | | | |
NextEra Energy Capital Holdings, Inc. | | | | | | |
NextEra Energy Operating Partners LP144A | | | | | | |
NextEra Energy Operating Partners LP144A | | | | | | |
Northern States Power Co. | | | | | | |
The accompanying notes are an integral part of these financial statements.
Allspring Managed Fixed Income Portfolio | 15
Portfolio of investments—November 30, 2023 (unaudited)
| | | | | |
| | | | | | |
Northern States Power Co. | | | | | | |
Oncor Electric Delivery Co. LLC | | | | | | |
PPL Electric Utilities Corp. | | | | | | |
Public Service Electric & Gas Co. Series D | | | | | | |
| | | | | | |
Rochester Gas & Electric Corp.144A | | | | | | |
San Diego Gas & Electric Co. | | | | | | |
Sigeco Securitization I LLC Series A2 | | | | | | |
Southern California Edison Co. Series 2004-B | | | | | | |
Tucson Electric Power Co. | | | | | | |
| | | | | | |
| | | | | | |
Wisconsin Power & Light Co. | | | | | | |
| | | | | | |
| | | | | | |
AmeriGas Partners LP/AmeriGas Finance Corp. | | | | | | |
| | | | | | |
CenterPoint Energy Resources Corp. | | | | | | |
| | | | | | |
| | | | | | |
Total corporate bonds and notes (Cost $142,111,141) | | | | | | |
Municipal obligations: 7.39% | | | | | | |
| | | | | | |
Miscellaneous revenue: 0.24% | | | | | | |
Alabama Federal Aid Highway Finance Authority Series B | | | | | | |
| | | | | | |
Miscellaneous revenue: 0.10% | | | | | | |
City of Yuma Excise Tax Revenue | | | | | | |
| | | | | | |
| | | | | | |
Campbell Union High School District | | | | | | |
Desert Community College District | | | | | | |
Oxnard Union High School District | | | | | | |
Palomar Community College District | | | | | | |
San Ramon Valley Unified School District | | | | | | |
Solano County Community College District Series B | | | | | | |
| | | | | | |
| | | | | | |
| | | | | | |
San Jose Redevelopment Agency Successor Agency Series T | | | | | | |
| | | | | | |
The accompanying notes are an integral part of these financial statements.
16 | Allspring Managed Fixed Income Portfolio
Portfolio of investments—November 30, 2023 (unaudited)
| | | | | |
| | | | | | |
| | | | | | |
Florida Housing Finance Corp. Series 4 (GNMA / FNMA / FHLMC Insured) | | | | | | |
Water & sewer revenue: 0.25% | | | | | | |
Florida Water Pollution Control Financing Corp. Clean Water State Revolving Fund Series A | | | | | | |
| | | | | | |
| | | | | | |
| | | | | | |
Cherokee County Board of Education | | | | | | |
| | | | | | |
| | | | | | |
Idaho Housing & Finance Association Series D-1 (GNMA / FNMA / FHLMC Insured) | | | | | | |
| | | | | | |
| | | | | | |
Indiana Finance Authority Community Foundation of Northwest Indiana Obligated Group | | | | | | |
Miscellaneous revenue: 0.07% | | | | | | |
Indianapolis Local Public Improvement Bond Bank Series A-2 | | | | | | |
| | | | | | |
| | | | | | |
Miscellaneous revenue: 0.07% | | | | | | |
Louisiana Local Government Environmental Facilities & CDA Series A | | | | | | |
| | | | | | |
State of Louisiana Gasoline & Fuels Tax Revenue Series A | | | | | | |
| | | | | | |
| | | | | | |
| | | | | | |
Commonwealth of Massachusetts Series D | | | | | | |
Water & sewer revenue: 0.07% | | | | | | |
Massachusetts Water Resources Authority Series C | | | | | | |
| | | | | | |
| | | | | | |
| | | | | | |
Michigan Finance Authority Trinity Health Corp. Obligated Group Series T | | | | | | |
The accompanying notes are an integral part of these financial statements.
Allspring Managed Fixed Income Portfolio | 17
Portfolio of investments—November 30, 2023 (unaudited)
| | | | | |
| | | | | | |
| | | | | | |
State of Minnesota Series F | | | | | | |
| | | | | | |
Minnesota Housing Finance Agency Series U (GNMA / FNMA / FHLMC Insured)%% | | | | | | |
| | | | | | |
| | | | | | |
| | | | | | |
State of Mississippi Series E | | | | | | |
| | | | | | |
| | | | | | |
University of Nebraska Facilities Corp. Series A | | | | | | |
| | | | | | |
Miscellaneous revenue: 0.09% | | | | | | |
Hudson County Improvement Authority (AGM Insured) | | | | | | |
| | | | | | |
| | | | | | |
State of New York Series B | | | | | | |
State of New York Series C | | | | | | |
| | | | | | |
| | | | | | |
| | | | | | |
| | | | | | |
| | | | | | |
| | | | | | |
| | | | | | |
| | | | | | |
State of Ohio Cleveland Clinic Health System Obligated Group Series G | | | | | | |
| | | | | | |
Ohio Housing Finance Agency Series C%% | | | | | | |
| | | | | | |
| | | | | | |
| | | | | | |
Oklahoma Development Finance Authority Oklahoma Gas and Electric Co. Series A-2 | | | | | | |
Oklahoma Development Finance Authority Public Service Co. of Oklahoma Series A-2 | | | | | | |
| | | | | | |
The accompanying notes are an integral part of these financial statements.
18 | Allspring Managed Fixed Income Portfolio
Portfolio of investments—November 30, 2023 (unaudited)
| | | | | |
Water & sewer revenue: 0.19% | | | | | | |
Oklahoma Water Resources Board (Credit Enhancement Reserve Fund Insured) | | | | | | |
| | | | | | |
| | | | | | |
| | | | | | |
| | | | | | |
| | | | | | |
State of Oregon Department of Transportation Series B | | | | | | |
| | | | | | |
| | | | | | |
| | | | | | |
University of Pittsburgh-of the Commonwealth System of Higher Education Series A | | | | | | |
| | | | | | |
| | | | | | |
South Dakota Housing Development Authority Series E (GNMA / FNMA / FHLMC Insured) | | | | | | |
| | | | | | |
| | | | | | |
Board of Regents of the University of Texas System Series D | | | | | | |
Permanent University Fund - University of Texas System | | | | | | |
| | | | | | |
| | | | | | |
Stafford Municipal School District Series B | | | | | | |
| | | | | | |
| | | | | | |
| | | | | | |
Texas Department of Housing & Community Affairs Series C (GNMA Insured) | | | | | | |
| | | | | | |
Texas Natural Gas Securitization Finance Corp. | | | | | | |
| | | | | | |
| | | | | | |
| | | | | | |
Vermont Housing Finance Agency | | | | | | |
| | | | | | |
| | | | | | |
| | | | | | |
The accompanying notes are an integral part of these financial statements.
Allspring Managed Fixed Income Portfolio | 19
Portfolio of investments—November 30, 2023 (unaudited)
| | | | | |
| | | | | | |
Virginia Housing Development Authority Commonwealth Mortgage Bonds 2016-A Series A | | | | | | |
| | | | | | |
| | | | | | |
| | | | | | |
King County Public Hospital District No. 2 | | | | | | |
Water & sewer revenue: 0.10% | | | | | | |
County of King Sewer Revenue Series B | | | | | | |
| | | | | | |
| | | | | | |
| | | | | | |
County of Ohio Special District Excise Tax Revenue | | | | | | |
| | | | | | |
| | | | | | |
State of Wisconsin Series 2 | | | | | | |
State of Wisconsin Series 4 | | | | | | |
| | | | | | |
Total municipal obligations (Cost $29,546,770) | | | | | | |
Non-agency mortgage-backed securities: 7.19% | | | | | | |
CAMB Commercial Mortgage Trust Series 2019-LIFE Class A (U.S. SOFR 1 Month+1.12%)144A± | | | | | | |
COMM Mortgage Trust Series 2014-CR17 Class A5 | | | | | | |
COMM Mortgage Trust Series 2014-CR21 Class A3 | | | | | | |
COMM Mortgage Trust Series 2014-UBS5 Class ASB | | | | | | |
COMM Mortgage Trust Series 2014-UBS5 Class A4 | | | | | | |
DC Commercial Mortgage Trust Series 2023-DC Class A144A | | | | | | |
GS Mortgage Securities Corp. II Series 2023-SHIP Class A144A±± | | | | | | |
GS Mortgage Securities Trust Series 2014-GC26 Class A5 | | | | | | |
JP Morgan Chase Commercial Mortgage Securities Trust Series 2014- C20 Class A5 | | | | | | |
JP Morgan Chase Commercial Mortgage Securities Trust Series 2022- ACB Class A (30 Day Average U.S. SOFR+1.40%)144A± | | | | | | |
JPMBB Commercial Mortgage Securities Trust Series 2014-C19 Class A4 | | | | | | |
JPMBB Commercial Mortgage Securities Trust Series 2014-C26 Class A4 | | | | | | |
Morgan Stanley Bank of America Merrill Lynch Trust Series 2014-C15 Class ASB | | | | | | |
Morgan Stanley Bank of America Merrill Lynch Trust Series 2014-C19 Class A4 | | | | | | |
Seasoned Credit Risk Transfer Trust Series 2018-3 Class MA±± | | | | | | |
Seasoned Credit Risk Transfer Trust Series 2019-3 Class M55D | | | | | | |
Seasoned Credit Risk Transfer Trust Series 2020-2 Class MT | | | | | | |
The accompanying notes are an integral part of these financial statements.
20 | Allspring Managed Fixed Income Portfolio
Portfolio of investments—November 30, 2023 (unaudited)
| | | | | |
Non-agency mortgage-backed securities(continued) | | | | | | |
Towd Point Mortgage Trust Series 2018-3 Class A1144A±± | | | | | | |
Towd Point Mortgage Trust Series 2019-4 Class A1144A±± | | | | | | |
WFRBS Commercial Mortgage Trust Series 2014-C20 Class A5 | | | | | | |
Total non-agency mortgage-backed securities (Cost $26,048,460) | | | | | | |
U.S. Treasury securities: 12.74% | | | | | | |
| | | | | | |
| | | | | | |
| | | | | | |
| | | | | | |
| | | | | | |
| | | | | | |
| | | | | | |
| | | | | | |
| | | | | | |
| | | | | | |
| | | | | | |
| | | | | | |
| | | | | | |
| | | | | | |
| | | | | | |
| | | | | | |
| | | | | | |
| | | | | | |
| | | | | | |
| | | | | | |
Total U.S. Treasury securities (Cost $56,598,713) | | | | | | |
Yankee corporate bonds and notes: 6.01% | | | | | | |
| | | | | | |
| | | | | | |
| | | | | | |
| | | | | | |
| | | | | | |
| | | | | | |
Anglo American Capital PLC144A | | | | | | |
South32 Treasury Ltd.144A | | | | | | |
| | | | | | |
Consumer, non-cyclical: 0.39% | | | | | | |
Commercial services: 0.14% | | | | | | |
| | | | | | |
| | | | | | |
Teva Pharmaceutical Finance Netherlands III BV | | | | | | |
The accompanying notes are an integral part of these financial statements.
Allspring Managed Fixed Income Portfolio | 21
Portfolio of investments—November 30, 2023 (unaudited)
| | | | | |
| | | | | | |
| | | | | | |
| | | | | | |
| | | | | | |
| | | | | | |
| | | | | | |
| | | | | | |
| | | | | | |
| | | | | | |
| | | | | | |
| | | | | | |
Bank of Montreal Series H | | | | | | |
| | | | | | |
| | | | | | |
BNP Paribas SA (U.S. SOFR+1.87%)144A±%% | | | | | | |
| | | | | | |
Cooperatieve Rabobank UA (1 Year Treasury Constant Maturity+0.73%)144A± | | | | | | |
Cooperatieve Rabobank UA (1 Year Treasury Constant Maturity+1.00%)144A± | | | | | | |
Credit Suisse Group AG (3 Month LIBOR+1.41%)144A± | | | | | | |
HSBC Holdings PLC (U.S. SOFR+1.41%)± | | | | | | |
HSBC Holdings PLC (U.S. SOFR 3 Month+1.80%)± | | | | | | |
Mitsubishi UFJ Financial Group, Inc. (1 Year Treasury Constant Maturity+0.75%)± | | | | | | |
Mitsubishi UFJ Financial Group, Inc. (1 Year Treasury Constant Maturity+0.83%)± | | | | | | |
Mitsubishi UFJ Financial Group, Inc. (1 Year Treasury Constant Maturity+0.97%)± | | | | | | |
Mitsubishi UFJ Financial Group, Inc. (1 Year Treasury Constant Maturity+2.13%)± | | | | | | |
| | | | | | |
| | | | | | |
Sumitomo Mitsui Financial Group, Inc. | | | | | | |
Sumitomo Mitsui Financial Group, Inc. | | | | | | |
Sumitomo Mitsui Financial Group, Inc. | | | | | | |
| | | | | | |
| | | | | | |
| | | | | | |
UBS Group AG (1 Year Treasury Constant Maturity+1.10%)144A± | | | | | | |
UBS Group AG (1 Year Treasury Constant Maturity+2.40%)144A± | | | | | | |
| | | | | | |
| | | | | | |
| | | | | | |
Embraer Netherlands Finance BV144A | | | | | | |
The accompanying notes are an integral part of these financial statements.
22 | Allspring Managed Fixed Income Portfolio
Portfolio of investments—November 30, 2023 (unaudited)
| | | | | |
Building materials: 0.14% | | | | | | |
Masonite International Corp.144A | | | | | | |
| | | | | | |
Sensata Technologies BV144A | | | | | | |
| | | | | | |
| | | | | | |
NXP BV/NXP Funding LLC/NXP USA, Inc. | | | | | | |
NXP BV/NXP Funding LLC/NXP USA, Inc. | | | | | | |
| | | | | | |
| | | | | | |
| | | | | | |
| | | | | | |
| | | | | | |
Total yankee corporate bonds and notes (Cost $22,854,413) | | | | | | |
| | | | | |
Short-term investments: 0.83% | | | | | | |
Investment companies: 0.83% | | | | | | |
Allspring Government Money Market Fund Select Class♠∞## | | | | | | |
Total short-term investments (Cost $2,884,376) | | | | | | |
Total investments in securities (Cost $389,351,666) | | | | | | |
Other assets and liabilities, net | | | | | | |
| | | | | | |
| The coupon of the security is adjusted based on the principal and/or interest payments received from the underlying pool of mortgages as well as the credit quality and the actual prepayment speed of the underlying mortgages. The rate shown is the rate in effect at period end. |
| The security may be resold in transactions exempt from registration, normally to qualified institutional buyers, pursuant to Rule 144A under the Securities Act of 1933. |
| Variable rate investment. The rate shown is the rate in effect at period end. |
| The security is purchased on a when-issued basis. |
| The issuer of the security is an affiliated person of the Portfolio as defined in the Investment Company Act of 1940. |
| The rate represents the 7-day annualized yield at period end. |
| All or a portion of this security is segregated as collateral for when-issued securities. |
|
| Assured Guaranty Municipal |
| Community Development Authority |
| Federal Home Loan Mortgage Corporation |
| Federal National Mortgage Association |
| Government National Mortgage Association |
| |
| London Interbank Offered Rate |
| |
| Real estate investment trust |
| |
| Secured Overnight Financing Rate |
The accompanying notes are an integral part of these financial statements.
Allspring Managed Fixed Income Portfolio | 23
Portfolio of investments—November 30, 2023 (unaudited)
Investments in affiliates
An affiliated investment is an investment in which the Portfolio owns at least 5% of the outstanding voting shares of the issuer or as a result of other relationships, such as the Portfolio and the issuer having the same adviser or investment manager. Transactions with issuers that were affiliates of the Portfolio at the end of the period were as follows:
| | | | | Net
change in
unrealized
gains
(losses) | | | Income
from
affiliated
securities |
| | | | | | | | |
Allspring Government Money Market Fund Select Class | | | | | | | | |
The accompanying notes are an integral part of these financial statements.
24 | Allspring Managed Fixed Income Portfolio
Statement of assets and liabilities—November 30, 2023 (unaudited)
Financial statements
Statement of assets and liabilities
| |
Investments in unaffiliated securities, at value (cost $386,467,290) | |
Investments in affiliated securities, at value (cost $2,884,376) | |
| |
| |
Receivable for investments sold | |
Prepaid expenses and other assets | |
| |
| |
Payable for when-issued transactions | |
| |
Trustees’ fees and expenses payable | |
Accrued expenses and other liabilities | |
| |
| |
The accompanying notes are an integral part of these financial statements.
Allspring Managed Fixed Income Portfolio | 25
Statement of operations—six months ended November 30, 2023 (unaudited)
Statement of operations
| |
Interest (net of foreign withholding taxes of $120) | |
Income from affiliated securities | |
| |
| |
| |
Custody and accounting fees | |
| |
Interest holder report expenses | |
Trustees’ fees and expenses | |
| |
| |
Less: Fee waivers and/or expense reimbursements | |
| |
| |
Realized and unrealized gains (losses) on investments | |
Net realized losses on investments | |
Net change in unrealized gains (losses) on investments | |
Net realized and unrealized gains (losses) on investments | |
Net decrease in net assets resulting from operations | |
The accompanying notes are an integral part of these financial statements.
26 | Allspring Managed Fixed Income Portfolio
Statement of changes in net assets
Statement of changes in net assets
|
Six months ended
November 30, 2023 (unaudited) | |
| | | | |
| | | | |
Net realized losses on investments | | | | |
Net change in unrealized gains (losses) on investments | | | | |
Net decrease in net assets resulting from operations | | | | |
| | | | |
Transactions in investors’ beneficial interests | | | | |
| | | | |
| | | | |
Net decrease in net assets resulting from capital transactions | | | | |
Total decrease in net assets | | | | |
| | | | |
| | | | |
| | | | |
The accompanying notes are an integral part of these financial statements.
Allspring Managed Fixed Income Portfolio | 27
| Six months ended
November 30, 2023
(unaudited) | |
| | | | | |
| | | | | | |
Ratios to average net assets (annualized) | | | | | | |
| | | | | | |
| | | | | | |
| | | | | | |
| | | | | | |
| | | | | | |
| Returns for periods of less than one year are not annualized. |
| Net expense ratios reflect voluntary waivers, if any. |
The accompanying notes are an integral part of these financial statements.
28 | Allspring Managed Fixed Income Portfolio
Notes to financial statements (unaudited)
Notes to financial statements
Allspring Master Trust (the “Trust”), a Delaware statutory trust organized on March 10, 1999, is an open-end management investment company registered under the Investment Company Act of 1940, as amended (the “1940 Act”). As an investment company, the Trust follows the accounting and reporting guidance in Financial Accounting Standards Board (“FASB”) Accounting Standards Codification Topic 946, Financial Services – Investment Companies. These financial statements report on the Allspring Managed Fixed Income Portfolio (the “Portfolio”) which is a diversified series of the Trust.
Interests in the Portfolio are available solely through private placement transactions that do not involve any “public offering” within the meaning of Section 4(a)(2) of the Securities Act of 1933.
2.
SIGNIFICANT ACCOUNTING POLICIES
The following significant accounting policies, which are consistently followed in the preparation of the financial statements of the Portfolio, are in conformity with U.S. generally accepted accounting principles which require management to make estimates and assumptions that affect the reported amounts of assets and liabilities, disclosure of contingent assets and liabilities at the date of the financial statements, and the reported amounts of income and expenses during the reporting period. Actual results could differ from those estimates.
Securities valuation
All investments are valued each business day as of the close of regular trading on the New York Stock Exchange (generally 4 p.m. Eastern Time), although the Portfolio may deviate from this calculation time under unusual or unexpected circumstances.
Debt securities are valued at the evaluated bid price provided by an independent pricing service (e.g. taking into account various factors, including yields, maturities, or credit ratings) or, if a reliable price is not available, the quoted bid price from an independent broker-dealer.
Investments in registered open-end investment companies (other than those listed on a foreign or domestic exchange or market) are valued at net asset value.
Investments which are not valued using the methods discussed above are valued at their fair value, as determined in good faith by Allspring Funds Management, LLC (“Allspring Funds Management”), which was named the valuation designee by the Board of Trustees. As the valuation designee, Allspring Funds Management is responsible for day-to-day valuation activities for the Allspring Funds. In connection with these responsibilities, Allspring Funds Management has established a Valuation Committee and has delegated to it the authority to take any actions regarding the valuation of portfolio securities that the Valuation Committee deems necessary or appropriate, including determining the fair value of portfolio securities. On a quarterly basis, the Board of Trustees receives reports of valuation actions taken by the Valuation Committee. On at least an annual basis, the Board of Trustees receives an assessment of the adequacy and effectiveness of Allspring Funds Management’s process for determining the fair value of the portfolio of investments.
When-issued transactions
The Portfolio may purchase securities on a forward commitment or when-issued basis. The Portfolio records a when-issued transaction on the trade date and will segregate assets in an amount at least equal in value to the Portfolio’s commitment to purchase when-issued securities. Securities purchased on a when-issued basis are marked-to-market daily and the Portfolio begins earning interest on the settlement date. Losses may arise due to changes in the market value of the underlying securities or if the counterparty does not perform under the contract.
Security transactions and income recognition
Securities transactions are recorded on a trade date basis. Realized gains or losses are recorded on the basis of identified cost.
Interest income is accrued daily and bond discounts are accreted and premiums are amortized daily. To the extent debt obligations are placed on non-accrual status, any related interest income may be reduced by writing off interest receivables when the collection of all or a portion of interest has been determined to be doubtful based on consistently applied procedures and the fair value has decreased. If the issuer subsequently resumes interest payments or when the collectability of interest is reasonably assured, the debt obligation is removed from non-accrual status. Interest income is recorded net of foreign taxes withheld where recovery of such taxes is not assured. Paydown gains and losses are included in interest income.
Interest earned on cash balances held at the custodian is recorded as interest income.
Federal and other taxes
The Portfolio is not required to pay federal income taxes on its net investment income and net capital gains as it is treated as a partnership for federal income tax purposes. All income, gains and losses of the Portfolio are deemed to have been “passed through” to the interest holders in proportion to their holdings of the Portfolio regardless of whether income and gains have been distributed by the Portfolio.
The Portfolio’s income tax returns and all financial records supporting those returns for the prior three fiscal years are subject to examination by the federal revenue authority. Management has analyzed the Portfolio’s tax positions taken on federal, state, and foreign tax returns, as applicable, for all open tax years and does not believe that there are any uncertain tax positions that require recognition of a tax liability.
Allspring Managed Fixed Income Portfolio | 29
Notes to financial statements (unaudited)
As of November 30, 2023, the aggregate cost of all investments for federal income tax purposes was $389,350,420 and the unrealized gains (losses) consisted of:
3.
FAIR VALUATION MEASUREMENTS
Fair value measurements of investments are determined within a framework that has established a fair value hierarchy based upon the various data inputs utilized in determining the value of the Portfolio’s investments. The three-level hierarchy gives the highest priority to unadjusted quoted prices in active markets for identical assets or liabilities (Level 1) and the lowest priority to unobservable inputs (Level 3). The Portfolio’s investments are classified within the fair value hierarchy based on the lowest level of input that is significant to the fair value measurement. The inputs are summarized into three broad levels as follows:
•Level 1—quoted prices in active markets for identical securities
•Level 2—other significant observable inputs (including quoted prices for similar securities, interest rates, prepayment speeds, credit risk, etc.)
•Level 3—significant unobservable inputs (including the Portfolio’s own assumptions in determining the fair value of investments)
The inputs or methodologies used for valuing investments in securities are not necessarily an indication of the risk associated with investing in those securities.
The following is a summary of the inputs used in valuing the Portfolio’s assets and liabilities as of November 30, 2023:
| | Other significant
observable inputs
(Level 2) | Significant
unobservable inputs
(Level 3) | |
| | | | |
| | | | |
| | | | |
| | | | |
Corporate bonds and notes | | | | |
| | | | |
Non-agency mortgage-backed securities | | | | |
| | | | |
Yankee corporate bonds and notes | | | | |
| | | | |
| | | | |
| | | | |
Additional sector, industry or geographic detail, if any, is included in the Portfolio of Investments.
At November 30, 2023, the Portfolio did not have any transfers into/out of Level 3.
4.
TRANSACTIONS WITH AFFILIATES
Advisory fee
The Trust has entered into an advisory contract with Allspring Funds Management, a wholly owned subsidiary of Allspring Global Investments Holdings, LLC, a holding company indirectly owned by certain private funds of GTCR LLC and Reverence Capital Partners, L.P. The adviser is responsible for implementing investment policies and guidelines and for supervising the subadviser, who is responsible for day-to-day portfolio management of the Portfolio. Pursuant to the contract, Allspring Funds Management is entitled to receive an advisory fee at the following annual rate based on the Portfolio’s average daily net assets:
30 | Allspring Managed Fixed Income Portfolio
Notes to financial statements (unaudited)
For the six months ended November 30, 2023, the advisory fee was equivalent to an annual rate of 0.40% of the Portfolio’s average daily net assets.
Allspring Funds Management has retained the services of a subadviser to provide daily portfolio management to the Portfolio. The fee for subadvisory services is borne by Allspring Funds Management. Galliard Capital Management, LLC, an affiliate of Allspring Funds Management and a wholly owned subsidiary of Allspring Global Investments Holdings, LLC, is the subadviser to the Portfolio and is entitled to receive a fee from Allspring Funds Management at an annual rate starting at 0.20% and declining to 0.10% as the average daily net assets of the Portfolio increase.
Allspring Funds Management has voluntarily waived and/or reimbursed advisory fees to reduce the net operating expense ratio of the Portfolio. These voluntary waivers may be discontinued at any time.
Interfund transactions
The Portfolio may purchase or sell portfolio investment securities to certain affiliates pursuant to Rule 17a-7 under the 1940 Act and under procedures adopted by the Board of Trustees. The procedures have been designed to ensure that these interfund transactions, which do not incur broker commissions, are effected at current market prices. Pursuant to these procedures, the Portfolio did not have any interfund transactions during the six months ended November 30, 2023.
5.
INVESTMENT PORTFOLIO TRANSACTIONS
Purchases and sales of investments, excluding short-term securities, for the six months ended November 30, 2023 were as follows:
The Trust, along with Allspring Variable Trust and Allspring Funds Trust (excluding the money market funds), are parties to a $350,000,000 revolving credit agreement whereby the Portfolio is permitted to use bank borrowings for temporary or emergency purposes, such as to fund interest holders withdrawal requests. Interest under the credit agreement is charged to the Portfolio based on borrowing rate equal to the higher of the Federal Funds rate or the overnight bank funding rate in effect on that day plus a spread. In addition, an annual commitment fee based on the unused balance is allocated to each participating fund.
For the six months ended November 30, 2023, there were no borrowings by the Portfolio under the agreement.
Under the Portfolio’s organizational documents, the officers and Trustees have been granted certain indemnification rights against certain liabilities that may arise out of performance of their duties to the Portfolio. The Portfolio has entered into a separate agreement with each Trustee that converts indemnification rights currently existing under the Portfolio’s organizational documents into contractual rights that cannot be changed in the future without the consent of the Trustee. Additionally, in the normal course of business, the Portfolio may enter into contracts with service providers that contain a variety of indemnification clauses. The Portfolio’s maximum exposure under these arrangements is dependent on future claims that may be made against the Portfolio and, therefore, cannot be estimated.
Allspring Managed Fixed Income Portfolio | 31
Other information (unaudited)
Other information
Proxy voting information
A description of the policies and procedures used to determine how to vote proxies relating to portfolio securities is available without charge, upon request, by calling 1-866-259-3305, visiting our website at allspringglobal.com, or visiting the SEC website at sec.gov. Information regarding how the proxies related to portfolio securities were voted during the most recent 12-month period ended June 30 is available on the website at allspringglobal.com or by visiting the SEC website at sec.gov.
Quarterly portfolio holdings information
The Portfolio files its complete schedule of portfolio holdings with the SEC for the first and third quarters of each fiscal year as an exhibit to its reports on Form N-PORT. Interest holders may view the filed Form N-PORT by visiting the SEC website at sec.gov.
32 | Allspring Managed Fixed Income Portfolio
Other information (unaudited)
Board of trustees and officers
Each of the Trustees and Officers listed in the table below acts in identical capacities for each fund in the Allspring family of funds, which consists of 126 mutual funds comprising the Allspring Funds Trust, Allspring Variable Trust, Allspring Master Trust and four closed-end funds (collectively the “Fund Complex”). This table should be read in conjunction with the Prospectus and the Statement of Additional Information†. The mailing address of each Trustee and Officer is 1415 Vantage Park Drive, 3rd Floor, Charlotte, NC 28203. Each Trustee and Officer serves an indefinite term, however, each Trustee serves such term until reaching the mandatory retirement age established by the Trustees.
Independent Trustees
| | Principal occupations during past five years or longer | Current other
public company or
investment
company
directorships |
William R. Ebsworth
(Born 1957) | | Retired. From 1984 to 2013, equities analyst, portfolio manager, research director and chief investment officer at Fidelity Management and Research Company in Boston, Tokyo, and Hong Kong, and retired in 2013 as Chief Investment Officer of Fidelity Strategic Advisers, Inc. where he led a team of investment professionals managing client assets. Prior thereto, Board member of Hong Kong Securities Clearing Co., Hong Kong Options Clearing Corp., the Thailand International Fund, Ltd., Fidelity Investments Life Insurance Company, and Empire Fidelity Investments Life Insurance Company. Serves on the Investment Company Institute’s Board of Governors since 2022 and Executive Committee since 2023 as well as the Vice Chairman of the Governing Council of the Independent Directors Council since 2023. Audit Committee Chair and Investment Committee Chair of the Vincent Memorial Hospital Foundation (non-profit organization). Mr. Ebsworth is a CFA charterholder. | |
Jane A. Freeman
(Born 1953) | Trustee,
since 2015;
Chair Liaison,
| Retired. From 2012 to 2014 and 1999 to 2008, Chief Financial Officer of Scientific Learning Corporation. From 2008 to 2012, Ms. Freeman provided consulting services related to strategic business projects. Prior to 1999, Portfolio Manager at Rockefeller & Co. and Scudder, Stevens & Clark. Board member of the Harding Loevner Funds from 1996 to 2014, serving as both Lead Independent Director and chair of the Audit Committee. Board member of the Russell Exchange Traded Funds Trust from 2011 to 2012 and the chair of the Audit Committee. Ms. Freeman is also an inactive Chartered Financial Analyst. | |
Isaiah Harris, Jr.
(Born 1952) | Trustee,
since 2009;
Audit Committee Chair,
since 2019 | Retired. Member of the Advisory Board of CEF of East Central Florida. Chairman of the Board of CIGNA Corporation from 2009 to 2021, and Director from 2005 to 2008. From 2003 to 2011, Director of Deluxe Corporation. Prior thereto, President and CEO of BellSouth Advertising and Publishing Corp. from 2005 to 2007, President and CEO of BellSouth Enterprises from 2004 to 2005 and President of BellSouth Consumer Services from 2000 to 2003. Emeritus member of the Iowa State University Foundation Board of Governors. Emeritus Member of the Advisory board of Iowa State University School of Business. Advisory Board Member, Palm Harbor Academy (private school). Advisory Board Member, Fellowship of Christian Athletes. Mr. Harris is a certified public accountant (inactive status). | |
David F. Larcker
(Born 1950) | | Distinguished Visiting Fellow at the Hoover Institution since 2022. James Irvin Miller Professor of Accounting at the Graduate School of Business (Emeritus), Stanford University, Director of the Corporate Governance Research Initiative and Senior Faculty of The Rock Center for Corporate Governance since 2006. From 2005 to 2008, Professor of Accounting at the Graduate School of Business, Stanford University. Prior thereto, Ernst & Young Professor of Accounting at The Wharton School, University of Pennsylvania from 1985 to 2005. | |
Olivia S. Mitchell
(Born 1953) | | International Foundation of Employee Benefit Plans Professor since 1993, Wharton School of the University of Pennsylvania. Director of Wharton’s Pension Research Council and Boettner Center on Pensions & Retirement Research, and Research Associate at the National Bureau of Economic Research. Previously taught at Cornell University from 1978 to 1993. | |
Timothy J. Penny
(Born 1951) | Trustee,
since 1996;
Chair,
since 2018 | President and Chief Executive Officer of Southern Minnesota Initiative Foundation, a non-profit organization, since 2007. Vice Chair of the Economic Club of Minnesota, since 2007. Co-Chair of the Committee for a Responsible Federal Budget, since 1995. Member of the Board of Trustees of NorthStar Education Finance, Inc., a non-profit organization, from 2007-2022. Senior Fellow of the University of Minnesota Humphrey Institute from 1995 to 2017. | |
* Length of service dates reflect the Trustee’s commencement of service with the Trust’s predecessor entities, where applicable.
# Ms. Freeman will serve as Chair Liaison through June 2024, at which time Ms. Wheelock will assume the role.
†
The Statement of Additional Information includes additional information about the Trustees and is available, without charge, upon request, by calling 1-800-222-8222 or by visiting the website at allspringglobal.com.
Allspring Managed Fixed Income Portfolio | 33
Other information (unaudited)
| Position held and length of service* | Principal occupations during past five years or longer | Current other public company or investment company directorships |
James G. Polisson
(Born 1959) | Trustee,
since 2018; Nominating and Governance Committee Chair, since 2024 | Retired. Chief Marketing Officer, Source (ETF) UK Services, Ltd, from 2015 to 2017. From 2012 to 2015, Principal of The Polisson Group, LLC, a management consulting, corporate advisory and principal investing company. Chief Executive Officer and Managing Director at Russell Investments, Global Exchange Traded Funds from 2010 to 2012. Managing Director of Barclays Global Investors from 1998 to 2010 and Global Chief Marketing Officer for iShares and Barclays Global Investors from 2000 to 2010. Trustee of the San Francisco Mechanics’ Institute, a non- profit organization, from 2013 to 2015. Board member of the Russell Exchange Traded Fund Trust from 2011 to 2012. Director of Barclays Global Investors Holdings Deutschland GmbH from 2006 to 2009. Mr. Polisson is an attorney and has a retired status with the Massachusetts and District of Columbia Bar Associations. | |
Pamela Wheelock
(Born 1959) | Trustee,
since January 2020;
previously Trustee from
January 2018 to
| Retired. Executive and Senior Financial leadership positions in the public, private and nonprofit sectors. Interim President and CEO, McKnight Foundation, 2020. Interim Commissioner, Minnesota Department of Human Services, 2019. Chief Operating Officer, Twin Cities Habitat for Humanity, 2017-2019. Vice President for University Services, University of Minnesota, 2012- 2016. Interim President and CEO, Blue Cross and Blue Shield of Minnesota, 2011-2012. Executive Vice-President and Chief Financial Officer, Minnesota Wild, 2002-2008. Commissioner, Minnesota Department of Finance, 1999-2002. Chair of the Board of Directors of Destination Medical Center Corporation. Board member of the Minnesota Wild Foundation. | |
* Length of service dates reflect the Trustee’s commencement of service with the Trust’s predecessor entities, where applicable.
# Ms. Freeman will serve as Chair Liaison through June 2024, at which time Ms. Wheelock will assume the role.
34 | Allspring Managed Fixed Income Portfolio
Other information (unaudited)
Officers1
| Position held and
length of service | Principal occupations during past five years or longer |
| | President and Chief Executive Officer of Allspring Funds Management, LLC since 2017 and Head of Global Fund Governance of Allspring Global Investments since 2022. Prior thereto, co-president of Galliard Capital Management, LLC, an affiliate of Allspring Funds Management, LLC, from 2019 to 2022 and Head of Affiliated Managers, Allspring Global Investments, from 2014 to 2019 and Executive Vice President responsible for marketing, investments and product development for Allspring Funds Management, LLC, from 2009 to 2014. |
Jeremy DePalma
(Born 1974) | Treasurer,
since 2012
(for certain funds in
the Fund Complex);
since 2021 (for
the remaining funds in the Complex) | Senior Vice President of Allspring Funds Management, LLC since 2009. Senior Vice President of Evergreen Investment Management Company, LLC from 2008 to 2010 and head of the Fund Reporting and Control Team within Fund Administration from 2005 to 2010. |
Christopher Baker
(Born 1976) | Chief Compliance Officer,
since 2022 | Global Chief Compliance Officer for Allspring Global Investments since 2022. Prior thereto, Chief Compliance Officer for State Street Global Advisors from 2018 to 2021. Senior Compliance Officer for the State Street divisions of Alternative Investment Solutions, Sector Solutions, and Global Marketing from 2015 to 2018. From 2010 to 2015 Vice President, Global Head of Investment and Marketing Compliance for State Street Global Advisors. |
Matthew Prasse
(Born 1983) | Chief Legal Officer,
since 2022;
Secretary,
since 2021 | Senior Counsel of the Allspring Legal Department since 2021. Senior Counsel of the Wells Fargo Legal Department from 2018 to 2021. Previously, Counsel for Barings LLC from 2015 to 2018. Prior to joining Barings, Associate at Morgan, Lewis & Bockius LLP from 2008 to 2015. |
1 For those Officers with tenures at Allspring Global Investments and/or Allspring Funds Management, LLC that began prior to 2021, such tenures include years of service during which these businesses/entities were known as Wells Fargo Asset Management and Wells Fargo Funds Management, LLC, respectively.
Allspring Managed Fixed Income Portfolio | 35
This page is intentionally left blank.
For more information
More information about Allspring Funds is available free upon request. To obtain literature, please write, visit the Portfolio’s website, or call:
Allspring Funds
P.O. Box 219967
Kansas City, MO 64121-9967
Website: allspringglobal.com
Individual investors: 1-800-222-8222
Retail investment professionals: 1-888-877-9275
Institutional investment professionals: 1-800-260-5969
This report and the financial statements contained herein are submitted for the general information of the interest holders of the Portfolio. If this report is used for promotional purposes, distribution of the report must be accompanied or preceded by a current prospectus. Before investing, please consider the investment objectives, risks, charges, and expenses of the investment. For a current prospectus and, if available, a summary prospectus, containing this information, call 1-800-222-8222 or visit the Portfolio’s website at allspringglobal.com. Read the prospectus carefully before you invest or send money.
Allspring Global InvestmentsTM is the trade name for the asset management firms of Allspring Global Investments Holdings, LLC, a holding company indirectly owned by certain private funds of GTCR LLC and Reverence Capital Partners, L.P. These firms include but are not limited to Allspring Global Investments, LLC, and Allspring Funds Management, LLC. Certain products managed by Allspring entities are distributed by Allspring Funds Distributor, LLC (a broker-dealer and Member FINRA/SIPC).
This material is for general informational and educational purposes only and is NOT intended to provide investment advice or a recommendation of any kind - including a recommendation for any specific investment, strategy, or plan.
© 2024 Allspring Global Investments Holdings, LLC. All rights reserved.
Allspring Real Return Fund
Semi-Annual Report
November 30, 2023
The views expressed and any forward-looking statements are as of November 30, 2023, unless otherwise noted, and are those of the Fund’s portfolio managers and/or Allspring Global Investments. Discussions of individual securities or the markets generally are not intended as individual recommendations. Future events or results may vary significantly from those expressed in any forward-looking statements. The views expressed are subject to change at any time in response to changing circumstances in the market. Allspring Global Investments disclaims any obligation to publicly update or revise any views expressed or forward-looking statements.
Allspring Real Return Fund | 1
Letter to shareholders (unaudited)
Andrew Owen
President
Allspring Funds
Dear Shareholder:
We are pleased to offer you this semi-annual report for the Allspring Real Return Fund for the six-month period that ended November 30, 2023. Globally, stocks and bonds experienced high levels of volatility during the period. The market was focused on the impact of ongoing aggressive central bank rate hikes on persistently high inflation. As inflation finally gradually declined, anticipation rose over an end to the central bank monetary tightening cycle. For the six-month period, domestic U.S. and global stocks and bonds had positive overall results, with U.S. stocks leading the way. After suffering deep and broad losses through 2022, bonds now benefit from a base of higher yields that can help generate higher income.
For the period, U.S. stocks, based on the S&P 500 Index,1 returned 10.17%. International stocks, as measured by the MSCI ACWI ex USA Index (Net),2 gained 5.07% while the MSCI EM Index (Net) (USD)3 returned 4.60%. Among bond indexes, the Bloomberg U.S. Aggregate Bond Index4 returned -0.80%, the Bloomberg Global Aggregate ex-USD Index (unhedged)5 gained 0.63%, the Bloomberg Municipal Bond Index6 returned 2.29%, and the ICE BofA U.S. High Yield Index7 returned 5.53%.
Affected by high inflation and central bank rate hikes, markets were volatile.
The six-month period began in June with the Federal Reserve’s (Fed’s) first pause on interest rate hikes since March 2022, when it began its aggressive campaign to rein in inflation. However, the Core Consumer Price Index (CPI)8, while continuing to decline, remained stubbornly high in June at 4.8%—well above the Fed’s 2.0% target rate. With the U.S. unemployment rate still at 3.6%, near a historical low, and U.S. payrolls continuing to grow in June, expectations of more Fed rate hikes were reinforced. However, U.S. and global stocks had strong returns in June.
July was a good month for stocks, while bonds had more muted but positive monthly returns overall. More volatile sectors and regions tended to do well, as investors grew more optimistic regarding economic prospects. With strong second quarter gross domestic product growth—initially estimated at 2.4%—and U.S. annual inflation easing steadily to 3.2% in July, hopes for a soft economic landing grew. The Fed, the European Central Bank (ECB), and the Bank of England (BoE) all raised their respective key interest rates by 0.25% in July. In the Fed’s case, speculation grew that it could be very close to the end of its tightening cycle. Meanwhile, China’s economy showed signs of stagnation, renewing concerns of global fallout.
“ With strong
second-quarter gross
domestic product
growth—initially
estimated at 2.4%—and
U.S. annual inflation easing steadily to 3.2%
in July, hopes for a soft
economic landing grew. ”
1
The S&P 500 Index consists of 500 stocks chosen for market size, liquidity, and industry group representation. It is a market-value-weighted index with each stock’s weight in the index proportionate to its market value. You cannot invest directly in an index.
2
The Morgan Stanley Capital International (MSCI) All Country World Index (ACWI) ex USA Index (Net) is a free-float-adjusted market-capitalization-weighted index that is designed to measure the equity market performance of developed and emerging markets, excluding the U.S. Source: MSCI. MSCI makes no express or implied warranties or representations and shall have no liability whatsoever with respect to any MSCI data contained herein. The MSCI data may not be further redistributed or used as a basis for other indexes or any securities or financial products. This report is not approved, reviewed, or produced by MSCI. You cannot invest directly in an index.
3
The MSCI Emerging Markets (EM) Index (Net) (USD) is a free-float-adjusted market-capitalization-weighted index that is designed to measure the equity market performance of emerging markets. You cannot invest directly in an index.
4
The Bloomberg U.S. Aggregate Bond Index is a broad-based benchmark that measures the investment-grade, U.S.-dollar-denominated, fixed-rate taxable bond market, including Treasuries, government-related and corporate securities, mortgage-backed securities (agency fixed-rate and hybrid adjustable-rate mortgage pass-throughs), asset-backed securities, and commercial mortgage-backed securities. You cannot invest directly in an index.
5
The Bloomberg Global Aggregate ex-USD Index (unhedged) is an unmanaged index that provides a broad-based measure of the global investment-grade fixed income markets excluding the U.S.-dollar-denominated debt market. You cannot invest directly in an index.
6
The Bloomberg Municipal Bond Index is an unmanaged index composed of long-term tax-exempt bonds with a minimum credit rating of Baa. You cannot invest directly in an index.
7
The ICE BofA U.S. High Yield Index is a market-capitalization-weighted index of domestic and Yankee high yield bonds. The index tracks the performance of high yield securities traded in the U.S. bond market. You cannot invest directly in an index. Copyright 2024. ICE Data Indices, LLC. All rights reserved.
8
The Core Consumer Price Index (CPI) is a measure of the average change over time in the prices paid by urban consumers for a market basket of consumer goods and services excluding energy and food prices. You cannot invest directly in an index.
2 | Allspring Real Return Fund
Letter to shareholders (unaudited)
Stocks retreated in August while monthly bond returns were flat overall. Increased global market volatility reflected unease over the Chinese property market being stressed along with weak Chinese economic data. However, speculation grew over a possible end to the Fed’s campaign of interest rate increases or at least a pause in September. U.S. economic data generally remained solid, with resilient job market data and inflation ticking up slightly in August, as the annual CPI1 rose 3.7%. However, the three-month trend for Core CPI stood at an annualized 2.4%.
Stocks and bonds both had negative overall returns in September as investors reluctantly recited the new chorus of “higher for longer,” led by the Fed’s determination not to lower interest rates until it knows it has vanquished its pesky opponent—higher-than-targeted inflation. As of September, the two primary gauges of U.S. inflation—the annual Core Personal Consumption Expenditures Price Index2 and the CPI—both stood at roughly 4%, twice as high as the Fed’s oft-stated 2% target. The month ended with the prospect of yet another U.S. government shutdown, averted at least temporarily.
October was a tough month for financial markets overall. Key global indexes were pushed down by rising geopolitical tensions—particularly the Israel-Hamas conflict, and concerns over the Fed’s “higher for longer” monetary policy. The U.S. 10-year Treasury yield rose above 5% for the first time since 2007. Commodity prices did well as oil prices rallied in response to the prospect of oil supply disruptions from the Middle East. U.S. annualized third quarter GDP was estimated at a healthier-than-anticipated 4.9%. China’s GDP indicated surprisingly strong industrial production and retail sales, offset by ongoing weakness in its real estate sector.
In November, the market mood turned positive as cooling inflation inspired confidence that central banks could hold off on further rate hikes. Overall annual inflation in the U.S. fell to 3.1% in November while 12-month inflation in the U.K. and eurozone eased to 4.6% and 2.4%, respectively—far below their peak levels of mid-2022. Third quarter annualized U.S. GDP growth was raised to an estimated 5.2% while U.S. job totals rose by just below 200,000 in November, indicating a slight cooling of the labor market. All of this fresh evidence added to confidence for a U.S. soft economic landing, leading to a more buoyant mood heading into winter as the Federal Open Market Committee held rates steady at its November meeting.
1
The CPI is a measure of the average change over time in the prices paid by urban consumers for a market basket of consumer goods and services. You cannot invest directly in an index.
2
The Core Personal Consumption Expenditures Price Index (PCE) is a measure of prices that people living in the United States, or those buying on their behalf, pay for goods and services. It is sometimes called the core PCE price index, because two categories that can have price swings – food and energy – are left out to make underlying inflation easier to see. You cannot invest directly in an index.
Allspring Real Return Fund | 3
Letter to shareholders (unaudited)
For further information about your fund, contact your investment professional, visit our website at allspringglobal.com, or call us directly at 1-800-222-8222.
Don’t let short-term uncertainty derail long-term investment goals.
Periods of investment uncertainty can present challenges, but experience has taught us that maintaining long-term investment goals can be an effective way to plan for the future. To help you create a sound strategy based on your personal goals and risk tolerance, Allspring Funds offers more than 100 mutual funds spanning a wide range of asset classes and investment styles. Although diversification cannot guarantee an investment profit or prevent losses, we believe it can be an effective way to manage investment risk and potentially smooth out overall portfolio performance. We encourage investors to know their investments and to understand that appropriate levels of risk-taking may unlock opportunities.
Thank you for choosing to invest with Allspring Funds. We appreciate your confidence in us and remain committed to helping you meet your financial needs.
Sincerely,
Andrew Owen
President
Allspring Funds
4 | Allspring Real Return Fund
Letter to shareholders (unaudited)
|
Beginning in July 2024, the Fund will be required by the Securities and Exchange Commission to send shareholders a paper copy of a new tailored shareholder report in place of the full shareholder report that you are now receiving. The tailored shareholder report will contain concise information about the Fund, including certain expense and performance information and fund statistics. If you wish to receive this new tailored shareholder report electronically, please follow the instructions on the back cover of this report. |
Other information that is currently included in the shareholder report, such as the Fund’s financial statements, will be available online and upon request, free of charge, in paper or electronic format. |
Allspring Real Return Fund | 5
Performance highlights (unaudited)
Performance highlights
| The Fund seeks returns that exceed the rate of inflation over the long-term. |
| Allspring Funds Management, LLC |
Subadvisers for the
affiliated master portfolio* | Allspring Global Investments, LLC
Allspring Global Investments (UK) Limited† |
| Kandarp R. Acharya, CFA, FRM††, Rushabh Amin†††, Petros N. Bocray, CFA, FRM, Travis L. Keshemberg, CFA, CIPM, FRM, Matthias Scheiber, CFA††† |
Average annual total returns (%) as of November 30, 2023 |
| | | | |
| | | | | | | | | |
| | | | | | | | | |
| | | | | | | | | |
| | | | | | | | | |
Administrator Class (IPBIX) | | | | | | | | | |
Institutional Class (IPBNX)4 | | | | | | | | | |
| | | | | | | | | |
Bloomberg U.S. Aggregate Bond Index6 | | | | | | | | | |
Real Return Blended Index7 | | | | | | | | | |
| | | | | | | | | |
Bloomberg U.S. TIPS Index9 | | | | | | | | | |
Figures quoted represent past performance, which is no guarantee of future results, and do not reflect taxes that a shareholder may pay on an investment in a fund. Investment return and principal value of an investment will fluctuate so that an investor’s shares, when redeemed, may be worth more or less than their original cost. Performance shown without sales charges would be lower if sales charges were reflected. Current performance may be lower or higher than the performance data quoted, which assumes the reinvestment of dividends and capital gains. Current month-end performance is available on the Fund’s website, allspringglobal.com.
Index returns do not include transaction costs associated with buying and selling securities, any mutual fund fees or expenses, or any taxes. It is not possible to invest directly in an index.
For Class A shares, the maximum front-end sales charge is 4.50%. For Class C shares, the maximum contingent deferred sales charge is 1.00%. Performance including a contingent deferred sales charge assumes the sales charge for the corresponding time period. Class R6, Administrator Class and Institutional Class shares are sold without a front-end sales charge or contingent deferred sales charge.
|
| Reflects the expense ratios as stated in the most recent prospectuses. The expense ratios shown are subject to change and may differ from the annualized expense ratios shown in the Financial Highlights of this report. |
| The manager has contractually committed through September 30, 2025, to waive fees and/or reimburse expenses to the extent necessary to cap total annual fund operating expenses after fee waivers at 0.77% for Class A, 1.52% for Class C, 0.40% for Class R6, 0.60% for Administrator Class and 0.45% for Institutional Class. Brokerage commissions, stamp duty fees, interest, taxes, acquired fund fees and expenses (if any) from funds in which the affiliated master portfolio invests, and extraordinary expenses are excluded from the expense caps. Net expenses from the affiliated master portfolio are included in the expense caps. Prior to or after the commitment expiration date, the caps may be increased or the commitment to maintain the caps may be terminated only with the approval of the Board of Trustees. Without these caps, the Fund’s returns would have been lower. The expense ratio paid by an investor is the net expense ratio (the total annual fund operating expenses after fee waivers) as stated in the prospectuses. |
| Historical performance shown for the Class R6 shares prior to their inception reflects the performance of the Administrator Class shares, and is not adjusted to reflect the Class R6 expenses. If these expenses had been included, returns for the Class R6 shares would be higher. |
| Historical performance shown for the Institutional Class shares prior to their inception reflects the performance of the Administrator Class shares, and includes the higher expenses applicable to the Administrator Class shares. If these expenses had not been included, returns for the Institutional Class shares would be higher. |
| The Fund is a feeder fund in a master-feeder structure that invests substantially all of its assets in a single affiliated master portfolio of the Allspring Master Trust with a substantially identical investment objective and substantially similar investment strategies. References to the investment activities of the Fund are intended to refer to the investment activities of the affiliated master portfolio in which it invests. |
| Allspring Global Investments (UK) Limited became a subadviser effective December 1, 2023. |
| Mr. Acharya has announced his intention to retire from Allspring Global Investments, LLC on February 15, 2024 but will continue to serve as a portfolio manager of the Fund until that date. |
| Mr. Amin and Mr. Scheiber became portfolio managers of the Fund on December 1, 2023. |
CFA® and Chartered Financial Analyst® are trademarks owned by CFA Institute. |
6 | Allspring Real Return Fund
Performance highlights (unaudited)
Footnotes continued from previous page |
| The Russell 3000® Index measures the performance of the 3,000 largest U.S. companies based on total market capitalization, which represents approximately 98% of the investable U.S. equity market. You cannot invest directly in an index. |
| The Bloomberg U.S. Aggregate Bond Index is a broad-based benchmark that measures the investment-grade, U.S.–dollar–denominated, fixed-rate taxable bond market, including Treasuries, government-related and corporate securities, mortgage-backed securities (agency fixed-rate and hybrid adjustable-rate mortgage pass-throughs), asset-backed securities, and commercial mortgage-backed securities. You cannot invest directly in an index. |
| Source: Allspring Funds Management, LLC. The Real Return Blended Index is composed 40% of the Russell 1000® Index, 35% of the Bloomberg U.S. Treasury Inflation Protected Securities (TIPS) Index and 25% of the Bloomberg U.S. Aggregate Bond Index. You cannot invest directly in an index. |
| The Russell 1000® Index measures the performance of the 1,000 largest companies in the Russell 3000® Index, which represents approximately 92% of the total market capitalization of the Russell 3000® Index. You cannot invest directly in an index. |
| The Bloomberg U.S. Treasury Inflation-Protected Securities (TIPS) Index is an index of inflation-indexed-linked U.S. Treasury securities. You cannot invest directly in an index. |
Bond values fluctuate in response to the financial condition of individual issuers, general market and economic conditions, and changes in interest rates. Changes in market conditions and government policies may lead to periods of heightened volatility in the bond market and reduced liquidity for certain bonds held by the Fund. In general, when interest rates rise, bond values fall and investors may lose principal value. Interest rate changes and their impact on the Fund and its share price can be sudden and unpredictable. Stock values fluctuate in response to the activities of individual companies and general market and economic conditions. High-yield securities have a greater risk of default and tend to be more volatile than higher-rated debt securities. Loans are subject to risks similar to those associated with other below-investment-grade bond investments, such as credit risk (for example, risk of issuer default), below-investment-grade bond risk (for example, risk of greater volatility in value), and risk that the loan may become illiquid or difficult to price. The use of derivatives may reduce returns and/or increase volatility. Foreign investments are especially volatile and can rise or fall dramatically due to differences in the political and economic conditions of the host country. These risks are generally intensified in emerging markets. Securities issued by U.S. government agencies or government-sponsored entities may not be guaranteed by the U.S. Treasury. This fund is exposed to mortgage- and asset-backed securities risk and small-company securities risk. Consult the Fund’s prospectus for additional information on these and other risks.
Allspring Real Return Fund | 7
Performance highlights (unaudited)
Ten largest holdings (%) as of November 30, 20231 |
| |
| |
| |
| |
| |
| |
| |
| |
| |
| |
| Each holding represents the Fund’s allocable portion of the affiliated master portfolio security. Figures represent each holding as a percentage of the Fund’s net assets. Holdings are subject to change and may have changed since the date specified. |
Portfolio allocation as of November 30, 20231 |
| Figures represent the portfolio allocation of the affiliated master portfolio as a percentage of the long-term investments of the affiliated master portfolio. Allocations are subject to change and may have changed since the date specified. |
8 | Allspring Real Return Fund
Fund expenses (unaudited)
Fund expenses
As a shareholder of the Fund, you incur two types of costs: (1) transaction costs, including sales charges (loads) on purchase payments and contingent deferred sales charges (if any) on redemptions and (2) ongoing costs, including management fees, distribution (12b-1) and/or shareholder servicing fees, and other Fund expenses. This example is intended to help you understand your ongoing costs (in dollars) of investing in the Fund and to compare these costs with the ongoing costs of investing in other mutual funds.
The example is based on an investment of $1,000 invested at the beginning of the six-month period and held for the entire period from June 1, 2023 to November 30, 2023.
Actual expenses
The “Actual” line of the table below provides information about actual account values and actual expenses. You may use the information in this line, together with the amount you invested, to estimate the expenses that you paid over the period. Simply divide your account value by $1,000 (for example, an $8,600 account value divided by $1,000= 8.6), then multiply the result by the number in the “Actual” line under the heading entitled “Expenses paid during period” for your applicable class of shares to estimate the expenses you paid on your account during this period.
Hypothetical example for comparison purposes
The “Hypothetical” line of the table below provides information about hypothetical account values and hypothetical expenses based on the Fund’s actual expense ratio and an assumed rate of return of 5% per year before expenses, which is not the Fund’s actual return. The hypothetical account values and expenses may not be used to estimate the actual ending account balance or expenses you paid for the period. You may use this information to compare the ongoing costs of investing in the Fund and other funds. To do so, compare this 5% hypothetical example with the 5% hypothetical examples that appear in the shareholder reports of the other funds.
Please note that the expenses shown in the table are meant to highlight your ongoing costs only and do not reflect any transactional costs, such as sales charges (loads) and contingent deferred sales charges. Therefore, the “Hypothetical” line of the table is useful in comparing ongoing costs only, and will not help you determine the relative total costs of owning different funds. In addition, if these transactional costs were included, your costs would have been higher.
| Beginning
account value
6-1-2023 | Ending
account value
11-30-2023 | | |
| | | | |
| | | | |
Hypothetical (5% return before expenses) | | | | |
| | | | |
| | | | |
Hypothetical (5% return before expenses) | | | | |
| | | | |
| | | | |
Hypothetical (5% return before expenses) | | | | |
| | | | |
| | | | |
Hypothetical (5% return before expenses) | | | | |
| | | | |
| | | | |
Hypothetical (5% return before expenses) | | | | |
| Expenses paid is equal to the annualized net expense ratio of each class multiplied by the average account value over the period, multiplied by 183 divided by 366 (to reflect the one-half-year period). |
| Amounts reflect net expenses allocated from the affiliated Master Portfolio in which the Fund invests. |
Allspring Real Return Fund | 9
Portfolio of investments—November 30, 2023 (unaudited)
| | | | | |
Investment companies: 99.83% | | | | | | |
Affiliated master portfolio: 99.83% | | | | | | |
Allspring Real Return Portfolio | | | | | | |
Total investment companies (Cost $76,276,139) | | | | | | |
Total investments in securities (Cost $76,276,139) | | | | | | |
Other assets and liabilities, net | | | | | | |
| | | | | | |
Transactions with the affiliated Master Portfolio were as follows:
| % of
ownership,
beginning
of period | % of
ownership,
end of
period | Net realized
gains
(losses) on
investments
allocated
from
affiliated
Master
Portfolio | Net
change in
unrealized
gains
(losses) on
investments
allocated
from
affiliated
Master
Portfolio | Interest
allocated
from
affiliated
Master
Portfolio | Dividends
allocated
from
affiliated
Master
Portfolio | Affiliated
Income
Allocated
from
affiliated
Master
Portfolio | |
Allspring Real Return Portfolio | | | | | | | | |
The accompanying notes are an integral part of these financial statements.
10 | Allspring Real Return Fund
Statement of assets and liabilities—November 30, 2023 (unaudited)
Financial statements
Statement of assets and liabilities
| |
Investments in affiliated Master Portfolio, at value (cost $76,276,139) | |
Receivable for Fund shares sold | |
| |
Prepaid expenses and other assets | |
| |
| |
Payable for Fund shares redeemed | |
Professional fees payable | |
Shareholder report expenses payable | |
Administration fees payable | |
Shareholder servicing fees payable | |
Trustees’ fees and expenses payable | |
| |
Accrued expenses and other liabilities | |
| |
| |
| |
| |
| |
| |
Computation of net asset value and offering price per share | |
| |
Shares outstanding–Class A1 | |
Net asset value per share–Class A | |
Maximum offering price per share – Class A2 | |
| |
Shares outstanding–Class C1 | |
Net asset value per share–Class C | |
| |
Shares outstanding–Class R61 | |
Net asset value per share–Class R6 | |
Net assets–Administrator Class | |
Shares outstanding–Administrator Class1 | |
Net asset value per share–Administrator Class | |
Net assets–Institutional Class | |
Shares outstanding–Institutional Class1 | |
Net asset value per share–Institutional Class | |
1 The Fund has an unlimited number of authorized shares.
2 Maximum offering price is computed as 100/95.50 of net asset value. On investments of $50,000 or more, the offering price is reduced.
The accompanying notes are an integral part of these financial statements.
Allspring Real Return Fund | 11
Statement of operations—six months ended November 30, 2023 (unaudited)
Statement of operations
| |
Interest allocated from affiliated Master Portfolio | |
Dividends allocated from affiliated Master Portfolio (net of foreign withholding taxes of $1,872) | |
Affiliated income allocated from affiliated Master Portfolio | |
Expenses allocated from affiliated Master Portfolio | |
Waivers allocated from affiliated Master Portfolio | |
| |
| |
| |
| |
| |
| |
| |
| |
| |
Shareholder servicing fees | |
| |
| |
| |
| |
| |
Custody and accounting fees | |
| |
| |
Shareholder report expenses | |
Trustees’ fees and expenses | |
| |
| |
Less: Fee waivers and/or expense reimbursements | |
| |
| |
| |
| |
Realized and unrealized gains (losses) on investments | |
Net realized losses on investments allocated from affiliated Master Portfolio | |
Net change in unrealized gains (losses) on investments allocated from affiliated Master Portfolio | |
Net realized and unrealized gains (losses) on investments | |
Net increase in net assets resulting from operations | |
The accompanying notes are an integral part of these financial statements.
12 | Allspring Real Return Fund
Statement of changes in net assets
Statement of changes in net assets
|
Six months ended
November 30, 2023 (unaudited) | |
| | | | |
| | | | |
Net realized losses on investments | | | | |
Net change in unrealized gains (losses) on investments | | | | |
Net increase (decrease) in net assets resulting from operations | | | | |
Distributions to shareholders from | | | | |
Net investment income and net realized gains | | | | |
| | | | |
| | | | |
| | | | |
| | | | |
| | | | |
Total distributions to shareholders | | | | |
Capital share transactions | | | | |
Proceeds from shares sold | | | | |
| | | | |
| | | | |
| | | | |
| | | | |
| | | | |
| | | | |
Reinvestment of distributions | | | | |
| | | | |
| | | | |
| | | | |
| | | | |
| | | | |
| | | | |
Payment for shares redeemed | | | | |
| | | | |
| | | | |
| | | | |
| | | | |
| | | | |
| | | | |
Net decrease in net assets resulting from capital share transactions | | | | |
Total decrease in net assets | | | | |
| | | | |
| | | | |
| | | | |
The accompanying notes are an integral part of these financial statements.
Allspring Real Return Fund | 13
Financial highlights
(For a share outstanding throughout each period)
| Six months ended
November 30, 2023
(unaudited) | |
| | | | | |
Net asset value, beginning of period | | | | | | |
| | | | | | |
Net realized and unrealized gains (losses) on investments | | | | | | |
Total from investment operations | | | | | | |
Distributions to shareholders from | | | | | | |
| | | | | | |
| | | | | | |
Total distributions to shareholders | | | | | | |
Net asset value, end of period | | | | | | |
| | | | | | |
Ratios to average net assets (annualized)* | | | | | | |
| | | | | | |
| | | | | | |
| | | | | | |
| | | | | | |
| | | | | | |
Net assets, end of period (000s omitted) | | | | | | |
| Ratios include net expenses allocated from the affiliated Master Portfolio which were as follows: |
Six months ended November 30, 2023 (unaudited) | |
| |
| |
| |
| |
| |
| Calculated based upon average shares outstanding |
| Total return calculations do not include any sales charges. Returns for periods of less than one year are not annualized. |
| Portfolio turnover rate is calculated by multiplying the affiliated Master Portfolio’s percentage of the Fund’s total investment in securities at the end of the period by the affiliated Master Portfolio’s portfolio turnover rate. |
The accompanying notes are an integral part of these financial statements.
14 | Allspring Real Return Fund
(For a share outstanding throughout each period)
| Six months ended
November 30, 2023
(unaudited) | |
| | | | | |
Net asset value, beginning of period | | | | | | |
| | | | | | |
Net realized and unrealized gains (losses) on investments | | | | | | |
Total from investment operations | | | | | | |
Distributions to shareholders from | | | | | | |
| | | | | | |
| | | | | | |
Total distributions to shareholders | | | | | | |
Net asset value, end of period | | | | | | |
| | | | | | |
Ratios to average net assets (annualized)* | | | | | | |
| | | | | | |
| | | | | | |
| | | | | | |
| | | | | | |
| | | | | | |
Net assets, end of period (000s omitted) | | | | | | |
| Ratios include net expenses allocated from the affiliated Master Portfolio which were as follows: |
Six months ended November 30, 2023 (unaudited) | |
| |
| |
| |
| |
| |
| Calculated based upon average shares outstanding |
| Total return calculations do not include any sales charges. Returns for periods of less than one year are not annualized. |
| Portfolio turnover rate is calculated by multiplying the affiliated Master Portfolio’s percentage of the Fund’s total investment in securities at the end of the period by the affiliated Master Portfolio’s portfolio turnover rate. |
The accompanying notes are an integral part of these financial statements.
Allspring Real Return Fund | 15
(For a share outstanding throughout each period)
| Six months ended
November 30, 2023
(unaudited) | |
| | | | | |
Net asset value, beginning of period | | | | | | |
| | | | | | |
Net realized and unrealized gains (losses) on investments | | | | | | |
Total from investment operations | | | | | | |
Distributions to shareholders from | | | | | | |
| | | | | | |
| | | | | | |
Total distributions to shareholders | | | | | | |
Net asset value, end of period | | | | | | |
| | | | | | |
Ratios to average net assets (annualized)* | | | | | | |
| | | | | | |
| | | | | | |
| | | | | | |
| | | | | | |
| | | | | | |
Net assets, end of period (000s omitted) | | | | | | |
| Ratios include net expenses allocated from the affiliated Master Portfolio which were as follows: |
Six months ended November 30, 2023 (unaudited) | |
| |
| |
| |
| |
| |
| Calculated based upon average shares outstanding |
| Returns for periods of less than one year are not annualized. |
| Portfolio turnover rate is calculated by multiplying the affiliated Master Portfolio’s percentage of the Fund’s total investment in securities at the end of the period by the affiliated Master Portfolio’s portfolio turnover rate. |
The accompanying notes are an integral part of these financial statements.
16 | Allspring Real Return Fund
(For a share outstanding throughout each period)
| Six months ended
November 30, 2023
(unaudited) | |
| | | | | |
Net asset value, beginning of period | | | | | | |
| | | | | | |
Net realized and unrealized gains (losses) on investments | | | | | | |
Total from investment operations | | | | | | |
Distributions to shareholders from | | | | | | |
| | | | | | |
| | | | | | |
Total distributions to shareholders | | | | | | |
Net asset value, end of period | | | | | | |
| | | | | | |
Ratios to average net assets (annualized)* | | | | | | |
| | | | | | |
| | | | | | |
| | | | | | |
| | | | | | |
| | | | | | |
Net assets, end of period (000s omitted) | | | | | | |
| Ratios include net expenses allocated from the affiliated Master Portfolio which were as follows: |
Six months ended November 30, 2023 (unaudited) | |
| |
| |
| |
| |
| |
| Calculated based upon average shares outstanding |
| Returns for periods of less than one year are not annualized. |
| Portfolio turnover rate is calculated by multiplying the affiliated Master Portfolio’s percentage of the Fund’s total investment in securities at the end of the period by the affiliated Master Portfolio’s portfolio turnover rate. |
The accompanying notes are an integral part of these financial statements.
Allspring Real Return Fund | 17
(For a share outstanding throughout each period)
| Six months ended
November 30, 2023
(unaudited) | |
| | | | | |
Net asset value, beginning of period | | | | | | |
| | | | | | |
Net realized and unrealized gains (losses) on investments | | | | | | |
Total from investment operations | | | | | | |
Distributions to shareholders from | | | | | | |
| | | | | | |
| | | | | | |
Total distributions to shareholders | | | | | | |
Net asset value, end of period | | | | | | |
| | | | | | |
Ratios to average net assets (annualized)* | | | | | | |
| | | | | | |
| | | | | | |
| | | | | | |
| | | | | | |
| | | | | | |
Net assets, end of period (000s omitted) | | | | | | |
| Ratios include net expenses allocated from the affiliated Master Portfolio which were as follows: |
Six months ended November 30, 2023 (unaudited) | |
| |
| |
| |
| |
| |
| Calculated based upon average shares outstanding |
| Returns for periods of less than one year are not annualized. |
| Portfolio turnover rate is calculated by multiplying the affiliated Master Portfolio’s percentage of the Fund’s total investment in securities at the end of the period by the affiliated Master Portfolio’s portfolio turnover rate. |
The accompanying notes are an integral part of these financial statements.
18 | Allspring Real Return Fund
Notes to financial statements (unaudited)
Notes to financial statements
Allspring Funds Trust (the “Trust”), a Delaware statutory trust organized on March 10, 1999, is an open-end management investment company registered under the Investment Company Act of 1940, as amended (the “1940 Act”). As an investment company, the Trust follows the accounting and reporting guidance in Financial Accounting Standards Board (“FASB”) Accounting Standards Codification Topic 946, Financial Services – Investment Companies. These financial statements report on the Allspring Real Return Fund (the “Fund”) which is a diversified series of the Trust.
The Fund is a feeder fund in a master-feeder structure that invests substantially all of its assets in a single master portfolio with a substantially identical investment objective and substantially similar investment strategies. The Fund invests in Allspring Real Return Portfolio, a separate diversified portfolio (the “affiliated Master Portfolio”) of Allspring Master Trust, a registered open-end management investment company. As of November 30, 2023, the Fund owned 31.25% of Allspring Real Return Portfolio. The affiliated Master Portfolio directly acquires portfolio securities and the Fund acquires an indirect interest in those securities. The Fund accounts for its investment in the affiliated Master Portfolio as a partnership investment and records on a daily basis its share of the affiliated Master Portfolio’s income, expense and realized and unrealized gains and losses. The financial statements of the affiliated Master Portfolio for the six months ended November 30, 2023 are included in this report and should be read in conjunction with the Fund’s financial statements.
2.
SIGNIFICANT ACCOUNTING POLICIES
The following significant accounting policies, which are consistently followed in the preparation of the financial statements of the Fund, are in conformity with U.S. generally accepted accounting principles which require management to make estimates and assumptions that affect the reported amounts of assets and liabilities, disclosure of contingent assets and liabilities at the date of the financial statements, and the reported amounts of income and expenses during the reporting period. Actual results could differ from those estimates.
Securities valuation
All investments are valued each business day as of the close of regular trading on the New York Stock Exchange (generally 4 p.m. Eastern Time), although the Fund may deviate from this calculation time under unusual or unexpected circumstances.
Investments in the affiliated Master Portfolio are valued daily based on the Fund’s proportionate share of the affiliated Master Portfolio’s net assets, which are also valued daily.
Investments which are not valued using the method discussed above are valued at their fair value, as determined in good faith by Allspring Funds Management, LLC (“Allspring Funds Management”), which was named the valuation designee by the Board of Trustees. As the valuation designee, Allspring Funds Management is responsible for day-to-day valuation activities for the Allspring Funds. In connection with these responsibilities, Allspring Funds Management has established a Valuation Committee and has delegated to it the authority to take any actions regarding the valuation of portfolio securities that the Valuation Committee deems necessary or appropriate, including determining the fair value of portfolio securities. On a quarterly basis, the Board of Trustees receives reports of valuation actions taken by the Valuation Committee. On at least an annual basis, the Board of Trustees receives an assessment of the adequacy and effectiveness of Allspring Funds Management’s process for determining the fair value of the portfolio of investments.
Investment transactions, income and expenses
Investments in the affiliated Master Portfolio are recorded on a trade date basis. The Fund records daily its proportionate share of the affiliated Master Portfolio’s income, expenses and realized and unrealized gains or losses. The Fund also accrues its own expenses.
Distributions to shareholders
Distributions to shareholders are recorded on the ex-dividend date and paid from net investment income monthly and any net realized gains are paid at least annually. Such distributions are determined in accordance with income tax regulations and may differ from U.S. generally accepted accounting principles. Dividend sources are estimated at the time of declaration. The tax character of distributions is determined as of the Fund’s fiscal year end. Therefore, a portion of the Fund’s distributions made prior to the Fund’s fiscal year end may be categorized as a tax return of capital at year end.
Federal and other taxes
The Fund intends to continue to qualify as a regulated investment company by distributing substantially all of its investment company taxable income and any net realized capital gains (after reduction for capital loss carryforwards) sufficient to relieve it from all, or substantially all, federal income taxes. Accordingly, no provision for federal income taxes was required.
The Fund’s income and federal excise tax returns and all financial records supporting those returns for the are subject to examination by the federal and Delaware revenue authorities. Management has analyzed the Fund’s tax positions taken on federal, state, and foreign tax returns, as applicable, for all open tax years and does not believe that there are any uncertain tax positions that require recognition of a tax liability.
Allspring Real Return Fund | 19
Notes to financial statements (unaudited)
As of November 30, 2023, the aggregate cost of all investments for federal income tax purposes was $76,321,262 and the unrealized gains (losses) consisted of:
As of May 31, 2023, the Fund had capital loss carryforwards which consist of $1,240,076 in short-term capital losses and $151,059 in long-term capital losses.
Class allocations
The separate classes of shares offered by the Fund differ principally in applicable sales charges, distribution, shareholder servicing, and administration fees. Class specific expenses are charged directly to that share class. Investment income, common fund-level expenses, and realized and unrealized gains (losses) on investments are allocated daily to each class of shares based on the relative proportion of net assets of each class.
3.
FAIR VALUATION MEASUREMENTS
At November 30, 2023, the Fund’s investment in the affiliated Master Portfolio was measured at fair value using the net asset value per share (or its equivalent) as a practical expedient. The investment objective and fair value of the affiliated Master Portfolio is as follows:
Affiliated Master Portfolio | | Fair value of affiliated
Master Portfolio |
Allspring Real Return Portfolio | Seeks returns that exceed the rate of inflation over the long-term | |
The affiliated Master Portfolio does not have a redemption period notice, can be redeemed daily and does not have any unfunded commitments.
4.
TRANSACTIONS WITH AFFILIATES
Management fee
Allspring Funds Management, a wholly owned subsidiary of Allspring Global Investments Holdings, LLC, a holding company indirectly owned by certain private funds of GTCR LLC and Reverence Capital Partners, L.P., is the manager of the Fund and provides advisory and fund-level administrative services under an investment management agreement. Under the investment management agreement, Allspring Funds Management is responsible for, among other services, implementing the investment objectives and strategies of the Fund and providing fund-level administrative services in connection with the Fund’s operations. As long as the Fund continues to invest substantially all of its assets in a single affiliated Master Portfolio, the Fund pays Allspring Funds Management an investment management fee only for fund-level administrative services at the following annual rate based on the Fund’s average daily net assets:
For the six months ended November 30, 2023, the management fee was equivalent to an annual rate of 0.05% of the Fund’s average daily net assets.
Allspring Funds Management also serves as the adviser to the affiliated Master Portfolio and is entitled to receive a fee from the affiliated Master Portfolio for those services.
Administration fees
Under a class-level administration agreement, Allspring Funds Management provides class-level administrative services to the Fund, which includes paying fees and expenses for services provided by the transfer agent, sub-transfer agents, omnibus account servicers and record-keepers. As compensation for its services under the class-level administration agreement, Allspring Funds Management receives an annual fee which is calculated based on the average daily net assets of each class as follows:
| Class-level
administration fee |
| |
| |
| |
| |
| |
Prior to June 30, 2023, the class-level administration fee for Class A and Class C was 0.16% of its respective average daily net assets.
20 | Allspring Real Return Fund
Notes to financial statements (unaudited)
Waivers and/or expense reimbursements
Allspring Funds Management has contractually committed to waive and/or reimburse management and administration fees to the extent necessary to maintain certain net operating expense ratios for the Fund. When each class of the Fund has exceeded its expense cap, Allspring Funds Management will waive fees and/or reimburse expenses from fund-level expenses on a proportionate basis and then from class specific expenses. When only certain classes exceed their expense caps, waivers and/or reimbursements are applied against class specific expenses before fund-level expenses. Net expenses from the affiliated Master Portfolio are included in the expense caps. Allspring Funds Management has contractually committed through September 30, 2025 to waive fees and/or reimburse expenses to the extent necessary to cap the Fund’s expenses. Prior to or after the commitment expiration date, the caps may be increased or the commitment to maintain the cap may be terminated only with the approval of the Board of Trustees. As of November 30, 2023, the contractual expense caps are as follows:
Prior to June 30, 2023, the Fund’s expenses were capped at 0.78% for Class A shares and 1.53% for Class C shares.
Distribution fee
The Trust has adopted a distribution plan for Class C shares pursuant to Rule 12b-1 under the 1940 Act. A distribution fee is charged to Class C shares and paid to Allspring Funds Distributor, LLC (“Allspring Funds Distributor”), the principal underwriter, an affiliate of Allspring Funds Management, at an annual rate up to 0.75% of the average daily net assets of Class C shares.
In addition, Allspring Funds Distributor is entitled to receive the front-end sales charge from the purchase of Class A shares and a contingent deferred sales charge on the redemption of certain Class A shares. Allspring Funds Distributor is also entitled to receive the contingent deferred sales charges from redemptions of Class C shares. For the six months ended November 30, 2023, Allspring Funds Distributor received $1,189 from the sale of Class A shares. No contingent deferred sales charges were incurred by Class A and Class C shares for the six months ended November 30, 2023.
Shareholder servicing fees
The Trust has entered into contracts with one or more shareholder servicing agents, whereby Class A, Class C, and Administrator Class are charged a fee at an annual rate up to 0.25% of the average daily net assets of each respective class. A portion of these total shareholder servicing fees were paid to affiliates of the Fund.
5.
INVESTMENT PORTFOLIO TRANSACTIONS
The Fund seeks to achieve its investment objective by investing substantially all of its assets in a single affiliated Master Portfolio. Purchases and sales have been calculated by multiplying the Fund’s ownership percentage of the affiliated Master Portfolio at the end of the period by the affiliated Master Portfolio’s purchases and sales. Purchases and sales of investments, excluding short-term securities, for the six months ended November 30, 2023 were as follows:
The Trust (excluding the money market funds), Allspring Master Trust and Allspring Variable Trust are parties to a $350,000,000 revolving credit agreement whereby the Fund is permitted to use bank borrowings for temporary or emergency purposes, such as to fund shareholder redemption requests. Interest under the credit agreement is charged to the Fund based on borrowing rate equal to the higher of the Federal Funds rate or the overnight bank funding rate in effect on that day plus a spread. In addition, an annual commitment fee based on the unused balance is allocated to each participating fund.
For the six months ended November 30, 2023, there were no borrowings by the Fund under the agreement.
Under the Fund’s organizational documents, the officers and Trustees have been granted certain indemnification rights against certain liabilities that may arise out of performance of their duties to the Fund. The Fund has entered into a separate agreement with each Trustee that converts indemnification rights currently existing under the Fund’s organizational documents into contractual rights that cannot be changed in the future without
Allspring Real Return Fund | 21
Notes to financial statements (unaudited)
the consent of the Trustee. Additionally, in the normal course of business, the Fund may enter into contracts with service providers that contain a variety of indemnification clauses. The Fund’s maximum exposure under these arrangements is dependent on future claims that may be made against the Fund and, therefore, cannot be estimated.
22 | Allspring Real Return Fund
Portfolio of investments—November 30, 2023 (unaudited)
| | | | | |
| | | | | | |
| | | | | | |
| | | | | | |
| | | | | | |
Agnico Eagle Mines Ltd.-U.S. Exchange Traded Shares | | | | | | |
Alamos Gold, Inc. Class A | | | | | | |
| | | | | | |
| | | | | | |
| | | | | | |
| | | | | | |
| | | | | | |
Dundee Precious Metals, Inc. | | | | | | |
| | | | | | |
| | | | | | |
| | | | | | |
| | | | | | |
| | | | | | |
| | | | | | |
| | | | | | |
| | | | | | |
| | | | | | |
Northern Star Resources Ltd. | | | | | | |
| | | | | | |
Osisko Gold Royalties Ltd. | | | | | | |
| | | | | | |
Pan American Silver Corp. | | | | | | |
Pan American Silver Corp.-U.S. Exchange Traded Shares | | | | | | |
| | | | | | |
SilverCrest Metals, Inc.† | | | | | | |
SSR Mining, Inc.-U.S. Exchange Traded Shares | | | | | | |
Torex Gold Resources, Inc.† | | | | | | |
Triple Flag Precious Metals Corp. | | | | | | |
Wheaton Precious Metals Corp. | | | | | | |
| | | | | | |
| | | | | | |
| | | | | | |
| | | | | | |
| | | | | | |
| | | | | | |
| | | | | | |
| | | | | | |
| | | | | | |
Alexandria Real Estate Equities, Inc. | | | | | | |
Residential REITs : 1.12% | | | | | | |
American Homes 4 Rent Class A | | | | | | |
Apartment Income REIT Corp. | | | | | | |
The accompanying notes are an integral part of these financial statements.
Allspring Real Return Portfolio | 23
Portfolio of investments—November 30, 2023 (unaudited)
| | | | | |
Residential REITs (continued) | | | | | | |
| | | | | | |
| | | | | | |
Mid-America Apartment Communities, Inc. | | | | | | |
| | | | | | |
| | | | | | |
| | | | | | |
Federal Realty Investment Trust | | | | | | |
Simon Property Group, Inc. | | | | | | |
| | | | | | |
Specialized REITs : 2.42% | | | | | | |
| | | | | | |
| | | | | | |
Extra Space Storage, Inc. | | | | | | |
Four Corners Property Trust, Inc. | | | | | | |
Gaming & Leisure Properties, Inc. | | | | | | |
| | | | | | |
| | | | | | |
| | | | | | |
Total common stocks (Cost $11,747,712) | | | | | | |
| | | | | |
Corporate bonds and notes: 7.38% | | | | | | |
| | | | | | |
| | | | | | |
Cleveland-Cliffs, Inc.144A | | | | | | |
| | | | | | |
| | | | | | |
| | | | | | |
| | | | | | |
CCO Holdings LLC/CCO Holdings Capital Corp.144A | | | | | | |
Gray Television, Inc.144A | | | | | | |
Sirius XM Radio, Inc.144A | | | | | | |
| | | | | | |
Consumer, cyclical: 2.62% | | | | | | |
| | | | | | |
American Airlines, Inc./AAdvantage Loyalty IP Ltd.144A | | | | | | |
Hawaiian Airlines Pass-Through Certificates Series 2013-1 Class A | | | | | | |
Hawaiian Brand Intellectual Property Ltd./HawaiianMiles Loyalty Ltd.144A | | | | | | |
Mileage Plus Holdings LLC/Mileage Plus Intellectual Property Assets Ltd.144A | | | | | | |
Spirit Loyalty Cayman Ltd./Spirit IP Cayman Ltd.144A | | | | | | |
| | | | | | |
The accompanying notes are an integral part of these financial statements.
24 | Allspring Real Return Portfolio
Portfolio of investments—November 30, 2023 (unaudited)
| | | | | |
| | | | | | |
| | | | | | |
Michael Kors USA, Inc.144A | | | | | | |
| | | | | | |
Auto manufacturers: 0.08% | | | | | | |
Ford Motor Credit Co. LLC | | | | | | |
Auto parts & equipment: 0.09% | | | | | | |
Adient Global Holdings Ltd.144A | | | | | | |
Distribution/wholesale: 0.14% | | | | | | |
G-III Apparel Group Ltd.144A | | | | | | |
| | | | | | |
| | | | | | |
Cedar Fair LP/Canada’s Wonderland Co./Magnum Management Corp./Millennium Op144A | | | | | | |
Churchill Downs, Inc.144A | | | | | | |
| | | | | | |
| | | | | | |
Live Nation Entertainment, Inc.144A | | | | | | |
SeaWorld Parks & Entertainment, Inc.144A | | | | | | |
Six Flags Theme Parks, Inc.144A | | | | | | |
| | | | | | |
| | | | | | |
Tri Pointe Group, Inc./Tri Pointe Homes, Inc. | | | | | | |
| | | | | | |
| | | | | | |
| | | | | | |
Carnival Holdings Bermuda Ltd.144A | | | | | | |
| | | | | | |
| | | | | | |
| | | | | | |
| | | | | | |
Bath & Body Works, Inc.144A | | | | | | |
Dave & Buster’s, Inc.144A | | | | | | |
| | | | | | |
Consumer, non-cyclical: 0.88% | | | | | | |
Commercial services: 0.64% | | | | | | |
Allied Universal Holdco LLC/Allied Universal Finance Corp.144A | | | | | | |
| | | | | | |
Prime Security Services Borrower LLC/Prime Finance, Inc.144A | | | | | | |
| | | | | | |
| | | | | | |
The accompanying notes are an integral part of these financial statements.
Allspring Real Return Portfolio | 25
Portfolio of investments—November 30, 2023 (unaudited)
| | | | | |
| | | | | | |
| | | | | | |
Performance Food Group, Inc.144A | | | | | | |
| | | | | | |
| | | | | | |
Energy-alternate sources: 0.04% | | | | | | |
TerraForm Power Operating LLC144A | | | | | | |
| | | | | | |
Aethon United BR LP/Aethon United Finance Corp.144A | | | | | | |
Antero Resources Corp.144A | | | | | | |
Nabors Industries, Inc.144A | | | | | | |
| | | | | | |
| | | | | | |
Oil & gas services: 0.20% | | | | | | |
Archrock Partners LP/Archrock Partners Finance Corp.144A | | | | | | |
Oceaneering International, Inc.144A | | | | | | |
USA Compression Partners LP/USA Compression Finance Corp. | | | | | | |
| | | | | | |
| | | | | | |
Antero Midstream Partners LP/Antero Midstream Finance Corp.144A | | | | | | |
| | | | | | |
EQM Midstream Partners LP | | | | | | |
Hess Midstream Operations LP144A | | | | | | |
Tallgrass Energy Partners LP/Tallgrass Energy Finance Corp.144A | | | | | | |
Venture Global LNG, Inc.144A | | | | | | |
| | | | | | |
| | | | | | |
Diversified financial services: 0.60% | | | | | | |
| | | | | | |
Nationstar Mortgage Holdings, Inc.144A | | | | | | |
| | | | | | |
| | | | | | |
| | | | | | |
United Wholesale Mortgage LLC144A | | | | | | |
| | | | | | |
| | | | | | |
Ladder Capital Finance Holdings LLLP/Ladder Capital Finance Corp.144A | | | | | | |
MPT Operating Partnership LP/MPT Finance Corp. | | | | | | |
| | | | | | |
| | | | | | |
| | | | | | |
The accompanying notes are an integral part of these financial statements.
26 | Allspring Real Return Portfolio
Portfolio of investments—November 30, 2023 (unaudited)
| | | | | |
| | | | | | |
| | | | | | |
| | | | | | |
Electrical components & equipment: 0.25% | | | | | | |
WESCO Distribution, Inc.144A | | | | | | |
Machinery-diversified: 0.08% | | | | | | |
TK Elevator U.S. Newco, Inc.144A | | | | | | |
Packaging & containers: 0.21% | | | | | | |
Ardagh Metal Packaging Finance USA LLC/Ardagh Metal Packaging Finance PLC144A | | | | | | |
Ardagh Packaging Finance PLC/Ardagh Holdings USA, Inc.144A | | | | | | |
| | | | | | |
Trucking & leasing: 0.21% | | | | | | |
Fortress Transportation & Infrastructure Investors LLC144A | | | | | | |
| | | | | | |
| | | | | | |
NSG Holdings LLC/NSG Holdings, Inc.144A | | | | | | |
Vistra Operations Co. LLC144A | | | | | | |
| | | | | | |
Total corporate bonds and notes (Cost $17,727,322) | | | | | | |
| | | | | | |
| | | | | | |
| | | | | | |
DirecTV Financing LLC (U.S. SOFR 1 Month+5.00%)± | | | | | | |
Consumer, cyclical: 0.25% | | | | | | |
| | | | | | |
Mileage Plus Holdings LLC (U.S. SOFR 3 Month+5.25%)± | | | | | | |
SkyMiles IP Ltd. (U.S. SOFR 3 Month+3.75%)± | | | | | | |
| | | | | | |
| | | | | | |
SeaWorld Parks & Entertainment, Inc. (U.S. SOFR 1 Month+3.00%)± | | | | | | |
| | | | | | |
Carnival Corp. (U.S. SOFR 1 Month+3.00%)± | | | | | | |
Consumer, non-cyclical: 0.06% | | | | | | |
Commercial services: 0.06% | | | | | | |
Geo Group, Inc. (U.S. SOFR 1 Month+7.13%)± | | | | | | |
| | | | | | |
| | | | | | |
GIP II Blue Holding LP (U.S. SOFR 1 Month+4.50%)± | | | | | | |
The accompanying notes are an integral part of these financial statements.
Allspring Real Return Portfolio | 27
Portfolio of investments—November 30, 2023 (unaudited)
| | | | | |
| | | | | | |
| | | | | | |
Asurion LLC (U.S. SOFR 1 Month+3.25%)± | | | | | | |
| | | | | | |
| | | | | | |
Constellation Renewables LLC (U.S. SOFR 3 Month+2.50%)± | | | | | | |
Total loans (Cost $1,207,265) | | | | | | |
U.S. Treasury securities: 19.81% | | | | | | |
| | | | | | |
| | | | | | |
| | | | | | |
| | | | | | |
| | | | | | |
| | | | | | |
| | | | | | |
| | | | | | |
| | | | | | |
| | | | | | |
| | | | | | |
| | | | | | |
| | | | | | |
| | | | | | |
| | | | | | |
| | | | | | |
| | | | | | |
| | | | | | |
| | | | | | |
| | | | | | |
| | | | | | |
Total U.S. Treasury securities (Cost $51,827,923) | | | | | | |
Yankee corporate bonds and notes: 1.24% | | | | | | |
Consumer, cyclical: 0.50% | | | | | | |
| | | | | | |
Air Canada Pass-Through Trust Series 2020-1 Class C144A | | | | | | |
| | | | | | |
| | | | | | |
Royal Caribbean Cruises Ltd.144A | | | | | | |
| | | | | | |
Consumer, non-cyclical: 0.16% | | | | | | |
| | | | | | |
Teva Pharmaceutical Finance Netherlands III BV | | | | | | |
The accompanying notes are an integral part of these financial statements.
28 | Allspring Real Return Portfolio
Portfolio of investments—November 30, 2023 (unaudited)
| | | | | |
| | | | | | |
| | | | | | |
Northriver Midstream Finance LP144A | | | | | | |
| | | | | | |
Diversified financial services: 0.10% | | | | | | |
Macquarie Airfinance Holdings Ltd.144A | | | | | | |
| | | | | | |
| | | | | | |
| | | | | | |
| | | | | | |
| | | | | | |
| | | | | | |
Total yankee corporate bonds and notes (Cost $2,938,942) | | | | | | |
| | | | | |
Short-term investments: 64.11% | | | | | | |
Investment companies: 64.11% | | | | | | |
Allspring Government Money Market Fund Select Class♠∞ | | | | | | |
Total short-term investments (Cost $151,041,184) | | | | | | |
Total investments in securities (Cost $236,490,348) | | | | | | |
Other assets and liabilities, net | | | | | | |
| | | | | | |
| Non-income-earning security |
| The security may be resold in transactions exempt from registration, normally to qualified institutional buyers, pursuant to Rule 144A under the Securities Act of 1933. |
| Variable rate investment. The rate shown is the rate in effect at period end. |
| The issuer of the security is an affiliated person of the Portfolio as defined in the Investment Company Act of 1940. |
| The rate represents the 7-day annualized yield at period end. |
|
| American depositary receipt |
| Real estate investment trust |
| Secured Overnight Financing Rate |
| Treasury Inflation-Protected Securities |
The accompanying notes are an integral part of these financial statements.
Allspring Real Return Portfolio | 29
Portfolio of investments—November 30, 2023 (unaudited)
Investments in affiliates
An affiliated investment is an investment in which the Portfolio owns at least 5% of the outstanding voting shares of the issuer or as a result of other relationships, such as the Portfolio and the issuer having the same adviser or investment manager. Transactions with issuers that were affiliates of the Portfolio at the end of the period were as follows:
| | | | | Net
change in
unrealized
gains
(losses) | | | Income
from
affiliated
securities |
| | | | | | | | |
Allspring Government Money Market Fund Select Class | | | | | | | | |
The accompanying notes are an integral part of these financial statements.
30 | Allspring Real Return Portfolio
Statement of assets and liabilities—November 30, 2023 (unaudited)
Financial statements
Statement of assets and liabilities
| |
Investments in unaffiliated securities, at value (cost $85,449,164) | |
Investments in affiliated securities, at value (cost $151,041,184) | |
| |
Cash at broker segregated for futures contracts | |
Foreign currency, at value (cost $20,832) | |
Receivable for dividends and interest | |
Receivable for investments sold | |
Prepaid expenses and other assets | |
| |
| |
| |
Payable for investments purchased | |
Professional fees payable | |
Custody and accounting fees payable | |
Interest holder report expenses payable | |
Trustees’ fees and expenses payable | |
| |
| |
The accompanying notes are an integral part of these financial statements.
Allspring Real Return Portfolio | 31
Statement of operations—six months ended November 30, 2023 (unaudited)
Statement of operations
| |
| |
Dividends (net of foreign withholdings taxes of $5,760) | |
Income from affiliated securities | |
| |
| |
| |
Custody and accounting fees | |
| |
Interest holder report expenses | |
Trustees’ fees and expenses | |
| |
| |
Less: Fee waivers and/or expense reimbursements | |
| |
| |
Realized and unrealized gains (losses) on investments | |
Net realized gains (losses) on | |
| |
Foreign currency and foreign currency translations | |
| |
Net realized losses on investments | |
Net change in unrealized gains (losses) on | |
| |
Foreign currency and foreign currency translations | |
| |
Net change in unrealized gains (losses) on investments | |
Net realized and unrealized gains (losses) on investments | |
Net increase in net assets resulting from operations | |
The accompanying notes are an integral part of these financial statements.
32 | Allspring Real Return Portfolio
Statement of changes in net assets
Statement of changes in net assets
|
Six months ended
November 30, 2023 (unaudited) | |
| | | | |
| | | | |
Net realized gains (losses) on investments | | | | |
Net change in unrealized gains (losses) on investments | | | | |
Net increase (decrease) in net assets resulting from operations | | | | |
| | | | |
Transactions in investors’ beneficial interests | | | | |
| | | | |
| | | | |
Net increase (decrease) in net assets resulting from capital transactions | | | | |
Total increase (decrease) in net assets | | | | |
| | | | |
| | | | |
| | | | |
The accompanying notes are an integral part of these financial statements.
Allspring Real Return Portfolio | 33
| Six months ended
November 30, 2023
(unaudited) | |
| | | | | |
| | | | | | |
Ratios to average net assets (annualized) | | | | | | |
| | | | | | |
| | | | | | |
| | | | | | |
| | | | | | |
| | | | | | |
| Returns for periods of less than one year are not annualized. |
| Net expense ratios reflect voluntary waivers, if any. |
The accompanying notes are an integral part of these financial statements.
34 | Allspring Real Return Portfolio
Notes to financial statements (unaudited)
Notes to financial statements
Allspring Master Trust (the “Trust”), a Delaware statutory trust organized on March 10, 1999, is an open-end management investment company registered under the Investment Company Act of 1940, as amended (the “1940 Act”). As an investment company, the Trust follows the accounting and reporting guidance in Financial Accounting Standards Board (“FASB”) Accounting Standards Codification Topic 946, Financial Services – Investment Companies. These financial statements report on the Allspring Real Return Portfolio (the “Portfolio”) which is a diversified series of the Trust.
Interests in the Portfolio are available solely through private placement transactions that do not involve any “public offering” within the meaning of Section 4(a)(2) of the Securities Act of 1933.
2.
SIGNIFICANT ACCOUNTING POLICIES
The following significant accounting policies, which are consistently followed in the preparation of the financial statements of the Portfolio, are in conformity with U.S. generally accepted accounting principles which require management to make estimates and assumptions that affect the reported amounts of assets and liabilities, disclosure of contingent assets and liabilities at the date of the financial statements, and the reported amounts of income and expenses during the reporting period. Actual results could differ from those estimates.
Securities valuation
All investments are valued each business day as of the close of regular trading on the New York Stock Exchange (generally 4 p.m. Eastern Time), although the Portfolio may deviate from this calculation time under unusual or unexpected circumstances.
Debt securities are valued at the evaluated bid price provided by an independent pricing service (e.g. taking into account various factors, including yields, maturities, or credit ratings) or, if a reliable price is not available, the quoted bid price from an independent broker-dealer.
Equity securities, exchange-traded funds and futures contracts that are listed on a foreign or domestic exchange or market are valued at the official closing price or, if none, the last sales price.
The values of securities denominated in foreign currencies are translated into U.S. dollars at rates provided by an independent foreign currency pricing source at a time each business day specified by the Valuation Committee at Allspring Funds Management, LLC (“Allspring Funds Management”).
Many securities markets and exchanges outside the U.S. close prior to the close of the New York Stock Exchange and therefore may not fully reflect trading or events that occur after the close of the principal exchange in which the foreign securities are traded, but before the close of the New York Stock Exchange. If such trading or events are expected to materially affect the value of such securities, then fair value pricing procedures implemented by Allspring Funds Management are applied. These procedures take into account multiple factors including movements in U.S. securities markets after foreign exchanges close. Foreign securities that are fair valued under these procedures are categorized as Level 2 and the application of these procedures may result in transfers between Level 1 and Level 2. Depending on market activity, such fair valuations may be frequent. Such fair value pricing may result in net asset values that are higher or lower than net asset values based on the last reported sales price or latest quoted bid price. On November 30, 2023, such fair value pricing was not used in pricing foreign securities.
Investments in registered open-end investment companies (other than those listed on a foreign or domestic exchange or market) are valued at net asset value.
Investments which are not valued using the methods discussed above are valued at their fair value, as determined in good faith by Allspring Funds Management, which was named the valuation designee by the Board of Trustees. As the valuation designee, Allspring Funds Management is responsible for day-to-day valuation activities for the Allspring Funds. In connection with these responsibilities, Allspring Funds Management has established a Valuation Committee and has delegated to it the authority to take any actions regarding the valuation of portfolio securities that the Valuation Committee deems necessary or appropriate, including determining the fair value of portfolio securities. On a quarterly basis, the Board of Trustees receives reports of valuation actions taken by the Valuation Committee. On at least an annual basis, the Board of Trustees receives an assessment of the adequacy and effectiveness of Allspring Funds Management’s process for determining the fair value of the portfolio of investments.
Foreign currency translation
The accounting records of the Portfolio are maintained in U.S. dollars. The values of other assets and liabilities denominated in foreign currencies are translated into U.S. dollars at rates provided by an independent foreign currency pricing source at a time each business day specified by the Valuation Committee. Purchases and sales of securities, and income and expenses are converted at the rate of exchange on the respective dates of such transactions. Net realized foreign exchange gains or losses arise from sales of foreign currencies, currency gains or losses realized between the trade and settlement dates on securities transactions, and the difference between the amounts of dividends, interest and foreign withholding taxes recorded and the U.S. dollar equivalent of the amounts actually paid or received. Net unrealized foreign exchange gains and losses arise from changes in the fair value of assets and liabilities other than investments in securities resulting from changes in exchange rates. The changes in net assets arising from changes in exchange rates of securities and the changes in net assets resulting from changes in market prices of securities are not separately presented. Such changes are included in net realized and unrealized gains or losses from investments.
Allspring Real Return Portfolio | 35
Notes to financial statements (unaudited)
Loans
The Portfolio may invest in direct debt instruments which are interests in amounts owed to lenders by corporate or other borrowers. The loans pay interest at rates which are periodically reset by reference to a base lending rate plus a spread. Investments in loans may be in the form of participations in loans or assignments of all or a portion of loans from third parties. When the Portfolio purchases participations, it generally has no rights to enforce compliance with the terms of the loan agreement with the borrower. As a result, the Portfolio assumes the credit risk of both the borrower and the lender that is selling the participation. When the Portfolio purchases assignments from lenders, it acquires direct rights against the borrower on the loan and may enforce compliance by the borrower with the terms of the loan agreement. Loans may include fully funded term loans or unfunded loan commitments, which are contractual obligations for future funding. Unfunded loan commitments represent the remaining obligation of the Portfolio to the borrower. At any point in time, up to the maturity date of the issue, the borrower may demand the unfunded portion. Unfunded amounts, if any, are marked to market and any unrealized gains or losses are recorded in the Statement of Assets and Liabilities.
Futures contracts
Futures contracts are agreements between the Portfolio and a counterparty to buy or sell a specific amount of a commodity, financial instrument or currency at a specified price and on a specified date. The Portfolio may buy and sell futures contracts in order to gain exposure to, or protect against, changes in interest rates and is subject to interest rate risk. The primary risks associated with the use of futures contracts are the imperfect correlation between changes in market values of securities held by the Portfolio and the prices of futures contracts, and the possibility of an illiquid market. Futures contracts are generally entered into on a regulated futures exchange and cleared through a clearinghouse associated with the exchange. With futures contracts, there is minimal counterparty risk to the Portfolio since futures contracts are exchange-traded and the exchange’s clearinghouse, as the counterparty to all exchange-traded futures, guarantees the futures contracts against default.
Upon entering into a futures contracts, the Portfolio is required to deposit either cash or securities (initial margin) with the broker in an amount equal to a certain percentage of the contract value. Subsequent payments (variation margin) are paid to or received from the broker each day equal to the daily changes in the contract value. Such payments are recorded as unrealized gains or losses and, if any, shown as variation margin receivable (payable) in the Statement of Assets and Liabilities. Should the Portfolio fail to make requested variation margin payments, the broker can gain access to the initial margin to satisfy the Portfolio’s payment obligations. When the contracts are closed, a realized gain or loss is recorded in the Statement of Operations.
Inflation-indexed bonds and TIPS
The Portfolio may invest in inflation-indexed bonds, including Treasury inflation-protected securities (TIPS). Inflation-indexed bonds are fixed income securities whose principal value is periodically adjusted according to the rate of inflation. If the index measuring inflation falls, the principal value of inflation-indexed bonds (other than municipal inflation-indexed bonds and certain corporate inflation-indexed bonds) will be adjusted downward, and consequently the interest payable on these securities (calculated with respect to a smaller principal amount) will be reduced. Repayment of the original bond principal upon maturity (as adjusted for inflation) is guaranteed in the case of U.S. Treasury inflation-indexed bonds. For bonds that do not provide a similar guarantee, the adjusted principal value of the bond repaid at maturity may be less than the original principal. The value of inflation-indexed bonds is expected to change in response to changes in real interest rates. Real interest rates are tied to the relationship between nominal interest rates and the rate of inflation. If nominal interest rates increase at a faster rate than inflation, real interest rates may rise, leading to a decrease in value of inflation-indexed bonds. Inflation-indexed bonds, including TIPS, decline in value when real interest rates rise. In certain interest rate environments, such as when real interest rates are rising faster than nominal interest rates, inflation-indexed bonds may experience greater losses than other fixed income securities with similar durations.
Security transactions and income recognition
Securities transactions are recorded on a trade date basis. Realized gains or losses are recorded on the basis of identified cost.
Interest income is accrued daily and bond discounts are accreted and premiums are amortized daily. To the extent debt obligations are placed on non-accrual status, any related interest income may be reduced by writing off interest receivables when the collection of all or a portion of interest has been determined to be doubtful based on consistently applied procedures and the fair value has decreased. If the issuer subsequently resumes interest payments or when the collectability of interest is reasonably assured, the debt obligation is removed from non-accrual status. Paydown gains and losses are included in interest income.
Dividend income is recognized on the ex-dividend date, except for certain dividends from foreign securities, which are recorded as soon as the custodian verifies the ex-dividend date.
Interest earned on cash balances held at the custodian is recorded as interest income.
Income is recorded net of foreign taxes withheld where recovery of such taxes is not assured.
Distributions received from REIT investments may be characterized as ordinary income, capital gains, or a return of capital to the Portfolio based on information provided by the REIT. The proper characterization of REIT distributions is generally not known until after the end of each calendar year. As such, estimates may be used in reporting the character of income and distributions for financial statement purposes.
36 | Allspring Real Return Portfolio
Notes to financial statements (unaudited)
Federal and other taxes
The Portfolio is not required to pay federal income taxes on its net investment income and net capital gains as it is treated as a partnership for federal income tax purposes. All income, gains and losses of the Portfolio are deemed to have been “passed through” to the interest holders in proportion to their holdings of the Portfolio regardless of whether income and gains have been distributed by the Portfolio.
The Portfolio’s income tax returns and all financial records supporting those returns for the prior three fiscal years are subject to examination by the federal revenue authority. Management has analyzed the Portfolio’s tax positions taken on federal, state, and foreign tax returns, as applicable, for all open tax years and does not believe that there are any uncertain tax positions that require recognition of a tax liability.
As of November 30, 2023, the aggregate cost of all investments for federal income tax purposes was $236,313,680 and the unrealized gains (losses) consisted of:
3.
FAIR VALUATION MEASUREMENTS
Fair value measurements of investments are determined within a framework that has established a fair value hierarchy based upon the various data inputs utilized in determining the value of the Portfolio’s investments. The three-level hierarchy gives the highest priority to unadjusted quoted prices in active markets for identical assets or liabilities (Level 1) and the lowest priority to unobservable inputs (Level 3). The Portfolio’s investments are classified within the fair value hierarchy based on the lowest level of input that is significant to the fair value measurement. The inputs are summarized into three broad levels as follows:
•Level 1—quoted prices in active markets for identical securities
•Level 2—other significant observable inputs (including quoted prices for similar securities, interest rates, prepayment speeds, credit risk, etc.)
•Level 3—significant unobservable inputs (including the Portfolio’s own assumptions in determining the fair value of investments)
The inputs or methodologies used for valuing investments in securities are not necessarily an indication of the risk associated with investing in those securities.
The following is a summary of the inputs used in valuing the Portfolio’s assets and liabilities as of November 30, 2023:
| | Other significant
observable inputs
(Level 2) | Significant
unobservable inputs
(Level 3) | |
| | | | |
| | | | |
| | | | |
| | | | |
| | | | |
Corporate bonds and notes | | | | |
| | | | |
| | | | |
Yankee corporate bonds and notes | | | | |
| | | | |
| | | | |
| | | | |
Additional sector, industry or geographic detail, if any, is included in the Portfolio of Investments.
At November 30, 2023, the Portfolio did not have any transfers into/out of Level 3.
4.
TRANSACTIONS WITH AFFILIATES
Advisory fee
The Trust has entered into an advisory contract with Allspring Funds Management, a wholly owned subsidiary of Allspring Global Investments Holdings, LLC, a holding company indirectly owned by certain private funds of GTCR LLC and Reverence Capital Partners, L.P. The adviser is responsible for implementing investment policies and guidelines and for supervising the subadviser, who is responsible for day-to-day portfolio management of the
Allspring Real Return Portfolio | 37
Notes to financial statements (unaudited)
Portfolio. Pursuant to the contract, Allspring Funds Management is entitled to receive an advisory fee at the following annual rate based on the Portfolio’s average daily net assets:
For the six months ended November 30, 2023, the advisory fee was equivalent to an annual rate of 0.40% of the Portfolio’s average daily net assets.
Allspring Funds Management has retained the services of a subadviser to provide daily portfolio management to the Portfolio. The fee for subadvisory services is borne by Allspring Funds Management. Allspring Global Investments, LLC, an affiliate of Allspring Funds Management and a wholly owned subsidiary of Allspring Global Investments Holdings, LLC, is the subadviser to the Portfolio and is entitled to receive a fee from Allspring Funds Management at an annual rate starting at 0.28% and declining to 0.18% as the average daily net assets of the Portfolio increase.
Allspring Funds Management has voluntarily waived and/or reimbursed advisory fees to reduce the net operating expense ratio of the Portfolio. These voluntary waivers may be discontinued at any time.
Interfund transactions
The Portfolio may purchase or sell portfolio investment securities to certain affiliates pursuant to Rule 17a-7 under the 1940 Act and under procedures adopted by the Board of Trustees. The procedures have been designed to ensure that these interfund transactions, which do not incur broker commissions, are effected at current market prices. Pursuant to these procedures, the Portfolio did not have any interfund transactions during the six months ended November 30, 2023.
5.
INVESTMENT PORTFOLIO TRANSACTIONS
Purchases and sales of investments, excluding short-term securities, for the six months ended November 30, 2023 were as follows:
6.
DERIVATIVE TRANSACTIONS
During the six months ended November 30, 2023, the Portfolio entered into futures contracts to speculate on interest rates and to help manage the duration of the portfolio. The Portfolio had an average notional amount of $6,805,040 in long futures contracts during the six months ended November 30, 2023.
The fair value, realized gains or losses and change in unrealized gains or losses, if any, on derivative instruments are reflected in the corresponding financial statement captions.
The Trust, along with Allspring Variable Trust and Allspring Funds Trust (excluding the money market funds), are parties to a $350,000,000 revolving credit agreement whereby the Portfolio is permitted to use bank borrowings for temporary or emergency purposes, such as to fund interest holders withdrawal requests. Interest under the credit agreement is charged to the Portfolio based on borrowing rate equal to the higher of the Federal Funds rate or the overnight bank funding rate in effect on that day plus a spread. In addition, an annual commitment fee based on the unused balance is allocated to each participating fund.
For the six months ended November 30, 2023, there were no borrowings by the Portfolio under the agreement.
Under the Portfolio’s organizational documents, the officers and Trustees have been granted certain indemnification rights against certain liabilities that may arise out of performance of their duties to the Portfolio. The Portfolio has entered into a separate agreement with each Trustee that converts indemnification rights currently existing under the Portfolio’s organizational documents into contractual rights that cannot be changed in the future without the consent of the Trustee. Additionally, in the normal course of business, the Portfolio may enter into contracts with service providers that contain a variety of indemnification clauses. The Portfolio’s maximum exposure under these arrangements is dependent on future claims that may be made against the Portfolio and, therefore, cannot be estimated.
38 | Allspring Real Return Portfolio
Other information (unaudited)
Other information
Proxy voting information
A description of the policies and procedures used to determine how to vote proxies relating to portfolio securities is available without charge, upon request, by calling 1-866-259-3305, visiting our website at allspringglobal.com, or visiting the SEC website at sec.gov. Information regarding how the proxies related to portfolio securities were voted during the most recent 12-month period ended June 30 is available on the website at allspringglobal.com or by visiting the SEC website at sec.gov.
Quarterly portfolio holdings information
The Fund and Portfolio file their complete schedule of portfolio holdings with the SEC for the first and third quarters of each fiscal year as an exhibit to their reports on Form N-PORT. Shareholders and Interest holders may view the filed Form N-PORT by visiting the SEC website at sec.gov.
Allspring Real Return Fund | 39
Other information (unaudited)
Board of trustees and officers
Each of the Trustees and Officers listed in the table below acts in identical capacities for each fund in the Allspring family of funds, which consists of 126 mutual funds comprising the Allspring Funds Trust, Allspring Variable Trust, Allspring Master Trust and four closed-end funds (collectively the “Fund Complex”). This table should be read in conjunction with the Prospectus and the Statement of Additional Information†. The mailing address of each Trustee and Officer is 1415 Vantage Park Drive, 3rd Floor, Charlotte, NC 28203. Each Trustee and Officer serves an indefinite term, however, each Trustee serves such term until reaching the mandatory retirement age established by the Trustees.
Independent Trustees
| | Principal occupations during past five years or longer | Current other
public company or
investment
company
directorships |
William R. Ebsworth
(Born 1957) | | Retired. From 1984 to 2013, equities analyst, portfolio manager, research director and chief investment officer at Fidelity Management and Research Company in Boston, Tokyo, and Hong Kong, and retired in 2013 as Chief Investment Officer of Fidelity Strategic Advisers, Inc. where he led a team of investment professionals managing client assets. Prior thereto, Board member of Hong Kong Securities Clearing Co., Hong Kong Options Clearing Corp., the Thailand International Fund, Ltd., Fidelity Investments Life Insurance Company, and Empire Fidelity Investments Life Insurance Company. Serves on the Investment Company Institute’s Board of Governors since 2022 and Executive Committee since 2023 as well as the Vice Chairman of the Governing Council of the Independent Directors Council since 2023. Audit Committee Chair and Investment Committee Chair of the Vincent Memorial Hospital Foundation (non-profit organization). Mr. Ebsworth is a CFA charterholder. | |
Jane A. Freeman
(Born 1953) | Trustee,
since 2015;
Chair Liaison,
| Retired. From 2012 to 2014 and 1999 to 2008, Chief Financial Officer of Scientific Learning Corporation. From 2008 to 2012, Ms. Freeman provided consulting services related to strategic business projects. Prior to 1999, Portfolio Manager at Rockefeller & Co. and Scudder, Stevens & Clark. Board member of the Harding Loevner Funds from 1996 to 2014, serving as both Lead Independent Director and chair of the Audit Committee. Board member of the Russell Exchange Traded Funds Trust from 2011 to 2012 and the chair of the Audit Committee. Ms. Freeman is also an inactive Chartered Financial Analyst. | |
Isaiah Harris, Jr.
(Born 1952) | Trustee,
since 2009;
Audit Committee Chair,
since 2019 | Retired. Member of the Advisory Board of CEF of East Central Florida. Chairman of the Board of CIGNA Corporation from 2009 to 2021, and Director from 2005 to 2008. From 2003 to 2011, Director of Deluxe Corporation. Prior thereto, President and CEO of BellSouth Advertising and Publishing Corp. from 2005 to 2007, President and CEO of BellSouth Enterprises from 2004 to 2005 and President of BellSouth Consumer Services from 2000 to 2003. Emeritus member of the Iowa State University Foundation Board of Governors. Emeritus Member of the Advisory board of Iowa State University School of Business. Advisory Board Member, Palm Harbor Academy (private school). Advisory Board Member, Fellowship of Christian Athletes. Mr. Harris is a certified public accountant (inactive status). | |
David F. Larcker
(Born 1950) | | Distinguished Visiting Fellow at the Hoover Institution since 2022. James Irvin Miller Professor of Accounting at the Graduate School of Business (Emeritus), Stanford University, Director of the Corporate Governance Research Initiative and Senior Faculty of The Rock Center for Corporate Governance since 2006. From 2005 to 2008, Professor of Accounting at the Graduate School of Business, Stanford University. Prior thereto, Ernst & Young Professor of Accounting at The Wharton School, University of Pennsylvania from 1985 to 2005. | |
Olivia S. Mitchell
(Born 1953) | | International Foundation of Employee Benefit Plans Professor since 1993, Wharton School of the University of Pennsylvania. Director of Wharton’s Pension Research Council and Boettner Center on Pensions & Retirement Research, and Research Associate at the National Bureau of Economic Research. Previously taught at Cornell University from 1978 to 1993. | |
Timothy J. Penny
(Born 1951) | Trustee,
since 1996;
Chair,
since 2018 | President and Chief Executive Officer of Southern Minnesota Initiative Foundation, a non-profit organization, since 2007. Vice Chair of the Economic Club of Minnesota, since 2007. Co-Chair of the Committee for a Responsible Federal Budget, since 1995. Member of the Board of Trustees of NorthStar Education Finance, Inc., a non-profit organization, from 2007-2022. Senior Fellow of the University of Minnesota Humphrey Institute from 1995 to 2017. | |
* Length of service dates reflect the Trustee’s commencement of service with the Trust’s predecessor entities, where applicable.
# Ms. Freeman will serve as Chair Liaison through June 2024, at which time Ms. Wheelock will assume the role.
†
The Statement of Additional Information includes additional information about the Trustees and is available, without charge, upon request, by calling 1-800-222-8222 or by visiting the website at allspringglobal.com.
40 | Allspring Real Return Fund
Other information (unaudited)
| Position held and length of service* | Principal occupations during past five years or longer | Current other public company or investment company directorships |
James G. Polisson
(Born 1959) | Trustee,
since 2018; Nominating and Governance Committee Chair, since 2024 | Retired. Chief Marketing Officer, Source (ETF) UK Services, Ltd, from 2015 to 2017. From 2012 to 2015, Principal of The Polisson Group, LLC, a management consulting, corporate advisory and principal investing company. Chief Executive Officer and Managing Director at Russell Investments, Global Exchange Traded Funds from 2010 to 2012. Managing Director of Barclays Global Investors from 1998 to 2010 and Global Chief Marketing Officer for iShares and Barclays Global Investors from 2000 to 2010. Trustee of the San Francisco Mechanics’ Institute, a non- profit organization, from 2013 to 2015. Board member of the Russell Exchange Traded Fund Trust from 2011 to 2012. Director of Barclays Global Investors Holdings Deutschland GmbH from 2006 to 2009. Mr. Polisson is an attorney and has a retired status with the Massachusetts and District of Columbia Bar Associations. | |
Pamela Wheelock
(Born 1959) | Trustee,
since January 2020;
previously Trustee from
January 2018 to
| Retired. Executive and Senior Financial leadership positions in the public, private and nonprofit sectors. Interim President and CEO, McKnight Foundation, 2020. Interim Commissioner, Minnesota Department of Human Services, 2019. Chief Operating Officer, Twin Cities Habitat for Humanity, 2017-2019. Vice President for University Services, University of Minnesota, 2012- 2016. Interim President and CEO, Blue Cross and Blue Shield of Minnesota, 2011-2012. Executive Vice-President and Chief Financial Officer, Minnesota Wild, 2002-2008. Commissioner, Minnesota Department of Finance, 1999-2002. Chair of the Board of Directors of Destination Medical Center Corporation. Board member of the Minnesota Wild Foundation. | |
* Length of service dates reflect the Trustee’s commencement of service with the Trust’s predecessor entities, where applicable.
# Ms. Freeman will serve as Chair Liaison through June 2024, at which time Ms. Wheelock will assume the role.
Allspring Real Return Fund | 41
Other information (unaudited)
Officers1
| Position held and
length of service | Principal occupations during past five years or longer |
| | President and Chief Executive Officer of Allspring Funds Management, LLC since 2017 and Head of Global Fund Governance of Allspring Global Investments since 2022. Prior thereto, co-president of Galliard Capital Management, LLC, an affiliate of Allspring Funds Management, LLC, from 2019 to 2022 and Head of Affiliated Managers, Allspring Global Investments, from 2014 to 2019 and Executive Vice President responsible for marketing, investments and product development for Allspring Funds Management, LLC, from 2009 to 2014. |
Jeremy DePalma
(Born 1974) | Treasurer,
since 2012
(for certain funds in
the Fund Complex);
since 2021 (for
the remaining funds in the Complex) | Senior Vice President of Allspring Funds Management, LLC since 2009. Senior Vice President of Evergreen Investment Management Company, LLC from 2008 to 2010 and head of the Fund Reporting and Control Team within Fund Administration from 2005 to 2010. |
Christopher Baker
(Born 1976) | Chief Compliance Officer,
since 2022 | Global Chief Compliance Officer for Allspring Global Investments since 2022. Prior thereto, Chief Compliance Officer for State Street Global Advisors from 2018 to 2021. Senior Compliance Officer for the State Street divisions of Alternative Investment Solutions, Sector Solutions, and Global Marketing from 2015 to 2018. From 2010 to 2015 Vice President, Global Head of Investment and Marketing Compliance for State Street Global Advisors. |
Matthew Prasse
(Born 1983) | Chief Legal Officer,
since 2022;
Secretary,
since 2021 | Senior Counsel of the Allspring Legal Department since 2021. Senior Counsel of the Wells Fargo Legal Department from 2018 to 2021. Previously, Counsel for Barings LLC from 2015 to 2018. Prior to joining Barings, Associate at Morgan, Lewis & Bockius LLP from 2008 to 2015. |
1 For those Officers with tenures at Allspring Global Investments and/or Allspring Funds Management, LLC that began prior to 2021, such tenures include years of service during which these businesses/entities were known as Wells Fargo Asset Management and Wells Fargo Funds Management, LLC, respectively.
42 | Allspring Real Return Fund
This page is intentionally left blank.
This page is intentionally left blank.
For more information
More information about Allspring Funds is available free upon request. To obtain literature, please write, visit the Fund’s website, or call:
Allspring Funds
P.O. Box 219967
Kansas City, MO 64121-9967
Website: allspringglobal.com
Individual investors: 1-800-222-8222
Retail investment professionals: 1-888-877-9275
Institutional investment professionals: 1-800-260-5969
This report and the financial statements contained herein are submitted for the general information of the shareholders of the Fund. If this report is used for promotional purposes, distribution of the report must be accompanied or preceded by a current prospectus. Before investing, please consider the investment objectives, risks, charges, and expenses of the investment. For a current prospectus and, if available, a summary prospectus, containing this information, call 1-800-222-8222 or visit the Fund’s website at allspringglobal.com. Read the prospectus carefully before you invest or send money.
Allspring Global InvestmentsTM is the trade name for the asset management firms of Allspring Global Investments Holdings, LLC, a holding company indirectly owned by certain private funds of GTCR LLC and Reverence Capital Partners, L.P. These firms include but are not limited to Allspring Global Investments, LLC, and Allspring Funds Management, LLC. Certain products managed by Allspring entities are distributed by Allspring Funds Distributor, LLC (a broker-dealer and Member FINRA/SIPC).
This material is for general informational and educational purposes only and is NOT intended to provide investment advice or a recommendation of any kind - including a recommendation for any specific investment, strategy, or plan.
© 2024 Allspring Global Investments Holdings, LLC. All rights reserved.
ALL-12052023-b7pyzk8p 01-24
SAR1753 11-23
Allspring Small Company Growth Fund
Semi-Annual Report
November 30, 2023
The views expressed and any forward-looking statements are as of November 30, 2023, unless otherwise noted, and are those of the Fund’s portfolio managers and/or Allspring Global Investments. Discussions of individual securities or the markets generally are not intended as individual recommendations. Future events or results may vary significantly from those expressed in any forward-looking statements. The views expressed are subject to change at any time in response to changing circumstances in the market. Allspring Global Investments disclaims any obligation to publicly update or revise any views expressed or forward-looking statements.
Allspring Small Company Growth Fund | 1
Letter to shareholders (unaudited)
Andrew Owen
President
Allspring Funds
Dear Shareholder:
We are pleased to offer you this semi-annual report for the Allspring Small Company Growth Fund for the six-month period that ended November 30, 2023. Globally, stocks and bonds experienced high levels of volatility during the period. The market was focused on the impact of ongoing aggressive central bank rate hikes on persistently high inflation. As inflation finally gradually declined, anticipation rose over an end to the central bank monetary tightening cycle. For the six-month period, domestic U.S. and global stocks and bonds had positive overall results, with U.S. stocks leading the way. After suffering deep and broad losses through 2022, bonds now benefit from a base of higher yields that can help generate higher income.
For the period, U.S. stocks, based on the S&P 500 Index,1 returned 10.17%. International stocks, as measured by the MSCI ACWI ex USA Index (Net),2 gained 5.07% while the MSCI EM Index (Net) (USD)3 returned 4.60%. Among bond indexes, the Bloomberg U.S. Aggregate Bond Index4 returned -0.80%, the Bloomberg Global Aggregate ex-USD Index (unhedged)5 gained 0.63%, the Bloomberg Municipal Bond Index6 returned 2.29%, and the ICE BofA U.S. High Yield Index7 returned 5.53%.
Affected by high inflation and central bank rate hikes, markets were volatile.
The six-month period began in June with the Federal Reserve’s (Fed’s) first pause on interest rate hikes since March 2022, when it began its aggressive campaign to rein in inflation. However, the Core Consumer Price Index (CPI)8, while continuing to decline, remained stubbornly high in June at 4.8%—well above the Fed’s 2.0% target rate. With the U.S. unemployment rate still at 3.6%, near a historical low, and U.S. payrolls continuing to grow in June, expectations of more Fed rate hikes were reinforced. However, U.S. and global stocks had strong returns in June.
July was a good month for stocks, while bonds had more muted but positive monthly returns overall. More volatile sectors and regions tended to do well, as investors grew more optimistic regarding economic prospects. With strong second quarter gross domestic product growth—initially estimated at 2.4%—and U.S. annual inflation easing steadily to 3.2% in July, hopes for a soft economic landing grew. The Fed, the European Central Bank (ECB), and the Bank of England (BoE) all raised their respective key interest rates by 0.25% in July. In the Fed’s case, speculation grew that it could be very close to the end of its tightening cycle. Meanwhile, China’s economy showed signs of stagnation, renewing concerns of global fallout.
1
The S&P 500 Index consists of 500 stocks chosen for market size, liquidity, and industry group representation. It is a market-value-weighted index with each stock’s weight in the index proportionate to its market value. You cannot invest directly in an index.
2
The Morgan Stanley Capital International (MSCI) All Country World Index (ACWI) ex USA Index (Net) is a free-float-adjusted market-capitalization-weighted index that is designed to measure the equity market performance of developed and emerging markets, excluding the U.S. Source: MSCI. MSCI makes no express or implied warranties or representations and shall have no liability whatsoever with respect to any MSCI data contained herein. The MSCI data may not be further redistributed or used as a basis for other indexes or any securities or financial products. This report is not approved, reviewed, or produced by MSCI. You cannot invest directly in an index.
3
The MSCI Emerging Markets (EM) Index (Net) (USD) is a free-float-adjusted market-capitalization-weighted index that is designed to measure the equity market performance of emerging markets. You cannot invest directly in an index.
4
The Bloomberg U.S. Aggregate Bond Index is a broad-based benchmark that measures the investment-grade, U.S.-dollar-denominated, fixed-rate taxable bond market, including Treasuries, government-related and corporate securities, mortgage-backed securities (agency fixed-rate and hybrid adjustable-rate mortgage pass-throughs), asset-backed securities, and commercial mortgage-backed securities. You cannot invest directly in an index.
5
The Bloomberg Global Aggregate ex-USD Index (unhedged) is an unmanaged index that provides a broad-based measure of the global investment-grade fixed income markets excluding the U.S.-dollar-denominated debt market. You cannot invest directly in an index.
6
The Bloomberg Municipal Bond Index is an unmanaged index composed of long-term tax-exempt bonds with a minimum credit rating of Baa. You cannot invest directly in an index.
7
The ICE BofA U.S. High Yield Index is a market-capitalization-weighted index of domestic and Yankee high yield bonds. The index tracks the performance of high yield securities traded in the U.S. bond market. You cannot invest directly in an index. Copyright 2024. ICE Data Indices, LLC. All rights reserved.
8
The Core Consumer Price Index (CPI) is a measure of the average change over time in the prices paid by urban consumers for a market basket of consumer goods and services excluding energy and food prices. You cannot invest directly in an index.
2 | Allspring Small Company Growth Fund
Letter to shareholders (unaudited)
“ With strong
second-quarter gross
domestic product
growth—initially
estimated at 2.4%—and
U.S. annual inflation easing steadily to 3.2%
in July, hopes for a soft
economic landing grew. ”
Stocks retreated in August while monthly bond returns were flat overall. Increased global market volatility reflected unease over the Chinese property market being stressed along with weak Chinese economic data. However, speculation grew over a possible end to the Fed’s campaign of interest rate increases or at least a pause in September. U.S. economic data generally remained solid, with resilient job market data and inflation ticking up slightly in August, as the annual CPI1 rose 3.7%. However, the three-month trend for Core CPI stood at an annualized 2.4%.
Stocks and bonds both had negative overall returns in September as investors reluctantly recited the new chorus of “higher for longer,” led by the Fed’s determination not to lower interest rates until it knows it has vanquished its pesky opponent—higher-than-targeted inflation. As of September, the two primary gauges of U.S. inflation—the annual Core Personal Consumption Expenditures Price Index2 and the CPI—both stood at roughly 4%, twice as high as the Fed’s oft-stated 2% target. The month ended with the prospect of yet another U.S. government shutdown, averted at least temporarily.
October was a tough month for financial markets overall. Key global indexes were pushed down by rising geopolitical tensions—particularly the Israel-Hamas conflict, and concerns over the Fed’s “higher for longer” monetary policy. The U.S. 10-year Treasury yield rose above 5% for the first time since 2007. Commodity prices did well as oil prices rallied in response to the prospect of oil supply disruptions from the Middle East. U.S. annualized third quarter GDP was estimated at a healthier-than-anticipated 4.9%. China’s GDP indicated surprisingly strong industrial production and retail sales, offset by ongoing weakness in its real estate sector.
In November, the market mood turned positive as cooling inflation inspired confidence that central banks could hold off on further rate hikes. Overall annual inflation in the U.S. fell to 3.1% in November while 12-month inflation in the U.K. and eurozone eased to 4.6% and 2.4%, respectively—far below their peak levels of mid-2022. Third quarter annualized U.S. GDP growth was raised to an estimated 5.2% while U.S. job totals rose by just below 200,000 in November, indicating a slight cooling of the labor market. All of this fresh evidence added to confidence for a U.S. soft economic landing, leading to a more buoyant mood heading into winter as the Federal Open Market Committee held rates steady at its November meeting.
1
The CPI is a measure of the average change over time in the prices paid by urban consumers for a market basket of consumer goods and services. You cannot invest directly in an index.
2
The Core Personal Consumption Expenditures Price Index (PCE) is a measure of prices that people living in the United States, or those buying on their behalf, pay for goods and services. It is sometimes called the core PCE price index, because two categories that can have price swings – food and energy – are left out to make underlying inflation easier to see. You cannot invest directly in an index.
Allspring Small Company Growth Fund | 3
Letter to shareholders (unaudited)
For further information about your fund, contact your investment professional, visit our website at allspringglobal.com, or call us directly at 1-800-222-8222.
Don’t let short-term uncertainty derail long-term investment goals.
Periods of investment uncertainty can present challenges, but experience has taught us that maintaining long-term investment goals can be an effective way to plan for the future. To help you create a sound strategy based on your personal goals and risk tolerance, Allspring Funds offers more than 100 mutual funds spanning a wide range of asset classes and investment styles. Although diversification cannot guarantee an investment profit or prevent losses, we believe it can be an effective way to manage investment risk and potentially smooth out overall portfolio performance. We encourage investors to know their investments and to understand that appropriate levels of risk-taking may unlock opportunities.
Thank you for choosing to invest with Allspring Funds. We appreciate your confidence in us and remain committed to helping you meet your financial needs.
Sincerely,
Andrew Owen
President
Allspring Funds
4 | Allspring Small Company Growth Fund
Letter to shareholders (unaudited)
|
Beginning in July 2024, the Fund will be required by the Securities and Exchange Commission to send shareholders a paper copy of a new tailored shareholder report in place of the full shareholder report that you are now receiving. The tailored shareholder report will contain concise information about the Fund, including certain expense and performance information and fund statistics. If you wish to receive this new tailored shareholder report electronically, please follow the instructions on the back cover of this report. |
Other information that is currently included in the shareholder report, such as the Fund’s financial statements, will be available online and upon request, free of charge, in paper or electronic format. |
Allspring Small Company Growth Fund | 5
Performance highlights (unaudited)
Performance highlights
| The Fund seeks long-term capital appreciation. |
| Allspring Funds Management, LLC |
Subadviser for the affiliated master portfolio* | Peregrine Capital Management, LLC |
| William A. Grierson, CFA, Paul E. von Kuster, CFA, Allison Lewis, CFA†, Ryan H. Smith, CFA, Samuel D. Smith, CFA |
Average annual total returns (%) as of November 30, 2023 |
| | | | |
| | | | | | | | | |
| | | | | | | | | |
| | | | | | | | | |
| | | | | | | | | |
Administrator Class (NVSCX) | | | | | | | | | |
Institutional Class (WSCGX) | | | | | | | | | |
| | | | | | | | | |
Russell 2000® Growth Index5 | | | | | | | | | |
Figures quoted represent past performance, which is no guarantee of future results, and do not reflect taxes that a shareholder may pay on an investment in a fund. Investment return and principal value of an investment will fluctuate so that an investor’s shares, when redeemed, may be worth more or less than their original cost. Performance shown without sales charges would be lower if sales charges were reflected. Current performance may be lower or higher than the performance data quoted, which assumes the reinvestment of dividends and capital gains. Current month-end performance is available on the Fund’s website, allspringglobal.com.
Index returns do not include transaction costs associated with buying and selling securities, any mutual fund fees or expenses, or any taxes. It is not possible to invest directly in an index.
For Class A shares, the maximum front-end sales charge is 5.75%. For Class C shares, the maximum contingent deferred sales charge is 1.00%. Performance including a contingent deferred sales charge assumes the sales charge for the corresponding time period. Class R6, Administrator Class and Institutional Class shares are sold without a front-end sales charge or contingent deferred sales charge.
|
| Reflects the expense ratios as stated in the most recent prospectuses. The expense ratios shown are subject to change and may differ from the annualized expense ratios shown in the Financial Highlights of this report. |
| The manager has contractually committed through September 30, 2024, to waive fees and/or reimburse expenses to the extent necessary to cap total annual fund operating expenses after fee waivers at 1.28% for Class A, 2.03% for Class C, 0.86% for Class R6, 1.19% for Administrator Class and 0.94% for Institutional Class. Brokerage commissions, stamp duty fees, interest, taxes, acquired fund fees and expenses (if any) from funds in which the affiliated master portfolio invests, and extraordinary expenses are excluded from the expense caps. Net expenses from the affiliated master portfolio are included in the expense caps. Prior to or after the commitment expiration date, the caps may be increased or the commitment to maintain the caps may be terminated only with the approval of the Board of Trustees. Without these caps, the Fund’s returns would have been lower. The expense ratio paid by an investor is the net expense ratio (the total annual fund operating expenses after fee waivers) as stated in the prospectuses. |
| Historical performance shown for the Class R6 shares prior to their inception reflects the performance of the Institutional Class shares, and includes the higher expenses applicable to the Institutional Class shares. If these expenses had not been included, returns for the Class R6 shares would be higher. |
| The Russell 3000® Index measures the performance of the 3,000 largest U.S. companies based on total market capitalization, which represents approximately 98% of the investable U.S. equity market. You cannot invest directly in an index. |
| The Russell 2000® Growth Index measures the performance of those Russell 2000 companies with higher price/book ratios and higher forecasted growth values. You cannot invest directly in an index. |
Stock values fluctuate in response to the activities of individual companies and general market and economic conditions. Smaller-company stocks tend to be more volatile and less liquid than those of larger companies. Certain investment strategies tend to increase the total risk of an investment (relative to the broader market). This fund is exposed to foreign investment risk. Consult the Fund’s prospectus for additional information on these and other risks.
| The Fund is a feeder fund in a master-feeder structure that invests substantially all of its assets in a single affiliated master portfolio of the Allspring Master Trust with a substantially identical investment objective and substantially similar investment strategies. References to the investment activities of the Fund are intended to refer to the investment activities of the affiliated master portfolio in which it invests. |
| Ms. Lewis became a portfolio manager of the Fund on June 30, 2023. |
CFA® and Chartered Financial Analyst® are trademarks owned by CFA Institute. |
6 | Allspring Small Company Growth Fund
Performance highlights (unaudited)
Ten largest holdings (%) as of November 30, 20231 |
| |
| |
| |
| |
International Game Technology PLC | |
| |
| |
SS&C Technologies Holdings, Inc. | |
| |
| |
| Each holding represents the Fund’s allocable portion of the affiliated master portfolio security. Figures represent each holding as a percentage of the Fund’s net assets. Holdings are subject to change and may have changed since the date specified. |
Sector allocation as of November 30, 20231 |
| Figures represent the sector allocation of the affiliated master portfolio as a percentage of the long-term investments of the affiliated master portfolio. Allocations are subject to change and may have changed since the date specified. |
Allspring Small Company Growth Fund | 7
Fund expenses (unaudited)
Fund expenses
As a shareholder of the Fund, you incur two types of costs: (1) transaction costs, including sales charges (loads) on purchase payments and contingent deferred sales charges (if any) on redemptions and (2) ongoing costs, including management fees, distribution (12b-1) and/or shareholder servicing fees, and other Fund expenses. This example is intended to help you understand your ongoing costs (in dollars) of investing in the Fund and to compare these costs with the ongoing costs of investing in other mutual funds.
The example is based on an investment of $1,000 invested at the beginning of the six-month period and held for the entire period from June 1, 2023 to November 30, 2023.
Actual expenses
The “Actual” line of the table below provides information about actual account values and actual expenses. You may use the information in this line, together with the amount you invested, to estimate the expenses that you paid over the period. Simply divide your account value by $1,000 (for example, an $8,600 account value divided by $1,000= 8.6), then multiply the result by the number in the “Actual” line under the heading entitled “Expenses paid during period” for your applicable class of shares to estimate the expenses you paid on your account during this period.
Hypothetical example for comparison purposes
The “Hypothetical” line of the table below provides information about hypothetical account values and hypothetical expenses based on the Fund’s actual expense ratio and an assumed rate of return of 5% per year before expenses, which is not the Fund’s actual return. The hypothetical account values and expenses may not be used to estimate the actual ending account balance or expenses you paid for the period. You may use this information to compare the ongoing costs of investing in the Fund and other funds. To do so, compare this 5% hypothetical example with the 5% hypothetical examples that appear in the shareholder reports of the other funds.
Please note that the expenses shown in the table are meant to highlight your ongoing costs only and do not reflect any transactional costs, such as sales charges (loads) and contingent deferred sales charges. Therefore, the “Hypothetical” line of the table is useful in comparing ongoing costs only, and will not help you determine the relative total costs of owning different funds. In addition, if these transactional costs were included, your costs would have been higher.
| Beginning
account value
6-1-2023 | Ending
account value
11-30-2023 | | |
| | | | |
| | | | |
Hypothetical (5% return before expenses) | | | | |
| | | | |
| | | | |
Hypothetical (5% return before expenses) | | | | |
| | | | |
| | | | |
Hypothetical (5% return before expenses) | | | | |
| | | | |
| | | | |
Hypothetical (5% return before expenses) | | | | |
| | | | |
| | | | |
Hypothetical (5% return before expenses) | | | | |
| Expenses paid is equal to the annualized net expense ratio of each class multiplied by the average account value over the period, multiplied by 183 divided by 366 (to reflect the one-half-year period). |
| Amounts reflect net expenses allocated from the affiliated Master Portfolio in which the Fund invests. |
8 | Allspring Small Company Growth Fund
Portfolio of investments—November 30, 2023 (unaudited)
| | | | | |
Investment companies: 99.94% | | | | | | |
Affiliated master portfolio: 99.94% | | | | | | |
Allspring Small Company Growth Portfolio | | | | | | |
Total investment companies (Cost $356,675,551) | | | | | | |
Total investments in securities (Cost $356,675,551) | | | | | | |
Other assets and liabilities, net | | | | | | |
| | | | | | |
Transactions with the affiliated Master Portfolio were as follows:
| % of
ownership,
beginning
of period | % of
ownership,
end of
period | Net realized
gains
(losses) on
investments
allocated
from
affiliated
Master
Portfolio | Net
change in
unrealized
gains
(losses) on
investments
allocated
from
affiliated
Master
Portfolio | Dividends
allocated
from
affiliated
Master
Portfolio | Interest
allocated
from
affiliated
Master
Portfolio | Affiliated
Income
Allocated
from
affiliated
Master
Portfolio | |
Allspring Small Company Growth Portfolio | | | | | | | | |
The accompanying notes are an integral part of these financial statements.
Allspring Small Company Growth Fund | 9
Statement of assets and liabilities—November 30, 2023 (unaudited)
Financial statements
Statement of assets and liabilities
| |
Investments in affiliated Master Portfolio, at value (cost $356,675,551) | |
Receivable for Fund shares sold | |
| |
Prepaid expenses and other assets | |
| |
| |
Payable for Fund shares redeemed | |
Administration fees payable | |
Trustees’ fees and expenses payable | |
| |
Accrued expenses and other liabilities | |
| |
| |
| |
| |
Total distributable earnings | |
| |
Computation of net asset value and offering price per share | |
| |
Shares outstanding–Class A1 | |
Net asset value per share–Class A | |
Maximum offering price per share – Class A2 | |
| |
Shares outstanding–Class C1 | |
Net asset value per share–Class C | |
| |
Shares outstanding–Class R61 | |
Net asset value per share–Class R6 | |
Net assets–Administrator Class | |
Shares outstanding–Administrator Class1 | |
Net asset value per share–Administrator Class | |
Net assets–Institutional Class | |
Shares outstanding–Institutional Class1 | |
Net asset value per share–Institutional Class | |
1 The Fund has an unlimited number of authorized shares.
2 Maximum offering price is computed as 100/94.25 of net asset value. On investments of $50,000 or more, the offering price is reduced.
The accompanying notes are an integral part of these financial statements.
10 | Allspring Small Company Growth Fund
Statement of operations—six months ended November 30, 2023 (unaudited)
Statement of operations
| |
Dividends allocated from affiliated Master Portfolio (net of foreign withholding taxes of $4,391) | |
Affiliated income allocated from affiliated Master Portfolio | |
Interest allocated from affiliated Master Portfolio | |
Expenses allocated from affiliated Master Portfolio | |
| |
| |
| |
| |
| |
| |
| |
| |
| |
Shareholder servicing fees | |
| |
| |
| |
| |
| |
Custody and accounting fees | |
| |
| |
Shareholder report expenses | |
Trustees’ fees and expenses | |
| |
| |
Less: Fee waivers and/or expense reimbursements | |
| |
| |
| |
| |
| |
| |
Realized and unrealized gains (losses) on investments | |
Net realized gains on investments allocated from affiliated Master Portfolio | |
Net change in unrealized gains (losses) on investments allocated from affiliated Master Portfolio | |
Net realized and unrealized gains (losses) on investments | |
Net increase in net assets resulting from operations | |
The accompanying notes are an integral part of these financial statements.
Allspring Small Company Growth Fund | 11
Statement of changes in net assets
Statement of changes in net assets
|
Six months ended
November 30, 2023 (unaudited) | |
| | | | |
| | | | |
Net realized gains on investments | | | | |
Net change in unrealized gains (losses) on investments | | | | |
Net increase (decrease) in net assets resulting from operations | | | | |
Distributions to shareholders from | | | | |
Net investment income and net realized gains | | | | |
| | | | |
| | | | |
| | | | |
| | | | |
| | | | |
Total distributions to shareholders | | | | |
Capital share transactions | | | | |
Proceeds from shares sold | | | | |
| | | | |
| | | | |
| | | | |
| | | | |
| | | | |
| | | | |
Reinvestment of distributions | | | | |
| | | | |
| | | | |
| | | | |
| | | | |
| | | | |
| | | | |
Payment for shares redeemed | | | | |
| | | | |
| | | | |
| | | | |
| | | | |
| | | | |
| | | | |
Net decrease in net assets resulting from capital share transactions | | | | |
Total decrease in net assets | | | | |
| | | | |
| | | | |
| | | | |
The accompanying notes are an integral part of these financial statements.
12 | Allspring Small Company Growth Fund
Financial highlights
(For a share outstanding throughout each period)
| Six months ended
November 30, 2023
(unaudited) | |
| | | | | |
Net asset value, beginning of period | | | | | | |
| | | | | | |
Net realized and unrealized gains (losses) on investments | | | | | | |
Total from investment operations | | | | | | |
Distributions to shareholders from | | | | | | |
| | | | | | |
Net asset value, end of period | | | | | | |
| | | | | | |
Ratios to average net assets (annualized)* | | | | | | |
| | | | | | |
| | | | | | |
| | | | | | |
| | | | | | |
| | | | | | |
Net assets, end of period (000s omitted) | | | | | | |
| Ratios include net expenses allocated from the affiliated Master Portfolio which were as follows: |
Six months ended November 30, 2023 (unaudited) | |
| |
| |
| |
| |
| |
| Calculated based upon average shares outstanding |
| Total return calculations do not include any sales charges. Returns for periods of less than one year are not annualized. |
| Portfolio turnover rate is calculated by multiplying the affiliated Master Portfolio’s percentage of the Fund’s total investment in securities at the end of the period by the affiliated Master Portfolio’s portfolio turnover rate. |
The accompanying notes are an integral part of these financial statements.
Allspring Small Company Growth Fund | 13
(For a share outstanding throughout each period)
| Six months ended
November 30, 2023
(unaudited) | |
| | | | | |
Net asset value, beginning of period | | | | | | |
| | | | | | |
Net realized and unrealized gains (losses) on investments | | | | | | |
Total from investment operations | | | | | | |
Distributions to shareholders from | | | | | | |
| | | | | | |
Net asset value, end of period | | | | | | |
| | | | | | |
Ratios to average net assets (annualized)* | | | | | | |
| | | | | | |
| | | | | | |
| | | | | | |
| | | | | | |
| | | | | | |
Net assets, end of period (000s omitted) | | | | | | |
| Ratios include net expenses allocated from the affiliated Master Portfolio which were as follows: |
Six months ended November 30, 2023 (unaudited) | |
| |
| |
| |
| |
| |
| Calculated based upon average shares outstanding |
| Total return calculations do not include any sales charges. Returns for periods of less than one year are not annualized. |
| Portfolio turnover rate is calculated by multiplying the affiliated Master Portfolio’s percentage of the Fund’s total investment in securities at the end of the period by the affiliated Master Portfolio’s portfolio turnover rate. |
The accompanying notes are an integral part of these financial statements.
14 | Allspring Small Company Growth Fund
(For a share outstanding throughout each period)
| Six months ended
November 30, 2023
(unaudited) | |
| | | | | |
Net asset value, beginning of period | | | | | | |
| | | | | | |
Net realized and unrealized gains (losses) on investments | | | | | | |
Total from investment operations | | | | | | |
Distributions to shareholders from | | | | | | |
| | | | | | |
Net asset value, end of period | | | | | | |
| | | | | | |
Ratios to average net assets (annualized)* | | | | | | |
| | | | | | |
| | | | | | |
| | | | | | |
| | | | | | |
| | | | | | |
Net assets, end of period (000s omitted) | | | | | | |
| Ratios include net expenses allocated from the affiliated Master Portfolio which were as follows: |
Six months ended November 30, 2023 (unaudited) | |
| |
| |
| |
| |
| |
| Calculated based upon average shares outstanding |
| Returns for periods of less than one year are not annualized. |
| Portfolio turnover rate is calculated by multiplying the affiliated Master Portfolio’s percentage of the Fund’s total investment in securities at the end of the period by the affiliated Master Portfolio’s portfolio turnover rate. |
The accompanying notes are an integral part of these financial statements.
Allspring Small Company Growth Fund | 15
(For a share outstanding throughout each period)
| Six months ended
November 30, 2023
(unaudited) | |
| | | | | |
Net asset value, beginning of period | | | | | | |
| | | | | | |
Net realized and unrealized gains (losses) on investments | | | | | | |
Total from investment operations | | | | | | |
Distributions to shareholders from | | | | | | |
| | | | | | |
Net asset value, end of period | | | | | | |
| | | | | | |
Ratios to average net assets (annualized)* | | | | | | |
| | | | | | |
| | | | | | |
| | | | | | |
| | | | | | |
| | | | | | |
Net assets, end of period (000s omitted) | | | | | | |
| Ratios include net expenses allocated from the affiliated Master Portfolio which were as follows: |
Six months ended November 30, 2023 (unaudited) | |
| |
| |
| |
| |
| |
| Calculated based upon average shares outstanding |
| Returns for periods of less than one year are not annualized. |
| Portfolio turnover rate is calculated by multiplying the affiliated Master Portfolio’s percentage of the Fund’s total investment in securities at the end of the period by the affiliated Master Portfolio’s portfolio turnover rate. |
The accompanying notes are an integral part of these financial statements.
16 | Allspring Small Company Growth Fund
(For a share outstanding throughout each period)
| Six months ended
November 30, 2023
(unaudited) | |
| | | | | |
Net asset value, beginning of period | | | | | | |
| | | | | | |
Net realized and unrealized gains (losses) on investments | | | | | | |
Total from investment operations | | | | | | |
Distributions to shareholders from | | | | | | |
| | | | | | |
Net asset value, end of period | | | | | | |
| | | | | | |
Ratios to average net assets (annualized)* | | | | | | |
| | | | | | |
| | | | | | |
| | | | | | |
| | | | | | |
| | | | | | |
Net assets, end of period (000s omitted) | | | | | | |
| Ratios include net expenses allocated from the affiliated Master Portfolio which were as follows: |
Six months ended November 30, 2023 (unaudited) | |
| |
| |
| |
| |
| |
| Calculated based upon average shares outstanding |
| Returns for periods of less than one year are not annualized. |
| Portfolio turnover rate is calculated by multiplying the affiliated Master Portfolio’s percentage of the Fund’s total investment in securities at the end of the period by the affiliated Master Portfolio’s portfolio turnover rate. |
The accompanying notes are an integral part of these financial statements.
Allspring Small Company Growth Fund | 17
Notes to financial statements (unaudited)
Notes to financial statements
Allspring Funds Trust (the “Trust”), a Delaware statutory trust organized on March 10, 1999, is an open-end management investment company registered under the Investment Company Act of 1940, as amended (the “1940 Act”). As an investment company, the Trust follows the accounting and reporting guidance in Financial Accounting Standards Board (“FASB”) Accounting Standards Codification Topic 946, Financial Services – Investment Companies. These financial statements report on the Allspring Small Company Growth Fund (the “Fund”) which is a diversified series of the Trust.
The Fund is a feeder fund in a master-feeder structure that invests substantially all of its assets in a single master portfolio with a substantially identical investment objective and substantially similar investment strategies. The Fund invests in Allspring Small Company Growth Portfolio, a separate diversified portfolio (the “affiliated Master Portfolio”) of Allspring Master Trust, a registered open-end management investment company. As of November 30, 2023, the Fund owned 96.41% of Allspring Small Company Growth Portfolio. The affiliated Master Portfolio directly acquires portfolio securities and the Fund acquires an indirect interest in those securities. The Fund accounts for its investment in the affiliated Master Portfolio as a partnership investment and records on a daily basis its share of the affiliated Master Portfolio’s income, expense and realized and unrealized gains and losses. The financial statements of the affiliated Master Portfolio for the six months ended November 30, 2023 are included in this report and should be read in conjunction with the Fund’s financial statements.
2.
SIGNIFICANT ACCOUNTING POLICIES
The following significant accounting policies, which are consistently followed in the preparation of the financial statements of the Fund, are in conformity with U.S. generally accepted accounting principles which require management to make estimates and assumptions that affect the reported amounts of assets and liabilities, disclosure of contingent assets and liabilities at the date of the financial statements, and the reported amounts of income and expenses during the reporting period. Actual results could differ from those estimates.
Securities valuation
All investments are valued each business day as of the close of regular trading on the New York Stock Exchange (generally 4 p.m. Eastern Time), although the Fund may deviate from this calculation time under unusual or unexpected circumstances.
Investments in the affiliated Master Portfolio are valued daily based on the Fund’s proportionate share of the affiliated Master Portfolio’s net assets, which are also valued daily.
Investments which are not valued using the method discussed above are valued at their fair value, as determined in good faith by Allspring Funds Management, LLC (“Allspring Funds Management”), which was named the valuation designee by the Board of Trustees. As the valuation designee, Allspring Funds Management is responsible for day-to-day valuation activities for the Allspring Funds. In connection with these responsibilities, Allspring Funds Management has established a Valuation Committee and has delegated to it the authority to take any actions regarding the valuation of portfolio securities that the Valuation Committee deems necessary or appropriate, including determining the fair value of portfolio securities. On a quarterly basis, the Board of Trustees receives reports of valuation actions taken by the Valuation Committee. On at least an annual basis, the Board of Trustees receives an assessment of the adequacy and effectiveness of Allspring Funds Management’s process for determining the fair value of the portfolio of investments.
Investment transactions, income and expenses
Investments in the affiliated Master Portfolio are recorded on a trade date basis. The Fund records daily its proportionate share of the affiliated Master Portfolio’s income, expenses and realized and unrealized gains or losses. The Fund also accrues its own expenses.
Distributions to shareholders
Distributions to shareholders from net investment income and any net realized gains are recorded on the ex-dividend date and paid at least annually. Such distributions are determined in accordance with income tax regulations and may differ from U.S. generally accepted accounting principles. Dividend sources are estimated at the time of declaration. The tax character of distributions is determined as of the Fund’s fiscal year end. Therefore, a portion of the Fund’s distributions made prior to the Fund’s fiscal year end may be categorized as a tax return of capital at year end.
Federal and other taxes
The Fund intends to continue to qualify as a regulated investment company by distributing substantially all of its investment company taxable income and any net realized capital gains (after reduction for capital loss carryforwards) sufficient to relieve it from all, or substantially all, federal income taxes. Accordingly, no provision for federal income taxes was required.
The Fund’s income and federal excise tax returns and all financial records supporting those returns for the prior three fiscal years are subject to examination by the federal and Delaware revenue authorities. Management has analyzed the Fund’s tax positions taken on federal, state, and foreign tax returns, as applicable, for all open tax years and does not believe that there are any uncertain tax positions that require recognition of a tax liability.
18 | Allspring Small Company Growth Fund
Notes to financial statements (unaudited)
As of November 30, 2023, the aggregate cost of all investments for federal income tax purposes was $372,082,423 and the unrealized gains (losses) consisted of:
As of May 31, 2023, the Fund had a qualified late-year ordinary loss of $950,497 which was recognized on the first day of the current fiscal year.
Class allocations
The separate classes of shares offered by the Fund differ principally in applicable sales charges, distribution, shareholder servicing, and administration fees. Class specific expenses are charged directly to that share class. Investment income, common fund-level expenses, and realized and unrealized gains (losses) on investments are allocated daily to each class of shares based on the relative proportion of net assets of each class.
3.
FAIR VALUATION MEASUREMENTS
At November 30, 2023, the Fund’s investment in the affiliated Master Portfolio was measured at fair value using the net asset value per share (or its equivalent) as a practical expedient. The investment objective and fair value of the affiliated Master Portfolio is as follows:
Affiliated Master Portfolio | | Fair value of affiliated
Master Portfolio |
Allspring Small Company Growth Portfolio | Seek long-term capital appreciation | |
The affiliated Master Portfolio does not have a redemption period notice, can be redeemed daily and does not have any unfunded commitments.
4.
TRANSACTIONS WITH AFFILIATES
Management fee
Allspring Funds Management, a wholly owned subsidiary of Allspring Global Investments Holdings, LLC, a holding company indirectly owned by certain private funds of GTCR LLC and Reverence Capital Partners, L.P., is the manager of the Fund and provides advisory and fund-level administrative services under an investment management agreement. Under the investment management agreement, Allspring Funds Management is responsible for, among other services, implementing the investment objectives and strategies of the Fund and providing fund-level administrative services in connection with the Fund’s operations. As long as the Fund continues to invest substantially all of its assets in a single affiliated Master Portfolio, the Fund pays Allspring Funds Management an investment management fee only for fund-level administrative services at the following annual rate based on the Fund’s average daily net assets:
For the six months ended November 30, 2023, the management fee was equivalent to an annual rate of 0.05% of the Fund’s average daily net assets.
Allspring Funds Management also serves as the adviser to the affiliated Master Portfolio and is entitled to receive a fee from the affiliated Master Portfolio for those services.
Administration fees
Under a class-level administration agreement, Allspring Funds Management provides class-level administrative services to the Fund, which includes paying fees and expenses for services provided by the transfer agent, sub-transfer agents, omnibus account servicers and record-keepers. As compensation for its services under the class-level administration agreement, Allspring Funds Management receives an annual fee which is calculated based on the average daily net assets of each class as follows:
| Class-level
administration fee |
| |
| |
| |
| |
| |
Prior to June 30, 2023, the class-level administration fee for Class A and Class C was 0.21% of its respective average daily net assets.
Allspring Small Company Growth Fund | 19
Notes to financial statements (unaudited)
Waivers and/or expense reimbursements
Allspring Funds Management has contractually committed to waive and/or reimburse management and administration fees to the extent necessary to maintain certain net operating expense ratios for the Fund. When each class of the Fund has exceeded its expense cap, Allspring Funds Management will waive fees and/or reimburse expenses from fund-level expenses on a proportionate basis and then from class specific expenses. When only certain classes exceed their expense caps, waivers and/or reimbursements are applied against class specific expenses before fund-level expenses. Net expenses from the affiliated Master Portfolio are included in the expense caps. Allspring Funds Management has contractually committed through September 30, 2024 to waive fees and/or reimburse expenses to the extent necessary to cap the Fund’s expenses. Prior to or after the commitment expiration date, the caps may be increased or the commitment to maintain the cap may be terminated only with the approval of the Board of Trustees. As of November 30, 2023, the contractual expense caps are as follows:
Prior to June 30, 2023, the Fund’s expenses were capped at 1.29% for Class A shares and 2.04% for Class C shares ..
Distribution fee
The Trust has adopted a distribution plan for Class C shares pursuant to Rule 12b-1 under the 1940 Act. A distribution fee is charged to Class C shares and paid to Allspring Funds Distributor, LLC (“Allspring Funds Distributor”), the principal underwriter, an affiliate of Allspring Funds Management, at an annual rate up to 0.75% of the average daily net assets of Class C shares.
In addition, Allspring Funds Distributor is entitled to receive the front-end sales charge from the purchase of Class A shares and a contingent deferred sales charge on the redemption of certain Class A shares. Allspring Funds Distributor is also entitled to receive the contingent deferred sales charges from redemptions of Class C shares. For the six months ended November 30, 2023, Allspring Funds Distributor received $566 from the sale of Class A shares. No contingent deferred sales charges were incurred by Class A and Class C shares for the six months ended November 30, 2023.
Shareholder servicing fees
The Trust has entered into contracts with one or more shareholder servicing agents, whereby Class A, Class C, and Administrator Class are charged a fee at an annual rate up to 0.25% of the average daily net assets of each respective class. A portion of these total shareholder servicing fees were paid to affiliates of the Fund.
5.
INVESTMENT PORTFOLIO TRANSACTIONS
The Fund seeks to achieve its investment objective by investing substantially all of its assets in the affiliated Master Portfolio. Purchases and sales have been calculated by multiplying the Fund’s ownership percentage of the affiliated Master Portfolio at the end of the period by the affiliated Master Portfolio’s purchases and sales. Purchases and sales of investments, excluding U.S. government obligations (if any) and short-term securities, for the six months ended November 30, 2023 were $164,094,575 and $396,585,550, respectively.
The Trust (excluding the money market funds), Allspring Master Trust and Allspring Variable Trust are parties to a $350,000,000 revolving credit agreement whereby the Fund is permitted to use bank borrowings for temporary or emergency purposes, such as to fund shareholder redemption requests. Interest under the credit agreement is charged to the Fund based on borrowing rate equal to the higher of the Federal Funds rate or the overnight bank funding rate in effect on that day plus a spread. In addition, an annual commitment fee based on the unused balance is allocated to each participating fund.
For the six months ended November 30, 2023, there were no borrowings by the Fund under the agreement.
Concentration risks result from exposure to a limited number of sectors. Through its investment in the affiliated Master Portfolio which may invest a substantial portion of its assets in any sector, the Fund may in turn be more affected by changes in that sector than a fund whose investments are not heavily weighted in any sectors. As of the end of the period, the Master Portfolio concentrated its portfolio in investments related to the industrials sector.
Under the Fund’s organizational documents, the officers and Trustees have been granted certain indemnification rights against certain liabilities that may arise out of performance of their duties to the Fund. The Fund has entered into a separate agreement with each Trustee that converts indemnification rights currently existing under the Fund’s organizational documents into contractual rights that cannot be changed in the future without
20 | Allspring Small Company Growth Fund
Notes to financial statements (unaudited)
the consent of the Trustee. Additionally, in the normal course of business, the Fund may enter into contracts with service providers that contain a variety of indemnification clauses. The Fund’s maximum exposure under these arrangements is dependent on future claims that may be made against the Fund and, therefore, cannot be estimated.
Allspring Small Company Growth Fund | 21
Portfolio of investments—November 30, 2023 (unaudited)
| | | | | |
| | | | | | |
Communication services: 0.35% | | | | | | |
| | | | | | |
Lions Gate Entertainment Corp. Class B† | | | | | | |
Consumer discretionary: 8.67% | | | | | | |
Automobile components: 0.45% | | | | | | |
Fox Factory Holding Corp.† | | | | | | |
| | | | | | |
Ollie’s Bargain Outlet Holdings, Inc.† | | | | | | |
Hotels, restaurants & leisure: 2.63% | | | | | | |
| | | | | | |
International Game Technology PLC | | | | | | |
Papa John’s International, Inc. | | | | | | |
| | | | | | |
Household durables: 0.78% | | | | | | |
| | | | | | |
| | | | | | |
Topgolf Callaway Brands Corp.† | | | | | | |
| | | | | | |
Academy Sports & Outdoors, Inc. | | | | | | |
Boot Barn Holdings, Inc.† | | | | | | |
| | | | | | |
| | | | | | |
| | | | | | |
| | | | | | |
| | | | | | |
Consumer staples distribution & retail : 1.30% | | | | | | |
Performance Food Group Co.† | | | | | | |
| | | | | | |
Lamb Weston Holdings, Inc. | | | | | | |
| | | | | | |
| | | | | | |
| | | | | | |
Personal care products: 1.65% | | | | | | |
| | | | | | |
| | | | | | |
Energy equipment & services: 0.89% | | | | | | |
| | | | | | |
Oil, gas & consumable fuels: 0.53% | | | | | | |
| | | | | | |
The accompanying notes are an integral part of these financial statements.
22 | Allspring Small Company Growth Portfolio
Portfolio of investments—November 30, 2023 (unaudited)
| | | | | |
| | | | | | |
| | | | | | |
| | | | | | |
| | | | | | |
| | | | | | |
| | | | | | |
Virtu Financial, Inc. Class A | | | | | | |
| | | | | | |
Financial services: 3.20% | | | | | | |
| | | | | | |
| | | | | | |
Shift4 Payments, Inc. Class A† | | | | | | |
| | | | | | |
| | | | | | |
| | | | | | |
| | | | | | |
| | | | | | |
Ryan Specialty Holdings, Inc.† | | | | | | |
Skyward Specialty Insurance Group, Inc.† | | | | | | |
| | | | | | |
| | | | | | |
| | | | | | |
| | | | | | |
Amicus Therapeutics, Inc.† | | | | | | |
Blueprint Medicines Corp.† | | | | | | |
| | | | | | |
Dynavax Technologies Corp.† | | | | | | |
| | | | | | |
Ionis Pharmaceuticals, Inc.† | | | | | | |
| | | | | | |
Neurocrine Biosciences, Inc.† | | | | | | |
Sarepta Therapeutics, Inc.† | | | | | | |
SpringWorks Therapeutics, Inc.† | | | | | | |
Syndax Pharmaceuticals, Inc.† | | | | | | |
Ultragenyx Pharmaceutical, Inc.† | | | | | | |
| | | | | | |
Health care equipment & supplies: 5.08% | | | | | | |
| | | | | | |
| | | | | | |
| | | | | | |
| | | | | | |
iRhythm Technologies, Inc.† | | | | | | |
| | | | | | |
| | | | | | |
| | | | | | |
The accompanying notes are an integral part of these financial statements.
Allspring Small Company Growth Portfolio | 23
Portfolio of investments—November 30, 2023 (unaudited)
| | | | | |
Health care providers & services: 2.01% | | | | | | |
| | | | | | |
Privia Health Group, Inc.† | | | | | | |
U.S. Physical Therapy, Inc. | | | | | | |
| | | | | | |
Health care technology: 1.95% | | | | | | |
Evolent Health, Inc. Class A† | | | | | | |
| | | | | | |
| | | | | | |
| | | | | | |
Life sciences tools & services: 4.12% | | | | | | |
Adaptive Biotechnologies Corp.† | | | | | | |
| | | | | | |
| | | | | | |
| | | | | | |
| | | | | | |
| | | | | | |
| | | | | | |
Axsome Therapeutics, Inc.† | | | | | | |
| | | | | | |
Aerospace & defense: 0.69% | | | | | | |
Kratos Defense & Security Solutions, Inc.† | | | | | | |
Air freight & logistics: 0.72% | | | | | | |
| | | | | | |
| | | | | | |
Advanced Drainage Systems, Inc. | | | | | | |
| | | | | | |
Masonite International Corp.† | | | | | | |
Zurn Elkay Water Solutions Corp. Class C | | | | | | |
| | | | | | |
Commercial services & supplies: 1.66% | | | | | | |
Montrose Environmental Group, Inc.† | | | | | | |
| | | | | | |
| | | | | | |
| | | | | | |
Construction & engineering: 1.74% | | | | | | |
| | | | | | |
| | | | | | |
| | | | | | |
The accompanying notes are an integral part of these financial statements.
24 | Allspring Small Company Growth Portfolio
Portfolio of investments—November 30, 2023 (unaudited)
| | | | | |
Electrical equipment: 1.44% | | | | | | |
| | | | | | |
| | | | | | |
| | | | | | |
Ground transportation: 1.40% | | | | | | |
Knight-Swift Transportation Holdings, Inc. | | | | | | |
Schneider National, Inc. Class B | | | | | | |
| | | | | | |
| | | | | | |
| | | | | | |
| | | | | | |
| | | | | | |
| | | | | | |
| | | | | | |
Professional services: 8.32% | | | | | | |
| | | | | | |
| | | | | | |
| | | | | | |
| | | | | | |
SS&C Technologies Holdings, Inc. | | | | | | |
| | | | | | |
| | | | | | |
Trading companies & distributors: 1.80% | | | | | | |
| | | | | | |
Core & Main, Inc. Class A† | | | | | | |
| | | | | | |
Information technology: 20.65% | | | | | | |
Communications equipment: 1.71% | | | | | | |
| | | | | | |
| | | | | | |
| | | | | | |
Electronic equipment, instruments & components: 1.95% | | | | | | |
| | | | | | |
| | | | | | |
| | | | | | |
| | | | | | |
Semiconductors & semiconductor equipment: 2.73% | | | | | | |
| | | | | | |
| | | | | | |
| | | | | | |
| | | | | | |
| | | | | | |
The accompanying notes are an integral part of these financial statements.
Allspring Small Company Growth Portfolio | 25
Portfolio of investments—November 30, 2023 (unaudited)
| | | | | |
| | | | | | |
| | | | | | |
| | | | | | |
| | | | | | |
| | | | | | |
DoubleVerify Holdings, Inc.† | | | | | | |
| | | | | | |
| | | | | | |
| | | | | | |
| | | | | | |
| | | | | | |
| | | | | | |
| | | | | | |
Sprout Social, Inc. Class A† | | | | | | |
| | | | | | |
| | | | | | |
| | | | | | |
Technology hardware, storage & peripherals: 0.65% | | | | | | |
Pure Storage, Inc. Class A† | | | | | | |
| | | | | | |
| | | | | | |
| | | | | | |
| | | | | | |
| | | | | | |
| | | | | | |
| | | | | | |
| | | | | | |
Hotel & resort REITs: 0.84% | | | | | | |
Ryman Hospitality Properties, Inc. | | | | | | |
Real estate management & development: 0.70% | | | | | | |
DigitalBridge Group, Inc. | | | | | | |
Total common stocks (Cost $312,765,656) | | | | | | |
| | | | | |
Short-term investments: 2.09% | | | | | | |
Investment companies: 2.09% | | | | | | |
Allspring Government Money Market Fund Select Class♠∞ | | | | | | |
Total short-term investments (Cost $10,036,036) | | | | | | |
Total investments in securities (Cost $322,801,692) | | | | | | |
Other assets and liabilities, net | | | | | | |
| | | | | | |
The accompanying notes are an integral part of these financial statements.
26 | Allspring Small Company Growth Portfolio
Portfolio of investments—November 30, 2023 (unaudited)
| Non-income-earning security |
| The issuer of the security is an affiliated person of the Portfolio as defined in the Investment Company Act of 1940. |
| The rate represents the 7-day annualized yield at period end. |
|
| Real estate investment trust |
Investments in affiliates
An affiliated investment is an investment in which the Portfolio owns at least 5% of the outstanding voting shares of the issuer or as a result of other relationships, such as the Portfolio and the issuer having the same adviser or investment manager. Transactions with issuers that were affiliates of the Portfolio at the end of the period were as follows:
| | | | | Net
change in
unrealized
gains
(losses) | | | Income
from
affiliated
securities |
| | | | | | | | |
Allspring Government Money Market Fund Select Class | | | | | | | | |
The accompanying notes are an integral part of these financial statements.
Allspring Small Company Growth Portfolio | 27
Statement of assets and liabilities—November 30, 2023 (unaudited)
Financial statements
Statement of assets and liabilities
| |
Investments in unaffiliated securities, at value (cost $312,765,656) | |
Investments in affiliated securities, at value (cost $10,036,036) | |
| |
Receivable for investments sold | |
Prepaid expenses and other assets | |
| |
| |
| |
Custody and accounting fees payable | |
Trustees’ fees and expenses payable | |
Accrued expenses and other liabilities | |
| |
| |
The accompanying notes are an integral part of these financial statements.
28 | Allspring Small Company Growth Portfolio
Statement of operations—six months ended November 30, 2023 (unaudited)
Statement of operations
| |
Dividends (net of foreign withholdings taxes of $4,509) | |
Income from affiliated securities | |
| |
| |
| |
| |
Custody and accounting fees | |
| |
Interest holder report expenses | |
Trustees’ fees and expenses | |
| |
| |
| |
Realized and unrealized gains (losses) on investments | |
Net realized gains on investments | |
Net change in unrealized gains (losses) on investments | |
Net realized and unrealized gains (losses) on investments | |
Net increase in net assets resulting from operations | |
The accompanying notes are an integral part of these financial statements.
Allspring Small Company Growth Portfolio | 29
Statement of changes in net assets
Statement of changes in net assets
|
Six months ended
November 30, 2023 (unaudited) | |
| | | | |
| | | | |
Net realized gains on investments | | | | |
Net change in unrealized gains (losses) on investments | | | | |
Net increase (decrease) in net assets resulting from operations | | | | |
| | | | |
Transactions in investors’ beneficial interests | | | | |
| | | | |
| | | | |
Net decrease in net assets resulting from capital transactions | | | | |
Total decrease in net assets | | | | |
| | | | |
| | | | |
| | | | |
The accompanying notes are an integral part of these financial statements.
30 | Allspring Small Company Growth Portfolio
| Six months ended
November 30, 2023
(unaudited) | |
| | | | | |
| | | | | | |
Ratios to average net assets (annualized) | | | | | | |
| | | | | | |
| | | | | | |
| | | | | | |
| | | | | | |
| | | | | | |
| Returns for periods of less than one year are not annualized. |
| Net expense ratios reflect voluntary waivers, if any. |
The accompanying notes are an integral part of these financial statements.
Allspring Small Company Growth Portfolio | 31
Notes to financial statements (unaudited)
Notes to financial statements
Allspring Master Trust (the “Trust”), a Delaware statutory trust organized on March 10, 1999, is an open-end management investment company registered under the Investment Company Act of 1940, as amended (the “1940 Act”). As an investment company, the Trust follows the accounting and reporting guidance in Financial Accounting Standards Board (“FASB”) Accounting Standards Codification Topic 946, Financial Services – Investment Companies. These financial statements report on the Allspring Small Company Growth Portfolio (the “Portfolio”) which is a diversified series of the Trust.
Interests in the Portfolio are available solely through private placement transactions that do not involve any “public offering” within the meaning of Section 4(a)(2) of the Securities Act of 1933.
2.
SIGNIFICANT ACCOUNTING POLICIES
The following significant accounting policies, which are consistently followed in the preparation of the financial statements of the Portfolio, are in conformity with U.S. generally accepted accounting principles which require management to make estimates and assumptions that affect the reported amounts of assets and liabilities, disclosure of contingent assets and liabilities at the date of the financial statements, and the reported amounts of income and expenses during the reporting period. Actual results could differ from those estimates.
Securities valuation
All investments are valued each business day as of the close of regular trading on the New York Stock Exchange (generally 4 p.m. Eastern Time), although the Portfolio may deviate from this calculation time under unusual or unexpected circumstances.
Equity securities and exchange-traded funds that are listed on a foreign or domestic exchange or market are valued at the official closing price or, if none, the last sales price.
Investments in registered open-end investment companies (other than those listed on a foreign or domestic exchange or market) are valued at net asset value.
Investments which are not valued using the methods discussed above are valued at their fair value, as determined in good faith by Allspring Funds Management, LLC (“Allspring Funds Management”), which was named the valuation designee by the Board of Trustees. As the valuation designee, Allspring Funds Management is responsible for day-to-day valuation activities for the Allspring Funds. In connection with these responsibilities, Allspring Funds Management has established a Valuation Committee and has delegated to it the authority to take any actions regarding the valuation of portfolio securities that the Valuation Committee deems necessary or appropriate, including determining the fair value of portfolio securities. On a quarterly basis, the Board of Trustees receives reports of valuation actions taken by the Valuation Committee. On at least an annual basis, the Board of Trustees receives an assessment of the adequacy and effectiveness of Allspring Funds Management’s process for determining the fair value of the portfolio of investments.
Security transactions and income recognition
Securities transactions are recorded on a trade date basis. Realized gains or losses are recorded on the basis of identified cost.
Dividend income is recognized on the ex-dividend date. Dividend income is recorded net of foreign taxes withheld where recovery of such taxes is not assured.
Interest earned on cash balances held at the custodian is recorded as interest income.
Distributions received from REIT investments may be characterized as ordinary income, capital gains, or a return of capital to the Portfolio based on information provided by the REIT. The proper characterization of REIT distributions is generally not known until after the end of each calendar year. As such, estimates may be used in reporting the character of income and distributions for financial statement purposes.
Federal and other taxes
The Portfolio is not required to pay federal income taxes on its net investment income and net capital gains as it is treated as a partnership for federal income tax purposes. All income, gains and losses of the Portfolio are deemed to have been “passed through” to the interest holders in proportion to their holdings of the Portfolio regardless of whether income and gains have been distributed by the Portfolio.
The Portfolio’s income tax returns and all financial records supporting those returns for the prior three fiscal years are subject to examination by the federal revenue authority. Management has analyzed the Portfolio’s tax positions taken on federal, state, and foreign tax returns, as applicable, for all open tax years and does not believe that there are any uncertain tax positions that require recognition of a tax liability.
As of November 30, 2023, the aggregate cost of all investments for federal income tax purposes was $326,041,469 and the unrealized gains (losses) consisted of:
32 | Allspring Small Company Growth Portfolio
Notes to financial statements (unaudited)
3.
FAIR VALUATION MEASUREMENTS
Fair value measurements of investments are determined within a framework that has established a fair value hierarchy based upon the various data inputs utilized in determining the value of the Portfolio’s investments. The three-level hierarchy gives the highest priority to unadjusted quoted prices in active markets for identical assets or liabilities (Level 1) and the lowest priority to unobservable inputs (Level 3). The Portfolio’s investments are classified within the fair value hierarchy based on the lowest level of input that is significant to the fair value measurement. The inputs are summarized into three broad levels as follows:
•Level 1—quoted prices in active markets for identical securities
•Level 2—other significant observable inputs (including quoted prices for similar securities, interest rates, prepayment speeds, credit risk, etc.)
•Level 3—significant unobservable inputs (including the Portfolio’s own assumptions in determining the fair value of investments)
The inputs or methodologies used for valuing investments in securities are not necessarily an indication of the risk associated with investing in those securities.
The following is a summary of the inputs used in valuing the Portfolio’s assets and liabilities as of November 30, 2023:
| | Other significant
observable inputs
(Level 2) | Significant
unobservable inputs
(Level 3) | |
| | | | |
| | | | |
| | | | |
| | | | |
| | | | |
| | | | |
| | | | |
| | | | |
| | | | |
| | | | |
| | | | |
| | | | |
| | | | |
| | | | |
| | | | |
| | | | |
Additional sector, industry or geographic detail, if any, is included in the Portfolio of Investments.
At November 30, 2023, the Portfolio did not have any transfers into/out of Level 3.
4.
TRANSACTIONS WITH AFFILIATES AND OTHER EXPENSES
Advisory fee
The Trust has entered into an advisory contract with Allspring Funds Management, a wholly owned subsidiary of Allspring Global Investments Holdings, LLC, a holding company indirectly owned by certain private funds of GTCR LLC and Reverence Capital Partners, L.P. The adviser is responsible for implementing investment policies and guidelines and for supervising the subadviser, who is responsible for day-to-day portfolio management of the Portfolio. Pursuant to the contract, Allspring Funds Management is entitled to receive an advisory fee at the following annual rate based on the Portfolio’s average daily net assets:
For the six months ended November 30, 2023, the advisory fee was equivalent to an annual rate of 0.79% of the Portfolio’s average daily net assets.
Allspring Small Company Growth Portfolio | 33
Notes to financial statements (unaudited)
Allspring Funds Management has retained the services of a subadviser to provide daily portfolio management to the Portfolio. The fee for subadvisory services is borne by Allspring Funds Management. Peregrine Capital Management, LLC, which is not an affiliate of Allspring Funds Management, is the subadviser to the Portfolio and is entitled to receive a fee from Allspring Funds Management at an annual rate of 0.38% of the Portfolio’s average daily net assets.
Interfund transactions
The Portfolio may purchase or sell portfolio investment securities to certain affiliates pursuant to Rule 17a-7 under the 1940 Act and under procedures adopted by the Board of Trustees. The procedures have been designed to ensure that these interfund transactions, which do not incur broker commissions, are effected at current market prices. Pursuant to these procedures, the Portfolio did not have any interfund transactions during the six months ended November 30, 2023.
5.
INVESTMENT PORTFOLIO TRANSACTIONS
Purchases and sales of investments, excluding U.S. government obligations (if any) and short-term securities, for the six months ended November 30, 2023 were $169,102,454 and $409,295,099, respectively.
The Trust, along with Allspring Variable Trust and Allspring Funds Trust (excluding the money market funds), are parties to a $350,000,000 revolving credit agreement whereby the Portfolio is permitted to use bank borrowings for temporary or emergency purposes, such as to fund interest holders withdrawal requests. Interest under the credit agreement is charged to the Portfolio based on borrowing rate equal to the higher of the Federal Funds rate or the overnight bank funding rate in effect on that day plus a spread. In addition, an annual commitment fee based on the unused balance is allocated to each participating fund.
For the six months ended November 30, 2023, there were no borrowings by the Portfolio under the agreement.
As of the end of the period, the Portfolio concentrated its portfolio of investments in the industrials sector. A fund that invests a substantial portion of its assets in any sector may be more affected by changes in that sector than would be a fund whose investments are not heavily weighted in any sector.
Under the Portfolio’s organizational documents, the officers and Trustees have been granted certain indemnification rights against certain liabilities that may arise out of performance of their duties to the Portfolio. The Portfolio has entered into a separate agreement with each Trustee that converts indemnification rights currently existing under the Portfolio’s organizational documents into contractual rights that cannot be changed in the future without the consent of the Trustee. Additionally, in the normal course of business, the Portfolio may enter into contracts with service providers that contain a variety of indemnification clauses. The Portfolio’s maximum exposure under these arrangements is dependent on future claims that may be made against the Portfolio and, therefore, cannot be estimated.
34 | Allspring Small Company Growth Portfolio
Other information (unaudited)
Other information
Proxy voting information
A description of the policies and procedures used to determine how to vote proxies relating to portfolio securities is available without charge, upon request, by calling 1-866-259-3305, visiting our website at allspringglobal.com, or visiting the SEC website at sec.gov. Information regarding how the proxies related to portfolio securities were voted during the most recent 12-month period ended June 30 is available on the website at allspringglobal.com or by visiting the SEC website at sec.gov.
Quarterly portfolio holdings information
The Fund and Portfolio file their complete schedule of portfolio holdings with the SEC for the first and third quarters of each fiscal year as an exhibit to their reports on Form N-PORT. Shareholders and Interest holders may view the filed Form N-PORT by visiting the SEC website at sec.gov.
Allspring Small Company Growth Fund | 35
Other information (unaudited)
Board of trustees and officers
Each of the Trustees and Officers listed in the table below acts in identical capacities for each fund in the Allspring family of funds, which consists of 126 mutual funds comprising the Allspring Funds Trust, Allspring Variable Trust, Allspring Master Trust and four closed-end funds (collectively the “Fund Complex”). This table should be read in conjunction with the Prospectus and the Statement of Additional Information†. The mailing address of each Trustee and Officer is 1415 Vantage Park Drive, 3rd Floor, Charlotte, NC 28203. Each Trustee and Officer serves an indefinite term, however, each Trustee serves such term until reaching the mandatory retirement age established by the Trustees.
Independent Trustees
| | Principal occupations during past five years or longer | Current other
public company or
investment
company
directorships |
William R. Ebsworth
(Born 1957) | | Retired. From 1984 to 2013, equities analyst, portfolio manager, research director and chief investment officer at Fidelity Management and Research Company in Boston, Tokyo, and Hong Kong, and retired in 2013 as Chief Investment Officer of Fidelity Strategic Advisers, Inc. where he led a team of investment professionals managing client assets. Prior thereto, Board member of Hong Kong Securities Clearing Co., Hong Kong Options Clearing Corp., the Thailand International Fund, Ltd., Fidelity Investments Life Insurance Company, and Empire Fidelity Investments Life Insurance Company. Serves on the Investment Company Institute’s Board of Governors since 2022 and Executive Committee since 2023 as well as the Vice Chairman of the Governing Council of the Independent Directors Council since 2023. Audit Committee Chair and Investment Committee Chair of the Vincent Memorial Hospital Foundation (non-profit organization). Mr. Ebsworth is a CFA charterholder. | |
Jane A. Freeman
(Born 1953) | Trustee,
since 2015;
Chair Liaison,
| Retired. From 2012 to 2014 and 1999 to 2008, Chief Financial Officer of Scientific Learning Corporation. From 2008 to 2012, Ms. Freeman provided consulting services related to strategic business projects. Prior to 1999, Portfolio Manager at Rockefeller & Co. and Scudder, Stevens & Clark. Board member of the Harding Loevner Funds from 1996 to 2014, serving as both Lead Independent Director and chair of the Audit Committee. Board member of the Russell Exchange Traded Funds Trust from 2011 to 2012 and the chair of the Audit Committee. Ms. Freeman is also an inactive Chartered Financial Analyst. | |
Isaiah Harris, Jr.
(Born 1952) | Trustee,
since 2009;
Audit Committee Chair,
since 2019 | Retired. Member of the Advisory Board of CEF of East Central Florida. Chairman of the Board of CIGNA Corporation from 2009 to 2021, and Director from 2005 to 2008. From 2003 to 2011, Director of Deluxe Corporation. Prior thereto, President and CEO of BellSouth Advertising and Publishing Corp. from 2005 to 2007, President and CEO of BellSouth Enterprises from 2004 to 2005 and President of BellSouth Consumer Services from 2000 to 2003. Emeritus member of the Iowa State University Foundation Board of Governors. Emeritus Member of the Advisory board of Iowa State University School of Business. Advisory Board Member, Palm Harbor Academy (private school). Advisory Board Member, Fellowship of Christian Athletes. Mr. Harris is a certified public accountant (inactive status). | |
David F. Larcker
(Born 1950) | | Distinguished Visiting Fellow at the Hoover Institution since 2022. James Irvin Miller Professor of Accounting at the Graduate School of Business (Emeritus), Stanford University, Director of the Corporate Governance Research Initiative and Senior Faculty of The Rock Center for Corporate Governance since 2006. From 2005 to 2008, Professor of Accounting at the Graduate School of Business, Stanford University. Prior thereto, Ernst & Young Professor of Accounting at The Wharton School, University of Pennsylvania from 1985 to 2005. | |
Olivia S. Mitchell
(Born 1953) | | International Foundation of Employee Benefit Plans Professor since 1993, Wharton School of the University of Pennsylvania. Director of Wharton’s Pension Research Council and Boettner Center on Pensions & Retirement Research, and Research Associate at the National Bureau of Economic Research. Previously taught at Cornell University from 1978 to 1993. | |
Timothy J. Penny
(Born 1951) | Trustee,
since 1996;
Chair,
since 2018 | President and Chief Executive Officer of Southern Minnesota Initiative Foundation, a non-profit organization, since 2007. Vice Chair of the Economic Club of Minnesota, since 2007. Co-Chair of the Committee for a Responsible Federal Budget, since 1995. Member of the Board of Trustees of NorthStar Education Finance, Inc., a non-profit organization, from 2007-2022. Senior Fellow of the University of Minnesota Humphrey Institute from 1995 to 2017. | |
* Length of service dates reflect the Trustee’s commencement of service with the Trust’s predecessor entities, where applicable.
# Ms. Freeman will serve as Chair Liaison through June 2024, at which time Ms. Wheelock will assume the role.
†
The Statement of Additional Information includes additional information about the Trustees and is available, without charge, upon request, by calling 1-800-222-8222 or by visiting the website at allspringglobal.com.
36 | Allspring Small Company Growth Fund
Other information (unaudited)
| Position held and length of service* | Principal occupations during past five years or longer | Current other public company or investment company directorships |
James G. Polisson
(Born 1959) | Trustee,
since 2018; Nominating and Governance Committee Chair, since 2024 | Retired. Chief Marketing Officer, Source (ETF) UK Services, Ltd, from 2015 to 2017. From 2012 to 2015, Principal of The Polisson Group, LLC, a management consulting, corporate advisory and principal investing company. Chief Executive Officer and Managing Director at Russell Investments, Global Exchange Traded Funds from 2010 to 2012. Managing Director of Barclays Global Investors from 1998 to 2010 and Global Chief Marketing Officer for iShares and Barclays Global Investors from 2000 to 2010. Trustee of the San Francisco Mechanics’ Institute, a non- profit organization, from 2013 to 2015. Board member of the Russell Exchange Traded Fund Trust from 2011 to 2012. Director of Barclays Global Investors Holdings Deutschland GmbH from 2006 to 2009. Mr. Polisson is an attorney and has a retired status with the Massachusetts and District of Columbia Bar Associations. | |
Pamela Wheelock
(Born 1959) | Trustee,
since January 2020;
previously Trustee from
January 2018 to
| Retired. Executive and Senior Financial leadership positions in the public, private and nonprofit sectors. Interim President and CEO, McKnight Foundation, 2020. Interim Commissioner, Minnesota Department of Human Services, 2019. Chief Operating Officer, Twin Cities Habitat for Humanity, 2017-2019. Vice President for University Services, University of Minnesota, 2012- 2016. Interim President and CEO, Blue Cross and Blue Shield of Minnesota, 2011-2012. Executive Vice-President and Chief Financial Officer, Minnesota Wild, 2002-2008. Commissioner, Minnesota Department of Finance, 1999-2002. Chair of the Board of Directors of Destination Medical Center Corporation. Board member of the Minnesota Wild Foundation. | |
* Length of service dates reflect the Trustee’s commencement of service with the Trust’s predecessor entities, where applicable.
# Ms. Freeman will serve as Chair Liaison through June 2024, at which time Ms. Wheelock will assume the role.
Allspring Small Company Growth Fund | 37
Other information (unaudited)
Officers1
| Position held and
length of service | Principal occupations during past five years or longer |
| | President and Chief Executive Officer of Allspring Funds Management, LLC since 2017 and Head of Global Fund Governance of Allspring Global Investments since 2022. Prior thereto, co-president of Galliard Capital Management, LLC, an affiliate of Allspring Funds Management, LLC, from 2019 to 2022 and Head of Affiliated Managers, Allspring Global Investments, from 2014 to 2019 and Executive Vice President responsible for marketing, investments and product development for Allspring Funds Management, LLC, from 2009 to 2014. |
Jeremy DePalma
(Born 1974) | Treasurer,
since 2012
(for certain funds in
the Fund Complex);
since 2021 (for
the remaining funds in the Complex) | Senior Vice President of Allspring Funds Management, LLC since 2009. Senior Vice President of Evergreen Investment Management Company, LLC from 2008 to 2010 and head of the Fund Reporting and Control Team within Fund Administration from 2005 to 2010. |
Christopher Baker
(Born 1976) | Chief Compliance Officer,
since 2022 | Global Chief Compliance Officer for Allspring Global Investments since 2022. Prior thereto, Chief Compliance Officer for State Street Global Advisors from 2018 to 2021. Senior Compliance Officer for the State Street divisions of Alternative Investment Solutions, Sector Solutions, and Global Marketing from 2015 to 2018. From 2010 to 2015 Vice President, Global Head of Investment and Marketing Compliance for State Street Global Advisors. |
Matthew Prasse
(Born 1983) | Chief Legal Officer,
since 2022;
Secretary,
since 2021 | Senior Counsel of the Allspring Legal Department since 2021. Senior Counsel of the Wells Fargo Legal Department from 2018 to 2021. Previously, Counsel for Barings LLC from 2015 to 2018. Prior to joining Barings, Associate at Morgan, Lewis & Bockius LLP from 2008 to 2015. |
1 For those Officers with tenures at Allspring Global Investments and/or Allspring Funds Management, LLC that began prior to 2021, such tenures include years of service during which these businesses/entities were known as Wells Fargo Asset Management and Wells Fargo Funds Management, LLC, respectively.
38 | Allspring Small Company Growth Fund
This page is intentionally left blank.
This page is intentionally left blank.
For more information
More information about Allspring Funds is available free upon request. To obtain literature, please write, visit the Fund’s website, or call:
Allspring Funds
P.O. Box 219967
Kansas City, MO 64121-9967
Website: allspringglobal.com
Individual investors: 1-800-222-8222
Retail investment professionals: 1-888-877-9275
Institutional investment professionals: 1-800-260-5969
This report and the financial statements contained herein are submitted for the general information of the shareholders of the Fund. If this report is used for promotional purposes, distribution of the report must be accompanied or preceded by a current prospectus. Before investing, please consider the investment objectives, risks, charges, and expenses of the investment. For a current prospectus and, if available, a summary prospectus, containing this information, call 1-800-222-8222 or visit the Fund’s website at allspringglobal.com. Read the prospectus carefully before you invest or send money.
Allspring Global InvestmentsTM is the trade name for the asset management firms of Allspring Global Investments Holdings, LLC, a holding company indirectly owned by certain private funds of GTCR LLC and Reverence Capital Partners, L.P. These firms include but are not limited to Allspring Global Investments, LLC, and Allspring Funds Management, LLC. Certain products managed by Allspring entities are distributed by Allspring Funds Distributor, LLC (a broker-dealer and Member FINRA/SIPC).
This material is for general informational and educational purposes only and is NOT intended to provide investment advice or a recommendation of any kind - including a recommendation for any specific investment, strategy, or plan.
© 2024 Allspring Global Investments Holdings, LLC. All rights reserved.
ALL-12052023-hp8bsyrt 01-24
SAR1848 11-23
Allspring Small Company Value Fund
Semi-Annual Report
November 30, 2023
The views expressed and any forward-looking statements are as of November 30, 2023, unless otherwise noted, and are those of the Fund’s portfolio managers and/or Allspring Global Investments. Discussions of individual securities or the markets generally are not intended as individual recommendations. Future events or results may vary significantly from those expressed in any forward-looking statements. The views expressed are subject to change at any time in response to changing circumstances in the market. Allspring Global Investments disclaims any obligation to publicly update or revise any views expressed or forward-looking statements.
Allspring Small Company Value Fund | 1
Letter to shareholders (unaudited)
Andrew Owen
President
Allspring Funds
Dear Shareholder:
We are pleased to offer you this semi-annual report for the Allspring Small Company Value Fund for the six-month period that ended November 30, 2023. Globally, stocks and bonds experienced high levels of volatility during the period. The market was focused on the impact of ongoing aggressive central bank rate hikes on persistently high inflation. As inflation finally gradually declined, anticipation rose over an end to the central bank monetary tightening cycle. For the six-month period, domestic U.S. and global stocks and bonds had positive overall results, with U.S. stocks leading the way. After suffering deep and broad losses through 2022, bonds now benefit from a base of higher yields that can help generate higher income.
For the period, U.S. stocks, based on the S&P 500 Index,1 returned 10.17%. International stocks, as measured by the MSCI ACWI ex USA Index (Net),2 gained 5.07% while the MSCI EM Index (Net) (USD)3 returned 4.60%. Among bond indexes, the Bloomberg U.S. Aggregate Bond Index4 returned -0.80%, the Bloomberg Global Aggregate ex-USD Index (unhedged)5 gained 0.63%, the Bloomberg Municipal Bond Index6 returned 2.29%, and the ICE BofA U.S. High Yield Index7 returned 5.53%.
Affected by high inflation and central bank rate hikes, markets were volatile.
The six-month period began in June with the Federal Reserve’s (Fed’s) first pause on interest rate hikes since March 2022, when it began its aggressive campaign to rein in inflation. However, the Core Consumer Price Index (CPI)8, while continuing to decline, remained stubbornly high in June at 4.8%—well above the Fed’s 2.0% target rate. With the U.S. unemployment rate still at 3.6%, near a historical low, and U.S. payrolls continuing to grow in June, expectations of more Fed rate hikes were reinforced. However, U.S. and global stocks had strong returns in June.
July was a good month for stocks, while bonds had more muted but positive monthly returns overall. More volatile sectors and regions tended to do well, as investors grew more optimistic regarding economic prospects. With strong second quarter gross domestic product growth—initially estimated at 2.4%—and U.S. annual inflation easing steadily to 3.2% in July, hopes for a soft economic landing grew. The Fed, the European Central Bank (ECB), and the Bank of England (BoE) all raised their respective key interest rates by 0.25% in July. In the Fed’s case, speculation grew that it could be very close to the end of its tightening cycle. Meanwhile, China’s economy showed signs of stagnation, renewing concerns of global fallout.
1
The S&P 500 Index consists of 500 stocks chosen for market size, liquidity, and industry group representation. It is a market-value-weighted index with each stock’s weight in the index proportionate to its market value. You cannot invest directly in an index.
2
The Morgan Stanley Capital International (MSCI) All Country World Index (ACWI) ex USA Index (Net) is a free-float-adjusted market-capitalization-weighted index that is designed to measure the equity market performance of developed and emerging markets, excluding the U.S. Source: MSCI. MSCI makes no express or implied warranties or representations and shall have no liability whatsoever with respect to any MSCI data contained herein. The MSCI data may not be further redistributed or used as a basis for other indexes or any securities or financial products. This report is not approved, reviewed, or produced by MSCI. You cannot invest directly in an index.
3
The MSCI Emerging Markets (EM) Index (Net) (USD) is a free-float-adjusted market-capitalization-weighted index that is designed to measure the equity market performance of emerging markets. You cannot invest directly in an index.
4
The Bloomberg U.S. Aggregate Bond Index is a broad-based benchmark that measures the investment-grade, U.S.-dollar-denominated, fixed-rate taxable bond market, including Treasuries, government-related and corporate securities, mortgage-backed securities (agency fixed-rate and hybrid adjustable-rate mortgage pass-throughs), asset-backed securities, and commercial mortgage-backed securities. You cannot invest directly in an index.
5
The Bloomberg Global Aggregate ex-USD Index (unhedged) is an unmanaged index that provides a broad-based measure of the global investment-grade fixed income markets excluding the U.S.-dollar-denominated debt market. You cannot invest directly in an index.
6
The Bloomberg Municipal Bond Index is an unmanaged index composed of long-term tax-exempt bonds with a minimum credit rating of Baa. You cannot invest directly in an index.
7
The ICE BofA U.S. High Yield Index is a market-capitalization-weighted index of domestic and Yankee high yield bonds. The index tracks the performance of high yield securities traded in the U.S. bond market. You cannot invest directly in an index. Copyright 2024. ICE Data Indices, LLC. All rights reserved.
8
The Core Consumer Price Index (CPI) is a measure of the average change over time in the prices paid by urban consumers for a market basket of consumer goods and services excluding energy and food prices. You cannot invest directly in an index.
2 | Allspring Small Company Value Fund
Letter to shareholders (unaudited)
“ With strong
second-quarter gross
domestic product
growth—initially
estimated at 2.4%—and
U.S. annual inflation easing steadily to 3.2%
in July, hopes for a soft
economic landing grew. ”
Stocks retreated in August while monthly bond returns were flat overall. Increased global market volatility reflected unease over the Chinese property market being stressed along with weak Chinese economic data. However, speculation grew over a possible end to the Fed’s campaign of interest rate increases or at least a pause in September. U.S. economic data generally remained solid, with resilient job market data and inflation ticking up slightly in August, as the annual CPI1 rose 3.7%. However, the three-month trend for Core CPI stood at an annualized 2.4%.
Stocks and bonds both had negative overall returns in September as investors reluctantly recited the new chorus of “higher for longer,” led by the Fed’s determination not to lower interest rates until it knows it has vanquished its pesky opponent—higher-than-targeted inflation. As of September, the two primary gauges of U.S. inflation—the annual Core Personal Consumption Expenditures Price Index2 and the CPI—both stood at roughly 4%, twice as high as the Fed’s oft-stated 2% target. The month ended with the prospect of yet another U.S. government shutdown, averted at least temporarily.
October was a tough month for financial markets overall. Key global indexes were pushed down by rising geopolitical tensions—particularly the Israel-Hamas conflict, and concerns over the Fed’s “higher for longer” monetary policy. The U.S. 10-year Treasury yield rose above 5% for the first time since 2007. Commodity prices did well as oil prices rallied in response to the prospect of oil supply disruptions from the Middle East. U.S. annualized third quarter GDP was estimated at a healthier-than-anticipated 4.9%. China’s GDP indicated surprisingly strong industrial production and retail sales, offset by ongoing weakness in its real estate sector.
In November, the market mood turned positive as cooling inflation inspired confidence that central banks could hold off on further rate hikes. Overall annual inflation in the U.S. fell to 3.1% in November while 12-month inflation in the U.K. and eurozone eased to 4.6% and 2.4%, respectively—far below their peak levels of mid-2022. Third quarter annualized U.S. GDP growth was raised to an estimated 5.2% while U.S. job totals rose by just below 200,000 in November, indicating a slight cooling of the labor market. All of this fresh evidence added to confidence for a U.S. soft economic landing, leading to a more buoyant mood heading into winter as the Federal Open Market Committee held rates steady at its November meeting.
1
The CPI is a measure of the average change over time in the prices paid by urban consumers for a market basket of consumer goods and services. You cannot invest directly in an index.
2
The Core Personal Consumption Expenditures Price Index (PCE) is a measure of prices that people living in the United States, or those buying on their behalf, pay for goods and services. It is sometimes called the core PCE price index, because two categories that can have price swings – food and energy – are left out to make underlying inflation easier to see. You cannot invest directly in an index.
Allspring Small Company Value Fund | 3
Letter to shareholders (unaudited)
For further information about your fund, contact your investment professional, visit our website at allspringglobal.com, or call us directly at 1-800-222-8222.
Don’t let short-term uncertainty derail long-term investment goals.
Periods of investment uncertainty can present challenges, but experience has taught us that maintaining long-term investment goals can be an effective way to plan for the future. To help you create a sound strategy based on your personal goals and risk tolerance, Allspring Funds offers more than 100 mutual funds spanning a wide range of asset classes and investment styles. Although diversification cannot guarantee an investment profit or prevent losses, we believe it can be an effective way to manage investment risk and potentially smooth out overall portfolio performance. We encourage investors to know their investments and to understand that appropriate levels of risk-taking may unlock opportunities.
Thank you for choosing to invest with Allspring Funds. We appreciate your confidence in us and remain committed to helping you meet your financial needs.
Sincerely,
Andrew Owen
President
Allspring Funds
4 | Allspring Small Company Value Fund
Letter to shareholders (unaudited)
|
Beginning in July 2024, the Fund will be required by the Securities and Exchange Commission to send shareholders a paper copy of a new tailored shareholder report in place of the full shareholder report that you are now receiving. The tailored shareholder report will contain concise information about the Fund, including certain expense and performance information and fund statistics. If you wish to receive this new tailored shareholder report electronically, please follow the instructions on the back cover of this report. |
Other information that is currently included in the shareholder report, such as the Fund’s financial statements, will be available online and upon request, free of charge, in paper or electronic format. |
Allspring Small Company Value Fund | 5
Performance highlights (unaudited)
Performance highlights
| The Fund seeks long-term capital appreciation. |
| Allspring Funds Management, LLC |
Subadviser for the affiliated master portfolio* | Allspring Global Investments, LLC |
| Jeff Goverman, Gustaf Little, Garth R. Nisbet, CFA, Craig Pieringer, CFA |
Average annual total returns (%) as of November 30, 2023 |
| | | | |
| | | | | | | | | |
| | | | | | | | | |
| | | | | | | | | |
| | | | | | | | | |
Administrator Class (SCVIX) | | | | | | | | | |
Institutional Class (SCVNX) | | | | | | | | | |
| | | | | | | | | |
Russell 2000 ® Value Index5 | | | | | | | | | |
Figures quoted represent past performance, which is no guarantee of future results, and do not reflect taxes that a shareholder may pay on an investment in a fund. Investment return and principal value of an investment will fluctuate so that an investor’s shares, when redeemed, may be worth more or less than their original cost. Performance shown without sales charges would be lower if sales charges were reflected. Current performance may be lower or higher than the performance data quoted, which assumes the reinvestment of dividends and capital gains. Current month-end performance is available on the Fund’s website, allspringglobal.com.
Index returns do not include transaction costs associated with buying and selling securities, any mutual fund fees or expenses, or any taxes. It is not possible to invest directly in an index.
For Class A shares, the maximum front-end sales charge is 5.75%. For Class C shares, the maximum contingent deferred sales charge is 1.00%. Performance including a contingent deferred sales charge assumes the sales charge for the corresponding time period. Class R6, Administrator Class and Institutional Class shares are sold without a front-end sales charge or contingent deferred sales charge.
|
| Reflects the expense ratios as stated in the most recent prospectuses. The expense ratios shown are subject to change and may differ from the annualized expense ratios shown in the Financial Highlights of this report. |
| The manager has contractually committed through September 30, 2024, to waive fees and/or reimburse expenses to the extent necessary to cap total annual fund operating expenses after fee waivers at 1.15% for Class A, 1.90% for Class C, 0.75% for Class R6, 1.05% for Administrator Class and 0.85% for Institutional Class. Brokerage commissions, stamp duty fees, interest, taxes, acquired fund fees and expenses (if any) from funds in which the affiliated master portfolio invests, and extraordinary expenses are excluded from the expense caps. Net expenses from the affiliated master portfolio are included in the expense caps. Prior to or after the commitment expiration date, the caps may be increased or the commitment to maintain the caps may be terminated only with the approval of the Board of Trustees. Without these caps, the Fund’s returns would have been lower. The expense ratio paid by an investor is the net expense ratio (the total annual fund operating expenses after fee waivers) as stated in the prospectuses. |
| Historical performance shown for the Class R6 shares prior to their inception reflects the performance of the Institutional Class shares, and includes the higher expenses applicable to the Institutional Class shares. If these expenses had not been included, returns for the Class R6 shares would be higher. |
| The Russell 3000® Index measures the performance of the 3,000 largest U.S. companies based on total market capitalization, which represents approximately 98% of the investable U.S. equity market. You cannot invest directly in an index. |
| The Russell 2000® Value Index measures the performance of those Russell 2000 companies with lower price/book ratios and lower forecasted growth values. You cannot invest directly in an index. |
Stock values fluctuate in response to the activities of individual companies and general market and economic conditions. Smaller-company stocks tend to be more volatile and less liquid than those of larger companies. Certain investment strategies tend to increase the total risk of an investment (relative to the broader market). Consult the Fund’s prospectus for additional information on these and other risks.
| The Fund is a feeder fund in a master-feeder structure that invests substantially all of its assets in a single affiliated master portfolio of the Allspring Master Trust with a substantially identical investment objective and substantially similar investment strategies. References to the investment activities of the Fund are intended to refer to the investment activities of the affiliated master portfolio in which it invests. |
CFA® and Chartered Financial Analyst® are trademarks owned by CFA Institute. |
6 | Allspring Small Company Value Fund
Performance highlights (unaudited)
Ten largest holdings (%) as of November 30, 20231 |
| |
| |
Atlantic Union Bankshares Corp. | |
| |
Annaly Capital Management, Inc. | |
| |
| |
| |
| |
| |
| Each holding represents the Fund’s allocable portion of the affiliated master portfolio security. Figures represent each holding as a percentage of the Fund’s net assets. Holdings are subject to change and may have changed since the date specified. |
Sector allocation as of November 30, 20231 |
| Figures represent the sector allocation of the affiliated master portfolio as a percentage of the long-term investments of the affiliated master portfolio. These amounts are subject to change and may have changed since the date specified. |
Allspring Small Company Value Fund | 7
Fund expenses (unaudited)
Fund expenses
As a shareholder of the Fund, you incur two types of costs: (1) transaction costs, including sales charges (loads) on purchase payments and contingent deferred sales charges (if any) on redemptions and (2) ongoing costs, including management fees, distribution (12b-1) and/or shareholder servicing fees, and other Fund expenses. This example is intended to help you understand your ongoing costs (in dollars) of investing in the Fund and to compare these costs with the ongoing costs of investing in other mutual funds.
The example is based on an investment of $1,000 invested at the beginning of the six-month period and held for the entire period from June 1, 2023 to November 30, 2023.
Actual expenses
The “Actual” line of the table below provides information about actual account values and actual expenses. You may use the information in this line, together with the amount you invested, to estimate the expenses that you paid over the period. Simply divide your account value by $1,000 (for example, an $8,600 account value divided by $1,000= 8.6), then multiply the result by the number in the “Actual” line under the heading entitled “Expenses paid during period” for your applicable class of shares to estimate the expenses you paid on your account during this period.
Hypothetical example for comparison purposes
The “Hypothetical” line of the table below provides information about hypothetical account values and hypothetical expenses based on the Fund’s actual expense ratio and an assumed rate of return of 5% per year before expenses, which is not the Fund’s actual return. The hypothetical account values and expenses may not be used to estimate the actual ending account balance or expenses you paid for the period. You may use this information to compare the ongoing costs of investing in the Fund and other funds. To do so, compare this 5% hypothetical example with the 5% hypothetical examples that appear in the shareholder reports of the other funds.
Please note that the expenses shown in the table are meant to highlight your ongoing costs only and do not reflect any transactional costs, such as sales charges (loads) and contingent deferred sales charges. Therefore, the “Hypothetical” line of the table is useful in comparing ongoing costs only, and will not help you determine the relative total costs of owning different funds. In addition, if these transactional costs were included, your costs would have been higher.
| Beginning
account value
6-1-2023 | Ending
account value
11-30-2023 | | |
| | | | |
| | | | |
Hypothetical (5% return before expenses) | | | | |
| | | | |
| | | | |
Hypothetical (5% return before expenses) | | | | |
| | | | |
| | | | |
Hypothetical (5% return before expenses) | | | | |
| | | | |
| | | | |
Hypothetical (5% return before expenses) | | | | |
| | | | |
| | | | |
Hypothetical (5% return before expenses) | | | | |
| Expenses paid is equal to the annualized net expense ratio of each class multiplied by the average account value over the period, multiplied by 183 divided by 366 (to reflect the one-half-year period). |
| Amounts reflect net expenses allocated from the affiliated Master Portfolio in which the Fund invests. |
8 | Allspring Small Company Value Fund
Portfolio of investments—November 30, 2023 (unaudited)
| | | | | |
Investment companies: 100.08% | | | | | | |
Affiliated master portfolio: 100.08% | | | | | | |
Allspring Small Company Value Portfolio | | | | | | |
Total investment companies (Cost $371,341,172) | | | | | | |
Total investments in securities (Cost $371,341,172) | | | | | | |
Other assets and liabilities, net | | | | | | |
| | | | | | |
Transactions with the affiliated Master Portfolio were as follows:
| % of
ownership,
beginning
of period | % of
ownership,
end of
period | Net realized
gains
(losses) on
investments
allocated
from
affiliated
Master
Portfolio | Net
change in
unrealized
gains
(losses) on
investments
allocated
from
affiliated
Master
Portfolio | Dividends
allocated
from
affiliated
Master
Portfolio | Interest
allocated
from
affiliated
Master
Portfolio | Affiliated
Income
Allocated
from
affiliated
Master
Portfolio | |
Allspring Small Company Value Portfolio | | | | | | | | |
The accompanying notes are an integral part of these financial statements.
Allspring Small Company Value Fund | 9
Statement of assets and liabilities—November 30, 2023 (unaudited)
Financial statements
Statement of assets and liabilities
| |
Investments in affiliated Master Portfolio, at value (cost $371,341,172) | |
Receivable for Fund shares sold | |
| |
Prepaid expenses and other assets | |
| |
| |
Payable for Fund shares redeemed | |
Shareholder servicing fees payable | |
Administration fees payable | |
Trustees’ fees and expenses payable | |
| |
Accrued expenses and other liabilities | |
| |
| |
| |
| |
Total distributable earnings | |
| |
Computation of net asset value and offering price per share | |
| |
Shares outstanding–Class A1 | |
Net asset value per share–Class A | |
Maximum offering price per share – Class A2 | |
| |
Shares outstanding–Class C1 | |
Net asset value per share–Class C | |
| |
Shares outstanding–Class R61 | |
Net asset value per share–Class R6 | |
Net assets–Administrator Class | |
Shares outstanding–Administrator Class1 | |
Net asset value per share–Administrator Class | |
Net assets–Institutional Class | |
Shares outstanding–Institutional Class1 | |
Net asset value per share–Institutional Class | |
1 The Fund has an unlimited number of authorized shares.
2 Maximum offering price is computed as 100/94.25 of net asset value. On investments of $50,000 or more, the offering price is reduced.
The accompanying notes are an integral part of these financial statements.
10 | Allspring Small Company Value Fund
Statement of operations—six months ended November 30, 2023 (unaudited)
Statement of operations
| |
Dividends allocated from affiliated Master Portfolio (net of foreign withholding taxes of $9,212) | |
Affiliated income allocated from affiliated Master Portfolio | |
Interest allocated from affiliated Master Portfolio | |
Expenses allocated from affiliated Master Portfolio | |
Waivers allocated from affiliated Master Portfolio | |
| |
| |
| |
| |
| |
| |
| |
| |
| |
Shareholder servicing fees | |
| |
| |
| |
| |
| |
Custody and accounting fees | |
| |
| |
Shareholder report expenses | |
Trustees’ fees and expenses | |
| |
| |
Less: Fee waivers and/or expense reimbursements | |
| |
| |
| |
| |
| |
| |
Realized and unrealized gains (losses) on investments | |
Net realized gains on investments allocated from affiliated Master Portfolio | |
Net change in unrealized gains (losses) on investments allocated from affiliated Master Portfolio | |
Net realized and unrealized gains (losses) on investments | |
Net increase in net assets resulting from operations | |
The accompanying notes are an integral part of these financial statements.
Allspring Small Company Value Fund | 11
Statement of changes in net assets
Statement of changes in net assets
|
Six months ended
November 30, 2023 (unaudited) | |
| | | | |
| | | | |
Net realized gains (losses) on investments | | | | |
Net change in unrealized gains (losses) on investments | | | | |
Net increase (decrease) in net assets resulting from operations | | | | |
Distributions to shareholders from | | | | |
Net investment income and net realized gains | | | | |
| | | | |
| | | | |
| | | | |
| | | | |
| | | | |
Total distributions to shareholders | | | | |
Capital share transactions | | | | |
Proceeds from shares sold | | | | |
| | | | |
| | | | |
| | | | |
| | | | |
| | | | |
| | | | |
Reinvestment of distributions | | | | |
| | | | |
| | | | |
| | | | |
| | | | |
| | | | |
| | | | |
Payment for shares redeemed | | | | |
| | | | |
| | | | |
| | | | |
| | | | |
| | | | |
| | | | |
Net decrease in net assets resulting from capital share transactions | | | | |
Total increase (decrease) in net assets | | | | |
| | | | |
| | | | |
| | | | |
The accompanying notes are an integral part of these financial statements.
12 | Allspring Small Company Value Fund
Financial highlights
(For a share outstanding throughout each period)
| Six months ended
November 30, 2023
(unaudited) | |
| | | | | |
Net asset value, beginning of period | | | | | | |
| | | | | | |
Net realized and unrealized gains (losses) on investments | | | | | | |
Total from investment operations | | | | | | |
Distributions to shareholders from | | | | | | |
| | | | | | |
| | | | | | |
Total distributions to shareholders | | | | | | |
Net asset value, end of period | | | | | | |
| | | | | | |
Ratios to average net assets (annualized)* | | | | | | |
| | | | | | |
| | | | | | |
| | | | | | |
| | | | | | |
| | | | | | |
Net assets, end of period (000s omitted) | | | | | | |
| Ratios include net expenses allocated from the affiliated Master Portfolio which were as follows: |
Six months ended November 30, 2023 (unaudited) | |
| |
| |
| |
| |
| |
| Calculated based upon average shares outstanding |
| Total return calculations do not include any sales charges. Returns for periods of less than one year are not annualized. |
| Portfolio turnover rate is calculated by multiplying the affiliated Master Portfolio’s percentage of the Fund’s total investment in securities at the end of the period by the affiliated Master Portfolio’s portfolio turnover rate. |
The accompanying notes are an integral part of these financial statements.
Allspring Small Company Value Fund | 13
(For a share outstanding throughout each period)
| Six months ended
November 30, 2023
(unaudited) | |
| | | | | |
Net asset value, beginning of period | | | | | | |
Net investment income (loss) | | | | | | |
Net realized and unrealized gains (losses) on investments | | | | | | |
Total from investment operations | | | | | | |
Distributions to shareholders from | | | | | | |
| | | | | | |
| | | | | | |
Total distributions to shareholders | | | | | | |
Net asset value, end of period | | | | | | |
| | | | | | |
Ratios to average net assets (annualized)* | | | | | | |
| | | | | | |
| | | | | | |
Net investment income (loss) | | | | | | |
| | | | | | |
| | | | | | |
Net assets, end of period (000s omitted) | | | | | | |
| Ratios include net expenses allocated from the affiliated Master Portfolio which were as follows: |
Six months ended November 30, 2023 (unaudited) | |
| |
| |
| |
| |
| |
| Calculated based upon average shares outstanding |
| Amount is less than $0.005. |
| Total return calculations do not include any sales charges. Returns for periods of less than one year are not annualized. |
| Portfolio turnover rate is calculated by multiplying the affiliated Master Portfolio’s percentage of the Fund’s total investment in securities at the end of the period by the affiliated Master Portfolio’s portfolio turnover rate. |
The accompanying notes are an integral part of these financial statements.
14 | Allspring Small Company Value Fund
(For a share outstanding throughout each period)
| Six months ended
November 30, 2023
(unaudited) | |
| | | | | |
Net asset value, beginning of period | | | | | | |
| | | | | | |
Net realized and unrealized gains (losses) on investments | | | | | | |
Total from investment operations | | | | | | |
Distributions to shareholders from | | | | | | |
| | | | | | |
| | | | | | |
Total distributions to shareholders | | | | | | |
Net asset value, end of period | | | | | | |
| | | | | | |
Ratios to average net assets (annualized)* | | | | | | |
| | | | | | |
| | | | | | |
| | | | | | |
| | | | | | |
| | | | | | |
Net assets, end of period (000s omitted) | | | | | | |
| Ratios include net expenses allocated from the affiliated Master Portfolio which were as follows: |
Six months ended November 30, 2023 (unaudited) | |
| |
| |
| |
| |
| |
| Calculated based upon average shares outstanding |
| Returns for periods of less than one year are not annualized. |
| Portfolio turnover rate is calculated by multiplying the affiliated Master Portfolio’s percentage of the Fund’s total investment in securities at the end of the period by the affiliated Master Portfolio’s portfolio turnover rate. |
The accompanying notes are an integral part of these financial statements.
Allspring Small Company Value Fund | 15
(For a share outstanding throughout each period)
| Six months ended
November 30, 2023
(unaudited) | |
| | | | | |
Net asset value, beginning of period | | | | | | |
| | | | | | |
Net realized and unrealized gains (losses) on investments | | | | | | |
Total from investment operations | | | | | | |
Distributions to shareholders from | | | | | | |
| | | | | | |
| | | | | | |
Total distributions to shareholders | | | | | | |
Net asset value, end of period | | | | | | |
| | | | | | |
Ratios to average net assets (annualized)* | | | | | | |
| | | | | | |
| | | | | | |
| | | | | | |
| | | | | | |
| | | | | | |
Net assets, end of period (000s omitted) | | | | | | |
| Ratios include net expenses allocated from the affiliated Master Portfolio which were as follows: |
Six months ended November 30, 2023 (unaudited) | |
| |
| |
| |
| |
| |
| Calculated based upon average shares outstanding |
| Returns for periods of less than one year are not annualized. |
| Portfolio turnover rate is calculated by multiplying the affiliated Master Portfolio’s percentage of the Fund’s total investment in securities at the end of the period by the affiliated Master Portfolio’s portfolio turnover rate. |
The accompanying notes are an integral part of these financial statements.
16 | Allspring Small Company Value Fund
(For a share outstanding throughout each period)
| Six months ended
November 30, 2023
(unaudited) | |
| | | | | |
Net asset value, beginning of period | | | | | | |
| | | | | | |
Net realized and unrealized gains (losses) on investments | | | | | | |
Total from investment operations | | | | | | |
Distributions to shareholders from | | | | | | |
| | | | | | |
| | | | | | |
Total distributions to shareholders | | | | | | |
Net asset value, end of period | | | | | | |
| | | | | | |
Ratios to average net assets (annualized)* | | | | | | |
| | | | | | |
| | | | | | |
| | | | | | |
| | | | | | |
| | | | | | |
Net assets, end of period (000s omitted) | | | | | | |
| Ratios include net expenses allocated from the affiliated Master Portfolio which were as follows: |
Six months ended November 30, 2023 (unaudited) | |
| |
| |
| |
| |
| |
| Calculated based upon average shares outstanding |
| Returns for periods of less than one year are not annualized. |
| Portfolio turnover rate is calculated by multiplying the affiliated Master Portfolio’s percentage of the Fund’s total investment in securities at the end of the period by the affiliated Master Portfolio’s portfolio turnover rate. |
The accompanying notes are an integral part of these financial statements.
Allspring Small Company Value Fund | 17
Notes to financial statements (unaudited)
Notes to financial statements
Allspring Funds Trust (the “Trust”), a Delaware statutory trust organized on March 10, 1999, is an open-end management investment company registered under the Investment Company Act of 1940, as amended (the “1940 Act”). As an investment company, the Trust follows the accounting and reporting guidance in Financial Accounting Standards Board (“FASB”) Accounting Standards Codification Topic 946, Financial Services – Investment Companies. These financial statements report on the Allspring Small Company Value Fund (the “Fund”) which is a diversified series of the Trust.
The Fund is a feeder fund in a master-feeder structure that invests substantially all of its assets in a single master portfolio with a substantially identical investment objective and substantially similar investment strategies. The Fund invests in Allspring Small Company Value Portfolio, a separate diversified portfolio (the “affiliated Master Portfolio”) of Allspring Master Trust, a registered open-end management investment company. As of November 30, 2023, the Fund owned 88.78% of Allspring Small Company Value Portfolio. The affiliated Master Portfolio directly acquires portfolio securities and the Fund acquires an indirect interest in those securities. The Fund accounts for its investment in the affiliated Master Portfolio as a partnership investment and records on a daily basis its share of the affiliated Master Portfolio’s income, expense and realized and unrealized gains and losses. The financial statements of the affiliated Master Portfolio for the six months ended November 30, 2023 are included in this report and should be read in conjunction with the Fund’s financial statements.
2.
SIGNIFICANT ACCOUNTING POLICIES
The following significant accounting policies, which are consistently followed in the preparation of the financial statements of the Fund, are in conformity with U.S. generally accepted accounting principles which require management to make estimates and assumptions that affect the reported amounts of assets and liabilities, disclosure of contingent assets and liabilities at the date of the financial statements, and the reported amounts of income and expenses during the reporting period. Actual results could differ from those estimates.
Securities valuation
All investments are valued each business day as of the close of regular trading on the New York Stock Exchange (generally 4 p.m. Eastern Time), although the Fund may deviate from this calculation time under unusual or unexpected circumstances.
Investments in the affiliated Master Portfolio are valued daily based on the Fund’s proportionate share of the affiliated Master Portfolio’s net assets, which are also valued daily.
Investments which are not valued using the method discussed above are valued at their fair value, as determined in good faith by Allspring Funds Management, LLC (“Allspring Funds Management”), which was named the valuation designee by the Board of Trustees. As the valuation designee, Allspring Funds Management is responsible for day-to-day valuation activities for the Allspring Funds. In connection with these responsibilities, Allspring Funds Management has established a Valuation Committee and has delegated to it the authority to take any actions regarding the valuation of portfolio securities that the Valuation Committee deems necessary or appropriate, including determining the fair value of portfolio securities. On a quarterly basis, the Board of Trustees receives reports of valuation actions taken by the Valuation Committee. On at least an annual basis, the Board of Trustees receives an assessment of the adequacy and effectiveness of Allspring Funds Management’s process for determining the fair value of the portfolio of investments.
Investment transactions, income and expenses
Investments in the affiliated Master Portfolio are recorded on a trade date basis. The Fund records daily its proportionate share of the affiliated Master Portfolio’s income, expenses and realized and unrealized gains or losses. The Fund also accrues its own expenses.
Distributions to shareholders
Distributions to shareholders from net investment income and any net realized gains are recorded on the ex-dividend date and paid at least annually. Such distributions are determined in accordance with income tax regulations and may differ from U.S. generally accepted accounting principles. Dividend sources are estimated at the time of declaration. The tax character of distributions is determined as of the Fund’s fiscal year end. Therefore, a portion of the Fund’s distributions made prior to the Fund’s fiscal year end may be categorized as a tax return of capital at year end.
Federal and other taxes
The Fund intends to continue to qualify as a regulated investment company by distributing substantially all of its investment company taxable income and any net realized capital gains (after reduction for capital loss carryforwards) sufficient to relieve it from all, or substantially all, federal income taxes. Accordingly, no provision for federal income taxes was required.
The Fund’s income and federal excise tax returns and all financial records supporting those returns for the prior three fiscal years are subject to examination by the federal and Delaware revenue authorities. Management has analyzed the Fund’s tax positions taken on federal, state, and foreign tax returns, as applicable, for all open tax years and does not believe that there are any uncertain tax positions that require recognition of a tax liability.
18 | Allspring Small Company Value Fund
Notes to financial statements (unaudited)
As of November 30, 2023, the aggregate cost of all investments for federal income tax purposes was $385,348,064 and the unrealized gains (losses) consisted of:
Class allocations
The separate classes of shares offered by the Fund differ principally in applicable sales charges, distribution, shareholder servicing, and administration fees. Class specific expenses are charged directly to that share class. Investment income, common fund-level expenses, and realized and unrealized gains (losses) on investments are allocated daily to each class of shares based on the relative proportion of net assets of each class.
3.
FAIR VALUATION MEASUREMENTS
At November 30, 2023, the Fund’s investment in the affiliated Master Portfolio was measured at fair value using the net asset value per share (or its equivalent) as a practical expedient. The investment objective and fair value of the affiliated Master Portfolio is as follows:
Affiliated Master Portfolio | | Fair value of affiliated
Master Portfolio |
Allspring Small Company Value Portfolio | Seeks long-term capital appreciation | |
The affiliated Master Portfolio does not have a redemption period notice, can be redeemed daily and does not have any unfunded commitments.
4.
TRANSACTIONS WITH AFFILIATES
Management fee
Allspring Funds Management, a wholly owned subsidiary of Allspring Global Investments Holdings, LLC, a holding company indirectly owned by certain private funds of GTCR LLC and Reverence Capital Partners, L.P., is the manager of the Fund and provides advisory and fund-level administrative services under an investment management agreement. Under the investment management agreement, Allspring Funds Management is responsible for, among other services, implementing the investment objectives and strategies of the Fund and providing fund-level administrative services in connection with the Fund’s operations. As long as the Fund continues to invest substantially all of its assets in a single affiliated Master Portfolio, the Fund pays Allspring Funds Management an investment management fee only for fund-level administrative services at the following annual rate based on the Fund’s average daily net assets:
For the six months ended November 30, 2023, the management fee was equivalent to an annual rate of 0.05% of the Fund’s average daily net assets.
Allspring Funds Management also serves as the adviser to the affiliated Master Portfolio and is entitled to receive a fee from the affiliated Master Portfolio for those services.
Administration fees
Under a class-level administration agreement, Allspring Funds Management provides class-level administrative services to the Fund, which includes paying fees and expenses for services provided by the transfer agent, sub-transfer agents, omnibus account servicers and record-keepers. As compensation for its services under the class-level administration agreement, Allspring Funds Management receives an annual fee which is calculated based on the average daily net assets of each class as follows:
| Class-level
administration fee |
| |
| |
| |
| |
| |
Prior to June 30, 2023, the class-level administration fee for Class A and Class C was 0.21% of its respective average daily net assets.
Allspring Small Company Value Fund | 19
Notes to financial statements (unaudited)
Waivers and/or expense reimbursements
Allspring Funds Management has contractually committed to waive and/or reimburse management and administration fees to the extent necessary to maintain certain net operating expense ratios for the Fund. When each class of the Fund has exceeded its expense cap, Allspring Funds Management will waive fees and/or reimburse expenses from fund-level expenses on a proportionate basis and then from class specific expenses. When only certain classes exceed their expense caps, waivers and/or reimbursements are applied against class specific expenses before fund-level expenses. Net expenses from the affiliated Master Portfolio are included in the expense caps. Allspring Funds Management has contractually committed through September 30, 2024 to waive fees and/or reimburse expenses to the extent necessary to cap the Fund’s expenses. Prior to or after the commitment expiration date, the caps may be increased or the commitment to maintain the cap may be terminated only with the approval of the Board of Trustees. As of November 30, 2023, the contractual expense caps are as follows:
Distribution fee
The Trust has adopted a distribution plan for Class C shares pursuant to Rule 12b-1 under the 1940 Act. A distribution fee is charged to Class C shares and paid to Allspring Funds Distributor, LLC (“Allspring Funds Distributor”), the principal underwriter, an affiliate of Allspring Funds Management, at an annual rate up to 0.75% of the average daily net assets of Class C shares.
In addition, Allspring Funds Distributor is entitled to receive the front-end sales charge from the purchase of Class A shares and a contingent deferred sales charge on the redemption of certain Class A shares. Allspring Funds Distributor is also entitled to receive the contingent deferred sales charges from redemptions of Class C shares. For the six months ended November 30, 2023, Allspring Funds Distributor received $276 from the sale of Class A shares. No contingent deferred sales charges were incurred by Class A and Class C shares for the six months ended November 30, 2023.
Shareholder servicing fees
The Trust has entered into contracts with one or more shareholder servicing agents, whereby Class A, Class C, and Administrator Class are charged a fee at an annual rate up to 0.25% of the average daily net assets of each respective class. A portion of these total shareholder servicing fees were paid to affiliates of the Fund.
5.
INVESTMENT PORTFOLIO TRANSACTIONS
The Fund seeks to achieve its investment objective by investing substantially all of its assets in the affiliated Master Portfolio. Purchases and sales have been calculated by multiplying the Fund’s ownership percentage of the affiliated Master Portfolio at the end of the period by the affiliated Master Portfolio’s purchases and sales. Purchases and sales of investments, excluding U.S. government obligations (if any) and short-term securities, for the six months ended November 30, 2023 were $260,742,070 and $287,981,224, respectively.
The Trust (excluding the money market funds), Allspring Master Trust and Allspring Variable Trust are parties to a $350,000,000 revolving credit agreement whereby the Fund is permitted to use bank borrowings for temporary or emergency purposes, such as to fund shareholder redemption requests. Interest under the credit agreement is charged to the Fund based on borrowing rate equal to the higher of the Federal Funds rate or the overnight bank funding rate in effect on that day plus a spread. In addition, an annual commitment fee based on the unused balance is allocated to each participating fund.
For the six months ended November 30, 2023, there were no borrowings by the Fund under the agreement.
Concentration risks result from exposure to a limited number of sectors. Through its investment in the affiliated Master Portfolio which may invest a substantial portion of its assets in any sectors, the Fund may in turn be more affected by changes in that sectors than a fund whose investments are not heavily weighted in any sectors. As of the end of the period, the Master Portfolio concentrated its portfolio in investments related to the financials sector.
Under the Fund’s organizational documents, the officers and Trustees have been granted certain indemnification rights against certain liabilities that may arise out of performance of their duties to the Fund. The Fund has entered into a separate agreement with each Trustee that converts indemnification rights currently existing under the Fund’s organizational documents into contractual rights that cannot be changed in the future without
20 | Allspring Small Company Value Fund
Notes to financial statements (unaudited)
the consent of the Trustee. Additionally, in the normal course of business, the Fund may enter into contracts with service providers that contain a variety of indemnification clauses. The Fund’s maximum exposure under these arrangements is dependent on future claims that may be made against the Fund and, therefore, cannot be estimated.
Allspring Small Company Value Fund | 21
Portfolio of investments—November 30, 2023 (unaudited)
| | | | | |
| | | | | | |
Communication services: 0.87% | | | | | | |
Interactive media & services: 0.87% | | | | | | |
| | | | | | |
Consumer discretionary: 13.93% | | | | | | |
Automobile components: 1.07% | | | | | | |
| | | | | | |
Diversified consumer services: 0.77% | | | | | | |
Adtalem Global Education, Inc.† | | | | | | |
Grand Canyon Education, Inc.† | | | | | | |
| | | | | | |
Hotels, restaurants & leisure: 1.32% | | | | | | |
Carrols Restaurant Group, Inc. | | | | | | |
Wyndham Hotels & Resorts, Inc. | | | | | | |
| | | | | | |
Household durables: 3.72% | | | | | | |
| | | | | | |
Century Communities, Inc. | | | | | | |
Ethan Allen Interiors, Inc. | | | | | | |
| | | | | | |
| | | | | | |
| | | | | | |
Johnson Outdoors, Inc. Class A | | | | | | |
Malibu Boats, Inc. Class A† | | | | | | |
| | | | | | |
| | | | | | |
American Eagle Outfitters, Inc. | | | | | | |
Dick’s Sporting Goods, Inc. | | | | | | |
| | | | | | |
| | | | | | |
| | | | | | |
| | | | | | |
| | | | | | |
Textiles, apparel & luxury goods: 0.38% | | | | | | |
| | | | | | |
| | | | | | |
| | | | | | |
Coca-Cola Consolidated, Inc. | | | | | | |
Consumer staples distribution & retail: 1.09% | | | | | | |
Grocery Outlet Holding Corp.† | | | | | | |
The accompanying notes are an integral part of these financial statements.
22 | Allspring Small Company Value Portfolio
Portfolio of investments—November 30, 2023 (unaudited)
| | | | | |
Consumer staples distribution & retail(continued) | | | | | | |
Ingles Markets, Inc. Class A | | | | | | |
Sprouts Farmers Market, Inc.† | | | | | | |
| | | | | | |
| | | | | | |
| | | | | | |
John B Sanfilippo & Son, Inc. | | | | | | |
Tootsie Roll Industries, Inc. | | | | | | |
| | | | | | |
Household products: 0.15% | | | | | | |
Central Garden & Pet Co. Class A† | | | | | | |
| | | | | | |
Energy equipment & services: 1.99% | | | | | | |
| | | | | | |
Patterson-UTI Energy, Inc. | | | | | | |
| | | | | | |
Oil, gas & consumable fuels: 6.73% | | | | | | |
California Resources Corp. | | | | | | |
| | | | | | |
| | | | | | |
| | | | | | |
| | | | | | |
| | | | | | |
| | | | | | |
| | | | | | |
| | | | | | |
| | | | | | |
| | | | | | |
| | | | | | |
Atlantic Union Bankshares Corp. | | | | | | |
| | | | | | |
| | | | | | |
| | | | | | |
| | | | | | |
Great Southern Bancorp, Inc. | | | | | | |
| | | | | | |
| | | | | | |
| | | | | | |
| | | | | | |
| | | | | | |
| | | | | | |
| | | | | | |
| | | | | | |
Donnelley Financial Solutions, Inc.† | | | | | | |
The accompanying notes are an integral part of these financial statements.
Allspring Small Company Value Portfolio | 23
Portfolio of investments—November 30, 2023 (unaudited)
| | | | | |
Capital markets(continued) | | | | | | |
| | | | | | |
| | | | | | |
| | | | | | |
Financial services: 2.65% | | | | | | |
Cass Information Systems, Inc. | | | | | | |
Federal Agricultural Mortgage Corp. Class C | | | | | | |
Jackson Financial, Inc. Class A | | | | | | |
| | | | | | |
| | | | | | |
| | | | | | |
| | | | | | |
Brighthouse Financial, Inc.† | | | | | | |
Genworth Financial, Inc. Class A† | | | | | | |
| | | | | | |
| | | | | | |
Mortgage real estate investment trusts (REITs): 2.80% | | | | | | |
| | | | | | |
Annaly Capital Management, Inc. | | | | | | |
| | | | | | |
| | | | | | |
| | | | | | |
| | | | | | |
Health care equipment & supplies: 3.02% | | | | | | |
Globus Medical, Inc. Class A† | | | | | | |
| | | | | | |
| | | | | | |
Merit Medical Systems, Inc.† | | | | | | |
| | | | | | |
| | | | | | |
| | | | | | |
| | | | | | |
Health care providers & services: 3.28% | | | | | | |
| | | | | | |
AMN Healthcare Services, Inc.† | | | | | | |
Brookdale Senior Living, Inc.† | | | | | | |
| | | | | | |
| | | | | | |
Option Care Health, Inc.† | | | | | | |
Quipt Home Medical Corp.† | | | | | | |
| | | | | | |
The accompanying notes are an integral part of these financial statements.
24 | Allspring Small Company Value Portfolio
Portfolio of investments—November 30, 2023 (unaudited)
| | | | | |
| | | | | | |
| | | | | | |
Prestige Consumer Healthcare, Inc.† | | | | | | |
| | | | | | |
| | | | | | |
| | | | | | |
| | | | | | |
Gibraltar Industries, Inc.† | | | | | | |
| | | | | | |
Zurn Elkay Water Solutions Corp. Class C | | | | | | |
| | | | | | |
Commercial services & supplies: 0.56% | | | | | | |
| | | | | | |
Construction & engineering: 2.12% | | | | | | |
Comfort Systems USA, Inc. | | | | | | |
| | | | | | |
Sterling Infrastructure, Inc.† | | | | | | |
| | | | | | |
Electrical equipment: 0.85% | | | | | | |
| | | | | | |
| | | | | | |
| | | | | | |
Ground transportation: 1.08% | | | | | | |
| | | | | | |
| | | | | | |
Allison Transmission Holdings, Inc. | | | | | | |
| | | | | | |
| | | | | | |
| | | | | | |
| | | | | | |
Standex International Corp. | | | | | | |
| | | | | | |
| | | | | | |
| | | | | | |
| | | | | | |
Marine transportation: 0.93% | | | | | | |
| | | | | | |
Professional services: 0.96% | | | | | | |
| | | | | | |
| | | | | | |
| | | | | | |
The accompanying notes are an integral part of these financial statements.
Allspring Small Company Value Portfolio | 25
Portfolio of investments—November 30, 2023 (unaudited)
| | | | | |
Trading companies & distributors: 2.45% | | | | | | |
| | | | | | |
| | | | | | |
Hudson Technologies, Inc.† | | | | | | |
| | | | | | |
| | | | | | |
Information technology: 8.92% | | | | | | |
Communications equipment: 0.20% | | | | | | |
| | | | | | |
| | | | | | |
| | | | | | |
Electronic equipment, instruments & components: 4.23% | | | | | | |
| | | | | | |
| | | | | | |
Insight Enterprises, Inc.† | | | | | | |
Napco Security Technologies, Inc. | | | | | | |
| | | | | | |
Richardson Electronics Ltd. | | | | | | |
| | | | | | |
| | | | | | |
| | | | | | |
| | | | | | |
| | | | | | |
| | | | | | |
| | | | | | |
| | | | | | |
Semiconductors & semiconductor equipment: 1.83% | | | | | | |
| | | | | | |
| | | | | | |
| | | | | | |
| | | | | | |
| | | | | | |
| | | | | | |
| | | | | | |
| | | | | | |
| | | | | | |
| | | | | | |
| | | | | | |
| | | | | | |
Core Molding Technologies, Inc.† | | | | | | |
| | | | | | |
| | | | | | |
Minerals Technologies, Inc. | | | | | | |
| | | | | | |
The accompanying notes are an integral part of these financial statements.
26 | Allspring Small Company Value Portfolio
Portfolio of investments—November 30, 2023 (unaudited)
| | | | | |
Construction materials: 2.05% | | | | | | |
| | | | | | |
| | | | | | |
| | | | | | |
Containers & packaging: 0.46% | | | | | | |
| | | | | | |
| | | | | | |
| | | | | | |
Ramaco Resources, Inc. Class A | | | | | | |
Worthington Industries, Inc. | | | | | | |
| | | | | | |
| | | | | | |
| | | | | | |
Armada Hoffler Properties, Inc. | | | | | | |
| | | | | | |
Global Medical REIT, Inc. | | | | | | |
| | | | | | |
Plymouth Industrial REIT, Inc. | | | | | | |
| | | | | | |
| | | | | | |
| | | | | | |
| | | | | | |
| | | | | | |
| | | | | | |
Brixmor Property Group, Inc. | | | | | | |
Retail Opportunity Investments Corp. | | | | | | |
| | | | | | |
| | | | | | |
Specialized REITs : 0.81% | | | | | | |
| | | | | | |
| | | | | | |
Electric utilities: 0.10% | | | | | | |
| | | | | | |
Total common stocks (Cost $391,837,508) | | | | | | |
The accompanying notes are an integral part of these financial statements.
Allspring Small Company Value Portfolio | 27
Portfolio of investments—November 30, 2023 (unaudited)
| | | | | |
| | | | | | |
| | | | | | |
Energy equipment & services: 0.00% | | | | | | |
| | | | | | |
| | | | | | |
| | | | | |
Short-term investments: 0.89% | | | | | | |
Investment companies: 0.89% | | | | | | |
Allspring Government Money Market Fund Select Class♠∞ | | | | | | |
Total short-term investments (Cost $4,605,062) | | | | | | |
Total investments in securities (Cost $396,442,570) | | | | | | |
Other assets and liabilities, net | | | | | | |
| | | | | | |
| Non-income-earning security |
| The issuer of the security is an affiliated person of the Portfolio as defined in the Investment Company Act of 1940. |
| The rate represents the 7-day annualized yield at period end. |
|
| Real estate investment trust |
Investments in affiliates
An affiliated investment is an investment in which the Portfolio owns at least 5% of the outstanding voting shares of the issuer or as a result of other relationships, such as the Portfolio and the issuer having the same adviser or investment manager. Transactions with issuers that were affiliates of the Portfolio at the end of the period were as follows:
| | | | | Net
change in
unrealized
gains
(losses) | | | Income
from
affiliated
securities |
| | | | | | | | |
Allspring Government Money Market Fund Select Class | | | | | | | | |
The accompanying notes are an integral part of these financial statements.
28 | Allspring Small Company Value Portfolio
Statement of assets and liabilities—November 30, 2023 (unaudited)
Financial statements
Statement of assets and liabilities
| |
Investments in unaffiliated securities, at value (cost $391,837,508) | |
Investments in affiliated securities, at value (cost $4,605,062) | |
| |
Receivable for investments sold | |
| |
Prepaid expenses and other assets | |
| |
| |
Payable for investments purchased | |
| |
Trustees’ fees and expenses payable | |
Accrued expenses and other liabilities | |
| |
| |
The accompanying notes are an integral part of these financial statements.
Allspring Small Company Value Portfolio | 29
Statement of operations—six months ended November 30, 2023 (unaudited)
Statement of operations
| |
Dividends (net of foreign withholdings taxes of $10,361) | |
Income from affiliated securities | |
| |
| |
| |
| |
Custody and accounting fees | |
| |
Interest holder report expenses | |
Trustees’ fees and expenses | |
| |
| |
Less: Fee waivers and/or expense reimbursements | |
| |
| |
Realized and unrealized gains (losses) on investments | |
Net realized gains on investments | |
Net change in unrealized gains (losses) on investments | |
Net realized and unrealized gains (losses) on investments | |
Net increase in net assets resulting from operations | |
The accompanying notes are an integral part of these financial statements.
30 | Allspring Small Company Value Portfolio
Statement of changes in net assets
Statement of changes in net assets
|
Six months ended
November 30, 2023 (unaudited) | |
| | | | |
| | | | |
Net realized gains (losses) on investments | | | | |
Net change in unrealized gains (losses) on investments | | | | |
Net increase (decrease) in net assets resulting from operations | | | | |
| | | | |
Transactions in investors’ beneficial interests | | | | |
| | | | |
| | | | |
Net decrease in net assets resulting from capital transactions | | | | |
Total increase (decrease) in net assets | | | | |
| | | | |
| | | | |
| | | | |
The accompanying notes are an integral part of these financial statements.
Allspring Small Company Value Portfolio | 31
| Six months ended
November 30, 2023
(unaudited) | |
| | | | | |
| | | | | | |
Ratios to average net assets (annualized) | | | | | | |
| | | | | | |
| | | | | | |
| | | | | | |
| | | | | | |
| | | | | | |
| Returns for periods of less than one year are not annualized. |
| Net expense ratios reflect voluntary waivers, if any. |
The accompanying notes are an integral part of these financial statements.
32 | Allspring Small Company Value Portfolio
Notes to financial statements (unaudited)
Notes to financial statements
Allspring Master Trust (the “Trust”), a Delaware statutory trust organized on March 10, 1999, is an open-end management investment company registered under the Investment Company Act of 1940, as amended (the “1940 Act”). As an investment company, the Trust follows the accounting and reporting guidance in Financial Accounting Standards Board (“FASB”) Accounting Standards Codification Topic 946, Financial Services – Investment Companies. These financial statements report on the Allspring Small Company Value Portfolio (the “Portfolio”) which is a diversified series of the Trust.
Interests in the Portfolio are available solely through private placement transactions that do not involve any “public offering” within the meaning of Section 4(a)(2) of the Securities Act of 1933.
2.
SIGNIFICANT ACCOUNTING POLICIES
The following significant accounting policies, which are consistently followed in the preparation of the financial statements of the Portfolio, are in conformity with U.S. generally accepted accounting principles which require management to make estimates and assumptions that affect the reported amounts of assets and liabilities, disclosure of contingent assets and liabilities at the date of the financial statements, and the reported amounts of income and expenses during the reporting period. Actual results could differ from those estimates.
Securities valuation
All investments are valued each business day as of the close of regular trading on the New York Stock Exchange (generally 4 p.m. Eastern Time), although the Portfolio may deviate from this calculation time under unusual or unexpected circumstances.
Equity securities and exchange-traded funds that are listed on a foreign or domestic exchange or market are valued at the official closing price or, if none, the last sales price.
Investments in registered open-end investment companies (other than those listed on a foreign or domestic exchange or market) are valued at net asset value.
Investments which are not valued using the methods discussed above are valued at their fair value, as determined in good faith by Allspring Funds Management, LLC (“Allspring Funds Management”), which was named the valuation designee by the Board of Trustees. As the valuation designee, Allspring Funds Management is responsible for day-to-day valuation activities for the Allspring Funds. In connection with these responsibilities, Allspring Funds Management has established a Valuation Committee and has delegated to it the authority to take any actions regarding the valuation of portfolio securities that the Valuation Committee deems necessary or appropriate, including determining the fair value of portfolio securities. On a quarterly basis, the Board of Trustees receives reports of valuation actions taken by the Valuation Committee. On at least an annual basis, the Board of Trustees receives an assessment of the adequacy and effectiveness of Allspring Funds Management’s process for determining the fair value of the portfolio of investments.
Security transactions and income recognition
Securities transactions are recorded on a trade date basis. Realized gains or losses are recorded on the basis of identified cost.
Dividend income is recognized on the ex-dividend date. Dividend income is recorded net of foreign taxes withheld where recovery of such taxes is not assured.
Interest earned on cash balances held at the custodian is recorded as interest income.
Distributions received from REIT investments may be characterized as ordinary income, capital gains, or a return of capital to the Portfolio based on information provided by the REIT. The proper characterization of REIT distributions is generally not known until after the end of each calendar year. As such, estimates may be used in reporting the character of income and distributions for financial statement purposes.
Federal and other taxes
The Portfolio is not required to pay federal income taxes on its net investment income and net capital gains as it is treated as a partnership for federal income tax purposes. All income, gains and losses of the Portfolio are deemed to have been “passed through” to the interest holders in proportion to their holdings of the Portfolio regardless of whether income and gains have been distributed by the Portfolio.
The Portfolio’s income tax returns and all financial records supporting those returns for the prior three fiscal years are subject to examination by the federal revenue authority. Management has analyzed the Portfolio’s tax positions taken on federal, state, and foreign tax returns, as applicable, for all open tax years and does not believe that there are any uncertain tax positions that require recognition of a tax liability.
As of November 30, 2023, the aggregate cost of all investments for federal income tax purposes was $399,922,128 and the unrealized gains (losses) consisted of:
Allspring Small Company Value Portfolio | 33
Notes to financial statements (unaudited)
3.
FAIR VALUATION MEASUREMENTS
Fair value measurements of investments are determined within a framework that has established a fair value hierarchy based upon the various data inputs utilized in determining the value of the Portfolio’s investments. The three-level hierarchy gives the highest priority to unadjusted quoted prices in active markets for identical assets or liabilities (Level 1) and the lowest priority to unobservable inputs (Level 3). The Portfolio’s investments are classified within the fair value hierarchy based on the lowest level of input that is significant to the fair value measurement. The inputs are summarized into three broad levels as follows:
•Level 1—quoted prices in active markets for identical securities
•Level 2—other significant observable inputs (including quoted prices for similar securities, interest rates, prepayment speeds, credit risk, etc.)
•Level 3—significant unobservable inputs (including the Portfolio’s own assumptions in determining the fair value of investments)
The inputs or methodologies used for valuing investments in securities are not necessarily an indication of the risk associated with investing in those securities.
The following is a summary of the inputs used in valuing the Portfolio’s assets and liabilities as of November 30, 2023:
| | Other significant
observable inputs
(Level 2) | Significant
unobservable inputs
(Level 3) | |
| | | | |
| | | | |
| | | | |
| | | | |
| | | | |
| | | | |
| | | | |
| | | | |
| | | | |
| | | | |
| | | | |
| | | | |
| | | | |
| | | | |
| | | | |
| | | | |
| | | | |
| | | | |
| | | | |
Additional sector, industry or geographic detail, if any, is included in the Portfolio of Investments.
At November 30, 2023, the Portfolio did not have any transfers into/out of Level 3.
4.
TRANSACTIONS WITH AFFILIATES
Advisory fee
The Trust has entered into an advisory contract with Allspring Funds Management, a wholly owned subsidiary of Allspring Global Investments Holdings, LLC, a holding company indirectly owned by certain private funds of GTCR LLC and Reverence Capital Partners, L.P. The adviser is responsible for implementing investment policies and guidelines and for supervising the subadviser, who is responsible for day-to-day portfolio management of the Portfolio. Pursuant to the contract, Allspring Funds Management is entitled to receive an advisory fee at the following annual rate based on the Portfolio’s average daily net assets:
34 | Allspring Small Company Value Portfolio
Notes to financial statements (unaudited)
For the six months ended November 30, 2023, the advisory fee was equivalent to an annual rate of 0.80% of the Portfolio’s average daily net assets.
Allspring Funds Management has retained the services of a subadviser to provide daily portfolio management to the Portfolio. The fee for subadvisory services is borne by Allspring Funds Management. Allspring Global Investments, LLC, an affiliate of Allspring Funds Management and a wholly owned subsidiary of Allspring Global Investments Holdings, LLC, is the subadviser to the Portfolio and is entitled to receive a fee from Allspring Funds Management at an annual rate starting at 0.55% and declining to 0.40% as the average daily net assets of the Portfolio increase.
Allspring Funds Management has voluntarily waived and/or reimbursed advisory fees to reduce the net operating expense ratio of the Portfolio. These voluntary waivers may be discontinued at any time.
Interfund transactions
The Portfolio may purchase or sell portfolio investment securities to certain affiliates pursuant to Rule 17a-7 under the 1940 Act and under procedures adopted by the Board of Trustees. The procedures have been designed to ensure that these interfund transactions, which do not incur broker commissions, are effected at current market prices. Pursuant to these procedures, the Portfolio did not have any interfund transactions during the six months ended November 30, 2023.
5.
INVESTMENT PORTFOLIO TRANSACTIONS
Purchases and sales of investments, excluding U.S. government obligations (if any) and short-term securities, for the six months ended November 30, 2023 were $293,264,627 and $323,876,372, respectively.
The Trust, along with Allspring Variable Trust and Allspring Funds Trust (excluding the money market funds), are parties to a $350,000,000 revolving credit agreement whereby the Portfolio is permitted to use bank borrowings for temporary or emergency purposes, such as to fund interest holders withdrawal requests. Interest under the credit agreement is charged to the Portfolio based on borrowing rate equal to the higher of the Federal Funds rate or the overnight bank funding rate in effect on that day plus a spread. In addition, an annual commitment fee based on the unused balance is allocated to each participating fund.
For the six months ended November 30, 2023, there were no borrowings by the Portfolio under the agreement.
As of the end of the period, the Portfolio concentrated its portfolio of investments in financials sector. A fund that invests a substantial portion of its assets in any sector may be more affected by changes in that sector than would be a fund whose investments are not heavily weighted in any sector.
Under the Portfolio’s organizational documents, the officers and Trustees have been granted certain indemnification rights against certain liabilities that may arise out of performance of their duties to the Portfolio. The Portfolio has entered into a separate agreement with each Trustee that converts indemnification rights currently existing under the Portfolio’s organizational documents into contractual rights that cannot be changed in the future without the consent of the Trustee. Additionally, in the normal course of business, the Portfolio may enter into contracts with service providers that contain a variety of indemnification clauses. The Portfolio’s maximum exposure under these arrangements is dependent on future claims that may be made against the Portfolio and, therefore, cannot be estimated.
Allspring Small Company Value Portfolio | 35
Other information (unaudited)
Other information
Proxy voting information
A description of the policies and procedures used to determine how to vote proxies relating to portfolio securities is available without charge, upon request, by calling 1-866-259-3305, visiting our website at allspringglobal.com, or visiting the SEC website at sec.gov. Information regarding how the proxies related to portfolio securities were voted during the most recent 12-month period ended June 30 is available on the website at allspringglobal.com or by visiting the SEC website at sec.gov.
Quarterly portfolio holdings information
The Fund and Portfolio file their complete schedule of portfolio holdings with the SEC for the first and third quarters of each fiscal year as an exhibit to their reports on Form N-PORT. Shareholders and Interest holders may view the filed Form N-PORT by visiting the SEC website at sec.gov.
36 | Allspring Small Company Value Fund
Other information (unaudited)
Board of trustees and officers
Each of the Trustees and Officers listed in the table below acts in identical capacities for each fund in the Allspring family of funds, which consists of 126 mutual funds comprising the Allspring Funds Trust, Allspring Variable Trust, Allspring Master Trust and four closed-end funds (collectively the “Fund Complex”). This table should be read in conjunction with the Prospectus and the Statement of Additional Information†. The mailing address of each Trustee and Officer is 1415 Vantage Park Drive, 3rd Floor, Charlotte, NC 28203. Each Trustee and Officer serves an indefinite term, however, each Trustee serves such term until reaching the mandatory retirement age established by the Trustees.
Independent Trustees
| | Principal occupations during past five years or longer | Current other
public company or
investment
company
directorships |
William R. Ebsworth
(Born 1957) | | Retired. From 1984 to 2013, equities analyst, portfolio manager, research director and chief investment officer at Fidelity Management and Research Company in Boston, Tokyo, and Hong Kong, and retired in 2013 as Chief Investment Officer of Fidelity Strategic Advisers, Inc. where he led a team of investment professionals managing client assets. Prior thereto, Board member of Hong Kong Securities Clearing Co., Hong Kong Options Clearing Corp., the Thailand International Fund, Ltd., Fidelity Investments Life Insurance Company, and Empire Fidelity Investments Life Insurance Company. Serves on the Investment Company Institute’s Board of Governors since 2022 and Executive Committee since 2023 as well as the Vice Chairman of the Governing Council of the Independent Directors Council since 2023. Audit Committee Chair and Investment Committee Chair of the Vincent Memorial Hospital Foundation (non-profit organization). Mr. Ebsworth is a CFA charterholder. | |
Jane A. Freeman
(Born 1953) | Trustee,
since 2015;
Chair Liaison,
| Retired. From 2012 to 2014 and 1999 to 2008, Chief Financial Officer of Scientific Learning Corporation. From 2008 to 2012, Ms. Freeman provided consulting services related to strategic business projects. Prior to 1999, Portfolio Manager at Rockefeller & Co. and Scudder, Stevens & Clark. Board member of the Harding Loevner Funds from 1996 to 2014, serving as both Lead Independent Director and chair of the Audit Committee. Board member of the Russell Exchange Traded Funds Trust from 2011 to 2012 and the chair of the Audit Committee. Ms. Freeman is also an inactive Chartered Financial Analyst. | |
Isaiah Harris, Jr.
(Born 1952) | Trustee,
since 2009;
Audit Committee Chair,
since 2019 | Retired. Member of the Advisory Board of CEF of East Central Florida. Chairman of the Board of CIGNA Corporation from 2009 to 2021, and Director from 2005 to 2008. From 2003 to 2011, Director of Deluxe Corporation. Prior thereto, President and CEO of BellSouth Advertising and Publishing Corp. from 2005 to 2007, President and CEO of BellSouth Enterprises from 2004 to 2005 and President of BellSouth Consumer Services from 2000 to 2003. Emeritus member of the Iowa State University Foundation Board of Governors. Emeritus Member of the Advisory board of Iowa State University School of Business. Advisory Board Member, Palm Harbor Academy (private school). Advisory Board Member, Fellowship of Christian Athletes. Mr. Harris is a certified public accountant (inactive status). | |
David F. Larcker
(Born 1950) | | Distinguished Visiting Fellow at the Hoover Institution since 2022. James Irvin Miller Professor of Accounting at the Graduate School of Business (Emeritus), Stanford University, Director of the Corporate Governance Research Initiative and Senior Faculty of The Rock Center for Corporate Governance since 2006. From 2005 to 2008, Professor of Accounting at the Graduate School of Business, Stanford University. Prior thereto, Ernst & Young Professor of Accounting at The Wharton School, University of Pennsylvania from 1985 to 2005. | |
Olivia S. Mitchell
(Born 1953) | | International Foundation of Employee Benefit Plans Professor since 1993, Wharton School of the University of Pennsylvania. Director of Wharton’s Pension Research Council and Boettner Center on Pensions & Retirement Research, and Research Associate at the National Bureau of Economic Research. Previously taught at Cornell University from 1978 to 1993. | |
Timothy J. Penny
(Born 1951) | Trustee,
since 1996;
Chair,
since 2018 | President and Chief Executive Officer of Southern Minnesota Initiative Foundation, a non-profit organization, since 2007. Vice Chair of the Economic Club of Minnesota, since 2007. Co-Chair of the Committee for a Responsible Federal Budget, since 1995. Member of the Board of Trustees of NorthStar Education Finance, Inc., a non-profit organization, from 2007-2022. Senior Fellow of the University of Minnesota Humphrey Institute from 1995 to 2017. | |
* Length of service dates reflect the Trustee’s commencement of service with the Trust’s predecessor entities, where applicable.
# Ms. Freeman will serve as Chair Liaison through June 2024, at which time Ms. Wheelock will assume the role.
†
The Statement of Additional Information includes additional information about the Trustees and is available, without charge, upon request, by calling 1-800-222-8222 or by visiting the website at allspringglobal.com.
Allspring Small Company Value Fund | 37
Other information (unaudited)
| Position held and length of service* | Principal occupations during past five years or longer | Current other public company or investment company directorships |
James G. Polisson
(Born 1959) | Trustee,
since 2018; Nominating and Governance Committee Chair, since 2024 | Retired. Chief Marketing Officer, Source (ETF) UK Services, Ltd, from 2015 to 2017. From 2012 to 2015, Principal of The Polisson Group, LLC, a management consulting, corporate advisory and principal investing company. Chief Executive Officer and Managing Director at Russell Investments, Global Exchange Traded Funds from 2010 to 2012. Managing Director of Barclays Global Investors from 1998 to 2010 and Global Chief Marketing Officer for iShares and Barclays Global Investors from 2000 to 2010. Trustee of the San Francisco Mechanics’ Institute, a non- profit organization, from 2013 to 2015. Board member of the Russell Exchange Traded Fund Trust from 2011 to 2012. Director of Barclays Global Investors Holdings Deutschland GmbH from 2006 to 2009. Mr. Polisson is an attorney and has a retired status with the Massachusetts and District of Columbia Bar Associations. | |
Pamela Wheelock
(Born 1959) | Trustee,
since January 2020;
previously Trustee from
January 2018 to
| Retired. Executive and Senior Financial leadership positions in the public, private and nonprofit sectors. Interim President and CEO, McKnight Foundation, 2020. Interim Commissioner, Minnesota Department of Human Services, 2019. Chief Operating Officer, Twin Cities Habitat for Humanity, 2017-2019. Vice President for University Services, University of Minnesota, 2012- 2016. Interim President and CEO, Blue Cross and Blue Shield of Minnesota, 2011-2012. Executive Vice-President and Chief Financial Officer, Minnesota Wild, 2002-2008. Commissioner, Minnesota Department of Finance, 1999-2002. Chair of the Board of Directors of Destination Medical Center Corporation. Board member of the Minnesota Wild Foundation. | |
* Length of service dates reflect the Trustee’s commencement of service with the Trust’s predecessor entities, where applicable.
# Ms. Freeman will serve as Chair Liaison through June 2024, at which time Ms. Wheelock will assume the role.
38 | Allspring Small Company Value Fund
Other information (unaudited)
Officers1
| Position held and
length of service | Principal occupations during past five years or longer |
| | President and Chief Executive Officer of Allspring Funds Management, LLC since 2017 and Head of Global Fund Governance of Allspring Global Investments since 2022. Prior thereto, co-president of Galliard Capital Management, LLC, an affiliate of Allspring Funds Management, LLC, from 2019 to 2022 and Head of Affiliated Managers, Allspring Global Investments, from 2014 to 2019 and Executive Vice President responsible for marketing, investments and product development for Allspring Funds Management, LLC, from 2009 to 2014. |
Jeremy DePalma
(Born 1974) | Treasurer,
since 2012
(for certain funds in
the Fund Complex);
since 2021 (for
the remaining funds in the Complex) | Senior Vice President of Allspring Funds Management, LLC since 2009. Senior Vice President of Evergreen Investment Management Company, LLC from 2008 to 2010 and head of the Fund Reporting and Control Team within Fund Administration from 2005 to 2010. |
Christopher Baker
(Born 1976) | Chief Compliance Officer,
since 2022 | Global Chief Compliance Officer for Allspring Global Investments since 2022. Prior thereto, Chief Compliance Officer for State Street Global Advisors from 2018 to 2021. Senior Compliance Officer for the State Street divisions of Alternative Investment Solutions, Sector Solutions, and Global Marketing from 2015 to 2018. From 2010 to 2015 Vice President, Global Head of Investment and Marketing Compliance for State Street Global Advisors. |
Matthew Prasse
(Born 1983) | Chief Legal Officer,
since 2022;
Secretary,
since 2021 | Senior Counsel of the Allspring Legal Department since 2021. Senior Counsel of the Wells Fargo Legal Department from 2018 to 2021. Previously, Counsel for Barings LLC from 2015 to 2018. Prior to joining Barings, Associate at Morgan, Lewis & Bockius LLP from 2008 to 2015. |
1 For those Officers with tenures at Allspring Global Investments and/or Allspring Funds Management, LLC that began prior to 2021, such tenures include years of service during which these businesses/entities were known as Wells Fargo Asset Management and Wells Fargo Funds Management, LLC, respectively.
Allspring Small Company Value Fund | 39
This page is intentionally left blank.
For more information
More information about Allspring Funds is available free upon request. To obtain literature, please write, visit the Fund’s website, or call:
Allspring Funds
P.O. Box 219967
Kansas City, MO 64121-9967
Website: allspringglobal.com
Individual investors: 1-800-222-8222
Retail investment professionals: 1-888-877-9275
Institutional investment professionals: 1-800-260-5969
This report and the financial statements contained herein are submitted for the general information of the shareholders of the Fund. If this report is used for promotional purposes, distribution of the report must be accompanied or preceded by a current prospectus. Before investing, please consider the investment objectives, risks, charges, and expenses of the investment. For a current prospectus and, if available, a summary prospectus, containing this information, call 1-800-222-8222 or visit the Fund’s website at allspringglobal.com. Read the prospectus carefully before you invest or send money.
Allspring Global InvestmentsTM is the trade name for the asset management firms of Allspring Global Investments Holdings, LLC, a holding company indirectly owned by certain private funds of GTCR LLC and Reverence Capital Partners, L.P. These firms include but are not limited to Allspring Global Investments, LLC, and Allspring Funds Management, LLC. Certain products managed by Allspring entities are distributed by Allspring Funds Distributor, LLC (a broker-dealer and Member FINRA/SIPC).
This material is for general informational and educational purposes only and is NOT intended to provide investment advice or a recommendation of any kind - including a recommendation for any specific investment, strategy, or plan.
© 2024 Allspring Global Investments Holdings, LLC. All rights reserved.
ALL-12052023-kkmxx55n 01-24
SAR1815 11-23
ITEM 2. CODE OF ETHICS
Not applicable.
ITEM 3. AUDIT COMMITTEE FINANCIAL EXPERT
Not applicable.
ITEM 4. PRINCIPAL ACCOUNTANT FEES AND SERVICES
Not applicable.
ITEM 5. AUDIT COMMITTEE OF LISTED REGISTRANTS
Not applicable.
ITEM 6. INVESTMENTS
A Portfolio of Investments for the series of Allspring Master Trust is included as part of the report to shareholders filed under Item 1 of this Form.
ITEM 7. DISCLOSURE OF PROXY VOTING POLICIES AND PROCEDURES FOR CLOSED-END MANAGEMENT INVESTMENT COMPANIES
Not applicable.
ITEM 8. PORTFOLIO MANAGERS OF CLOSED-END MANAGEMENT INVESTMENT COMPANIES
Not applicable.
ITEM 9. PURCHASES OF EQUITY SECURITIES BY CLOSED-END MANAGEMENT INVESTMENT COMPANY AND AFFILIATED PURCHASERS
Not applicable.
ITEM 10. SUBMISSION OF MATTERS TO A VOTE OF SECURITY HOLDERS
There have been no material changes to the procedures by which shareholders may recommend nominees to the registrant’s Board of Trustees that have been implemented since the registrant’s last provided disclosure in response to the requirements of this Item.
ITEM 11. CONTROLS AND PROCEDURES
(a) The President and Treasurer have concluded that the Allspring Master Trust disclosure controls and procedures (as defined in Rule 30a-3(c) under the Investment Company Act of 1940) provide reasonable assurances that material information relating to the registrant is made known to them by the appropriate persons, based on their evaluation of these controls and procedures as of a date within 90 days of the filing of this report.
(b) There were no significant changes in the registrant’s internal controls over financial reporting (as defined in Rule 30a-3(d) under the Investment Company Act of 1940) that occurred during the most recent fiscal half-year of the period covered by this report that materially affected, or is reasonably likely to materially affect, the registrant’s internal control over financial reporting.
ITEM 12. DISCLOSURES OF SECURITIES LENDING ACTIVITES FOR CLOSED-END MANAGEMENT INVESTMENT COMPANIES
Not applicable.
ITEM 13. EXHIBITS
(a)(1) Not applicable.
(a)(2) Certifications pursuant to Section 302 of the Sarbanes-Oxley Act of 2002.
(a)(3) Not applicable.
(a)(4) Not applicable.
(b) Certifications pursuant to Section 906 of the Sarbanes-Oxley Act of 2002.
SIGNATURES
Pursuant to the requirements of the Securities Exchange Act of 1934 and the Investment Company Act of 1940, the registrant has duly caused this report to be signed on its behalf by the undersigned, thereunto duly authorized.
| | |
| Allspring Master Trust |
| |
| By: | | /s/ Andrew Owen |
| | Andrew Owen |
| | President |
|
| Date: January 25, 2024 |
Pursuant to the requirements of the Securities Exchange Act of 1934 and the Investment Company Act of 1940, this report has been signed below by the following persons on behalf of the registrant and in the capacities and on the date indicated.
| | |
| Allspring Master Trust |
| |
| By: | | /s/ Andrew Owen |
| | Andrew Owen |
| | President |
|
| Date: January 25, 2024 |
| |
| By: | | /s/ Jeremy DePalma |
| | Jeremy DePalma |
| | Treasurer |
|
| Date: January 25, 2024 |