
UNITED STATES
SECURITIES AND EXCHANGE COMMISSION
Washington, D.C. 20549
FORM N-CSRS
CERTIFIED SHAREHOLDER REPORT OF REGISTERED
MANAGEMENT INVESTMENT COMPANIES
Investment Company Act file number: 811-09689
Wells Fargo Master Trust
(Exact name of registrant as specified in charter)
525 Market St., San Francisco, CA 94105
(Address of principal executive offices) (Zip code)
C. David Messman
Wells Fargo Funds Management, LLC
525 Market St., San Francisco, CA 94105
(Name and address of agent for service)
Registrant’s telephone number, including area code: 800-222-8222
Date of fiscal year end: February 28
Registrant is making a filing for 11 of its series:
Wells Fargo Bloomberg Barclays U.S. Aggregate ex-Corporate Credit Portfolio, Wells Fargo Emerging Markets Bond Portfolio, Wells Fargo Factor Enhanced Emerging Markets Portfolio, Wells Fargo Factor Enhanced International Portfolio, Wells Fargo Factor Enhanced Large Cap Portfolio, Wells Fargo Factor Enhanced Small Cap Portfolio, Wells Fargo High Yield Corporate Bond Portfolio, Wells Fargo Investment Grade Corporate Bond Portfolio, Wells Fargo Strategic Retirement Bond Portfolio, Wells Fargo U.S. REIT Portfolio, and Wells Fargo International Government Bond Portfolio.
Date of reporting period: August 31, 2017
ITEM 1. REPORT TO STOCKHOLDERS
Semi-Annual Report
August 31, 2017

Target Date Funds

| ∎ | | Wells Fargo Target Today Fund (formerly Wells Fargo Dow Jones Target Today Fund) |
| ∎ | | Wells Fargo Target 2010 Fund (formerly Wells Fargo Dow Jones Target 2010 Fund) |
| ∎ | | Wells Fargo Target 2015 Fund (formerly Wells Fargo Dow Jones Target 2015 Fund) |
| ∎ | | Wells Fargo Target 2020 Fund (formerly Wells Fargo Dow Jones Target 2020 Fund) |
| ∎ | | Wells Fargo Target 2025 Fund (formerly Wells Fargo Dow Jones Target 2025 Fund) |
| ∎ | | Wells Fargo Target 2030 Fund (formerly Wells Fargo Dow Jones Target 2030 Fund) |
| ∎ | | Wells Fargo Target 2035 Fund (formerly Wells Fargo Dow Jones Target 2035 Fund) |
| ∎ | | Wells Fargo Target 2040 Fund (formerly Wells Fargo Dow Jones Target 2040 Fund) |
| ∎ | | Wells Fargo Target 2045 Fund (formerly Wells Fargo Dow Jones Target 2045 Fund) |
| ∎ | | Wells Fargo Target 2050 Fund (formerly Wells Fargo Dow Jones Target 2050 Fund) |
| ∎ | | Wells Fargo Target 2055 Fund (formerly Wells Fargo Dow Jones Target 2055 Fund) |
| ∎ | | Wells Fargo Target 2060 Fund (formerly Wells Fargo Dow Jones Target 2060 Fund) |

Reduce clutter. Save trees.
Sign up for electronic delivery of prospectuses and shareholder reports at wellsfargo.com/advantagedelivery
Contents
Dow Jones® and Dow Jones Target Date IndexesSM are service marks of Dow Jones Trademark Holdings LLC (Dow Jones); have been licensed to CME Group Index Services LLC (CME Indexes); and have been sublicensed for use for certain purposes by Wells Fargo Funds Management, LLC. The Wells Fargo Target Date Funds are not sponsored, endorsed, sold, or promoted by Dow Jones, CME Indexes, or their respective affiliates, and none of them makes any representation regarding the advisability of investing in such product(s).
The views expressed and any forward-looking statements are as of August 31, 2017, unless otherwise noted, and are those of the Fund managers and/or Wells Fargo Funds Management, LLC. Discussions of individual securities, or the markets generally, or any Wells Fargo Fund are not intended as individual recommendations. Future events or results may vary significantly from those expressed in any forward-looking statements. The views expressed are subject to change at any time in response to changing circumstances in the market. Wells Fargo Funds Management, LLC and the Fund disclaim any obligation to publicly update or revise any views expressed or forward-looking statements.
NOT FDIC INSURED ◾ NO BANK GUARANTEE ◾ MAY LOSE VALUE
| | | | |
| 2 | | Wells Fargo Target Date Funds | | Letter to shareholders (unaudited) |

Andrew Owen
President
Wells Fargo Funds
Hiring remained strong, and business and consumer sentiment improved.
During the second quarter, most equity markets in the U.S. and abroad advanced.
Dear Shareholder:
We are pleased to offer you this semi-annual report for the Wells Fargo Target Date Funds for the six-month period that ended August 31, 2017. Effective July 14, 2017, the Wells Fargo Target Date Funds, following a vote of the Wells Fargo Funds Board of Trustees, approved several enhancements to the Wells Fargo Dow Jones Target Date Funds. Despite heightened market volatility at times, in general, global stocks delivered double-digit results and bond markets had smaller, but positive, results as well. U.S. and international stocks returned 5.65% and 13.05%, respectively, for the six-month period, as measured by the S&P 500 Index1 and the MSCI ACWI ex USA Index (Net)2; within fixed income, the Bloomberg Barclays U.S. Aggregate Bond Index3 returned 2.74% and the Bloomberg Barclays Municipal Bond Index4 returned 3.79% as interest rates rose from low levels.
Equity and bond markets advanced during the first half of 2017.
Stocks rallied globally through the first quarter of 2017, supported by signs of improvement in the U.S. and global economies. U.S. economic data released during the quarter reflected a healthy economy. Hiring remained strong, and business and consumer sentiment improved. In March, U.S. Federal Reserve (Fed) officials raised their target interest rate by a quarter percentage point to a range of 0.75% to 1.00%. With the Fed’s target interest-rate increase, short-term bond yields rose during the quarter. Meanwhile, longer-term Treasury yields were little changed, leading to positive performance. Investment-grade and high-yield bonds benefited from strong demand. Municipal bond returns were positive in the quarter, helped by strong demand and constrained new-issue supply. Stocks in emerging markets generally outperformed stocks in the U.S. and international developed markets because they benefited from both global economic growth and recent weakening in the U.S. dollar. Stocks in Asia, Europe, and Latin America also outperformed the U.S. market during the quarter.
During the second quarter, most equity markets in the U.S. and abroad advanced. Steady, albeit modest, economic growth both in the U.S. and abroad and generally favorable corporate earnings announcements after the second quarter supported higher valuations. Within the economy, U.S. inflation trended lower despite the unemployment rate continuing to decline. Ten-year U.S. Treasury yields declined, resulting in stronger prices for long-term bonds. As was widely expected, in June, the Fed raised the target interest rate by a quarter percentage point to a range of 1.00% to 1.25%. In addition, the Fed indicated that it would begin to sell bonds accumulated on its balance sheet during quantitative easing programs conducted since 2008, likely beginning later this year.
| 1 | The S&P 500 Index consists of 500 stocks chosen for market size, liquidity, and industry group representation. It is a market-value-weighted index with each stock’s weight in the index proportionate to its market value. You cannot invest directly in an index. |
| 2 | The Morgan Stanley Capital International (MSCI) All Country World Index (ACWI) ex USA Index (Net) is a free-float-adjusted market-capitalization-weighted index that is designed to measure the equity market performance of developed markets, excluding the United States and Canada. Source: MSCI. MSCI makes no express or implied warranties or representations and shall have no liability whatsoever with respect to any MSCI data contained herein. The MSCI data may not be further redistributed or used as a basis for other indexes or any securities or financial products. This report is not approved, reviewed, or produced by MSCI. You cannot invest directly in an index. |
| 3 | The Bloomberg Barclays U.S. Aggregate Bond Index is a broad-based benchmark that measures the investment-grade, U.S. dollar–denominated, fixed-rate taxable bond market, including Treasuries, government-related and corporate securities, mortgage-backed securities (agency fixed-rate and hybrid adjustable-rate mortgage pass-throughs), asset-backed securities, and commercial mortgage-backed securities. You cannot invest directly in an index. |
| 4 | The Bloomberg Barclays Municipal Bond Index is an unmanaged index composed of long-term tax-exempt bonds with a minimum credit rating of Baa. You cannot invest directly in an index. |
| 5 | The Chicago Board Options Exchange Market Volatility Index (CBOE VIX) is a popular measure of the implied volatility of S&P 500 Index options. It represents one measure of the market’s expectation of stock market volatility over the next 30-day period. You cannot invest directly in an index. |
| | | | | | |
| Letter to shareholders (unaudited) | | Wells Fargo Target Date Funds | | | 3 | |
Volatility increased during the third quarter of 2017.
Early in July and again in August, volatility expectations increased and then receded, as measured by the CBOE VIX5, amid geopolitical tensions, particularly in Asia, and declining investor optimism about President Trump’s potential to move forward with his agenda for tax and regulatory reforms. Economic momentum increased in Europe; the European Central Bank held its rates steady at low levels and continued its quantitative easing bond buying program, which is intended to spark economic activity. In emerging markets, many countries benefited from stronger currencies versus the U.S. dollar.
Don’t let short-term uncertainty derail long-term investment goals.
Periods of investment uncertainty can present challenges, but experience has taught us that maintaining long-term investment goals can be an effective way to plan for the future. To help you create a sound strategy based on your personal goals and risk tolerance, Wells Fargo Funds offers more than 100 mutual funds spanning a wide range of asset classes and investment styles. Although diversification cannot guarantee an investment profit or prevent losses, we believe it can be an effective way to manage investment risk and potentially smooth out overall portfolio performance. We encourage investors to know their investments and to understand that appropriate levels of risk-taking may unlock opportunities.
Thank you for choosing to invest with Wells Fargo Funds. We appreciate your confidence in us and remain committed to helping you meet your financial needs.
Sincerely,

Andrew Owen
President
Wells Fargo Funds
For further information about your Fund, contact your investment professional, visit our website at wellsfargofunds.com, or call us directly at 1-800-222-8222. We are available 24 hours a day, 7 days a week.
| | | | |
| 4 | | Wells Fargo Target Date Funds | | Performance highlights (unaudited) |
Wells Fargo Target Date Funds1
Investment objective
Each Fund seeks total return over time, consistent with its strategic target asset allocation.
Manager
Wells Fargo Funds Management, LLC
Subadviser‡
Wells Fargo Capital Management Incorporated
Portfolio managers‡
Kandarp R. Acharya, CFA®, FRM
Petros Bocray, CFA®, FRM
Christian L. Chan, CFA®
The target date represents the year in which investors may likely begin withdrawing assets. The Funds gradually seek to reduce market risk as the target date approaches and after it arrives by decreasing equity exposure and increasing fixed income exposure. The principal value is not guaranteed at any time, including at the target date.
Stock values fluctuate in response to the activities of individual companies and general market and economic conditions. Bond values fluctuate in response to the financial condition of individual issuers, general market and economic conditions, and changes in interest rates. Changes in market conditions and government policies may lead to periods of heightened volatility in the bond market and reduced liquidity for certain bonds held by the Funds. In general, when interest rates rise, bond values fall and investors may lose principal value. Interest-rate changes and their impact on the Funds and its share price can be sudden and unpredictable. High-yield securities have a greater risk of default and tend to be more volatile than higher-rated debt securities. The use of derivatives may reduce returns and/or increase volatility. Securities issued by U.S. government agencies or government sponsored entities may not be guaranteed by the U.S. Treasury. Certain investment strategies tend to increase the total risk of an investment (relative to the broader market). The Funds are exposed to foreign investment risk, mortgage- and asset-backed securities risk, new fund risk, regulatory risk, and smaller-company investment risk. Consult the Funds’ prospectus for additional information on these and other risks.
Please see footnotes on pages 18-19.
| | | | | | |
| Performance highlights (unaudited) | | Wells Fargo Target Date Funds | | | 5 | |
Target Today Fund
Average annual total returns (%) as of August 31, 20172
| | | | | | | | | | | | | | | | | | | | | | | | | | | | | | | | | | |
| | | | | Including sales charge | | | Excluding sales charge | | | Expense ratios3 (%) | |
| | | Inception date | | 1 year | | | 5 year | | | 10 year | | | 1 year | | | 5 year | | | 10 year | | | Gross | | | Net4 | |
| Class A (STWRX) | | 3-1-1994 | | | (4.61 | ) | | | 0.56 | | | | 2.58 | | | | 1.17 | | | | 1.75 | | | | 3.19 | | | | 0.75 | | | | 0.65 | |
| Class C (WFODX) | | 12-1-1998 | | | (0.58 | ) | | | 1.00 | | | | 2.42 | | | | 0.42 | | | | 1.00 | | | | 2.42 | | | | 1.50 | | | | 1.40 | |
| Class R (WFRRX) | | 6-28-2013 | | | – | | | | – | | | | – | | | | 1.01 | | | | 1.53 | | | | 3.06 | | | | 1.00 | | | | 0.90 | |
| Class R4 (WOTRX) | | 11-30-2012 | | | – | | | | – | | | | – | | | | 1.16 | | | | 2.08 | | | | 3.61 | | | | 0.47 | | | | 0.34 | |
| Class R6 (WOTDX) | | 6-30-2004 | | | – | | | | – | | | | – | | | | 1.63 | | | | 2.27 | | | | 3.71 | | | | 0.32 | | | | 0.19 | |
| Administrator Class (WFLOX) | | 11-8-1999 | | | – | | | | – | | | | – | | | | 1.33 | | | | 1.91 | | | | 3.37 | | | | 0.67 | | | | 0.54 | |
| Wells Fargo Target Today Blended Index5* | | – | | | – | | | | – | | | | – | | | | – | | | | – | | | | – | | | | – | | | | – | |
| Bloomberg Barclays U.S. Aggregate Bond Index6 | | – | | | – | | | | – | | | | – | | | | 0.49 | | | | 2.19 | | | | 4.40 | | | | – | | | | – | |
| S&P 500 Index7 | | – | | | – | | | | – | | | | – | | | | 16.23 | | | | 14.34 | | | | 7.61 | | | | – | | | | – | |
| Dow Jones Global Target Today Index8 | | – | | | – | | | | – | | | | – | | | | 1.88 | | | | 2.55 | | | | 4.10 | | | | – | | | | – | |
| Russell 3000® Index9 | | – | | | – | | | | – | | | | – | | | | 16.06 | | | | 14.27 | | | | 7.70 | | | | – | | | | – | |
| * | | The inception date of the index is July 14, 2017. Performance results for the periods indicated are not yet available. |
Figures quoted represent past performance, which is no guarantee of future results, and do not reflect taxes that a shareholder may pay on fund distributions or the redemption of fund shares. Investment return and principal value of an investment will fluctuate so that an investor’s shares, when redeemed, may be worth more or less than their original cost. Performance shown without sales charges would be lower if sales charges were reflected. Current performance may be lower or higher than the performance data quoted and assumes the reinvestment of dividends and capital gains. Current month-end performance is available on the Fund’s website, wellsfargofunds.com.
Index returns do not include transaction costs associated with buying and selling securities, any mutual fund fees or expenses, or any taxes. It is not possible to invest directly in an index.
For Class A shares, the maximum front-end sales charge is 5.75%. For Class C shares, the maximum contingent deferred sales charge is 1.00%. Performance including a contingent deferred sales charge assumes the sales charge for the corresponding time period. Class R, Class R4, Class R6, and Administrator Class shares are sold without a front-end sales charge or contingent deferred sales charge.
Please see footnotes on pages 18-19.
| | | | |
| 6 | | Wells Fargo Target Date Funds | | Performance highlights (unaudited) |
Target 2010 Fund
Average annual total returns (%) as of August 31, 201710
| | | | | | | | | | | | | | | | | | | | | | | | | | | | | | | | | | |
| | | | | Including sales charge | | | Excluding sales charge | | | Expense ratios11 (%) | |
| | | Inception date | | 1 year | | | 5 year | | | 10 year | | | 1 year | | | 5 year | | | 10 year | | | Gross | | | Net4 | |
| Class A (STNRX) | | 3-1-1994 | | | (4.61 | ) | | | 1.06 | | | | 2.44 | | | | 1.18 | | | | 2.27 | | | | 3.05 | | | | 0.78 | | | | 0.65 | |
| Class C (WFOCX) | | 12-1-1998 | | | (0.61 | ) | | | 1.50 | | | | 2.28 | | | | 0.39 | | | | 1.50 | | | | 2.28 | | | | 1.53 | | | | 1.40 | |
| Class R (WFARX) | | 6-28-2013 | | | – | | | | – | | | | – | | | | 0.90 | | | | 2.02 | | | | 2.90 | | | | 1.03 | | | | 0.90 | |
| Class R4 (WFORX) | | 11-30-2012 | | | – | | | | – | | | | – | | | | 1.50 | | | | 2.64 | | | | 3.50 | | | | 0.50 | | | | 0.34 | |
| Class R6 (WFOAX) | | 6-30-2004 | | | – | | | | – | | | | – | | | | 1.68 | | | | 2.77 | | | | 3.57 | | | | 0.35 | | | | 0.19 | |
| Administrator Class (WFLGX) | | 11-8-1999 | | | – | | | | – | | | | – | | | | 1.30 | | | | 2.42 | | | | 3.24 | | | | 0.70 | | | | 0.54 | |
| Wells Fargo Target 2010 Blended Index5* | | – | | | – | | | | – | | | | – | | | | – | | | | – | | | | – | | | | – | | | | – | |
| Bloomberg Barclays U.S. Aggregate Bond Index6 | | – | | | – | | | | – | | | | – | | | | 0.49 | | | | 2.19 | | | | 4.40 | | | | – | | | | – | |
| S&P 500 Index7 | | – | | | – | | | | – | | | | – | | | | 16.23 | | | | 14.34 | | | | 7.61 | | | | – | | | | – | |
| Dow Jones Global Target 2010 Index8 | | – | | | – | | | | – | | | | – | | | | 1.96 | | | | 3.11 | | | | 4.00 | | | | – | | | | – | |
| Russell 3000® Index9 | | – | | | – | | | | – | | | | – | | | | 16.06 | | | | 14.27 | | | | 7.70 | | | | – | | | | – | |
| * | | The inception date of the index is July 14, 2017. Performance results for the periods indicated are not yet available. |
Figures quoted represent past performance, which is no guarantee of future results, and do not reflect taxes that a shareholder may pay on fund distributions or the redemption of fund shares. Investment return and principal value of an investment will fluctuate so that an investor’s shares, when redeemed, may be worth more or less than their original cost. Performance shown without sales charges would be lower if sales charges were reflected. Current performance may be lower or higher than the performance data quoted and assumes the reinvestment of dividends and capital gains. Current month-end performance is available on the Fund’s website, wellsfargofunds.com.
Index returns do not include transaction costs associated with buying and selling securities, any mutual fund fees or expenses, or any taxes. It is not possible to invest directly in an index.
For Class A shares, the maximum front-end sales charge is 5.75%. For Class C shares, the maximum contingent deferred sales charge is 1.00%. Performance including a contingent deferred sales charge assumes the sales charge for the corresponding time period. Class R, Class R4, Class R6, and Administrator Class shares are sold without a front-end sales charge or contingent deferred sales charge.
Please see footnotes on pages 18-19.
| | | | | | |
| Performance highlights (unaudited) | | Wells Fargo Target Date Funds | | | 7 | |
Target 2015 Fund
Average annual total returns (%) as of August 31, 201712
| | | | | | | | | | | | | | | | | | | | | | | | | | | | | | | | | | |
| | | | | Including sales charge | | | Excluding sales charge | | | Expense ratios11 (%) | |
| | | Inception date | | 1 year | | | 5 year | | | 10 year | | | 1 year | | | 5 year | | | 10 year | | | Gross | | | Net4 | |
| Class A (WFACX) | | 11-30-2012 | | | (4.33 | ) | | | 2.10 | | | | 2.72 | | | | 1.51 | | | | 3.31 | | | | 3.33 | | | | 0.76 | | | | 0.65 | |
| Class R (WFBRX) | | 6-28-2013 | | | – | | | | – | | | | – | | | | 1.27 | | | | 3.03 | | | | 3.09 | | | | 1.01 | | | | 0.90 | |
| Class R4 (WFSRX) | | 11-30-2012 | | | – | | | | – | | | | – | | | | 1.82 | | | | 3.65 | | | | 3.64 | | | | 0.48 | | | | 0.34 | |
| Class R6 (WFSCX) | | 6-29-2007 | | | – | | | | – | | | | – | | | | 1.91 | | | | 3.76 | | | | 3.70 | | | | 0.33 | | | | 0.19 | |
| Administrator Class (WFFFX) | | 6-29-2007 | | | – | | | | – | | | | – | | | | 1.76 | | | | 3.43 | | | | 3.39 | | | | 0.68 | | | | 0.54 | |
| Wells Fargo Target 2015 Blended Index5* | | – | | | – | | | | – | | | | – | | | | – | | | | – | | | | – | | | | – | | | | – | |
| Bloomberg Barclays U.S. Aggregate Bond Index6 | | – | | | – | | | | – | | | | – | | | | 0.49 | | | | 2.19 | | | | 4.40 | | | | – | | | | – | |
| S&P 500 Index7 | | – | | | – | | | | – | | | | – | | | | 16.23 | | | | 14.34 | | | | 7.61 | | | | – | | | | – | |
| Dow Jones Global Target 2015 Index8 | | – | | | – | | | | – | | | | – | | | | 2.63 | | | | 4.20 | | | | 4.15 | | | | – | | | | – | |
| Russell 3000® Index9 | | – | | | – | | | | – | | | | – | | | | 16.06 | | | | 14.27 | | | | 7.70 | | | | – | | | | – | |
| * | | The inception date of the index is July 14, 2017. Performance results for the periods indicated are not yet available. |
Figures quoted represent past performance, which is no guarantee of future results, and do not reflect taxes that a shareholder may pay on fund distributions or the redemption of fund shares. Investment return and principal value of an investment will fluctuate so that an investor’s shares, when redeemed, may be worth more or less than their original cost. Performance shown without sales charges would be lower if sales charges were reflected. Current performance may be lower or higher than the performance data quoted and assumes the reinvestment of dividends and capital gains. Current month-end performance is available on the Fund’s website, wellsfargofunds.com.
Index returns do not include transaction costs associated with buying and selling securities, any mutual fund fees or expenses, or any taxes. It is not possible to invest directly in an index.
For Class A shares, the maximum front-end sales charge is 5.75%. Class R, Class R4, Class R6, and Administrator Class shares are sold without a front-end sales charge or contingent deferred sales charge.
Please see footnotes on pages 18-19.
| | | | |
| 8 | | Wells Fargo Target Date Funds | | Performance highlights (unaudited) |
Target 2020 Fund
Average annual total returns (%) as of August 31, 20172
| | | | | | | | | | | | | | | | | | | | | | | | | | | | | | | | | | |
| | | | | Including sales charge | | | Excluding sales charge | | | Expense ratios13 (%) | |
| | | Inception date | | 1 year | | | 5 year | | | 10 year | | | 1 year | | | 5 year | | | 10 year | | | Gross | | | Net4 | |
| Class A (STTRX) | | 3-1-1994 | | | (2.68 | ) | | | 3.30 | | | | 2.85 | | | | 3.26 | | | | 4.53 | | | | 3.46 | | | | 0.75 | | | | 0.65 | |
| Class C (WFLAX) | | 12-1-1998 | | | 1.41 | | | | 3.74 | | | | 2.68 | | | | 2.41 | | | | 3.74 | | | | 2.68 | | | | 1.50 | | | | 1.40 | |
| Class R (WFURX) | | 6-28-2013 | | | – | | | | – | | | | – | | | | 3.07 | | | | 4.32 | | | | 3.33 | | | | 1.00 | | | | 0.90 | |
| Class R4 (WFLRX) | | 11-30-2012 | | | – | | | | – | | | | – | | | | 3.57 | | | | 4.90 | | | | 3.91 | | | | 0.47 | | | | 0.34 | |
| Class R6 (WFOBX) | | 6-30-2004 | | | – | | | | – | | | | – | | | | 3.67 | | | | 5.02 | | | | 3.97 | | | | 0.32 | | | | 0.19 | |
| Administrator Class (WFLPX) | | 11-8-1999 | | | – | | | | – | | | | – | | | | 3.33 | | | | 4.67 | | | | 3.64 | | | | 0.67 | | | | 0.54 | |
| Wells Fargo Target 2020 Blended Index5* | | – | | | – | | | | – | | | | – | | | | – | | | | – | | | | – | | | | – | | | | – | |
| Bloomberg Barclays U.S. Aggregate Bond Index6 | | – | | | – | | | | – | | | | – | | | | 0.49 | | | | 2.19 | | | | 4.40 | | | | – | | | | – | |
| S&P 500 Index7 | | – | | | – | | | | – | | | | – | | | | 16.23 | | | | 14.34 | | | | 7.61 | | | | – | | | | – | |
| Dow Jones Global Target 2020 Index8 | | – | | | – | | | | – | | | | – | | | | 4.82 | | | | 5.56 | | | | 4.45 | | | | – | | | | – | |
| Russell 3000® Index9 | | – | | | – | | | | – | | | | – | | | | 16.06 | | | | 14.27 | | | | 7.70 | | | | – | | | | – | |
| * | | The inception date of the index is July 14, 2017. Performance results for the periods indicated are not yet available. |
Figures quoted represent past performance, which is no guarantee of future results, and do not reflect taxes that a shareholder may pay on fund distributions or the redemption of fund shares. Investment return and principal value of an investment will fluctuate so that an investor’s shares, when redeemed, may be worth more or less than their original cost. Performance shown without sales charges would be lower if sales charges were reflected. Current performance may be lower or higher than the performance data quoted and assumes the reinvestment of dividends and capital gains. Current month-end performance is available on the Fund’s website, wellsfargofunds.com.
Index returns do not include transaction costs associated with buying and selling securities, any mutual fund fees or expenses, or any taxes. It is not possible to invest directly in an index.
For Class A shares, the maximum front-end sales charge is 5.75%. For Class C shares, the maximum contingent deferred sales charge is 1.00%. Performance including a contingent deferred sales charge assumes the sales charge for the corresponding time period. Class R, Class R4, Class R6, and Administrator Class shares are sold without a front-end sales charge or contingent deferred sales charge.
Please see footnotes on pages 18-19.
| | | | | | |
| Performance highlights (unaudited) | | Wells Fargo Target Date Funds | | | 9 | |
Target 2025 Fund
Average annual total returns (%) as of August 31, 201712
| | | | | | | | | | | | | | | | | | | | | | | | | | | | | | | | | | |
| | | | | Including sales charge | | | Excluding sales charge | | | Expense ratios11 (%) | |
| | | Inception date | | 1 year | | | 5 year | | | 10 year | | | 1 year | | | 5 year | | | 10 year | | | Gross | | | Net4 | |
| Class A (WFAYX) | | 11-30-2012 | | | (0.91 | ) | | | 4.66 | | | | 3.39 | | | | 5.15 | | | | 5.91 | | | | 4.00 | | | | 0.74 | | | | 0.65 | |
| Class R (WFHRX) | | 6-28-2013 | | | – | | | | – | | | | – | | | | 4.14 | | | | 5.48 | | | | 3.69 | | | | 0.99 | | | | 0.90 | |
| Class R4 (WFGRX) | | 11-30-2012 | | | – | | | | – | | | | – | | | | 5.51 | | | | 6.28 | | | | 4.34 | | | | 0.46 | | | | 0.34 | |
| Class R6 (WFTYX) | | 6-29-2007 | | | – | | | | – | | | | – | | | | 5.72 | | | | 6.41 | | | | 4.40 | | | | 0.31 | | | | 0.19 | |
| Administrator Class (WFTRX) | | 6-29-2007 | | | – | | | | – | | | | – | | | | 5.38 | | | | 6.03 | | | | 4.08 | | | | 0.66 | | | | 0.54 | |
| Wells Fargo Target 2025 Blended Index5* | | – | | | – | | | | – | | | | – | | | | – | | | | – | | | | – | | | | – | | | | – | |
| Bloomberg Barclays U.S. Aggregate Bond Index6 | | – | | | – | | | | – | | | | – | | | | 0.49 | | | | 2.19 | | | | 4.40 | | | | – | | | | – | |
| S&P 500 Index7 | | – | | | – | | | | – | | | | – | | | | 16.23 | | | | 14.34 | | | | 7.61 | | | | – | | | | – | |
| Dow Jones Global Target 2025 Index8 | | – | | | – | | | | – | | | | – | | | | 6.78 | | | | 6.91 | | | | 4.80 | | | | – | | | | – | |
| Russell 3000® Index9 | | – | | | – | | | | – | | | | – | | | | 16.06 | | | | 14.27 | | | | 7.70 | | | | – | | | | – | |
| * | | The inception date of the index is July 14, 2017. Performance results for the periods indicated are not yet available. |
Figures quoted represent past performance, which is no guarantee of future results, and do not reflect taxes that a shareholder may pay on fund distributions or the redemption of fund shares. Investment return and principal value of an investment will fluctuate so that an investor’s shares, when redeemed, may be worth more or less than their original cost. Performance shown without sales charges would be lower if sales charges were reflected. Current performance may be lower or higher than the performance data quoted and assumes the reinvestment of dividends and capital gains. Current month-end performance is available on the Fund’s website, wellsfargofunds.com.
Index returns do not include transaction costs associated with buying and selling securities, any mutual fund fees or expenses, or any taxes. It is not possible to invest directly in an index.
For Class A shares, the maximum front-end sales charge is 5.75%. Class R, Class R4, Class R6, and Administrator Class shares are sold without a front-end sales charge or contingent deferred sales charge.
Please see footnotes on pages 18-19.
| | | | |
| 10 | | Wells Fargo Target Date Funds | | Performance highlights (unaudited) |
Target 2030 Fund
Average annual total returns (%) as of August 31, 20172
| | | | | | | | | | | | | | | | | | | | | | | | | | | | | | | | | | |
| | | | | Including sales charge | | | Excluding sales charge | | | Expense ratios13 (%) | |
| | | Inception date | | 1 year | | | 5 year | | | 10 year | | | 1 year | | | 5 year | | | 10 year | | | Gross | | | Net4 | |
| Class A (STHRX) | | 3-1-1994 | | | 1.54 | | | | 6.01 | | | | 3.60 | | | | 7.71 | | | | 7.27 | | | | 4.22 | | | | 0.75 | | | | 0.65 | |
| Class C (WFDMX) | | 12-1-1998 | | | 5.89 | | | | 6.48 | | | | 3.45 | | | | 6.89 | | | | 6.48 | | | | 3.45 | | | | 1.50 | | | | 1.40 | |
| Class R (WFJRX) | | 6-28-2013 | | | – | | | | – | | | | – | | | | 7.26 | | | | 7.00 | | | | 4.06 | | | | 1.00 | | | | 0.90 | |
| Class R4 (WTHRX) | | 11-30-2012 | | | – | | | | – | | | | – | | | | 8.06 | | | | 7.67 | | | | 4.68 | | | | 0.47 | | | | 0.34 | |
| Class R6 (WFOOX) | | 6-30-2004 | | | – | | | | – | | | | – | | | | 8.16 | | | | 7.79 | | | | 4.74 | | | | 0.32 | | | | 0.19 | |
| Administrator Class (WFLIX) | | 11-8-1999 | | | – | | | | – | | | | – | | | | 7.87 | | | | 7.42 | | | | 4.41 | | | | 0.67 | | | | 0.54 | |
| Wells Fargo Target 2030 Blended Index5* | | – | | | – | | | | – | | | | – | | | | – | | | | – | | | | – | | | | – | | | | – | |
| Bloomberg Barclays U.S. Aggregate Bond Index6 | | – | | | – | | | | – | | | | – | | | | 0.49 | | | | 2.19 | | | | 4.40 | | | | – | | | | – | |
| S&P 500 Index7 | | – | | | – | | | | – | | | | – | | | | 16.23 | | | | 14.34 | | | | 7.61 | | | | – | | | | – | |
| Dow Jones Global Target 2030 Index8 | | – | | | – | | | | – | | | | – | | | | 9.21 | | | | 8.28 | | | | 5.16 | | | | – | | | | – | |
| Russell 3000® Index9 | | – | | | – | | | | – | | | | – | | | | 16.06 | | | | 14.27 | | | | 7.70 | | | | – | | | | – | |
| * | | The inception date of the index is July 14, 2017. Performance results for the periods indicated are not yet available. |
Figures quoted represent past performance, which is no guarantee of future results, and do not reflect taxes that a shareholder may pay on fund distributions or the redemption of fund shares. Investment return and principal value of an investment will fluctuate so that an investor’s shares, when redeemed, may be worth more or less than their original cost. Performance shown without sales charges would be lower if sales charges were reflected. Current performance may be lower or higher than the performance data quoted and assumes the reinvestment of dividends and capital gains. Current month-end performance is available on the Fund’s website, wellsfargofunds.com.
Index returns do not include transaction costs associated with buying and selling securities, any mutual fund fees or expenses, or any taxes. It is not possible to invest directly in an index.
For Class A shares, the maximum front-end sales charge is 5.75%. For Class C shares, the maximum contingent deferred sales charge is 1.00%. Performance including a contingent deferred sales charge assumes the sales charge for the corresponding time period. Class R, Class R4, Class R6, and Administrator Class shares are sold without a front-end sales charge or contingent deferred sales charge.
Please see footnotes on pages 18-19.
| | | | | | |
| Performance highlights (unaudited) | | Wells Fargo Target Date Funds | | | 11 | |
Target 2035 Fund
Average annual total returns (%) as of August 31, 201712
| | | | | | | | | | | | | | | | | | | | | | | | | | | | | | | | | | |
| | | | | Including sales charge | | | Excluding sales charge | | | Expense ratios13 (%) | |
| | | Inception date | | 1 year | | | 5 year | | | 10 year | | | 1 year | | | 5 year | | | 10 year | | | Gross | | | Net4 | |
| Class A (WFQBX) | | 11-30-2012 | | | 3.62 | | | | 7.17 | | | | 4.15 | | | | 9.92 | | | | 8.44 | | | | 4.77 | | | | 0.76 | | | | 0.65 | |
| Class R (WFKRX) | | 6-28-2013 | | | – | | | | – | | | | – | | | | 9.62 | | | | 8.13 | | | | 4.48 | | | | 1.01 | | | | 0.90 | |
| Class R4 (WTTRX) | | 11-30-2012 | | | – | | | | – | | | | – | | | | 10.24 | | | | 8.79 | | | | 5.09 | | | | 0.48 | | | | 0.34 | |
| Class R6 (WFQRX) | | 6-29-2007 | | | – | | | | – | | | | – | | | | 10.41 | | | | 8.93 | | | | 5.16 | | | | 0.33 | | | | 0.19 | |
| Administrator Class (WFQWX) | | 6-29-2007 | | | – | | | | – | | | | – | | | | 10.05 | | | | 8.54 | | | | 4.79 | | | | 0.68 | | | | 0.54 | |
| Wells Fargo Target 2035 Blended Index5* | | – | | | – | | | | – | | | | – | | | | – | | | | – | | | | – | | | | – | | | | – | |
| Bloomberg Barclays U.S. Aggregate Bond Index6 | | – | | | – | | | | – | | | | – | | | | 0.49 | | | | 2.19 | | | | 4.40 | | | | – | | | | – | |
| S&P 500 Index7 | | – | | | – | | | | – | | | | – | | | | 16.23 | | | | 14.34 | | | | 7.61 | | | | – | | | | – | |
| Dow Jones Global Target 2035 Index8 | | – | | | – | | | | – | | | | – | | | | 11.38 | | | | 9.40 | | | | 5.47 | | | | – | | | | – | |
| Russell 3000® Index9 | | – | | | – | | | | – | | | | – | | | | 16.06 | | | | 14.27 | | | | 7.70 | | | | – | | | | – | |
| * | | The inception date of the index is July 14, 2017. Performance results for the periods indicated are not yet available. |
Figures quoted represent past performance, which is no guarantee of future results, and do not reflect taxes that a shareholder may pay on fund distributions or the redemption of fund shares. Investment return and principal value of an investment will fluctuate so that an investor’s shares, when redeemed, may be worth more or less than their original cost. Performance shown without sales charges would be lower if sales charges were reflected. Current performance may be lower or higher than the performance data quoted and assumes the reinvestment of dividends and capital gains. Current month-end performance is available on the Fund’s website, wellsfargofunds.com.
Index returns do not include transaction costs associated with buying and selling securities, any mutual fund fees or expenses, or any taxes. It is not possible to invest directly in an index.
For Class A shares, the maximum front-end sales charge is 5.75%. Class R, Class R4, Class R6, and Administrator Class shares are sold without a front-end sales charge or contingent deferred sales charge.
Please see footnotes on pages 18-19.
| | | | |
| 12 | | Wells Fargo Target Date Funds | | Performance highlights (unaudited) |
Target 2040 Fund
Average annual total returns (%) as of August 31, 20172
| | | | | | | | | | | | | | | | | | | | | | | | | | | | | | | | | | |
| | | | | Including sales charge | | | Excluding sales charge | | | Expense ratios13 (%) | |
| | | Inception date | | 1 year | | | 5 year | | | 10 year | | | 1 year | | | 5 year | | | 10 year | | | Gross | | | Net4 | |
| Class A (STFRX) | | 3-1-1994 | | | 5.34 | | | | 7.99 | | | | 4.24 | | | | 11.78 | | | | 9.29 | | | | 4.86 | | | | 0.75 | | | | 0.65 | |
| Class C (WFOFX) | | 7-1-1998 | | | 9.98 | | | | 8.47 | | | | 4.08 | | | | 10.98 | | | | 8.47 | | | | 4.08 | | | | 1.50 | | | | 1.40 | |
| Class R (WFMRX) | | 6-28-2013 | | | – | | | | – | | | | – | | | | 11.56 | | | | 9.06 | | | | 4.73 | | | | 1.00 | | | | 0.90 | |
| Class R4 (WTFRX) | | 11-30-2012 | | | – | | | | – | | | | – | | | | 12.13 | | | | 9.67 | | | | 5.31 | | | | 0.47 | | | | 0.34 | |
| Class R6 (WFOSX) | | 6-30-2004 | | | – | | | | – | | | | – | | | | 12.28 | | | | 9.82 | | | | 5.39 | | | | 0.32 | | | | 0.19 | |
| Administrator Class (WFLWX) | | 11-8-1999 | | | – | | | | – | | | | – | | | | 11.92 | | | | 9.43 | | | | 5.05 | | | | 0.67 | | | | 0.54 | |
| Wells Fargo Target 2040 Blended Index5* | | – | | | – | | | | – | | | | – | | | | – | | | | – | | | | – | | | | – | | | | – | |
| Bloomberg Barclays U.S. Aggregate Bond Index6 | | – | | | – | | | | – | | | | – | | | | 0.49 | | | | 2.19 | | | | 4.40 | | | | – | | | | – | |
| S&P 500 Index7 | | – | | | – | | | | – | | | | – | | | | 16.23 | | | | 14.34 | | | | 7.61 | | | | – | | | | – | |
| Dow Jones Global Target 2040 Index8 | | – | | | – | | | | – | | | | – | | | | 13.18 | | | | 10.26 | | | | 5.76 | | | | – | | | | – | |
| Russell 3000® Index9 | | – | | | – | | | | – | | | | – | | | | 16.06 | | | | 14.27 | | | | 7.70 | | | | – | | | | – | |
| * | | The inception date of the index is July 14, 2017. Performance results for the periods indicated are not yet available. |
Figures quoted represent past performance, which is no guarantee of future results, and do not reflect taxes that a shareholder may pay on fund distributions or the redemption of fund shares. Investment return and principal value of an investment will fluctuate so that an investor’s shares, when redeemed, may be worth more or less than their original cost. Performance shown without sales charges would be lower if sales charges were reflected. Current performance may be lower or higher than the performance data quoted and assumes the reinvestment of dividends and capital gains. Current month-end performance is available on the Fund’s website, wellsfargofunds.com.
Index returns do not include transaction costs associated with buying and selling securities, any mutual fund fees or expenses, or any taxes. It is not possible to invest directly in an index.
For Class A shares, the maximum front-end sales charge is 5.75%. For Class C shares, the maximum contingent deferred sales charge is 1.00%. Performance including a contingent deferred sales charge assumes the sales charge for the corresponding time period. Class R, Class R4, Class R6, and Administrator Class shares are sold without a front-end sales charge or contingent deferred sales charge.
Please see footnotes on pages 18-19.
| | | | | | |
| Performance highlights (unaudited) | | Wells Fargo Target Date Funds | | | 13 | |
Target 2045 Fund
Average annual total returns (%) as of August 31, 201712
| | | | | | | | | | | | | | | | | | | | | | | | | | | | | | | | | | |
| | | | | Including sales charge | | | Excluding sales charge | | | Expense ratios13 (%) | |
| | | Inception date | | 1 year | | | 5 year | | | 10 year | | | 1 year | | | 5 year | | | 10 year | | | Gross | | | Net4 | |
| Class A (WFQVX) | | 11-30-2012 | | | 6.51 | | | | 8.53 | | | | 4.69 | | | | 13.05 | | | | 9.81 | | | | 5.32 | | | | 0.77 | | | | 0.65 | |
| Class R (WFNRX) | | 6-28-2013 | | | – | | | | – | | | | – | | | | 12.72 | | | | 9.53 | | | | 5.06 | | | | 1.02 | | | | 0.90 | |
| Class R4 (WFFRX) | | 11-30-2012 | | | – | | | | – | | | | – | | | | 13.42 | | | | 10.21 | | | | 5.66 | | | | 0.49 | | | | 0.34 | |
| Class R6 (WFQPX) | | 6-29-2007 | | | – | | | | – | | | | – | | | | 13.54 | | | | 10.32 | | | | 5.71 | | | | 0.34 | | | | 0.19 | |
| Administrator Class (WFQYX) | | 6-29-2007 | | | – | | | | – | | | | – | | | | 13.11 | | | | 9.92 | | | | 5.38 | | | | 0.69 | | | | 0.54 | |
| Wells Fargo Target 2045 Blended Index5* | | – | | | – | | | | – | | | | – | | | | – | | | | – | | | | – | | | | – | | | | – | |
| Bloomberg Barclays U.S. Aggregate Bond Index6 | | – | | | – | | | | – | | | | – | | | | 0.49 | | | | 2.19 | | | | 4.40 | | | | – | | | | – | |
| S&P 500 Index7 | | – | | | – | | | | – | | | | – | | | | 16.23 | | | | 14.34 | | | | 7.61 | | | | – | | | | – | |
| Dow Jones Global Target 2045 Index8 | | – | | | – | | | | – | | | | – | | | | 14.41 | | | | 10.76 | | | | 5.99 | | | | – | | | | – | |
| Russell 3000® Index9 | | – | | | – | | | | – | | | | – | | | | 16.06 | | | | 14.27 | | | | 7.70 | | | | – | | | | – | |
| * | | The inception date of the index is July 14, 2017. Performance results for the periods indicated are not yet available. |
Figures quoted represent past performance, which is no guarantee of future results, and do not reflect taxes that a shareholder may pay on fund distributions or the redemption of fund shares. Investment return and principal value of an investment will fluctuate so that an investor’s shares, when redeemed, may be worth more or less than their original cost. Performance shown without sales charges would be lower if sales charges were reflected. Current performance may be lower or higher than the performance data quoted and assumes the reinvestment of dividends and capital gains. Current month-end performance is available on the Fund’s website, wellsfargofunds.com.
Index returns do not include transaction costs associated with buying and selling securities, any mutual fund fees or expenses, or any taxes. It is not possible to invest directly in an index.
For Class A shares, the maximum front-end sales charge is 5.75%. Class R, Class R4, Class R6, and Administrator Class shares are sold without a front-end sales charge or contingent deferred sales charge.
Please see footnotes on pages 18-19.
| | | | |
| 14 | | Wells Fargo Target Date Funds | | Performance highlights (unaudited) |
Target 2050 Fund
Average annual total returns (%) as of August 31, 201714
| | | | | | | | | | | | | | | | | | | | | | | | | | | | | | | | | | |
| | | | | Including sales charge | | | Excluding sales charge | | | Expense ratios11 (%) | |
| | | Inception date | | 1 year | | | 5 year | | | 10 year | | | 1 year | | | 5 year | | | 10 year | | | Gross | | | Net4 | |
| Class A (WFQAX) | | 11-30-2012 | | | 7.08 | | | | 8.66 | | | | 4.73 | | | | 13.56 | | | | 9.95 | | | | 5.36 | | | | 0.74 | | | | 0.65 | |
| Class C (WFQCX) | | 11-30-2012 | | | 11.72 | | | | 9.13 | | | | 4.57 | | | | 12.72 | | | | 9.13 | | | | 4.57 | | | | 1.49 | | | | 1.40 | |
| Class R (WFWRX) | | 6-28-2013 | | | – | | | | – | | | | – | | | | 13.37 | | | | 9.68 | | | | 5.10 | | | | 0.99 | | | | 0.90 | |
| Class R4 (WQFRX) | | 11-30-2012 | | | – | | | | – | | | | – | | | | 13.95 | | | | 10.32 | | | | 5.69 | | | | 0.46 | | | | 0.34 | |
| Class R6 (WFQFX) | | 6-29-2007 | | | – | | | | – | | | | – | | | | 14.14 | | | | 10.47 | | | | 5.76 | | | | 0.31 | | | | 0.19 | |
| Administrator Class (WFQDX) | | 6-29-2007 | | | – | | | | – | | | | – | | | | 13.75 | | | | 10.09 | | | | 5.41 | | | | 0.66 | | | | 0.54 | |
| Wells Fargo Target 2050 Blended Index5* | | – | | | – | | | | – | | | | – | | | | – | | | | – | | | | – | | | | – | | | | – | |
| Bloomberg Barclays U.S. Aggregate Bond Index6 | | – | | | – | | | | – | | | | – | | | | 0.49 | | | | 2.19 | | | | 4.40 | | | | – | | | | – | |
| S&P 500 Index7 | | – | | | – | | | | – | | | | – | | | | 16.23 | | | | 14.34 | | | | 7.61 | | | | – | | | | – | |
| Dow Jones Global Target 2050 Index8 | | – | | | – | | | | – | | | | – | | | | 14.95 | | | | 10.89 | | | | 6.05 | | | | – | | | | – | |
| Russell 3000® Index9 | | – | | | – | | | | – | | | | – | | | | 16.06 | | | | 14.27 | | | | 7.70 | | | | – | | | | – | |
| * | | The inception date of the index is July 14, 2017. Performance results for the periods indicated are not yet available. |
Figures quoted represent past performance, which is no guarantee of future results, and do not reflect taxes that a shareholder may pay on fund distributions or the redemption of fund shares. Investment return and principal value of an investment will fluctuate so that an investor’s shares, when redeemed, may be worth more or less than their original cost. Performance shown without sales charges would be lower if sales charges were reflected. Current performance may be lower or higher than the performance data quoted and assumes the reinvestment of dividends and capital gains. Current month-end performance is available on the Fund’s website, wellsfargofunds.com.
Index returns do not include transaction costs associated with buying and selling securities, any mutual fund fees or expenses, or any taxes. It is not possible to invest directly in an index.
For Class A shares, the maximum front-end sales charge is 5.75%. For Class C shares, the maximum contingent deferred sales charge is 1.00%. Performance including a contingent deferred sales charge assumes the sales charge for the corresponding time period. Class R, Class R4, Class R6, and Administrator Class shares are sold without a front-end sales charge or contingent deferred sales charge.
Please see footnotes on pages 18-19.
| | | | | | |
| Performance highlights (unaudited) | | Wells Fargo Target Date Funds | | | 15 | |
Target 2055 Fund
Average annual total returns (%) as of August 31, 201712
| | | | | | | | | | | | | | | | | | | | | | | | | | | | | | | | | | |
| | | | | Including sales charge | | | Excluding sales charge | | | Expense ratios11 (%) | |
| | | Inception date | | 1 year | | | 5 year | | | Since
inception | | | 1 year | | | 5 year | | | Since
inception | | | Gross | | | Net4 | |
| Class A (WFQZX) | | 11-30-2012 | | | 7.00 | | | | 8.64 | | | | 6.90 | | | | 13.53 | | | | 9.94 | | | | 7.94 | | | | 0.80 | | | | 0.65 | |
| Class R (WFYRX) | | 6-28-2013 | | | – | | | | – | | | | – | | | | 13.15 | | | | 9.66 | | | | 7.56 | | | | 1.05 | | | | 0.90 | |
| Class R4 (WFVRX) | | 11-30-2012 | | | – | | | | – | | | | – | | | | 13.84 | | | | 10.31 | | | | 8.30 | | | | 0.52 | | | | 0.34 | |
| Class R6 (WFQUX) | | 6-30-2011 | | | – | | | | – | | | | – | | | | 14.00 | | | | 10.45 | | | | 8.41 | | | | 0.37 | | | | 0.19 | |
| Administrator Class (WFLHX) | | 6-30-2011 | | | – | | | | – | | | | – | | | | 13.71 | | | | 10.07 | | | | 8.05 | | | | 0.72 | | | | 0.54 | |
| Wells Fargo Target 2055 Blended Index5* | | – | | | – | | | | – | | | | – | | | | – | | | | – | | | | – | | | | – | | | | – | |
| Bloomberg Barclays U.S. Aggregate Bond Index6 | | – | | | – | | | | – | | | | – | | | | 0.49 | | | | 2.19 | | | | 3.21 | ** | | | – | | | | – | |
| S&P 500 Index7 | | – | | | – | | | | – | | | | – | | | | 16.23 | | | | 14.34 | | | | 13.09** | | | | – | | | | – | |
| Dow Jones Global Target 2055 Index8 | | – | | | – | | | | – | | | | – | | | | 14.97 | | | | 10.89 | | | | 8.74 | ** | | | – | | | | – | |
| Russell 3000® Index9 | | – | | | – | | | | – | | | | – | | | | 16.06 | | | | 14.27 | | | | 12.72 | ** | | | – | | | | – | |
| * | | The inception date of the index is July 14, 2017. Performance results for the periods indicated are not yet available. |
| ** | | Return is based on the inception date of the oldest class. |
Figures quoted represent past performance, which is no guarantee of future results, and do not reflect taxes that a shareholder may pay on fund distributions or the redemption of fund shares. Investment return and principal value of an investment will fluctuate so that an investor’s shares, when redeemed, may be worth more or less than their original cost. Performance shown without sales charges would be lower if sales charges were reflected. Current performance may be lower or higher than the performance data quoted, which assumes the reinvestment of dividends and capital gains. Current month-end performance is available on the Fund’s website, wellsfargofunds.com.
Index returns do not include transaction costs associated with buying and selling securities, any mutual fund fees or expenses, or any taxes. It is not possible to invest directly in an index.
For Class A shares, the maximum front-end sales charge is 5.75%. Class R, Class R4, Class R6, and Administrator Class shares are sold without a front-end sales charge or contingent deferred sales charge.
Please see footnotes on pages 18-19.
| | | | |
| 16 | | Wells Fargo Target Date Funds | | Performance highlights (unaudited) |
Target 2060 Fund
Average annual total returns (%) as of August 31, 201714
| | | | | | | | | | | | | | | | | | | | | | | | | | |
| | | | | Including sales charge | | | Excluding sales charge | | | Expense ratios13 (%) | |
| | | Inception date | | 1 year | | | Since
inception | | | 1 year | | | Since
inception | | | Gross | | | Net4 | |
| Class A (WFAFX) | | 6-30-2015 | | | 7.14 | | | | 4.05 | | | | 13.66 | | | | 6.93 | | | | 2.25 | | | | 0.65 | |
| Class C (WFCFX) | | 6-30-2015 | | | 11.85 | | | | 6.12 | | | | 12.85 | | | | 6.12 | | | | 3.00 | | | | 1.40 | |
| Class R (WFRFX) | | 6-30-2015 | | | – | | | | – | | | | 13.36 | | | | 6.64 | | | | 2.50 | | | | 0.90 | |
| Class R4 (WFSFX) | | 6-30-2015 | | | – | | | | – | | | | 13.99 | | | | 7.28 | | | | 1.97 | | | | 0.34 | |
| Class R6 (WFUFX) | | 6-30-2015 | | | – | | | | – | | | | 14.18 | | | | 7.39 | | | | 1.82 | | | | 0.19 | |
| Administrator Class (WFDFX) | | 6-30-2015 | | | – | | | | – | | | | 13.79 | | | | 7.05 | | | | 2.17 | | | | 0.54 | |
| Wells Fargo Target 2060 Blended Index5* | | – | | | – | | | | – | | | | – | | | | – | | | | – | | | | – | |
| Bloomberg Barclays U.S. Aggregate Bond Index6 | | – | | | – | | | | – | | | | 0.49 | | | | 3.20 | | | | – | | | | – | |
| S&P 500 Index7 | | – | | | – | | | | – | | | | 16.23 | | | | 11.04 | | | | – | | | | – | |
| Dow Jones Global Target 2060 Index8 | | – | | | – | | | | – | | | | 14.97 | | | | 7.65 | | | | – | | | | – | |
| Russell 3000® Index9 | | – | | | – | | | | – | | | | 16.06 | | | | 10.24 | | | | – | | | | – | |
| * | | The inception date of the index is July 14, 2017. Performance results for the periods indicated are not yet available. |
Figures quoted represent past performance, which is no guarantee of future results, and do not reflect taxes that a shareholder may pay on fund distributions or the redemption of fund shares. Investment return and principal value of an investment will fluctuate so that an investor’s shares, when redeemed, may be worth more or less than their original cost. Performance shown without sales charges would be lower if sales charges were reflected. Current performance may be lower or higher than the performance data quoted, which assumes the reinvestment of dividends and capital gains. Current month-end performance is available on the Fund’s website, wellsfargofunds.com.
Index returns do not include transaction costs associated with buying and selling securities, any mutual fund fees or expenses, or any taxes. It is not possible to invest directly in an index.
For Class A shares, the maximum front-end sales charge is 5.75%. For Class C shares, the maximum contingent deferred sales charge is 1.00%. Performance including a contingent deferred sales charge assumes the sales charge for the corresponding time period. Class R, Class R4, Class R6, and Administrator Class shares are sold without a front-end sales charge or contingent deferred sales charge.
Please see footnotes on pages 18-19.
| | | | | | |
| Performance highlights (unaudited) | | Wells Fargo Target Date Funds | | | 17 | |
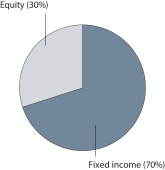
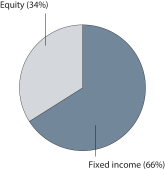
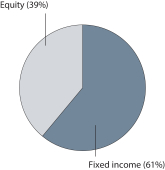
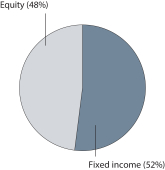
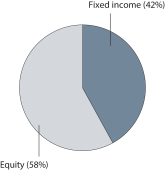
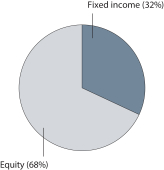
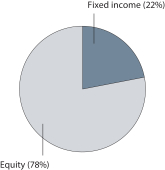
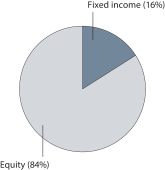
Portfolio allocation as of August 31, 201715
| | | | |
| Target Today Fund | | Target 2010 Fund | | Target 2015 Fund |
| | | |
 | |  | |  |
| | | | |
| Target 2020 Fund | | Target 2025 Fund | | Target 2030 Fund |
| | | |
 | |  | |  |
| | | | |
| Target 2035 Fund | | Target 2040 Fund | | Target 2045 Fund |
| | | |
 | |  | | 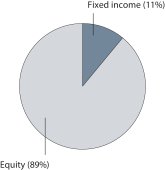 |
Please see footnotes on pages 18-19.
| | | | |
| 18 | | Wells Fargo Target Date Funds | | Performance highlights (unaudited) |
| | | | |
| Target 2050 Fund | | Target 2055 Fund | | Target 2060 Fund |
| | | |
 | |  | | 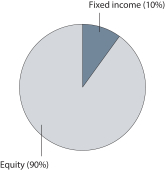 |
| ‡ | The subadviser and portfolio managers began management of each Fund effective July 14, 2017. |
| 1 | The Funds are gateway funds that invest in various affiliated master portfolios which in turn invest in a combination of securities to gain exposure to equity and fixed income asset classes. References to the investment activities of the Funds are intended to refer to the investment activities of the underlying affiliated master portfolios in which the Funds invest. |
| 2 | Historical performance shown for Class R shares prior to their inception reflects the performance of the Class A shares and has been adjusted to reflect the higher expenses applicable to Class R shares. Historical performance shown for Class R4 shares prior to their inception reflects the performance of Class R6 shares and includes the expenses applicable to Class R6. Effective June 1, 2013, Institutional Class was renamed Class R6 and modified to assume the features and attributes of Class R6. Historical performance shown for Class R6 shares from inception through May 31, 2013, reflects Institutional Class performance and expenses. |
| 3 | Reflects the expense ratios as stated in the most recent prospectuses, which include the impact of 0.15% of acquired fund fees and expenses which represent the net expenses from the underlying affiliated master portfolios. The expense ratios shown are subject to change and may differ from the annualized expense ratios shown in the financial highlights of this report. |
| 4 | The manager has contractually committed through July 31, 2018, to waive fees and/or reimburse expenses to the extent necessary to cap the Fund’s Total Annual Fund Operating Expenses After Fee Waivers at the amounts shown. Brokerage commissions, stamp duty fees, interest, taxes, acquired fund fees and expenses, and extraordinary expenses are excluded from the expense cap. After this time, the cap may be increased or the commitment to maintain the cap may be terminated only with the approval of the Board of Trustees. Net expenses from the underlying affiliated master portfolios are included in the expense cap. Without this cap, the Fund’s return would have been lower. The expense ratio paid by an investor is the net expense ratio or the Fund’s Total Annual Fund Operating Expenses After Fee Waivers, as stated in the prospectuses. |
| 5 | Effective July 14, 2017, the Fund replaced the Dow Jones Global Target Date Indexes with the Wells Fargo Blended Indexes in order to better align with the Wells Fargo Target Date Funds. See Appendix for additional details on Wells Fargo Target Date Blended Indexes. |
| 6 | The Bloomberg Barclays U.S. Aggregate Bond Index is a broad-based benchmark that measures the investment-grade, U.S. dollar-denominated, fixed-rate taxable bond market, including Treasuries, government-related and corporate securities, mortgage-backed securities (agency fixed-rate and hybrid adjustable-rate mortgage pass-throughs), asset-backed securities, and commercial mortgage-backed securities. You cannot invest directly in an index. |
| 7 | The S&P 500 Index consists of 500 stocks chosen for market size, liquidity, and industry group representation. It is a market-value-weighted index with each stock’s weight in the index proportionate to its market value. You cannot invest directly in an index. |
| 8 | The Dow Jones Global Target Date Indexes (each an “index” or collectively the “indexes”) are a series of indexes designed as benchmarks for multi-asset class portfolios with risk profiles that became more conservative over time. The index weightings among the major asset classes are adjusted monthly based on a published set of index rules. The indexes with longer time horizons have higher allocations to equity securities, while the indexes with shorter time horizons replace some of their stock allocations with allocations to fixed income securities and money market instruments. You cannot invest directly in an index. |
| 9 | The Russell 3000® Index measures the performance of the 3,000 largest U.S. companies based on total market capitalization, which represents approximately 98% of the investable U.S. equity market. You cannot invest directly in an index. |
| 10 | Historical performance shown for Class R shares prior to their inception reflects the performance of Class A shares and has been adjusted to reflect the higher expenses applicable to Class R shares. Historical performance shown for Class R4 shares prior to their inception reflects the performance of Class R6 shares, and includes the higher expenses applicable to Class R6. If these expenses had not been included, returns for Class R4 shares would be higher. Effective June 1, 2013, Institutional Class was renamed Class R6 and modified to assume the features and attributes of Class R6. Historical performance shown for Class R6 shares from inception through May 31, 2013, reflects Institutional Class performance and expenses. |
| | | | | | |
| Performance highlights (unaudited) | | Wells Fargo Target Date Funds | | | 19 | |
| 11 | Reflects the expense ratios as stated in the most recent prospectuses, which include the impact of 0.16% of acquired fund fees and expenses which represent the net expenses from the underlying affiliated master portfolios. The expense ratios shown are subject to change and may differ from the annualized expense ratios shown in the financial highlights of this report. |
| 12 | Historical performance shown for Class A shares prior to their inception reflects the performance of Class R6 shares and has been adjusted to reflect the higher expenses applicable to Class A shares. Historical performance shown for Class R shares prior to their inception reflects the performance of the former Investor Class shares and has been adjusted to reflect the higher expenses applicable to Class R shares. Historical performance shown for Class R4 shares prior to their inception reflects the performance of Class R6 shares and includes the expenses applicable to Class R4. Effective June 1, 2013, Institutional Class was renamed Class R6 and modified to assume the features and attributes of Class R6. Historical performance shown for Class R6 shares from inception through May 31, 2013, reflects Institutional Class performance and expenses. |
| 13 | Reflects the expense ratios as stated in the most recent prospectuses, which include the impact of 0.17% of acquired fund fees and expenses which represent the net expenses from the underlying affiliated master portfolios. The expense ratios shown are subject to change and may differ from the annualized expense ratios shown in the financial highlights of this report. |
| 14 | Historical performance shown for Class A and Class C shares prior to their inception reflects the performance of Class R6 shares and has been adjusted to reflect the higher expenses applicable to Class A and Class C shares. Historical performance shown for Class R shares prior to their inception reflects the performance of the former Investor Class shares and has been adjusted to reflect the higher expenses applicable to Class R shares. Historical performance shown for Class R4 shares prior to their inception reflects the performance of Class R6 shares and includes the expenses applicable to Class R6. If these expenses had not been included, returns for Class R4 shares would be higher. Effective June 1, 2013, Institutional Class was renamed Class R6 and modified to assume the features and attributes of Class R6. Historical performance shown for Class R6 shares from inception through May 31, 2013, reflects Institutional Class performance and expenses. |
| 15 | Each chart represents the composite of the portfolio allocations of the affiliated master portfolios in which the Fund invests and is calculated based on the total investments of the underlying affiliated master portfolios. Portfolio holdings are subject to change and may have changed since the date specified. See the Portfolio of investments of each underlying affiliated master portfolio which is also included in this report. |
| | | | |
| 20 | | Wells Fargo Target Date Funds | | Fund expenses (unaudited) |
As a shareholder of the Fund, you incur two types of costs: (1) transaction costs, including sales charges (loads) on purchase payments and contingent deferred sales charges (if any) on redemptions and (2) ongoing costs, including management fees, distribution (12b-1) and/or shareholder servicing fees, and other Fund expenses. This example is intended to help you understand your ongoing costs (in dollars) of investing in the Fund and to compare these costs with the ongoing costs of investing in other mutual funds.
The example is based on an investment of $1,000 invested at the beginning of the six-month period and held for the entire period from March 1, 2017 to August 31, 2017.
Actual expenses
The “Actual” line of the table below provides information about actual account values and actual expenses. You may use the information in this line, together with the amount you invested, to estimate the expenses that you paid over the period. Simply divide your account value by $1,000 (for example, an $8,600 account value divided by $1,000 = 8.6), then multiply the result by the number in the “Actual” line under the heading entitled “Expenses paid during period” for your applicable class of shares to estimate the expenses you paid on your account during this period.
Hypothetical example for comparison purposes
The “Hypothetical” line of the table below provides information about hypothetical account values and hypothetical expenses based on the Fund’s actual expense ratio and an assumed rate of return of 5% per year before expenses, which is not the Fund’s actual return. The hypothetical account values and expenses may not be used to estimate the actual ending account balance or expenses you paid for the period. You may use this information to compare the ongoing costs of investing in the Fund and other funds. To do so, compare this 5% hypothetical example with the 5% hypothetical examples that appear in the shareholder reports of the other funds.
Please note that the expenses shown in the table are meant to highlight your ongoing costs only and do not reflect any transactional costs, such as sales charges (loads) and contingent deferred sales charges. Therefore, the “Hypothetical” line of the table is useful in comparing ongoing costs only and will not help you determine the relative total costs of owning different funds. In addition, if these transactional costs were included, your costs would have been higher.
| | | | | | | | | | | | | | | | |
| Target Today Fund | | Beginning
account value
3-1-2017 | | | Ending
account value
8-31-2017 | | | Expenses
paid during
the period¹ | | | Annualized net
expense ratio | |
Class A | | | | | | | | | | | | | | | | |
Actual | | $ | 1,000.00 | | | $ | 1,023.67 | | | $ | 3.72 | | | | 0.73 | % |
Hypothetical (5% return before expenses) | | $ | 1,000.00 | | | $ | 1,021.53 | | | $ | 3.72 | | | | 0.73 | % |
Class C | | | | | | | | | | | | | | | | |
Actual | | $ | 1,000.00 | | | $ | 1,019.50 | | | $ | 7.53 | | | | 1.48 | % |
Hypothetical (5% return before expenses) | | $ | 1,000.00 | | | $ | 1,017.74 | | | $ | 7.53 | | | | 1.48 | % |
Class R | | | | | | | | | | | | | | | | |
Actual | | $ | 1,000.00 | | | $ | 1,022.79 | | | $ | 5.00 | | | | 0.98 | % |
Hypothetical (5% return before expenses) | | $ | 1,000.00 | | | $ | 1,020.27 | | | $ | 4.99 | | | | 0.98 | % |
Class R4 | | | | | | | | | | | | | | | | |
Actual | | $ | 1,000.00 | | | $ | 1,022.20 | | | $ | 2.29 | | | | 0.45 | % |
Hypothetical (5% return before expenses) | | $ | 1,000.00 | | | $ | 1,022.94 | | | $ | 2.29 | | | | 0.45 | % |
Class R6 | | | | | | | | | | | | | | | | |
Actual | | $ | 1,000.00 | | | $ | 1,025.97 | | | $ | 1.43 | | | | 0.28 | % |
Hypothetical (5% return before expenses) | | $ | 1,000.00 | | | $ | 1,023.79 | | | $ | 1.43 | | | | 0.28 | % |
Administrator Class | | | | | | | | | | | | | | | | |
Actual | | $ | 1,000.00 | | | $ | 1,025.05 | | | $ | 3.16 | | | | 0.62 | % |
Hypothetical (5% return before expenses) | | $ | 1,000.00 | | | $ | 1,022.08 | | | $ | 3.16 | | | | 0.62 | % |
| 1 | Expenses paid is equal to the annualized net expense ratio of each class multiplied by the average account value over the period, multiplied by the number of days in the most recent fiscal half-year divided by the number of days in the fiscal year (to reflect the one-half-year period). |
| | | | | | |
| Fund expenses (unaudited) | | Wells Fargo Target Date Funds | | | 21 | |
| | | | | | | | | | | | | | | | |
| Target 2010 Fund | | Beginning
account value
3-1-2017 | | | Ending
account value
8-31-2017 | | | Expenses
paid during
the period¹ | | | Annualized net
expense ratio | |
Class A | | | | | | | | | | | | | | | | |
Actual | | $ | 1,000.00 | | | $ | 1,024.98 | | | $ | 3.83 | | | | 0.75 | % |
Hypothetical (5% return before expenses) | | $ | 1,000.00 | | | $ | 1,021.42 | | | $ | 3.82 | | | | 0.75 | % |
Class C | | | | | | | | | | | | | | | | |
Actual | | $ | 1,000.00 | | | $ | 1,020.70 | | | $ | 7.64 | | | | 1.50 | % |
Hypothetical (5% return before expenses) | | $ | 1,000.00 | | | $ | 1,017.64 | | | $ | 7.63 | | | | 1.50 | % |
Class R | | | | | | | | | | | | | | | | |
Actual | | $ | 1,000.00 | | | $ | 1,023.52 | | | $ | 5.10 | | | | 1.00 | % |
Hypothetical (5% return before expenses) | | $ | 1,000.00 | | | $ | 1,020.16 | | | $ | 5.09 | | | | 1.00 | % |
Class R4 | | | | | | | | | | | | | | | | |
Actual | | $ | 1,000.00 | | | $ | 1,026.29 | | | $ | 2.25 | | | | 0.44 | % |
Hypothetical (5% return before expenses) | | $ | 1,000.00 | | | $ | 1,022.99 | | | $ | 2.24 | | | | 0.44 | % |
Class R6 | | | | | | | | | | | | | | | | |
Actual | | $ | 1,000.00 | | | $ | 1,027.11 | | | $ | 1.48 | | | | 0.29 | % |
Hypothetical (5% return before expenses) | | $ | 1,000.00 | | | $ | 1,023.74 | | | $ | 1.48 | | | | 0.29 | % |
Administrator Class | | | | | | | | | | | | | | | | |
Actual | | $ | 1,000.00 | | | $ | 1,025.50 | | | $ | 3.27 | | | | 0.64 | % |
Hypothetical (5% return before expenses) | | $ | 1,000.00 | | | $ | 1,021.98 | | | $ | 3.26 | | | | 0.64 | % |
| Target 2015 Fund | | | | | | | | | | | | |
Class A | | | | | | | | | | | | | | | | |
Actual | | $ | 1,000.00 | | | $ | 1,028.64 | | | $ | 3.83 | | | | 0.75 | % |
Hypothetical (5% return before expenses) | | $ | 1,000.00 | | | $ | 1,021.42 | | | $ | 3.82 | | | | 0.75 | % |
Class R | | | | | | | | | | | | | | | | |
Actual | | $ | 1,000.00 | | | $ | 1,027.73 | | | $ | 5.11 | | | | 1.00 | % |
Hypothetical (5% return before expenses) | | $ | 1,000.00 | | | $ | 1,020.16 | | | $ | 5.09 | | | | 1.00 | % |
Class R4 | | | | | | | | | | | | | | | | |
Actual | | $ | 1,000.00 | | | $ | 1,030.03 | | | $ | 2.30 | | | | 0.45 | % |
Hypothetical (5% return before expenses) | | $ | 1,000.00 | | | $ | 1,022.94 | | | $ | 2.29 | | | | 0.45 | % |
Class R6 | | | | | | | | | | | | | | | | |
Actual | | $ | 1,000.00 | | | $ | 1,030.81 | | | $ | 1.54 | | | | 0.30 | % |
Hypothetical (5% return before expenses) | | $ | 1,000.00 | | | $ | 1,023.69 | | | $ | 1.53 | | | | 0.30 | % |
Administrator Class | | | | | | | | | | | | | | | | |
Actual | | $ | 1,000.00 | | | $ | 1,029.47 | | | $ | 3.27 | | | | 0.64 | % |
Hypothetical (5% return before expenses) | | $ | 1,000.00 | | | $ | 1,021.98 | | | $ | 3.26 | | | | 0.64 | % |
| | | | |
| 22 | | Wells Fargo Target Date Funds | | Fund expenses (unaudited) |
| | | | | | | | | | | | | | | | |
| Target 2020 Fund | | Beginning
account value
3-1-2017 | | | Ending
account value
8-31-2017 | | | Expenses
paid during
the period¹ | | | Annualized net
expense ratio | |
Class A | | | | | | | | | | | | | | | | |
Actual | | $ | 1,000.00 | | | $ | 1,034.97 | | | $ | 3.95 | | | | 0.77 | % |
Hypothetical (5% return before expenses) | | $ | 1,000.00 | | | $ | 1,021.32 | | | $ | 3.92 | | | | 0.77 | % |
Class C | | | | | | | | | | | | | | | | |
Actual | | $ | 1,000.00 | | | $ | 1,030.51 | | | $ | 7.78 | | | | 1.52 | % |
Hypothetical (5% return before expenses) | | $ | 1,000.00 | | | $ | 1,017.54 | | | $ | 7.73 | | | | 1.52 | % |
Class R | | | | | | | | | | | | | | | | |
Actual | | $ | 1,000.00 | | | $ | 1,034.44 | | | $ | 5.33 | | | | 1.04 | % |
Hypothetical (5% return before expenses) | | $ | 1,000.00 | | | $ | 1,019.96 | | | $ | 5.30 | | | | 1.04 | % |
Class R4 | | | | | | | | | | | | | | | | |
Actual | | $ | 1,000.00 | | | $ | 1,036.30 | | | $ | 2.41 | | | | 0.47 | % |
Hypothetical (5% return before expenses) | | $ | 1,000.00 | | | $ | 1,022.84 | | | $ | 2.40 | | | | 0.47 | % |
Class R6 | | | | | | | | | | | | | | | | |
Actual | | $ | 1,000.00 | | | $ | 1,036.99 | | | $ | 1.59 | | | | 0.31 | % |
Hypothetical (5% return before expenses) | | $ | 1,000.00 | | | $ | 1,023.64 | | | $ | 1.58 | | | | 0.31 | % |
Administrator Class | | | | | | | | | | | | | | | | |
Actual | | $ | 1,000.00 | | | $ | 1,035.79 | | | $ | 3.39 | | | | 0.66 | % |
Hypothetical (5% return before expenses) | | $ | 1,000.00 | | | $ | 1,021.88 | | | $ | 3.36 | | | | 0.66 | % |
| Target 2025 Fund | | | | | | | | | | | | |
Class A | | | | | | | | | | | | | | | | |
Actual | | $ | 1,000.00 | | | $ | 1,039.12 | | | $ | 3.96 | | | | 0.77 | % |
Hypothetical (5% return before expenses) | | $ | 1,000.00 | | | $ | 1,021.32 | | | $ | 3.92 | | | | 0.77 | % |
Class R | | | | | | | | | | | | | | | | |
Actual | | $ | 1,000.00 | | | $ | 1,030.51 | | | $ | 5.37 | | | | 1.05 | % |
Hypothetical (5% return before expenses) | | $ | 1,000.00 | | | $ | 1,019.91 | | | $ | 5.35 | | | | 1.05 | % |
Class R4 | | | | | | | | | | | | | | | | |
Actual | | $ | 1,000.00 | | | $ | 1,040.87 | | | $ | 2.42 | | | | 0.47 | % |
Hypothetical (5% return before expenses) | | $ | 1,000.00 | | | $ | 1,022.84 | | | $ | 2.40 | | | | 0.47 | % |
Class R6 | | | | | | | | | | | | | | | | |
Actual | | $ | 1,000.00 | | | $ | 1,041.87 | | | $ | 1.60 | | | | 0.31 | % |
Hypothetical (5% return before expenses) | | $ | 1,000.00 | | | $ | 1,023.64 | | | $ | 1.58 | | | | 0.31 | % |
Administrator Class | | | | | | | | | | | | | | | | |
Actual | | $ | 1,000.00 | | | $ | 1,038.86 | | | $ | 3.39 | | | | 0.66 | % |
Hypothetical (5% return before expenses) | | $ | 1,000.00 | | | $ | 1,021.88 | | | $ | 3.36 | | | | 0.66 | % |
| | | | | | |
| Fund expenses (unaudited) | | Wells Fargo Target Date Funds | | | 23 | |
| | | | | | | | | | | | | | | | |
| Target 2030 Fund | | Beginning
account value
3-1-2017 | | | Ending
account value
8-31-2017 | | | Expenses
paid during
the period¹ | | | Annualized net
expense ratio | |
Class A | | | | | | | | | | | | | | | | |
Actual | | $ | 1,000.00 | | | $ | 1,044.91 | | | $ | 3.97 | | | | 0.77 | % |
Hypothetical (5% return before expenses) | | $ | 1,000.00 | | | $ | 1,021.32 | | | $ | 3.92 | | | | 0.77 | % |
Class C | | | | | | | | | | | | | | | | |
Actual | | $ | 1,000.00 | | | $ | 1,041.26 | | | $ | 7.82 | | | | 1.52 | % |
Hypothetical (5% return before expenses) | | $ | 1,000.00 | | | $ | 1,017.54 | | | $ | 7.73 | | | | 1.52 | % |
Class R | | | | | | | | | | | | | | | | |
Actual | | $ | 1,000.00 | | | $ | 1,041.42 | | | $ | 5.45 | | | | 1.06 | % |
Hypothetical (5% return before expenses) | | $ | 1,000.00 | | | $ | 1,019.86 | | | $ | 5.40 | | | | 1.06 | % |
Class R4 | | | | | | | | | | | | | | | | |
Actual | | $ | 1,000.00 | | | $ | 1,046.61 | | | $ | 2.42 | | | | 0.47 | % |
Hypothetical (5% return before expenses) | | $ | 1,000.00 | | | $ | 1,022.84 | | | $ | 2.40 | | | | 0.47 | % |
Class R6 | | | | | | | | | | | | | | | | |
Actual | | $ | 1,000.00 | | | $ | 1,047.25 | | | $ | 1.65 | | | | 0.32 | % |
Hypothetical (5% return before expenses) | | $ | 1,000.00 | | | $ | 1,023.59 | | | $ | 1.63 | | | | 0.32 | % |
Administrator Class | | | | | | | | | | | | | | | | |
Actual | | $ | 1,000.00 | | | $ | 1,045.45 | | | $ | 3.45 | | | | 0.67 | % |
Hypothetical (5% return before expenses) | | $ | 1,000.00 | | | $ | 1,021.83 | | | $ | 3.41 | | | | 0.67 | % |
| Target 2035 Fund | | | | | | | | | | | | |
Class A | | | | | | | | | | | | | | | | |
Actual | | $ | 1,000.00 | | | $ | 1,049.87 | | | $ | 4.03 | | | | 0.78 | % |
Hypothetical (5% return before expenses) | | $ | 1,000.00 | | | $ | 1,021.27 | | | $ | 3.97 | | | | 0.78 | % |
Class R | | | | | | | | | | | | | | | | |
Actual | | $ | 1,000.00 | | | $ | 1,047.69 | | | $ | 5.32 | | | | 1.03 | % |
Hypothetical (5% return before expenses) | | $ | 1,000.00 | | | $ | 1,020.01 | | | $ | 5.24 | | | | 1.03 | % |
Class R4 | | | | | | | | | | | | | | | | |
Actual | | $ | 1,000.00 | | | $ | 1,051.25 | | | $ | 2.53 | | | | 0.49 | % |
Hypothetical (5% return before expenses) | | $ | 1,000.00 | | | $ | 1,022.74 | | | $ | 2.50 | | | | 0.49 | % |
Class R6 | | | | | | | | | | | | | | | | |
Actual | | $ | 1,000.00 | | | $ | 1,051.99 | | | $ | 1.66 | | | | 0.32 | % |
Hypothetical (5% return before expenses) | | $ | 1,000.00 | | | $ | 1,023.59 | | | $ | 1.63 | | | | 0.32 | % |
Administrator Class | | | | | | | | | | | | | | | | |
Actual | | $ | 1,000.00 | | | $ | 1,050.79 | | | $ | 3.46 | | | | 0.67 | % |
Hypothetical (5% return before expenses) | | $ | 1,000.00 | | | $ | 1,021.83 | | | $ | 3.41 | | | | 0.67 | % |
| | | | |
| 24 | | Wells Fargo Target Date Funds | | Fund expenses (unaudited) |
| | | | | | | | | | | | | | | | |
| Target 2040 Fund | | Beginning
account value
3-1-2017 | | | Ending
account value
8-31-2017 | | | Expenses
paid during
the period¹ | | | Annualized net
expense ratio | |
Class A | | | | | | | | | | | | | | | | |
Actual | | $ | 1,000.00 | | | $ | 1,053.53 | | | $ | 4.04 | | | | 0.78 | % |
Hypothetical (5% return before expenses) | | $ | 1,000.00 | | | $ | 1,021.27 | | | $ | 3.97 | | | | 0.78 | % |
Class C | | | | | | | | | | | | | | | | |
Actual | | $ | 1,000.00 | | | $ | 1,050.03 | | | $ | 7.91 | | | | 1.53 | % |
Hypothetical (5% return before expenses) | | $ | 1,000.00 | | | $ | 1,017.49 | | | $ | 7.78 | | | | 1.53 | % |
Class R | | | | | | | | | | | | | | | | |
Actual | | $ | 1,000.00 | | | $ | 1,053.20 | | | $ | 5.49 | | | | 1.06 | % |
Hypothetical (5% return before expenses) | | $ | 1,000.00 | | | $ | 1,019.86 | | | $ | 5.40 | | | | 1.06 | % |
Class R4 | | | | | | | | | | | | | | | | |
Actual | | $ | 1,000.00 | | | $ | 1,055.39 | | | $ | 2.49 | | | | 0.48 | % |
Hypothetical (5% return before expenses) | | $ | 1,000.00 | | | $ | 1,022.79 | | | $ | 2.45 | | | | 0.48 | % |
Class R6 | | | | | | | | | | | | | | | | |
Actual | | $ | 1,000.00 | | | $ | 1,056.42 | | | $ | 1.66 | | | | 0.32 | % |
Hypothetical (5% return before expenses) | | $ | 1,000.00 | | | $ | 1,023.59 | | | $ | 1.63 | | | | 0.32 | % |
Administrator Class | | | | | | | | | | | | | | | | |
Actual | | $ | 1,000.00 | | | $ | 1,054.49 | | | $ | 3.47 | | | | 0.67 | % |
Hypothetical (5% return before expenses) | | $ | 1,000.00 | | | $ | 1,021.83 | | | $ | 3.41 | | | | 0.67 | % |
| Target 2045 Fund | | | | | | | | | | | | |
Class A | | | | | | | | | | | | | | | | |
Actual | | $ | 1,000.00 | | | $ | 1,056.39 | | | $ | 4.09 | | | | 0.79 | % |
Hypothetical (5% return before expenses) | | $ | 1,000.00 | | | $ | 1,021.22 | | | $ | 4.02 | | | | 0.79 | % |
Class R | | | | | | | | | | | | | | | | |
Actual | | $ | 1,000.00 | | | $ | 1,055.54 | | | $ | 5.34 | | | | 1.03 | % |
Hypothetical (5% return before expenses) | | $ | 1,000.00 | | | $ | 1,020.01 | | | $ | 5.24 | | | | 1.03 | % |
Class R4 | | | | | | | | | | | | | | | | |
Actual | | $ | 1,000.00 | | | $ | 1,058.46 | | | $ | 2.54 | | | | 0.49 | % |
Hypothetical (5% return before expenses) | | $ | 1,000.00 | | | $ | 1,022.74 | | | $ | 2.50 | | | | 0.49 | % |
Class R6 | | | | | | | | | | | | | | | | |
Actual | | $ | 1,000.00 | | | $ | 1,059.34 | | | $ | 1.66 | | | | 0.32 | % |
Hypothetical (5% return before expenses) | | $ | 1,000.00 | | | $ | 1,023.59 | | | $ | 1.63 | | | | 0.32 | % |
Administrator Class | | | | | | | | | | | | | | | | |
Actual | | $ | 1,000.00 | | | $ | 1,057.03 | | | $ | 3.47 | | | | 0.67 | % |
Hypothetical (5% return before expenses) | | $ | 1,000.00 | | | $ | 1,021.83 | | | $ | 3.41 | | | | 0.67 | % |
| | | | | | |
| Fund expenses (unaudited) | | Wells Fargo Target Date Funds | | | 25 | |
| | | | | | | | | | | | | | | | |
| Target 2050 Fund | | Beginning
account value
3-1-2017 | | | Ending
account value
8-31-2017 | | | Expenses
paid during
the period¹ | | | Annualized net
expense ratio | |
Class A | | | | | | | | | | | | | | | | |
Actual | | $ | 1,000.00 | | | $ | 1,057.96 | | | $ | 4.05 | | | | 0.78 | % |
Hypothetical (5% return before expenses) | | $ | 1,000.00 | | | $ | 1,021.27 | | | $ | 3.97 | | | | 0.78 | % |
Class C | | | | | | | | | | | | | | | | |
Actual | | $ | 1,000.00 | | | $ | 1,053.81 | | | $ | 7.92 | | | | 1.53 | % |
Hypothetical (5% return before expenses) | | $ | 1,000.00 | | | $ | 1,017.49 | | | $ | 7.78 | | | | 1.53 | % |
Class R | | | | | | | | | | | | | | | | |
Actual | | $ | 1,000.00 | | | $ | 1,056.72 | | | $ | 5.34 | | | | 1.03 | % |
Hypothetical (5% return before expenses) | | $ | 1,000.00 | | | $ | 1,020.01 | | | $ | 5.24 | | | | 1.03 | % |
Class R4 | | | | | | | | | | | | | | | | |
Actual | | $ | 1,000.00 | | | $ | 1,059.18 | | | $ | 2.49 | | | | 0.48 | % |
Hypothetical (5% return before expenses) | | $ | 1,000.00 | | | $ | 1,022.79 | | | $ | 2.45 | | | | 0.48 | % |
Class R6 | | | | | | | | | | | | | | | | |
Actual | | $ | 1,000.00 | | | $ | 1,060.84 | | | $ | 1.71 | | | | 0.33 | % |
Hypothetical (5% return before expenses) | | $ | 1,000.00 | | | $ | 1,023.54 | | | $ | 1.68 | | | | 0.33 | % |
Administrator Class | | | | | | | | | | | | | | | | |
Actual | | $ | 1,000.00 | | | $ | 1,059.21 | | | $ | 3.48 | | | | 0.67 | % |
Hypothetical (5% return before expenses) | | $ | 1,000.00 | | | $ | 1,021.83 | | | $ | 3.41 | | | | 0.67 | % |
| Target 2055 Fund | | | | | | | | | | | | |
Class A | | | | | | | | | | | | | | | | |
Actual | | $ | 1,000.00 | | | $ | 1,057.93 | | | $ | 4.05 | | | | 0.78 | % |
Hypothetical (5% return before expenses) | | $ | 1,000.00 | | | $ | 1,021.27 | | | $ | 3.97 | | | | 0.78 | % |
Class R | | | | | | | | | | | | | | | | |
Actual | | $ | 1,000.00 | | | $ | 1,056.88 | | | $ | 5.34 | | | | 1.03 | % |
Hypothetical (5% return before expenses) | | $ | 1,000.00 | | | $ | 1,020.01 | | | $ | 5.24 | | | | 1.03 | % |
Class R4 | | | | | | | | | | | | | | | | |
Actual | | $ | 1,000.00 | | | $ | 1,060.01 | | | $ | 2.54 | | | | 0.49 | % |
Hypothetical (5% return before expenses) | | $ | 1,000.00 | | | $ | 1,022.74 | | | $ | 2.50 | | | | 0.49 | % |
Class R6 | | | | | | | | | | | | | | | | |
Actual | | $ | 1,000.00 | | | $ | 1,060.83 | | | $ | 1.66 | | | | 0.32 | % |
Hypothetical (5% return before expenses) | | $ | 1,000.00 | | | $ | 1,023.59 | | | $ | 1.63 | | | | 0.32 | % |
Administrator Class | | | | | | | | | | | | | | | | |
Actual | | $ | 1,000.00 | | | $ | 1,058.99 | | | $ | 3.48 | | | | 0.67 | % |
Hypothetical (5% return before expenses) | | $ | 1,000.00 | | | $ | 1,021.83 | | | $ | 3.41 | | | | 0.67 | % |
| | | | |
| 26 | | Wells Fargo Target Date Funds | | Fund expenses (unaudited) |
| | | | | | | | | | | | | | | | |
| Target 2060 Fund | | Beginning
account value
3-1-2017 | | | Ending
account value
8-31-2017 | | | Expenses
paid during
the period¹ | | | Annualized net
expense ratio | |
Class A | | | | | | | | | | | | | | | | |
Actual | | $ | 1,000.00 | | | $ | 1,058.29 | | | $ | 4.05 | | | | 0.78 | % |
Hypothetical (5% return before expenses) | | $ | 1,000.00 | | | $ | 1,021.27 | | | $ | 3.97 | | | | 0.78 | % |
Class C | | | | | | | | | | | | | | | | |
Actual | | $ | 1,000.00 | | | $ | 1,054.50 | | | $ | 7.92 | | | | 1.53 | % |
Hypothetical (5% return before expenses) | | $ | 1,000.00 | | | $ | 1,017.49 | | | $ | 7.78 | | | | 1.53 | % |
Class R | | | | | | | | | | | | | | | | |
Actual | | $ | 1,000.00 | | | $ | 1,057.06 | | | $ | 5.34 | | | | 1.03 | % |
Hypothetical (5% return before expenses) | | $ | 1,000.00 | | | $ | 1,020.01 | | | $ | 5.24 | | | | 1.03 | % |
Class R4 | | | | | | | | | | | | | | | | |
Actual | | $ | 1,000.00 | | | $ | 1,060.43 | | | $ | 2.49 | | | | 0.48 | % |
Hypothetical (5% return before expenses) | | $ | 1,000.00 | | | $ | 1,022.79 | | | $ | 2.45 | | | | 0.48 | % |
Class R6 | | | | | | | | | | | | | | | | |
Actual | | $ | 1,000.00 | | | $ | 1,060.27 | | | $ | 1.66 | | | | 0.32 | % |
Hypothetical (5% return before expenses) | | $ | 1,000.00 | | | $ | 1,023.59 | | | $ | 1.63 | | | | 0.32 | % |
Administrator Class | | | | | | | | | | | | | | | | |
Actual | | $ | 1,000.00 | | | $ | 1,058.47 | | | $ | 3.48 | | | | 0.67 | % |
Hypothetical (5% return before expenses) | | $ | 1,000.00 | | | $ | 1,021.83 | | | $ | 3.41 | | | | 0.67 | % |
| | | | | | |
| Portfolios of investments—August 31, 2017 (unaudited) | | Wells Fargo Target Date Funds | | | 27 | |
TARGET TODAY FUND
| | | | | | | | | | | | | | | | |
| Security name | | | | | | | | | | | Value | |
| | | | |
Investment Companies: 101.02% | | | | | | | | | | | | | | | | |
| | | | |
| Affiliated Master Portfolios: 101.02% | | | | | | | | | | | | | | | | |
Wells Fargo Bloomberg Barclays US Aggregate ex-Corporate Portfolio | | | | | | | | | | | | | | $ | 56,370,720 | |
Wells Fargo Emerging Markets Bond Portfolio | | | | | | | | | | | | | | | 4,812,286 | |
Wells Fargo Factor Enhanced Emerging Markets Portfolio | | | | | | | | | | | | | | | 3,629,942 | |
Wells Fargo Factor Enhanced International Portfolio | | | | | | | | | | | | | | | 12,186,481 | |
Wells Fargo Factor Enhanced Large Cap Portfolio | | | | | | | | | | | | | | | 23,527,146 | |
Wells Fargo Factor Enhanced Small Cap Portfolio | | | | | | | | | | | | | | | 5,866,569 | |
Wells Fargo High Yield Corporate Bond Portfolio | | | | | | | | | | | | | | | 4,809,860 | |
Wells Fargo Investment Grade Corporate Bond Portfolio | | | | | | | | | | | | | | | 29,345,898 | |
Wells Fargo Strategic Retirement Bond Portfolio | | | | | | | | | | | | | | | 19,073,237 | |
Wells Fargo U.S. REIT Portfolio | | | | | | | | | | | | | | | 4,106,390 | |
| | | | |
Total Investment Companies (Cost $141,815,627) | | | | | | | | | | | | | | | 163,728,529 | |
| | | | | | | | | | | | | | | | |
| | | | | | | | |
| Total investments in securities (Cost $141,815,627) | | | 101.02 | % | | | 163,728,529 | |
Other assets and liabilities, net | | | (1.02 | ) | | | (1,654,157 | ) |
| | | | | | | | |
| Total net assets | | | 100.00 | % | | $ | 162,074,372 | |
| | | | | | | | |
TARGET 2010 FUND
| | | | | | | | | | | | | | | | |
| Security name | | | | | | | | | | | Value | |
| | | | |
Investment Companies: 100.40% | | | | | | | | | | | | | | | | |
| | | | |
| Affiliated Master Portfolios: 100.40% | | | | | | | | | | | | | | | | |
Wells Fargo Bloomberg Barclays US Aggregate ex-Corporate Portfolio | | | | | | | | | | | | | | $ | 63,891,803 | |
Wells Fargo Emerging Markets Bond Portfolio | | | | | | | | | | | | | | | 5,454,377 | |
Wells Fargo Factor Enhanced Emerging Markets Portfolio | | | | | | | | | | | | | | | 4,949,474 | |
Wells Fargo Factor Enhanced International Portfolio | | | | | | | | | | | | | | | 16,609,308 | |
Wells Fargo Factor Enhanced Large Cap Portfolio | | | | | | | | | | | | | | | 32,079,577 | |
Wells Fargo Factor Enhanced Small Cap Portfolio | | | | | | | | | | | | | | | 7,987,605 | |
Wells Fargo High Yield Corporate Bond Portfolio | | | | | | | | | | | | | | | 5,450,537 | |
Wells Fargo Investment Grade Corporate Bond Portfolio | | | | | | | | | | | | | | | 33,262,274 | |
Wells Fargo Strategic Retirement Bond Portfolio | | | | | | | | | | | | | | | 21,617,213 | |
Wells Fargo U.S. REIT Portfolio | | | | | | | | | | | | | | | 5,598,459 | |
| | | | |
Total Investment Companies (Cost $160,339,092) | | | | | | | | | | | | | | | 196,900,627 | |
| | | | | | | | | | | | | | | | |
| | | | | | | | |
| Total investments in securities (Cost $160,339,092) | | | 100.40 | % | | | 196,900,627 | |
Other assets and liabilities, net | | | (0.40 | ) | | | (778,240 | ) |
| | | | | | | | |
| Total net assets | | | 100.00 | % | | $ | 196,122,387 | |
| | | | | | | | |
The accompanying notes are an integral part of these financial statements.
| | | | |
| 28 | | Wells Fargo Target Date Funds | | Portfolios of investments—August 31, 2017 (unaudited) |
TARGET 2015 FUND
| | | | | | | | | | | | | | | | |
| Security name | | | | | | | | | | | Value | |
| | | | |
Investment Companies: 105.52% | | | | | | | | | | | | | | | | |
| | | | |
| Affiliated Master Portfolios: 105.52% | | | | | | | | | | | | | | | | |
Wells Fargo Bloomberg Barclays US Aggregate ex-Corporate Portfolio | | | | | | | | | | | | | | $ | 68,395,789 | |
Wells Fargo Emerging Markets Bond Portfolio | | | | | | | | | | | | | | | 5,848,056 | |
Wells Fargo Factor Enhanced Emerging Markets Portfolio | | | | | | | | | | | | | | | 6,578,950 | |
Wells Fargo Factor Enhanced International Portfolio | | | | | | | | | | | | | | | 22,010,287 | |
Wells Fargo Factor Enhanced Large Cap Portfolio | | | | | | | | | | | | | | | 42,711,084 | |
Wells Fargo Factor Enhanced Small Cap Portfolio | | | | | | | | | | | | | | | 10,643,878 | |
Wells Fargo High Yield Corporate Bond Portfolio | | | | | | | | | | | | | | | 5,835,188 | |
Wells Fargo Investment Grade Corporate Bond Portfolio | | | | | | | | | | | | | | | 35,613,758 | |
Wells Fargo Strategic Retirement Bond Portfolio | | | | | | | | | | | | | | | 23,141,771 | |
Wells Fargo U.S. REIT Portfolio | | | | | | | | | | | | | | | 7,436,951 | |
| | | | |
Total Investment Companies (Cost $183,062,539) | | | | | | | | | | | | | | | 228,215,712 | |
| | | | | | | | | | | | | | | | |
| | | | | | | | |
| Total investments in securities (Cost $183,062,539) | | | 105.52 | % | | | 228,215,712 | |
Other assets and liabilities, net | | | (5.52 | ) | | | (11,940,368 | ) |
| | | | | | | | |
| Total net assets | | | 100.00 | % | | $ | 216,275,344 | |
| | | | | | | | |
TARGET 2020 FUND
| | | | | | | | | | | | | | | | |
| Security name | | | | | | | | | | | Value | |
| | | | |
Investment Companies: 101.17% | | | | | | | | | | | | | | | | |
| | | | |
| Affiliated Master Portfolios: 101.17% | | | | | | | | | | | | | | | | |
Wells Fargo Bloomberg Barclays US Aggregate ex-Corporate Portfolio | | | | | | | | | | | | | | $ | 310,844,086 | |
Wells Fargo Emerging Markets Bond Portfolio | | | | | | | | | | | | | | | 26,349,020 | |
Wells Fargo Factor Enhanced Emerging Markets Portfolio | | | | | | | | | | | | | | | 42,910,600 | |
Wells Fargo Factor Enhanced International Portfolio | | | | | | | | | | | | | | | 143,802,826 | |
Wells Fargo Factor Enhanced Large Cap Portfolio | | | | | | | | | | | | | | | 267,435,902 | |
Wells Fargo Factor Enhanced Small Cap Portfolio | | | | | | | | | | | | | | | 66,648,034 | |
Wells Fargo High Yield Corporate Bond Portfolio | | | | | | | | | | | | | | | 26,335,735 | |
Wells Fargo Investment Grade Corporate Bond Portfolio | | | | | | | | | | | | | | | 161,798,651 | |
Wells Fargo Strategic Retirement Bond Portfolio | | | | | | | | | | | | | | | 68,524,449 | |
Wells Fargo U.S. REIT Portfolio | | | | | | | | | | | | | | | 30,640,672 | |
| | | | |
Total Investment Companies (Cost $1,008,750,809) | | | | | | | | | | | | | | | 1,145,289,975 | |
| | | | | | | | | | | | | | | | |
| | | | | | | | |
| Total investments in securities (Cost $1,008,750,809) | | | 101.17 | % | | | 1,145,289,975 | |
Other assets and liabilities, net | | | (1.17 | ) | | | (13,261,065 | ) |
| | | | | | | | |
| Total net assets | | | 100.00 | % | | $ | 1,132,028,910 | |
| | | | | | | | |
The accompanying notes are an integral part of these financial statements.
| | | | | | |
| Portfolios of investments—August 31, 2017 (unaudited) | | Wells Fargo Target Date Funds | | | 29 | |
TARGET 2025 FUND
| | | | | | | | | | | | | | | | |
| Security name | | | | | | | | | | | Value | |
| | | | |
Investment Companies: 108.86% | | | | | | | | | | | | | | | | |
| | | | |
| Affiliated Master Portfolios: 108.86% | | | | | | | | | | | | | | | | |
Wells Fargo Bloomberg Barclays US Aggregate ex-Corporate Portfolio | | | | | | | | | | | | | | $ | 153,413,453 | |
Wells Fargo Emerging Markets Bond Portfolio | | | | | | | | | | | | | | | 12,915,001 | |
Wells Fargo Factor Enhanced Emerging Markets Portfolio | | | | | | | | | | | | | | | 31,406,876 | |
Wells Fargo Factor Enhanced International Portfolio | | | | | | | | | | | | | | | 104,778,862 | |
Wells Fargo Factor Enhanced Large Cap Portfolio | | | | | | | | | | | | | | | 187,399,303 | |
Wells Fargo Factor Enhanced Small Cap Portfolio | | | | | | | | | | | | | | | 47,129,442 | |
Wells Fargo High Yield Corporate Bond Portfolio | | | | | | | | | | | | | | | 12,907,518 | |
Wells Fargo Investment Grade Corporate Bond Portfolio | | | | | | | | | | | | | | | 79,928,366 | |
Wells Fargo Strategic Retirement Bond Portfolio | | | | | | | | | | | | | | | 13,422,925 | |
Wells Fargo U.S. REIT Portfolio | | | | | | | | | | | | | | | 8,466,945 | |
| | | | |
Total Investment Companies (Cost $482,523,373) | | | | | | | | | | | | | | | 651,768,691 | |
| | | | | | | | | | | | | | | | |
| | | | | | | | |
| Total investments in securities (Cost $482,523,373) | | | 108.86 | % | | | 651,768,691 | |
Other assets and liabilities, net | | | (8.86 | ) | | | (53,058,716 | ) |
| | | | | | | | |
| Total net assets | | | 100.00 | % | | $ | 598,709,975 | |
| | | | | | | | |
TARGET 2030 FUND
| | | | | | | | | | | | | | | | |
| Security name | | | | | | | | | | | Value | |
| | | | |
Investment Companies: 101.60% | | | | | | | | | | | | | | | | |
| | | | |
| Affiliated Master Portfolios: 101.60% | | | | | | | | | | | | | | | | |
Wells Fargo Bloomberg Barclays US Aggregate ex-Corporate Portfolio | | | | | | | | | | | | | | $ | 250,574,219 | |
Wells Fargo Emerging Markets Bond Portfolio | | | | | | | | | | | | | | | 21,164,384 | |
Wells Fargo Factor Enhanced Emerging Markets Portfolio | | | | | | | | | | | | | | | 78,618,547 | |
Wells Fargo Factor Enhanced International Portfolio | | | | | | | | | | | | | | | 265,869,018 | |
Wells Fargo Factor Enhanced Large Cap Portfolio | | | | | | | | | | | | | | | 453,401,105 | |
Wells Fargo Factor Enhanced Small Cap Portfolio | | | | | | | | | | | | | | | 113,445,906 | |
Wells Fargo High Yield Corporate Bond Portfolio | | | | | | | | | | | | | | | 21,153,713 | |
Wells Fargo Investment Grade Corporate Bond Portfolio | | | | | | | | | | | | | | | 130,472,830 | |
Wells Fargo Strategic Retirement Bond Portfolio | | | | | | | | | | | | | | | 3,563,089 | |
Wells Fargo U.S. REIT Portfolio | | | | | | | | | | | | | | | 2,686,278 | |
| | | | |
Total Investment Companies (Cost $1,235,545,416) | | | | | | | | | | | | | | | 1,340,949,089 | |
| | | | | | | | | | | | | | | | |
| | | | | | | | |
| Total investments in securities (Cost $1,235,545,416) | | | 101.60 | % | | | 1,340,949,089 | |
Other assets and liabilities, net | | | (1.60 | ) | | | (21,075,200 | ) |
| | | | | | | | |
| Total net assets | | | 100.00 | % | | $ | 1,319,873,889 | |
| | | | | | | | |
The accompanying notes are an integral part of these financial statements.
| | | | |
| 30 | | Wells Fargo Target Date Funds | | Portfolios of investments—August 31, 2017 (unaudited) |
TARGET 2035 FUND
| | | | | | | | | | | | | | | | |
| Security name | | | | | | | | | | | Value | |
| | | | |
Investment Companies: 108.64% | | | | | | | | | | | | | | | | |
| | | | |
| Affiliated Master Portfolios: 108.64% | | | | | | | | | | | | | | | | |
Wells Fargo Bloomberg Barclays US Aggregate ex-Corporate Portfolio | | | | | | | | | | | | | | $ | 75,720,819 | |
Wells Fargo Emerging Markets Bond Portfolio | | | | | | | | | | | | | | | 6,405,948 | |
Wells Fargo Factor Enhanced Emerging Markets Portfolio | | | | | | | | | | | | | | | 40,746,007 | |
Wells Fargo Factor Enhanced International Portfolio | | | | | | | | | | | | | | | 136,098,132 | |
Wells Fargo Factor Enhanced Large Cap Portfolio | | | | | | | | | | | | | | | 223,561,238 | |
Wells Fargo Factor Enhanced Small Cap Portfolio | | | | | | | | | | | | | | | 56,022,105 | |
Wells Fargo High Yield Corporate Bond Portfolio | | | | | | | | | | | | | | | 6,402,718 | |
Wells Fargo Investment Grade Corporate Bond Portfolio | | | | | | | | | | | | | | | 39,418,252 | |
| | | | |
Total Investment Companies (Cost $535,816,819) | | | | | | | | | | | | | | | 584,375,219 | |
| | | | | | | | | | | | | | | | |
| | | | | | | | |
| Total investments in securities (Cost $535,816,819) | | | 108.64 | % | | | 584,375,219 | |
Other assets and liabilities, net | | | (8.64 | ) | | | (46,479,132 | ) |
| | | | | | | | |
| Total net assets | | | 100.00 | % | | $ | 537,896,087 | |
| | | | | | | | |
TARGET 2040 FUND
| | | | | | | | | | | | | | | | |
| Security name | | | | | | | | | | | Value | |
| | | | |
Investment Companies: 101.23% | | | | | | | | | | | | | | | | |
| | | | |
| Affiliated Master Portfolios: 101.23% | | | | | | | | | | | | | | | | |
Wells Fargo Bloomberg Barclays US Aggregate ex-Corporate Portfolio | | | | | | | | | | | | | | $ | 104,915,597 | |
Wells Fargo Emerging Markets Bond Portfolio | | | | | | | | | | | | | | | 8,875,722 | |
Wells Fargo Factor Enhanced Emerging Markets Portfolio | | | | | | | | | | | | | | | 84,723,892 | |
Wells Fargo Factor Enhanced International Portfolio | | | | | | | | | | | | | | | 284,648,684 | |
Wells Fargo Factor Enhanced Large Cap Portfolio | | | | | | | | | | | | | | | 454,763,829 | |
Wells Fargo Factor Enhanced Small Cap Portfolio | | | | | | | | | | | | | | | 113,821,753 | |
Wells Fargo High Yield Corporate Bond Portfolio | | | | | | | | | | | | | | | 8,871,247 | |
Wells Fargo Investment Grade Corporate Bond Portfolio | | | | | | | | | | | | | | | 54,609,323 | |
| | | | |
Total Investment Companies (Cost $1,105,904,431) | | | | | | | | | | | | | | | 1,115,230,047 | |
| | | | | | | | | | | | | | | | |
| | | | | | | | |
| Total investments in securities (Cost $1,105,904,431) | | | 101.23 | % | | | 1,115,230,047 | |
Other assets and liabilities, net | | | (1.23 | ) | | | (13,522,399 | ) |
| | | | | | | | |
| Total net assets | | | 100.00 | % | | $ | 1,101,707,648 | |
| | | | | | | | |
The accompanying notes are an integral part of these financial statements.
| | | | | | |
| Portfolios of investments—August 31, 2017 (unaudited) | | Wells Fargo Target Date Funds | | | 31 | |
TARGET 2045 FUND
| | | | | | | | | | | | | | | | |
| Security name | | | | | | | | | | | Value | |
| | | | |
Investment Companies: 108.30% | | | | | | | | | | | | | | | | |
| | | | |
| Affiliated Master Portfolios: 108.30% | | | | | | | | | | | | | | | | |
Wells Fargo Bloomberg Barclays US Aggregate ex-Corporate Portfolio | | | | | | | | | | | | | | $ | 24,381,050 | |
Wells Fargo Emerging Markets Bond Portfolio | | | | | | | | | | | | | | | 2,062,463 | |
Wells Fargo Factor Enhanced Emerging Markets Portfolio | | | | | | | | | | | | | | | 30,721,297 | |
Wells Fargo Factor Enhanced International Portfolio | | | | | | | | | | | | | | | 102,893,819 | |
Wells Fargo Factor Enhanced Large Cap Portfolio | | | | | | | | | | | | | | | 161,561,313 | |
Wells Fargo Factor Enhanced Small Cap Portfolio | | | | | | | | | | | | | | | 40,595,504 | |
Wells Fargo High Yield Corporate Bond Portfolio | | | | | | | | | | | | | | | 2,061,423 | |
Wells Fargo Investment Grade Corporate Bond Portfolio | | | | | | | | | | | | | | | 12,689,637 | |
| | | | |
Total Investment Companies (Cost $379,151,061) | | | | | | | | | | | | | | | 376,966,506 | |
| | | | | | | | | | | | | | | | |
| | | | | | | | |
| Total investments in securities (Cost $379,151,061) | | | 108.30 | % | | | 376,966,506 | |
Other assets and liabilities, net | | | (8.30 | ) | | | (28,876,655 | ) |
| | | | | | | | |
| Total net assets | | | 100.00 | % | | $ | 348,089,851 | |
| | | | | | | | |
TARGET 2050 FUND
| | | | | | | | | | | | | | | | |
| Security name | | | | | | | | | | | Value | |
| | | | |
Investment Companies: 101.26% | | | | | | | | | | | | | | | | |
| | | | |
| Affiliated Master Portfolios: 101.26% | | | | | | | | | | | | | | | | |
Wells Fargo Bloomberg Barclays US Aggregate ex-Corporate Portfolio | | | | | | | | | | | | | | $ | 35,444,517 | |
Wells Fargo Emerging Markets Bond Portfolio | | | | | | | | | | | | | | | 2,998,485 | |
Wells Fargo Factor Enhanced Emerging Markets Portfolio | | | | | | | | | | | | | | | 49,686,118 | |
Wells Fargo Factor Enhanced International Portfolio | | | | | | | | | | | | | | | 167,211,015 | |
Wells Fargo Factor Enhanced Large Cap Portfolio | | | | | | | | | | | | | | | 260,658,209 | |
Wells Fargo Factor Enhanced Small Cap Portfolio | | | | | | | | | | | | | | | 65,391,750 | |
Wells Fargo High Yield Corporate Bond Portfolio | | | | | | | | | | | | | | | 2,996,973 | |
Wells Fargo Investment Grade Corporate Bond Portfolio | | | | | | | | | | | | | | | 18,447,841 | |
| | | | |
Total Investment Companies (Cost $574,052,720) | | | | | | | | | | | | | | | 602,834,908 | |
| | | | | | | | | | | | | | | | |
| | | | | | | | |
| Total investments in securities (Cost $574,052,720) | | | 101.26 | % | | | 602,834,908 | |
Other assets and liabilities, net | | | (1.26 | ) | | | (7,515,342 | ) |
| | | | | | | | |
| Total net assets | | | 100.00 | % | | $ | 595,319,566 | |
| | | | | | | | |
The accompanying notes are an integral part of these financial statements.
| | | | |
| 32 | | Wells Fargo Target Date Funds | | Portfolios of investments—August 31, 2017 (unaudited) |
TARGET 2055 FUND
| | | | | | | | | | | | | | | | |
| Security name | | | | | | | | | | | Value | |
| | | | |
Investment Companies: 104.88% | | | | | | | | | | | | | | | | |
| | | | |
| Affiliated Master Portfolios: 104.88% | | | | | | | | | | | | | | | | |
Wells Fargo Bloomberg Barclays US Aggregate ex-Corporate Portfolio | | | | | | | | | | | | | | $ | 5,996,371 | |
Wells Fargo Emerging Markets Bond Portfolio | | | | | | | | | | | | | | | 508,224 | |
Wells Fargo Factor Enhanced Emerging Markets Portfolio | | | | | | | | | | | | | | | 8,459,006 | |
Wells Fargo Factor Enhanced International Portfolio | | | | | | | | | | | | | | | 28,131,836 | |
Wells Fargo Factor Enhanced Large Cap Portfolio | | | | | | | | | | | | | | | 44,052,420 | |
Wells Fargo Factor Enhanced Small Cap Portfolio | | | | | | | | | | | | | | | 11,080,279 | |
Wells Fargo High Yield Corporate Bond Portfolio | | | | | | | | | | | | | | | 507,212 | |
Wells Fargo Investment Grade Corporate Bond Portfolio | | | | | | | | | | | | | | | 3,121,255 | |
| | | | |
Total Investment Companies (Cost $108,705,307) | | | | | | | | | | | | | | | 101,856,603 | |
| | | | | | | | | | | | | | | | |
| | | | | | | | |
| Total investments in securities (Cost $108,705,307) | | | 104.88 | % | | | 101,856,603 | |
Other assets and liabilities, net | | | (4.88 | ) | | | (4,735,354 | ) |
| | | | | | | | |
| Total net assets | | | 100.00 | % | | $ | 97,121,249 | |
| | | | | | | | |
TARGET 2060 FUND
| | | | | | | | | | | | | | | | |
| Security name | | | | | | | | | | | Value | |
| | | | |
Investment Companies: 100.83% | | | | | | | | | | | | | | | | |
| | | | |
| Affiliated Master Portfolios: 100.83% | | | | | | | | | | | | | | | | |
Wells Fargo Bloomberg Barclays US Aggregate ex-Corporate Portfolio | | | | | | | | | | | | | | $ | 1,486,823 | |
Wells Fargo Emerging Markets Bond Portfolio | | | | | | | | | | | | | | | 125,791 | |
Wells Fargo Factor Enhanced Emerging Markets Portfolio | | | | | | | | | | | | | | | 2,082,786 | |
Wells Fargo Factor Enhanced International Portfolio | | | | | | | | | | | | | | | 6,993,968 | |
Wells Fargo Factor Enhanced Large Cap Portfolio | | | | | | | | | | | | | | | 10,926,497 | |
Wells Fargo Factor Enhanced Small Cap Portfolio | | | | | | | | | | | | | | | 2,741,148 | |
Wells Fargo High Yield Corporate Bond Portfolio | | | | | | | | | | | | | | | 125,728 | |
Wells Fargo Investment Grade Corporate Bond Portfolio | | | | | | | | | | | | | | | 774,033 | |
| | | | |
Total Investment Companies (Cost $31,802,655) | | | | | | | | | | | | | | | 25,256,774 | |
| | | | | | | | | | | | | | | | |
| | | | | | | | |
| Total investments in securities (Cost $31,802,655) | | | 100.83 | % | | | 25,256,774 | |
Other assets and liabilities, net | | | (0.83 | ) | | | (209,091 | ) |
| | | | | | | | |
| Total net assets | | | 100.00 | % | | $ | 25,047,683 | |
| | | | | | | | |
The accompanying notes are an integral part of these financial statements.
This page is intentionally left blank.
| | | | |
| 34 | | Wells Fargo Target Date Funds | | Statements of assets and liabilities—August 31, 2017 (unaudited) |
| | | | | | | | | | | | | | | | |
| | | Target Today
Fund | | | Target 2010
Fund | | | Target 2015
Fund | | | Target 2020
Fund | |
| | | | |
Assets | | | | | | | | | | | | | | | | |
Investments in affiliated Master Portfolios, at value (see cost below) | | $ | 163,728,529 | | | $ | 196,900,627 | | | $ | 228,215,712 | | | $ | 1,145,289,975 | |
Receivable for Fund shares sold | | | 50,054 | | | | 67,568 | | | | 75,889 | | | | 354,448 | |
Receivable from manager | | | 14,817 | | | | 12,094 | | | | 15,860 | | | | 12,385 | |
Prepaid expenses and other assets | | | 91,854 | | | | 89,863 | | | | 73,156 | | | | 146,832 | |
| | | | |
Total assets | | | 163,885,254 | | | | 197,070,152 | | | | 228,380,617 | | | | 1,145,803,640 | |
| | | | |
| | | | |
Liabilities | | | | | | | | | | | | | | | | |
Payable for Fund shares redeemed | | | 1,738,567 | | | | 885,209 | | | | 12,023,710 | | | | 13,483,873 | |
Administration fees payable | | | 16,929 | | | | 18,712 | | | | 18,103 | | | | 86,597 | |
Distribution fees payable | | | 1,712 | | | | 1,031 | | | | 6 | | | | 4,076 | |
Accrued expenses and other liabilities | | | 53,674 | | | | 42,813 | | | | 63,454 | | | | 200,184 | |
| | | | |
Total liabilities | | | 1,810,882 | | | | 947,765 | | | | 12,105,273 | | | | 13,774,730 | |
| | | | |
Total net assets | | $ | 162,074,372 | | | $ | 196,122,387 | | | $ | 216,275,344 | | | $ | 1,132,028,910 | |
| | | | |
| | | | |
NET ASSETS CONSIST OF | | | | | | | | | | | | | | | | |
Paid-in capital | | $ | 129,707,689 | | | $ | 157,301,558 | | | $ | 154,287,662 | | | $ | 899,167,283 | |
Undistributed net investment income | | | 1,626,551 | | | | 1,055,281 | | | | 349,054 | | | | 8,149,742 | |
Accumulated net realized gains on investments | | | 8,827,230 | | | | 1,204,013 | | | | 16,485,455 | | | | 88,172,719 | |
Net unrealized gains (losses) on investments | | | 21,912,902 | | | | 36,561,535 | | | | 45,153,173 | | | | 136,539,166 | |
| | | | |
Total net assets | | $ | 162,074,372 | | | $ | 196,122,387 | | | $ | 216,275,344 | | | $ | 1,132,028,910 | |
| | | | |
| | | | |
COMPUTATION OF NET ASSET VALUE AND OFFERING PRICE PER SHARE | | | | | | | | | | | | | | | | |
Net assets – Class A | | $ | 54,777,725 | | | $ | 56,149,473 | | | $ | 49,877,728 | | | $ | 209,370,419 | |
Shares outstanding – Class A1 | | | 5,065,261 | | | | 4,413,524 | | | | 4,801,695 | | | | 13,608,357 | |
Net asset value per share – Class A | | | $10.81 | | | | $12.72 | | | | $10.39 | | | | $15.39 | |
Maximum offering price per share – Class A2 | | | $11.47 | | | | $13.50 | | | | $11.02 | | | | $16.33 | |
Net assets – Class C | | $ | 2,679,686 | | | $ | 1,607,146 | | | | N/A | | | $ | 6,141,862 | |
Shares outstanding – Class C1 | | | 243,970 | | | | 125,351 | | | | N/A | | | | 404,034 | |
Net asset value per share – Class C | | | $10.98 | | | | $12.82 | | | | N/A | | | | $15.20 | |
Net assets – Class R | | $ | 32,688 | | | $ | 27,787 | | | $ | 28,623 | | | $ | 63,614 | |
Shares outstanding – Class R1 | | | 3,036 | | | | 2,201 | | | | 2,717 | | | | 4,153 | |
Net asset value per share – Class R | | | $10.77 | | | | $12.62 | | | | $10.53 | | | | $15.32 | |
Net assets – Class R4 | | $ | 21,979,294 | | | $ | 30,151,780 | | | $ | 62,244,180 | | | $ | 225,624,508 | |
Share outstanding – Class R41 | | | 1,989,818 | | | | 2,341,611 | | | | 5,966,347 | | | | 14,371,544 | |
Net asset value per share – Class R4 | | | $11.05 | | | | $12.88 | | | | $10.43 | | | | $15.70 | |
Net assets – Class R6 | | $ | 47,920,026 | | | $ | 68,047,381 | | | $ | 83,622,893 | | | $ | 531,339,501 | |
Shares outstanding – Class R61 | | | 4,331,499 | | | | 5,284,010 | | | | 8,020,971 | | | | 33,838,354 | |
Net asset value per share – Class R6 | | | $11.06 | | | | $12.88 | | | | $10.43 | | | | $15.70 | |
Net assets – Administrator Class | | $ | 34,684,953 | | | $ | 40,138,820 | | | $ | 20,501,920 | | | $ | 159,489,006 | |
Shares outstanding – Administrator Class1 | | | 3,138,941 | | | | 3,119,493 | | | | 1,939,563 | | | | 10,206,201 | |
Net asset value per share – Administrator Class | | | $11.05 | | | | $12.87 | | | | $10.57 | | | | $15.63 | |
| | | | |
Investments in affiliated Master Portfolios, at cost | | $ | 141,815,627 | | | $ | 160,339,092 | | | $ | 183,062,539 | | | $ | 1,008,750,809 | |
| | | | |
| 1 | Each Fund has an unlimited number of authorized shares. |
| 2 | Maximum offering price is computed as 100/94.25 of net asset value. On investments of $50,000 or more, the offering price is reduced. |
The accompanying notes are an integral part of these financial statements.
| | | | | | |
| Statements of assets and liabilities—August 31, 2017 (unaudited) | | Wells Fargo Target Date Funds | | | 35 | |
| | | | | | | | | | | | | | | | | | | | | | | | | | | | | | |
Target 2025
Fund | | | Target 2030
Fund | | | Target 2035
Fund | | | Target 2040
Fund | | | Target 2045
Fund | | | Target 2050
Fund | | | Target 2055
Fund | | | Target 2060
Fund | |
| | | | | | | |
| | | | | | | | | | | | | | | | | | | | | | | | | | | | | | |
| $ | 651,768,691 | | | $ | 1,340,949,089 | | | $ | 584,375,219 | | | $ | 1,115,230,047 | | | $ | 376,966,506 | | | $ | 602,834,908 | | | $ | 101,856,603 | | | $ | 25,256,774 | |
| | 421,171 | | | | 980,618 | | | | 554,993 | | | | 581,632 | | | | 305,228 | | | | 703,801 | | | | 162,285 | | | | 79,690 | |
| | 16,907 | | | | 26,820 | | | | 27,280 | | | | 37,932 | | | | 27,363 | | | | 33,892 | | | | 17,361 | | | | 13,989 | |
| | 184,405 | | | | 230,038 | | | | 147,894 | | | | 257,621 | | | | 130,973 | | | | 178,690 | | | | 98,570 | | | | 92,688 | |
| | |
| | 652,391,174 | | | | 1,342,186,565 | | | | 585,105,386 | | | | 1,116,107,232 | | | | 377,430,070 | | | | 603,751,291 | | | | 102,134,819 | | | | 25,443,141 | |
| | |
| | | | | | | |
| | | | | | | | | | | | | | | | | | | | | | | | | | | | | | |
| | 53,503,065 | | | | 21,967,596 | | | | 47,050,616 | | | | 14,105,011 | | | | 29,240,221 | | | | 8,281,430 | | | | 5,002,060 | | | | 393,748 | |
| | 48,404 | | | | 104,779 | | | | 43,810 | | | | 90,633 | | | | 26,432 | | | | 42,779 | | | | 5,986 | | | | 1,519 | |
| | 8 | | | | 3,098 | | | | 41 | | | | 3,279 | | | | 9 | | | | 870 | | | | 9 | | | | 191 | |
| | 129,722 | | | | 237,203 | | | | 114,832 | | | | 200,661 | | | | 73,557 | | | | 106,646 | | | | 5,515 | | | | 0 | |
| | |
| | 53,681,199 | | | | 22,312,676 | | | | 47,209,299 | | | | 14,399,584 | | | | 29,340,219 | | | | 8,431,725 | | | | 5,013,570 | | | | 395,458 | |
| | |
| $ | 598,709,975 | | | $ | 1,319,873,889 | | | $ | 537,896,087 | | | $ | 1,101,707,648 | | | $ | 348,089,851 | | | $ | 595,319,566 | | | $ | 97,121,249 | | | $ | 25,047,683 | |
| | |
| | | | | | | |
| | | | | | | | | | | | | | | | | | | | | | | | | | | | | | |
| $ | 327,733,967 | | | $ | 972,736,794 | | | $ | 352,481,660 | | | $ | 801,301,114 | | | $ | 238,737,627 | | | $ | 379,954,666 | | | $ | 77,671,728 | | | $ | 25,103,215 | |
| | 4,535,240 | | | | 12,323,321 | | | | 2,608,012 | | | | 10,474,702 | | | | 1,616,882 | | | | 1,734,755 | | | | 531,685 | | | | 141,970 | |
| | 97,195,450 | | | | 229,410,101 | | | | 134,248,015 | | | | 280,606,216 | | | | 109,919,897 | | | | 184,847,957 | | | | 25,766,540 | | | | 6,348,379 | |
| | 169,245,318 | | | | 105,403,673 | | | | 48,558,400 | | | | 9,325,616 | | | | (2,184,555 | ) | | | 28,782,188 | | | | (6,848,704 | ) | | | (6,545,881 | ) |
| | |
| $ | 598,709,975 | | | $ | 1,319,873,889 | | | $ | 537,896,087 | | | $ | 1,101,707,648 | | | $ | 348,089,851 | | | $ | 595,319,566 | | | $ | 97,121,249 | | | $ | 25,047,683 | |
| | |
| | | | | | | |
| | | | | | | | | | | | | | | | | | | | | | | | | | | | | | |
| $ | 132,033,916 | | | $ | 230,244,790 | | | $ | 121,684,836 | | | $ | 222,051,900 | | | $ | 62,284,837 | | | $ | 65,643,532 | | | $ | 9,573,938 | | | $ | 649,612 | |
| | 12,121,848 | | | | 13,194,607 | | | | 10,338,243 | | | | 10,846,025 | | | | 4,969,355 | | | | 5,464,372 | | | | 653,464 | | | | 57,651 | |
| | $10.89 | | | | $17.45 | | | | $11.77 | | | | $20.47 | | | | $12.53 | | | | $12.01 | | | | $14.65 | | | | $11.27 | |
| | $11.55 | | | | $18.51 | | | | $12.49 | | | | $21.72 | | | | $13.29 | | | | $12.74 | | | | $15.54 | | | | $11.96 | |
| | N/A | | | $ | 4,897,893 | | | | N/A | | | $ | 5,219,420 | | | | N/A | | | $ | 1,351,365 | | | | N/A | | | $ | 257,443 | |
| | N/A | | | | 289,713 | | | | N/A | | | | 273,290 | | | | N/A | | | | 112,971 | | | | N/A | | | | 22,809 | |
| | N/A | | | | $16.91 | | | | N/A | | | | $19.10 | | | | N/A | | | | $11.96 | | | | N/A | | | | $11.29 | |
| $ | 36,942 | | | $ | 40,977 | | | $ | 193,640 | | | $ | 60,493 | | | $ | 44,141 | | | $ | 36,864 | | | $ | 43,603 | | | $ | 136,958 | |
| | 3,417 | | | | 2,362 | | | | 16,365 | | | | 2,966 | | | | 3,483 | | | | 3,062 | | | | 3,009 | | | | 12,336 | |
| | $10.81 | | | | $17.35 | | | | $11.83 | | | | $20.39 | | | | $12.67 | | | | $12.04 | | | | $14.49 | | | | $11.10 | |
| $ | 151,224,024 | | | $ | 356,044,083 | | | $ | 135,936,266 | | | $ | 294,180,267 | | | $ | 88,297,307 | | | $ | 183,780,713 | | | $ | 25,993,051 | | | $ | 6,590,326 | |
| | 13,814,532 | | | | 20,073,056 | | | | 11,529,534 | | | | 14,035,288 | | | | 7,013,429 | | | | 15,235,264 | | | | 1,769,431 | | | | 574,084 | |
| | $10.95 | | | | $17.74 | | | | $11.79 | | | | $20.96 | | | | $12.59 | | | | $12.06 | | | | $14.69 | | | | $11.48 | |
| $ | 261,254,435 | | | $ | 509,846,011 | | | $ | 233,251,494 | | | $ | 411,324,121 | | | $ | 160,401,872 | | | $ | 236,986,659 | | | $ | 52,584,245 | | | $ | 12,428,112 | |
| | 23,862,328 | | | | 28,751,843 | | | | 19,785,072 | | | | 19,614,973 | | | | 12,766,461 | | | | 19,654,967 | | | | 3,585,868 | | | | 1,085,451 | |
| | $10.95 | | | | $17.73 | | | | $11.79 | | | | $20.97 | | | | $12.56 | | | | $12.06 | | | | $14.66 | | | | $11.45 | |
| $ | 54,160,658 | | | $ | 218,800,135 | | | $ | 46,829,851 | | | $ | 168,871,447 | | | $ | 37,061,694 | | | $ | 107,520,433 | | | $ | 8,926,412 | | | $ | 4,985,232 | |
| | 4,939,601 | | | | 12,355,150 | | | | 3,959,822 | | | | 8,079,216 | | | | 2,931,570 | | | | 8,940,613 | | | | 609,001 | | | | 440,369 | |
| | $10.96 | | | | $17.71 | | | | $11.83 | | | | $20.90 | | | | $12.64 | | | | $12.03 | | | | $14.66 | | | | $11.32 | |
| | | | | | | |
| $ | 482,523,373 | | | $ | 1,235,545,416 | | | $ | 535,816,819 | | | $ | 1,105,904,431 | | | $ | 379,151,061 | | | $ | 574,052,720 | | | $ | 108,705,307 | | | $ | 31,802,655 | |
| | |
The accompanying notes are an integral part of these financial statements.
| | | | |
| 36 | | Wells Fargo Target Date Funds | | Statements of operations—six months ended August 31, 2017 (unaudited) |
| | | | | | | | | | | | | | | | |
| | | Target Today
Fund | | | Target 2010
Fund | | | Target 2015
Fund | | | Target 2020
Fund | |
| | | | |
Investment income | | | | | | | | | | | | | | | | |
Interest allocated from affiliated Master Portfolios* | | $ | 2,682,457 | | | $ | 1,784,231 | | | $ | 2,217,436 | | | $ | 11,173,866 | |
Dividends allocated from affiliated Master Portfolios** | | | 700,732 | | | | 533,400 | | | | 826,975 | | | | 5,295,944 | |
Securities lending income allocated from affiliated Master Portfolios | | | 9,471 | | | | 5,679 | | | | 9,449 | | | | 61,123 | |
Expenses allocated from affiliated Master Portfolios | | | (271,724 | ) | | | (176,154 | ) | | | (232,005 | ) | | | (1,172,254 | ) |
| | | | |
Total investment income | | | 3,120,936 | | | | 2,147,156 | | | | 2,821,855 | | | | 15,358,679 | |
| | | | |
| | | | |
Expenses | | | | | | | | | | | | | | | | |
Management fee | | | 318,798 | | | | 195,064 | | | | 244,988 | | | | 1,153,117 | |
Administration fees | | | | | | | | | | | | | | | | |
Class A | | | 58,681 | | | | 61,240 | | | | 55,011 | | | | 227,098 | |
Class C | | | 2,908 | | | | 1,781 | | | | N/A | | | | 6,930 | |
Class R | | | 34 | | | | 34 | | | | 31 | | | | 114 | |
Class R4 | | | 73,284 | | | | 16,281 | | | | 34,979 | | | | 122,644 | |
Class R6 | | | 9,256 | | | | 11,508 | | | | 17,385 | | | | 89,969 | |
Administrator Class | | | 24,330 | | | | 29,064 | | | | 13,740 | | | | 118,369 | |
Shareholder servicing fees | | | | | | | | | | | | | | | | |
Class A | | | 69,857 | | | | 72,905 | | | | 65,490 | | | | 270,355 | |
Class C | | | 3,462 | | | | 2,120 | | | | N/A | | | | 8,250 | |
Class R | | | 40 | | | | 41 | | | | 37 | | | | 136 | |
Class R4 | | | 91,403 | | | | 20,351 | | | | 43,483 | | | | 153,031 | |
Administrator Class | | | 46,788 | | | | 55,520 | | | | 24,792 | | | | 222,690 | |
Distribution fees | | | | | | | | | | | | | | | | |
Class C | | | 10,385 | | | | 6,359 | | | | N/A | | | | 24,751 | |
Class R | | | 40 | | | | 41 | | | | 37 | | | | 136 | |
Custody and accounting fees | | | 8,692 | | | | 4,607 | | | | 6,548 | | | | 27,308 | |
Professional fees | | | 18,612 | | | | 17,783 | | | | 19,162 | | | | 19,464 | |
Registration fees | | | 47,185 | | | | 42,291 | | | | 49,912 | | | | 54,337 | |
Shareholder report expenses | | | 22,985 | | | | 19,949 | | | | 27,090 | | | | 45,242 | |
Trustees’ fees and expenses | | | 11,620 | | | | 11,618 | | | | 11,620 | | | | 11,669 | |
Interest expense | | | 11 | | | | 18 | | | | 88 | | | | 323 | |
Other fees and expenses | | | 8,144 | | | | 6,196 | | | | 8,698 | | | | 21,059 | |
| | | | |
Total expenses | | | 826,515 | | | | 574,771 | | | | 623,091 | | | | 2,576,992 | |
Less: Fee waivers and/or expense reimbursements | | | (262,816 | ) | | | (177,371 | ) | | | (219,613 | ) | | | (620,796 | ) |
| | | | |
Net expenses | | | 563,699 | | | | 397,400 | | | | 403,478 | | | | 1,956,196 | |
| | | | |
Net investment income | | | 2,557,237 | | | | 1,749,756 | | | | 2,418,377 | | | | 13,402,483 | |
| | | | |
| | | | |
REALIZED AND UNREALIZED GAINS (LOSSES) ON INVESTMENTS | | | | | | | | | | | | | | | | |
Net realized gains on securities transaction allocated from affiliated Master Portfolios | | | 5,256,097 | | | | 4,826,682 | | | | 8,757,969 | | | | 69,125,686 | |
| | | | |
Net change in unrealized gains (losses) on securities transactions allocated from affiliated Master Portfolios | | | (751,521 | ) | | | (1,029,180 | ) | | | (3,232,568 | ) | | | (36,693,379 | ) |
| | | | |
Net realized and unrealized gains (losses) on investments | | | 4,504,576 | | | | 3,797,502 | | | | 5,525,401 | | | | 32,432,307 | |
| | | | |
Net increase in net assets resulting from operations | | $ | 7,061,813 | | | $ | 5,547,258 | | | $ | 7,943,778 | | | $ | 45,834,790 | |
| | | | |
| | | | |
* Net of foreign interest withholding taxes allocated from affiliated Master Portfolios in the amount of | | | $7,797 | | | | $2,551 | | | | $4,509 | | | | $21,924 | |
** Net of foreign dividend withholding taxes allocated from affiliated Master Portfolios in the amount of | | | $47,125 | | | | $32,458 | | | | $51,682 | | | | $336,579 | |
The accompanying notes are an integral part of these financial statements.
| | | | | | |
| Statements of operations—six months ended August 31, 2017 (unaudited) | | Wells Fargo Target Date Funds | | | 37 | |
| | | | | | | | | | | | | | | | | | | | | | | | | | | | | | |
Target 2025 Fund | | | Target 2030
Fund | | | Target 2035
Fund | | | Target 2040
Fund | | | Target 2045
Fund | | | Target 2050
Fund | | | Target 2055
Fund | | | Target 2060
Fund | |
| | | | | | | |
| | | | | | | | | | | | | | | | | | | | | | | | | | | | | | |
| $ | 5,627,769 | | | $ | 8,091,873 | | | $ | 2,568,171 | | | $ | 3,027,547 | | | $ | 698,863 | | | $ | 803,246 | | | $ | 144,454 | | | $ | 31,662 | |
| | 4,169,729 | | | | 10,576,065 | | | | 5,841,583 | | | | 11,893,349 | | | | 4,739,099 | | | | 7,396,591 | | | | 1,350,333 | | | | 294,175 | |
| | 49,694 | | | | 126,134 | | | | 71,116 | | | | 143,842 | | | | 58,864 | | | | 91,082 | | | | 17,051 | | | | 3,546 | |
| | (708,347 | ) | | | (1,383,904 | ) | | | (640,625 | ) | | | (1,157,509 | ) | | | (428,221 | ) | | | (648,564 | ) | | | (118,166 | ) | | | (25,711 | ) |
| | |
| | 9,138,845 | | | | 17,410,168 | | | | 7,840,245 | | | | 13,907,229 | | | | 5,068,605 | | | | 7,642,355 | | | | 1,393,672 | | | | 303,672 | |
| | |
| | | | | | | |
| | | | | | | | | | | | | | | | | | | | | | | | | | | | | | |
| | 691,446 | | | | 1,326,738 | | | | 606,333 | | | | 1,078,990 | | | | 398,790 | | | | 599,975 | | | | 109,992 | | | | 23,560 | |
| | | | | | | | | | | | | | | | | | | | | | | | | | | | | | |
| | 143,878 | | | | 244,778 | | | | 132,118 | | | | 233,926 | | | | 71,555 | | | | 69,315 | | | | 10,136 | | | | 729 | |
| | N/A | | | | 4,951 | | | | N/A | | | | 5,241 | | | | N/A | | | | 1,364 | | | | N/A | | | | 259 | |
| | 158 | | | | 215 | | | | 201 | | | | 129 | | | | 45 | | | | 38 | | | | 43 | | | | 140 | |
| | 89,202 | | | | 178,656 | | | | 77,963 | | | | 140,220 | | | | 50,594 | | | | 89,120 | | | | 15,730 | | | | 2,848 | |
| | 54,240 | | | | 87,419 | | | | 47,768 | | | | 70,437 | | | | 32,728 | | | | 41,675 | | | | 9,896 | | | | 2,049 | |
| | 39,213 | | | | 158,515 | | | | 31,720 | | | | 119,895 | | | | 25,260 | | | | 74,734 | | | | 5,962 | | | | 3,404 | |
| | | | | | | | | | | | | | | | | | | | | | | | | | | | | | |
| | 171,284 | | | | 291,402 | | | | 157,283 | | | | 278,484 | | | | 85,185 | | | | 82,518 | | | | 12,067 | | | | 868 | |
| | N/A | | | | 5,895 | | | | N/A | | | | 6,240 | | | | N/A | | | | 1,624 | | | | N/A | | | | 309 | |
| | 188 | | | | 256 | | | | 239 | | | | 154 | | | | 53 | | | | 45 | | | | 52 | | | | 166 | |
| | 111,279 | | | | 222,951 | | | | 97,454 | | | | 175,275 | | | | 63,242 | | | | 111,400 | | | | 19,663 | | | | 3,561 | |
| | 70,899 | | | | 300,802 | | | | 58,319 | | | | 228,363 | | | | 47,181 | | | | 142,449 | | | | 11,235 | | | | 6,547 | |
| | | | | | | | | | | | | | | | | | | | | | | | | | | | | | |
| | N/A | | | | 17,684 | | | | N/A | | | | 18,719 | | | | N/A | | | | 4,872 | | | | N/A | | | | 926 | |
| | 188 | | | | 256 | | | | 239 | | | | 154 | | | | 53 | | | | 45 | | | | 52 | | | | 166 | |
| | 16,620 | | | | 31,110 | | | | 13,862 | | | | 26,094 | | | | 11,281 | | | | 13,864 | | | | 3,325 | | | | 1,473 | |
| | 17,566 | | | | 19,498 | | | | 18,963 | | | | 18,849 | | | | 19,031 | | | | 18,998 | | | | 17,600 | | | | 14,910 | |
| | 39,663 | | | | 48,370 | | | | 52,135 | | | | 46,845 | | | | 50,563 | | | | 50,099 | | | | 41,008 | | | | 38,321 | |
| | 42,705 | | | | 53,557 | | | | 41,152 | | | | 47,080 | | | | 29,328 | | | | 37,979 | | | | 14,921 | | | | 8,405 | |
| | 11,816 | | | | 11,618 | | | | 11,620 | | | | 11,644 | | | | 11,624 | | | | 11,662 | | | | 11,675 | | | | 11,613 | |
| | 479 | | | | 711 | | | | 762 | | | | 689 | | | | 668 | | | | 423 | | | | 130 | | | | 16 | |
| | 13,914 | | | | 24,106 | | | | 12,846 | | | | 19,044 | | | | 9,548 | | | | 12,276 | | | | 4,479 | | | | 5,701 | |
| | |
| | 1,514,738 | | | | 3,029,488 | | | | 1,360,977 | | | | 2,526,472 | | | | 906,729 | | | | 1,364,475 | | | | 287,966 | | | | 125,971 | |
| | (410,468 | ) | | | (678,903 | ) | | | (353,368 | ) | | | (550,731 | ) | | | (274,106 | ) | | | (370,387 | ) | | | (133,913 | ) | | | (89,833 | ) |
| | |
| | 1,104,270 | | | | 2,350,585 | | | | 1,007,609 | | | | 1,975,741 | | | | 632,623 | | | | 994,088 | | | | 154,053 | | | | 36,138 | |
| | |
| | 8,034,575 | | | | 15,059,583 | | | | 6,832,636 | | | | 11,931,488 | | | | 4,435,982 | | | | 6,648,267 | | | | 1,239,619 | | | | 267,534 | |
| | |
| | | | | | | |
| | | | | | | | | | | | | | | | | | | | | | | | | | | | | | | |
| 61,513,569 | | | | 190,509,827 | | | | 108,653,304 | | | | 244,037,029 | | | | 93,822,869 | | | | 156,165,736 | | | | 26,219,838 | | | | 6,501,821 | |
| | |
| (39,166,055 | ) | | | (138,367,435 | ) | | | (81,770,407 | ) | | | (190,387,487 | ) | | | (73,057,728 | ) | | | (123,635,348 | ) | | | (20,331,350 | ) | | | (5,208,788 | ) |
| | |
| | 22,347,514 | | | | 52,142,392 | | | | 26,882,897 | | | | 53,649,542 | | | | 20,765,141 | | | | 32,530,388 | | | | 5,888,488 | | | | 1,293,033 | |
| | |
| $ | 30,382,089 | | | $ | 67,201,975 | | | $ | 33,715,533 | | | $ | 65,581,030 | | | $ | 25,201,123 | | | $ | 39,178,655 | | | $ | 7,128,107 | | | $ | 1,560,567 | |
| | |
| | | | | | | |
| $12,049 | | | | $14,962 | | | | $4,965 | | | | $4,826 | | | | $1,176 | | | | $1,087 | | | | $228 | | | | $36 | |
| $273,995 | | | | $692,806 | | | | $386,980 | | | | $788,405 | | | | $317,121 | | | | $494,180 | | | | $90,949 | | | | $19,582 | |
The accompanying notes are an integral part of these financial statements.
| | | | |
| 38 | | Wells Fargo Target Date Funds | | Statements of changes in net assets |
| | | | | | | | | | | | | | | | |
| | | Target Today Fund | |
| | | Six months ended
August 31, 2017
(unaudited) | | | Year ended
February 28, 2017 | |
| |
Operations | | | | | |
Net investment income | | | | | | $ | 2,557,237 | | | | | | | $ | 8,108,238 | |
Net realized gains on investments | | | | | | | 5,256,097 | | | | | | | | 19,448,165 | |
Net change in unrealized gains (losses) on investments | | | | | | | (751,521 | ) | | | | | | | (6,228,835 | ) |
| | | | |
Net increase in net assets resulting from operations | | | | | | | 7,061,813 | | | | | | | | 21,327,568 | |
| | | | |
| |
Distributions to shareholders from | | | | | |
Net investment income | |
Class A | | | | | | | 0 | | | | | | | | (583,927 | ) |
Class C | | | | | | | 0 | | | | | | | | (10,272 | ) |
Class R | | | | | | | 0 | | | | | | | | (250 | ) |
Class R4 | | | | | | | 0 | | | | | | | | (3,309,292 | ) |
Class R6 | | | | | | | 0 | | | | | | | | (1,204,070 | ) |
Administrator Class | | | | | | | 0 | | | | | | | | (546,519 | ) |
Net realized gains | |
Class A | | | | | | | 0 | | | | | | | | (509,224 | ) |
Class C | | | | | | | 0 | | | | | | | | (24,645 | ) |
Class R | | | | | | | 0 | | | | | | | | (258 | ) |
Class R4 | | | | | | | 0 | | | | | | | | (2,228,868 | ) |
Class R6 | | | | | | | 0 | | | | | | | | (1,878,874 | ) |
Administrator Class | | | | | | | 0 | | | | | | | | (438,853 | ) |
| | | | |
Total distributions to shareholders | | | | | | | 0 | | | | | | | | (10,735,052 | ) |
| | | | |
| | | | |
Capital share transactions | | | Shares | | | | | | | | Shares | | | | | |
Proceeds from shares sold | |
Class A | | | 113,769 | | | | 1,213,271 | | | | 246,349 | | | | 2,631,608 | |
Class C | | | 4,295 | | | | 46,350 | | | | 28,357 | | | | 310,720 | |
Class R | | | 154 | | | | 1,643 | | | | 397 | | | | 4,180 | |
Class R4 | | | 994,542 | | | | 10,835,924 | | | | 3,300,035 | | | | 36,219,983 | |
Class R6 | | | 573,938 | | | | 6,245,280 | | | | 6,202,776 | | | | 68,036,987 | |
Administrator Class | | | 296,243 | | | | 3,226,203 | | | | 792,164 | | | | 8,623,265 | |
| | | | |
| | | | | | | 21,568,671 | | | | | | | | 115,826,743 | |
| | | | |
Reinvestment of distributions | |
Class A | | | 0 | | | | 0 | | | | 103,641 | | | | 1,083,760 | |
Class C | | | 0 | | | | 0 | | | | 3,217 | | | | 34,356 | |
Class R | | | 0 | | | | 0 | | | | 49 | | | | 508 | |
Class R4 | | | 0 | | | | 0 | | | | 517,812 | | | | 5,538,160 | |
Class R6 | | | 0 | | | | 0 | | | | 282,767 | | | | 3,032,839 | |
Administrator Class | | | 0 | | | | 0 | | | | 92,160 | | | | 983,978 | |
| | | | |
| | | | | | | 0 | | | | | | | | 10,673,601 | |
| | | | |
Payment for shares redeemed | |
Class A | | | (348,240 | ) | | | (3,717,842 | ) | | | (1,450,631 | ) | | | (15,543,355 | ) |
Class B | | | N/A | | | | N/A | | | | (310 | )1 | | | (3,437 | )1 |
Class C | | | (22,448 | ) | | | (243,425 | ) | | | (29,507 | ) | | | (322,360 | ) |
Class R | | | (177 | ) | | | (1,863 | ) | | | (157 | ) | | | (1,691 | ) |
Class R4 | | | (22,023,867 | ) | | | (240,859,878 | ) | | | (6,307,526 | ) | | | (68,848,062 | ) |
Class R6 | | | (2,982,749 | ) | | | (32,493,136 | ) | | | (22,670,955 | ) | | | (246,443,613 | ) |
Administrator Class | | | (795,412 | ) | | | (8,669,755 | ) | | | (3,068,548 | ) | | | (33,333,515 | ) |
| | | | |
| | | | | | | (285,985,899 | ) | | | | | | | (364,496,033 | ) |
| | | | |
Net decrease in net assets resulting from capital share transactions | | | | | | | (264,417,228 | ) | | | | | | | (237,995,689 | ) |
| | | | |
Total decrease in net assets | | | | | | | (257,355,415 | ) | | | | | | | (227,403,173 | ) |
| | | | |
| | |
Net assets | | | | | | | | |
Beginning of period | | | | | | | 419,429,787 | | | | | | | | 646,832,960 | |
| | | | |
End of period | | | | | | $ | 162,074,372 | | | | | | | $ | 419,429,787 | |
| | | | |
Undistributed (overdistributed) net investment income | | | | | | $ | 1,626,551 | | | | | | | $ | (930,686 | ) |
| | | | |
| 1 | For the period from March 1, 2016 to December 5, 2016. Effective at the close of business on December 5, 2016, Class B shares were converted to Class A shares and are no longer offered by the Fund. |
The accompanying notes are an integral part of these financial statements.
| | | | | | |
| Statements of changes in net assets | | Wells Fargo Target Date Funds | | | 39 | |
| | | | | | | | | | | | | | | | |
| | | Target 2010 Fund | |
| | | Six months ended
August 31, 2017
(unaudited) | | | Year ended
February 28, 2017 | |
| |
Operations | | | | | |
Net investment income | | | | | | $ | 1,749,756 | | | | | | | $ | 5,300,135 | |
Net realized gains on investments | | | | | | | 4,826,682 | | | | | | | | 17,262,849 | |
Net change in unrealized gains (losses) on investments | | | | | | | (1,029,180 | ) | | | | | | | (6,339,716 | ) |
| | | | |
Net increase in net assets resulting from operations | | | | | | | 5,547,258 | | | | | | | | 16,223,268 | |
| | | | |
| |
Distributions to shareholders from | | | | | |
Net investment income | |
Class A | | | | | | | 0 | | | | | | | | (482,645 | ) |
Class B | | | | | | | N/A | | | | | | | | (34 | )1 |
Class C | | | | | | | 0 | | | | | | | | (2,721 | ) |
Class R | | | | | | | 0 | | | | | | | | (297 | ) |
Class R4 | | | | | | | 0 | | | | | | | | (630,636 | ) |
Class R6 | | | | | | | 0 | | | | | | | | (1,832,870 | ) |
Administrator Class | | | | | | | 0 | | | | | | | | (678,380 | ) |
Net realized gains | |
Class A | | | | | | | 0 | | | | | | | | (1,034,288 | ) |
Class C | | | | | | | 0 | | | | | | | | (29,911 | ) |
Class R | | | | | | | 0 | | | | | | | | (882 | ) |
Class R4 | | | | | | | 0 | | | | | | | | (927,722 | ) |
Class R6 | | | | | | | 0 | | | | | | | | (2,563,659 | ) |
Administrator Class | | | | | | | 0 | | | | | | | | (1,215,342 | ) |
| | | | |
Total distributions to shareholders | | | | | | | 0 | | | | | | | | (9,399,387 | ) |
| | | | |
| | | | |
Capital share transactions | | | Shares | | | | | | | | Shares | | | | | |
Proceeds from shares sold | |
Class A | | | 48,323 | | | | 604,550 | | | | 320,041 | | | | 4,005,083 | |
Class C | | | 4,237 | | | | 53,842 | | | | 22,779 | | | | 286,839 | |
Class R | | | 0 | | | | 0 | | | | 9 | | | | 113 | |
Class R4 | | | 273,225 | | | | 3,465,250 | | | | 1,041,548 | | | | 13,249,443 | |
Class R6 | | | 689,439 | | | | 8,717,518 | | | | 4,547,953 | | | | 57,992,817 | |
Administrator Class | | | 170,419 | | | | 2,159,909 | | | | 722,092 | | | | 9,180,641 | |
| | | | |
| | | | | | | 15,001,069 | | | | | | | | 84,714,936 | |
| | | | |
Reinvestment of distributions | |
Class A | | | 0 | | | | 0 | | | | 120,746 | | | | 1,496,895 | |
Class B | | | N/A | | | | N/A | | | | 3 | 1 | | | 34 | 1 |
Class C | | | 0 | | | | 0 | | | | 2,527 | | | | 31,542 | |
Class R | | | 0 | | | | 0 | | | | 96 | | | | 1,179 | |
Class R4 | | | 0 | | | | 0 | | | | 124,200 | | | | 1,558,358 | |
Class R6 | | | 0 | | | | 0 | | | | 340,421 | | | | 4,277,373 | |
Administrator Class | | | 0 | | | | 0 | | | | 148,875 | | | | 1,866,250 | |
| | | | |
| | | | | | | 0 | | | | | | | | 9,231,631 | |
| | | | |
Payment for shares redeemed | |
Class A | | | (487,541 | ) | | | (6,105,026 | ) | | | (1,120,538 | ) | | | (14,076,865 | ) |
Class B | | | N/A | | | | N/A | | | | (2,486 | )1 | | | (31,397 | )1 |
Class C | | | (19,107 | ) | | | (242,010 | ) | | | (44,856 | ) | | | (570,911 | ) |
Class R | | | (2,100 | ) | | | (25,956 | ) | | | (48 | ) | | | (608 | ) |
Class R4 | | | (1,828,337 | ) | | | (23,182,781 | ) | | | (2,965,131 | ) | | | (37,697,012 | ) |
Class R6 | | | (1,984,460 | ) | | | (25,158,018 | ) | | | (14,486,651 | ) | | | (183,122,305 | ) |
Administrator Class | | | (1,001,173 | ) | | | (12,686,300 | ) | | | (4,298,183 | ) | | | (54,267,295 | ) |
| | | | |
| | | | | | | (67,400,091 | ) | | | | | | | (289,766,393 | ) |
| | | | |
Net decrease in net assets resulting from capital share transactions | | | | | | | (52,399,022 | ) | | | | | | | (195,819,826 | ) |
| | | | |
Total decrease in net assets | | | | | | | (46,851,764 | ) | | | | | | | (188,995,945 | ) |
| | | | |
| | |
Net assets | | | | | | | | |
Beginning of period | | | | | | | 242,974,151 | | | | | | | | 431,970,096 | |
| | | | |
End of period | | | | | | $ | 196,122,387 | | | | | | | $ | 242,974,151 | |
| | | | |
Undistributed (overdistributed) net investment income | | | | | | $ | 1,055,281 | | | | | | | $ | (694,475 | ) |
| | | | |
| 1 | For the period from March 1, 2016 to December 5, 2016. Effective at the close of business on December 5, 2016, Class B shares were converted to Class A shares and are no longer offered by the Fund. |
The accompanying notes are an integral part of these financial statements.
| | | | |
| 40 | | Wells Fargo Target Date Funds | | Statements of changes in net assets |
| | | | | | | | | | | | | | | | |
| | | Target 2015 Fund | |
| | | Six months ended
August 31, 2017
(unaudited) | | | Year ended
February 28, 2017 | |
| |
Operations | | | | | |
Net investment income | | | | | | $ | 2,418,377 | | | | | | | $ | 10,627,268 | |
Net realized gains on investments | | | | | | | 8,757,969 | | | | | | | | 31,119,358 | |
Net change in unrealized gains (losses) on investments | | | | | | | (3,232,568 | ) | | | | | | | (8,924,342 | ) |
| | | | |
Net increase in net assets resulting from operations | | | | | | | 7,943,778 | | | | | | | | 32,822,284 | |
| | | | |
| |
Distributions to shareholders from | | | | | |
Net investment income | |
Class A | | | | | | | (98,441 | ) | | | | | | | (664,158 | ) |
Class R | | | | | | | (12 | ) | | | | | | | (317 | ) |
Class R4 | | | | | | | (317,128 | ) | | | | | | | (1,501,134 | ) |
Class R6 | | | | | | | (461,344 | ) | | | | | | | (4,179,131 | ) |
Administrator Class | | | | | | | (45,109 | ) | | | | | | | (1,183,112 | ) |
Net realized gains | |
Class A | | | | | | | 0 | | | | | | | | (979,508 | ) |
Class R | | | | | | | 0 | | | | | | | | (591 | ) |
Class R4 | | | | | | | 0 | | | | | | | | (1,921,730 | ) |
Class R6 | | | | | | | 0 | | | | | | | | (5,490,488 | ) |
Administrator Class | | | | | | | 0 | | | | | | | | (1,670,852 | ) |
| | | | |
Total distributions to shareholders | | | | | | | (922,034 | ) | | | | | | | (17,591,021 | ) |
| | | | |
| | | | |
Capital share transactions | | | Shares | | | | | | | | Shares | | | | | |
Proceeds from shares sold | |
Class A | | | 110,922 | | | | 1,137,454 | | | | 472,706 | | | | 4,872,068 | |
Class R | | | 7 | | | | 75 | | | | 66 | | | | 681 | |
Class R4 | | | 521,655 | | | | 5,358,623 | | | | 3,281,066 | | | | 33,966,649 | |
Class R6 | | | 812,144 | | | | 8,335,147 | | | | 8,730,425 | | | | 90,017,825 | |
Administrator Class | | | 93,709 | | | | 975,981 | | | | 1,191,525 | | | | 12,386,745 | |
| | | | |
| | | | | | | 15,807,280 | | | | | | | | 141,243,968 | |
| | | | |
Reinvestment of distributions | |
Class A | | | 9,477 | | | | 97,803 | | | | 162,003 | | | | 1,635,999 | |
Class R | | | 1 | | | | 12 | | | | 89 | | | | 908 | |
Class R4 | | | 30,611 | | | | 317,128 | | | | 337,377 | | | | 3,422,864 | |
Class R6 | | | 43,667 | | | | 451,949 | | | | 921,605 | | | | 9,365,745 | |
Administrator Class | | | 4,259 | | | | 44,719 | | | | 277,370 | | | | 2,844,581 | |
| | | | |
| | | | | | | 911,611 | | | | | | | | 17,270,097 | |
| | | | |
Payment for shares redeemed | |
Class A | | | (732,777 | ) | | | (7,495,658 | ) | | | (2,799,861 | ) | | | (28,769,893 | ) |
Class R | | | (856 | ) | | | (8,810 | ) | | | (792 | ) | | | (8,129 | ) |
Class R4 | | | (4,996,195 | ) | | | (51,301,937 | ) | | | (6,077,465 | ) | | | (62,298,002 | ) |
Class R6 | | | (5,191,906 | ) | | | (53,596,469 | ) | | | (34,369,025 | ) | | | (348,220,043 | ) |
Administrator Class | | | (287,312 | ) | | | (2,989,249 | ) | | | (11,547,122 | ) | | | (118,243,491 | ) |
| | | | |
| | | | | | | (115,392,123 | ) | | | | | | | (557,539,558 | ) |
| | | | |
Net decrease in net assets resulting from capital share transactions | | | | | | | (98,673,232 | ) | | | | | | | (399,025,493 | ) |
| | | | |
Total decrease in net assets | | | | | | | (91,651,488 | ) | | | | | | | (383,794,230 | ) |
| | | | |
| | |
Net assets | | | | | | | | |
Beginning of period | | | | | | | 307,926,832 | | | | | | | | 691,721,062 | |
| | | | |
End of period | | | | | | $ | 216,275,344 | | | | | | | $ | 307,926,840 | |
| | | | |
Undistributed (overdistributed) net investment income | | | | | | $ | 349,054 | | | | | | | $ | (1,147,289 | ) |
| | | | |
The accompanying notes are an integral part of these financial statements.
| | | | | | |
| Statements of changes in net assets | | Wells Fargo Target Date Funds | | | 41 | |
| | | | | | | | | | | | | | | | |
| | | Target 2020 Fund | |
| | | Six months ended
August 31, 2017
(unaudited) | | | Year ended
February 28, 2017 | |
| |
Operations | | | | | |
Net investment income | | | | | | $ | 13,402,483 | | | | | | | $ | 39,779,558 | |
Net realized gains on investments | | | | | | | 69,125,686 | | | | | | | | 156,680,560 | |
Net change in unrealized gains (losses) on investments | | | | | | | (36,693,379 | ) | | | | | | | (34,503,411 | ) |
| | | | |
Net increase in net assets resulting from operations | | | | | | | 45,834,790 | | | | | | | | 161,956,707 | |
| | | | |
| |
Distributions to shareholders from | | | | | |
Net investment income | |
Class A | | | | | | | 0 | | | | | | | | (2,619,472 | ) |
Class B | | | | | | | N/A | | | | | | | | (87 | )1 |
Class C | | | | | | | 0 | | | | | | | | (38,178 | ) |
Class R | | | | | | | 0 | | | | | | | | (4,251 | ) |
Class R4 | | | | | | | 0 | | | | | | | | (5,634,274 | ) |
Class R6 | | | | | | | 0 | | | | | | | | (16,606,485 | ) |
Administrator Class | | | | | | | 0 | | | | | | | | (6,009,682 | ) |
Net realized gains | |
Class A | | | | | | | 0 | | | | | | | | (3,151,261 | ) |
Class C | | | | | | | 0 | | | | | | | | (99,187 | ) |
Class R | | | | | | | 0 | | | | | | | | (6,324 | ) |
Class R4 | | | | | | | 0 | | | | | | | | (5,485,709 | ) |
Class R6 | | | | | | | 0 | | | | | | | | (17,730,052 | ) |
Administrator Class | | | | | | | 0 | | | | | | | | (6,409,366 | ) |
| | | | |
Total distributions to shareholders | | | | | | | 0 | | | | | | | | (63,794,328 | ) |
| | | | |
| | | | |
Capital share transactions | | | Shares | | | | | | | | Shares | | | | | |
Proceeds from shares sold | |
Class A | | | 398,846 | | | | 6,026,006 | | | | 1,077,052 | | | | 15,995,960 | |
Class C | | | 16,259 | | | | 243,161 | | | | 145,106 | | | | 2,155,858 | |
Class R | | | 649 | | | | 9,756 | | | | 3,506 | | | | 52,543 | |
Class R4 | | | 1,994,901 | | | | 30,672,100 | | | | 7,912,329 | | | | 120,262,004 | |
Class R6 | | | 2,899,598 | | | | 44,617,392 | | | | 29,579,390 | | | | 448,662,128 | |
Administrator Class | | | 1,009,604 | | | | 15,460,947 | | | | 4,539,800 | | | | 68,331,350 | |
| | | | |
| | | | | | | 97,029,362 | | | | | | | | 655,459,843 | |
| | | | |
Reinvestment of distributions | |
Class A | | | 0 | | | | 0 | | | | 385,483 | | | | 5,674,858 | |
Class B | | | N/A | | | | N/A | | | | 6 | 1 | | | 87 | 1 |
Class C | | | 0 | | | | 0 | | | | 8,796 | | | | 128,190 | |
Class R | | | 0 | | | | 0 | | | | 722 | | | | 10,575 | |
Class R4 | | | 0 | | | | 0 | | | | 741,202 | | | | 11,119,983 | |
Class R6 | | | 0 | | | | 0 | | | | 2,223,824 | | | | 33,407,112 | |
Administrator Class | | | 0 | | | | 0 | | | | 824,099 | | | | 12,315,923 | |
| | | | |
| | | | | | | 0 | | | | | | | | 62,656,728 | |
| | | | |
Payment for shares redeemed | |
Class A | | | (1,496,575 | ) | | | (22,667,457 | ) | | | (3,011,707 | ) | | | (44,676,552 | ) |
Class B | | | N/A | | | | N/A | | | | (2,821 | )1 | | | (41,676 | )1 |
Class C | | | (67,466 | ) | | | (1,010,163 | ) | | | (149,522 | ) | | | (2,211,488 | ) |
Class R | | | (18,190 | ) | | | (270,263 | ) | | | (11,485 | ) | | | (168,905 | ) |
Class R4 | | | (11,245,424 | ) | | | (173,330,033 | ) | | | (13,315,739 | ) | | | (201,266,768 | ) |
Class R6 | | | (11,681,371 | ) | | | (180,057,444 | ) | | | (66,534,662 | ) | | | (998,627,589 | ) |
Administrator Class | | | (3,911,186 | ) | | | (60,081,562 | ) | | | (28,809,682 | ) | | | (431,422,845 | ) |
| | | | |
| | | | | | | (437,416,922 | ) | | | | | | | (1,678,415,823 | ) |
| | | | |
Net decrease in net assets resulting from capital share transactions | | | | | | | (340,387,560 | ) | | | | | | | (960,299,252 | ) |
| | | | |
Total decrease in net assets | | | | | | | (294,552,770 | ) | | | | | | | (862,136,873 | ) |
| | | | |
| | |
Net assets | | | | | | | | |
Beginning of period | | | | | | | 1,426,581,680 | | | | | | | | 2,288,718,553 | |
| | | | |
End of period | | | | | | $ | 1,132,028,910 | | | | | | | $ | 1,426,581,680 | |
| | | | |
Undistributed (overdistributed) net investment income | | | | | | $ | 8,149,742 | | | | | | | $ | (5,252,741 | ) |
| | | | |
| 1 | For the period from March 1, 2016 to December 5, 2016. Effective at the close of business on December 5, 2016, Class B shares were converted to Class A shares and are no longer offered by the Fund. |
The accompanying notes are an integral part of these financial statements.
| | | | |
| 42 | | Wells Fargo Target Date Funds | | Statements of changes in net assets |
| | | | | | | | | | | | | | | | |
| | | Target 2025 Fund | |
| | | Six months ended
August 31, 2017
(unaudited) | | | Year ended
February 28, 2017 | |
| |
Operations | | | | | |
Net investment income | | | | | | $ | 8,034,575 | | | | | | | $ | 35,642,585 | |
Net realized gains on investments | | | | | | | 61,513,569 | | | | | | | | 155,982,862 | |
Net change in unrealized gains (losses) on investments | | | | | | | (39,166,055 | ) | | | | | | | 8,889,925 | |
| | | | |
Net increase in net assets resulting from operations | | | | | | | 30,382,089 | | | | | | | | 200,515,372 | |
| | | | |
| |
Distributions to shareholders from | | | | | |
Net investment income | |
Class A | | | | | | | 0 | | | | | | | | (2,306,156 | ) |
Class R | | | | | | | 0 | | | | | | | | (7,276 | ) |
Class R4 | | | | | | | 0 | | | | | | | | (4,717,186 | ) |
Class R6 | | | | | | | 0 | | | | | | | | (18,967,324 | ) |
Administrator Class | | | | | | | 0 | | | | | | | | (4,708,394 | ) |
Net realized gains | |
Class A | | | | | | | 0 | | | | | | | | (2,361,873 | ) |
Class R | | | | | | | 0 | | | | | | | | (9,422 | ) |
Class R4 | | | | | | | 0 | | | | | | | | (4,472,260 | ) |
Class R6 | | | | | | | 0 | | | | | | | | (24,192,306 | ) |
Administrator Class | | | | | | | 0 | | | | | | | | (4,706,783 | ) |
| | | | |
Total distributions to shareholders | | | | | | | 0 | | | | | | | | (66,448,980 | ) |
| | | | |
| | | | |
Capital share transactions | | | Shares | | | | | | | | Shares | | | | | |
Proceeds from shares sold | |
Class A | | | 421,842 | | | | 4,498,366 | | | | 1,513,892 | | | | 15,681,305 | |
Class R | | | 6,359 | | | | 66,171 | | | | 2,822 | | | | 29,361 | |
Class R4 | | | 2,100,055 | | | | 22,473,921 | | | | 8,631,979 | | | | 90,459,627 | |
Class R6 | | | 3,466,412 | | | | 37,109,690 | | | | 27,490,150 | | | | 286,244,401 | |
Administrator Class | | | 496,155 | | | | 5,328,357 | | | | 4,209,931 | | | | 43,679,906 | |
| | | | |
| | | | | | | 69,476,505 | | | | | | | | 436,094,600 | |
| | | | |
Reinvestment of distributions | |
Class A | | | 0 | | | | 0 | | | | 446,066 | | | | 4,593,108 | |
Class R | | | 0 | | | | 0 | | | | 1,620 | | | | 16,698 | |
Class R4 | | | 0 | | | | 0 | | | | 889,379 | | | | 9,189,446 | |
Class R6 | | | 0 | | | | 0 | | | | 4,035,204 | | | | 41,802,977 | |
Administrator Class | | | 0 | | | | 0 | | | | 909,253 | | | | 9,408,063 | |
| | | | |
| | | | | | | 0 | | | | | | | | 65,010,292 | |
| | | | |
Payment for shares redeemed | |
Class A | | | (1,695,266 | ) | | | (18,107,400 | ) | | | (6,507,824 | ) | | | (67,704,631 | ) |
Class R | | | (61,100 | ) | | | (644,007 | ) | | | (31,107 | ) | | | (319,792 | ) |
Class R4 | | | (14,388,333 | ) | | | (154,235,207 | ) | | | (11,942,981 | ) | | | (124,035,573 | ) |
Class R6 | | | (14,997,380 | ) | | | (162,460,445 | ) | | | (140,764,802 | ) | | | (1,457,629,379 | ) |
Administrator Class | | | (1,778,236 | ) | | | (19,099,571 | ) | | | (29,281,475 | ) | | | (303,427,237 | ) |
| | | | |
| | | | | | | (354,546,630 | ) | | | | | | | (1,953,116,612 | ) |
| | | | |
Net decrease in net assets resulting from capital share transactions | | | | | | | (285,070,125 | ) | | | | | | | (1,452,011,720 | ) |
| | | | |
Total decrease in net assets | | | | | | | (254,688,036 | ) | | | | | | | (1,317,945,328 | ) |
| | | | |
| | |
Net assets | | | | | | | | |
Beginning of period | | | | | | | 853,398,011 | | | | | | | | 2,171,343,339 | |
| | | | |
End of period | | | | | | $ | 598,709,975 | | | | | | | $ | 853,398,011 | |
| | | | |
Undistributed (overdistributed) net investment income | | | | | | $ | 4,535,240 | | | | | | | $ | (3,499,335 | ) |
| | | | |
The accompanying notes are an integral part of these financial statements.
| | | | | | |
| Statements of changes in net assets | | Wells Fargo Target Date Funds | | | 43 | |
| | | | | | | | | | | | | | | | |
| | | Target 2030 Fund | |
| | | Six months ended
August 31, 2017
(unaudited) | | | Year ended
February 28, 2017 | |
| |
Operations | | | | | |
Net investment income | | | | | | $ | 15,059,583 | | | | | | | $ | 41,788,964 | |
Net realized gains on investments | | | | | | | 190,509,827 | | | | | | | | 285,192,645 | |
Net change in unrealized gains (losses) on investments | | | | | | | (138,367,435 | ) | | | | | | | 3,651,745 | |
| | | | |
Net increase in net assets resulting from operations | | | | | | | 67,201,975 | | | | | | | | 330,633,354 | |
| | | | |
| |
Distributions to shareholders from | | | | | |
Net investment income | |
Class A | | | | | | | 0 | | | | | | | | (4,250,699 | ) |
Class C | | | | | | | 0 | | | | | | | | (63,295 | ) |
Class R | | | | | | | 0 | | | | | | | | (14,867 | ) |
Class R4 | | | | | | | 0 | | | | | | | | (10,858,017 | ) |
Class R6 | | | | | | | 0 | | | | | | | | (14,022,915 | ) |
Administrator Class | | | | | | | 0 | | | | | | | | (8,992,896 | ) |
Net realized gains | |
Class A | | | | | | | 0 | | | | | | | | (3,932,043 | ) |
Class C | | | | | | | 0 | | | | | | | | (87,929 | ) |
Class R | | | | | | | 0 | | | | | | | | (15,488 | ) |
Class R4 | | | | | | | 0 | | | | | | | | (8,913,930 | ) |
Class R6 | | | | | | | 0 | | | | | | | | (23,598,415 | ) |
Administrator Class | | | | | | | 0 | | | | | | | | (7,999,829 | ) |
| | | | |
Total distributions to shareholders | | | | | | | 0 | | | | | | | | (82,750,323 | ) |
| | | | |
| | | | |
Capital share transactions | | | Shares | | | | | | | | Shares | | | | | |
Proceeds from shares sold | |
Class A | | | 359,333 | | | | 6,123,479 | | | | 1,063,697 | | | | 17,423,388 | |
Class B | | | N/A | | | | N/A | | | | 1,321 | 1 | | | 21,894 | 1 |
Class C | | | 15,199 | | | | 254,802 | | | | 16,824 | | | | 268,578 | |
Class R | | | 2,651 | | | | 44,287 | | | | 2,851 | | | | 46,868 | |
Class R4 | | | 2,810,167 | | | | 48,636,444 | | | | 9,056,613 | | | | 151,196,897 | |
Class R6 | | | 4,452,345 | | | | 77,076,864 | | | | 22,368,225 | | | | 371,281,603 | |
Administrator Class | | | 1,492,696 | | | | 25,774,417 | | | | 5,648,833 | | | | 93,336,961 | |
| | | | |
| | | | | | | 157,910,293 | | | | | | | | 633,576,189 | |
| | | | |
Reinvestment of distributions | |
Class A | | | 0 | | | | 0 | | | | 493,003 | | | | 8,029,944 | |
Class C | | | 0 | | | | 0 | | | | 8,931 | | | | 141,623 | |
Class R | | | 0 | | | | 0 | | | | 1,868 | | | | 30,355 | |
Class R4 | | | 0 | | | | 0 | | | | 1,196,727 | | | | 19,771,947 | |
Class R6 | | | 0 | | | | 0 | | | | 2,210,976 | | | | 36,707,115 | |
Administrator Class | | | 0 | | | | 0 | | | | 1,029,012 | | | | 16,991,572 | |
| | | | |
| | | | | | | 0 | | | | | | | | 81,672,556 | |
| | | | |
Payment for shares redeemed | |
Class A | | | (937,064 | ) | | | (16,048,748 | ) | | | (2,806,490 | ) | | | (45,994,982 | ) |
Class B | | | N/A | | | | N/A | | | | (6,730 | )1 | | | (107,466 | )1 |
Class C | | | (10,545 | ) | | | (172,757 | ) | | | (55,899 | ) | | | (883,151 | ) |
Class R | | | (54,558 | ) | | | (912,765 | ) | | | (6,765 | ) | | | (111,328 | ) |
Class R4 | | | (12,679,634 | ) | | | (219,793,445 | ) | | | (13,713,378 | ) | | | (228,391,107 | ) |
Class R6 | | | (12,227,307 | ) | | | (212,290,435 | ) | | | (71,624,029 | ) | | | (1,201,710,967 | ) |
Administrator Class | | | (4,621,520 | ) | | | (80,073,322 | ) | | | (23,620,555 | ) | | | (392,144,183 | ) |
| | | | |
| | | | | | | (529,291,472 | ) | | | | | | | (1,869,343,184 | ) |
| | | | |
Net decrease in net assets resulting from capital share transactions | | | | | | | (371,381,179 | ) | | | | | | | (1,154,094,439 | ) |
| | | | |
Total decrease in net assets | | | | | | | (304,179,204 | ) | | | | | | | (906,211,408 | ) |
| | | | |
| | |
Net assets | | | | | | | | |
Beginning of period | | | | | | | 1,624,053,093 | | | | | | | | 2,530,264,501 | |
| | | | |
End of period | | | | | | $ | 1,319,873,889 | | | | | | | $ | 1,624,053,093 | |
| | | | |
Undistributed (overdistributed) net investment income | | | | | | $ | 12,323,321 | | | | | | | $ | (2,736,262 | ) |
| | | | |
| 1 | For the period from March 1, 2016 to December 5, 2016. Effective at the close of business on December 5, 2016, Class B shares were converted to Class A shares and are no longer offered by the Fund. |
The accompanying notes are an integral part of these financial statements.
| | | | |
| 44 | | Wells Fargo Target Date Funds | | Statements of changes in net assets |
| | | | | | | | | | | | | | | | |
| | | Target 2035 Fund | |
| | | Six months ended
August 31, 2017
(unaudited) | | | Year ended
February 28, 2017 | |
| |
Operations | | | | | |
Net investment income | | | | | | $ | 6,832,636 | | | | | | | $ | 20,578,296 | |
Net realized gains on investments | | | | | | | 108,653,304 | | | | | | | | 159,628,599 | |
Net change in unrealized gains (losses) on investments | | | | | | | (81,770,407 | ) | | | | | | | 19,222,082 | |
| | | | |
Net increase in net assets resulting from operations | | | | | | | 33,715,533 | | | | | | | | 199,428,977 | |
| | | | |
| |
Distributions to shareholders from | | | | | |
Net investment income | |
Class A | | | | | | | (439,566 | ) | | | | | | | (1,962,259 | ) |
Class R | | | | | | | (482 | ) | | | | | | | (1,558 | ) |
Class R4 | | | | | | | (1,056,332 | ) | | | | | | | (4,088,239 | ) |
Class R6 | | | | | | | (1,766,702 | ) | | | | | | | (11,397,239 | ) |
Administrator Class | | | | | | | (172,234 | ) | | | | | | | (2,957,409 | ) |
Net realized gains | |
Class A | | | | | | | 0 | | | | | | | | (2,126,418 | ) |
Class R | | | | | | | 0 | | | | | | | | (2,161 | ) |
Class R4 | | | | | | | 0 | | | | | | | | (3,964,240 | ) |
Class R6 | | | | | | | 0 | | | | | | | | (13,329,527 | ) |
Administrator Class | | | | | | | 0 | | | | | | | | (3,129,387 | ) |
| | | | |
Total distributions to shareholders | | | | | | | (3,435,316 | ) | | | | | | | (42,958,437 | ) |
| | | | |
| | | | |
Capital share transactions | | | Shares | | | | | | | | Shares | | | | | |
Proceeds from shares sold | |
Class A | | | 516,990 | | | | 5,943,433 | | | | 1,253,704 | | | | 13,492,027 | |
Class R | | | 6,840 | | | | 77,925 | | | | 9,064 | | | | 98,311 | |
Class R4 | | | 1,775,581 | | | | 20,417,996 | | | | 6,809,847 | | | | 74,141,264 | |
Class R6 | | | 3,001,197 | | | | 34,527,092 | | | | 19,872,642 | | | | 214,299,770 | |
Administrator Class | | | 442,895 | | | | 5,105,141 | | | | 3,078,500 | | | | 33,060,548 | |
| | | | |
| | | | | | | 66,071,587 | | | | | | | | 335,091,920 | |
| | | | |
Reinvestment of distributions | |
Class A | | | 37,297 | | | | 434,136 | | | | 374,031 | | | | 4,045,225 | |
Class R | | | 41 | | | | 482 | | | | 341 | | | | 3,719 | |
Class R4 | | | 90,672 | | | | 1,056,332 | | | | 744,052 | | | | 8,052,479 | |
Class R6 | | | 146,417 | | | | 1,705,759 | | | | 2,212,469 | | | | 23,935,961 | |
Administrator Class | | | 14,733 | | | | 172,234 | | | | 560,180 | | | | 6,086,796 | |
| | | | |
| | | | | | | 3,368,943 | | | | | | | | 42,124,180 | |
| | | | |
Payment for shares redeemed | |
Class A | | | (1,528,934 | ) | | | (17,636,041 | ) | | | (4,754,278 | ) | | | (51,553,434 | ) |
Class R | | | (5,640 | ) | | | (64,124 | ) | | | (1,649 | ) | | | (18,193 | ) |
Class R4 | | | (11,636,228 | ) | | | (133,821,246 | ) | | | (9,351,383 | ) | | | (100,761,245 | ) |
Class R6 | | | (11,548,586 | ) | | | (134,719,881 | ) | | | (66,063,881 | ) | | | (722,366,426 | ) |
Administrator Class | | | (1,001,350 | ) | | | (11,565,985 | ) | | | (17,507,773 | ) | | | (192,188,450 | ) |
| | | | |
| | | | | | | (297,807,277 | ) | | | | | | | (1,066,887,748 | ) |
| | | | |
Net decrease in net assets resulting from capital share transactions | | | | | | | (228,366,747 | ) | | | | | | | (689,671,648 | ) |
| | | | |
Total decrease in net assets | | | | | | | (198,086,530 | ) | | | | | | | (533,201,108 | ) |
| | | | |
| | |
Net assets | | | | | | | | |
Beginning of period | | | | | | | 735,982,617 | | | | | | | | 1,269,183,725 | |
| | | | |
End of period | | | | | | $ | 537,896,087 | | | | | | | $ | 735,982,617 | |
| | | | |
Undistributed (overdistributed) net investment income | | | | | | $ | 2,608,012 | | | | | | | $ | (789,308 | ) |
| | | | |
The accompanying notes are an integral part of these financial statements.
| | | | | | |
| Statements of changes in net assets | | Wells Fargo Target Date Funds | | | 45 | |
| | | | | | | | | | | | | | | | |
| | | Target 2040 Fund | |
| | | Six months ended
August 31, 2017
(unaudited) | | | Year ended
February 28, 2017 | |
| |
Operations | | | | | |
Net investment income | | | | | | $ | 11,931,488 | | | | | | | $ | 29,675,772 | |
Net realized gains on investments | | | | | | | 244,037,029 | | | | | | | | 281,561,882 | |
Net change in unrealized gains (losses) on investments | | | | | | | (190,387,487 | ) | | | | | | | 28,899,272 | |
| | | | |
Net increase in net assets resulting from operations | | | | | | | 65,581,030 | | | | | | | | 340,136,926 | |
| | | | |
| |
Distributions to shareholders from | | | | | |
Net investment income | |
Class A | | | | | | | 0 | | | | | | | | (3,118,747 | ) |
Class B | | | | | | | N/A | | | | | | | | (240 | )1 |
Class C | | | | | | | 0 | | | | | | | | (39,836 | ) |
Class R | | | | | | | 0 | | | | | | | | (4,094 | ) |
Class R4 | | | | | | | 0 | | | | | | | | (6,907,862 | ) |
Class R6 | | | | | | | 0 | | | | | | | | (15,908,768 | ) |
Administrator Class | | | | | | | 0 | | | | | | | | (4,922,079 | ) |
Net realized gains | |
Class A | | | | | | | 0 | | | | | | | | (3,955,515 | ) |
Class C | | | | | | | 0 | | | | | | | | (92,338 | ) |
Class R | | | | | | | 0 | | | | | | | | (5,844 | ) |
Class R4 | | | | | | | 0 | | | | | | | | (7,095,650 | ) |
Class R6 | | | | | | | 0 | | | | | | | | (19,057,353 | ) |
Administrator Class | | | | | | | 0 | | | | | | | | (5,594,910 | ) |
| | | | |
Total distributions to shareholders | | | | | | | 0 | | | | | | | | (66,703,236 | ) |
| | | | |
| | | | |
Capital share transactions | | | Shares | | | | | | | | Shares | | | | | |
Proceeds from shares sold | |
Class A | | | 316,742 | | | | 6,320,577 | | | | 750,385 | | | | 13,850,987 | |
Class C | | | 27,645 | | | | 515,102 | | | | 22,185 | | | | 384,662 | |
Class R | | | 826 | | | | 16,074 | | | | 5,024 | | | | 95,186 | |
Class R4 | | | 1,928,537 | | | | 39,248,770 | | | | 5,991,638 | | | | 113,545,876 | |
Class R6 | | | 3,142,600 | | | | 63,974,158 | | | | 16,718,285 | | | | 314,049,695 | |
Administrator Class | | | 1,061,261 | | | | 21,526,966 | | | | 3,806,064 | | | | 71,124,538 | |
| | | | |
| | | | | | | 131,601,647 | | | | | | | | 513,050,944 | |
| | | | |
Reinvestment of distributions | |
Class A | | | 0 | | | | 0 | | | | 373,738 | | | | 6,933,608 | |
Class B | | | N/A | | | | N/A | | | | 14 | 1 | | | 240 | 1 |
Class C | | | 0 | | | | 0 | | | | 7,220 | | | | 126,095 | |
Class R | | | 0 | | | | 0 | | | | 537 | | | | 9,938 | |
Class R4 | | | 0 | | | | 0 | | | | 740,553 | | | | 14,003,512 | |
Class R6 | | | 0 | | | | 0 | | | | 1,820,117 | | | | 34,392,916 | |
Administrator Class | | | 0 | | | | 0 | | | | 550,579 | | | | 10,409,892 | |
| | | | |
| | | | | | | 0 | | | | | | | | 65,876,201 | |
| | | | |
Payment for shares redeemed | |
Class A | | | (728,181 | ) | | | (14,554,978 | ) | | | (1,937,707 | ) | | | (35,723,021 | ) |
Class B | | | N/A | | | | N/A | | | | (5,548 | )1 | | | (97,562 | )1 |
Class C | | | (17,244 | ) | | | (319,549 | ) | | | (60,643 | ) | | | (1,048,846 | ) |
Class R | | | (18,224 | ) | | | (354,416 | ) | | | (2,536 | ) | | | (47,441 | ) |
Class R4 | | | (7,464,377 | ) | | | (152,192,470 | ) | | | (9,697,443 | ) | | | (183,790,455 | ) |
Class R6 | | | (8,195,715 | ) | | | (167,798,108 | ) | | | (48,266,026 | ) | | | (923,947,920 | ) |
Administrator Class | | | (2,934,155 | ) | | | (59,707,600 | ) | | | (13,179,578 | ) | | | (250,636,949 | ) |
| | | | |
| | | | | | | (394,927,121 | ) | | | | | | | (1,395,292,194 | ) |
| | | | |
Net decrease in net assets resulting from capital share transactions | | | | | | | (263,325,474 | ) | | | | | | | (816,365,049 | ) |
| | | | |
Total decrease in net assets | | | | | | | (197,744,444 | ) | | | | | | | (542,931,359 | ) |
| | | | |
| | |
Net assets | | | | | | | | |
Beginning of period | | | | | | | 1,299,452,092 | | | | | | | | 1,842,383,451 | |
| | | | |
End of period | | | | | | $ | 1,101,707,648 | | | | | | | $ | 1,299,452,092 | |
| | | | |
Undistributed (overdistributed) net investment income | | | | | | $ | 10,474,702 | | | | | | | $ | (1,456,786 | ) |
| | | | |
| 1 | For the period from March 1, 2016 to December 5, 2016. Effective at the close of business on December 5, 2016, Class B shares were converted to Class A shares and are no longer offered by the Fund. |
The accompanying notes are an integral part of these financial statements.
| | | | |
| 46 | | Wells Fargo Target Date Funds | | Statements of changes in net assets |
| | | | | | | | | | | | | | | | |
| | | Target 2045 Fund | |
| | | Six months ended
August 31, 2017
(unaudited) | | | Year ended
February 28, 2017 | |
| |
Operations | | | | | |
Net investment income | | | | | | $ | 4,435,982 | | | | | | | $ | 11,887,740 | |
Net realized gains on investments | | | | | | | 93,822,869 | | | | | | | | 114,510,017 | |
Net change in unrealized gains (losses) on investments | | | | | | | (73,057,728 | ) | | | | | | | 20,363,337 | |
| | | | |
Net increase in net assets resulting from operations | | | | | | | 25,201,123 | | | | | | �� | | 146,761,094 | |
| | | | |
| |
Distributions to shareholders from | | | | | |
Net investment income | |
Class A | | | | | | | (290,430 | ) | | | | | | | (1,166,088 | ) |
Class R | | | | | | | (132 | ) | | | | | | | (440 | ) |
Class R4 | | | | | | | (770,814 | ) | | | | | | | (2,597,632 | ) |
Class R6 | | | | | | | (1,335,391 | ) | | | | | | | (7,314,597 | ) |
Administrator Class | | | | | | | (161,243 | ) | | | | | | | (1,885,277 | ) |
Net realized gains | |
Class A | | | | | | | 0 | | | | | | | | (1,033,575 | ) |
Class R | | | | | | | 0 | | | | | | | | (492 | ) |
Class R4 | | | | | | | 0 | | | | | | | | (2,165,894 | ) |
Class R6 | | | | | | | 0 | | | | | | | | (7,211,828 | ) |
Administrator Class | | | | | | | 0 | | | | | | | | (1,659,277 | ) |
| | | | |
Total distributions to shareholders | | | | | | | (2,558,010 | ) | | | | | | | (25,035,100 | ) |
| | | | |
| | | | |
Capital share transactions | | | Shares | | | | | | | | Shares | | | | | |
Proceeds from shares sold | |
Class A | | | 355,614 | | | | 4,339,011 | | | | 1,201,048 | | | | 13,439,925 | |
Class R | | | 268 | | | | 3,308 | | | | 1,044 | | | | 11,983 | |
Class R4 | | | 1,346,593 | | | | 16,493,063 | | | | 4,442,172 | | | | 50,226,606 | |
Class R6 | | | 2,236,688 | | | | 27,337,350 | | | | 15,704,610 | | | | 175,212,278 | |
Administrator Class | | | 418,437 | | | | 5,136,472 | | | | 2,322,405 | | | | 25,910,378 | |
| | | | |
| | | | | | | 53,309,204 | | | | | | | | 264,801,170 | |
| | | | |
Reinvestment of distributions | |
Class A | | | 23,366 | | | | 288,806 | | | | 194,607 | | | | 2,190,289 | |
Class R | | | 11 | | | | 132 | | | | 82 | | | | 932 | |
Class R4 | | | 62,112 | | | | 770,814 | | | | 421,613 | | | | 4,763,526 | |
Class R6 | | | 104,530 | | | | 1,294,077 | | | | 1,260,571 | | | | 14,181,842 | |
Administrator Class | | | 12,931 | | | | 161,243 | | | | 312,184 | | | | 3,542,901 | |
| | | | |
| | | | | | | 2,515,072 | | | | | | | | 24,679,490 | |
| | | | |
Payment for shares redeemed | |
Class A | | | (1,335,815 | ) | | | (16,413,228 | ) | | | (3,119,406 | ) | | | (34,969,496 | ) |
Class R | | | (274 | ) | | | (3,319 | ) | | | (579 | ) | | | (6,579 | ) |
Class R4 | | | (7,106,741 | ) | | | (87,064,627 | ) | | | (5,181,915 | ) | | | (58,020,514 | ) |
Class R6 | | | (8,002,917 | ) | | | (99,193,415 | ) | | | (38,859,114 | ) | | | (444,874,202 | ) |
Administrator Class | | | (956,154 | ) | | | (11,739,894 | ) | | | (9,816,729 | ) | | | (113,364,507 | ) |
| | | | |
| | | | | | | (214,414,483 | ) | | | | | | | (651,235,298 | ) |
| | | | |
Net decrease in net assets resulting from capital share transactions | | | | | | | (158,590,207 | ) | | | | | | | (361,754,638 | ) |
| | | | |
Total decrease in net assets | | | | | | | (135,947,094 | ) | | | | | | | (240,028,644 | ) |
| | | | |
| | |
Net assets | | | | | | | | |
Beginning of period | | | | | | | 484,036,945 | | | | | | | | 724,065,589 | |
| | | | |
End of period | | | | | | $ | 348,089,851 | | | | | | | $ | 484,036,945 | |
| | | | |
Undistributed (overdistributed) net investment income | | | | | | $ | 1,616,882 | | | | | | | $ | (261,090 | ) |
| | | | |
The accompanying notes are an integral part of these financial statements.
| | | | | | |
| Statements of changes in net assets | | Wells Fargo Target Date Funds | | | 47 | |
| | | | | | | | | | | | | | | | |
| | | Target 2050 Fund | |
| | | Six months ended
August 31, 2017
(unaudited) | | | Year ended
February 28, 2017 | |
| |
Operations | | | | | |
Net investment income | | | | | | $ | 6,648,267 | | | | | | | $ | 20,768,333 | |
Net realized gains on investments | | | | | | | 156,165,736 | | | | | | | | 178,311,295 | |
Net change in unrealized gains (losses) on investments | | | | | | | (123,635,348 | ) | | | | | | | 61,120,568 | |
| | | | |
Net increase in net assets resulting from operations | | | | | | | 39,178,655 | | | | | | | | 260,200,196 | |
| | | | |
| |
Distributions to shareholders from | | | | | |
Net investment income | |
Class A | | | | | | | (276,783 | ) | | | | | | | (1,052,438 | ) |
Class C | | | | | | | (1,214 | ) | | | | | | | (10,753 | ) |
Class R | | | | | | | (115 | ) | | | | | | | (570 | ) |
Class R4 | | | | | | | (1,337,308 | ) | | | | | | | (4,811,396 | ) |
Class R6 | | | | | | | (1,722,560 | ) | | | | | | | (13,860,592 | ) |
Administrator Class | | | | | | | (526,593 | ) | | | | | | | (3,479,790 | ) |
Net realized gains | |
Class A | | | | | | | 0 | | | | | | | | (931,850 | ) |
Class C | | | | | | | 0 | | | | | | | | (17,124 | ) |
Class R | | | | | | | 0 | | | | | | | | (486 | ) |
Class R4 | | | | | | | 0 | | | | | | | | (3,687,375 | ) |
Class R6 | | | | | | | 0 | | | | | | | | (14,124,221 | ) |
Administrator Class | | | | | | | 0 | | | | | | | | (2,769,054 | ) |
| | | | |
Total distributions to shareholders | | | | | | | (3,864,573 | ) | | | | | | | (44,745,649 | ) |
| | | | |
| | | | |
Capital share transactions | | | Shares | | | | | | | | Shares | | | | | |
Proceeds from shares sold | |
Class A | | | 414,730 | | | | 4,854,532 | | | | 1,073,967 | | | | 11,452,648 | |
Class C | | | 14,218 | | | | 166,561 | | | | 34,167 | | | | 367,397 | |
Class R | | | 65 | | | | 765 | | | | 1,294 | | | | 13,688 | |
Class R4 | | | 2,811,515 | | | | 33,021,160 | | | | 8,595,718 | | | | 92,702,362 | |
Class R6 | | | 4,193,783 | | | | 49,178,494 | | | | 25,211,448 | | | | 268,725,737 | |
Administrator Class | | | 1,698,591 | | | | 19,847,370 | | | | 5,754,148 | | | | 61,093,379 | |
| | | | |
| | | | | | | 107,068,882 | | | | | | | | 434,355,211 | |
| | | | |
Reinvestment of distributions | |
Class A | | | 23,199 | | | | 274,910 | | | | 183,141 | | | | 1,974,063 | |
Class C | | | 102 | | | | 1,201 | | | | 2,542 | | | | 27,550 | |
Class R | | | 10 | | | | 115 | | | | 98 | | | | 1,056 | |
Class R4 | | | 112,474 | | | | 1,337,308 | | | | 786,828 | | | | 8,498,771 | |
Class R6 | | | 142,061 | | | | 1,687,680 | | | | 2,556,328 | | | | 27,519,772 | |
Administrator Class | | | 44,375 | | | | 526,286 | | | | 576,210 | | | | 6,206,033 | |
| | | | |
| | | | | | | 3,827,500 | | | | | | | | 44,227,245 | |
| | | | |
Payment for shares redeemed | |
Class A | | | (618,736 | ) | | | (7,288,370 | ) | | | (1,727,222 | ) | | | (18,384,264 | ) |
Class C | | | (8,579 | ) | | | (100,026 | ) | | | (22,857 | ) | | | (244,462 | ) |
Class R | | | (14 | ) | | | (155 | ) | | | (1,744 | ) | | | (18,969 | ) |
Class R4 | | | (8,947,381 | ) | | | (105,148,428 | ) | | | (10,848,862 | ) | | | (117,265,781 | ) |
Class R6 | | | (9,807,045 | ) | | | (115,833,526 | ) | | | (86,275,614 | ) | | | (948,116,955 | ) |
Administrator Class | | | (3,408,922 | ) | | | (39,918,455 | ) | | | (14,966,837 | ) | | | (162,602,080 | ) |
| | | | |
| | | | | | | (268,288,960 | ) | | | | | | | (1,246,632,511 | ) |
| | | | |
Net decrease in net assets resulting from capital share transactions | | | | | | | (157,392,578 | ) | | | | | | | (768,050,055 | ) |
| | | | |
Total decrease in net assets | | | | | | | (122,078,496 | ) | | | | | | | (552,595,508 | ) |
| | | | |
| | |
Net assets | | | | | | | | |
Beginning of period | | | | | | | 717,398,062 | | | | | | | | 1,269,993,570 | |
| | | | |
End of period | | | | | | $ | 595,319,566 | | | | | | | $ | 717,398,062 | |
| | | | |
Undistributed (overdistributed) net investment income | | | | | | $ | 1,734,755 | | | | | | | $ | (1,048,939 | ) |
| | | | |
The accompanying notes are an integral part of these financial statements.
| | | | |
| 48 | | Wells Fargo Target Date Funds | | Statements of changes in net assets |
| | | | | | | | | | | | | | | | |
| | | Target 2055 Fund | |
| | | Six months ended
August 31, 2017
(unaudited) | | | Year ended
February 28, 2017 | |
| |
Operations | | | | | |
Net investment income | | | | | | $ | 1,239,619 | | | | | | | $ | 3,900,658 | |
Net realized gains on investments | | | | | | | 26,219,838 | | | | | | | | 30,594,432 | |
Net change in unrealized gains (losses) on investments | | | | | | | (20,331,350 | ) | | | | | | | 13,165,216 | |
| | | | |
Net increase in net assets resulting from operations | | | | | | | 7,128,107 | | | | | | | | 47,660,306 | |
| | | | |
| |
Distributions to shareholders from | | | | | |
Net investment income | |
Class A | | | | | | | (42,378 | ) | | | | | | | (165,923 | ) |
Class R | | | | | | | (156 | ) | | | | | | | (775 | ) |
Class R4 | | | | | | | (274,428 | ) | | | | | | | (719,343 | ) |
Class R6 | | | | | | | (429,216 | ) | | | | | | | (3,141,825 | ) |
Administrator Class | | | | | | | (40,799 | ) | | | | | | | (380,788 | ) |
| | | | |
Total distributions to shareholders | | | | | | | (786,977 | ) | | | | | | | (4,408,654 | ) |
| | | | |
| | | | |
Capital share transactions | | | Shares | | | | | | | | Shares | | | | | |
Proceeds from shares sold | |
Class A | | | 97,259 | | | | 1,388,302 | | | | 295,984 | | | | 3,791,625 | |
Class R | | | 369 | | | | 5,250 | | | | 2,272 | | | | 28,459 | |
Class R4 | | | 734,662 | | | | 10,505,544 | | | | 1,821,833 | | | | 23,608,827 | |
Class R6 | | | 1,144,701 | | | | 16,343,400 | | | | 10,227,920 | | | | 130,922,660 | |
Administrator Class | | | 194,671 | | | | 2,777,807 | | | | 1,273,847 | | | | 16,263,083 | |
| | | | |
| | | | | | | 31,020,303 | | | | | | | | 174,614,654 | |
| | | | |
Reinvestment of distributions | |
Class A | | | 2,861 | | | | 41,350 | | | | 12,712 | | | | 162,444 | |
Class R | | | 11 | | | | 156 | | | | 61 | | | | 775 | |
Class R4 | | | 18,952 | | | | 274,428 | | | | 56,009 | | | | 719,343 | |
Class R6 | | | 28,553 | | | | 412,586 | | | | 230,120 | | | | 2,903,253 | |
Administrator Class | | | 2,823 | | | | 40,799 | | | | 29,767 | | | | 380,770 | |
| | | | |
| | | | | | | 769,319 | | | | | | | | 4,166,585 | |
| | | | |
Payment for shares redeemed | |
Class A | | | (113,273 | ) | | | (1,631,467 | ) | | | (415,288 | ) | | | (5,349,209 | ) |
Class R | | | (299 | ) | | | (4,189 | ) | | | (3,065 | ) | | | (39,597 | ) |
Class R4 | | | (2,078,635 | ) | | | (29,819,066 | ) | | | (1,128,838 | ) | | | (14,561,489 | ) |
Class R6 | | | (2,295,692 | ) | | | (33,154,413 | ) | | | (19,725,771 | ) | | | (262,098,148 | ) |
Administrator Class | | | (285,894 | ) | | | (4,073,848 | ) | | | (1,881,274 | ) | | | (24,996,411 | ) |
| | | | |
| | | | | | | (68,682,983 | ) | | | | | | | (307,044,854 | ) |
| | | | |
Net decrease in net assets resulting from capital share transactions | | | | | | | (36,893,361 | ) | | | | | | | (128,263,615 | ) |
| | | | |
Total decrease in net assets | | | | | | | (30,552,231 | ) | | | | | | | (85,011,963 | ) |
| | | | |
| | |
Net assets | | | | | | | | |
Beginning of period | | | | | | | 127,673,480 | | | | | | | | 212,685,443 | |
| | | | |
End of period | | | | | | $ | 97,121,249 | | | | | | | $ | 127,673,480 | |
| | | | |
Undistributed net investment income | | | | | | $ | 531,685 | | | | | | | $ | 79,043 | |
| | | | |
The accompanying notes are an integral part of these financial statements.
| | | | | | |
| Statements of changes in net assets | | Wells Fargo Target Date Funds | | | 49 | |
| | | | | | | | | | | | | | | | |
| | | Target 2060 Fund | |
| | | Six months ended
August 31, 2017
(unaudited) | | | Year ended
February 28, 2017 | |
| |
Operations | | | | | |
Net investment income | | | | | | $ | 267,534 | | | | | | | $ | 135,221 | |
Net realized gains on investments | | | | | | | 6,501,821 | | | | | | | | 3,164,642 | |
Net change in unrealized gains (losses) on investments | | | | | | | (5,208,788 | ) | | | | | | | (1,311,506 | ) |
| | | | |
Net increase in net assets resulting from operations | | | | | | | 1,560,567 | | | | | | | | 1,988,357 | |
| | | | |
| |
Distributions to shareholders from | | | | | |
Net investment income | |
Class A | | | | | | | (2,715 | ) | | | | | | | (3,486 | ) |
Class C | | | | | | | (80 | ) | | | | | | | (1,567 | ) |
Class R | | | | | | | (372 | ) | | | | | | | (2,177 | ) |
Class R4 | | | | | | | (40,714 | ) | | | | | | | (31,389 | ) |
Class R6 | | | | | | | (81,236 | ) | | | | | | | (68,995 | ) |
Administrator Class | | | | | | | (23,976 | ) | | | | | | | (26,508 | ) |
| | | | |
Total distributions to shareholders | | | | | | | (149,093 | ) | | | | | | | (134,122 | ) |
| | | | |
| | | | |
Capital share transactions | | | Shares | | | | | | | | Shares | | | | | |
Proceeds from shares sold | |
Class A | | | 34,196 | | | | 374,324 | | | | 67,988 | | | | 679,344 | |
Class C | | | 1,301 | | | | 14,410 | | | | 3,964 | | | | 38,209 | |
Class R | | | 255 | | | | 2,777 | | | | 2,739 | | | | 27,102 | |
Class R4 | | | 311,289 | | | | 3,478,533 | | | | 680,949 | | | | 6,938,855 | |
Class R6 | | | 588,355 | | | | 6,564,105 | | | | 1,251,361 | | | | 12,719,457 | |
Administrator Class | | | 236,654 | | | | 2,594,931 | | | | 556,655 | | | | 5,584,665 | |
| | | | |
| | | | | | | 13,029,080 | | | | | | | | 25,987,632 | |
| | | | |
Reinvestment of distributions | |
Class A | | | 244 | | | | 2,715 | | | | 351 | | | | 3,486 | |
Class C | | | 7 | | | | 80 | | | | 164 | | | | 1,567 | |
Class R | | | 34 | | | | 372 | | | | 232 | | | | 2,177 | |
Class R4 | | | 3,600 | | | | 40,714 | | | | 3,060 | | | | 31,389 | |
Class R6 | | | 7,110 | | | | 80,206 | | | | 6,704 | | | | 68,438 | |
Administrator Class | | | 2,148 | | | | 23,976 | | | | 2,643 | | | | 26,508 | |
| | | | |
| | | | | | | 148,063 | | | | | | | | 133,565 | |
| | | | |
Payment for shares redeemed | |
Class A | | | (39,580 | ) | | | (435,718 | ) | | | (16,887 | ) | | | (170,284 | ) |
Class C | | | (2,028 | ) | | | (21,678 | ) | | | (42 | ) | | | (404 | ) |
Class R | | | (2 | ) | | | (26 | ) | | | (1,028 | ) | | | (10,133 | ) |
Class R4 | | | (332,740 | ) | | | (3,728,284 | ) | | | (113,793 | ) | | | (1,178,005 | ) |
Class R6 | | | (663,090 | ) | | | (7,448,561 | ) | | | (169,020 | ) | | | (1,736,930 | ) |
Administrator Class | | | (210,678 | ) | | | (2,344,989 | ) | | | (187,439 | ) | | | (1,931,014 | ) |
| | | | |
| | | | | | | (13,979,256 | ) | | | | | | | (5,026,770 | ) |
| | | | |
Net increase (decrease) in net assets resulting from capital share transactions | | | | | | | (802,113 | ) | | | | | | | 21,094,427 | |
| | | | |
Total increase in net assets | | | | | | | 609,361 | | | | | | | | 22,948,662 | |
| | | | |
| | |
Net assets | | | | | | | | |
Beginning of period | | | | | | | 24,438,322 | | | | | | | | 1,489,660 | |
| | | | |
End of period | | | | | | $ | 25,047,683 | | | | | | | $ | 24,438,322 | |
| | | | |
Undistributed net investment income | | | | | | $ | 141,970 | | | | | | | $ | 23,529 | |
| | | | |
The accompanying notes are an integral part of these financial statements.
| | | | |
| 50 | | Wells Fargo Target Date Funds | | Financial highlights |
| | | | | | | | | | | | | | | | | | | | | | | | |
| Target Today Fund | | Beginning
net asset
value per
share | | | Net
investment
income | | | Net realized
and unrealized
gains (losses)
on investments | | | Distributions
from net
investment
income | | | Distributions
from net
realized gains | | | Ending
net asset
value per
share | |
Class A | | | | | | | | | | | | | | | | | | | | | | | | |
Six months ended August 31, 2017 (unaudited) | | $ | 10.56 | | | | 0.07 | | | | 0.18 | | | | 0.00 | | | | 0.00 | | | $ | 10.81 | |
Year ended February 28, 2017 | | $ | 10.41 | | | | 0.12 | | | | 0.23 | | | | (0.11 | ) | | | (0.09 | ) | | $ | 10.56 | |
Year ended February 29, 2016 | | $ | 10.81 | | | | 0.10 | 4 | | | (0.29 | ) | | | (0.03 | ) | | | (0.18 | ) | | $ | 10.41 | |
Year ended February 28, 2015 | | $ | 10.85 | | | | 0.15 | | | | 0.05 | | | | (0.13 | ) | | | (0.11 | ) | | $ | 10.81 | |
Year ended February 28, 2014 | | $ | 10.84 | | | | 0.15 | | | | 0.13 | | | | (0.13 | ) | | | (0.14 | ) | | $ | 10.85 | |
Year ended February 28, 2013 | | $ | 10.86 | | | | 0.15 | 4 | | | 0.08 | | | | (0.17 | ) | | | (0.08 | ) | | $ | 10.84 | |
Class C | | | | | | | | | | | | | | | | | | | | | | | | |
Six months ended August 31, 2017 (unaudited) | | $ | 10.77 | | | | 0.04 | | | | 0.17 | | | | 0.00 | | | | 0.00 | | | $ | 10.98 | |
Year ended February 28, 2017 | | $ | 10.63 | | | | 0.03 | | | | (0.24 | ) | | | (0.04 | ) | | | (0.09 | ) | | $ | 10.77 | |
Year ended February 29, 2016 | | $ | 11.08 | | | | 0.02 | 4 | | | (0.29 | ) | | | 0.00 | | | | (0.18 | ) | | $ | 10.63 | |
Year ended February 28, 2015 | | $ | 11.11 | | | | 0.06 | 4 | | | 0.06 | | | | (0.04 | ) | | | (0.11 | ) | | $ | 11.08 | |
Year ended February 28, 2014 | | $ | 11.09 | | | | 0.06 | 4 | | | 0.14 | | | | (0.04 | ) | | | (0.14 | ) | | $ | 11.11 | |
Year ended February 28, 2013 | | $ | 11.11 | | | | 0.07 | | | | 0.08 | | | | (0.09 | ) | | | (0.08 | ) | | $ | 11.09 | |
Class R | | | | | | | | | | | | | | | | | | | | | | | | |
Six months ended August 31, 2017 (unaudited) | | $ | 10.53 | | | | 0.06 | | | | 0.18 | | | | 0.00 | | | | 0.00 | | | $ | 10.77 | |
Year ended February 28, 2017 | | $ | 10.39 | | | | 0.09 | | | | 0.23 | | | | (0.09 | ) | | | (0.09 | ) | | $ | 10.53 | |
Year ended February 29, 2016 | | $ | 10.80 | | | | 0.07 | | | | (0.29 | ) | | | (0.01 | ) | | | (0.18 | ) | | $ | 10.39 | |
Year ended February 28, 2015 | | $ | 10.85 | | | | 0.11 | | | | 0.06 | | | | (0.11 | ) | | | (0.11 | ) | | $ | 10.80 | |
Year ended February 28, 20145 | | $ | 10.57 | | | | 0.07 | | | | 0.41 | | | | (0.06 | ) | | | (0.14 | ) | | $ | 10.85 | |
Class R4 | | | | | | | | | | | | | | | | | | | | | | | | |
Six months ended August 31, 2017 (unaudited) | | $ | 10.81 | | | | 0.08 | 4 | | | 0.16 | | | | 0.00 | | | | 0.00 | | | $ | 11.05 | |
Year ended February 28, 2017 | | $ | 10.65 | | | | 0.14 | | | | 0.25 | | | | (0.14 | ) | | | (0.09 | ) | | $ | 10.81 | |
Year ended February 29, 2016 | | $ | 11.06 | | | | 0.14 | | | | (0.30 | ) | | | (0.07 | ) | | | (0.18 | ) | | $ | 10.65 | |
Year ended February 28, 2015 | | $ | 11.10 | | | | 0.18 | | | | 0.06 | | | | (0.17 | ) | | | (0.11 | ) | | $ | 11.06 | |
Year ended February 28, 2014 | | $ | 11.08 | | | | 0.18 | 4 | | | 0.15 | | | | (0.17 | ) | | | (0.14 | ) | | $ | 11.10 | |
Year ended February 28, 20136 | | $ | 11.24 | | | | 0.05 | 4 | | | (0.06 | ) | | | (0.07 | ) | | | (0.08 | ) | | $ | 11.08 | |
Class R67 | | | | | | | | | | | | | | | | | | | | | | | | |
Six months ended August 31, 2017 (unaudited) | | $ | 10.78 | | | | 0.10 | 4 | | | 0.18 | | | | 0.00 | | | | 0.00 | | | $ | 11.06 | |
Year ended February 28, 2017 | | $ | 10.64 | | | | 0.17 | 4 | | | 0.23 | | | | (0.17 | ) | | | (0.09 | ) | | $ | 10.78 | |
Year ended February 29, 2016 | | $ | 11.05 | | | | 0.15 | | | | (0.29 | ) | | | (0.09 | ) | | | (0.18 | ) | | $ | 10.64 | |
Year ended February 28, 2015 | | $ | 11.08 | | | | 0.19 | | | | 0.08 | | | | (0.19 | ) | | | (0.11 | ) | | $ | 11.05 | |
Year ended February 28, 2014 | | $ | 11.07 | | | | 0.20 | 4 | | | 0.14 | | | | (0.19 | ) | | | (0.14 | ) | | $ | 11.08 | |
Year ended February 28, 2013 | | $ | 11.09 | | | | 0.21 | | | | 0.08 | | | | (0.23 | ) | | | (0.08 | ) | | $ | 11.07 | |
Administrator Class | | | | | | | | | | | | | | | | | | | | | | | | |
Six months ended August 31, 2017 (unaudited) | | $ | 10.78 | | | | 0.08 | | | | 0.19 | | | | 0.00 | | | | 0.00 | | | $ | 11.05 | |
Year ended February 28, 2017 | | $ | 10.63 | | | | 0.13 | 4 | | | 0.23 | | | | (0.12 | ) | | | (0.09 | ) | | $ | 10.78 | |
Year ended February 29, 2016 | | $ | 11.03 | | | | 0.12 | 4 | | | (0.29 | ) | | | (0.05 | ) | | | (0.18 | ) | | $ | 10.63 | |
Year ended February 28, 2015 | | $ | 11.07 | | | | 0.16 | | | | 0.06 | | | | (0.15 | ) | | | (0.11 | ) | | $ | 11.03 | |
Year ended February 28, 2014 | | $ | 11.05 | | | | 0.16 | | | | 0.14 | | | | (0.14 | ) | | | (0.14 | ) | | $ | 11.07 | |
Year ended February 28, 2013 | | $ | 11.07 | | | | 0.17 | | | | 0.08 | | | | (0.19 | ) | | | (0.08 | ) | | $ | 11.05 | |
| 1 | Ratios include net expenses allocated from the affiliated Master Portfolios which were as follows: |
| | | | | | | | | | | | | | | | | | | | | | | | |
| | | Six months ended
August 31, 2017
(unaudited) | | | Year ended
February 28, 2017 | | | Year ended
February 29, 2016 | | | Year ended February 28 | |
| | | | | | 2015 | | | 2014 | | | 2013 | |
| | | | | | | | |
Class A | | | 0.16 | % | | | 0.15 | % | | | 0.15 | % | | | 0.16 | % | | | 0.18 | % | | | 0.25 | % |
Class C | | | 0.16 | | | | 0.15 | | | | 0.15 | | | | 0.16 | | | | 0.18 | | | | 0.25 | |
Class R | | | 0.15 | | | | 0.16 | | | | 0.14 | | | | 0.16 | | | | 0.18 | 5 | | | N/A | |
Class R4 | | | 0.16 | | | | 0.15 | | | | 0.15 | | | | 0.16 | | | | 0.18 | | | | 0.25 | 6 |
Class R67 | | | 0.16 | | | | 0.15 | | | | 0.15 | | | | 0.16 | | | | 0.18 | | | | 0.25 | |
Administrator Class | | | 0.16 | | | | 0.15 | | | | 0.15 | | | | 0.16 | | | | 0.18 | | | | 0.25 | |
| 2 | Total return calculations do not include any sales charges. Returns for periods of less than one year are not annualized. |
| 3 | Portfolio turnover rate is calculated by aggregating the results of multiplying the Fund’s investment percentage in the respective affiliated Master Portfolios by the corresponding affiliated Master Portfolio’s portfolio turnover rate. |
| 4 | Calculated based upon average shares outstanding |
| 5 | For the period from June 28, 2013 (commencement of class operations) to February 28, 2014 |
| 6 | For the period from November 30, 2012 (commencement of class operations) to February 28, 2013 |
| 7 | On June 1, 2013, Institutional Class was renamed Class R6. |
The accompanying notes are an integral part of these financial statements.
| | | | | | |
| Financial highlights | | Wells Fargo Target Date Funds | | | 51 | |
| | | | | | | | | | | | | | | | | | | | | | |
| Ratio to average net assets (annualized) | | | Total
return2 | | | Portfolio
turnover
rate3 | | | Net assets at
end of period
(000s omitted) | |
Net investment
income | | | Gross
expenses1 | | | Net
expenses1 | | | | |
| | | | | | | | | | | | | | | | | | | | | | |
| | 1.35 | % | | | 0.87 | % | | | 0.73 | % | | | 2.37 | % | | | 92 | % | | $ | 54,778 | |
| | 1.06 | % | | | 0.85 | % | | | 0.76 | % | | | 3.39 | % | | | 41 | % | | $ | 55,965 | |
| | 0.98 | % | | | 0.86 | % | | | 0.77 | % | | | (1.74 | )% | | | 36 | % | | $ | 66,656 | |
| | 1.26 | % | | | 0.98 | % | | | 0.81 | % | | | 1.83 | % | | | 42 | % | | $ | 15,537 | |
| | 1.29 | % | | | 1.01 | % | | | 0.85 | % | | | 2.67 | % | | | 40 | % | | $ | 17,467 | |
| | 1.39 | % | | | 1.08 | % | | | 0.96 | % | | | 2.15 | % | | | 39 | % | | $ | 19,815 | |
| | | | | | | | | | | | | | | | | | | | | | |
| | 0.59 | % | | | 1.62 | % | | | 1.48 | % | | | 1.95 | % | | | 92 | % | | $ | 2,680 | |
| | 0.31 | % | | | 1.61 | % | | | 1.51 | % | | | 2.57 | % | | | 41 | % | | $ | 2,822 | |
| | 0.19 | % | | | 1.63 | % | | | 1.53 | % | | | (2.44 | )% | | | 36 | % | | $ | 2,763 | |
| | 0.51 | % | | | 1.73 | % | | | 1.56 | % | | | 1.09 | % | | | 42 | % | | $ | 3,471 | |
| | 0.54 | % | | | 1.76 | % | | | 1.60 | % | | | 1.89 | % | | | 40 | % | | $ | 4,287 | |
| | 0.64 | % | | | 1.83 | % | | | 1.71 | % | | | 1.36 | % | | | 39 | % | | $ | 4,945 | |
| | | | | | | | | | | | | | | | | | | | | | |
| | 1.11 | % | | | 1.12 | % | | | 0.98 | % | | | 2.28 | % | | | 92 | % | | $ | 33 | |
| | 0.79 | % | | | 1.12 | % | | | 1.01 | % | | | 3.13 | % | | | 41 | % | | $ | 32 | |
| | 0.69 | % | | | 1.12 | % | | | 1.02 | % | | | (2.00 | )% | | | 36 | % | | $ | 29 | |
| | 1.01 | % | | | 1.27 | % | | | 1.06 | % | | | 1.53 | % | | | 42 | % | | $ | 28 | |
| | 1.02 | % | | | 1.27 | % | | | 1.06 | % | | | 4.61 | % | | | 40 | % | | $ | 26 | |
| | | | | | | | | | | | | | | | | | | | | | |
| | 1.48 | % | | | 0.60 | % | | | 0.45 | % | | | 2.22 | % | | | 82 | % | | $ | 21,979 | |
| | 1.37 | % | | | 0.58 | % | | | 0.45 | % | | | 3.71 | % | | | 41 | % | | $ | 248,734 | |
| | 1.27 | % | | | 0.59 | % | | | 0.45 | % | | | (1.40 | )% | | | 36 | % | | $ | 271,674 | |
| | 1.62 | % | | | 0.65 | % | | | 0.45 | % | | | 2.16 | % | | | 42 | % | | $ | 338,108 | |
| | 1.66 | % | | | 0.66 | % | | | 0.45 | % | | | 3.09 | % | | | 40 | % | | $ | 367,184 | |
| | 2.06 | % | | | 0.75 | % | | | 0.45 | % | | | (0.09 | )% | | | 39 | % | | $ | 3,073 | |
| | | | | | | | | | | | | | | | | | | | | | |
| | 1.77 | % | | | 0.44 | % | | | 0.28 | % | | | 2.60 | % | | | 92 | % | | $ | 47,920 | |
| | 1.53 | % | | | 0.42 | % | | | 0.30 | % | | | 3.81 | % | | | 41 | % | | $ | 72,643 | |
| | 1.42 | % | | | 0.43 | % | | | 0.30 | % | | | (1.25 | )% | | | 36 | % | | $ | 243,820 | |
| | 1.77 | % | | | 0.51 | % | | | 0.30 | % | | | 2.41 | % | | | 42 | % | | $ | 240,044 | |
| | 1.79 | % | | | 0.57 | % | | | 0.37 | % | | | 3.23 | % | | | 40 | % | | $ | 233,894 | |
| | 1.90 | % | | | 0.65 | % | | | 0.45 | % | | | 2.63 | % | | | 39 | % | | $ | 671,576 | |
| | | | | | | | | | | | | | | | | | | | | | |
| | 1.45 | % | | | 0.79 | % | | | 0.62 | % | | | 2.50 | % | | | 92 | % | | $ | 34,685 | |
| | 1.17 | % | | | 0.77 | % | | | 0.65 | % | | | 3.41 | % | | | 41 | % | | $ | 39,234 | |
| | 1.07 | % | | | 0.78 | % | | | 0.65 | % | | | (1.56 | )% | | | 36 | % | | $ | 61,887 | |
| | 1.42 | % | | | 0.82 | % | | | 0.65 | % | | | 1.95 | % | | | 42 | % | | $ | 99,638 | |
| | 1.45 | % | | | 0.85 | % | | | 0.69 | % | | | 2.87 | % | | | 40 | % | | $ | 116,854 | |
| | 1.54 | % | | | 0.92 | % | | | 0.80 | % | | | 2.29 | % | | | 39 | % | | $ | 139,771 | |
The accompanying notes are an integral part of these financial statements.
| | | | |
| 52 | | Wells Fargo Target Date Funds | | Financial highlights |
| | | | | | | | | | | | | | | | | | | | | | | | |
| Target 2010 Fund | | Beginning
net asset
value per
share | | | Net
investment
income | | | Net realized
and unrealized
gains (losses)
on investments | | | Distributions
from net
investment
income | | | Distributions
from net
realized gains | | | Ending
net asset
value per
share | |
Class A | | | | | | | | | | | | | | | | | | | | | | | | |
Six months ended August 31, 2017 (unaudited) | | $ | 12.41 | | | | 0.10 | | | | 0.21 | | | | 0.00 | | | | 0.00 | | | $ | 12.72 | |
Year ended February 28, 2017 | | $ | 12.26 | | | | 0.15 | | | | 0.30 | | | | (0.09 | ) | | | (0.21 | ) | | $ | 12.41 | |
Year ended February 29, 2016 | | $ | 13.16 | | | | 0.14 | 4 | | | (0.40 | ) | | | (0.06 | ) | | | (0.58 | ) | | $ | 12.26 | |
Year ended February 28, 2015 | | $ | 13.33 | | | | 0.18 | 4 | | | 0.09 | | | | (0.17 | ) | | | (0.27 | ) | | $ | 13.16 | |
Year ended February 28, 2014 | | $ | 13.30 | | | | 0.19 | 4 | | | 0.31 | | | | (0.17 | ) | | | (0.30 | ) | | $ | 13.33 | |
Year ended February 28, 2013 | | $ | 13.26 | | | | 0.19 | 4 | | | 0.19 | | | | (0.21 | ) | | | (0.13 | ) | | $ | 13.30 | |
Class C | | | | | | | | | | | | | | | | | | | | | | | | |
Six months ended August 31, 2017 (unaudited) | | $ | 12.56 | | | | 0.06 | | | | 0.20 | | | | 0.00 | | | | 0.00 | | | $ | 12.82 | |
Year ended February 28, 2017 | | $ | 12.42 | | | | 0.07 | | | | 0.30 | | | | (0.02 | ) | | | (0.21 | ) | | $ | 12.56 | |
Year ended February 29, 2016 | | $ | 13.36 | | | | 0.04 | 4 | | | (0.40 | ) | | | 0.00 | | | | (0.58 | ) | | $ | 12.42 | |
Year ended February 28, 2015 | | $ | 13.52 | | | | 0.09 | | | | 0.09 | | | | (0.07 | ) | | | (0.27 | ) | | $ | 13.36 | |
Year ended February 28, 2014 | | $ | 13.48 | | | | 0.09 | 4 | | | 0.31 | | | | (0.06 | ) | | | (0.30 | ) | | $ | 13.52 | |
Year ended February 28, 2013 | | $ | 13.44 | | | | 0.09 | | | | 0.19 | | | | (0.11 | ) | | | (0.13 | ) | | $ | 13.48 | |
Class R | | | | | | | | | | | | | | | | | | | | | | | | |
Six months ended August 31, 2017 (unaudited) | | $ | 12.33 | | | | 0.07 | 4 | | | 0.22 | | | | 0.00 | | | | 0.00 | | | $ | 12.62 | |
Year ended February 28, 2017 | | $ | 12.19 | | | | 0.11 | | | | 0.31 | | | | (0.07 | ) | | | (0.21 | ) | | $ | 12.33 | |
Year ended February 29, 2016 | | $ | 13.11 | | | | 0.11 | 4 | | | (0.41 | ) | | | (0.04 | ) | | | (0.58 | ) | | $ | 12.19 | |
Year ended February 28, 2015 | | $ | 13.28 | | | | 0.15 | 4 | | | 0.10 | | | | (0.15 | ) | | | (0.27 | ) | | $ | 13.11 | |
Year ended February 28, 20145 | | $ | 13.08 | | | | 0.10 | 4 | | | 0.58 | | | | (0.18 | ) | | | (0.30 | ) | | $ | 13.28 | |
Class R4 | | | | | | | | | | | | | | | | | | | | | | | | |
Six months ended August 31, 2017 (unaudited) | | $ | 12.55 | | | | 0.11 | 4 | | | 0.22 | | | | 0.00 | | | | 0.00 | | | $ | 12.88 | |
Year ended February 28, 2017 | | $ | 12.38 | | | | 0.19 | 4 | | | 0.32 | | | | (0.13 | ) | | | (0.21 | ) | | $ | 12.55 | |
Year ended February 29, 2016 | | $ | 13.30 | | | | 0.18 | 4 | | | (0.41 | ) | | | (0.11 | ) | | | (0.58 | ) | | $ | 12.38 | |
Year ended February 28, 2015 | | $ | 13.46 | | | | 0.23 | 4 | | | 0.10 | | | | (0.22 | ) | | | (0.27 | ) | | $ | 13.30 | |
Year ended February 28, 2014 | | $ | 13.43 | | | | 0.24 | 4 | | | 0.31 | | | | (0.22 | ) | | | (0.30 | ) | | $ | 13.46 | |
Year ended February 28, 20136 | | $ | 13.56 | | | | 0.08 | | | | 0.00 | 7 | | | (0.08 | ) | | | (0.13 | ) | | $ | 13.43 | |
Class R68 | | | | | | | | | | | | | | | | | | | | | | | | |
Six months ended August 31, 2017 (unaudited) | | $ | 12.54 | | | | 0.14 | | | | 0.20 | | | | 0.00 | | | | 0.00 | | | $ | 12.88 | |
Year ended February 28, 2017 | | $ | 12.37 | | | | 0.21 | 4 | | | 0.32 | | | | (0.15 | ) | | | (0.21 | ) | | $ | 12.54 | |
Year ended February 29, 2016 | | $ | 13.29 | | | | 0.19 | | | | (0.40 | ) | | | (0.13 | ) | | | (0.58 | ) | | $ | 12.37 | |
Year ended February 28, 2015 | | $ | 13.45 | | | | 0.27 | | | | 0.08 | | | | (0.24 | ) | | | (0.27 | ) | | $ | 13.29 | |
Year ended February 28, 2014 | | $ | 13.43 | | | | 0.25 | 4 | | | 0.32 | | | | (0.25 | ) | | | (0.30 | ) | | $ | 13.45 | |
Year ended February 28, 2013 | | $ | 13.39 | | | | 0.26 | | | | 0.19 | | | | (0.28 | ) | | | (0.13 | ) | | $ | 13.43 | |
Administrator Class | | | | | | | | | | | | | | | | | | | | | | | | |
Six months ended August 31, 2017 (unaudited) | | $ | 12.55 | | | | 0.09 | | | | 0.23 | | | | 0.00 | | | | 0.00 | | | $ | 12.87 | |
Year ended February 28, 2017 | | $ | 12.39 | | | | 0.16 | | | | 0.31 | | | | (0.10 | ) | | | (0.21 | ) | | $ | 12.55 | |
Year ended February 29, 2016 | | $ | 13.29 | | | | 0.16 | 4 | | | (0.41 | ) | | | (0.07 | ) | | | (0.58 | ) | | $ | 12.39 | |
Year ended February 28, 2015 | | $ | 13.46 | | | | 0.21 | | | | 0.08 | | | | (0.19 | ) | | | (0.27 | ) | | $ | 13.29 | |
Year ended February 28, 2014 | | $ | 13.42 | | | | 0.21 | 4 | | | 0.32 | | | | (0.19 | ) | | | (0.30 | ) | | $ | 13.46 | |
Year ended February 28, 2013 | | $ | 13.38 | | | | 0.21 | 4 | | | 0.19 | | | | (0.23 | ) | | | (0.13 | ) | | $ | 13.42 | |
| 1 | Ratios include net expenses allocated from the affiliated Master Portfolios which were as follows: |
| | | | | | | | | | | | | | | | | | | | | | | | |
| | | Six months ended
August 31, 2017
(unaudited) | | | Year ended
February 28, 2017 | | | Year ended
February 29, 2016 | | | Year ended February 28 | |
| | | | | | 2015 | | | 2014 | | | 2013 | |
| | | | | | | | |
Class A | | | 0.16 | % | | | 0.16 | % | | | 0.15 | % | | | 0.16 | % | | | 0.19 | % | | | 0.26 | % |
Class C | | | 0.16 | | | | 0.16 | | | | 0.15 | | | | 0.16 | | | | 0.19 | | | | 0.26 | |
Class R | | | 0.18 | | | | 0.16 | | | | 0.15 | | | | 0.16 | | | | 0.19 | 5 | | | N/A | |
Class R4 | | | 0.16 | | | | 0.16 | | | | 0.15 | | | | 0.16 | | | | 0.19 | | | | 0.26 | 6 |
Class R68 | | | 0.16 | | | | 0.16 | | | | 0.15 | | | | 0.16 | | | | 0.19 | | | | 0.26 | |
Administrator Class | | | 0.16 | | | | 0.16 | | | | 0.15 | | | | 0.16 | | | | 0.19 | | | | 0.26 | |
| 2 | Total return calculations do not include any sales charges. Returns for periods of less than one year are not annualized. |
| 3 | Portfolio turnover rate is calculated by aggregating the results of multiplying the Fund’s investment percentage in the respective affiliated Master Portfolios by the corresponding affiliated Master Portfolio’s portfolio turnover rate. |
| 4 | Calculated based upon average shares outstanding |
| 5 | For the period from June 28, 2013 (commencement of class operations) to February 28, 2014 |
| 6 | For the period from November 30, 2012 (commencement of class operations) to February 28, 2013 |
| 7 | Amount is less than $0.005. |
| 8 | On June 1, 2013, Institutional Class was renamed Class R6. |
The accompanying notes are an integral part of these financial statements.
| | | | | | |
| Financial highlights | | Wells Fargo Target Date Funds | | | 53 | |
| | | | | | | | | | | | | | | | | | | | | | |
| Ratio to average net assets (annualized) | | | Total
return2 | | | Portfolio
turnover
rate3 | | | Net assets at
end of period
(000s omitted) | |
Net investment
income | | | Gross
expenses1 | | | Net
expenses1 | | | | |
| | | | | | | | | | | | | | | | | | | | | | |
| | 1.35 | % | | | 0.89 | % | | | 0.75 | % | | | 2.50 | % | | | 88 | % | | $ | 56,149 | |
| | 1.14 | % | | | 0.87 | % | | | 0.78 | % | | | 3.71 | % | | | 41 | % | | $ | 60,237 | |
| | 1.11 | % | | | 0.88 | % | | | 0.79 | % | | | (1.99 | )% | | | 36 | % | | $ | 67,826 | |
| | 1.36 | % | | | 0.99 | % | | | 0.83 | % | | | 2.11 | % | | | 41 | % | | $ | 26,753 | |
| | 1.39 | % | | | 1.02 | % | | | 0.87 | % | | | 3.87 | % | | | 40 | % | | $ | 32,012 | |
| | 1.39 | % | | | 1.08 | % | | | 0.99 | % | | | 2.92 | % | | | 37 | % | | $ | 36,462 | |
| | | | | | | | | | | | | | | | | | | | | | |
| | 0.60 | % | | | 1.63 | % | | | 1.50 | % | | | 2.07 | % | | | 88 | % | | $ | 1,607 | |
| | 0.39 | % | | | 1.62 | % | | | 1.53 | % | | | 2.96 | % | | | 41 | % | | $ | 1,761 | |
| | 0.34 | % | | | 1.65 | % | | | 1.55 | % | | | (2.69 | )% | | | 36 | % | | $ | 1,984 | |
| | 0.61 | % | | | 1.75 | % | | | 1.58 | % | | | 1.39 | % | | | 41 | % | | $ | 2,781 | |
| | 0.64 | % | | | 1.77 | % | | | 1.62 | % | | | 3.07 | % | | | 40 | % | | $ | 2,952 | |
| | 0.64 | % | | | 1.83 | % | | | 1.74 | % | | | 2.10 | % | | | 37 | % | | $ | 3,269 | |
| | | | | | | | | | | | | | | | | | | | | | |
| | 1.09 | % | | | 1.16 | % | | | 1.00 | % | | | 2.35 | % | | | 88 | % | | $ | 28 | |
| | 0.88 | % | | | 1.14 | % | | | 1.03 | % | | | 3.45 | % | | | 41 | % | | $ | 53 | |
| | 0.84 | % | | | 1.16 | % | | | 1.05 | % | | | (2.27 | )% | | | 36 | % | | $ | 52 | |
| | 1.09 | % | | | 1.26 | % | | | 1.08 | % | | | 1.92 | % | | | 41 | % | | $ | 53 | |
| | 1.18 | % | | | 1.29 | % | | | 1.08 | % | | | 5.36 | % | | | 40 | % | | $ | 26 | |
| | | | | | | | | | | | | | | | | | | | | | |
| | 1.63 | % | | | 0.61 | % | | | 0.44 | % | | | 2.63 | % | | | 88 | % | | $ | 30,152 | |
| | 1.45 | % | | | 0.59 | % | | | 0.47 | % | | | 4.11 | % | | | 41 | % | | $ | 48,885 | |
| | 1.42 | % | | | 0.61 | % | | | 0.47 | % | | | (1.73 | )% | | | 36 | % | | $ | 70,528 | |
| | 1.73 | % | | | 0.66 | % | | | 0.47 | % | | | 2.55 | % | | | 41 | % | | $ | 148,668 | |
| | 1.79 | % | | | 0.67 | % | | | 0.47 | % | | | 4.24 | % | | | 40 | % | | $ | 199,432 | |
| | 2.03 | % | | | 0.75 | % | | | 0.47 | % | | | 0.63 | % | | | 37 | % | | $ | 5,555 | |
| | | | | | | | | | | | | | | | | | | | | | |
| | 1.81 | % | | | 0.46 | % | | | 0.29 | % | | | 2.71 | % | | | 88 | % | | $ | 68,047 | |
| | 1.61 | % | | | 0.44 | % | | | 0.32 | % | | | 4.27 | % | | | 41 | % | | $ | 82,474 | |
| | 1.57 | % | | | 0.45 | % | | | 0.32 | % | | | (1.59 | )% | | | 36 | % | | $ | 200,168 | |
| | 1.88 | % | | | 0.51 | % | | | 0.38 | % | | | 2.71 | % | | | 41 | % | | $ | 184,812 | |
| | 1.89 | % | | | 0.57 | % | | | 0.48 | % | | | 4.35 | % | | | 40 | % | | $ | 242,218 | |
| | 1.91 | % | | | 0.65 | % | | | 0.48 | % | | | 3.43 | % | | | 37 | % | | $ | 486,113 | |
| | | | | | | | | | | | | | | | | | | | | | |
| | 1.46 | % | | | 0.80 | % | | | 0.64 | % | | | 2.55 | % | | | 88 | % | | $ | 40,139 | |
| | 1.26 | % | | | 0.79 | % | | | 0.67 | % | | | 3.84 | % | | | 41 | % | | $ | 49,565 | |
| | 1.22 | % | | | 0.80 | % | | | 0.67 | % | | | (1.83 | )% | | | 36 | % | | $ | 91,381 | |
| | 1.53 | % | | | 0.86 | % | | | 0.67 | % | | | 2.26 | % | | | 41 | % | | $ | 168,185 | |
| | 1.55 | % | | | 0.92 | % | | | 0.71 | % | | | 4.08 | % | | | 40 | % | | $ | 201,159 | |
| | 1.54 | % | | | 0.92 | % | | | 0.83 | % | | | 3.08 | % | | | 37 | % | | $ | 241,045 | |
The accompanying notes are an integral part of these financial statements.
| | | | |
| 54 | | Wells Fargo Target Date Funds | | Financial highlights |
| | | | | | | | | | | | | | | | | | | | | | | | |
| Target 2015 Fund | | Beginning
net asset
value per
share | | | Net
investment
income | | | Net realized
and unrealized
gains (losses)
on investments | | | Distributions
from net
investment
income | | | Distributions
from net
realized gains | | | Ending
net asset
value per
share | |
Class A | | | | | | | | | | | | | | | | | | | | | | | | |
Six months ended August 31, 2017 (unaudited) | | $ | 10.12 | | | | 0.07 | | | | 0.22 | | | | (0.02 | ) | | | 0.00 | | | $ | 10.39 | |
Year ended February 28, 2017 | | $ | 9.87 | | | | 0.15 | 4 | | | 0.37 | | | | (0.10 | ) | | | (0.17 | ) | | $ | 10.12 | |
Year ended February 29, 2016 | | $ | 10.40 | | | | 0.15 | | | | (0.41 | ) | | | (0.09 | ) | | | (0.18 | ) | | $ | 9.87 | |
Year ended February 28, 2015 | | $ | 10.38 | | | | 0.15 | | | | 0.13 | | | | (0.14 | ) | | | (0.12 | ) | | $ | 10.40 | |
Year ended February 28, 2014 | | $ | 10.13 | | | | 0.15 | 4 | | | 0.40 | | | | (0.14 | ) | | | (0.16 | ) | | $ | 10.38 | |
Year ended February 28, 20135 | | $ | 10.11 | | | | 0.03 | | | | 0.13 | | | | (0.04 | ) | | | (0.10 | ) | | $ | 10.13 | |
Class R | | | | | | | | | | | | | | | | | | | | | | | | |
Six months ended August 31, 2017 (unaudited) | | $ | 10.26 | | | | 0.05 | | | | 0.22 | | | | 0.00 | 6 | | | 0.00 | | | $ | 10.53 | |
Year ended February 28, 2017 | | $ | 10.01 | | | | 0.13 | | | | 0.37 | | | | (0.08 | ) | | | (0.17 | ) | | $ | 10.26 | |
Year ended February 29, 2016 | | $ | 10.55 | | | | 0.13 | | | | (0.42 | ) | | | (0.07 | ) | | | (0.18 | ) | | $ | 10.01 | |
Year ended February 28, 2015 | | $ | 10.52 | | | | 0.12 | | | | 0.14 | | | | (0.11 | ) | | | (0.12 | ) | | $ | 10.55 | |
Year ended February 28, 20147 | | $ | 10.08 | | | | 0.08 | 4 | | | 0.57 | | | | (0.05 | ) | | | (0.16 | ) | | $ | 10.52 | |
Class R4 | | | | | | | | | | | | | | | | | | | | | | | | |
Six months ended August 31, 2017 (unaudited) | | $ | 10.16 | | | | 0.09 | 4 | | | 0.21 | | | | (0.03 | ) | | | 0.00 | | | $ | 10.43 | |
Year ended February 28, 2017 | | $ | 9.91 | | | | 0.18 | 4 | | | 0.37 | | | | (0.13 | ) | | | (0.17 | ) | | $ | 10.16 | |
Year ended February 29, 2016 | | $ | 10.43 | | | | 0.18 | | | | (0.41 | ) | | | (0.11 | ) | | | (0.18 | ) | | $ | 9.91 | |
Year ended February 28, 2015 | | $ | 10.40 | | | | 0.18 | | | | 0.14 | | | | (0.17 | ) | | | (0.12 | ) | | $ | 10.43 | |
Year ended February 28, 2014 | | $ | 10.14 | | | | 0.20 | | | | 0.38 | | | | (0.16 | ) | | | (0.16 | ) | | $ | 10.40 | |
Year ended February 28, 20135 | | $ | 10.11 | | | | 0.05 | 4 | | | 0.13 | | | | (0.05 | ) | | | (0.10 | ) | | $ | 10.14 | |
Class R68 | | | | | | | | | | | | | | | | | | | | | | | | |
Six months ended August 31, 2017 (unaudited) | | $ | 10.15 | | | | 0.14 | | | | 0.18 | | | | (0.04 | ) | | | 0.00 | | | $ | 10.43 | |
Year ended February 28, 2017 | | $ | 9.90 | | | | 0.20 | 4 | | | 0.37 | | | | (0.15 | ) | | | (0.17 | ) | | $ | 10.15 | |
Year ended February 29, 2016 | | $ | 10.42 | | | | 0.20 | | | | (0.42 | ) | | | (0.12 | ) | | | (0.18 | ) | | $ | 9.90 | |
Year ended February 28, 2015 | | $ | 10.39 | | | | 0.20 | | | | 0.14 | | | | (0.19 | ) | | | (0.12 | ) | | $ | 10.42 | |
Year ended February 28, 2014 | | $ | 10.13 | | | | 0.21 | | | | 0.39 | | | | (0.18 | ) | | | (0.16 | ) | | $ | 10.39 | |
Year ended February 28, 2013 | | $ | 9.98 | | | | 0.18 | | | | 0.27 | | | | (0.20 | ) | | | (0.10 | ) | | $ | 10.13 | |
Administrator Class | | | | | | | | | | | | | | | | | | | | | | | | |
Six months ended August 31, 2017 (unaudited) | | $ | 10.29 | | | | 0.08 | | | | 0.22 | | | | (0.02 | ) | | | 0.00 | | | $ | 10.57 | |
Year ended February 28, 2017 | | $ | 10.02 | | | | 0.17 | 4 | | | 0.38 | | | | (0.11 | ) | | | (0.17 | ) | | $ | 10.29 | |
Year ended February 29, 2016 | | $ | 10.55 | | | | 0.17 | | | | (0.43 | ) | | | (0.09 | ) | | | (0.18 | ) | | $ | 10.02 | |
Year ended February 28, 2015 | | $ | 10.52 | | | | 0.17 | | | | 0.13 | | | | (0.15 | ) | | | (0.12 | ) | | $ | 10.55 | |
Year ended February 28, 2014 | | $ | 10.24 | | | | 0.16 | | | | 0.42 | | | | (0.14 | ) | | | (0.16 | ) | | $ | 10.52 | |
Year ended February 28, 2013 | | $ | 10.10 | | | | 0.15 | 4 | | | 0.26 | | | | (0.17 | ) | | | (0.10 | ) | | $ | 10.24 | |
| 1 | Ratios include net expenses allocated from the affiliated Master Portfolio which were as follows: |
| | | | | | | | | | | | | | | | | | | | | | | | |
| | | Six months ended
August 31, 2017
(unaudited) | | | Year ended February 28, 2017 | | | Year ended February 29, 2016 | | | Year ended February 28 | |
| | | | | | 2015 | | | 2014 | | | 2013 | |
| | | | | | | | |
Class A | | | 0.17 | % | | | 0.16 | % | | | 0.16 | % | | | 0.16 | % | | | 0.19 | % | | | 0.26 | %5 |
Class R | | | 0.19 | | | | 0.16 | | | | 0.16 | | | | 0.16 | | | | 0.19 | 7 | | | N/A | |
Class R4 | | | 0.17 | | | | 0.16 | | | | 0.16 | | | | 0.16 | | | | 0.19 | | | | 0.26 | 5 |
Class R68 | | | 0.17 | | | | 0.16 | | | | 0.16 | | | | 0.16 | | | | 0.19 | | | | 0.26 | |
Administrator Class | | | 0.17 | | | | 0.16 | | | | 0.16 | | | | 0.16 | | | | 0.19 | | | | 0.26 | |
| 2 | Total return calculations do not include any sales charges. Returns for periods of less than one year are not annualized. |
| 3 | Portfolio turnover rate is calculated by aggregating the results of multiplying the Fund’s investment percentage in the respective affiliated Master Portfolios by the corresponding affiliated Master Portfolio’s portfolio turnover rate. |
| 4 | Calculated based upon average shares outstanding |
| 5 | For the period from November 30, 2012 (commencement of class operations) to February 28, 2013 |
| 6 | Amount is less than $0.005. |
| 7 | For the period from June 28, 2013 (commencement of class operations) to February 28, 2014 |
| 8 | On June 1, 2013, Institutional Class was renamed Class R6. |
The accompanying notes are an integral part of these financial statements.
| | | | | | |
| Financial highlights | | Wells Fargo Target Date Funds | | | 55 | |
| | | | | | | | | | | | | | | | | | | | | | |
| Ratio to average net assets (annualized) | | | Total
return2 | | | Portfolio
turnover
rate3 | | | Net assets at
end of period
(000s omitted) | |
Net investment
income | | | Gross
expenses1 | | | Net
expenses1 | | | | |
| | | | | | | | | | | | | | | | | | | | | | |
| | 1.47 | % | | | 0.89 | % | | | 0.75 | % | | | 2.86 | % | | | 85 | % | | $ | 49,878 | |
| | 1.43 | % | | | 0.87 | % | | | 0.79 | % | | | 5.30 | % | | | 41 | % | | $ | 54,770 | |
| | 1.55 | % | | | 0.85 | % | | | 0.79 | % | | | (2.54 | )% | | | 36 | % | | $ | 74,807 | |
| | 1.39 | % | | | 0.99 | % | | | 0.84 | % | | | 2.75 | % | | | 39 | % | | $ | 1,947 | |
| | 1.45 | % | | | 0.99 | % | | | 0.84 | % | | | 5.56 | % | | | 38 | % | | $ | 332 | |
| | 1.28 | % | | | 1.05 | % | | | 0.84 | % | | | 1.60 | % | | | 35 | % | | $ | 10 | |
| | | | | | | | | | | | | | | | | | | | | | |
| | 1.22 | % | | | 1.15 | % | | | 1.00 | % | | | 2.77 | % | | | 85 | % | | $ | 29 | |
| | 1.18 | % | | | 1.12 | % | | | 1.04 | % | | | 4.99 | % | | | 41 | % | | $ | 37 | |
| | 1.25 | % | | | 1.14 | % | | | 1.06 | % | | | (2.78 | )% | | | 36 | % | | $ | 42 | |
| | 1.16 | % | | | 1.25 | % | | | 1.09 | % | | | 2.51 | % | | | 39 | % | | $ | 50 | |
| | 1.14 | % | | | 1.26 | % | | | 1.09 | % | | | 6.51 | % | | | 38 | % | | $ | 27 | |
| | | | | | | | | | | | | | | | | | | | | | |
| | 1.73 | % | | | 0.62 | % | | | 0.45 | % | | | 3.00 | % | | | 85 | % | | $ | 62,244 | |
| | 1.73 | % | | | 0.59 | % | | | 0.48 | % | | | 5.57 | % | | | 41 | % | | $ | 105,773 | |
| | 1.83 | % | | | 0.59 | % | | | 0.48 | % | | | (2.22 | )% | | | 36 | % | | $ | 127,503 | |
| | 1.78 | % | | | 0.66 | % | | | 0.48 | % | | | 3.15 | % | | | 39 | % | | $ | 180,101 | |
| | 1.76 | % | | | 0.66 | % | | | 0.48 | % | | | 5.90 | % | | | 38 | % | | $ | 189,078 | |
| | 1.90 | % | | | 0.75 | % | | | 0.48 | % | | | 1.72 | % | | | 35 | % | | $ | 2,614 | |
| | | | | | | | | | | | | | | | | | | | | | |
| | 1.91 | % | | | 0.46 | % | | | 0.30 | % | | | 3.08 | % | | | 85 | % | | $ | 83,623 | |
| | 1.92 | % | | | 0.43 | % | | | 0.33 | % | | | 5.74 | % | | | 41 | % | | $ | 125,438 | |
| | 1.97 | % | | | 0.44 | % | | | 0.33 | % | | | (2.12 | )% | | | 36 | % | | $ | 367,041 | |
| | 1.92 | % | | | 0.51 | % | | | 0.33 | % | | | 3.31 | % | | | 39 | % | | $ | 420,676 | |
| | 1.88 | % | | | 0.55 | % | | | 0.38 | % | | | 6.04 | % | | | 38 | % | | $ | 437,620 | |
| | 1.87 | % | | | 0.65 | % | | | 0.49 | % | | | 4.56 | % | | | 35 | % | | $ | 613,945 | |
| | | | | | | | | | | | | | | | | | | | | | |
| | 1.58 | % | | | 0.79 | % | | | 0.64 | % | | | 2.95 | % | | | 85 | % | | $ | 20,502 | |
| | 1.59 | % | | | 0.78 | % | | | 0.68 | % | | | 5.52 | % | | | 41 | % | | $ | 21,910 | |
| | 1.62 | % | | | 0.78 | % | | | 0.68 | % | | | (2.45 | )% | | | 36 | % | | $ | 122,329 | |
| | 1.57 | % | | | 0.83 | % | | | 0.68 | % | | | 2.91 | % | | | 39 | % | | $ | 188,412 | |
| | 1.54 | % | | | 0.85 | % | | | 0.72 | % | | | 5.79 | % | | | 38 | % | | $ | 211,930 | |
| | 1.47 | % | | | 0.92 | % | | | 0.84 | % | | | 4.06 | % | | | 35 | % | | $ | 194,125 | |
The accompanying notes are an integral part of these financial statements.
| | | | |
| 56 | | Wells Fargo Target Date Funds | | Financial highlights |
| | | | | | | | | | | | | | | | | | | | | | | | |
| Target 2020 Fund | | Beginning net asset value per share | | | Net investment income | | | Net realized and unrealized gains (losses) on investments | | | Distributions from net investment income | | | Distributions from net realized gains | | | Ending net asset value per share | |
Class A | | | | | | | | | | | | | | | | | | | | | | | | |
Six months ended August 31, 2017 (unaudited) | | $ | 14.87 | | | | 0.13 | | | | 0.39 | | | | 0.00 | | | | 0.00 | | | $ | 15.39 | |
Year ended February 28, 2017 | | $ | 14.19 | | | | 0.21 | | | | 0.85 | | | | (0.17 | ) | | | (0.21 | ) | | $ | 14.87 | |
Year ended February 29, 2016 | | $ | 15.24 | | | | 0.22 | 4 | | | (0.81 | ) | | | (0.10 | ) | | | (0.36 | ) | | $ | 14.19 | |
Year ended February 28, 2015 | | $ | 15.14 | | | | 0.20 | 4 | | | 0.33 | | | | (0.18 | ) | | | (0.25 | ) | | $ | 15.24 | |
Year ended February 28, 2014 | | $ | 14.53 | | | | 0.20 | | | | 0.97 | | | | (0.17 | ) | | | (0.39 | ) | | $ | 15.14 | |
Year ended February 28, 2013 | | $ | 14.25 | | | | 0.20 | | | | 0.50 | | | | (0.21 | ) | | | (0.21 | ) | | $ | 14.53 | |
Class C | | | | | | | | | | | | | | | | | | | | | | | | |
Six months ended August 31, 2017 (unaudited) | | $ | 14.75 | | | | 0.07 | | | | 0.38 | | | | 0.00 | | | | 0.00 | | | $ | 15.20 | |
Year ended February 28, 2017 | | $ | 14.10 | | | | 0.10 | | | | 0.84 | | | | (0.08 | ) | | | (0.21 | ) | | $ | 14.75 | |
Year ended February 29, 2016 | | $ | 15.16 | | | | 0.11 | 4 | | | (0.79 | ) | | | (0.02 | ) | | | (0.36 | ) | | $ | 14.10 | |
Year ended February 28, 2015 | | $ | 15.08 | | | | 0.09 | | | | 0.32 | | | | (0.08 | ) | | | (0.25 | ) | | $ | 15.16 | |
Year ended February 28, 2014 | | $ | 14.49 | | | | 0.08 | | | | 0.97 | | | | (0.07 | ) | | | (0.39 | ) | | $ | 15.08 | |
Year ended February 28, 2013 | | $ | 14.20 | | | | 0.09 | | | | 0.51 | | | | (0.10 | ) | | | (0.21 | ) | | $ | 14.49 | |
Class R | | | | | | | | | | | | | | | | | | | | | | | | |
Six months ended August 31, 2017 (unaudited) | | $ | 14.81 | | | | 0.11 | 4 | | | 0.40 | | | | 0.00 | | | | 0.00 | | | $ | 15.32 | |
Year ended February 28, 2017 | | $ | 14.14 | | | | 0.18 | | | | 0.84 | | | | (0.14 | ) | | | (0.21 | ) | | $ | 14.81 | |
Year ended February 29, 2016 | | $ | 15.18 | | | | 0.17 | 4 | | | (0.79 | ) | | | (0.06 | ) | | | (0.36 | ) | | $ | 14.14 | |
Year ended February 28, 2015 | | $ | 15.10 | | | | 0.15 | 4 | | | 0.34 | | | | (0.16 | ) | | | (0.25 | ) | | $ | 15.18 | |
Year ended February 28, 20145 | | $ | 14.48 | | | | 0.10 | 4 | | | 1.10 | | | | (0.19 | ) | | | (0.39 | ) | | $ | 15.10 | |
Class R4 | | | | | | | | | | | | | | | | | | | | | | | | |
Six months ended August 31, 2017 (unaudited) | | $ | 15.15 | | | | 0.16 | 4 | | | 0.39 | | | | 0.00 | | | | 0.00 | | | $ | 15.70 | |
Year ended February 28, 2017 | | $ | 14.44 | | | | 0.27 | 4 | | | 0.86 | | | | (0.21 | ) | | | (0.21 | ) | | $ | 15.15 | |
Year ended February 29, 2016 | | $ | 15.50 | | | | 0.26 | | | | (0.81 | ) | | | (0.15 | ) | | | (0.36 | ) | | $ | 14.44 | |
Year ended February 28, 2015 | | $ | 15.40 | | | | 0.26 | | | | 0.33 | | | | (0.24 | ) | | | (0.25 | ) | | $ | 15.50 | |
Year ended February 28, 2014 | | $ | 14.77 | | | | 0.19 | | | | 1.06 | | | | (0.23 | ) | | | (0.39 | ) | | $ | 15.40 | |
Year ended February 28, 20136 | | $ | 14.66 | | | | 0.09 | | | | 0.31 | | | | (0.08 | ) | | | (0.21 | ) | | $ | 14.77 | |
Class R67 | | | | | | | | | | | | | | | | | | | | | | | | |
Six months ended August 31, 2017 (unaudited) | | $ | 15.14 | | | | 0.20 | | | | 0.36 | | | | 0.00 | | | | 0.00 | | | $ | 15.70 | |
Year ended February 28, 2017 | | $ | 14.43 | | | | 0.29 | 4 | | | 0.86 | | | | (0.23 | ) | | | (0.21 | ) | | $ | 15.14 | |
Year ended February 29, 2016 | | $ | 15.50 | | | | 0.27 | | | | (0.80 | ) | | | (0.18 | ) | | | (0.36 | ) | | $ | 14.43 | |
Year ended February 28, 2015 | | $ | 15.40 | | | | 0.28 | | | | 0.33 | | | | (0.26 | ) | | | (0.25 | ) | | $ | 15.50 | |
Year ended February 28, 2014 | | $ | 14.77 | | | | 0.27 | 4 | | | 1.00 | | | | (0.25 | ) | | | (0.39 | ) | | $ | 15.40 | |
Year ended February 28, 2013 | | $ | 14.47 | | | | 0.27 | | | | 0.52 | | | | (0.28 | ) | | | (0.21 | ) | | $ | 14.77 | |
Administrator Class | | | | | | | | | | | | | | | | | | | | | | | | |
Six months ended August 31, 2017 (unaudited) | | $ | 15.09 | | | | 0.14 | | | | 0.40 | | | | 0.00 | | | | 0.00 | | | $ | 15.63 | |
Year ended February 28, 2017 | | $ | 14.40 | | | | 0.24 | 4 | | | 0.84 | | | | (0.18 | ) | | | (0.21 | ) | | $ | 15.09 | |
Year ended February 29, 2016 | | $ | 15.46 | | | | 0.23 | | | | (0.81 | ) | | | (0.12 | ) | | | (0.36 | ) | | $ | 14.40 | |
Year ended February 28, 2015 | | $ | 15.36 | | | | 0.23 | | | | 0.33 | | | | (0.21 | ) | | | (0.25 | ) | | $ | 15.46 | |
Year ended February 28, 2014 | | $ | 14.73 | | | | 0.22 | | | | 0.99 | | | | (0.19 | ) | | | (0.39 | ) | | $ | 15.36 | |
Year ended February 28, 2013 | | $ | 14.44 | | | | 0.21 | | | | 0.52 | | | | (0.23 | ) | | | (0.21 | ) | | $ | 14.73 | |
| 1 | Ratios include net expenses allocated from the affiliated Master Portfolios which were as follows: |
| | | | | | | | | | | | | | | | | | | | | | | | |
| | | Six months ended
August 31, 2017 (unaudited) | | | Year ended
February 28, 2017 | | | Year ended
February 29, 2016 | | | Year ended February 28 | |
| | | | | | 2015 | | | 2014 | | | 2013 | |
| | | | | | | | |
Class A | | | 0.18 | % | | | 0.17 | % | | | 0.16 | % | | | 0.16 | % | | | 0.19 | % | | | 0.26 | % |
Class C | | | 0.18 | | | | 0.17 | | | | 0.16 | | | | 0.16 | | | | 0.19 | | | | 0.26 | |
Class R | | | 0.18 | | | | 0.17 | | | | 0.16 | | | | 0.16 | | | | 0.19 | 5 | | | N/A | |
Class R4 | | | 0.18 | | | | 0.17 | | | | 0.16 | | | | 0.16 | | | | 0.19 | | | | 0.26 | 6 |
Class R67 | | | 0.18 | | | | 0.17 | | | | 0.16 | | | | 0.16 | | | | 0.19 | | | | 0.26 | |
Administrator Class | | | 0.18 | | | | 0.17 | | | | 0.16 | | | | 0.16 | | | | 0.19 | | | | 0.26 | |
| 2 | Total return calculations do not include any sales charges. Returns for periods of less than one year are not annualized. |
| 3 | Portfolio turnover rate is calculated by aggregating the results of multiplying the Fund’s investment percentage in the respective affiliated Master Portfolios by the corresponding affiliated Master Portfolio’s portfolio turnover rate. |
| 4 | Calculated based upon average shares outstanding |
| 5 | For the period from June 28, 2013 (commencement of class operations) to February 28, 2014 |
| 6 | For the period from November 30, 2012 (commencement of class operations) to February 28, 2013 |
| 7 | On June 1, 2013, Institutional Class was renamed Class R6. |
The accompanying notes are an integral part of these financial statements.
| | | | | | |
| Financial highlights | | Wells Fargo Target Date Funds | | | 57 | |
| | | | | | | | | | | | | | | | | | | | | | |
| Ratio to average net assets (annualized) | | | Total
return2 | | | Portfolio
turnover
rate3 | | | Net assets at
end of period
(000s omitted) | |
Net investment
income | | | Gross
expenses1 | | | Net
expenses1 | | | | |
| | | | | | | | | | | | | | | | | | | | | | |
| | 1.76 | % | | | 0.84 | % | | | 0.77 | % | | | 3.50 | % | | | 77 | % | | $ | 209,370 | |
| | 1.44 | % | | | 0.85 | % | | | 0.81 | % | | | 7.53 | % | | | 39 | % | | $ | 218,652 | |
| | 1.49 | % | | | 0.86 | % | | | 0.82 | % | | | (3.86 | )% | | | 34 | % | | $ | 230,667 | |
| | 1.34 | % | | | 0.95 | % | | | 0.86 | % | | | 3.57 | % | | | 36 | % | | $ | 64,808 | |
| | 1.32 | % | | | 0.98 | % | | | 0.90 | % | | | 8.16 | % | | | 35 | % | | $ | 75,871 | |
| | 1.36 | % | | | 1.06 | % | | | 1.01 | % | | | 5.00 | % | | | 32 | % | | $ | 74,720 | |
| | | | | | | | | | | | | | | | | | | | | | |
| | 1.01 | % | | | 1.59 | % | | | 1.52 | % | | | 3.05 | % | | | 77 | % | | $ | 6,142 | |
| | 0.69 | % | | | 1.60 | % | | | 1.56 | % | | | 6.71 | % | | | 39 | % | | $ | 6,713 | |
| | 0.74 | % | | | 1.62 | % | | | 1.58 | % | | | (4.50 | )% | | | 34 | % | | $ | 6,355 | |
| | 0.59 | % | | | 1.70 | % | | | 1.61 | % | | | 2.71 | % | | | 36 | % | | $ | 5,509 | |
| | 0.57 | % | | | 1.73 | % | | | 1.65 | % | | | 7.36 | % | | | 35 | % | | $ | 5,208 | |
| | 0.61 | % | | | 1.81 | % | | | 1.76 | % | | | 4.28 | % | | | 32 | % | | $ | 4,514 | |
| | | | | | | | | | | | | | | | | | | | | | |
| | 1.52 | % | | | 1.10 | % | | | 1.04 | % | | | 3.44 | % | | | 77 | % | | $ | 64 | |
| | 1.21 | % | | | 1.10 | % | | | 1.06 | % | | | 7.27 | % | | | 39 | % | | $ | 321 | |
| | 1.25 | % | | | 1.14 | % | | | 1.08 | % | | | (4.08 | )% | | | 34 | % | | $ | 409 | |
| | 1.00 | % | | | 1.21 | % | | | 1.11 | % | | | 3.30 | % | | | 36 | % | | $ | 744 | |
| | 1.07 | % | | | 1.24 | % | | | 1.11 | % | | | 8.37 | % | | | 35 | % | | $ | 27 | |
| | | | | | | | | | | | | | | | | | | | | | |
| | 2.05 | % | | | 0.57 | % | | | 0.47 | % | | | 3.63 | % | | | 77 | % | | $ | 225,625 | |
| | 1.76 | % | | | 0.56 | % | | | 0.50 | % | | | 7.89 | % | | | 39 | % | | $ | 357,823 | |
| | 1.82 | % | | | 0.58 | % | | | 0.50 | % | | | (3.52 | )% | | | 34 | % | | $ | 408,501 | |
| | 1.72 | % | | | 0.62 | % | | | 0.50 | % | | | 3.89 | % | | | 36 | % | | $ | 772,604 | |
| | 1.70 | % | | | 0.63 | % | | | 0.50 | % | | | 8.58 | % | | | 35 | % | | $ | 803,141 | |
| | 1.72 | % | | | 0.73 | % | | | 0.50 | % | | | 2.79 | % | | | 32 | % | | $ | 23,050 | |
| | | | | | | | | | | | | | | | | | | | | | |
| | 2.21 | % | | | 0.41 | % | | | 0.31 | % | | | 3.70 | % | | | 77 | % | | $ | 531,340 | |
| | 1.92 | % | | | 0.41 | % | | | 0.35 | % | | | 8.04 | % | | | 39 | % | | $ | 645,237 | |
| | 1.97 | % | | | 0.43 | % | | | 0.35 | % | | | (3.42 | )% | | | 34 | % | | $ | 1,116,419 | |
| | 1.85 | % | | | 0.47 | % | | | 0.35 | % | | | 4.04 | % | | | 36 | % | | $ | 1,114,670 | |
| | 1.88 | % | | | 0.53 | % | | | 0.40 | % | | | 8.72 | % | | | 35 | % | | $ | 1,065,417 | |
| | 1.85 | % | | | 0.63 | % | | | 0.50 | % | | | 5.60 | % | | | 32 | % | | $ | 1,605,032 | |
| | | | | | | | | | | | | | | | | | | | | | |
| | 1.86 | % | | | 0.76 | % | | | 0.66 | % | | | 3.58 | % | | | 77 | % | | $ | 159,489 | |
| | 1.60 | % | | | 0.76 | % | | | 0.70 | % | | | 7.58 | % | | | 39 | % | | $ | 197,835 | |
| | 1.62 | % | | | 0.77 | % | | | 0.70 | % | | | (3.72 | )% | | | 34 | % | | $ | 526,327 | |
| | 1.50 | % | | | 0.79 | % | | | 0.70 | % | | | 3.69 | % | | | 36 | % | | $ | 670,893 | |
| | 1.52 | % | | | 0.82 | % | | | 0.74 | % | | | 8.35 | % | | | 35 | % | | $ | 746,910 | |
| | 1.47 | % | | | 0.90 | % | | | 0.85 | % | | | 5.19 | % | | | 32 | % | | $ | 688,261 | |
The accompanying notes are an integral part of these financial statements.
| | | | |
| 58 | | Wells Fargo Target Date Funds | | Financial highlights |
| | | | | | | | | | | | | | | | | | | | | | | | |
| Target 2025 Fund | | Beginning
net asset
value per
share | | | Net
investment
income | | | Net realized
and unrealized
gains (losses)
on investments | | | Distributions
from net
investment
income | | | Distributions
from net
realized gains | | | Ending
net asset
value per
share | |
Class A | | | | | | | | | | | | | | | | | | | | | | | | |
Six months ended August 31, 2017 (unaudited) | | $ | 10.48 | | | | 0.09 | | | | 0.32 | | | | 0.00 | | | | 0.00 | | | $ | 10.89 | |
Year ended February 28, 2017 | | $ | 9.77 | | | | 0.13 | | | | 0.90 | | | | (0.15 | ) | | | (0.17 | ) | | $ | 10.48 | |
Year ended February 29, 2016 | | $ | 10.69 | | | | 0.14 | 4 | | | (0.73 | ) | | | (0.08 | ) | | | (0.25 | ) | | $ | 9.77 | |
Year ended February 28, 2015 | | $ | 10.56 | | | | 0.13 | | | | 0.33 | | | | (0.13 | ) | | | (0.20 | ) | | $ | 10.69 | |
Year ended February 28, 2014 | | $ | 9.95 | | | | 0.15 | | | | 0.92 | | | | (0.13 | ) | | | (0.33 | ) | | $ | 10.56 | |
Year ended February 28, 20135 | | $ | 9.83 | | | | 0.04 | | | | 0.33 | | | | (0.05 | ) | | | (0.20 | ) | | $ | 9.95 | |
Class R | | | | | | | | | | | | | | | | | | | | | | | | |
Six months ended August 31, 2017 (unaudited) | | $ | 10.49 | | | | 0.08 | 4 | | | 0.24 | | | | 0.00 | | | | 0.00 | | | $ | 10.81 | |
Year ended February 28, 2017 | | $ | 9.79 | | | | 0.12 | | | | 0.88 | | | | (0.13 | ) | | | (0.17 | ) | | $ | 10.49 | |
Year ended February 29, 2016 | | $ | 10.71 | | | | 0.13 | | | | (0.73 | ) | | | (0.07 | ) | | | (0.25 | ) | | $ | 9.79 | |
Year ended February 28, 2015 | | $ | 10.57 | | | | 0.11 | | | | 0.33 | | | | (0.10 | ) | | | (0.20 | ) | | $ | 10.71 | |
Year ended February 28, 20146 | | $ | 9.95 | | | | 0.07 | | | | 0.94 | | | | (0.06 | ) | | | (0.33 | ) | | $ | 10.57 | |
Class R4 | | | | | | | | | | | | | | | | | | | | | | | | |
Six months ended August 31, 2017 (unaudited) | | $ | 10.52 | | | | 0.10 | | | | 0.33 | | | | 0.00 | | | | 0.00 | | | $ | 10.95 | |
Year ended February 28, 2017 | | $ | 9.80 | | | | 0.17 | | | | 0.90 | | | | (0.18 | ) | | | (0.17 | ) | | $ | 10.52 | |
Year ended February 29, 2016 | | $ | 10.72 | | | | 0.18 | | | | (0.73 | ) | | | (0.12 | ) | | | (0.25 | ) | | $ | 9.80 | |
Year ended February 28, 2015 | | $ | 10.58 | | | | 0.17 | | | | 0.33 | | | | (0.16 | ) | | | (0.20 | ) | | $ | 10.72 | |
Year ended February 28, 2014 | | $ | 9.97 | | | | 0.15 | | | | 0.95 | | | | (0.16 | ) | | | (0.33 | ) | | $ | 10.58 | |
Year ended February 28, 20135 | | $ | 9.83 | | | | 0.06 | | | | 0.33 | | | | (0.05 | ) | | | (0.20 | ) | | $ | 9.97 | |
Class R67 | | | | | | | | | | | | | | | | | | | | | | | | |
Six months ended August 31, 2017 (unaudited) | | $ | 10.51 | | | | 0.12 | 4 | | | 0.32 | | | | 0.00 | | | | 0.00 | | | $ | 10.95 | |
Year ended February 28, 2017 | | $ | 9.80 | | | | 0.20 | 4 | | | 0.87 | | | | (0.19 | ) | | | (0.17 | ) | | $ | 10.51 | |
Year ended February 29, 2016 | | $ | 10.71 | | | | 0.20 | | | | (0.73 | ) | | | (0.13 | ) | | | (0.25 | ) | | $ | 9.80 | |
Year ended February 28, 2015 | | $ | 10.57 | | | | 0.19 | | | | 0.33 | | | | (0.18 | ) | | | (0.20 | ) | | $ | 10.71 | |
Year ended February 28, 2014 | | $ | 9.96 | | | | 0.19 | | | | 0.92 | | | | (0.17 | ) | | | (0.33 | ) | | $ | 10.57 | |
Year ended February 28, 2013 | | $ | 9.71 | | | | 0.18 | | | | 0.45 | | | | (0.18 | ) | | | (0.20 | ) | | $ | 9.96 | |
Administrator Class | | | | | | | | | | | | | | | | | | | | | | | | |
Six months ended August 31, 2017 (unaudited) | | $ | 10.55 | | | | 0.10 | 4 | | | 0.31 | | | | 0.00 | | | | 0.00 | | | $ | 10.96 | |
Year ended February 28, 2017 | | $ | 9.82 | | | | 0.17 | 4 | | | 0.89 | | | | (0.16 | ) | | | (0.17 | ) | | $ | 10.55 | |
Year ended February 29, 2016 | | $ | 10.74 | | | | 0.16 | | | | (0.74 | ) | | | (0.09 | ) | | | (0.25 | ) | | $ | 9.82 | |
Year ended February 28, 2015 | | $ | 10.60 | | | | 0.15 | | | | 0.33 | | | | (0.14 | ) | | | (0.20 | ) | | $ | 10.74 | |
Year ended February 28, 2014 | | $ | 9.98 | | | | 0.15 | | | | 0.94 | | | | (0.14 | ) | | | (0.33 | ) | | $ | 10.60 | |
Year ended February 28, 2013 | | $ | 9.74 | | | | 0.14 | 4 | | | 0.45 | | | | (0.15 | ) | | | (0.20 | ) | | $ | 9.98 | |
| 1 | Ratios include net expenses allocated from the affiliated Master Portfolio which were as follows: |
| | | | | | | | | | | | | | | | | | | | | | | | |
| | | Six months ended
August 31, 2017
(unaudited) | | | Year ended February 28, 2017 | | | Year ended February 29, 2016 | | | Year ended February 28 | |
| | | | | | 2015 | | | 2014 | | | 2013 | |
| | | | | | | | |
Class A | | | 0.18 | % | | | 0.17 | % | | | 0.16 | % | | | 0.16 | % | | | 0.19 | % | | | 0.26 | %5 |
Class R | | | 0.19 | | | | 0.17 | | | | 0.16 | | | | 0.16 | | | | 0.19 | 6 | | | N/A | |
Class R4 | | | 0.18 | | | | 0.17 | | | | 0.16 | | | | 0.16 | | | | 0.19 | | | | 0.26 | 5 |
Class R67 | | | 0.18 | | | | 0.16 | | | | 0.16 | | | | 0.16 | | | | 0.19 | | | | 0.26 | |
Administrator Class | | | 0.18 | | | | 0.16 | | | | 0.16 | | | | 0.16 | | | | 0.19 | | | | 0.26 | |
| 2 | Total return calculations do not include any sales charges. Returns for periods of less than one year are not annualized. |
| 3 | Portfolio turnover rate is calculated by aggregating the results of multiplying the Fund’s investment percentage in the respective affiliated Master Portfolios by the corresponding affiliated Master Portfolio’s portfolio turnover rate. |
| 4 | Calculated based upon average shares outstanding |
| 5 | For the period from November 30, 2012 (commencement of class operations) to February 28, 2013 |
| 6 | For the period from June 28, 2013 (commencement of class operations) to February 28, 2014 |
| 7 | On June 1, 2013, Institutional Class was renamed Class R6. |
The accompanying notes are an integral part of these financial statements.
| | | | | | |
| Financial highlights | | Wells Fargo Target Date Funds | | | 59 | |
| | | | | | | | | | | | | | | | | | | | | | |
| Ratio to average net assets (annualized) | | | Total
return2 | | | Portfolio
turnover
rate3 | | | Net assets at
end of period
(000s omitted) | |
Net investment
income | | | Gross
expenses1 | | | Net
expenses1 | | | | |
| | | | | | | | | | | | | | | | | | | | | | |
| | 1.76 | % | | | 0.85 | % | | | 0.77 | % | | | 3.91 | % | | | 63 | % | | $ | 132,034 | |
| | 1.37 | % | | | 0.84 | % | | | 0.81 | % | | | 10.61 | % | | | 36 | % | | $ | 140,428 | |
| | 1.40 | % | | | 0.84 | % | | | 0.81 | % | | | (5.56 | )% | | | 32 | % | | $ | 175,373 | |
| | 1.25 | % | | | 0.96 | % | | | 0.86 | % | | | 4.46 | % | | | 31 | % | | $ | 3,193 | |
| | 1.28 | % | | | 0.97 | % | | | 0.86 | % | | | 10.99 | % | | | 32 | % | | $ | 1,379 | |
| | 1.01 | % | | | 1.06 | % | | | 0.86 | % | | | 3.92 | % | | | 28 | % | | $ | 159 | |
| | | | | | | | | | | | | | | | | | | | | | |
| | 1.56 | % | | | 1.13 | % | | | 1.05 | % | | | 3.05 | % | | | 63 | % | | $ | 37 | |
| | 1.12 | % | | | 1.10 | % | | | 1.06 | % | | | 10.22 | % | | | 36 | % | | $ | 610 | |
| | 1.20 | % | | | 1.13 | % | | | 1.08 | % | | | (5.72 | )% | | | 32 | % | | $ | 830 | |
| | 0.85 | % | | | 1.21 | % | | | 1.11 | % | | | 4.24 | % | | | 31 | % | | $ | 1,032 | |
| | 0.96 | % | | | 1.22 | % | | | 1.11 | % | | | 10.27 | % | | | 32 | % | | $ | 28 | |
| | | | | | | | | | | | | | | | | | | | | | |
| | 2.04 | % | | | 0.58 | % | | | 0.47 | % | | | 4.09 | % | | | 63 | % | | $ | 151,224 | |
| | 1.65 | % | | | 0.57 | % | | | 0.50 | % | | | 10.98 | % | | | 36 | % | | $ | 274,639 | |
| | 1.78 | % | | | 0.58 | % | | | 0.50 | % | | | (5.26 | )% | | | 32 | % | | $ | 279,663 | |
| | 1.65 | % | | | 0.63 | % | | | 0.50 | % | | | 4.87 | % | | | 31 | % | | $ | 379,384 | |
| | 1.60 | % | | | 0.63 | % | | | 0.50 | % | | | 11.29 | % | | | 32 | % | | $ | 354,137 | |
| | 1.51 | % | | | 0.73 | % | | | 0.50 | % | | | 4.13 | % | | | 28 | % | | $ | 4,210 | |
| | | | | | | | | | | | | | | | | | | | | | |
| | 2.21 | % | | | 0.42 | % | | | 0.31 | % | | | 4.19 | % | | | 63 | % | | $ | 261,254 | |
| | 1.92 | % | | | 0.41 | % | | | 0.35 | % | | | 11.04 | % | | | 36 | % | | $ | 372,101 | |
| | 1.92 | % | | | 0.43 | % | | | 0.35 | % | | | (5.02 | )% | | | 32 | % | | $ | 1,416,984 | |
| | 1.79 | % | | | 0.48 | % | | | 0.35 | % | | | 5.03 | % | | | 31 | % | | $ | 1,481,264 | |
| | 1.78 | % | | | 0.52 | % | | | 0.39 | % | | | 11.42 | % | | | 32 | % | | $ | 1,409,281 | |
| | 1.83 | % | | | 0.63 | % | | | 0.50 | % | | | 6.74 | % | | | 28 | % | | $ | 1,577,058 | |
| | | | | | | | | | | | | | | | | | | | | | |
| | 1.86 | % | | | 0.76 | % | | | 0.66 | % | | | 3.89 | % | | | 63 | % | | $ | 54,161 | |
| | 1.59 | % | | | 0.76 | % | | | 0.70 | % | | | 10.87 | % | | | 36 | % | | $ | 65,620 | |
| | 1.58 | % | | | 0.77 | % | | | 0.70 | % | | | (5.45 | )% | | | 32 | % | | $ | 298,492 | |
| | 1.45 | % | | | 0.80 | % | | | 0.70 | % | | | 4.65 | % | | | 31 | % | | $ | 350,823 | |
| | 1.43 | % | | | 0.82 | % | | | 0.74 | % | | | 11.11 | % | | | 32 | % | | $ | 354,050 | |
| | 1.42 | % | | | 0.90 | % | | | 0.85 | % | | | 6.27 | % | | | 28 | % | | $ | 271,593 | |
The accompanying notes are an integral part of these financial statements.
| | | | |
| 60 | | Wells Fargo Target Date Funds | | Financial highlights |
| | | | | | | | | | | | | | | | | | | | | | | | |
| Target 2030 Fund | | Beginning
net asset
value per
share | | | Net
investment
income | | | Net realized
and unrealized
gains (losses)
on investments | | | Distributions
from net
investment
income | | | Distributions
from net
realized gains | | | Ending
net asset
value per
share | |
Class A | | | | | | | | | | | | | | | | | | | | | | | | |
Six months ended August 31, 2017 (unaudited) | | $ | 16.70 | | | | 0.15 | | | | 0.60 | | | | 0.00 | | | | 0.00 | | | $ | 17.45 | |
Year ended February 28, 2017 | | $ | 15.17 | | | | 0.23 | | | | 1.90 | | | | (0.31 | ) | | | (0.29 | ) | | $ | 16.70 | |
Year ended February 29, 2016 | | $ | 16.97 | | | | 0.21 | 4 | | | (1.44 | ) | | | (0.14 | ) | | | (0.43 | ) | | $ | 15.17 | |
Year ended February 28, 2015 | | $ | 16.61 | | | | 0.22 | | | | 0.67 | | | | (0.19 | ) | | | (0.34 | ) | | $ | 16.97 | |
Year ended February 28, 2014 | | $ | 15.31 | | | | 0.20 | | | | 1.83 | | | | (0.19 | ) | | | (0.54 | ) | | $ | 16.61 | |
Year ended February 28, 2013 | | $ | 14.74 | | | | 0.20 | | | | 0.85 | | | | (0.20 | ) | | | (0.28 | ) | | $ | 15.31 | |
Class C | | | | | | | | | | | | | | | | | | | | | | | | |
Six months ended August 31, 2017 (unaudited) | | $ | 16.24 | | | | 0.08 | | | | 0.59 | | | | 0.00 | | | | 0.00 | | | $ | 16.91 | |
Year ended February 28, 2017 | | $ | 14.79 | | | | 0.07 | | | | 1.88 | | | | (0.21 | ) | | | (0.29 | ) | | $ | 16.24 | |
Year ended February 29, 2016 | | $ | 16.58 | | | | 0.10 | | | | (1.41 | ) | | | (0.05 | ) | | | (0.43 | ) | | $ | 14.79 | |
Year ended February 28, 2015 | | $ | 16.25 | | | | 0.08 | | | | 0.67 | | | | (0.08 | ) | | | (0.34 | ) | | $ | 16.58 | |
Year ended February 28, 2014 | | $ | 15.00 | | | | 0.08 | | | | 1.79 | | | | (0.08 | ) | | | (0.54 | ) | | $ | 16.25 | |
Year ended February 28, 2013 | | $ | 14.45 | | | | 0.08 | | | | 0.85 | | | | (0.10 | ) | | | (0.28 | ) | | $ | 15.00 | |
Class R | | | | | | | | | | | | | | | | | | | | | | | | |
Six months ended August 31, 2017 (unaudited) | | $ | 16.66 | | | | 0.13 | 4 | | | 0.56 | | | | 0.00 | | | | 0.00 | | | $ | 17.35 | |
Year ended February 28, 2017 | | $ | 15.14 | | | | 0.18 | | | | 1.90 | | | | (0.27 | ) | | | (0.29 | ) | | $ | 16.66 | |
Year ended February 29, 2016 | | $ | 16.95 | | | | 0.18 | | | | (1.44 | ) | | | (0.12 | ) | | | (0.43 | ) | | $ | 15.14 | |
Year ended February 28, 2015 | | $ | 16.61 | | | | 0.13 | 4 | | | 0.71 | | | | (0.16 | ) | | | (0.34 | ) | | $ | 16.95 | |
Year ended February 28, 20145 | | $ | 15.39 | | | | 0.10 | | | | 1.75 | | | | (0.09 | ) | | | (0.54 | ) | | $ | 16.61 | |
Class R4 | | | | | | | | | | | | | | | | | | | | | | | | |
Six months ended August 31, 2017 (unaudited) | | $ | 16.95 | | | | 0.18 | 4 | | | 0.61 | | | | 0.00 | | | | 0.00 | | | $ | 17.74 | |
Year ended February 28, 2017 | | $ | 15.38 | | | | 0.27 | | | | 1.94 | | | | (0.35 | ) | | | (0.29 | ) | | $ | 16.95 | |
Year ended February 29, 2016 | | $ | 17.20 | | | | 0.28 | | | | (1.47 | ) | | | (0.20 | ) | | | (0.43 | ) | | $ | 15.38 | |
Year ended February 28, 2015 | | $ | 16.83 | | | | 0.26 | | | | 0.70 | | | | (0.25 | ) | | | (0.34 | ) | | $ | 17.20 | |
Year ended February 28, 2014 | | $ | 15.50 | | | | 0.23 | | | | 1.89 | | | | (0.25 | ) | | | (0.54 | ) | | $ | 16.83 | |
Year ended February 28, 20136 | | $ | 15.07 | | | | 0.08 | | | | 0.71 | | | | (0.08 | ) | | | (0.28 | ) | | $ | 15.50 | |
Class R67 | | | | | | | | | | | | | | | | | | | | | | | | |
Six months ended August 31, 2017 (unaudited) | | $ | 16.93 | | | | 0.19 | 4 | | | 0.61 | | | | 0.00 | | | | 0.00 | | | $ | 17.73 | |
Year ended February 28, 2017 | | $ | 15.37 | | | | 0.31 | 4 | | | 1.92 | | | | (0.38 | ) | | | (0.29 | ) | | $ | 16.93 | |
Year ended February 29, 2016 | | $ | 17.19 | | | | 0.30 | | | | (1.46 | ) | | | (0.23 | ) | | | (0.43 | ) | | $ | 15.37 | |
Year ended February 28, 2015 | | $ | 16.81 | | | | 0.28 | | | | 0.72 | | | | (0.28 | ) | | | (0.34 | ) | | $ | 17.19 | |
Year ended February 28, 2014 | | $ | 15.49 | | | | 0.29 | 4 | | | 1.84 | | | | (0.27 | ) | | | (0.54 | ) | | $ | 16.81 | |
Year ended February 28, 2013 | | $ | 14.91 | | | | 0.27 | | | | 0.86 | | | | (0.27 | ) | | | (0.28 | ) | | $ | 15.49 | |
Administrator Class | | | | | | | | | | | | | | | | | | | | | | | | |
Six months ended August 31, 2017 (unaudited) | | $ | 16.94 | | | | 0.16 | 4 | | | 0.61 | | | | 0.00 | | | | 0.00 | | | $ | 17.71 | |
Year ended February 28, 2017 | | $ | 15.37 | | | | 0.25 | 4 | | | 1.93 | | | | (0.32 | ) | | | (0.29 | ) | | $ | 16.94 | |
Year ended February 29, 2016 | | $ | 17.19 | | | | 0.25 | | | | (1.47 | ) | | | (0.17 | ) | | | (0.43 | ) | | $ | 15.37 | |
Year ended February 28, 2015 | | $ | 16.82 | | | | 0.23 | | | | 0.70 | | | | (0.22 | ) | | | (0.34 | ) | | $ | 17.19 | |
Year ended February 28, 2014 | | $ | 15.49 | | | | 0.23 | | | | 1.86 | | | | (0.22 | ) | | | (0.54 | ) | | $ | 16.82 | |
Year ended February 28, 2013 | | $ | 14.91 | | | | 0.21 | | | | 0.88 | | | | (0.23 | ) | | | (0.28 | ) | | $ | 15.49 | |
| 1 | Ratios include net expenses allocated from the affiliated Master Portfolios which were as follows: |
| | | | | | | | | | | | | | | | | | | | | | | | |
| | | Six months ended
August 31, 2017
(unaudited) | | | Year ended
February 28, 2017 | | | Year ended
February 29, 2016 | | | Year ended February 28 | |
| | | | | | 2015 | | | 2014 | | | 2013 | |
| | | | | | | | |
Class A | | | 0.18 | % | | | 0.17 | % | | | 0.16 | % | | | 0.16 | % | | | 0.19 | % | | | 0.27 | % |
Class C | | | 0.18 | | | | 0.17 | | | | 0.16 | | | | 0.16 | | | | 0.19 | | | | 0.27 | |
Class R | | | 0.19 | | | | 0.17 | | | | 0.16 | | | | 0.16 | | | | 0.19 | 5 | | | N/A | |
Class R4 | | | 0.18 | | | | 0.17 | | | | 0.16 | | | | 0.16 | | | | 0.19 | | | | 0.27 | 6 |
Class R67 | | | 0.18 | | | | 0.16 | | | | 0.16 | | | | 0.16 | | | | 0.19 | | | | 0.27 | |
Administrator Class | | | 0.18 | | | | 0.17 | | | | 0.16 | | | | 0.16 | | | | 0.19 | | | | 0.27 | |
| 2 | Total return calculations do not include any sales charges. Returns for periods of less than one year are not annualized. |
| 3 | Portfolio turnover rate is calculated by aggregating the results of multiplying the Fund’s investment percentage in the respective affiliated Master Portfolios by the corresponding affiliated Master Portfolio’s portfolio turnover rate. |
| 4 | Calculated based upon average shares outstanding |
| 5 | For the period from June 28, 2013 (commencement of class operations) to February 28, 2014 |
| 6 | For the period from November 30, 2012 (commencement of class operations) to February 28, 2013 |
| 7 | On June 1, 2013, Institutional Class was renamed Class R6. |
The accompanying notes are an integral part of these financial statements.
| | | | | | |
| Financial highlights | | Wells Fargo Target Date Funds | | | 61 | |
| | | | | | | | | | | | | | | | | | | | | | |
| Ratio to average net assets (annualized) | | | Total
return2 | | | Portfolio
turnover
rate3 | | | Net assets at
end of period
(000s omitted) | |
Net investment
income | | | Gross
expenses1 | | | Net
expenses1 | | | | |
| | | | | | | | | | | | | | | | | | | | | | |
| | 1.72 | % | | | 0.84 | % | | | 0.77 | % | | | 4.49 | % | | | 51 | % | | $ | 230,245 | |
| | 1.32 | % | | | 0.84 | % | | | 0.82 | % | | | 14.15 | % | | | 31 | % | | $ | 230,044 | |
| | 1.32 | % | | | 0.86 | % | | | 0.83 | % | | | (7.37 | )% | | | 30 | % | | $ | 227,928 | |
| | 1.22 | % | | | 0.95 | % | | | 0.87 | % | | | 5.44 | % | | | 26 | % | | $ | 60,747 | |
| | 1.22 | % | | | 0.98 | % | | | 0.91 | % | | | 13.52 | % | | | 29 | % | | $ | 65,634 | |
| | 1.29 | % | | | 1.06 | % | | | 1.02 | % | | | 7.28 | % | | | 25 | % | | $ | 60,857 | |
| | | | | | | | | | | | | | | | | | | | | | |
| | 0.97 | % | | | 1.59 | % | | | 1.52 | % | | | 4.13 | % | | | 51 | % | | $ | 4,898 | |
| | 0.57 | % | | | 1.59 | % | | | 1.57 | % | | | 13.28 | % | | | 31 | % | | $ | 4,630 | |
| | 0.63 | % | | | 1.63 | % | | | 1.59 | % | | | (8.05 | )% | | | 30 | % | | $ | 4,662 | |
| | 0.45 | % | | | 1.70 | % | | | 1.62 | % | | | 4.67 | % | | | 26 | % | | $ | 5,020 | |
| | 0.47 | % | | | 1.73 | % | | | 1.66 | % | | | 12.64 | % | | | 29 | % | | $ | 4,097 | |
| | 0.53 | % | | | 1.82 | % | | | 1.77 | % | | | 6.52 | % | | | 25 | % | | $ | 3,465 | |
| | | | | | | | | | | | | | | | | | | | | | |
| | 1.58 | % | | | 1.12 | % | | | 1.06 | % | | | 4.14 | % | | | 51 | % | | $ | 41 | |
| | 1.06 | % | | | 1.10 | % | | | 1.07 | % | | | 13.88 | % | | | 31 | % | | $ | 904 | |
| | 1.11 | % | | | 1.12 | % | | | 1.08 | % | | | (7.57 | )% | | | 30 | % | | $ | 853 | |
| | 0.72 | % | | | 1.22 | % | | | 1.12 | % | | | 5.15 | % | | | 26 | % | | $ | 603 | |
| | 0.87 | % | | | 1.22 | % | | | 1.12 | % | | | 12.19 | % | | | 29 | % | | $ | 28 | |
| | | | | | | | | | | | | | | | | | | | | | |
| | 2.01 | % | | | 0.57 | % | | | 0.47 | % | | | 4.66 | % | | | 51 | % | | $ | 356,044 | |
| | 1.64 | % | | | 0.56 | % | | | 0.51 | % | | | 14.52 | % | | | 31 | % | | $ | 507,587 | |
| | 1.73 | % | | | 0.58 | % | | | 0.51 | % | | | (7.07 | )% | | | 30 | % | | $ | 513,864 | |
| | 1.57 | % | | | 0.62 | % | | | 0.51 | % | | | 5.82 | % | | | 26 | % | | $ | 897,425 | |
| | 1.53 | % | | | 0.63 | % | | | 0.51 | % | | | 13.99 | % | | | 29 | % | | $ | 850,913 | |
| | 1.35 | % | | | 0.73 | % | | | 0.51 | % | | | 5.34 | % | | | 25 | % | | $ | 19,568 | |
| | | | | | | | | | | | | | | | | | | | | | |
| | 2.17 | % | | | 0.41 | % | | | 0.32 | % | | | 4.73 | % | | | 51 | % | | $ | 509,846 | |
| | 1.87 | % | | | 0.41 | % | | | 0.36 | % | | | 14.63 | % | | | 31 | % | | $ | 618,551 | |
| | 1.85 | % | | | 0.43 | % | | | 0.36 | % | | | (6.93 | )% | | | 30 | % | | $ | 1,284,324 | |
| | 1.72 | % | | | 0.47 | % | | | 0.36 | % | | | 6.04 | % | | | 26 | % | | $ | 1,185,077 | |
| | 1.76 | % | | | 0.53 | % | | | 0.41 | % | | | 14.08 | % | | | 29 | % | | $ | 1,049,122 | |
| | 1.80 | % | | | 0.64 | % | | | 0.51 | % | | | 7.82 | % | | | 25 | % | | $ | 1,478,163 | |
| | | | | | | | | | | | | | | | | | | | | | |
| | 1.81 | % | | | 0.76 | % | | | 0.67 | % | | | 4.55 | % | | | 51 | % | | $ | 218,800 | |
| | 1.51 | % | | | 0.76 | % | | | 0.71 | % | | | 14.32 | % | | | 31 | % | | $ | 262,336 | |
| | 1.52 | % | | | 0.77 | % | | | 0.71 | % | | | (7.27 | )% | | | 30 | % | | $ | 498,554 | |
| | 1.38 | % | | | 0.79 | % | | | 0.71 | % | | | 5.61 | % | | | 26 | % | | $ | 643,336 | |
| | 1.38 | % | | | 0.82 | % | | | 0.75 | % | | | 13.74 | % | | | 29 | % | | $ | 685,421 | |
| | 1.43 | % | | | 0.91 | % | | | 0.86 | % | | | 7.46 | % | | | 25 | % | | $ | 572,735 | |
The accompanying notes are an integral part of these financial statements.
| | | | |
| 62 | | Wells Fargo Target Date Funds | | Financial highlights |
| | | | | | | | | | | | | | | | | | | | | | | | |
| Target 2035 Fund | | Beginning
net asset
value per
share | | | Net
investment
income | | | Net realized
and unrealized
gains (losses)
on investments | | | Distributions
from net
investment
income | | | Distributions
from net
realized gains | | | Ending
net asset
value per
share | |
Class A | | | | | | | | | | | | | | | | | | | | | | | | |
Six months ended August 31, 2017 (unaudited) | | $ | 11.25 | | | | 0.10 | | | | 0.46 | | | | (0.04 | ) | | | 0.00 | | | $ | 11.77 | |
Year ended February 28, 2017 | | $ | 9.89 | | | | 0.13 | | | | 1.56 | | | | (0.15 | ) | | | (0.18 | ) | | $ | 11.25 | |
Year ended February 29, 2016 | | $ | 11.32 | | | | 0.15 | | | | (1.18 | ) | | | (0.11 | ) | | | (0.29 | ) | | $ | 9.89 | |
Year ended February 28, 2015 | | $ | 11.02 | | | | 0.12 | | | | 0.56 | | | | (0.13 | ) | | | (0.25 | ) | | $ | 11.32 | |
Year ended February 28, 2014 | | $ | 9.99 | | | | 0.14 | | | | 1.41 | | | | (0.13 | ) | | | (0.39 | ) | | $ | 11.02 | |
Year ended February 28, 20134 | | $ | 9.60 | | | | 0.02 | 5 | | | 0.58 | | | | (0.05 | ) | | | (0.16 | ) | | $ | 9.99 | |
Class R | | | | | | | | | | | | | | | | | | | | | | | | |
Six months ended August 31, 2017 (unaudited) | | $ | 11.32 | | | | 0.09 | | | | 0.45 | | | | (0.03 | ) | | | 0.00 | | | $ | 11.83 | |
Year ended February 28, 2017 | | $ | 9.95 | | | | 0.11 | | | | 1.57 | | | | (0.13 | ) | | | (0.18 | ) | | $ | 11.32 | |
Year ended February 29, 2016 | | $ | 11.39 | | | | 0.11 | | | | (1.17 | ) | | | (0.09 | ) | | | (0.29 | ) | | $ | 9.95 | |
Year ended February 28, 2015 | | $ | 11.09 | | | | 0.10 | | | | 0.55 | | | | (0.10 | ) | | | (0.25 | ) | | $ | 11.39 | |
Year ended February 28, 20146 | | $ | 10.16 | | | | 0.06 | 5 | | | 1.32 | | | | (0.06 | ) | | | (0.39 | ) | | $ | 11.09 | |
Class R4 | | | | | | | | | | | | | | | | | | | | | | | | |
Six months ended August 31, 2017 (unaudited) | | $ | 11.27 | | | | 0.12 | 5 | | | 0.46 | | | | (0.06 | ) | | | 0.00 | | | $ | 11.79 | |
Year ended February 28, 2017 | | $ | 9.91 | | | | 0.17 | 5 | | | 1.56 | | | | (0.19 | ) | | | (0.18 | ) | | $ | 11.27 | |
Year ended February 29, 2016 | | $ | 11.33 | | | | 0.18 | | | | (1.17 | ) | | | (0.14 | ) | | | (0.29 | ) | | $ | 9.91 | |
Year ended February 28, 2015 | | $ | 11.03 | | | | 0.17 | | | | 0.54 | | | | (0.16 | ) | | | (0.25 | ) | | $ | 11.33 | |
Year ended February 28, 2014 | | $ | 9.99 | | | | 0.15 | | | | 1.44 | | | | (0.16 | ) | | | (0.39 | ) | | $ | 11.03 | |
Year ended February 28, 20134 | | $ | 9.60 | | | | 0.03 | 5 | | | 0.57 | | | | (0.05 | ) | | | (0.16 | ) | | $ | 9.99 | |
Class R67 | | | | | | | | | | | | | | | | | | | | | | | | |
Six months ended August 31, 2017 (unaudited) | | $ | 11.27 | | | | 0.17 | | | | 0.42 | | | | (0.07 | ) | | | 0.00 | | | $ | 11.79 | |
Year ended February 28, 2017 | | $ | 9.91 | | | | 0.20 | 5 | | | 1.55 | | | | (0.21 | ) | | | (0.18 | ) | | $ | 11.27 | |
Year ended February 29, 2016 | | $ | 11.33 | | | | 0.19 | | | | (1.16 | ) | | | (0.16 | ) | | | (0.29 | ) | | $ | 9.91 | |
Year ended February 28, 2015 | | $ | 11.03 | | | | 0.18 | | | | 0.55 | | | | (0.18 | ) | | | (0.25 | ) | | $ | 11.33 | |
Year ended February 28, 2014 | | $ | 9.99 | | | | 0.19 | | | | 1.41 | | | | (0.17 | ) | | | (0.39 | ) | | $ | 11.03 | |
Year ended February 28, 2013 | | $ | 9.50 | | | | 0.17 | | | | 0.65 | | | | (0.17 | ) | | | (0.16 | ) | | $ | 9.99 | |
Administrator Class | | | | | | | | | | | | | | | | | | | | | | | | |
Six months ended August 31, 2017 (unaudited) | | $ | 11.30 | | | | 0.10 | 5 | | | 0.47 | | | | (0.04 | ) | | | 0.00 | | | $ | 11.83 | |
Year ended February 28, 2017 | | $ | 9.94 | | | | 0.16 | 5 | | | 1.55 | | | | (0.17 | ) | | | (0.18 | ) | | $ | 11.30 | |
Year ended February 29, 2016 | | $ | 11.37 | | | | 0.16 | | | | (1.18 | ) | | | (0.12 | ) | | | (0.29 | ) | | $ | 9.94 | |
Year ended February 28, 2015 | | $ | 11.06 | | | | 0.15 | | | | 0.55 | | | | (0.14 | ) | | | (0.25 | ) | | $ | 11.37 | |
Year ended February 28, 2014 | | $ | 10.02 | | | | 0.14 | | | | 1.43 | | | | (0.14 | ) | | | (0.39 | ) | | $ | 11.06 | |
Year ended February 28, 2013 | | $ | 9.53 | | | | 0.13 | | | | 0.66 | | | | (0.14 | ) | | | (0.16 | ) | | $ | 10.02 | |
| 1 | Ratios include net expenses allocated from the affiliated Master Portfolios which were as follows: |
| | | | | | | | | | | | | | | | | | | | | | | | |
| | | Six months ended
August 31, 2017
(unaudited) | | | Year ended
February 28, 2017 | | | Year ended
February 29, 2016 | | | Year ended February 28 | |
| | | | | | 2015 | | | 2014 | | | 2013 | |
| | | | | | | | |
Class A | | | 0.19 | % | | | 0.17 | % | | | 0.17 | % | | | 0.16 | % | | | 0.19 | % | | | 0.27 | %4 |
Class R | | | 0.19 | | | | 0.17 | | | | 0.17 | | | | 0.16 | | | | 0.19 | 6 | | | N/A | |
Class R4 | | | 0.19 | | | | 0.17 | | | | 0.16 | | | | 0.16 | | | | 0.19 | | | | 0.27 | 4 |
Class R67 | | | 0.19 | | | | 0.16 | | | | 0.16 | | | | 0.16 | | | | 0.19 | | | | 0.27 | |
Administrator Class | | | 0.19 | | | | 0.16 | | | | 0.16 | | | | 0.16 | | | | 0.19 | | | | 0.27 | |
| 2 | Total return calculations do not include any sales charges. Returns for periods of less than one year are not annualized. |
| 3 | Portfolio turnover rate is calculated by aggregating the results of multiplying the Fund’s investment percentage in the respective affiliated Master Portfolios by the corresponding affiliated Master Portfolio’s portfolio turnover rate. |
| 4 | For the period from November 30, 2012 (commencement of class operations) to February 28, 2013 |
| 5 | Calculated based upon average shares outstanding |
| 6 | For the period from June 28, 2013 (commencement of class operations) to February 28, 2014 |
| 7 | On June 1, 2013, Institutional Class was renamed Class R6. |
The accompanying notes are an integral part of these financial statements.
| | | | | | |
| Financial highlights | | Wells Fargo Target Date Funds | | | 63 | |
| | | | | | | | | | | | | | | | | | | | | | |
| Ratio to average net assets (annualized) | | | Total
return2 | | | Portfolio
turnover
rate3 | | | Net assets at
end of period
(000s omitted) | |
Net investment
income | | | Gross
expenses1 | | | Net
expenses1 | | | | |
| | | | | | | | | | | | | | | | | | | | | | |
| | 1.68 | % | | | 0.86 | % | | | 0.78 | % | | | 4.99 | % | | | 39 | % | | $ | 121,685 | |
| | 1.28 | % | | | 0.85 | % | | | 0.83 | % | | | 17.33 | % | | | 27 | % | | $ | 127,294 | |
| | 1.19 | % | | | 0.84 | % | | | 0.83 | % | | | (9.28 | )% | | | 28 | % | | $ | 142,817 | |
| | 1.05 | % | | | 0.97 | % | | | 0.88 | % | | | 6.33 | % | | | 22 | % | | $ | 1,677 | |
| | 1.11 | % | | | 0.98 | % | | | 0.88 | % | | | 15.82 | % | | | 26 | % | | $ | 532 | |
| | 1.04 | % | | | 1.07 | % | | | 0.88 | % | | | 6.36 | % | | | 22 | % | | $ | 41 | |
| | | | | | | | | | | | | | | | | | | | | | |
| | 1.45 | % | | | 1.11 | % | | | 1.03 | % | | | 4.77 | % | | | 39 | % | | $ | 194 | |
| | 0.89 | % | | | 1.11 | % | | | 1.08 | % | | | 17.09 | % | | | 27 | % | | $ | 171 | |
| | 1.02 | % | | | 1.13 | % | | | 1.09 | % | | | (9.48 | )% | | | 28 | % | | $ | 73 | |
| | 0.90 | % | | | 1.23 | % | | | 1.13 | % | | | 5.97 | % | | | 22 | % | | $ | 36 | |
| | 0.79 | % | | | 1.26 | % | | | 1.13 | % | | | 13.76 | % | | | 26 | % | | $ | 28 | |
| | | | | | | | | | | | | | | | | | | | | | |
| | 1.99 | % | | | 0.59 | % | | | 0.49 | % | | | 5.13 | % | | | 39 | % | | $ | 135,936 | |
| | 1.54 | % | | | 0.57 | % | | | 0.52 | % | | | 17.68 | % | | | 27 | % | | $ | 240,025 | |
| | 1.66 | % | | | 0.59 | % | | | 0.52 | % | | | (8.92 | )% | | | 28 | % | | $ | 228,810 | |
| | 1.51 | % | | | 0.64 | % | | | 0.52 | % | | | 6.63 | % | | | 22 | % | | $ | 329,135 | |
| | 1.45 | % | | | 0.65 | % | | | 0.52 | % | | | 16.28 | % | | | 26 | % | | $ | 297,612 | |
| | 1.30 | % | | | 0.75 | % | | | 0.52 | % | | | 6.38 | % | | | 22 | % | | $ | 1,940 | |
| | | | | | | | | | | | | | | | | | | | | | |
| | 2.14 | % | | | 0.43 | % | | | 0.32 | % | | | 5.20 | % | | | 39 | % | | $ | 233,251 | |
| | 1.83 | % | | | 0.42 | % | | | 0.37 | % | | | 17.86 | % | | | 27 | % | | $ | 317,594 | |
| | 1.80 | % | | | 0.44 | % | | | 0.37 | % | | | (8.78 | )% | | | 28 | % | | $ | 714,884 | |
| | 1.65 | % | | | 0.49 | % | | | 0.37 | % | | | 6.79 | % | | | 22 | % | | $ | 674,926 | |
| | 1.71 | % | | | 0.55 | % | | | 0.41 | % | | | 16.41 | % | | | 26 | % | | $ | 570,482 | |
| | 1.76 | % | | | 0.66 | % | | | 0.52 | % | | | 8.86 | % | | | 22 | % | | $ | 648,345 | |
| | | | | | | | | | | | | | | | | | | | | | |
| | 1.79 | % | | | 0.77 | % | | | 0.67 | % | | | 5.08 | % | | | 39 | % | | $ | 46,830 | |
| | 1.52 | % | | | 0.77 | % | | | 0.72 | % | | | 17.38 | % | | | 27 | % | | $ | 50,898 | |
| | 1.46 | % | | | 0.78 | % | | | 0.72 | % | | | (9.17 | )% | | | 28 | % | | $ | 182,599 | |
| | 1.31 | % | | | 0.81 | % | | | 0.72 | % | | | 6.50 | % | | | 22 | % | | $ | 227,265 | |
| | 1.33 | % | | | 0.85 | % | | | 0.75 | % | | | 15.96 | % | | | 26 | % | | $ | 236,217 | |
| | 1.36 | % | | | 0.93 | % | | | 0.87 | % | | | 8.48 | % | | | 22 | % | | $ | 172,860 | |
The accompanying notes are an integral part of these financial statements.
| | | | |
| 64 | | Wells Fargo Target Date Funds | | Financial highlights |
| | | | | | | | | | | | | | | | | | | | | | | | |
| Target 2040 Fund | | Beginning
net asset
value per
share | | | Net
investment
income | | | Net realized
and unrealized
gains (losses)
on investments | | | Distributions
from net
investment
income | | | Distributions
from net
realized gains | | | Ending
net asset
value per
share | |
Class A | | | | | | | | | | | | | | | | | | | | | | | | |
Six months ended August 31, 2017 (unaudited) | | $ | 19.43 | | | | 0.17 | | | | 0.87 | | | | 0.00 | | | | 0.00 | | | $ | 20.47 | |
Year ended February 28, 2017 | | $ | 16.74 | | | | 0.23 | | | | 3.08 | | | | (0.27 | ) | | | (0.35 | ) | | $ | 19.43 | |
Year ended February 29, 2016 | | $ | 19.53 | | | | 0.22 | 4 | | | (2.27 | ) | | | (0.20 | ) | | | (0.54 | ) | | $ | 16.74 | |
Year ended February 28, 2015 | | $ | 18.90 | | | | 0.22 | | | | 1.08 | | | | (0.21 | ) | | | (0.46 | ) | | $ | 19.53 | |
Year ended February 28, 2014 | | $ | 16.92 | | | | 0.21 | | | | 2.71 | | | | (0.21 | ) | | | (0.73 | ) | | $ | 18.90 | |
Year ended February 28, 2013 | | $ | 16.07 | | | | 0.21 | | | | 1.19 | | | | (0.21 | ) | | | (0.34 | ) | | $ | 16.92 | |
Class C | | | | | | | | | | | | | | | | | | | | | | | | |
Six months ended August 31, 2017 (unaudited) | | $ | 18.19 | | | | 0.10 | | | | 0.81 | | | | 0.00 | | | | 0.00 | | | $ | 19.10 | |
Year ended February 28, 2017 | | $ | 15.71 | | | | 0.04 | | | | 2.94 | | | | (0.15 | ) | | | (0.35 | ) | | $ | 18.19 | |
Year ended February 29, 2016 | | $ | 18.38 | | | | 0.09 | 4 | | | (2.15 | ) | | | (0.07 | ) | | | (0.54 | ) | | $ | 15.71 | |
Year ended February 28, 2015 | | $ | 17.85 | | | | 0.06 | 4 | | | 1.02 | | | | (0.09 | ) | | | (0.46 | ) | | $ | 18.38 | |
Year ended February 28, 2014 | | $ | 16.03 | | | | 0.07 | 4 | | | 2.57 | | | | (0.09 | ) | | | (0.73 | ) | | $ | 17.85 | |
Year ended February 28, 2013 | | $ | 15.26 | | | | 0.09 | 4 | | | 1.12 | | | | (0.10 | ) | | | (0.34 | ) | | $ | 16.03 | |
Class R | | | | | | | | | | | | | | | | | | | | | | | | |
Six months ended August 31, 2017 (unaudited) | | $ | 19.36 | | | | 0.15 | 4 | | | 0.88 | | | | 0.00 | | | | 0.00 | | | $ | 20.39 | |
Year ended February 28, 2017 | | $ | 16.69 | | | | 0.18 | | | | 3.07 | | | | (0.23 | ) | | | (0.35 | ) | | $ | 19.36 | |
Year ended February 29, 2016 | | $ | 19.51 | | | | 0.18 | | | | (2.28 | ) | | | (0.18 | ) | | | (0.54 | ) | | $ | 16.69 | |
Year ended February 28, 2015 | | $ | 18.90 | | | | 0.14 | 4 | | | 1.11 | | | | (0.18 | ) | | | (0.46 | ) | | $ | 19.51 | |
Year ended February 28, 20145 | | $ | 17.19 | | | | 0.09 | 4 | | | 2.45 | | | | (0.10 | ) | | | (0.73 | ) | | $ | 18.90 | |
Class R4 | | | | | | | | | | | | | | | | | | | | | | | | |
Six months ended August 31, 2017 (unaudited) | | $ | 19.86 | | | | 0.20 | 4 | | | 0.90 | | | | 0.00 | | | | 0.00 | | | $ | 20.96 | |
Year ended February 28, 2017 | | $ | 17.09 | | | | 0.27 | | | | 3.18 | | | | (0.33 | ) | | | (0.35 | ) | | $ | 19.86 | |
Year ended February 29, 2016 | | $ | 19.93 | | | | 0.28 | | | | (2.32 | ) | | | (0.26 | ) | | | (0.54 | ) | | $ | 17.09 | |
Year ended February 28, 2015 | | $ | 19.28 | | | | 0.29 | | | | 1.10 | | | | (0.28 | ) | | | (0.46 | ) | | $ | 19.93 | |
Year ended February 28, 2014 | | $ | 17.24 | | | | 0.27 | 4 | | | 2.78 | | | | (0.28 | ) | | | (0.73 | ) | | $ | 19.28 | |
Year ended February 28, 20136 | | $ | 16.52 | | | | 0.09 | | | | 1.06 | | | | (0.09 | ) | | | (0.34 | ) | | $ | 17.24 | |
Class R67 | | | | | | | | | | | | | | | | | | | | | | | | |
Six months ended August 31, 2017 (unaudited) | | $ | 19.85 | | | | 0.28 | | | | 0.84 | | | | 0.00 | | | | 0.00 | | | $ | 20.97 | |
Year ended February 28, 2017 | | $ | 17.09 | | | | 0.41 | | | | 3.06 | | | | (0.36 | ) | | | (0.35 | ) | | $ | 19.85 | |
Year ended February 29, 2016 | | $ | 19.93 | | | | 0.32 | | | | (2.33 | ) | | | (0.29 | ) | | | (0.54 | ) | | $ | 17.09 | |
Year ended February 28, 2015 | | $ | 19.27 | | | | 0.30 | | | | 1.13 | | | | (0.31 | ) | | | (0.46 | ) | | $ | 19.93 | |
Year ended February 28, 2014 | | $ | 17.24 | | | | 0.31 | 4 | | | 2.75 | | | | (0.30 | ) | | | (0.73 | ) | | $ | 19.27 | |
Year ended February 28, 2013 | | $ | 16.37 | | | | 0.29 | | | | 1.21 | | | | (0.29 | ) | | | (0.34 | ) | | $ | 17.24 | |
Administrator Class | | | | | | | | | | | | | | | | | | | | | | | | |
Six months ended August 31, 2017 (unaudited) | | $ | 19.82 | | | | 0.18 | 4 | | | 0.90 | | | | 0.00 | | | | 0.00 | | | $ | 20.90 | |
Year ended February 28, 2017 | | $ | 17.07 | | | | 0.25 | | | | 3.14 | | | | (0.29 | ) | | | (0.35 | ) | | $ | 19.82 | |
Year ended February 29, 2016 | | $ | 19.89 | | | | 0.27 | | | | (2.33 | ) | | | (0.22 | ) | | | (0.54 | ) | | $ | 17.07 | |
Year ended February 28, 2015 | | $ | 19.25 | | | | 0.25 | | | | 1.09 | | | | (0.24 | ) | | | (0.46 | ) | | $ | 19.89 | |
Year ended February 28, 2014 | | $ | 17.21 | | | | 0.24 | | | | 2.77 | | | | (0.24 | ) | | | (0.73 | ) | | $ | 19.25 | |
Year ended February 28, 2013 | | $ | 16.34 | | | | 0.22 | | | | 1.22 | | | | (0.23 | ) | | | (0.34 | ) | | $ | 17.21 | |
| 1 | Ratios include net expenses allocated from the affiliated Master Portfolios which were as follows: |
| | | | | | | | | | | | | | | | | | | | | | | | |
| | | Six months ended
August 31, 2017 (unaudited) | | | Year ended
February 28, 2017 | | | Year ended
February 29, 2016 | | | Year ended February 28 | |
| | | | | | 2015 | | | 2014 | | | 2013 | |
| | | | | | | | |
Class A | | | 0.19 | % | | | 0.17 | % | | | 0.16 | % | | | 0.16 | % | | | 0.19 | % | | | 0.27 | % |
Class C | | | 0.19 | | | | 0.17 | | | | 0.16 | | | | 0.16 | | | | 0.19 | | | | 0.27 | |
Class R | | | 0.19 | | | | 0.17 | | | | 0.17 | | | | 0.16 | | | | 0.19 | 5 | | | N/A | |
Class R4 | | | 0.19 | | | | 0.17 | | | | 0.16 | | | | 0.16 | | | | 0.19 | | | | 0.27 | 6 |
Class R67 | | | 0.19 | | | | 0.16 | | | | 0.16 | | | | 0.16 | | | | 0.19 | | | | 0.27 | |
Administrator Class | | | 0.19 | | | | 0.17 | | | | 0.16 | | | | 0.16 | | | | 0.19 | | | | 0.27 | |
| 2 | Total return calculations do not include any sales charges. Returns for periods of less than one year are not annualized. |
| 3 | Portfolio turnover rate is calculated by aggregating the results of multiplying the Fund’s investment percentage in the respective affiliated Master Portfolios by the corresponding affiliated Master Portfolio’s portfolio turnover rate. |
| 4 | Calculated based upon average shares outstanding |
| 5 | For the period from June 28, 2013 (commencement of class operations) to February 28, 2014 |
| 6 | For the period from November 30, 2012 (commencement of class operations) to February 28, 2013 |
| 7 | On June 1, 2013, Institutional Class was renamed Class R6. |
The accompanying notes are an integral part of these financial statements.
| | | | | | |
| Financial highlights | | Wells Fargo Target Date Funds | | | 65 | |
| | | | | | | | | | | | | | | | | | | | | | |
| Ratio to average net assets (annualized) | | | Total
return2 | | | Portfolio
turnover
rate3 | | | Net assets at
end of period
(000s omitted) | |
Net investment
income | | | Gross
expenses1 | | | Net
expenses1 | | | | |
| | | | | | | | | | | | | | | | | | | | | | |
| | 1.66 | % | | | 0.85 | % | | | 0.78 | % | | | 5.35 | % | | | 30 | % | | $ | 222,052 | |
| | 1.21 | % | | | 0.85 | % | | | 0.83 | % | | | 20.01 | % | | | 24 | % | | $ | 218,689 | |
| | 1.23 | % | | | 0.87 | % | | | 0.84 | % | | | (10.72 | )% | | | 27 | % | | $ | 202,038 | |
| | 1.11 | % | | | 0.96 | % | | | 0.88 | % | | | 7.01 | % | | | 18 | % | | $ | 111,874 | |
| | 1.15 | % | | | 0.99 | % | | | 0.92 | % | | | 17.54 | % | | | 25 | % | | $ | 114,233 | |
| | 1.25 | % | | | 1.08 | % | | | 1.03 | % | | | 8.99 | % | | | 20 | % | | $ | 104,836 | |
| | | | | | | | | | | | | | | | | | | | | | |
| | 0.91 | % | | | 1.60 | % | | | 1.53 | % | | | 5.00 | % | | | 30 | % | | $ | 5,219 | |
| | 0.47 | % | | | 1.60 | % | | | 1.58 | % | | | 19.11 | % | | | 24 | % | | $ | 4,782 | |
| | 0.54 | % | | | 1.63 | % | | | 1.60 | % | | | (11.39 | )% | | | 27 | % | | $ | 4,621 | |
| | 0.35 | % | | | 1.71 | % | | | 1.63 | % | | | 6.15 | % | | | 18 | % | | $ | 5,747 | |
| | 0.40 | % | | | 1.74 | % | | | 1.67 | % | | | 16.68 | % | | | 25 | % | | $ | 4,813 | |
| | 0.50 | % | | | 1.83 | % | | | 1.78 | % | | | 8.18 | % | | | 20 | % | | $ | 4,040 | |
| | | | | | | | | | | | | | | | | | | | | | |
| | 1.53 | % | | | 1.11 | % | | | 1.06 | % | | | 5.32 | % | | | 30 | % | | $ | 60 | |
| | 0.94 | % | | | 1.10 | % | | | 1.08 | % | | | 19.68 | % | | | 24 | % | | $ | 394 | |
| | 0.97 | % | | | 1.12 | % | | | 1.09 | % | | | (10.96 | )% | | | 27 | % | | $ | 289 | |
| | 0.72 | % | | | 1.23 | % | | | 1.13 | % | | | 6.71 | % | | | 18 | % | | $ | 137 | |
| | 0.75 | % | | | 1.24 | % | | | 1.13 | % | | | 14.96 | % | | | 25 | % | | $ | 29 | |
| | | | | | | | | | | | | | | | | | | | | | |
| | 1.97 | % | | | 0.57 | % | | | 0.48 | % | | | 5.54 | % | | | 30 | % | | $ | 294,180 | |
| | 1.54 | % | | | 0.57 | % | | | 0.52 | % | | | 20.43 | % | | | 24 | % | | $ | 388,622 | |
| | 1.64 | % | | | 0.59 | % | | | 0.52 | % | | | (10.45 | )% | | | 27 | % | | $ | 385,259 | |
| | 1.47 | % | | | 0.63 | % | | | 0.52 | % | | | 7.35 | % | | | 18 | % | | $ | 678,944 | |
| | 1.42 | % | | | 0.64 | % | | | 0.52 | % | | | 18.02 | % | | | 25 | % | | $ | 635,241 | |
| | 1.12 | % | | | 0.75 | % | | | 0.52 | % | | | 7.13 | % | | | 20 | % | | $ | 13,651 | |
| | | | | | | | | | | | | | | | | | | | | | |
| | 2.12 | % | | | 0.42 | % | | | 0.32 | % | | | 5.64 | % | | | 30 | % | | $ | 411,324 | |
| | 1.80 | % | | | 0.41 | % | | | 0.37 | % | | | 20.56 | % | | | 24 | % | | $ | 489,693 | |
| | 1.75 | % | | | 0.43 | % | | | 0.37 | % | | | (10.32 | )% | | | 27 | % | | $ | 929,672 | |
| | 1.61 | % | | | 0.48 | % | | | 0.37 | % | | | 7.57 | % | | | 18 | % | | $ | 872,914 | |
| | 1.70 | % | | | 0.54 | % | | | 0.42 | % | | | 18.14 | % | | | 25 | % | | $ | 724,856 | |
| | 1.76 | % | | | 0.65 | % | | | 0.52 | % | | | 9.50 | % | | | 20 | % | | $ | 993,528 | |
| | | | | | | | | | | | | | | | | | | | | | |
| | 1.76 | % | | | 0.77 | % | | | 0.67 | % | | | 5.45 | % | | | 30 | % | | $ | 168,871 | |
| | 1.43 | % | | | 0.76 | % | | | 0.72 | % | | | 20.09 | % | | | 24 | % | | $ | 197,272 | |
| | 1.42 | % | | | 0.78 | % | | | 0.72 | % | | | (10.56 | )% | | | 27 | % | | $ | 320,415 | |
| | 1.27 | % | | | 0.80 | % | | | 0.72 | % | | | 7.10 | % | | | 18 | % | | $ | 427,789 | |
| | 1.30 | % | | | 0.83 | % | | | 0.76 | % | | | 17.79 | % | | | 25 | % | | $ | 452,487 | |
| | 1.39 | % | | | 0.92 | % | | | 0.87 | % | | | 9.14 | % | | | 20 | % | | $ | 360,567 | |
The accompanying notes are an integral part of these financial statements.
| | | | |
| 66 | | Wells Fargo Target Date Funds | | Financial highlights |
| | | | | | | | | | | | | | | | | | | | | | | | |
| Target 2045 Fund | | Beginning
net asset
value per
share | | | Net
investment
income | | | Net realized
and unrealized
gains (losses)
on investments | | | Distributions
from net
investment
income | | | Distributions
from net
realized gains | | | Ending
net asset
value per
share | |
Class A | | | | | | | | | | | | | | | | | | | | | | | | |
Six months ended August 31, 2017 (unaudited) | | $ | 11.91 | | | | 0.10 | | | | 0.57 | | | | (0.05 | ) | | | 0.00 | | | $ | 12.53 | |
Year ended February 28, 2017 | | $ | 10.07 | | | | 0.13 | | | | 2.05 | | | | (0.17 | ) | | | (0.17 | ) | | $ | 11.91 | |
Year ended February 29, 2016 | | $ | 11.85 | | | | 0.16 | | | | (1.52 | ) | | | (0.13 | ) | | | (0.29 | ) | | $ | 10.07 | |
Year ended February 28, 2015 | | $ | 11.43 | | | | 0.11 | 4 | | | 0.72 | | | | (0.13 | ) | | | (0.28 | ) | | $ | 11.85 | |
Year ended February 28, 2014 | | $ | 10.17 | | | | 0.12 | 4 | | | 1.73 | | | | (0.14 | ) | | | (0.45 | ) | | $ | 11.43 | |
Year ended February 28, 20135 | | $ | 9.64 | | | | 0.03 | | | | 0.68 | | | | (0.05 | ) | | | (0.13 | ) | | $ | 10.17 | |
Class R | | | | | | | | | | | | | | | | | | | | | | | | |
Six months ended August 31, 2017 (unaudited) | | $ | 12.04 | | | | 0.08 | | | | 0.59 | | | | (0.04 | ) | | | 0.00 | | | $ | 12.67 | |
Year ended February 28, 2017 | | $ | 10.19 | | | | 0.11 | | | | 2.05 | | | | (0.14 | ) | | | (0.17 | ) | | $ | 12.04 | |
Year ended February 29, 2016 | | $ | 11.97 | | | | 0.11 | | | | (1.51 | ) | | | (0.09 | ) | | | (0.29 | ) | | $ | 10.19 | |
Year ended February 28, 2015 | | $ | 11.54 | | | | 0.10 | | | | 0.71 | | | | (0.10 | ) | | | (0.28 | ) | | $ | 11.97 | |
Year ended February 28, 20146 | | $ | 10.45 | | | | 0.05 | | | | 1.55 | | | | (0.06 | ) | | | (0.45 | ) | | $ | 11.54 | |
Class R4 | | | | | | | | | | | | | | | | | | | | | | | | |
Six months ended August 31, 2017 (unaudited) | | $ | 11.96 | | | | 0.12 | 4 | | | 0.58 | | | | (0.07 | ) | | | 0.00 | | | $ | 12.59 | |
Year ended February 28, 2017 | | $ | 10.11 | | | | 0.16 | | | | 2.06 | | | | (0.20 | ) | | | (0.17 | ) | | $ | 11.96 | |
Year ended February 29, 2016 | | $ | 11.89 | | | | 0.18 | | | | (1.51 | ) | | | (0.16 | ) | | | (0.29 | ) | | $ | 10.11 | |
Year ended February 28, 2015 | | $ | 11.46 | | | | 0.17 | | | | 0.71 | | | | (0.17 | ) | | | (0.28 | ) | | $ | 11.89 | |
Year ended February 28, 2014 | | $ | 10.18 | | | | 0.14 | | | | 1.76 | | | | (0.17 | ) | | | (0.45 | ) | | $ | 11.46 | |
Year ended February 28, 20135 | | $ | 9.64 | | | | 0.06 | | | | 0.66 | | | | (0.05 | ) | | | (0.13 | ) | | $ | 10.18 | |
Class R67 | | | | | | | | | | | | | | | | | | | | | | | | |
Six months ended August 31, 2017 (unaudited) | | $ | 11.93 | | | | 0.16 | | | | 0.55 | | | | (0.08 | ) | | | 0.00 | | | $ | 12.56 | |
Year ended February 28, 2017 | | $ | 10.10 | | | | 0.23 | | | | 1.99 | | | | (0.22 | ) | | | (0.17 | ) | | $ | 11.93 | |
Year ended February 29, 2016 | | $ | 11.87 | | | | 0.19 | | | | (1.49 | ) | | | (0.18 | ) | | | (0.29 | ) | | $ | 10.10 | |
Year ended February 28, 2015 | | $ | 11.44 | | | | 0.18 | | | | 0.71 | | | | (0.18 | ) | | | (0.28 | ) | | $ | 11.87 | |
Year ended February 28, 2014 | | $ | 10.17 | | | | 0.19 | | | | 1.71 | | | | (0.18 | ) | | | (0.45 | ) | | $ | 11.44 | |
Year ended February 28, 2013 | | $ | 9.55 | | | | 0.16 | | | | 0.76 | | | | (0.17 | ) | | | (0.13 | ) | | $ | 10.17 | |
Administrator Class | | | | | | | | | | | | | | | | | | | | | | | | |
Six months ended August 31, 2017 (unaudited) | | $ | 12.01 | | | | 0.10 | | | | 0.58 | | | | (0.05 | ) | | | 0.00 | | | $ | 12.64 | |
Year ended February 28, 2017 | | $ | 10.16 | | | | 0.16 | 4 | | | 2.04 | | | | (0.18 | ) | | | (0.17 | ) | | $ | 12.01 | |
Year ended February 29, 2016 | | $ | 11.94 | | | | 0.16 | | | | (1.51 | ) | | | (0.14 | ) | | | (0.29 | ) | | $ | 10.16 | |
Year ended February 28, 2015 | | $ | 11.51 | | | | 0.14 | | | | 0.71 | | | | (0.14 | ) | | | (0.28 | ) | | $ | 11.94 | |
Year ended February 28, 2014 | | $ | 10.23 | | | | 0.14 | | | | 1.73 | | | | (0.14 | ) | | | (0.45 | ) | | $ | 11.51 | |
Year ended February 28, 2013 | | $ | 9.59 | | | | 0.12 | | | | 0.77 | | | | (0.12 | ) | | | (0.13 | ) | | $ | 10.23 | |
| 1 | Ratios include net expenses allocated from the affiliated Master Portfolios which were as follows: |
| | | | | | | | | | | | | | | | | | | | | | | | |
| | | Six months ended
August 31, 2017 (unaudited) | | | Year ended
February 28, 2017 | | | Year ended
February 29, 2016 | | | Year ended February 28 | |
| | | | | | 2015 | | | 2014 | | | 2013 | |
| | | | | | | | |
Class A | | | 0.19 | % | | | 0.17 | % | | | 0.17 | % | | | 0.16 | % | | | 0.19 | % | | | 0.27 | %5 |
Class R | | | 0.19 | | | | 0.16 | | | | 0.16 | | | | 0.16 | | | | 0.19 | 6 | | | N/A | |
Class R4 | | | 0.19 | | | | 0.17 | | | | 0.16 | | | | 0.16 | | | | 0.19 | | | | 0.27 | 5 |
Class R67 | | | 0.19 | | | | 0.16 | | | | 0.16 | | | | 0.16 | | | | 0.19 | | | | 0.27 | |
Administrator Class | | | 0.19 | | | | 0.17 | | | | 0.16 | | | | 0.16 | | | | 0.19 | | | | 0.27 | |
| 2 | Total return calculations do not include any sales charges. Returns for periods of less than one year are not annualized. |
| 3 | Portfolio turnover rate is calculated by aggregating the results of multiplying the Fund’s investment percentage in the respective affiliated Master Portfolios by the corresponding affiliated Master Portfolio’s portfolio turnover rate. |
| 4 | Calculated based upon average shares outstanding |
| 5 | For the period from November 30, 2012 (commencement of class operations) to February 28, 2013 |
| 6 | For the period from June 28, 2013 (commencement of class operations) to February 28, 2014 |
| 7 | On June 1, 2013, Institutional Class was renamed Class R6. |
The accompanying notes are an integral part of these financial statements.
| | | | | | |
| Financial highlights | | Wells Fargo Target Date Funds | | | 67 | |
| | | | | | | | | | | | | | | | | | | | | | |
| Ratio to average net assets (annualized) | | | Total
return2 | | | Portfolio
turnover
rate3 | | | Net assets at
end of period
(000s omitted) | |
Net investment
income1 | | | Gross
expenses1 | | | Net
expenses1 | | | | |
| | | | | | | | | | | | | | | | | | | | | | |
| | 1.64 | % | | | 0.88 | % | | | 0.79 | % | | | 5.64 | % | | | 23 | % | | $ | 62,285 | |
| | 1.22 | % | | | 0.86 | % | | | 0.83 | % | | | 21.85 | % | | | 22 | % | | $ | 70,570 | |
| | 1.09 | % | | | 0.86 | % | | | 0.83 | % | | | (11.70 | )% | | | 26 | % | | $ | 77,062 | |
| | 0.96 | % | | | 0.99 | % | | | 0.88 | % | | | 7.41 | % | | | 16 | % | | $ | 793 | |
| | 1.09 | % | | | 1.01 | % | | | 0.88 | % | | | 18.54 | % | | | 24 | % | | $ | 167 | |
| | 1.08 | % | | | 1.10 | % | | | 0.88 | % | | | 7.41 | % | | | 19 | % | | $ | 13 | |
| | | | | | | | | | | | | | | | | | | | | | |
| | 1.41 | % | | | 1.13 | % | | | 1.03 | % | | | 5.55 | % | | | 23 | % | | $ | 44 | |
| | 0.88 | % | | | 1.11 | % | | | 1.08 | % | | | 21.41 | % | | | 22 | % | | $ | 42 | |
| | 1.01 | % | | | 1.14 | % | | | 1.09 | % | | | (11.84 | )% | | | 26 | % | | $ | 30 | |
| | 0.83 | % | | | 1.25 | % | | | 1.13 | % | | | 7.11 | % | | | 16 | % | | $ | 31 | |
| | 0.68 | % | | | 1.30 | % | | | 1.13 | % | | | 15.52 | % | | | 24 | % | | $ | 29 | |
| | | | | | | | | | | | | | | | | | | | | | |
| | 1.97 | % | | | 0.61 | % | | | 0.49 | % | | | 5.85 | % | | | 23 | % | | $ | 88,297 | |
| | 1.46 | % | | | 0.59 | % | | | 0.52 | % | | | 22.25 | % | | | 22 | % | | $ | 151,999 | |
| | 1.61 | % | | | 0.60 | % | | | 0.52 | % | | | (11.41 | )% | | | 26 | % | | $ | 131,789 | |
| | 1.44 | % | | | 0.66 | % | | | 0.52 | % | | | 7.79 | % | | | 16 | % | | $ | 199,015 | |
| | 1.39 | % | | | 0.68 | % | | | 0.52 | % | | | 18.99 | % | | | 24 | % | | $ | 174,582 | |
| | 1.29 | % | | | 0.78 | % | | | 0.52 | % | | | 7.55 | % | | | 19 | % | | $ | 1,246 | |
| | | | | | | | | | | | | | | | | | | | | | |
| | 2.11 | % | | | 0.45 | % | | | 0.32 | % | | | 5.93 | % | | | 23 | % | | $ | 160,402 | |
| | 1.77 | % | | | 0.43 | % | | | 0.37 | % | | | 22.26 | % | | | 22 | % | | $ | 219,922 | |
| | 1.73 | % | | | 0.45 | % | | | 0.37 | % | | | (11.21 | )% | | | 26 | % | | $ | 407,094 | |
| | 1.58 | % | | | 0.51 | % | | | 0.37 | % | | | 7.96 | % | | | 16 | % | | $ | 367,164 | |
| | 1.67 | % | | | 0.57 | % | | | 0.42 | % | | | 19.07 | % | | | 24 | % | | $ | 291,293 | |
| | 1.74 | % | | | 0.69 | % | | | 0.52 | % | | | 9.85 | % | | | 19 | % | | $ | 324,476 | |
| | | | | | | | | | | | | | | | | | | | | | |
| | 1.75 | % | | | 0.79 | % | | | 0.67 | % | | | 5.70 | % | | | 23 | % | | $ | 37,062 | |
| | 1.46 | % | | | 0.78 | % | | | 0.72 | % | | | 21.89 | % | | | 22 | % | | $ | 41,504 | |
| | 1.39 | % | | | 0.79 | % | | | 0.72 | % | | | (11.55 | )% | | | 26 | % | | $ | 108,091 | |
| | 1.24 | % | | | 0.83 | % | | | 0.72 | % | | | 7.54 | % | | | 16 | % | | $ | 130,175 | |
| | 1.28 | % | | | 0.87 | % | | | 0.75 | % | | | 18.65 | % | | | 24 | % | | $ | 126,533 | |
| | 1.35 | % | | | 0.96 | % | | | 0.87 | % | | | 9.49 | % | | | 19 | % | | $ | 85,590 | |
The accompanying notes are an integral part of these financial statements.
| | | | |
| 68 | | Wells Fargo Target Date Funds | | Financial highlights |
| | | | | | | | | | | | | | | | | | | | | | | | |
| Target 2050 Fund | | Beginning
net asset
value per
share | | | Net
investment
income | | | Net realized
and unrealized
gains (losses)
on investments | | | Distributions
from net
investment
income | | | Distributions
from net
realized gains | | | Ending
net asset
value per
share | |
Class A | | | | | | | | | | | | | | | | | | | | | | | | |
Six months ended August 31, 2017 (unaudited) | | $ | 11.40 | | | | 0.10 | | | | 0.56 | | | | (0.05 | ) | | | 0.00 | | | $ | 12.01 | |
Year ended February 28, 2017 | | $ | 9.61 | | | | 0.12 | | | | 2.02 | | | | (0.18 | ) | | | (0.17 | ) | | $ | 11.40 | |
Year ended February 29, 2016 | | $ | 11.34 | | | | 0.11 | 4 | | | (1.44 | ) | | | (0.12 | ) | | | (0.28 | ) | | $ | 9.61 | |
Year ended February 28, 2015 | | $ | 10.93 | | | | 0.11 | | | | 0.69 | | | | (0.13 | ) | | | (0.26 | ) | | $ | 11.34 | |
Year ended February 28, 2014 | | $ | 9.72 | | | | 0.15 | | | | 1.62 | | | | (0.13 | ) | | | (0.43 | ) | | $ | 10.93 | |
Year ended February 28, 20135 | | $ | 9.29 | | | | 0.03 | | | | 0.65 | | | | (0.05 | ) | | | (0.20 | ) | | $ | 9.72 | |
Class C | | | | | | | | | | | | | | | | | | | | | | | | |
Six months ended August 31, 2017 (unaudited) | | $ | 11.36 | | | | 0.05 | | | | 0.56 | | | | (0.01 | ) | | | 0.00 | | | $ | 11.96 | |
Year ended February 28, 2017 | | $ | 9.58 | | | | 0.04 | | | | 2.02 | | | | (0.11 | ) | | | (0.17 | ) | | $ | 11.36 | |
Year ended February 29, 2016 | | $ | 11.30 | | | | 0.06 | | | | (1.46 | ) | | | (0.04 | ) | | | (0.28 | ) | | $ | 9.58 | |
Year ended February 28, 2015 | | $ | 10.91 | | | | 0.04 | | | | 0.68 | | | | (0.07 | ) | | | (0.26 | ) | | $ | 11.30 | |
Year ended February 28, 2014 | | $ | 9.71 | | | | 0.08 | | | | 1.61 | | | | (0.06 | ) | | | (0.43 | ) | | $ | 10.91 | |
Year ended February 28, 20135 | | $ | 9.29 | | | | 0.02 | | | | 0.64 | | | | (0.04 | ) | | | (0.20 | ) | | $ | 9.71 | |
Class R | | | | | | | | | | | | | | | | | | | | | | | | |
Six months ended August 31, 2017 (unaudited) | | $ | 11.43 | | | | 0.08 | | | | 0.57 | | | | (0.04 | ) | | | 0.00 | | | $ | 12.04 | |
Year ended February 28, 2017 | | $ | 9.63 | | | | 0.09 | | | | 2.04 | | | | (0.16 | ) | | | (0.17 | ) | | $ | 11.43 | |
Year ended February 29, 2016 | | $ | 11.37 | | | | 0.11 | | | | (1.47 | ) | | | (0.10 | ) | | | (0.28 | ) | | $ | 9.63 | |
Year ended February 28, 2015 | | $ | 10.95 | | | | 0.09 | | | | 0.68 | | | | (0.09 | ) | | | (0.26 | ) | | $ | 11.37 | |
Year ended February 28, 20146 | | $ | 9.91 | | | | 0.05 | | | | 1.48 | | | | (0.06 | ) | | | (0.43 | ) | | $ | 10.95 | |
Class R4 | | | | | | | | | | | | | | | | | | | | | | | | |
Six months ended August 31, 2017 (unaudited) | | $ | 11.45 | | | | 0.12 | 4 | | | 0.55 | | | | (0.06 | ) | | | 0.00 | | | $ | 12.06 | |
Year ended February 28, 2017 | | $ | 9.64 | | | | 0.16 | 4 | | | 2.03 | | | | (0.21 | ) | | | (0.17 | ) | | $ | 11.45 | |
Year ended February 29, 2016 | | $ | 11.38 | | | | 0.17 | | | | (1.48 | ) | | | (0.15 | ) | | | (0.28 | ) | | $ | 9.64 | |
Year ended February 28, 2015 | | $ | 10.96 | | | | 0.16 | | | | 0.68 | | | | (0.16 | ) | | | (0.26 | ) | | $ | 11.38 | |
Year ended February 28, 2014 | | $ | 9.73 | | | | 0.15 | 4 | | | 1.67 | | | | (0.16 | ) | | | (0.43 | ) | | $ | 10.96 | |
Year ended February 28, 20135 | | $ | 9.29 | | | | 0.05 | | | | 0.64 | | | | (0.05 | ) | | | (0.20 | ) | | $ | 9.73 | |
Class R67 | | | | | | | | | | | | | | | | | | | | | | | | |
Six months ended August 31, 2017 (unaudited) | | $ | 11.44 | | | | 0.15 | | | | 0.54 | | | | (0.07 | ) | | | 0.00 | | | $ | 12.06 | |
Year ended February 28, 2017 | | $ | 9.64 | | | | 0.19 | 4 | | | 2.01 | | | | (0.23 | ) | | | (0.17 | ) | | $ | 11.44 | |
Year ended February 29, 2016 | | $ | 11.37 | | | | 0.18 | | | | (1.46 | ) | | | (0.17 | ) | | | (0.28 | ) | | $ | 9.64 | |
Year ended February 28, 2015 | | $ | 10.95 | | | | 0.17 | | | | 0.68 | | | | (0.17 | ) | | | (0.26 | ) | | $ | 11.37 | |
Year ended February 28, 2014 | | $ | 9.72 | | | | 0.17 | 4 | | | 1.66 | | | | (0.17 | ) | | | (0.43 | ) | | $ | 10.95 | |
Year ended February 28, 2013 | | $ | 9.20 | | | | 0.16 | | | | 0.72 | | | | (0.16 | ) | | | (0.20 | ) | | $ | 9.72 | |
Administrator Class | | | | | | | | | | | | | | | | | | | | | | | | |
Six months ended August 31, 2017 (unaudited) | | $ | 11.41 | | | | 0.10 | 4 | | | 0.58 | | | | (0.06 | ) | | | 0.00 | | | $ | 12.03 | |
Year ended February 28, 2017 | | $ | 9.61 | | | | 0.15 | 4 | | | 2.01 | | | | (0.19 | ) | | | (0.17 | ) | | $ | 11.41 | |
Year ended February 29, 2016 | | $ | 11.34 | | | | 0.15 | | | | (1.47 | ) | | | (0.13 | ) | | | (0.28 | ) | | $ | 9.61 | |
Year ended February 28, 2015 | | $ | 10.92 | | | | 0.13 | | | | 0.69 | | | | (0.14 | ) | | | (0.26 | ) | | $ | 11.34 | |
Year ended February 28, 2014 | | $ | 9.70 | | | | 0.13 | 4 | | | 1.65 | | | | (0.13 | ) | | | (0.43 | ) | | $ | 10.92 | |
Year ended February 28, 2013 | | $ | 9.18 | | | | 0.12 | | | | 0.73 | | | | (0.13 | ) | | | (0.20 | ) | | $ | 9.70 | |
| 1 | Ratios include net expenses allocated from the affiliated Master Portfolios which were as follows: |
| | | | | | | | | | | | | | | | | | | | | | | | |
| | | Six months ended
August 31, 2017 (unaudited) | | | Year ended
February 28, 2017 | | | Year ended
February 29, 2016 | | | Year ended February 28 | |
| | | | | | 2015 | | | 2014 | | | 2013 | |
| | | | | | | | |
Class A | | | 0.19 | % | | | 0.17 | % | | | 0.17 | % | | | 0.16 | % | | | 0.21 | % | | | 0.27 | %5 |
Class C | | | 0.19 | | | | 0.17 | | | | 0.16 | | | | 0.16 | | | | 0.21 | | | | 0.27 | 5 |
Class R | | | 0.19 | | | | 0.19 | | | | 0.19 | | | | 0.16 | | | | 0.21 | 6 | | | N/A | |
Class R4 | | | 0.19 | | | | 0.17 | | | | 0.16 | | | | 0.16 | | | | 0.21 | | | | 0.27 | 5 |
Class R67 | | | 0.19 | | | | 0.16 | | | | 0.16 | | | | 0.16 | | | | 0.21 | | | | 0.27 | |
Administrator Class | | | 0.19 | | | | 0.17 | | | | 0.16 | | | | 0.16 | | | | 0.21 | | | | 0.27 | |
| 2 | Total return calculations do not include any sales charges. Returns for periods of less than one year are not annualized. |
| 3 | Portfolio turnover rate is calculated by aggregating the results of multiplying the Fund’s investment percentage in the respective affiliated Master Portfolios by the corresponding affiliated Master Portfolio’s portfolio turnover rate. |
| 4 | Calculated based upon average shares outstanding |
| 5 | For the period from November 30, 2012 (commencement of class operations) to February 28, 2013 |
| 6 | For the period from June 28, 2013 (commencement of class operations) to February 28, 2014 |
| 7 | On June 1, 2013, Institutional Class was renamed Class R6. |
The accompanying notes are an integral part of these financial statements.
| | | | | | |
| Financial highlights | | Wells Fargo Target Date Funds | | | 69 | |
| | | | | | | | | | | | | | | | | | | | | | |
| Ratio to average net assets (annualized) | | | Total
return2 | | | Portfolio
turnover
rate3 | | | Net assets at
end of period
(000s omitted) | |
Net investment
income | | | Gross
expenses1 | | | Net
expenses1 | | | | |
| | | | | | | | | | | | | | | | | | | | | | |
| | 1.64 | % | | | 0.87 | % | | | 0.78 | % | | | 5.80 | % | | | 21 | % | | $ | 65,644 | |
| | 1.13 | % | | | 0.85 | % | | | 0.83 | % | | | 22.48 | % | | | 21 | % | | $ | 64,356 | |
| | 1.05 | % | | | 0.86 | % | | | 0.83 | % | | | (11.93 | )% | | | 26 | % | | $ | 58,749 | |
| | 0.94 | % | | | 0.97 | % | | | 0.88 | % | | | 7.52 | % | | | 16 | % | | $ | 1,629 | |
| | 1.00 | % | | | 0.98 | % | | | 0.88 | % | | | 18.62 | % | | | 23 | % | | $ | 210 | |
| | 1.07 | % | | | 1.05 | % | | | 0.88 | % | | | 7.49 | % | | | 19 | % | | $ | 11 | |
| | | | | | | | | | | | | | | | | | | | | | |
| | 0.90 | % | | | 1.61 | % | | | 1.53 | % | | | 5.38 | % | | | 21 | % | | $ | 1,351 | |
| | 0.33 | % | | | 1.61 | % | | | 1.58 | % | | | 21.58 | % | | | 21 | % | | $ | 1,218 | |
| | 0.49 | % | | | 1.64 | % | | | 1.60 | % | | | (12.56 | )% | | | 26 | % | | $ | 894 | |
| | 0.20 | % | | | 1.72 | % | | | 1.63 | % | | | 6.70 | % | | | 16 | % | | $ | 737 | |
| | 0.39 | % | | | 1.73 | % | | | 1.63 | % | | | 17.68 | % | | | 23 | % | | $ | 163 | |
| | 0.16 | % | | | 1.81 | % | | | 1.63 | % | | | 7.31 | % | | | 19 | % | | $ | 17 | |
| | | | | | | | | | | | | | | | | | | | | | |
| | 1.41 | % | | | 1.14 | % | | | 1.03 | % | | | 5.67 | % | | | 21 | % | | $ | 37 | |
| | 0.94 | % | | | 1.13 | % | | | 1.08 | % | | | 22.29 | % | | | 21 | % | | $ | 34 | |
| | 1.00 | % | | | 1.17 | % | | | 1.10 | % | | | (12.21 | )% | | | 26 | % | | $ | 32 | |
| | 0.82 | % | | | 1.25 | % | | | 1.13 | % | | | 7.20 | % | | | 16 | % | | $ | 31 | |
| | 0.69 | % | | | 1.27 | % | | | 1.13 | % | | | 15.67 | % | | | 23 | % | | $ | 29 | |
| | | | | | | | | | | | | | | | | | | | | | |
| | 1.96 | % | | | 0.59 | % | | | 0.48 | % | | | 5.92 | % | | | 21 | % | | $ | 183,781 | |
| | 1.45 | % | | | 0.57 | % | | | 0.52 | % | | | 23.00 | % | | | 21 | % | | $ | 243,339 | |
| | 1.61 | % | | | 0.59 | % | | | 0.52 | % | | | (11.72 | )% | | | 26 | % | | $ | 219,157 | |
| | 1.43 | % | | | 0.64 | % | | | 0.52 | % | | | 7.82 | % | | | 16 | % | | $ | 360,833 | |
| | 1.39 | % | | | 0.65 | % | | | 0.52 | % | | | 19.10 | % | | | 23 | % | | $ | 307,320 | |
| | 1.03 | % | | | 0.76 | % | | | 0.52 | % | | | 7.63 | % | | | 19 | % | | $ | 6,538 | |
| | | | | | | | | | | | | | | | | | | | | | |
| | 2.10 | % | | | 0.44 | % | | | 0.33 | % | | | 6.08 | % | | | 21 | % | | $ | 236,987 | |
| | 1.81 | % | | | 0.42 | % | | | 0.37 | % | | | 23.09 | % | | | 21 | % | | $ | 287,423 | |
| | 1.72 | % | | | 0.44 | % | | | 0.37 | % | | | (11.51 | )% | | | 26 | % | | $ | 806,152 | |
| | 1.58 | % | | | 0.49 | % | | | 0.37 | % | | | 7.98 | % | | | 16 | % | | $ | 818,335 | |
| | 1.66 | % | | | 0.55 | % | | | 0.41 | % | | | 19.28 | % | | | 23 | % | | $ | 693,648 | |
| | 1.75 | % | | | 0.67 | % | | | 0.52 | % | | | 9.94 | % | | | 19 | % | | $ | 754,088 | |
| | | | | | | | | | | | | | | | | | | | | | |
| | 1.75 | % | | | 0.78 | % | | | 0.67 | % | | | 5.92 | % | | | 21 | % | | $ | 107,520 | |
| | 1.37 | % | | | 0.76 | % | | | 0.72 | % | | | 22.72 | % | | | 21 | % | | $ | 121,028 | |
| | 1.39 | % | | | 0.78 | % | | | 0.72 | % | | | (11.86 | )% | | | 26 | % | | $ | 185,008 | |
| | 1.23 | % | | | 0.81 | % | | | 0.72 | % | | | 7.64 | % | | | 16 | % | | $ | 226,405 | |
| | 1.28 | % | | | 0.85 | % | | | 0.75 | % | | | 18.79 | % | | | 23 | % | | $ | 202,276 | |
| | 1.38 | % | | | 0.94 | % | | | 0.87 | % | | | 9.59 | % | | | 19 | % | | $ | 141,212 | |
The accompanying notes are an integral part of these financial statements.
| | | | |
| 70 | | Wells Fargo Target Date Funds | | Financial highlights |
| | | | | | | | | | | | | | | | | | | | | | | | |
| Target 2055 Fund | | Beginning
net asset
value per
share | | | Net
investment
income | | | Net realized
and unrealized
gains (losses)
on investments | | | Distributions
from net
investment
income | | | Distributions
from net
realized gains | | | Ending
net asset
value per
share | |
Class A | | | | | | | | | | | | | | | | | | | | | | | | |
Six months ended August 31, 2017 (unaudited) | | $ | 13.91 | | | | 0.12 | | | | 0.69 | | | | (0.07 | ) | | | 0.00 | | | $ | 14.65 | |
Year ended February 28, 2017 | | $ | 11.56 | | | | 0.14 | | | | 2.44 | | | | (0.23 | ) | | | 0.00 | | | $ | 13.91 | |
Year ended February 29, 2016 | | $ | 13.28 | | | | 0.14 | 4 | | | (1.71 | ) | | | (0.12 | ) | | | (0.03 | ) | | $ | 11.56 | |
Year ended February 28, 2015 | | $ | 12.63 | | | | 0.13 | | | | 0.80 | | | | (0.14 | ) | | | (0.14 | ) | | $ | 13.28 | |
Year ended February 28, 2014 | | $ | 10.90 | | | | 0.14 | | | | 1.87 | | | | (0.13 | ) | | | (0.15 | ) | | $ | 12.63 | |
Year ended February 28, 20135 | | $ | 10.19 | | | | 0.03 | 4 | | | 0.72 | | | | (0.04 | ) | | | 0.00 | | | $ | 10.90 | |
Class R | | | | | | | | | | | | | | | | | | | | | | | | |
Six months ended August 31, 2017 (unaudited) | | $ | 13.76 | | | | 0.10 | | | | 0.68 | | | | (0.05 | ) | | | 0.00 | | | $ | 14.49 | |
Year ended February 28, 2017 | | $ | 11.45 | | | | 0.10 | | | | 2.41 | | | | (0.20 | ) | | | 0.00 | | | $ | 13.76 | |
Year ended February 29, 2016 | | $ | 13.16 | | | | 0.12 | | | | (1.71 | ) | | | (0.09 | ) | | | (0.03 | ) | | $ | 11.45 | |
Year ended February 28, 2015 | | $ | 12.51 | | | | 0.11 | | | | 0.79 | | | | (0.11 | ) | | | (0.14 | ) | | $ | 13.16 | |
Year ended February 28, 20146 | | $ | 11.01 | | | | 0.06 | | | | 1.65 | | | | (0.06 | ) | | | (0.15 | ) | | $ | 12.51 | |
Class R4 | | | | | | | | | | | | | | | | | | | | | | | | |
Six months ended August 31, 2017 (unaudited) | | $ | 13.94 | | | | 0.14 | 4 | | | 0.70 | | | | (0.09 | ) | | | 0.00 | | | $ | 14.69 | |
Year ended February 28, 2017 | | $ | 11.59 | | | | 0.18 | | | | 2.44 | | | | (0.27 | ) | | | 0.00 | | | $ | 13.94 | |
Year ended February 29, 2016 | | $ | 13.32 | | | | 0.20 | | | | (1.74 | ) | | | (0.16 | ) | | | (0.03 | ) | | $ | 11.59 | |
Year ended February 28, 2015 | | $ | 12.65 | | | | 0.18 | | | | 0.81 | | | | (0.18 | ) | | | (0.14 | ) | | $ | 13.32 | |
Year ended February 28, 2014 | | $ | 10.91 | | | | 0.15 | | | | 1.90 | | | | (0.16 | ) | | | (0.15 | ) | | $ | 12.65 | |
Year ended February 28, 20135 | | $ | 10.19 | | | | 0.04 | 4 | | | 0.72 | | | | (0.04 | ) | | | 0.00 | | | $ | 10.91 | |
Class R67 | | | | | | | | | | | | | | | | | | | | | | | | |
Six months ended August 31, 2017 (unaudited) | | $ | 13.91 | | | | 0.15 | 4 | | | 0.69 | | | | (0.09 | ) | | | 0.00 | | | $ | 14.66 | |
Year ended February 28, 2017 | | $ | 11.57 | | | | 0.23 | 4 | | | 2.40 | | | | (0.29 | ) | | | 0.00 | | | $ | 13.91 | |
Year ended February 29, 2016 | | $ | 13.29 | | | | 0.21 | | | | (1.72 | ) | | | (0.18 | ) | | | (0.03 | ) | | $ | 11.57 | |
Year ended February 28, 2015 | | $ | 12.63 | | | | 0.19 | | | | 0.80 | | | | (0.19 | ) | | | (0.14 | ) | | $ | 13.29 | |
Year ended February 28, 2014 | | $ | 10.90 | | | | 0.19 | | | | 1.87 | | | | (0.18 | ) | | | (0.15 | ) | | $ | 12.63 | |
Year ended February 28, 2013 | | $ | 10.08 | | | | 0.15 | | | | 0.83 | | | | (0.16 | ) | | | 0.00 | | | $ | 10.90 | |
Administrator Class | | | | | | | | | | | | | | | | | | | | | | | | |
Six months ended August 31, 2017 (unaudited) | | $ | 13.91 | | | | 0.12 | | | | 0.70 | | | | (0.07 | ) | | | 0.00 | | | $ | 14.66 | |
Year ended February 28, 2017 | | $ | 11.57 | | | | 0.17 | 4 | | | 2.41 | | | | (0.24 | ) | | | 0.00 | | | $ | 13.91 | |
Year ended February 29, 2016 | | $ | 13.28 | | | | 0.17 | | | | (1.71 | ) | | | (0.14 | ) | | | (0.03 | ) | | $ | 11.57 | |
Year ended February 28, 2015 | | $ | 12.62 | | | | 0.14 | | | | 0.81 | | | | (0.15 | ) | | | (0.14 | ) | | $ | 13.28 | |
Year ended February 28, 2014 | | $ | 10.90 | | | | 0.14 | | | | 1.87 | | | | (0.14 | ) | | | (0.15 | ) | | $ | 12.62 | |
Year ended February 28, 2013 | | $ | 10.06 | | | | 0.14 | 4 | | | 0.81 | | | | (0.11 | ) | | | 0.00 | | | $ | 10.90 | |
| 1 | Includes net expenses allocated from the affiliated Master Portfolios in which the Fund invests. |
| | | | | | | | | | | | | | | | | | | | | | | | |
| | | Six months ended August 31, 2017 (unaudited) | | | Year ended February 28, 2017 | | | Year ended February 29, 2016 | | | Year ended February 28 | |
| | | | | | 2015 | | | 2014 | | | 2013 | |
| | | | | | | | |
Class A | | | 0.19 | % | | | 0.17 | % | | | 0.17 | % | | | 0.16 | % | | | 0.18 | % | | | 0.27 | %5 |
Class R | | | 0.19 | | | | 0.17 | | | | 0.20 | | | | 0.16 | | | | 0.18 | 6 | | | N/A | |
Class R4 | | | 0.19 | | | | 0.17 | | | | 0.16 | | | | 0.16 | | | | 0.18 | | | | 0.27 | 5 |
Class R67 | | | 0.19 | | | | 0.16 | | | | 0.16 | | | | 0.16 | | | | 0.18 | | | | 0.27 | |
Administrator Class | | | 0.19 | | | | 0.17 | | | | 0.16 | | | | 0.16 | | | | 0.18 | | | | 0.27 | |
| 2 | Total return calculations do not include any sales charges. Returns for periods of less than one year are not annualized. |
| 3 | Portfolio turnover rate is calculated by aggregating the results of multiplying the Fund’s investment percentage in the respective affiliated Master Portfolios by the corresponding affiliated Master Portfolio’s portfolio turnover rate. |
| 4 | Calculated based upon average shares outstanding |
| 5 | For the period from November 30, 2012 (commencement of class operations) to February 28, 2013 |
| 6 | For the period from June 28, 2013 (commencement of class operations) to February 28, 2014 |
| 7 | On June 1, 2013, Institutional Class was renamed Class R6. |
The accompanying notes are an integral part of these financial statements.
| | | | | | |
| Financial highlights | | Wells Fargo Target Date Funds | | | 71 | |
| | | | | | | | | | | | | | | | | | | | | | |
| Ratio to average net assets (annualized) | | | Total
return2 | | | Portfolio
turnover
rate3 | | | Net assets at
end of period
(000s omitted) | |
Net investment
income | | | Gross
expenses1 | | | Net
expenses1 | | | | |
| | | | | | | | | | | | | | | | | | | | | | |
| | 1.64 | % | | | 0.97 | % | | | 0.78 | % | | | 5.79 | % | | | 21 | % | | $ | 9,574 | |
| | 1.13 | % | | | 0.91 | % | | | 0.83 | % | | | 22.45 | % | | | 21 | % | | $ | 9,270 | |
| | 1.15 | % | | | 0.94 | % | | | 0.84 | % | | | (11.93 | )% | | | 26 | % | | $ | 8,940 | |
| | 0.97 | % | | | 1.07 | % | | | 0.88 | % | | | 7.46 | % | | | 16 | % | | $ | 565 | |
| | 1.10 | % | | | 1.19 | % | | | 0.88 | % | | | 18.69 | % | | | 23 | % | | $ | 66 | |
| | 1.05 | % | | | 1.44 | % | | | 0.88 | % | | | 7.39 | % | | | 19 | % | | $ | 14 | |
| | | | | | | | | | | | | | | | | | | | | | |
| | 1.39 | % | | | 1.23 | % | | | 1.03 | % | | | 5.69 | % | | | 21 | % | | $ | 44 | |
| | 0.98 | % | | | 1.16 | % | | | 1.08 | % | | | 22.04 | % | | | 21 | % | | $ | 40 | |
| | 0.98 | % | | | 1.24 | % | | | 1.09 | % | | | (12.16 | )% | | | 26 | % | | $ | 42 | |
| | 0.83 | % | | | 1.36 | % | | | 1.13 | % | | | 7.24 | % | | | 16 | % | | $ | 31 | |
| | 0.73 | % | | | 1.48 | % | | | 1.13 | % | | | 15.66 | % | | | 23 | % | | $ | 29 | |
| | | | | | | | | | | | | | | | | | | | | | |
| | 1.97 | % | | | 0.70 | % | | | 0.49 | % | | | 6.00 | % | | | 21 | % | | $ | 25,993 | |
| | 1.32 | % | | | 0.64 | % | | | 0.52 | % | | | 22.78 | % | | | 21 | % | | $ | 43,147 | |
| | 1.61 | % | | | 0.66 | % | | | 0.52 | % | | | (11.70 | )% | | | 26 | % | | $ | 27,193 | |
| | 1.41 | % | | | 0.74 | % | | | 0.52 | % | | | 7.92 | % | | | 16 | % | | $ | 33,651 | |
| | 1.40 | % | | | 0.86 | % | | | 0.52 | % | | | 19.06 | % | | | 23 | % | | $ | 20,591 | |
| | 1.51 | % | | | 1.09 | % | | | 0.52 | % | | | 7.51 | % | | | 19 | % | | $ | 33 | |
| | | | | | | | | | | | | | | | | | | | | | |
| | 2.09 | % | | | 0.55 | % | | | 0.32 | % | | | 6.08 | % | | | 21 | % | | $ | 52,584 | |
| | 1.79 | % | | | 0.47 | % | | | 0.37 | % | | | 22.97 | % | | | 21 | % | | $ | 65,516 | |
| | 1.72 | % | | | 0.51 | % | | | 0.37 | % | | | (11.52 | )% | | | 26 | % | | $ | 161,764 | |
| | 1.55 | % | | | 0.59 | % | | | 0.37 | % | | | 8.01 | % | | | 16 | % | | $ | 126,822 | |
| | 1.63 | % | | | 0.75 | % | | | 0.40 | % | | | 19.18 | % | | | 23 | % | | $ | 74,427 | |
| | 1.69 | % | | | 1.17 | % | | | 0.52 | % | | | 9.90 | % | | | 19 | % | | $ | 36,345 | |
| | | | | | | | | | | | | | | | | | | | | | |
| | 1.77 | % | | | 0.89 | % | | | 0.67 | % | | | 5.90 | % | | | 21 | % | | $ | 8,926 | |
| | 1.34 | % | | | 0.83 | % | | | 0.72 | % | | | 22.50 | % | | | 21 | % | | $ | 9,700 | |
| | 1.37 | % | | | 0.85 | % | | | 0.72 | % | | | (11.75 | )% | | | 26 | % | | $ | 14,747 | |
| | 1.16 | % | | | 0.91 | % | | | 0.72 | % | | | 7.66 | % | | | 16 | % | | $ | 12,493 | |
| | 1.28 | % | | | 1.05 | % | | | 0.75 | % | | | 18.70 | % | | | 23 | % | | $ | 8,462 | |
| | 1.36 | % | | | 1.45 | % | | | 0.87 | % | | | 9.52 | % | | | 19 | % | | $ | 4,739 | |
The accompanying notes are an integral part of these financial statements.
| | | | |
| 72 | | Wells Fargo Target Date Funds | | Financial highlights |
| | | | | | | | | | | | | | | | | | | | |
| Target 2060 Fund | | Beginning
net asset
value per
share | | | Net
investment
income | | | Net realized
and unrealized
gains (losses)
on investments | | | Distributions
from net
investment
income | | | Ending
net asset
value per
share | |
Class A | | | | | | | | | | | | | | | | | | | | |
Six months ended August 31, 2017 (unaudited) | | $ | 10.69 | | | | 0.09 | | | | 0.53 | | | | (0.04 | ) | | $ | 11.27 | |
Year ended February 28, 2017 | | $ | 8.84 | | | | 0.09 | 4 | | | 1.86 | | | | (0.10 | ) | | $ | 10.69 | |
Year ended February 29, 20165 | | $ | 10.00 | | | | 0.06 | | | | (1.11 | ) | | | (0.11 | ) | | $ | 8.84 | |
Class C | | | | | | | | | | | | | | | | | | | | |
Six months ended August 31, 2017 (unaudited) | | $ | 10.71 | | | | 0.05 | | | | 0.53 | | | | (0.00 | )6 | | $ | 11.29 | |
Year ended February 28, 2017 | | $ | 8.90 | | | | 0.04 | | | | 1.84 | | | | (0.07 | ) | | $ | 10.71 | |
Year ended February 29, 20165 | | $ | 10.00 | | | | 0.01 | | | | (1.11 | ) | | | 0.00 | | | $ | 8.90 | |
Class R | | | | | | | | | | | | | | | | | | | | |
Six months ended August 31, 2017 (unaudited) | | $ | 10.53 | | | | 0.08 | | | | 0.52 | | | | (0.03 | ) | | $ | 11.10 | |
Year ended February 28, 2017 | | $ | 8.84 | | | | 0.09 | 4 | | | 1.80 | | | | (0.20 | ) | | $ | 10.53 | |
Year ended February 29, 20165 | | $ | 10.00 | | | | 0.05 | | | | (1.11 | ) | | | (0.10 | ) | | $ | 8.84 | |
Class R4 | | | | | | | | | | | | | | | | | | | | |
Six months ended August 31, 2017 (unaudited) | | $ | 10.88 | | | | 0.11 | | | | 0.55 | | | | (0.06 | ) | | $ | 11.48 | |
Year ended February 28, 2017 | | $ | 8.97 | | | | 0.12 | 4 | | | 1.89 | | | | (0.10 | ) | | $ | 10.88 | |
Year ended February 29, 20165 | | $ | 10.00 | | | | 0.08 | 4 | | | (1.11 | ) | | | 0.00 | | | $ | 8.97 | |
Class R6 | | | | | | | | | | | | | | | | | | | | |
Six months ended August 31, 2017 (unaudited) | | $ | 10.86 | | | | 0.12 | | | | 0.53 | | | | (0.06 | ) | | $ | 11.45 | |
Year ended February 28, 2017 | | $ | 8.95 | | | | 0.13 | 4 | | | 1.90 | | | | (0.12 | ) | | $ | 10.86 | |
Year ended February 29, 20165 | | $ | 10.00 | | | | 0.09 | 4 | | | (1.12 | ) | | | (0.02 | ) | | $ | 8.95 | |
Administrator Class | | | | | | | | | | | | | | | | | | | | |
Six months ended August 31, 2017 (unaudited) | | $ | 10.74 | | | | 0.10 | | | | 0.53 | | | | (0.05 | ) | | $ | 11.32 | |
Year ended February 28, 2017 | | $ | 8.89 | | | | 0.10 | 4 | | | 1.88 | | | | (0.13 | ) | | $ | 10.74 | |
Year ended February 29, 20165 | | $ | 10.00 | | | | 0.07 | | | | (1.12 | ) | | | (0.06 | ) | | $ | 8.89 | |
| 1 | Ratios include net expenses allocated from the affiliated Master Portfolios which were as follows: |
| | | | | | | | | | | | | | | | | | | | | | | | |
| | | Six months ended August 31, 2017 (unaudited) | | | Year ended
February 28, 2017 | | | Year ended
February 29, 20165 | | | | | | | | | | |
Class A | | | 0.19 | % | | | 0.17 | % | | | 0.15 | % | | | | | | | | | | | | |
Class C | | | 0.19 | | | | 0.16 | | | | 0.16 | | | | | | | | | | | | | |
Class R | | | 0.20 | | | | 0.19 | | | | 0.17 | | | | | | | | | | | | | |
Class R4 | | | 0.19 | | | | 0.17 | | | | 0.16 | | | | | | | | | | | | | |
Class R6 | | | 0.19 | | | | 0.17 | | | | 0.16 | | | | | | | | | | | | | |
Administrator Class | | | 0.19 | | | | 0.17 | | | | 0.16 | | | | | | | | | | | | | |
| 2 | Total return calculations do not include any sales charges. Returns for periods of less than one year are not annualized. |
| 3 | Portfolio turnover rate is calculated by aggregating the results of multiplying the Fund’s investment percentage in the respective affiliated Master Portfolios by the corresponding affiliated Master Portfolio’s portfolio turnover rate. |
| 4 | Calculated based upon average shares outstanding |
| 5 | For the period from June 30, 2015 (commencement of Fund operations) to February 29, 2016 |
| 6 | Amount is less than $0.005. |
The accompanying notes are an integral part of these financial statements.
| | | | | | |
| Financial highlights | | Wells Fargo Target Date Funds | | | 73 | |
| | | | | | | | | | | | | | | | | | | | | | |
| Ratio to average net assets (annualized) | | | Total
return2 | | | Portfolio
turnover
rate3 | | | Net assets at
end of period
(000s omitted) | |
Net investment
income | | | Gross
expenses1 | | | Net
expenses1 | | | | |
| | | | | | | | | | | | | | | | | | | | | | |
| | 1.62 | % | | | 1.42 | % | | | 0.78 | % | | | 5.83 | % | | | 21 | % | | $ | 650 | |
| | 0.90 | % | | | 3.21 | % | | | 0.83 | % | | | 22.23 | % | | | 21 | % | | $ | 671 | |
| | 0.97 | % | | | 14.47 | % | | | 0.83 | % | | | (10.59 | )% | | | 26 | % | | $ | 100 | |
| | | | | | | | | | | | | | | | | | | | | | |
| | 0.89 | % | | | 2.16 | % | | | 1.53 | % | | | 5.45 | % | | | 21 | % | | $ | 257 | |
| | 0.39 | % | | | 5.30 | % | | | 1.58 | % | | | 21.22 | % | | | 21 | % | | $ | 252 | |
| | 0.21 | % | | | 15.14 | % | | | 1.58 | % | | | (11.00 | )% | | | 26 | % | | $ | 173 | |
| | | | | | | | | | | | | | | | | | | | | | |
| | 1.39 | % | | | 1.67 | % | | | 1.03 | % | | | 5.71 | % | | | 21 | % | | $ | 137 | |
| | 0.89 | % | | | 4.69 | % | | | 1.08 | % | | | 21.73 | % | | | 21 | % | | $ | 127 | |
| | 0.72 | % | | | 14.73 | % | | | 1.08 | % | | | (10.66 | )% | | | 26 | % | | $ | 89 | |
| | | | | | | | | | | | | | | | | | | | | | |
| | 1.97 | % | | | 1.14 | % | | | 0.48 | % | | | 6.04 | % | | | 21 | % | | $ | 6,590 | |
| | 1.14 | % | | | 1.88 | % | | | 0.52 | % | | | 22.45 | % | | | 21 | % | | $ | 6,443 | |
| | 1.29 | % | | | 14.19 | % | | | 0.52 | % | | | (10.30 | )% | | | 26 | % | | $ | 195 | |
| | | | | | | | | | | | | | | | | | | | | | |
| | 2.11 | % | | | 0.99 | % | | | 0.32 | % | | | 6.03 | % | | | 21 | % | | $ | 12,428 | |
| | 1.31 | % | | | 1.82 | % | | | 0.37 | % | | | 22.75 | % | | | 21 | % | | $ | 12,518 | |
| | 1.41 | % | | | 14.05 | % | | | 0.37 | % | | | (10.30 | )% | | | 26 | % | | $ | 573 | |
| | | | | | | | | | | | | | | | | | | | | | |
| | 1.73 | % | | | 1.34 | % | | | 0.67 | % | | | 5.85 | % | | | 21 | % | | $ | 4,985 | |
| | 0.98 | % | | | 2.31 | % | | | 0.72 | % | | | 22.38 | % | | | 21 | % | | $ | 4,427 | |
| | 1.10 | % | | | 14.35 | % | | | 0.72 | % | | | (10.50 | )% | | | 26 | % | | $ | 359 | |
The accompanying notes are an integral part of these financial statements.
| | | | |
| 74 | | Wells Fargo Target Date Funds | | Notes to financial statements (unaudited) |
1. ORGANIZATION
Wells Fargo Funds Trust (the “Trust”), a Delaware statutory trust organized on March 10, 1999, is an open-end management investment company registered under the Investment Company Act of 1940, as amended (the “1940 Act”). As an investment company, the Trust follows the accounting and reporting guidance in Financial Accounting Standards Board Accounting Standards Codification Topic 946, Financial Services – Investment Companies. These financial statements report on the following funds: Wells Fargo Target Today Fund (“Target Today Fund”), Wells FargoTarget 2010 Fund (“Target 2010 Fund”), Wells FargoTarget 2015 Fund (“Target 2015 Fund”), Wells Fargo Target 2020 Fund (“Target 2020 Fund” ), Wells Fargo Target 2025 Fund (“Target 2025 Fund” ), Wells Fargo Target 2030 Fund (“Target 2030 Fund” ), Wells Fargo Target 2035 Fund (“Target 2035 Fund” ), Wells Fargo Target 2040 Fund (“Target 2040 Fund” ), Wells Fargo Target 2045 Fund (“Target 2045 Fund” ), Wells Fargo Target 2050 Fund (“Target 2050 Fund” ), Wells Fargo Target 2055 Fund (“Target 2055 Fund” ), and Wells Fargo Target 2060 Fund (“Target 2060 Fund” ) (each, a “Fund”, collectively, the “Funds”). Each Fund is a diversified series of the Trust.
Effective July 14, 2017, each Fund was renamed with new underlying strategies. The name changes of each Fund were as follows:
| | |
| Former fund name | | New fund name |
Wells Fargo Dow Jones Target Today Fund | | Wells Fargo Target Today Fund |
Wells Fargo Dow Jones Target 2010 Fund | | Wells Fargo Target 2010 Fund |
Wells Fargo Dow Jones Target 2015 Fund | | Wells Fargo Target 2015 Fund |
Wells Fargo Dow Jones Target 2020 Fund | | Wells Fargo Target 2020 Fund |
Wells Fargo Dow Jones Target 2025 Fund | | Wells Fargo Target 2025 Fund |
Wells Fargo Dow Jones Target 2030 Fund | | Wells Fargo Target 2030 Fund |
Wells Fargo Dow Jones Target 2035 Fund | | Wells Fargo Target 2035 Fund |
Wells Fargo Dow Jones Target 2040 Fund | | Wells Fargo Target 2040 Fund |
Wells Fargo Dow Jones Target 2045 Fund | | Wells Fargo Target 2045 Fund |
Wells Fargo Dow Jones Target 2050 Fund | | Wells Fargo Target 2050 Fund |
Wells Fargo Dow Jones Target 2055 Fund | | Wells Fargo Target 2055 Fund |
Wells Fargo Dow Jones Target 2060 Fund | | Wells Fargo Target 2060 Fund |
Effective at the close of business on December 5, 2016, Class B shares of Target Today Fund, Target 2010 Fund, Target 2020 Fund, Target 2030 Fund and Target 2040 Fund were converted to Class A shares and are no longer offered by each Fund. Information for Class B shares reflected in the financial statements represents activity through December 5, 2016.
Each Fund seeks to achieve its investment objective by investing in multiple diversified portfolios (each, an “affiliated Master Portfolio”, collectively, the “affiliated Master Portfolios”) of Wells Fargo Master Trust, a registered open-end management investment company. Each affiliated Master Portfolio directly acquires portfolio securities, and a Fund investing in an affiliated Master Portfolio acquires an indirect interest in those securities. Each Fund accounts for its investment in the affiliated Master Portfolios as partnership investments and records on a daily basis its share of the affiliated Master Portfolio’s income, expense and realized and unrealized gains and losses. The financial statements of each affiliated Master Portfolios
| | | | | | |
| Notes to financial statements (unaudited) | | Wells Fargo Target Date Funds | | | 75 | |
for the six months ended August 31, 2017 are included in this report and should be read in conjunction with each Fund’s financial statements. As of August 31, 2017, the Funds own the following percentages of the affiliated Master Portfolios:
| | | | | | | | | | | | | | | | | | | | | | | | | | | | | | | | | | | | | | | | | | | | | | | | |
| | | Target
Today
Fund | | | Target
2010
Fund | | | Target
2015
Fund | | | Target
2020
Fund | | | Target
2025
Fund | | | Target
2030
Fund | | | Target
2035
Fund | | | Target
2040
Fund | | | Target
2045
Fund | | | Target
2050
Fund | | | Target
2055
Fund | | | Target
2060
Fund | |
Wells Fargo Bloomberg Barclays US Aggregate ex-Corporate Portfolio | | | 5 | % | | | 5 | % | | | 6 | % | | | 27 | % | | | 13 | % | | | 22 | % | | | 7 | % | | | 9 | % | | | 2 | % | | | 3 | % | | | 1 | % | | | 0 | %* |
Wells Fargo Emerging Markets Bond Portfolio | | | 5 | | | | 6 | | | | 6 | | | | 27 | | | | 13 | | | | 22 | | | | 7 | | | | 9 | | | | 2 | | | | 3 | | | | 0 | * | | | 0 | * |
Wells Fargo Factor Enhanced Emerging Markets Portfolio | | | 0 | * | | | 1 | | | | 2 | | | | 11 | | | | 8 | | | | 21 | | | | 11 | | | | 22 | | | | 8 | | | | 13 | | | | 2 | | | | 1 | |
Wells Fargo Factor Enhanced International Portfolio | | | 0 | * | | | 1 | | | | 2 | | | | 11 | | | | 8 | | | | 21 | | | | 11 | | | | 22 | | | | 8 | | | | 13 | | | | 2 | | | | 1 | |
Wells Fargo Factor Enhanced Large Cap Portfolio | | | 1 | | | | 2 | | | | 2 | | | | 12 | | | | 9 | | | | 21 | | | | 10 | | | | 21 | | | | 7 | | | | 12 | | | | 2 | | | | 1 | |
Wells Fargo Factor Enhanced Small Cap Portfolio | | | 1 | | | | 1 | | | | 2 | | | | 12 | | | | 9 | | | | 21 | | | | 10 | | | | 21 | | | | 8 | | | | 12 | | | | 2 | | | | 1 | |
Wells Fargo High Yield Corporate Bond Portfolio | | | 5 | | | | 5 | | | | 6 | | | | 27 | | | | 13 | | | | 22 | | | | 7 | | | | 9 | | | | 2 | | | | 3 | | | | 1 | | | | 0 | * |
Wells Fargo Investment Grade Corporate Bond Portfolio | | | 5 | | | | 6 | | | | 5 | | | | 27 | | | | 13 | | | | 22 | | | | 7 | | | | 9 | | | | 2 | | | | 3 | | | | 1 | | | | 0 | * |
Wells Fargo Strategic Retirement Bond Portfolio | | | 13 | | | | 14 | | | | 16 | | | | 46 | | | | 9 | | | | 2 | | | | N/A | | | | N/A | | | | N/A | | | | N/A | | | | N/A | | | | N/A | |
Wells Fargo U.S. REIT Portfolio | | | 7 | | | | 9 | | | | 13 | | | | 52 | | | | 14 | | | | 5 | | | | N/A | | | | N/A | | | | N/A | | | | N/A | | | | N/A | | | | N/A | |
| * | The amount owned is less than 1%. |
Prior to July 14, 2017, each Fund primarily invested in three affiliated Master Portfolios: Wells Fargo Diversified Fixed Income Portfolio, Wells Fargo Diversified Stock Portfolio and Wells Fargo Short-Term Investment Portfolio.
2. SIGNIFICANT ACCOUNTING POLICIES
The following significant accounting policies, which are consistently followed in the preparation of the financial statements of each Fund, are in conformity with U.S. generally accepted accounting principles which require management to make estimates and assumptions that affect the reported amounts of assets and liabilities, disclosure of contingent assets and liabilities at the date of the financial statements, and the reported amounts of revenues and expenses during the reporting period. Actual results could differ from those estimates.
Securities valuation
All investments are valued each business day as of the close of regular trading on the New York Stock Exchange (generally 4 p.m. Eastern Time), although the Funds may deviate from this calculation time under unusual or unexpected circumstances.
Investments in the affiliated Master Portfolios are valued daily based on each Fund’s proportionate share of each affiliated Master Portfolio’s net assets, which are also valued daily. Securities held in the affiliated Master Portfolios are valued as discussed in the Notes to Financial Statements of the affiliated Master Portfolios, which are included elsewhere in this report.
Security transactions and income recognition
Securities transactions are recorded on a trade date basis in each affiliated Master Portfolio. Realized gains or losses in each affiliated Master Portfolio are recorded on the basis of identified cost.
Interest income is accrued daily and bond discounts are accreted and premiums are amortized daily based on the effective interest method by each affiliated Master Portfolio. To the extent debt obligations are placed on non-accrual status, any related interest income may be reduced by writing off interest receivables when the collection of all or a portion of interest has been determined to be doubtful based on consistently applied procedures and the fair value has decreased. If the issuer subsequently resumes interest payments or when the collectability of interest is reasonably assured, the debt obligation is removed from non-accrual status.
| | | | |
| 76 | | Wells Fargo Target Date Funds | | Notes to financial statements (unaudited) |
Dividend income in each affiliated Master Portfolio is recognized on the ex-dividend date, except for certain dividends from foreign securities which are recorded as soon as the custodian verifies the ex-dividend date.
Income from foreign securities is recorded net of foreign taxes withheld where recovery of such taxes is not assured.
Each Fund records daily its proportionate share of each affiliated Master Portfolio’s interest and dividend income and realized and unrealized gains or losses.
Distributions to shareholders
Distributions to shareholders from net investment income and net realized gains, if any, are recorded on the ex-dividend date. Such distributions are determined in accordance with income tax regulations and may differ from U.S. generally accepted accounting principles. Dividend sources are estimated at the time of declaration. The tax character of distributions is determined as of the Funds’ fiscal year end. Therefore, a portion of each Fund’s distributions made prior the Fund’s fiscal year end may be categorized as a tax return of capital.
Federal and other taxes
Each Fund is treated as a separate entity for federal income tax purposes. Each Fund intends to continue to qualify as a regulated investment company by distributing substantially all of its investment company taxable income and any net realized capital gains (after reduction for capital loss carryforwards) sufficient to relieve it from all, or substantially all, federal income taxes. Accordingly, no provision for federal income taxes was required.
Each Fund’s income and federal excise tax returns and all financial records supporting those returns for the prior three fiscal years are subject to examination by the federal and Delaware revenue authorities. Management has analyzed each Fund’s tax positions taken on federal, state, and foreign tax returns for all open tax years and does not believe that there are any uncertain tax positions that require recognition of a tax liability.
As of August 31, 2017, the aggregate cost of all investments for federal income tax purposes and the unrealized gains (losses) were as follows:
| | | | | | | | | | | | | | | | |
| | | Tax cost | | | Gross
unrealized
gains | | | Gross
unrealized
losses | | | Net unrealized gains (losses) | |
Target Today Fund | | $ | 142,011,115 | | | $ | 21,717,414 | | | $ | 0 | | | $ | 21,717,414 | |
Target 2010 Fund | | | 160,748,315 | | | | 36,152,312 | | | | 0 | | | | 36,152,312 | |
Target 2015 Fund | | | 183,725,618 | | | | 44,490,094 | | | | 0 | | | | 44,490,094 | |
Target 2020 Fund | | | 1,010,763,510 | | | | 134,526,465 | | | | 0 | | | | 134,526,465 | |
Target 2025 Fund | | | 484,393,878 | | | | 167,374,813 | | | | 0 | | | | 167,374,813 | |
Target 2030 Fund | | | 1,238,073,556 | | | | 102,875,533 | | | | 0 | | | | 102,875,533 | |
Target 2035 Fund | | | 536,491,861 | | | | 47,883,358 | | | | 0 | | | | 47,883,358 | |
Target 2040 Fund | | | 1,107,865,304 | | | | 7,364,743 | | | | 0 | | | | 7,364,743 | |
Target 2045 Fund | | | 379,333,834 | | | | 0 | | | | (2,367,328 | ) | | | (2,367,328 | ) |
Target 2050 Fund | | | 575,149,235 | | | | 27,685,673 | | | | 0 | | | | 27,685,673 | |
Target 2055 Fund | | | 108,713,170 | | | | 0 | | | | (6,856,567 | ) | | | (6,856,567 | ) |
Target 2060 Fund | | | 31,775,927 | | | | 0 | | | | (6,519,153 | ) | | | (6,519,153 | ) |
As of February 28, 2017, capital loss carryforwards available to offset future net realized capital gains were as follows:
| | | | | | | | |
| | | No expiration | |
| | | Short-term | | | Long-term | |
Target 2055 Fund | | $ | 1,822,061 | | | $ | 0 | |
Target 2060 Fund | | | 41,819 | | | | 53,116 | |
| | | | | | |
| Notes to financial statements (unaudited) | | Wells Fargo Target Date Funds | | | 77 | |
At February 28, 2017, current year deferred post-October capital losses and late-year ordinary losses, which were recognized on the first day of the current fiscal year were as follows:
| | | | | | | | | | | | |
| | | Deferred post-October
capital losses | | | Late-year
ordinary losses
deferred | |
| | | Short-term | | | Long-term | | |
Target Today Fund | | $ | 0 | | | $ | 0 | | | $ | 763,398 | |
Target 2010 Fund | | | 0 | | | | 0 | | | | 362,770 | |
Target 2015 Fund | | | 0 | | | | 0 | | | | 777,441 | |
Target 2020 Fund | | | 0 | | | | 0 | | | | 3,692,583 | |
Target 2025 Fund | | | 0 | | | | 0 | | | | 1,451,620 | |
Target 2030 Fund | | | 0 | | | | 0 | | | | 822,110 | |
Target 2060 Fund | | | 43,798 | | | | 64,147 | | | | 3,362 | |
Class allocations
The separate classes of shares offered by each Fund differ principally in applicable sales charges, distribution, shareholder servicing, and administration fees. Class specific expenses are charged directly to that share class. Investment income, common expenses, and realized and unrealized gains (losses) on investments are allocated daily to each class of shares based on the relative proportion of net assets of each class.
3. FAIR VALUATION MEASUREMENTS
As of August 31, 2017, each Fund’s investment in an affiliated Master Portfolio was measured at fair value using the net asset value per share (or its equivalent) as a practical expedient. The aggregate fair value of affiliated Master Portfolios held in each Fund was as follows:
| | | | |
| | | Aggregate
fair value of affiliated
Master Portfolios | |
Target Today Fund | | $ | 163,728,529 | |
Target 2010 Fund | | | 196,900,627 | |
Target 2015 Fund | | | 228,215,712 | |
Target 2020 Fund | | | 1,145,289,975 | |
Target 2025 Fund | | | 651,768,591 | |
Target 2030 Fund | | | 1,340,949,089 | |
Target 2035 Fund | | | 584,375,219 | |
Target 2040 Fund | | | 1,115,230,047 | |
Target 2045 Fund | | | 376,966,506 | |
Target 2050 Fund | | | 602,834,908 | |
Target 2055 Fund | | | 101,856,603 | |
Target 2060 Fund | | | 25,256,774 | |
Each affiliated Master Portfolio does not have a redemption period notice, can be redeemed daily and does not have any unfunded commitments.
| | | | |
| 78 | | Wells Fargo Target Date Funds | | Notes to financial statements (unaudited) |
The investment objective of each affiliated Master Portfolio is as follows:
| | |
| Affiliated Master Portfolio | | Investment objective |
Wells Fargo Bloomberg Barclays US Aggregate ex-Corporate Portfolio | | Seeks to replicate the total return of the Bloomberg Barclays U.S. Aggregate ex-Corporate Index, before fees and expenses |
Wells Fargo Emerging Markets Bond Portfolio | | Seeks to replicate the total return of the JP Morgan EMBI Global Diversified Index, before fees and expenses |
Wells Fargo Factor Enhanced Emerging Markets Portfolio | | Seeks to replicate the total return of the Wells Fargo Factor Enhanced Emerging Markets Index, before fees and expenses |
Wells Fargo Factor Enhanced International Portfolio | | Seeks to replicate the total return of the Wells Fargo Factor Enhanced International Index, before fees and expenses. |
Wells Fargo Factor Enhanced Large Cap Portfolio | | Seeks to replicate the total return of the Wells Fargo Factor Enhanced Large Cap Index, before fees and expenses |
Wells Fargo Factor Enhanced Small Cap Portfolio | | Seeks to replicate the total return of the Wells Fargo Factor Enhanced Small Cap Index, before fees and expenses |
Wells Fargo High Yield Corporate Bond Portfolio | | Seeks to replicate the total return of the Wells Fargo High Yield Bond Index, before fees and expenses |
Wells Fargo Investment Grade Corporate Bond Portfolio | | Seeks to replicate the total return of the Wells Fargo Investment Grade Corporate Bond Index, before fees and expenses |
Wells Fargo Strategic Retirement Bond Portfolio | | Seeks to replicate the total return of a blended index that is weighted 50% to the Bloomberg Barclays U.S. Treasury Inflation-Linked 1-10 Year Bond Index and 50% to the Bloomberg Barclays U.S. Intermediate Government Bond Index, before fees and expenses |
Wells Fargo U.S. REIT Portfolio | | Seeks to replicate the total return of the Wells Fargo U.S. REIT Index, before fees and expenses |
4. TRANSACTIONS WITH AFFILIATES AND OTHER EXPENSES
Management fee
Wells Fargo Funds Management, LLC (“Funds Management”), an indirect wholly owned subsidiary of Wells Fargo & Company (“Wells Fargo”), is the manager of each Fund and provides advisory and fund-level administrative services under an investment management agreement. Under the investment management agreement, Funds Management is responsible for, among other services, implementing the investment objectives and strategies of each Fund, supervising the subadviser, providing fund-level administrative services in connection with each Fund’s operations, and providing any other fund-level administrative services reasonably necessary for the operation of each Fund. As compensation for its services under the investment management agreement, Funds Management is entitled to receive an annual management fee starting at 0.10% and declining to 0.08% as the average daily net assets of each Fund increase. Prior to July 14, 2017, Funds Management received a fee at an annual rate which started at 0.20% and declined to 0.18% as the average daily net assets of the Fund increased. For the six months ended August 31, 2017, the management fee was equivalent to an annual rate of 0.18% of each Fund’s average daily net assets, except for Target Today Fund and Target 2060 Fund which each incurred advisory fees equivalent to an annual rate of 0.19% and 0.17%, respectively, of its average daily net assets.
Funds Management also serves as the adviser to each affiliated Master Portfolio and is entitled to receive a fee from each affiliated Master Portfolio for those services.
Funds Management has retained the services of a subadviser to provide daily portfolio management to the Funds. The fees for subadvisory services are borne by Funds Management. Wells Capital Management Incorporated, an affiliate of Funds Management and an indirect, wholly owned subsidiary of Wells Fargo, is the subadviser to each Fund and is entitled to receive a fee from Funds Management at an annual rate starting at 0.05% and declining to 0.03% as the average daily net assets of each Fund increase. Prior to July 14, 2017, Global Index Advisors, Inc., which is not an affiliate of Funds Management, was the subadviser to the Funds and was entitled to receive an annual fee which started at 0.60% and declined to 0.40% as the average daily net assets of each Fund increased.
Administration fees
Under a class-level administration agreement, Funds Management provides class-level administrative services to the Funds, which includes paying fees and expenses for services provided by the transfer agent, sub-transfer agents, omnibus account
| | | | | | |
| Notes to financial statements (unaudited) | | Wells Fargo Target Date Funds | | | 79 | |
servicers and record-keepers. As compensation for its services under the class-level administration agreement, Funds Management receives an annual fee which is calculated based on the average daily net assets of each class as follows:
| | | | |
| | | Class-level
administration fee | |
Class A, Class C, Class R | | | 0.21 | % |
Class R4 | | | 0.08 | |
Class R6 | | | 0.03 | |
Administrator Class | | | 0.13 | |
Funds Management has contractually waived and/or reimbursed management and administration fees to the extent necessary to maintain certain net operating expense ratios for the Funds. Waiver of fees and/or reimbursement of expenses by Funds Management were made first from fund level expenses on a proportionate basis and then from class specific expenses. Funds Management has committed through July 31, 2018 to waive fees and/or reimburse expenses to the extent necessary to cap each Fund’s expenses as follows:
| | | | | | | | | | | | | | | | | | | | | | | | |
| | | Class A | | | Class C | | | Class R | | | Class R4 | | | Class R6 | | | Administrator
Class | |
Target Today Fund | | | 0.65 | % | | | 1.40 | % | | | 0.90 | % | | | 0.34 | % | | | 0.19 | % | | | 0.54 | % |
Target 2010 Fund | | | 0.65 | | | | 1.40 | | | | 0.90 | | | | 0.34 | | | | 0.19 | | | | 0.54 | |
Target 2015 Fund | | | 0.65 | | | | N/A | | | | 0.90 | | | | 0.34 | | | | 0.19 | | | | 0.54 | |
Target 2020 Fund | | | 0.65 | | | | 1.40 | | | | 0.90 | | | | 0.34 | | | | 0.19 | | | | 0.54 | |
Target 2025 Fund | | | 0.65 | | | | N/A | | | | 0.90 | | | | 0.34 | | | | 0.19 | | | | 0.54 | |
Target 2030 Fund | | | 0.65 | | | | 1.40 | | | | 0.90 | | | | 0.34 | | | | 0.19 | | | | 0.54 | |
Target 2035 Fund | | | 0.65 | | | | N/A | | | | 0.90 | | | | 0.34 | | | | 0.19 | | | | 0.54 | |
Target 2040 Fund | | | 0.65 | | | | 1.40 | | | | 0.90 | | | | 0.34 | | | | 0.19 | | | | 0.54 | |
Target 2045 Fund | | | 0.65 | | | | N/A | | | | 0.90 | | | | 0.34 | | | | 0.19 | | | | 0.54 | |
Target 2050 Fund | | | 0.65 | | | | 1.40 | | | | 0.90 | | | | 0.34 | | | | 0.19 | | | | 0.54 | |
Target 2055 Fund | | | 0.65 | | | | N/A | | | | 0.90 | | | | 0.34 | | | | 0.19 | | | | 0.54 | |
Target 2060 Fund | | | 0.65 | | | | 1.40 | | | | 0.90 | | | | 0.34 | | | | 0.19 | | | | 0.54 | |
Prior to July 14, 2017, each Fund’s expenses were capped as following:
| | | | | | | | | | | | | | | | | | | | | | | | |
| | | Class A | | | Class C | | | Class R | | | Class R4 | | | Class R6 | | | Administrator
Class | |
Target Today Fund | | | 0.76 | % | | | 1.51 | % | | | 1.01 | % | | | 0.45 | % | | | 0.30 | % | | | 0.65 | % |
Target 2010 Fund | | | 0.78 | | | | 1.53 | | | | 1.03 | | | | 0.47 | | | | 0.32 | | | | 0.67 | |
Target 2015 Fund | | | 0.79 | | | | N/A | | | | 1.04 | | | | 0.48 | | | | 0.33 | | | | 0.68 | |
Target 2020 Fund | | | 0.81 | | | | 1.56 | | | | 1.06 | | | | 0.50 | | | | 0.35 | | | | 0.70 | |
Target 2025 Fund | | | 0.81 | | | | N/A | | | | 1.06 | | | | 0.50 | | | | 0.35 | | | | 0.70 | |
Target 2030 Fund | | | 0.82 | | | | 1.57 | | | | 1.07 | | | | 0.51 | | | | 0.36 | | | | 0.71 | |
Target 2035 Fund | | | 0.83 | | | | N/A | | | | 1.08 | | | | 0.52 | | | | 0.37 | | | | 0.72 | |
Target 2040 Fund | | | 0.83 | | | | 1.58 | | | | 1.08 | | | | 0.52 | | | | 0.37 | | | | 0.72 | |
Target 2045 Fund | | | 0.83 | | | | N/A | | | | 1.08 | | | | 0.52 | | | | 0.37 | | | | 0.72 | |
Target 2050 Fund | | | 0.83 | | | | 1.58 | | | | 1.08 | | | | 0.52 | | | | 0.37 | | | | 0.72 | |
Target 2055 Fund | | | 0.83 | | | | N/A | | | | 1.08 | | | | 0.52 | | | | 0.37 | | | | 0.72 | |
Target 2060 Fund | | | 0.83 | | | | 1.58 | | | | 1.08 | | | | 0.52 | | | | 0.37 | | | | 0.72 | |
Net expenses from affiliated Master Portfolios are included in the expense caps. After the expiration date, each expense cap may be increased or the commitment to maintain the cap may be terminated only with the approval of the Board of Trustees.
Distribution fees
The Trust has adopted a Distribution Plan for Class C and Class R shares of the Funds pursuant to Rule 12b-1 under the 1940 Act. Distribution fees are charged to the Class C and Class R shares and paid to Wells Fargo Funds Distributor, LLC
| | | | |
| 80 | | Wells Fargo Target Date Funds | | Notes to financial statements (unaudited) |
(“Funds Distributor”), the principal underwriter of each Fund, at an annual rate of 0.75% of the average daily net assets of Class C shares and 0.25% of the average daily net assets of Class R shares.
In addition, Funds Distributor is entitled to receive the front-end sales charge from the purchase of Class A shares and a contingent deferred sales charge on the redemption of certain Class A shares. Funds Distributor is also entitled to receive the contingent deferred sales charges from redemptions of Class C shares. For the six months ended August 31, 2017, Funds Distributor received the following amounts in front-end sales charges and contingent deferred sales charges.
| | | | | | | | |
| | | Front-end
sales charges
Class A | | | Contingent deferred sales charges
Class C | |
Target Today Fund | | $ | 2 | | | $ | 0 | |
Target 2010 Fund | | | 56 | | | | 0 | |
Target 2015 Fund | | | 100 | | | | N/A | |
Target 2020 Fund | | | 356 | | | | 267 | |
Target 2025 Fund | | | 136 | | | | N/A | |
Target 2030 Fund | | | 651 | | | | 0 | |
Target 2035 Fund | | | 260 | | | | N/A | |
Target 2040 Fund | | | 1,044 | | | | 0 | |
Target 2045 Fund | | | 193 | | | | N/A | |
Target 2050 Fund | | | 651 | | | | 0 | |
Target 2055 Fund | | | 157 | | | | N/A | |
Target 2060 Fund | | | 8 | | | | 0 | |
Shareholder servicing fees
The Trust has entered into contracts with one or more shareholder servicing agents, whereby Class A, Class C, Class R, and Administrator Class of each Fund are charged a fee at an annual rate of 0.25% of the average daily net assets of each respective class. Class R4 is charged a fee at an annual rate of 0.10% of its average daily net assets.
A portion of these total shareholder servicing fees were paid to affiliates of Wells Fargo.
5. INVESTMENT PORTFOLIO TRANSACTIONS
Purchases and sales of investments, excluding short-term securities, for the six months ended August 31, 2017 were as follows:
| | | | | | | | | | | | | | | | |
| | | Purchase at cost* | | | Sales proceeds* | |
| | | U.S. government | | | Non-U.S.
government | | | U.S.
government | | | Non-U.S.
government | |
Target Today Fund | | $ | 184,396,635 | | | $ | 73,055,231 | | | $ | 130,222,621 | | | $ | 70,190,011 | |
Target 2010 Fund | | | 200,835,796 | | | | 95,032,696 | | | | 138,255,405 | | | | 75,681,887 | |
Target 2015 Fund | | | 244,235,122 | | | | 121,077,719 | | | | 181,466,978 | | | | 119,080,863 | |
Target 2020 Fund | | | 1,123,142,793 | | | | 709,451,195 | | | | 882,487,458 | | | | 712,021,180 | |
Target 2025 Fund | | | 517,529,987 | | | | 467,031,783 | | | | 417,218,199 | | | | 451,058,474 | |
Target 2030 Fund | | | 768,957,633 | | | | 1,085,493,906 | | | | 615,449,955 | | | | 980,323,835 | |
Target 2035 Fund | | | 231,417,925 | | | | 525,720,802 | | | | 186,143,245 | | | | 467,957,490 | |
Target 2040 Fund | | | 296,506,588 | | | | 1,063,488,499 | | | | 230,287,924 | | | | 921,300,013 | |
Target 2045 Fund | | | 65,018,553 | | | | 376,358,356 | | | | 49,068,683 | | | | 328,850,510 | |
Target 2050 Fund | | | 85,307,956 | | | | 607,237,116 | | | | 60,789,116 | | | | 533,939,094 | |
Target 2055 Fund | | | 14,289,103 | | | | 102,574,912 | | | | 10,120,355 | | | | 88,279,560 | |
Target 2060 Fund | | | 3,493,424 | | | | 25,435,768 | | | | 2,452,634 | | | | 20,735,401 | |
| * | The Funds seek to achieve their investment objective by investing all of their investable assets in affiliated Master Portfolios. Purchases and sales related to these investments have been calculated by aggregating the results of multiplying each Fund’s ownership percentage of the respective affiliated Master Portfolio by the corresponding affiliated Master Portfolio’s purchases and sales. |
| | | | | | |
| Notes to financial statements (unaudited) | | Wells Fargo Target Date Funds | | | 81 | |
6. BANK BORROWINGS
The Trust (excluding the money market funds and certain other funds) and Wells Fargo Variable Trust are parties to a $280,000,000 revolving credit agreement whereby each Fund is permitted to use bank borrowings for temporary or emergency purposes, such as to fund shareholder redemption requests. Interest under the credit agreement is charged to each Fund based on a borrowing rate equal to the higher of the Federal Funds rate in effect on that day plus 1.25% or the overnight LIBOR rate in effect on that day plus 1.25%. In addition, an annual commitment fee equal to 0.25% of the unused balance is allocated to each participating fund. Prior to August 29, 2017, the revolving credit agreement amount was $30,000,000 and the annual commitment fee was equal to 0.20% of the unused balance which was allocated to each participating fund.
During the year ended August 31, 2017, the Funds had borrowings under the agreement. The amounts, including the related interest and fees, were not material to each Fund.
7. INDEMNIFICATION
Under the Trust’s organizational documents, the officers and Trustees have been granted certain indemnification rights against certain liabilities that may arise out of performance of their duties to the Trust. Additionally, in the normal course of business, the Trust may enter into contracts with service providers that contain a variety of indemnification clauses. The Trust’s maximum exposure under these arrangements is dependent on future claims that may be made against the Funds and, therefore, cannot be estimated.
8. REDEMPTIONS IN-KIND
After the close of business on December 9, 2016, the following Funds each redeemed assets through a redemption in-kind from a shareholder in Class R6. Each Fund invests all of its assets in the affiliated Master Portfolios to achieve its investment objective. In each redemption transaction, each applicable Fund issued securities which it received from the affiliated Master Portfolios on a pro-rata basis. The value of securities from the Portfolios along with any cash issued in the redemption, the percentage of the Fund and Class R6 at the time of the transaction and the gains or losses realized by each Fund are reflected in the table below. The redemption in-kind is reflected on the Statements of Changes in Net Assets.
| | | | | | | | | | | | | | | | | | | | |
| | | Value of
securities | | | Cash | | | % of Fund on August 31, 2017 | | | % of Class R6 on August 31, 2017 | | | Gains
recognized | |
Target Today Fund | | $ | 105,985,689 | | | $ | 15,411,197 | | | | 21 | % | | | 56 | % | | $ | 13,693,939 | |
Target 2010 Fund | | | 44,481,032 | | | | 6,468,094 | | | | 15 | | | | 33 | | | | 9,446,049 | |
Target 2015 Fund | | | 141,203,562 | | | | 20,532,749 | | | | 27 | | | | 49 | | | | 18,589,051 | |
Target 2020 Fund | | | 446,374,230 | | | | 64,908,349 | | | | 22 | | | | 40 | | | | 107,022,336 | |
Target 2025 Fund | | | 922,814,403 | | | | 134,188,661 | | | | 47 | | | | 69 | | | | 97,311,715 | |
Target 2030 Fund | | | 620,359,094 | | | | 90,207,907 | | | | 27 | | | | 51 | | | | 205,832,959 | |
Target 2035 Fund | | | 410,931,047 | | | | 59,754,471 | | | | 34 | | | | 58 | | | | 116,877,858 | |
Target 2040 Fund | | | 485,327,423 | | | | 70,572,627 | | | | 28 | | | | 52 | | | | 211,673,564 | |
Target 2045 Fund | | | 249,349,193 | | | | 36,258,465 | | | | 34 | | | | 57 | | | | 88,998,866 | |
Target 2050 Fund | | | 584,732,726 | | | | 85,027,391 | | | | 46 | | | | 70 | | | | 131,256,617 | |
Target 2055 Fund | | | 136,882,005 | | | | 19,904,341 | | | | 50 | | | | 66 | | | | 25,419,397 | |
9. SUBSEQUENT DISTRIBUTIONS
On September 25, 2017, Target Today Fund declared distributions from net investment income to shareholders of record on September 22, 2017. The per share amounts payable on September 26, 2017 were as follows:
| | | | |
| Net investment income | | Target
Today
Fund | |
Class A | | $ | 0.06781 | |
Class C | | | 0.00689 | |
Class R | | | 0.05020 | |
Class R4 | | | 0.07494 | |
Class R6 | | | 0.10681 | |
Administrator Class | | | 0.07434 | |
These distributions are not reflected in the accompanying financial statements.
| | | | |
| 82 | | Wells Fargo Target Date Funds | | Portfolio of investments—August 31, 2017 (unaudited) |
BLOOMBERG BARCLAYS US AGGREGATE EX-CORPORATE PORTFOLIO
| | | | | | | | | | | | | | | | |
| Security name | | Interest rate | | | Maturity date | | | Principal | | | Value | |
| | | | |
Agency Securities: 39.65% | | | | | | | | | | | | | | | | |
Federal Farm Credit Bank Bonds | | | 0.89 | % | | | 11-16-2018 | | | $ | 530,000 | | | $ | 527,352 | |
FHLB | | | 0.88 | | | | 8-5-2019 | | | | 120,000 | | | | 118,809 | |
FHLB | | | 1.00 | | | | 9-26-2019 | | | | 120,000 | | | | 118,974 | |
FHLMC | | | 1.13 | | | | 7-14-2021 | | | | 120,000 | | | | 117,707 | |
FHLMC | | | 1.25 | | | | 10-2-2019 | | | | 130,000 | | | | 129,451 | |
FHLMC | | | 1.30 | | | | 8-28-2019 | | | | 100,000 | | | | 99,648 | |
FHLMC | | | 1.75 | | | | 12-14-2018 | | | | 2,560,000 | | | | 2,573,412 | |
FHLMC | | | 2.00 | | | | 9-14-2018 | | | | 900,000 | | | | 906,708 | |
FHLMC | | | 2.13 | | | | 6-9-2023 | | | | 1,200,000 | | | | 1,216,862 | |
FHLMC | | | 2.29 | | | | 4-13-2022 | | | | 920,000 | | | | 920,622 | |
FHLMC | | | 2.38 | | | | 1-13-2022 | | | | 3,000,000 | | | | 3,080,190 | |
FHLMC | | | 2.50 | | | | 3-1-2032 | | | | 10,517,829 | | | | 10,667,898 | |
FHLMC | | | 2.75 | | | | 12-13-2024 | | | | 2,020,000 | | | | 2,107,280 | |
FHLMC | | | 3.00 | | | | 2-1-2047 | | | | 20,053,914 | | | | 20,291,218 | |
FHLMC %% | | | 3.00 | | | | 9-13-2047 | | | | 9,085,000 | | | | 9,184,367 | |
FHLMC | | | 3.50 | | | | 2-1-2044 | | | | 17,968,666 | | | | 18,709,253 | |
FHLMC | | | 3.50 | | | | 4-1-2045 | | | | 756,605 | | | | 788,206 | |
FHLMC | | | 3.50 | | | | 8-1-2047 | | | | 11,044,258 | | | | 11,452,167 | |
FHLMC %% | | | 3.50 | | | | 9-13-2047 | | | | 95,000 | | | | 98,444 | |
FHLMC | | | 6.00 | | | | 7-1-2040 | | | | 4,676,726 | | | | 5,270,638 | |
FHLMC | | | 6.25 | | | | 7-15-2032 | | | | 1,010,000 | | | | 1,457,954 | |
FHLMC | | | 6.75 | | | | 3-15-2031 | | | | 600,000 | | | | 883,299 | |
FHLMC Series K005 Class A2 | | | 4.32 | | | | 11-25-2019 | | | | 1,400,000 | | | | 1,470,184 | |
FHLMC Series K014 Class A1 | | | 2.79 | | | | 10-25-2020 | | | | 10,975 | | | | 11,125 | |
FHLMC Series K015 Class A2 | | | 3.23 | | | | 7-25-2021 | | | | 60,000 | | | | 62,847 | |
FHLMC Series K028 Class A1 | | | 2.18 | | | | 11-25-2022 | | | | 666,238 | | | | 671,320 | |
FHLMC Series K029 Class A2 ±± | | | 3.32 | | | | 2-25-2023 | | | | 1,425,000 | | | | 1,510,002 | |
FHLMC Series K030 Class A2 ±± | | | 3.25 | | | | 4-25-2023 | | | | 1,510,000 | | | | 1,595,394 | |
FHLMC Series K034 Class A2 ±± | | | 3.53 | | | | 7-25-2023 | | | | 60,000 | | | | 64,336 | |
FHLMC Series K035 Class A2 ±± | | | 3.46 | | | | 8-25-2023 | | | | 55,000 | | | | 58,771 | |
FHLMC Series K048 Class A2 ±± | | | 3.28 | | | | 6-25-2025 | | | | 1,420,000 | | | | 1,504,114 | |
FHLMC Series K062 Class A2 | | | 3.41 | | | | 12-25-2026 | | | | 750,000 | | | | 798,953 | |
FHLMC Series K063 Class A2 ±± | | | 3.43 | | | | 1-25-2027 | | | | 45,000 | | | | 47,998 | |
FHLMC Series K706 Class A2 | | | 2.32 | | | | 10-25-2018 | | | | 58,984 | | | | 59,346 | |
FHLMC Series K717 Class A2 | | | 2.99 | | | | 9-25-2021 | | | | 900,000 | | | | 936,076 | |
FNMA ¤ | | | 0.00 | | | | 10-9-2019 | | | | 3,140,000 | | | | 3,028,999 | |
FNMA | | | 1.00 | | | | 10-24-2019 | | | | 650,000 | | | | 644,261 | |
FNMA | | | 1.13 | | | | 10-19-2018 | | | | 110,000 | | | | 109,791 | |
FNMA | | | 1.38 | | | | 2-26-2021 | | | | 120,000 | | | | 119,291 | |
FNMA | | | 1.50 | | | | 11-30-2020 | | | | 120,000 | | | | 119,701 | |
FNMA | | | 1.63 | | | | 11-27-2018 | | | | 2,880,000 | | | | 2,890,673 | |
FNMA | | | 2.01 | | | | 7-25-2022 | | | | 18,456 | | | | 18,533 | |
FNMA | | | 2.50 | | | | 12-1-2027 | | | | 1,117,919 | | | | 1,140,686 | |
FNMA | | | 2.50 | | | | 9-1-2031 | | | | 10,832,030 | | | | 10,996,155 | |
FNMA %% | | | 2.50 | | | | 9-18-2032 | | | | 2,345,000 | | | | 2,377,610 | |
FNMA ±± | | | 2.99 | | | | 9-25-2027 | | | | 168,393 | | | | 171,972 | |
FNMA | | | 3.00 | | | | 12-1-2026 | | | | 5,504,842 | | | | 5,698,583 | |
FNMA | | | 3.00 | | | | 12-1-2030 | | | | 748,782 | | | | 773,677 | |
FNMA | | | 3.00 | | | | 7-1-2032 | | | | 7,723,689 | | | | 7,979,369 | |
FNMA %% | | | 3.00 | | | | 9-18-2032 | | | | 3,940,000 | | | | 4,068,050 | |
The accompanying notes are an integral part of these financial statements.
| | | | | | |
| Portfolio of investments—August 31, 2017 (unaudited) | | Wells Fargo Target Date Funds | | | 83 | |
BLOOMBERG BARCLAYS US AGGREGATE EX-CORPORATE PORTFOLIO
| | | | | | | | | | | | | | | | |
| Security name | | Interest rate | | | Maturity date | | | Principal | | | Value | |
| | | | |
Agency Securities (continued) | | | | | | | | | | | | | | | | |
FNMA | | | 3.00 | % | | | 8-1-2036 | | | $ | 371,258 | | | $ | 381,325 | |
FNMA | | | 3.00 | | | | 2-1-2037 | | | | 6,375,192 | | | | 6,537,400 | |
FNMA | | | 3.00 | | | | 8-1-2037 | | | | 1,792,641 | | | | 1,840,750 | |
FNMA | | | 3.00 | | | | 11-1-2046 | | | | 939,413 | | | | 950,517 | |
FNMA | | | 3.00 | | | | 7-1-2047 | | | | 29,724,959 | | | | 30,076,317 | |
FNMA %% | | | 3.00 | | | | 9-13-2047 | | | | 7,080,000 | | | | 7,159,650 | |
FNMA | | | 3.50 | | | | 6-1-2031 | | | | 4,439,578 | | | | 4,634,851 | |
FNMA %% | | | 3.50 | | | | 9-18-2032 | | | | 3,420,000 | | | | 3,569,759 | |
FNMA | | | 3.50 | | | | 1-1-2035 | | | | 272,597 | | | | 286,158 | |
FNMA | | | 3.50 | | | | 3-1-2036 | | | | 3,866,834 | | | | 4,039,696 | |
FNMA | | | 3.50 | | | | 4-1-2037 | | | | 2,673,240 | | | | 2,796,638 | |
FNMA | | | 3.50 | | | | 6-1-2042 | | | | 3,512,386 | | | | 3,652,756 | |
FNMA | | | 3.50 | | | | 7-1-2042 | | | | 1,483,804 | | | | 1,544,338 | |
FNMA | | | 3.50 | | | | 10-1-2042 | | | | 7,614,309 | | | | 7,919,858 | |
FNMA | | | 3.50 | | | | 9-1-2043 | | | | 22,315,538 | | | | 23,226,076 | |
FNMA %% | | | 3.50 | | | | 9-13-2047 | | | | 8,265,000 | | | | 8,563,148 | |
FNMA | | | 4.00 | | | | 6-1-2042 | | | | 14,330,223 | | | | 15,201,041 | |
FNMA | | | 4.00 | | | | 6-1-2042 | | | | 1,369,499 | | | | 1,452,496 | |
FNMA | | | 4.00 | | | | 8-1-2043 | | | | 10,406,057 | | | | 11,012,807 | |
FNMA %% | | | 4.00 | | | | 9-13-2047 | | | | 21,250,000 | | | | 22,449,463 | |
FNMA | | | 4.50 | | | | 5-1-2040 | | | | 570,323 | | | | 617,478 | |
FNMA | | | 4.50 | | | | 9-1-2040 | | | | 15,874,450 | | | | 17,120,101 | |
FNMA | | | 4.50 | | | | 2-1-2047 | | | | 4,811,612 | | | | 5,175,799 | |
FNMA %% | | | 4.50 | | | | 9-13-2047 | | | | 4,710,000 | | | | 5,065,826 | |
FNMA | | | 5.00 | | | | 1-1-2042 | | | | 541,791 | | | | 592,944 | |
FNMA | | | 5.00 | | | | 6-1-2045 | | | | 2,015,654 | | | | 2,204,797 | |
FNMA | | | 5.00 | | | | 7-1-2045 | | | | 9,724,153 | | | | 10,639,021 | |
FNMA | | | 5.50 | | | | 9-1-2040 | | | | 7,301,546 | | | | 8,113,161 | |
FNMA | | | 6.00 | | | | 5-1-2041 | | | | 212,931 | | | | 242,331 | |
FNMA | | | 7.13 | | | | 1-15-2030 | | | | 1,780,000 | | | | 2,641,730 | |
FNMA | | | 7.25 | | | | 5-15-2030 | | | | 80,000 | | | | 120,337 | |
FNMA Series 2016-M7 Class A2 | | | 2.50 | | | | 9-25-2026 | | | | 495,000 | | | | 487,583 | |
FNMA Series 2017-M1 Class A2 ±± | | | 2.50 | | | | 10-25-2026 | | | | 65,000 | | | | 63,976 | |
FNMA Series 2017-M3 Class A2 ±± | | | 2.57 | | | | 12-25-2026 | | | | 995,000 | | | | 983,534 | |
GNMA | | | 3.00 | | | | 4-20-2045 | | | | 11,198,227 | | | | 11,439,382 | |
GNMA | | | 3.00 | | | | 11-20-2045 | | | | 798,348 | | | | 815,540 | |
GNMA | | | 3.00 | | | | 3-20-2046 | | | | 15,747,148 | | | | 16,086,264 | |
GNMA %% | | | 3.00 | | | | 9-21-2047 | | | | 7,585,000 | | | | 7,741,441 | |
GNMA | | | 3.50 | | | | 2-20-2045 | | | | 22,189,644 | | | | 23,172,344 | |
GNMA | | | 3.50 | | | | 6-20-2045 | | | | 3,645,728 | | | | 3,807,193 | |
GNMA | | | 3.50 | | | | 11-20-2045 | | | | 4,046,976 | | | | 4,226,220 | |
GNMA | | | 3.50 | | | | 7-20-2047 | | | | 13,888,928 | | | | 14,499,552 | |
GNMA %% | | | 3.50 | | | | 9-21-2047 | | | | 405,000 | | | | 422,323 | |
GNMA | | | 4.00 | | | | 7-20-2044 | | | | 4,026,529 | | | | 4,273,056 | |
GNMA | | | 4.00 | | | | 8-20-2044 | | | | 1,956,755 | | | | 2,076,559 | |
GNMA | | | 4.00 | | | | 9-20-2044 | | | | 3,973,323 | | | | 4,216,290 | |
GNMA %% | | | 4.00 | | | | 9-21-2047 | | | | 10,100,000 | | | | 10,642,875 | |
TVA | | | 1.75 | | | | 10-15-2018 | | | | 2,050,000 | | | | 2,060,000 | |
TVA | | | 3.50 | | | | 12-15-2042 | | | | 30,000 | | | | 31,951 | |
| | | | |
Total Agency Securities (Cost $454,327,783) | | | | | | | | | | | | | | | 456,522,928 | |
| | | | | | | | | | | | | | | | |
The accompanying notes are an integral part of these financial statements.
| | | | |
| 84 | | Wells Fargo Target Date Funds | | Portfolio of investments—August 31, 2017 (unaudited) |
BLOOMBERG BARCLAYS US AGGREGATE EX-CORPORATE PORTFOLIO
| | | | | | | | | | | | | | | | |
| Security name | | Interest rate | | | Maturity date | | | Principal | | | Value | |
| | | | |
Asset-Backed Securities: 0.65% | | | | | | | | | | | | | | | | |
Americredit Automobile Receivables Trust Series 2016-3 Class A3 | | | 1.46 | % | | | 5-10-2021 | | | $ | 455,000 | | | $ | 453,927 | |
Bank of America Credit Card Trust Series 2017 Class A1 | | | 1.95 | | | | 8-15-2022 | | | | 20,000 | | | | 20,129 | |
Capital Auto Receivables Asset Trust Series 2015-3 Class A4 | | | 2.13 | | | | 5-20-2020 | | | | 185,000 | | | | 185,974 | |
Capital Auto Receivables Asset Trust Series 2016-1 Class A4 | | | 1.98 | | | | 10-20-2020 | | | | 50,000 | | | | 50,199 | |
Capital One Multi Asset Execution Trust Series 2016-A5 Class A5 | | | 1.66 | | | | 6-17-2024 | | | | 188,000 | | | | 186,376 | |
Capital One Multi Asset Execution Trust Series 2017 Class A3 | | | 2.43 | | | | 1-15-2025 | | | | 40,000 | | | | 40,734 | |
Capital One Multi Asset Execution Trust Series 2017-A1 Class A1 | | | 2.00 | | | | 1-17-2023 | | | | 100,000 | | | | 100,722 | |
CarMax Auto Owner Trust Series 2016-3 Class A3 | | | 1.39 | | | | 5-17-2021 | | | | 465,000 | | | | 463,471 | |
CarMax Auto Owner Trust Series 2016-3 Class A4 | | | 1.60 | | | | 1-18-2022 | | | | 17,000 | | | | 16,895 | |
CarMax Auto Owner Trust Series 2016-4 Class A3 | | | 1.40 | | | | 8-15-2021 | | | | 470,000 | | | | 467,757 | |
CarMax Auto Owner Trust Series 2016-4 Class A4 | | | 1.60 | | | | 6-15-2022 | | | | 10,000 | | | | 9,924 | |
Chase Issuance Trust Series 2016-A2 Class A2 | | | 1.37 | | | | 6-15-2021 | | | | 590,000 | | | | 587,613 | |
Chase Issuance Trust Series 2016-A4 Class A4 | | | 1.49 | | | | 7-15-2022 | | | | 510,000 | | | | 506,074 | |
Citibank Credit Card Issuance Trust Series 2014-A6 Class A6 | | | 2.15 | | | | 7-15-2021 | | | | 570,000 | | | | 575,423 | |
Citibank Credit Card Issuance Trust Series 2017-A2 Class A2 | | | 1.74 | | | | 1-19-2021 | | | | 580,000 | | | | 581,629 | |
Citibank Credit Card Issuance Trust Series 2017-A3 Class A3 | | | 1.92 | | | | 4-7-2022 | | | | 590,000 | | | | 593,129 | |
Nissan Auto Receivables Owners Trust Series 2017-A Class A4 | | | 2.11 | | | | 5-15-2023 | | | | 15,000 | | | | 15,146 | |
Synchrony Credit Card Master Note Trust Series 2015-1 Class A | | | 2.37 | | | | 3-15-2023 | | | | 425,000 | | | | 430,810 | |
Synchrony Credit Card Master Note Trust Series 2016-2 Class A | | | 2.21 | | | | 5-15-2024 | | | | 175,000 | | | | 176,328 | |
Toyota Auto Receivables Owner Trust Series 2017-B Class A3 | | | 1.76 | | | | 7-15-2021 | | | | 425,000 | | | | 426,205 | |
World Financial Network Credit Card Master Trust Series 2012-A Class A | | | 3.14 | | | | 1-17-2023 | | | | 15,000 | | | | 15,322 | |
World Financial Network Credit Card Master Trust Series 2016-A Class A | | | 2.03 | | | | 4-15-2025 | | | | 487,000 | | | | 485,359 | |
World Omni Auto Receivables Trust Series 2016-B Class A4 | | | 1.48 | | | | 11-15-2022 | | | | 422,000 | | | | 417,667 | |
World Omni Auto Receivables Trust Series 2017-A Class A3 | | | 1.93 | | | | 9-15-2022 | | | | 95,000 | | | | 95,494 | |
World Omni Auto Receivables Trust Series 2017-A Class A4 | | | 2.24 | | | | 6-15-2023 | | | | 210,000 | | | | 212,544 | |
World Omni Automobile Lease Securitization Trust Series 2016-A Class A3 | | | 1.45 | | | | 8-15-2019 | | | | 450,000 | | | | 449,232 | |
| | | | |
Total Asset-Backed Securities (Cost $7,548,187) | | | | | | | | | | | | | | | 7,564,083 | |
| | | | | | | | | | | | | | | | |
| | | | |
Municipal Obligations: 0.81% | | | | | | | | | | | | | | | | |
| | | | |
| California: 0.28% | | | | | | | | | | | | | | | | |
Bay Area CA Toll Authority Series 1 (Transportation Revenue) | | | 6.92 | | | | 4-1-2040 | | | | 15,000 | | | | 21,684 | |
Bay Area CA Toll Authority Series 1 (Transportation Revenue) | | | 7.04 | | | | 4-1-2050 | | | | 320,000 | | | | 502,266 | |
California Build America Bonds (GO Revenue) | | | 5.70 | | | | 11-1-2021 | | | | 270,000 | | | | 308,105 | |
California Build America Bonds (GO Revenue) | | | 7.60 | | | | 11-1-2040 | | | | 15,000 | | | | 23,887 | |
California Department of Water Resources Series P (Utilities Revenue) | | | 2.00 | | | | 5-1-2022 | | | | 55,000 | | | | 54,844 | |
California Series B (Education Revenue) | | | 3.90 | | | | 11-1-2047 | | | | 15,000 | | | | 15,770 | |
California State Build America Bonds (GO Revenue) | | | 7.55 | | | | 4-1-2039 | | | | 110,000 | | | | 172,352 | |
California State Build America Bonds (GO Revenue) | | | 7.63 | | | | 3-1-2040 | | | | 800,000 | | | | 1,245,776 | |
Los Angeles CA Community College District Build America Bonds (GO Revenue) | | | 6.75 | | | | 8-1-2049 | | | | 5,000 | | | | 7,772 | |
Los Angeles CA DW&P Build America Bonds (Utilities Revenue) | | | 6.57 | | | | 7-1-2045 | | | | 175,000 | | | | 261,686 | |
Los Angeles CA Unified School District Build America Bonds (GO Revenue) | | | 5.75 | | | | 7-1-2034 | | | | 15,000 | | | | 19,358 | |
Los Angeles CA Unified School District Build America Bonds (GO Revenue) | | | 5.76 | | | | 7-1-2029 | | | | 160,000 | | | | 199,910 | |
Los Angeles CA Unified School District Build America Bonds (GO Revenue) | | | 6.76 | | | | 7-1-2034 | | | | 160,000 | | | | 225,459 | |
University of California Series AD (Education Revenue) | | | 4.86 | | | | 5-15-2112 | | | | 150,000 | | | | 165,669 | |
| | | | |
| | | | | | | | | | | | | | | 3,224,538 | |
| | | | | | | | | | | | | | | | |
| | | | |
| Florida: 0.03% | | | | | | | | | | | | | | | | |
Florida Board of Administrative Finance Series A (Miscellaneous Revenue) | | | 2.64 | | | | 7-1-2021 | | | | 370,000 | | | | 375,994 | |
| | | | | | | | | | | | | | | | |
The accompanying notes are an integral part of these financial statements.
| | | | | | |
| Portfolio of investments—August 31, 2017 (unaudited) | | Wells Fargo Target Date Funds | | | 85 | |
BLOOMBERG BARCLAYS US AGGREGATE EX-CORPORATE PORTFOLIO
| | | | | | | | | | | | | | | | |
| Security name | | Interest rate | | | Maturity date | | | Principal | | | Value | |
| | | | |
| Georgia: 0.04% | | | | | | | | | | | | | | | | |
Municipal Electric Authority of Georgia Build America Bonds (Utilities Revenue) | | | 6.66 | % | | | 4-1-2057 | | | $ | 330,000 | | | $ | 416,447 | |
Municipal Electric Authority of Georgia Build America Bonds (Utilities Revenue) | | | 7.06 | | | | 4-1-2057 | | | | 10,000 | | | | 12,376 | |
| | | | |
| | | | | | | | | | | | | | | 428,823 | |
| | | | | | | | | | | | | | | | |
| | | | |
| Illinois: 0.16% | | | | | | | | | | | | | | | | |
Chicago IL Series B (GO Revenue) | | | 6.31 | | | | 1-1-2044 | | | | 330,000 | | | | 354,740 | |
Chicago IL Transit Authority Series B (Tax Revenue) | | | 6.90 | | | | 12-1-2040 | | | | 310,000 | | | | 411,510 | |
Illinois Build America Bonds Series 3 (Miscellaneous Revenue) | | | 6.73 | | | | 4-1-2035 | | | | 45,000 | | | | 49,593 | |
Illinois Taxable Pension (GO Revenue) | | | 5.10 | | | | 6-1-2033 | | | | 1,010,000 | | | | 1,005,475 | |
| | | | |
| | | | | | | | | | | | | | | 1,821,318 | |
| | | | | | | | | | | | | | | | |
| | | | |
| Kansas: 0.00% | | | | | | | | | | | | | | | | |
Kansas Development Finance Authority Series H (Miscellaneous Revenue) | | | 4.93 | | | | 4-15-2045 | | | | 5,000 | | | | 5,734 | |
| | | | | | | | | | | | | | | | |
| | | | |
| Massachusetts: 0.03% | | | | | | | | | | | | | | | | |
Massachusetts Build America Bonds (GO Revenue) | | | 4.91 | | | | 5-1-2029 | | | | 300,000 | | | | 357,201 | |
Massachusetts Build America Bonds Series D (GO Revenue) | | | 4.50 | | | | 8-1-2031 | | | | 5,000 | | | | 5,782 | |
Massachusetts Build America Bonds Series E (GO Revenue) | | | 4.20 | | | | 12-1-2021 | | | | 10,000 | | | | 10,730 | |
| | | | |
| | | | | | | | | | | | | | | 373,713 | |
| | | | | | | | | | | | | | | | |
| | | | |
| New Jersey: 0.09% | | | | | | | | | | | | | | | | |
New Jersey EDA Series A (Miscellaneous Revenue, National Insured) | | | 7.43 | | | | 2-15-2029 | | | | 395,000 | | | | 490,250 | |
New Jersey EDA Series B (Miscellaneous Revenue, AGM Insured) ¤ | | | 0.00 | | | | 2-15-2022 | | | | 25,000 | | | | 21,878 | |
New Jersey Turnpike Authority Build America Bonds Series A (Transportation Revenue) | | | 7.10 | | | | 1-1-2041 | | | | 370,000 | | | | 550,212 | |
| | | | |
| | | | | | | | | | | | | | | 1,062,340 | |
| | | | | | | | | | | | | | | | |
| | | | |
| New York: 0.15% | | | | | | | | | | | | | | | | |
Metropolitan Transportation Authority New York Build America Bonds Series E (Transportation Revenue) | | | 6.67 | | | | 11-15-2039 | | | | 50,000 | | | | 70,653 | |
Metropolitan Transportation Authority New York Build America Bonds Series E (Transportation Revenue) | | | 6.81 | | | | 11-15-2040 | | | | 10,000 | | | | 14,353 | |
Metropolitan Transportation Authority New York Dedicated Tax Fund Build America Bonds (Tax Revenue) | | | 7.34 | | | | 11-15-2039 | | | | 210,000 | | | | 326,487 | |
New York NY Municipal Water Finance Authority (Water & Sewer Revenue) | | | 5.44 | | | | 6-15-2043 | | | | 10,000 | | | | 13,190 | |
New York NY Municipal Water Finance Authority Series CC (Water & Sewer Revenue) | | | 5.88 | | | | 6-15-2044 | | | | 400,000 | | | | 559,040 | |
Port Authority of New York & New Jersey (Airport Revenue) | | | 5.65 | | | | 11-1-2040 | | | | 45,000 | | | | 60,243 | |
Port Authority of New York & New Jersey Consolidated Bonds Series 174 (Airport Revenue) | | | 4.46 | | | | 10-1-2062 | | | | 590,000 | | | | 672,659 | |
| | | | |
| | | | | | | | | | | | | | | 1,716,625 | |
| | | | | | | | | | | | | | | | |
| | | | |
| Ohio: 0.02% | | | | | | | | | | | | | | | | |
American Municipal Power Ohio Incorporated Build America Bonds (Utilities Revenue) | | | 5.94 | | | | 2-15-2047 | | | | 150,000 | | | | 199,610 | |
American Municipal Power Ohio Incorporated Build America Bonds Series E (Utilities Revenue) | | | 6.27 | | | | 2-15-2050 | | | | 10,000 | | | | 13,105 | |
Ohio State University Build America Bonds (Education Revenue) | | | 4.91 | | | | 6-1-2040 | | | | 5,000 | | | | 6,147 | |
| | | | |
| | | | | | | | | | | | | | | 218,862 | |
| | | | | | | | | | | | | | | | |
| | | | |
| Oregon: 0.01% | | | | | | | | | | | | | | | | |
Oregon Department of Transportation Build America Bonds Series A (Tax Revenue) | | | 5.83 | | | | 11-15-2034 | | | | 100,000 | | | | 130,167 | |
| | | | | | | | | | | | | | | | |
The accompanying notes are an integral part of these financial statements.
| | | | |
| 86 | | Wells Fargo Target Date Funds | | Portfolio of investments—August 31, 2017 (unaudited) |
BLOOMBERG BARCLAYS US AGGREGATE EX-CORPORATE PORTFOLIO
| | | | | | | | | | | | | | | | |
| Security name | | Interest rate | | | Maturity date | | | Principal | | | Value | |
| | | | |
| Pennsylvania: 0.00% | | | | | | | | | | | | | | | | |
Pennsylvania Turnpike Comission Series B (Transportation Revenue) | | | 5.51 | % | | | 12-1-2045 | | | $ | 5,000 | | | $ | 6,599 | |
| | | | | | | | | | | | | | | | |
| | | | |
Total Municipal Obligations (Cost $9,146,064) | | | | | | | | | | | | | | | 9,364,713 | |
| | | | | | | | | | | | | | | | |
| | | | |
Non-Agency Mortgage-Backed Securities: 1.58% | | | | | | | | | | | | | | | | |
CFCRE Commercial Mortgage Trust Series 2016-C7 Class A3 | | | 3.84 | | | | 12-10-2054 | | | | 20,000 | | | | 21,354 | |
Citigroup Commercial Mortgage Trust Series 2015-GC27 Class A5 | | | 3.14 | | | | 2-10-2048 | | | | 55,000 | | | | 56,156 | |
Citigroup Commercial Mortgage Trust Series 2016 GC37 Class B | | | 4.23 | | | | 4-10-2049 | | | | 535,000 | | | | 565,122 | |
Citigroup Commercial Mortgage Trust Series 2016-GC36 Class A5 | | | 3.62 | | | | 2-10-2049 | | | | 1,465,000 | | | | 1,541,221 | |
Citigroup Commercial Mortgage Trust Series 2016-GC36 Class B ±± | | | 4.92 | | | | 2-10-2049 | | | | 40,000 | | | | 43,879 | |
Citigroup Commercial Mortgage Trust Series 2016-P5 Class A2 | | | 2.40 | | | | 10-10-2049 | | | | 60,000 | | | | 60,796 | |
Commercial Mortgage Pass-Through Certificate Series 2012-CR3 Class A3 | | | 2.82 | | | | 10-15-2045 | | | | 1,505,000 | | | | 1,537,559 | |
Commercial Mortgage Pass-Through Certificate Series 2013-CR9 Class A4 ±± | | | 4.37 | | | | 7-10-2045 | | | | 1,395,000 | | | | 1,530,716 | |
Commercial Mortgage Trust Series 2012-LC4 Class A4 | | | 3.29 | | | | 12-10-2044 | | | | 1,460,000 | | | | 1,518,342 | |
Commercial Mortgage Trust Series 2013-CR6 Class A4 | | | 3.10 | | | | 3-10-2046 | | | | 60,000 | | | | 62,188 | |
Commercial Mortgage Trust Series 2014 UBS5 Class C ±± | | | 4.77 | | | | 9-10-2047 | | | | 390,000 | | | | 405,387 | |
Commercial Mortgage Trust Series 2014-UBS6 Class C ±± | | | 4.61 | | | | 12-10-2047 | | | | 60,000 | | | | 59,381 | |
Commercial Mortgage Trust Series 2015-CR23 Class A3 | | | 3.23 | | | | 5-10-2048 | | | | 60,000 | | | | 61,896 | |
Commercial Mortgage Trust Series 2016 CR1 Class C ±± | | | 4.54 | | | | 10-10-2049 | | | | 65,000 | | | | 66,739 | |
Commercial Mortgage Trust Series 2016-CR28 Class A4 | | | 3.76 | | | | 2-10-2049 | | | | 1,055,000 | | | | 1,123,314 | |
Goldman Sachs Mortgage Securities Trust Series 2010-C1 Class D 144A±± | | | 6.20 | | | | 8-10-2043 | | | | 890,000 | | | | 926,836 | |
Goldman Sachs Mortgage Securities Trust Series 2011-GC5 Class AS 144A±± | | | 5.21 | | | | 8-10-2044 | | | | 45,000 | | | | 48,803 | |
Goldman Sachs Mortgage Securities Trust Series 2011-GC6 Class AS 144A | | | 4.95 | | | | 1-10-2045 | | | | 50,000 | | | | 54,691 | |
Goldman Sachs Mortgage Securities Trust Series 2012-GC6 Class A3 | | | 3.48 | | | | 1-10-2045 | | | | 936,463 | | | | 983,590 | |
Goldman Sachs Mortgage Securities Trust Series 2012-GCJ9 Class AS | | | 3.12 | | | | 11-10-2045 | | | | 40,000 | | | | 40,798 | |
Goldman Sachs Mortgage Securities Trust Series 2013-GC14 Class A5 | | | 4.24 | | | | 8-10-2046 | | | | 1,150,000 | | | | 1,257,433 | |
JPMorgan Chase Commercial Mortgage Securities Corporation Series 201- C30 Clas A5 | | | 3.82 | | | | 7-15-2048 | | | | 1,450,000 | | | | 1,552,824 | |
JPMorgan Chase Commercial Mortgage Securities Corporation Series 2013-C15 Class A4 | | | 4.10 | | | | 11-15-2045 | | | | 20,000 | | | | 21,712 | |
JPMorgan Chase Commercial Mortgage Securities Corporation Series 2013-C17 Class B ±± | | | 5.05 | | | | 1-15-2047 | | | | 40,000 | | | | 43,133 | |
JPMorgan Chase Commercial Mortgage Securities Corporation Series 2015-C31 Class A3 | | | 3.80 | | | | 8-15-2048 | | | | 1,465,000 | | | | 1,568,163 | |
JPMorgan Chase Commercial Mortgage Securities Trust Series 2015-C28 Class A2 | | | 2.77 | | | | 10-15-2048 | | | | 20,000 | | | | 20,415 | |
Morgan Stanley Bank of America Merrill Lynch Trust Series 2013-C11 Class AS ±± | | | 4.52 | | | | 8-15-2046 | | | | 765,000 | | | | 827,286 | |
Morgan Stanley Bank of America Merrill Lynch Trust Series 2013-C8 Class A4 | | | 3.13 | | | | 12-15-2048 | | | | 50,000 | | | | 51,748 | |
Morgan Stanley Bank of America Merrill Lynch Trust Series 2014-C14 Class A2 | | | 2.92 | | | | 2-15-2047 | | | | 500,000 | | | | 507,425 | |
Morgan Stanley Bank of America Merrill Lynch Trust Series 2015-C22 Class A4 | | | 3.31 | | | | 4-15-2048 | | | | 60,000 | | | | 62,218 | |
Morgan Stanley Bank of America Merrill Lynch Trust Series 2015-C22 Class B ±± | | | 3.88 | | | | 4-15-2048 | | | | 1,455,000 | | | | 1,495,931 | |
Morgan Stanley Bank of America Merrill LynchTrust Series 2012-C5 Class A4 | | | 3.18 | | | | 8-15-2045 | | | | 60,000 | | | | 62,367 | |
| |
Total Non-Agency Mortgage-Backed Securities (Cost $18,063,108) | | | | 18,179,423 | |
| | | | | | | | | | | | | | | | |
| | | | |
U.S. Treasury Securities: 47.75% | | | | | | | | | | | | | | | | |
U.S. Treasury Bond | | | 2.50 | | | | 2-15-2046 | | | | 210,000 | | | | 200,370 | |
U.S. Treasury Bond | | | 2.75 | | | | 8-15-2042 | | | | 6,035,000 | | | | 6,113,031 | |
U.S. Treasury Bond | | | 2.75 | | | | 11-15-2042 | | | | 6,085,000 | | | | 6,158,210 | |
U.S. Treasury Bond | | | 2.88 | | | | 5-15-2043 | | | | 5,955,000 | | | | 6,153,888 | |
U.S. Treasury Bond | | | 3.00 | | | | 5-15-2042 | | | | 5,800,000 | | | | 6,151,852 | |
U.S. Treasury Bond | | | 3.00 | | | | 11-15-2044 | | | | 585,000 | | | | 618,295 | |
U.S. Treasury Bond | | | 3.00 | | | | 5-15-2045 | | | | 810,000 | | | | 855,056 | |
U.S. Treasury Bond | | | 3.00 | | | | 11-15-2045 | | | | 55,000 | | | | 58,029 | |
U.S. Treasury Bond | | | 3.00 | | | | 2-15-2047 | | | | 15,000 | | | | 15,829 | |
U.S. Treasury Bond | | | 3.00 | | | | 5-15-2047 | | | | 26,361,000 | | | | 27,830,420 | |
The accompanying notes are an integral part of these financial statements.
| | | | | | |
| Portfolio of investments—August 31, 2017 (unaudited) | | Wells Fargo Target Date Funds | | | 87 | |
BLOOMBERG BARCLAYS US AGGREGATE EX-CORPORATE PORTFOLIO
| | | | | | | | | | | | | | | | |
| Security name | | Interest rate | | | Maturity date | | | Principal | | | Value | |
| | | | |
U.S. Treasury Securities (continued) | | | | | | | | | | | | | | | | |
U.S. Treasury Bond | | | 3.13 | % | | | 11-15-2041 | | | $ | 5,670,000 | | | $ | 6,150,621 | |
U.S. Treasury Bond | | | 3.38 | | | | 5-15-2044 | | | | 1,565,000 | | | | 1,769,184 | |
U.S. Treasury Bond | | | 3.63 | | | | 8-15-2043 | | | | 1,100,000 | | | | 1,293,445 | |
U.S. Treasury Bond | | | 3.63 | | | | 2-15-2044 | | | | 35,000 | | | | 41,230 | |
U.S. Treasury Bond | | | 3.75 | | | | 11-15-2043 | | | | 5,100,000 | | | | 6,126,574 | |
U.S. Treasury Bond | | | 4.25 | | | | 11-15-2040 | | | | 2,775,000 | | | | 3,565,983 | |
U.S. Treasury Bond | | | 4.38 | | | | 5-15-2041 | | | | 4,665,000 | | | | 6,110,239 | |
U.S. Treasury Bond | | | 4.75 | | | | 2-15-2041 | | | | 390,000 | | | | 536,448 | |
U.S. Treasury Bond | | | 5.00 | | | | 5-15-2037 | | | | 5,504,000 | | | | 7,698,290 | |
U.S. Treasury Bond | | | 5.38 | | | | 2-15-2031 | | | | 2,017,000 | | | | 2,753,520 | |
U.S. Treasury Bond | | | 5.50 | | | | 8-15-2028 | | | | 110,000 | | | | 145,836 | |
U.S. Treasury Bond | | | 6.13 | | | | 11-15-2027 | | | | 1,195,000 | | | | 1,634,723 | |
U.S. Treasury Note | | | 0.75 | | | | 2-15-2019 | | | | 5,990,000 | | | | 5,943,203 | |
U.S. Treasury Note | | | 0.75 | | | | 7-15-2019 | | | | 50,000 | | | | 49,473 | |
U.S. Treasury Note | | | 0.88 | | | | 4-15-2019 | | | | 6,000,000 | | | | 5,957,344 | |
U.S. Treasury Note | | | 1.00 | | | | 3-15-2019 | | | | 5,965,000 | | | | 5,937,505 | |
U.S. Treasury Note | | | 1.00 | | | | 11-15-2019 | | | | 2,360,000 | | | | 2,342,023 | |
U.S. Treasury Note | | | 1.00 | | | | 11-30-2019 | | | | 6,015,000 | | | | 5,969,653 | |
U.S. Treasury Note | | | 1.13 | | | | 1-31-2019 | | | | 5,895,000 | | | | 5,880,953 | |
U.S. Treasury Note | | | 1.13 | | | | 2-28-2019 | | | | 5,965,000 | | | | 5,950,553 | |
U.S. Treasury Note | | | 1.13 | | | | 12-31-2019 | | | | 6,010,000 | | | | 5,978,307 | |
U.S. Treasury Note | | | 1.13 | | | | 6-30-2021 | | | | 730,000 | | | | 717,596 | |
U.S. Treasury Note | | | 1.25 | | | | 12-31-2018 | | | | 2,855,000 | | | | 2,853,996 | |
U.S. Treasury Note | | | 1.25 | | | | 1-31-2019 | | | | 5,945,000 | | | | 5,942,213 | |
U.S. Treasury Note | | | 1.25 | | | | 3-31-2019 | | | | 5,960,000 | | | | 5,954,180 | |
U.S. Treasury Note | | | 1.25 | | | | 4-30-2019 | | | | 5,960,000 | | | | 5,954,180 | |
U.S. Treasury Note | | | 1.25 | | | | 5-31-2019 | | | | 310,000 | | | | 309,649 | |
U.S. Treasury Note | | | 1.25 | | | | 6-30-2019 | | | | 20,000 | | | | 19,975 | |
U.S. Treasury Note | | | 1.25 | | | | 2-29-2020 | | | | 4,680,000 | | | | 4,665,558 | |
U.S. Treasury Note | | | 1.25 | | | | 3-31-2021 | | | | 6,035,000 | | | | 5,972,764 | |
U.S. Treasury Note | | | 1.25 | | | | 10-31-2021 | | | | 6,010,000 | | | | 5,918,441 | |
U.S. Treasury Note | | | 1.38 | | | | 2-28-2019 | | | | 5,935,000 | | | | 5,942,187 | |
U.S. Treasury Note | | | 1.38 | | | | 12-15-2019 | | | | 5,970,000 | | | | 5,972,565 | |
U.S. Treasury Note | | | 1.38 | | | | 10-31-2020 | | | | 3,365,000 | | | | 3,354,090 | |
U.S. Treasury Note | | | 1.38 | | | | 1-31-2021 | | | | 1,750,000 | | | | 1,741,660 | |
U.S. Treasury Note | | | 1.38 | | | | 4-30-2021 | | | | 6,025,000 | | | | 5,985,226 | |
U.S. Treasury Note | | | 1.38 | | | | 5-31-2021 | | | | 6,035,000 | | | | 5,990,916 | |
U.S. Treasury Note | | | 1.38 | | | | 6-30-2023 | | | | 6,170,000 | | | | 6,015,750 | |
U.S. Treasury Note | | | 1.38 | | | | 8-31-2023 | | | | 435,000 | | | | 423,292 | |
U.S. Treasury Note | | | 1.38 | | | | 9-30-2023 | | | | 6,135,000 | | | | 5,967,006 | |
U.S. Treasury Note | | | 1.50 | | | | 1-31-2019 | | | | 385,000 | | | | 386,083 | |
U.S. Treasury Note | | | 1.50 | | | | 2-28-2019 | | | | 5,920,000 | | | | 5,936,419 | |
U.S. Treasury Note | | | 1.50 | | | | 3-31-2019 | | | | 5,930,000 | | | | 5,948,995 | |
U.S. Treasury Note | | | 1.50 | | | | 11-30-2019 | | | | 5,950,000 | | | | 5,969,059 | |
U.S. Treasury Note | | | 1.50 | | | | 6-15-2020 | | | | 56,243,000 | | | | 56,379,214 | |
U.S. Treasury Note | | | 1.50 | | | | 3-31-2023 | | | | 6,085,000 | | | | 5,988,258 | |
U.S. Treasury Note | | | 1.50 | | | | 8-15-2026 | | | | 5,880,000 | | | | 5,595,647 | |
U.S. Treasury Note | | | 1.63 | | | | 3-31-2019 | | | | 5,905,000 | | | | 5,934,756 | |
U.S. Treasury Note | | | 1.63 | | | | 4-30-2019 | | | | 5,915,000 | | | | 5,946,423 | |
U.S. Treasury Note | | | 1.63 | | | | 12-31-2019 | | | | 5,935,000 | | | | 5,970,471 | |
The accompanying notes are an integral part of these financial statements.
| | | | |
| 88 | | Wells Fargo Target Date Funds | | Portfolio of investments—August 31, 2017 (unaudited) |
BLOOMBERG BARCLAYS US AGGREGATE EX-CORPORATE PORTFOLIO
| | | | | | | | | | | | | | | | |
| Security name | | Interest rate | | | Maturity date | | | Principal | | | Value | |
| | | | |
U.S. Treasury Securities (continued) | | | | | | | | | | | | | | | | |
U.S. Treasury Note | | | 1.63 | % | | | 3-15-2020 | | | $ | 10,000 | | | $ | 10,061 | |
U.S. Treasury Note | | | 1.63 | | | | 4-30-2023 | | | | 6,070,000 | | | | 6,008,352 | |
U.S. Treasury Note | | | 1.63 | | | | 5-31-2023 | | | | 6,085,000 | | | | 6,021,060 | |
U.S. Treasury Note | | | 1.63 | | | | 10-31-2023 | | | | 6,080,000 | | | | 5,998,300 | |
U.S. Treasury Note | | | 1.63 | | | | 2-15-2026 | | | | 6,240,000 | | | | 6,026,231 | |
U.S. Treasury Note | | | 1.63 | | | | 5-15-2026 | | | | 6,285,000 | | | | 6,056,678 | |
U.S. Treasury Note | | | 1.75 | | | | 12-31-2020 | | | | 10,000 | | | | 10,078 | |
U.S. Treasury Note | | | 1.75 | | | | 11-30-2021 | | | | 5,965,000 | | | | 5,991,563 | |
U.S. Treasury Note | | | 1.75 | | | | 2-28-2022 | | | | 1,030,000 | | | | 1,033,661 | |
U.S. Treasury Note | | | 1.75 | | | | 6-30-2022 | | | | 34,453,000 | | | | 34,516,254 | |
U.S. Treasury Note | | | 1.75 | | | | 5-15-2023 | | | | 6,035,000 | | | | 6,011,897 | |
U.S. Treasury Note | | | 1.88 | | | | 11-30-2021 | | | | 5,925,000 | | | | 5,985,176 | |
U.S. Treasury Note | | | 1.88 | | | | 7-31-2022 | | | | 1,670,000 | | | | 1,682,460 | |
U.S. Treasury Note | | | 1.88 | | | | 8-31-2024 | | | | 5,285,000 | | | | 5,258,781 | |
U.S. Treasury Note | | | 2.00 | | | | 5-31-2021 | | | | 5,890,000 | | | | 5,981,801 | |
U.S. Treasury Note | | | 2.00 | | | | 10-31-2021 | | | | 5,895,000 | | | | 5,982,043 | |
U.S. Treasury Note | | | 2.00 | | | | 11-15-2021 | | | | 5,895,000 | | | | 5,985,958 | |
U.S. Treasury Note | | | 2.00 | | | | 12-31-2021 | | | | 3,630,000 | | | | 3,682,607 | |
U.S. Treasury Note | | | 2.00 | | | | 2-15-2023 | | | | 30,000 | | | | 30,330 | |
U.S. Treasury Note | | | 2.00 | | | | 6-30-2024 | | | | 24,961,000 | | | | 25,061,429 | |
U.S. Treasury Note | | | 2.00 | | | | 2-15-2025 | | | | 5,995,000 | | | | 5,996,639 | |
U.S. Treasury Note | | | 2.00 | | | | 8-15-2025 | | | | 6,025,000 | | | | 6,011,114 | |
U.S. Treasury Note | | | 2.13 | | | | 12-31-2021 | | | | 5,885,000 | | | | 6,000,401 | |
U.S. Treasury Note | | | 2.13 | | | | 12-31-2022 | | | | 3,190,000 | | | | 3,246,697 | |
U.S. Treasury Note | | | 2.13 | | | | 11-30-2023 | | | | 4,850,000 | | | | 4,925,402 | |
U.S. Treasury Note | | | 2.13 | | | | 7-31-2024 | | | | 2,455,000 | | | | 2,483,865 | |
U.S. Treasury Note | | | 2.13 | | | | 5-15-2025 | | | | 5,985,000 | | | | 6,033,394 | |
U.S. Treasury Note | | | 2.25 | | | | 3-31-2021 | | | | 5,810,000 | | | | 5,952,300 | |
U.S. Treasury Note | | | 2.25 | | | | 4-30-2021 | | | | 5,825,000 | | | | 5,968,350 | |
U.S. Treasury Note | | | 2.25 | | | | 11-15-2025 | | | | 1,710,000 | | | | 1,736,251 | |
U.S. Treasury Note | | | 2.38 | | | | 8-15-2024 | | | | 35,000 | | | | 35,983 | |
U.S. Treasury Note | | | 2.38 | | | | 5-15-2027 | | | | 11,113,000 | | | | 11,354,360 | |
U.S. Treasury Note | | | 2.75 | | | | 11-15-2023 | | | | 50,000 | | | | 52,623 | |
U.S. Treasury Note | | | 3.13 | | | | 5-15-2019 | | | | 5,680,000 | | | | 5,853,506 | |
U.S. Treasury Note | | | 3.13 | | | | 5-15-2021 | | | | 5,640,000 | | | | 5,957,691 | |
U.S. Treasury Note | | | 3.38 | | | | 11-15-2019 | | | | 5,685,000 | | | | 5,935,495 | |
U.S. Treasury Note | | | 6.00 | | | | 2-15-2026 | | | | 1,485,000 | | | | 1,945,408 | |
U.S. Treasury Note | | | 6.50 | | | | 11-15-2026 | | | | 3,485,000 | | | | 4,781,257 | |
U.S. Treasury Note | | | 8.00 | | | | 11-15-2021 | | | | 760,000 | | | | 956,561 | |
U.S. Treasury Note | | | 8.13 | | | | 8-15-2019 | | | | 55,000 | | | | 62,187 | |
U.S. Treasury Note | | | 8.13 | | | | 5-15-2021 | | | | 2,490,000 | | | | 3,077,776 | |
U.S. Treasury Note | | | 8.75 | | | | 5-15-2020 | | | | 1,865,000 | | | | 2,229,695 | |
U.S. Treasury Note | | | 9.00 | | | | 11-15-2018 | | | | 1,925,000 | | | | 2,104,416 | |
| |
Total U.S. Treasury Securities (Cost $543,936,181) | | | | 549,782,747 | |
| | | | | | | | | | | | | | | | |
| | | | |
Yankee Corporate Bonds and Notes: 0.99% | | | | | | | | | | | | | | | | |
| | | | |
Energy: 0.57% | | | | | | | | | | | | | | | | |
| | | | |
| Oil, Gas & Consumable Fuels: 0.57% | | | | | | | | | | | | | | | | |
Ecopetrol SA | | | 4.25 | | | | 9-18-2018 | | | | 1,040,000 | | | | 1,064,440 | |
Ecopetrol SA | | | 7.38 | | | | 9-18-2043 | | | | 40,000 | | | | 45,040 | |
The accompanying notes are an integral part of these financial statements.
| | | | | | |
| Portfolio of investments—August 31, 2017 (unaudited) | | Wells Fargo Target Date Funds | | | 89 | |
BLOOMBERG BARCLAYS US AGGREGATE EX-CORPORATE PORTFOLIO
| | | | | | | | | | | | | | | | |
| Security name | | Interest rate | | | Maturity date | | | Principal | | | Value | |
| | | | |
| Oil, Gas & Consumable Fuels (continued) | | | | | | | | | | | | | | | | |
Nexen Incorporated | | | 7.50 | % | | | 7-30-2039 | | | $ | 320,000 | | | $ | 472,118 | |
Nexen Incorporated | | | 7.88 | | | | 3-15-2032 | | | | 200,000 | | | | 289,872 | |
Petroleos Mexicanos Company | | | 5.50 | | | | 6-27-2044 | | | | 2,130,000 | | | | 2,004,330 | |
Petroleos Mexicanos Company 144A | | | 6.50 | | | | 3-13-2027 | | | | 530,000 | | | | 592,526 | |
Petroleos Mexicanos Company | | | 6.50 | | | | 6-2-2041 | | | | 110,000 | | | | 115,363 | |
Petroleos Mexicanos Company | | | 8.00 | | | | 5-3-2019 | | | | 1,080,000 | | | | 1,182,600 | |
Statoil ASA | | | 2.90 | | | | 11-8-2020 | | | | 110,000 | | | | 113,349 | |
Statoil ASA | | | 4.80 | | | | 11-8-2043 | | | | 560,000 | | | | 641,666 | |
| |
| | | | 6,521,304 | |
| | | | | | | | | | | | | | | | |
| | | | |
Financials: 0.42% | | | | | | | | | | | | | | | | |
| | | | |
| Banks: 0.42% | | | | | | | | | | | | | | | | |
Corporacion Andina de Fomento | | | 2.13 | | | | 9-27-2021 | | | | 10,000 | | | | 9,951 | |
Corporación Andina de Fomento | | | 4.38 | | | | 6-15-2022 | | | | 270,000 | | | | 293,193 | |
Export-Import Bank of Korea | | | 2.88 | | | | 1-21-2025 | | | | 400,000 | | | | 396,532 | |
Export-Import Bank of Korea | | | 5.13 | | | | 6-29-2020 | | | | 1,180,000 | | | | 1,267,426 | |
Japan Bank for International Cooperation | | | 1.88 | | | | 4-20-2021 | | | | 2,550,000 | | | | 2,531,081 | |
Nordic Investment Bank | | | 1.25 | | | | 8-2-2021 | | | | 400,000 | | | | 392,564 | |
| |
| | | | 4,890,747 | |
| | | | | | | | | | | | | | | | |
| |
Total Yankee Corporate Bonds and Notes (Cost $11,238,181) | | | | 11,412,051 | |
| | | | | | | | | | | | | | | | |
| | | | |
Yankee Government Bonds: 4.94% | | | | | | | | | | | | | | | | |
African Development Bank | | | 1.13 | | | | 9-20-2019 | | | | 880,000 | | | | 873,488 | |
Israel AID Bond | | | 5.50 | | | | 4-26-2024 | | | | 60,000 | | | | 72,462 | |
Asian Development Bank | | | 1.63 | | | | 5-5-2020 | | | | 140,000 | | | | 140,242 | |
Asian Development Bank | | | 2.00 | | | | 2-16-2022 | | | | 1,620,000 | | | | 1,633,538 | |
Asian Development Bank | | | 2.63 | | | | 1-12-2027 | | | | 900,000 | | | | 926,770 | |
Asian Development Bank | | | 5.82 | | | | 6-16-2028 | | | | 10,000 | | | | 12,755 | |
Asian Development Bank | | | 6.22 | | | | 8-15-2027 | | | | 470,000 | | | | 623,747 | |
Canada Government Bond | | | 1.63 | | | | 2-27-2019 | | | | 245,000 | | | | 245,938 | |
Council of Europe | | | 1.88 | | | | 1-27-2020 | | | | 370,000 | | | | 372,829 | |
European Bank for Reconstruction and Development | | | 0.88 | | | | 7-22-2019 | | | | 60,000 | | | | 59,105 | |
European Bank for Reconstruction and Development | | | 2.13 | | | | 3-7-2022 | | | | 1,190,000 | | | | 1,202,985 | |
European Investment Bank | | | 1.25 | | | | 12-16-2019 | | | | 1,680,000 | | | | 1,668,398 | |
European Investment Bank | | | 1.38 | | | | 6-15-2020 | | | | 1,740,000 | | | | 1,729,455 | |
European Investment Bank | | | 1.63 | | | | 8-14-2020 | | | | 570,000 | | | | 570,038 | |
European Investment Bank | | | 1.63 | | | | 12-15-2020 | | | | 280,000 | | | | 279,399 | |
European Investment Bank | | | 1.88 | | | | 3-15-2019 | | | | 170,000 | | | | 171,081 | |
European Investment Bank | | | 1.88 | | | | 2-10-2025 | | | | 110,000 | | | | 107,786 | |
European Investment Bank | | | 2.38 | | | | 6-15-2022 | | | | 1,540,000 | | | | 1,573,892 | |
Export Development Canada | | | 1.25 | | | | 12-10-2018 | | | | 100,000 | | | | 99,804 | |
Export Development Canada | | | 1.63 | | | | 1-17-2020 | | | | 1,170,000 | | | | 1,173,587 | |
FMS Wertmanagement | | | 1.75 | | | | 3-17-2020 | | | | 550,000 | | | | 552,373 | |
Hydro-Quebec | | | 9.40 | | | | 2-1-2021 | | | | 1,195,000 | | | | 1,458,942 | |
Inter-American Development Bank | | | 1.50 | | | | 9-25-2018 | | | | 720,000 | | | | 720,671 | |
Inter-American Development Bank | | | 1.75 | | | | 4-14-2022 | | | | 1,590,000 | | | | 1,582,905 | |
Inter-American Development Bank | | | 2.13 | | | | 1-18-2022 | | | | 590,000 | | | | 597,973 | |
Inter-American Development Bank | | | 2.13 | | | | 1-15-2025 | | | | 10,000 | | | | 10,000 | |
The accompanying notes are an integral part of these financial statements.
| | | | |
| 90 | | Wells Fargo Target Date Funds | | Portfolio of investments—August 31, 2017 (unaudited) |
BLOOMBERG BARCLAYS US AGGREGATE EX-CORPORATE PORTFOLIO
| | | | | | | | | | | | | | | | |
| Security name | | Interest rate | | | Maturity date | | | Principal | | | Value | |
| | | | |
Yankee Government Bonds (continued) | | | | | | | | | | | | | | | | |
Inter-American Development Bank | | | 3.20 | % | | | 8-7-2042 | | | $ | 80,000 | | | $ | 81,211 | |
Inter-American Development Bank | | | 3.88 | | | | 2-14-2020 | | | | 140,000 | | | | 147,679 | |
Inter-American Development Bank | | | 4.38 | | | | 1-24-2044 | | | | 40,000 | | | | 49,012 | |
International Bank for Reconstruction and Development | | | 1.00 | | | | 10-5-2018 | | | | 1,120,000 | | | | 1,115,342 | |
International Bank for Reconstruction and Development | | | 1.25 | | | | 7-26-2019 | | | | 2,115,000 | | | | 2,106,183 | |
International Bank for Reconstruction and Development | | | 1.38 | | | | 3-30-2020 | | | | 850,000 | | | | 846,501 | |
International Bank for Reconstruction and Development | | | 1.38 | | | | 5-24-2021 | | | | 1,740,000 | | | | 1,719,651 | |
International Bank for Reconstruction and Development | | | 1.88 | | | | 3-15-2019 | | | | 40,000 | | | | 40,252 | |
International Bank for Reconstruction and Development | | | 2.00 | | | | 1-26-2022 | | | | 240,000 | | | | 241,881 | |
International Bank for Reconstruction and Development | | | 2.50 | | | | 7-29-2025 | | | | 10,000 | | | | 10,154 | |
International Bank for Reconstruction and Development | | | 4.75 | | | | 2-15-2035 | | | | 130,000 | | | | 163,908 | |
International Finance Corporation | | | 1.75 | | | | 9-4-2018 | | | | 1,170,000 | | | | 1,174,375 | |
Italy Government Bond | | | 5.38 | | | | 6-15-2033 | | | | 200,000 | | | | 233,014 | |
Italy Government Bond | | | 6.88 | | | | 9-27-2023 | | | | 255,000 | | | | 306,408 | |
KfW | | | 1.50 | | | | 6-15-2021 | | | | 2,910,000 | | | | 2,884,976 | |
KfW | | | 2.00 | | | | 5-2-2025 | | | | 40,000 | | | | 39,561 | |
KfW | | | 2.13 | | | | 3-7-2022 | | | | 2,390,000 | | | | 2,418,618 | |
KfW | | | 2.13 | | | | 6-15-2022 | | | | 130,000 | | | | 131,434 | |
KfW | | | 2.13 | | | | 1-17-2023 | | | | 400,000 | | | | 403,711 | |
KfW | | | 2.75 | | | | 9-8-2020 | | | | 2,660,000 | | | | 2,747,178 | |
Korea Development Bank | | | 2.25 | | | | 5-18-2020 | | | | 650,000 | | | | 649,165 | |
Landwirtschaftliche Rentenbank | | | 1.75 | | | | 7-27-2026 | | | | 10,000 | | | | 9,562 | |
Landwirtschaftliche Rentenbank | | | 1.88 | | | | 9-17-2018 | | | | 90,000 | | | | 90,446 | |
Landwirtschaftliche Rentenbank | | | 2.25 | | | | 10-1-2021 | | | | 1,210,000 | | | | 1,231,069 | |
Oesterreichische Kontrollbank Aktiengesellschaft | | | 1.13 | | | | 4-26-2019 | | | | 1,070,000 | | | | 1,062,774 | |
Oriental Republic of Uruguay | | | 4.50 | | | | 8-14-2024 | | | | 105,000 | | | | 115,763 | |
Oriental Republic of Uruguay | | | 5.10 | | | | 6-18-2050 | | | | 670,000 | | | | 706,850 | |
Province of Alberta | | | 1.90 | | | | 12-6-2019 | | | | 230,000 | | | | 230,531 | |
Province of Alberta | | | 2.20 | | | | 7-26-2022 | | | | 90,000 | | | | 90,373 | |
Province of British Columbia | | | 2.00 | | | | 10-23-2022 | | | | 15,000 | | | | 14,995 | |
Province of British Columbia | | | 2.25 | | | | 6-2-2026 | | | | 530,000 | | | | 523,073 | |
Province of Manitoba | | | 2.10 | | | | 9-6-2022 | | | | 530,000 | | | | 529,285 | |
Province of Manitoba | | | 2.13 | | | | 6-22-2026 | | | | 20,000 | | | | 19,225 | |
Province of Ontario | | | 1.63 | | | | 1-18-2019 | | | | 160,000 | | | | 160,181 | |
Province of Ontario | | | 2.00 | | | | 9-27-2018 | | | | 90,000 | | | | 90,414 | |
Province of Ontario | | | 2.50 | | | | 4-27-2026 | | | | 690,000 | | | | 688,697 | |
Province of Ontario | | | 3.20 | | | | 5-16-2024 | | | | 5,000 | | | | 5,264 | |
Province of Ontario | | | 4.40 | | | | 4-14-2020 | | | | 1,040,000 | | | | 1,109,471 | |
Province of Quebec | | | 2.50 | | | | 4-20-2026 | | | | 75,000 | | | | 75,161 | |
Province of Quebec | | | 2.63 | | | | 2-13-2023 | | | | 60,000 | | | | 61,533 | |
Republic of Chile | | | 2.25 | | | | 10-30-2022 | | | | 200,000 | | | | 200,180 | |
Republic of Chile | | | 3.63 | | | | 10-30-2042 | | | | 285,000 | | | | 287,850 | |
Republic of Colombia | | | 4.38 | | | | 7-12-2021 | | | | 805,000 | | | | 859,338 | |
Republic of Colombia | | | 6.13 | | | | 1-18-2041 | | | | 100,000 | | | | 118,625 | |
Republic of Colombia | | | 7.38 | | | | 9-18-2037 | | | | 815,000 | | | | 1,079,875 | |
Republic of Hungary | | | 4.00 | | | | 3-25-2019 | | | | 610,000 | | | | 629,032 | |
Republic of Hungary | | | 5.38 | | | | 3-25-2024 | | | | 15,000 | | | | 17,303 | |
Republic of Hungary | | | 6.38 | | | | 3-29-2021 | | | | 30,000 | | | | 33,993 | |
Republic of Hungary | | | 7.63 | | | | 3-29-2041 | | | | 245,000 | | | | 378,211 | |
Republic of Korea | | | 3.88 | | | | 9-11-2023 | | | | 415,000 | | | | 445,693 | |
The accompanying notes are an integral part of these financial statements.
| | | | | | |
| Portfolio of investments—August 31, 2017 (unaudited) | | Wells Fargo Target Date Funds | | | 91 | |
BLOOMBERG BARCLAYS US AGGREGATE EX-CORPORATE PORTFOLIO
| | | | | | | | | | | | | | | | |
| Security name | | Interest rate | | | Maturity date | | | Principal | | | Value | |
| | | | |
Yankee Government Bonds (continued) | | | | | | | | | | | | | | | | |
Republic of Panama | | | 6.70 | % | | | 1-26-2036 | | | $ | 20,000 | | | $ | 26,700 | |
Republic of Panama | | | 9.38 | | | | 4-1-2029 | | | | 595,000 | | | | 899,938 | |
Republic of Peru | | | 5.63 | | | | 11-18-2050 | | | | 535,000 | | | | 676,775 | |
Republic of Peru | | | 7.35 | | | | 7-21-2025 | | | | 240,000 | | | | 316,560 | |
Republic of Philippines | | | 5.50 | | | | 3-30-2026 | | | | 955,000 | | | | 1,150,595 | |
Republic of Poland | | | 3.00 | | | | 3-17-2023 | | | | 960,000 | | | | 988,080 | |
Republic of Poland | | | 3.25 | | | | 4-6-2026 | | | | 10,000 | | | | 10,333 | |
Republic of Poland | | | 5.13 | | | | 4-21-2021 | | | | 10,000 | | | | 11,050 | |
Republic of the Philippines | | | 4.00 | | | | 1-15-2021 | | | | 105,000 | | | | 111,826 | |
Republic of the Philippines | | | 6.38 | | | | 1-15-2032 | | | | 200,000 | | | | 264,607 | |
Republic of the Philippines | | | 6.38 | | | | 10-23-2034 | | | | 475,000 | | | | 642,271 | |
State of Israel | | | 2.88 | | | | 3-16-2026 | | | | 205,000 | | | | 208,377 | |
State of Israel | | | 4.00 | | | | 6-30-2022 | | | | 365,000 | | | | 392,904 | |
Swedish Export Credit ¤ | | | 0.00 | | | | 5-11-2037 | | | | 275,000 | | | | 145,686 | |
Swedish Export Credit | | | 1.88 | | | | 6-23-2020 | | | | 800,000 | | | | 804,403 | |
United Mexican States | | | 4.00 | | | | 10-2-2023 | | | | 120,000 | | | | 127,020 | |
United Mexican States | | | 4.13 | | | | 1-21-2026 | | | | 200,000 | | | | 211,588 | |
United Mexican States | | | 5.75 | | | | 10-12-2110 | | | | 1,045,000 | | | | 1,127,033 | |
United Mexican States | | | 7.50 | | | | 4-8-2033 | | | | 715,000 | | | | 981,338 | |
United Mexican States | | | 8.13 | | | | 12-30-2019 | | | | 810,000 | | | | 938,588 | |
| | | | |
Total Yankee Government Bonds (Cost $56,479,245) | | | | | | | | | | | | | | | 56,870,816 | |
| | | | | | | | | | | | | | | | |
| | | | |
| | | Yield | | | | | | Shares | | | | |
| Short-Term Investments: 8.51% | | | | | | | | | | | | | | | | |
| | | | |
| Investment Companies: 8.51% | | | | | | | | | | | | | | | | |
Wells Fargo Government Money Market Select Class (l)(u)## | | | 0.92 | | | | | | | | 97,959,223 | | | | 97,959,223 | |
| | | | | | | | | | | | | | | | |
| | | | |
Total Short-Term Investments (Cost $97,959,223) | | | | | | | | | | | | | | | 97,959,223 | |
| | | | | | | | | | | | | | | | |
| | | | | | | | |
| Total investments in securities (Cost $1,198,697,972) | | | 104.88 | % | | | 1,207,655,984 | |
Other assets and liabilities, net | | | (4.88 | ) | | | (56,213,681 | ) |
| | | | | | | | |
| Total net assets | | | 100.00 | % | | $ | 1,151,442,303 | |
| | | | | | | | |
| %% | The security is issued on a when-issued basis. |
| ±± | The coupon of the security is adjusted based on the principal and interest payments received from the underlying pool of mortgages as well as the credit quality and the actual prepayment speed of the underlying mortgages. |
| ¤ | The security is issued in zero coupon form with no periodic interest payments. |
| 144A | The security may be resold in transactions exempt from registration, normally to qualified institutional buyers, pursuant to Rule 144A under the Securities Act of 1933. |
| (l) | The issuer of the security is an affiliated person of the Portfolio as defined in the Investment Company Act of 1940. |
| (u) | The rate represents the 7-day annualized yield at period end. |
| ## | All or a portion of this security is segregated for when-issued securities. |
The accompanying notes are an integral part of these financial statements.
| | | | |
| 92 | | Wells Fargo Target Date Funds | | Portfolio of investments—August 31, 2017 (unaudited) |
BLOOMBERG BARCLAYS US AGGREGATE EX-CORPORATE PORTFOLIO
Investments In Affiliates
An affiliated investment is an investment in which the Portfolio owns at least 5% of the outstanding voting shares of the issuer or as a result of other relationships, such as the Portfolio and the issuer having the same investment manager. Transactions with issuers that were either affiliated persons of the Portfolio at the beginning of the period or the end of the period were as follows:
| | | | | | | | | | | | | | | | | | | | | | | | | | | | | | | | |
| | | Shares, beginning of period | | | Shares purchased | | | Shares sold | | | Shares, end of period | | | Net realized gains (losses) | | | Net change
in unrealized gains (losses) | | | Income from affiliated securities | | | Value, end of period | |
Investment companies - 8.51% | | | | | | | | | | | | | | | | | | | | | | | | | | | | | | | | |
Wells Fargo Government Money Market Fund Select Class | | | 0 | | | | 295,863,417 | | | | 197,904,194 | | | | 97,959,223 | | | $ | 0 | | | $ | 0 | | | $ | 156,388 | | | $ | 97,959,223 | |
The accompanying notes are an integral part of these financial statements.
| | | | | | |
| Portfolio of investments—August 31, 2017 (unaudited) | | Wells Fargo Target Date Funds | | | 93 | |
EMERGING MARKETS BOND PORTFOLIO
| | | | | | | | | | | | | | | | |
| Security name | | Interest rate | | | Expiration date | | | Principal | | | Value | |
| | | | |
Participation Notes: 1.10% | | | | | | | | | | | | | | | | |
| | | | |
| Ireland: 0.78% | | | | | | | | | | | | | | | | |
RZD Capital PLC (Russian Railways) (Energy, Oil, Gas & Consumable Fuels) | | | 4.38 | % | | | 3-1-2024 | | | $ | 750,000 | | | $ | 757,500 | |
| | | | | | | | | | | | | | | | |
| | | | |
| United Kingdom: 0.32% | | | | | | | | | | | | | | | | |
Biz Finance PLC (State Export-Import Ukreximbank) (Financials, Banks) | | | 9.63 | | | | 4-27-2022 | | | | 300,000 | | | | 316,260 | |
| | | | | | | | | | | | | | | | |
| | | | |
Total Participation Notes (Cost $1,072,073) | | | | | | | | | | | | | | | 1,073,760 | |
| | | | | | | | | | | | | | | | |
| | | | |
| | | | | | Maturity date | | | | | | | |
| Yankee Corporate Bonds and Notes: 14.08% | | | | | | | | | | | | | | | | |
| | | | |
| Azerbaijan: 1.03% | | | | | | | | | | | | | | | | |
State Oil Company of the Azerbaijan Republic (Energy, Oil, Gas & Consumable Fuels) | | | 4.75 | | | | 3-13-2023 | | | | 1,000,000 | | | | 1,005,000 | |
| | | | | | | | | | | | | | | | |
| | | | |
| Brazil: 0.20% | | | | | | | | | | | | | | | | |
Caixa Economica Federal (Financials, Banks) | | | 3.50 | | | | 11-7-2022 | | | | 200,000 | | | | 195,300 | |
| | | | | | | | | | | | | | | | |
| | | | |
| Chile: 1.81% | | | | | | | | | | | | | | | | |
Banco del Estado de Chile (Financials, Banks) | | | 4.13 | | | | 10-7-2020 | | | | 300,000 | | | | 316,538 | |
Codelco Incorporated (Materials, Metals & Mining) | | | 4.88 | | | | 11-4-2044 | | | | 250,000 | | | | 273,069 | |
Codelco Incorporated (Materials, Metals & Mining) | | | 5.63 | | | | 9-21-2035 | | | | 1,000,000 | | | | 1,178,948 | |
| |
| | | | 1,768,555 | |
| | | | | | | | | | | | | | | | |
| | | | |
| China: 1.01% | | | | | | | | | | | | | | | | |
Export-Import Bank of China (Financials, Banks) | | | 2.00 | | | | 4-26-2021 | | | | 1,000,000 | | | | 986,471 | |
| | | | | | | | | | | | | | | | |
| | | | |
| Indonesia: 0.95% | | | | | | | | | | | | | | | | |
PT Pertamina Persero (Energy, Oil, Gas & Consumable Fuels) | | | 5.63 | | | | 5-20-2043 | | | | 200,000 | | | | 214,197 | |
PT Perusahaan Listrik Negara (Utilities, Electric Utilities) | | | 4.13 | | | | 5-15-2027 | | | | 700,000 | | | | 706,083 | |
| |
| | | | 920,280 | |
| | | | | | | | | | | | | | | | |
| | | | |
| Ireland: 0.30% | | | | | | | | | | | | | | | | |
Vnesheconombank (Finance, Banks) | | | 5.94 | | | | 11-21-2023 | | | | 275,000 | | | | 294,982 | |
| | | | | | | | | | | | | | | | |
| | | | |
| Kazakhstan: 0.68% | | | | | | | | | | | | | | | | |
KazMunayGas National Company JSC (Energy, Oil, Gas & Consumable Fuels) | | | 5.75 | | | | 4-30-2043 | | | | 650,000 | | | | 663,130 | |
| | | | | | | | | | | | | | | | |
| | | | |
| Malaysia: 1.63% | | | | | | | | | | | | | | | | |
Petronas Capital Limited (Energy, Oil, Gas & Consumable Fuels) | | | 3.13 | | | | 3-18-2022 | | | | 200,000 | | | | 205,583 | |
Petronas Capital Limited (Energy, Oil, Gas & Consumable Fuels) | | | 3.50 | | | | 3-18-2025 | | | | 216,000 | | | | 224,959 | |
Petronas Capital Limited (Energy, Oil, Gas & Consumable Fuels) | | | 7.88 | | | | 5-22-2022 | | | | 936,000 | | | | 1,158,688 | |
| |
| | | | 1,589,230 | |
| | | | | | | | | | | | | | | | |
| | | | |
| Mexico: 3.02% | | | | | | | | | | | | | | | | |
Petroleos Mexicanos Company (Energy, Oil, Gas & Consumable Fuels) | | | 3.50 | | | | 1-30-2023 | | | | 225,000 | | | | 223,031 | |
Petroleos Mexicanos Company (Energy, Oil, Gas & Consumable Fuels) | | | 4.88 | | | | 1-24-2022 | | | | 2,000,000 | | | | 2,107,800 | |
Petroleos Mexicanos Company (Energy, Oil, Gas & Consumable Fuels) | | | 5.38 | | | | 3-13-2022 | | | | 225,000 | | | | 241,425 | |
Petroleos Mexicanos Company (Energy, Oil, Gas & Consumable Fuels) | | | 5.63 | | | | 1-23-2046 | | | | 400,000 | | | | 376,520 | |
| |
| | | | 2,948,776 | |
| | | | | | | | | | | | | | | | |
The accompanying notes are an integral part of these financial statements.
| | | | |
| 94 | | Wells Fargo Target Date Funds | | Portfolio of investments—August 31, 2017 (unaudited) |
EMERGING MARKETS BOND PORTFOLIO
| | | | | | | | | | | | | | | | |
| Security name | | Interest rate | | | Maturity date | | | Principal | | | Value | |
| | | | |
| South Africa: 0.29% | | | | | | | | | | | | | | | | |
Eskom Holdings Limited (Utilities, Electric Utilities) | | | 5.75 | % | | | 1-26-2021 | | | $ | 275,000 | | | $ | 281,486 | |
| | | | | | | | | | | | | | | | |
| | | | |
| United Kingdom: 0.22% | | | | | | | | | | | | | | | | |
State Savings Bank of Ukraine JSC (Finance, Banks) | | | 9.63 | | | | 3-20-2025 | | | | 200,000 | | | | 210,540 | |
| | | | | | | | | | | | | | | | |
| | | | |
| Venezuela: 0.55% | | | | | | | | | | | | | | | | |
Petroleos de Venezuela SA (Energy, Oil, Gas & Consumable Fuels) | | | 5.38 | | | | 4-12-2027 | | | | 200,000 | | | | 60,500 | |
Petroleos de Venezuela SA (Energy, Oil, Gas & Consumable Fuels) | | | 6.00 | | | | 11-15-2026 | | | | 225,000 | | | | 67,500 | |
Petroleos de Venezuela SA (Energy, Oil, Gas & Consumable Fuels) | | | 9.00 | | | | 11-17-2021 | | | | 1,050,000 | | | | 409,500 | |
| |
| | | | 537,500 | |
| | | | | | | | | | | | | | | | |
| | | | |
| Virgin Islands (British): 2.39% | | | | | | | | | | | | | | | | |
Chinalco Capital Holding Company (Materials, Metals & Mining) | | | 4.00 | | | | 8-25-2021 | | | | 650,000 | | | | 655,879 | |
Sinochem Capital Company Limited (5 Year Treasury Constant Maturity +4.30%) (Materials, Chemicals) ± | | | 5.00 | | | | 12-29-2049 | | | | 275,000 | | | | 281,531 | |
Sinopec Group Overseas Development (2015) Limited (Energy, Oil, Gas & Consumable Fuels) | | | 4.10 | | | | 4-28-2045 | | | | 200,000 | | | | 201,974 | |
Sinopec Group Overseas Development (2016) Limited (Energy, Oil, Gas & Consumable Fuels) | | | 1.75 | | | | 9-29-2019 | | | | 1,200,000 | | | | 1,188,989 | |
| |
| | | | 2,328,373 | |
| | | | | | | | | | | | | | | | |
| |
Total Yankee Corporate Bonds and Notes (Cost $13,654,024) | | | | 13,729,623 | |
| | | | | | | | | | | | | | | | |
| | | | |
Yankee Government Bonds: 78.55% | | | | | | | | | | | | | | | | |
Arab Republic of Egypt | | | 5.88 | | | | 6-11-2025 | | | | 1,000,000 | | | | 1,014,692 | |
Arab Republic of Egypt | | | 6.13 | | | | 1-31-2022 | | | | 200,000 | | | | 208,200 | |
Arab Republic of Egypt | | | 8.50 | | | | 1-31-2047 | | | | 750,000 | | | | 840,000 | |
Banco Nacional de Desenvolvimento Economico e Social | | | 4.00 | | | | 4-14-2019 | | | | 900,000 | | | | 917,658 | |
China Development Bank | | | 4.00 | | | | 1-24-2037 | | | | 600,000 | | | | 620,960 | |
Dominican Republic | | | 5.95 | | | | 1-25-2027 | | | | 2,300,000 | | | | 2,495,500 | |
Export-Import Bank of India | | | 4.00 | | | | 1-14-2023 | | | | 275,000 | | | | 289,236 | |
Federation of Malaysia | | | 3.18 | | | | 4-27-2026 | | | | 900,000 | | | | 916,380 | |
Federative Republic of Brazil | | | 6.00 | | | | 4-7-2026 | | | | 1,973,000 | | | | 2,188,057 | |
Federative Republic of Brazil | | | 10.13 | | | | 5-15-2027 | | | | 425,000 | | | | 618,375 | |
Government of Jamaica | | | 6.75 | | | | 4-28-2028 | | | | 325,000 | | | | 377,000 | |
Government of Jamaica | | | 7.88 | | | | 7-28-2045 | | | | 500,000 | | | | 612,500 | |
Islamic Republic of Pakistan | | | 8.25 | | | | 4-15-2024 | | | | 800,000 | | | | 900,982 | |
Lebanese Republic | | | 6.00 | | | | 1-27-2023 | | | | 850,000 | | | | 835,499 | |
Lebanese Republic | | | 6.38 | | | | 3-9-2020 | | | | 200,000 | | | | 203,751 | |
Lebanese Republic | | | 6.60 | | | | 11-27-2026 | | | | 1,150,000 | | | | 1,140,085 | |
Lebanese Republic | | | 7.05 | | | | 11-2-2035 | | | | 200,000 | | | | 194,932 | |
Lebanese Republic | | | 8.25 | | | | 4-12-2021 | | | | 350,000 | | | | 374,675 | |
Oman Government International Bond | | | 4.75 | | | | 6-15-2026 | | | | 375,000 | | | | 374,250 | |
Oriental Republic of Uruguay | | | 5.10 | | | | 6-18-2050 | | | | 375,000 | | | | 395,625 | |
Republic of Argentina | | | 5.63 | | | | 1-26-2022 | | | | 2,150,000 | | | | 2,248,900 | |
Republic of Argentina | | | 7.50 | | | | 4-22-2026 | | | | 225,000 | | | | 252,563 | |
Republic of Argentina | | | 7.63 | | | | 4-22-2046 | | | | 1,250,000 | | | | 1,371,875 | |
Republic of Chile | | | 3.86 | | | | 6-21-2047 | | | | 550,000 | | | | 570,625 | |
Republic of Colombia | | | 3.88 | | | | 4-25-2027 | | | | 2,243,000 | | | | 2,285,617 | |
Republic of Colombia | | | 5.00 | | | | 6-15-2045 | | | | 236,000 | | | | 244,260 | |
Republic of Costa Rica | | | 5.63 | | | | 4-30-2043 | | | | 300,000 | | | | 272,625 | |
The accompanying notes are an integral part of these financial statements.
| | | | | | |
| Portfolio of investments—August 31, 2017 (unaudited) | | Wells Fargo Target Date Funds | | | 95 | |
EMERGING MARKETS BOND PORTFOLIO
| | | | | | | | | | | | | | | | |
| Security name | | Interest rate | | | Maturity date | | | Principal | | | Value | |
| | | | |
Yankee Government Bonds (continued) | | | | | | | | | | | | | | | | |
Republic of Costa Rica | | | 7.00 | % | | | 4-4-2044 | | | $ | 550,000 | | | $ | 578,188 | |
Republic of Croatia | | | 6.00 | | | | 1-26-2024 | | | | 425,000 | | | | 484,551 | |
Republic of Croatia | | | 6.63 | | | | 7-14-2020 | | | | 628,000 | | | | 693,953 | |
Republic of Ecuador | | | 7.95 | | | | 6-20-2024 | | | | 1,700,000 | | | | 1,663,875 | |
Republic of Ecuador | | | 10.50 | | | | 3-24-2020 | | | | 425,000 | | | | 454,219 | |
Republic of El Salvador | | | 6.38 | | | | 1-18-2027 | | | | 300,000 | | | | 288,750 | |
Republic of El Salvador | | | 7.65 | | | | 6-15-2035 | | | | 547,000 | | | | 545,633 | |
Republic of Gabon | | | 6.38 | | | | 12-12-2024 | | | | 700,000 | | | | 689,612 | |
Republic of Ghana | | | 8.13 | | | | 1-18-2026 | | | | 225,000 | | | | 238,757 | |
Republic of Ghana | | | 9.25 | | | | 9-15-2022 | | | | 600,000 | | | | 666,660 | |
Republic of Guatemala | | | 4.38 | | | | 6-5-2027 | | | | 800,000 | | | | 792,000 | |
Republic of Hungary | | | 5.38 | | | | 2-21-2023 | | | | 2,000,000 | | | | 2,267,700 | |
Republic of Hungary | | | 5.38 | | | | 3-25-2024 | | | | 200,000 | | | | 230,710 | |
Republic of Hungary | | | 6.25 | | | | 1-29-2020 | | | | 450,000 | | | | 491,625 | |
Republic of Indonesia | | | 4.55 | | | | 3-29-2026 | | | | 1,000,000 | | | | 1,063,750 | |
Republic of Indonesia | | | 5.88 | | | | 1-15-2024 | | | | 2,050,000 | | | | 2,368,705 | |
Republic of Indonesia | | | 7.75 | | | | 1-17-2038 | | | | 275,000 | | | | 392,806 | |
Republic of Iraq | | | 5.80 | | | | 1-15-2028 | | | | 500,000 | | | | 474,313 | |
Republic of Ivory Coast | | | 5.38 | | | | 7-23-2024 | | | | 375,000 | | | | 377,888 | |
Republic of Ivory Coast | | | 6.13 | | | | 6-15-2033 | | | | 500,000 | | | | 498,850 | |
Republic of Kazakhstan | | | 3.88 | | | | 10-14-2024 | | | | 1,400,000 | | | | 1,453,200 | |
Republic of Kazakhstan | | | 4.88 | | | | 10-14-2044 | | | | 300,000 | | | | 310,695 | |
Republic of Kenya | | | 6.88 | | | | 6-24-2024 | | | | 850,000 | | | | 891,608 | |
Republic of Lithuania | | | 6.63 | | | | 2-1-2022 | | | | 950,000 | | | | 1,116,250 | |
Republic of Namibia | | | 5.25 | | | | 10-29-2025 | | | | 200,000 | | | | 204,900 | |
Republic of Namibia | | | 5.50 | | | | 11-3-2021 | | | | 200,000 | | | | 215,750 | |
Republic of Panama | | | 4.00 | | | | 9-22-2024 | | | | 2,100,000 | | | | 2,254,350 | |
Republic of Panama | | | 4.50 | | | | 5-15-2047 | | | | 400,000 | | | | 429,000 | |
Republic of Paraguay | | | 4.63 | | | | 1-25-2023 | | | | 225,000 | | | | 237,375 | |
Republic of Paraguay | | | 5.00 | | | | 4-15-2026 | | | | 250,000 | | | | 270,625 | |
Republic of Peru | | | 6.55 | | | | 3-14-2037 | | | | 1,065,000 | | | | 1,443,075 | |
Republic of Peru | | | 7.35 | | | | 7-21-2025 | | | | 200,000 | | | | 263,800 | |
Republic of Peru | | | 8.75 | | | | 11-21-2033 | | | | 325,000 | | | | 511,875 | |
Republic of Philippines | | | 3.95 | | | | 1-20-2040 | | | | 1,850,000 | | | | 1,951,088 | |
Republic of Philippines | | | 5.50 | | | | 3-30-2026 | | | | 379,000 | | | | 456,624 | |
Republic of Poland | | | 3.25 | | | | 4-6-2026 | | | | 1,700,000 | | | | 1,756,610 | |
Republic of Poland | | | 5.13 | | | | 4-21-2021 | | | | 625,000 | | | | 690,625 | |
Republic of Senegal | | | 8.75 | | | | 5-13-2021 | | | | 850,000 | | | | 975,375 | |
Republic of Serbia | | | 4.88 | | | | 2-25-2020 | | | | 425,000 | | | | 446,386 | |
Republic of Serbia | | | 5.88 | | | | 12-3-2018 | | | | 950,000 | | | | 991,420 | |
Republic of South Africa | | | 4.88 | | | | 4-14-2026 | | | | 1,800,000 | | | | 1,847,326 | |
Republic of South Africa | | | 6.25 | | | | 3-8-2041 | | | | 200,000 | | | | 222,254 | |
Republic of Sri Lanka | | | 5.88 | | | | 7-25-2022 | | | | 450,000 | | | | 478,173 | |
Republic of Turkey | | | 3.25 | | | | 3-23-2023 | | | | 250,000 | | | | 239,692 | |
Republic of Turkey | | | 5.63 | | | | 3-30-2021 | | | | 411,000 | | | | 439,415 | |
Republic of Turkey | | | 6.63 | | | | 2-17-2045 | | | | 1,650,000 | | | | 1,891,032 | |
Republic of Turkey | | | 8.00 | | | | 2-14-2034 | | | | 200,000 | | | | 255,736 | |
Republic of Venezuela | | | 6.00 | | | | 12-9-2020 | | | | 425,000 | | | | 163,625 | |
Republic of Venezuela | | | 9.00 | | | | 5-7-2023 | | | | 1,210,000 | | | | 438,625 | |
Republic of Venezuela | | | 9.25 | | | | 9-15-2027 | | | | 300,000 | | | | 117,750 | |
The accompanying notes are an integral part of these financial statements.
| | | | |
| 96 | | Wells Fargo Target Date Funds | | Portfolio of investments—August 31, 2017 (unaudited) |
EMERGING MARKETS BOND PORTFOLIO
| | | | | | | | | | | | | | | | |
| Security name | | Interest rate | | | Maturity date | | | Principal | | | Value | |
| | | | |
Yankee Government Bonds (continued) | | | | | | | | | | | | | | | | |
Republic of Zambia | | | 8.50 | % | | | 4-14-2024 | | | $ | 200,000 | | | $ | 216,940 | |
Republica Orient Uruguay | | | 4.13 | | | | 11-20-2045 | | | | 1,400,000 | | | | 1,365,000 | |
Republica Orient Uruguay | | | 8.00 | | | | 11-18-2022 | | | | 270,000 | | | | 330,750 | |
Romania | | | 6.13 | | | | 1-22-2044 | | | | 200,000 | | | | 256,270 | |
Romania | | | 6.75 | | | | 2-7-2022 | | | | 802,000 | | | | 935,790 | |
Russian Federation | | | 4.50 | | | | 4-4-2022 | | | | 600,000 | | | | 640,219 | |
Russian Federation | | | 7.50 | | | | 3-31-2030 | | | | 479,750 | | | | 575,433 | |
Russian Federation | | | 12.75 | | | | 6-24-2028 | | | | 950,000 | | | | 1,676,389 | |
Sri Lanka | | | 6.25 | | | | 7-27-2021 | | | | 2,050,000 | | | | 2,206,925 | |
Sultanate of Oman | | | 5.38 | | | | 3-8-2027 | | | | 1,650,000 | | | | 1,718,063 | |
Sultanate of Oman | | | 6.50 | | | | 3-8-2047 | | | | 200,000 | | | | 209,000 | |
Ukraine Government | | | 7.75 | | | | 9-1-2019 | | | | 1,500,000 | | | | 1,562,250 | |
Ukraine Government | | | 7.75 | | | | 9-1-2020 | | | | 225,000 | | | | 234,590 | |
Ukraine Government | | | 7.75 | | | | 9-1-2025 | | | | 600,000 | | | | 616,500 | |
Ukraine Government | | | 7.75 | | | | 9-1-2026 | | | | 250,000 | | | | 256,250 | |
United Mexican States | | | 6.75 | | | | 9-27-2034 | | | | 2,000,000 | | | | 2,619,400 | |
ZAR Sovereign Capital Fund Proprietary Limited | | | 3.90 | | | | 6-24-2020 | | | | 200,000 | | | | 203,927 | |
| |
Total Yankee Government Bonds (Cost $75,388,367) | | | | 76,615,322 | |
| | | | | | | | | | | | | | | | |
| | | | |
| | | Yield | | | | | | Shares | | | | |
| Short-Term Investments: 1.76% | | | | | | | | | | | | | | | | |
| | | | |
| Investment Companies: 1.76% | | | | | | | | | | | | | | | | |
Wells Fargo Government Money Market Fund Select Class (l)(u) | | | 0.92 | | | | | | | | 1,716,841 | | | | 1,716,841 | |
| | | | | | | | | | | | | | | | |
| | | | |
Total Short-Term Investments (Cost $1,716,841) | | | | | | | | | | | | | | | 1,716,841 | |
| | | | | | | | | | | | | | | | |
| | | | | | | | |
| Total investments in securities (Cost $91,831,305) | | | 95.49 | % | | | 93,135,546 | |
Other assets and liabilities, net | | | 4.51 | | | | 4,393,719 | |
| | | | | | | | |
| Total net assets | | | 100.00 | % | | $ | 97,529,265 | |
| | | | | | | | |
| ± | Variable rate investment. The rate shown is the rate in effect at period end. |
| (l) | The issuer of the security is an affiliated person of the Portfolio as defined in the Investment Company Act of 1940. |
| (u) | The rate represents the 7-day annualized yield at period end. |
Investments In Affiliates
An affiliated investment is an investment in which the Portfolio owns at least 5% of the outstanding voting shares of the issuer or as a result of other relationships, such as the Portfolio and the issuer having the same investment manager. Transactions with issuers that were either affiliated persons of the Portfolio at the beginning of the period or the end of the period were as follows:
| | | | | | | | | | | | | | | | | | | | | | | | | | | | | | | | |
| | | Shares, beginning of period | | | Shares purchased | | | Shares sold | | | Shares, end of
period | | | Net realized gains (losses) | | | Net change
in unrealized gains (losses) | | | Income from affiliated securities | | | Value, end of period | |
Investment companies - 1.76% | | | | | | | | | | | | | | | | | | | | | | | | | | | | | | | | |
Wells Fargo Government Money Market Fund Select Class | | | 0 | | | | 34,649,717 | | | | 32,932,876 | | | | 1,716,841 | | | $ | 0 | | | $ | 0 | | | $ | 4,849 | | | $ | 1,716,841 | |
The accompanying notes are an integral part of these financial statements.
| | | | | | |
| Portfolio of investments—August 31, 2017 (unaudited) | | Wells Fargo Target Date Funds | | | 97 | |
FACTOR ENHANCED EMERGING MARKETS PORTFOLIO
| | | | | | | | | | | | | | | | |
| Security name | | | | | | | | Shares | | | Value | |
| | | | |
Common Stocks: 82.64% | | | | | | | | | | | | | | | | |
| | | | |
| Brazil: 4.02% | | | | | | | | | | | | | | | | |
B2W Companhia Digital (Consumer Discretionary, Internet & Direct Marketing Retail) † | | | | | | | | | | | 32,835 | | | $ | 192,868 | |
Banco de Brasil SA (Financials, Banks) | | | | | | | | | | | 120,109 | | | | 1,171,386 | |
Banco Santander (Brasil) SA (Financials, Banks) | | | | | | | | | | | 1,200 | | | | 6,351 | |
BRF SA (Consumer Staples, Food Products) † | | | | | | | | | | | 60,227 | | | | 813,524 | |
CCR SA (Industrials, Transportation Infrastructure) | | | | | | | | | | | 119,682 | | | | 663,833 | |
Centrais Electricas Brasileiras SA (Utilities, Electric Utilities) † | | | | | | | | | | | 31,866 | | | | 178,369 | |
Companhia de Saneamento Basico do Estado de Sao Paulo SA (Utilities, Water Utilities) | | | | | | | | | | | 49,841 | | | | 509,042 | |
Companhia de Saneamento de Minas Gerais SA (Utilities, Water Utilities) | | | | | | | | | | | 16,559 | | | | 226,777 | |
Companhia Hering (Consumer Discretionary, Specialty Retail) | | | | | | | | | | | 27,210 | | | | 233,388 | |
CPFL Energia SA (Utilities, Electric Utilities) | | | | | | | | | | | 50,112 | | | | 431,258 | |
CPFL Energias Renovaveis SA (Utilities, Independent Power & Renewable Electricity Producers) † | | | | | | | | | | | 1,400 | | | | 5,782 | |
CVC Brasil Operadora e Agencia de Viagens SA (Consumer Discretionary, Hotels, Restaurants & Leisure) | | | | | | | | | | | 20,264 | | | | 245,909 | |
Ecorodovias Infraestrutura Logistica SA (Industrials, Transportation Infrastructure) | | | | | | | | | | | 1,700 | | | | 5,779 | |
EDP Energias do Brasil SA (Utilities, Electric Utilities) | | | | | | | | | | | 45,347 | | | | 219,543 | |
Embraer SA (Industrials, Aerospace & Defense) | | | | | | | | | | | 66,730 | | | | 380,091 | |
Equatorial Energia SA (Utilities, Electric Utilities) | | | | | | | | | | | 22,714 | | | | 441,025 | |
Estacio Participacoes SA (Consumer Discretionary, Diversified Consumer Services) | | | | | | | | | | | 32,033 | | | | 262,646 | |
Fibria Celulose SA (Materials, Paper & Forest Products) | | | | | | | | | | | 29,166 | | | | 387,200 | |
Fleury SA (Health Care, Health Care Providers & Services) | | | | | | | | | | | 21,105 | | | | 212,535 | |
Grendene SA (Consumer Discretionary, Textiles, Apparel & Luxury Goods) | | | | | | | | | | | 24,740 | | | | 214,088 | |
Hypermarcas SA (Consumer Staples, Personal Products) | | | | | | | | | | | 49,836 | | | | 467,195 | |
Iguatemi Empresa de Shopping Centers SA (Real Estate, Real Estate Management & Development) | | | | | | | | | | | 26,580 | | | | 315,800 | |
JBS SA (Consumer Staples, Food Products) | | | | | | | | | | | 98,129 | | | | 270,273 | |
Kroton Educacional SA (Consumer Discretionary, Diversified Consumer Services) | | | | | | | | | | | 182,369 | | | | 1,041,082 | |
Light SA (Utilities, Electric Utilities) † | | | | | | | | | | | 27,231 | | | | 178,204 | |
Localiza Rent a Car SA (Industrials, Road & Rail) | | | | | | | | | | | 17,907 | | | | 338,759 | |
Lojas Renner SA (Consumer Discretionary, Multiline Retail) | | | | | | | | | | | 92,033 | | | | 894,645 | |
M Dias Branco SA (Consumer Staples, Food Products) | | | | | | | | | | | 26,055 | | | | 406,405 | |
MRV Engenharia e Participacoes SA (Consumer Discretionary, Household Durables) | | | | | | | | | | | 1,900 | | | | 8,142 | |
Multiplan Empreendimentos Imobiliarios SA (Real Estate, Real Estate Management & Development) | | | | | | | | | | | 13,775 | | | | 319,842 | |
Natura Cosmeticos SA (Consumer Staples, Personal Products) | | | | | | | | | | | 33,576 | | | | 314,657 | |
Odontoprev SA (Health Care, Health Care Providers & Services) | | | | | | | | | | | 45,262 | | | | 213,092 | |
Porto Seguro SA (Financials, Insurance) | | | | | | | | | | | 16,668 | | | | 184,003 | |
Qualicorp SA (Health Care, Health Care Providers & Services) | | | | | | | | | | | 26,101 | | | | 288,965 | |
Raia Drogasil SA (Consumer Staples, Food & Staples Retailing) | | | | | | | | | | | 34,633 | | | | 762,997 | |
Rumo SA (Industrials, Road & Rail) † | | | | | | | | | | | 127,675 | | | | 418,979 | |
Sao Martinho SA (Consumer Staples, Food Products) | | | | | | | | | | | 37,811 | | | | 209,604 | |
Smiles SA (Consumer Discretionary, Media) | | | | | | | | | | | 10,492 | | | | 231,682 | |
Tim Participacoes SA (Telecommunication Services, Wireless Telecommunication Services) | | | | | | | | | | | 95,614 | | | | 342,623 | |
Ultrapar Participacoes SA (Energy, Oil, Gas & Consumable Fuels) | | | | | | | | | | | 43,298 | | | | 1,010,289 | |
WEG SA (Industrials, Machinery) | | | | | | | | | | | 67,610 | | | | 439,443 | |
| | | | |
| | | | | | | | | | | | | | | 15,458,075 | |
| | | | | | | | | | | | | | | | |
| | | | |
| Chile: 2.76% | | | | | | | | | | | | | | | | |
AES Gener SA (Utilities, Independent Power & Renewable Electricity Producers) | | | | | | | | | | | 195,388 | | | | 68,749 | |
Aguas Andinas SA Class A (Utilities, Water Utilities) | | | | | | | | | | | 390,950 | | | | 251,162 | |
Almendral SA (Telecommunication Services, Wireless Telecommunication Services) | | | | | | | | | | | 84,862 | | | | 6,787 | |
Antarchile SA (Industrials, Industrial Conglomerates) | | | | | | | | | | | 4,891 | | | | 71,970 | |
The accompanying notes are an integral part of these financial statements.
| | | | |
| 98 | | Wells Fargo Target Date Funds | | Portfolio of investments—August 31, 2017 (unaudited) |
FACTOR ENHANCED EMERGING MARKETS PORTFOLIO
| | | | | | | | | | | | | | | | |
| Security name | | | | | | | | Shares | | | Value | |
| | | | |
| Chile (continued) | | | | | | | | | | | | | | | | |
Banco de Chile (Financials, Banks) | | | | | | | | | | | 5,660,298 | | | $ | 823,843 | |
Banco de Credito e Inversiones (Financials, Banks) | | | | | | | | | | | 8,155 | | | | 533,262 | |
Banco Santander Chile SA (Financials, Banks) | | | | | | | | | | | 8,700,471 | | | | 636,506 | |
Banmedica SA (Health Care, Health Care Providers & Services) | | | | | | | | | | | 32,620 | | | | 83,477 | |
CAP SA (Materials, Metals & Mining) | | | | | | | | | | | 6,817 | | | | 80,575 | |
Cencosud SA (Consumer Staples, Food & Staples Retailing) | | | | | | | | | | | 219,725 | | | | 663,225 | |
Colbun SA (Utilities, Independent Power & Renewable Electricity Producers) | | | | | | | | | | | 826,298 | | | | 200,619 | |
Compania Cervecerias Unidas SA (Consumer Staples, Beverages) | | | | | | | | | | | 32,132 | | | | 440,692 | |
Empresa Nacional de Telecomunicaciones SA (Telecommunication Services, Wireless Telecommunication Services) | | | | | | | | | | | 12,086 | | | | 127,196 | |
Empresas CMPC SA (Materials, Paper & Forest Products) | | | | | | | | | | | 247,153 | | | | 650,273 | |
Empresas Copec SA (Energy, Oil, Gas & Consumable Fuels) | | | | | | | | | | | 55,359 | | | | 705,436 | |
Enel Americas SA (Utilities, Electric Utilities) | | | | | | | | | | | 3,122,066 | | | | 676,271 | |
Enel Chile SA (Utilities, Electric Utilities) | | | | | | | | | | | 2,828,002 | | | | 334,715 | |
Enel Generacion Chile SA (Utilities, Independent Power & Renewable Electricity Producers) | | | | | | | | | | | 514,041 | | | | 437,394 | |
Engie Energia Chile SA (Utilities, Electric Utilities) | | | | | | | | | | | 112,914 | | | | 239,292 | |
Grupo Security SA (Financials, Diversified Financial Services) | | | | | | | | | | | 133,287 | | | | 55,321 | |
Inversiones Aguas Metropolitanas SA (Utilities, Water Utilities) | | | | | | | | | | | 69,029 | | | | 124,196 | |
Itau CorpBanca SA (Financials, Banks) | | | | | | | | | | | 40,091,631 | �� | | | 387,242 | |
LANTAM Airlines Group SA (Industrials, Airlines) | | | | | | | | | | | 46,743 | | | | 590,619 | |
Parque Arauco SA (Real Estate, Real Estate Management & Development) | | | | | | | | | | | 145,668 | | | | 400,734 | |
Quinenco SA (Industrials, Industrial Conglomerates) | | | | | | | | | | | 28,133 | | | | 83,248 | |
Ripley Corporation SA (Consumer Discretionary, Multiline Retail) | | | | | | | | | | | 162,374 | | | | 154,813 | |
SACI Falabella (Consumer Discretionary, Multiline Retail) | | | | | | | | | | | 134,171 | | | | 1,351,957 | |
Sigdo Koppers SA (Industrials, Industrial Conglomerates) | | | | | | | | | | | 3,641 | | | | 6,435 | |
Sociedad Matriz del Banco de Chile SA Class B (Financials, Banks) | | | | | | | | | | | 515,192 | | | | 230,723 | |
Sociedad Matriz SAAM SA (Industrials, Transportation Infrastructure) | | | | | | | | | | | 81,487 | | | | 8,589 | |
Vina Concha y Toro SA (Consumer Staples, Beverages) | | | | | | | | | | | 109,453 | | | | 186,966 | |
| | | | |
| | | | | | | | | | | | | | | 10,612,287 | |
| | | | | | | | | | | | | | | | |
| | | | |
| China: 12.47% | | | | | | | | | | | | | | | | |
Agricultural Bank of China Limited H Shares (Financials, Banks) | | | | | | | | | | | 3,572,000 | | | | 1,679,706 | |
Air China H Shares (Industrials, Airlines) | | | | | | | | | | | 436,000 | | | | 387,766 | |
Aluminum Corporation of China Limited (Materials, Metals & Mining) † | | | | | | | | | | | 294,000 | | | | 217,520 | |
Anhui Conch Cement Company Limited H Shares (Materials, Construction Materials) | | | | | | | | | | | 192,000 | | | | 716,404 | |
Anhui Gujing Distillery Company Class B (Consumer Staples, Beverages) | | | | | | | | | | | 34,400 | | | | 147,521 | |
BAIC Motor Corporation Limited H Shares (Consumer Discretionary, Auto Components) | | | | | | | | | | | 189,000 | | | | 168,333 | |
Bank of China Limited H Shares (Financials, Banks) | | | | | | | | | | | 9,339,000 | | | | 4,916,676 | |
Bank of Communications Limited H Shares (Financials, Banks) | | | | | | | | | | | 989,847 | | | | 756,386 | |
Bank of Jinzhou Company Limited H Shares (Financials, Banks) | | | | | | | | | | | 80,000 | | | | 82,599 | |
BBMG Corporation (Materials, Construction Materials) | | | | | | | | | | | 379,000 | | | | 195,172 | |
Beijing Capital International Airport Company Limited H Shares (Industrials, Transportation Infrastructure) | | | | | | | | | | | 226,000 | | | | 365,608 | |
Beijing Enterprises Water Group Limited (Utilities, Water Utilities) | | | | | | | | | | | 232,000 | | | | 197,144 | |
China Agri-Industries Holdings Limited (Consumer Staples, Food Products) | | | | | | | | | | | 826,000 | | | | 386,309 | |
China Cinda Asset Management Company Limited H Shares (Financials, Capital Markets) | | | | | | | | | | | 1,508,000 | | | | 560,749 | |
China CITIC Bank H Shares (Financials, Banks) | | | | | | | | | | | 1,104,351 | | | | 729,578 | |
China Communications Construction Company Limited H Shares (Industrials, Construction & Engineering) | | | | | | | | | | | 633,000 | | | | 842,841 | |
China Communications Services Corporation Limited H Shares (Telecommunication Services, Diversified Telecommunication Services) | | | | | | | | | | | 352,000 | | | | 190,714 | |
China Cosco Holdings Company Limited (Industrials, Marine) | | | | | | | | | | | 412,500 | | | | 261,445 | |
China Eastern Airlines Company H Shares (Industrials, Airlines) | | | | | | | | | | | 400,000 | | | | 220,298 | |
The accompanying notes are an integral part of these financial statements.
| | | | | | |
| Portfolio of investments—August 31, 2017 (unaudited) | | Wells Fargo Target Date Funds | | | 99 | |
FACTOR ENHANCED EMERGING MARKETS PORTFOLIO
| | | | | | | | | | | | | | | | |
| Security name | | | | | | | | Shares | | | Value | |
| | | | |
| China (continued) | | | | | | | | | | | | | | | | |
China Energy Engineering Corporation Limited H Shares (Industrials, Construction & Engineering) | | | | | | | | | | | 916,000 | | | $ | 169,722 | |
China Everbright Bank Company Limited H Shares (Financials, Banks) | | | | | | | | | | | 400,000 | | | | 192,186 | |
China Huarong Asset Management Company Limited H Shares (Financials, Capital Markets) | | | | | | | | | | | 1,425,000 | | | | 608,185 | |
China Jinmao Holdings Group Limited (Real Estate, Real Estate Management & Development) | | | | | | | | | | | 668,000 | | | | 297,050 | |
China Mengniu Dairy Company Limited (Consumer Staples, Food Products) | | | | | | | | | | | 430,000 | | | | 1,004,428 | |
China Merchants Bank Company Limited H Shares (Financials, Banks) | | | | | | | | | | | 444,000 | | | | 1,673,705 | |
China Minsheng Banking Corporation Limited H Shares (Financials, Banks) | | | | | | | | | | | 722,948 | | | | 721,493 | |
China Molybdenum Company Limited H Shares (Materials, Metals & Mining) | | | | | | | | | | | 294,000 | | | | 159,665 | |
China National Building Material Company Limited H Shares (Materials, Construction Materials) | | | | | | | | | | | 472,000 | | | | 296,743 | |
China Petroleum & Chemical Corporation H Shares (Energy, Oil, Gas & Consumable Fuels) | | | | | | | | | | | 3,112,000 | | | | 2,381,993 | |
China Railway Construction Corporation Limited H Shares (Industrials, Construction & Engineering) | | | | | | | | | | | 258,000 | | | | 338,253 | |
China Railway Group Limited H Shares (Industrials, Construction & Engineering) | | | | | | | | | | | 590,000 | | | | 471,955 | |
China Reinsurance Group Corporation H Shares (Financials, Insurance) | | | | | | | | | | | 1,546,000 | | | | 351,644 | |
China Resources Beer Holdings Company Limited (Consumer Staples, Beverages) | | | | | | | | | | | 92,000 | | | | 230,889 | |
China Resources Cement Holdings Limited (Materials, Construction Materials) | | | | | | | | | | | 368,000 | | | | 202,204 | |
China Resources Power Holdings Company (Utilities, Independent Power & Renewable Electricity Producers) | | | | | | | | | | | 304,000 | | | | 557,830 | |
China Southern Airlines Company H Shares (Industrials, Airlines) | | | | | | | | | | | 372,000 | | | | 290,441 | |
China Telecom Corporation Limited H Shares (Telecommunication Services, Diversified Telecommunication Services) | | | | | | | | | | | 1,708,000 | | | | 877,380 | |
China Unicom Hong Kong Limited (Telecommunication Services, Diversified Telecommunication Services) † | | | | | | | | | | | 866,000 | | | | 1,261,528 | |
China Vanke Company Limited H Shares (Real Estate, Real Estate Management & Development) | | | | | | | | | | | 70,600 | | | | 211,554 | |
Chongqing Changchun Automobile Class B (Consumer Discretionary, Automobiles) | | | | | | | | | | | 148,500 | | | | 194,312 | |
Chongqing Rural Commercial Bank (Financials, Banks) | | | | | | | | | | | 468,000 | | | | 325,924 | |
COSCO Shipping Ports Limited (Industrials, Transportation Infrastructure) | | | | | | | | | | | 402,000 | | | | 475,162 | |
CRRC Corporation Limited H Shares (Industrials, Machinery) | | | | | | | | | | | 533,000 | | | | 480,846 | |
CSG Holding Company Limited B Shares (Materials, Construction Materials) | | | | | | | | | | | 179,170 | | | | 109,896 | |
Datang International Power Generation Company Limited (Utilities, Independent Power & Renewable Electricity Producers) † | | | | | | | | | | | 20,000 | | | | 6,568 | |
Dazhong Transportation Group Class B (Industrials, Road & Rail) | | | | | | | | | | | 94,700 | | | | 64,775 | |
Dongfeng Motor Group Company Limited H Shares (Consumer Discretionary, Automobiles) | | | | | | | | | | | 454,000 | | | | 589,418 | |
Far East Horizon Limited (Financials, Diversified Financial Services) | | | | | | | | | | | 468,000 | | | | 427,588 | |
Fuyao Glass Industry Group Company Limited H Shares (Consumer Discretionary, Auto Components) | | | | | | | | | | | 128,800 | | | | 410,639 | |
Great Wall Motor Company Limited H Shares (Consumer Discretionary, Automobiles) | | | | | | | | | | | 418,000 | | | | 524,520 | |
Guangzhou Automobile Group H Shares (Consumer Discretionary, Automobiles) | | | | | | | | | | | 266,000 | | | | 524,811 | |
Guangzhou R&F Properties Company Limited H Shares (Real Estate, Real Estate Management & Development) | | | | | | | | | | | 143,200 | | | | 334,498 | |
Huadian Fuxin Energy Corporation Limited H Shares (Utilities, Independent Power & Renewable Electricity Producers) | | | | | | | | | | | 258,000 | | | | 57,035 | |
Huaneng Power International Incorporated H Shares (Utilities, Independent Power & Renewable Electricity Producers) | | | | | | | | | | | 578,000 | | | | 378,157 | |
Industrial & Commercial Bank of China Limited H Shares (Financials, Banks) | | | | | | | | | | | 8,326,000 | | | | 6,234,592 | |
Jiangsu Express Company Limited H Shares (Industrials, Transportation Infrastructure) | | | | | | | | | | | 212,000 | | | | 325,081 | |
Lao Feng Xiang Company Limited Class B (Consumer Discretionary, Textiles, Apparel & Luxury Goods) | | | | | | | | | | | 40,700 | | | | 157,428 | |
Legend Holdings Corporation H Shares (Financials, Diversified Financial Services) | | | | | | | | | | | 69,400 | | | | 164,948 | |
Lenovo Group Limited (Information Technology, Technology Hardware, Storage & Peripherals) | | | | | | | | | | | 314,000 | | | | 171,731 | |
Metallurgical Corporation of China Limited H Shares (Industrials, Construction & Engineering) † | | | | | | | | | | | 575,000 | | | | 188,832 | |
New China Life Insurance Company Limited H Shares (Financials, Insurance) | | | | | | | | | | | 97,600 | | | | 624,830 | |
Nexteer Automotive Group Limited (Consumer Discretionary, Auto Components) | | | | | | | | | | | 148,000 | | | | 245,855 | |
Orient Securities Company Limited of China H Shares (Financials, Diversified Financial Services) † | | | | | | | | | | | 208,800 | | | | 220,386 | |
PetroChina Company Limited H Shares (Energy, Oil, Gas & Consumable Fuels) | | | | | | | | | | | 2,434,692 | | | | 1,555,565 | |
PICC Property & Casualty Company Limited H Shares (Financials, Insurance) | | | | | | | | | | | 312,000 | | | | 586,065 | |
Poly Property Group Company Limited (Real Estate, Real Estate Management & Development) † | | | | | | | | | | | 575,000 | | | | 301,249 | |
Postal Savings Bank of China Company Limited H Shares (Financials, Banks) | | | | | | | | | | | 1,350,000 | | | | 814,235 | |
The accompanying notes are an integral part of these financial statements.
| | | | |
| 100 | | Wells Fargo Target Date Funds | | Portfolio of investments—August 31, 2017 (unaudited) |
FACTOR ENHANCED EMERGING MARKETS PORTFOLIO
| | | | | | | | | | | | | | | | |
| Security name | | | | | | | | Shares | | | Value | |
| | | | |
| China (continued) | | | | | | | | | | | | | | | | |
Shandong Weigao Group Medical Polymer Company Limited H Shares (Health Care, Health Care Equipment & Supplies) | | | | | | | | | | | 380,000 | | | $ | 303,485 | |
Shanghai Electric Group Company Limited (Industrials, Electrical Equipment) † | | | | | | | | | | | 488,000 | | | | 221,372 | |
Shanghai Fosun Pharmaceutical Company Limited H Shares (Health Care, Pharmaceuticals) | | | | | | | | | | | 69,500 | | | | 261,100 | |
Shanghai Industrial Holdings Limited (Industrials, Industrial Conglomerates) | | | | | | | | | | | 136,000 | | | | 413,609 | |
Shanghai Jinqiao Export Processing Zone Development Compay Limited Class B (Real Estate, Real Estate Management & Development) | | | | | | | | | | | 49,900 | | | | 71,257 | |
Shanghai Mechanical & Electrical Industry Company Limited Class B (Industrials, Machinery) | | | | | | | | | | | 35,000 | | | | 70,945 | |
Shanghai Pharmaceuticals Holding Company Limited H Shares (Health Care, Health Care Providers & Services) | | | | | | | | | | | 158,800 | | | | 390,824 | |
Shanghai Zhenhua Heavy Industry Company Limited Class B (Industrials, Machinery) | | | | | | | | | | | 173,300 | | | | 89,943 | |
Shenzhen Expressway Company Limited (Industrials, Transportation Infrastructure) | | | | | | | | | | | 144,000 | | | | 140,582 | |
Shenzhen Investment Limited (Real Estate, Real Estate Management & Development) | | | | | | | | | | | 920,000 | | | | 419,691 | |
Sinopec Engineering Group H Shares (Industrials, Construction & Engineering) | | | | | | | | | | | 255,500 | | | | 230,499 | |
Sinopec Shanghai Petrochemical Company Limited (Materials, Chemicals) | | | | | | | | | | | 630,000 | | | | 392,857 | |
Sinopharm Group Company Limited H Shares (Health Care, Health Care Providers & Services) | | | | | | | | | | | 173,200 | | | | 782,368 | |
Sinotruk Hong Kong Limited (Industrials, Machinery) | | | | | | | | | | | 218,000 | | | | 241,240 | |
Tong Ren Tang Technologies Company Limited H Shares (Health Care, Pharmaceuticals) | | | | | | | | | | | 189,000 | | | | 265,661 | |
Tsingtao Brewery Company Limited H Shares (Consumer Staples, Beverages) | | | | | | | | | | | 102,000 | | | | 422,950 | |
Weichai Power Company Limited (Industrials, Machinery) | | | | | | | | | | | 257,000 | | | | 264,693 | |
Yantai Changyu Pioneer Wine Company Limited Class B (Consumer Staples, Beverages) | | | | | | | | | | | 75,300 | | | | 186,957 | |
Yuexiu Property Company Limited (Real Estate, Real Estate Management & Development) | | | | | | | | | | | 1,960,000 | | | | 360,656 | |
Zhejiang Expressway Company Limited (Industrials, Transportation Infrastructure) | | | | | | | | | | | 206,000 | | | | 257,706 | |
Zijin Mining Group Company Limited H Shares (Materials, Metals & Mining) | | | | | | | | | | | 890,000 | | | | 326,397 | |
Zoomlion Heavy Industry Science and Technology Company Limited H Shares (Industrials, Machinery) | | | | | | | | | | | 11,400 | | | | 5,201 | |
| | | | |
| | | | | | | | | | | | | | | 47,936,556 | |
| | | | | | | | | | | | | | | | |
| | | | |
| Colombia: 0.58% | | | | | | | | | | | | | | | | |
Almacenes Exito SA (Consumer Staples, Food & Staples Retailing) | | | | | | | | | | | 52,361 | | | | 272,697 | |
Cementos Argos SA (Materials, Construction Materials) | | | | | | | | | | | 87,626 | | | | 355,341 | |
Corporacion Financiera Colombiana SA (Financials, Diversified Financial Services) | | | | | | | | | | | 23,739 | | | | 231,651 | |
Empresa de Energia de Bogota SA (Utilities, Gas Utilities) | | | | | | | | | | | 136,636 | | | | 90,340 | |
Grupo Argos SA (Materials, Construction Materials) | | | | | | | | | | | 23,111 | | | | 164,401 | |
Grupo de Inversiones Suramericana SA (Financials, Diversified Financial Services) | | | | | | | | | | | 40,649 | | | | 571,978 | |
Grupo Nutresa SA (Consumer Staples, Food Products) | | | | | | | | | | | 18,688 | | | | 171,970 | |
Interconexion Electrica SA (Utilities, Electric Utilities) | | | | | | | | | | | 83,776 | | | | 379,496 | |
| | | | |
| | | | | | | | | | | | | | | 2,237,874 | |
| | | | | | | | | | | | | | | | |
| | | | |
| Greece: 0.31% | | | | | | | | | | | | | | | | |
Hellenic Telecommunications Organization SA (Telecommunication Services, Diversified Telecommunication Services) | | | | | | | | | | | 15,140 | | | | 192,851 | |
Jumbo SA (Consumer Discretionary, Specialty Retail) | | | | | | | | | | | 16,390 | | | | 273,161 | |
Motor Oil (Hellas) Corinth Refineries SA (Energy, Oil, Gas & Consumable Fuels) | | | | | | | | | | | 295 | | | | 6,637 | |
Mytilineos Holdings SA (Industrials, Industrial Conglomerates) | | | | | | | | | | | 18,599 | | | | 190,193 | |
OPAP SA (Consumer Discretionary, Hotels, Restaurants & Leisure) | | | | | | | | | | | 22,538 | | | | 251,937 | |
Titan Cement Company SA (Materials, Construction Materials) | | | | | | | | | | | 9,641 | | | | 273,730 | |
| | | | |
| | | | | | | | | | | | | | | 1,188,509 | |
| | | | | | | | | | | | | | | | |
| | | | |
| India: 2.67% | | | | | | | | | | | | | | | | |
Doctor Reddy’s Laboratories Limited ADR (Health Care, Pharmaceuticals) | | | | | | | | | | | 101,849 | | | | 3,278,519 | |
Infosys Limited ADR (Information Technology, IT Services) | | | | | | | | | | | 466,229 | | | | 6,993,435 | |
| | | | |
| | | | | | | | | | | | | | | 10,271,954 | |
| | | | | | | | | | | | | | | | |
The accompanying notes are an integral part of these financial statements.
| | | | | | |
| Portfolio of investments—August 31, 2017 (unaudited) | | Wells Fargo Target Date Funds | | | 101 | |
FACTOR ENHANCED EMERGING MARKETS PORTFOLIO
| | | | | | | | | | | | | | | | |
| Security name | | | | | | | | Shares | | | Value | |
| | | | |
| Indonesia: 1.47% | | | | | | | | | | | | | | | | |
PT Ace Hardware Incorporated Indonesia Tbk (Consumer Discretionary, Specialty Retail) | | | | | | | | | | | 3,336,900 | | | $ | 272,614 | |
PT AKR Corporindo Tbk (Industrials, Trading Companies & Distributors) | | | | | | | | | | | 432,400 | | | | 219,571 | |
PT Bank Danamon Indonesia Tbk (Financials, Banks) | | | | | | | | | | | 487,500 | | | | 199,136 | |
PT Bank Negara Indonesia Persero Tbk (Financials, Banks) | | | | | | | | | | | 1,207,600 | | | | 665,257 | |
PT Bank Sinarmas Tbk (Financials, Banks) † | | | | | | | | | | | 81,800 | | | | 5,334 | |
PT Bank Tabungan Negara Persero Tbk (Financials, Banks) | | | | | | | | | | | 1,143,600 | | | | 258,000 | |
PT Gudang Garam Tbk (Consumer Staples, Tobacco) | | | | | | | | | | | 95,400 | | | | 494,804 | |
PT Hanjaya Mandala Sampoerna Tbk (Consumer Staples, Tobacco) | | | | | | | | | | | 1,920,400 | | | | 523,929 | |
PT Hanson International Tbk (Real Estate, Real Estate Management & Development) † | | | | | | | | | | | 19,056,900 | | | | 192,826 | |
PT Indofood CBP Sukses Makmur Tbk (Consumer Staples, Food Products) | | | | | | | | | | | 657,700 | | | | 430,103 | |
PT Indofood Sukses Makmur Tbk (Consumer Staples, Food Products) | | | | | | | | | | | 969,800 | | | | 608,760 | |
PT Jasa Marga (Persero) Tbk (Industrials, Transportation Infrastructure) | | | | | | | | | | | 655,600 | �� | | | 286,229 | |
PT Kalbe Farma Tbk (Health Care, Pharmaceuticals) | | | | | | | | | | | 3,717,000 | | | | 476,396 | |
PT Mayora Indah Tbk (Consumer Staples, Food Products) | | | | | | | | | | | 388,787 | | | | 58,280 | |
PT Perusahaan Gas Negara Persero Tbk (Utilities, Gas Utilities) | | | | | | | | | | | 1,381,900 | | | | 219,579 | |
PT Properti Tbk (Real Estate, Real Estate Management & Development) | | | | | | | | | | | 3,342,300 | | | | 51,104 | |
PT Sumber Alfaria Trijaya Tbk (Consumer Staples, Food & Staples Retailing) | | | | | | | | | | | 117,000 | | | | 5,963 | |
PT Surya Citra Media Tbk (Consumer Discretionary, Media) | | | | | | | | | | | 1,098,300 | | | | 181,925 | |
PT Ultrajaya Milk Industry & Trading Company Tbk (Consumer Staples, Food Products) | | | | | | | | | | | 62,000 | | | | 5,553 | |
PT United Tractors Tbk (Energy, Oil, Gas & Consumable Fuels) | | | | | | | | | | | 226,100 | | | | 513,478 | |
| | | | |
| | | | | | | | | | | | | | | 5,668,841 | |
| | | | | | | | | | | | | | | | |
| | | | |
| Luxembourg: 0.07% | | | | | | | | | | | | | | | | |
Kernel Holding SA (Consumer Staples, Food Products) | | | | | | | | | | | 16,128 | | | | 274,429 | |
| | | | | | | | | | | | | | | | |
| | | | |
| Malaysia: 4.69% | | | | | | | | | | | | | | | | |
Aeon Company Bhd (Consumer Discretionary, Multiline Retail) | | | | | | | | | | | 44,500 | | | | 20,945 | |
Affin Holdings Bhd (Financials, Banks) | | | | | | | | | | | 15,300 | | | | 9,136 | |
Alliance Financial Group Bhd (Financials, Banks) | | | | | | | | | | | 178,600 | | | | 160,596 | |
AMMB Holdings Bhd (Financials, Banks) | | | | | | | | | | | 172,900 | | | | 173,285 | |
Astro Malaysia Holdings Bhd (Consumer Discretionary, Media) | | | | | | | | | | | 380,700 | | | | 238,913 | |
Axiata Group Bhd (Telecommunication Services, Wireless Telecommunication Services) | | | | | | | | | | | 512,300 | | | | 591,415 | |
Batu Kawan Bhd (Materials, Chemicals) | | | | | | | | | | | 2,000 | | | | 8,851 | |
Bermaz Auto Bhd (Consumer Discretionary, Specialty Retail) | | | | | | | | | | | 180,500 | | | | 79,039 | |
Bimb Holdings Bhd (Financials, Banks) | | | | | | | | | | | 52,600 | | | | 54,195 | |
Boustead Holdings Bhd (Industrials, Industrial Conglomerates) | | | | | | | | | | | 147,300 | | | | 93,130 | |
British American Tobacco Malaysia Bhd (Consumer Staples, Tobacco) | | | | | | | | | | | 39,900 | | | | 412,781 | |
Bursa Malaysia Bhd (Financials, Diversified Financial Services) | | | | | | | | | | | 150,100 | | | | 357,105 | |
Cahya Mata Sarawak Bhd (Materials, Construction Materials) | | | | | | | | | | | 361,600 | | | | 343,776 | |
Carlsberg Brewery Malaysia Bhd (Consumer Staples, Beverages) | | | | | | | | | | | 2,300 | | | | 7,982 | |
Dialog Group Bhd (Industrials, Construction & Engineering) | | | | | | | | | | | 27,100 | | | | 13,009 | |
Digi.com Bhd (Telecommunication Services, Wireless Telecommunication Services) | | | | | | | | | | | 424,000 | | | | 480,543 | |
Felda Global Ventures Holdings Bhd (Consumer Staples, Food Products) | | | | | | | | | | | 489,400 | | | | 177,630 | |
Fraser & Neave Holdings Bhd (Consumer Staples, Beverages) | | | | | | | | | | | 29,800 | | | | 169,708 | |
Genting Bhd (Consumer Discretionary, Hotels, Restaurants & Leisure) | | | | | | | | | | | 469,400 | | | | 1,067,293 | |
Genting Malaysia Bhd (Consumer Discretionary, Hotels, Restaurants & Leisure) | | | | | | | | | | | 657,500 | | | | 903,764 | |
HAP Seng Consolidated Bhd (Industrials, Industrial Conglomerates) | | | | | | | | | | | 87,500 | | | | 186,044 | |
Hartalega Holdings Bhd (Health Care, Health Care Equipment & Supplies) | | | | | | | | | | | 241,400 | | | | 383,821 | |
Heineken Malaysia Bhd (Consumer Staples, Beverages) | | | | | | | | | | | 11,800 | | | | 51,947 | |
IGB REIT Bhd (Real Estate, Equity REITs) | | | | | | | | | | | 265,300 | | | | 106,853 | |
The accompanying notes are an integral part of these financial statements.
| | | | |
| 102 | | Wells Fargo Target Date Funds | | Portfolio of investments—August 31, 2017 (unaudited) |
FACTOR ENHANCED EMERGING MARKETS PORTFOLIO
| | | | | | | | | | | | | | | | |
| Security name | | | | | | | | Shares | | | Value | |
| | | | |
| Malaysia (continued) | | | | | | | | | | | | | | | | |
Inari Amertron Bhd (Information Technology, Electronic Equipment, Instruments & Components) | | | | | | | | | | | 520,600 | | | $ | 309,641 | |
IOI Corporation Bhd (Consumer Staples, Food Products) | | | | | | | | | | | 511,400 | | | | 543,673 | |
IOI Properties Group Bhd (Real Estate, Real Estate Management & Development) | | | | | | | | | | | 316,200 | | | | 147,345 | |
KLCC Property Holdings Bhd (Real Estate, Equity REITs) | | | | | | | | | | | 116,600 | | | | 212,968 | |
Kossan Rubber Industries Bhd (Health Care, Health Care Equipment & Supplies) | | | | | | | | | | | 44,200 | | | | 74,521 | |
KPJ Healthcare Bhd (Health Care, Health Care Providers & Services) | | | | | | | | | | | 68,900 | | | | 67,117 | |
Kuala Lumpur Kepong Bhd (Consumer Staples, Food Products) | | | | | | | | | | | 128,700 | | | | 739,562 | |
LPI Capital Bhd (Financials, Insurance) | | | | | | | | | | | 12,200 | | | | 50,965 | |
Mah Sing Group Bhd (Real Estate, Real Estate Management & Development) | | | | | | | | | | | 187,100 | | | | 64,842 | |
Malayan Banking Bhd (Financials, Banks) | | | | | | | | | | | 523,400 | | | | 1,159,434 | |
Malaysia Airports Holdings Bhd (Industrials, Transportation Infrastructure) | | | | | | | | | | | 254,700 | | | | 536,776 | |
Malaysia Building Society Bhd (Financials, Thrifts & Mortgage Finance) | | | | | | | | | | | 672,100 | | | | 203,023 | |
Malaysian Resources Corporation Bhd (Industrials, Construction & Engineering) | | | | | | | | | | | 586,700 | | | | 164,861 | |
Maxis Bhd (Telecommunication Services, Wireless Telecommunication Services) | | | | | | | | | | | 216,500 | | | | 293,027 | |
My EG Services Bhd (Information Technology, IT Services) | | | | | | | | | | | 382,600 | | | | 189,934 | |
Nestle Malaysia Bhd (Consumer Staples, Food Products) | | | | | | | | | | | 11,600 | | | | 228,170 | |
Press Metal Bhd (Materials, Metals & Mining) | | | | | | | | | | | 368,800 | | | | 310,032 | |
Public Bank Bhd (Financials, Banks) | | | | | | | | | | | 318,400 | | | | 1,535,895 | |
Ql Resources Bhd (Consumer Staples, Food Products) | | | | | | | | | | | 92,200 | | | | 104,064 | |
Sapurakencana Petroleum Bhd (Energy, Energy Equipment & Services) | | | | | | | | | | | 11,300 | | | | 3,652 | |
Sime Darby Bhd (Industrials, Industrial Conglomerates) | | | | | | | | | | | 591,900 | | | | 1,247,418 | |
SP Setia Bhd (Real Estate, Real Estate Management & Development) | | | | | | | | | | | 394,499 | | | | 310,389 | |
Sunway Bhd (Real Estate, Real Estate Management & Development) | | | | | | | | | | | 430,300 | | | | 437,303 | |
Sunway Real Estate Investment Trust (Real Estate, Real Estate Management & Development) | | | | | | | | | | | 12,700 | | | | 5,085 | |
Telecom Malaysia Bhd (Telecommunication Services, Diversified Telecommunication Services) | | | | | | | | | | | 340,400 | | | | 512,533 | |
Tenaga Nasional Bhd (Utilities, Electric Utilities) | | | | | | | | | | | 336,500 | | | | 1,125,213 | |
Top Glove Corporation Bhd (Health Care, Health Care Equipment & Supplies) | | | | | | | | | | | 207,300 | | | | 272,322 | |
UMW Holdings Bhd (Consumer Discretionary, Automobiles) | | | | | | | | | | | 58,400 | | | | 83,145 | |
WCT Holdings Bhd (Industrials, Construction & Engineering) † | | | | | | | | | | | 440,900 | | | | 180,676 | |
Westports Holdings Bhd (Industrials, Transportation Infrastructure) | | | | | | | | | | | 219,700 | | | | 192,922 | |
Yinson Holdings Bhd (Energy, Energy Equipment & Services) | | | | | | | | | | | 6,500 | | | | 5,540 | |
YTL Corporation Bhd (Utilities, Multi-Utilities) | | | | | | | | | | | 1,323,900 | | | | 443,315 | |
YTL Power International Bhd (Utilities, Multi-Utilities) | | | | | | | | | | | 567,300 | | | | 187,307 | |
| | | | |
| | | | | | | | | | | | | | | 18,034,431 | |
| | | | | | | | | | | | | | | | |
| | | | |
| Mexico: 4.30% | | | | | | | | | | | | | | | | |
Alsea SAB de CV (Consumer Discretionary, Hotels, Restaurants & Leisure) | | | | | | | | | | | 75,674 | | | | 275,113 | |
America Movil SAB de CV Series L (Telecommunication Services, Wireless Telecommunication Services) | | | | | | | | | | | 2,851,523 | | | | 2,650,688 | |
Arca Continental SAB de CV (Consumer Staples, Beverages) | | | | | | | | | | | 131,967 | | | | 963,075 | |
Banregio Grupo Financiero SAB de CV (Financials, Banks) | | | | | | | | | | | 30,983 | | | | 200,445 | |
Coca-Cola Femsa SAB de CV Series L (Consumer Staples, Beverages) | | | | | | | | | | | 85,028 | | | | 696,755 | |
El Puerto de Liverpool SAB de CV (Consumer Discretionary, Multiline Retail) | | | | | | | | | | | 23,933 | | | | 213,090 | |
Fibra Uno Administracion SAB de CV (Real Estate, Equity REITs) | | | | | | | | | | | 395,353 | | | | 703,616 | |
Fomento Economico Mexicano SAB de CV (Consumer Staples, Beverages) | | | | | | | | | | | 276,528 | | | | 2,769,417 | |
Genomma Lab Internacional SAB de CV (Health Care, Pharmaceuticals) † | | | | | | | | | | | 159,993 | | | | 205,548 | |
Gentera SAB de CV (Financials, Consumer Finance) | | | | | | | | | | | 129,148 | | | | 198,931 | |
Gruma SAB de CV Class B (Consumer Staples, Food Products) | | | | | | | | | | | 32,320 | | | | 474,065 | |
Grupo Aeromexico SAB de CV (Industrials, Airlines) † | | | | | | | | | | | 74,970 | | | | 151,498 | |
Grupo Aeroportuario del Centro Norte SAB de CV (Industrials, Transportation Infrastructure) | | | | | | | | | | | 32,910 | | | | 199,088 | |
The accompanying notes are an integral part of these financial statements.
| | | | | | |
| Portfolio of investments—August 31, 2017 (unaudited) | | Wells Fargo Target Date Funds | | | 103 | |
FACTOR ENHANCED EMERGING MARKETS PORTFOLIO
| | | | | | | | | | | | | | | | |
| Security name | | | | | | | | Shares | | | Value | |
| | | | |
| Mexico (continued) | | | | | | | | | | | | | | | | |
Grupo Aeroportuario del Pacifico SAB de CV Class B (Industrials, Transportation Infrastructure) | | | | | | | | | | | 43,915 | | | $ | 485,173 | |
Grupo Aeroportuario del Sureste SAB de CV Class B (Industrials, Transportation Infrastructure) | | | | | | | | | | | 22,475 | | | | 457,551 | |
Grupo Carso SAB de CV (Industrials, Industrial Conglomerates) | | | | | | | | | | | 51,801 | | | | 208,777 | |
Grupo Comercial Chedraui SAB de CV (Consumer Staples, Food & Staples Retailing) | | | | | | | | | | | 35,944 | | | | 77,078 | |
Grupo Elektra SAB de CV (Financials, Banks) | | | | | | | | | | | 9,179 | | | | 399,416 | |
Grupo Financiero Santander SAB de CV Class B (Financials, Banks) | | | | | | | | | | | 141,703 | | | | 291,026 | |
Grupo Gicsa SAB de CV (Real Estate, Real Estate Management & Development) † | | | | | | | | | | | 114,178 | | | | 76,697 | |
Grupo Lala SAB de CV (Consumer Staples, Food Products) | | | | | | | | | | | 117,067 | | | | 207,888 | |
Impulsora del Desarrollo y el Empleo en America Latina SAB de CV (Industrials, Construction & Engineering) † | | | | | | | | | | | 9,700 | | | | 18,500 | |
Industrias Bachoco SAB de CV Ser B (Consumer Staples, Food Products) | | | | | | | | | | | 34,455 | | | | 182,187 | |
Industrias CH SAB de CV (Materials, Metals & Mining) † | | | | | | | | | | | 1,100 | | | | 5,233 | |
Industrias Penoles SAB de CV (Materials, Metals & Mining) | | | | | | | | | | | 17,433 | | | | 453,521 | |
Infraestructura Energetica Nova SAB de CV (Utilities, Gas Utilities) | | | | | | | | | | | 89,626 | | | | 488,703 | |
Macquarie Mexico Real Estate Management SA de CV (Real Estate, Equity REITs) 144A | | | | | | | | | | | 160,605 | | | | 215,227 | |
Mexichem SAB de CV (Materials, Chemicals) | | | | | | | | | | | 111,524 | | | | 296,911 | |
Nemak SAB de CV (Consumer Discretionary, Auto Components) 144A | | | | | | | | | | | 199,820 | | | | 168,200 | |
OHL Mexico SAB de CV (Industrials, Transportation Infrastructure) | | | | | | | | | | | 135,591 | | | | 191,944 | |
Organizacion Soriana SAB de CV Class B (Consumer Staples, Food & Staples Retailing) † | | | | | | | | | | | 25,823 | | | | 63,564 | |
PLA Administradora Industria S de RL de CV (Real Estate, Equity REITs) | | | | | | | | | | | 105,904 | | | | 180,483 | |
Prologis Property Mexico SA de CV (Real Estate, Equity REITs) | | | | | | | | | | | 111,194 | | | | 226,751 | |
Promotora Y Operadora de Infraestructura SAB de CV (Industrials, Transportation Infrastructure) | | | | | | | | | | | 27,604 | | | | 301,650 | |
Telesites SAB de CV (Telecommunication Services, Diversified Telecommunication Services) † | | | | | | | | | | | 259,729 | | | | 205,410 | |
Wal-Mart de Mexico SAB de CV (Consumer Staples, Food & Staples Retailing) | | | | | | | | | | | 670,839 | | | | 1,632,143 | |
| | | | |
| | | | | | | | | | | | | | | 16,535,362 | |
| | | | | | | | | | | | | | | | |
| | | | |
| Philippines: 1.67% | | | | | | | | | | | | | | | | |
Alliance Global Group Incorporated (Industrials, Industrial Conglomerates) | | | | | | | | | | | 1,201,900 | | | | 326,488 | |
Ayala Corporation (Financials, Diversified Financial Services) | | | | | | | | | | | 51,500 | | | | 925,933 | |
Belle Corporation (Real Estate, Real Estate Management & Development) | | | | | | | | | | | 73,000 | | | | 5,250 | |
Bloomberry Resorts Corporation (Consumer Discretionary, Hotels, Restaurants & Leisure) † | | | | | | | | | | | 876,100 | | | | 192,102 | |
Cebu Air Incorporated (Industrials, Airlines) | | | | | | | | | | | 40,340 | | | | 85,379 | |
China Banking Corporation (Financials, Banks) | | | | | | | | | | | 12,600 | | | | 8,877 | |
Cosco Capital Incorporated (Consumer Staples, Food & Staples Retailing) | | | | | | | | | | | 32,000 | | | | 4,903 | |
D&L Industries Incorporated (Materials, Chemicals) | | | | | | | | | | | 841,400 | | | | 170,023 | |
DMCI Holdings Incorporated (Industrials, Industrial Conglomerates) | | | | | | | | | | | 1,116,100 | | | | 342,442 | |
Energy Development Corporation (Utilities, Independent Power & Renewable Electricity Producers) | | | | | | | | | | | 2,604,400 | | | | 345,082 | |
First Gen Corporation (Utilities, Independent Power & Renewable Electricity Producers) | | | | | | | | | | | 265,400 | | | | 87,239 | |
First Philippine Holdings Corporation (Utilities, Electric Utilities) | | | | | | | | | | | 4,850 | | | | 6,350 | |
Globe Telecom Incorporated (Telecommunication Services, Wireless Telecommunication Services) | | | | | | | | | | | 5,350 | | | | 209,107 | |
GT Capital Holdings Incorporated (Financials, Diversified Financial Services) | | | | | | | | | | | 18,525 | | | | 404,748 | |
International Container Term Services Incorporated (Industrials, Transportation Infrastructure) | | | | | | | | | | | 262,880 | | | | 536,343 | |
Jollibee Foods Corporation (Consumer Discretionary, Hotels, Restaurants & Leisure) | | | | | | | | | | | 97,980 | | | | 456,104 | |
Manila Electric Company (Utilities, Electric Utilities) | | | | | | | | | | | 76,690 | | | | 406,156 | |
Manila Water Company (Utilities, Water Utilities) | | | | | | | | | | | 295,300 | | | | 178,611 | |
Max’s Group Incorporated (Consumer Discretionary, Hotels, Restaurants & Leisure) | | | | | | | | | | | 231,500 | | | | 89,849 | |
Petron Corporation (Energy, Oil, Gas & Consumable Fuels) | | | | | | | | | | | 1,003,000 | | | | 192,093 | |
Philippine National Bank (Financials, Banks) | | | | | | | | | | | 26,120 | | | | 30,883 | |
Philippine Seven Corporation (Consumer Staples, Food & Staples Retailing) | | | | | | | | | | | 1,390 | | | | 4,618 | |
Puregold Price Club Incorporated (Consumer Staples, Food & Staples Retailing) | | | | | | | | | | | 208,100 | | | | 195,411 | |
The accompanying notes are an integral part of these financial statements.
| | | | |
| 104 | | Wells Fargo Target Date Funds | | Portfolio of investments—August 31, 2017 (unaudited) |
FACTOR ENHANCED EMERGING MARKETS PORTFOLIO
| | | | | | | | | | | | | | | | |
| Security name | | | | | | | | Shares | | | Value | |
| | | | |
| Philippines (continued) | | | | | | | | | | | | | | | | |
Rizal Commercial Banking (Financials, Banks) | | | | | | | | | | | 60,330 | | | $ | 60,483 | |
Robinsons Land Company (Financials, Real Estate Management & Development) | | | | | | | | | | | 471,200 | | | | 213,638 | |
Robinsons Retail Holdings (Consumer Staples, Food & Staples Retailing) | | | | | | | | | | | 246,460 | | | | 437,097 | |
San Miguel Corporation (Consumer Staples, Beverages) | | | | | | | | | | | 26,850 | | | | 52,472 | |
Semirara Mining and Power Corporation (Energy, Oil, Gas & Consumable Fuels) | | | | | | | | | | | 96,020 | | | | 325,759 | |
Vista Land & Lifescapes Incorporated (Real Estate, Real Estate Management & Development) | | | | | | | | | | | 1,110,400 | | | | 129,116 | |
| | | | |
| | | | | | | | | | | | | | | 6,422,556 | |
| | | | | | | | | | | | | | | | |
| | | | |
| Poland: 2.07% | | | | | | | | | | | | | | | | |
Alior Bank SA (Financials, Banks) † | | | | | | | | | | | 15,045 | | | | 278,353 | |
Amrest Holdings SE (Consumer Discretionary, Hotels, Restaurants & Leisure) † | | | | | | | | | | | 755 | | | | 75,557 | |
Budimex SA (Industrials, Construction & Engineering) | | | | | | | | | | | 2,353 | | | | 149,829 | |
CCC SA (Consumer Discretionary, Textiles, Apparel & Luxury Goods) | | | | | | | | | | | 4,387 | | | | 322,449 | |
CD Projekt SA (Information Technology, Software) | | | | | | | | | | | 10,801 | | | | 252,517 | |
Ciech SA (Materials, Chemicals) † | | | | | | | | | | | 4,936 | | | | 86,798 | |
Cyfrowy Polsat SA (Consumer Discretionary, Media) | | | | | | | | | | | 56,065 | | | | 421,199 | |
Enea SA (Utilities, Electric Utilities) | | | | | | | | | | | 55,622 | | | | 237,781 | |
Eurocash SA (Consumer Staples, Food & Staples Retailing) | | | | | | | | | | | 22,297 | | | | 244,640 | |
Grupa Kety SA (Materials, Metals & Mining) | | | | | | | | | | | 1,665 | | | | 187,676 | |
Grupa Lotos SA (Energy, Oil, Gas & Consumable Fuels) | | | | | | | | | | | 13,965 | | | | 230,421 | |
ING Bank Slaski SA (Financials, Banks) † | | | | | | | | | | | 1,117 | | | | 62,624 | |
Inter Cars SA (Consumer Discretionary, Distributors) | | | | | | | | | | | 64 | | | | 5,131 | |
Jastrzebska Spolka Weglowa SA (Materials, Metals & Mining) † | | | | | | | | | | | 8,945 | | | | 260,780 | |
Kruk SA (Financials, Diversified Financial Services) | | | | | | | | | | | 3,674 | | | | 351,148 | |
LPP SA (Consumer Discretionary, Textiles, Apparel & Luxury Goods) | | | | | | | | | | | 224 | | | | 548,330 | |
Orange Polska SA (Telecommunication Services, Diversified Telecommunication Services) † | | | | | | | | | | | 138,633 | | | | 232,784 | |
PKO Bank Polski SA (Financials, Banks) † | | | | | | | | | | | 71,817 | | | | 738,443 | |
Polska Grupa Energetyczna SA (Utilities, Electric Utilities) | | | | | | | | | | | 123,411 | | | | 493,672 | |
Polski Koncern Naftowy Orlen SA (Energy, Oil, Gas & Consumable Fuels) | | | | | | | | | | | 38,149 | | | | 1,260,832 | |
Polskie Gornictwo Naftowe i Gazownictwo SA (Energy, Oil, Gas & Consumable Fuels) | | | | | | | | | | | 203,370 | | | | 389,375 | |
Powszechny Zaklad Ubezpieczen SA (Financials, Insurance) | | | | | | | | | | | 47,283 | | | | 642,846 | |
Synthos SA (Materials, Chemicals) | | | | | | | | | | | 109,761 | | | | 147,074 | |
Tauron Polska Energia SA (Utilities, Electric Utilities) † | | | | | | | | | | | 298,584 | | | | 328,105 | |
| | | | |
| | | | | | | | | | | | | | | 7,948,364 | |
| | | | | | | | | | | | | | | | |
| | | | |
| Russia: 1.94% | | | | | | | | | | | | | | | | |
Aeroflot PJSC (Industrials, Airlines) | | | | | | | | | | | 60,058 | | | | 201,384 | |
Alrosa PJSC (Materials, Metals & Mining) | | | | | | | | | | | 334,200 | | | | 465,247 | |
Bank Otkritie Financial Corporation PJSC (Financials, Banks) † | | | | | | | | | | | 2,043 | | | | 44,026 | |
Bashneft PJSC (Energy, Oil, Gas & Consumable Fuels) † | | | | | | | | | | | 102 | | | | 3,833 | |
Credit Bank of Moscow PJSC (Financials, Banks) † | | | | | | | | | | | 1,243,300 | | | | 98,169 | |
Gazprom Neft PJSC (Energy, Oil, Gas & Consumable Fuels) | | | | | | | | | | | 39,455 | | | | 140,869 | |
Inter Rao Ues PJSC (Utilities, Electric Utilities) | | | | | | | | | | | 4,043,002 | | | | 269,673 | |
LSR Group PJSC (Real Estate, Construction Materials) | | | | | | | | | | | 2,444 | | | | 32,844 | |
Lukoil PJSC (Energy, Oil, Gas & Consumable Fuels) | | | | | | | | | | | 7,560 | | | | 381,877 | |
Magnit PJSC (Consumer Staples, Food & Staples Retailing) | | | | | | | | | | | 7,224 | | | | 1,351,270 | |
Magnitogorsk Iron & Steel Works PJSC (Materials, Metals & Mining) | | | | | | | | | | | 173,000 | | | | 120,568 | |
MMC Norilsk Nickel PJSC (Materials, Metals & Mining) | | | | | | | | | | | 11,701 | | | | 1,972,861 | |
Mobile TeleSystems OJSC (Telecommunication Services, Wireless Telecommunication Services) | | | | | | | | | | | 125,114 | | | | 583,132 | |
The accompanying notes are an integral part of these financial statements.
| | | | | | |
| Portfolio of investments—August 31, 2017 (unaudited) | | Wells Fargo Target Date Funds | | | 105 | |
FACTOR ENHANCED EMERGING MARKETS PORTFOLIO
| | | | | | | | | | | | | | | | |
| Security name | | | | | | | | Shares | | | Value | |
| | | | |
| Russia (continued) | | | | | | | | | | | | | | | | |
Nizhnekamskneftekhim PJSC (Materials, Chemicals) † | | | | | | | | | | | 5,400 | | | $ | 4,618 | |
Novolipetsk Steel PJSC (Materials, Metals & Mining) | | | | | | | | | | | 117,410 | | | | 278,319 | |
PhosAgro PJSC (Materials, Chemicals) | | | | | | | | | | | 5,015 | | | | 199,805 | |
Pik Group PJSC (Real Estate, Construction & Engineering) † | | | | | | | | | | | 24,459 | | | | 122,200 | |
Severstal PJSC (Materials, Metals & Mining) | | | | | | | | | | | 21,260 | | | | 333,900 | |
United Wagon PJSC (Industrials, Road & Rail) † | | | | | | | | | | | 11,222 | | | | 151,290 | |
VTB Bank PJSC (Financials, Banks) | | | | | | | | | | | 625,185,027 | | | | 698,422 | |
| | | | |
| | | | | | | | | | | | | | | 7,454,307 | |
| | | | | | | | | | | | | | | | |
| | | | |
| South Africa: 3.71% | | | | | | | | | | | | | | | | |
Advtech Limited (Consumer Discretionary, Diversified Consumer Services) | | | | | | | | | | | 58,617 | | | | 82,009 | |
Aeci Limited (Materials, Chemicals) | | | | | | | | | | | 15,370 | | | | 126,422 | |
Alexander Forbes Group Holdings Limited (Financials, Diversified Financial Services) | | | | | | | | | | | 71,394 | | | | 36,990 | |
Anglogold Ashanti Limited (Materials, Metals & Mining) | | | | | | | | | | | 39,838 | | | | 403,196 | |
Arrowhead Properties Limited REIT (Real Estate, Equity REITs) | | | | | | | | | | | 216,729 | | | | 141,945 | |
Attacq Limited (Real Estate, Real Estate Management & Development) † | | | | | | | | | | | 207,533 | | | | 288,755 | |
Avi Limited (Consumer Staples, Food Products) | | | | | | | | | | | 65,619 | | | | 498,319 | |
Barloworld Limited (Industrials, Trading Companies & Distributors) | | | | | | | | | | | 23,914 | | | | 236,222 | |
Bid Corporation Limited (Consumer Staples, Food & Staples Retailing) | | | | | | | | | | | 42,836 | | | | 972,843 | |
Capitec Bank Holdings Limited (Financials, Banks) | | | | | | | | | | | 8,616 | | | | 596,422 | |
Clicks Group Limited (Consumer Staples, Food & Staples Retailing) | | | | | | | | | | | 51,938 | | | | 594,090 | |
Distell Group Limited (Consumer Staples, Beverages) | | | | | | | | | | | 20,587 | | | | 218,693 | |
Emira Property Fund Limited (Real Estate, Real Estate Management & Development) | | | | | | | | | | | 59,962 | | | | 63,932 | |
Famous Brands Limited (Consumer Discretionary, Hotels, Restaurants & Leisure) † | | | | | | | | | | | 506 | | | | 4,598 | |
Fortress Income Fund Limited (Real Estate, Real Estate Management & Development) | | | | | | | | | | | 135,408 | | | | 410,218 | |
Gold Fields Limited (Materials, Metals & Mining) | | | | | | | | | | | 80,109 | | | | 357,169 | |
Growthpoint Properties Limited (Real Estate, Equity REITs) | | | | | | | | | | | 277,793 | | | | 537,061 | |
Harmony Gold Mining Company Limited (Materials, Metals & Mining) | | | | | | | | | | | 32,545 | | | | 64,646 | |
Hyprop Investments Limited (Real Estate, Real Estate Management & Development) | | | | | | | | | | | 34,851 | | | | 305,759 | |
Imperial Holdings Limited (Consumer Discretionary, Distributors) | | | | | | | | | | | 12,679 | | | | 203,332 | |
Investec Limited (Financials, Capital Markets) | | | | | | | | | | | 26,492 | | | | 201,754 | |
Liberty Holdings Limited (Financials, Insurance) | | | | | | | | | | | 22,965 | | | | 182,890 | |
Life Healthcare Group Holdings Limited (Health Care, Health Care Providers & Services) | | | | | | | | | | | 2,304 | | | | 4,670 | |
Massmart Holdings Limited (Consumer Staples, Food & Staples Retailing) | | | | | | | | | | | 546 | | | | 5,106 | |
Mondi Limited (Materials, Paper & Forest Products) | | | | | | | | | | | 15,865 | | | | 432,604 | |
Mr. Price Group Limited (Consumer Discretionary, Specialty Retail) | | | | | | | | | | | 19,579 | | | | 272,793 | |
Nampak Limited (Materials, Containers & Packaging) † | | | | | | | | | | | 131,716 | | | | 191,163 | |
Nedbank Group Limited (Financials, Banks) | | | | | | | | | | | 12,581 | | | | 212,640 | |
Netcare Limited (Health Care, Health Care Providers & Services) | | | | | | | | | | | 101,032 | | | | 187,249 | |
Omnia Holdings Limited (Materials, Chemicals) | | | | | | | | | | | 421 | | | | 4,579 | |
Pick’n Pay Stores Limited (Consumer Staples, Food & Staples Retailing) | | | | | | | | | | | 43,578 | | | | 214,327 | |
Pioneer Foods Group Limited (Consumer Staples, Food Products) | | | | | | | | | | | 19,134 | | | | 186,284 | |
PPC Limited (Materials, Construction Materials) | | | | | | | | | | | 146,401 | | | | 63,923 | |
PSG Group Limited (Financials, Diversified Financial Services) | | | | | | | | | | | 18,928 | | | | 367,538 | |
Redefine Properties Limited (Real Estate, Equity REITs) | | | | | | | | | | | 522,663 | | | | 428,295 | |
Resilient REIT Limited (Real Estate, Equity REITs) | | | | | | | | | | | 58,448 | | | | 561,892 | |
Reunert Limited (Industrials, Industrial Conglomerates) | | | | | | | | | | | 19,622 | | | | 104,832 | |
SA Corporate Real Estate Limited REIT (Real Estate, Equity REITs) | | | | | | | | | | | 559,282 | | | | 232,591 | |
Santam Limited (Financials, Insurance) | | | | | | | | | | | 10,271 | | | | 204,492 | |
The accompanying notes are an integral part of these financial statements.
| | | | |
| 106 | | Wells Fargo Target Date Funds | | Portfolio of investments—August 31, 2017 (unaudited) |
FACTOR ENHANCED EMERGING MARKETS PORTFOLIO
| | | | | | | | | | | | | | | | |
| Security name | | | | | | | | Shares | | | Value | |
| | | | |
| South Africa (continued) | | | | | | | | | | | | | | | | |
Sappi Limited (Materials, Paper & Forest Products) | | | | | | | | | | | 56,581 | | | $ | 380,143 | |
Shoprite Holdings Limited (Consumer Staples, Food & Staples Retailing) | | | | | | | | | | | 53,258 | | | | 922,750 | |
Sibanye Gold Limited (Materials, Metals & Mining) | | | | | | | | | | | 133,393 | | | | 212,978 | |
SPAR Group Limited (Consumer Staples, Food & Staples Retailing) | | | | | | | | | | | 16,719 | | | | 217,265 | |
Super Group Limited (Consumer Staples, Food & Staples Retailing) † | | | | | | | | | | | 38,358 | | | | 121,808 | |
Telkom South Africa Limited (Telecommunication Services, Diversified Telecommunication Services) | | | | | | | | | | | 879 | | | | 4,241 | |
The Bidvest Group Limited (Industrials, Industrial Conglomerates) | | | | | | | | | | | 32,218 | | | | 424,620 | |
Tiger Brands Limited (Consumer Staples, Food Products) | | | | | | | | | | | 24,264 | | | | 751,678 | |
Tongaat-Hulett Limited (Consumer Staples, Food Products) | | | | | | | | | | | 25,044 | | | | 228,363 | |
Truworths International Limited (Consumer Discretionary, Specialty Retail) | | | | | | | | | | | 1,217 | | | | 7,768 | |
Vodacom Group Proprietary Limited (Consumer Discretionary, Media) | | | | | | | | | | | 19,028 | | | | 265,613 | |
Vukile Property Fund Limited REIT (Real Estate, Equity REITs) | | | | | | | | | | | 154,610 | | | | 222,845 | |
Wilson Bayly Holmes Ovcon Limited (Industrials, Construction & Engineering) | | | | | | | | | | | 465 | | | | 4,960 | |
Woolworths Holdings Limited (Consumer Discretionary, Multiline Retail) | | | | | | | | | | | 47,994 | | | | 218,927 | |
Zeder Investments Limited (Financials, Capital Markets) | | | | | | | | | | | 136,614 | | | | 66,686 | |
| | | | |
| | | | | | | | | | | | | | | 14,252,888 | |
| | | | | | | | | | | | | | | | |
| | | | |
| South Korea: 18.15% | | | | | | | | | | | | | | | | |
Amorepacific Corporation (Consumer Staples, Personal Products) | | | | | | | | | | | 2,719 | | | | 694,459 | |
Amorepacific Group (Consumer Staples, Personal Products) | | | | | | | | | | | 5,515 | | | | 655,383 | |
Asiana Airlines (Industrials, Airlines) † | | | | | | | | | | | 37,608 | | | | 149,585 | |
BGF Retail Company Limited (Consumer Staples, Food & Staples Retailing) | | | | | | | | | | | 4,508 | | | | 364,606 | |
Binggrae Company Limited (Consumer Staples, Food Products) | | | | | | | | | | | 3,028 | | | | 162,732 | |
BNK Financial Group Incorporated (Financials, Banks) | | | | | | | | | | | 43,518 | | | | 380,532 | |
Celltrion Incorporated (Health Care, Pharmaceuticals) † | | | | | | | | | | | 10,181 | | | | 1,039,228 | |
Chabiotech Company Limited (Health Care, Health Care Providers & Services) † | | | | | | | | | | | 453 | | | | 5,042 | |
Cheil Worldwide Incorporated (Consumer Discretionary, Media) | | | | | | | | | | | 14,327 | | | | 241,409 | |
Chong Kun Dang Pharmaceutical Corporation (Health Care, Pharmaceuticals) | | | | | | | | | | | 1,827 | | | | 168,507 | |
CJ CGV Company Limited (Consumer Discretionary, Media) | | | | | | | | | | | 69 | | | | 4,002 | |
CJ Cheiljedang Corporation (Consumer Staples, Food Products) | | | | | | | | | | | 1,706 | | | | 548,444 | |
CJ Corporation (Industrials, Industrial Conglomerates) | | | | | | | | | | | 2,038 | | | | 319,906 | |
CJ E&M Corporation (Consumer Discretionary, Media) | | | | | | | | | | | 3,459 | | | | 233,136 | |
CJ Korea Express Corporation (Industrials, Road & Rail) † | | | | | | | | | | | 1,860 | | | | 278,769 | |
CJ O Shopping Company Limited (Consumer Discretionary, Internet & Direct Marketing Retail) | | | | | | | | | | | 1,188 | | | | 225,463 | |
Com2us Corporation (Information Technology, Software) | | | | | | | | | | | 49 | | | | 4,737 | |
Cosmax Incorporated (Consumer Staples, Personal Products) | | | | | | | | | | | 1,971 | | | | 206,259 | |
Coway Company Limited (Consumer Discretionary, Household Durables) | | | | | | | | | | | 6,535 | | | | 572,595 | |
Daelim Industrial Company Limited (Industrials, Construction & Engineering) | | | | | | | | | | | 4,244 | | | | 315,402 | |
Daesang Corporation (Consumer Staples, Food Products) | | | | | | | | | | | 8,560 | | | | 182,951 | |
Daewoo Engineering & Construction Company Limited (Industrials, Construction & Engineering) † | | | | | | | | | | | 30,823 | | | | 192,165 | |
Daewoo Securities Company Limited (Financials, Capital Markets) | | | | | | | | | | | 25,827 | | | | 232,480 | |
Daewoong Pharmaceutical Company (Health Care, Pharmaceuticals) | | | | | | | | | | | 2,577 | | | | 230,824 | |
Daishin Securities Company Limited (Financials, Capital Markets) | | | | | | | | | | | 15,159 | | | | 189,555 | |
DGB Financial Group Incorporated (Financials, Banks) | | | | | | | | | | | 20,249 | | | | 197,534 | |
Dong-A Socio Holdings Company Limited (Health Care, Pharmaceuticals) (a) | | | | | | | | | | | 1,647 | | | | 184,769 | |
Dong-A ST Company Limited (Health Care, Pharmaceuticals) | | | | | | | | | | | 2,406 | | | | 178,167 | |
Dongbu Insurance Company Limited (Financials, Insurance) | | | | | | | | | | | 7,348 | | | | 490,040 | |
Dongkuk Steel Mill Company Limited (Materials, Metals & Mining) | | | | | | | | | | | 8,851 | | | | 99,295 | |
Doosan Corporation (Industrials, Industrial Conglomerates) | | | | | | | | | | | 2,676 | | | | 303,767 | |
E-MART Limited (Consumer Staples, Food & Staples Retailing) | | | | | | | | | | | 3,289 | | | | 653,366 | |
The accompanying notes are an integral part of these financial statements.
| | | | | | |
| Portfolio of investments—August 31, 2017 (unaudited) | | Wells Fargo Target Date Funds | | | 107 | |
FACTOR ENHANCED EMERGING MARKETS PORTFOLIO
| | | | | | | | | | | | | | | | |
| Security name | | | | | | | | Shares | | | Value | |
| | | | |
| South Korea (continued) | | | | | | | | | | | | | | | | |
Grand Korea Leisure Company Limited (Consumer Discretionary, Hotels, Restaurants & Leisure) | | | | | | | | | | | 245 | | | $ | 5,019 | |
Green Cross Corporation (Health Care, Biotechnology) | | | | | | | | | | | 1,266 | | | | 203,777 | |
Green Cross Holdings Corporation (Health Care, Biotechnology) | | | | | | | | | | | 6,834 | | | | 204,547 | |
GS Engineering & Construction Corporation (Industrials, Construction & Engineering) † | | | | | | | | | | | 7,339 | | | | 185,493 | |
GS Holdings Corporation (Energy, Oil, Gas & Consumable Fuels) | | | | | | | | | | | 9,629 | | | | 602,880 | |
GS Home Shopping Incorporated (Consumer Discretionary, Internet & Direct Marketing Retail) | | | | | | | | | | | 1,014 | | | | 198,286 | |
GS Retail Company Limited (Consumer Staples, Food & Staples Retailing) | | | | | | | | | | | 7,371 | | | | 263,764 | |
Hana Financial Group Incorporated (Financials, Banks) | | | | | | | | | | | 33,569 | | | | 1,458,745 | |
Hana Tour Service Incorporated (Consumer Discretionary, Hotels, Restaurants & Leisure) | | | | | | | | | | | 2,521 | | | | 190,260 | |
Hanil Cement Company Limited (Materials, Construction Materials) | | | | | | | | | | | 1,994 | | | | 227,234 | |
Hankook Tire Company Limited (Consumer Discretionary, Auto Components) | | | | | | | | | | | 11,932 | | | | 624,324 | |
Hankook Tire Worldwide Company Limited (Financials, Diversified Financial Services) | | | | | | | | | | | 10,362 | | | | 195,735 | |
Hanmi Pharm Company Limited (Health Care, Pharmaceuticals) † | | | | | | | | | | | 823 | | | | 294,137 | |
Hanmi Science Company Limited (Health Care, Pharmaceuticals) | | | | | | | | | | | 4,242 | | | | 336,697 | |
Hanon Systems (Consumer Discretionary, Auto Components) | | | | | | | | | | | 23,361 | | | | 239,287 | |
Hansol Chemical Company Limited (Materials, Chemicals) | | | | | | | | | | | 74 | | | | 5,066 | |
Hanssem Company Limited (Consumer Discretionary, Household Durables) | | | | | | | | | | | 2,199 | | | | 331,527 | |
Hanwha Chem Corporation (Materials, Chemicals) | | | | | | | | | | | 13,471 | | | | 422,313 | |
Hanwha Corporation (Korea) (Industrials, Industrial Conglomerates) | | | | | | | | | | | 10,697 | | | | 466,262 | |
Hanwha Life Insurance Company Limited (Financials, Insurance) | | | | | | | | | | | 69,610 | | | | 451,885 | |
Hanwha Techwin Company Limited (Industrials, Aerospace & Defense) † | | | | | | | | | | | 6,030 | | | | 207,488 | |
Hite Jinro Company Limited (Consumer Staples, Beverages) | | | | | | | | | | | 11,876 | | | | 274,888 | |
Hotel Shilla Company Limited (Consumer Discretionary, Specialty Retail) | | | | | | | | | | | 5,656 | | | | 310,488 | |
Huchems Fine Chemical Corporation (Materials, Chemicals) | | | | | | | | | | | 271 | | | | 5,756 | |
Hugel Incorporated (Health Care, Biotechnology) † | | | | | | | | | | | 457 | | | | 235,066 | |
Hyosung Corporation (Materials, Chemicals) | | | | | | | | | | | 2,631 | | | | 369,824 | |
Hyundai Elevator Company (Industrials, Machinery) | | | | | | | | | | | 91 | | | | 4,197 | |
Hyundai Engineering & Construction Company Limited (Industrials, Construction & Engineering) | | | | | | | | | | | 10,004 | | | | 360,644 | |
Hyundai Glovis Company Limited (Industrials, Air Freight & Logistics) | | | | | | | | | | | 1,853 | | | | 254,714 | |
Hyundai Heavy Industries Company Limited (Industrials, Machinery) | | | | | | | | | | | 5,285 | | | | 696,011 | |
Hyundai Home Shopping Network Corporation (Consumer Discretionary, Internet & Direct Marketing Retail) | | | | | | | | | | | 2,176 | | | | 265,342 | |
Hyundai Marine & Fire Insurance Company Limited (Financials, Insurance) | | | | | | | | | | | 9,711 | | | | 397,879 | |
Hyundai Merchant Marine Company Limited (Industrials, Marine) † | | | | | | | | | | | 25,230 | | | | 199,137 | |
Hyundai Mipo Dockyard Company Limited (Industrials, Machinery) † | | | | | | | | | | | 2,398 | | | | 214,791 | |
Hyundai Mobis (Consumer Discretionary, Auto Components) | | | | | | | | | | | 8,609 | | | | 1,801,813 | |
Hyundai Motor Company (Consumer Discretionary, Automobiles) | | | | | | | | | | | 19,456 | | | | 2,424,236 | |
Hyundai Robotics Company Limited (Information Technology, Semiconductors & Semiconductor Equipment) † | | | | | | | | | | | 759 | | | | 298,188 | |
Hyundai Rotem Company (Industrials, Machinery) † | | | | | | | | | | | 11,084 | | | | 181,850 | |
Hyundai Steel Company (Materials, Metals & Mining) | | | | | | | | | | | 8,997 | | | | 460,382 | |
Ilyang Pharmaceutical Company Limited (Health Care, Pharmaceuticals) | | | | | | | | | | | 5,593 | | | | 179,555 | |
Industrial Bank of Korea (Financials, Banks) | | | | | | | | | | | 29,071 | | | | 385,431 | |
Innocean Worldwide Incorporated (Consumer Discretionary, Media) | | | | | | | | | | | 83 | | | | 5,278 | |
Is Dongseo Company Limited (Industrials, Building Products) | | | | | | | | | | | 126 | | | | 3,989 | |
JB Financial Group Company Limited (Financials, Banks) | | | | | | | | | | | 39,586 | | | | 218,362 | |
Jeil Pharmaceutical Company Limited (Health Care, Pharmaceuticals) † | | | | | | | | | | | 48 | | | | 2,114 | |
Kangwon Land Incorporated (Consumer Discretionary, Hotels, Restaurants & Leisure) | | | | | | | | | | | 12,826 | | | | 392,424 | |
KB Financial Group Incorporated (Financials, Banks) | | | | | | | | | | | 51,523 | | | | 2,531,371 | |
KEPCO Plant Service & Engineering Company Limited (Industrials, Commercial Services & Supplies) | | | | | | | | | | | 110 | | | | 4,463 | |
Kia Motors Corporation (Consumer Discretionary, Automobiles) | | | | | | | | | | | 35,071 | | | | 1,102,578 | |
Kiwoom Securities Company (Financials, Capital Markets) | | | | | | | | | | | 2,466 | | | | 176,487 | |
The accompanying notes are an integral part of these financial statements.
| | | | |
| 108 | | Wells Fargo Target Date Funds | | Portfolio of investments—August 31, 2017 (unaudited) |
FACTOR ENHANCED EMERGING MARKETS PORTFOLIO
| | | | | | | | | | | | | | | | |
| Security name | | | | | | | | Shares | | | Value | |
| | | | |
| South Korea (continued) | | | | | | | | | | | | | | | | |
Koh Young Technology Incorporated (Information Technology, Semiconductors & Semiconductor Equipment) | | | | | | | | | | | 3,679 | | | $ | 199,024 | |
Kolon Industries Incorporated (Materials, Chemicals) | | | | | | | | | | | 85 | | | | 5,390 | |
Kolon Life Science Incorporated (Health Care, Pharmaceuticals) | | | | | | | | | | | 1,290 | | | | 149,867 | |
Korea Aerospace Industries Limited (Industrials, Aerospace & Defense) | | | | | | | | | | | 7,810 | | | | 320,337 | |
Korea Electric Power Corporation (Utilities, Electric Utilities) | | | | | | | | | | | 37,072 | | | | 1,410,419 | |
Korea Gas Corporation (Utilities, Gas Utilities) † | | | | | | | | | | | 12,195 | | | | 489,920 | |
Korea Investment Holdings Company Limited (Financials, Capital Markets) | | | | | | | | | | | 8,020 | | | | 467,288 | |
Korea Kolmar Company Limited (Consumer Staples, Personal Products) | | | | | | | | | | | 3,139 | | | | 189,019 | |
Korea Petrochemical Industrial Company Limited (Materials, Chemicals) | | | | | | | | | | | 24 | | | | 5,694 | |
Korea Reinsurance Company (Financials, Insurance) | | | | | | | | | | | 20,977 | | | | 231,610 | |
Korean Air Lines Company Limited (Industrials, Airlines) † | | | | | | | | | | | 8,897 | | | | 261,955 | |
KT&G Corporation (Consumer Staples, Tobacco) | | | | | | | | | | | 17,787 | | | | 1,806,147 | |
Kumho Petrochemical Company Limited (Materials, Chemicals) | | | | | | | | | | | 2,795 | | | | 195,323 | |
LF Corporation (Consumer Discretionary, Textiles, Apparel & Luxury Goods) | | | | | | | | | | | 7,197 | | | | 185,733 | |
LG Chem Limited (Materials, Chemicals) | | | | | | | | | | | 4,327 | | | | 1,454,357 | |
LG Corporation (Industrials, Industrial Conglomerates) | | | | | | | | | | | 17,716 | | | | 1,319,745 | |
LG Display Company Limited (Information Technology, Electronic Equipment, Instruments & Components) | | | | | | | | | | | 28,656 | | | | 791,623 | |
LG Electronics Incorporated (Consumer Discretionary, Household Durables) | | | | | | | | | | | 15,298 | | | | 1,105,700 | |
LG Household & Health Care Limited (Consumer Staples, Personal Products) | | | | | | | | | | | 1,553 | | | | 1,322,171 | |
LG Innotek Company Limited (Information Technology, Electronic Equipment, Instruments & Components) | | | | | | | | | | | 2,058 | | | | 336,734 | |
LG International Corporation (Industrials, Trading Companies & Distributors) | | | | | | | | | | | 180 | | | | 4,605 | |
LG Uplus Corporation (Telecommunication Services, Diversified Telecommunication Services) | | | | | | | | | | | 9,994 | | | | 122,310 | |
Lig Nex1 Company Limited (Industrials, Aerospace & Defense) | | | | | | | | | | | 71 | | | | 5,251 | |
Loen Entertainment Incorporated (Consumer Discretionary, Media) | | | | | | | | | | | 2,038 | | | | 145,132 | |
Lotte Chemical Corporation (Materials, Chemicals) | | | | | | | | | | | 1,726 | | | | 611,509 | |
Lotte Chilsung Beverage Company Limited (Consumer Staples, Beverages) | | | | | | | | | | | 182 | | | | 249,693 | |
Lotte Confectionery Company Limited (Consumer Staples, Food Products) | | | | | | | | | | | 1,333 | | | | 233,476 | |
Lotte Fine Chemical Company Limited (Materials, Chemicals) | | | | | | | | | | | 5,699 | | | | 220,106 | |
Lotte Food Company Limited (Consumer Staples, Food Products) | | | | | | | | | | | 386 | | | | 211,554 | |
Lotte Shopping Company Limited (Consumer Discretionary, Multiline Retail) | | | | | | | | | | | 2,351 | | | | 535,835 | |
LS Corporation (Industrials, Electrical Equipment) | | | | | | | | | | | 4,999 | | | | 374,615 | |
LS Industrial Systems Company Limited (Industrials, Electrical Equipment) | | | | | | | | | | | 5,108 | | | | 263,645 | |
Medy-Tox Incorporated (Health Care, Biotechnology) | | | | | | | | | | | 603 | | | | 304,334 | |
Meritz Financial Group Incorporated (Financials, Diversified Financial Services) | | | | | | | | | | | 19,613 | | | | 291,342 | |
Meritz Fire & Marine Insurance Company Limited (Financials, Insurance) | | | | | | | | | | | 15,401 | | | | 345,553 | |
Meritz Securities Company Limited (Financials, Capital Markets) | | | | | | | | | | | 47,817 | | | | 204,609 | |
Mirae Asset Life Insurance Company Limited (Financials, Insurance) | | | | | | | | | | | 31,674 | | | | 155,898 | |
Naver Corporation (Information Technology, Internet Software & Services) | | | | | | | | | | | 4,012 | | | | 2,686,289 | |
NCsoft Corporation (Information Technology, Software) | | | | | | | | | | | 2,066 | | | | 704,485 | |
NH Investment & Securities Company Class C (Financials, Capital Markets) | | | | | | | | | | | 15,295 | | | | 187,186 | |
Nong Shim Company Limited (Consumer Staples, Food Products) | | | | | | | | | | | 903 | | | | 266,271 | |
Orion Corporation (Consumer Staples, Food Products) | | | | | | | | | | | 44 | | | | 1,073 | |
Ottogi Corporation (Consumer Staples, Food Products) | | | | | | | | | | | 488 | | | | 329,344 | |
Pan Ocean Company Limited (Industrials, Marine) † | | | | | | | | | | | 33,987 | | | | 193,807 | |
Paradise Company Limited (Consumer Discretionary, Hotels, Restaurants & Leisure) | | | | | | | | | | | 16,043 | | | | 207,722 | |
POSCO (Materials, Metals & Mining) | | | | | | | | | | | 9,897 | | | | 3,014,894 | |
S-Oil Corporation (Energy, Oil, Gas & Consumable Fuels) | | | | | | | | | | | 2,383 | | | | 265,224 | |
S1 Corporation Incorporated (Industrials, Commercial Services & Supplies) | | | | | | | | | | | 4,688 | | | | 372,928 | |
Samsung Biologics Company Limited (Health Care, Life Sciences Tools & Services) 144A† | | | | | | | | | | | 1,488 | | | | 373,452 | |
Samsung Card Company Limited (Financials, Consumer Finance) | | | | | | | | | | | 5,689 | | | | 187,178 | |
The accompanying notes are an integral part of these financial statements.
| | | | | | |
| Portfolio of investments—August 31, 2017 (unaudited) | | Wells Fargo Target Date Funds | | | 109 | |
FACTOR ENHANCED EMERGING MARKETS PORTFOLIO
| | | | | | | | | | | | | | | | |
| Security name | | | | | | | | Shares | | | Value | |
| | | | |
| South Korea (continued) | | | | | | | | | | | | | | | | |
Samsung Engineering Company Limited (Industrials, Construction & Engineering) † | | | | | | | | | | | 19,845 | | | $ | 188,313 | |
Samsung Fire & Marine Insurance Company Limited (Financials, Insurance) | | | | | | | | | | | 5,349 | | | | 1,311,634 | |
Samsung Heavy Industries Company Limited (Industrials, Machinery) † | | | | | | | | | | | 44,671 | | | | 423,891 | |
Samsung Life Insurance Company Limited (Financials, Insurance) | | | | | | | | | | | 13,731 | | | | 1,406,466 | |
Samsung SDS Company Limited (Information Technology, Technology Hardware, Storage & Peripherals) | | | | | | | | | | | 4,365 | | | | 648,401 | |
Samyang Holdings Corporation (Consumer Staples, Food Products) | | | | | | | | | | | 1,928 | | | | 182,951 | |
Seegene Incorporated (Health Care, Biotechnology) † | | | | | | | | | | | 5,986 | | | | 167,222 | |
SFA Engineering Corporation (Information Technology, Electronic Equipment, Instruments & Components) | | | | | | | | | | | 5,671 | | | | 190,358 | |
Shinhan Financial Group Company Limited (Financials, Banks) | | | | | | | | | | | 53,871 | | | | 2,484,296 | |
Shinsegae Company Limited (Consumer Discretionary, Multiline Retail) | | | | | | | | | | | 1,584 | | | | 271,117 | |
SK Chemicals Company Limited (Materials, Chemicals) | | | | | | | | | | | 3,160 | | | | 191,685 | |
SK Company Limited (Industrials, Industrial Conglomerates) | | | | | | | | | | | 6,209 | | | | 1,472,958 | |
SK Innovation Company Limited (Energy, Oil, Gas & Consumable Fuels) | | | | | | | | | | | 6,065 | | | | 1,013,881 | |
SK Materials Company Limited (Materials, Chemicals) | | | | | | | | | | | 1,179 | | | | 190,924 | |
SK Networks Company Limited (Industrials, Trading Companies & Distributors) | | | | | | | | | | | 36,234 | | | | 225,257 | |
SK Telecom Company Limited (Telecommunication Services, Wireless Telecommunication Services) | | | | | | | | | | | 6,624 | | | | 1,489,166 | |
SKC Company Limited (Materials, Chemicals) | | | | | | | | | | | 194 | | | | 6,349 | |
Soulbrain Company Limited (Materials, Chemicals) | | | | | | | | | | | 3,111 | | | | 177,953 | |
Taekwang Industrial Company Limited (Materials, Chemicals) | | | | | | | | | | | 132 | | | | 142,465 | |
Vieworks Company Limited (Health Care, Health Care Equipment & Supplies) | | | | | | | | | | | 91 | | | | 3,874 | |
Woori Bank (Financials, Banks) | | | | | | | | | | | 73,392 | | | | 1,210,617 | |
Yuhan Corporation (Health Care, Pharmaceuticals) | | | | | | | | | | | 1,551 | | | | 310,860 | |
Yungjin Pharmaceutical Company (Health Care, Pharmaceuticals) † | | | | | | | | | | | 19,288 | | | | 178,751 | |
| | | | |
| | | | | | | | | | | | | | | 69,783,858 | |
| | | | | | | | | | | | | | | | |
| | | | |
| Taiwan: 15.02% | | | | | | | | | | | | | | | | |
Accton Technology Corporation (Information Technology, Communications Equipment) | | | | | | | | | | | 90,000 | | | | 235,594 | |
Acer Incorporated (Information Technology, Technology Hardware, Storage & Peripherals) | | | | | | | | | | | 619,000 | | | | 311,766 | |
Advanced Semiconductor Engineering Incorporated (Information Technology, Semiconductors & Semiconductor Equipment) | | | | | | | | | | | 792,000 | | | | 955,260 | |
Amtran Technology Company Limited (Consumer Discretionary, Household Durables) | | | | | | | | | | | 7,000 | | | | 3,897 | |
Asia Cement Corporation (Materials, Construction Materials) | | | | | | | | | | | 375,000 | | | | 339,847 | |
Asustek Computer Incorporated (Information Technology, Technology Hardware, Storage & Peripherals) | | | | | | | | | | | 90,000 | | | | 745,552 | |
BizLink Holding Incorporated (Industrials, Electrical Equipment) | | | | | | | | | | | 1,000 | | | | 8,715 | |
Capital Securities Corporation (Financials, Capital Markets) | | | | | | | | | | | 153,000 | | | | 49,988 | |
Cathay Financial Holding Company Limited (Financials, Insurance) | | | | | | | | | | | 1,080,000 | | | | 1,762,484 | |
Chailease Holding Company Limited (Financials, Diversified Financial Services) | | | | | | | | | | | 211,000 | | | | 574,711 | |
Chang Hwa Commercial Bank (Financials, Banks) | | | | | | | | | | | 32,800 | | | | 17,933 | |
Cheng Loong Corporation (Materials, Containers & Packaging) | | | | | | | | | | | 332,000 | | | | 199,119 | |
Cheng Uei Precision Industry Company Limited (Information Technology, Electronic Equipment, Instruments & Components) | | | | | | | | | | | 32,000 | | | | 43,686 | |
Chicony Electronics Company Limited (Information Technology, Technology Hardware, Storage & Peripherals) | | | | | | | | | | | 2,010 | | | | 5,048 | |
China Bills Finance Corporation (Financials, Capital Markets) | | | | | | | | | | | 384,000 | | | | 190,225 | |
China Life Insurance Company - Taiwan Exchange (Financials, Insurance) | | | | | | | | | | | 535,000 | | | | 590,328 | |
China Motor Company Limited (Consumer Discretionary, Automobiles) | | | | | | | | | | | 256,000 | | | | 238,364 | |
China Petrochemical Development Corporation (Materials, Chemicals) † | | | | | | | | | | | 575,000 | | | | 261,979 | |
China Steel Chemical Corporation (Materials, Chemicals) | | | | | | | | | | | 47,000 | | | | 179,877 | |
China Steel Corporation (Materials, Metals & Mining) | | | | | | | | | | | 1,232,000 | | | | 1,032,824 | |
China Synthetic Rubber Corporation (Materials, Chemicals) | | | | | | | | | | | 273,000 | | | | 330,632 | |
Chunghwa Telecom Company Limited (Telecommunication Services, Diversified Telecommunication Services) | | | | | | | | | | | 539,000 | | | | 1,875,311 | |
The accompanying notes are an integral part of these financial statements.
| | | | |
| 110 | | Wells Fargo Target Date Funds | | Portfolio of investments—August 31, 2017 (unaudited) |
FACTOR ENHANCED EMERGING MARKETS PORTFOLIO
| | | | | | | | | | | | | | | | |
| Security name | | | | | | | | Shares | | | Value | |
| | | | |
| Taiwan (continued) | | | | | | | | | | | | | | | | |
Cleanaway Company Limited (Industrials, Commercial Services & Supplies) | | | | | | | | | | | 29,000 | | | $ | 163,359 | |
Compal Electronic Incorporated (Information Technology, Technology Hardware, Storage & Peripherals) | | | | | | | | | | | 536,000 | | | | 385,407 | |
Compeq Manufacturing Company Limited (Information Technology, Electronic Equipment, Instruments & Components) | | | | | | | | | | | 197,000 | | | | 212,477 | |
CTBC Financial Holding Company Limited (Financials, Banks) | | | | | | | | | | | 2,534,000 | | | | 1,641,529 | |
CTCI Corporation (Industrials, Construction & Engineering) | | | | | | | | | | | 112,000 | | | | 181,106 | |
E.SUN Financial Holding Company Limited (Financials, Banks) | | | | | | | | | | | 1,603,052 | | | | 987,997 | |
Elan Microelectronics Corporation (Information Technology, Semiconductors & Semiconductor Equipment) | | | | | | | | | | | 137,000 | | | | 195,883 | |
Elite Material Company Limited (Information Technology, Electronic Equipment, Instruments & Components) | | | | | | | | | | | 41,000 | | | | 206,501 | |
Eternal Chemical Company Limited (Materials, Chemicals) | | | | | | | | | | | 165,900 | | | | 175,361 | |
Eva Airways Corporation (Industrials, Airlines) | | | | | | | | | | | 394,490 | | | | 205,225 | |
Evergreen Marine Corporation (Taiwan) Limited (Industrials, Marine) † | | | | | | | | | | | 392,000 | | | | 298,751 | |
Far Eastern Department Stores Company Limited (Consumer Discretionary, Multiline Retail) | | | | | | | | | | | 266,000 | | | | 133,093 | |
Far Eastern International Bank (Financials, Banks) | | | | | | | | | | | 405,108 | | | | 124,973 | |
Far Eastern New Century Corporation (Industrials, Industrial Conglomerates) | | | | | | | | | | | 626,000 | | | | 500,941 | |
Far Eastone Telecommunications Company Limited (Telecommunication Services, Wireless Telecommunication Services) | | | | | | | | | | | 223,000 | | | | 540,893 | |
Feng Hsin Iron & Steel Company (Materials, Metals & Mining) | | | | | | | | | | | 3,000 | | | | 5,229 | |
Feng Tay Enterprise Company Limited (Consumer Discretionary, Textiles, Apparel & Luxury Goods) | | | | | | | | | | | 42,000 | | | | 199,013 | |
First Financial Holding Company Limited (Financials, Banks) | | | | | | | | | | | 1,901,280 | | | | 1,234,802 | |
Flexium Interconnect Incorporated (Information Technology, Electronic Equipment, Instruments & Components) | | | | | | | | | | | 1,049 | | | | 4,640 | |
Formosa Chemicals & Fibre Corporation (Materials, Chemicals) | | | | | | | | | | | 528,000 | | | | 1,660,333 | |
Formosa Petrochemical Corporation (Energy, Oil, Gas & Consumable Fuels) | | | | | | | | | | | 149,000 | | | | 525,813 | |
Formosa Plastics Corporation (Materials, Chemicals) | | | | | | | | | | | 670,000 | | | | 2,084,662 | |
Formosa Taffeta Company Limited (Consumer Discretionary, Textiles, Apparel & Luxury Goods) | | | | | | | | | | | 140,000 | | | | 139,170 | |
Fubon Financial Holding Company Limited (Financials, Diversified Financial Services) | | | | | | | | | | | 925,000 | | | | 1,486,547 | |
General Interface Solution Holding Limited (Information Technology, Electronic Equipment, Instruments & Components) | | | | | | | | | | | 18,000 | | | | 215,614 | |
Getac Technology Corporation (Information Technology, Technology Hardware, Storage & Peripherals) | | | | | | | | | | | 3,000 | | | | 4,279 | |
Giant Manufacturing Company Limited (Consumer Discretionary, Leisure Products) | | | | | | | | | | | 34,000 | | | | 171,808 | |
Gourmet Master Company Limited (Consumer Discretionary, Hotels, Restaurants & Leisure) | | | | | | | | | | | 18,000 | | | | 213,526 | |
Grand Pacific Petrochemical Corporation (Materials, Chemicals) | | | | | | | | | | | 273,000 | | | | 231,126 | |
Grape King Bio Limited (Consumer Staples, Personal Products) | | | | | | | | | | | 30,000 | | | | 182,412 | |
Great Wall Enterprises Company Limited (Consumer Staples, Food Products) | | | | | | | | | | | 260,000 | | | | 266,642 | |
Greatek Electronic Incorporated (Information Technology, Semiconductors & Semiconductor Equipment) | | | | | | | | | | | 174,000 | | | | 278,478 | |
Hannstar Display Corporation (Information Technology, Electronic Equipment, Instruments & Components) | | | | | | | | | | | 630,000 | | | | 256,768 | |
Hey Song Corporation (Consumer Staples, Beverages) | | | | | | | | | | | 6,000 | | | | 6,243 | |
Highwealth Construction Corporation (Real Estate, Real Estate Management & Development) | | | | | | | | | | | 118,000 | | | | 187,680 | |
Hon Hai Precision Industry Company Limited (Information Technology, Electronic Equipment, Instruments & Components) | | | | | | | | | | | 1,937,000 | | | | 7,541,585 | |
Hotai Motor Company Limited (Consumer Discretionary, Specialty Retail) | | | | | | | | | | | 50,000 | | | | 588,986 | |
Hua Nan Financial Holdings Company Limited Class C (Financials, Banks) | | | | | | | | | | | 1,677,900 | | | | 936,831 | |
Huaku Development Company Limited (Financials, Real Estate Management & Development) | | | | | | | | | | | 88,000 | | | | 180,496 | |
Inventec Company Limited (Information Technology, Technology Hardware, Storage & Peripherals) | | | | | | | | | | | 323,000 | | | | 256,332 | |
Kenda Rubber Industrial Company Limited (Consumer Discretionary, Auto Components) | | | | | | | | | | | 53,000 | | | | 75,780 | |
King Yuan Electronics Company Limited (Information Technology, Semiconductors & Semiconductor Equipment) | | | | | | | | | | | 4,000 | | | | 3,877 | |
King’s Town Bank Company Limited (Financials, Banks) | | | | | | | | | | | 214,000 | | | | 225,849 | |
Lee Chang Yung Chemical Industry Corporation (Materials, Chemicals) | | | | | | | | | | | 109,000 | | | | 146,097 | |
Lien Hwa Industrial Corporation (Consumer Staples, Food Products) | | | | | | | | | | | 348,600 | | | | 318,232 | |
Lite-On Technology Corporation (Information Technology, Technology Hardware, Storage & Peripherals) | | | | | | | | | | | 274,000 | | | | 405,385 | |
The accompanying notes are an integral part of these financial statements.
| | | | | | |
| Portfolio of investments—August 31, 2017 (unaudited) | | Wells Fargo Target Date Funds | | | 111 | |
FACTOR ENHANCED EMERGING MARKETS PORTFOLIO
| | | | | | | | | | | | | | | | |
| Security name | | | | | | | | Shares | | | Value | |
| | | | |
| Taiwan (continued) | | | | | | | | | | | | | | | | |
Long Chen Paper Company Limited (Materials, Paper & Forest Products) | | | | | | | | | | | 129,000 | | | $ | 189,146 | |
Macronix International Company Limited (Information Technology, Semiconductors & Semiconductor Equipment) † | | | | | | | | | | | 270,564 | | | | 377,439 | |
Mercuries Life Insurance Company (Financials, Insurance) † | | | | | | | | | | | 318,000 | | | | 170,175 | |
Merida Industry Company Limited (Consumer Discretionary, Leisure Products) | | | | | | | | | | | 37,000 | | | | 162,447 | |
Merry Electronics Company Limited (Information Technology, Electronic Equipment, Instruments & Components) | | | | | | | | | | | 25,000 | | | | 196,329 | |
Micro-Star International Company Limited (Information Technology, Technology Hardware, Storage & Peripherals) | | | | | | | | | | | 82,000 | | | | 186,666 | |
Mitac Holdings Corporation (Information Technology, Technology Hardware, Storage & Peripherals) | | | | | | | | | | | 158,000 | | | | 188,214 | |
Nan Kang Rubber Tire Company Limited (Consumer Discretionary, Auto Components) | | | | | | | | | | | 80,000 | | | | 72,236 | |
Nan Ya Plastics Corporation (Materials, Chemicals) | | | | | | | | | | | 665,000 | | | | 1,679,081 | |
Nanya Technology Corporation (Information Technology, Semiconductors & Semiconductor Equipment) | | | | | | | | | | | 107,000 | | | | 229,395 | |
Nien Made Enterprise Company Limited (Consumer Discretionary, Household Durables) | | | | | | | | | | | 18,000 | | | | 193,545 | |
Novatek Microelectronics Corporation Limited (Information Technology, Semiconductors & Semiconductor Equipment) | | | | | | | | | | | 59,000 | | | | 229,713 | |
Oriental Union Chemical Corporation (Materials, Chemicals) | | | | | | | | | | | 5,000 | | | | 4,440 | |
Pegatron Corporation (Information Technology, Technology Hardware, Storage & Peripherals) | | | | | | | | | | | 256,000 | | | | 805,858 | |
Pou Chen Corporation (Consumer Discretionary, Textiles, Apparel & Luxury Goods) | | | | | | | | | | | 148,000 | | | | 191,994 | |
Powertech Technology Incorporated (Information Technology, Semiconductors & Semiconductor Equipment) | | | | | | | | | | | 96,000 | | | | 291,381 | |
President Chain Store Corporation (Consumer Staples, Food & Staples Retailing) | | | | | | | | | | | 119,000 | | | | 995,643 | |
Prince Housing & Development Corporation (Financials, Real Estate Management & Development) | | | | | | | | | | | 201,000 | | | | 76,593 | |
Qisda Corporation (Information Technology, Technology Hardware, Storage & Peripherals) | | | | | | | | | | | 347,000 | | | | 248,358 | |
Quanta Computer Incorporated (Information Technology, Technology Hardware, Storage & Peripherals) | | | | | | | | | | | 330,000 | | | | 751,218 | |
Radiant Opto-Electronics Corporation (Information Technology, Semiconductors & Semiconductor Equipment) | | | | | | | | | | | 2,000 | | | | 5,043 | |
Realtek Semiconductor Corporation (Information Technology, Semiconductors & Semiconductor Equipment) | | | | | | | | | | | 63,000 | | | | 244,243 | |
Ruentex Development Company Limited (Real Estate, Real Estate Management & Development) † | | | | | | | | | | | 208,800 | | | | 204,448 | |
Sanyang Industry Company Limited (Consumer Discretionary, Automobiles) | | | | | | | | | | | 325,000 | | | | 222,381 | |
Scinopharm Taiwan Limited (Health Care, Pharmaceuticals) | | | | | | | | | | | 4,680 | | | | 5,381 | |
Sercomm Corporation (Information Technology, Communications Equipment) | | | | | | | | | | | 2,000 | | | | 5,269 | |
Shihlin Electric & Engineering Corporation (Industrials, Electrical Equipment) | | | | | | | | | | | 3,000 | | | | 4,255 | |
Shin Kong Financial Holding Company Limited (Financials, Insurance) | | | | | | | | | | | 2,088,000 | | | | 606,772 | |
Shin Kong No.1 REIT (Real Estate, Equity REITs) | | | | | | | | | | | 10,000 | | | | 4,692 | |
Shinkong Synthetic Fibers Corporation (Materials, Chemicals) | | | | | | | | | | | 210,000 | | | | 63,183 | |
Siliconware Precision Industries Company (Information Technology, Semiconductors & Semiconductor Equipment) | | | | | | | | | | | 273,000 | | | | 432,400 | |
Sinbon Electronics Company Limited (Information Technology, Electronic Equipment, Instruments & Components) | | | | | | | | | | | 2,000 | | | | 4,937 | |
Sinopac Financial Holdings Company Limited (Financials, Banks) | | | | | | | | | | | 1,669,000 | | | | 536,443 | |
Standard Foods Corporation (Consumer Staples, Food Products) | | | | | | | | | | | 160,160 | | | | 409,170 | |
Synnex Technology International Corporation (Information Technology, Electronic Equipment, Instruments & Components) | | | | | | | | | | | 178,000 | | | | 198,767 | |
Taichung Commercial Bank (Financials, Banks) | | | | | | | | | | | 1,045,476 | | | | 330,836 | |
Tainan Spinning Company Limited (Consumer Discretionary, Textiles, Apparel & Luxury Goods) | | | | | | | | | | | 9,000 | | | | 4,041 | |
Taishin Financial Holdings Company Limited (Financials, Banks) | | | | | | | | | | | 2,101,578 | | | | 933,137 | |
Taiwan Business Bank (Financials, Banks) | | | | | | | | | | | 1,210,250 | | | | 334,454 | |
Taiwan Cement Corporation (Materials, Construction Materials) | | | | | | | | | | | 483,000 | | | | 557,757 | |
Taiwan Cooperative Financial Holdings (Financials, Banks) | | | | | | | | | | | 1,878,720 | | | | 989,816 | |
Taiwan Glass Industrial Corporation (Industrials, Building Products) † | | | | | | | | | | | 336,000 | | | | 182,591 | |
Taiwan High Speed Rail Corporation (Industrials, Transportation Infrastructure) | | | | | | | | | | | 441,000 | | | | 388,701 | |
Taiwan Hon Chuan Enterprise Company Limited (Materials, Containers & Packaging) | | | | | | | | | | | 103,000 | | | | 186,689 | |
Taiwan Mobile Company Limited (Telecommunication Services, Wireless Telecommunication Services) | | | | | | | | | | | 297,000 | | | | 1,062,858 | |
Taiwan Secom Company Limited (Industrials, Commercial Services & Supplies) | | | | | | | | | | | 46,000 | | | | 135,962 | |
Taiwan Shin Kong Security Company (Industrials, Commercial Services & Supplies) | | | | | | | | | | | 35,000 | | | | 46,854 | |
Tatung Company Limited (Consumer Discretionary, Household Durables) † | | | | | | | | | | | 453,000 | | | | 209,396 | |
The accompanying notes are an integral part of these financial statements.
| | | | |
| 112 | | Wells Fargo Target Date Funds | | Portfolio of investments—August 31, 2017 (unaudited) |
FACTOR ENHANCED EMERGING MARKETS PORTFOLIO
| | | | | | | | | | | | | | | | |
| Security name | | | | | | | | Shares | | | Value | |
| | | | |
| Taiwan (continued) | | | | | | | | | | | | | | | | |
Teco Electric & Machinery Company Limited (Industrials, Electrical Equipment) | | | | | | | | | | | 396,000 | | | $ | 370,032 | |
Tong Yang Industry Company Limited (Consumer Discretionary, Auto Components) | | | | | | | | | | | 97,000 | | | | 181,600 | |
Transcend Information Incorporated (Information Technology, Technology Hardware, Storage & Peripherals) | | | | | | | | | | | 1,000 | | | | 2,982 | |
Tripod Technology Corporation (Information Technology, Electronic Equipment, Instruments & Components) | | | | | | | | | | | 91,000 | | | | 340,734 | |
TSRC Corporation (Materials, Chemicals) | | | | | | | | | | | 97,000 | | | | 102,532 | |
Tung Ho Steel Enterprise Corporation (Materials, Metals & Mining) | | | | | | | | | | | 5,000 | | | | 3,993 | |
U-Ming Marine Transport Corporation (Industrials, Marine) | | | | | | | | | | | 78,000 | | | | 99,248 | |
Uni-President Enterprises Corporation (Consumer Staples, Food Products) | | | | | | | | | | | 919,000 | | | | 1,954,995 | |
Union Bank of Taiwan (Financials, Banks) | | | | | | | | | | | 14,000 | | | | 4,180 | |
Voltronic Power Technology Corporation (Industrials, Electrical Equipment) | | | | | | | | | | | 14,000 | | | | 252,361 | |
Walsin Lihwa Corporation (Industrials, Electrical Equipment) | | | | | | | | | | | 576,000 | | | | 277,703 | |
Waterland Financial Holdings (Financials, Capital Markets) | | | | | | | | | | | 571,383 | | | | 167,180 | |
Windbond Electronics Corporation (Information Technology, Semiconductors & Semiconductor Equipment) | | | | | | | | | | | 458,000 | | | | 351,327 | |
Wistron Corporation (Information Technology, Technology Hardware, Storage & Peripherals) | | | | | | | | | | | 398,458 | | | | 376,290 | |
Wistron Neweb Corporation (Information Technology, Communications Equipment) | | | | | | | | | | | 63,843 | | | | 192,085 | |
WPG Holdings Company Limited (Information Technology, Electronic Equipment, Instruments & Components) | | | | | | | | | | | 144,000 | | | | 187,521 | |
WT Microelectronics Company Limited (Information Technology, Electronic Equipment, Instruments & Components) | | | | | | | | | | | 2,000 | | | | 3,340 | |
YFY Incorporated (Materials, Paper & Forest Products) † | | | | | | | | | | | 427,000 | | | | 169,787 | |
Yuanta Financial Holding Company Limited (Financials, Capital Markets) | | | | | | | | | | | 1,986,000 | | | | 862,076 | |
Yulon Motor Company Limited (Consumer Discretionary, Automobiles) | | | | | | | | | | | 221,000 | | | | 190,397 | |
Yungtay Engineering Company Limited (Industrials, Machinery) | | | | | | | | | | | 85,000 | | | | 158,289 | |
| | | | |
| | | | | | | | | | | | | | | 57,739,870 | |
| | | | | | | | | | | | | | | | |
| | | | |
| Thailand: 5.04% | | | | | | | | | | | | | | | | |
Advanced Info Service PCL (Telecommunication Services, Wireless Telecommunication Services) | | | | | | | | | | | 104,900 | | | | 592,343 | |
AP Thailand PCL (Real Estate, Real Estate Management & Development) | | | | | | | | | | | 1,097,800 | | | | 259,531 | |
Asia Aviation PCL (Industrials, Airlines) | | | | | | | | | | | 706,700 | | | | 131,954 | |
Bangkok Bank PCL (Financials, Banks) | | | | | | | | | | | 89,200 | | | | 495,630 | |
Bangkok Chain Hospital PCL (Health Care, Health Care Providers & Services) | | | | | | | | | | | 487,800 | | | | 217,420 | |
Bangkok Expressway and Metro PCL (Industrials, Transportation Infrastructure) | | | | | | | | | | | 1,297,600 | | | | 304,812 | |
Bangkok Insurance PCL (Financials, Insurance) | | | | | | | | | | | 1,000 | | | | 10,631 | |
Bangkok Life Assurance PCL (Financials, Insurance) | | | | | | | | | | | 213,400 | | | | 294,023 | |
Bangkokland PCL (Real Estate, Real Estate Management & Development) | | | | | | | | | | | 8,296,800 | | | | 452,257 | |
Banpu PCL (Energy, Oil, Gas & Consumable Fuels) | | | | | | | | | | | 420,900 | | | | 223,094 | |
Beauty Community PCL (Consumer Discretionary, Specialty Retail) | | | | | | | | | | | 463,500 | | | | 192,631 | |
BEC World PCL (Consumer Discretionary, Media) | | | | | | | | | | | 300,300 | | | | 156,458 | |
Berli Jucker PCL (Industrials, Industrial Conglomerates) | | | | | | | | | | | 197,300 | | | | 292,637 | |
Bumrungrad Hospital PCL (Health Care, Health Care Providers & Services) | | | | | | | | | | | 40,900 | | | | 268,520 | |
Carabao Group PCL (Consumer Staples, Beverages) | | | | | | | | | | | 101,600 | | | | 211,890 | |
Central Plaza Hotel PCL (Consumer Discretionary, Hotels, Restaurants & Leisure) | | | | | | | | | | | 230,900 | | | | 283,366 | |
Charoen Pokphand Foods PCL (Consumer Staples, Food Products) | | | | | | | | | | | 678,600 | | | | 556,900 | |
CP All PCL (Consumer Staples, Food & Staples Retailing) | | | | | | | | | | | 864,100 | | | | 1,613,438 | |
Delta Electronics Thailand PCL (Information Technology, Electronic Equipment, Instruments & Components) | | | | | | | | | | | 152,100 | | | | 407,677 | |
Eastern Polymer Group PCL (Materials, Chemicals) | | | | | | | | | | | 371,700 | | | | 128,732 | |
Electricity Genera PCL (Utilities, Independent Power & Renewable Electricity Producers) | | | | | | | | | | | 66,700 | | | | 470,044 | |
GFPT PCL (Consumer Staples, Food Products) | | | | | | | | | | | 384,600 | | | | 222,386 | |
Global Power Synergy PCL (Utilities, Independent Power & Renewable Electricity Producers) | | | | | | | | | | | 164,400 | | | | 193,091 | |
Hana Microelectronics PCL (Information Technology, Electronic Equipment, Instruments & Components) | | | | | | | | | | | 150,000 | | | | 197,636 | |
Home Product Center PCL (Consumer Discretionary, Specialty Retail) | | | | | | | | | | | 1,133,800 | | | | 341,455 | |
Indorama Ventures PCL (Materials, Chemicals) | | | | | | | | | | | 253,300 | | | | 297,506 | |
The accompanying notes are an integral part of these financial statements.
| | | | | | |
| Portfolio of investments—August 31, 2017 (unaudited) | | Wells Fargo Target Date Funds | | | 113 | |
FACTOR ENHANCED EMERGING MARKETS PORTFOLIO
| | | | | | | | | | | | | | | | |
| Security name | | | | | | | | Shares | | | Value | |
| | | | |
| Thailand (continued) | | | | | | | | | | | | | | | | |
Jasmine International PCL (Telecommunication Services, Diversified Telecommunication Services) | | | | | | | | | | | 21,000 | | | $ | 4,933 | |
Khon Kaen Sugar Industry PCL (Consumer Staples, Food Products) | | | | | | | | | | | 877,100 | | | | 117,810 | |
Kiatnakin Bank PCL (Financials, Banks) | | | | | | | | | | | 128,300 | | | | 271,437 | |
Krung Thai Bank PCL (Financials, Banks) | | | | | | | | | | | 954,600 | | | | 537,600 | |
Krungthai Card PCL (Financials, Consumer Finance) | | | | | | | | | | | 1,300 | | | | 4,659 | |
Land & Houses PCL (Real Estate, Real Estate Management & Development) | | | | | | | | | | | 893,100 | | | | 260,897 | |
Major Cineplex Group PCL (Consumer Discretionary, Media) | | | | | | | | | | | 201,200 | | | | 181,780 | |
MBK PCL (Real Estate, Real Estate Management & Development) | | | | | | | | | | | 17,700 | | | | 8,102 | |
MK Restaurants Group PCL (Consumer Discretionary, Hotels, Restaurants & Leisure) | | | | | | | | | | | 3,500 | | | | 6,377 | |
Muangthai Leasing PCL (Financials, Consumer Finance) | | | | | | | | | | | 196,200 | | | | 200,897 | |
Pruksa Holding PCL (Real Estate, Real Estate Management & Development) | | | | | | | | | | | 480,600 | | | | 330,001 | |
PTT Global Chemical PCL (Materials, Chemicals) | | | | | | | | | | | 298,500 | | | | 687,705 | |
PTT PCL (Energy, Oil, Gas & Consumable Fuels) | | | | | | | | | | | 153,600 | | | | 1,845,698 | |
Quality Houses PCL (Real Estate, Real Estate Management & Development) | | | | | | | | | | | 3,091,600 | | | | 223,456 | |
Ratchaburi Electricity Generating Holding PLC (Utilities, Independent Power & Renewable Electricity Producers) | | | | | | | | | | | 253,100 | | | | 424,946 | |
Sansiri PCL (Real Estate, Real Estate Management & Development) | | | | | | | | | | | 4,007,400 | | | | 251,028 | |
Siam City Cement PCL (Materials, Construction Materials) | | | | | | | | | | | 39,600 | | | | 348,237 | |
Siam Global House PCL (Consumer Discretionary, Specialty Retail) | | | | | | | | | | | 568,500 | | | | 256,814 | |
Srisawad Power 1979 PCL (Financials, Diversified Financial Services) | | | | | | | | | | | 139,200 | | | | 214,847 | |
Supalai PCL (Real Estate, Real Estate Management & Development) | | | | | | | | | | | 324,200 | | | | 246,531 | |
Thai Oil PCL (Energy, Oil, Gas & Consumable Fuels) | | | | | | | | | | | 84,900 | | | | 240,983 | |
Thai Union Group PCL (Consumer Staples, Food Products) | | | | | | | | | | | 925,000 | | | | 551,574 | |
Thai Vegetable Oil PCL (Consumer Staples, Food Products) | | | | | | | | | | | 5,600 | | | | 4,807 | |
Thanachart Capital PCL (Financials, Banks) | | | | | | | | | | | 257,900 | | | | 363,103 | |
The Siam Cement PCL (Materials, Construction Materials) | | | | | | | | | | | 107,100 | | | | 1,612,709 | |
Thoresen Thai Agencies PCL (Industrials, Marine) | | | | | | | | | | | 569,400 | | | | 157,762 | |
Tipco Asphalt PCL (Materials, Construction Materials) | | | | | | | | | | | 290,500 | | | | 202,969 | |
Tisco Financial Group PCL (Financials, Banks) | | | | | | | | | | | 154,800 | | | | 348,481 | |
Total Access Communication PCL (Telecommunication Services, Wireless Telecommunication Services) | | | | | | | | | | | 121,800 | | | | 200,830 | |
TTW PCL (Utilities, Water Utilities) | | | | | | | | | | | 653,100 | | | | 214,389 | |
Vibhavadi Medical Center PCL (Health Care, Health Care Providers & Services) | | | | | | | | | | | 777,900 | | | | 65,128 | |
Wha Corp PCL (Real Estate, Real Estate Management & Development) | | | | | | | | | | | 2,068,400 | | | | 198,088 | |
| | | | |
| | | | | | | | | | | | | | | 19,400,640 | |
| | | | | | | | | | | | | | | | |
| | | | |
| Turkey: 1.70% | | | | | | | | | | | | | | | | |
Anadolu Efes Biracilik ve Malt Sanayii AS (Consumer Staples, Beverages) | | | | | | | | | | | 56,402 | | | | 346,225 | |
Arcelik AS (Consumer Discretionary, Household Durables) | | | | | | | | | | | 34,383 | | | | 238,937 | |
Aselsan Elektronik Sanayi ve Ticaret AS (Industrials, Aerospace & Defense) | | | | | | | | | | | 43,000 | | | | 336,171 | |
Bim Birlesik Magazalar AS (Consumer Staples, Food & Staples Retailing) | | | | | | | | | | | 36,802 | | | | 815,194 | |
Coca-Cola Icecek Uretim AS (Consumer Staples, Beverages) | | | | | | | | | | | 22,231 | | | | 258,383 | |
Emlak Konut Gayrimenkul Yati AS (Real Estate, Equity REITs) † | | | | | | | | | | | 393,494 | | | | 334,976 | |
Enka Insaat ve Sanayi AS (Industrials, Industrial Conglomerates) | | | | | | | | | | | 281,120 | | | | 435,485 | |
Eregli Demir ve Celik Fabrikalari T AS (Materials, Metals & Mining) | | | | | | | | | | | 236,625 | | | | 563,197 | |
Ford Otomotiv Sanayi AS (Consumer Discretionary, Automobiles) | | | | | | | | | | | 26,663 | | | | 367,025 | |
Koc Holding AS (Industrials, Industrial Conglomerates) | | | | | | | | | | | 162,926 | | | | 851,050 | |
Petkim Petrokimya Holding SA (Materials, Chemicals) | | | | | | | | | | | 163,149 | | | | 294,779 | |
Soda Sanayii AS (Materials, Chemicals) | | | | | | | | | | | 116,692 | | | | 176,038 | |
TAV Havalimanlari Holding AS (Industrials, Transportation Infrastructure) | | | | | | | | | | | 2,308 | | | | 14,181 | |
Tofas Turk Otomobil Fabrikasi AS (Consumer Discretionary, Automobiles) | | | | | | | | | | | 40,771 | | | | 373,049 | |
Tupras Turkiye Petrol Rafinerileri AS (Energy, Oil, Gas & Consumable Fuels) | | | | | | | | | | | 7,583 | | | | 257,553 | |
The accompanying notes are an integral part of these financial statements.
| | | | |
| 114 | | Wells Fargo Target Date Funds | | Portfolio of investments—August 31, 2017 (unaudited) |
FACTOR ENHANCED EMERGING MARKETS PORTFOLIO
| | | | | | | | | | | | | | | | |
| Security name | | | | | | | | Shares | | | Value | |
| | | | |
| Turkey (continued) | | | | | | | | | | | | | | | | |
Turk Sise ve Cam Fabrikalari AS (Industrials, Industrial Conglomerates) | | | | | | | | | | | 265,055 | | | $ | 340,759 | |
Turkcell Iletisim Hizmetleri AS (Telecommunication Services, Wireless Telecommunication Services) | | | | | | | | | | | 63,937 | | | | 244,559 | |
Ulker Biskuvi Sanayi AS (Consumer Staples, Food Products) | | | | | | | | | | | 42,468 | | | | 253,805 | |
Yazicilar Holding AS Class A (Industrials, Industrial Conglomerates) | | | | | | | | | | | 8,652 | | | | 56,518 | |
| | | | |
| | | | | | | | | | | | | | | 6,557,884 | |
| | | | | | | | | | | | | | | | |
| | | | |
Total Common Stocks (Cost $311,950,786) | | | | | | | | | | | | | | | 317,778,685 | |
| | | | | | | | | | | | | | | | |
| | | | |
Exchange-Traded Funds: 8.98% | | | | | | | | | | | | | | | | |
| | | | |
| United States: 8.98% | | | | | | | | | | | | | | | | |
iShares India 50 ETF | | | | | | | | | | | 107,237 | | | | 3,785,466 | |
iShares MSCI India ETF | | | | | | | | | | | 412,007 | | | | 14,053,559 | |
iShares MSCI India Small-Cap ETF | | | | | | | | | | | 40,370 | | | | 1,869,535 | |
Powershares India Portfolio | | | | | | | | | | | 68,037 | | | | 1,677,112 | |
WisdomTree India Earnings Fund | | | | | | | | | | | 500,210 | | | | 13,145,519 | |
| | | | |
Total Exchange-Traded Funds (Cost $34,007,319) | | | | | | | | | | | | | | | 34,531,191 | |
| | | | | | | | | | | | | | | | |
| | | | |
| | | Dividend yield | | | | | | | | | | |
| Preferred Stocks: 4.18% | | | | | | | | | | | | | | | | |
| | | | |
| Brazil: 3.63% | | | | | | | | | | | | | | | | |
Alpargatas SA (Consumer Discretionary, Personal Products) | | | 1.86 | % | | | | | | | 21,972 | | | | 96,324 | |
Banco Bradesco SA (Financials, Banks) | | | 0.87 | | | | | | | | 346,153 | | | | 3,692,621 | |
Bradespar SA (Materials, Metals & Mining) | | | 1.74 | | | | | | | | 24,800 | | | | 211,771 | |
Braskem SA Class A (Materials, Chemicals) | | | 3.20 | | | | | | | | 16,310 | | | | 197,460 | |
Companhia Brasileira de Distribuicao (Consumer Staples, Food & Staples Retailing) †† | | | 0.02 | | | | | | | | 23,073 | | | | 527,670 | |
Companhia de Saneamento do Parana (Utilities, Water Utilities) | | | 3.07 | | | | | | | | 63,140 | | | | 209,407 | |
Companhia de Transmissao de Energia Electrica Paulista (Utilities, Electric Utilities) | | | 1.13 | | | | | | | | 10,680 | | | | 240,040 | |
Companhia Energetica de Minas Gerais SA (Utilities, Electric Utilities) | | | 2.95 | | | | | | | | 95,069 | | | | 253,086 | |
Companhia Energetica de Sao Paulo Preference B (Utilities, Independent Power & Renewable Electricity Producers) | | | 3.28 | | | | | | | | 40,987 | | | | 191,794 | |
Companhia Paranaense de Energia-Copel Preference B (Utilities, Electric Utilities) | | | 6.72 | | | | | | | | 600 | | | | 5,478 | |
Gerdau SA (Materials, Metals & Mining) | | | 0.17 | | | | | | | | 96,900 | | | | 364,778 | |
Itau Unibanco Holding SA (Financials, Banks) | | | 1.20 | | | | | | | | 379,580 | | | | 4,865,560 | |
Itausa Investimentos Itau SA (Financials, Banks) | | | 0.91 | | | | | | | | 466,829 | | | | 1,512,669 | |
Klabin SA (Materials, Containers & Packaging) | | | 1.61 | | | | | | | | 7,600 | | | | 7,436 | |
Lojas Americanas SA (Consumer Discretionary, Multiline Retail) | | | 0.14 | | | | | | | | 54,835 | | | | 309,550 | |
Metalurgica Gerdau SA (Materials, Metals & Mining) † | | | 0.00 | | | | | | | | 71,500 | | | | 128,561 | |
Suzano Papel e Celulose SA Preference A (Materials, Paper & Forest Products) | | | 1.99 | | | | | | | | 58,429 | | | | 324,827 | |
Telefonica Brasil SA (Telecommunication Services, Diversified Telecommunication Services) | | | 3.16 | | | | | | | | 52,709 | | | | 817,799 | |
| | | | |
| | | | | | | | | | | | | | | 13,956,831 | |
| | | | | | | | | | | | | | | | |
| | | | |
| Chile: 0.13% | | | | | | | | | | | | | | | | |
Embotelladora Andina SA Preference B (Consumer Discretionary, Food & Staples Retailing) | | | 1.34 | | | | | | | | 65,206 | | | | 314,962 | |
Sociedad Quimica y Minera de Chile SA Class B (Materials, Chemicals) | | | 2.10 | | | | | | | | 4,332 | | | | 203,441 | |
| | | | |
| | | | | | | | | | | | | | | 518,403 | |
| | | | | | | | | | | | | | | | |
The accompanying notes are an integral part of these financial statements.
| | | | | | |
| Portfolio of investments—August 31, 2017 (unaudited) | | Wells Fargo Target Date Funds | | | 115 | |
FACTOR ENHANCED EMERGING MARKETS PORTFOLIO
| | | | | | | | | | | | | | | | |
| Security name | | Dividend yield | | | | | | Shares | | | Value | |
| | | | |
| Colombia: 0.28% | | | | | | | | | | | | | | | | |
Banco Davivienda SA (Financials, Banks) | | | 1.47 | % | | | | | | | 13,288 | | | $ | 148,681 | |
Bancolombia SA (Financials, Banks) | | | 1.41 | | | | | | | | 81,728 | | | | 931,089 | |
| | | | |
| | | | | | | | | | | | | | | 1,079,770 | |
| | | | | | | | | | | | | | | | |
| | | | |
| Russia: 0.14% | | | | | | | | | | | | | | | | |
Transneft PJSC (Energy, Oil, Gas & Consumable Fuels) | | | 2.38 | | | | | | | | 172 | | | | 527,668 | |
| | | | | | | | | | | | | | | | |
| | | | |
Total Preferred Stocks (Cost $14,702,602) | | | | | | | | | | | | | | | 16,082,672 | |
| | | | | | | | | | | | | | | | |
| | | | |
| | | Yield | | | | | | | | | | |
| Short-Term Investments: 3.44% | | | | | | | | | | | | | | | | |
| | | | |
| Investment Companies: 3.44% | | | | | | | | | | | | | | | | |
Wells Fargo Government Money Market Fund Select Class (l)(u) | | | 0.92 | | | | | | | | 13,203,143 | | | | 13,203,143 | |
| | | | | | | | | | | | | | | | |
| | | | |
Total Short-Term Investments (Cost $13,203,143) | | | | | | | | | | | | | | | 13,203,143 | |
| | | | | | | | | | | | | | | | |
| | | | | | | | |
| Total investments in securities (Cost $373,863,850) | | | 99.24 | % | | | 381,595,691 | |
Other assets and liabilities, net | | | 0.76 | | | | 2,927,335 | |
| | | | | | | | |
| Total net assets | | | 100.00 | % | | $ | 384,523,026 | |
| | | | | | | | |
| † | Non-income-earning security |
| 144A | The security may be resold in transactions exempt from registration, normally to qualified institutional buyers, pursuant to Rule 144A under the Securities Act of 1933. |
| †† | On the last dividend date, partial dividends were declared. |
| (a) | The security is fair valued in accordance with procedures approved by the Board of Trustees. |
| (l) | The issuer of the security is an affiliated person of the Portfolio as defined in the Investment Company Act of 1940. |
| (u) | The rate represents the 7-day annualized yield at period end. |
Futures Contracts
| | | | | | | | | | | | | | | | | | | | | | | | |
| Description | | Number of contracts | | | Expiration date | | | Notional cost | | | Notional value | | | Unrealized gains | | | Unrealized losses | |
Long | | | | | | | | | | | | | | | | | | | | | | | | |
MSCI Emerging Markets Index | | | 85 | | | | 9-15-2017 | | | $ | 4,618,783 | | | $ | 4,616,350 | | | $ | 0 | | | $ | (2,433 | ) |
Forward Foreign Currency Contracts
| | | | | | | | | | | | | | |
Currency to be received | | Currency to be
delivered | | Counterparty | | Settlement date | | Unrealized gains | | | Unrealized losses | |
| 319,276 USD | | 1,101,692 TRY | | State Street Bank | | 9-6-2017 | | $ | 733 | | | $ | 0 | |
Investments In Affiliates
An affiliated investment is an investment in which the Portfolio owns at least 5% of the outstanding voting shares of the issuer or as a result of other relationships, such as the Portfolio and the issuer having the same investment manager. Transactions with issuers that were either affiliated persons of the Portfolio at the beginning of the period or the end of the period were as follows:
| | | | | | | | | | | | | | | | | | | | | | | | | | | | | | | | |
| | | Shares, beginning of period | | | Shares purchased | | | Shares sold | | | Shares, end of period | | | Net realized gains (losses) | | | Net change in unrealized gains (losses) | | | Income from affiliated securities | | | Value, end of period | |
Investment companies - 3.44% | | | | | | | | | | | | | | | | | | | | | | | | | | | | | | | | |
Wells Fargo Government Money Market Fund Select Class | | | 0 | | | | 250,089,338 | | | | 236,886,195 | | | | 13,203,143 | | | $ | 0 | | | $ | 0 | | | $ | 10,982 | | | $ | 13,203,143 | |
The accompanying notes are an integral part of these financial statements.
| | | | |
| 116 | | Wells Fargo Target Date Funds | | Portfolio of investments—August 31, 2017 (unaudited) |
FACTOR ENHANCED INTERNATIONAL PORTFOLIO
| | | | | | | | | | | | | | | | |
| Security name | | | | | | | | Shares | | | Value | |
|
Common Stocks: 94.35% | |
|
| Australia: 8.70% | |
Abacus Property Group (Real Estate, Equity REITs) | | | | | | | | | | | 851 | | | $ | 1,056 | |
AGL Energy Limited (Utilities, Multi-Utilities) | | | | | | | | | | | 71,722 | | | | 1,367,799 | |
Alumina Limited (Materials, Metals & Mining) | | | | | | | | | | | 431,688 | | | | 727,521 | |
Amcor Limited (Materials, Containers & Packaging) | | | | | | | | | | | 122,921 | | | | 1,574,205 | |
APA Group (Utilities, Gas Utilities) | | | | | | | | | | | 109,681 | | | | 772,511 | |
Aristocrat Leisure Limited (Consumer Discretionary, Hotels, Restaurants & Leisure) | | | | | | | | | | | 71,585 | | | | 1,204,710 | |
ASX Limited (Financials, Capital Markets) | | | | | | | | | | | 20,543 | | | | 892,960 | |
Aurizon Holdings Limited (Industrials, Road & Rail) | | | | | | | | | | | 214,728 | | | | 846,662 | |
Australia & New Zealand Banking Group Limited (Financials, Banks) | | | | | | | | | | | 313,367 | | | | 7,323,865 | |
Bank of Queensland Limited (Financials, Banks) | | | | | | | | | | | 72,565 | | | | 726,261 | |
Bendigo Bank Limited (Financials, Banks) | | | | | | | | | | | 75,558 | | | | 717,775 | |
BHP Billiton Limited (Materials, Metals & Mining) | | | | | | | | | | | 315,627 | | | | 6,869,851 | |
BlueScope Steel Limited (Materials, Metals & Mining) | | | | | | | | | | | 68,021 | | | | 587,777 | |
Boral Limited (Materials, Construction Materials) | | | | | | | | | | | 139,122 | | | | 737,669 | |
Brambles Limited (Industrials, Commercial Services & Supplies) | | | | | | | | | | | 174,511 | | | | 1,291,553 | |
Caltex Australia Limited (Energy, Oil, Gas & Consumable Fuels) | | | | | | | | | | | 30,041 | | | | 797,389 | |
Challenger Financial Services Group Limited (Financials, Diversified Financial Services) | | | | | | | | | | | 65,613 | | | | 654,074 | |
Coca-Cola Amatil Limited (Consumer Staples, Beverages) | | | | | | | | | | | 96,122 | | | | 615,118 | |
Cochlear Limited (Health Care, Health Care Equipment & Supplies) | | | | | | | | | | | 6,047 | | | | 750,911 | |
Commonwealth Bank of Australia (Financials, Banks) | | | | | | | | | | | 183,132 | | | | 11,035,021 | |
Computershare Limited (Information Technology, IT Services) | | | | | | | | | | | 57,614 | | | | 643,493 | |
Crown Limited (Consumer Discretionary, Hotels, Restaurants & Leisure) | | | | | | | | | | | 70,262 | | | | 647,915 | |
CSL Limited (Health Care, Biotechnology) | | | | | | | | | | | 50,632 | | | | 5,172,917 | |
Dexus Property Group (Real Estate, Equity REITs) | | | | | | | | | | | 118,602 | | | | 904,171 | |
Domino’s Pizza Enterprises Limited (Consumer Discretionary, Hotels, Restaurants & Leisure) | | | | | | | | | | | 7,600 | | | | 260,696 | |
Fortescue Metals Group Limited (Materials, Metals & Mining) | | | | | | | | | | | 195,508 | | | | 934,069 | |
Goodman Group (Real Estate, Equity REITs) | | | | | | | | | | | 171,892 | | | | 1,132,791 | |
Healthscope Limited (Health Care, Health Care Providers & Services) | | | | | | | | | | | 209,577 | | | | 289,890 | |
Iluka Resources Limited (Materials, Metals & Mining) | | | | | | | | | | | 45,635 | | | | 343,548 | |
Incitec Pivot Limited (Materials, Chemicals) | | | | | | | | | | | 253,371 | | | | 670,719 | |
Insurance Australia Group Limited (Financials, Insurance) | | | | | | | | | | | 245,478 | | | | 1,250,865 | |
Lendlease Corporation Limited (Real Estate, Real Estate Management & Development) | | | | | | | | | | | 57,471 | | | | 757,483 | |
Link Administration Holdings Limited (Financials, Capital Markets) | | | | | | | | | | | 106,382 | | | | 639,337 | |
Macquarie Group Limited (Financials, Capital Markets) | | | | | | | | | | | 35,159 | | | | 2,426,029 | |
Medibank Private Limited (Financials, Insurance) | | | | | | | | | | | 314,271 | | | | 759,482 | |
Mirvac Group (Real Estate, Equity REITs) | | | | | | | | | | | 462,850 | | | | 853,627 | |
National Australia Bank Limited (Financials, Banks) | | | | | | | | | | | 282,850 | | | | 6,790,517 | |
Newcrest Mining Limited (Materials, Metals & Mining) | | | | | | | | | | | 87,494 | | | | 1,589,294 | |
Oil Search Limited (Energy, Oil, Gas & Consumable Fuels) | | | | | | | | | | | 129,744 | | | | 692,069 | |
Orica Limited (Materials, Chemicals) | | | | | | | | | | | 45,545 | | | | 736,068 | |
Origin Energy Limited (Energy, Oil, Gas & Consumable Fuels) † | | | | | | | | | | | 181,258 | | | | 1,102,296 | |
Qantas Airways Limited (Industrials, Airlines) | | | | | | | | | | | 197,578 | | | | 898,410 | |
QBE Insurance Group Limited (Financials, Insurance) | | | | | | | | | | | 142,640 | | | | 1,183,809 | |
Qube Holdings Limited (Industrials, Transportation Infrastructure) | | | | | | | | | | | 314,708 | | | | 630,446 | |
Ramsay Health Care Limited (Health Care, Health Care Providers & Services) | | | | | | | | | | | 15,411 | | | | 836,864 | |
Rio Tinto Limited (Materials, Metals & Mining) | | | | | | | | | | | 43,961 | | | | 2,370,790 | |
Scentre Group (Real Estate, Equity REITs) | | | | | | | | | | | 577,373 | | | | 1,771,673 | |
SEEK Limited (Industrials, Commercial Services & Supplies) | | | | | | | | | | | 50,755 | | | | 675,824 | |
The accompanying notes are an integral part of these financial statements.
| | | | | | |
| Portfolio of investments—August 31, 2017 (unaudited) | | Wells Fargo Target Date Funds | | | 117 | |
FACTOR ENHANCED INTERNATIONAL PORTFOLIO
| | | | | | | | | | | | | | | | |
| Security name | | | | | | | | Shares | | | Value | |
|
| Australia (continued) | |
Sonic Healthcare Limited (Health Care, Health Care Providers & Services) | | | | | | | | | | | 45,320 | | | $ | 788,994 | |
South32 Limited – Athens Exchange (Materials, Metals & Mining) | | | | | | | | | | | 567,682 | | | | 1,317,734 | |
Spark Infrastructure Group (Utilities, Electric Utilities) | | | | | | | | | | | 332,035 | | | | 712,668 | |
Stockland Australia (Real Estate, Equity REITs) | | | | | | | | | | | 293,690 | | | | 1,034,269 | |
Suncorp Group Limited (Financials, Insurance) | | | | | | | | | | | 134,782 | | | | 1,396,098 | |
Sydney Airport Holdings Limited (Industrials, Transportation Infrastructure) | | | | | | | | | | | 238,843 | | | | 1,405,025 | |
Tabcorp Holdings Limited (Consumer Discretionary, Hotels, Restaurants & Leisure) | | | | | | | | | | | 196,222 | | | | 641,105 | |
Tatts Group Limited (Consumer Discretionary, Hotels, Restaurants & Leisure) | | | | | | | | | | | 209,889 | | | | 685,759 | |
Telstra Corporation Limited (Telecommunication Services, Diversified Telecommunication Services) | | | | | | | | | | | 1,301,905 | | | | 3,798,263 | |
The GPT Group (Real Estate, Equity REITs) | | | | | | | | | | | 195,301 | | | | 776,273 | |
The Star Entertainment Group Limited (Consumer Discretionary, Hotels, Restaurants & Leisure) | | | | | | | | | | | 168,626 | | | | 697,056 | |
Transurban Group (Industrials, Transportation Infrastructure) | | | | | | | | | | | 237,665 | | | | 2,297,410 | |
Treasury Wine Estates Limited (Consumer Staples, Beverages) | | | | | | | | | | | 74,081 | | | | 852,737 | |
Vicinity Centres (Real Estate, Equity REITs) | | | | | | | | | | | 416,016 | | | | 866,465 | |
Wesfarmers Limited (Consumer Staples, Food & Staples Retailing) | | | | | | | | | | | 117,339 | | | | 3,975,535 | |
Westfield Corporation (Real Estate, Equity REITs) | | | | | | | | | | | 246,138 | | | | 1,453,809 | |
Westpac Banking Corporation (Financials, Banks) | | | | | | | | | | | 351,777 | | | | 8,744,501 | |
Woodside Petroleum Limited (Energy, Oil, Gas & Consumable Fuels) | | | | | | | | | | | 71,959 | | | | 1,649,185 | |
Woolworths Limited (Consumer Staples, Food & Staples Retailing) | | | | | | | | | | | 134,523 | | | | 2,780,415 | |
| |
| | | | 112,333,081 | |
| | | | | | | | | | | | | | | | |
| | | | |
| Austria: 0.41% | | | | | | | | | | | | | | | | |
ams AG (Information Technology, Semiconductors & Semiconductor Equipment) | | | | | | | | | | | 9,993 | | | | 719,554 | |
Andritz AG (Industrials, Machinery) | | | | | | | | | | | 10,814 | | | | 588,449 | |
Buwog AG (Real Estate, Real Estate Management & Development) | | | | | | | | | | | 13,868 | | | | 426,762 | |
Erste Bank Der Oesterreichischen Sparkassen AG (Financials, Banks) | | | | | | | | | | | 29,809 | | | | 1,259,581 | |
OMV AG (Energy, Oil, Gas & Consumable Fuels) | | | | | | | | | | | 14,981 | | | | 861,211 | |
Raiffeisen Bank International AG (Financials, Banks) † | | | | | | | | | | | 22,302 | | | | 731,702 | |
Voestalpine AG (Materials, Metals & Mining) | | | | | | | | | | | 13,736 | | | | 712,785 | |
| |
| | | | 5,300,044 | |
| | | | | | | | | | | | | | | | |
| | | | |
| Belgium: 0.61% | | | | | | | | | | | | | | | | |
Ackermans & Van Haaren NV (Financials, Diversified Financial Services) | | | | | | | | | | | 3,843 | | | | 645,976 | |
Colruyt SA (Consumer Staples, Food & Staples Retailing) | | | | | | | | | | | 4,879 | | | | 271,098 | |
Galapagos NV (Health Care, Biotechnology) † | | | | | | | | | | | 116 | | | | 10,670 | |
Galapagos NV (Health Care, Biotechnology) † | | | | | | | | | | | 8,344 | | | | 767,532 | |
KBC Groep NV (Financials, Banks) | | | | | | | | | | | 26,934 | | | | 2,213,350 | |
Proximus SA (Telecommunication Services, Diversified Telecommunication Services) | | | | | | | | | | | 18,440 | | | | 650,106 | |
Solvay SA (Materials, Chemicals) | | | | | | | | | | | 7,727 | | | | 1,120,851 | |
Telenet Group Holding NV (Consumer Discretionary, Media) † | | | | | | | | | | | 10,455 | | | | 707,813 | |
UCB SA (Health Care, Pharmaceuticals) | | | | | | | | | | | 11,986 | | | | 826,017 | |
Umicore (Materials, Metals & Mining) | | | | | | | | | | | 8,955 | | | | 668,945 | |
| |
| | | | 7,882,358 | |
| | | | | | | | | | | | | | | | |
| | | | |
| Canada: 9.63% | | | | | | | | | | | | | | | | |
Agnico-Eagle Mines Limited (Materials, Metals & Mining) | | | | | | | | | | | 26,695 | | | | 1,368,366 | |
Agrium Incorporated (Materials, Chemicals) | | | | | | | | | | | 14,515 | | | | 1,423,661 | |
Alimentation Couche-Tard Incorporated Class B (Consumer Staples, Food & Staples Retailing) | | | | | | | | | | | 45,235 | | | | 2,160,050 | |
The accompanying notes are an integral part of these financial statements.
| | | | |
| 118 | | Wells Fargo Target Date Funds | | Portfolio of investments—August 31, 2017 (unaudited) |
FACTOR ENHANCED INTERNATIONAL PORTFOLIO
| | | | | | | | | | | | | | | | |
| Security name | | | | | | | | Shares | | | Value | |
| | | | |
| Canada (continued) | | | | | | | | | | | | | | | | |
Bank of Montreal (Financials, Banks) | | | | | | | | | | | 67,891 | | | $ | 4,871,842 | |
Barrick Gold Corporation (Materials, Metals & Mining) | | | | | | | | | | | 128,771 | | | | 2,319,167 | |
BCE Incorporated (Telecommunication Services, Diversified Telecommunication Services) | | | | | | | | | | | 97,315 | | | | 4,632,155 | |
Brookfield Asset Management Incorporated Class A (Financials, Capital Markets) | | | | | | | | | | | 97,519 | | | | 3,857,028 | |
Canadian Imperial Bank of Commerce (Financials, Banks) | | | | | | | | | | | 41,674 | | | | 3,501,117 | |
Canadian National Railway Company (Industrials, Road & Rail) | | | | | | | | | | | 69,637 | | | | 5,644,570 | |
Canadian Pacific Railway Limited (Industrials, Road & Rail) | | | | | | | | | | | 15,282 | | | | 2,377,934 | |
Canadian Tire Corporation Limited Class A (Consumer Discretionary, Multiline Retail) | | | | | | | | | | | 7,375 | | | | 872,893 | |
CGI Group Incorporated Class A (Information Technology, IT Services) † | | | | | | | | | | | 28,065 | | | | 1,427,803 | |
Constellation Software Incorporated (Information Technology, Software) | | | | | | | | | | | 2,328 | | | | 1,294,471 | |
Dollarama Incorporated (Consumer Discretionary, Multiline Retail) | | | | | | | | | | | 11,744 | | | | 1,157,424 | |
Enbridge Incorporated – Toronto Exchange (Energy, Oil, Gas & Consumable Fuels) | | | | | | | | | | | 174,564 | | | | 6,978,366 | |
EnCana Corporation (Energy, Oil, Gas & Consumable Fuels) | | | | | | | | | | | 89,590 | | | | 835,815 | |
Fortis Incorporated (Utilities, Electric Utilities) | | | | | | | | | | | 44,044 | | | | 1,611,508 | |
Franco-Nevada Corporation (Materials, Metals & Mining) | | | | | | | | | | | 20,608 | | | | 1,685,936 | |
Gildan Activewear Incorporated (Consumer Discretionary, Textiles, Apparel & Luxury Goods) | | | | | | | | | | | 25,233 | | | | 790,280 | |
Goldcorp Incorporated (Materials, Metals & Mining) | | | | | | | | | | | 92,700 | | | | 1,273,859 | |
Great-West Lifeco Incorporated (Financials, Insurance) | | | | | | | | | | | 30,668 | | | | 849,494 | |
Imperial Oil Limited (Energy, Oil, Gas & Consumable Fuels) | | | | | | | | | | | 26,162 | | | | 772,237 | |
Intact Financial Corporation (Financials, Insurance) | | | | | | | | | | | 13,975 | | | | 1,152,021 | |
Inter Pipeline Limited (Energy, Oil, Gas & Consumable Fuels) | | | | | | | | | | | 36,689 | | | | 671,934 | |
Loblaw Companies Limited (Consumer Staples, Food & Staples Retailing) | | | | | | | | | | | 21,954 | | | | 1,190,746 | |
Magna International Incorporated (Consumer Discretionary, Auto Components) | | | | | | | | | | | 38,927 | | | | 1,873,172 | |
Manulife Financial Corporation (Financials, Insurance) | | | | | | | | | | | 200,393 | | | | 3,936,449 | |
Metro Incorporated (Consumer Staples, Food & Staples Retailing) | | | | | | | | | | | 25,330 | | | | 836,118 | |
National Bank of Canada (Financials, Banks) | | | | | | | | | | | 36,008 | | | | 1,657,449 | |
Pembina Pipeline Corporation (Energy, Oil, Gas & Consumable Fuels) | | | | | | | | | | | 40,052 | | | | 1,290,965 | |
Potash Corporation of Saskatchewan (Materials, Chemicals) | | | | | | | | | | | 81,993 | | | | 1,426,793 | |
Power Corporation of Canada (Financials, Insurance) | | | | | | | | | | | 39,696 | | | | 970,188 | |
Power Financial Corporation (Financials, Insurance) | | | | | | | | | | | 25,912 | | | | 699,494 | |
Restaurant Brands International Incorporated (Consumer Discretionary, Hotels, Restaurants & Leisure) | | | | | | | | | | | 26,203 | | | | 1,599,563 | |
RioCan REIT (Real Estate, Equity REITs) | | | | | | | | | | | 34,843 | | | | 664,075 | |
Rogers Communications Incorporated Class B (Telecommunication Services, Wireless Telecommunication Services) | | | | | | | | | | | 39,122 | | | | 2,042,333 | |
Royal Bank of Canada (Financials, Banks) | | | | | | | | | | | 154,831 | | | | 11,491,281 | |
Saputo Incorporated (Consumer Staples, Food Products) | | | | | | | | | | | 25,233 | | | | 851,910 | |
Shaw Communications Incorporated Class B (Consumer Discretionary, Media) | | | | | | | | | | | 48,826 | | | | 1,089,323 | |
Sun Life Financial Incorporated (Financials, Insurance) | | | | | | | | | | | 62,758 | | | | 2,409,807 | |
Suncor Energy Incorporated (Energy, Oil, Gas & Consumable Fuels) | | | | | | | | | | | 176,662 | | | | 5,535,763 | |
Teck Resources Limited Class B (Materials, Metals & Mining) | | | | | | | | | | | 43,805 | | | | 1,090,258 | |
TELUS Corporation (Telecommunication Services, Diversified Telecommunication Services) | | | | | | | | | | | 75,694 | | | | 2,740,441 | |
The Bank of Nova Scotia (Financials, Banks) | | | | | | | | | | | 127,708 | | | | 7,945,253 | |
The Toronto-Dominion Bank (Financials, Banks) | | | | | | | | | | | 198,128 | | | | 10,639,811 | |
Thomson Corporation (Financials, Capital Markets) | | | | | | | | | | | 30,767 | | | | 1,406,843 | |
TransCanada Corporation (Energy, Oil, Gas & Consumable Fuels) | | | | | | | | | | | 90,111 | | | | 4,575,727 | |
Waste Connections Incorporated – Toronto Exchange (Industrials, Commercial Services & Supplies) | | | | | | | | | | | 26,700 | | | | 1,781,283 | |
Wheaton Precious Metals Corporation (Materials, Metals & Mining) | | | | | | | | | | | 52,076 | | | | 1,081,763 | |
| |
| | | | 124,356,739 | |
| | | | | | | | | | | | | | | | |
The accompanying notes are an integral part of these financial statements.
| | | | | | |
| Portfolio of investments—August 31, 2017 (unaudited) | | Wells Fargo Target Date Funds | | | 119 | |
FACTOR ENHANCED INTERNATIONAL PORTFOLIO
| | | | | | | | | | | | | | | | |
| Security name | | | | | | | | Shares | | | Value | |
| | | | |
| China: 0.20% | | | | | | | | | | | | | | | | |
AAC Technologies Holdings Incorporated (Information Technology, Electronic Equipment, Instruments & Components) | | | | 74,500 | | | $ | 1,358,483 | |
COSCO Shipping Ports Limited (Industrials, Transportation Infrastructure) | | | | | | | | | | | 2,473 | | | | 2,923 | |
Shenzhou International Group Holdings Limited (Consumer Discretionary, Textiles, Apparel & Luxury Goods) | | | | | | | | | | | 79,000 | | | | 632,949 | |
Towngas China Company Limited (Utilities, Gas Utilities) | | | | | | | | | | | 2,084 | | | | 1,411 | |
Wynn Macau Limited (Consumer Discretionary, Hotels, Restaurants & Leisure) | | | | | | | | | | | 291,934 | | | | 640,888 | |
| |
| | | | 2,636,654 | |
| | | | | | | | | | | | | | | | |
| | | | |
| Czech Republic: 0.06% | | | | | | | | | | | | | | | | |
CEZ AS (Utilities, Electric Utilities) | | | | | | | | | | | 37,971 | | | | 720,277 | |
| | | | | | | | | | | | | | | | |
| | | | |
| Denmark: 1.88% | | | | | | | | | | | | | | | | |
A.P. Moller Maersk AS Class B (Industrials, Marine) | | | | | | | | | | | 688 | | | | 1,418,446 | |
Carlsberg AS Class B (Consumer Staples, Beverages) | | | | | | | | | | | 10,787 | | | | 1,238,010 | |
Christian Hansen Holding AS (Materials, Chemicals) | | | | | | | | | | | 9,371 | | | | 806,248 | |
Coloplast AS Class B (Health Care, Health Care Equipment & Supplies) | | | | | | | | | | | 11,082 | | | | 907,336 | |
Danske Bank AS (Financials, Banks) | | | | | | | | | | | 79,514 | | | | 3,090,270 | |
DONG Energy AS (Utilities, Electric Utilities) 144A | | | | | | | | | | | 17,306 | | | | 900,848 | |
DSV AS (Industrials, Road & Rail) | | | | | | | | | | | 18,776 | | | | 1,331,407 | |
Genmab AS (Health Care, Biotechnology) † | | | | | | | | | | | 6,047 | | | | 1,411,243 | |
GN Store Nord AS (Health Care, Health Care Equipment & Supplies) | | | | | | | | | | | 22,359 | | | | 741,560 | |
H. Lundbeck AS (Health Care, Pharmaceuticals) | | | | | | | | | | | 11,370 | | | | 724,167 | |
ISS AS (Industrials, Commercial Services & Supplies) | | | | | | | | | | | 17,386 | | | | 676,533 | |
Jyske Bank AS (Financials, Banks) | | | | | | | | | | | 11,152 | | | | 671,010 | |
Novo Nordisk AS Class B (Health Care, Pharmaceuticals) | | | | | | | | | | | 190,255 | | | | 9,075,207 | |
Sydbank AS (Financials, Banks) | | | | | | | | | | | 15,769 | | | | 615,126 | |
TDC AS (Telecommunication Services, Diversified Telecommunication Services) | | | | | | | | | | | 114,386 | | | | 681,480 | |
| |
| | | | 24,288,891 | |
| | | | | | | | | | | | | | | | |
| | | | |
| Finland: 0.98% | | | | | | | | | | | | | | | | |
Amer Sports Oyj (Consumer Discretionary, Leisure Products) | | | | | | | | | | | 14,274 | | | | 377,403 | |
Elisa Oyj (Telecommunication Services, Diversified Telecommunication Services) | | | | | | | | | | | 15,998 | | | | 698,945 | |
Fortum Oyj (Utilities, Electric Utilities) | | | | | | | | | | | 43,277 | | | | 776,909 | |
Huhtamaki Oyj (Materials, Containers & Packaging) | | | | | | | | | | | 16,588 | | | | 645,338 | |
Kesko Oyj Class B (Consumer Staples, Food & Staples Retailing) | | | | | | | | | | | 6,846 | | | | 368,943 | |
Kone Oyj Class B (Industrials, Machinery) | | | | | | | | | | | 41,004 | | | | 2,224,908 | |
Metso Oyj (Industrials, Machinery) | | | | | | | | | | | 18,615 | | | | 616,941 | |
Neste Oil Oyj (Energy, Oil, Gas & Consumable Fuels) | | | | | | | | | | | 16,614 | | | | 732,583 | |
Orion Oyj Class B (Health Care, Pharmaceuticals) | | | | | | | | | | | 10,776 | | | | 510,310 | |
Sampo Oyj Class A (Financials, Insurance) | | | | | | | | | | | 48,888 | | | | 2,580,533 | |
Stora Enso Oyj (Materials, Paper & Forest Products) | | | | | | | | | | | 56,251 | | | | 739,283 | |
UPM-Kymmene Oyj (Materials, Paper & Forest Products) | | | | | | | | | | | 53,758 | | | | 1,398,958 | |
Wartsila Oyj (Industrials, Machinery) | | | | | | | | | | | 14,870 | | | | 1,025,831 | |
| |
| | | | 12,696,885 | |
| | | | | | | | | | | | | | | | |
| | | | |
| France: 8.51% | | | | | | | | | | | | | | | | |
Aeroports de Paris SA (Industrials, Transportation Infrastructure) | | | | | | | | | | | 4,173 | | | | 744,418 | |
Air Liquide SA (Materials, Chemicals) | | | | | | | | | | | 40,997 | | | | 5,004,943 | |
Alstom SA (Industrials, Machinery) | | | | | | | | | | | 18,244 | | | | 648,843 | |
The accompanying notes are an integral part of these financial statements.
| | | | |
| 120 | | Wells Fargo Target Date Funds | | Portfolio of investments—August 31, 2017 (unaudited) |
FACTOR ENHANCED INTERNATIONAL PORTFOLIO
| | | | | | | | | | | | | | | | |
| Security name | | | | | | | | Shares | | | Value | |
| | | | |
| France (continued) | | | | | | | | | | | | | | | | |
Amundi SA (Financials, Diversified Financial Services) | | | | | | | | | | | 9,002 | | | $ | 693,032 | |
Arkema SA (Materials, Chemicals) | | | | | | | | | | | 6,812 | | | | 740,221 | |
Atos Origin SA (Information Technology, IT Services) | | | | | | | | | | | 9,763 | | | | 1,506,259 | |
Bouygues SA (Industrials, Construction & Engineering) | | | | | | | | | | | 28,685 | | | | 1,300,871 | |
Bureau Veritas SA (Industrials, Professional Services) | | | | | | | | | | | 29,719 | | | | 706,696 | |
Capgemini SA (Information Technology, IT Services) | | | | | | | | | | | 18,067 | | | | 2,003,028 | |
Carrefour SA (Consumer Staples, Food & Staples Retailing) | | | | | | | | | | | 69,088 | | | | 1,393,245 | |
Christian Dior SA (Consumer Discretionary, Textiles, Apparel & Luxury Goods) | | | | | | | | | | | 5,535 | | | | 1,708,895 | |
Compagnie de Saint-Gobain SA (Industrials, Building Products) | | | | | | | | | | | 54,713 | | | | 3,001,009 | |
Compagnie Generale des Establissements Michelin SA (Consumer Discretionary, Auto Components) | | | | | | | | | | | 18,297 | | | | 2,494,002 | |
Dassault Systemes SA (Information Technology, Software) | | | | | | | | | | | 13,964 | | | | 1,375,640 | |
Eiffage SA (Industrials, Construction & Engineering) | | | | | | | | | | | 9,724 | | | | 1,004,792 | |
Electricite de France SA (Utilities, Electric Utilities) | | | | | | | | | | | 64,725 | | | | 685,762 | |
Elior Group SA (Consumer Discretionary, Hotels, Restaurants & Leisure) 144A | | | | | | | | | | | 22,549 | | | | 598,609 | |
Essilor International SA Cie Generale d’Optique (Health Care, Health Care Equipment & Supplies) | | | | | | | | | | | 22,304 | | | | 2,815,820 | |
Eurazeo (Financials, Diversified Financial Services) | | | | | | | | | | | 8,356 | | | | 691,238 | |
Eutelsat Communications SA (Consumer Discretionary, Media) | | | | | | | | | | | 25,536 | | | | 742,200 | |
Faurecia (Consumer Discretionary, Auto Components) | | | | | | | | | | | 11,837 | | | | 688,434 | |
Fonciere des Regions (Real Estate, Equity REITs) | | | | | | | | | | | 6,798 | | | | 672,259 | |
Gecina SA (Real Estate, Equity REITs) | | | | | | | | | | | 4,300 | | | | 670,069 | |
Groupe Danone SA (Consumer Staples, Food Products) | | | | | | | | | | | 64,229 | | | | 5,057,886 | |
Groupe Eurotunnel SE (Industrials, Transportation Infrastructure) | | | | | | | | | | | 59,439 | | | | 708,653 | |
Hermes International SA (Consumer Discretionary, Textiles, Apparel & Luxury Goods) | | | | | | | | | | | 2,251 | | | | 1,190,592 | |
ICADE (Real Estate, Equity REITs) | | | | | | | | | | | 4,167 | | | | 370,359 | |
Iliad SA (Telecommunication Services, Diversified Telecommunication Services) | | | | | | | | | | | 2,574 | | | | 664,782 | |
Ipsen SA (Health Care, Pharmaceuticals) | | | | | | | | | | | 4,852 | | | | 651,829 | |
Kering SA (Consumer Discretionary, Textiles, Apparel & Luxury Goods) | | | | | | | | | | | 7,303 | | | | 2,741,175 | |
Klepierre (Real Estate, Equity REITs) | | | | | | | | | | | 25,869 | | | | 1,042,437 | |
Lagardere SCA (Consumer Discretionary, Media) | | | | | | | | | | | 20,837 | | | | 669,498 | |
Legrand SA (Industrials, Electrical Equipment) | | | | | | | | | | | 27,521 | | | | 1,929,050 | |
LVMH Moet Hennessy Louis Vuitton SA (Consumer Discretionary, Textiles, Apparel & Luxury Goods) | | | | | | | | | | | 28,314 | | | | 7,423,839 | |
Orpea SA (Health Care, Health Care Providers & Services) | | | | | | | | | | | 5,909 | | | | 716,099 | |
Pernod-Ricard SA (Consumer Staples, Beverages) | | | | | | | | | | | 21,661 | | | | 2,960,274 | |
Peugeot SA (Consumer Discretionary, Automobiles) | | | | | | | | | | | 47,842 | | | | 1,010,071 | |
Rexel SA (Industrials, Trading Companies & Distributors) | | | | | | | | | | | 40,115 | | | | 599,324 | |
Rubis (Utilities, Gas Utilities) | | | | | | | | | | | 11,604 | | | | 754,382 | |
Safran SA (Industrials, Aerospace & Defense) | | | | | | | | | | | 36,499 | | | | 3,545,107 | |
Sanofi SA (Health Care, Pharmaceuticals) | | | | | | | | | | | 122,557 | | | | 11,914,036 | |
SCOR SE (Financials, Insurance) | | | | | | | | | | | 16,224 | | | | 679,848 | |
SEB SA (Consumer Discretionary, Household Durables) | | | | | | | | | | | 3,651 | | | | 663,250 | |
Societe BIC SA (Industrials, Commercial Services & Supplies) | | | | | | | | | | | 5,525 | | | | 663,972 | |
Sodexho Alliance SA (Consumer Discretionary, Hotels, Restaurants & Leisure) | | | | | | | | | | | 10,507 | | | | 1,226,166 | |
Suez Environnement Company SA (Utilities, Multi-Utilities) | | | | | | | | | | | 39,622 | | | | 751,623 | |
Teleperformance SE (Industrials, Professional Services) | | | | | | | | | | | 5,305 | | | | 730,053 | |
Thales SA (Industrials, Aerospace & Defense) | | | | | | | | | | | 10,427 | | | | 1,154,393 | |
Total SA (Energy, Oil, Gas & Consumable Fuels) | | | | | | | | | | | 267,242 | | | | 13,821,517 | |
Ubisoft Entertainment SA (Information Technology, Software) † | | | | | | | | | | | 11,587 | | | | 771,898 | |
Unibail-Rodamco SA (Financials, Real Estate Management & Development) | | | | | | | | | | | 176 | | | | 44,743 | |
Unibail-Rodamco SE (Real Estate, Equity REITs) | | | | | | | | | | | 11,973 | | | | 3,043,785 | |
Valeo SA (Consumer Discretionary, Auto Components) | | | | | | | | | | | 22,738 | | | | 1,520,707 | |
The accompanying notes are an integral part of these financial statements.
| | | | | | |
| Portfolio of investments—August 31, 2017 (unaudited) | | Wells Fargo Target Date Funds | | | 121 | |
FACTOR ENHANCED INTERNATIONAL PORTFOLIO
| | | | | | | | | | | | | | | | |
| Security name | | | | | | | | Shares | | | Value | |
| | | | |
| France (continued) | | | | | | | | | | | | | | | | |
Veolia Environnement SA (Utilities, Multi-Utilities) | | | | | | | | | | | 59,200 | | | $ | 1,389,056 | |
Vinci SA (Industrials, Construction & Engineering) | | | | | | | | | | | 56,584 | | | | 5,210,332 | |
Vivendi SA (Consumer Discretionary, Media) | | | | | | | | | | | 103,241 | | | | 2,368,961 | |
| |
| | | | 109,879,982 | |
| | | | | | | | | | | | | | | | |
| | | | |
| Germany: 9.22% | | | | | | | | | | | | | | | | |
Adidas AG (Consumer Discretionary, Textiles, Apparel & Luxury Goods) | | | | | | | | | | | 17,731 | | | | 3,979,891 | |
Allianz AG (Financials, Insurance) | | | | | | | | | | | 46,462 | | | | 9,942,102 | |
BASF SE (Materials, Chemicals) | | | | | | | | | | | 95,574 | | | | 9,257,963 | |
Bayer AG (Health Care, Pharmaceuticals) | | | | | | | | | | | 88,413 | | | | 11,314,517 | |
Bayerische Motoren Werke AG (Consumer Discretionary, Automobiles) | | | | | | | | | | | 34,910 | | | | 3,241,573 | |
Beiersdorf AG (Consumer Staples, Personal Products) | | | | | | | | | | | 9,787 | | | | 1,044,856 | |
Brenntag AG (Materials, Chemicals) | | | | | | | | | | | 16,353 | | | | 866,593 | |
Covestro AG (Materials, Chemicals) 144A | | | | | | | | | | | 9,009 | | | | 707,942 | |
Deutsche Boerse AG (Financials, Capital Markets) | | | | | | | | | | | 19,203 | | | | 2,052,620 | |
Deutsche Lufthansa AG (Industrials, Airlines) | | | | | | | | | | | 28,610 | | | | 717,619 | |
Deutsche Post AG (Industrials, Air Freight & Logistics) | | | | | | | | | | | 98,669 | | | | 4,092,914 | |
Deutsche Telekom AG (Telecommunication Services, Diversified Telecommunication Services) | | | | | | | | | | | 381,402 | | | | 6,883,250 | |
Deutsche Wohnen AG (Real Estate, Real Estate Management & Development) | | | | | | | | | | | 36,247 | | | | 1,539,601 | |
Duerr AG (Industrials, Machinery) | | | | | | | | | | | 2,590 | | | | 301,667 | |
E.ON SE (Utilities, Multi-Utilities) | | | | | | | | | | | 221,408 | | | | 2,502,648 | |
Evonik Industries AG (Materials, Chemicals) | | | | | | | | | | | 20,067 | | | | 650,491 | |
Fraport AG (Industrials, Transportation Infrastructure) | | | | | | | | | | | 7,261 | | | | 716,490 | |
Freenet AG (Telecommunication Services, Wireless Telecommunication Services) | | | | | | | | | | | 20,411 | | | | 681,810 | |
Fresenius Medical Care AG & Company KGaA (Health Care, Health Care Providers & Services) | | | | | | | | | | | 22,527 | | | | 2,105,156 | |
Fresenius SE & Company KGaA (Health Care, Health Care Providers & Services) | | | | | | | | | | | 43,490 | | | | 3,680,521 | |
Hannover Rueck SE (Financials, Insurance) | | | | | | | | | | | 6,801 | | | | 824,199 | |
Hugo Boss AG (Consumer Discretionary, Textiles, Apparel & Luxury Goods) | | | | | | | | | | | 7,358 | | | | 622,876 | |
Infineon Technologies AG (Information Technology, Semiconductors & Semiconductor Equipment) | | | | | | | | | | | 117,495 | | | | 2,709,321 | |
Innogy SE (Utilities, Multi-Utilities) | | | | | | | | | | | 15,828 | | | | 697,642 | |
K&S AG (Materials, Chemicals) | | | | | | | | | | | 24,849 | | | | 592,222 | |
Kion Group AG (Industrials, Machinery) | | | | | | | | | | | 8,421 | | | | 768,099 | |
LANXESS AG (Materials, Chemicals) | | | | | | | | | | | 8,981 | | | | 669,818 | |
LEG Immobilien AG (Real Estate, Real Estate Management & Development) | | | | | | | | | | | 7,125 | | | | 720,119 | |
Linde AG (Materials, Chemicals) | | | | | | | | | | | 18,217 | | | | 3,492,599 | |
MAN SE (Industrials, Machinery) | | | | | | | | | | | 5,902 | | | | 662,626 | |
Merck KGaA (Health Care, Pharmaceuticals) | | | | | | | | | | | 13,176 | | | | 1,447,133 | |
Metro Wholesale & Food Specialist AG (Consumer Staples, Food & Staples Retailing) † | | | | | | | | | | | 27,817 | | | | 543,744 | |
MTU Aero Engines AG (Industrials, Aerospace & Defense) | | | | | | | | | | | 4,886 | | | | 684,025 | |
Muenchener Rueckversicherungs Gesellschaft AG (Financials, Insurance) | | | | | | | | | | | 16,427 | | | | 3,390,929 | |
Osram Licht AG (Industrials, Electrical Equipment) | | | | | | | | | | | 9,097 | | | | 747,021 | |
ProSiebenSat.1 Media AG (Consumer Discretionary, Media) | | | | | | | | | | | 27,046 | | | | 907,309 | |
Rheinmetall AG (Industrials, Industrial Conglomerates) | | | | | | | | | | | 6,875 | | | | 702,708 | |
SAP SE (Information Technology, Software) | | | | | | | | | | | 107,048 | | | | 11,227,056 | |
Siemens AG (Industrials, Industrial Conglomerates) | | | | | | | | | | | 92,577 | | | | 12,100,877 | |
Stada Arzneimittel AG (Health Care, Pharmaceuticals) | | | | | | | | | | | 7,136 | | | | 667,542 | |
Symrise AG (Materials, Chemicals) | | | | | | | | | | | 12,330 | | | | 901,245 | |
Telefonica Deutschland Holding AG (Telecommunication Services, Diversified Telecommunication Services) | | | | | | | | | | | 130,895 | | | | 708,376 | |
Thyssenkrupp AG (Materials, Metals & Mining) | | | | | | | | | | | 45,048 | | | | 1,350,875 | |
TUI AG – BATS Exchange (Consumer Discretionary, Hotels, Restaurants & Leisure) | | | | | | | | | | | 42,697 | | | | 722,167 | |
The accompanying notes are an integral part of these financial statements.
| | | | |
| 122 | | Wells Fargo Target Date Funds | | Portfolio of investments—August 31, 2017 (unaudited) |
FACTOR ENHANCED INTERNATIONAL PORTFOLIO
| | | | | | | | | | | | | | | | |
| Security name | | | | | | | | Shares | | | Value | |
| | | | |
| Germany (continued) | | | | | | | | | | | | | | | | |
Uniper SE (Utilities, Independent Power & Renewable Electricity Producers) | | | | | | | | | | | 26,146 | | | $ | 650,990 | |
United Internet AG (Information Technology, Internet Software & Services) | | | | | | | | | | | 12,151 | | | | 721,088 | |
Vonovia SE (Real Estate, Real Estate Management & Development) | | | | | | | | | | | 44,972 | | | | 1,900,808 | |
Wirecard AG (Information Technology, IT Services) | | | | | | | | | | | 11,000 | | | | 937,730 | |
Zalando SE (Consumer Discretionary, Internet & Direct Marketing Retail) 144A† | | | | | | | | | | | 14,211 | | | | 673,062 | |
| |
| | | | 119,024,430 | |
| | | | | | | | | | | | | | | | |
| | | | |
| Hong Kong: 2.82% | | | | | | | | | | | | | | | | |
ASM Pacific Technology (Information Technology, Semiconductors & Semiconductor Equipment) | | | | | | | | | | | 47,844 | | | | 591,803 | |
Cheung Kong Property Holding Limited (Real Estate, Real Estate Management & Development) | | | | | | | | | | | 288,190 | | | | 2,529,937 | |
China Merchants Holdings International Company Limited (Industrials, Transportation Infrastructure) | | | | | | | | | | | 3,673 | | | | 12,015 | |
China Pharmaceutical Group Limited (Health Care, Pharmaceuticals) | | | | | | | | | | | 420,000 | | | | 655,835 | |
CK Hutchison Holdings Limited (Industrials, Industrial Conglomerates) | | | | | | | | | | | 301,070 | | | | 3,939,503 | |
CLP Holdings Limited (Utilities, Electric Utilities) | | | | | | | | | | | 237,886 | | | | 2,512,382 | |
Dairy Farm International Holdings Limited (Consumer Staples, Food & Staples Retailing) | | | | | | | | | | | 34,340 | | | | 278,154 | |
First Pacific Company Limited (Financials, Diversified Financial Services) | | | | | | | | | | | 294,894 | | | | 237,023 | |
Galaxy Entertainment Group Limited (Consumer Discretionary, Hotels, Restaurants & Leisure) | | | | | | | | | | | 308,625 | | | | 1,936,362 | |
Hang Lung Group Limited (Real Estate, Real Estate Management & Development) | | | | | | | | | | | 108,705 | | | | 409,775 | |
Hang Lung Properties Limited (Real Estate, Real Estate Management & Development) | | | | | | | | | | | 252,332 | | | | 613,922 | |
Hang Seng Bank Limited (Financials, Banks) | | | | | | | | | | | 76,455 | | | | 1,758,541 | |
Henderson Land Development Company Limited (Real Estate, Real Estate Management & Development) | | | | | | | | | | | 117,917 | | | | 730,792 | |
Hong Kong & China Gas Company Limited (Utilities, Gas Utilities) | | | | | | | | | | | 828,519 | | | | 1,566,888 | |
Hong Kong Land Holdings Limited (Real Estate, Real Estate Management & Development) | | | | | | | | | | | 128,325 | | | | 950,888 | |
Hong Kong Telecommunications Trust & Hong Kong Trust Limited (Telecommunication Services, Diversified Telecommunication Services) | | | | | | | | | | | 507,574 | | | | 655,081 | |
Hopewell Holdings (Industrials, Industrial Conglomerates) | | | | | | | | | | | 88,349 | | | | 347,153 | |
Hysan Development Company Limited (Real Estate, Real Estate Management & Development) | | | | | | | | | | | 80,574 | | | | 372,716 | |
I Cable Communications Limited (Consumer Discretionary, Media) † | | | | | | | | | | | 113,892 | | | | 4,221 | |
Jardine Matheson Holdings Limited (Industrials, Industrial Conglomerates) | | | | | | | | | | | 28,628 | | | | 1,881,146 | |
Jardine Strategic Holdings Limited (Industrials, Industrial Conglomerates) | | | | | | | | | | | 19,217 | | | | 842,666 | |
Link REIT (Real Estate, Equity REITs) | | | | | | | | | | | 242,107 | | | | 1,998,545 | |
MTR Corporation Limited (Industrials, Road & Rail) | | | | | | | | | | | 163,069 | | | | 953,315 | |
New World Development Limited (Real Estate, Real Estate Management & Development) | | | | | | | | | | | 551,960 | | | | 754,684 | |
NWS Holdings Limited (Industrials, Industrial Conglomerates) | | | | | | | | | | | 185,429 | | | | 356,368 | |
Sands China Limited (Consumer Discretionary, Hotels, Restaurants & Leisure) | | | | | | | | | | | 279,117 | | | | 1,250,110 | |
Sino Land Company (Real Estate, Real Estate Management & Development) | | | | | | | | | | | 397,899 | | | | 688,439 | |
Sun Hung Kai Properties Limited (Real Estate, Real Estate Management & Development) | | | | | | | | | | | 158,309 | | | | 2,641,939 | |
Swire Pacific Limited (Financials, Real Estate Management & Development) | | | | | | | | | | | 66,478 | | | | 676,609 | |
Swire Properties Limited (Real Estate, Real Estate Management & Development) | | | | | | | | | | | 192,353 | | | | 666,104 | |
Techtronic Industries Company Limited (Consumer Discretionary, Household Durables) | | | | | | | | | | | 144,743 | | | | 749,077 | |
The Wharf Holdings Limited (Real Estate, Real Estate Management & Development) | | | | | | | | | | | 125,717 | | | | 1,197,611 | |
Vitasoy International Holdings Limited (Consumer Staples, Food Products) | | | | | | | | | | | 97,005 | | | | 212,957 | |
Wheelock & Company Limited (Real Estate, Real Estate Management & Development) | | | | | | | | | | | 100,945 | | | | 755,241 | |
Yue Yuen Industrial Holdings Limited (Consumer Discretionary, Textiles, Apparel & Luxury Goods) | | | | | | | | | | | 157,222 | | | | 681,063 | |
| |
| | | | 36,408,865 | |
| | | | | | | | | | | | | | | | |
| | | | |
| Ireland: 0.37% | | | | | | | | | | | | | | | | |
DCC plc (Industrials, Industrial Conglomerates) | | | | | | | | | | | 10,069 | | | | 917,275 | |
Glanbia plc (Consumer Staples, Food Products) | | | | | | | | | | | 33,676 | | | | 629,808 | |
The accompanying notes are an integral part of these financial statements.
| | | | | | |
| Portfolio of investments—August 31, 2017 (unaudited) | | Wells Fargo Target Date Funds | | | 123 | |
FACTOR ENHANCED INTERNATIONAL PORTFOLIO
| | | | | | | | | | | | | | | | |
| Security name | | | | | | | | Shares | | | Value | |
| | | | |
| Ireland (continued) | | | | | | | | | | | | | | | | |
Kerry Group plc Class A (Consumer Staples, Food Products) | | | | | | | | | | | 17,565 | | | $ | 1,635,810 | |
Kingspan Group plc (Industrials, Building Products) | | | | | | | | | | | 19,815 | | | | 766,635 | |
Smurfit Kappa Group plc (Materials, Containers & Packaging) | | | | | | | | | | | 29,074 | | | | 886,565 | |
| |
| | | | 4,836,093 | |
| | | | | | | | | | | | | | | | |
| | | | |
| Italy: 0.96% | | | | | | | | | | | | | | | | |
Assicurazioni Generali SpA (Financials, Insurance) | | | | | | | | | | | 131,698 | | | | 2,357,971 | |
Atlantia SpA (Industrials, Transportation Infrastructure) | | | | | | | | | | | 52,270 | | | | 1,680,071 | |
Davide Campari-Milano SpA (Consumer Staples, Beverages) | | | | | | | | | | | 89,926 | | | | 650,879 | |
Leonardo-Finmeccanica SpA (Industrials, Aerospace & Defense) | | | | | | | | | | | 44,539 | | | | 753,435 | |
Luxottica Group SpA (Consumer Discretionary, Textiles, Apparel & Luxury Goods) | | | | | | | | | | | 19,086 | | | | 1,098,558 | |
Moncler SpA (Consumer Discretionary, Textiles, Apparel & Luxury Goods) | | | | | | | | | | | 22,394 | | | | 636,349 | |
Poste Italiane SpA (Financials, Insurance) | | | | | | | | | | | 55,944 | | | | 406,584 | |
Prysmian SpA (Industrials, Electrical Equipment) | | | | | | | | | | | 24,477 | | | | 769,843 | |
Recordati SpA (Health Care, Pharmaceuticals) | | | | | | | | | | | 16,171 | | | | 692,643 | |
Snam SpA (Utilities, Gas Utilities) | | | | | | | | | | | 278,940 | | | | 1,358,141 | |
Telecom Italia SpA (Telecommunication Services, Diversified Telecommunication Services) † | | | | | | | | | | | 1,205,006 | | | | 1,154,055 | |
Terna SpA (Utilities, Electric Utilities) | | | | | | | | | | | 150,316 | | | | 887,561 | |
| |
| | | | 12,446,090 | |
| | | | | | | | | | | | | | | | |
| | | | |
| Japan: 15.36% | | | | | | | | | | | | | | | | |
Advance Residence Investment Corporation (Real Estate, Equity REITs) | | | | | | | | | | | 265 | | | | 678,552 | |
Aeon Mall Company Limited (Real Estate, Real Estate Management & Development) | | | | | | | | | | | 19,800 | | | | 355,890 | |
Air Water Incorporated (Materials, Chemicals) | | | | | | | | | | | 32,700 | | | | 603,226 | |
Ajinomoto Company Incorporated (Consumer Staples, Food Products) | | | | | | | | | | | 60,400 | | | | 1,193,056 | |
Alfresa Holdings Corporation (Health Care, Health Care Providers & Services) | | | | | | | | | | | 29,700 | | | | 558,960 | |
All Nippon Airways Company Limited (Industrials, Airlines) | | | | | | | | | | | 422,000 | | | | 1,565,394 | |
Aozora Bank Limited (Financials, Banks) | | | | | | | | | | | 120,000 | | | | 454,087 | |
Asahi Breweries Limited (Consumer Staples, Beverages) | | | | | | | | | | | 46,300 | | | | 2,016,926 | |
Asahi Glass Company Limited (Industrials, Building Products) | | | | | | | | | | | 22,200 | | | | 866,312 | |
Asahi Intecc Company Limited (Health Care, Health Care Equipment & Supplies) | | | | | | | | | | | 8,100 | | | | 424,396 | |
Asahi Kasei Corporation (Materials, Chemicals) | | | | | | | | | | | 135,000 | | | | 1,617,274 | |
Bandai Namco Holdings Incorporated (Consumer Discretionary, Leisure Products) | | | | | | | | | | | 19,500 | | | | 653,636 | |
Benesse Corporation (Consumer Discretionary, Diversified Consumer Services) | | | | | | | | | | | 11,100 | | | | 427,098 | |
Bridgestone Corporation (Consumer Discretionary, Auto Components) | | | | | | | | | | | 73,400 | | | | 3,150,722 | |
Brother Industries Limited (Information Technology, Technology Hardware, Storage & Peripherals) | | | | | | | | | | | 32,800 | | | | 777,521 | |
CALBEE Incorporated (Consumer Staples, Food Products) | | | | | | | | | | | 12,500 | | | | 427,525 | |
Canon Incorporated (Information Technology, Technology Hardware, Storage & Peripherals) | | | | | | | | | | | 115,000 | | | | 4,031,564 | |
Casio Computer Company Limited (Consumer Discretionary, Household Durables) | | | | | | | | | | | 40,100 | | | | 566,839 | |
Chubu Electric Power Company Incorporated (Utilities, Electric Utilities) | | | | | | | | | | | 77,100 | | | | 1,007,802 | |
Citizen Holdings Company Limited (Information Technology, Electronic Equipment, Instruments & Components) | | | | | | | | | | | 52,900 | | | | 374,850 | |
Coca-Cola Bottlers Japan Incorporated (Consumer Staples, Beverages) | | | | | | | | | | | 19,000 | | | | 651,567 | |
Comsys Holdings Corporation (Industrials, Construction & Engineering) | | | | | | | | | | | 18,300 | | | | 393,516 | |
Cosmos Pharmaceutical Corporation (Consumer Staples, Food & Staples Retailing) | | | | | | | | | | | 1,800 | | | | 408,186 | |
Credit Saison Company Limited (Financials, Consumer Finance) | | | | | | | | | | | 31,200 | | | | 566,189 | |
CyberAgent Incorporated (Consumer Discretionary, Media) | | | | | | | | | | | 14,100 | | | | 461,086 | |
Dai Nippon Printing Company Limited (Industrials, Commercial Services & Supplies) | | | | | | | | | | | 64,000 | | | | 755,647 | |
Daicel Chemical Industries Limited (Materials, Chemicals) | | | | | | | | | | | 49,900 | | | | 635,920 | |
Daifuku Company Limited (Industrials, Machinery) | | | | | | | | | | | 17,100 | | | | 744,290 | |
The accompanying notes are an integral part of these financial statements.
| | | | |
| 124 | | Wells Fargo Target Date Funds | | Portfolio of investments—August 31, 2017 (unaudited) |
FACTOR ENHANCED INTERNATIONAL PORTFOLIO
| | | | | | | | | | | | | | | | |
| Security name | | | | | | | | Shares | | | Value | |
| | | | |
| Japan (continued) | | | | | | | | | | | | | | | | |
Daiichikosho Company Limited (Consumer Discretionary, Media) | | | | | | | | | | | 8,000 | | | $ | 387,866 | |
Daito Trust Construction Company Limited (Real Estate, Real Estate Management & Development) | | | | | | | | | | | 7,700 | | | | 1,364,758 | |
Daiwa House Industry Company Limited (Real Estate, Real Estate Management & Development) | | | | | | | | | | | 70,300 | | | | 2,460,036 | |
Daiwa House Residential Investment Corporation (Real Estate, Equity REITs) | | | | | | | | | | | 279 | | | | 682,175 | |
Daiwa Securities Group Incorporated (Financials, Capital Markets) | | | | | | | | | | | 179,000 | | | | 979,872 | |
Dena Company Limited (Information Technology, Internet Software & Services) | | | | | | | | | | | 15,900 | | | | 340,172 | |
DIC Incorporated (Materials, Chemicals) | | | | | | | | | | | 13,500 | | | | 477,077 | |
Disco Corporation (Information Technology, Semiconductors & Semiconductor Equipment) | | | | | | | | | | | 4,100 | | | | 735,081 | |
Don Quijote Company Limited (Consumer Discretionary, Multiline Retail) | | | | | | | | | | | 16,400 | | | | 622,823 | |
East Japan Railway Company (Industrials, Road & Rail) | | | | | | | | | | | 42,000 | | | | 3,852,914 | |
Ebara Corporation (Industrials, Machinery) | | | | | | | | | | | 13,300 | | | | 411,939 | |
Electric Power Development Company Limited (Utilities, Independent Power & Renewable Electricity Producers) | | | | | | | | | | | 23,600 | | | | 646,164 | |
Ezaki Glico Company Limited (Consumer Staples, Food Products) | | | | | | | | | | | 8,500 | | | | 451,539 | |
Fuji Electric Holdings Company Limited (Industrials, Electrical Equipment) | | | | | | | | | | | 78,000 | | | | 429,963 | |
Fujikura Limited (Industrials, Electrical Equipment) | | | | | | | | | | | 41,700 | | | | 339,108 | |
Fujitsu Limited (Information Technology, IT Services) | | | | | | | | | | | 221,000 | | | | 1,638,578 | |
Fukuoka Financial Group Incorporated (Financials, Banks) | | | | | | | | | | | 92,000 | | | | 404,202 | |
Furukawa Electric Company Limited (Industrials, Electrical Equipment) | | | | | | | | | | | 9,600 | | | | 520,453 | |
Glory Limited (Industrials, Machinery) | | | | | | | | | | | 11,000 | | | | 374,221 | |
Hakuhodo DY Holdings Incorporated (Consumer Discretionary, Media) | | | | | | | | | | | 52,900 | | | | 720,347 | |
Hankyu Hanshin Holdings Incorporated (Industrials, Road & Rail) | | | | | | | | | | | 25,300 | | | | 964,270 | |
Haseko Corporation (Consumer Discretionary, Household Durables) | | | | | | | | | | | 41,600 | | | | 515,388 | |
Hikari Tsushin Incorporated (Consumer Discretionary, Specialty Retail) | | | | | | | | | | | 4,200 | | | | 521,108 | |
Hino Motors Limited (Industrials, Machinery) | | | | | | | | | | | 41,700 | | | | 479,075 | |
Hisamitsu Pharmaceutical Company Incorporated (Health Care, Pharmaceuticals) | | | | | | | | | | | 11,000 | | | | 529,313 | |
Hitachi Chemical Company Limited (Materials, Chemicals) | | | | | | | | | | | 17,600 | | | | 476,442 | |
Hitachi Construction Machinery Company Limited (Industrials, Machinery) | | | | | | | | | | | 16,000 | | | | 451,903 | |
Hitachi High Technologies Corporation (Information Technology, Electronic Equipment, Instruments & Components) | | | | 11,600 | | | | 414,154 | |
Hitachi Limited (Information Technology, Electronic Equipment, Instruments & Components) | | | | | | | | | | | 487,000 | | | | 3,353,427 | |
Hitachi Metals Limited (Materials, Metals & Mining) | | | | | | | | | | | 29,200 | | | | 390,183 | |
Hokuhoku Financial Group Incorporated (Financials, Banks) | | | | | | | | | | | 23,500 | | | | 361,045 | |
Horiba Limited (Information Technology, Electronic Equipment, Instruments & Components) | | | | | | | | | | | 6,900 | | | | 423,032 | |
Hoya Corporation (Health Care, Health Care Equipment & Supplies) | | | | | | | | | | | 41,100 | | | | 2,353,432 | |
Idemitsu Kosan Company Limited (Energy, Oil, Gas & Consumable Fuels) | | | | | | | | | | | 16,600 | | | | 405,581 | |
Iida Group Holdings Company (Consumer Discretionary, Household Durables) | | | | | | | | | | | 28,700 | | | | 487,927 | |
Inpex Holdings Incorporated (Energy, Oil, Gas & Consumable Fuels) | | | | | | | | | | | 117,200 | | | | 1,120,455 | |
Isetan Mitsukoshi Holdings Limited (Consumer Discretionary, Multiline Retail) | | | | | | | | | | | 53,900 | | | | 555,008 | |
ITO EN Limited (Consumer Staples, Beverages) | | | | | | | | | | | 10,800 | | | | 397,872 | |
Itochu Corporation (Industrials, Trading Companies & Distributors) | | | | | | | | | | | 157,900 | | | | 2,579,601 | |
Izumi Company Limited (Consumer Discretionary, Multiline Retail) | | | | | | | | | | | 7,000 | | | | 366,762 | |
J.Front Retailing Company Limited (Consumer Discretionary, Multiline Retail) | | | | | | | | | | | 37,500 | | | | 523,605 | |
Japan Airport Terminal Company Limited (Industrials, Transportation Infrastructure) | | | | | | | | | | | 11,300 | | | | 410,124 | |
Japan Prime Realty Investment Corporation (Real Estate, Equity REITs) | | | | | | | | | | | 189 | | | | 679,090 | |
Japan Retail Fund Investment Corporation (Real Estate, Equity REITs) | | | | | | | | | | | 360 | | | | 662,459 | |
JSR Corporation (Materials, Chemicals) | | | | | | | | | | | 30,900 | | | | 602,063 | |
JX Holdings Incorporated (Energy, Oil, Gas & Consumable Fuels) | | | | | | | | | | | 366,000 | | | | 1,772,487 | |
K’s Holdings Corporation (Consumer Discretionary, Specialty Retail) | | | | | | | | | | | 15,500 | | | | 346,559 | |
Kagome Company Limited (Consumer Staples, Food Products) | | | | | | | | | | | 13,500 | | | | 426,115 | |
Kajima Corporation (Industrials, Construction & Engineering) | | | | | | | | | | | 100,000 | | | | 917,815 | |
The accompanying notes are an integral part of these financial statements.
| | | | | | |
| Portfolio of investments—August 31, 2017 (unaudited) | | Wells Fargo Target Date Funds | | | 125 | |
FACTOR ENHANCED INTERNATIONAL PORTFOLIO
| | | | | | | | | | | | | | | | |
| Security name | | | | | | | | Shares | | | Value | |
| | | | |
| Japan (continued) | | | | | | | | | | | | | | | | |
Kakaku.com Incorporated (Information Technology, Internet Software & Services) | | | | | | | | | | | 19,000 | | | $ | 236,603 | |
Kaken Pharmaceutical Company Limited (Health Care, Pharmaceuticals) | | | | | | | | | | | 5,500 | | | | 290,672 | |
Kamigumi Company Limited (Industrials, Transportation Infrastructure) | | | | | | | | | | | 25,000 | | | | 276,754 | |
Kansai Electric Power Company Incorporated (Utilities, Electric Utilities) | | | | | | | | | | | 97,300 | | | | 1,363,006 | |
KDDI Corporation (Telecommunication Services, Wireless Telecommunication Services) | | | | | | | | | | | 199,200 | | | | 5,376,144 | |
Keikyu Corporation (Industrials, Road & Rail) | | | | | | | | | | | 60,000 | | | | 637,468 | |
Keisei Electric Railway Company Limited (Industrials, Road & Rail) | | | | | | | | | | | 24,000 | | | | 653,841 | |
Kewpie Corporation (Consumer Staples, Food Products) | | | | | | | | | | | 17,600 | | | | 421,849 | |
Kintetsu Corporation (Industrials, Road & Rail) | | | | | | | | | | | 182,000 | | | | 687,042 | |
Kirin Brewery Company Limited (Consumer Staples, Beverages) | | | | | | | | | | | 93,600 | | | | 2,125,550 | |
Kobayashi Pharmaceutical Company Limited (Consumer Staples, Personal Products) | | | | | | | | | | | 9,700 | | | | 602,638 | |
Konica Minolta Holdings Incorporated (Information Technology, Technology Hardware, Storage & Peripherals) | | | | | | | | | | | 73,400 | | | | 586,212 | |
Kose Corporation (Consumer Staples, Personal Products) | | | | | | | | | | | 5,900 | | | | 740,619 | |
Kuraray Company Limited (Materials, Chemicals) | | | | | | | | | | | 36,100 | | | | 685,649 | |
Kyocera Corporation (Information Technology, Electronic Equipment, Instruments & Components) | | | | | | | | | | | 40,000 | | | | 2,401,419 | |
Kyushu Electric Power Company Incorporated (Utilities, Electric Utilities) | | | | | | | | | | | 61,500 | | | | 722,773 | |
Kyushu Financial Group Incorporated (Financials, Banks) | | | | | | | | | | | 69,900 | | | | 426,006 | |
Lawson Incorporated (Consumer Staples, Food & Staples Retailing) | | | | | | | | | | | 7,700 | | | | 517,606 | |
Lion Corporation (Consumer Staples, Household Products) | | | | | | | | | | | 37,400 | | | | 743,679 | |
LIXIL Group Corporation (Industrials, Building Products) | | | | | | | | | | | 31,300 | | | | 821,114 | |
M3 Incorporated (Health Care, Health Care Technology) | | | | | | | | | | | 24,500 | | | | 636,708 | |
Mabuchi Motor Company Limited (Industrials, Electrical Equipment) | | | | | | | | | | | 12,500 | | | | 590,121 | |
Marubeni Corporation (Industrials, Trading Companies & Distributors) | | | | | | | | | | | 174,900 | | | | 1,138,159 | |
Matsumotokiyoshi Holdings Company Limited (Consumer Staples, Food & Staples Retailing) | | | | | | | | | | | 6,900 | | | | 469,477 | |
Mebuki Financial Group Incorporated (Financials, Banks) | | | | | | | | | | | 149,900 | | | | 531,778 | |
Medipal Holdings Corporation (Health Care, Health Care Providers & Services) | | | | | | | | | | | 28,100 | | | | 495,619 | |
Meiji Holdings Company Limited (Consumer Staples, Food Products) | | | | | | | | | | | 16,700 | | | | 1,330,714 | |
Minebea Company Limited (Industrials, Machinery) | | | | | | | | | | | 42,800 | | | | 703,503 | |
Miraca Holdings Incorporated (Health Care, Health Care Providers & Services) | | | | | | | | | | | 8,200 | | | | 372,575 | |
Mitsubishi Chemical Holdings Corporation (Materials, Chemicals) | | | | | | | | | | | 138,000 | | | | 1,284,159 | |
Mitsubishi Gas Chemical Company Incorporated (Materials, Chemicals) | | | | | | | | | | | 25,200 | | | | 625,559 | |
Mitsubishi Materials Corporation (Materials, Metals & Mining) | | | | | | | | | | | 19,500 | | | | 699,754 | |
Mitsubishi Tanabe Pharma Corporation (Health Care, Pharmaceuticals) | | | | | | | | | | | 27,600 | | | | 677,855 | |
Mitsubishi UFJ Lease & Finance Company Limited (Financials, Diversified Financial Services) | | | | | | | | | | | 90,400 | | | | 457,201 | |
Mitsui Chemicals Incorporated (Materials, Chemicals) | | | | | | | | | | | 111,000 | | | | 664,374 | |
Mitsui OSK Lines Limited (Industrials, Marine) | | | | | | | | | | | 127,000 | | | | 407,796 | |
Morinaga & Company Limited (Consumer Staples, Food Products) | | | | | | | | | | | 6,900 | | | | 395,415 | |
Nabtesco Corporation (Industrials, Machinery) | | | | | | | | | | | 17,700 | | | | 619,061 | |
Nagoya Railroad Company Limited (Industrials, Road & Rail) | | | | | | | | | | | 107,000 | | | | 478,865 | |
Nankai Electric Railway Company Limited (Industrials, Road & Rail) | | | | | | | | | | | 65,000 | | | | 333,470 | |
NEC Corporation (Information Technology, Technology Hardware, Storage & Peripherals) | | | | | | | | | | | 244,000 | | | | 645,873 | |
NH Foods Limited (Consumer Staples, Food Products) | | | | | | | | | | | 22,000 | | | | 646,382 | |
NHK Spring Company Limited (Consumer Discretionary, Auto Components) | | | | | | | | | | | 35,800 | | | | 357,886 | |
Nichirei Corporation (Consumer Staples, Food Products) | | | | | | | | | | | 19,900 | | | | 526,214 | |
Nihon Kohden Corporation (Health Care, Health Care Equipment & Supplies) | | | | | | | | | | | 12,300 | | | | 285,305 | |
Nihon M&A Center Incorporated (Industrials, Professional Services) | | | | | | | | | | | 9,500 | | | | 439,851 | |
Nikon Corporation (Consumer Discretionary, Household Durables) | | | | | | | | | | | 40,000 | | | | 659,663 | |
Nippon Express Company Limited (Industrials, Road & Rail) | | | | | | | | | | | 105,000 | | | | 724,928 | |
Nippon Prologis REIT Incorporated (Real Estate, Equity REITs) | | | | | | | | | | | 306 | | | | 664,689 | |
Nippon Shinyaku Company Limited (Health Care, Pharmaceuticals) | | | | | | | | | | | 8,100 | | | | 563,651 | |
The accompanying notes are an integral part of these financial statements.
| | | | |
| 126 | | Wells Fargo Target Date Funds | | Portfolio of investments—August 31, 2017 (unaudited) |
FACTOR ENHANCED INTERNATIONAL PORTFOLIO
| | | | | | | | | | | | | | | | |
| Security name | | | | | | | | Shares | | | Value | |
| | | | |
| Japan (continued) | | | | | | | | | | | | | | | | |
Nippon Shokubai Company Limited (Materials, Chemicals) | | | | | | | | | | | 5,700 | | | $ | 406,495 | |
Nippon Telegraph & Telephone Corporation (Telecommunication Services, Diversified Telecommunication Services) | | | | 152,000 | | | | 7,560,249 | |
Nippon Television Network Corporation (Consumer Discretionary, Media) | | | | | | | | | | | 600 | | | | 10,894 | |
Nisshin Seifun Group Incorporated (Consumer Staples, Food Products) | | | | | | | | | | | 45,000 | | | | 782,235 | |
Nissin Food Products Company Limited (Consumer Staples, Food Products) | | | | | | | | | | | 10,500 | | | | 647,565 | |
Nitori Holdings Company Limited (Consumer Discretionary, Specialty Retail) | | | | | | | | | | | 10,300 | | | | 1,590,885 | |
Nomura Real Estate Holding Incorporated (Real Estate, Real Estate Management & Development) | | | | | | | | | | | 19,700 | | | | 406,956 | |
Nomura Real Estate Master Fund Incorporated (Real Estate, Equity REITs) | | | | | | | | | | | 548 | | | | 724,286 | |
Nomura Research Institute Limited (Information Technology, IT Services) | | | | | | | | | | | 16,400 | | | | 638,486 | |
NSK Limited (Industrials, Machinery) | | | | | | | | | | | 52,800 | | | | 626,770 | |
Obayashi Corporation (Industrials, Construction & Engineering) | | | | | | | | | | | 67,700 | | | | 798,717 | |
Omron Corporation (Information Technology, Electronic Equipment, Instruments & Components) | | | | | | | | | | | 19,800 | | | | 994,188 | |
Oracle Corporation (Japan) (Information Technology, Software) | | | | | | | | | | | 5,600 | | | | 414,136 | |
ORIX Corporation (Financials, Diversified Financial Services) | | | | | | | | | | | 135,300 | | | | 2,165,465 | |
ORIX JREIT Incorporated (Real Estate, Equity REITs) | | | | | | | | | | | 448 | | | | 646,315 | |
Osaka Gas Company Limited (Utilities, Gas Utilities) | | | | | | | | | | | 210,000 | | | | 821,585 | |
Otsuka Corporation (Information Technology, IT Services) | | | | | | | | | | | 9,500 | | | | 629,099 | |
Panasonic Corporation (Consumer Discretionary, Household Durables) | | | | | | | | | | | 257,000 | | | | 3,425,965 | |
Park24 Company Limited (Industrials, Commercial Services & Supplies) | | | | | | | | | | | 18,300 | | | | 439,959 | |
Pigeon Corporation (Consumer Staples, Household Products) | | | | | | | | | | | 15,900 | | | | 615,405 | |
Pilot Corporation (Industrials, Commercial Services & Supplies) | | | | | | | | | | | 7,900 | | | | 346,368 | |
Pola Orbis Holdings Incorporated (Consumer Staples, Personal Products) | | | | | | | | | | | 13,500 | | | | 434,097 | |
Recruit Holdings Company Limited (Industrials, Professional Services) | | | | | | | | | | | 168,000 | | | | 3,348,233 | |
Relo Holdings Incorporated (Real Estate, Real Estate Management & Development) | | | | | | | | | | | 16,600 | | | | 377,345 | |
Resona Holdings Incorporated (Financials, Banks) | | | | | | | | | | | 249,500 | | | | 1,245,060 | |
Ricoh Company Limited (Information Technology, Technology Hardware, Storage & Peripherals) | | | | | | | | | | | 79,600 | | | | 797,195 | |
Rohm Company Limited (Information Technology, Semiconductors & Semiconductor Equipment) | | | | | | | | | | | 9,600 | | | | 747,496 | |
Rohto Pharmaceutical Company Limited (Health Care, Pharmaceuticals) | | | | | | | | | | | 15,400 | | | | 357,491 | |
Ryohin Keikaku Company Limited (Consumer Discretionary, Multiline Retail) | | | | | | | | | | | 2,500 | | | | 693,592 | |
Santen Pharmaceutical Company Limited (Health Care, Pharmaceuticals) | | | | | | | | | | | 49,700 | | | | 771,258 | |
Sanwa Holdings Corporation (Industrials, Building Products) | | | | | | | | | | | 36,700 | | | | 409,280 | |
Sapporo Holdings Limited (Consumer Staples, Beverages) | | | | | | | | | | | 13,400 | | | | 389,439 | |
Sawai Pharmaceutical Company Limited (Health Care, Pharmaceuticals) | | | | | | | | | | | 5,800 | | | | 317,078 | |
SBI Holdings Incorporated (Financials, Capital Markets) | | | | | | | | | | | 35,600 | | | | 494,809 | |
SCREEN Holdings Company Limited (Information Technology, Semiconductors & Semiconductor Equipment) | | | | | | | | | | | 5,600 | | | | 362,178 | |
SCSK Corporation (Information Technology, IT Services) | | | | | | | | | | | 8,900 | | | | 385,355 | |
Sega Sammy Holdings Incorporated (Consumer Discretionary, Leisure Products) | | | | | | | | | | | 28,800 | | | | 413,917 | |
Seibu Holdings Incorporated (Industrials, Industrial Conglomerates) | | | | | | | | | | | 37,700 | | | | 648,480 | |
Seiko Epson Corporation (Information Technology, Technology Hardware, Storage & Peripherals) | | | | | | | | | | | 33,000 | | | | 846,800 | |
Sekisui Chemical Company Limited (Consumer Discretionary, Household Durables) | | | | | | | | | | | 45,000 | | | | 839,132 | |
Sharp Corporation (Consumer Discretionary, Household Durables) † | | | | | | | | | | | 212,000 | | | | 636,376 | |
Shimadzu Corporation (Information Technology, Electronic Equipment, Instruments & Components) | | | | | | | | | | | 36,900 | | | | 678,355 | |
Shimamura Company Limited (Consumer Discretionary, Specialty Retail) | | | | | | | | | | | 3,700 | | | | 451,667 | |
Shimizu Corporation (Industrials, Construction & Engineering) | | | | | | | | | | | 66,600 | | | | 688,203 | |
Showa Denko KK (Materials, Chemicals) | | | | | | | | | | | 20,000 | | | | 531,405 | |
Showa Shell Sekiyu KK (Energy, Oil, Gas & Consumable Fuels) | | | | | | | | | | | 31,500 | | | | 345,272 | |
SoftBank Group Corporation (Telecommunication Services, Wireless Telecommunication Services) | | | | | | | | | | | 93,300 | | | | 7,571,953 | |
Sohgo Security Services Company Limited (Industrials, Commercial Services & Supplies) | | | | | | | | | | | 15,500 | | | | 677,469 | |
Sojitz Corporation (Industrials, Trading Companies & Distributors) | | | | | | | | | | | 212,800 | | | | 571,028 | |
The accompanying notes are an integral part of these financial statements.
| | | | | | |
| Portfolio of investments—August 31, 2017 (unaudited) | | Wells Fargo Target Date Funds | | | 127 | |
FACTOR ENHANCED INTERNATIONAL PORTFOLIO
| | | | | | | | | | | | | | | | |
| Security name | | | | | | | | Shares | | | Value | |
| | | | |
| Japan (continued) | | | | | | | | | | | | | | | | |
Sony Financial Holdings Incorporated (Financials, Insurance) | | | | | | | | | | | 22,900 | | | $ | 362,867 | |
Square Enix Company Limited (Information Technology, Software) | | | | | | | | | | | 12,900 | | | | 453,527 | |
Stanley Electric Company Limited (Consumer Discretionary, Auto Components) | | | | | | | | | | | 22,100 | | | | 733,752 | |
Start Today Company Limited (Consumer Discretionary, Internet & Direct Marketing Retail) | | | | | | | | | | | 20,300 | | | | 631,519 | |
Sumitomo Corporation (Industrials, Trading Companies & Distributors) | | | | | | | | | | | 127,500 | | | | 1,805,192 | |
Sumitomo Dainippon Pharma Company Limited (Health Care, Pharmaceuticals) | | | | | | | | | | | 25,500 | | | | 346,541 | |
Sumitomo Foresting Company Limited (Consumer Discretionary, Household Durables) | | | | | | | | | | | 25,700 | | | | 400,690 | |
Sumitomo Heavy Industries Limited (Industrials, Machinery) | | | | | | | | | | | 64,000 | | | | 477,373 | |
Sumitomo Rubber Industries Limited (Consumer Discretionary, Auto Components) | | | | | | | | | | | 27,900 | | | | 462,652 | |
Sundrug Company Limited (Consumer Staples, Food & Staples Retailing) | | | | | | | | | | | 11,200 | | | | 464,056 | |
Suntory Beverage & Food Limited (Consumer Staples, Beverages) | | | | | | | | | | | 13,400 | | | | 619,202 | |
Suzuken Company Limited (Health Care, Health Care Providers & Services) | | | | | | | | | | | 13,500 | | | | 491,813 | |
Suzuki Motor Corporation (Consumer Discretionary, Automobiles) | | | | | | | | | | | 44,800 | | | | 2,251,920 | |
T&D Holdings Incorporated (Financials, Insurance) | | | | | | | | | | | 67,000 | | | | 919,357 | |
Taiheiyo Cement Corporation (Materials, Construction Materials) | | | | | | | | | | | 143,000 | | | | 551,526 | |
Taisei Corporation (Industrials, Construction & Engineering) | | | | | | | | | | | 110,000 | | | | 1,103,652 | |
Takara Holdings Incorporated (Consumer Staples, Beverages) | | | | | | | | | | | 33,900 | | | | 328,716 | |
Takashimaya Company Limited (Consumer Discretionary, Multiline Retail) | | | | | | | | | | | 35,000 | | | | 321,235 | |
Takeda Pharmaceutical Company Limited (Health Care, Pharmaceuticals) | | | | | | | | | | | 78,600 | | | | 4,344,860 | |
Teijin Limited (Materials, Chemicals) | | | | | | | | | | | 31,000 | | | | 629,390 | |
Temp Holdings Company Limited (Industrials, Professional Services) | | | | | | | | | | | 24,300 | | | | 493,803 | |
The Chugoku Bank Limited (Financials, Banks) | | | | | | | | | | | 33,500 | | | | 451,603 | |
The Chugoku Electric Power Company Incorporated (Utilities, Electric Utilities) | | | | | | | | | | | 47,800 | | | | 551,329 | |
The Gunma Bank Limited (Financials, Banks) | | | | | | | | | | | 74,800 | | | | 438,179 | |
The Yokohama Rubber Company Limited (Consumer Discretionary, Auto Components) | | | | | | | | | | | 19,400 | | | | 359,112 | |
THK Company Limited (Industrials, Machinery) | | | | | | | | | | | 18,100 | | | | 604,239 | |
TIS Incorporated (Information Technology, IT Services) | | | | | | | | | | | 13,300 | | | | 392,582 | |
Tobu Railway Company Limited (Industrials, Road & Rail) | | | | | | | | | | | 121,000 | | | | 669,195 | |
Toho Company Limited Tokyo (Consumer Discretionary, Media) | | | | | | | | | | | 18,300 | | | | 679,997 | |
Toho Gas Company Limited (Utilities, Gas Utilities) | | | | | | | | | | | 60,000 | | | | 395,688 | |
Tohoku Electric Power Company Incorporated (Utilities, Electric Utilities) | | | | | | | | | | | 55,400 | | | | 757,917 | |
Tokyo Broadcasting System Incorporated (Consumer Discretionary, Media) | | | | | | | | | | | 18,100 | | | | 347,396 | |
Tokyo Electron Limited (Information Technology, Semiconductors & Semiconductor Equipment) | | | | | | | | | | | 17,100 | | | | 2,404,749 | |
Tokyo Gas Company Limited (Utilities, Gas Utilities) | | | | | | | | | | | 219,000 | | | | 1,161,785 | |
Toppan Printing Company Limited (Industrials, Commercial Services & Supplies) | | | | | | | | | | | 65,000 | | | | 650,976 | |
Tosoh Corporation (Materials, Chemicals) | | | | | | | | | | | 66,000 | | | | 774,458 | |
Toyoda Gosei Company Limited (Consumer Discretionary, Auto Components) | | | | | | | | | | | 13,700 | | | | 319,399 | |
Toyota Tsusho Corporation (Industrials, Trading Companies & Distributors) | | | | | | | | | | | 23,700 | | | | 729,745 | |
Trend Micro Incorporated (Information Technology, Software) | | | | | | | | | | | 13,300 | | | | 615,791 | |
Tsumura & Company (Health Care, Pharmaceuticals) | | | | | | | | | | | 9,700 | | | | 365,730 | |
Tsuruha Holdings Incorporated (Consumer Staples, Food & Staples Retailing) | | | | | | | | | | | 5,800 | | | | 690,608 | |
Unicharm Corporation (Consumer Staples, Household Products) | | | | | | | | | | | 41,800 | | | | 983,641 | |
United Urban Investment Corporation (Real Estate, Equity REITs) | | | | | | | | | | | 463 | | | | 698,703 | |
USS Company Limited (Consumer Discretionary, Specialty Retail) | | | | | | | | | | | 34,500 | | | | 678,169 | |
West Japan Railway Company (Industrials, Road & Rail) | | | | | | | | | | | 19,700 | | | | 1,431,962 | |
Yahoo! Japan Corporation (Information Technology, Internet Software & Services) | | | | | | | | | | | 134,900 | | | | 618,453 | |
Yakult Honsha Company Limited (Consumer Staples, Food Products) | | | | | | | | | | | 13,400 | | | | 928,804 | |
Yamada Denki Company Limited (Consumer Discretionary, Specialty Retail) | | | | | | | | | | | 108,000 | | | | 584,527 | |
Yamaha Corporation (Consumer Discretionary, Leisure Products) | | | | | | | | | | | 19,100 | | | | 665,420 | |
Yamaha Motor Company Limited (Consumer Discretionary, Automobiles) | | | | | | | | | | | 29,600 | | | | 837,368 | |
The accompanying notes are an integral part of these financial statements.
| | | | |
| 128 | | Wells Fargo Target Date Funds | | Portfolio of investments—August 31, 2017 (unaudited) |
FACTOR ENHANCED INTERNATIONAL PORTFOLIO
| | | | | | | | | | | | | | | | |
| Security name | | | | | | | | Shares | | | Value | |
| | | | |
| Japan (continued) | | | | | | | | | | | | | | | | |
Yamazaki Baking Company Limited (Consumer Staples, Food Products) | | | | | | | | | | | 28,700 | | | $ | 544,056 | |
Yaskawa Electric Corporation (Information Technology, Electronic Equipment, Instruments & Components) | | | | | | | | | | | 28,300 | | | | 857,225 | |
Yokogawa Electric Corporation (Information Technology, Electronic Equipment, Instruments & Components) | | | | | | | | | | | 33,700 | | | | 525,111 | |
Zenkoku Hosho Company Limited (Financials, Diversified Financial Services) | | | | | | | | | | | 7,900 | | | | 320,858 | |
| |
| | | | 198,387,267 | |
| | | | | | | | | | | | | | | | |
| | | | |
| Luxembourg: 0.26% | | | | | | | | | | | | | | | | |
B&M European Value Retail SA (Consumer Discretionary, Multiline Retail) | | | | | | | | | | | 69,752 | | | | 335,891 | |
Eurofins Scientific SE (Health Care, Life Sciences Tools & Services) | | | | | | | | | | | 1,154 | | | | 659,551 | |
RTL Group SA (Consumer Discretionary, Media) | | | | | | | | | | | 8,473 | | | | 643,026 | |
SES SA (Consumer Discretionary, Media) | | | | | | | | | | | 44,732 | | | | 1,022,690 | |
Subsea 7 SA (Energy, Energy Equipment & Services) | | | | | | | | | | | 47,678 | | | | 686,474 | |
| |
| | | | 3,347,632 | |
| | | | | | | | | | | | | | | | |
| | | | |
| Netherlands: 3.51% | | | | | | | | | | | | | | | | |
Aalberts Industries NV (Industrials, Machinery) | | | | | | | | | | | 16,309 | | | | 725,638 | |
ABN AMRO Group NV (Financials, Banks) 144A | | | | | | | | | | | 33,229 | | | | 931,183 | |
Airbus Group NV (Industrials, Aerospace & Defense) | | | | | | | | | | | 58,935 | | | | 4,953,942 | |
Akzo Nobel NV (Materials, Chemicals) | | | | | | | | | | | 26,947 | | | | 2,463,673 | |
Altice NV Class A (Consumer Discretionary, Media) † | | | | | | | | | | | 53,002 | | | | 1,222,175 | |
Exor NV (Financials, Diversified Financial Services) | | | | | | | | | | | 11,577 | | | | 742,842 | |
Ferrari NV (Consumer Discretionary, Automobiles) | | | | | | | | | | | 11,757 | | | | 1,345,059 | |
Fiat Chrysler Automobiles NV (Consumer Discretionary, Automobiles) | | | | | | | | | | | 100,643 | | | | 1,515,603 | |
Gemalto NV (Information Technology, Software) | | | | | | | | | | | 10,220 | | | | 552,294 | |
Gemalto NV (Information Technology, Software) | | | | | | | | | | | 163 | | | | 8,809 | |
Heineken Holding NV (Consumer Staples, Beverages) | | | | | | | | | | | 10,355 | | | | 1,022,411 | |
Heineken NV (Consumer Staples, Beverages) | | | | | | | | | | | 22,084 | | | | 2,316,930 | |
IMCD Group NV (Industrials, Trading Companies & Distributors) | | | | | | | | | | | 5,481 | | | | 322,361 | |
Koninklijke Ahold NV (Consumer Staples, Food & Staples Retailing) | | | | | | | | | | | 133,306 | | | | 2,396,283 | |
Koninklijke DSM NV (Materials, Chemicals) | | | | | | | | | | | 19,183 | | | | 1,455,365 | |
Koninklijke KPN NV (Telecommunication Services, Diversified Telecommunication Services) | | | | | | | | | | | 327,046 | | | | 1,156,706 | |
Koninklijke Philips NV (Industrials, Industrial Conglomerates) | | | | | | | | | | | 98,311 | | | | 3,719,353 | |
Koninklijke Vopak NV (Energy, Oil, Gas & Consumable Fuels) | | | | | | | | | | | 14,029 | | | | 593,798 | |
NN Group NV (Financials, Insurance) | | | | | | | | | | | 32,672 | | | | 1,296,545 | |
Philips Lighting NV (Industrials, Electrical Equipment) | | | | | | | | | | | 17,530 | | | | 646,927 | |
Qiagen NV (Health Care, Life Sciences Tools & Services) | | | | | | | | | | | 21,009 | | | | 674,149 | |
Randstad Holdings NV (Industrials, Professional Services) | | | | | | | | | | | 14,825 | | | | 866,626 | |
RELX NV (Industrials, Professional Services) | | | | | | | | | | | 106,149 | | | | 2,228,449 | |
STMicroelectronics NV (Information Technology, Semiconductors & Semiconductor Equipment) | | | | | | | | | | | 63,579 | | | | 1,103,526 | |
Unilever NV (Consumer Staples, Personal Products) | | | | | | | | | | | 162,803 | | | | 9,692,414 | |
Wolters Kluwer NV (Consumer Discretionary, Media) | | | | | | | | | | | 30,626 | | | | 1,337,853 | |
| |
| | | | 45,290,914 | |
| | | | | | | | | | | | | | | | |
| | | | |
| New Zealand: 0.28% | | | | | | | | | | | | | | | | |
Auckland International Airport Limited (Industrials, Transportation Infrastructure) | | | | | | | | | | | 126,051 | | | | 614,526 | |
Contact Energy Limited (Utilities, Electric Utilities) | | | | | | | | | | | 92,506 | | | | 370,620 | |
Fisher & Paykel Healthcare Corporation (Health Care, Health Care Equipment & Supplies) | | | | | | | | | | | 81,934 | | | | 692,413 | |
Fletcher Building Limited (Materials, Construction Materials) | | | | | | | | | | | 111,913 | | | | 655,685 | |
Meridian Energy Limited (Utilities, Independent Power & Renewable Electricity Producers) | | | | | | | | | | | 164,218 | | | | 347,830 | |
The accompanying notes are an integral part of these financial statements.
| | | | | | |
| Portfolio of investments—August 31, 2017 (unaudited) | | Wells Fargo Target Date Funds | | | 129 | |
FACTOR ENHANCED INTERNATIONAL PORTFOLIO
| | | | | | | | | | | | | | | | |
| Security name | | | | | | | | Shares | | | Value | |
| | | | |
| New Zealand (continued) | | | | | | | | | | | | | | | | |
Ryman Healthcare Limited (Health Care, Health Care Providers & Services) | | | | | | | | | | | 31,606 | | | $ | 206,053 | |
Spark New Zealand Limited (Telecommunication Services, Diversified Telecommunication Services) | | | | | | | | | | | 245,804 | | | | 690,948 | |
| |
| | | | 3,578,075 | |
| | | | | | | | | | | | | | | | |
| | | | |
| Norway: 0.55% | | | | | | | | | | | | | | | | |
Den Norske Bank ASA (Financials, Banks) | | | | | | | | | | | 88,201 | | | | 1,722,420 | |
Gjensidige Forsikring ASA (Financials, Insurance) | | | | | | | | | | | 38,214 | | | | 668,922 | |
Marine Harvest ASA (Consumer Staples, Food Products) | | | | | | | | | | | 42,516 | | | | 844,516 | |
Norsk Hydro ASA (Materials, Metals & Mining) | | | | | | | | | | | 115,344 | | | | 832,599 | |
Orkla ASA (Consumer Staples, Food Products) | | | | | | | | | | | 88,953 | | | | 913,270 | |
Telenor ASA (Telecommunication Services, Diversified Telecommunication Services) | | | | | | | | | | | 65,992 | | | | 1,336,351 | |
TGS Nopec Geophysical Company ASA (Energy, Energy Equipment & Services) | | | | | | | | | | | 9,964 | | | | 213,717 | |
Yara International ASA (Materials, Chemicals) | | | | | | | | | | | 15,397 | | | | 629,737 | |
| |
| | | | 7,161,532 | |
| | | | | | | | | | | | | | | | |
| | | | |
| Portugal: 0.19% | | | | | | | | | | | | | | | | |
Energias de Portugal SA (Utilities, Electric Utilities) | | | | | | | | | | | 262,449 | | | | 1,007,595 | |
Galp Energia SGPS SA (Energy, Oil, Gas & Consumable Fuels) | | | | | | | | | | | 45,722 | | | | 757,118 | |
Jeronimo Martins SA (Consumer Staples, Food & Staples Retailing) | | | | | | | | | | | 33,336 | | | | 665,118 | |
| |
| | | | 2,429,831 | |
| | | | | | | | | | | | | | | | |
| | | | |
| Singapore: 1.53% | | | | | | | | | | | | | | | | |
Ascendas REIT (Real Estate, Equity REITs) | | | | | | | | | | | 224,600 | | | | 440,603 | |
CapitaLand Limited (Real Estate, Real Estate Management & Development) | | | | | | | | | | | 281,263 | | | | 784,081 | |
CapitaLand Mall Trust (Real Estate, Equity REITs) | | | | | | | | | | | 292,900 | | | | 468,744 | |
City Developments Limited (Real Estate, Real Estate Management & Development) | | | | | | | | | | | 83,075 | | | | 717,437 | |
ComfortDelGro Corporation Limited (Industrials, Road & Rail) | | | | | | | | | | | 402,837 | | | | 680,332 | |
DBS Group Holdings Limited (Financials, Banks) | | | | | | | | | | | 181,213 | | | | 2,755,715 | |
Genting Singapore plc (Consumer Discretionary, Hotels, Restaurants & Leisure) | | | | | | | | | | | 843,624 | | | | 737,265 | |
Global Logistic Properties Limited (Real Estate, Real Estate Management & Development) | | | | | | | | | | | 307,905 | | | | 735,729 | |
Jardine Cycle & Carriage Limited (Consumer Discretionary, Distributors) | | | | | | | | | | | 20,477 | | | | 603,007 | |
Keppel Corporation Limited (Industrials, Industrial Conglomerates) | | | | | | | | | | | 163,143 | | | | 759,196 | |
Oversea-Chinese Banking Corporation Limited (Financials, Banks) | | | | | | | | | | | 307,796 | | | | 2,535,552 | |
Singapore Airlines Limited (Industrials, Airlines) | | | | | | | | | | | 89,921 | | | | 683,717 | |
Singapore Exchange Limited (Financials, Capital Markets) | | | | | | | | | | | 122,574 | | | | 677,979 | |
Singapore Technologies Engineering Limited (Industrials, Aerospace & Defense) | | | | | | | | | | | 244,469 | | | | 658,071 | |
Singapore Telecommunications Limited (Telecommunication Services, Diversified Telecommunication Services) | | | | | | | | | | | 875,855 | | | | 2,389,958 | |
Singapore Telecommunications Limited GDR (Telecommunication Services, Diversified Telecommunication Services) | | | | 11,900 | | | | 32,559 | |
United Overseas Bank Limited (Financials, Banks) | | | | | | | | | | | 146,285 | | | | 2,592,456 | |
United Overseas Land Limited (Real Estate, Real Estate Management & Development) | | | | | | | | | | | 119,473 | | | | 720,741 | |
Wilmar International Limited (Consumer Staples, Food Products) | | | | | | | | | | | 316,485 | | | | 774,903 | |
| |
| | | | 19,748,045 | |
| | | | | | | | | | | | | | | | |
| | | | |
| Spain: 2.72% | | | | | | | | | | | | | | | | |
Abertis Infraestructuras SA (Industrials, Transportation Infrastructure) | | | | | | | | | | | 72,350 | | | | 1,464,195 | |
Actividades de Construccion y Servicios SA (Industrials, Construction & Engineering) | | | | | | | | | | | 22,349 | | | | 844,987 | |
Aena SA (Industrials, Transportation Infrastructure) 144A | | | | | | | | | | | 8,036 | | | | 1,569,378 | |
Amadeus IT Holding SA Class A (Information Technology, IT Services) | | | | | | | | | | | 44,478 | | | | 2,757,047 | |
The accompanying notes are an integral part of these financial statements.
| | | | |
| 130 | | Wells Fargo Target Date Funds | | Portfolio of investments—August 31, 2017 (unaudited) |
FACTOR ENHANCED INTERNATIONAL PORTFOLIO
| | | | | | | | | | | | | | | | |
| Security name | | | | | | | | Shares | | | Value | |
| | | | |
| Spain (continued) | | | | | | | | | | | | | | | | |
Banco de Sabade SA (Financials, Banks) | | | | | | | | | | | 562,535 | | | $ | 1,236,881 | |
Bankia SA (Financials, Banks) | | | | | | | | | | | 128,347 | | | | 624,761 | |
Bankinter SA (Financials, Banks) | | | | | | | | | | | 70,188 | | | | 669,278 | |
CaixaBank SA (Financials, Banks) | | | | | | | | | | | 359,183 | | | | 1,854,884 | |
Distribuidora Internacional SA (Consumer Staples, Food & Staples Retailing) | | | | | | | | | | | 106,576 | | | | 674,459 | |
Enagas SA (Energy, Oil, Gas & Consumable Fuels) | | | | | | | | | | | 24,328 | | | | 716,937 | |
Endesa SA (Utilities, Electric Utilities) | | | | | | | | | | | 37,733 | | | | 910,289 | |
Gas Natural SDG SA (Utilities, Gas Utilities) | | | | | | | | | | | 37,329 | | | | 907,431 | |
Grifols SA (Health Care, Biotechnology) | | | | | | | | | | | 31,048 | | | | 877,826 | |
Iberdrola SA (Utilities, Electric Utilities) | | | | | | | | | | | 637,712 | | | | 5,208,629 | |
Industria de Diseno Textil SA (Consumer Discretionary, Specialty Retail) | | | | | | | | | | | 114,577 | | | | 4,353,151 | |
International Consolidated Airlines Group SA (Industrials, Airlines) | | | | | | | | | | | 115,027 | | | | 909,554 | |
Mapfre SA (Financials, Insurance) | | | | | | | | | | | 182,314 | | | | 645,248 | |
Merlin Properties Socimi SA (Real Estate, Equity REITs) | | | | | | | | | | | 51,716 | | | | 712,619 | |
Red Electrica Corporacion SA (Utilities, Electric Utilities) | | | | | | | | | | | 44,142 | | | | 991,335 | |
Repsol YPF SA (Energy, Oil, Gas & Consumable Fuels) | | | | | | | | | | | 126,117 | | | | 2,166,463 | |
Telefonica SA (Telecommunication Services, Diversified Telecommunication Services) | | | | | | | | | | | 464,163 | | | | 5,005,670 | |
| |
| | | | 35,101,022 | |
| | | | | | | | | | | | | | | | |
| | | | |
| Sweden: 3.21% | | | | | | | | | | | | | | | | |
Alfa Laval AB (Industrials, Machinery) | | | | | | | | | | | 27,334 | | | | 619,214 | |
Atlas Copco AB Class A (Industrials, Machinery) | | | | | | | | | | | 66,956 | | | | 2,624,057 | |
BillerudKorsnas AB (Materials, Containers & Packaging) | | | | | | | | | | | 40,981 | | | | 683,382 | |
Boliden AB (Materials, Metals & Mining) | | | | | | | | | | | 26,858 | | | | 939,688 | |
Castellum AB (Real Estate, Real Estate Management & Development) | | | | | | | | | | | 44,625 | | | | 698,656 | |
Electrolux AB Class B (Consumer Discretionary, Household Durables) | | | | | | | | | | | 23,067 | | | | 838,694 | |
Elekta AB Class B (Health Care, Health Care Equipment & Supplies) | | | | | | | | | | | 68,956 | | | | 713,794 | |
Essity Aktiebolag AB (Consumer Staples, Household Products) † | | | | | | | | | | | 65,678 | | | | 1,823,436 | |
Fabege AB (Real Estate, Real Estate Management & Development) | | | | | | | | | | | 33,214 | | | | 666,307 | |
Getinge AB Class B (Health Care, Health Care Equipment & Supplies) | | | | | | | | | | | 33,478 | | | | 621,886 | |
Hennes & Mauritz AB Class B (Consumer Discretionary, Specialty Retail) | | | | | | | | | | | 96,501 | | | | 2,441,142 | |
Hexpol AB (Materials, Chemicals) | | | | | | | | | | | 31,786 | | | | 311,029 | |
Husqvarna AB Class B (Consumer Discretionary, Household Durables) | | | | | | | | | | | 65,799 | | | | 663,725 | |
Industrivarden AB Class A (Financials, Diversified Financial Services) | | | | | | | | | | | 26,917 | | | | 672,777 | |
Intrum Justitia AB (Industrials, Commercial Services & Supplies) | | | | | | | | | | | 8,964 | | | | 292,529 | |
Investor AB Class B (Financials, Diversified Financial Services) | | | | | | | | | | | 46,626 | | | | 2,180,565 | |
Lundin Petroleum AB (Energy, Oil, Gas & Consumable Fuels) | | | | | | | | | | | 29,235 | | | | 627,325 | |
Nordea Bank AB (Financials, Banks) | | | | | | | | | | | 308,663 | | | | 4,152,670 | |
Saab AB Class B (Industrials, Aerospace & Defense) | | | | | | | | | | | 13,167 | | | | 600,703 | |
Sandvik AB (Industrials, Machinery) | | | | | | | | | | | 115,363 | | | | 1,906,323 | |
Securitas AB (Industrials, Commercial Services & Supplies) | | | | | | | | | | | 39,125 | | | | 643,076 | |
Skandinaviska Enskilda Banken AB Class A (Financials, Banks) | | | | | | | | | | | 157,042 | | | | 2,043,626 | |
Skanska AB Class B (Industrials, Construction & Engineering) | | | | | | | | | | | 42,130 | | | | 951,746 | |
SKF AB Class B (Industrials, Machinery) | | | | | | | | | | | 35,589 | | | | 711,265 | |
Svenska Handelsbanken AB Class A (Financials, Banks) | | | | | | | | | | | 150,657 | | | | 2,252,531 | |
Swedbank AB Class A (Financials, Banks) | | | | | | | | | | | 95,330 | | | | 2,577,086 | |
Swedish Match AB (Consumer Staples, Tobacco) | | | | | | | | | | | 20,293 | | | | 723,532 | |
Tele2 AB Class B (Telecommunication Services, Wireless Telecommunication Services) | | | | | | | | | | | 62,235 | | | | 724,505 | |
Telefonaktiebolaget LM Ericsson Class B (Information Technology, Communications Equipment) | | | | | | | | | | | 315,141 | | | | 1,847,040 | |
The accompanying notes are an integral part of these financial statements.
| | | | | | |
| Portfolio of investments—August 31, 2017 (unaudited) | | Wells Fargo Target Date Funds | | | 131 | |
FACTOR ENHANCED INTERNATIONAL PORTFOLIO
| | | | | | | | | | | | | | | | |
| Security name | | | | | | | | Shares | | | Value | |
|
| Sweden (continued) | |
Telia Company AB (Telecommunication Services, Diversified Telecommunication Services) | | | | | | | | | | | 298,908 | | | $ | 1,425,745 | |
Trelleborg AB Class B (Industrials, Machinery) | | | | | | | | | | | 28,435 | | | | 677,437 | |
Volvo AB Class B (Industrials, Machinery) | | | | | | | | | | | 161,092 | | | | 2,751,179 | |
| |
| | | | 41,406,670 | |
| | | | | | | | | | | | | | | | |
| | | | |
| Switzerland: 7.35% | | | | | | | | | | | | | | | | |
ABB Limited (Industrials, Electrical Equipment) | | | | | | | | | | | 222,993 | | | | 5,162,360 | |
Adecco SA (Industrials, Professional Services) | | | | | | | | | | | 18,665 | | | | 1,352,748 | |
Aryzta AG (Consumer Staples, Food Products) | | | | | | | | | | | 19,725 | | | | 621,606 | |
Baloise Holding AG (Financials, Insurance) | | | | | | | | | | | 5,612 | | | | 893,636 | |
Barry Callebaut AG (Consumer Staples, Food Products) | | | | | | | | | | | 253 | | | | 364,086 | |
Chocoladefabriken Lindt & Sprungli AG (Consumer Staples, Food Products) | | | | | | | | | | | 12 | | | | 834,718 | |
Clariant AG (Materials, Chemicals) | | | | | | | | | | | 27,932 | | | | 674,015 | |
Coca-Cola HBC AG (Consumer Staples, Beverages) | | | | | | | | | | | 22,539 | | | | 770,599 | |
dormakaba Holding AG (Industrials, Building Products) | | | | | | | | | | | 362 | | | | 326,345 | |
Dufry Group Register Shares (Consumer Discretionary, Specialty Retail) † | | | | | | | | | | | 3,935 | | | | 606,489 | |
EMS-Chemie Holdings AG (Materials, Chemicals) | | | | | | | | | | | 986 | | | | 673,988 | |
Flughafen Zuerich AG (Industrials, Transportation Infrastructure) | | | | | | | | | | | 2,648 | | | | 648,918 | |
Geberit AG (Industrials, Building Products) | | | | | | | | | | | 3,775 | | | | 1,724,622 | |
Georg Fischer AG (Industrials, Machinery) | | | | | | | | | | | 539 | | | | 621,090 | |
Givaudan SA (Materials, Chemicals) | | | | | | | | | | | 854 | | | | 1,745,492 | |
Helvetia Holding AG (Financials, Insurance) | | | | | | | | | | | 1,132 | | | | 648,661 | |
Julius Baer Group Limited (Financials, Capital Markets) | | | | | | | | | | | 23,723 | | | | 1,325,984 | |
Kuehne & Nagel International AG (Industrials, Marine) | | | | | | | | | | | 6,285 | | | | 1,138,438 | |
LafargeHolcim Limited – BATS Exchange (Materials, Construction Materials) | | | | | | | | | | | 49,184 | | | | 2,890,159 | |
Logitech International SA (Information Technology, Technology Hardware, Storage & Peripherals) | | | | | | | | | | | 19,985 | | | | 710,661 | |
Lonza Group AG (Health Care, Life Sciences Tools & Services) | | | | | | | | | | | 7,722 | | | | 1,955,162 | |
Nestle SA (Consumer Staples, Food Products) | | | | | | | | | | | 337,939 | | | | 28,668,167 | |
Partners Group Holding AG (Financials, Capital Markets) | | | | | | | | | | | 2,331 | | | | 1,511,947 | |
PSP Swiss Property AG (Real Estate, Real Estate Management & Development) | | | | | | | | | | | 7,070 | | | | 648,793 | |
Roche Holding AG (Health Care, Pharmaceuticals) | | | | | | | | | | | 75,240 | | | | 19,105,207 | |
Schindler Holding AG – Participation Certificate (Industrials, Machinery) | | | | | | | | | | | 4,407 | | | | 943,947 | |
SGS SA (Industrials, Professional Services) | | | | | | | | | | | 634 | | | | 1,416,820 | |
Sika AG (Materials, Chemicals) | | | | | | | | | | | 210 | | | | 1,489,157 | |
Sonova Holding AG (Health Care, Health Care Equipment & Supplies) | | | | | | | | | | | 5,822 | | | | 984,145 | |
Straumann Holding AG (Health Care, Health Care Equipment & Supplies) | | | | | | | | | | | 1,168 | | | | 748,461 | |
Swatch Group AG Class B (Consumer Discretionary, Textiles, Apparel & Luxury Goods) | | | | | | | | | | | 3,202 | | | | 1,278,195 | |
Swiss Life Holding AG (Financials, Insurance) | | | | | | | | | | | 3,143 | | | | 1,124,853 | |
Swiss Prime Site AG (Real Estate, Real Estate Management & Development) | | | | | | | | | | | 9,149 | | | | 828,128 | |
Swiss Reinsurance AG (Financials, Insurance) | | | | | | | | | | | 33,733 | | | | 3,055,124 | |
Swisscom AG (Telecommunication Services, Diversified Telecommunication Services) | | | | | | | | | | | 2,691 | | | | 1,357,076 | |
Temenos Group AG (Information Technology, Software) | | | | | | | | | | | 7,317 | | | | 721,819 | |
Vifor Pharma AG (Health Care, Pharmaceuticals) | | | | | | | | | | | 5,823 | | | | 588,403 | |
Zurich Insurance Group AG (Financials, Insurance) | | | | | | | | | | | 15,917 | | | | 4,762,070 | |
| |
| | | | 94,922,089 | |
| | | | | | | | | | | | | | | | |
| | | | |
| Thailand: 0.05% | | | | | | | | | | | | | | | | |
Thai Beverage PCL (Consumer Staples, Beverages) | | | | | | | | | | | 933,600 | | | | 640,325 | |
| | | | | | | | | | | | | | | | |
The accompanying notes are an integral part of these financial statements.
| | | | |
| 132 | | Wells Fargo Target Date Funds | | Portfolio of investments—August 31, 2017 (unaudited) |
FACTOR ENHANCED INTERNATIONAL PORTFOLIO
| | | | | | | | | | | | | | | | |
| Security name | | | | | | | | Shares | | | Value | |
| | | | |
| United Kingdom: 14.99% | | | | | | | | | | | | | | | | |
3i Group plc (Financials, Capital Markets) | | | | | | | | | | | 102,859 | | | $ | 1,289,503 | |
Admiral Group plc (Financials, Insurance) | | | | | | | | | | | 25,077 | | | | 626,167 | |
Aggreko plc (Industrials, Commercial Services & Supplies) | | | | | | | | | | | 55,866 | | | | 650,886 | |
Ashtead Group plc (Industrials, Trading Companies & Distributors) | | | | | | | | | | | 47,212 | | | | 1,015,259 | |
Associated British Foods plc (Consumer Staples, Food Products) | | | | | | | | | | | 38,369 | | | | 1,648,210 | |
AstraZeneca plc (Health Care, Pharmaceuticals) | | | | | | | | | | | 138,604 | | | | 8,138,786 | |
Auto Trader Group plc (Information Technology, Internet Software & Services) 144A | | | | | | | | | | | 132,374 | | | | 604,925 | |
Babcock International Group plc (Industrials, Commercial Services & Supplies) | | | | | | | | | | | 57,338 | | | | 602,418 | |
BAE Systems plc (Industrials, Aerospace & Defense) | | | | | | | | | | | 346,574 | | | | 2,722,542 | |
Barratt Developments plc (Consumer Discretionary, Household Durables) | | | | | | | | | | | 99,470 | | | | 803,261 | |
BBA Aviation plc (Industrials, Transportation Infrastructure) | | | | | | | | | | | 162,426 | | | | 633,880 | |
Beazley plc (Financials, Insurance) | | | | | | | | | | | 98,208 | | | | 648,933 | |
Bellway plc (Consumer Discretionary, Household Durables) | | | | | | | | | | | 16,610 | | | | 687,953 | |
BHP Billiton plc (Materials, Metals & Mining) | | | | | | | | | | | 196,373 | | | | 3,749,277 | |
Booker Group plc (Consumer Staples, Food & Staples Retailing) | | | | | | | | | | | 263,940 | | | | 682,602 | |
BP plc (Energy, Oil, Gas & Consumable Fuels) | | | | | | | | | | | 2,068,722 | | | | 11,908,055 | |
British American Tobacco plc (Consumer Staples, Tobacco) | | | | | | | | | | | 196,249 | | | | 12,259,614 | |
BT Group plc (Telecommunication Services, Diversified Telecommunication Services) | | | | | | | | | | | 913,342 | | | | 3,455,142 | |
Bunzl plc (Industrials, Trading Companies & Distributors) | | | | | | | | | | | 36,807 | | | | 1,099,448 | |
Burberry Group plc (Consumer Discretionary, Textiles, Apparel & Luxury Goods) | | | | | | | | | | | 44,480 | | | | 1,033,583 | |
Carnival plc (Consumer Discretionary, Hotels, Restaurants & Leisure) | | | | | | | | | | | 19,291 | | | | 1,340,805 | |
Centamin plc (Materials, Metals & Mining) | | | | | | | | | | | 144,477 | | | | 283,037 | |
Centrica plc (Utilities, Multi-Utilities) | | | | | | | | | | | 591,323 | | | | 1,528,514 | |
Close Brothers Group plc (Financials, Capital Markets) | | | | | | | | | | | 17,024 | | | | 340,112 | |
Compass Group plc (Consumer Discretionary, Hotels, Restaurants & Leisure) | | | | | | | | | | | 167,305 | | | | 3,573,963 | |
Conva Tec Limited (Health Care, Health Care Equipment & Supplies) 144A† | | | | | | | | | | | 160,561 | | | | 595,666 | |
Croda International plc (Materials, Chemicals) | | | | | | | | | | | 15,115 | | | | 750,927 | |
Daily Mail & General Trust plc Class A (Consumer Discretionary, Media) | | | | | | | | | | | 32,417 | | | | 261,361 | |
Derwent Valley Holdings plc (Real Estate, Equity REITs) | | | | | | | | | | | 19,038 | | | | 685,366 | |
Diageo plc (Consumer Staples, Beverages) | | | | | | | | | | | 264,945 | | | | 8,880,206 | |
Dialog Semiconductor plc (Information Technology, Semiconductors & Semiconductor Equipment) † | | | | | | | | | | | 15,069 | | | | 684,997 | |
Direct Line Insurance Group plc (Financials, Insurance) | | | | | | | | | | | 148,878 | | | | 731,747 | |
Dixons Carphone plc (Consumer Discretionary, Specialty Retail) | | | | | | | | | | | 175,154 | | | | 392,737 | |
DS Smith plc (Materials, Containers & Packaging) | | | | | | | | | | | 104,311 | | | | 671,456 | |
easyJet plc (Industrials, Airlines) | | | | | | | | | | | 37,133 | | | | 574,280 | |
Electrocomponents plc (Information Technology, Electronic Equipment, Instruments & Components) | | | | | | | | | | | 83,611 | | | | 683,843 | |
Experian Group Limited plc (Industrials, Professional Services) | | | | | | | | | | | 102,563 | | | | 2,060,981 | |
Fresnillo plc (Materials, Metals & Mining) | | | | | | | | | | | 34,174 | | | | 714,117 | |
G4S plc (Industrials, Commercial Services & Supplies) | | | | | | | | | | | 180,456 | | | | 661,541 | |
GKN plc (Consumer Discretionary, Auto Components) | | | | | | | | | | | 186,845 | | | | 770,492 | |
GlaxoSmithKline plc (Health Care, Pharmaceuticals) | | | | | | | | | | | 535,041 | | | | 10,609,702 | |
Halma plc (Information Technology, Electronic Equipment, Instruments & Components) | | | | | | | | | | | 45,544 | | | | 643,700 | |
Hammerson plc (Real Estate, Equity REITs) | | | | | | | | | | | 87,715 | | | | 636,310 | |
Hargreaves Lansdown plc (Financials, Capital Markets) | | | | | | | | | | | 39,434 | | | | 713,890 | |
Hikma Pharmaceuticals plc (Health Care, Pharmaceuticals) | | | | | | | | | | | 15,242 | | | | 246,762 | |
Hiscox Limited (Financials, Insurance) | | | | | | | | | | | 39,323 | | | | 649,845 | |
Howden Joinery Group plc (Industrials, Trading Companies & Distributors) | | | | | | | | | | | 121,317 | | | | 668,288 | |
IMI plc (Industrials, Machinery) | | | | | | | | | | | 41,775 | | | | 613,119 | |
Imperial Tobacco Group plc (Consumer Staples, Tobacco) | | | | | | | | | | | 101,502 | | | | 4,200,730 | |
Inchcape plc (Consumer Discretionary, Distributors) | | | | | | | | | | | 66,033 | | | | 710,849 | |
The accompanying notes are an integral part of these financial statements.
| | | | | | |
| Portfolio of investments—August 31, 2017 (unaudited) | | Wells Fargo Target Date Funds | | | 133 | |
FACTOR ENHANCED INTERNATIONAL PORTFOLIO
| | | | | | | | | | | | | | | | |
| Security name | | | | | | | | Shares | | | Value | |
|
| United Kingdom (continued) | |
Indivior plc (Health Care, Pharmaceuticals) † | | | | | | | | | | | 119,255 | | | $ | 642,434 | |
Informa plc (Consumer Discretionary, Media) | | | | | | | | | | | 81,272 | | | | 725,666 | |
Inmarsat plc (Telecommunication Services, Diversified Telecommunication Services) | | | | | | | | | | | 67,637 | | | | 640,218 | |
InterContinental Hotels Group plc (Consumer Discretionary, Hotels, Restaurants & Leisure) | | | | | | | | | | | 19,323 | | | | 963,483 | |
Intermediate Capital Group (Financials, Capital Markets) | | | | | | | | | | | 57,893 | | | | 664,770 | |
Intertek Group plc (Industrials, Professional Services) | | | | | | | | | | | 15,745 | | | | 1,040,389 | |
Investec plc (Financials, Capital Markets) | | | | | | | | | | | 87,832 | | | | 670,096 | |
ITV plc (Consumer Discretionary, Media) | | | | | | | | | | | 424,776 | | | | 871,155 | |
J Sainsbury plc (Consumer Staples, Food & Staples Retailing) | | | | | | | | | | | 199,684 | | | | 608,346 | |
John Wood Group plc (Energy, Energy Equipment & Services) | | | | | | | | | | | 78,844 | | | | 577,055 | |
Johnson Matthey plc (Materials, Chemicals) | | | | | | | | | | | 22,853 | | | | 816,796 | |
Just Eat plc (Information Technology, Internet Software & Services) † | | | | | | | | | | | 75,012 | | | | 646,007 | |
Kingfisher plc (Consumer Discretionary, Specialty Retail) | | | | | | | | | | | 224,275 | | | | 866,840 | |
Land Securities Group plc (Real Estate, Equity REITs) | | | | | | | | | | | 86,878 | | | | 1,134,654 | |
Legal & General Group plc (Financials, Insurance) | | | | | | | | | | | 635,294 | | | | 2,137,541 | |
Marks & Spencer Group plc (Consumer Discretionary, Multiline Retail) | | | | | | | | | | | 185,441 | | | | 766,381 | |
Mediclinic International plc (Health Care, Health Care Providers & Services) | | | | | | | | | | | 67,988 | | | | 672,113 | |
Meggitt plc (Industrials, Aerospace & Defense) | | | | | | | | | | | 102,548 | | | | 686,893 | |
Melrose Industries plc (Industrials, Electrical Equipment) | | | | | | | | | | | 212,752 | | | | 605,241 | |
Merlin Entertainment plc (Consumer Discretionary, Hotels, Restaurants & Leisure) 144A | | | | | | | | | | | 104,818 | | | | 625,247 | |
Metro Bank plc (Financials, Banks) † | | | | | | | | | | | 13,378 | | | | 600,106 | |
Micro Focus International plc (Information Technology, Software) | | | | | | | | | | | 26,318 | | | | 773,543 | |
Mondi plc (Materials, Paper & Forest Products) | | | | | | | | | | | 33,824 | | | | 924,180 | |
National Grid plc (Utilities, Multi-Utilities) | | | | | | | | | | | 391,556 | | | | 4,935,114 | |
Next plc (Consumer Discretionary, Multiline Retail) | | | | | | | | | | | 16,784 | | | | 896,134 | |
Pennon Group plc (Utilities, Water Utilities) | | | | | | | | | | | 61,277 | | | | 643,407 | |
Persimmon plc (Consumer Discretionary, Household Durables) | | | | | | | | | | | 31,143 | | | | 1,070,807 | |
Phoenix Group Holdings (Financials, Insurance) | | | | | | | | | | | 65,640 | | | | 664,179 | |
Playtech plc (Information Technology, Software) | | | | | | | | | | | 52,302 | | | | 642,502 | |
Provident Financial plc (Financials, Consumer Finance) | | | | | | | | | | | 20,911 | | | | 238,763 | |
Randgold Resources Limited (Materials, Metals & Mining) | | | | | | | | | | | 10,180 | | | | 1,041,254 | |
Reckitt Benckiser Group plc (Consumer Staples, Household Products) | | | | | | | | | | | 71,260 | | | | 6,756,171 | |
RELX plc (Industrials, Professional Services) | | | | | | | | | | | 118,917 | | | | 2,600,279 | |
Rentokil Initial plc (Industrials, Commercial Services & Supplies) | | | | | | | | | | | 205,769 | | | | 810,214 | |
Rightmove plc (Information Technology, Internet Software & Services) | | | | | | | | | | | 11,815 | | | | 629,758 | |
Rio Tinto plc (Materials, Metals & Mining) | | | | | | | | | | | 119,380 | | | | 5,783,485 | |
Royal Dutch Shell plc Class A (Energy, Oil, Gas & Consumable Fuels) | | | | | | | | | | | 472,521 | | | | 13,019,362 | |
RPC Group plc (Materials, Containers & Packaging) | | | | | | | | | | | 53,074 | | | | 636,200 | |
RSA Insurance Group plc (Financials, Insurance) | | | | | | | | | | | 95,650 | | | | 824,361 | |
Schroders plc (Financials, Capital Markets) | | | | | | | | | | | 15,952 | | | | 694,736 | |
Segro plc (Real Estate, Equity REITs) | | | | | | | | | | | 108,154 | | | | 752,415 | |
Severn Trent plc (Utilities, Water Utilities) | | | | | | | | | | | 21,822 | | | | 640,267 | |
Sky plc (Consumer Discretionary, Media) | | | | | | | | | | | 110,430 | | | | 1,365,140 | |
Smith & Nephew plc (Health Care, Health Care Equipment & Supplies) | | | | | | | | | | | 89,742 | | | | 1,621,155 | |
Smiths Group plc (Industrials, Industrial Conglomerates) | | | | | | | | | | | 42,627 | | | | 851,620 | |
Spectris plc (Information Technology, Electronic Equipment, Instruments & Components) | | | | | | | | | | | 19,686 | | | | 589,051 | |
Spirax-Sarco Engineering plc (Industrials, Machinery) | | | | | | | | | | | 9,340 | | | | 678,759 | |
SSE plc (Utilities, Electric Utilities) | | | | | | | | | | | 109,525 | | | | 2,018,173 | |
Tate & Lyle plc (Consumer Staples, Food Products) | | | | | | | | | | | 75,793 | | | | 669,885 | |
Taylor Wimpey plc (Consumer Discretionary, Household Durables) | | | | | | | | | | | 320,073 | | | | 829,843 | |
The accompanying notes are an integral part of these financial statements.
| | | | |
| 134 | | Wells Fargo Target Date Funds | | Portfolio of investments—August 31, 2017 (unaudited) |
FACTOR ENHANCED INTERNATIONAL PORTFOLIO
| | | | | | | | | | | | | | | | |
| Security name | | | | | | | | Shares | | | Value | |
|
| United Kingdom (continued) | |
TechnipFMC plc -BATS Exchange (Energy, Energy Equipment & Services) † | | | | | | | | | | | 45,060 | | | $ | 1,155,442 | |
Tesco plc (Consumer Staples, Food & Staples Retailing) † | | | | | | | | | | | 795,088 | | | | 1,859,885 | |
The Berkeley Group Holdings plc (Consumer Discretionary, Household Durables) | | | | | | | | | | | 13,306 | | | | 643,676 | |
The British Land Company plc (Real Estate, Equity REITs) | | | | | | | | | | | 119,245 | | | | 942,907 | |
The Sage Group plc (Information Technology, Software) | | | | | | | | | | | 126,055 | | | | 1,128,787 | |
TP Icap plc (Financials, Capital Markets) | | | | | | | | | | | 106,173 | | | | 677,675 | |
Travis Perkins plc (Industrials, Trading Companies & Distributors) | | | | | | | | | | | 33,191 | | | | 645,936 | |
Unilever plc (Consumer Staples, Personal Products) | | | | | | | | | | | 135,233 | | | | 7,902,384 | |
United Business Media plc (Consumer Discretionary, Media) | | | | | | | | | | | 73,017 | | | | 626,466 | |
United Utilities Group plc (Utilities, Water Utilities) | | | | | | | | | | | 65,461 | | | | 770,294 | |
Whitbread plc (Consumer Discretionary, Hotels, Restaurants & Leisure) | | | | | | | | | | | 18,020 | | | | 875,677 | |
William Hill plc (Consumer Discretionary, Hotels, Restaurants & Leisure) | | | | | | | | | | | 197,141 | | | | 631,190 | |
William Morrison Supermarkets plc (Consumer Staples, Food & Staples Retailing) | | | | | | | | | | | 213,814 | | | | 680,148 | |
Wolseley plc (Industrials, Trading Companies & Distributors) | | | | | | | | | | | 26,028 | | | | 1,549,223 | |
WPP plc (Consumer Discretionary, Media) | | | | | | | | | | | 149,339 | | | | 2,742,167 | |
| |
| | | | 193,533,832 | |
| | | | | | | | | | | | | | | | |
| |
Total Common Stocks (Cost $1,110,393,000) | | | | 1,218,357,623 | |
| | | | | | | | | | | | | | | | |
| | | | |
| | | Dividend yield | | | | | | | | | | |
| Preferred Stocks: 0.55% | | | | | | | | | | | | | | | | |
| | | | |
| Germany: 0.55% | | | | | | | | | | | | | | | | |
Fuchs Petrolub AG (Materials, Chemicals) | | | 1.75 | % | | | | | | | 11,774 | | | | 654,564 | |
Henkel AG & Company KGaA (Consumer Staples, Household Products) | | | 1.28 | | | | | | | | 18,935 | | | | 2,537,010 | |
Porsche Automobil Holding SE (Consumer Discretionary, Automobiles) | | | 2.00 | | | | | | | | 16,297 | | | | 923,671 | |
Schaeffler AG Preference (Consumer Discretionary, Auto Components) | | | 3.85 | | | | | | | | 19,199 | | | | 270,609 | |
Volkswagen AG (Consumer Discretionary, Automobiles) | | | 1.50 | | | | | | | | 17,856 | | | | 2,664,526 | |
| | | | |
Total Preferred Stocks (Cost $6,817,191) | | | | | | | | | | | | | | | 7,050,380 | |
| | | | | | | | | | | | | | | | |
| | | | |
| | | | | | Expiration date | | | | | | | |
| Rights: 0.00% | | | | | | | | | | | | | | | | |
| | | | |
| Sweden: 0.00% | | | | | | | | | | | | | | | | |
Getinge AB (Health Care, Health Care Equipment & Supplies) †(a) | | | | | | | 9-14-2017 | | | | 33,478 | | | | 12,399 | |
| | | | | | | | | | | | | | | | |
| | | | |
Total Rights (Cost $0) | | | | | | | | | | | | | | | 12,399 | |
| | | | | | | | | | | | | | | | |
| | | | |
| | | Yield | | | | | | | | | | |
| Short-Term Investments: 4.47% | | | | | | | | | | | | | | | | |
| | | | |
| Investment Companies: 4.47% | | | | | | | | | | | | | | | | |
Wells Fargo Government Money Market Select Class (l)(u) | | | 0.92 | | | | | | | | 57,687,125 | | | | 57,687,125 | |
| | | | | | | | | | | | | | | | |
| | | | |
Total Short-Term Investments (Cost $57,687,125) | | | | | | | | | | | | | | | 57,687,125 | |
| | | | | | | | | | | | | | | | |
| | | | | | | | |
| Total investments in securities (Cost $1,174,897,316) | | | 99.37 | % | | | 1,283,107,527 | |
Other assets and liabilities, net | | | 0.63 | | | | 8,136,091 | |
| | | | | | | | |
| Total net assets | | | 100.00 | % | | $ | 1,291,243,618 | |
| | | | | | | | |
The accompanying notes are an integral part of these financial statements.
| | | | | | |
| Portfolio of investments—August 31, 2017 (unaudited) | | Wells Fargo Target Date Funds | | | 135 | |
FACTOR ENHANCED INTERNATIONAL PORTFOLIO
| † | Non-income-earning security |
| 144A | The security may be resold in transactions exempt from registration, normally to qualified institutional buyers, pursuant to Rule 144A under the Securities Act of 1933. |
| (a) | The security is fair valued in accordance with procedures approved by the Board of Trustees. |
| (l) | The issuer of the security is an affiliated person of the Portfolio as defined in the Investment Company Act of 1940. |
| (u) | The rate represents the 7-day annualized yield at period end. |
Futures Contracts
| | | | | | | | | | | | | | | | | | | | | | | | |
| Description | | Number of contracts | | | Expiration date | | | Notional cost | | | Notional value | | | Unrealized gains | | | Unrealized losses | |
Long | | | | | | | | | | | | | | | | | | | | | | | | |
MSCI EAFE Index | | | 239 | | | | 9-15-2017 | | | $ | 23,077,933 | | | $ | 23,120,860 | | | $ | 42,927 | | | $ | 0 | |
Investments In Affiliates
An affiliated investment is an investment in which the Portfolio owns at least 5% of the outstanding voting shares of the issuer or as a result of other relationships, such as the Portfolio and the issuer having the same investment manager. Transactions with issuers that were either affiliated persons of the Portfolio at the beginning of the period or the end of the period were as follows:
| | | | | | | | | | | | | | | | | | | | | | | | | | | | | | | | |
| | | Shares, beginning of period | | | Shares purchased | | | Shares sold | | | Shares, end of period | | | Net realized gains (losses) | | | Net change in unrealized gains (losses) | | | Income from affiliated securities | | | Value, end of period | |
Investment companies - 4.47% | | | | | | | | | | | | | | | | | | | | | | | | | | | | | | | | |
Wells Fargo Government Money Market Fund Select Class | | | 0 | | | | 472,462,496 | | | | 414,775,371 | | | | 57,687,125 | | | $ | 0 | | | $ | 0 | | | $ | 26,461 | | | $ | 57,687,125 | |
The accompanying notes are an integral part of these financial statements.
| | | | |
| 136 | | Wells Fargo Target Date Funds | | Portfolio of investments—August 31, 2017 (unaudited) |
FACTOR ENHANCED LARGE CAP PORTFOLIO
| | | | | | | | | | | | | | | | |
| Security name | | | | | | | | Shares | | | Value | |
|
Common Stocks: 94.61% | |
|
Consumer Discretionary: 11.90% | |
|
| Auto Components: 0.19% | |
Lear Corporation | | | | | | | | | | | 15,214 | | | $ | 2,275,101 | |
The Goodyear Tire & Rubber Company | | | | | | | | | | | 62,174 | | | | 1,883,872 | |
| |
| | | | 4,158,973 | |
| | | | | | | | | | | | | | | | |
| | | | |
| Automobiles: 0.64% | | | | | | | | | | | | | | | | |
Ford Motor Company | | | | | | | | | | | 515,758 | | | | 5,688,811 | |
General Motors Company | | | | | | | | | | | 170,391 | | | | 6,226,087 | |
Harley-Davidson Incorporated | | | | | | | | | | | 40,433 | | | | 1,900,755 | |
| |
| | | | 13,815,653 | |
| | | | | | | | | | | | | | | | |
| | | | |
| Distributors: 0.21% | | | | | | | | | | | | | | | | |
Genuine Parts Company | | | | | | | | | | | 29,543 | | | | 2,447,047 | |
LKQ Corporation † | | | | | | | | | | | 60,749 | | | | 2,104,953 | |
| |
| | | | 4,552,000 | |
| | | | | | | | | | | | | | | | |
| | | | |
| Hotels, Restaurants & Leisure: 2.43% | | | | | | | | | | | | | | | | |
Aramark | | | | | | | | | | | 53,282 | | | | 2,168,045 | |
Carnival Corporation | | | | | | | | | | | 49,016 | | | | 3,405,632 | |
Chipotle Mexican Grill Incorporated † | | | | | | | | | | | 5,306 | | | | 1,680,463 | |
Darden Restaurants Incorporated | | | | | | | | | | | 24,344 | | | | 1,998,399 | |
Domino’s Pizza Incorporated | | | | | | | | | | | 10,549 | | | | 1,922,661 | |
Hilton Worldwide Holdings Incorporated | | | | | | | | | | | 35,442 | | | | 2,279,984 | |
Marriott International Incorporated Class A | | | | | | | | | | | 36,465 | | | | 3,777,045 | |
McDonald’s Corporation | | | | | | | | | | | 100,387 | | | | 16,058,909 | |
Norwegian Cruise Line Holdings Limited † | | | | | | | | | | | 39,368 | | | | 2,340,821 | |
Starbucks Corporation | | | | | | | | | | | 175,983 | | | | 9,654,427 | |
Vail Resorts Incorporated | | | | | | | | | | | 9,671 | | | | 2,204,506 | |
Wyndham Worldwide Corporation | | | | | | | | | | | 21,905 | | | | 2,183,491 | |
Yum! Brands Incorporated | | | | | | | | | | | 37,966 | | | | 2,916,548 | |
| |
| | | | 52,590,931 | |
| | | | | | | | | | | | | | | | |
| | | | |
| Household Durables: 0.59% | | | | | | | | | | | | | | | | |
D.R. Horton Incorporated | | | | | | | | | | | 63,375 | | | | 2,291,006 | |
Leggett & Platt Incorporated | | | | | | | | | | | 41,370 | | | | 1,901,779 | |
Lennar Corporation Class A | | | | | | | | | | | 41,879 | | | | 2,167,657 | |
Mohawk Industries Incorporated † | | | | | | | | | | | 9,002 | | | | 2,278,586 | |
NVR Incorporated † | | | | | | | | | | | 793 | | | | 2,157,631 | |
Whirlpool Corporation | | | | | | | | | | | 11,839 | | | | 2,031,809 | |
| |
| | | | 12,828,468 | |
| | | | | | | | | | | | | | | | |
| | | | |
| Leisure Products: 0.09% | | | | | | | | | | | | | | | | |
Hasbro Incorporated | | | | | | | | | | | 19,472 | | | | 1,913,124 | |
Mattel Incorporated | | | | | | | | | | | 451 | | | | 7,315 | |
| |
| | | | 1,920,439 | |
| | | | | | | | | | | | | | | | |
The accompanying notes are an integral part of these financial statements.
| | | | | | |
| Portfolio of investments—August 31, 2017 (unaudited) | | Wells Fargo Target Date Funds | | | 137 | |
FACTOR ENHANCED LARGE CAP PORTFOLIO
| | | | | | | | | | | | | | | | |
| Security name | | | | | | | | Shares | | | Value | |
| | | | |
| Media: 3.78% | | | | | | | | | | | | | | | | |
CBS Corporation Class B | | | | | | | | | | | 51,356 | | | $ | 3,289,865 | |
Charter Communications Incorporated Class A † | | | | | | | | | | | 26,797 | | | | 10,679,676 | |
Comcast Corporation Class A | | | | | | | | | | | 597,592 | | | | 24,268,211 | |
DISH Network Corporation Class A † | | | | | | | | | | | 34,953 | | | | 2,002,457 | |
Interpublic Group of Companies Incorporated | | | | | | | | | | | 94,012 | | | | 1,893,402 | |
Omnicom Group Incorporated | | | | | | | | | | | 37,225 | | | | 2,694,345 | |
Sirius XM Holdings Incorporated | | | | | | | | | | | 402,389 | | | | 2,313,737 | |
The Walt Disney Company | | | | | | | | | | | 188,677 | | | | 19,094,112 | |
Time Warner Incorporated | | | | | | | | | | | 94,153 | | | | 9,518,868 | |
Twenty-First Century Fox Incorporated Class A | | | | | | | | | | | 146,427 | | | | 4,039,921 | |
Viacom Incorporated Class B | | | | | | | | | | | 66,472 | | | | 1,901,099 | |
| |
| | | | 81,695,693 | |
| | | | | | | | | | | | | | | | |
| | | | |
| Multiline Retail: 0.49% | | | | | | | | | | | | | | | | |
Dollar General Corporation | | | | | | | | | | | 43,561 | | | | 3,160,786 | |
Dollar Tree Incorporated † | | | | | | | | | | | 36,280 | | | | 2,889,339 | |
Macy’s Incorporated | | | | | | | | | | | 435 | | | | 9,035 | |
Target Corporation | | | | | | | | | | | 83,379 | | | | 4,546,657 | |
| |
| | | | 10,605,817 | |
| | | | | | | | | | | | | | | | |
| | | | |
| Specialty Retail: 2.65% | | | | | | | | | | | | | | | | |
Advance Auto Parts Incorporated | | | | | | | | | | | 20,694 | | | | 2,025,942 | |
AutoZone Incorporated † | | | | | | | | | | | 4,219 | | | | 2,229,488 | |
Best Buy Company Incorporated | | | | | | | | | | | 37,474 | | | | 2,033,339 | |
Foot Locker Incorporated | | | | | | | | | | | 43,318 | | | | 1,526,093 | |
L Brands Incorporated | | | | | | | | | | | 46,103 | | | | 1,669,851 | |
Lowe’s Companies Incorporated | | | | | | | | | | | 108,197 | | | | 7,994,676 | |
O’Reilly Automotive Incorporated † | | | | | | | | | | | 13,385 | | | | 2,625,200 | |
Ross Stores Incorporated | | | | | | | | | | | 59,004 | | | | 3,448,784 | |
The Home Depot Incorporated | | | | | | | | | | | 144,684 | | | | 21,683,791 | |
The TJX Companies Incorporated | | | | | | | | | | | 79,772 | | | | 5,767,516 | |
Tiffany & Company | | | | | | | | | | | 23,576 | | | | 2,154,846 | |
Tractor Supply Company | | | | | | | | | | | 35,090 | | | | 2,088,206 | |
ULTA Beauty Incorporated † | | | | | | | | | | | 9,241 | | | | 2,042,353 | |
| |
| | | | 57,290,085 | |
| | | | | | | | | | | | | | | | |
| | | | |
| Textiles, Apparel & Luxury Goods: 0.83% | | | | | | | | | | | | | | | | |
Coach Incorporated | | | | | | | | | | | 48,874 | | | | 2,038,046 | |
HanesBrands Incorporated | | | | | | | | | | | 94,091 | | | | 2,282,648 | |
Nike Incorporated Class B | | | | | | | | | | | 162,935 | | | | 8,604,597 | |
PVH Corporation | | | | | | | | | | | 16,549 | | | | 2,083,354 | |
VF Corporation | | | | | | | | | | | 45,746 | | | | 2,876,051 | |
| |
| | | | 17,884,696 | |
| | | | | | | | | | | | | | | | |
| | | | |
Consumer Staples: 11.02% | | | | | | | | | | | | | | | | |
| | | | |
| Beverages: 2.57% | | | | | | | | | | | | | | | | |
Brown-Forman Corporation Class B | | | | | | | | | | | 45,216 | | | | 2,398,256 | |
Constellation Brands Incorporated Class A | | | | | | | | | | | 19,473 | | | | 3,896,547 | |
The accompanying notes are an integral part of these financial statements.
| | | | |
| 138 | | Wells Fargo Target Date Funds | | Portfolio of investments—August 31, 2017 (unaudited) |
FACTOR ENHANCED LARGE CAP PORTFOLIO
| | | | | | | | | | | | | | | | |
| Security name | | | | | | | | Shares | | | Value | |
|
| Beverages (continued) | |
Dr Pepper Snapple Group Incorporated | | | | | | | | | | | 31,293 | | | $ | 2,849,228 | |
Molson Coors Brewing Company Class B | | | | | | | | | | | 28,008 | | | | 2,513,718 | |
Monster Beverage Corporation † | | | | | | | | | | | 60,058 | | | | 3,352,438 | |
PepsiCo Incorporated | | | | | | | | | | | 169,411 | | | | 19,605,935 | |
The Coca-Cola Company | | | | | | | | | | | 459,856 | | | | 20,946,440 | |
| |
| | | | 55,562,562 | |
| | | | | | | | | | | | | | | | |
| | | | |
| Food & Staples Retailing: 2.28% | | | | | | | | | | | | | | | | |
Costco Wholesale Corporation | | | | | | | | | | | 53,868 | | | | 8,443,270 | |
CVS Health Corporation | | | | | | | | | | | 132,847 | | | | 10,274,387 | |
Sysco Corporation | | | | | | | | | | | 71,111 | | | | 3,745,416 | |
The Kroger Company | | | | | | | | | | | 129,532 | | | | 2,832,865 | |
Wal-Mart Stores Incorporated | | | | | | | | | | | 181,617 | | | | 14,178,839 | |
Walgreens Boots Alliance Incorporated | | | | | | | | | | | 120,394 | | | | 9,812,111 | |
| |
| | | | 49,286,888 | |
| | | | | | | | | | | | | | | | |
| | | | |
| Food Products: 1.97% | | | | | | | | | | | | | | | | |
Archer Daniels Midland Company | | | | | | | | | | | 76,186 | | | | 3,148,006 | |
Bunge Limited | | | | | | | | | | | 28,283 | | | | 2,110,760 | |
Campbell Soup Company | | | | | | | | | | | 41,916 | | | | 1,936,519 | |
ConAgra Foods Incorporated | | | | | | | | | | | 63,085 | | | | 2,047,739 | |
General Mills Incorporated | | | | | | | | | | | 60,613 | | | | 3,228,248 | |
Hormel Foods Corporation | | | | | | | | | | | 64,632 | | | | 1,986,788 | |
Ingredion Incorporated | | | | | | | | | | | 18,463 | | | | 2,286,089 | |
Kellogg Company | | | | | | | | | | | 32,413 | | | | 2,121,755 | |
McCormick & Company Incorporated | | | | | | | | | | | 22,673 | | | | 2,156,882 | |
Mondelez International Incorporated Class A | | | | | | | | | | | 178,010 | | | | 7,237,887 | |
Pinnacle Foods Incorporated | | | | | | | | | | | 36,582 | | | | 2,169,678 | |
The Hershey Company | | | | | | | | | | | 20,504 | | | | 2,151,280 | |
The J.M. Smucker Company | | | | | | | | | | | 18,860 | | | | 1,975,774 | |
The Kraft Heinz Company | | | | | | | | | | | 71,099 | | | | 5,741,245 | |
Tyson Foods Incorporated Class A | | | | | | | | | | | 36,995 | | | | 2,341,784 | |
| |
| | | | 42,640,434 | |
| | | | | | | | | | | | | | | | |
| | | | |
| Household Products: 2.19% | | | | | | | | | | | | | | | | |
Church & Dwight Company Incorporated | | | | | | | | | | | 46,967 | | | | 2,356,334 | |
Colgate-Palmolive Company | | | | | | | | | | | 107,915 | | | | 7,731,030 | |
Kimberly-Clark Corporation | | | | | | | | | | | 47,311 | | | | 5,832,973 | |
The Clorox Company | | | | | | | | | | | 18,781 | | | | 2,601,732 | |
The Procter & Gamble Company | | | | | | | | | | | 312,467 | | | | 28,831,330 | |
| |
| | | | 47,353,399 | |
| | | | | | | | | | | | | | | | |
| | | | |
| Personal Products: 0.23% | | | | | | | | | | | | | | | | |
Coty Incorporated Class A | | | | | | | | | | | 115,610 | | | | 1,916,814 | |
The Estee Lauder Companies Incorporated Class A | | | | | | | | | | | 28,690 | | | | 3,069,544 | |
| |
| | | | 4,986,358 | |
| | | | | | | | | | | | | | | | |
The accompanying notes are an integral part of these financial statements.
| | | | | | |
| Portfolio of investments—August 31, 2017 (unaudited) | | Wells Fargo Target Date Funds | | | 139 | |
FACTOR ENHANCED LARGE CAP PORTFOLIO
| | | | | | | | | | | | | | | | |
| Security name | | | | | | | | Shares | | | Value | |
| | | | |
| Tobacco: 1.78% | | | | | | | | | | | | | | | | |
Altria Group Incorporated | | | | | | | | | | | 246,690 | | | $ | 15,640,146 | |
Philip Morris International | | | | | | | | | | | 194,014 | | | | 22,686,057 | |
| |
| | | | 38,326,203 | |
| | | | | | | | | | | | | | | | |
| | | | |
Energy: 4.14% | | | | | | | | | | | | | | | | |
| | | | |
| Energy Equipment & Services: 0.11% | | | | | | | | | | | | | | | | |
Baker Hughes Incorporated | | | | | | | | | | | 306 | | | | 10,373 | |
National Oilwell Varco Incorporated | | | | | | | | | | | 74,056 | | | | 2,271,297 | |
| |
| | | | 2,281,670 | |
| | | | | | | | | | | | | | | | |
| | | | |
| Oil, Gas & Consumable Fuels: 4.03% | | | | | | | | | | | | | | | | |
Andeavor Corporation | | | | | | | | | | | 23,324 | | | | 2,335,899 | |
Chevron Corporation | | | | | | | | | | | 240,089 | | | | 25,838,379 | |
Exxon Mobil Corporation | | | | | | | | | | | 550,586 | | | | 42,026,230 | |
Marathon Petroleum Corporation | | | | | | | | | | | 72,854 | | | | 3,821,192 | |
ONEOK Incorporated | | | | | | | | | | | 42,959 | | | | 2,326,659 | |
Phillips 66 Company | | | | | | | | | | | 56,646 | | | | 4,747,501 | |
Targa Resources Corporation | | | | | | | | | | | 50,500 | | | | 2,250,785 | |
Valero Energy Corporation | | | | | | | | | | | 55,594 | | | | 3,785,952 | |
| |
| | | | 87,132,597 | |
| | | | | | | | | | | | | | | | |
| | | | |
Financials: 8.07% | | | | | | | | | | | | | | | | |
| | | | |
| Banks: 1.94% | | | | | | | | | | | | | | | | |
Associated Banc-Corp | | | | | | | | | | | 105,697 | | | | 2,314,764 | |
Bank of Hawaii Corporation | | | | | | | | | | | 122 | | | | 9,532 | |
BB&T Corporation | | | | | | | | | | | 117,547 | | | | 5,417,741 | |
CIT Group Incorporated | | | | | | | | | | | 43,585 | | | | 1,954,787 | |
Citizens Financial Group Incorporated | | | | | | | | | | | 99,260 | | | | 3,288,484 | |
Fifth Third Bancorp | | | | | | | | | | | 126,846 | | | | 3,314,486 | |
Fulton Financial Corporation | | | | | | | | | | | 123,425 | | | | 2,153,766 | |
Hancock Holding Company | | | | | | | | | | | 47,487 | | | | 2,087,054 | |
M&T Bank Corporation | | | | | | | | | | | 20,909 | | | | 3,091,605 | |
PNC Financial Services Group Incorporated | | | | | | | | | | | 64,676 | | | | 8,111,017 | |
Synovus Financial Corporation | | | | | | | | | | | 233 | | | | 9,814 | |
US Bancorp | | | | | | | | | | | 197,683 | | | | 10,131,254 | |
Wintrust Financial Corporation | | | | | | | | | | | 130 | | | | 9,465 | |
| |
| | | | 41,893,769 | |
| | | | | | | | | | | | | | | | |
| | | | |
| Capital Markets: 1.55% | | | | | | | | | | | | | | | | |
CBOE Holdings Incorporated | | | | | | | | | | | 20,940 | | | | 2,112,637 | |
CME Group Incorporated | | | | | | | | | | | 43,425 | | | | 5,462,865 | |
Franklin Resources Incorporated | | | | | | | | | | | 56,267 | | | | 2,432,422 | |
Intercontinental Exchange Incorporated | | | | | | | | | | | 69,387 | | | | 4,487,257 | |
Market Axess Holdings Incorporated | | | | | | | | | | | 10,666 | | | | 2,058,005 | |
Moody’s Corporation | | | | | | | | | | | 20,443 | | | | 2,739,975 | |
MSCI Incorporated | | | | | | | | | | | 18,287 | | | | 2,095,873 | |
Raymond James Financial Incorporated | | | | | | | | | | | 28,665 | | | | 2,245,043 | |
S&P Global Incorporated | | | | | | | | | | | 31,085 | | | | 4,797,348 | |
The accompanying notes are an integral part of these financial statements.
| | | | |
| 140 | | Wells Fargo Target Date Funds | | Portfolio of investments—August 31, 2017 (unaudited) |
FACTOR ENHANCED LARGE CAP PORTFOLIO
| | | | | | | | | | | | | | | | |
| Security name | | | | | | | | Shares | | | Value | |
| | | | |
| Capital Markets (continued) | | | | | | | | | | | | | | | | |
SEI Investments Company | | | | | | | | | | | 36,292 | | | $ | 2,121,630 | |
T. Rowe Price Group Incorporated | | | | | | | | | | | 35,166 | | | | 2,966,604 | |
| |
| | | | 33,519,659 | |
| | | | | | | | | | | | | | | | |
| | | | |
| Consumer Finance: 0.78% | | | | | | | | | | | | | | | | |
Ally Financial Incorporated | | | | | | | | | | | 102,363 | | | | 2,313,404 | |
American Express Company | | | | | | | | | | | 91,618 | | | | 7,888,310 | |
Discover Financial Services | | | | | | | | | | | 54,841 | | | | 3,232,877 | |
Synchrony Financial | | | | | | | | | | | 112,900 | | | | 3,476,191 | |
| |
| | | | 16,910,782 | |
| | | | | | | | | | | | | | | | |
| | | | |
| Diversified Financial Services: 1.23% | | | | | | | | | | | | | | | | |
Berkshire Hathaway Incorporated Class B † | | | | | | | | | | | 147,108 | | | | 26,650,085 | |
| | | | | | | | | | | | | | | | |
| | | | |
| Insurance: 2.47% | | | | | | | | | | | | | | | | |
AFLAC Incorporated | | | | | | | | | | | 28,574 | | | | 2,358,784 | |
Alleghany Corporation † | | | | | | | | | | | 5,041 | | | | 2,836,923 | |
American Financial Group Incorporated | | | | | | | | | | | 21,445 | | | | 2,183,316 | |
Aon plc | | | | | | | | | | | 27,849 | | | | 3,875,467 | |
Arch Capital Group Limited † | | | | | | | | | | | 23,051 | | | | 2,243,784 | |
Arthur J. Gallagher & Company | | | | | | | | | | | 40,637 | | | | 2,352,882 | |
Axis Capital Holdings Limited | | | | | | | | | | | 42,073 | | | | 2,534,477 | |
Cincinnati Financial Corporation | | | | | | | | | | | 33,254 | | | | 2,555,237 | |
Everest Reinsurance Group Limited | | | | | | | | | | | 8,300 | | | | 2,095,584 | |
Loews Corporation | | | | | | | | | | | 58,823 | | | | 2,739,975 | |
Markel Corporation † | | | | | | | | | | | 2,267 | | | | 2,384,867 | |
Marsh & McLennan Companies Incorporated | | | | | | | | | | | 62,583 | | | | 4,886,481 | |
ProAssurance Corporation | | | | | | | | | | | 169 | | | | 8,999 | |
Reinsurance Group of America Incorporated | | | | | | | | | | | 20,051 | | | | 2,695,857 | |
The Allstate Corporation | | | | | | | | | | | 40,142 | | | | 3,632,851 | |
The Progressive Corporation | | | | | | | | | | | 69,636 | | | | 3,236,681 | |
The Travelers Companies Incorporated | | | | | | | | | | | 30,232 | | | | 3,663,514 | |
Torchmark Corporation | | | | | | | | | | | 28,723 | | | | 2,210,809 | |
Unum Group | | | | | | | | | | | 50,378 | | | | 2,427,212 | |
Willis Towers Watson plc | | | | | | | | | | | 16,274 | | | | 2,416,201 | |
| |
| | | | 53,339,901 | |
| | | | | | | | | | | | | | | | |
| | | | |
| Mortgage REITs: 0.10% | | | | | | | | | | | | | | | | |
Annaly Capital Management Incorporated | | | | | | | | | | | 178,706 | | | | 2,233,825 | |
| | | | | | | | | | | | | | | | |
| | | | |
Health Care: 15.85% | | | | | | | | | | | | | | | | |
| | | | |
| Biotechnology: 1.72% | | | | | | | | | | | | | | | | |
AbbVie Incorporated | | | | | | | | | | | 199,712 | | | | 15,038,314 | |
Biogen Incorporated | | | | | | | | | | | 27,238 | | | | 8,622,460 | |
Gilead Sciences Incorporated | | | | | | | | | | | 160,920 | | | | 13,470,613 | |
| |
| | | | 37,131,387 | |
| | | | | | | | | | | | | | | | |
The accompanying notes are an integral part of these financial statements.
| | | | | | |
| Portfolio of investments—August 31, 2017 (unaudited) | | Wells Fargo Target Date Funds | | | 141 | |
FACTOR ENHANCED LARGE CAP PORTFOLIO
| | | | | | | | | | | | | | | | |
| Security name | | | | | | | | Shares | | | Value | |
| | | | |
| Health Care Equipment & Supplies: 3.76% | | | | | | | | | | | | | | | | |
Abbott Laboratories | | | | | | | | | | | 217,944 | | | $ | 11,102,067 | |
Align Technology Incorporated † | | | | | | | | | | | 12,481 | | | | 2,205,891 | |
Baxter International Incorporated | | | | | | | | | | | 65,079 | | | | 4,037,501 | |
Becton Dickinson & Company | | | | | | | | | | | 25,658 | | | | 5,117,232 | |
Boston Scientific Corporation † | | | | | | | | | | | 173,325 | | | | 4,775,104 | |
C.R. Bard Incorporated | | | | | | | | | | | 7,519 | | | | 2,412,170 | |
Danaher Corporation | | | | | | | | | | | 76,859 | | | | 6,411,577 | |
Dentsply Sirona Incorporated | | | | | | | | | | | 37,882 | | | | 2,142,985 | |
Edwards Lifesciences Corporation † | | | | | | | | | | | 26,615 | | | | 3,025,061 | |
Hologic Incorporated † | | | | | | | | | | | 51,157 | | | | 1,974,660 | |
IDEXX Laboratories Incorporated † | | | | | | | | | | | 14,275 | | | | 2,218,764 | |
Intuitive Surgical Incorporated † | | | | | | | | | | | 4,423 | | | | 4,443,650 | |
Medtronic plc | | | | | | | | | | | 168,224 | | | | 13,562,219 | |
ResMed Incorporated | | | | | | | | | | | 28,755 | | | | 2,230,813 | |
Stryker Corporation | | | | | | | | | | | 39,071 | | | | 5,523,467 | |
Teleflex Incorporated | | | | | | | | | | | 10,562 | | | | 2,236,503 | |
The Cooper Companies Incorporated | | | | | | | | | | | 9,219 | | | | 2,312,402 | |
Varian Medical Systems Incorporated | | | | | | | | | | | 21,120 | | | | 2,244,001 | |
West Pharmaceutical Services Incorporated | | | | | | | | | | | 104 | | | | 9,052 | |
Zimmer Biomet Holdings Incorporated | | | | | | | | | | | 28,167 | | | | 3,218,643 | |
| |
| | | | 81,203,762 | |
| | | | | | | | | | | | | | | | |
| | | | |
| Health Care Providers & Services: 3.51% | | | | | | | | | | | | | | | | |
Aetna Incorporated | | | | | | | | | | | 38,519 | | | | 6,074,446 | |
AmerisourceBergen Corporation | | | | | | | | | | | 26,751 | | | | 2,146,768 | |
Anthem Incorporated | | | | | | | | | | | 33,892 | | | | 6,644,188 | |
Cardinal Health Incorporated | | | | | | | | | | | 44,081 | | | | 2,973,704 | |
Centene Corporation † | | | | | | | | | | | 23,979 | | | | 2,130,534 | |
Cigna Corporation | | | | | | | | | | | 30,830 | | | | 5,612,910 | |
DaVita HealthCare Partners Incorporated † | | | | | | | | | | | 34,230 | | | | 2,004,509 | |
Express Scripts Holding Company † | | | | | | | | | | | 76,677 | | | | 4,816,849 | |
HCA Holdings Incorporated † | | | | | | | | | | | 40,034 | | | | 3,149,074 | |
Henry Schein Incorporated † | | | | | | | | | | | 13,215 | | | | 2,295,181 | |
Humana Incorporated | | | | | | | | | | | 16,549 | | | | 4,263,352 | |
Laboratory Corporation of America Holdings † | | | | | | | | | | | 16,096 | | | | 2,524,980 | |
McKesson Corporation | | | | | | | | | | | 26,616 | | | | 3,974,035 | |
Quest Diagnostics Incorporated | | | | | | | | | | | 21,100 | | | | 2,286,185 | |
UnitedHealth Group Incorporated | | | | | | | | | | | 114,934 | | | | 22,860,373 | |
WellCare Health Plans Incorporated † | | | | | | | | | | | 12,034 | | | | 2,102,099 | |
| |
| | | | 75,859,187 | |
| | | | | | | | | | | | | | | | |
| | | | |
| Health Care Technology: 0.12% | | | | | | | | | | | | | | | | |
Cerner Corporation † | | | | | | | | | | | 39,934 | | | | 2,706,726 | |
| | | | | | | | | | | | | | | | |
| | | | |
| Life Sciences Tools & Services: 1.00% | | | | | | | | | | | | | | | | |
Agilent Technologies Incorporated | | | | | | | | | | | 46,408 | | | | 3,003,526 | |
Charles River Laboratories International Incorporated † | | | | | | | | | | | 108 | | | | 11,750 | |
Mettler-Toledo International Incorporated † | | | | | | | | | | | 3,907 | | | | 2,364,087 | |
PerkinElmer Incorporated | | | | | | | | | | | 31,959 | | | | 2,140,933 | |
The accompanying notes are an integral part of these financial statements.
| | | | |
| 142 | | Wells Fargo Target Date Funds | | Portfolio of investments—August 31, 2017 (unaudited) |
FACTOR ENHANCED LARGE CAP PORTFOLIO
| | | | | | | | | | | | | | | | |
| Security name | | | | | | | | Shares | | | Value | |
| | | | |
| Life Sciences Tools & Services (continued) | | | | | | | | | | | | | | | | |
Quintiles Transnational Holdings Incorporated † | | | | | | | | | | | 23,995 | | | $ | 2,304,239 | |
Thermo Fisher Scientific Incorporated | | | | | | | | | | | 50,355 | | | | 9,423,435 | |
Waters Corporation † | | | | | | | | | | | 12,569 | | | | 2,306,160 | |
| |
| | | | 21,554,130 | |
| | | | | | | | | | | | | | | | |
| | | | |
| Pharmaceuticals: 5.74% | | | | | | | | | | | | | | | | |
Bristol-Myers Squibb Company | | | | | | | | | | | 211,430 | | | | 12,787,286 | |
Eli Lilly & Company | | | | | | | | | | | 127,064 | | | | 10,329,033 | |
Johnson & Johnson | | | | | | | | | | | 340,393 | | | | 45,057,822 | |
Merck & Company Incorporated | | | | | | | | | | | 344,324 | | | | 21,988,531 | |
Mylan NV † | | | | | | | | | | | 72,841 | | | | 2,293,035 | |
Perrigo Company plc | | | | | | | | | | | 29,380 | | | | 2,319,845 | |
Pfizer Incorporated | | | | | | | | | | | 744,311 | | | | 25,247,029 | |
Zoetis Incorporated | | | | | | | | | | | 66,372 | | | | 4,161,524 | |
| |
| | | | 124,184,105 | |
| | | | | | | | | | | | | | | | |
| | | | |
Industrials: 11.80% | | | | | | | | | | | | | | | | |
| | | | |
| Aerospace & Defense: 3.12% | | | | | | | | | | | | | | | | |
General Dynamics Corporation | | | | | | | | | | | 34,207 | | | | 6,887,580 | |
Huntington Ingalls Industries Incorporated | | | | | | | | | | | 10,033 | | | | 2,146,661 | |
L-3 Technologies Incorporated | | | | | | | | | | | 11,629 | | | | 2,110,431 | |
Lockheed Martin Corporation | | | | | | | | | | | 28,485 | | | | 8,699,034 | |
Northrop Grumman Corporation | | | | | | | | | | | 21,415 | | | | 5,829,378 | |
Raytheon Company | | | | | | | | | | | 35,790 | | | | 6,514,138 | |
Rockwell Collins Incorporated | | | | | | | | | | | 20,621 | | | | 2,702,382 | |
Spirit AeroSystems Holdings Incorporated Class A | | | | | | | | | | | 176 | | | | 13,112 | |
Teledyne Technologies Incorporated † | | | | | | | | | | | 17,519 | | | | 2,628,901 | |
Textron Incorporated | | | | | | | | | | | 46,973 | | | | 2,305,905 | |
The Boeing Company | | | | | | | | | | | 71,389 | | | | 17,109,088 | |
United Technologies Corporation | | | | | | | | | | | 87,438 | | | | 10,468,077 | |
| |
| | | | 67,414,687 | |
| | | | | | | | | | | | | | | | |
| | | | |
| Air Freight & Logistics: 0.93% | | | | | | | | | | | | | | | | |
C.H. Robinson Worldwide Incorporated | | | | | | | | | | | 31,711 | | | | 2,239,748 | |
Expeditors International of Washington Incorporated | | | | | | | | | | | 38,310 | | | | 2,149,191 | |
FedEx Corporation | | | | | | | | | | | 30,530 | | | | 6,545,021 | |
United Parcel Service Incorporated Class B | | | | | | | | | | | 80,863 | | | | 9,247,493 | |
| |
| | | | 20,181,453 | |
| | | | | | | | | | | | | | | | |
| | | | |
| Airlines: 0.53% | | | | | | | | | | | | | | | | |
Alaska Air Group Incorporated | | | | | | | | | | | 23,890 | | | | 1,783,627 | |
American Airlines Group Incorporated | | | | | | | | | | | 55,414 | | | | 2,479,222 | |
JetBlue Airways Corporation † | | | | | | | | | | | 94,801 | | | | 1,878,008 | |
Southwest Airlines Company | | | | | | | | | | | 60,523 | | | | 3,155,669 | |
United Continental Holdings Incorporated † | | | | | | | | | | | 36,370 | | | | 2,253,485 | |
| |
| | | | 11,550,011 | |
| | | | | | | | | | | | | | | | |
The accompanying notes are an integral part of these financial statements.
| | | | | | |
| Portfolio of investments—August 31, 2017 (unaudited) | | Wells Fargo Target Date Funds | | | 143 | |
FACTOR ENHANCED LARGE CAP PORTFOLIO
| | | | | | | | | | | | | | | | |
| Security name | | | | | | | | Shares | | | Value | |
| | | | |
| Building Products: 0.71% | | | | | | | | | | | | | | | | |
A.O. Smith Corporation | | | | | | | | | | | 38,367 | | | $ | 2,136,658 | |
Allegion plc | | | | | | | | | | | 26,422 | | | | 2,079,676 | |
Fortune Brands Home & Security Incorporated | | | | | | | | | | | 33,342 | | | | 2,084,875 | |
Johnson Controls International plc | | | | | | | | | | | 121,282 | | | | 4,801,554 | |
Masco Corporation | | | | | | | | | | | 57,163 | | | | 2,101,884 | |
Owens Corning Incorporated | | | | | | | | | | | 29,315 | | | | 2,173,121 | |
| |
| | | | 15,377,768 | |
| | | | | | | | | | | | | | | | |
| | | | |
| Commercial Services & Supplies: 0.54% | | | | | | | | | | | | | | | | |
Cintas Corporation | | | | | | | | | | | 15,921 | | | | 2,149,494 | |
Deluxe Corporation | | | | | | | | | | | 33,579 | | | | 2,328,704 | |
Republic Services Incorporated | | | | | | | | | | | 44,799 | | | | 2,922,687 | |
Stericycle Incorporated † | | | | | | | | | | | 120 | | | | 8,627 | |
Waste Management Incorporated | | | | | | | | | | | 55,227 | | | | 4,258,554 | |
| |
| | | | 11,668,066 | |
| | | | | | | | | | | | | | | | |
| | | | |
| Construction & Engineering: 0.20% | | | | | | | | | | | | | | | | |
Fluor Corporation | | | | | | | | | | | 52,987 | | | | 2,043,709 | |
Jacobs Engineering Group Incorporated | | | | | | | | | | | 41,071 | | | | 2,237,959 | |
| |
| | | | 4,281,668 | |
| | | | | | | | | | | | | | | | |
| | | | |
| Electrical Equipment: 0.78% | | | | | | | | | | | | | | | | |
AMETEK Incorporated | | | | | | | | | | | 35,981 | | | | 2,275,798 | |
Eaton Corporation plc | | | | | | | | | | | 61,307 | | | | 4,399,390 | |
Emerson Electric Company | | | | | | | | | | | 83,128 | | | | 4,907,877 | |
Regal-Beloit Corporation | | | | | | | | | | | 123 | | | | 9,274 | |
Rockwell Automation Incorporated | | | | | | | | | | | 17,932 | | | | 2,941,924 | |
Sensata Technologies Holding NV † | | | | | | | | | | | 50,145 | | | | 2,239,476 | |
| |
| | | | 16,773,739 | |
| | | | | | | | | | | | | | | | |
| | | | |
| Industrial Conglomerates: 1.43% | | | | | | | | | | | | | | | | |
3M Company | | | | | | | | | | | 72,159 | | | | 14,743,527 | |
Honeywell International Incorporated | | | | | | | | | | | 91,260 | | | | 12,618,520 | |
Roper Industries Incorporated | | | | | | | | | | | 15,554 | | | | 3,587,686 | |
| |
| | | | 30,949,733 | |
| | | | | | | | | | | | | | | | |
| | | | |
| Machinery: 1.73% | | | | | | | | | | | | | | | | |
Allison Transmission Holdings Incorporated | | | | | | | | | | | 269 | | | | 9,342 | |
Cummins Incorporated | | | | | | | | | | | 24,457 | | | | 3,897,957 | |
Deere & Company | | | | | | | | | | | 43,506 | | | | 5,043,651 | |
Donaldson Company Incorporated | | | | | | | | | | | 47,821 | | | | 2,259,542 | |
Dover Corporation | | | | | | | | | | | 25,586 | | | | 2,171,740 | |
Fortive Corporation | | | | | | | | | | | 37,075 | | | | 2,408,763 | |
IDEX Corporation | | | | | | | | | | | 19,217 | | | | 2,259,535 | |
Illinois Tool Works Incorporated | | | | | | | | | | | 31,904 | | | | 4,387,119 | |
Ingersoll-Rand plc | | | | | | | | | | | 35,349 | | | | 3,018,451 | |
Parker-Hannifin Corporation | | | | | | | | | | | 18,585 | | | | 2,990,141 | |
Snap-on Incorporated | | | | | | | | | | | 13,888 | | | | 2,049,452 | |
The accompanying notes are an integral part of these financial statements.
| | | | |
| 144 | | Wells Fargo Target Date Funds | | Portfolio of investments—August 31, 2017 (unaudited) |
FACTOR ENHANCED LARGE CAP PORTFOLIO
| | | | | | | | | | | | | | | | |
| Security name | | | | | | | | Shares | | | Value | |
| | | | |
| Machinery (continued) | | | | | | | | | | | | | | | | |
Stanley Black & Decker Incorporated | | | | | | | | | | | 18,825 | | | $ | 2,710,800 | |
The Toro Company | | | | | | | | | | | 33,903 | | | | 2,091,137 | |
Xylem Incorporated | | | | | | | | | | | 34,038 | | | | 2,112,739 | |
| |
| | | | 37,410,369 | |
| | | | | | | | | | | | | | | | |
| | | | |
| Professional Services: 0.55% | | | | | | | | | | | | | | | | |
Equifax Incorporated | | | | | | | | | | | 18,544 | | | | 2,641,964 | |
IHS Markit Limited † | | | | | | | | | | | 49,482 | | | | 2,317,737 | |
Manpower Incorporated | | | | | | | | | | | 19,286 | | | | 2,150,582 | |
Nielsen Holdings plc | | | | | | | | | | | 61,617 | | | | 2,393,820 | |
Robert Half International Incorporated | | | | | | | | | | | 215 | | | | 9,740 | |
Verisk Analytics Incorporated † | | | | | | | | | | | 28,027 | | | | 2,271,588 | |
| |
| | | | 11,785,431 | |
| | | | | | | | | | | | | | | | |
| | | | |
| Road & Rail: 1.08% | | | | | | | | | | | | | | | | |
CSX Corporation | | | | | | | | | | | 112,824 | | | | 5,663,765 | |
J.B. Hunt Transport Services Incorporated | | | | | | | | | | | 20,992 | | | | 2,075,899 | |
Norfolk Southern Corporation | | | | | | | | | | | 40,966 | | | | 4,937,223 | |
Union Pacific Corporation | | | | | | | | | | | 102,314 | | | | 10,773,664 | |
| |
| | | | 23,450,551 | |
| | | | | | | | | | | | | | | | |
| | | | |
| Trading Companies & Distributors: 0.20% | | | | | | | | | | | | | | | | |
Fastenal Company | | | | | | | | | | | 56,146 | | | | 2,395,750 | |
HD Supply Holdings Incorporated † | | | | | | | | | | | 239 | | | | 7,959 | |
W.W. Grainger Incorporated | | | | | | | | | | | 11,916 | | | | 1,937,184 | |
| |
| | | | 4,340,893 | |
| | | | | | | | | | | | | | | | |
| | | | |
Information Technology: 14.83% | | | | | | | | | | | | | | | | |
| | | | |
| Communications Equipment: 1.42% | | | | | | | | | | | | | | | | |
Cisco Systems Incorporated | | | | | | | | | | | 621,051 | | | | 20,004,053 | |
CommScope Holdings Incorporated † | | | | | | | | | | | 57,717 | | | | 1,908,124 | |
F5 Networks Incorporated † | | | | | | | | | | | 16,915 | | | | 2,019,313 | |
Harris Corporation | | | | | | | | | | | 19,729 | | | | 2,424,694 | |
Juniper Networks Incorporated | | | | | | | | | | | 77,356 | | | | 2,145,082 | |
Motorola Solutions Incorporated | | | | | | | | | | | 25,095 | | | | 2,211,371 | |
| |
| | | | 30,712,637 | |
| | | | | | | | | | | | | | | | |
| | | | |
| Electronic Equipment, Instruments & Components: 0.64% | | | | | | | | | | | | | | | | |
Amphenol Corporation Class A | | | | | | | | | | | 45,137 | | | | 3,653,389 | |
Arrow Electronics Incorporated † | | | | | | | | | | | 29,186 | | | | 2,318,244 | |
CDW Corporation of Delaware | | | | | | | | | | | 34,622 | | | | 2,195,727 | |
Corning Incorporated | | | | | | | | | | | 117,687 | | | | 3,384,678 | |
Keysight Technologies Incorporated † | | | | | | | | | | | 56,058 | | | | 2,290,530 | |
National Instruments Corporation | | | | | | | | | | | 256 | | | | 10,340 | |
| |
| | | | 13,852,908 | |
| | | | | | | | | | | | | | | | |
| | | | |
| Internet Software & Services: 3.75% | | | | | | | | | | | | | | | | |
Akamai Technologies Incorporated † | | | | | | | | | | | 42,808 | | | | 2,018,397 | |
Alphabet Incorporated Class A † | | | | | | | | | | | 36,657 | | | | 35,016,242 | |
The accompanying notes are an integral part of these financial statements.
| | | | | | |
| Portfolio of investments—August 31, 2017 (unaudited) | | Wells Fargo Target Date Funds | | | 145 | |
FACTOR ENHANCED LARGE CAP PORTFOLIO
| | | | | | | | | | | | | | | | |
| Security name | | | | | | | | Shares | | | Value | |
| | | | |
| Internet Software & Services (continued) | | | | | | | | | | | | | | | | |
Alphabet Incorporated Class C † | | | | | | | | | | | 37,354 | | | $ | 35,087,731 | |
eBay Incorporated † | | | | | | | | | | | 124,825 | | | | 4,509,927 | |
IAC/InterActive Corp † | | | | | | | | | | | 21,394 | | | | 2,428,433 | |
VeriSign Incorporated † | | | | | | | | | | | 20,385 | | | | 2,114,944 | |
| |
| | | | 81,175,674 | |
| | | | | | | | | | | | | | | | |
| | | | |
| IT Services: 3.60% | | | | | | | | | | | | | | | | |
Accenture plc Class A | | | | | | | | | | | 76,759 | | | | 10,037,007 | |
Alliance Data Systems Corporation | | | | | | | | | | | 8,884 | | | | 2,003,342 | |
Amdocs Limited | | | | | | | | | | | 33,716 | | | | 2,184,460 | |
Automatic Data Processing Incorporated | | | | | | | | | | | 53,445 | | | | 5,690,289 | |
Broadridge Financial Solutions Incorporated | | | | | | | | | | | 29,797 | | | | 2,328,040 | |
Cognizant Technology Solutions Corporation Class A | | | | | | | | | | | 75,760 | | | | 5,361,535 | |
DXC Technology Company | | | | | | | | | | | 38,863 | | | | 3,303,355 | |
Fidelity National Information Services Incorporated | | | | | | | | | | | 40,994 | | | | 3,809,162 | |
Fiserv Incorporated † | | | | | | | | | | | 25,956 | | | | 3,211,017 | |
Gartner Incorporated † | | | | | | | | | | | 17,531 | | | | 2,114,063 | |
International Business Machines Corporation | | | | | | | | | | | 107,005 | | | | 15,304,925 | |
Jack Henry & Associates Incorporated | | | | | | | | | | | 22,004 | | | | 2,267,952 | |
Leidos Holdings Incorporated | | | | | | | | | | | 37,276 | | | | 2,173,936 | |
Paychex Incorporated | | | | | | | | | | | 46,777 | | | | 2,667,692 | |
PayPal Holdings Incorporated † | | | | | | | | | | | 142,004 | | | | 8,758,806 | |
The Western Union Company | | | | | | | | | | | 116,876 | | | | 2,211,294 | |
Total System Services Incorporated | | | | | | | | | | | 32,404 | | | | 2,239,764 | |
Vantiv Incorporated Class A † | | | | | | | | | | | 29,633 | | | | 2,094,757 | |
| |
| | | | 77,761,396 | |
| | | | | | | | | | | | | | | | |
| | | | |
| Semiconductors & Semiconductor Equipment: 2.41% | | | | | | | | | | | | | | | | |
Advanced Micro Devices Incorporated † | | | | | | | | | | | 166,424 | | | | 2,163,512 | |
Applied Materials Incorporated | | | | | | | | | | | 128,597 | | | | 5,802,297 | |
Intel Corporation | | | | | | | | | | | 569,536 | | | | 19,973,628 | |
KLA-Tencor Corporation | | | | | | | | | | | 25,282 | | | | 2,368,670 | |
Lam Research Corporation | | | | | | | | | | | 20,284 | | | | 3,366,738 | |
Microchip Technology Incorporated | | | | | | | | | | | 26,509 | | | | 2,300,982 | |
MKS Instruments Incorporated | | | | | | | | | | | 26,909 | | | | 2,215,956 | |
ON Semiconductor Corporation † | | | | | | | | | | | 133,543 | | | | 2,280,914 | |
Teradyne Incorporated | | | | | | | | | | | 287 | | | | 10,220 | |
Texas Instruments Incorporated | | | | | | | | | | | 114,290 | | | | 9,465,498 | |
Xilinx Incorporated | | | | | | | | | | | 33,904 | | | | 2,239,698 | |
| |
| | | | 52,188,113 | |
| | | | | | | | | | | | | | | | |
| | | | |
| Software: 2.44% | | | | | | | | | | | | | | | | |
Activision Blizzard Incorporated | | | | | | | | | | | 90,985 | | | | 5,964,977 | |
Ansys Incorporated † | | | | | | | | | | | 16,289 | | | | 2,098,349 | |
CA Incorporated | | | | | | | | | | | 63,265 | | | | 2,099,133 | |
Cadence Design Systems Incorporated † | | | | | | | | | | | 57,490 | | | | 2,258,782 | |
CDK Global Incorporated | | | | | | | | | | | 35,313 | | | | 2,277,688 | |
Citrix Systems Incorporated | | | | | | | | | | | 27,630 | | | | 2,160,942 | |
Electronic Arts Incorporated † | | | | | | | | | | | 36,741 | | | | 4,464,032 | |
Intuit Incorporated | | | | | | | | | | | 28,195 | | | | 3,988,183 | |
The accompanying notes are an integral part of these financial statements.
| | | | |
| 146 | | Wells Fargo Target Date Funds | | Portfolio of investments—August 31, 2017 (unaudited) |
FACTOR ENHANCED LARGE CAP PORTFOLIO
| | | | | | | | | | | | | | | | |
| Security name | | | | | | | | Shares | | | Value | |
| | | | |
| Software (continued) | | | | | | | | | | | | | | | | |
Oracle Corporation | | | | | | | | | | | 364,152 | | | $ | 18,327,770 | |
PTC Incorporated † | | | | | | | | | | | 39,105 | | | | 2,189,880 | |
Symantec Corporation | | | | | | | | | | | 84,179 | | | | 2,523,686 | |
Synopsys Incorporated † | | | | | | | | | | | 26,368 | | | | 2,120,515 | |
Take-Two Interactive Software Incorporated † | | | | | | | | | | | 22,702 | | | | 2,220,029 | |
| |
| | | | 52,693,966 | |
| | | | | | | | | | | | | | | | |
| | | | |
| Technology Hardware, Storage & Peripherals: 0.57% | | | | | | | | | | | | | | | | |
Hewlett Packard Enterprise Company | | | | | | | | | | | 218,822 | | | | 3,951,925 | |
HP Incorporated | | | | | | | | | | | 230,243 | | | | 4,393,036 | |
NetApp Incorporated | | | | | | | | | | | 55,326 | | | | 2,138,903 | |
Seagate Technology plc | | | | | | | | | | | 56,211 | | | | 1,772,333 | |
| |
| | | | 12,256,197 | |
| | | | | | | | | | | | | | | | |
| | | | |
Materials: 4.21% | | | | | | | | | | | | | | | | |
| | | | |
| Chemicals: 3.05% | | | | | | | | | | | | | | | | |
Air Products & Chemicals Incorporated | | | | | | | | | | | 26,887 | | | | 3,908,563 | |
Axalta Coating Systems Limited † | | | | | | | | | | | 67,979 | | | | 2,006,740 | |
Celanese Corporation Series A | | | | | | | | | | | 23,212 | | | | 2,252,028 | |
E.I. du Pont de Nemours & Company | | | | | | | | | | | 112,220 | | | | 9,418,624 | |
Eastman Chemical Company | | | | | | | | | | | 27,417 | | | | 2,363,345 | |
Ecolab Incorporated | | | | | | | | | | | 28,702 | | | | 3,825,977 | |
FMC Corporation | | | | | | | | | | | 25,408 | | | | 2,190,678 | |
International Flavors & Fragrances Incorporated | | | | | | | | | | | 16,348 | | | | 2,237,224 | |
LyondellBasell Industries NV Class A | | | | | | | | | | | 43,145 | | | | 3,908,506 | |
Monsanto Company | | | | | | | | | | | 50,576 | | | | 5,927,507 | |
PPG Industries Incorporated | | | | | | | | | | | 32,004 | | | | 3,338,657 | |
Praxair Incorporated | | | | | | | | | | | 35,000 | | | | 4,603,900 | |
RPM International Incorporated | | | | | | | | | | | 44,629 | | | | 2,185,482 | |
The Chemours Company | | | | | | | | | | | 45,312 | | | | 2,223,460 | |
The Dow Chemical Company | | | | | | | | | | | 151,756 | | | | 10,114,537 | |
The Mosaic Company | | | | | | | | | | | 95,322 | | | | 1,904,534 | |
The Sherwin-Williams Company | | | | | | | | | | | 10,262 | | | | 3,481,589 | |
| |
| | | | 65,891,351 | |
| | | | | | | | | | | | | | | | |
| | | | |
| Construction Materials: 0.11% | | | | | | | | | | | | | | | | |
Martin Marietta Materials Incorporated | | | | | | | | | | | 11,432 | | | | 2,423,470 | |
| | | | | | | | | | | | | | | | |
| | | | |
| Containers & Packaging: 0.65% | | | | | | | | | | | | | | | | |
AptarGroup Incorporated | | | | | | | | | | | 119 | | | | 9,950 | |
Ball Corporation | | | | | | | | | | | 51,378 | | | | 2,054,606 | |
Berry Plastics Group Incorporated † | | | | | | | | | | | 176 | | | | 9,898 | |
Crown Holdings Incorporated † | | | | | | | | | | | 36,439 | | | | 2,150,994 | |
International Paper Company | | | | | | | | | | | 57,597 | | | | 3,102,750 | |
Packaging Corporation of America | | | | | | | | | | | 19,618 | | | | 2,205,259 | |
Sealed Air Corporation | | | | | | | | | | | 48,427 | | | | 2,149,190 | |
Sonoco Products Company | | | | | | | | | | | 201 | | | | 9,700 | |
WestRock Company | | | | | | | | | | | 40,464 | | | | 2,302,806 | |
| |
| | | | 13,995,153 | |
| | | | | | | | | | | | | | | | |
The accompanying notes are an integral part of these financial statements.
| | | | | | |
| Portfolio of investments—August 31, 2017 (unaudited) | | Wells Fargo Target Date Funds | | | 147 | |
FACTOR ENHANCED LARGE CAP PORTFOLIO
| | | | | | | | | | | | | | | | |
| Security name | | | | | | | | Shares | | | Value | |
| | | | |
| Metals & Mining: 0.40% | | | | | | | | | | | | | | | | |
Newmont Mining Corporation | | | | | | | | | | | 71,075 | | | $ | 2,725,016 | |
Nucor Corporation | | | | | | | | | | | 65,434 | | | | 3,606,068 | |
Steel Dynamics Incorporated | | | | | | | | | | | 70,204 | | | | 2,418,528 | |
| |
| | | | 8,749,612 | |
| | | | | | | | | | | | | | | | |
| | | | |
Real Estate: 5.46% | | | | | | | | | | | | | | | | |
| | | | |
| Equity REITs: 5.36% | | | | | | | | | | | | | | | | |
Acadia Realty Trust | | | | | | | | | | | 78,457 | | | | 2,250,931 | |
Alexandria Real Estate Equities Incorporated | | | | | | | | | | | 18,234 | | | | 2,211,967 | |
American Tower Corporation | | | | | | | | | | | 52,865 | | | | 7,826,663 | |
AvalonBay Communities Incorporated | | | | | | | | | | | 17,943 | | | | 3,368,438 | |
Boston Properties Incorporated | | | | | | | | | | | 22,967 | | | | 2,769,820 | |
Brixmor Property Group Incorporated | | | | | | | | | | | 140,976 | | | | 2,639,071 | |
Colony NorthStar Incorporated Class A | | | | | | | | | | | 717 | | | | 9,400 | |
Crown Castle International Corporation | | | | | | | | | | | 44,696 | | | | 4,846,834 | |
DDR Corporation | | | | | | | | | | | 1,072 | | | | 10,377 | |
Digital Realty Trust Incorporated | | | | | | | | | | | 23,221 | | | | 2,747,973 | |
Duke Realty Corporation | | | | | | | | | | | 78,929 | | | | 2,345,770 | |
EPR Properties | | | | | | | | | | | 38,790 | | | | 2,702,111 | |
Equinix Incorporated | | | | | | | | | | | 9,503 | | | | 4,451,300 | |
Equity Residential | | | | | | | | | | | 47,189 | | | | 3,168,741 | |
Essex Property Trust Incorporated | | | | | | | | | | | 9,424 | | | | 2,506,502 | |
Extra Space Storage Incorporated | | | | | | | | | | | 28,354 | | | | 2,201,121 | |
Federal Realty Investment Trust | | | | | | | | | | | 19,549 | | | | 2,481,354 | |
Gaming and Leisure Properties Incorporated | | | | | | | | | | | 277 | | | | 10,856 | |
GGP Incorporated | | | | | | | | | | | 125,793 | | | | 2,610,205 | |
HCP Incorporated | | | | | | | | | | | 77,980 | | | | 2,324,584 | |
Host Hotels & Resorts Incorporated | | | | | | | | | | | 130,285 | | | | 2,360,764 | |
Hudson Pacific Properties Incorporated | | | | | | | | | | | 287 | | | | 9,471 | |
Iron Mountain Incorporated | | | | | | | | | | | 56,799 | | | | 2,239,017 | |
JBG Smith Properties † | | | | | | | | | | | 16,759 | | | | 548,522 | |
Kilroy Realty Corporation | | | | | | | | | | | 135 | | | | 9,346 | |
Kimco Realty Corporation | | | | | | | | | | | 117,689 | | | | 2,309,058 | |
Liberty Property Trust | | | | | | | | | | | 56,664 | | | | 2,413,886 | |
Mid-America Apartment Communities Incorporated | | | | | | | | | | | 20,834 | | | | 2,217,988 | |
Paramount Group Incorporated | | | | | | | | | | | 631 | | | | 9,957 | |
Piedmont Office Realty Trust Incorporated Class A | | | | | | | | | | | 104,171 | | | | 2,109,463 | |
Prologis Incorporated | | | | | | | | | | | 68,696 | | | | 4,352,579 | |
Public Storage Incorporated | | | | | | | | | | | 19,097 | | | | 3,921,378 | |
Realty Income Corporation | | | | | | | | | | | 51,326 | | | | 2,954,325 | |
Regency Centers Corporation | | | | | | | | | | | 36,722 | | | | 2,361,959 | |
Retail Properties of America Incorporated Class A | | | | | | | | | | | 812 | | | | 10,824 | |
SBA Communications Corporation † | | | | | | | | | | | 15,348 | | | | 2,356,685 | |
Simon Property Group Incorporated | | | | | | | | | | | 41,590 | | | | 6,523,391 | |
SL Green Realty Corporation | | | | | | | | | | | 22,349 | | | | 2,153,997 | |
The Macerich Company | | | | | | | | | | | 52,061 | | | | 2,747,259 | |
UDR Incorporated | | | | | | | | | | | 56,448 | | | | 2,191,311 | |
Ventas Incorporated | | | | | | | | | | | 49,181 | | | | 3,365,948 | |
VEREIT Incorporated | | | | | | | | | | | 294,876 | | | | 2,488,753 | |
Vornado Realty Trust | | | | | | | | | | | 33,519 | | | | 2,496,830 | |
The accompanying notes are an integral part of these financial statements.
| | | | |
| 148 | | Wells Fargo Target Date Funds | | Portfolio of investments—August 31, 2017 (unaudited) |
FACTOR ENHANCED LARGE CAP PORTFOLIO
| | | | | | | | | | | | | | | | |
| Security name | | | | | | | | Shares | | | Value | |
|
| Equity REITs (continued) | |
Weingarten Realty Investors | | | | | | | | | | | 325 | | | $ | 10,413 | |
Welltower Incorporated | | | | | | | | | | | 50,248 | | | | 3,679,159 | |
Weyerhaeuser Company | | | | | | | | | | | 110,884 | | | | 3,615,927 | |
WP Carey Incorporated | | | | | | | | | | | 43,553 | | | | 2,998,624 | |
| |
| | | | 115,940,852 | |
| | | | | | | | | | | | | | | | |
| | | | |
| Real Estate Management & Development: 0.10% | | | | | | | | | | | | | | | | |
CBRE Group Incorporated Class A † | | | | | | | | | | | 59,316 | | | | 2,140,121 | |
| | | | | | | | | | | | | | | | |
| | | | |
Telecommunication Services: 2.74% | | | | | | | | | | | | | | | | |
| | | | |
| Diversified Telecommunication Services: 2.61% | | | | | | | | | | | | | | | | |
AT&T Incorporated | | | | | | | | | | | 785,093 | | | | 29,409,584 | |
CenturyLink Incorporated | | | | | | | | | | | 115,602 | | | | 2,279,671 | |
Verizon Communications Incorporated | | | | | | | | | | | 516,889 | | | | 24,795,166 | |
| |
| | | | 56,484,421 | |
| | | | | | | | | | | | | | | | |
| | | | |
| Wireless Telecommunication Services: 0.13% | | | | | | | | | | | | | | | | |
T-Mobile USA Incorporated † | | | | | | | | | | | 43,658 | | | | 2,825,109 | |
| | | | | | | | | | | | | | | | |
| | | | |
Utilities: 4.59% | | | | | | | | | | | | | | | | |
| | | | |
| Electric Utilities: 2.79% | | | | | | | | | | | | | | | | |
ALLETE Incorporated | | | | | | | | | | | 31,458 | | | | 2,432,647 | |
Alliant Energy Corporation | | | | | | | | | | | 67,956 | | | | 2,904,440 | |
American Electric Power Company Incorporated | | | | | | | | | | | 48,796 | | | | 3,592,849 | |
Duke Energy Corporation | | | | | | | | | | | 78,316 | | | | 6,836,987 | |
Edison International | | | | | | | | | | | 33,889 | | | | 2,717,220 | |
Entergy Corporation | | | | | | | | | | | 35,579 | | | | 2,816,789 | |
Eversource Energy | | | | | | | | | | | 43,678 | | | | 2,751,714 | |
Exelon Corporation | | | | | | | | | | | 118,826 | | | | 4,499,941 | |
FirstEnergy Corporation | | | | | | | | | | | 73,832 | | | | 2,405,447 | |
IDACORP Incorporated | | | | | | | | | | | 27,800 | | | | 2,473,644 | |
NextEra Energy Incorporated | | | | | | | | | | | 47,556 | | | | 7,157,653 | |
PG&E Corporation | | | | | | | | | | | 53,027 | | | | 3,732,040 | |
Pinnacle West Capital Corporation | | | | | | | | | | | 25,758 | | | | 2,317,447 | |
Portland General Electric Company | | | | | | | | | | | 55,509 | | | | 2,637,233 | |
PPL Corporation | | | | | | | | | | | 71,365 | | | | 2,800,363 | |
The Southern Company | | | | | | | | | | | 117,565 | | | | 5,673,687 | |
Xcel Energy Incorporated | | | | | | | | | | | 52,318 | | | | 2,589,741 | |
| |
| | | | 60,339,842 | |
| | | | | | | | | | | | | | | | |
| | | | |
| Gas Utilities: 0.10% | | | | | | | | | | | | | | | | |
ONE Gas Incorporated | | | | | | | | | | | 142 | | | | 10,684 | |
Spire Incorporated | | | | | | | | | | | 142 | | | | 10,863 | |
UGI Corporation | | | | | | | | | | | 44,517 | | | | 2,199,585 | |
| |
| | | | 2,221,132 | |
| | | | | | | | | | | | | | | | |
| | | | |
| Independent Power & Renewable Electricity Producers: 0.10% | | | | | | | | | | | | | | | | |
AES Corporation | | | | | | | | | | | 200,532 | | | | 2,213,873 | |
| | | | | | | | | | | | | | | | |
The accompanying notes are an integral part of these financial statements.
| | | | | | |
| Portfolio of investments—August 31, 2017 (unaudited) | | Wells Fargo Target Date Funds | | | 149 | |
FACTOR ENHANCED LARGE CAP PORTFOLIO
| | | | | | | | | | | | | | | | |
| Security name | | | | | | | | Shares | | | Value | |
| | | | |
| Multi-Utilities: 1.50% | | | | | | | | | | | | | | | | |
Ameren Corporation | | | | | | | | | | | 46,793 | | | $ | 2,807,112 | |
CenterPoint Energy Incorporated | | | | | | | | | | | 69,970 | | | | 2,072,511 | |
CMS Energy Corporation | | | | | | | | | | | 44,653 | | | | 2,167,457 | |
Consolidated Edison Incorporated | | | | | | | | | | | 36,921 | | | | 3,111,333 | |
Dominion Resources Incorporated | | | | | | | | | | | 69,566 | | | | 5,479,714 | |
DTE Energy Company | | | | | | | | | | | 22,121 | | | | 2,484,630 | |
NiSource Incorporated | | | | | | | | | | | 86,432 | | | | 2,322,428 | |
Public Service Enterprise Group Incorporated | | | | | | | | | | | 65,682 | | | | 3,076,545 | |
SCANA Corporation | | | | | | | | | | | 37,644 | | | | 2,272,945 | |
Sempra Energy | | | | | | | | | | | 34,751 | | | | 4,098,185 | |
WEC Energy Group Incorporated | | | | | | | | | | | 38,343 | | | | 2,500,730 | |
| |
| | | | 32,393,590 | |
| | | | | | | | | | | | | | | | |
| | | | |
| Water Utilities: 0.10% | | | | | | | | | | | | | | | | |
American Water Works Company Incorporated | | | | | | | | | | | 25,682 | | | | 2,077,676 | |
| | | | | | | | | | | | | | | | |
| | | | |
Total Common Stocks (Cost $1,642,768,516) | | | | | | | | | | | | | | | 2,045,621,646 | |
| | | | | | | | | | | | | | | | |
| | | | |
| | | Yield | | | | | | | | | | |
| Short-Term Investments: 4.86% | | | | | | | | | | | | | | | | |
| | | | |
| Investment Companies: 4.86% | | | | | | | | | | | | | | | | |
Wells Fargo Government Money Market Select Class (l)(u) | | | 0.92 | % | | | | | | | 105,054,093 | | | | 105,054,093 | |
| | | | | | | | | | | | | | | | |
| | | | |
Total Short-Term Investments (Cost $105,054,093) | | | | | | | | | | | | | | | 105,054,093 | |
| | | | | | | | | | | | | | | | |
| | | | | | | | |
| Total investments in securities (Cost $1,747,822,609) | | | 99.47 | % | | | 2,150,675,739 | |
Other assets and liabilities, net | | | 0.53 | | | | 11,411,289 | |
| | | | | | | | |
| Total net assets | | | 100.00 | % | | $ | 2,162,087,028 | |
| | | | | | | | |
| † | Non-income-earning security |
| (l) | The issuer of the security is an affiliated person of the Portfolio as defined in the Investment Company Act of 1940. |
| (u) | The rate represents the 7-day annualized yield at period end. |
Futures Contracts
| | | | | | | | | | | | | | | | | | | | | | | | |
| Description | | Number of contracts | | | Expiration date | | | Notional cost | | | Notional value | | | Unrealized gains | | | Unrealized losses | |
Long | | | | | | | | | | | | | | | | | | | | | | | | |
S&P 500 E-Mini Index | | | 395 | | | | 9-15-2017 | | | $ | 48,252,980 | | | $ | 48,784,479 | | | $ | 531,499 | | | $ | 0 | |
The accompanying notes are an integral part of these financial statements.
| | | | |
| 150 | | Wells Fargo Target Date Funds | | Portfolio of investments—August 31, 2017 (unaudited) |
FACTOR ENHANCED LARGE CAP PORTFOLIO
Investments In Affiliates
An affiliated investment is an investment in which the Portfolio owns at least 5% of the outstanding voting shares of the issuer or as a result of other relationships, such as the Portfolio and the issuer having the same investment manager. Transactions with issuers that were either affiliated persons of the Portfolio at the beginning of the period or the end of the period were as follows:
| | | | | | | | | | | | | | | | | | | | | | | | | | | | | | | | |
| | | Shares, beginning of period | | | Shares purchased | | | Shares sold | | | Shares, end of period | | | Net realized gains (losses) | | | Net change in unrealized gains (losses) | | | Income from affiliated securities | | | Value, end of period | |
Investment companies - 4.86% | | | | | | | | | | | | | | | | | | | | | | | | | | | | | | | | |
Wells Fargo Government Money Market Fund Select Class | | | 0 | | | | 1,332,389,629 | | | | 1,227,335,536 | | | | 105,054,093 | | | $ | 0 | | | $ | 0 | | | $ | 81,912 | | | $ | 105,054,093 | |
The accompanying notes are an integral part of these financial statements.
| | | | | | |
| Portfolio of investments—August 31, 2017 (unaudited) | | Wells Fargo Target Date Funds | | | 151 | |
FACTOR ENHANCED SMALL CAP PORTFOLIO
| | | | | | | | | | | | | | | | |
| Security name | | | | | | | | Shares | | | Value | |
|
Common Stocks: 94.52% | |
|
Consumer Discretionary: 13.78% | |
|
| Auto Components: 0.92% | |
Cooper Tire & Rubber Company | | | | | | | | | | | 18,581 | | | $ | 624,295 | |
Cooper-Standard Holdings Incorporated † | | | | | | | | | | | 6,124 | | | | 615,952 | |
Dorman Products Incorporated † | | | | | | | | | | | 12,057 | | | | 800,826 | |
Fox Factory Holding Corporation † | | | | | | | | | | | 15,023 | | | | 600,920 | |
LCI Industries | | | | | | | | | | | 8,364 | | | | 826,363 | |
Motorcar Parts of America Incorporated † | | | | | | | | | | | 11,535 | | | | 303,024 | |
Standard Motor Products Incorporated | | | | | | | | | | | 9,228 | | | | 406,955 | |
Stoneridge Incorporated † | | | | | | | | | | | 17,866 | | | | 295,861 | |
Superior Industries International Incorporated | | | | | | | | | | | 14,829 | | | | 217,245 | |
Tower International Incorporated | | | | | | | | | | | 12,214 | | | | 274,204 | |
| |
| | | | 4,965,645 | |
| | | | | | | | | | | | | | | | |
| | | | |
| Automobiles: 0.08% | | | | | | | | | | | | | | | | |
Winnebago Industries Incorporated | | | | | | | | | | | 11,476 | | | | 414,857 | |
| | | | | | | | | | | | | | | | |
| | | | |
| Distributors: 0.09% | | | | | | | | | | | | | | | | |
Core Mark Holding Company Incorporated | | | | | | | | | | | 18,049 | | | | 488,406 | |
| | | | | | | | | | | | | | | | |
| | | | |
| Diversified Consumer Services: 0.87% | | | | | | | | | | | | | | | | |
Adtalem Global Education Incorporated | | | | | | | | | | | 20,886 | | | | 714,301 | |
American Public Education Incorporated † | | | | | | | | | | | 11,681 | | | | 215,514 | |
Capella Education Company | | | | | | | | | | | 4,312 | | | | 290,413 | |
Career Education Corporation † | | | | | | | | | | | 33,877 | | | | 325,558 | |
Carriage Services Incorporated | | | | | | | | | | | 12,447 | | | | 304,827 | |
Graham Holdings Company Class B | | | | | | | | | | | 1,696 | | | | 995,891 | |
K12 Incorporated † | | | | | | | | | | | 17,196 | | | | 308,152 | |
Laureate Education Incorporated Class A † | | | | | | | | | | | 15,548 | | | | 227,623 | |
Regis Corporation † | | | | | | | | | | | 31,504 | | | | 418,373 | |
Strayer Education Incorporated | | | | | | | | | | | 4,794 | | | | 383,568 | |
Weight Watchers International Incorporated † | | | | | | | | | | | 10,590 | | | | 495,718 | |
| |
| | | | 4,679,938 | |
| | | | | | | | | | | | | | | | |
| | | | |
| Hotels, Restaurants & Leisure: 3.55% | | | | | | | | | | | | | | | | |
BJ’s Restaurants Incorporated † | | | | | | | | | | | 10,714 | | | | 322,491 | |
Bloomin’ Brands Incorporated | | | | | | | | | | | 40,812 | | | | 694,212 | |
Bob Evans Farms Incorporated | | | | | | | | | | | 7,909 | | | | 543,981 | |
Bojangles Incorporated † | | | | | | | | | | | 287 | | | | 3,831 | |
Brinker International Incorporated | | | | | | | | | | | 20,873 | | | | 651,655 | |
Carrols Restaurant Group Incorporated † | | | | | | | | | | | 26,540 | | | | 289,286 | |
Choice Hotels International Incorporated | | | | | | | | | | | 13,939 | | | | 864,915 | |
Churchill Downs Incorporated | | | | | | | | | | | 5,426 | | | | 1,060,240 | |
Chuy’s Holding Incorporated † | | | | | | | | | | | 14,697 | | | | 276,304 | |
ClubCorp Holdings Incorporated | | | | | | | | | | | 26,975 | | | | 458,575 | |
Dave & Buster’s Entertainment Incorporated † | | | | | | | | | | | 15,622 | | | | 913,262 | |
Del Frisco’s Restaurant Group Incorporated † | | | | | | | | | | | 292 | | | | 4,088 | |
Del Taco Restaurants Incorporated † | | | | | | | | | | | 19,935 | | | | 280,685 | |
Denny’s Corporation † | | | | | | | | | | | 43,512 | | | | 520,404 | |
The accompanying notes are an integral part of these financial statements.
| | | | |
| 152 | | Wells Fargo Target Date Funds | | Portfolio of investments—August 31, 2017 (unaudited) |
FACTOR ENHANCED SMALL CAP PORTFOLIO
| | | | | | | | | | | | | | | | |
| Security name | | | | | | | | Shares | | | Value | |
| | | | |
| Hotels, Restaurants & Leisure (continued) | | | | | | | | | | | | | | | | |
DineEquity Incorporated | | | | | | | | | | | 10,607 | | | $ | 421,628 | |
Eldorado Resorts Incorporated † | | | | | | | | | | | 11,578 | | | | 266,294 | |
Fiesta Restaurant Group Incorporated † | | | | | | | | | | | 13,439 | | | | 233,839 | |
Hyatt Hotels Corporation Class A † | | | | | | | | | | | 7,702 | | | | 458,346 | |
International Game Technology | | | | | | | | | | | 39,818 | | | | 811,093 | |
International Speedway Corporation Class A | | | | | | | | | | | 9,562 | | | | 340,885 | |
Interval Leisure Group Incorporated | | | | | | | | | | | 40,054 | | | | 1,057,426 | |
Lindblad Expeditions Holding † | | | | | | | | | | | 522 | | | | 5,805 | |
Marcus Corporation | | | | | | | | | | | 10,885 | | | | 271,037 | |
Marriott Vacations Worldwide Corporation | | | | | | | | | | | 8,365 | | | | 973,351 | |
Monarch Casino & Resort Incorporated † | | | | | | | | | | | 8,926 | | | | 317,498 | |
Papa John’s International Incorporated | | | | | | | | | | | 10,924 | | | | 817,006 | |
Penn National Gaming Incorporated † | | | | | | | | | | | 32,553 | | | | 722,351 | |
Pinnacle Entertainment Incorporated † | | | | | | | | | | | 22,201 | | | | 432,920 | |
Planet Fitness Incorporated Class A | | | | | | | | | | | 25,192 | | | | 639,121 | |
Playa Hotels & Resorts NV † | | | | | | | | | | | 30,175 | | | | 312,915 | |
Red Robin Gourmet Burgers Incorporated † | | | | | | | | | | | 6,648 | | | | 378,936 | |
Red Rock Resorts Incorporated Class A | | | | | | | | | | | 18,371 | | | | 415,185 | |
Ruth’s Chris Steak House Incorporated | | | | | | | | | | | 18,752 | | | | 366,602 | |
SeaWorld Entertainment Incorporated | | | | | | | | | | | 31,869 | | | | 413,660 | |
Sonic Corporation | | | | | | | | | | | 16,851 | | | | 394,482 | |
Speedway Motorsports Incorporated | | | | | | | | | | | 11,771 | | | | 244,955 | |
The Cheesecake Factory Incorporated | | | | | | | | | | | 16,808 | | | | 696,355 | |
The Habit Restaurants Incorporated Class A † | | | | | | | | | | | 265 | | | | 3,445 | |
The Wendy’s Company | | | | | | | | | | | 61,207 | | | | 913,208 | |
Wingstop Incorporated | | | | | | | | | | | 13,040 | | | | 422,626 | |
Zoe’s Kitchen Incorporated † | | | | | | | | | | | 275 | | | | 3,539 | |
| |
| | | | 19,218,437 | |
| | | | | | | | | | | | | | | | |
| | | | |
| Household Durables: 1.74% | | | | | | | | | | | | | | | | |
Bassett Furniture Industries Incorporated | | | | | | | | | | | 8,608 | | | | 308,597 | |
Beazer Homes Incorporated † | | | | | | | | | | | 21,620 | | | | 322,354 | |
Cavco Industries Incorporated † | | | | | | | | | | | 3,858 | | | | 519,094 | |
Century Communities Incorporated † | | | | | | | | | | | 12,984 | | | | 292,789 | |
Ethan Allen Interiors Incorporated | | | | | | | | | | | 13,200 | | | | 386,100 | |
Flexsteel Industries Incorporated | | | | | | | | | | | 5,584 | | | | 254,072 | |
Green Brick Partners Incorporated † | | | | | | | | | | | 460 | | | | 4,347 | |
Hooker Furniture Corporation | | | | | | | | | | | 6,957 | | | | 280,019 | |
Hovnanian Enterprises Incorporated Class A † | | | | | | | | | | | 94,712 | | | | 172,376 | |
Installed Building Products † | | | | | | | | | | | 8,426 | | | | 486,180 | |
iRobot Corporation † | | | | | | | | | | | 10,046 | | | | 958,589 | |
KB Home Incorporated | | | | | | | | | | | 25,239 | | | | 540,115 | |
La-Z-Boy Incorporated | | | | | | | | | | | 19,981 | | | | 476,547 | |
LGI Homes Incorporated † | | | | | | | | | | | 7,608 | | | | 323,644 | |
M/I Homes Incorporated † | | | | | | | | | | | 13,993 | | | | 344,228 | |
MDC Holdings Incorporated | | | | | | | | | | | 15,467 | | | | 483,344 | |
Meritage Corporation † | | | | | | | | | | | 14,269 | | | | 580,748 | |
Nacco Industries Class A | | | | | | | | | | | 67 | | | | 4,858 | |
PICO Holdings Incorporated † | | | | | | | | | | | 17,825 | | | | 289,656 | |
The accompanying notes are an integral part of these financial statements.
| | | | | | |
| Portfolio of investments—August 31, 2017 (unaudited) | | Wells Fargo Target Date Funds | | | 153 | |
FACTOR ENHANCED SMALL CAP PORTFOLIO
| | | | | | | | | | | | | | | | |
| Security name | | | | | | | | Shares | | | Value | |
| | | | |
| Household Durables (continued) | | | | | | | | | | | | | | | | |
Taylor Morrison Home Corporation Class A † | | | | | | | | | | | 13,409 | | | $ | 271,130 | |
TopBuild Corporation † | | | | | | | | | | | 14,331 | | | | 850,545 | |
TRI Pointe Homes Incorporated † | | | | | | | | | | | 46,689 | | | | 594,818 | |
Universal Electronics Incorporated † | | | | | | | | | | | 6,662 | | | | 390,060 | |
William Lyon Homes Class A † | | | | | | | | | | | 12,152 | | | | 291,526 | |
| |
| | | | 9,425,736 | |
| | | | | | | | | | | | | | | | |
| | | | |
| Internet & Direct Marketing Retail: 0.86% | | | | | | | | | | | | | | | | |
1-800-Flowers.com Incorporated Class A † | | | | | | | | | | | 488 | | | | 4,392 | |
FTD Companies Incorporated † | | | | | | | | | | | 16,298 | | | | 218,230 | |
HSN Incorporated | | | | | | | | | | | 12,686 | | | | 465,576 | |
Liberty Expedia Holdings Incorporated Class A † | | | | | | | | | | | 23,630 | | | | 1,292,325 | |
Nutrisystem Incorporated | | | | | | | | | | | 11,804 | | | | 640,957 | |
PetMed Express Incorporated | | | | | | | | | | | 9,589 | | | | 347,793 | |
Shutterfly Incorporated † | | | | | | | | | | | 13,744 | | | | 626,452 | |
Wayfair Incorporated Class A † | | | | | | | | | | | 15,158 | | | | 1,076,370 | |
| |
| | | | 4,672,095 | |
| | | | | | | | | | | | | | | | |
| | | | |
| Leisure Products: 0.36% | | | | | | | | | | | | | | | | |
Acushnet Holdings Corporation | | | | | | | | | | | 10,997 | | | | 180,791 | |
American Outdoor Brands Corporation † | | | | | | | | | | | 24,822 | | | | 405,095 | |
Callaway Golf Company | | | | | | | | | | | 34,536 | | | | 481,432 | |
Malibu Boats Incorporated Class A † | | | | | | | | | | | 10,577 | | | | 285,262 | |
Nautilus Group Incorporated † | | | | | | | | | | | 14,852 | | | | 242,830 | |
Sturm, Ruger & Company Incorporated | | | | | | | | | | | 8,038 | | | | 368,140 | |
| |
| | | | 1,963,550 | |
| | | | | | | | | | | | | | | | |
| | | | |
| Media: 1.20% | | | | | | | | | | | | | | | | |
AMC Entertainment Holdings Class A | | | | | | | | | | | 21,438 | | | | 287,269 | |
Entercom Communications Corporation | | | | | | | | | | | 504 | | | | 5,191 | |
Entravision Communications Corporation Class A | | | | | | | | | | | 41,618 | | | | 230,980 | |
Gannett Company Incorporated | | | | | | | | | | | 46,292 | | | | 393,019 | |
Gray Television Incorporated † | | | | | | | | | | | 25,251 | | | | 361,089 | |
John Wiley & Sons Incorporated Class A | | | | | | | | | | | 17,739 | | | | 957,019 | |
Meredith Corporation | | | | | | | | | | | 14,339 | | | | 779,325 | |
MSG Networks Incorporated Class A † | | | | | | | | | | | 23,984 | | | | 514,457 | |
National CineMedia Incorporated | | | | | | | | | | | 60,425 | | | | 326,899 | |
New Media Investment Group Incorporated | | | | | | | | | | | 28,971 | | | | 399,510 | |
Reading International Incorporated Class A † | | | | | | | | | | | 312 | | | | 4,917 | |
Regal Entertainment Group Class A | | | | | | | | | | | 41,386 | | | | 611,271 | |
Scholastic Corporation | | | | | | | | | | | 10,141 | | | | 399,860 | |
The E.W. Scripps Company † | | | | | | | | | | | 23,924 | | | | 427,761 | |
Time Incorporated | | | | | | | | | | | 37,471 | | | | 492,744 | |
World Wrestling Entertainment Incorporated Class A | | | | | | | | | | | 13,963 | | | | 304,393 | |
| |
| | | | 6,495,704 | |
| | | | | | | | | | | | | | | | |
| | | | |
| Multiline Retail: 0.46% | | | | | | | | | | | | | | | | |
Big Lots Stores Incorporated | | | | | | | | | | | 16,873 | | | | 803,155 | |
Dillard’s Incorporated Class A | | | | | | | | | | | 6,361 | | | | 386,749 | |
The accompanying notes are an integral part of these financial statements.
| | | | |
| 154 | | Wells Fargo Target Date Funds | | Portfolio of investments—August 31, 2017 (unaudited) |
FACTOR ENHANCED SMALL CAP PORTFOLIO
| | | | | | | | | | | | | | | | |
| Security name | | | | | | | | Shares | | | Value | |
| | | | |
| Multiline Retail (continued) | | | | | | | | | | | | | | | | |
Fred’s Incorporated Class A | | | | | | | | | | | 370 | | | $ | 2,190 | |
JCPenny Company Incorporated † | | | | | | | | | | | 128,974 | | | | 499,129 | |
Ollie’s Bargain Outlet Holdings Incorporated † | | | | | | | | | | | 19,122 | | | | 800,256 | |
| |
| | | | 2,491,479 | |
| | | | | | | | | | | | | | | | |
| | | | |
| Specialty Retail: 2.78% | | | | | | | | | | | | | | | | |
Aaron’s Incorporated | | | | | | | | | | | 26,962 | | | | 1,193,608 | |
American Eagle Outfitters Incorporated | | | | | | | | | | | 61,096 | | | | 730,097 | |
Asbury Automotive Group Incorporated † | | | | | | | | | | | 6,791 | | | | 365,695 | |
Ascena Retail Group Incorporated † | | | | | | | | | | | 127,150 | | | | 259,386 | |
Barnes & Noble Education Incorporated † | | | | | | | | | | | 25,326 | | | | 131,189 | |
Barnes & Noble Incorporated | | | | | | | | | | | 37,820 | | | | 293,105 | |
Caleres Incorporated | | | | | | | | | | | 19,559 | | | | 527,702 | |
Camping World Holdings Incorporated Class A | | | | | | | | | | | 7,079 | | | | 260,153 | |
Chico’s FAS Incorporated | | | | | | | | | | | 55,880 | | | | 429,158 | |
Children’s Place Retail Stores Incorporated | | | | | | | | | | | 7,109 | | | | 754,620 | |
Citi Trends Incorporated | | | | | | | | | | | 100 | | | | 1,813 | |
DSW Incorporated Class A | | | | | | | | | | | 27,158 | | | | 503,238 | |
Express Incorporated † | | | | | | | | | | | 45,513 | | | | 289,918 | |
Finish Line Incorporated Class A | | | | | | | | | | | 20,255 | | | | 168,724 | |
Five Below Incorporated † | | | | | | | | | | | 21,119 | | | | 1,004,631 | |
Francescas Holdings Corporation † | | | | | | | | | | | 25,807 | | | | 187,359 | |
GameStop Corporation Class A | | | | | | | | | | | 34,239 | | | | 633,422 | |
Genesco Incorporated † | | | | | | | | | | | 11,927 | | | | 252,256 | |
Group 1 Automotive Incorporated | | | | | | | | | | | 8,688 | | | | 521,454 | |
Haverty Furniture Companies Incorporated | | | | | | | | | | | 13,773 | | | | 322,977 | |
Hibbett Sports Incorporated † | | | | | | | | | | | 16,899 | | | | 207,858 | |
Lithia Motors Incorporated Class A | | | | | | | | | | | 8,649 | | | | 934,092 | |
MarineMax Incorporated † | | | | | | | | | | | 13,792 | | | | 222,741 | |
Murphy USA Incorporated † | | | | | | | | | | | 13,374 | | | | 862,088 | |
Office Depot Incorporated | | | | | | | | | | | 193,470 | | | | 829,986 | |
Penske Auto Group Incorporated | | | | | | | | | | | 11,580 | | | | 490,529 | |
Pier 1 Imports Incorporated | | | | | | | | | | | 53,925 | | | | 225,946 | |
Rent-A-Center Incorporated | | | | | | | | | | | 21,058 | | | | 254,802 | |
Select Comfort Corporation † | | | | | | | | | | | 16,870 | | | | 498,171 | |
Sonic Automotive Incorporated | | | | | | | | | | | 14,289 | | | | 258,631 | |
Tailored Brands Incorporated | | | | | | | | | | | 23,528 | | | | 278,101 | |
The Buckle Incorporated | | | | | | | | | | | 19,196 | | | | 271,623 | |
The Cato Corporation Class A | | | | | | | | | | | 18,863 | | | | 248,237 | |
Urban Outfitters Incorporated † | | | | | | | | | | | 31,332 | | | | 640,426 | |
Winmark Corporation | | | | | | | | | | | 39 | | | | 5,142 | |
| |
| | | | 15,058,878 | |
| | | | | | | | | | | | | | | | |
| | | | |
| Textiles, Apparel & Luxury Goods: 0.87% | | | | | | | | | | | | | | | | |
Columbia Sportswear Company | | | | | | | | | | | 11,155 | | | | 639,070 | |
Crocs Incorporated † | | | | | | | | | | | 37,350 | | | | 333,536 | |
Culp Incorporated | | | | | | | | | | | 9,135 | | | | 264,915 | |
Fossil Group Incorporated † | | | | | | | | | | | 27,263 | | | | 226,010 | |
G-III Apparel Group Limited † | | | | | | | | | | | 15,901 | | | | 437,278 | |
The accompanying notes are an integral part of these financial statements.
| | | | | | |
| Portfolio of investments—August 31, 2017 (unaudited) | | Wells Fargo Target Date Funds | | | 155 | |
FACTOR ENHANCED SMALL CAP PORTFOLIO
| | | | | | | | | | | | | | | | |
| Security name | | | | | | | | Shares | | | Value | |
| | | | |
| Textiles, Apparel & Luxury Goods (continued) | | | | | | | | | | | | | | | | |
Movado Group Incorporated | | | | | | | | | | | 10,556 | | | $ | 292,929 | |
Oxford Industries Incorporated | | | | | | | | | | | 5,836 | | | | 337,379 | |
Steven Madden Limited † | | | | | | | | | | | 20,798 | | | | 881,835 | |
Unifi Incorporated † | | | | | | | | | | | 10,883 | | | | 338,244 | |
Wolverine World Wide Incorporated | | | | | | | | | | | 37,147 | | | | 976,966 | |
| |
| | | | 4,728,162 | |
| | | | | | | | | | | | | | | | |
| | | | |
Consumer Staples: 3.35% | | | | | | | | | | | | | | | | |
| | | | |
| Beverages: 0.39% | | | | | | | | | | | | | | | | |
Boston Beer Company Incorporated † | | | | | | | | | | | 4,039 | | | | 601,811 | |
Coca Cola Bottling Corporation | | | | | | | | | | | 1,916 | | | | 409,238 | |
MGP Ingredients Incorporated | | | | | | | | | | | 5,283 | | | | 297,063 | |
National Beverage Corporation | | | | | | | | | | | 4,664 | | | | 542,003 | |
Primo Water Corporation † | | | | | | | | | | | 21,785 | | | | 238,546 | |
| |
| | | | 2,088,661 | |
| | | | | | | | | | | | | | | | |
| | | | |
| Food & Staples Retailing: 0.75% | | | | | | | | | | | | | | | | |
Ingles Markets Incorporated Class A | | | | | | | | | | | 10,100 | | | | 221,695 | |
Performance Food Group Company † | | | | | | | | | | | 28,150 | | | | 782,570 | |
Pricesmart Incorporated | | | | | | | | | | | 10,336 | | | | 839,800 | |
Smart & Final Stores Incorporated † | | | | | | | | | | | 371 | | | | 2,616 | |
SpartanNash Company | | | | | | | | | | | 17,577 | | | | 433,097 | |
Supervalu Incorporated † | | | | | | | | | | | 18,023 | | | | 360,280 | |
The Andersons Incorporated | | | | | | | | | | | 12,737 | | | | 405,673 | |
The Chef’s Warehouse Incorporated † | | | | | | | | | | | 327 | | | | 5,641 | |
United Natural Foods Incorporated † | | | | | | | | | | | 21,244 | | | | 738,229 | |
Weis Markets Incorporated | | | | | | | | | | | 6,747 | | | | 298,285 | |
| |
| | | | 4,087,886 | |
| | | | | | | | | | | | | | | | |
| | | | |
| Food Products: 1.49% | | | | | | | | | | | | | | | | |
Amplify Snack Brands Incorporated † | | | | | | | | | | | 550 | | | | 3,966 | |
Blue Buffalo Pet Products Incorporated † | | | | | | | | | | | 35,460 | | | | 913,450 | |
Calavo Growers Incorporated | | | | | | | | | | | 6,326 | | | | 424,791 | |
Dean Foods Company | | | | | | | | | | | 36,319 | | | | 399,509 | |
Farmer Bros Corporation † | | | | | | | | | | | 9,502 | | | | 309,290 | |
Fresh del Monte Produce Incorporated | | | | | | | | | | | 12,638 | | | | 593,860 | |
Freshpet Incorporated † | | | | | | | | | | | 16,817 | | | | 266,549 | |
Hostess Brands Incorporated † | | | | | | | | | | | 34,205 | | | | 456,295 | |
J & J Snack Foods Corporation | | | | | | | | | | | 5,655 | | | | 720,956 | |
John B. Sanfilippo & Son Incorporated | | | | | | | | | | | 4,341 | | | | 269,402 | |
Lancaster Colony Corporation | | | | | | | | | | | 7,310 | | | | 851,395 | |
Landec Corporation † | | | | | | | | | | | 23,025 | | | | 299,325 | |
Omega Protein Corporation | | | | | | | | | | | 15,366 | | | | 242,783 | |
Pilgrim S Pride Corporation † | | | | | | | | | | | 21,218 | | | | 624,870 | |
Sanderson Farms Incorporated | | | | | | | | | | | 7,498 | | | | 1,106,105 | |
Seaboard Corporation | | | | | | | | | | | 63 | | | | 270,627 | |
Tootsie Roll Industries Incorporated | | | | | | | | | | | 7,699 | | | | 287,558 | |
| |
| | | | 8,040,731 | |
| | | | | | | | | | | | | | | | |
The accompanying notes are an integral part of these financial statements.
| | | | |
| 156 | | Wells Fargo Target Date Funds | | Portfolio of investments—August 31, 2017 (unaudited) |
FACTOR ENHANCED SMALL CAP PORTFOLIO
| | | | | | | | | | | | | | | | |
| Security name | | | | | | | | Shares | | | Value | |
| | | | |
| Household Products: 0.32% | | | | | | | | | | | | | | | | |
Central Garden & Pet Company Class A † | | | | | | | | | | | 13,951 | | | $ | 475,590 | |
HRG Group Incorporated † | | | | | | | | | | | 45,032 | | | | 711,055 | |
WD-40 Company | | | | | | | | | | | 5,081 | | | | 553,575 | |
| |
| | | | 1,740,220 | |
| | | | | | | | | | | | | | | | |
| | | | |
| Personal Products: 0.18% | | | | | | | | | | | | | | | | |
Inter Parfums Incorporated | | | | | | | | | | | 6,884 | | | | 271,574 | |
Medifast Incorporated | | | | | | | | | | | 7,053 | | | | 399,341 | |
USANA Health Sciences Incorporated † | | | | | | | | | | | 4,680 | | | | 277,056 | |
| |
| | | | 947,971 | |
| | | | | | | | | | | | | | | | |
| | | | |
| Tobacco: 0.22% | | | | | | | | | | | | | | | | |
Universal Corporation | | | | | | | | | | | 10,000 | | | | 572,000 | |
Vector Group Limited | | | | | | | | | | | 29,307 | | | | 633,031 | |
| |
| | | | 1,205,031 | |
| | | | | | | | | | | | | | | | |
| | | | |
Energy: 2.51% | | | | | | | | | | | | | | | | |
| | | | |
| Energy Equipment & Services: 0.88% | | | | | | | | | | | | | | | | |
Archrock Incorporated | | | | | | | | | | | 35,373 | | | | 360,805 | |
Atwood Oceanics Incorporated † | | | | | | | | | | | 36,952 | | | | 242,775 | |
Basic Energy Services Incorporated † | | | | | | | | | | | 11,730 | | | | 167,035 | |
Bristow Group Incorporated | | | | | | | | | | | 353 | | | | 2,909 | |
Dril-Quip Incorporated † | | | | | | | | | | | 16,620 | | | | 624,081 | |
Exterran Corporation † | | | | | | | | | | | 16,510 | | | | 457,987 | |
Keane Group Incorporated † | | | | | | | | | | | 17,556 | | | | 227,350 | |
McDermott International Incorporated † | | | | | | | | | | | 94,046 | | | | 577,442 | |
Natural Gas Services Group Incorporated † | | | | | | | | | | | 189 | | | | 4,460 | |
Newpark Resources Incorporated † | | | | | | | | | | | 51,707 | | | | 416,241 | |
Noble Corporation plc † | | | | | | | | | | | 128,950 | | | | 420,377 | |
ProPetro Holding Corporation † | | | | | | | | | | | 20,373 | | | | 234,493 | |
Rowan Companies plc Class A † | | | | | | | | | | | 58,497 | | | | 570,346 | |
Seacor Holdings Incorporated | | | | | | | | | | | 11,473 | | | | 440,219 | |
Seacor Marine Holdings Incorporated † | | | | | | | | | | | 133 | | | | 1,704 | |
| |
| | | | 4,748,224 | |
| | | | | | | | | | | | | | | | |
| | | | |
| Oil, Gas & Consumable Fuels: 1.63% | | | | | | | | | | | | | | | | |
Andeavor Corporation | | | | | | | | | | | 226 | | | | 22,634 | |
Arch Coal Incorporated | | | | | | | | | | | 8,981 | | | | 717,312 | |
California Resources Corporation † | | | | | | | | | | | 395 | | | | 3,081 | |
Centennial Resource Development Class A † | | | | | | | | | | | 38,027 | | | | 657,487 | |
Clean Energy Fuels Corporation † | | | | | | | | | | | 104,453 | | | | 248,598 | |
CVR Energy Incorporated | | | | | | | | | | | 12,721 | | | | 272,484 | |
Delek US Holdings Incorporated | | | | | | | | | | | 27,533 | | | | 680,616 | |
Energy XXI Gulf Coast Incorporated † | | | | | | | | | | | 15,367 | | | | 160,585 | |
Enlink Midstream LLC | | | | | | | | | | | 29,276 | | | | 499,156 | |
Green Plains Renewable Energy Incorporated | | | | | | | | | | | 17,194 | | | | 318,949 | |
Midstates Petroleum Company Incorporated † | | | | | | | | | | | 324 | | | | 4,695 | |
Par Pacific Holdings Incorporated † | | | | | | | | | | | 18,481 | | | | 329,147 | |
The accompanying notes are an integral part of these financial statements.
| | | | | | |
| Portfolio of investments—August 31, 2017 (unaudited) | | Wells Fargo Target Date Funds | | | 157 | |
FACTOR ENHANCED SMALL CAP PORTFOLIO
| | | | | | | | | | | | | | | | |
| Security name | | | | | | | | Shares | | | Value | |
| | | | |
| Oil, Gas & Consumable Fuels (continued) | | | | | | | | | | | | | | | | |
PBF Energy Incorporated Class A | | | | | | | | | | | 40,759 | | | $ | 965,173 | |
Peabody Energy Corporation † | | | | | | | | | | | 21,657 | | | | 628,053 | |
Penn Virginia Corporation † | | | | | | | | | | | 7,873 | | | | 303,111 | |
Renewable Energy Group Incorporated † | | | | | | | | | | | 21,978 | | | | 265,934 | |
Resolute Energy Corporation † | | | | | | | | | | | 9,189 | | | | 271,535 | |
Rex American Resources Corporation † | | | | | | | | | | | 3,638 | | | | 315,124 | |
Sandridge Energy Incorporated † | | | | | | | | | | | 22,077 | | | | 380,166 | |
Tallgrass Energy Gp Lp | | | | | | | | | | | 22,944 | | | | 616,735 | |
Tellurian Incorporated † | | | | | | | | | | | 28,000 | | | | 258,720 | |
World Fuel Services Corporation | | | | | | | | | | | 27,036 | | | | 933,823 | |
| |
| | | | 8,853,118 | |
| | | | | | | | | | | | | | | | |
| | | | |
Financials: 19.36% | | | | | | | | | | | | | | | | |
| | | | |
| Banks: 10.14% | | | | | | | | | | | | | | | | |
1st Source Corporation | | | | | | | | | | | 5,482 | | | | 255,845 | |
Access National Corporation | | | | | | | | | | | 11,886 | | | | 305,232 | |
Allegiance Bancshares Incorporated † | | | | | | | | | | | 7,993 | | | | 272,162 | |
American National Bankshares Incorporated | | | | | | | | | | | 133 | | | | 4,855 | |
Ameris Bancorp | | | | | | | | | | | 14,081 | | | | 620,268 | |
AMES National Corporation | | | | | | | | | | | 161 | | | | 4,363 | |
Arrow Financial Corporation | | | | | | | | | | | 7,600 | | | | 245,480 | |
Atlantic Capital Bancshares † | | | | | | | | | | | 16,432 | | | | 294,954 | |
Banc of California Incorporated | | | | | | | | | | | 19,720 | | | | 365,806 | |
BancFirst Corporation | | | | | | | | | | | 7,120 | | | | 358,848 | |
BancorpSouth Incorporated | | | | | | | | | | | 27,687 | | | | 804,307 | |
Bank of Marin Bancorp | | | | | | | | | | | 5,374 | | | | 351,728 | |
Bankwell Financial Group Incorporated | | | | | | | | | | | 148 | | | | 5,017 | |
Banner Corporation | | | | | | | | | | | 11,135 | | | | 613,761 | |
Bar Harbor Bankshares | | | | | | | | | | | 12,457 | | | | 327,121 | |
Berkshire Hills Bancorp Incorporated | | | | | | | | | | | 11,873 | | | | 401,307 | |
Blue Hills Bancorp Incorporated | | | | | | | | | | | 23,263 | | | | 435,018 | |
BOK Financial Corporation | | | | | | | | | | | 7,705 | | | | 620,099 | |
Boston Private Financial Holdings Incorporated | | | | | | | | | | | 34,217 | | | | 502,990 | |
Bridge Bancorp Incorporated | | | | | | | | | | | 12,385 | | | | 382,697 | |
Brookline Bancorp Incorporated | | | | | | | | | | | 29,698 | | | | 426,166 | |
Bryn Mawr Bank Corporation | | | | | | | | | | | 9,386 | | | | 384,357 | |
Camden National Corporation | | | | | | | | | | | 9,794 | | | | 381,966 | |
Capital Bank Financial Corporation Class A | | | | | | | | | | | 10,610 | | | | 398,936 | |
Capital City Bank Group Incorporated | | | | | | | | | | | 100 | | | | 2,069 | |
Carolina Financial Corporation | | | | | | | | | | | 9,314 | | | | 316,955 | |
CenterState Banks Incorporated | | | | | | | | | | | 18,629 | | | | 455,852 | |
Central Pacific Financial Company | | | | | | | | | | | 223 | | | | 6,467 | |
Citizens & Northern Corporation | | | | | | | | | | | 11,522 | | | | 258,554 | |
City Holding Company | | | | | | | | | | | 7,203 | | | | 456,166 | |
CNB Financial Corporation | | | | | | | | | | | 12,285 | | | | 296,806 | |
CoBiz Incorporated | | | | | | | | | | | 24,966 | | | | 425,670 | |
Columbia Banking System Incorporated | | | | | | | | | | | 18,354 | | | | 682,218 | |
Community Bank System Incorporated | | | | | | | | | | | 13,514 | | | | 695,430 | |
Community Bankers Trust Corporation † | | | | | | | | | | | 32,812 | | | | 275,621 | |
The accompanying notes are an integral part of these financial statements.
| | | | |
| 158 | | Wells Fargo Target Date Funds | | Portfolio of investments—August 31, 2017 (unaudited) |
FACTOR ENHANCED SMALL CAP PORTFOLIO
| | | | | | | | | | | | | | | | |
| Security name | | | | | | | | Shares | | | Value | |
| | | | |
| Banks (continued) | | | | | | | | | | | | | | | | |
Community Trust Bancorp | | | | | | | | | | | 10,896 | | | $ | 463,625 | |
ConnectOne Bancorp Incorporated | | | | | | | | | | | 18,801 | | | | 428,663 | |
CU Bancorp † | | | | | | | | | | | 9,997 | | | | 356,393 | |
Customers Bancorp Incorporated † | | | | | | | | | | | 14,508 | | | | 408,835 | |
Eagle Bancorp Incorporated † | | | | | | | | | | | 10,995 | | | | 683,889 | |
Enterprise Bancorp Incorporated | | | | | | | | | | | 150 | | | | 4,799 | |
Enterprise Financial Service | | | | | | | | | | | 9,375 | | | | 358,125 | |
Equity Bancshares Incorporated Class A † | | | | | | | | | | | 100 | | | | 3,415 | |
Farmers Natl Banc Corporation | | | | | | | | | | | 14,785 | | | | 202,555 | |
FCB Financial Holdings Class A † | | | | | | | | | | | 11,660 | | | | 508,376 | |
Fidelity Southern Corporation | | | | | | | | | | | 13,245 | | | | 289,536 | |
Financial Institutions Incorporated | | | | | | | | | | | 7,160 | | | | 194,752 | |
First Bancorp | | | | | | | | | | | 13,699 | | | | 423,847 | |
First Bancorp Incorporated | | | | | | | | | | | 186 | | | | 4,842 | |
First Bancshares Incorporated | | | | | | | | | | | 183 | | | | 5,161 | |
First Busey Corporation | | | | | | | | | | | 14,523 | | | | 418,989 | |
First Citizens BancShares Corporation Class A | | | | | | | | | | | 1,826 | | | | 621,771 | |
First Commonwealth Financial Corporation | | | | | | | | | | | 32,223 | | | | 406,332 | |
First Community Bancshares | | | | | | | | | | | 10,249 | | | | 263,809 | |
First Connecticut Bancorp | | | | | | | | | | | 13,993 | | | | 346,327 | |
First Financial Bancorp | | | | | | | | | | | 22,002 | | | | 526,948 | |
First Financial Corporation | | | | | | | | | | | 9,109 | | | | 395,331 | |
First Foundation Incorporated † | | | | | | | | | | | 18,057 | | | | 306,066 | |
First Interstate Bancsys Class A | | | | | | | | | | | 7,228 | | | | 254,426 | |
First Merchants Corporation | | | | | | | | | | | 15,231 | | | | 598,121 | |
First Mid-Illinois Bancshares | | | | | | | | | | | 100 | | | | 3,468 | |
First of Long Island Corporation | | | | | | | | | | | 16,867 | | | | 451,192 | |
Flushing Financial Corporation | | | | | | | | | | | 15,240 | | | | 416,662 | |
Franklin Financial Network † | | | | | | | | | | | 7,217 | | | | 235,996 | |
German American Bancorp | | | | | | | | | | | 14,343 | | | | 466,721 | |
Glacier Bancorp Incorporated | | | | | | | | | | | 20,087 | | | | 667,089 | |
Great Southern Bancorp Incorporated | | | | | | | | | | | 8,311 | | | | 413,888 | |
Great Western Bancorp Incorporated | | | | | | | | | | | 20,520 | | | | 737,078 | |
Green Bancorp Incorporated † | | | | | | | | | | | 13,485 | | | | 270,374 | |
Guaranty Bancorp | | | | | | | | | | | 12,114 | | | | 312,541 | |
Hanmi Financial Corporation | | | | | | | | | | | 16,953 | | | | 452,645 | |
Harborone Bancorp Incorporated † | | | | | | | | | | | 234 | | | | 4,022 | |
Heartland Financial USA Incorporated | | | | | | | | | | | 10,648 | | | | 484,484 | |
Heritage Commerce Corporation | | | | | | | | | | | 26,669 | | | | 357,365 | |
Heritage Financial Corporation | | | | | | | | | | | 16,361 | | | | 427,840 | |
Hilltop Holdings Incorporated | | | | | | | | | | | 29,084 | | | | 688,418 | |
Hometrust Bancshares Incorporated † | | | | | | | | | | | 16,384 | | | | 380,109 | |
Hope Bancorp Incorporated | | | | | | | | | | | 45,599 | | | | 735,968 | |
Horizon Bancorp Indiana | | | | | | | | | | | 14,716 | | | | 385,118 | |
Independent Bank Corporation (Massachusetts) | | | | | | | | | | | 8,763 | | | | 607,276 | |
Independent Bank Corporation (Michigan) | | | | | | | | | | | 20,888 | | | | 426,115 | |
Independent Bank Group Incorporated | | | | | | | | | | | 6,566 | | | | 365,398 | |
Lakeland Bancorp Incorporated | | | | | | | | | | | 24,934 | | | | 461,279 | |
Lakeland Financial Corporation | | | | | | | | | | | 9,451 | | | | 410,740 | |
LCNB Corporation | | | | | | | | | | | 248 | | | | 4,576 | |
The accompanying notes are an integral part of these financial statements.
| | | | | | |
| Portfolio of investments—August 31, 2017 (unaudited) | | Wells Fargo Target Date Funds | | | 159 | |
FACTOR ENHANCED SMALL CAP PORTFOLIO
| | | | | | | | | | | | | | | | |
| Security name | | | | | | | | Shares | | | Value | |
| | | | |
| Banks (continued) | | | | | | | | | | | | | | | | |
LegacyTexas Financial Group | | | | | | | | | | | 15,775 | | | $ | 567,742 | |
Live Oak Bancshares Incorporated | | | | | | | | | | | 11,336 | | | | 253,360 | |
Mainsource Financial Group Class I | | | | | | | | | | | 11,889 | | | | 389,127 | |
Mercantile Bank Corporation | | | | | | | | | | | 10,628 | | | | 322,985 | |
Midland States Bancorp Incorporated | | | | | | | | | | | 9,144 | | | | 279,258 | |
Midwestone Financial Group Class I | | | | | | | | | | | 11,130 | | | | 365,954 | |
National Bank Holdings Corporation Class A | | | | | | | | | | | 14,919 | | | | 480,093 | |
National Bankshares Incorporated | | | | | | | | | | | 117 | | | | 4,610 | |
National Commerce Corporation † | | | | | | | | | | | 9,315 | | | | 370,271 | |
NBT Bancorp Incorporated | | | | | | | | | | | 18,424 | | | | 604,860 | |
Old National Bancorp | | | | | | | | | | | 29,708 | | | | 485,726 | |
Old Second Bancorp Incorporated | | | | | | | | | | | 33,038 | | | | 378,285 | |
Opus Bank † | | | | | | | | | | | 11,055 | | | | 247,632 | |
Pacific Continental Corporation | | | | | | | | | | | 13,593 | | | | 322,834 | |
Pacific Premier Bancorp Incorporated † | | | | | | | | | | | 15,498 | | | | 548,629 | |
Park National Corporation | | | | | | | | | | | 5,380 | | | | 519,654 | |
Park Sterling Corporation | | | | | | | | | | | 31,815 | | | | 361,737 | |
Peapack-Gladstone Financial Corporation | | | | | | | | | | | 10,634 | | | | 324,018 | |
People S Utah Bancorp | | | | | | | | | | | 10,181 | | | | 278,450 | |
Peoples Bancorp Incorporated | | | | | | | | | | | 13,233 | | | | 411,017 | |
Peoples Bancorp of North Carolina Incorporated | | | | | | | | | | | 100 | | | | 3,038 | |
Peoples Financial Services | | | | | | | | | | | 122 | | | | 5,069 | |
Pinnacle Financial Partners Incorporated | | | | | | | | | | | 1 | | | | 62 | |
Preferred Bank/Los Angeles | | | | | | | | | | | 6,321 | | | | 340,070 | |
Qcr Holdings Incorporated | | | | | | | | | | | 8,077 | | | | 352,965 | |
Renasant Corporation | | | | | | | | | | | 12,954 | | | | 515,958 | |
Republic Bancorp Incorporated Class A | | | | | | | | | | | 8,215 | | | | 292,290 | |
Republic First Bancorp Incorporated † | | | | | | | | | | | 32,216 | | | | 272,225 | |
S&T Bancorp Incorporated | | | | | | | | | | | 16,951 | | | | 609,219 | |
Sandy Spring Bancorp Incorporated | | | | | | | | | | | 9,979 | | | | 384,890 | |
Seacoast Banking Corporation † | | | | | | | | | | | 15,076 | | | | 344,788 | |
ServisFirst Bancshares Incorporated | | | | | | | | | | | 17,354 | | | | 591,945 | |
Sierra Bancorp | | | | | | | | | | | 196 | | | | 4,961 | |
Simmons First National Corporation Class A | | | | | | | | | | | 10,500 | | | | 548,100 | |
South State Corporation | | | | | | | | | | | 8,687 | | | | 714,506 | |
Southern National Bancorp of Virginia | | | | | | | | | | | 15,279 | | | | 255,923 | |
Southside Bancshares Incorporated | | | | | | | | | | | 11,507 | | | | 375,934 | |
Southwest Bancorp Incorporated | | | | | | | | | | | 14,431 | | | | 364,383 | |
State Bank Financial Corporation | | | | | | | | | | | 17,357 | | | | 466,383 | |
Sterling BanCorp | | | | | | | | | | | 39,752 | | | | 892,432 | |
Stock Yards Bancorp Incorporated | | | | | | | | | | | 15,633 | | | | 544,028 | |
Stonegate Bank | | | | | | | | | | | 7,745 | | | | 373,386 | |
TCF Financial Corporation | | | | | | | | | | | 48,426 | | | | 752,056 | |
Tompkins Trust Company Incorporated | | | | | | | | | | | 6,468 | | | | 491,051 | |
Towne Bank | | | | | | | | | | | 23,079 | | | | 708,525 | |
TriCo Bancshares | | | | | | | | | | | 10,002 | | | | 355,871 | |
TriState Capital Holdings Incorporated † | | | | | | | | | | | 16,468 | | | | 344,181 | |
Triumph Bancorp Incorporated † | | | | | | | | | | | 10,866 | | | | 306,421 | |
Trustmark Corporation | | | | | | | | | | | 14,259 | | | | 422,352 | |
Union Bankshares Corporation | | | | | | | | | | | 17,078 | | | | 535,054 | |
The accompanying notes are an integral part of these financial statements.
| | | | |
| 160 | | Wells Fargo Target Date Funds | | Portfolio of investments—August 31, 2017 (unaudited) |
FACTOR ENHANCED SMALL CAP PORTFOLIO
| | | | | | | | | | | | | | | | |
| Security name | | | | | | | | Shares | | | Value | |
| | | | |
| Banks (continued) | | | | | | | | | | | | | | | | |
United Community Bank | | | | | | | | | | | 15,040 | | | $ | 392,694 | |
Univest Corporation of Pennsylvania | | | | | | | | | | | 14,999 | | | | 437,221 | |
Valley National Bancorp | | | | | | | | | | | 70,996 | | | | 794,445 | |
Veritex Holdings Incorporated † | | | | | | | | | | | 11,824 | | | | 312,272 | |
Washington Trust Bancorp | | | | | | | | | | | 7,854 | | | | 402,518 | |
Washingtonfirst Bankshare | | | | | | | | | | | 7,833 | | | | 265,304 | |
WesBanco Incorporated | | | | | | | | | | | 16,891 | | | | 641,520 | |
West Bancorporation | | | | | | | | | | | 7,722 | | | | 169,498 | |
Westamerica Bancorporation | | | | | | | | | | | 10,383 | | | | 535,244 | |
| |
| | | | 54,911,410 | |
| | | | | | | | | | | | | | | | |
| | | | |
| Capital Markets: 1.43% | | | | | | | | | | | | | | | | |
Artisan Partners Asset Management Incorporated Class A | | | | | | | | | | | 17,398 | | | | 534,119 | |
BGC Partners Incorporated | | | | | | | | | | | 77,263 | | | | 1,003,646 | |
Cohen & Steers Incorporated | | | | | | | | | | | 9,520 | | | | 360,237 | |
Diamond Hill Investment Group | | | | | | | | | | | 1,986 | | | | 389,911 | |
Donnelley Financial Solutions † | | | | | | | | | | | 12,234 | | | | 261,930 | |
Evercore Partners Incorporated Class A | | | | | | | | | | | 12,818 | | | | 967,118 | |
Federated Investors Incorporated Class B | | | | | | | | | | | 19,577 | | | | 534,648 | |
Greenhill & Company Incorporated | | | | | | | | | | | 15,109 | | | | 227,390 | |
Houlihan Lokey Incorporated | | | | | | | | | | | 7,696 | | | | 277,441 | |
Intl Fcstone Incorporated † | | | | | | | | | | | 9,575 | | | | 339,817 | |
Ladenburg Thalmann Financial Services Incorporated | | | | | | | | | | | 2,130 | | | | 5,474 | |
Moelis Company Class A | | | | | | | | | | | 10,820 | | | | 426,308 | |
Morningstar Incorporated | | | | | | | | | | | 8,105 | | | | 670,284 | |
OM Asset Management plc | | | | | | | | | | | 20,214 | | | | 285,624 | |
PJT Partners Incorporated Class A | | | | | | | | | | | 8,441 | | | | 326,329 | |
Virtu Financial Incorporated Class A | | | | | | | | | | | 15,603 | | | | 280,074 | |
Virtus Investment Partners Incorporated | | | | | | | | | | | 3,235 | | | | 342,910 | |
Waddell & Reed Financial Incorporated Class A | | | | | | | | | | | 637 | | | | 11,855 | |
Westwood Holdings Group Incorporated | | | | | | | | | | | 7,892 | | | | 482,438 | |
| |
| | | | 7,727,553 | |
| | | | | | | | | | | | | | | | |
| | | | |
| Consumer Finance: 1.08% | | | | | | | | | | | | | | | | |
Credit Acceptance Corporation † | | | | | | | | | | | 4,427 | | | | 1,205,472 | |
Encore Capital Group Incorporated † | | | | | | | | | | | 10,808 | | | | 436,103 | |
Enova International Incorporated † | | | | | | | | | | | 17,971 | | | | 213,855 | |
Ezcorp Incorporated † | | | | | | | | | | | 28,891 | | | | 261,464 | |
First Cash Financial Services Incorporated | | | | | | | | | | | 19,844 | | | | 1,164,843 | |
Green Dot Corporation Class A † | | | | | | | | | | | 18,067 | | | | 870,468 | |
Nelnet Incorporated Class A | | | | | | | | | | | 7,346 | | | | 348,421 | |
PRA Group Incorporated † | | | | | | | | | | | 18,171 | | | | 525,142 | |
Santander Consumer USA Holdings Incorporated † | | | | | | | | | | | 38,878 | | | | 555,178 | |
World Acceptance Corporation † | | | | | | | | | | | 3,567 | | | | 266,883 | |
| |
| | | | 5,847,829 | |
| | | | | | | | | | | | | | | | |
| | | | |
| Diversified Financial Services: 0.00% | | | | | | | | | | | | | | | | |
Marlin Business Services Incorporated | | | | | | | | | | | 201 | | | | 5,246 | |
| | | | | | | | | | | | | | | | |
The accompanying notes are an integral part of these financial statements.
| | | | | | |
| Portfolio of investments—August 31, 2017 (unaudited) | | Wells Fargo Target Date Funds | | | 161 | |
FACTOR ENHANCED SMALL CAP PORTFOLIO
| | | | | | | | | | | | | | | | |
| Security name | | | | | | | | Shares | | | Value | |
| | | | |
| Insurance: 2.70% | | | | | | | | | | | | | | | | |
Ambac Financial Group Incorporated † | | | | | | | | | | | 23,992 | | | $ | 436,414 | |
American National Insurance Company | | | | | | | | | | | 4,221 | | | | 488,412 | |
Amerisafe Incorporated | | | | | | | | | | | 8,716 | | | | 468,921 | |
AmTrust Financial Services Incorporated | | | | | | | | | | | 29,587 | | | | 366,879 | |
Argo Group International Holdings Limited | | | | | | | | | | | 10,593 | | | | 637,699 | |
CNA Financial Corporation | | | | | | | | | | | 5,567 | | | | 273,117 | |
eHealth Incorporated † | | | | | | | | | | | 278 | | | | 6,750 | |
EMC Insurance Group Incorporated | | | | | | | | | | | 9,815 | | | | 273,642 | |
Employers Holdings Incorporated | | | | | | | | | | | 13,261 | | | | 558,951 | |
FBL Financial Group Incorporated | | | | | | | | | | | 3,903 | | | | 265,404 | |
Fidelity & Guaranty Life | | | | | | | | | | | 8,574 | | | | 267,938 | |
Greenlight Capital Limited † | | | | | | | | | | | 13,218 | | | | 294,101 | |
HCI Group Incorporated | | | | | | | | | | | 5,767 | | | | 224,855 | |
Heritage Insurance Holdings Incorporated | | | | | | | | | | | 21,264 | | | | 241,984 | |
Horace Mann Educators Corporation | | | | | | | | | | | 17,515 | | | | 615,652 | |
Infinity Property & Casualty Corporation | | | | | | | | | | | 4,930 | | | | 436,059 | |
Investors Title Company | | | | | | | | | | | 27 | | | | 4,748 | |
James River Group Holdings Limited | | | | | | | | | | | 8,516 | | | | 339,618 | |
Kemper Corporation | | | | | | | | | | | 16,723 | | | | 801,032 | |
Kinsale Capital Group Incorporated | | | | | | | | | | | 10,075 | | | | 381,339 | |
Maiden Holdings Limited | | | | | | | | | | | 33,943 | | | | 246,087 | |
Mercury General Corporation | | | | | | | | | | | 12,187 | | | | 700,387 | |
National General Holdings Corporation | | | | | | | | | | | 20,122 | | | | 345,495 | |
National Western Life Group Class A | | | | | | | | | | | 1,069 | | | | 357,484 | |
OneBeacon Insurance Group Limited Class A | | | | | | | | | | | 14,949 | | | | 272,371 | |
RLI Corporation | | | | | | | | | | | 17,491 | | | | 936,118 | |
Safety Insurance Group Incorporated | | | | | | | | | | | 6,959 | | | | 496,873 | |
Selective Insurance Group Incorporated | | | | | | | | | | | 22,477 | | | | 1,132,841 | |
State Auto Financial Corporation | | | | | | | | | | | 15,568 | | | | 385,152 | |
State National Companies Incorporated | | | | | | | | | | | 17,455 | | | | 362,540 | |
Stewart Information Services Corporation | | | | | | | | | | | 9,073 | | | | 327,354 | |
The Navigators Group Incorporated | | | | | | | | | | | 11,609 | | | | 647,782 | |
Trupanion Incorporated † | | | | | | | | | | | 12,165 | | | | 266,170 | |
United Fire Group Incorporated | | | | | | | | | | | 9,899 | | | | 416,352 | |
Universal Insurance Holdings Company | | | | | | | | | | | 14,655 | | | | 314,350 | |
WMIH Corporation † | | | | | | | | | | | 4,482 | | | | 5,603 | |
| |
| | | | 14,596,474 | |
| | | | | | | | | | | | | | | | |
| | | | |
| Mortgage REITs: 1.41% | | | | | | | | | | | | | | | | |
AG Mortgage Investment Trust Incorporated | | | | | | | | | | | 18,002 | | | | 346,899 | |
Anworth Mortgage Asset Corporation | | | | | | | | | | | 58,251 | | | | 353,001 | |
Apollo Commercial Real Estate Finance Incorporated | | | | | | | | | | | 29,726 | | | | 537,743 | |
Arbor Realty Trust Incorporated | | | | | | | | | | | 35,532 | | | | 291,362 | |
Ares Commercial Real Estate | | | | | | | | | | | 28,174 | | | | 371,615 | |
ARMOUR Residential REIT Incorporated | | | | | | | | | | | 16,087 | | | | 424,858 | |
Blackstone Mortgage Trust Incorporated Class A | | | | | | | | | | | 29,652 | | | | 929,590 | |
Capstead Mortgage Corporation | | | | | | | | | | | 765 | | | | 7,398 | |
CYS Investments Incorporated | | | | | | | | | | | 62,311 | | | | 547,714 | |
Dynex Capital Incorporated | | | | | | | | | | | 40,433 | | | | 289,096 | |
The accompanying notes are an integral part of these financial statements.
| | | | |
| 162 | | Wells Fargo Target Date Funds | | Portfolio of investments—August 31, 2017 (unaudited) |
FACTOR ENHANCED SMALL CAP PORTFOLIO
| | | | | | | | | | | | | | | | |
| Security name | | | | | | | | Shares | | | Value | |
| | | | |
| Mortgage REITs (continued) | | | | | | | | | | | | | | | | |
Hannon Armstrong Sustainable | | | | | | | | | | | 22,437 | | | $ | 520,538 | |
Invesco Mortgage Capital Incorporated | | | | | | | | | | | 40,693 | | | | 690,967 | |
Ladder Capital Corporation | | | | | | | | | | | 27,494 | | | | 377,218 | |
Mortgage Investment Corporation | | | | | | | | | | | 20,987 | | | | 402,950 | |
New York Mortgage Trust Incorporated | | | | | | | | | | | 54,068 | | | | 338,466 | |
PennyMac Mortgage Investment Trust | | | | | | | | | | | 21,842 | | | | 377,648 | |
Redwood Trust Incorporated | | | | | | | | | | | 30,692 | | | | 511,943 | |
Western Asset Mortgage Capital REIT | | | | | | | | | | | 30,495 | | | | 320,502 | |
| |
| | | | 7,639,508 | |
| | | | | | | | | | | | | | | | |
| | | | |
| Thrifts & Mortgage Finance: 2.60% | | | | | | | | | | | | | | | | |
Astoria Financial Corporation | | | | | | | | | | | 36,876 | | | | 722,401 | |
Bank Mutual Corporation | | | | | | | | | | | 37,896 | | | | 346,748 | |
Beneficial Bancorp Incorporated | | | | | | | | | | | 38,393 | | | | 573,975 | |
Bofi Holding Incorporated † | | | | | | | | | | | 21,295 | | | | 564,530 | |
Capitol Federal Financial Incorporated | | | | | | | | | | | 42,840 | | | | 587,765 | |
Charter Financial Corporation | | | | | | | | | | | 275 | | | | 4,472 | |
Clifton Bancorp Incorporated | | | | | | | | | | | 200 | | | | 3,150 | |
Dime Community Bancshares | | | | | | | | | | | 20,720 | | | | 392,644 | |
Essent Group Limited † | | | | | | | | | | | 29,438 | | | | 1,150,437 | |
Federal Agricultural Mortgage Corporation Class C | | | | | | | | | | | 4,259 | | | | 290,123 | |
First Defiance Financial Corporation | | | | | | | | | | | 6,506 | | | | 318,534 | |
Flagstar Bancorp Incorporated † | | | | | | | | | | | 8,764 | | | | 287,634 | |
Hingham Institution For Savings Corporation | | | | | | | | | | | 29 | | | | 5,336 | |
Home Bancorp Incorporated | | | | | | | | | | | 133 | | | | 5,371 | |
Homestreet Incorporated † | | | | | | | | | | | 12,575 | | | | 317,519 | |
Kearny Financial Corporation | | | | | | | | | | | 39,425 | | | | 557,864 | |
LendingTree Incorporated † | | | | | | | | | | | 2,804 | | | | 647,584 | |
Meridian Bancorp Incorporated | | | | | | | | | | | 31,807 | | | | 559,803 | |
Meta Financial Group Incorporated | | | | | | | | | | | 4,592 | | | | 322,818 | |
Nationstar Mortgage Holdings † | | | | | | | | | | | 15,234 | | | | 262,329 | |
NMI Holdings Incorporated Class A † | | | | | | | | | | | 31,289 | | | | 339,486 | |
Northfield Bancorp Incorporated | | | | | | | | | | | 33,891 | | | | 545,984 | |
Northwest Bancshares Incorporated | | | | | | | | | | | 30,840 | | | | 475,861 | |
Oceanfirst Financial Corporation | | | | | | | | | | | 15,339 | | | | 382,861 | |
Oritani Financial Corporation | | | | | | | | | | | 19,628 | | | | 315,029 | |
Pennymac Financial Service Incorporated † | | | | | | | | | | | 16,110 | | | | 273,870 | |
Provident Financial Services Incorporated | | | | | | | | | | | 23,844 | | | | 592,523 | |
Trustco Bank Corporation | | | | | | | | | | | 54,536 | | | | 430,834 | |
United Community Financial Corporation | | | | | | | | | | | 31,349 | | | | 284,962 | |
United Financial Bancorp Incorporated | | | | | | | | | | | 24,188 | | | | 418,936 | |
Walker & Dunlop Incorporated † | | | | | | | | | | | 11,441 | | | | 551,342 | |
Washington Federal Incorporated | | | | | | | | | | | 20,461 | | | | 639,406 | |
Waterstone Financial Incorporated | | | | | | | | | | | 20,626 | | | | 364,049 | |
Western New England Bancorp | | | | | | | | | | | 491 | | | | 4,885 | |
WSFS Financial Corporation | | | | | | | | | | | 12,502 | | | | 558,839 | |
| |
| | | | 14,099,904 | |
| | | | | | | | | | | | | | | | |
The accompanying notes are an integral part of these financial statements.
| | | | | | |
| Portfolio of investments—August 31, 2017 (unaudited) | | Wells Fargo Target Date Funds | | | 163 | |
FACTOR ENHANCED SMALL CAP PORTFOLIO
| | | | | | | | | | | | | | | | |
| Security name | | | | | | | | Shares | | | Value | |
| | | | |
Health Care: 12.15% | | | | | | | | | | | | | | | | |
| | | | |
| Biotechnology: 3.02% | | | | | | | | | | | | | | | | |
Achaogen Incorporated † | | | | | | | | | | | 13,855 | | | $ | 259,643 | |
Acorda Therapeutics Incorporated † | | | | | | | | | | | 18,684 | | | | 388,627 | |
AMAG Pharmaceuticals Incorporated † | | | | | | | | | | | 16,016 | | | | 267,467 | |
Arena Pharmaceuticals Incorporated † | | | | | | | | | | | 14,524 | | | | 336,666 | |
Array BioPharma Incorporated † | | | | | | | | | | | 71,642 | | | | 693,495 | |
Biocryst Pharmaceuticals Incorporated † | | | | | | | | | | | 46,490 | | | | 237,099 | |
Biotime Incorporated † | | | | | | | | | | | 1,621 | | | | 4,750 | |
Blueprint Medicines Corporation † | | | | | | | | | | | 12,542 | | | | 680,027 | |
Coherus Biosciences Incorporated † | | | | | | | | | | | 19,005 | | | | 274,622 | |
Cytokinetics Incorporated † | | | | | | | | | | | 21,081 | | | | 313,053 | |
Cytomx Therapeutics Incorporated † | | | | | | | | | | | 16,926 | | | | 292,481 | |
Eagle Pharmaceuticals Incorporated † | | | | | | | | | | | 4,260 | | | | 232,426 | |
Emergent BioSolutions Incorporated † | | | | | | | | | | | 13,105 | | | | 489,210 | |
Enanta Pharmaceuticals Incorporated † | | | | | | | | | | | 9,241 | | | | 396,069 | |
Exact Sciences Corporation † | | | | | | | | | | | 42,458 | | | | 1,778,566 | |
Fibrogen Incorporated † | | | | | | | | | | | 25,350 | | | | 1,221,870 | |
Foundation Medicine Incorporated † | | | | | | | | | | | 6,881 | | | | 277,304 | |
Genomic Health Incorporated † | | | | | | | | | | | 8,451 | | | | 267,897 | |
Immunogen Incorporated † | | | | | | | | | | | 44,782 | | | | 374,378 | |
Insys Therapeutics Incorporated † | | | | | | | | | | | 20,539 | | | | 187,726 | |
Invitae Corporation † | | | | | | | | | | | 555 | | | | 5,450 | |
Ironwood Pharmaceuticals Incorporated † | | | | | | | | | | | 61,654 | | | | 983,381 | |
Ligand Pharmaceuticals Incorporated † | | | | | | | | | | | 7,652 | | | | 986,113 | |
Merrimack Pharmaceuticals Incorporated | | | | | | | | | | | 1,433 | | | | 1,949 | |
MiMedx Group Incorporated † | | | | | | | | | | | 42,116 | | | | 685,227 | |
Momenta Pharmaceuticals Incorporated † | | | | | | | | | | | 33,087 | | | | 557,516 | |
Myriad Genetics Incorporated † | | | | | | | | | | | 27,714 | | | | 845,000 | |
Natera Incorporated † | | | | | | | | | | | 12,623 | | | | 155,894 | |
PDL BioPharma Incorporated † | | | | | | | | | | | 90,935 | | | | 283,717 | |
Progenics Pharmaceuticals Incorporated † | | | | | | | | | | | 43,766 | | | | 294,545 | |
Repligen Corporation † | | | | | | | | | | | 14,180 | | | | 619,241 | |
Retrophin Incorporated † | | | | | | | | | | | 19,793 | | | | 482,949 | |
Rigel Pharmaceuticals Incorporated † | | | | | | | | | | | 100,009 | | | | 255,023 | |
Spectrum Pharmaceuticals Incorporated † | | | | | | | | | | | 38,471 | | | | 375,477 | |
Vanda Pharmaceuticals Incorporated † | | | | | | | | | | | 24,923 | | | | 428,676 | |
Xencor Incorporated † | | | | | | | | | | | 19,962 | | | | 431,578 | |
| |
| | | | 16,365,112 | |
| | | | | | | | | | | | | | | | |
| | | | |
| Health Care Equipment & Supplies: 3.65% | | | | | | | | | | | | | | | | |
Abaxis Incorporated | | | | | | | | | | | 8,974 | | | | 414,778 | |
Accuray Incorporated † | | | | | | | | | | | 79,905 | | | | 331,606 | |
Analogic Corporation | | | | | | | | | | | 6,014 | | | | 430,302 | |
AngioDynamics Incorporated † | | | | | | | | | | | 19,593 | | | | 333,669 | |
Anika Therapeutics Incorporated † | | | | | | | | | | | 7,201 | | | | 386,694 | |
Antares Pharma Incorporated † | | | | | | | | | | | 87,426 | | | | 263,152 | |
Atricure Incorporated † | | | | | | | | | | | 16,057 | | | | 360,159 | |
Atrion Corporation | | | | | | | | | | | 714 | | | | 444,215 | |
Axogen Incorporated † | | | | | | | | | | | 16,380 | | | | 288,288 | |
The accompanying notes are an integral part of these financial statements.
| | | | |
| 164 | | Wells Fargo Target Date Funds | | Portfolio of investments—August 31, 2017 (unaudited) |
FACTOR ENHANCED SMALL CAP PORTFOLIO
| | | | | | | | | | | | | | | | |
| Security name | | | | | | | | Shares | | | Value | |
| | | | |
| Health Care Equipment & Supplies (continued) | | | | | | | | | | | | | | | | |
Cantel Medical Corporation | | | | | | | | | | | 12,469 | | | $ | 1,013,106 | |
Cardiovascular Systems Incorporated † | | | | | | | | | | | 12,017 | | | | 352,939 | |
CONMED Corporation | | | | | | | | | | | 10,104 | | | | 501,158 | |
CryoLife Incorporated † | | | | | | | | | | | 16,778 | | | | 348,982 | |
Cutera Incorporated † | | | | | | | | | | | 9,624 | | | | 357,532 | |
Exactech Incorporated † | | | | | | | | | | | 166 | | | | 5,071 | |
Glaukos Corporation † | | | | | | | | | | | 9,924 | | | | 374,631 | |
Globus Medical Incorporated † | | | | | | | | | | | 25,174 | | | | 761,010 | |
Haemonetics Corporation † | | | | | | | | | | | 19,411 | | | | 835,061 | |
Halyard Health Incorporated † | | | | | | | | | | | 16,091 | | | | 728,762 | |
Heska Corporation † | | | | | | | | | | | 3,198 | | | | 325,301 | |
ICU Medical Incorporated † | | | | | | | | | | | 5,483 | | | | 955,961 | |
Inogen Incorporated † | | | | | | | | | | | 6,194 | | | | 593,385 | |
Integer Holdings Corporation † | | | | | | | | | | | 11,850 | | | | 544,508 | |
Integra LifeSciences Holdings Corporation † | | | | | | | | | | | 20,374 | | | | 1,038,870 | |
Invacare Corporation | | | | | | | | | | | 20,729 | | | | 279,842 | |
iRhythm Technologies Incorporated † | | | | | | | | | | | 6,363 | | | | 303,770 | |
K2M Group Holdings Incorporated † | | | | | | | | | | | 17,792 | | | | 415,977 | |
Lantheus Holdings Incorporated † | | | | | | | | | | | 14,784 | | | | 258,720 | |
Lemaitre Vascular Incorporated | | | | | | | | | | | 7,177 | | | | 261,243 | |
Meridian Diagnostics Incorporated | | | | | | | | | | | 22,379 | | | | 311,068 | |
Merit Medical Systems Incorporated † | | | | | | | | | | | 18,757 | | | | 774,664 | |
Natus Medical Incorporated † | | | | | | | | | | | 13,063 | | | | 438,917 | |
Neogen Corporation † | | | | | | | | | | | 14,900 | | | | 1,026,610 | |
NxStage Medical Incorporated † | | | | | | | | | | | 25,480 | | | | 713,440 | |
OraSure Technologies Incorporated † | | | | | | | | | | | 25,614 | | | | 522,782 | |
Oxford Immunotec Global plc † | | | | | | | | | | | 18,176 | | | | 287,544 | |
Penumbra Incorporated † | | | | | | | | | | | 10,945 | | | | 941,270 | |
Quidel Corporation † | | | | | | | | | | | 10,953 | | | | 382,698 | |
STAAR Surgical Company † | | | | | | | | | | | 524 | | | | 6,262 | |
Surmodics Incorporated † | | | | | | | | | | | 12,475 | | | | 324,350 | |
Varex Imaging Corporation † | | | | | | | | | | | 15,972 | | | | 487,625 | |
| |
| | | | 19,725,922 | |
| | | | | | | | | | | | | | | | |
| | | | |
| Health Care Providers & Services: 2.32% | | | | | | | | | | | | | | | | |
AAC Holdings Incorporated † | | | | | | | | | | | 32,795 | | | | 304,666 | |
Aceto Corporation | | | | | | | | | | | 17,521 | | | | 185,898 | |
Almost Family Incorporated † | | | | | | | | | | | 6,449 | | | | 314,066 | |
Amedisys Incorporated † | | | | | | | | | | | 10,315 | | | | 538,856 | |
AMN Healthcare Services Incorporated † | | | | | | | | | | | 19,056 | | | | 711,742 | |
Biotelemetry Incorporated † | | | | | | | | | | | 11,081 | | | | 411,659 | |
Chemed Corporation | | | | | | | | | | | 5,678 | | | | 1,120,212 | |
CorVel Corporation † | | | | | | | | | | | 6,137 | | | | 318,510 | |
Cross Country Healthcare Incorporated † | | | | | | | | | | | 22,229 | | | | 275,195 | |
Diplomat Pharmacy Incorporated † | | | | | | | | | | | 21,275 | | | | 356,356 | |
Ensign Group Incorporated | | | | | | | | | | | 22,520 | | | | 462,561 | |
Landauer Incorporated | | | | | | | | | | | 5,818 | | | | 361,007 | |
LHC Group Incorporated † | | | | | | | | | | | 7,168 | | | | 467,712 | |
LifePoint Hospitals Incorporated † | | | | | | | | | | | 14,421 | | | | 835,697 | |
Magellan Health Services Incorporated † | | | | | | | | | | | 9,592 | | | | 775,993 | |
The accompanying notes are an integral part of these financial statements.
| | | | | | |
| Portfolio of investments—August 31, 2017 (unaudited) | | Wells Fargo Target Date Funds | | | 165 | |
FACTOR ENHANCED SMALL CAP PORTFOLIO
| | | | | | | | | | | | | | | | |
| Security name | | | | | | | | Shares | | | Value | |
| | | | |
| Health Care Providers & Services (continued) | | | | | | | | | | | | | | | | |
Molina Healthcare Incorporated † | | | | | | | | | | | 16,969 | | | $ | 1,086,016 | |
National Healthcare Corporation | | | | | | | | | | | 5,020 | | | | 312,947 | |
Owens & Minor Incorporated | | | | | | | | | | | 22,555 | | | | 630,187 | |
PharMerica Corporation † | | | | | | | | | | | 13,992 | | | | 411,365 | |
Premier Incorporated Class A † | | | | | | | | | | | 15,238 | | | | 510,473 | |
Providence Service Corporation † | | | | | | | | | | | 7,103 | | | | 368,148 | |
R1 RCM Incorporated † | | | | | | | | | | | 1,382 | | | | 4,561 | |
Radnet Incorporated † | | | | | | | | | | | 654 | | | | 6,704 | |
Select Medical Holdings Corporation † | | | | | | | | | | | 41,414 | | | | 770,300 | |
Surgery Partners Incorporated † | | | | | | | | | | | 12,424 | | | | 121,134 | |
Tivity Health Incorporated † | | | | | | | | | | | 13,592 | | | | 532,806 | |
U.S. Physical Therapy Incorporated | | | | | | | | | | | 6,373 | | | | 381,743 | |
| |
| | | | 12,576,514 | |
| | | | | | | | | | | | | | | | |
| | | | |
| Health Care Technology: 0.80% | | | | | | | | | | | | | | | | |
Allscripts Healthcare Solutions Incorporated † | | | | | | | | | | | 70,801 | | | | 930,325 | |
Computer Programs & Systems Incorporated | | | | | | | | | | | 8,392 | | | | 252,599 | |
Cotiviti Holdings Incorporated † | | | | | | | | | | | 12,145 | | | | 433,941 | |
HealthStream Incorporated † | | | | | | | | | | | 13,271 | | | | 311,736 | |
HMS Holdings Corporation † | | | | | | | | | | | 31,150 | | | | 551,978 | |
Inovalon Holdings Incorporated Class A † | | | | | | | | | | | 26,517 | | | | 359,305 | |
Omnicell Incorporated † | | | | | | | | | | | 15,130 | | | | 776,169 | |
Quality Systems Incorporated † | | | | | | | | | | | 22,110 | | | | 348,233 | |
Vocera Communications Incorporated † | | | | | | | | | | | 13,533 | | | | 376,894 | |
| |
| | | | 4,341,180 | |
| | | | | | | | | | | | | | | | |
| | | | |
| Life Sciences Tools & Services: 1.04% | | | | | | | | | | | | | | | | |
Albany Molecular Research Incorporated † | | | | | | | | | | | 12,512 | | | | 272,011 | |
Cambrex Corporation † | | | | | | | | | | | 12,938 | | | | 674,070 | |
Enzo Biochem Incorporated † | | | | | | | | | | | 26,494 | | | | 298,058 | |
INC Research Holdings Incorporated Class A † | | | | | | | | | | | 21,153 | | | | 1,241,681 | |
Luminex Corporation | | | | | | | | | | | 21,095 | | | | 407,766 | |
Neogenomics Incorporated † | | | | | | | | | | | 42,055 | | | | 425,176 | |
PRA Health Sciences Incorporated † | | | | | | | | | | | 14,995 | | | | 1,160,613 | |
VWR Corporation † | | | | | | | | | | | 34,147 | | | | 1,127,534 | |
| |
| | | | 5,606,909 | |
| | | | | | | | | | | | | | | | |
|
| Pharmaceuticals: 1.32% | |
Akorn Incorporated † | | | | | | | | | | | 35,938 | | | | 1,182,360 | |
Amphastar Pharmaceuticals Incorporated † | | | | | | | | | | | 17,637 | | | | 282,368 | |
ANI Pharmaceuticals Incorporated † | | | | | | | | | | | 5,788 | | | | 277,824 | |
Corcept Therapeutics Incorporated † | | | | | | | | | | | 38,913 | | | | 648,680 | |
Depomed Incorporated † | | | | | | | | | | | 31,520 | | | | 191,642 | |
Endo International plc † | | | | | | | | | | | 83,268 | | | | 731,926 | |
Horizon Pharma plc † | | | | | | | | | | | 63,378 | | | | 867,011 | |
Innoviva Incorporated † | | | | | | | | | | | 29,941 | | | | 420,372 | |
Intersect ENT Incorporated † | | | | | | | | | | | 11,878 | | | | 367,030 | |
Lannett Company Incorporated † | | | | | | | | | | | 14,340 | | | | 251,667 | |
Phibro Animal Health Corporation Class A | | | | | | | | | | | 7,910 | | | | 280,805 | |
The accompanying notes are an integral part of these financial statements.
| | | | |
| 166 | | Wells Fargo Target Date Funds | | Portfolio of investments—August 31, 2017 (unaudited) |
FACTOR ENHANCED SMALL CAP PORTFOLIO
| | | | | | | | | | | | | | | | |
| Security name | | | | | | | | Shares | | | Value | |
|
| Pharmaceuticals (continued) | |
Sciclone Pharmaceuticals Incorporated † | | | | | | | | | | | 24,756 | | | $ | 272,316 | |
Sucampo Pharmaceuticals Class A † | | | | | | | | | | | 25,469 | | | | 299,261 | |
Supernus Pharmaceuticals Incorporated † | | | | | | | | | | | 18,993 | | | | 869,879 | |
Teligent Incorporated † | | | | | | | | | | | 30,252 | | | | 209,041 | |
| |
| | | | 7,152,182 | |
| | | | | | | | | | | | | | | | |
| | | | |
Industrials: 14.36% | | | | | | | | | | | | | | | | |
| | | | |
| Aerospace & Defense: 1.53% | | | | | | | | | | | | | | | | |
AAR Corporation | | | | | | | | | | | 13,342 | | | | 481,113 | |
Aerojet Rocketdyne Holdings † | | | | | | | | | | | 25,452 | | | | 754,143 | |
Astronics Corporation | | | | | | | | | | | 10,625 | | | | 279,331 | |
Cubic Corporation | | | | | | | | | | | 11,282 | | | | 484,562 | |
DigitalGlobe Incorporated † | | | | | | | | | | | 24,759 | | | | 851,710 | |
Ducommun Incorporated † | | | | | | | | | | | 8,511 | | | | 234,053 | |
Engility Holdings Incorporated † | | | | | | | | | | | 9,659 | | | | 300,105 | |
Esterline Technologies Corporation † | | | | | | | | | | | 10,654 | | | | 909,852 | |
HEICO Corporation | | | | | | | | | | | 5,902 | | | | 506,214 | |
KLX Incorporated † | | | | | | | | | | | 19,929 | | | | 955,396 | |
Mercury Computer Systems Incorporated † | | | | | | | | | | | 15,545 | | | | 750,046 | |
Moog Incorporated Class A † | | | | | | | | | | | 12,739 | | | | 977,846 | |
National Presto Industries Incorporated | | | | | | | | | | | 3,238 | | | | 322,505 | |
Vectrus Incorporated † | | | | | | | | | | | 8,281 | | | | 236,671 | |
Wesco Aircraft Holdings Incorporated † | | | | | | | | | | | 30,111 | | | | 252,932 | |
| |
| | | | 8,296,479 | |
| | | | | | | | | | | | | | | | |
| | | | |
| Air Freight & Logistics: 0.46% | | | | | | | | | | | | | | | | |
Air Transport Services Group † | | | | | | | | | | | 21,741 | | | | 499,173 | |
Atlas Air Worldwide Holdings Incorporated † | | | | | | | | | | | 9,034 | | | | 603,471 | |
Echo Global Logistics Incorporated † | | | | | | | | | | | 18,588 | | | | 282,538 | |
Forward Air Corporation | | | | | | | | | | | 11,270 | | | | 585,702 | |
Hub Group Incorporated Class A † | | | | | | | | | | | 13,879 | | | | 533,648 | |
| |
| | | | 2,504,532 | |
| | | | | | | | | | | | | | | | |
| | | | |
| Airlines: 0.12% | | | | | | | | | | | | | | | | |
Allegiant Travel Company | | | | | | | | | | | 5,500 | | | | 649,000 | |
| | | | | | | | | | | | | | | | |
| | | | |
| Building Products: 1.49% | | | | | | | | | | | | | | | | |
Aaon Incorporated | | | | | | | | | | | 17,128 | | | | 558,373 | |
Advanced Drainage Systems Incorporated | | | | | | | | | | | 17,397 | | | | 338,372 | |
American Woodmark Corporation † | | | | | | | | | | | 4,830 | | | | 399,924 | |
Apogee Enterprises Incorporated | | | | | | | | | | | 9,608 | | | | 419,870 | |
Armstrong Flooring Incorporated † | | | | | | | | | | | 14,937 | | | | 222,860 | |
Builders FirstSource Incorporated † | | | | | | | | | | | 33,858 | | | | 551,208 | |
Continental Building Product † | | | | | | | | | | | 15,000 | | | | 365,250 | |
CSW Industrials Incorporated † | | | | | | | | | | | 10,489 | | | | 438,965 | |
Gibraltar Industries Incorporated † | | | | | | | | | | | 13,785 | | | | 403,211 | |
Griffon Corporation | | | | | | | | | | | 20,119 | | | | 373,207 | |
Insteel Industries Incorporated | | | | | | | | | | | 9,161 | | | | 229,666 | |
JELD-WEN Holding Incorporated † | | | | | | | | | | | 9,442 | | | | 288,170 | |
The accompanying notes are an integral part of these financial statements.
| | | | | | |
| Portfolio of investments—August 31, 2017 (unaudited) | | Wells Fargo Target Date Funds | | | 167 | |
FACTOR ENHANCED SMALL CAP PORTFOLIO
| | | | | | | | | | | | | | | | |
| Security name | | | | | | | | Shares | | | Value | |
| | | | |
| Building Products (continued) | | | | | | | | | | | | | | | | |
NCI Building Systems Incorporated † | | | | | | | | | | | 17,773 | | | $ | 298,586 | |
Patrick Industries Incorporated † | | | | | | | | | | | 5,805 | | | | 429,570 | |
Ply Gem Holdings Incorporated † | | | | | | | | | | | 15,298 | | | | 237,884 | |
Quanex Building Products Corporation | | | | | | | | | | | 20,249 | | | | 396,880 | |
Simpson Manufacturing Company Incorporated | | | | | | | | | | | 13,860 | | | | 606,791 | |
Trex Company Incorporated † | | | | | | | | | | | 10,899 | | | | 828,324 | |
Universal Forest Products Incorporated | | | | | | | | | | | 7,716 | | | | 672,912 | |
| |
| | | | 8,060,023 | |
| | | | | | | | | | | | | | | | |
| | | | |
| Commercial Services & Supplies: 2.69% | | | | | | | | | | | | | | | | |
ABM Industries Incorporated | | | | | | | | | | | 19,449 | | | | 864,119 | |
ACCO Brands Corporation † | | | | | | | | | | | 40,663 | | | | 445,260 | |
Brady Corporation Class A | | | | | | | | | | | 18,111 | | | | 604,002 | |
Brink’s Company | | | | | | | | | | | 18,171 | | | | 1,425,515 | |
Casella Waste Systems Incorporated Class A † | | | | | | | | | | | 21,039 | | | | 353,666 | |
Covanta Holding Corporation | | | | | | | | | | | 52,562 | | | | 754,265 | |
Ennis Incorporated | | | | | | | | | | | 21,635 | | | | 413,229 | |
Essendant Incorporated | | | | | | | | | | | 21,945 | | | | 260,268 | |
Herman Miller Incorporated | | | | | | | | | | | 23,989 | | | | 807,230 | |
Hudson Technologies Incorporated † | | | | | | | | | | | 30,679 | | | | 273,043 | |
InnerWorkings Incorporated † | | | | | | | | | | | 31,129 | | | | 325,921 | |
Interface Incorporated | | | | | | | | | | | 25,325 | | | | 481,175 | |
Kimball International Incorporated Class B | | | | | | | | | | | 297 | | | | 5,037 | |
Knoll Incorporated | | | | | | | | | | | 22,687 | | | | 409,500 | |
LSC Communications Incorporated | | | | | | | | | | | 14,020 | | | | 225,862 | |
Matthews International Corporation Class A | | | | | | | | | | | 13,240 | | | | 797,710 | |
Mcgrath RentCorp | | | | | | | | | | | 12,180 | | | | 491,707 | |
MSA Safety Incorporated | | | | | | | | | | | 11,909 | | | | 867,690 | |
Multi-Color Corporation | | | | | | | | | | | 6,159 | | | | 491,488 | |
Quad Graphics Incorporated | | | | | | | | | | | 12,519 | | | | 238,612 | |
SP Plus Corporation † | | | | | | | | | | | 8,810 | | | | 325,089 | |
Steelcase Incorporated Class A | | | | | | | | | | | 28,082 | | | | 370,682 | |
Tetra Tech Incorporated | | | | | | | | | | | 18,113 | | | | 771,614 | |
UniFirst Corporation | | | | | | | | | | | 5,455 | | | | 783,338 | |
US Ecology Incorporated | | | | | | | | | | | 10,191 | | | | 523,817 | |
Viad Corporation | | | | | | | | | | | 9,030 | | | | 496,199 | |
VSE Corporation | | | | | | | | | | | 6,406 | | | | 334,073 | |
West Corporation | | | | | | | | | | | 17,919 | | | | 418,767 | |
| |
| | | | 14,558,878 | |
| | | | | | | | | | | | | | | | |
| | | | |
| Construction & Engineering: 0.47% | | | | | | | | | | | | | | | | |
Argan Incorporated | | | | | | | | | | | 6,474 | | | | 410,128 | |
Comfort Systems USA Incorporated | | | | | | | | | | | 16,613 | | | | 565,673 | |
Great Lakes Dredge & Dock Company † | | | | | | | | | | | 1,124 | | | | 4,552 | |
MYR Group Incorporated † | | | | | | | | | | | 11,078 | | | | 285,923 | |
Nv5 Global Incorporated † | | | | | | | | | | | 6,637 | | | | 320,235 | |
Primoris Services Corporation | | | | | | | | | | | 18,281 | | | | 523,019 | |
Tutor Perini Corporation † | | | | | | | | | | | 15,889 | | | | 415,497 | |
| |
| | | | 2,525,027 | |
| | | | | | | | | | | | | | | | |
The accompanying notes are an integral part of these financial statements.
| | | | |
| 168 | | Wells Fargo Target Date Funds | | Portfolio of investments—August 31, 2017 (unaudited) |
FACTOR ENHANCED SMALL CAP PORTFOLIO
| | | | | | | | | | | | | | | | |
| Security name | | | | | | | | Shares | | | Value | |
| | | | |
| Electrical Equipment: 0.63% | | | | | | | | | | | | | | | | |
Atkore International Incorporated † | | | | | | | | | | | 14,895 | | | $ | 248,151 | |
AZZ Incorporated | | | | | | | | | | | 10,961 | | | | 535,993 | |
Babcock & Wilcox Enterprises Incorporated † | | | | | | | | | | | 28,076 | | | | 63,452 | |
Encore Wire Corporation | | | | | | | | | | | 10,488 | | | | 449,935 | |
Generac Holdings Incorporated † | | | | | | | | | | | 22,387 | | | | 903,987 | |
General Cable Corporation | | | | | | | | | | | 19,361 | | | | 328,169 | |
Powell Industries Incorporated | | | | | | | | | | | 150 | | | | 4,271 | |
Sunrun Incorporated † | | | | | | | | | | | 40,230 | | | | 269,541 | |
Thermon Group Holdings Incorporated † | | | | | | | | | | | 23,169 | | | | 382,752 | |
Vicor Corporation † | | | | | | | | | | | 12,831 | | | | 249,563 | |
| |
| | | | 3,435,814 | |
| | | | | | | | | | | | | | | | |
| | | | |
| Electronic Equipment, Instruments & Components: 0.09% | | | | | | | | | | | | | | | | |
ScanSource Incorporated † | | | | | | | | | | | 12,230 | | | | 480,028 | |
| | | | | | | | | | | | | | | | |
| | | | |
| Industrial Conglomerates: 0.08% | | | | | | | | | | | | | | | | |
Raven Industries Incorporated | | | | | | | | | | | 15,627 | | | | 437,556 | |
| | | | | | | | | | | | | | | | |
| | | | |
| Machinery: 3.32% | | | | | | | | | | | | | | | | |
Alamo Group Incorporated | | | | | | | | | | | 4,702 | | | | 431,456 | |
Albany International Corporation Class A | | | | | | | | | | | 9,290 | | | | 497,944 | |
Altra Holdings Incorporated | | | | | | | | | | | 13,170 | | | | 606,479 | |
American Railcar Industries | | | | | | | | | | | 137 | | | | 4,932 | |
Astec Industries Incorporated | | | | | | | | | | | 9,937 | | | | 493,670 | |
Barnes Group Incorporated | | | | | | | | | | | 17,776 | | | | 1,111,356 | |
Briggs & Stratton Corporation | | | | | | | | | | | 17,723 | | | | 371,120 | |
Columbus McKinnon Corporation | | | | | | | | | | | 10,921 | | | | 360,721 | |
Douglas Dynamics Incorporated | | | | | | | | | | | 12,072 | | | | 421,313 | |
EnPro Industries Incorporated | | | | | | | | | | | 8,781 | | | | 618,797 | |
ESCO Technologies Incorporated | | | | | | | | | | | 10,843 | | | | 590,401 | |
Federal Signal Corporation | | | | | | | | | | | 29,160 | | | | 545,000 | |
Franklin Electric Company Incorporated | | | | | | | | | | | 16,819 | | | | 648,372 | |
Global Brass & Copper Holdings Incorporated | | | | | | | | | | | 11,484 | | | | 342,797 | |
Hillenbrand Incorporated | | | | | | | | | | | 20,322 | | | | 726,511 | |
Hurco Companies Incorporated | | | | | | | | | | | 152 | | | | 5,343 | |
Hyster Yale Materials | | | | | | | | | | | 3,828 | | | | 272,477 | |
John Bean Technologies Corporation | | | | | | | | | | | 11,912 | | | | 1,056,594 | |
Kadant Incorporated | | | | | | | | | | | 5,552 | | | | 482,191 | |
Lindsay Manufacturing Company | | | | | | | | | | | 5,568 | | | | 482,022 | |
Lydall Incorporated † | | | | | | | | | | | 8,350 | | | | 392,450 | |
Meritor Incorporated † | | | | | | | | | | | 31,464 | | | | 624,875 | |
Milacron Holdings Corporation † | | | | | | | | | | | 16,594 | | | | 264,674 | |
Miller Industries Incorporated | | | | | | | | | | | 198 | | | | 4,970 | |
Mueller Industries Incorporated | | | | | | | | | | | 21,288 | | | | 635,021 | |
NN Incorporated | | | | | | | | | | | 12,154 | | | | 309,927 | |
Omega Flex Incorporated | | | | | | | | | | | 81 | | | | 4,697 | |
Park Ohio Holdings Corporation | | | | | | | | | | | 2,989 | | | | 119,112 | |
RBC Bearings Incorporated † | | | | | | | | | | | 8,889 | | | | 980,190 | |
REV Group Incorporated | | | | | | | | | | | 9,778 | | | | 246,308 | |
SPX Corporation † | | | | | | | | | | | 18,741 | | | | 451,658 | |
The accompanying notes are an integral part of these financial statements.
| | | | | | |
| Portfolio of investments—August 31, 2017 (unaudited) | | Wells Fargo Target Date Funds | | | 169 | |
FACTOR ENHANCED SMALL CAP PORTFOLIO
| | | | | | | | | | | | | | | | |
| Security name | | | | | | | | Shares | | | Value | |
| | | | |
| Machinery (continued) | | | | | | | | | | | | | | | | |
Standex International Corporation | | | | | | | | | | | 5,262 | | | $ | 502,258 | |
Tennant Company | | | | | | | | | | | 8,762 | | | | 534,044 | |
The Greenbrier Companies Incorporated | | | | | | | | | | | 10,207 | | | | 437,880 | |
Titan International Incorporated | | | | | | | | | | | 25,616 | | | | 219,785 | |
Wabash National Corporation | | | | | | | | | | | 25,690 | | | | 540,004 | |
Watts Water Technologies Incorporated | | | | | | | | | | | 10,510 | | | | 648,467 | |
Welbilt Incorporated † | | | | | | | | | | | 51,303 | | | | 1,020,930 | |
| |
| | | | 18,006,746 | |
| | | | | | | | | | | | | | | | |
| | | | |
| Marine: 0.09% | | | | | | | | | | | | | | | | |
Matson Incorporated | | | | | | | | | | | 18,294 | | | | 471,985 | |
| | | | | | | | | | | | | | | | |
| | | | |
| Professional Services: 1.50% | | | | | | | | | | | | | | | | |
Barrett Business Services Incorporated | | | | | | | | | | | 4,784 | | | | 246,759 | |
CBIZ Incorporated † | | | | | | | | | | | 32,677 | | | | 495,057 | |
CRA International Incorporated | | | | | | | | | | | 100 | | | | 3,753 | |
Exponent Incorporated | | | | | | | | | | | 9,746 | | | | 663,703 | |
FTI Consulting Incorporated † | | | | | | | | | | | 16,583 | | | | 562,330 | |
GP Strategies Corporation † | | | | | | | | | | | 13,147 | | | | 376,004 | |
Heidrick & Struggles International Incorporated | | | | | | | | | | | 12,537 | | | | 228,800 | |
ICF International Incorporated † | | | | | | | | | | | 9,364 | | | | 449,940 | |
Insperity Incorporated | | | | | | | | | | | 6,902 | | | | 554,231 | |
Kelly Services Incorporated Class A | | | | | | | | | | | 17,474 | | | | 377,963 | |
Kforce Incorporated | | | | | | | | | | | 13,307 | | | | 239,526 | |
Mistras Group Incorporated † | | | | | | | | | | | 13,836 | | | | 261,639 | |
Navigant Consulting Incorporated † | | | | | | | | | | | 22,555 | | | | 345,768 | |
On Assignment Incorporated † | | | | | | | | | | | 18,810 | | | | 897,237 | |
Resources Connection Incorporated | | | | | | | | | | | 23,297 | | | | 297,037 | |
RPX Corporation † | | | | | | | | | | | 24,479 | | | | 319,696 | |
The Advisory Board Company † | | | | | | | | | | | 17,176 | | | | 914,622 | |
TriNet Group Incorporated † | | | | | | | | | | | 14,606 | | | | 521,872 | |
TrueBlue Incorporated † | | | | | | | | | | | 18,043 | | | | 368,979 | |
| |
| | | | 8,124,916 | |
| | | | | | | | | | | | | | | | |
| | | | |
| Road & Rail: 0.81% | | | | | | | | | | | | | | | | |
Arcbest Corporation | | | | | | | | | | | 11,940 | | | | 354,618 | |
Heartland Express Incorporated | | | | | | | | | | | 18,800 | | | | 416,796 | |
Knight Transportation Incorporated | | | | | | | | | | | 22,641 | | | | 884,131 | |
Marten Transport Limited | | | | | | | | | | | 21,769 | | | | 373,338 | |
Saia Incorporated † | | | | | | | | | | | 11,037 | | | | 624,142 | |
Swift Transportation Company † | | | | | | | | | | | 29,761 | | | | 834,796 | |
Werner Enterprises Incorporated | | | | | | | | | | | 16,800 | | | | 556,080 | |
YRC Worldwide Incorporated † | | | | | | | | | | | 23,919 | | | | 320,275 | |
| |
| | | | 4,364,176 | |
| | | | | | | | | | | | | | | | |
| | | | |
| Trading Companies & Distributors: 1.08% | | | | | | | | | | | | | | | | |
Applied Industrial Technologies Incorporated | | | | | | | | | | | 13,704 | | | | 781,128 | |
BMC Stock Holdings Incorporated † | | | | | | | | | | | 24,362 | | | | 494,549 | |
CAI International Incorporated † | | | | | | | | | | | 8,577 | | | | 265,801 | |
The accompanying notes are an integral part of these financial statements.
| | | | |
| 170 | | Wells Fargo Target Date Funds | | Portfolio of investments—August 31, 2017 (unaudited) |
FACTOR ENHANCED SMALL CAP PORTFOLIO
| | | | | | | | | | | | | | | | |
| Security name | | | | | | | | Shares | | | Value | |
| | | | |
| Trading Companies & Distributors (continued) | | | | | | | | | | | | | | | | |
DXP Enterprises Incorporated † | | | | | | | | | | | 8,376 | | | $ | 226,906 | |
GATX Corporation | | | | | | | | | | | 13,809 | | | | 836,549 | |
GMS Incorporated † | | | | | | | | | | | 9,453 | | | | 304,198 | |
Kaman Corporation | | | | | | | | | | | 10,176 | | | | 499,031 | |
Nexeo Solutions Incorporated † | | | | | | | | | | | 556 | | | | 3,987 | |
Rush Enterprises Incorporated † | | | | | | | | | | | 12,760 | | | | 523,032 | |
Siteone Landscape Supply Incorporated † | | | | | | | | | | | 9,268 | | | | 465,624 | |
Titan Machinery Incorporated † | | | | | | | | | | | 15,225 | | | | 196,403 | |
Univar Incorporated † | | | | | | | | | | | 38,085 | | | | 1,074,378 | |
Veritiv Corporation † | | | | | | | | | | | 6,203 | | | | 173,684 | |
| |
| | | | 5,845,270 | |
| | | | | | | | | | | | | | | | |
| | | | |
Information Technology: 13.56% | | | | | | | | | | | | | | | | |
| | | | |
| Communications Equipment: 1.53% | | | | | | | | | | | | | | | | |
Acacia Communications Incorporated † | | | | | | | | | | | 7,610 | | | | 371,596 | |
ADTRAN Incorporated | | | | | | | | | | | 23,148 | | | | 511,571 | |
Applied Optoelectronics Incorporated † | | | | | | | | | | | 7,814 | | | | 461,964 | |
Calamp Corporation † | | | | | | | | | | | 16,429 | | | | 304,594 | |
Calix Networks Incorporated † | | | | | | | | | | | 729 | | | | 3,572 | |
Comtech Telecommunications Corporation | | | | | | | | | | | 14,152 | | | | 276,955 | |
Echostar Corporation † | | | | | | | | | | | 13,491 | | | | 813,507 | |
Emcore Corporation † | | | | | | | | | | | 466 | | | | 4,241 | |
Extreme Networks Incorporated † | | | | | | | | | | | 43,528 | | | | 497,525 | |
Harmonic Incorporated † | | | | | | | | | | | 52,326 | | | | 170,060 | |
Lumentum Holdings Incorporated † | | | | | | | | | | | 23,619 | | | | 1,342,740 | |
NETGEAR Incorporated † | | | | | | | | | | | 13,348 | | | | 640,704 | |
Oclaro Incorporated † | | | | | | | | | | | 68,605 | | | | 576,968 | |
Plantronics Incorporated | | | | | | | | | | | 11,312 | | | | 482,231 | |
ShoreTel Incorporated † | | | | | | | | | | | 41,346 | | | | 308,028 | |
Ubiquiti Networks Incorporated † | | | | | | | | | | | 10,344 | | | | 616,399 | |
Viavi Solutions Incorporated † | | | | | | | | | | | 90,428 | | | | 907,897 | |
| |
| | | | 8,290,552 | |
| | | | | | | | | | | | | | | | |
| | | | |
| Electronic Equipment, Instruments & Components: 2.24% | | | | | | | | | | | | | | | | |
Anixter International Incorporated † | | | | | | | | | | | 10,582 | | | | 780,952 | |
AVX Corporation | | | | | | | | | | | 18,837 | | | | 328,706 | |
Badger Meter Incorporated | | | | | | | | | | | 12,877 | | | | 591,054 | |
Benchmark Electronics Incorporated † | | | | | | | | | | | 18,856 | | | | 612,820 | |
Control4 Corporation † | | | | | | | | | | | 11,410 | | | | 282,512 | |
CTS Corporation | | | | | | | | | | | 21,273 | | | | 478,643 | |
Daktronics Incorporated | | | | | | | | | | | 28,317 | | | | 272,693 | |
Eplus Incorporated † | | | | | | | | | | | 6,437 | | | | 538,777 | |
II-VI Incorporated † | | | | | | | | | | | 22,856 | | | | 819,388 | |
Insight Enterprises Incorporated † | | | | | | | | | | | 15,093 | | | | 604,927 | |
Itron Incorporated † | | | | | | | | | | | 12,885 | | | | 935,451 | |
Kemet Corporation † | | | | | | | | | | | 17,393 | | | | 415,867 | |
Kimball Electronics Incorporated † | | | | | | | | | | | 12,698 | | | | 241,897 | |
Mesa Laboratories Incorporated | | | | | | | | | | | 1,920 | | | | 262,214 | |
Methode Electronics Incorporated | | | | | | | | | | | 15,142 | | | | 619,308 | |
The accompanying notes are an integral part of these financial statements.
| | | | | | |
| Portfolio of investments—August 31, 2017 (unaudited) | | Wells Fargo Target Date Funds | | | 171 | |
FACTOR ENHANCED SMALL CAP PORTFOLIO
| | | | | | | | | | | | | | | | |
| Security name | | | | | | | | Shares | | | Value | |
| | | | |
| Electronic Equipment, Instruments & Components (continued) | | | | | | | | | | | | | | | | |
MTS Systems Corporation | | | | | | | | | | | 7,790 | | | $ | 377,036 | |
OSI Systems Incorporated † | | | | | | | | | | | 7,283 | | | | 604,926 | |
Park Electrochemical Corporation | | | | | | | | | | | 18,085 | | | | 328,424 | |
PC Connection Incorporated | | | | | | | | | | | 189 | | | | 4,821 | |
Plexus Corporation † | | | | | | | | | | | 11,941 | | | | 621,887 | |
Sanmina Corporation † | | | | | | | | | | | 29,595 | | | | 1,108,333 | |
TTM Technologies Incorporated † | | | | | | | | | | | 36,990 | | | | 526,738 | |
Vishay Intertechnology Incorporated | | | | | | | | | | | 42,324 | | | | 749,135 | |
Vishay Precision Group † | | | | | | | | | | | 279 | | | | 6,096 | |
| |
| | | | 12,112,605 | |
| | | | | | | | | | | | | | | | |
| | | | |
| Internet Software & Services: 2.57% | | | | | | | | | | | | | | | | |
2U Incorporated † | | | | | | | | | | | 17,803 | | | | 891,930 | |
Actua Corporation † | | | | | | | | | | | 23,794 | | | | 304,563 | |
Alarm.com Holdings Incorporated † | | | | | | | | | | | 9,218 | | | | 414,073 | |
Angie’s List Incorporated † | | | | | | | | | | | 21,150 | | | | 257,184 | |
Appfolio Incorporated Class A † | | | | | | | | | | | 166 | | | | 7,121 | |
Bankrate Incorporated † | | | | | | | | | | | 19,367 | | | | 268,233 | |
Bazaarvoice Incorporated † | | | | | | | | | | | 65,029 | | | | 308,888 | |
Blucora Incorporated † | | | | | | | | | | | 17,684 | | | | 403,195 | |
Box Incorporated Class A † | | | | | | | | | | | 25,890 | | | | 507,962 | |
Carbonite Incorporated † | | | | | | | | | | | 13,034 | | | | 260,680 | |
ChannelAdvisor Corporation † | | | | | | | | | | | 435 | | | | 5,046 | |
Commercehub Incorporated Series C † | | | | | | | | | | | 13,470 | | | | 285,968 | |
Endurance International Group Holdings † | | | | | | | | | | | 35,286 | | | | 271,702 | |
Five9 Incorporated † | | | | | | | | | | | 22,685 | | | | 487,728 | |
GoDaddy Incorporated Class A † | | | | | | | | | | | 8,305 | | | | 372,230 | |
GTT Communications Incorporated † | | | | | | | | | | | 14,338 | | | | 455,232 | |
Instructure Incorporated † | | | | | | | | | | | 9,957 | | | | 294,727 | |
LivePerson Incorporated † | | | | | | | | | | | 25,393 | | | | 340,266 | |
Match Group Incorporated † | | | | | | | | | | | 16,909 | | | | 367,771 | |
Mindbody Incorporated Class A † | | | | | | | | | | | 11,605 | | | | 274,458 | |
Mulesoft Incorporated Class A † | | | | | | | | | | | 10,934 | | | | 238,361 | |
NIC Incorporated | | | | | | | | | | | 29,671 | | | | 485,121 | |
Nutanix Incorporated Class A † | | | | | | | | | | | 14,842 | | | | 326,524 | |
Q2 Holdings Incorporated † | | | | | | | | | | | 14,372 | | | | 583,503 | |
Quotient Technology Incorporated † | | | | | | | | | | | 29,144 | | | | 437,160 | |
Shutterstock Incorporated † | | | | | | | | | | | 7,762 | | | | 260,648 | |
SPS Commerce Incorporated † | | | | | | | | | | | 7,913 | | | | 482,060 | |
Stamps.com Incorporated † | | | | | | | | | | | 6,359 | | | | 1,216,159 | |
The Meet Group Incorporated † | | | | | | | | | | | 51,862 | | | | 203,299 | |
The Trade Desk Incorporated † | | | | | | | | | | | 7,042 | | | | 373,015 | |
TrueCar Incorporated † | | | | | | | | | | | 23,328 | | | | 395,410 | |
Twilio Incorporated Class A † | | | | | | | | | | | 19,434 | | | | 569,028 | |
Web.com Group Incorporated † | | | | | | | | | | | 20,181 | | | | 510,579 | |
WebMD Health Corporation † | | | | | | | | | | | 14,008 | | | | 930,692 | |
Xo Group Incorporated † | | | | | | | | | | | 7,613 | | | | 141,754 | |
| |
| | | | 13,932,270 | |
| | | | | | | | | | | | | | | | |
The accompanying notes are an integral part of these financial statements.
| | | | |
| 172 | | Wells Fargo Target Date Funds | | Portfolio of investments—August 31, 2017 (unaudited) |
FACTOR ENHANCED SMALL CAP PORTFOLIO
| | | | | | | | | | | | | | | | |
| Security name | | | | | | | | Shares | | | Value | |
| | | | |
| IT Services: 1.78% | | | | | | | | | | | | | | | | |
Black Knight Financial Services Incorporated Class A † | | | | | | | | | | | 9,637 | | | $ | 410,536 | |
Blackhawk Network Incorporated † | | | | | | | | | | | 21,072 | | | | 944,026 | |
Cardtronics Incorporated Class A † | | | | | | | | | | | 19,473 | | | | 505,909 | |
Cass Information Systems Incorporated | | | | | | | | | | | 7,064 | | | | 432,458 | |
Convergys Corporation | | | | | | | | | | | 38,787 | | | | 911,495 | |
CSG Systems International Incorporated | | | | | | | | | | | 12,886 | | | | 498,817 | |
Edgewater Technology Incorporated † | | | | | | | | | | | 744 | | | | 4,762 | |
Everi Holdings Incorporated † | | | | | | | | | | | 38,344 | | | | 295,632 | |
Exlservice Holdings Incorporated † | | | | | | | | | | | 13,062 | | | | 735,129 | |
Forrester Research Incorporated | | | | | | | | | | | 3,046 | | | | 124,125 | |
Hackett Group Incorporated | | | | | | | | | | | 17,482 | | | | 238,804 | |
Luxoft Holding Incorporated † | | | | | | | | | | | 8,835 | | | | 447,493 | |
ManTech International Corporation Class A | | | | | | | | | | | 11,053 | | | | 444,552 | |
Moneygram International Incorporated † | | | | | | | | | | | 15,725 | | | | 247,826 | |
Perficient Incorporated † | | | | | | | | | | | 19,788 | | | | 362,120 | |
Science Applications International Corporation | | | | | | | | | | | 12,801 | | | | 945,738 | |
Sykes Enterprises Incorporated † | | | | | | | | | | | 16,761 | | | | 446,848 | |
TeleTech Holdings Incorporated | | | | | | | | | | | 8,132 | | | | 322,840 | |
Travelport Worldwide Limited | | | | | | | | | | | 44,565 | | | | 674,714 | |
Unisys Corporation † | | | | | | | | | | | 26,793 | | | | 207,646 | |
Virtusa Corporation † | | | | | | | | | | | 11,601 | | | | 421,348 | |
| |
| | | | 9,622,818 | |
| | | | | | | | | | | | | | | | |
| | | | |
| Semiconductors & Semiconductor Equipment: 2.00% | | | | | | | | | | | | | | | | |
Advanced Energy Industries Incorporated † | | | | | | | | | | | 14,868 | | | | 1,093,393 | |
Alpha & Omega Semiconductor † | | | | | | | | | | | 269 | | | | 4,272 | |
Amkor Technology Incorporated † | | | | | | | | | | | 36,348 | | | | 319,135 | |
Axcelis Technologies Incorporated † | | | | | | | | | | | 15,720 | | | | 328,548 | |
Brooks Automation Incorporated | | | | | | | | | | | 26,729 | | | | 696,825 | |
Cabot Microelectronics Corporation | | | | | | | | | | | 7,907 | | | | 566,299 | |
Ceva Incorporated † | | | | | | | | | | | 10,241 | | | | 415,273 | |
Cohu Incorporated | | | | | | | | | | | 10,831 | | | | 203,190 | |
Diodes Incorporated † | | | | | | | | | | | 16,535 | | | | 465,295 | |
Impinj Incorporated † | | | | | | | | | | | 7,094 | | | | 271,275 | |
IXYS Corporation † | | | | | | | | | | | 14,980 | | | | 344,540 | |
MaxLinear Incorporated Class A † | | | | | | | | | | | 22,092 | | | | 477,187 | |
Nanometrics Incorporated † | | | | | | | | | | | 13,967 | | | | 360,209 | |
Neophotonics Corporation † | | | | | | | | | | | 579 | | | | 3,387 | |
NVE Corporation | | | | | | | | | | | 5,220 | | | | 395,885 | |
PDF Solutions Incorporated † | | | | | | | | | | | 16,562 | | | | 251,577 | |
Photronics Incorporated † | | | | | | | | | | | 34,862 | | | | 275,410 | |
Power Integrations Incorporated | | | | | | | | | | | 11,176 | | | | 814,172 | |
Rudolph Technologies Incorporated † | | | | | | | | | | | 17,166 | | | | 381,085 | |
Semtech Corporation † | | | | | | | | | | | 24,768 | | | | 931,277 | |
Silicon Laboratories Incorporated † | | | | | | | | | | | 15,032 | | | | 1,140,929 | |
Ultra Clean Holdings Incorporated † | | | | | | | | | | | 11,932 | | | | 275,271 | |
Xcerra Corporation † | | | | | | | | | | | 28,099 | | | | 275,932 | |
Xperi Corporation | | | | | | | | | | | 19,138 | | | | 521,511 | |
| |
| | | | 10,811,877 | |
| | | | | | | | | | | | | | | | |
The accompanying notes are an integral part of these financial statements.
| | | | | | |
| Portfolio of investments—August 31, 2017 (unaudited) | | Wells Fargo Target Date Funds | | | 173 | |
FACTOR ENHANCED SMALL CAP PORTFOLIO
| | | | | | | | | | | | | | | | |
| Security name | | | | | | | | Shares | | | Value | |
| | | | |
| Software: 2.96% | | | | | | | | | | | | | | | | |
8x8 Incorporated † | | | | | | | | | | | 41,338 | | | $ | 584,933 | |
A10 Networks Incorporated † | | | | | | | | | | | 33,416 | | | | 218,875 | |
ACI Worldwide Incorporated † | | | | | | | | | | | 45,186 | | | | 1,028,433 | |
American Software Incorporated Class A | | | | | | | | | | | 454 | | | | 4,999 | |
Barracuda Networks Incorporated † | | | | | | | | | | | 16,478 | | | | 398,932 | |
Bottomline Technologies Incorporated † | | | | | | | | | | | 18,510 | | | | 561,038 | |
CommVault Systems Incorporated † | | | | | | | | | | | 15,841 | | | | 967,093 | |
Ebix Incorporated | | | | | | | | | | | 9,143 | | | | 527,551 | |
Everbridge Incorporated † | | | | | | | | | | | 11,636 | | | | 269,606 | |
Gigamon Incorporated † | | | | | | | | | | | 13,416 | | | | 576,217 | |
Globant SA † | | | | | | | | | | | 10,584 | | | | 411,612 | |
MicroStrategy Incorporated Class A † | | | | | | | | | | | 3,645 | | | | 470,205 | |
Model N Incorporated † | | | | | | | | | | | 396 | | | | 5,366 | |
Monotype Imaging Holdings Incorporated | | | | | | | | | | | 15,851 | | | | 289,281 | |
Paycom Software Incorporated † | | | | | | | | | | | 17,924 | | | | 1,337,310 | |
Pegasystems Incorporated | | | | | | | | | | | 14,266 | | | | 821,008 | |
Progress Software Corporation | | | | | | | | | | | 16,756 | | | | 562,666 | |
PROS Holdings Incorporated † | | | | | | | | | | | 13,796 | | | | 363,387 | |
Qad Incorporated Class A | | | | | | | | | | | 161 | | | | 5,426 | |
Qualys Incorporated † | | | | | | | | | | | 13,839 | | | | 657,353 | |
RealPage Incorporated † | | | | | | | | | | | 22,383 | | | | 964,707 | |
RingCentral Incorporated Class A † | | | | | | | | | | | 22,872 | | | | 968,629 | |
Silver Spring Networks Incorporated † | | | | | | | | | | | 15,811 | | | | 200,167 | |
Synchronoss Technologies Incorporated † | | | | | | | | | | | 20,988 | | | | 352,389 | |
Tivo Corporation | | | | | | | | | | | 41,729 | | | | 763,641 | |
Vasco Data Security International Incorporated † | | | | | | | | | | | 20,965 | | | | 263,111 | |
Verint Systems Incorporated † | | | | | | | | | | | 24,062 | | | | 955,261 | |
Workiva Incorporated † | | | | | | | | | | | 16,568 | | | | 334,674 | |
Zix Corporation † | | | | | | | | | | | 823 | | | | 4,370 | |
Zynga Incorporated Class A † | | | | | | | | | | | 311,230 | | | | 1,167,113 | |
| |
| | | | 16,035,353 | |
| | | | | | | | | | | | | | | | |
| | | | |
| Technology Hardware, Storage & Peripherals: 0.48% | | | | | | | | | �� | | | | | | | |
Diebold Incorporated | | | | | | | | | | | 25,869 | | | | 529,021 | |
Electronics For Imaging Incorporated † | | | | | | | | | | | 15,639 | | | | 556,123 | |
Pure Storage Incorporated Class A † | | | | | | | | | | | 34,099 | | | | 507,734 | |
Quantum Corporation † | | | | | | | | | | | 99,458 | | | | 548,014 | |
Super Micro Computer Incorporated † | | | | | | | | | | | 16,862 | | | | 448,951 | |
| |
| | | | 2,589,843 | |
| | | | | | | | | | | | | | | | |
| | | | |
Materials: 4.04% | | | | | | | | | | | | | | | | |
| | | | |
| Chemicals: 1.87% | | | | | | | | | | | | | | | | |
Advansix Incorporated † | | | | | | | | | | | 12,501 | | | | 399,157 | |
American Vanguard Corporation | | | | | | | | | | | 15,674 | | | | 317,399 | |
Calgon Carbon Corporation | | | | | | | | | | | 26,950 | | | | 328,790 | |
Chase Corporation | | | | | | | | | | | 4,411 | | | | 412,429 | |
Futurefuel Corporation | | | | | | | | | | | 18,419 | | | | 248,288 | |
GCP Applied Technologies Incorporated † | | | | | | | | | | | 27,594 | | | | 779,530 | |
Hawkins Incorporated | | | | | | | | | | | 6,868 | | | | 244,844 | |
The accompanying notes are an integral part of these financial statements.
| | | | |
| 174 | | Wells Fargo Target Date Funds | | Portfolio of investments—August 31, 2017 (unaudited) |
FACTOR ENHANCED SMALL CAP PORTFOLIO
| | | | | | | | | | | | | | | | |
| Security name | | | | | | | | Shares | | | Value | |
| | | | |
| Chemicals (continued) | | | | | | | | | | | | | | | | |
HB Fuller Company | | | | | | | | | | | 14,127 | | | $ | 709,034 | |
Ingevity Corporation † | | | | | | | | | | | 16,876 | | | | 1,062,682 | |
Innophos Holdings Incorporated | | | | | | | | | | | 9,269 | | | | 423,223 | |
Innospec Incorporated | | | | | | | | | | | 9,315 | | | | 516,983 | |
KMG Chemicals Incorporated | | | | | | | | | | | 5,602 | | | | 269,008 | |
Kooper Holdings Incorporated † | | | | | | | | | | | 9,518 | | | | 373,106 | |
Kraton Performance Polymers Incorporated † | | | | | | | | | | | 11,039 | | | | 362,410 | |
Kronos Worldwide Incorporated | | | | | | | | | | | 14,630 | | | | 306,206 | |
Omnova Solutions Incorporated † | | | | | | | | | | | 27,965 | | | | 243,296 | |
Quaker Chemical Corporation | | | | | | | | | | | 5,051 | | | | 703,200 | |
Rayonier Advanced Materials | | | | | | | | | | | 19,808 | | | | 271,766 | |
Stepan Company | | | | | | | | | | | 6,930 | | | | 536,105 | |
Trecora Resources † | | | | | | | | | | | 448 | | | | 5,443 | |
Tredegar Corporation | | | | | | | | | | | 21,093 | | | | 343,816 | |
Trinseo SA | | | | | | | | | | | 15,425 | | | | 1,031,933 | |
Valvoline Incorporated | | | | | | | | | | | 11,760 | | | | 250,370 | |
| |
| | | | 10,139,018 | |
| | | | | | | | | | | | | | | | |
| | | | |
| Construction Materials: 0.09% | | | | | | | | | | | | | | | | |
US Concrete Incorporated † | | | | | | | | | | | 5,754 | | | | 460,608 | |
| | | | | | | | | | | | | | | | |
| | | | |
| Containers & Packaging: 0.31% | | | | | | | | | | | | | | | | |
Greif Incorporated Class A | | | | | | | | | | | 8,574 | | | | 518,298 | |
Myers Industries Incorporated | | | | | | | | | | | 19,721 | | | | 370,755 | |
Silgan Holdings Incorporated | | | | | | | | | | | 26,489 | | | | 797,054 | |
| |
| | | | 1,686,107 | |
| | | | | | | | | | | | | | | | |
| | | | |
| Metals & Mining: 1.19% | | | | | | | | | | | | | | | | |
Cleveland Cliffs Incorporated † | | | | | | | | | | | 122,739 | | | | 1,026,098 | |
Commercial Metals Company | | | | | | | | | | | 42,165 | | | | 796,497 | |
Compass Minerals International Incorporated | | | | | | | | | | | 13,057 | | | | 872,208 | |
Haynes International Incorporated | | | | | | | | | | | 10,699 | | | | 326,854 | |
Hecla Mining Company | | | | | | | | | | | 163,951 | | | | 865,661 | |
Kaiser Aluminum Corporation | | | | | | | | | | | 6,877 | | | | 662,393 | |
Materion Corporation | | | | | | | | | | | 10,214 | | | | 390,175 | |
Schnitzer Steel Industry | | | | | | | | | | | 13,395 | | | | 360,326 | |
Suncoke Energy Incorporated † | | | | | | | | | | | 32,095 | | | | 299,125 | |
Worthington Industries Incorporated | | | | | | | | | | | 17,042 | | | | 851,418 | |
| |
| | | | 6,450,755 | |
| | | | | | | | | | | | | | | | |
| | | | |
| Paper & Forest Products: 0.58% | | | | | | | | | | | | | | | | |
Boise Cascade Company † | | | | | | | | | | | 15,216 | | | | 456,480 | |
Clearwater Paper Corporation † | | | | | | | | | | | 8,050 | | | | 374,325 | |
Domtar Corporation | | | | | | | | | | | 22,309 | | | | 902,176 | |
Neenah Paper Incorporated | | | | | | | | | | | 6,457 | | | | 498,803 | |
PH Glatfelter Company | | | | | | | | | | | 22,886 | | | | 396,386 | |
Schweitzer-Mauduit International Incorporated | | | | | | | | | | | 12,936 | | | | 490,662 | |
| |
| | | | 3,118,832 | |
| | | | | | | | | | | | | | | | |
The accompanying notes are an integral part of these financial statements.
| | | | | | |
| Portfolio of investments—August 31, 2017 (unaudited) | | Wells Fargo Target Date Funds | | | 175 | |
FACTOR ENHANCED SMALL CAP PORTFOLIO
| | | | | | | | | | | | | | | | |
| Security name | | | | | | | | Shares | | | Value | |
| | | | |
Real Estate: 7.79% | | | | | | | | | | | | | | | | |
| | | | |
| Equity REITs: 7.12% | | | | | | | | | | | | | | | | |
Agree Realty Corporation | | | | | | | | | | | 9,556 | | | $ | 478,947 | |
Alexander S Incorporated REIT | | | | | | | | | | | 482 | | | | 201,809 | |
American Assets Trust Incorporated | | | | | | | | | | | 17,603 | | | | 715,034 | |
Armada Hoffler Properties Incorporated | | | | | | | | | | | 26,182 | | | | 350,053 | |
Ashford Hospitality Prime Incorporated | | | | | | | | | | | 511 | | | | 4,916 | |
Ashford Hospitality Trust Incorporated | | | | | | | | | | | 55,533 | | | | 344,860 | |
Bluerock Residential Growth REIT Incorporated | | | | | | | | | | | 390 | | | | 3,951 | |
Brandywine Realty Trust | | | | | | | | | | | 56,538 | | | | 971,323 | |
CareTrust REIT Incorporated | | | | | | | | | | | 25,299 | | | | 488,018 | |
Catchmark Timber Trust Incorporated Class A | | | | | | | | | | | 40,293 | | | | 464,578 | |
CBL & Associates Properties Incorporated | | | | | | | | | | | 82,223 | | | | 657,784 | |
Cedar Shopping Centers Incorporated | | | | | | | | | | | 109,015 | | | | 549,436 | |
Chatham Lodging Trust | | | | | | | | | | | 17,943 | | | | 363,884 | |
Chesapeake Lodging Trust | | | | | | | | | | | 20,980 | | | | 536,878 | |
Community Healthcare Trust Incorporated | | | | | | | | | | | 5,142 | | | | 136,572 | |
CorEnergy Infrastructure Trust Incorporated | | | | | | | | | | | 8,102 | | | | 264,368 | |
DiamondRock Hospitality | | | | | | | | | | | 72,481 | | | | 796,566 | |
Easterly Government Properties Incorporated | | | | | | | | | | | 21,686 | | | | 435,021 | |
EastGroup Properties Incorporated | | | | | | | | | | | 8,854 | | | | 786,766 | |
Felcor Lodging Trust Incorporated | | | | | | | | | | | 57,660 | | | | 420,918 | |
First Potomac Realty Trust | | | | | | | | | | | 37,712 | | | | 419,735 | |
Four Corners Property Trust Incorporated | | | | | | | | | | | 25,913 | | | | 658,449 | |
Franklin Street Properties Corporation | | | | | | | | | | | 52,708 | | | | 525,499 | |
Getty Realty Corporation | | | | | | | | | | | 14,596 | | | | 402,266 | |
Gladstone Commercial Corporation | | | | | | | | | | | 16,247 | | | | 347,686 | |
Global Net Lease Incorporated | | | | | | | | | | | 22,886 | | | | 495,711 | |
Government Properties Income | | | | | | | | | | | 27,468 | | | | 509,531 | |
Hersha Hospitality Trust | | | | | | | | | | | 17,724 | | | | 328,603 | |
Independence Realty Trust Incorporated | | | | | | | | | | | 539 | | | | 5,546 | |
InfraReit Incorporated | | | | | | | | | | | 17,007 | | | | 382,487 | |
Investors Real Estate Trust | | | | | | | | | | | 62,705 | | | | 393,787 | |
iStar Financial Incorporated † | | | | | | | | | | | 26,613 | | | | 308,977 | |
Kite Realty Group Trust | | | | | | | | | | | 57,119 | | | | 1,149,234 | |
Lexington Corporate Properties Trust | | | | | | | | | | | 63,091 | | | | 622,077 | |
LTC Properties Incorporated | | | | | | | | | | | 14,047 | | | | 683,106 | |
Mack-Cali Realty Corporation | | | | | | | | | | | 32,280 | | | | 738,889 | |
Medequities Realty Trust Incorporated | | | | | | | | | | | 15,228 | | | | 174,665 | |
MGM Growth Properties LLC Class A | | | | | | | | | | | 21,256 | | | | 650,434 | |
Monmouth Real Estate Investment Corporation | | | | | | | | | | | 27,752 | | | | 450,970 | |
Monogram Residential Trust Incorporated | | | | | | | | | | | 62,778 | | | | 753,336 | |
National Storage Affiliates | | | | | | | | | | | 20,997 | | | | 468,653 | |
New Senior Investment Group Incorporated | | | | | | | | | | | 49,082 | | | | 453,027 | |
New York REIT Incorporated | | | | | | | | | | | 61,524 | | | | 506,958 | |
Nexpoint Residential | | | | | | | | | | | 11,154 | | | | 259,888 | |
One Liberty Properties Incorporated | | | | | | | | | | | 10,467 | | | | 251,313 | |
Parkway Incorporated | | | | | | | | | | | 17,777 | | | | 408,160 | |
Pebblebrook Hotel Trust | | | | | | | | | | | 28,397 | | | | 953,855 | |
Pennsylvania Real Estate Investment Trust | | | | | | | | | | | 50,816 | | | | 509,684 | |
The accompanying notes are an integral part of these financial statements.
| | | | |
| 176 | | Wells Fargo Target Date Funds | | Portfolio of investments—August 31, 2017 (unaudited) |
FACTOR ENHANCED SMALL CAP PORTFOLIO
| | | | | | | | | | | | | | | | |
| Security name | | | | | | | | Shares | | | Value | |
| | | | |
| Equity REITs (continued) | | | | | | | | | | | | | | | | |
Potlatch Corporation | | | | | | | | | | | 13,626 | | | $ | 651,323 | |
Preferred Apartment Communities Incorporated Series A | | | | | | | | | | | 23,230 | | | | 422,554 | |
PS Business Parks Incorporated | | | | | | | | | | | 5,379 | | | | 726,757 | |
QTS Realty Trust Incorporated Class A | | | | | | | | | | | 16,541 | | | | 896,191 | |
Quality Care Properties Incorporated † | | | | | | | | | | | 36,693 | | | | 503,428 | |
Ramco-Gershenson Properties Trust | | | | | | | | | | | 52,855 | | | | 695,043 | |
Retail Opportunity Investment Corporation | | | | | | | | | | | 45,971 | | | | 912,065 | |
Rexford Industrial Realty Incorporated | | | | | | | | | | | 22,761 | | | | 683,968 | |
Ryman Hospitality Properties Incorporated | | | | | | | | | | | 15,228 | | | | 904,848 | |
Sabra Health Care REIT Incorporated | | | | | | | | | | | 61,738 | | | | 1,348,985 | |
Saul Centers Incorporated | | | | | | | | | | | 8,443 | | | | 511,646 | |
Select Income REIT | | | | | | | | | | | 16,559 | | | | 384,334 | |
Seritage Growth Property Class A | | | | | | | | | | | 10,925 | | | | 525,056 | |
STAG Industrial Incorporated | | | | | | | | | | | 25,807 | | | | 722,338 | |
Summit Hotel Properties Incorporated | | | | | | | | | | | 31,862 | | | | 472,832 | |
Terreno Realty Corporation | | | | | | | | | | | 16,374 | | | | 593,558 | |
Tier Incorporated | | | | | | | | | | | 26,950 | | | | 496,150 | |
UMH Properties Incorporated | | | | | | | | | | | 21,133 | | | | 334,324 | |
Universal Health Realty Income Trust | | | | | | | | | | | 5,576 | | | | 422,159 | |
Urban Edge Properties | | | | | | | | | | | 37,324 | | | | 938,699 | |
Urstadt Biddle Properties Incorporated | | | | | | | | | | | 24,012 | | | | 496,568 | |
Washington Prime Group Incorporated | | | | | | | | | | | 77,998 | | | | 651,283 | |
Washington Real Estate Investment Trust | | | | | | | | | | | 19,482 | | | | 640,179 | |
Whitestone REIT | | | | | | | | | | | 424 | | | | 5,317 | |
Xenia Hotels & Resorts Incorporated | | | | | | | | | | | 41,485 | | | | 828,041 | |
| |
| | | | 38,551,854 | |
| | | | | | | | | | | | | | | | |
| | | | |
| Real Estate Management & Development: 0.67% | | | | | | | | | | | | | | | | |
Alexander & Baldwin Incorporated | | | | | | | | | | | 18,230 | | | | 791,182 | |
Forestar Real Estate Group Incorporated † | | | | | | | | | | | 316 | | | | 5,435 | |
FRP Holdings Incorporated † | | | | | | | | | | | 3,408 | | | | 149,611 | |
HFF Incorporated Class A | | | | | | | | | | | 14,462 | | | | 551,436 | |
Kennedy Wilson Holdings Incorporated | | | | | | | | | | | 36,863 | | | | 711,456 | |
Marcus & Millichap Incorporated † | | | | | | | | | | | 10,184 | | | | 268,145 | |
Re/max Holdings Incorporated Class A | | | | | | | | | | | 7,861 | | | | 481,486 | |
The RMR Group Incorporated Class A | | | | | | | | | | | 4,788 | | | | 247,300 | |
The St. Joe Company † | | | | | | | | | | | 23,416 | | | | 441,392 | |
| |
| | | | 3,647,443 | |
| | | | | | | | | | | | | | | | |
| | | | |
Telecommunication Services: 1.20% | | | | | | | | | | | | | | | | |
| | | | |
| Diversified Telecommunication Services: 0.90% | | | | | | | | | | | | | | | | |
ATN International Incorporated | | | | | | | | | | | 5,748 | | | | 348,156 | |
Cincinnati Bell Incorporated † | | | | | | | | | | | 21,084 | | | | 443,818 | |
Cogent Communications Group Incorporated | | | | | | | | | | | 16,475 | | | | 767,735 | |
Consolidated Communications Holdings Incorporated | | | | | | | | | | | 30,915 | | | | 570,382 | |
Frontier Communications Corporation | | | | | | | | | | | 34,952 | | | | 470,804 | |
General Communication Incorporated Class A † | | | | | | | | | | | 9,186 | | | | 396,192 | |
Iradium Communications Incorporated † | | | | | | | | | | | 34,535 | | | | 383,339 | |
Lumos Networks Corporation † | | | | | | | | | | | 15,243 | | | | 274,069 | |
The accompanying notes are an integral part of these financial statements.
| | | | | | |
| Portfolio of investments—August 31, 2017 (unaudited) | | Wells Fargo Target Date Funds | | | 177 | |
FACTOR ENHANCED SMALL CAP PORTFOLIO
| | | | | | | | | | | | | | | | |
| Security name | | | | | | | | Shares | | | Value | |
| | | | |
| Diversified Telecommunication Services (continued) | | | | | | | | | | | | | | | | |
ORBCOMM Incorporated † | | | | | | | | | | | 29,918 | | | $ | 330,893 | |
Vonage Holdings Corporation † | | | | | | | | | | | 80,867 | | | | 671,196 | |
Windstream Holdings Incorporated | | | | | | | | | | | 114,275 | | | | 236,549 | |
| |
| | | | 4,893,133 | |
| | | | | | | | | | | | | | | | |
| | | | |
| Wireless Telecommunication Services: 0.30% | | | | | | | | | | | | | | | | |
Boingo Wireless Incorporated † | | | | | | | | | | | 18,422 | | | | 379,309 | |
Shenandoah Telecommunications Company | | | | | | | | | | | 18,501 | | | | 666,961 | |
Spok Holdings Incorporated | | | | | | | | | | | 17,502 | | | | 293,159 | |
United States Cellular Corporation † | | | | | | | | | | | 7,181 | | | | 277,761 | |
| |
| | | | 1,617,190 | |
| | | | | | | | | | | | | | | | |
| | | | |
Utilities: 2.42% | | | | | | | | | | | | | | | | |
| | | | |
| Electric Utilities: 0.84% | | | | | | | | | | | | | | | | |
Avangrid Incorporated | | | | | | | | | | | 21,574 | | | | 1,053,243 | |
El Paso Electric Company | | | | | | | | | | | 14,133 | | | | 785,088 | |
MGE Energy Incorporated | | | | | | | | | | | 14,970 | | | | 952,092 | |
Otter Tail Corporation | | | | | | | | | | | 16,254 | | | | 679,417 | |
PNM Resources Incorporated | | | | | | | | | | | 25,457 | | | | 1,079,377 | |
| |
| | | | 4,549,217 | |
| | | | | | | | | | | | | | | | |
| | | | |
| Gas Utilities: 0.49% | | | | | | | | | | | | | | | | |
Chesapeake Utilities Corporation | | | | | | | | | | | 8,233 | | | | 654,112 | |
Northwest Natural Gas Company | | | | | | | | | | | 11,326 | | | | 750,914 | |
South Jersey Industries Incorporated | | | | | | | | | | | 34,279 | | | | 1,229,931 | |
| |
| | | | 2,634,957 | |
| | | | | | | | | | | | | | | | |
| | | | |
| Independent Power & Renewable Electricity Producers: 0.33% | | | | | | | | | | | | | | | | |
8point3 Energy Partners LP | | | | | | | | | | | 18,220 | | | | 262,732 | |
NRG Yield Incorporated Class C | | | | | | | | | | | 24,081 | | | | 445,499 | |
Ormat Technologies Incorporated | | | | | | | | | | | 13,667 | | | | 785,032 | |
TerraForm Global Incorporated Class A † | | | | | | | | | | | 54,192 | | | | 273,670 | |
| |
| | | | 1,766,933 | |
| | | | | | | | | | | | | | | | |
| | | | |
| Multi-Utilities: 0.22% | | | | | | | | | | | | | | | | |
Avista Corporation | | | | | | | | | | | 19,908 | | | | 1,023,271 | |
Unitil Corporation | | | | | | | | | | | 3,405 | | | | 169,773 | |
| |
| | | | 1,193,044 | |
| | | | | | | | | | | | | | | | |
|
| Water Utilities: 0.54% | |
American States Water Company | | | | | | | | | | | 11,168 | | | | 550,582 | |
Artesian Resources Corporation Class A | | | | | | | | | | | 126 | | | | 4,673 | |
California Water Service Group | | | | | | | | | | | 20,968 | | | | 785,252 | |
Connecticut Water Service Incorporated | | | | | | | | | | | 9,821 | | | | 532,691 | |
Middlesex Water Company | | | | | | | | | | | 9,233 | | | | 350,669 | |
SJW Corporation | | | | | | | | | | | 8,608 | | | | 477,744 | |
The accompanying notes are an integral part of these financial statements.
| | | | |
| 178 | | Wells Fargo Target Date Funds | | Portfolio of investments—August 31, 2017 (unaudited) |
FACTOR ENHANCED SMALL CAP PORTFOLIO
| | | | | | | | | | | | | | | | |
| Security name | | | | | | | | Shares | | | Value | |
| | | | |
| Water Utilities (continued) | | | | | | | | | | | | | | | | |
York Water Company | | | | | | | | | | | 7,306 | | | $ | 240,367 | |
| |
| | | | 2,941,978 | |
| | | | | | | | | | | | | | | | |
| |
Total Common Stocks (Cost $512,755,140) | | | | 511,717,289 | |
| | | | | | | | | | | | | | | | |
| | | | |
| | | Yield | | | | | | | | | | |
| Short-Term Investments: 5.02% | | | | | | | | | | | | | | | | |
| | | | |
| Investment Companies: 5.02% | | | | | | | | | | | | | | | | |
Wells Fargo Government Money Market Select Class (l)(u) | | | 0.92 | % | | | | | | | 27,168,625 | | | | 27,168,625 | |
| | | | | | | | | | | | | | | | |
| | | | |
Total Short-Term Investments (Cost $27,168,625) | | | | | | | | | | | | | | | 27,168,625 | |
| | | | | | | | | | | | | | | | |
| | | | | | | | |
| Total investments in securities (Cost $539,923,765) | | | 99.54 | % | | | 538,885,914 | |
Other assets and liabilities, net | | | 0.46 | | | | 2,497,366 | |
| | | | | | | | |
| Total net assets | | | 100.00 | % | | $ | 541,383,280 | |
| | | | | | | | |
| † | Non-income-earning security |
| (l) | The issuer of the security is an affiliated person of the Portfolio as defined in the Investment Company Act of 1940. |
| (u) | The rate represents the 7-day annualized yield at period end. |
Futures Contracts
| | | | | | | | | | | | | | | | | | | | | | | | |
| Description | | Number of contracts | | | Expiration date | | | Notional cost | | | Notional value | | | Unrealized gains | | | Unrealized losses | |
Long | | | | | | | | | | | | | | | | | | | | | | | | |
Russell 2000 Index | | | 200 | | | | 9-15-2017 | | | $ | 13,823,887 | | | $ | 14,044,000 | | | $ | 220,113 | | | $ | 0 | |
Investments In Affiliates
An affiliated investment is an investment in which the Portfolio owns at least 5% of the outstanding voting shares of the issuer or as a result of other relationships, such as the Portfolio and the issuer having the same investment manager. Transactions with issuers that were either affiliated persons of the Portfolio at the beginning of the period or the end of the period were as follows:
| | | | | | | | | | | | | | | | | | | | | | | | | | | | | | | | |
| | | Shares, beginning of period | | | Shares purchased | | | Shares sold | | | Shares, end of period | | | Net realized gains (losses) | | | Net change in unrealized gains (losses) | | | Income from affiliated securities | | | Value, end of period | |
Investment companies - 5.02% | | | | | | | | | | | | | | | | | | | | | | | | | | | | | | | | |
Wells Fargo Government Money Market Fund Select Class | | | 0 | | | | 485,171,157 | | | | 458,002,532 | | | | 27,168,625 | | | $ | 0 | | | $ | 0 | | | $ | 41,649 | | | $ | 27,168,625 | |
The accompanying notes are an integral part of these financial statements.
| | | | | | |
| Portfolio of investments—August 31, 2017 (unaudited) | | Wells Fargo Target Date Funds | | | 179 | |
HIGH YIELD CORPORATE BOND PORTFOLIO
| | | | | | | | | | | | | | | | |
| Security name | | Interest rate | | | Maturity date | | | Principal | | | Value | |
| | | | |
Corporate Bonds and Notes: 74.01% | | | | | | | | | | | | | | | | |
| | | | |
Consumer Discretionary: 19.11% | | | | | | | | | | | | | | | | |
| | | | |
| Auto Components: 1.70% | | | | | | | | | | | | | | | | |
American Axle & Manufacturing Incorporated 144A | | | 6.50 | % | | | 4-1-2027 | | | $ | 300,000 | | | $ | 295,500 | |
Dana Incorporated | | | 6.00 | | | | 9-15-2023 | | | | 300,000 | | | | 314,250 | |
Goodyear Tire & Rubber Company | | | 5.13 | | | | 11-15-2023 | | | | 300,000 | | | | 313,872 | |
ZF North America Capital Incorporated 144A | | | 4.75 | | | | 4-29-2025 | | | | 700,000 | | | | 734,125 | |
| |
| | | | 1,657,747 | |
| | | | | | | | | | | | | | | | |
| | | | |
| Automobiles: 0.20% | | | | | | | | | | | | | | | | |
Tesla Incorporated 144A | | | 5.30 | | | | 8-15-2025 | | | | 200,000 | | | | 197,250 | |
| | | | | | | | | | | | | | | | |
| | | | |
| Distributors: 0.21% | | | | | | | | | | | | | | | | |
American Tire Distributors Holdings Incorporated 144A | | | 10.25 | | | | 3-1-2022 | | | | 200,000 | | | | 206,500 | |
| | | | | | | | | | | | | | | | |
| | | | |
| Diversified Consumer Services: 1.08% | | | | | | | | | | | | | | | | |
APX Group Incorporated | | | 7.88 | | | | 12-1-2022 | | | | 200,000 | | | | 217,000 | |
Hertz Corporation | | | 6.75 | | | | 4-15-2019 | | | | 300,000 | | | | 298,875 | |
Laureate Education Incorporated 144A | | | 8.25 | | | | 5-1-2025 | | | | 200,000 | | | | 217,500 | |
Service Corporation International | | | 5.38 | | | | 5-15-2024 | | | | 300,000 | | | | 319,125 | |
| |
| | | | 1,052,500 | |
| | | | | | | | | | | | | | | | |
| | | | |
| Hotels, Restaurants & Leisure: 3.05% | | | | | | | | | | | | | | | | |
Boyd Gaming Corporation | | | 6.88 | | | | 5-15-2023 | | | | 200,000 | | | | 215,000 | |
Diamond Resorts International Incorporated 144A | | | 7.75 | | | | 9-1-2023 | | | | 300,000 | | | | 321,000 | |
Hilton Worldwide Finance LLC | | | 4.88 | | | | 4-1-2027 | | | | 300,000 | | | | 317,250 | |
International Game Technology plc 144A | | | 5.63 | | | | 2-15-2020 | | | | 300,000 | | | | 317,250 | |
KFC Holding Company 144A | | | 4.75 | | | | 6-1-2027 | | | | 300,000 | | | | 307,875 | |
KFC Holding Company 144A | | | 5.00 | | | | 6-1-2024 | | | | 300,000 | | | | 313,590 | |
MGM Resorts International | | | 8.63 | | | | 2-1-2019 | | | | 700,000 | | | | 763,875 | |
Wynn Las Vegas LLC 144A | | | 5.50 | | | | 3-1-2025 | | | | 400,000 | | | | 417,000 | |
| |
| | | | 2,972,840 | |
| | | | | | | | | | | | | | | | |
| | | | |
| Household Durables: 1.32% | | | | | | | | | | | | | | | | |
Lennar Corporation | | | 4.50 | | | | 6-15-2019 | | | | 300,000 | | | | 308,250 | |
Lennar Corporation | | | 4.50 | | | | 11-15-2019 | | | | 200,000 | | | | 206,250 | |
Pulte Group Incorporated | | | 4.25 | | | | 3-1-2021 | | | | 200,000 | | | | 207,780 | |
Standard Pacific Corporation | | | 8.38 | | | | 1-15-2021 | | | | 200,000 | | | | 233,000 | |
Toll Brothers Finance Corporation | | | 5.88 | | | | 2-15-2022 | | | | 300,000 | | | | 331,986 | |
| |
| | | | 1,287,266 | |
| | | | | | | | | | | | | | | | |
| | | | |
| Internet & Direct Marketing Retail: 0.33% | | | | | | | | | | | | | | | | |
Netflix Incorporated | | | 5.38 | | | | 2-1-2021 | | | | 300,000 | | | | 321,375 | |
| | | | | | | | | | | | | | | | |
| | | | |
| Leisure Products: 0.69% | | | | | | | | | | | | | | | | |
Scientific Games Company | | | 10.00 | | | | 12-1-2022 | | | | 600,000 | | | | 667,500 | |
| | | | | | | | | | | | | | | | |
| | | | |
| Media: 7.31% | | | | | | | | | | | | | | | | |
Altice US Finance Corporation 144A | | | 5.38 | | | | 7-15-2023 | | | | 200,000 | | | | 209,500 | |
AMC Entertainment Holdings Incorporated | | | 5.88 | | | | 11-15-2026 | | | | 300,000 | | | | 281,625 | |
The accompanying notes are an integral part of these financial statements.
| | | | |
| 180 | | Wells Fargo Target Date Funds | | Portfolio of investments—August 31, 2017 (unaudited) |
HIGH YIELD CORPORATE BOND PORTFOLIO
| | | | | | | | | | | | | | | | |
| Security name | | Interest rate | | | Maturity date | | | Principal | | | Value | |
| | | | |
| Media (continued) | | | | | | | | | | | | | | | | |
AMC Networks Incorporated | | | 4.75 | % | | | 8-1-2025 | | | $ | 300,000 | | | $ | 300,750 | |
AMC Networks Incorporated | | | 5.00 | | | | 4-1-2024 | | | | 200,000 | | | | 206,250 | |
CCO Holdings LLC 144A | | | 5.13 | | | | 5-1-2027 | | | | 300,000 | | | | 309,000 | |
CCO Holdings LLC 144A | | | 5.88 | | | | 5-1-2027 | | | | 500,000 | | | | 532,500 | |
Cequel Communications Holdings LLC 144A | | | 7.75 | | | | 7-15-2025 | | | | 300,000 | | | | 331,125 | |
Clear Channel Worldwide Holdings Incorporated | | | 6.50 | | | | 11-15-2022 | | | | 400,000 | | | | 411,000 | |
Clear Channel Worldwide Holdings Incorporated | | | 7.63 | | | | 3-15-2020 | | | | 300,000 | | | | 298,875 | |
CSC Holdings LLC 144A | | | 5.50 | | | | 4-15-2027 | | | | 200,000 | | | | 209,000 | |
CSC Holdings LLC 144A | | | 10.13 | | | | 1-15-2023 | | | | 200,000 | | | | 231,690 | |
DISH DBS Corporation | | | 5.88 | | | | 7-15-2022 | | | | 300,000 | | | | 323,438 | |
DISH DBS Corporation | | | 5.88 | | | | 11-15-2024 | | | | 600,000 | | | | 647,250 | |
Gray Television Incorporated 144A | | | 5.88 | | | | 7-15-2026 | | | | 300,000 | | | | 309,000 | |
iHeart Communications Incorporated | | | 11.25 | | | | 3-1-2021 | | | | 200,000 | | | | 148,500 | |
Lamar Media Corporation | | | 5.00 | | | | 5-1-2023 | | | | 200,000 | | | | 207,000 | |
Nielsen Finance LLC 144A | | | 5.00 | | | | 4-15-2022 | | | | 200,000 | | | | 207,000 | |
Sinclair Television Group Company 144A | | | 5.13 | | | | 2-15-2027 | | | | 200,000 | | | | 194,000 | |
Sirius XM Radio Incorporated 144A | | | 5.38 | | | | 7-15-2026 | | | | 200,000 | | | | 210,000 | |
Sirius XM Radio Incorporated 144A | | | 6.00 | | | | 7-15-2024 | | | | 400,000 | | | | 432,112 | |
TEGNA Incorporated | | | 6.38 | | | | 10-15-2023 | | | | 300,000 | | | | 318,375 | |
Univision Communications Incorporated 144A | | | 5.13 | | | | 5-15-2023 | | | | 400,000 | | | | 407,000 | |
Viacom Incorporated (3 Month LIBOR +3.90%) ± | | | 6.25 | | | | 2-28-2057 | | | | 400,000 | | | | 401,000 | |
| |
| | | | 7,125,990 | |
| | | | | | | | | | | | | | | | |
| | | | |
| Multiline Retail: 1.05% | | | | | | | | | | | | | | | | |
Claire’s Stores Incorporated 144A | | | 9.00 | | | | 3-15-2019 | | | | 400,000 | | | | 208,000 | |
Dollar Tree Incorporated | | | 5.75 | | | | 3-1-2023 | | | | 400,000 | | | | 422,000 | |
JC Penney Corporation Incorporated | | | 5.65 | | | | 6-1-2020 | | | | 400,000 | | | | 395,820 | |
| |
| | | | 1,025,820 | |
| | | | | | | | | | | | | | | | |
| | | | |
| Specialty Retail: 1.95% | | | | | | | | | | | | | | | | |
Group 1 Automotive Incorporated | | | 5.00 | | | | 6-1-2022 | | | | 100,000 | | | | 102,250 | |
Guitar Center Incorporated 144A | | | 9.63 | | | | 4-15-2020 | | | | 400,000 | | | | 223,000 | |
L Brands Incorporated | | | 6.88 | | | | 11-1-2035 | | | | 400,000 | | | | 383,000 | |
L Brands Incorporated | | | 7.00 | | | | 5-1-2020 | | | | 300,000 | | | | 329,250 | |
New Albertsons Incorporated | | | 7.45 | | | | 8-1-2029 | | | | 400,000 | | | | 349,120 | |
Penske Auto Group Incorporated | | | 5.75 | | | | 10-1-2022 | | | | 300,000 | | | | 309,000 | |
Sally Holdings LLC / Sally Capital Incorporated | | | 5.63 | | | | 12-1-2025 | | | | 200,000 | | | | 204,252 | |
| |
| | | | 1,899,872 | |
| | | | | | | | | | | | | | | | |
| | | | |
| Textiles, Apparel & Luxury Goods: 0.22% | | | | | | | | | | | | | | | | |
HanesBrands Incorporated 144A | | | 4.63 | | | | 5-15-2024 | | | | 200,000 | | | | 208,000 | |
| | | | | | | | | | | | | | | | |
| | | | |
Consumer Staples: 2.74% | | | | | | | | | | | | | | | | |
| | | | |
| Food & Staples Retailing: 0.68% | | | | | | | | | | | | | | | | |
Albertsons Companies LLC | | | 5.75 | | | | 3-15-2025 | | | | 300,000 | | | | 270,375 | |
Rite Aid Corporation 144A | | | 6.13 | | | | 4-1-2023 | | | | 400,000 | | | | 393,000 | |
| |
| | | | 663,375 | |
| | | | | | | | | | | | | | | | |
The accompanying notes are an integral part of these financial statements.
| | | | | | |
| Portfolio of investments—August 31, 2017 (unaudited) | | Wells Fargo Target Date Funds | | | 181 | |
HIGH YIELD CORPORATE BOND PORTFOLIO
| | | | | | | | | | | | | | | | |
| Security name | | Interest rate | | | Maturity date | | | Principal | | | Value | |
| | | | |
| Food Products: 1.36% | | | | | | | | | | | | | | | | |
B&G Foods Incorporated | | | 5.25 | % | | | 4-1-2025 | | | $ | 300,000 | | | $ | 309,750 | |
JBS USA Finance Incorporated 144A | | | 7.25 | | | | 6-1-2021 | | | | 400,000 | | | | 409,840 | |
Lamb Weston Holdings Incorporated 144A | | | 4.88 | | | | 11-1-2026 | | | | 200,000 | | | | 207,530 | |
Post Holdings Incorporated 144A | | | 5.00 | | | | 8-15-2026 | | | | 400,000 | | | | 400,000 | |
| |
| | | | 1,327,120 | |
| | | | | | | | | | | | | | | | |
| | | | |
| Household Products: 0.22% | | | | | | | | | | | | | | | | |
Spectrum Brands Incorporated | | | 5.75 | | | | 7-15-2025 | | | | 200,000 | | | | 212,750 | |
| | | | | | | | | | | | | | | | |
| | | | |
| Personal Products: 0.48% | | | | | | | | | | | | | | | | |
Avon Products Incorporated | | | 6.60 | | | | 3-15-2020 | | | | 300,000 | | | | 303,840 | |
Revlon Consumer Products Corporation | | | 6.25 | | | | 8-1-2024 | | | | 200,000 | | | | 161,486 | |
| |
| | | | 465,326 | |
| | | | | | | | | | | | | | | | |
| | | | |
Energy: 12.68% | | | | | | | | | | | | | | | | |
| | | | |
| Energy Equipment & Services: 1.19% | | | | | | | | | | | | | | | | |
Diamond Offshore Drilling Incorporated | | | 5.70 | | | | 10-15-2039 | | | | 300,000 | | | | 229,500 | |
EP Energy LLC & Everest Acquisition Finance Incorporated | | | 6.38 | | | | 6-15-2023 | | | | 500,000 | | | | 285,000 | |
Hornbeck Offshore Services Incorporated | | | 5.00 | | | | 3-1-2021 | | | | 200,000 | | | | 92,000 | |
Pacific Drilling SA 144A | | | 5.38 | | | | 6-1-2020 | | | | 400,000 | | | | 148,000 | |
SESI LLC | | | 7.13 | | | | 12-15-2021 | | | | 200,000 | | | | 202,000 | |
Targa Resources Partners Company | | | 5.25 | | | | 5-1-2023 | | | | 200,000 | | | | 204,500 | |
| |
| | | | 1,161,000 | |
| | | | | | | | | | | | | | | | |
| | | | |
| Oil, Gas & Consumable Fuels: 11.49% | | | | | | | | | | | | | | | | |
Andeavor Logistics LP | | | 5.25 | | | | 1-15-2025 | | | | 200,000 | | | | 212,000 | |
Andeavor Logistics LP | | | 6.25 | | | | 10-15-2022 | | | | 200,000 | | | | 212,000 | |
Antero Resources Corporation | | | 5.63 | | | | 6-1-2023 | | | | 200,000 | | | | 203,500 | |
Ascent Resources Utica Holdings LLC 144A | | | 10.00 | | | | 4-1-2022 | | | | 200,000 | | | | 203,500 | |
California Resources Corporation 144A | | | 8.00 | | | | 12-15-2022 | | | | 500,000 | | | | 276,250 | |
Calumet Specialty Prod Company Guar | | | 6.50 | | | | 4-15-2021 | | | | 200,000 | | | | 192,000 | |
Carrizo Oil & Gas Incorporated | | | 6.25 | | | | 4-15-2023 | | | | 200,000 | | | | 194,000 | |
Cheniere Corpus Christi Holdings LLC | | | 5.88 | | | | 3-31-2025 | | | | 400,000 | | | | 430,000 | |
Chesapeake Energy Corporation | | | 5.75 | | | | 3-15-2023 | | | | 300,000 | | | | 265,125 | |
Chesapeake Energy Corporation | | | 6.63 | | | | 8-15-2020 | | | | 300,000 | | | | 300,000 | |
Concho Resources Incorporated | | | 4.38 | | | | 1-15-2025 | | | | 200,000 | | | | 208,000 | |
CONSOL Energy Incorporated | | | 8.00 | | | | 4-1-2023 | | | | 200,000 | | | | 211,000 | |
Continental Resources Incorporated | | | 5.00 | | | | 9-15-2022 | | | | 400,000 | | | | 402,000 | |
Crestwood Midstream Partners LP | | | 6.25 | | | | 4-1-2023 | | | | 200,000 | | | | 206,500 | |
DCP Midstream Operating LLC (3 Month LIBOR +3.85%) 144A± | | | 5.85 | | | | 5-21-2043 | | | | 600,000 | | | | 556,500 | |
Denbury Resources Incorporated 144A | | | 9.00 | | | | 5-15-2021 | | | | 400,000 | | | | 358,000 | |
Energy Transfer Equity LP | | | 5.88 | | | | 1-15-2024 | | | | 200,000 | | | | 215,500 | |
Genesis Energy LP | | | 6.75 | | | | 8-1-2022 | | | | 400,000 | | | | 405,000 | |
Gulfport Energy Corporation 144A | | | 6.00 | | | | 10-15-2024 | | | | 300,000 | | | | 294,000 | |
Laredo Petroleum Incorporated | | | 5.63 | | | | 1-15-2022 | | | | 400,000 | | | | 398,500 | |
Murray Energy Corporation 144A | | | 11.25 | | | | 4-15-2021 | | | | 500,000 | | | | 288,125 | |
Newfield Exploration Company | | | 5.75 | | | | 1-30-2022 | | | | 200,000 | | | | 211,000 | |
NGL Energy Partners LP | | | 6.13 | | | | 3-1-2025 | | | | 200,000 | | | | 178,000 | |
Oasis Petroleum Incorporated | | | 6.88 | | | | 3-15-2022 | | | | 200,000 | | | | 195,000 | |
Parsley Energy LLC 144A | | | 5.38 | | | | 1-15-2025 | | | | 300,000 | | | | 301,500 | |
The accompanying notes are an integral part of these financial statements.
| | | | |
| 182 | | Wells Fargo Target Date Funds | | Portfolio of investments—August 31, 2017 (unaudited) |
HIGH YIELD CORPORATE BOND PORTFOLIO
| | | | | | | | | | | | | | | | |
| Security name | | Interest rate | | | Maturity date | | | Principal | | | Value | |
| | | | |
| Oil, Gas & Consumable Fuels (continued) | | | | | | | | | | | | | | | | |
PBF Holding Company LLC | | | 7.00 | % | | | 11-15-2023 | | | $ | 200,000 | | | $ | 200,500 | |
QEP Resources Incorporated | | | 5.25 | | | | 5-1-2023 | | | | 400,000 | | | | 380,000 | |
Range Resources Corporation | | | 4.88 | | | | 5-15-2025 | | | | 500,000 | | | | 478,750 | |
Rice Energy Incorporated | | | 6.25 | | | | 5-1-2022 | | | | 200,000 | | | | 208,000 | |
Rockies Express Pipeline LLC 144A | | | 6.88 | | | | 4-15-2040 | | | | 300,000 | | | | 327,750 | |
Rowan Companies Incorporated | | | 4.88 | | | | 6-1-2022 | | | | 300,000 | | | | 272,250 | |
Sanchez Energy Corporation | | | 7.75 | | | | 6-15-2021 | | | | 300,000 | | | | 259,500 | |
SM Energy Corporation | | | 5.63 | | | | 6-1-2025 | | | | 300,000 | | | | 271,500 | |
Southwestern Energy Company | | | 4.10 | | | | 3-15-2022 | | | | 200,000 | | | | 184,500 | |
Sunoco LP / Sunoco Finance Corporation | | | 6.38 | | | | 4-1-2023 | | | | 200,000 | | | | 210,750 | |
Ultra Resources Incorporated 144A | | | 6.88 | | | | 4-15-2022 | | | | 300,000 | | | | 295,125 | |
Whiting Petroleum Corporation | | | 5.00 | | | | 3-15-2019 | | | | 300,000 | | | | 297,000 | |
Whiting Petroleum Corporation | | | 5.75 | | | | 3-15-2021 | | | | 200,000 | | | | 188,000 | |
Williams Companies Incorporated | | | 3.70 | | | | 1-15-2023 | | | | 500,000 | | | | 496,250 | |
WPX Energy Incorporated | | | 6.00 | | | | 1-15-2022 | | | | 200,000 | | | | 206,250 | |
| |
| | | | 11,193,125 | |
| | | | | | | | | | | | | | | | |
| | | | |
Financials: 6.62% | | | | | | | | | | | | | | | | |
| | | | |
| Capital Markets: 0.91% | | | | | | | | | | | | | | | | |
Blue Cube Spinco Incorporated | | | 10.00 | | | | 10-15-2025 | | | | 300,000 | | | | 369,750 | |
Jefferies Finance LLC 144A | | | 7.50 | | | | 4-15-2021 | | | | 300,000 | | | | 309,000 | |
MSCI Incorporated 144A | | | 5.25 | | | | 11-15-2024 | | | | 200,000 | | | | 213,000 | |
| |
| | | | 891,750 | |
| | | | | | | | | | | | | | | | |
| | | | |
| Consumer Finance: 2.36% | | | | | | | | | | | | | | | | |
Ally Financial Incorporated | | | 3.50 | | | | 1-27-2019 | | | | 400,000 | | | | 405,000 | |
Ally Financial Incorporated | | | 8.00 | | | | 3-15-2020 | | | | 300,000 | | | | 339,750 | |
NAVIENT Corporation | | | 4.88 | | | | 6-17-2019 | | | | 600,000 | | | | 620,250 | |
Navient Corporation | | | 5.00 | | | | 10-26-2020 | | | | 600,000 | | | | 615,750 | |
Springleaf Finance Corporation | | | 6.00 | | | | 6-1-2020 | | | | 300,000 | | | | 316,500 | |
| |
| | | | 2,297,250 | |
| | | | | | | | | | | | | | | | |
| | | | |
| Diversified Financial Services: 1.92% | | | | | | | | | | | | | | | | |
Argos Merger Incorporated 144A | | | 7.13 | | | | 3-15-2023 | | | | 600,000 | | | | 489,000 | |
CNH Industrial Capital LLC | | | 3.38 | | | | 7-15-2019 | | | | 400,000 | | | | 405,500 | |
GLP Capital LP/GLP Financing II Incorporated | | | 5.38 | | | | 4-15-2026 | | | | 200,000 | | | | 217,000 | |
Prime Services Company 144A | | | 9.25 | | | | 5-15-2023 | | | | 300,000 | | | | 331,500 | |
Transocean Incorporated 144A | | | 9.00 | | | | 7-15-2023 | | | | 400,000 | | | | 426,000 | |
| |
| | | | 1,869,000 | |
| | | | | | | | | | | | | | | | |
| | | | |
| Insurance: 0.68% | | | | | | | | | | | | | | | | |
Alliant Holdings International LLC 144A | | | 8.25 | | | | 8-1-2023 | | | | 200,000 | | | | 210,000 | |
Genworth Holdings Incorporated | | | 6.50 | | | | 6-15-2034 | | | | 300,000 | | | | 249,000 | |
Hub International Limited 144A | | | 7.88 | | | | 10-1-2021 | | | | 200,000 | | | | 207,940 | |
| |
| | | | 666,940 | |
| | | | | | | | | | | | | | | | |
The accompanying notes are an integral part of these financial statements.
| | | | | | |
| Portfolio of investments—August 31, 2017 (unaudited) | | Wells Fargo Target Date Funds | | | 183 | |
HIGH YIELD CORPORATE BOND PORTFOLIO
| | | | | | | | | | | | | | | | |
| Security name | | Interest rate | | | Maturity date | | | Principal | | | Value | |
| | | | |
| Real Estate Management & Development: 0.32% | | | | | | | | | | | | | | | | |
Realogy Group LLC 144A | | | 4.50 | % | | | 4-15-2019 | | | $ | 300,000 | | | $ | 309,000 | |
| | | | | | | | | | | | | | | | |
| | | | |
| Thrifts & Mortgage Finance: 0.43% | | | | | | | | | | | | | | | | |
Quicken Loans Incorporated 144A | | | 5.75 | | | | 5-1-2025 | | | | 400,000 | | | | 419,000 | |
| | | | | | | | | | | | | | | | |
| | | | |
Health Care: 6.76% | | | | | | | | | | | | | | | | |
| | | | |
| Health Care Equipment & Supplies: 0.60% | | | | | | | | | | | | | | | | |
Crimson Incorporated 144A | | | 6.63 | | | | 5-15-2022 | | | | 300,000 | | | | 294,000 | |
DJO Finco Incorporated 144A | | | 8.13 | | | | 6-15-2021 | | | | 200,000 | | | | 190,060 | |
Hologic Incorporated 144A | | | 5.25 | | | | 7-15-2022 | | | | 100,000 | | | | 105,280 | |
| |
| | | | 589,340 | |
| | | | | | | | | | | | | | | | |
| | | | |
| Health Care Providers & Services: 5.52% | | | | | | | | | | | | | | | | |
Centene Corporation | | | 6.13 | | | | 2-15-2024 | | | | 400,000 | | | | 430,500 | |
Community Health Systems Incorporated | | | 6.25 | | | | 3-31-2023 | | | | 800,000 | | | | 806,000 | |
DaVita HealthCare Partners Incorporated | | | 5.00 | | | | 5-1-2025 | | | | 300,000 | | | | 304,140 | |
DaVita HealthCare Partners Incorporated | | | 5.13 | | | | 7-15-2024 | | | | 300,000 | | | | 306,188 | |
Envision Healthcare Corporation | | | 5.63 | | | | 7-15-2022 | | | | 400,000 | | | | 416,000 | |
HCA Incorporated | | | 3.75 | | | | 3-15-2019 | | | | 300,000 | | | | 305,250 | |
HCA Incorporated | | | 7.50 | | | | 2-15-2022 | | | | 500,000 | | | | 576,250 | |
HealthSouth Corporation | | | 5.75 | | | | 11-1-2024 | | | | 400,000 | | | | 412,000 | |
Jaguar Holding Company II / Pharmaceutical Product Development LLC 144A | | | 6.38 | | | | 8-1-2023 | | | | 200,000 | | | | 210,500 | |
Kindred Healthcare Incorporated | | | 6.38 | | | | 4-15-2022 | | | | 300,000 | | | | 273,000 | |
Lifepoint Health Incorporated | | | 5.38 | | | | 5-1-2024 | | | | 200,000 | | | | 207,000 | |
MPH Acquisition Holdings LLC 144A | | | 7.13 | | | | 6-1-2024 | | | | 300,000 | | | | 321,750 | |
MPT Operating Partnership LP | | | 6.38 | | | | 3-1-2024 | | | | 100,000 | | | | 108,625 | |
Tenet Healthcare Corporation 144A | | | 4.63 | | | | 7-15-2024 | | | | 700,000 | | | | 699,860 | |
| |
| | | | 5,377,063 | |
| | | | | | | | | | | | | | | | |
| | | | |
| Health Care Technology: 0.21% | | | | | | | | | | | | | | | | |
Quintiles IMS Holdings Incorporated 144A | | | 4.88 | | | | 5-15-2023 | | | | 200,000 | | | | 208,000 | |
| | | | | | | | | | | | | | | | |
| | | | |
| Pharmaceuticals: 0.43% | | | | | | | | | | | | | | | | |
Endo Finance LLC 144A | | | 5.38 | | | | 1-15-2023 | | | | 500,000 | | | | 418,750 | |
| | | | | | | | | | | | | | | | |
| | | | |
Industrials: 6.38% | | | | | | | | | | | | | | | | |
| | | | |
| Aerospace & Defense: 1.86% | | | | | | | | | | | | | | | | |
Alcoa Incorporated | | | 6.75 | | | | 1-15-2028 | | | | 700,000 | | | | 798,000 | |
KLX Incorporated 144A | | | 5.88 | | | | 12-1-2022 | | | | 200,000 | | | | 209,750 | |
TransDigm Group Incorporated | | | 5.50 | | | | 10-15-2020 | | | | 300,000 | | | | 304,590 | |
TransDigm Incorporated | | | 6.00 | | | | 7-15-2022 | | | | 300,000 | | | | 310,500 | |
Triumph Group Incorporated | | | 5.25 | | | | 6-1-2022 | | | | 200,000 | | | | 192,120 | |
| |
| | | | 1,814,960 | |
| | | | | | | | | | | | | | | | |
| | | | |
| Air Freight & Logistics: 0.21% | | | | | | | | | | | | | | | | |
XPO Logistics Incorporated 144A | | | 6.13 | | | | 9-1-2023 | | | | 200,000 | | | | 208,750 | |
| | | | | | | | | | | | | | | | |
| | | | |
| Building Products: 0.22% | | | | | | | | | | | | | | | | |
Standard Industries Incorporated 144A | | | 5.50 | | | | 2-15-2023 | | | | 200,000 | | | | 210,750 | |
| | | | | | | | | | | | | | | | |
The accompanying notes are an integral part of these financial statements.
| | | | |
| 184 | | Wells Fargo Target Date Funds | | Portfolio of investments—August 31, 2017 (unaudited) |
HIGH YIELD CORPORATE BOND PORTFOLIO
| | | | | | | | | | | | | | | | |
| Security name | | Interest rate | | | Maturity date | | | Principal | | | Value | |
| | | | |
| Commercial Services & Supplies: 1.06% | | | | | | | | | | | | | | | | |
ADT Corporation | | | 3.50 | % | | | 7-15-2022 | | | $ | 200,000 | | | $ | 199,360 | |
Aramark Services Incorporated | | | 4.75 | | | | 6-1-2026 | | | | 300,000 | | | | 314,340 | |
BWAY Holding Company 144A | | | 7.25 | | | | 4-15-2025 | | | | 300,000 | | | | 306,375 | |
Reynolds Group Issuer Incorporated 144A | | | 7.00 | | | | 7-15-2024 | | | | 200,000 | | | | 214,250 | |
| |
| | | | 1,034,325 | |
| | | | | | | | | | | | | | | | |
| | | | |
| Construction & Engineering: 0.88% | | | | | | | | | | | | | | | | |
AECOM | | | 5.88 | | | | 10-15-2024 | | | | 300,000 | | | | 328,125 | |
United Rentals North America Incorporated | | | 5.50 | | | | 7-15-2025 | | | | 500,000 | | | | 535,000 | |
| |
| | | | 863,125 | |
| | | | | | | | | | | | | | | | |
| | | | |
| Electrical Equipment: 0.23% | | | | | | | | | | | | | | | | |
Vertiv Group Corporation 144A | | | 9.25 | | | | 10-15-2024 | | | | 200,000 | | | | 222,500 | |
| | | | | | | | | | | | | | | | |
| | | | |
| Machinery: 0.55% | | | | | | | | | | | | | | | | |
BlueLine Rental Finance Corporation 144A | | | 9.25 | | | | 3-15-2024 | | | | 300,000 | | | | 327,570 | |
Gates Global LLC 144A | | | 6.00 | | | | 7-15-2022 | | | | 200,000 | | | | 204,960 | |
| |
| | | | 532,530 | |
| | | | | | | | | | | | | | | | |
| | | | |
| Road & Rail: 0.40% | | | | | | | | | | | | | | | | |
Avis Budget Car Rental LLC 144A | | | 5.13 | | | | 6-1-2022 | | | | 200,000 | | | | 200,500 | |
The Hertz Corporation | | | 6.25 | | | | 10-15-2022 | | | | 200,000 | | | | 186,000 | |
| |
| | | | 386,500 | |
| | | | | | | | | | | | | | | | |
| | | | |
| Trading Companies & Distributors: 0.97% | | | | | | | | | | | | | | | | |
Aircastle Limited | | | 4.63 | | | | 12-15-2018 | | | | 300,000 | | | | 308,625 | |
Ashtead Capital Incorporated 144A | | | 4.38 | | | | 8-15-2027 | | | | 200,000 | | | | 204,500 | |
HD Supply Incorporated 144A | | | 5.75 | | | | 4-15-2024 | | | | 300,000 | | | | 321,750 | |
Herc Rentals Incorporated 144A | | | 7.50 | | | | 6-1-2022 | | | | 100,000 | | | | 109,500 | |
| |
| | | | 944,375 | |
| | | | | | | | | | | | | | | | |
| | | | |
Information Technology: 5.23% | | | | | | | | | | | | | | | | |
| | | | |
| Communications Equipment: 0.51% | | | | | | | | | | | | | | | | |
CommScope Technologies Finance LLC 144A | | | 5.00 | | | | 3-15-2027 | | | | 500,000 | | | | 498,275 | |
| | | | | | | | | | | | | | | | |
| | | | |
| Electronic Equipment, Instruments & Components: 0.21% | | | | | | | | | | | | | | | | |
CDW LLC / CDW Finance Corporation | | | 5.00 | | | | 9-1-2023 | | | | 200,000 | | | | 208,250 | |
| | | | | | | | | | | | | | | | |
| | | | |
| Internet Software & Services: 1.29% | | | | | | | | | | | | | | | | |
Infor Software Parent LLC (PIK at 7.88%) 144A¥ | | | 7.13 | | | | 5-1-2021 | | | | 400,000 | | | | 408,000 | |
Rackspace Hosting Company 144A | | | 8.63 | | | | 11-15-2024 | | | | 300,000 | | | | 318,375 | |
Verisign Incorporated | | | 5.25 | | | | 4-1-2025 | | | | 300,000 | | | | 321,000 | |
Zayo Group LLC | | | 6.00 | | | | 4-1-2023 | | | | 200,000 | | | | 211,690 | |
| |
| | | | 1,259,065 | |
| | | | | | | | | | | | | | | | |
| | | | |
| IT Services: 0.79% | | | | | | | | | | | | | | | | |
Conduent Business Services LLC 144A | | | 10.50 | | | | 12-15-2024 | | | | 200,000 | | | | 236,000 | |
First Data Corporation 144A | | | 7.00 | | | | 12-1-2023 | | | | 500,000 | | | | 538,750 | |
| |
| | | | 774,750 | |
| | | | | | | | | | | | | | | | |
The accompanying notes are an integral part of these financial statements.
| | | | | | |
| Portfolio of investments—August 31, 2017 (unaudited) | | Wells Fargo Target Date Funds | | | 185 | |
HIGH YIELD CORPORATE BOND PORTFOLIO
| | | | | | | | | | | | | | | | |
| Security name | | Interest rate | | | Maturity date | | | Principal | | | Value | |
| | | | |
| Semiconductors & Semiconductor Equipment: 0.33% | | | | | | | | | | | | | | | | |
Micron Technology Incorporated | | | 5.50 | % | | | 2-1-2025 | | | $ | 300,000 | | | $ | 316,860 | |
| | | | | | | | | | | | | | | | |
| | | | |
| Software: 1.00% | | | | | | | | | | | | | | | | |
BMC Software Finance Incorporated 144A | | | 8.13 | | | | 7-15-2021 | | | | 200,000 | | | | 206,500 | |
Solera LLC / Solera Finance Incorporated 144A | | | 10.50 | | | | 3-1-2024 | | | | 300,000 | | | | 341,625 | |
Symantec Corporation 144A | | | 5.00 | | | | 4-15-2025 | | | | 200,000 | | | | 209,440 | |
Veritas US Incorporated / Veritas Bermuda Limited 144A | | | 10.50 | | | | 2-1-2024 | | | | 200,000 | | | | 214,500 | |
| |
| | | | 972,065 | |
| | | | | | | | | | | | | | | | |
| | | | |
| Technology Hardware, Storage & Peripherals: 1.10% | | | | | | | | | | | | | | | | |
Diamond 1 Finance Corporation 144A | | | 5.88 | | | | 6-15-2021 | | | | 200,000 | | | | 209,690 | |
EMC Corporation | | | 3.38 | | | | 6-1-2023 | | | | 300,000 | | | | 289,647 | |
NCR Corporation | | | 6.38 | | | | 12-15-2023 | | | | 200,000 | | | | 213,900 | |
Western Digital Corporation | | | 10.50 | | | | 4-1-2024 | | | | 300,000 | | | | 355,875 | |
| |
| | | | 1,069,112 | |
| | | | | | | | | | | | | | | | |
| | | | |
Materials: 5.66% | | | | | | | | | | | | | | | | |
| | | | |
| Chemicals: 1.88% | | | | | | | | | | | | | | | | |
CF Industries Incorporated | | | 7.13 | | | | 5-1-2020 | | | | 300,000 | | | | 330,750 | |
Chemours Company | | | 6.63 | | | | 5-15-2023 | | | | 200,000 | | | | 212,250 | |
Hexion Incorporated | | | 6.63 | | | | 4-15-2020 | | | | 400,000 | | | | 364,000 | |
Platform Specialty Products 144A | | | 6.50 | | | | 2-1-2022 | | | | 300,000 | | | | 311,250 | |
Signode Industrial Group LLC 144A | | | 6.38 | | | | 5-1-2022 | | | | 300,000 | | | | 309,750 | |
Tronox Finance LLC | | | 6.38 | | | | 8-15-2020 | | | | 300,000 | | | | 304,875 | |
| |
| | | | 1,832,875 | |
| | | | | | | | | | | | | | | | |
| | | | |
| Construction Materials: 0.21% | | | | | | | | | | | | | | | | |
Summit Materials LLC | | | 6.13 | | | | 7-15-2023 | | | | 200,000 | | | | 209,500 | |
| | | | | | | | | | | | | | | | |
| | | | |
| Containers & Packaging: 1.87% | | | | | | | | | | | | | | | | |
Ball Corporation | | | 5.25 | | | | 7-1-2025 | | | | 200,000 | | | | 218,000 | |
Berry Plastics Corporation | | | 6.00 | | | | 10-15-2022 | | | | 300,000 | | | | 317,625 | |
BWAY Holding Company 144A | | | 5.50 | | | | 4-15-2024 | | | | 300,000 | | | | 313,125 | |
Owens-Brockway Glass Container Incorporated 144A | | | 5.88 | | | | 8-15-2023 | | | | 200,000 | | | | 219,500 | |
Reynolds Group Issuer Incorporated 144A | | | 5.13 | | | | 7-15-2023 | | | | 300,000 | | | | 312,657 | |
Sealed Air Corporation 144A | | | 5.25 | | | | 4-1-2023 | | | | 200,000 | | | | 214,000 | |
Sealed Air Corporation 144A | | | 6.50 | | | | 12-1-2020 | | | | 200,000 | | | | 223,120 | |
| |
| | | | 1,818,027 | |
| | | | | | | | | | | | | | | | |
| | | | |
| Metals & Mining: 1.70% | | | | | | | | | | | | | | | | |
Aleris International Incorporated | | | 7.88 | | | | 11-1-2020 | | | | 300,000 | | | | 295,815 | |
Freeport Mcmoran Incorporated | | | 6.50 | | | | 11-15-2020 | | | | 500,000 | | | | 511,250 | |
Freeport-McMoRan Copper & Gold Incorporated | | | 5.40 | | | | 11-14-2034 | | | | 200,000 | | | | 192,500 | |
Joseph T Ryerson & Son Incorporated 144A | | | 11.00 | | | | 5-15-2022 | | | | 200,000 | | | | 226,250 | |
Steel Dynamics Incorporated | | | 5.25 | | | | 4-15-2023 | | | | 200,000 | | | | 207,000 | |
United States Steel Corporation 144A | | | 8.38 | | | | 7-1-2021 | | | | 200,000 | | | | 221,000 | |
| |
| | | | 1,653,815 | |
| | | | | | | | | | | | | | | | |
The accompanying notes are an integral part of these financial statements.
| | | | |
| 186 | | Wells Fargo Target Date Funds | | Portfolio of investments—August 31, 2017 (unaudited) |
HIGH YIELD CORPORATE BOND PORTFOLIO
| | | | | | | | | | | | | | | | |
| Security name | | Interest rate | | | Maturity date | | | Principal | | | Value | |
| | | | |
Real Estate: 1.90% | | | | | | | | | | | | | | | | |
| | | | |
| Equity REITs: 1.36% | | | | | | | | | | | | | | | | |
Equinix Incorporated | | | 5.38 | % | | | 4-1-2023 | | | $ | 300,000 | | | $ | 312,750 | |
Iron Mountain Incorporated | | | 5.75 | | | | 8-15-2024 | | | | 300,000 | | | | 306,015 | |
MGM Growth Properties Operating Partnership LP | | | 4.50 | | | | 9-1-2026 | | | | 300,000 | | | | 305,250 | |
SBA Communications Corporation | | | 4.88 | | | | 7-15-2022 | | | | 200,000 | | | | 207,000 | |
Uniti Group Incorporated / CSL Capital LLC | | | 8.25 | | | | 10-15-2023 | | | | 200,000 | | | | 195,420 | |
| |
| | | | 1,326,435 | |
| | | | | | | | | | | | | | | | |
| | | | |
| Real Estate Management & Development: 0.54% | | | | | | | | | | | | | | | | |
Icahn Enterprises Company | | | 6.75 | | | | 2-1-2024 | | | | 500,000 | | | | 526,400 | |
| | | | | | | | | | | | | | | | |
| | | | |
Telecommunication Services: 3.93% | | | | | | | | | | | | | | | | |
| | | | |
| Diversified Telecommunication Services: 2.36% | | | | | | | | | | | | | | | | |
CenturyLink Incorporated | | | 7.60 | | | | 9-15-2039 | | | | 300,000 | | | | 264,750 | |
Centurylink Incorporated | | | 5.63 | | | | 4-1-2025 | | | | 300,000 | | | | 285,375 | |
Embarq Corporation | | | 8.00 | | | | 6-1-2036 | | | | 200,000 | | | | 203,000 | |
Frontier Communications Corporation | | | 8.75 | | | | 4-15-2022 | | | | 300,000 | | | | 254,250 | |
Hughes Satellite Systems Company | | | 7.63 | | | | 6-15-2021 | | | | 300,000 | | | | 341,625 | |
Level 3 Financing Incorporated | | | 5.38 | | | | 1-15-2024 | | | | 400,000 | | | | 408,880 | |
Level 3 Financing Incorporated | | | 5.63 | | | | 2-1-2023 | | | | 300,000 | | | | 309,000 | |
Windstream Services LLC | | | 7.50 | | | | 6-1-2022 | | | | 300,000 | | | | 234,000 | |
| |
| | | | 2,300,880 | |
| | | | | | | | | | | | | | | | |
| | | | |
| Wireless Telecommunication Services: 1.57% | | | | | | | | | | | | | | | | |
Sprint Corporation | | | 6.90 | | | | 5-1-2019 | | | | 200,000 | | | | 214,020 | |
Sprint Corporation | | | 7.25 | | | | 9-15-2021 | | | | 200,000 | | | | 220,500 | |
Sprint Corporation | | | 7.88 | | | | 9-15-2023 | | | | 400,000 | | | | 457,052 | |
T-Mobile USA Incorporated | | | 5.38 | | | | 4-15-2027 | | | | 400,000 | | | | 429,120 | |
T-Mobile USA Incorporated | | | 6.50 | | | | 1-15-2024 | | | | 200,000 | | | | 213,500 | |
| |
| | | | 1,534,192 | |
| | | | | | | | | | | | | | | | |
| | | | |
Utilities: 3.00% | | | | | | | | | | | | | | | | |
| | | | |
| Electric Utilities: 0.45% | | | | | | | | | | | | | | | | |
Talen Energy Supply LLC Company | | | 6.50 | | | | 6-1-2025 | | | | 600,000 | | | | 438,000 | |
| | | | | | | | | | | | | | | | |
| | | | |
| Gas Utilities: 0.80% | | | | | | | | | | | | | | | | |
AmeriGas Partners LP / AmeriGas Finance Corporation | | | 5.50 | | | | 5-20-2025 | | | | 300,000 | | | | 303,750 | |
Ferrellgas LP | | | 6.75 | | | | 6-15-2023 | | | | 500,000 | | | | 473,750 | |
| |
| | | | 777,500 | |
| | | | | | | | | | | | | | | | |
| | | | |
| Independent Power & Renewable Electricity Producers: 1.75% | | | | | | | | | | | | | | | | |
AES Corporation | | | 8.00 | | | | 6-1-2020 | | | | 65,000 | | | | 74,263 | |
Calpine Corporation 144A | | | 6.00 | | | | 1-15-2022 | | | | 300,000 | | | | 309,375 | |
Dynergy Incorporated | | | 5.88 | | | | 6-1-2023 | | | | 500,000 | | | | 496,250 | |
NRG Energy Incorporated | | | 6.63 | | | | 3-15-2023 | | | | 200,000 | | | | 207,000 | |
TerraForm Power Operating LLC 144A | | | 6.38 | | | | 2-1-2023 | | | | 200,000 | | | | 207,000 | |
The AES Corporation | | | 5.50 | | | | 3-15-2024 | | | | 400,000 | | | | 415,000 | |
| |
| | | | 1,708,888 | |
| | | | | | | | | | | | | | | | |
| |
Total Corporate Bonds and Notes (Cost $72,798,510) | | | | 72,134,153 | |
| | | | | | | | | | | | | | | | |
The accompanying notes are an integral part of these financial statements.
| | | | | | |
| Portfolio of investments—August 31, 2017 (unaudited) | | Wells Fargo Target Date Funds | | | 187 | |
HIGH YIELD CORPORATE BOND PORTFOLIO
| | | | | | | | | | | | | | | | |
| Security name | | Interest rate | | | Maturity date | | | Principal | | | Value | |
| | | | |
Yankee Corporate Bonds and Notes: 18.46% | | | | | | | | | | | | | | | | |
| | | | |
Consumer Discretionary: 3.67% | | | | | | | | | | | | | | | | |
| | | | |
| Auto Components: 0.31% | | | | | | | | | | | | | | | | |
IHO Verwaltungs GmbH 144A | | | 4.50 | % | | | 9-15-2023 | | | $ | 300,000 | | | $ | 305,250 | |
| | | | | | | | | | | | | | | | |
| | | | |
| Automobiles: 1.18% | | | | | | | | | | | | | | | | |
Fiat Chrysler Automobiles NV | | | 5.25 | | | | 4-15-2023 | | | | 600,000 | | | | 639,000 | |
Jaguar Land Rover Automotive plc 144A | | | 4.13 | | | | 12-15-2018 | | | | 500,000 | | | | 507,500 | |
| |
| | | | 1,146,500 | |
| | | | | | | | | | | | | | | | |
| | | | |
| Household Durables: 0.32% | | | | | | | | | | | | | | | | |
Brookfield Residential Properties Incorporated 144A | | | 6.13 | | | | 7-1-2022 | | | | 300,000 | | | | 312,750 | |
| | | | | | | | | | | | | | | | |
| | | | |
| Media: 1.86% | | | | | | | | | | | | | | | | |
Altice SA 144A | | | 7.63 | | | | 2-15-2025 | | | | 200,000 | | | | 216,440 | |
Societe Francaise du Radiotelephone Group SA 144A | | | 6.25 | | | | 5-15-2024 | | | | 800,000 | | | | 843,000 | |
Unitymedia GmbH 144A | | | 6.13 | | | | 1-15-2025 | | | | 300,000 | | | | 320,985 | |
Videotron Limited | | | 5.00 | | | | 7-15-2022 | | | | 400,000 | | | | 428,000 | |
| |
| | | | 1,808,425 | |
| | | | | | | | | | | | | | | | |
| | | | |
Consumer Staples: 0.32% | | | | | | | | | | | | | | | | |
| | | | |
| Food & Staples Retailing: 0.32% | | | | | | | | | | | | | | | | |
Tesco Place 144A | | | 6.15 | | | | 11-15-2037 | | | | 300,000 | | | | 314,661 | |
| | | | | | | | | | | | | | | | |
| | | | |
Energy: 2.76% | | | | | | | | | | | | | | | | |
| | | | |
| Energy Equipment & Services: 0.86% | | | | | | | | | | | | | | | | |
Alcoa Nederland Holding Company BV 144A | | | 7.00 | | | | 9-30-2026 | | | | 300,000 | | | | 335,250 | |
Ensco plc | | | 4.70 | | | | 3-15-2021 | | | | 200,000 | | | | 190,000 | |
Noble Holding International Limited | | | 8.70 | | | | 4-1-2045 | | | | 200,000 | | | | 142,980 | |
Precision Drilling Corporation | | | 5.25 | | | | 11-15-2024 | | | | 200,000 | | | | 176,500 | |
| |
| | | | 844,730 | |
| | | | | | | | | | | | | | | | |
| | | | |
| Oil, Gas & Consumable Fuels: 1.90% | | | | | | | | | | | | | | | | |
MEG Energy Corporation 144A | | | 6.50 | | | | 1-15-2025 | | | | 300,000 | | | | 278,625 | |
Navios Maritime Acquisition Corporation 144A | | | 8.13 | | | | 11-15-2021 | | | | 300,000 | | | | 249,000 | |
Seven Generations Energy Company 144A | | | 6.88 | | | | 6-30-2023 | | | | 400,000 | | | | 416,000 | |
Tullow Oil plc 144A | | | 6.25 | | | | 4-15-2022 | | | | 400,000 | | | | 376,000 | |
Weatherford International Limited | | | 5.13 | | | | 9-15-2020 | | | | 200,000 | | | | 193,000 | |
Weatherford International Limited | | | 7.00 | | | | 3-15-2038 | | | | 400,000 | | | | 338,000 | |
| |
| | | | 1,850,625 | |
| | | | | | | | | | | | | | | | |
| | | | |
Financials: 1.75% | | | | | | | | | | | | | | | | |
| | | | |
| Banks: 0.76% | | | | | | | | | | | | | | | | |
Intesa Sanpaolo SpA 144A | | | 5.02 | | | | 6-26-2024 | | | | 400,000 | | | | 409,397 | |
Royal Bank of Scotland Group plc | | | 6.00 | | | | 12-19-2023 | | | | 300,000 | | | | 332,444 | |
| |
| | | | 741,841 | |
| | | | | | | | | | | | | | | | |
| | | | |
| Diversified Financial Services: 0.99% | | | | | | | | | | | | | | | | |
Algeco Scotsman Global Finance plc 144A | | | 10.75 | | | | 10-15-2019 | | | | 300,000 | | | | 249,750 | |
Anglo American Capital plc 144A | | | 4.45 | | | | 9-27-2020 | | | | 300,000 | | | | 314,250 | |
The accompanying notes are an integral part of these financial statements.
| | | | |
| 188 | | Wells Fargo Target Date Funds | | Portfolio of investments—August 31, 2017 (unaudited) |
HIGH YIELD CORPORATE BOND PORTFOLIO
| | | | | | | | | | | | | | | | |
| Security name | | Interest rate | | | Maturity date | | | Principal | | | Value | |
| | | | |
| Diversified Financial Services (continued) | | | | | | | | | | | | | | | | |
Deutsche Bank AG (5 Year USD Swap Rate +2.25%) ± | | | 4.30 | % | | | 5-24-2028 | | | $ | 200,000 | | | $ | 200,235 | |
New Red Finance Incorporated 144A | | | 4.63 | | | | 1-15-2022 | | | | 200,000 | | | | 204,440 | |
| |
| | | | 968,675 | |
| | | | | | | | | | | | | | | | |
| | | | |
Health Care: 1.18% | | | | | | | | | | | | | | | | |
| | | | |
| Pharmaceuticals: 1.18% | | | | | | | | | | | | | | | | |
Concordia International 144A | | | 9.00 | | | | 4-1-2022 | | | | 400,000 | | | | 288,000 | |
Mallinckrodt plc 144A | | | 4.88 | | | | 4-15-2020 | | | | 300,000 | | | | 297,750 | |
Valeant Pharmaceuticals International Incorporated 144A | | | 5.63 | | | | 12-1-2021 | | | | 400,000 | | | | 367,000 | |
Valeant Pharmaceuticals International Incorporated 144A | | | 7.50 | | | | 7-15-2021 | | | | 200,000 | | | | 196,250 | |
| |
| | | | 1,149,000 | |
| | | | | | | | | | | | | | | | |
| | | | |
Industrials: 1.44% | | | | | | | | | | | | | | | | |
| | | | |
| Aerospace & Defense: 0.56% | | | | | | | | | | | | | | | | |
Bombardier Incorporated 144A | | | 6.13 | | | | 1-15-2023 | | | | 200,000 | | | | 205,188 | |
Bombardier Incorporated 144A | | | 8.75 | | | | 12-1-2021 | | | | 300,000 | | | | 340,779 | |
| |
| | | | 545,967 | |
| | | | | | | | | | | | | | | | |
| | | | |
| Commercial Services & Supplies: 0.21% | | | | | | | | | | | | | | | | |
Park Aerospace Holdings Company 144A | | | 5.25 | | | | 8-15-2022 | | | | 200,000 | | | | 208,000 | |
| | | | | | | | | | | | | | | | |
| | | | |
| Electrical Equipment: 0.34% | | | | | | | | | | | | | | | | |
Sensata Technologies BV 144A | | | 5.63 | | | | 11-1-2024 | | | | 300,000 | | | | 327,000 | |
| | | | | | | | | | | | | | | | |
| | | | |
| Professional Services: 0.33% | | | | | | | | | | | | | | | | |
IHS Markit Limited 144A | | | 4.75 | | | | 2-15-2025 | | | | 300,000 | | | | 319,500 | |
| | | | | | | | | | | | | | | | |
| | | | |
Information Technology: 1.11% | | | | | | | | | | | | | | | | |
| | | | |
| Communications Equipment: 0.45% | | | | | | | | | | | | | | | | |
Nokia Corporation | | | 5.38 | | | | 5-15-2019 | | | | 200,000 | | | | 211,060 | |
Nokia Corporation | | | 6.63 | | | | 5-15-2039 | | | | 200,000 | | | | 230,000 | |
| |
| | | | 441,060 | |
| | | | | | | | | | | | | | | | |
| | | | |
| Semiconductors & Semiconductor Equipment: 0.44% | | | | | | | | | | | | | | | | |
NXP BV / NXP Funding LLC 144A | | | 4.63 | | | | 6-15-2022 | | | | 400,000 | | | | 427,000 | |
| | | | | | | | | | | | | | | | |
| | | | |
| Software: 0.22% | | | | | | | | | | | | | | | | |
Open Text Corporation 144A | | | 5.63 | | | | 1-15-2023 | | | | 200,000 | | | | 210,750 | |
| | | | | | | | | | | | | | | | |
| | | | |
Materials: 2.64% | | | | | | | | | | | | | | | | |
| | | | |
| Containers & Packaging: 0.23% | | | | | | | | | | | | | | | | |
Ardagh Packaging Finance plc 144A | | | 7.25 | | | | 5-15-2024 | | | | 200,000 | | | | 220,620 | |
| | | | | | | | | | | | | | | | |
| | | | |
| Metals & Mining: 2.41% | | | | | | | | | | | | | | | | |
Anglo American Capital plc 144A | | | 4.75 | | | | 4-10-2027 | | | | 300,000 | | | | 315,000 | |
ArcelorMittal SA | | | 5.75 | | | | 8-5-2020 | | | | 200,000 | | | | 216,000 | |
ArcelorMittal SA | | | 7.25 | | | | 3-1-2041 | | | | 400,000 | | | | 463,120 | |
Constellium NV 144A | | | 8.00 | | | | 1-15-2023 | | | | 300,000 | | | | 319,500 | |
The accompanying notes are an integral part of these financial statements.
| | | | | | |
| Portfolio of investments—August 31, 2017 (unaudited) | | Wells Fargo Target Date Funds | | | 189 | |
HIGH YIELD CORPORATE BOND PORTFOLIO
| | | | | | | | | | | | | | | | |
| Security name | | Interest rate | | | Maturity date | | | Principal | | | Value | |
| | | | |
| Metals & Mining (continued) | | | | | | | | | | | | | | | | |
FMG Resources August 2006 Property Limited 144A | | | 4.75 | % | | | 5-15-2022 | | | $ | 200,000 | | | $ | 206,500 | |
Novelis Corporation 144A | | | 6.25 | | | | 8-15-2024 | | | | 300,000 | | | | 316,875 | |
Teck Resources Limited | | | 4.75 | | | | 1-15-2022 | | | | 300,000 | | | | 314,640 | |
Teck Resources Limited | | | 5.40 | | | | 2-1-2043 | | | | 200,000 | | | | 199,500 | |
| |
| | | | 2,351,135 | |
| | | | | | | | | | | | | | | | |
| | | | |
Telecommunication Services: 3.34% | | | | | | | | | | | | | | | | |
| | | | |
| Diversified Telecommunication Services: 2.37% | | | | | | | | | | | | | | | | |
Intelsat Jackson Holdings SA | | | 7.25 | | | | 10-15-2020 | | | | 400,000 | | | | 380,750 | |
Telecom Italia Capital SA | | | 7.18 | | | | 6-18-2019 | | | | 100,000 | | | | 108,370 | |
Telecom Italia Capital SA | | | 7.72 | | | | 6-4-2038 | | | | 300,000 | | | | 385,440 | |
Virgin Media Finance plc 144A | | | 6.00 | | | | 10-15-2024 | | | | 400,000 | | | | 419,000 | |
Wind Acquisition Finance SA 144A | | | 4.75 | | | | 7-15-2020 | | | | 600,000 | | | | 607,500 | |
Ziggo Bond Finance BV 144A | | | 5.88 | | | | 1-15-2025 | | | | 400,000 | | | | 414,500 | |
| |
| | | | 2,315,560 | |
| | | | | | | | | | | | | | | | |
| | | | |
| Wireless Telecommunication Services: 0.97% | | | | | | | | | | | | | | | | |
Altice Financing SA 144A | | | 6.63 | | | | 2-15-2023 | | | | 100,000 | | | | 105,750 | |
Inmarsat Finance plc 144A | | | 4.88 | | | | 5-15-2022 | | | | 200,000 | | | | 203,500 | |
Millicom International Cellular SA 144A | | | 6.00 | | | | 3-15-2025 | | | | 400,000 | | | | 425,511 | |
SoftBank Group Corporation 144A | | | 4.50 | | | | 4-15-2020 | | | | 200,000 | | | | 206,750 | |
| |
| | | | 941,511 | |
| | | | | | | | | | | | | | | | |
| | | | |
Utilities: 0.25% | | | | | | | | | | | | | | | | |
| | | | |
| Electric Utilities: 0.25% | | | | | | | | | | | | | | | | |
Enel SpA (5 Year USD Swap Rate +5.88%) 144A± | | | 8.75 | | | | 9-24-2073 | | | | 200,000 | | | | 241,750 | |
| | | | | | | | | | | | | | | | |
| |
Total Yankee Corporate Bonds and Notes (Cost $17,974,404) | | | | 17,992,310 | |
| | | | | | | | | | | | | | | | |
| | | | |
| | | Yield | | | | | | Shares | | | | |
| Short-Term Investments: 4.30% | | | | | | | | | | | | | | | | |
| | | | |
| Investment Companies: 4.30% | | | | | | | | | | | | | | | | |
Wells Fargo Government Money Market Fund Select Class (l)(u) | | | 0.92 | | | | | | | | 4,196,265 | | | | 4,196,265 | |
| | | | | | | | | | | | | | | | |
| |
Total Short-Term Investments (Cost $4,196,265) | | | | 4,196,265 | |
| | | | | | | | | | | | | | | | |
| | | | | | | | |
| Total investments in securities (Cost $94,969,179) | | | 96.77 | % | | | 94,322,728 | |
Other assets and liabilities, net | | | 3.23 | | | | 3,144,498 | |
| | | | | | | | |
| Total net assets | | | 100.00 | % | | $ | 97,467,226 | |
| | | | | | | | |
| 144A | The security may be resold in transactions exempt from registration, normally to qualified institutional buyers, pursuant to Rule 144A under the Securities Act of 1933. |
| ± | Variable rate investment. The rate shown is the rate in effect at period end. |
| ¥ | A payment-in-kind (PIK) security is a security in which the issuer may make interest or dividend payments in cash or additional securities. These additional securities generally have the same terms as the original holdings. |
| (l) | The issuer of the security is an affiliated person of the Portfolio as defined in the Investment Company Act of 1940. |
| (u) | The rate represents the 7-day annualized yield at period end. |
The accompanying notes are an integral part of these financial statements.
| | | | |
| 190 | | Wells Fargo Target Date Funds | | Portfolio of investments—August 31, 2017 (unaudited) |
HIGH YIELD CORPORATE BOND PORTFOLIO
Investments In Affiliates
An affiliated investment is an investment in which the Portfolio owns at least 5% of the outstanding voting shares of the issuer or as a result of other relationships, such as the Portfolio and the issuer having the same investment manager. Transactions with issuers that were either affiliated persons of the Portfolio at the beginning of the period or the end of the period were as follows:
| | | | | | | | | | | | | | | | | | | | | | | | | | | | | | | | |
| | | Shares,
beginning of
period | | | Shares
purchased | | | Shares sold | | | Shares,
end of
period | | | Net
realized
gains
(losses) | | | Net change
in
unrealized
gains
(losses) | | | Income
from
affiliated
securities | | | Value,
end
of period | |
Investment companies - 4.30% | | | | | | | | | | | | | | | | | | | | | | | | | | | | | | | | |
Wells Fargo Government Money Market Fund Select Class | | | 0 | | | | 110,727,911 | | | | 106,531,646 | | | | 4,196,265 | | | $ | 0 | | | $ | 0 | | | $ | 8,405 | | | $ | 4,196,265 | |
The accompanying notes are an integral part of these financial statements.
| | | | | | |
| Portfolio of investments—August 31, 2017 (unaudited) | | Wells Fargo Target Date Funds | | | 191 | |
INVESTMENT GRADE CORPORATE BOND PORTFOLIO
| | | | | | | | | | | | | | | | |
| Security name | | Interest rate | | | Maturity date | | | Principal | | | Value | |
| | | | |
Corporate Bonds and Notes: 75.90% | | | | | | | | | | | | | | | | |
| | | | |
Consumer Discretionary: 7.64% | | | | | | | | | | | | | | | | |
| | | | |
| Auto Components: 0.05% | | | | | | | | | | | | | | | | |
Lear Corporation | | | 5.25 | % | | | 1-15-2025 | | | $ | 297,000 | | | $ | 318,306 | |
| | | | | | | | | | | | | | | | |
| | | | |
| Automobiles: 0.37% | | | | | | | | | | | | | | | | |
American Honda Finance Corporation | | | 1.65 | | | | 7-12-2021 | | | | 1,300,000 | | | | 1,280,971 | |
General Motors Company | | | 6.25 | | | | 10-2-2043 | | | | 175,000 | | | | 195,577 | |
General Motors Company | | | 6.60 | | | | 4-1-2036 | | | | 350,000 | | | | 409,893 | |
Toyota Motor Credit Corporation | | | 2.63 | | | | 1-10-2023 | | | | 310,000 | | | | 315,081 | |
| |
| | | | 2,201,522 | |
| | | | | | | | | | | | | | | | |
| | | | |
| Diversified Consumer Services: 0.04% | | | | | | | | | | | | | | | | |
President & Fellows of Harvard College | | | 4.88 | | | | 10-15-2040 | | | | 210,000 | | | | 264,997 | |
| | | | | | | | | | | | | | | | |
| | | | |
| Hotels, Restaurants & Leisure: 0.65% | | | | | | | | | | | | | | | | |
Marriott International Incorporated | | | 3.00 | | | | 3-1-2019 | | | | 140,000 | | | | 141,743 | |
Marriott International Incorporated | | | 3.38 | | | | 10-15-2020 | | | | 117,000 | | | | 120,843 | |
Marriott International Incorporated | | | 3.75 | | | | 3-15-2025 | | | | 500,000 | | | | 521,947 | |
McDonald’s Corporation | | | 2.63 | | | | 1-15-2022 | | | | 250,000 | | | | 253,810 | |
McDonald’s Corporation | | | 3.25 | | | | 6-10-2024 | | | | 350,000 | | | | 364,533 | |
McDonald’s Corporation | | | 3.38 | | | | 5-26-2025 | | | | 245,000 | | | | 253,716 | |
McDonald’s Corporation | | | 3.50 | | | | 7-15-2020 | | | | 140,000 | | | | 146,140 | |
McDonald’s Corporation | | | 3.63 | | | | 5-20-2021 | | | | 70,000 | | | | 73,642 | |
McDonald’s Corporation | | | 3.70 | | | | 2-15-2042 | | | | 350,000 | | | | 333,808 | |
McDonald’s Corporation | | | 6.30 | | | | 10-15-2037 | | | | 210,000 | | | | 279,101 | |
McDonald’s Corporation | | | 6.30 | | | | 3-1-2038 | | | | 420,000 | | | | 556,429 | |
McDonald’s Corporation | | | 4.60 | | | | 5-26-2045 | | | | 175,000 | | | | 191,621 | |
Starbucks Corporation | | | 2.00 | | | | 12-5-2018 | | | | 175,000 | | | | 176,048 | |
Starbucks Corporation | | | 4.30 | | | | 6-15-2045 | | | | 105,000 | | | | 116,270 | |
Wyndham Worldwide Corporation | | | 4.25 | | | | 3-1-2022 | | | | 350,000 | | | | 354,149 | |
| |
| | | | 3,883,800 | |
| | | | | | | | | | | | | | | | |
| | | | |
| Household Durables: 0.44% | | | | | | | | | | | | | | | | |
D.R. Horton Incorporated | | | 3.75 | | | | 3-1-2019 | | | | 182,000 | | | | 185,907 | |
D.R. Horton Incorporated | | | 4.00 | | | | 2-15-2020 | | | | 231,000 | | | | 240,402 | |
Newell Brands Incorporated | | | 3.15 | | | | 4-1-2021 | | | | 525,000 | | | | 539,979 | |
Newell Brands Incorporated | | | 4.20 | | | | 4-1-2026 | | | | 525,000 | | | | 559,710 | |
Newell Brands Incorporated | | | 5.50 | | | | 4-1-2046 | | | | 225,000 | | | | 269,277 | |
Newell Rubbermaid Incorporated | | | 2.88 | | | | 12-1-2019 | | | | 140,000 | | | | 142,571 | |
Newell Rubbermaid Incorporated | | | 4.70 | | | | 8-15-2020 | | | | 350,000 | | | | 375,269 | |
Whirlpool Corporation | | | 4.00 | | | | 3-1-2024 | | | | 87,000 | | | | 92,766 | |
Whirlpool Corporation | | | 4.70 | | | | 6-1-2022 | | | | 140,000 | | | | 153,691 | |
Whirlpool Corporation | | | 4.85 | | | | 6-15-2021 | | | | 70,000 | | | | 76,380 | |
| |
| | | | 2,635,952 | |
| | | | | | | | | | | | | | | | |
| | | | |
| Internet & Direct Marketing Retail: 0.59% | | | | | | | | | | | | | | | | |
Amazon.com Incorporated | | | 2.50 | | | | 11-29-2022 | | | | 620,000 | | | | 627,535 | |
Amazon.com Incorporated | | | 2.60 | | | | 12-5-2019 | | | | 280,000 | | | | 285,457 | |
Amazon.com Incorporated | | | 4.80 | | | | 12-5-2034 | | | | 850,000 | | | | 974,980 | |
The accompanying notes are an integral part of these financial statements.
| | | | |
| 192 | | Wells Fargo Target Date Funds | | Portfolio of investments—August 31, 2017 (unaudited) |
INVESTMENT GRADE CORPORATE BOND PORTFOLIO
| | | | | | | | | | | | | | | | |
| Security name | | Interest rate | | | Maturity date | | | Principal | | | Value | |
| | | | |
| Internet & Direct Marketing Retail (continued) | | | | | | | | | | | | | | | | |
Amazon.com Incorporated | | | 4.95 | % | | | 12-5-2044 | | | $ | 200,000 | | | $ | 233,267 | |
Expedia Incorporated | | | 4.50 | | | | 8-15-2024 | | | | 70,000 | | | | 74,914 | |
Expedia Incorporated | | | 5.95 | | | | 8-15-2020 | | | | 420,000 | | | | 459,330 | |
QVC Incorporated | | | 4.38 | | | | 3-15-2023 | | | | 210,000 | | | | 217,409 | |
QVC Incorporated | | | 4.45 | | | | 2-15-2025 | | | | 350,000 | | | | 355,498 | |
QVC Incorporated | | | 5.13 | | | | 7-2-2022 | | | | 140,000 | | | | 150,177 | |
QVC Incorporated | | | 5.45 | | | | 8-15-2034 | | | | 175,000 | | | | 172,716 | |
| |
| | | | 3,551,283 | |
| | | | | | | | | | | | | | | | |
| | | | |
| Leisure Products: 0.09% | | | | | | | | | | | | | | | | |
Hasbro Incorporated | | | 6.35 | | | | 3-15-2040 | | | | 108,000 | | | | 135,305 | |
Unilever Capital Corporation | | | 3.10 | | | | 7-30-2025 | | | | 390,000 | | | | 398,569 | |
| |
| | | | 533,874 | |
| | | | | | | | | | | | | | | | |
| | | | |
| Media: 3.24% | | | | | | | | | | | | | | | | |
21st Century Fox America Incorporated | | | 3.00 | | | | 9-15-2022 | | | | 262,000 | | | | 267,827 | |
21st Century Fox America Incorporated | | | 4.50 | | | | 2-15-2021 | | | | 350,000 | | | | 376,226 | |
21st Century Fox America Incorporated | | | 4.75 | | | | 9-15-2044 | | | | 350,000 | | | | 376,199 | |
21st Century Fox America Incorporated | | | 6.65 | | | | 11-15-2037 | | | | 325,000 | | | | 431,865 | |
21st Century Fox America Incorporated | | | 8.15 | | | | 10-17-2036 | | | | 175,000 | | | | 260,623 | |
CBS Corporation | | | 3.70 | | | | 8-15-2024 | | | | 350,000 | | | | 362,441 | |
CBS Corporation | | | 4.85 | | | | 7-1-2042 | | | | 140,000 | | | | 146,873 | |
CBS Corporation | | | 4.90 | | | | 8-15-2044 | | | | 350,000 | | | | 375,186 | |
CBS Corporation | | | 5.75 | | | | 4-15-2020 | | | | 320,000 | | | | 349,400 | |
CBS Corporation | | | 7.88 | | | | 7-30-2030 | | | | 420,000 | | | | 584,637 | |
Charter Communications Operating LLC | | | 4.46 | | | | 7-23-2022 | | | | 1,500,000 | | | | 1,587,428 | |
Charter Communications Operating LLC | | | 6.38 | | | | 10-23-2035 | | | | 170,000 | | | | 194,501 | |
Comcast Corporation | | | 2.35 | | | | 1-15-2027 | | | | 210,000 | | | | 197,649 | |
Comcast Corporation | | | 3.13 | | | | 7-15-2022 | | | | 350,000 | | | | 364,482 | |
Comcast Corporation | | | 4.40 | | | | 8-15-2035 | | | | 210,000 | | | | 226,657 | |
Comcast Corporation | | | 4.65 | | | | 7-15-2042 | | | | 384,000 | | | | 418,183 | |
Comcast Corporation | | | 4.75 | | | | 3-1-2044 | | | | 262,000 | | | | 289,114 | |
Comcast Corporation | | | 5.15 | | | | 3-1-2020 | | | | 350,000 | | | | 378,756 | |
Comcast Corporation | | | 6.95 | | | | 8-15-2037 | | | | 280,000 | | | | 389,236 | |
Discovery Communications LLC | | | 3.30 | | | | 5-15-2022 | | | | 175,000 | | | | 177,518 | |
Discovery Communications LLC | | | 4.38 | | | | 6-15-2021 | | | | 210,000 | | | | 222,026 | |
Discovery Communications LLC | | | 4.95 | | | | 5-15-2042 | | | | 175,000 | | | | 170,726 | |
Discovery Communications LLC | | | 5.63 | | | | 8-15-2019 | | | | 108,000 | | | | 114,905 | |
Discovery Communications LLC | | | 6.35 | | | | 6-1-2040 | | | | 175,000 | | | | 201,166 | |
Omnicom Group Incorporated | | | 3.63 | | | | 5-1-2022 | | | | 175,000 | | | | 183,313 | |
Omnicom Group Incorporated | | | 6.25 | | | | 7-15-2019 | | | | 455,000 | | | | 490,558 | |
TCI Communications Incorporated | | | 7.13 | | | | 2-15-2028 | | | | 245,000 | | | | 325,302 | |
Thomson Reuters Corporation | | | 4.30 | | | | 11-23-2023 | | | | 210,000 | | | | 225,329 | |
Thomson Reuters Corporation | | | 4.70 | | | | 10-15-2019 | | | | 297,000 | | | | 312,806 | |
Thomson Reuters Corporation | | | 5.65 | | | | 11-23-2043 | | | | 140,000 | | | | 168,855 | |
Thomson Reuters Corporation | | | 5.85 | | | | 4-15-2040 | | | | 94,000 | | | | 111,661 | |
Time Warner Cable Incorporated | | | 4.00 | | | | 1-15-2022 | | | | 210,000 | | | | 222,102 | |
Time Warner Cable Incorporated | | | 4.13 | | | | 2-15-2021 | | | | 350,000 | | | | 364,962 | |
Time Warner Cable Incorporated | | | 4.50 | | | | 9-15-2042 | | | | 220,000 | | | | 203,144 | |
The accompanying notes are an integral part of these financial statements.
| | | | | | |
| Portfolio of investments—August 31, 2017 (unaudited) | | Wells Fargo Target Date Funds | | | 193 | |
INVESTMENT GRADE CORPORATE BOND PORTFOLIO
| | | | | | | | | | | | | | | | |
| Security name | | Interest rate | | | Maturity date | | | Principal | | | Value | |
| | | | |
| Media (continued) | | | | | | | | | | | | | | | | |
Time Warner Cable Incorporated | | | 4.65 | % | | | 6-1-2044 | | | $ | 525,000 | | | $ | 515,118 | |
Time Warner Cable Incorporated | | | 4.70 | | | | 1-15-2021 | | | | 175,000 | | | | 188,475 | |
Time Warner Cable Incorporated | | | 5.50 | | | | 9-1-2041 | | | | 210,000 | | | | 215,110 | |
Time Warner Cable Incorporated | | | 6.55 | | | | 5-1-2037 | | | | 300,000 | | | | 346,790 | |
Time Warner Cable Incorporated | | | 6.63 | | | | 5-15-2029 | | | | 280,000 | | | | 350,330 | |
Time Warner Cable Incorporated | | | 6.75 | | | | 6-15-2039 | | | | 350,000 | | | | 411,741 | |
Time Warner Cable Incorporated | | | 7.30 | | | | 7-1-2038 | | | | 385,000 | | | | 474,616 | |
Time Warner Cable Incorporated | | | 7.63 | | | | 4-15-2031 | | | | 200,000 | | | | 275,062 | |
Time Warner Cable Incorporated | | | 8.38 | | | | 3-15-2023 | | | | 175,000 | | | | 219,568 | |
Time Warner Entertainment Company LP | | | 8.38 | | | | 7-15-2033 | | | | 210,000 | | | | 282,081 | |
Time Warner Incorporated | | | 3.40 | | | | 6-15-2022 | | | | 70,000 | | | | 72,424 | |
Time Warner Incorporated | | | 4.75 | | | | 3-29-2021 | | | | 350,000 | | | | 378,354 | |
Time Warner Incorporated | | | 4.90 | | | | 6-15-2042 | | | | 36,000 | | | | 36,700 | |
Time Warner Incorporated | | | 6.50 | | | | 11-15-2036 | | | | 176,000 | | | | 214,177 | |
Viacom Incorporated | | | 3.25 | | | | 3-15-2023 | | | | 140,000 | | | | 139,187 | |
Viacom Incorporated | | | 4.25 | | | | 9-1-2023 | | | | 180,000 | | | | 186,517 | |
Viacom Incorporated | | | 4.38 | | | | 3-15-2043 | | | | 386,000 | | | | 331,446 | |
Viacom Incorporated | | | 4.50 | | | | 3-1-2021 | | | | 350,000 | | | | 370,124 | |
Viacom Incorporated | | | 5.25 | | | | 4-1-2044 | | | | 350,000 | | | | 338,251 | |
Viacom Incorporated | | | 5.50 | | | | 5-15-2033 | | | | 140,000 | | | | 154,212 | |
Viacom Incorporated | | | 5.63 | | | | 9-15-2019 | | | | 105,000 | | | | 112,035 | |
Viacom Incorporated | | | 5.85 | | | | 9-1-2043 | | | | 87,000 | | | | 89,532 | |
Viacom Incorporated | | | 6.88 | | | | 4-30-2036 | | | | 238,000 | | | | 267,918 | |
Walt Disney Company | | | 2.55 | | | | 2-15-2022 | | | | 175,000 | | | | 178,003 | |
Walt Disney Company | | | 2.75 | | | | 8-16-2021 | | | | 350,000 | | | | 359,425 | |
Walt Disney Company | | | 3.00 | | | | 2-13-2026 | | | | 350,000 | | | | 355,468 | |
Walt Disney Company | | | 4.13 | | | | 12-1-2041 | | | | 175,000 | | | | 184,918 | |
Walt Disney Company | | | 4.13 | | | | 6-1-2044 | | | | 245,000 | | | | 259,890 | |
Walt Disney Company | | | 4.38 | | | | 8-16-2041 | | | | 545,000 | | | | 591,473 | |
Walt Disney Company | | | 5.50 | | | | 3-15-2019 | | | | 350,000 | | | | 370,597 | |
Walt Disney Company | | | 7.00 | | | | 3-1-2032 | | | | 52,000 | | | | 72,888 | |
| |
| | | | 19,414,086 | |
| | | | | | | | | | | | | | | | |
| | | | |
| Multiline Retail: 0.76% | | | | | | | | | | | | | | | | |
Dollar General Corporation | | | 3.25 | | | | 4-15-2023 | | | | 245,000 | | | | 251,533 | |
Kohl’s Corporation | | | 3.25 | | | | 2-1-2023 | | | | 105,000 | | | | 102,962 | |
Kohl’s Corporation | | | 4.75 | | | | 12-15-2023 | | | | 210,000 | | | | 219,643 | |
Macy’s Retail Holdings Incorporated | | | 3.88 | | | | 1-15-2022 | | | | 140,000 | | | | 140,917 | |
Macy’s Retail Holdings Incorporated | | | 4.38 | | | | 9-1-2023 | | | | 210,000 | | | | 211,540 | |
Macy’s Retail Holdings Incorporated | | | 6.70 | | | | 7-15-2034 | | | | 350,000 | | | | 375,713 | |
Macy’s Retail Holdings Incorporated | | | 6.90 | | | | 4-1-2029 | | | | 350,000 | | | | 380,704 | |
Nordstrom Incorporated | | | 4.00 | | | | 10-15-2021 | | | | 175,000 | | | | 181,260 | |
Nordstrom Incorporated | | | 4.75 | | | | 5-1-2020 | | | | 94,000 | | | | 98,698 | |
Nordstrom Incorporated | | | 5.00 | | | | 1-15-2044 | | | | 70,000 | | | | 68,991 | |
Target Corporation | | | 2.50 | | | | 4-15-2026 | | | | 1,880,000 | | | | 1,804,643 | |
Target Corporation | | | 2.90 | | | | 1-15-2022 | | | | 175,000 | | | | 181,011 | |
Target Corporation | | | 3.63 | | | | 4-15-2046 | | | | 210,000 | | | | 197,251 | |
Target Corporation | | | 6.35 | | | | 11-1-2032 | | | | 210,000 | | | | 275,752 | |
Target Corporation | | | 7.00 | | | | 1-15-2038 | | | | 37,000 | | | | 52,584 | |
| |
| | | | 4,543,202 | |
| | | | | | | | | | | | | | | | |
The accompanying notes are an integral part of these financial statements.
| | | | |
| 194 | | Wells Fargo Target Date Funds | | Portfolio of investments—August 31, 2017 (unaudited) |
INVESTMENT GRADE CORPORATE BOND PORTFOLIO
| | | | | | | | | | | | | | | | |
| Security name | | Interest rate | | | Maturity date | | | Principal | | | Value | |
| | | | |
| Specialty Retail: 1.33% | | | | | | | | | | | | | | | | |
Advance Auto Parts Incorporated | | | 4.50 | % | | | 1-15-2022 | | | $ | 70,000 | | | $ | 74,264 | |
Advance Auto Parts Incorporated | | | 4.50 | | | | 12-1-2023 | | | | 175,000 | | | | 185,691 | |
AutoZone Incorporated | | | 2.88 | | | | 1-15-2023 | | | | 175,000 | | | | 175,864 | |
AutoZone Incorporated | | | 3.13 | | | | 7-15-2023 | | | | 105,000 | | | | 106,425 | |
AutoZone Incorporated | | | 4.00 | | | | 11-15-2020 | | | | 140,000 | | | | 147,038 | |
Bed Bath & Beyond Incorporated | | | 4.92 | | | | 8-1-2034 | | | | 175,000 | | | | 165,918 | |
Bed Bath & Beyond Incorporated | | | 5.17 | | | | 8-1-2044 | | | | 245,000 | | | | 220,100 | |
Home Depot Incorporated | | | 2.70 | | | | 4-1-2023 | | | | 262,000 | | | | 267,122 | |
Home Depot Incorporated | | | 3.50 | | | | 9-15-2056 | | | | 260,000 | | | | 240,827 | |
Home Depot Incorporated | | | 3.75 | | | | 2-15-2024 | | | | 350,000 | | | | 375,102 | |
Home Depot Incorporated | | | 3.95 | | | | 9-15-2020 | | | | 280,000 | | | | 297,558 | |
Home Depot Incorporated | | | 4.20 | | | | 4-1-2043 | | | | 280,000 | | | | 297,099 | |
Home Depot Incorporated | | | 4.40 | | | | 4-1-2021 | | | | 350,000 | | | | 378,385 | |
Home Depot Incorporated | | | 5.40 | | | | 9-15-2040 | | | | 140,000 | | | | 174,107 | |
Home Depot Incorporated | | | 5.95 | | | | 4-1-2041 | | | | 350,000 | | | | 465,922 | |
Lowe’s Companies Incorporated | | | 2.50 | | | | 4-15-2026 | | | | 350,000 | | | | 337,667 | |
Lowe’s Companies Incorporated | | | 3.12 | | | | 4-15-2022 | | | | 140,000 | | | | 145,824 | |
Lowe’s Companies Incorporated | | | 3.75 | | | | 4-15-2021 | | | | 105,000 | | | | 111,237 | |
Lowe’s Companies Incorporated | | | 3.88 | | | | 9-15-2023 | | | | 175,000 | | | | 188,397 | |
Lowe’s Companies Incorporated | | | 4.25 | | | | 9-15-2044 | | | | 175,000 | | | | 185,414 | |
Lowe’s Companies Incorporated | | | 4.38 | | | | 9-15-2045 | | | | 400,000 | | | | 427,125 | |
Lowe’s Companies Incorporated | | | 4.63 | | | | 4-15-2020 | | | | 640,000 | | | | 678,361 | |
Lowe’s Companies Incorporated | | | 4.65 | | | | 4-15-2042 | | | | 350,000 | | | | 388,687 | |
O’Reilly Automotive Incorporated | | | 3.80 | | | | 9-1-2022 | | | | 105,000 | | | | 110,546 | |
O’Reilly Automotive Incorporated | | | 4.88 | | | | 1-14-2021 | | | | 31,000 | | | | 33,413 | |
O’Reilly Automotive Incorporated | | | 4.63 | | | | 9-15-2021 | | | | 105,000 | | | | 113,325 | |
TJX Companies Incorporated | | | 2.75 | | | | 6-15-2021 | | | | 350,000 | | | | 359,133 | |
Unilever Capital Corporation | | | 2.00 | | | | 7-28-2026 | | | | 1,400,000 | | | | 1,306,748 | |
| |
| | | | 7,957,299 | |
| | | | | | | | | | | | | | | | |
| | | | |
| Textiles, Apparel & Luxury Goods: 0.08% | | | | | | | | | | | | | | | | |
Nike Incorporated | | | 2.25 | | | | 5-1-2023 | | | | 70,000 | | | | 70,176 | |
Nike Incorporated | | | 3.63 | | | | 5-1-2043 | | | | 70,000 | | | | 69,899 | |
Nike Incorporated | | | 3.88 | | | | 11-1-2045 | | | | 350,000 | | | | 361,674 | |
| |
| | | | 501,749 | |
| | | | | | | | | | | | | | | | |
| | | | |
Consumer Staples: 6.87% | | | | | | | | | | | | | | | | |
| | | | |
| Beverages: 1.84% | | | | | | | | | | | | | | | | |
Anheuser-Busch InBev Finance Company | | | 3.30 | | | | 2-1-2023 | | | | 525,000 | | | | 544,612 | |
Anheuser-Busch InBev Finance Company | | | 4.00 | | | | 1-17-2043 | | | | 210,000 | | | | 210,986 | |
Anheuser-Busch InBev Finance Company | | | 4.63 | | | | 2-1-2044 | | | | 245,000 | | | | 269,120 | |
Anheuser-Busch InBev Worldwide Incorporated | | | 2.50 | | | | 7-15-2022 | | | | 500,000 | | | | 504,622 | |
Anheuser-Busch InBev Worldwide Incorporated | | | 3.75 | | | | 7-15-2042 | | | | 252,000 | | | | 244,768 | |
Anheuser-Busch InBev Worldwide Incorporated | | | 6.88 | | | | 11-15-2019 | | | | 350,000 | | | | 387,391 | |
Anheuser-Busch InBev Worldwide Incorporated | | | 7.75 | | | | 1-15-2019 | | | | 350,000 | | | | 377,913 | |
Coca Cola Company | | | 1.38 | | | | 5-30-2019 | | | | 210,000 | | | | 209,722 | |
Coca-Cola Company | | | 2.45 | | | | 11-1-2020 | | | | 700,000 | | | | 714,629 | |
Coca-Cola Company | | | 2.50 | | | | 4-1-2023 | | | | 245,000 | | | | 248,368 | |
Coca-Cola Company | | | 2.88 | | | | 10-27-2025 | | | | 700,000 | | | | 712,078 | |
The accompanying notes are an integral part of these financial statements.
| | | | | | |
| Portfolio of investments—August 31, 2017 (unaudited) | | Wells Fargo Target Date Funds | | | 195 | |
INVESTMENT GRADE CORPORATE BOND PORTFOLIO
| | | | | | | | | | | | | | | | |
| Security name | | Interest rate | | | Maturity date | | | Principal | | | Value | |
| | | | |
| Beverages (continued) | | | | | | | | | | | | | | | | |
Coca-Cola Company | | | 3.20 | % | | | 11-1-2023 | | | $ | 280,000 | | | $ | 293,112 | |
Coca-Cola Company | | | 3.30 | | | | 9-1-2021 | | | | 49,000 | | | | 51,642 | |
Constellation Brands Incorporated | | | 3.75 | | | | 5-1-2021 | | | | 98,000 | | | | 102,562 | |
Constellation Brands Incorporated | | | 3.88 | | | | 11-15-2019 | | | | 77,000 | | | | 80,004 | |
Constellation Brands Incorporated | | | 4.25 | | | | 5-1-2023 | | | | 360,000 | | | | 388,168 | |
Constellation Brands Incorporated | | | 6.00 | | | | 5-1-2022 | | | | 115,000 | | | | 132,322 | |
Diageo Investment Corporation | | | 4.25 | | | | 5-11-2042 | | | | 175,000 | | | | 190,321 | |
Diageo Investment Corporation | | | 7.45 | | | | 4-15-2035 | | | | 105,000 | | | | 155,336 | |
Molson Coors Brewing Company | | | 2.10 | | | | 7-15-2021 | | | | 260,000 | | | | 257,190 | |
Molson Coors Brewing Company | | | 4.20 | | | | 7-15-2046 | | | | 2,000,000 | | | | 1,998,521 | |
Molson Coors Brewing Company | | | 5.00 | | | | 5-1-2042 | | | | 350,000 | | | | 386,736 | |
Pepsi Bottling Group Incorporated | | | 7.00 | | | | 3-1-2029 | | | | 420,000 | | | | 577,957 | |
PepsiCo Incorporated | | | 2.25 | | | | 1-7-2019 | | | | 245,000 | | | | 247,307 | |
PepsiCo Incorporated | | | 2.75 | | | | 3-5-2022 | | | | 259,000 | | | | 267,742 | |
PepsiCo Incorporated | | | 3.00 | | | | 8-25-2021 | | | | 175,000 | | | | 182,286 | |
PepsiCo Incorporated | | | 3.60 | | | | 8-13-2042 | | | | 285,000 | | | | 283,273 | |
PepsiCo Incorporated | | | 4.00 | | | | 3-5-2042 | | | | 175,000 | | | | 184,320 | |
PepsiCo Incorporated | | | 4.25 | | | | 10-22-2044 | | | | 140,000 | | | | 151,507 | |
PepsiCo Incorporated | | | 4.50 | | | | 1-15-2020 | | | | 140,000 | | | | 149,432 | |
PepsiCo Incorporated | | | 4.88 | | | | 11-1-2040 | | | | 227,000 | | | | 265,827 | |
PepsiCo Incorporated | | | 5.50 | | | | 1-15-2040 | | | | 210,000 | | | | 266,157 | |
| |
| | | | 11,035,931 | |
| | | | | | | | | | | | | | | | |
| | | | |
| Food & Staples Retailing: 1.84% | | | | | | | | | | | | | | | | |
Costco Wholesale Corporation | | | 1.70 | | | | 12-15-2019 | | | | 350,000 | | | | 350,280 | |
CVS Caremark Corporation | | | 2.25 | | | | 12-5-2018 | | | | 195,000 | | | | 196,262 | |
CVS Caremark Corporation | | | 2.75 | | | | 12-1-2022 | | | | 350,000 | | | | 354,352 | |
CVS Caremark Corporation | | | 5.30 | | | | 12-5-2043 | | | | 210,000 | | | | 246,433 | |
CVS Health Corporation | | | 2.13 | | | | 6-1-2021 | | | | 260,000 | | | | 259,136 | |
CVS Health Corporation | | | 2.80 | | | | 7-20-2020 | | | | 400,000 | | | | 408,593 | |
CVS Health Corporation | | | 3.88 | | | | 7-20-2025 | | | | 525,000 | | | | 551,426 | |
CVS Health Corporation | | | 5.13 | | | | 7-20-2045 | | | | 700,000 | | | | 806,757 | |
Sysco Corporation | | | 3.30 | | | | 7-15-2026 | | | | 700,000 | | | | 708,244 | |
The Kroger Company | | | 2.30 | | | | 1-15-2019 | | | | 140,000 | | | | 140,728 | |
The Kroger Company | | | 3.30 | | | | 1-15-2021 | | | | 350,000 | | | | 360,279 | |
The Kroger Company | | | 3.40 | | | | 4-15-2022 | | | | 175,000 | | | | 180,473 | |
The Kroger Company | | | 3.85 | | | | 8-1-2023 | | | | 175,000 | | | | 183,453 | |
The Kroger Company | | | 5.00 | | | | 4-15-2042 | | | | 175,000 | | | | 181,152 | |
The Kroger Company | | | 5.15 | | | | 8-1-2043 | | | | 105,000 | | | | 112,005 | |
The Kroger Company | | | 6.90 | | | | 4-15-2038 | | | | 210,000 | | | | 266,039 | |
The Kroger Company | | | 7.50 | | | | 4-1-2031 | | | | 342,000 | | | | 461,114 | |
Wal-Mart Stores Incorporated | | | 3.63 | | | | 7-8-2020 | | | | 270,000 | | | | 285,049 | |
Wal-Mart Stores Incorporated | | | 4.00 | | | | 4-11-2043 | | | | 280,000 | | | | 297,638 | |
Wal-Mart Stores Incorporated | | | 4.25 | | | | 4-15-2021 | | | | 350,000 | | | | 379,935 | |
Wal-Mart Stores Incorporated | | | 4.30 | | | | 4-22-2044 | | | | 350,000 | | | | 391,935 | |
Wal-Mart Stores Incorporated | | | 4.88 | | | | 7-8-2040 | | | | 175,000 | | | | 208,288 | |
Wal-Mart Stores Incorporated | | | 5.63 | | | | 4-1-2040 | | | | 180,000 | | | | 232,479 | |
Wal-Mart Stores Incorporated | | | 5.63 | | | | 4-15-2041 | | | | 350,000 | | | | 455,527 | |
Wal-Mart Stores Incorporated | | | 5.88 | | | | 4-5-2027 | | | | 70,000 | | | | 88,311 | |
Wal-Mart Stores Incorporated | | | 7.55 | | | | 2-15-2030 | | | | 350,000 | | | | 514,132 | |
The accompanying notes are an integral part of these financial statements.
| | | | |
| 196 | | Wells Fargo Target Date Funds | | Portfolio of investments—August 31, 2017 (unaudited) |
INVESTMENT GRADE CORPORATE BOND PORTFOLIO
| | | | | | | | | | | | | | | | |
| Security name | | Interest rate | | | Maturity date | | | Principal | | | Value | |
| | | | |
| Food & Staples Retailing (continued) | | | | | | | | | | | | | | | | |
Walgreen Company | | | 3.10 | % | | | 9-15-2022 | | | $ | 700,000 | | | $ | 717,748 | |
Walgreen Company | | | 4.40 | | | | 9-15-2042 | | | | 350,000 | | | | 355,831 | |
Walgreens Boots Alliance Incorporated | | | 2.70 | | | | 11-18-2019 | | | | 210,000 | | | | 213,543 | |
Walgreens Boots Alliance Incorporated | | | 3.45 | | | | 6-1-2026 | | | | 525,000 | | | | 526,443 | |
Walgreens Boots Alliance Incorporated | | | 4.80 | | | | 11-18-2044 | | | | 540,000 | | | | 584,090 | |
| |
| | | | 11,017,675 | |
| | | | | | | | | | | | | | | | |
| | | | |
| Food Products: 1.41% | | | | | | | | | | | | | | | | |
Archer-Daniels-Midland Company | | | 4.54 | | | | 3-26-2042 | | | | 175,000 | | | | 198,075 | |
Archer-Daniels-Midland Company | | | 4.70 | | | | 3-1-2021 | | | | 374,000 | | | | 402,505 | |
Bunge Limited Finance Corporation | | | 8.50 | | | | 6-15-2019 | | | | 350,000 | | | | 388,886 | |
Campbell Soup Company | | | 2.50 | | | | 8-2-2022 | | | | 85,000 | | | | 85,759 | |
Campbell Soup Company | | | 4.50 | | | | 2-15-2019 | | | | 199,000 | | | | 206,625 | |
ConAgra Foods Incorporated | | | 8.25 | | | | 9-15-2030 | | | | 84,000 | | | | 119,178 | |
General Mills Incorporated | | | 3.65 | | | | 2-15-2024 | | | | 175,000 | | | | 183,991 | |
General Mills Incorporated | | | 5.40 | | | | 6-15-2040 | | | | 241,000 | | | | 284,804 | |
Hershey Company | | | 4.13 | | | | 12-1-2020 | | | | 350,000 | | | | 374,510 | |
J.M. Smucker Company | | | 3.50 | | | | 10-15-2021 | | | | 210,000 | | | | 220,023 | |
Kellogg Company | | | 4.00 | | | | 12-15-2020 | | | | 155,000 | | | | 164,667 | |
Kellogg Company | | | 4.15 | | | | 11-15-2019 | | | | 210,000 | | | | 220,311 | |
Kraft Foods Group Incorporated | | | 3.50 | | | | 6-6-2022 | | | | 700,000 | | | | 727,179 | |
Kraft Foods Group Incorporated | | | 6.50 | | | | 2-9-2040 | | | | 350,000 | | | | 436,002 | |
Kraft Heinz Foods Company | | | 2.80 | | | | 7-2-2020 | | | | 400,000 | | | | 407,429 | |
Kraft Heinz Foods Company | | | 3.00 | | | | 6-1-2026 | | | | 500,000 | | | | 481,629 | |
Kraft Heinz Foods Company | | | 4.38 | | | | 6-1-2046 | | | | 300,000 | | | | 292,728 | |
Mead Johnson Nutrition Company | | | 4.90 | | | | 11-1-2019 | | | | 175,000 | | | | 186,076 | |
Mead Johnson Nutrition Company | | | 5.90 | | | | 11-1-2039 | | | | 70,000 | | | | 90,331 | |
Tyson Foods Incorporated | | | 3.55 | | | | 6-2-2027 | | | | 1,500,000 | | | | 1,537,875 | |
Tyson Foods Incorporated | | | 4.50 | | | | 6-15-2022 | | | | 350,000 | | | | 380,800 | |
Tyson Foods Incorporated | | | 4.88 | | | | 8-15-2034 | | | | 175,000 | | | | 194,997 | |
Unilever Capital Corporation | | | 4.25 | | | | 2-10-2021 | | | | 300,000 | | | | 322,941 | |
Unilever Capital Corporation | | | 4.80 | | | | 2-15-2019 | | | | 245,000 | | | | 255,976 | |
Unilever Capital Corporation | | | 5.90 | | | | 11-15-2032 | | | | 210,000 | | | | 280,066 | |
| |
| | | | 8,443,363 | |
| | | | | | | | | | | | | | | | |
| | | | |
| Household Products: 0.60% | | | | | | | | | | | | | | | | |
Clorox Company | | | 3.05 | | | | 9-15-2022 | | | | 113,000 | | | | 116,919 | |
Clorox Company | | | 3.50 | | | | 12-15-2024 | | | | 140,000 | | | | 145,108 | |
Colgate-Palmolive Company | | | 2.30 | | | | 5-3-2022 | | | | 350,000 | | | | 354,336 | |
Kimberly-Clark Corporation | | | 2.40 | | | | 6-1-2023 | | | | 105,000 | | | | 105,242 | |
Kimberly-Clark Corporation | | | 5.30 | | | | 3-1-2041 | | | | 171,000 | | | | 215,008 | |
Kimberly-Clark Corporation | | | 6.63 | | | | 8-1-2037 | | | | 140,000 | | | | 200,637 | |
Kimberly-Clark Corporation | | | 7.50 | | | | 11-1-2018 | | | | 70,000 | | | | 74,710 | |
The Procter & Gamble Company | | | 3.10 | | | | 8-15-2023 | | | | 2,272,000 | | | | 2,387,321 | |
| |
| | | | 3,599,281 | |
| | | | | | | | | | | | | | | | |
| | | | |
| Personal Products: 0.03% | | | | | | | | | | | | | | | | |
Estee Lauder Companies Incorporated | | | 6.00 | | | | 5-15-2037 | | | | 140,000 | | | | 179,578 | |
| | | | | | | | | | | | | | | | |
The accompanying notes are an integral part of these financial statements.
| | | | | | |
| Portfolio of investments—August 31, 2017 (unaudited) | | Wells Fargo Target Date Funds | | | 197 | |
INVESTMENT GRADE CORPORATE BOND PORTFOLIO
| | | | | | | | | | | | | | | | |
| Security name | | Interest rate | | | Maturity date | | | Principal | | | Value | |
| | | | |
| Tobacco: 1.15% | | | | | | | | | | | | | | | | |
Altria Group Incorporated | | | 2.63 | % | | | 1-14-2020 | | | $ | 280,000 | | | $ | 285,032 | |
Altria Group Incorporated | | | 4.00 | | | | 1-31-2024 | | | | 62,000 | | | | 66,603 | |
Altria Group Incorporated | | | 4.25 | | | | 8-9-2042 | | | | 350,000 | | | | 357,234 | |
Altria Group Incorporated | | | 4.50 | | | | 5-2-2043 | | | | 175,000 | | | | 185,334 | |
Altria Group Incorporated | | | 4.75 | | | | 5-5-2021 | | | | 590,000 | | | | 645,009 | |
Altria Group Incorporated | | | 5.38 | | | | 1-31-2044 | | | | 525,000 | | | | 625,999 | |
Altria Group Incorporated | | | 9.70 | | | | 11-10-2018 | | | | 248,000 | | | | 271,042 | |
Philip Morris International Incorporated | | | 1.88 | | | | 1-15-2019 | | | | 175,000 | | | | 175,574 | |
Philip Morris International Incorporated | | | 2.50 | | | | 8-22-2022 | | | | 175,000 | | | | 176,568 | |
Philip Morris International Incorporated | | | 2.63 | | | | 3-6-2023 | | | | 122,000 | | | | 122,680 | |
Philip Morris International Incorporated | | | 3.25 | | | | 11-10-2024 | | | | 210,000 | | | | 215,538 | |
Philip Morris International Incorporated | | | 3.88 | | | | 8-21-2042 | | | | 415,000 | | | | 413,855 | |
Philip Morris International Incorporated | | | 4.13 | | | | 3-4-2043 | | | | 210,000 | | | | 214,263 | |
Philip Morris International Incorporated | | | 4.25 | | | | 11-10-2044 | | | | 210,000 | | | | 219,628 | |
Philip Morris International Incorporated | | | 4.38 | | | | 11-15-2041 | | | | 350,000 | | | | 371,947 | |
Philip Morris International Incorporated | | | 4.50 | | | | 3-26-2020 | | | | 525,000 | | | | 559,117 | |
Philip Morris International Incorporated | | | 4.50 | | | | 3-20-2042 | | | | 140,000 | | | | 150,938 | |
Reynolds American Incorporated | | | 4.00 | | | | 6-12-2022 | | | | 280,000 | | | | 296,996 | |
Reynolds American Incorporated | | | 4.45 | | | | 6-12-2025 | | | | 350,000 | | | | 378,261 | |
Reynolds American Incorporated | | | 5.70 | | | | 8-15-2035 | | | | 210,000 | | | | 245,900 | |
Reynolds American Incorporated | | | 6.15 | | | | 9-15-2043 | | | | 87,000 | | | | 107,893 | |
Reynolds American Incorporated | | | 6.88 | | | | 5-1-2020 | | | | 485,000 | | | | 543,040 | |
Reynolds American Incorporated | | | 7.25 | | | | 6-15-2037 | | | | 140,000 | | | | 192,392 | |
Reynolds American Incorporated | | | 8.13 | | | | 6-23-2019 | | | | 108,000 | | | | 119,494 | |
| |
| | | | 6,940,337 | |
| | | | | | | | | | | | | | | | |
| | | | |
Energy: 7.22% | | | | | | | | | | | | | | | | |
| | | | |
| Energy Equipment & Services: 0.60% | | | | | | | | | | | | | | | | |
Baker Hughes Incorporated | | | 6.88 | | | | 1-15-2029 | | | | 175,000 | | | | 221,057 | |
Baker Hughes Incorporated | | | 7.50 | | | | 11-15-2018 | | | | 262,000 | | | | 279,740 | |
Enterprise Products Operations | | | 6.88 | | | | 3-1-2033 | | | | 280,000 | | | | 358,331 | |
Halliburton Company | | | 3.25 | | | | 11-15-2021 | | | | 140,000 | | | | 144,649 | |
Halliburton Company | | | 3.50 | | | | 8-1-2023 | | | | 350,000 | | | | 364,304 | |
Halliburton Company | | | 3.80 | | | | 11-15-2025 | | | | 350,000 | | | | 361,584 | |
Halliburton Company | | | 4.50 | | | | 11-15-2041 | | | | 175,000 | | | | 177,770 | |
Halliburton Company | | | 4.75 | | | | 8-1-2043 | | | | 175,000 | | | | 183,040 | |
Halliburton Company | | | 5.00 | | | | 11-15-2045 | | | | 420,000 | | | | 454,884 | |
Halliburton Company | | | 7.45 | | | | 9-15-2039 | | | | 380,000 | | | | 527,430 | |
National Oilwell Varco Incorporated | | | 3.95 | | | | 12-1-2042 | | | | 280,000 | | | | 236,143 | |
Sabine Pass Liquefaction LLC | | | 4.20 | | | | 3-15-2028 | | | | 270,000 | | | | 271,066 | |
| |
| | | | 3,579,998 | |
| | | | | | | | | | | | | | | | |
| | | | |
| Oil, Gas & Consumable Fuels: 6.62% | | | | | | | | | | | | | | | | |
Anadarko Finance Company | | | 7.50 | | | | 5-1-2031 | | | | 227,000 | | | | 285,161 | |
Anadarko Petroleum Corporation | | | 3.45 | | | | 7-15-2024 | | | | 175,000 | | | | 173,699 | |
Anadarko Petroleum Corporation | | | 4.50 | | | | 7-15-2044 | | | | 350,000 | | | | 328,949 | |
Anadarko Petroleum Corporation | | | 5.55 | | | | 3-15-2026 | | | | 350,000 | | | | 390,690 | |
Anadarko Petroleum Corporation | | | 6.20 | | | | 3-15-2040 | | | | 210,000 | | | | 237,913 | |
Anadarko Petroleum Corporation | | | 6.45 | | | | 9-15-2036 | | | | 160,000 | | | | 186,983 | |
The accompanying notes are an integral part of these financial statements.
| | | | |
| 198 | | Wells Fargo Target Date Funds | | Portfolio of investments—August 31, 2017 (unaudited) |
INVESTMENT GRADE CORPORATE BOND PORTFOLIO
| | | | | | | | | | | | | | | | |
| Security name | | Interest rate | | | Maturity date | | | Principal | | | Value | |
| | | | |
| Oil, Gas & Consumable Fuels (continued) | | | | | | | | | | | | | | | | |
Anadarko Petroleum Corporation | | | 8.70 | % | | | 3-15-2019 | | | $ | 315,000 | | | $ | 344,894 | |
Apache Corporation | | | 3.25 | | | | 4-15-2022 | | | | 253,000 | | | | 257,462 | |
Apache Corporation | | | 4.25 | | | | 1-15-2044 | | | | 505,000 | | | | 469,037 | |
Apache Corporation | | | 5.10 | | | | 9-1-2040 | | | | 402,000 | | | | 418,898 | |
Apache Corporation | | | 5.25 | | | | 2-1-2042 | | | | 70,000 | | | | 74,456 | |
Apache Corporation | | | 6.00 | | | | 1-15-2037 | | | | 350,000 | | | | 403,269 | |
Boardwalk Pipelines LP | | | 3.38 | | | | 2-1-2023 | | | | 70,000 | | | | 69,705 | |
Boardwalk Pipelines LP | | | 5.75 | | | | 9-15-2019 | | | | 105,000 | | | | 111,663 | |
Buckeye Partners LP | | | 4.15 | | | | 7-1-2023 | | | | 175,000 | | | | 181,735 | |
Buckeye Partners LP | | | 4.88 | | | | 2-1-2021 | | | | 392,000 | | | | 417,089 | |
Buckeye Partners LP | | | 5.85 | | | | 11-15-2043 | | | | 140,000 | | | | 152,266 | |
Chevron Corporation | | | 2.10 | | | | 5-16-2021 | | | | 260,000 | | | | 261,737 | |
Chevron Corporation | | | 2.19 | | | | 11-15-2019 | | | | 70,000 | | | | 70,809 | |
Chevron Corporation | | | 2.36 | | | | 12-5-2022 | | | | 525,000 | | | | 528,036 | |
Chevron Corporation | | | 2.42 | | | | 11-17-2020 | | | | 350,000 | | | | 355,776 | |
Chevron Corporation | | | 2.95 | | | | 5-16-2026 | | | | 700,000 | | | | 707,654 | |
Chevron Corporation | | | 4.95 | | | | 3-3-2019 | | | | 350,000 | | | | 367,319 | |
Columbia Pipeline Group Incorporated | | | 5.80 | | | | 6-1-2045 | | | | 140,000 | | | | 170,333 | |
ConocoPhillips Company | | | 3.35 | | | | 5-15-2025 | | | | 350,000 | | | | 361,842 | |
ConocoPhillips Company | | | 4.30 | | | | 11-15-2044 | | | | 210,000 | | | | 219,162 | |
ConocoPhillips Company | | | 4.95 | | | | 3-15-2026 | | | | 350,000 | | | | 393,207 | |
ConocoPhillips Company | | | 5.90 | | | | 10-15-2032 | | | | 175,000 | | | | 214,673 | |
ConocoPhillips Company | | | 5.90 | | | | 5-15-2038 | | | | 280,000 | | | | 348,502 | |
ConocoPhillips Company | | | 6.95 | | | | 4-15-2029 | | | | 210,000 | | | | 274,115 | |
Devon Energy Corporation | | | 4.00 | | | | 7-15-2021 | | | | 140,000 | | | | 146,050 | |
Devon Energy Corporation | | | 7.95 | | | | 4-15-2032 | | | | 150,000 | | | | 197,880 | |
Devon Financing Corporation ULC | | | 7.88 | | | | 9-30-2031 | | | | 434,000 | | | | 573,743 | |
Dominion Gas Holdings LLC | | | 4.80 | | | | 11-1-2043 | | | | 350,000 | | | | 383,112 | |
El Paso Pipeline Partners Operating LLC | | | 4.70 | | | | 11-1-2042 | | | | 70,000 | | | | 66,006 | |
Enable Midstream Partner LP | | | 3.90 | | | | 5-15-2024 | | | | 700,000 | | | | 701,168 | |
Enbridge Energy Partners LP | | | 5.20 | | | | 3-15-2020 | | | | 266,000 | | | | 282,905 | |
Enbridge Energy Partners LP | | | 5.50 | | | | 9-15-2040 | | | | 140,000 | | | | 148,678 | |
Enbridge Energy Partners LP | | | 7.50 | | | | 4-15-2038 | | | | 189,000 | | | | 240,884 | |
Enbridge Energy Partners LP | | | 9.88 | | | | 3-1-2019 | | | | 87,000 | | | | 96,736 | |
Energy Transfer Partners LP | | | 3.60 | | | | 2-1-2023 | | | | 210,000 | | | | 213,015 | |
Energy Transfer Partners LP | | | 4.75 | | | | 1-15-2026 | | | | 280,000 | | | | 295,212 | |
Energy Transfer Partners LP | | | 4.90 | | | | 2-1-2024 | | | | 210,000 | | | | 225,375 | |
Energy Transfer Partners LP | | | 5.15 | | | | 2-1-2043 | | | | 140,000 | | | | 136,604 | |
Energy Transfer Partners LP | | | 5.15 | | | | 3-15-2045 | | | | 280,000 | | | | 271,000 | |
Energy Transfer Partners LP | | | 5.95 | | | | 10-1-2043 | | | | 140,000 | | | | 146,711 | |
Energy Transfer Partners LP | | | 6.05 | | | | 6-1-2041 | | | | 210,000 | | | | 224,568 | |
Energy Transfer Partners LP | | | 6.63 | | | | 10-15-2036 | | | | 161,000 | | | | 183,797 | |
Energy Transfer Partners LP | | | 7.50 | | | | 7-1-2038 | | | | 70,000 | | | | 85,996 | |
Energy Transfer Partners LP | | | 9.00 | | | | 4-15-2019 | | | | 280,000 | | | | 310,088 | |
Enterprise Products Operating LLC | | | 3.35 | | | | 3-15-2023 | | | | 245,000 | | | | 253,151 | |
Enterprise Products Operating LLC | | | 3.90 | | | | 2-15-2024 | | | | 210,000 | | | | 220,943 | |
Enterprise Products Operating LLC | | | 4.05 | | | | 2-15-2022 | | | | 175,000 | | | | 186,328 | |
Enterprise Products Operating LLC | | | 4.45 | | | | 2-15-2043 | | | | 355,000 | | | | 358,697 | |
Enterprise Products Operating LLC | | | 4.85 | | | | 3-15-2044 | | | | 280,000 | | | | 298,289 | |
Enterprise Products Operating LLC | | | 4.90 | | | | 5-15-2046 | | | | 245,000 | | | | 264,993 | |
The accompanying notes are an integral part of these financial statements.
| | | | | | |
| Portfolio of investments—August 31, 2017 (unaudited) | | Wells Fargo Target Date Funds | | | 199 | |
INVESTMENT GRADE CORPORATE BOND PORTFOLIO
| | | | | | | | | | | | | | | | |
| Security name | | Interest rate | | | Maturity date | | | Principal | | | Value | |
| | | | |
| Oil, Gas & Consumable Fuels (continued) | | | | | | | | | | | | | | | | |
Enterprise Products Operating LLC | | | 5.25 | % | | | 1-31-2020 | | | $ | 140,000 | | | $ | 150,274 | |
Enterprise Products Operating LLC | | | 5.70 | | | | 2-15-2042 | | | | 140,000 | | | | 165,258 | |
Enterprise Products Operating LLC | | | 5.95 | | | | 2-1-2041 | | | | 70,000 | | | | 84,420 | |
Enterprise Products Operating LLC | | | 7.55 | | | | 4-15-2038 | | | | 70,000 | | | | 96,434 | |
EOG Resources Incorporated | | | 3.90 | | | | 4-1-2035 | | | | 140,000 | | | | 139,147 | |
EOG Resources Incorporated | | | 4.10 | | | | 2-1-2021 | | | | 140,000 | | | | 148,125 | |
EOG Resources Incorporated | | | 4.40 | | | | 6-1-2020 | | | | 210,000 | | | | 222,579 | |
EOG Resources Incorporated | | | 5.63 | | | | 6-1-2019 | | | | 52,000 | | | | 55,331 | |
EOG Resources Incorporated | | | 6.88 | | | | 10-1-2018 | | | | 280,000 | | | | 294,723 | |
EQT Corporation | | | 4.88 | | | | 11-15-2021 | | | | 210,000 | | | | 226,682 | |
EQT Corporation | | | 8.13 | | | | 6-1-2019 | | | | 227,000 | | | | 249,250 | |
Exxon Mobil Corporation | | | 1.71 | | | | 3-1-2019 | | | | 210,000 | | | | 210,470 | |
Exxon Mobil Corporation | | | 1.82 | | | | 3-15-2019 | | | | 200,000 | | | | 200,907 | |
Exxon Mobil Corporation | | | 2.71 | | | | 3-6-2025 | | | | 350,000 | | | | 355,727 | |
Exxon Mobil Corporation | | | 3.57 | | | | 3-6-2045 | | | | 350,000 | | | | 344,490 | |
Exxon Mobil Corporation | | | 4.11 | | | | 3-1-2046 | | | | 1,100,000 | | | | 1,177,267 | |
Hess Corporation | | | 6.00 | | | | 1-15-2040 | | | | 245,000 | | | | 251,854 | |
Hess Corporation | | | 7.30 | | | | 8-15-2031 | | | | 269,000 | | | | 311,341 | |
Hess Corporation | | | 7.88 | | | | 10-1-2029 | | | | 196,000 | | | | 236,216 | |
Kerr-McGee Corporation | | | 6.95 | | | | 7-1-2024 | | | | 140,000 | | | | 165,439 | |
Kinder Morgan Energy Partners LP | | | 2.65 | | | | 2-1-2019 | | | | 250,000 | | | | 251,933 | |
Kinder Morgan Energy Partners LP | | | 3.45 | | | | 2-15-2023 | | | | 175,000 | | | | 177,391 | |
Kinder Morgan Energy Partners LP | | | 3.50 | | | | 3-1-2021 | | | | 210,000 | | | | 215,669 | |
Kinder Morgan Energy Partners LP | | | 3.95 | | | | 9-1-2022 | | | | 262,000 | | | | 272,968 | |
Kinder Morgan Energy Partners LP | | | 5.00 | | | | 8-15-2042 | | | | 175,000 | | | | 173,085 | |
Kinder Morgan Energy Partners LP | | | 5.00 | | | | 3-1-2043 | | | | 157,000 | | | | 154,459 | |
Kinder Morgan Energy Partners LP | | | 5.30 | | | | 9-15-2020 | | | | 87,000 | | | | 93,849 | |
Kinder Morgan Energy Partners LP | | | 5.50 | | | | 3-1-2044 | | | | 210,000 | | | | 219,692 | |
Kinder Morgan Energy Partners LP | | | 5.80 | | | | 3-15-2035 | | | | 70,000 | | | | 75,821 | |
Kinder Morgan Incorporated | | | 5.55 | | | | 6-1-2045 | | | | 375,000 | | | | 397,660 | |
Magellan Midstream Partners LP | | | 5.15 | | | | 10-15-2043 | | | | 140,000 | | | | 155,741 | |
Marathon Oil Corporation | | | 3.85 | | | | 6-1-2025 | | | | 245,000 | | | | 243,045 | |
Marathon Oil Corporation | | | 5.20 | | | | 6-1-2045 | | | | 140,000 | | | | 136,507 | |
Marathon Oil Corporation | | | 6.60 | | | | 10-1-2037 | | | | 315,000 | | | | 349,838 | |
Marathon Petroleum Corporation | | | 3.63 | | | | 9-15-2024 | | | | 350,000 | | | | 357,753 | |
Marathon Petroleum Corporation | | | 4.75 | | | | 9-15-2044 | | | | 350,000 | | | | 339,376 | |
Marathon Petroleum Corporation | | | 5.13 | | | | 3-1-2021 | | | | 24,000 | | | | 26,036 | |
MPLX LP | | | 4.88 | | | | 6-1-2025 | | | | 1,425,000 | | | | 1,526,602 | |
MPLX LP | | | 5.20 | | | | 3-1-2047 | | | | 220,000 | | | | 226,863 | |
NextEra Energy Capital | | | 4.50 | | | | 6-1-2021 | | | | 140,000 | | | | 150,071 | |
Noble Energy Incorporated | | | 3.90 | | | | 11-15-2024 | | | | 210,000 | | | | 215,372 | |
Noble Energy Incorporated | | | 4.15 | | | | 12-15-2021 | | | | 350,000 | | | | 370,626 | |
Noble Energy Incorporated | | | 8.25 | | | | 3-1-2019 | | | | 245,000 | | | | 266,837 | |
Occidental Petroleum Corporation | | | 3.00 | | | | 2-15-2027 | | | | 1,500,000 | | | | 1,487,823 | |
Occidental Petroleum Corporation | | | 3.50 | | | | 6-15-2025 | | | | 210,000 | | | | 217,114 | |
Occidental Petroleum Corporation | | | 4.10 | | | | 2-1-2021 | | | | 322,000 | | | | 342,944 | |
ONEOK Partners LP | | | 3.20 | | | | 9-15-2018 | | | | 87,000 | | | | 88,001 | |
ONEOK Partners LP | | | 3.38 | | | | 10-1-2022 | | | | 350,000 | | | | 353,755 | |
ONEOK Partners LP | | | 6.20 | | | | 9-15-2043 | | | | 700,000 | | | | 816,112 | |
ONEOK Partners LP | | | 8.63 | | | | 3-1-2019 | | | | 245,000 | | | | 267,526 | |
The accompanying notes are an integral part of these financial statements.
| | | | |
| 200 | | Wells Fargo Target Date Funds | | Portfolio of investments—August 31, 2017 (unaudited) |
INVESTMENT GRADE CORPORATE BOND PORTFOLIO
| | | | | | | | | | | | | | | | |
| Security name | | Interest rate | | | Maturity date | | | Principal | | | Value | |
| | | | |
| Oil, Gas & Consumable Fuels (continued) | | | | | | | | | | | | | | | | |
Phillips 66 | | | 4.65 | % | | | 11-15-2034 | | | $ | 140,000 | | | $ | 149,241 | |
Phillips 66 | | | 4.88 | | | | 11-15-2044 | | | | 140,000 | | | | 152,254 | |
Plains All American Pipeline LP | | | 2.60 | | | | 12-15-2019 | | | | 140,000 | | | | 140,221 | |
Plains All American Pipeline LP | | | 3.60 | | | | 11-1-2024 | | | | 210,000 | | | | 207,115 | |
Plains All American Pipeline LP | | | 3.85 | | | | 10-15-2023 | | | | 350,000 | | | | 353,577 | |
Plains All American Pipeline LP | | | 4.90 | | | | 2-15-2045 | | | | 175,000 | | | | 164,331 | |
Plains All American Pipeline LP | | | 5.00 | | | | 2-1-2021 | | | | 140,000 | | | | 147,966 | |
Plains All American Pipeline LP | | | 5.15 | | | | 6-1-2042 | | | | 350,000 | | | | 331,035 | |
Plains All American Pipeline LP | | | 6.65 | | | | 1-15-2037 | | | | 140,000 | | | | 156,252 | |
Plains All American Pipeline LP | | | 8.75 | | | | 5-1-2019 | | | | 590,000 | | | | 647,094 | |
Sabine Pass Liquefaction LLC | | | 5.63 | | | | 2-1-2021 | | | | 695,000 | | | | 752,424 | |
Sabine Pass Liquefaction LLC | | | 5.63 | | | | 3-1-2025 | | | | 545,000 | | | | 601,739 | |
Sabine Pass Liquefaction LLC | | | 5.75 | | | | 5-15-2024 | | | | 545,000 | | | | 606,114 | |
Spectra Energy Partners LP | | | 2.95 | | | | 9-25-2018 | | | | 350,000 | | | | 353,544 | |
Spectra Energy Partners LP | | | 4.75 | | | | 3-15-2024 | | | | 245,000 | | | | 268,313 | |
Sunoco Logistics Partner LP | | | 3.45 | | | | 1-15-2023 | | | | 140,000 | | | | 141,022 | |
Sunoco Logistics Partner LP | | | 4.95 | | | | 1-15-2043 | | | | 105,000 | | | | 100,254 | |
Sunoco Logistics Partner LP | | | 5.35 | | | | 5-15-2045 | | | | 140,000 | | | | 138,598 | |
TC Pipelines LP | | | 4.65 | | | | 6-15-2021 | | | | 210,000 | | | | 222,766 | |
Tennessee Gas Pipeline Company | | | 7.00 | | | | 10-15-2028 | | | | 175,000 | | | | 215,177 | |
Texas Eastern Transmission LP | | | 7.00 | | | | 7-15-2032 | | | | 227,000 | | | | 295,554 | |
Valero Energy Corporation | | | 6.13 | | | | 2-1-2020 | | | | 45,000 | | | | 49,153 | |
Valero Energy Corporation | | | 7.50 | | | | 4-15-2032 | | | | 210,000 | | | | 275,502 | |
Western Gas Partners LP | | | 4.00 | | | | 7-1-2022 | | | | 280,000 | | | | 289,863 | |
Western Gas Partners LP | | | 5.45 | | | | 4-1-2044 | | | | 350,000 | | | | 360,121 | |
Williams Partners LP | | | 3.35 | | | | 8-15-2022 | | | | 175,000 | | | | 177,927 | |
Williams Partners LP | | | 4.13 | | | | 11-15-2020 | | | | 210,000 | | | | 220,330 | |
Williams Partners LP | | | 4.30 | | | | 3-4-2024 | | | | 350,000 | | | | 371,022 | |
Williams Partners LP | | | 4.50 | | | | 11-15-2023 | | | | 280,000 | | | | 300,005 | |
Williams Partners LP | | | 5.10 | | | | 9-15-2045 | | | | 350,000 | | | | 365,671 | |
Williams Partners LP | | | 5.25 | | | | 3-15-2020 | | | | 448,000 | | | | 482,249 | |
Williams Partners LP | | | 6.30 | | | | 4-15-2040 | | | | 273,000 | | | | 321,756 | |
| |
| | | | 39,703,556 | |
| | | | | | | | | | | | | | | | |
| | | | |
Financials: 16.06% | | | | | | | | | | | | | | | | |
| | | | |
| Banks: 5.30% | | | | | | | | | | | | | | | | |
ABB Finance (USA) Incorporated | | | 4.38 | | | | 5-8-2042 | | | | 26,000 | | | | 28,581 | |
Bank of America Corporation | | | 3.25 | | | | 10-21-2027 | | | | 525,000 | | | | 517,464 | |
Bank of America Corporation (3 Month LIBOR +1.51%) ± | | | 3.71 | | | | 4-24-2028 | | | | 750,000 | | | | 767,298 | |
Bank of America Corporation | | | 4.18 | | | | 11-25-2027 | | | | 560,000 | | | | 579,936 | |
Bank of America Corporation | | | 4.20 | | | | 8-26-2024 | | | | 390,000 | | | | 410,725 | |
Bank of America Corporation | | | 4.25 | | | | 10-22-2026 | | | | 280,000 | | | | 293,718 | |
Bank of America Corporation | | | 5.00 | | | | 1-21-2044 | | | | 340,000 | | | | 394,078 | |
Bank of America Corporation | | | 5.49 | | | | 3-15-2019 | | | | 250,000 | | | | 262,094 | |
Bank of America Corporation | | | 5.88 | | | | 1-5-2021 | | | | 350,000 | | | | 390,523 | |
Bank One Corporation | | | 7.63 | | | | 10-15-2026 | | | | 168,000 | | | | 218,484 | |
Bank One Corporation | | | 8.00 | | | | 4-29-2027 | | | | 385,000 | | | | 519,469 | |
BB&T Corporation | | | 2.05 | | | | 5-10-2021 | | | | 210,000 | | | | 210,250 | |
BB&T Corporation | | | 2.45 | | | | 1-15-2020 | | | | 900,000 | | | | 913,420 | |
The accompanying notes are an integral part of these financial statements.
| | | | | | |
| Portfolio of investments—August 31, 2017 (unaudited) | | Wells Fargo Target Date Funds | | | 201 | |
INVESTMENT GRADE CORPORATE BOND PORTFOLIO
| | | | | | | | | | | | | | | | |
| Security name | | Interest rate | | | Maturity date | | | Principal | | | Value | |
| | | | |
| Banks (continued) | | | | | | | | | | | | | | | | |
Branch Banking & Trust Corporation | | | 2.30 | % | | | 10-15-2018 | | | $ | 500,000 | | | $ | 503,467 | |
Branch Banking & Trust Corporation | | | 3.80 | | | | 10-30-2026 | | | | 400,000 | | | | 427,013 | |
Branch Banking & Trust Corporation | | | 3.95 | | | | 3-22-2022 | | | | 350,000 | | | | 372,391 | |
Branch Banking & Trust Corporation | | | 6.85 | | | | 4-30-2019 | | | | 350,000 | | | | 378,435 | |
Citigroup Incorporated | | | 3.88 | | | | 3-26-2025 | | | | 300,000 | | | | 307,362 | |
Citigroup Incorporated | | | 2.75 | | | | 4-25-2022 | | | | 200,000 | | | | 201,806 | |
Citigroup Incorporated | | | 3.50 | | | | 5-15-2023 | | | | 350,000 | | | | 357,769 | |
Citigroup Incorporated | | | 4.40 | | | | 6-10-2025 | | | | 700,000 | | | | 740,243 | |
Citigroup Incorporated | | | 4.45 | | | | 9-29-2027 | | | | 525,000 | | | | 555,081 | |
Citigroup Incorporated | | | 4.60 | | | | 3-9-2026 | | | | 200,000 | | | | 213,447 | |
Citigroup Incorporated | | | 4.65 | | | | 7-30-2045 | | | | 300,000 | | | | 330,097 | |
Citigroup Incorporated | | | 4.75 | | | | 5-18-2046 | | | | 300,000 | | | | 322,451 | |
Citizens Bank NA | | | 2.55 | | | | 5-13-2021 | | | | 500,000 | | | | 504,351 | |
Citizens Financial Group Incorporated | | | 4.30 | | | | 12-3-2025 | | | | 245,000 | | | | 259,469 | |
City National Corporation | | | 5.25 | | | | 9-15-2020 | | | | 140,000 | | | | 152,291 | |
Commonwealth Bank of Australia | | | 2.30 | | | | 9-6-2019 | | | | 250,000 | | | | 252,195 | |
Commonwealth Bank of Australia | | | 2.25 | | | | 3-13-2019 | | | | 700,000 | | | | 705,182 | |
Commonwealth Bank of Australia | | | 2.55 | | | | 3-15-2021 | | | | 1,200,000 | | | | 1,214,743 | |
Compass Bank | | | 2.75 | | | | 9-29-2019 | | | | 250,000 | | | | 252,484 | |
Cooperatieve Rabobank U.A. | | | 2.75 | | | | 1-10-2022 | | | | 250,000 | | | | 255,162 | |
Discover Bank | | | 3.10 | | | | 6-4-2020 | | | | 500,000 | | | | 512,287 | |
Discover Bank | | | 4.20 | | | | 8-8-2023 | | | | 310,000 | | | | 331,195 | |
Discover Bank | | | 4.25 | | | | 3-13-2026 | | | | 250,000 | | | | 261,771 | |
Fifth Third Bancorp | | | 4.30 | | | | 1-16-2024 | | | | 350,000 | | | | 374,783 | |
Fifth Third Bank | | | 2.25 | | | | 6-14-2021 | | | | 200,000 | | | | 200,755 | |
Fifth Third Bank | | | 2.88 | | | | 10-1-2021 | | | | 300,000 | | | | 307,107 | |
Fifth Third Bank | | | 3.85 | | | | 3-15-2026 | | | | 1,400,000 | | | | 1,464,736 | |
HSBC Bank USA NA | | | 5.00 | | | | 9-27-2020 | | | | 350,000 | | | | 378,146 | |
HSBC Bank USA NA | | | 5.63 | | | | 8-15-2035 | | | | 225,000 | | | | 275,570 | |
Huntington Bancshares Incorporated | | | 7.00 | | | | 12-15-2020 | | | | 17,000 | | | | 19,500 | |
JPMorgan Chase & Company | | | 2.95 | | | | 10-1-2026 | | | | 525,000 | | | | 516,954 | |
JPMorgan Chase & Company | | | 3.20 | | | | 1-25-2023 | | | | 700,000 | | | | 720,237 | |
JPMorgan Chase & Company | | | 4.13 | | | | 12-15-2026 | | | | 700,000 | | | | 737,393 | |
JPMorgan Chase & Company (3 Month LIBOR +1.58%) ± | | | 4.26 | | | | 2-22-2048 | | | | 240,000 | | | | 253,944 | |
JPMorgan Chase & Company | | | 5.63 | | | | 8-16-2043 | | | | 140,000 | | | | 170,709 | |
Key Bank NA | | | 2.40 | | | | 6-9-2022 | | | | 1,300,000 | | | | 1,308,788 | |
Key Bank NA | | | 3.18 | | | | 10-15-2027 | | | | 250,000 | | | | 257,091 | |
KeyCorp | | | 2.30 | | | | 12-13-2018 | | | | 210,000 | | | | 211,473 | |
KeyCorp | | | 5.10 | | | | 3-24-2021 | | | | 300,000 | | | | 329,346 | |
MUFG Americas Holdings Corporation | | | 3.00 | | | | 2-10-2025 | | | | 350,000 | | | | 349,009 | |
National Australia Bank | | | 1.38 | | | | 7-12-2019 | | | | 340,000 | | | | 337,725 | |
PNC Bank NA | | | 2.70 | | | | 11-1-2022 | | | | 620,000 | | | | 626,873 | |
PNC Bank NA | | | 2.95 | | | | 1-30-2023 | | | | 300,000 | | | | 306,292 | |
PNC Bank NA | | | 3.30 | | | | 10-30-2024 | | | | 500,000 | | | | 517,135 | |
PNC Bank NA | | | 3.80 | | | | 7-25-2023 | | | | 300,000 | | | | 318,046 | |
PNC Bank NA | | | 4.20 | | | | 11-1-2025 | | | | 250,000 | | | | 273,009 | |
Regions Financial Corporation | | | 3.20 | | | | 2-8-2021 | | | | 700,000 | | | | 718,692 | |
Santander Bank | | | 2.70 | | | | 5-24-2019 | | | | 350,000 | | | | 353,008 | |
Santander Holdings USA | | | 4.50 | | | | 7-17-2025 | | | | 350,000 | | | | 366,210 | |
SunTrust Banks Incorporated | | | 3.30 | | | | 5-15-2026 | | | | 1,600,000 | | | | 1,607,024 | |
The accompanying notes are an integral part of these financial statements.
| | | | |
| 202 | | Wells Fargo Target Date Funds | | Portfolio of investments—August 31, 2017 (unaudited) |
INVESTMENT GRADE CORPORATE BOND PORTFOLIO
| | | | | | | | | | | | | | | | |
| Security name | | Interest rate | | | Maturity date | | | Principal | | | Value | |
| | | | |
| Banks (continued) | | | | | | | | | | | | | | | | |
SunTrust Banks Incorporated | | | 2.70 | % | | | 1-27-2022 | | | $ | 500,000 | | | $ | 505,970 | |
Union Bank NA | | | 2.63 | | | | 9-26-2018 | | | | 500,000 | | | | 504,375 | |
UnionBanCal Corporation | | | 3.50 | | | | 6-18-2022 | | | | 140,000 | | | | 145,587 | |
US Bancorp | | | 1.95 | | | | 11-15-2018 | | | | 175,000 | | | | 175,846 | |
US Bancorp | | | 2.20 | | | | 4-25-2019 | | | | 200,000 | | | | 201,691 | |
US Bancorp | | | 2.38 | | | | 7-22-2026 | | | | 190,000 | | | | 183,083 | |
US Bancorp | | | 3.00 | | | | 3-15-2022 | | | | 350,000 | | | | 362,631 | |
US Bancorp | | | 3.10 | | | | 4-27-2026 | | | | 700,000 | | | | 705,934 | |
US Bancorp | | | 3.60 | | | | 9-11-2024 | | | | 350,000 | | | | 367,508 | |
US Bancorp | | | 4.13 | | | | 5-24-2021 | | | | 350,000 | | | | 375,978 | |
| |
| | | | 31,744,890 | |
| | | | | | | | | | | | | | | | |
| | | | |
| Capital Markets: 2.56% | | | | | | | | | | | | | | | | |
AGL Capital Corporation | | | 4.40 | | | | 6-1-2043 | | | | 140,000 | | | | 146,877 | |
Ameriprise Financial Incorporated | | | 4.00 | | | | 10-15-2023 | | | | 350,000 | | | | 377,949 | |
Ameriprise Financial Incorporated | | | 5.30 | | | | 3-15-2020 | | | | 210,000 | | | | 227,261 | |
Ameriprise Financial Incorporated | | | 7.30 | | | | 6-28-2019 | | | | 45,000 | | | | 49,329 | |
Ares Capital Corporation | | | 3.88 | | | | 1-15-2020 | | | | 280,000 | | | | 288,095 | |
Ares Capital Corporation | | | 4.88 | | | | 11-30-2018 | | | | 70,000 | | | | 72,323 | |
Bank of New York Mellon | | | 2.30 | | | | 9-11-2019 | | | | 270,000 | | | | 272,693 | |
Bank of New York Mellon Corporation | | | 2.50 | | | | 4-15-2021 | | | | 350,000 | | | | 355,399 | |
Bank of New York Mellon Corporation | | | 2.60 | | | | 8-17-2020 | | | | 525,000 | | | | 535,664 | |
Bank of New York Mellon Corporation | | | 3.55 | | | | 9-23-2021 | | | | 420,000 | | | | 442,261 | |
Bank of New York Mellon Corporation | | | 3.95 | | | | 11-18-2025 | | | | 350,000 | | | | 377,910 | |
Bank of New York Mellon Corporation | | | 4.15 | | | | 2-1-2021 | | | | 70,000 | | | | 74,626 | |
Bank of New York Mellon Corporation | | | 5.45 | | | | 5-15-2019 | | | | 700,000 | | | | 743,439 | |
Charles Schwab Corporation | | | 4.45 | | | | 7-22-2020 | | | | 140,000 | | | | 149,813 | |
Franklin Resources Incorporated | | | 2.80 | | | | 9-15-2022 | | | | 210,000 | | | | 214,457 | |
Franklin Resources Incorporated | | | 4.63 | | | | 5-20-2020 | | | | 175,000 | | | | 187,114 | |
FS Investment Corporation | | | 4.00 | | | | 7-15-2019 | | | | 175,000 | | | | 177,422 | |
Goldman Sachs Group Incorporated | | | 3.00 | | | | 4-26-2022 | | | | 750,000 | | | | 762,414 | |
Goldman Sachs Group Incorporated | | | 3.63 | | | | 1-22-2023 | | | | 270,000 | | | | 280,720 | |
Goldman Sachs Group Incorporated | | | 3.75 | | | | 5-22-2025 | | | | 350,000 | | | | 361,058 | |
Goldman Sachs Group Incorporated | | | 5.25 | | | | 7-27-2021 | | | | 770,000 | | | | 848,243 | |
Goldman Sachs Group Incorporated | | | 6.25 | | | | 2-1-2041 | | | | 525,000 | | | | 696,257 | |
Jefferies Group Incorporated | | | 5.13 | | | | 1-20-2023 | | | | 175,000 | | | | 192,711 | |
Jefferies Group Incorporated | | | 6.25 | | | | 1-15-2036 | | | | 105,000 | | | | 115,406 | |
Jefferies Group Incorporated | | | 6.45 | | | | 6-8-2027 | | | | 105,000 | | | | 121,982 | |
Jefferies Group Incorporated | | | 6.50 | | | | 1-20-2043 | | | | 175,000 | | | | 199,428 | |
Jefferies Group Incorporated | | | 6.88 | | | | 4-15-2021 | | | | 105,000 | | | | 119,847 | |
Legg Mason Incorporated | | | 4.75 | | | | 3-15-2026 | | | | 190,000 | | | | 204,865 | |
Legg Mason Incorporated | | | 5.63 | | | | 1-15-2044 | | | | 420,000 | | | | 459,182 | |
Morgan Stanley | | | 3.63 | | | | 1-20-2027 | | | | 500,000 | | | | 511,104 | |
Morgan Stanley | | | 4.30 | | | | 1-27-2045 | | | | 350,000 | | | | 366,918 | |
Morgan Stanley | | | 5.00 | | | | 11-24-2025 | | | | 525,000 | | | | 577,852 | |
Morgan Stanley | | | 5.50 | | | | 7-24-2020 | | | | 350,000 | | | | 382,599 | |
Morgan Stanley | | | 5.63 | | | | 9-23-2019 | | | | 250,000 | | | | 267,945 | |
Morgan Stanley | | | 6.25 | | | | 8-9-2026 | | | | 300,000 | | | | 362,952 | |
Morgan Stanley | | | 7.25 | | | | 4-1-2032 | | | | 329,000 | | | | 455,414 | |
Morgan Stanley | | | 7.30 | | | | 5-13-2019 | | | | 280,000 | | | | 304,808 | |
The accompanying notes are an integral part of these financial statements.
| | | | | | |
| Portfolio of investments—August 31, 2017 (unaudited) | | Wells Fargo Target Date Funds | | | 203 | |
INVESTMENT GRADE CORPORATE BOND PORTFOLIO
| | | | | | | | | | | | | | | | |
| Security name | | Interest rate | | | Maturity date | | | Principal | | | Value | |
| | | | |
| Capital Markets (continued) | | | | | | | | | | | | | | | | |
Northern Trust Corporation | | | 3.45 | % | | | 11-4-2020 | | | $ | 350,000 | | | $ | 365,910 | |
Northern Trust Corporation | | | 3.95 | | | | 10-30-2025 | | | | 175,000 | | | | 187,811 | |
S&P Global Incorporated | | | 4.00 | | | | 6-15-2025 | | | | 227,000 | | | | 241,045 | |
State Street Corporation | | | 3.10 | | | | 5-15-2023 | | | | 320,000 | | | | 328,870 | |
State Street Corporation | | | 3.70 | | | | 11-20-2023 | | | | 1,500,000 | | | | 1,613,281 | |
TD Ameritrade Holding Corporation | | | 3.63 | | | | 4-1-2025 | | | | 140,000 | | | | 146,789 | |
TD Ameritrade Holding Corporation | | | 5.60 | | | | 12-1-2019 | | | | 140,000 | | | | 151,401 | |
| |
| | | | 15,319,444 | |
| | | | | | | | | | | | | | | | |
| | | | |
| Consumer Finance: 3.39% | | | | | | | | | | | | | | | | |
Ahold Finance USA LLC | | | 6.88 | | | | 5-1-2029 | | | | 210,000 | | | | 265,722 | |
American Express Company | | | 2.65 | | | | 12-2-2022 | | | | 402,000 | | | | 407,900 | |
American Express Company | | | 4.05 | | | | 12-3-2042 | | | | 633,000 | | | | 647,566 | |
American Express Credit Corporation | | | 2.25 | | | | 8-15-2019 | | | | 700,000 | | | | 706,280 | |
American Express Credit Corporation | | | 2.25 | | | | 5-5-2021 | | | | 200,000 | | | | 200,958 | |
American Express Credit Corporation | | | 2.38 | | | | 5-26-2020 | | | | 175,000 | | | | 177,105 | |
American Honda Finance Corporation | | | 2.00 | | | | 2-14-2020 | | | | 360,000 | | | | 361,906 | |
American Honda Finance Corporation | | | 2.13 | | | | 10-10-2018 | | | | 210,000 | | | | 211,358 | |
American Honda Finance Corporation | | | 2.25 | | | | 8-15-2019 | | | | 350,000 | | | | 353,595 | |
Capital One Bank USA NA | | | 2.15 | | | | 11-21-2018 | | | | 250,000 | | | | 250,856 | |
Capital One Bank USA NA | | | 2.30 | | | | 6-5-2019 | | | | 500,000 | | | | 501,988 | |
Capital One Bank USA NA | | | 2.40 | | | | 9-5-2019 | | | | 200,000 | | | | 201,243 | |
Capital One Bank USA NA | | | 3.38 | | | | 2-15-2023 | | | | 500,000 | | | | 509,447 | |
Capital One Financial Corporation | | | 3.75 | | | | 7-28-2026 | | | | 525,000 | | | | 523,023 | |
Capital One Financial Corporation | | | 3.75 | | | | 3-9-2027 | | | | 330,000 | | | | 334,653 | |
Capital One Financial Corporation | | | 4.75 | | | | 7-15-2021 | | | | 315,000 | | | | 342,028 | |
Caterpillar Financial Services Corporation | | | 2.63 | | | | 3-1-2023 | | | | 260,000 | | | | 262,911 | |
Caterpillar Financial Services Corporation | | | 2.10 | | | | 6-9-2019 | | | | 350,000 | | | | 352,587 | |
Caterpillar Financial Services Corporation | | | 3.75 | | | | 11-24-2023 | | | | 175,000 | | | | 187,308 | |
Caterpillar Financial Services Corporation | | | 7.15 | | | | 2-15-2019 | | | | 175,000 | | | | 188,382 | |
Daimler Finance North America LLC | | | 8.50 | | | | 1-18-2031 | | | | 297,000 | | | | 447,501 | |
Discover Financial Services | | | 3.85 | | | | 11-21-2022 | | | | 385,000 | | | | 400,358 | |
Discover Financial Services | | | 5.20 | | | | 4-27-2022 | | | | 420,000 | | | | 459,952 | |
Discover Financial Services | | | 3.95 | | | | 11-6-2024 | | | | 700,000 | | | | 723,419 | |
Ford Motor Credit Company LLC | | | 3.10 | | | | 5-4-2023 | | | | 200,000 | | | | 198,786 | |
Ford Motor Credit Company LLC | | | 3.66 | | | | 9-8-2024 | | | | 300,000 | | | | 301,191 | |
Ford Motor Credit Company LLC | | | 4.25 | | | | 9-20-2022 | | | | 541,000 | | | | 572,114 | |
Ford Motor Credit Company LLC | | | 4.75 | | | | 1-15-2043 | | | | 700,000 | | | | 675,539 | |
General Motors Financial Company | | | 3.15 | | | | 1-15-2020 | | | | 350,000 | | | | 357,136 | |
General Motors Financial Company | | | 3.45 | | | | 4-10-2022 | | | | 700,000 | | | | 712,972 | |
General Motors Financial Company | | | 4.00 | | | | 10-6-2026 | | | | 750,000 | | | | 753,468 | |
General Motors Financial Company | | | 3.70 | | | | 5-9-2023 | | | | 180,000 | | | | 183,530 | |
HSBC Finance Corporation | | | 6.68 | | | | 1-15-2021 | | | | 475,000 | | | | 541,069 | |
John Deere Capital Corporation | | | 1.95 | | | | 12-13-2018 | | | | 140,000 | | | | 140,703 | |
John Deere Capital Corporation | | | 2.80 | | | | 1-27-2023 | | | | 350,000 | | | | 358,209 | |
John Deere Capital Corporation | | | 3.90 | | | | 7-12-2021 | | | | 210,000 | | | | 224,039 | |
John Deere Capital Corporation | | | 5.75 | | | | 9-10-2018 | | | | 350,000 | | | | 364,854 | |
National City Corporation | | | 6.88 | | | | 5-15-2019 | | | | 350,000 | | | | 378,552 | |
Synchrony Financial | | | 3.00 | | | | 8-15-2019 | | | | 525,000 | | | | 532,609 | |
Synchrony Financial | | | 4.25 | | | | 8-15-2024 | | | | 2,635,000 | | | | 2,759,002 | |
The accompanying notes are an integral part of these financial statements.
| | | | |
| 204 | | Wells Fargo Target Date Funds | | Portfolio of investments—August 31, 2017 (unaudited) |
INVESTMENT GRADE CORPORATE BOND PORTFOLIO
| | | | | | | | | | | | | | | | |
| Security name | | Interest rate | | | Maturity date | | | Principal | | | Value | |
| | | | |
| Consumer Finance (continued) | | | | | | | | | | | | | | | | |
Toyota Motor Credit Corporation | | | 2.00 | % | | | 10-24-2018 | | | $ | 280,000 | | | $ | 281,652 | |
Toyota Motor Credit Corporation | | | 2.10 | | | | 1-17-2019 | | | | 245,000 | | | | 246,860 | |
Toyota Motor Credit Corporation | | | 3.30 | | | | 1-12-2022 | | | | 1,050,000 | | | | 1,100,113 | |
Toyota Motor Credit Corporation | | | 3.40 | | | | 9-15-2021 | | | | 245,000 | | | | 257,555 | |
Toyota Motor Credit Corporation | | | 4.50 | | | | 6-17-2020 | | | | 350,000 | | | | 375,028 | |
| |
| | | | 20,333,027 | |
| | | | | | | | | | | | | | | | |
| | | | |
| Diversified Financial Services: 1.11% | | | | | | | | | | | | | | | | |
Barclays Bank plc | | | 5.14 | | | | 10-14-2020 | | | | 560,000 | | | | 601,647 | |
Block Financial LLC | | | 5.50 | | | | 11-1-2022 | | | | 140,000 | | | | 153,979 | |
Boeing Capital Corporation | | | 4.70 | | | | 10-27-2019 | | | | 350,000 | | | | 372,067 | |
CME Group Incorporated | | | 5.30 | | | | 9-15-2043 | | | | 210,000 | | | | 267,496 | |
General Electric Capital Corporation | | | 4.38 | | | | 9-16-2020 | | | | 200,000 | | | | 215,151 | |
General Electric Capital Corporation | | | 6.75 | | | | 3-15-2032 | | | | 421,000 | | | | 589,454 | |
IntercontinentalExchange Incorporated | | | 2.50 | | | | 10-15-2018 | | | | 157,000 | | | | 158,393 | |
IntercontinentalExchange Incorporated | | | 2.75 | | | | 12-1-2020 | | | | 350,000 | | | | 356,162 | |
IntercontinentalExchange Incorporated | | | 4.00 | | | | 10-15-2023 | | | | 140,000 | | | | 151,154 | |
International Lease Finance Corporation | | | 5.88 | | | | 4-1-2019 | | | | 260,000 | | | | 275,192 | |
John Deere Capital Corporation | | | 1.95 | | | | 1-8-2019 | | | | 260,000 | | | | 261,505 | |
Moody’s Corporation | | | 4.50 | | | | 9-1-2022 | | | | 175,000 | | | | 190,091 | |
Moody’s Corporation | | | 4.88 | | | | 2-15-2024 | | | | 245,000 | | | | 273,251 | |
Moody’s Corporation | | | 5.25 | | | | 7-15-2044 | | | | 210,000 | | | | 248,164 | |
NASDAQ OMX Group Incorporated | | | 5.55 | | | | 1-15-2020 | | | | 350,000 | | | | 378,327 | |
National Rural Utilities Cooperative Finance Corporation | | | 8.00 | | | | 3-1-2032 | | | | 450,000 | | | | 675,089 | |
National Rural Utilities Cooperative Finance Corporation | | | 2.15 | | | | 2-1-2019 | | | | 70,000 | | | | 70,465 | |
National Rural Utilities Cooperative Finance Corporation | | | 2.30 | | | | 11-15-2019 | | | | 233,000 | | | | 235,774 | |
National Rural Utilities Cooperative Finance Corporation | | | 4.02 | | | | 11-1-2032 | | | | 140,000 | | | | 152,177 | |
National Rural Utilities Cooperative Finance Corporation (3 Month LIBOR +2.91%) ± | | | 4.75 | | | | 4-30-2043 | | | | 175,000 | | | | 181,783 | |
National Rural Utilities Cooperrative Finance Corporation | | | 3.25 | | | | 11-1-2025 | | | | 300,000 | | | | 308,818 | |
PNC Funding Corporation | | | 5.13 | | | | 2-8-2020 | | | | 105,000 | | | | 112,957 | |
PNC Funding Corporation | | | 6.70 | | | | 6-10-2019 | | | | 350,000 | | | | 379,107 | |
TECO Finance Incorporated | | | 5.15 | | | | 3-15-2020 | | | | 45,000 | | | | 48,070 | |
| |
| | | | 6,656,273 | |
| | | | | | | | | | | | | | | | |
| | | | |
| Insurance: 3.59% | | | | | | | | | | | | | | | | |
ACE INA Holdings Incorporated | | | 2.70 | | | | 3-13-2023 | | | | 280,000 | | | | 284,792 | |
ACE INA Holdings Incorporated | | | 3.15 | | | | 3-15-2025 | | | | 700,000 | | | | 717,157 | |
ACE INA Holdings Incorporated | | | 3.35 | | | | 5-15-2024 | | | | 350,000 | | | | 365,688 | |
ACE INA Holdings Incorporated | | | 5.90 | | | | 6-15-2019 | | | | 350,000 | | | | 375,311 | |
Alleghany Corporation | | | 5.63 | | | | 9-15-2020 | | | | 70,000 | | | | 76,963 | |
Allstate Corporation (3 Month LIBOR +2.12%) ± | | | 6.50 | | | | 5-15-2067 | | | | 140,000 | | | | 165,200 | |
American International Group Incorporated | | | 3.90 | | | | 4-1-2026 | | | | 700,000 | | | | 731,476 | |
American International Group Incorporated | | | 4.50 | | | | 7-16-2044 | | | | 865,000 | | | | 901,260 | |
American International Group Incorporated | | | 4.88 | | | | 6-1-2022 | | | | 1,450,000 | | | | 1,602,873 | |
American International Group Incorporated | | | 6.40 | | | | 12-15-2020 | | | | 200,000 | | | | 225,981 | |
AON Corporation | | | 6.25 | | | | 9-30-2040 | | | | 70,000 | | | | 91,343 | |
Arch Capital Group Limited | | | 5.14 | | | | 11-1-2043 | | | | 147,000 | | | | 169,533 | |
Berkshire Hathaway Finance Corporation | | | 2.90 | | | | 10-15-2020 | | | | 150,000 | | | | 155,295 | |
Berkshire Hathaway Finance Corporation | | | 4.30 | | | | 5-15-2043 | | | | 200,000 | | | | 216,874 | |
The accompanying notes are an integral part of these financial statements.
| | | | | | |
| Portfolio of investments—August 31, 2017 (unaudited) | | Wells Fargo Target Date Funds | | | 205 | |
INVESTMENT GRADE CORPORATE BOND PORTFOLIO
| | | | | | | | | | | | | | | | |
| Security name | | Interest rate | | | Maturity date | | | Principal | | | Value | |
| | | | |
| Insurance (continued) | | | | | | | | | | | | | | | | |
Berkshire Hathaway Finance Corporation | | | 4.40 | % | | | 5-15-2042 | | | $ | 180,000 | | | $ | 197,949 | |
Berkshire Hathaway Finance Corporation | | | 5.75 | | | | 1-15-2040 | | | | 175,000 | | | | 225,640 | |
Berkshire Hathaway Incorporated | | | 2.10 | | | | 8-14-2019 | | | | 200,000 | | | | 201,839 | |
Berkshire Hathaway Incorporated | | | 2.75 | | | | 3-15-2023 | | | | 425,000 | | | | 434,737 | |
Berkshire Hathaway Incorporated | | | 3.00 | | | | 2-11-2023 | | | | 75,000 | | | | 77,691 | |
Berkshire Hathaway Incorporated | | | 3.13 | | | | 3-15-2026 | | | | 525,000 | | | | 537,465 | |
Berkshire Hathaway Incorporated | | | 3.40 | | | | 1-31-2022 | | | | 175,000 | | | | 184,952 | |
Berkshire Hathaway Incorporated | | | 4.50 | | | | 2-11-2043 | | | | 275,000 | | | | 306,951 | |
CHUBB Corporation | | | 6.00 | | | | 5-11-2037 | | | | 196,000 | | | | 258,003 | |
CHUBB Corporation | | | 6.50 | | | | 5-15-2038 | | | | 245,000 | | | | 338,824 | |
CNA Financial Corporation | | | 5.88 | | | | 8-15-2020 | | | | 350,000 | | | | 385,561 | |
CNA Financial Corporation | | | 7.35 | | | | 11-15-2019 | | | | 206,000 | | | | 229,297 | |
Hartford Financial Services Group Incorporated | | | 4.30 | | | | 4-15-2043 | | | | 30,000 | | | | 31,618 | |
Hartford Financial Services Group Incorporated | | | 5.13 | | | | 4-15-2022 | | | | 168,000 | | | | 187,659 | |
Hartford Financial Services Group Incorporated | | | 5.50 | | | | 3-30-2020 | | | | 175,000 | | | | 189,786 | |
Hartford Financial Services Group Incorporated | | | 5.95 | | | | 10-15-2036 | | | | 52,000 | | | | 65,414 | |
Hartford Financial Services Group Incorporated | | | 6.10 | | | | 10-1-2041 | | | | 175,000 | | | | 229,184 | |
Lincoln National Corporation | | | 4.00 | | | | 9-1-2023 | | | | 175,000 | | | | 186,140 | |
Lincoln National Corporation | | | 4.85 | | | | 6-24-2021 | | | | 56,000 | | | | 61,046 | |
Lincoln National Corporation | | | 6.15 | | | | 4-7-2036 | | | | 350,000 | | | | 432,073 | |
Lincoln National Corporation | | | 6.25 | | | | 2-15-2020 | | | | 210,000 | | | | 230,103 | |
Loews Corporation | | | 2.63 | | | | 5-15-2023 | | | | 105,000 | | | | 105,779 | |
Loews Corporation | | | 4.13 | | | | 5-15-2043 | | | | 140,000 | | | | 141,532 | |
Marsh & McLennan Companies Incorporated | | | 4.80 | | | | 7-15-2021 | | | | 210,000 | | | | 229,442 | |
MetLife Incorporated | | | 3.05 | | | | 12-15-2022 | | | | 190,000 | | | | 196,437 | |
MetLife Incorporated | | | 4.13 | | | | 8-13-2042 | | | | 210,000 | | | | 215,535 | |
MetLife Incorporated | | | 4.37 | | | | 9-15-2023 | | | | 1,317,000 | | | | 1,445,540 | |
MetLife Incorporated | | | 4.72 | | | | 12-15-2044 | | | | 175,000 | | | | 196,149 | |
MetLife Incorporated | | | 4.75 | | | | 2-8-2021 | | | | 525,000 | | | | 571,992 | |
MetLife Incorporated | | | 4.88 | | | | 11-13-2043 | | | | 350,000 | | | | 404,176 | |
MetLife Incorporated | | | 5.70 | | | | 6-15-2035 | | | | 280,000 | | | | 350,132 | |
MetLife Incorporated | | | 6.38 | | | | 6-15-2034 | | | | 196,000 | | | | 257,610 | |
MetLife Incorporated | | | 6.50 | | | | 12-15-2032 | | | | 140,000 | | | | 184,833 | |
Principal Financial Group Incorporated | | | 3.30 | | | | 9-15-2022 | | | | 175,000 | | | | 181,646 | |
Principal Financial Group Incorporated | | | 3.40 | | | | 5-15-2025 | | | | 140,000 | | | | 145,259 | |
Principal Financial Group Incorporated | | | 4.63 | | | | 9-15-2042 | | | | 175,000 | | | | 193,653 | |
Principal Financial Group Incorporated (3 Month LIBOR +3.04%) ± | | | 4.70 | | | | 5-15-2055 | | | | 350,000 | | | | 362,950 | |
Progressive Corporation | | | 6.25 | | | | 12-1-2032 | | | | 52,000 | | | | 69,487 | |
Prudential Financial Incorporated | | | 5.10 | | | | 8-15-2043 | | | | 370,000 | | | | 432,054 | |
Prudential Financial Incorporated | | | 4.50 | | | | 11-16-2021 | | | | 175,000 | | | | 190,921 | |
Prudential Financial Incorporated | | | 4.60 | | | | 5-15-2044 | | | | 350,000 | | | | 387,337 | |
Prudential Financial Incorporated (3 Month LIBOR +3.04%) ± | | | 5.20 | | | | 3-15-2044 | | | | 175,000 | | | | 185,063 | |
Prudential Financial Incorporated (3 Month LIBOR +3.92%) ± | | | 5.63 | | | | 6-15-2043 | | | | 475,000 | | | | 516,563 | |
Prudential Financial Incorporated (3 Month LIBOR +4.18%) ± | | | 5.88 | | | | 9-15-2042 | | | | 350,000 | | | | 386,750 | |
Prudential Financial Incorporated | | | 6.20 | | | | 11-15-2040 | | | | 175,000 | | | | 229,868 | |
Prudential Financial Incorporated | | | 6.63 | | | | 12-1-2037 | | | | 45,000 | | | | 61,171 | |
Prudential Financial Incorporated | | | 7.38 | | | | 6-15-2019 | | | | 248,000 | | | | 271,925 | |
Prudential Financial Incorporated | | | 5.75 | | | | 7-15-2033 | | | | 350,000 | | | | 427,194 | |
Prudential Financial Incorporated | | | 5.40 | | | | 6-13-2035 | | | | 126,000 | | | | 149,431 | |
Reinsurance Group of America | | | 5.00 | | | | 6-1-2021 | | | | 42,000 | | | | 45,697 | |
The accompanying notes are an integral part of these financial statements.
| | | | |
| 206 | | Wells Fargo Target Date Funds | | Portfolio of investments—August 31, 2017 (unaudited) |
INVESTMENT GRADE CORPORATE BOND PORTFOLIO
| | | | | | | | | | | | | | | | |
| Security name | | Interest rate | | | Maturity date | | | Principal | | | Value | |
| | | | |
| Insurance (continued) | | | | | | | | | | | | | | | | |
Reinsurance Group of America Incorporated | | | 4.70 | % | | | 9-15-2023 | | | $ | 210,000 | | | $ | 229,040 | |
Reinsurance Group of America Incorporated | | | 6.45 | | | | 11-15-2019 | | | | 245,000 | | | | 267,705 | |
Transatlantic Holdings Incorporated | | | 8.00 | | | | 11-30-2039 | | | | 70,000 | | | | 95,780 | |
Travelers Companies Incorporated | | | 5.35 | | | | 11-1-2040 | | | | 245,000 | | | | 302,775 | |
Travelers Companies Incorporated | | | 5.90 | | | | 6-2-2019 | | | | 350,000 | | | | 374,410 | |
Travelers Companies Incorporated | | | 6.25 | | | | 6-15-2037 | | | | 255,000 | | | | 340,934 | |
WR Berkley Corporation | | | 5.38 | | | | 9-15-2020 | | | | 140,000 | | | | 152,366 | |
XL Capital Limited | | | 6.25 | | | | 5-15-2027 | | | | 70,000 | | | | 84,295 | |
XL Capital Limited | | | 6.38 | | | | 11-15-2024 | | | | 70,000 | | | | 84,199 | |
| |
| | | | 21,539,308 | |
| | | | | | | | | | | | | | | | |
| | | | |
| REITs: 0.09% | | | | | | | | | | | | | | | | |
American Tower Corporation | | | 5.05 | | | | 9-1-2020 | | | | 350,000 | | | | 378,999 | |
Health Care REIT Incorporated | | | 6.50 | | | | 3-15-2041 | | | | 140,000 | | | | 180,081 | |
| |
| | | | 559,080 | |
| | | | | | | | | | | | | | | | |
| | | | |
| Thrifts & Mortgage Finance: 0.02% | | | | | | | | | | | | | | | | |
People’s United Financial Incorporated | | | 3.65 | | | | 12-6-2022 | | | | 105,000 | | | | 108,716 | |
| | | | | | | | | | | | | | | | |
| | | | |
Health Care: 9.72% | | | | | | | | | | | | | | | | |
| | | | |
| Biotechnology: 2.02% | | | | | | | | | | | | | | | | |
AbbVie Incorporated | | | 2.30 | | | | 5-14-2021 | | | | 350,000 | | | | 350,780 | |
AbbVie Incorporated | | | 2.50 | | | | 5-14-2020 | | | | 250,000 | | | | 253,202 | |
AbbVie Incorporated | | | 3.20 | | | | 5-14-2026 | | | | 420,000 | | | | 419,679 | |
AbbVie Incorporated | | | 4.30 | | | | 5-14-2036 | | | | 245,000 | | | | 256,058 | |
AbbVie Incorporated | | | 4.40 | | | | 11-6-2042 | | | | 350,000 | | | | 362,849 | |
AbbVie Incorporated | | | 4.45 | | | | 5-14-2046 | | | | 420,000 | | | | 438,397 | |
Amgen Incorporated | | | 3.63 | | | | 5-15-2022 | | | | 200,000 | | | | 209,899 | |
Amgen Incorporated | | | 3.63 | | | | 5-22-2024 | | | | 350,000 | | | | 365,862 | |
Amgen Incorporated | | | 3.88 | | | | 11-15-2021 | | | | 750,000 | | | | 795,091 | |
Amgen Incorporated | | | 4.50 | | | | 3-15-2020 | | | | 45,000 | | | | 47,833 | |
Amgen Incorporated | | | 4.95 | | | | 10-1-2041 | | | | 320,000 | | | | 362,130 | |
Amgen Incorporated | | | 5.15 | | | | 11-15-2041 | | | | 245,000 | | | | 282,253 | |
Amgen Incorporated | | | 5.75 | | | | 3-15-2040 | | | | 56,000 | | | | 68,886 | |
Amgen Incorporated | | | 6.40 | | | | 2-1-2039 | | | | 175,000 | | | | 227,762 | |
Baxalta Incorporated | | | 2.88 | | | | 6-23-2020 | | | | 280,000 | | | | 284,932 | |
Baxalta Incorporated | | | 3.60 | | | | 6-23-2022 | | | | 140,000 | | | | 145,557 | |
Baxalta Incorporated | | | 4.00 | | | | 6-23-2025 | | | | 455,000 | | | | 479,397 | |
Baxalta Incorporated | | | 5.25 | | | | 6-23-2045 | | | | 280,000 | | | | 324,750 | |
Biogen Incorporated | | | 5.20 | | | | 9-15-2045 | | | | 420,000 | | | | 483,550 | |
Celgene Corporation | | | 2.88 | | | | 8-15-2020 | | | | 700,000 | | | | 717,585 | |
Celgene Corporation | | | 3.25 | | | | 8-15-2022 | | | | 350,000 | | | | 362,522 | |
Celgene Corporation | | | 3.63 | | | | 5-15-2024 | | | | 350,000 | | | | 365,563 | |
Celgene Corporation | | | 3.88 | | | | 8-15-2025 | | | | 175,000 | | | | 185,325 | |
Celgene Corporation | | | 3.95 | | | | 10-15-2020 | | | | 140,000 | | | | 148,116 | |
Celgene Corporation | | | 4.00 | | | | 8-15-2023 | | | | 175,000 | | | | 188,785 | |
Celgene Corporation | | | 4.63 | | | | 5-15-2044 | | | | 240,000 | | | | 257,971 | |
Celgene Corporation | | | 5.00 | | | | 8-15-2045 | | | | 350,000 | | | | 399,618 | |
Celgene Corporation | | | 5.25 | | | | 8-15-2043 | | | | 105,000 | | | | 121,484 | |
The accompanying notes are an integral part of these financial statements.
| | | | | | |
| Portfolio of investments—August 31, 2017 (unaudited) | | Wells Fargo Target Date Funds | | | 207 | |
INVESTMENT GRADE CORPORATE BOND PORTFOLIO
| | | | | | | | | | | | | | | | |
| Security name | | Interest rate | | | Maturity date | | | Principal | | | Value | |
| | | | |
| Biotechnology (continued) | | | | | | | | | | | | | | | | |
Genzyme Corporation | | | 5.00 | % | | | 6-15-2020 | | | $ | 140,000 | | | $ | 151,673 | |
Gilead Sciences Incorporated | | | 4.00 | | | | 9-1-2036 | | | | 310,000 | | | | 318,893 | |
Gilead Sciences Incorporated | | | 3.65 | | | | 3-1-2026 | | | | 350,000 | | | | 367,429 | |
Gilead Sciences Incorporated | | | 3.70 | | | | 4-1-2024 | | | | 350,000 | | | | 371,762 | |
Gilead Sciences Incorporated | | | 4.40 | | | | 12-1-2021 | | | | 560,000 | | | | 607,555 | |
Gilead Sciences Incorporated | | | 4.50 | | | | 4-1-2021 | | | | 350,000 | | | | 377,572 | |
Gilead Sciences Incorporated | | | 4.50 | | | | 2-1-2045 | | | | 200,000 | | | | 213,712 | |
Gilead Sciences Incorporated | | | 4.75 | | | | 3-1-2046 | | | | 350,000 | | | | 391,203 | |
Gilead Sciences Incorporated | | | 4.80 | | | | 4-1-2044 | | | | 350,000 | | | | 389,143 | |
| |
| | | | 12,094,778 | |
| | | | | | | | | | | | | | | | |
| | | | |
| Health Care Equipment & Supplies: 1.42% | | | | | | | | | | | | | | | | |
Abbott Laboratories | | | 2.35 | | | | 11-22-2019 | | | | 220,000 | | | | 221,937 | |
Abbott Laboratories | | | 2.90 | | | | 11-30-2021 | | | | 560,000 | | | | 569,675 | |
Abbott Laboratories | | | 3.75 | | | | 11-30-2026 | | | | 560,000 | | | | 579,808 | |
Abbott Laboratories | | | 4.13 | | | | 5-27-2020 | | | | 175,000 | | | | 184,536 | |
Abbott Laboratories | | | 5.13 | | | | 4-1-2019 | | | | 97,000 | | | | 101,815 | |
Abbott Laboratories | | | 5.30 | | | | 5-27-2040 | | | | 175,000 | | | | 199,620 | |
Abbott Laboratories | | | 6.00 | | | | 4-1-2039 | | | | 105,000 | | | | 130,345 | |
Abbott Laboratories | | | 6.15 | | | | 11-30-2037 | | | | 166,000 | | | | 207,071 | |
Becton Dickinson & Company | | | 2.89 | | | | 6-6-2022 | | | | 500,000 | | | | 502,212 | |
Becton Dickinson & Company | | | 3.13 | | | | 11-8-2021 | | | | 210,000 | | | | 215,331 | |
Becton Dickinson & Company | | | 3.25 | | | | 11-12-2020 | | | | 245,000 | | | | 252,150 | |
Becton Dickinson & Company | | | 3.70 | | | | 6-6-2027 | | | | 750,000 | | | | 759,355 | |
Becton Dickinson & Company | | | 4.69 | | | | 12-15-2044 | | | | 350,000 | | | | 367,525 | |
Boston Scientific Corporation | | | 3.85 | | | | 5-15-2025 | | | | 200,000 | | | | 209,536 | |
Boston Scientific Corporation | | | 6.00 | | | | 1-15-2020 | | | | 245,000 | | | | 267,126 | |
Boston Scientific Corporation | | | 7.38 | | | | 1-15-2040 | | | | 210,000 | | | | 285,576 | |
C.R. Bard Incorporated | | | 4.40 | | | | 1-15-2021 | | | | 118,000 | | | | 124,406 | |
Medtronic Incorporated | | | 2.50 | | | | 3-15-2020 | | | | 220,000 | | | | 223,795 | |
Medtronic Incorporated | | | 3.15 | | | | 3-15-2022 | | | | 350,000 | | | | 364,878 | |
Medtronic Incorporated | | | 3.50 | | | | 3-15-2025 | | | | 600,000 | | | | 632,406 | |
Medtronic Incorporated | | | 4.45 | | | | 3-15-2020 | | | | 280,000 | | | | 298,455 | |
Medtronic Incorporated | | | 4.50 | | | | 3-15-2042 | | | | 140,000 | | | | 158,342 | |
Medtronic Incorporated | | | 4.63 | | | | 3-15-2044 | | | | 175,000 | | | | 197,750 | |
Stryker Corporation | | | 4.10 | | | | 4-1-2043 | | | | 175,000 | | | | 176,943 | |
Stryker Corporation | | | 4.38 | | | | 1-15-2020 | | | | 105,000 | | | | 111,206 | |
Stryker Corporation | | | 4.63 | | | | 3-15-2046 | | | | 350,000 | | | | 386,824 | |
Zimmer Holdings Incorporated | | | 3.55 | | | | 4-1-2025 | | | | 500,000 | | | | 508,046 | |
Zimmer Holdings Incorporated | | | 4.63 | | | | 11-30-2019 | | | | 250,000 | | | | 263,188 | |
| |
| | | | 8,499,857 | |
| | | | | | | | | | | | | | | | |
| | | | |
| Health Care Providers & Services: 3.22% | | | | | | | | | | | | | | | | |
Aetna Incorporated | | | 2.20 | | | | 3-15-2019 | | | | 350,000 | | | | 352,075 | |
Aetna Incorporated | | | 2.75 | | | | 11-15-2022 | | | | 650,000 | | | | 660,041 | |
Aetna Incorporated | | | 4.13 | | | | 6-1-2021 | | | | 140,000 | | | | 148,858 | |
Aetna Incorporated | | | 4.13 | | | | 11-15-2042 | | | | 175,000 | | | | 184,681 | |
Aetna Incorporated | | | 4.75 | | | | 3-15-2044 | | | | 1,200,000 | | | | 1,375,825 | |
AmerisourceBergen Corporation | | | 3.50 | | | | 11-15-2021 | | | | 210,000 | | | | 219,376 | |
The accompanying notes are an integral part of these financial statements.
| | | | |
| 208 | | Wells Fargo Target Date Funds | | Portfolio of investments—August 31, 2017 (unaudited) |
INVESTMENT GRADE CORPORATE BOND PORTFOLIO
| | | | | | | | | | | | | | | | |
| Security name | | Interest rate | | | Maturity date | | | Principal | | | Value | |
| | | | |
| Health Care Providers & Services (continued) | | | | | | | | | | | | | | | | |
AmerisourceBergen Corporation | | | 4.25 | % | | | 3-1-2045 | | | $ | 175,000 | | | $ | 179,403 | |
AmerisourceBergen Corporation | | | 4.88 | | | | 11-15-2019 | | | | 175,000 | | | | 186,300 | |
Cardinal Health Incorporated | | | 2.62 | | | | 6-15-2022 | | | | 1,300,000 | | | | 1,307,336 | |
Cardinal Health Incorporated | | | 3.20 | | | | 3-15-2023 | | | | 190,000 | | | | 194,922 | |
Cardinal Health Incorporated | | | 3.50 | | | | 11-15-2024 | | | | 350,000 | | | | 361,595 | |
Catholic Health Initiatives | | | 4.35 | | | | 11-1-2042 | | | | 175,000 | | | | 165,869 | |
CIGNA Corporation | | | 4.00 | | | | 2-15-2022 | | | | 175,000 | | | | 186,813 | |
CIGNA Corporation | | | 4.50 | | | | 3-15-2021 | | | | 70,000 | | | | 75,093 | |
CIGNA Corporation | | | 5.13 | | | | 6-15-2020 | | | | 150,000 | | | | 162,236 | |
CIGNA Corporation | | | 5.38 | | | | 2-15-2042 | | | | 245,000 | | | | 299,395 | |
CIGNA Corporation | | | 6.15 | | | | 11-15-2036 | | | | 35,000 | | | | 45,168 | |
Coventry Health Care Incorporated | | | 5.45 | | | | 6-15-2021 | | | | 406,000 | | | | 448,198 | |
Dignity Health | | | 2.64 | | | | 11-1-2019 | | | | 350,000 | | | | 354,240 | |
Express Scripts Holding Company | | | 3.40 | | | | 3-1-2027 | | | | 600,000 | | | | 596,413 | |
Express Scripts Holding Company | | | 3.90 | | | | 2-15-2022 | | | | 350,000 | | | | 369,388 | |
Express Scripts Holding Company | | | 4.80 | | | | 7-15-2046 | | | | 210,000 | | | | 220,891 | |
Express Scripts Holding Company | | | 6.13 | | | | 11-15-2041 | | | | 175,000 | | | | 211,717 | |
Howard Hughes Medical Institute | | | 3.50 | | | | 9-1-2023 | | | | 332,000 | | | | 352,230 | |
Humana Incorporated | | | 3.15 | | | | 12-1-2022 | | | | 210,000 | | | | 215,644 | |
Humana Incorporated | | | 3.85 | | | | 10-1-2024 | | | | 350,000 | | | | 370,204 | |
Humana Incorporated | | | 4.95 | | | | 10-1-2044 | | | | 350,000 | | | | 403,148 | |
Kaiser Foundation Hospitals | | | 4.88 | | | | 4-1-2042 | | | | 175,000 | | | | 208,840 | |
Laboratory Corporation of America Holdings | | | 3.60 | | | | 2-1-2025 | | | | 350,000 | | | | 362,159 | |
Laboratory Corporation of America Holdings | | | 3.75 | | | | 8-23-2022 | | | | 39,000 | | | | 40,870 | |
Laboratory Corporation of America Holdings | | | 4.00 | | | | 11-1-2023 | | | | 105,000 | | | | 111,302 | |
Laboratory Corporation of America Holdings | | | 4.63 | | | | 11-15-2020 | | | | 350,000 | | | | 374,045 | |
McKesson Corporation | | | 2.28 | | | | 3-15-2019 | | | | 350,000 | | | | 352,094 | |
McKesson Corporation | | | 2.85 | | | | 3-15-2023 | | | | 140,000 | | | | 141,138 | |
McKesson Corporation | | | 4.88 | | | | 3-15-2044 | | | | 350,000 | | | | 386,284 | |
Medco Health Solutions Incorporated | | | 4.13 | | | | 9-15-2020 | | | | 350,000 | | | | 369,289 | |
Quest Diagnostics Incorporated | | | 4.70 | | | | 4-1-2021 | | | | 112,000 | | | | 120,633 | |
Quest Diagnostics Incorporated | | | 4.75 | | | | 1-30-2020 | | | | 413,000 | | | | 438,677 | |
UnitedHealth Group Incorporated | | | 1.63 | | | | 3-15-2019 | | | | 175,000 | | | | 174,875 | |
UnitedHealth Group Incorporated | | | 1.70 | | | | 2-15-2019 | | | | 360,000 | | | | 360,579 | |
UnitedHealth Group Incorporated | | | 2.13 | | | | 3-15-2021 | | | | 600,000 | | | | 602,704 | |
UnitedHealth Group Incorporated | | | 2.70 | | | | 7-15-2020 | | | | 320,000 | | | | 328,140 | |
UnitedHealth Group Incorporated | | | 3.95 | | | | 10-15-2042 | | | | 520,000 | | | | 541,875 | |
UnitedHealth Group Incorporated | | | 4.25 | | | | 3-15-2043 | | | | 175,000 | | | | 188,840 | |
UnitedHealth Group Incorporated | | | 4.75 | | | | 7-15-2045 | | | | 350,000 | | | | 407,792 | |
UnitedHealth Group Incorporated | | | 5.80 | | | | 3-15-2036 | | | | 175,000 | | | | 223,640 | |
UnitedHealth Group Incorporated | | | 5.95 | | | | 2-15-2041 | | | | 350,000 | | | | 464,444 | |
UnitedHealth Group Incorporated | | | 6.63 | | | | 11-15-2037 | | | | 105,000 | | | | 148,392 | |
WellPoint Incorporated | | | 2.25 | | | | 8-15-2019 | | | | 280,000 | | | | 281,897 | |
WellPoint Incorporated | | | 3.13 | | | | 5-15-2022 | | | | 350,000 | | | | 360,717 | |
WellPoint Incorporated | | | 3.30 | | | | 1-15-2023 | | | | 1,575,000 | | | | 1,631,132 | |
WellPoint Incorporated | | | 4.65 | | | | 1-15-2043 | | | | 315,000 | | | | 346,385 | |
WellPoint Incorporated | | | 4.65 | | | | 8-15-2044 | | | | 50,000 | | | | 54,752 | |
WellPoint Incorporated | | | 5.85 | | | | 1-15-2036 | | | | 200,000 | | | | 246,707 | |
WellPoint Incorporated | | | 7.00 | | | | 2-15-2019 | | | | 350,000 | | | | 374,989 | |
| |
| | | | 19,290,250 | |
| | | | | | | | | | | | | | | | |
The accompanying notes are an integral part of these financial statements.
| | | | | | |
| Portfolio of investments—August 31, 2017 (unaudited) | | Wells Fargo Target Date Funds | | | 209 | |
INVESTMENT GRADE CORPORATE BOND PORTFOLIO
| | | | | | | | | | | | | | | | |
| Security name | | Interest rate | | | Maturity date | | | Principal | | | Value | |
| | | | |
| Life Sciences Tools & Services: 0.35% | | | | | | | | | | | | | | | | |
Life Technologies Corporation | | | 5.00 | % | | | 1-15-2021 | | | $ | 105,000 | | | $ | 112,967 | |
Life Technologies Corporation | | | 6.00 | | | | 3-1-2020 | | | | 175,000 | | | | 190,718 | |
Thermo Fisher Scientific Incorporated | | | 2.40 | | | | 2-1-2019 | | | | 280,000 | | | | 282,041 | |
Thermo Fisher Scientific Incorporated | | | 3.00 | | | | 4-15-2023 | | | | 200,000 | | | | 204,160 | |
Thermo Fisher Scientific Incorporated | | | 3.15 | | | | 1-15-2023 | | | | 350,000 | | | | 359,985 | |
Thermo Fisher Scientific Incorporated | | | 3.30 | | | | 2-15-2022 | | | | 210,000 | | | | 218,370 | |
Thermo Fisher Scientific Incorporated | | | 3.60 | | | | 8-15-2021 | | | | 280,000 | | | | 293,415 | |
Thermo Fisher Scientific Incorporated | | | 4.15 | | | | 2-1-2024 | | | | 280,000 | | | | 302,140 | |
Thermo Fisher Scientific Incorporated | | | 5.30 | | | | 2-1-2044 | | | | 140,000 | | | | 165,386 | |
| |
| | | | 2,129,182 | |
| | | | | | | | | | | | | | | | |
| | | | |
| Pharmaceuticals: 2.71% | | | | | | | | | | | | | | | | |
Allergan Incorporated | | | 2.80 | | | | 3-15-2023 | | | | 157,000 | | | | 157,578 | |
Allergan Incorporated | | | 3.38 | | | | 9-15-2020 | | | | 350,000 | | | | 361,692 | |
Bristol-Myers Squibb Company | | | 1.75 | | | | 3-1-2019 | | | | 175,000 | | | | 175,192 | |
Bristol-Myers Squibb Company | | | 2.00 | | | | 8-1-2022 | | | | 175,000 | | | | 174,231 | |
Bristol-Myers Squibb Company | | | 3.25 | | | | 11-1-2023 | | | | 109,000 | | | | 114,725 | |
Bristol-Myers Squibb Company | | | 3.25 | | | | 8-1-2042 | | | | 175,000 | | | | 162,740 | |
Bristol-Myers Squibb Company | | | 4.50 | | | | 3-1-2044 | | | | 200,000 | | | | 224,149 | |
Eli Lilly & Company | | | 2.75 | | | | 6-1-2025 | | | | 70,000 | | | | 70,957 | |
Eli Lilly & Company | | | 3.70 | | | | 3-1-2045 | | | | 350,000 | | | | 351,578 | |
Eli Lilly & Company | | | 5.50 | | | | 3-15-2027 | | | | 280,000 | | | | 341,214 | |
GlaxoSmithKline Capital Incorporated | | | 2.80 | | | | 3-18-2023 | | | | 140,000 | | | | 143,817 | |
GlaxoSmithKline Capital Incorporated | | | 5.38 | | | | 4-15-2034 | | | | 210,000 | | | | 255,643 | |
GlaxoSmithKline Capital Incorporated | | | 6.38 | | | | 5-15-2038 | | | | 1,340,000 | | | | 1,846,363 | |
Johnson & Johnson | | | 1.13 | | | | 3-1-2019 | | | | 350,000 | | | | 348,616 | |
Johnson & Johnson | | | 2.45 | | | | 3-1-2026 | | | | 525,000 | | | | 519,027 | |
Johnson & Johnson | | | 3.38 | | | | 12-5-2023 | | | | 300,000 | | | | 322,718 | |
Johnson & Johnson | | | 3.70 | | | | 3-1-2046 | | | | 175,000 | | | | 182,152 | |
Johnson & Johnson | | | 4.38 | | | | 12-5-2033 | | | | 200,000 | | | | 227,973 | |
Johnson & Johnson | | | 4.50 | | | | 9-1-2040 | | | | 210,000 | | | | 246,389 | |
Johnson & Johnson | | | 4.85 | | | | 5-15-2041 | | | | 140,000 | | | | 170,890 | |
Johnson & Johnson | | | 4.95 | | | | 5-15-2033 | | | | 126,000 | | | | 154,631 | |
Merck & Company Incorporated | | | 2.35 | | | | 2-10-2022 | | | | 250,000 | | | | 254,078 | |
Merck & Company Incorporated | | | 2.40 | | | | 9-15-2022 | | | | 350,000 | | | | 356,230 | |
Merck & Company Incorporated | | | 2.75 | | | | 2-10-2025 | | | | 270,000 | | | | 272,224 | |
Merck & Company Incorporated | | | 3.60 | | | | 9-15-2042 | | | | 175,000 | | | | 172,615 | |
Merck & Company Incorporated | | | 3.70 | | | | 2-10-2045 | | | | 200,000 | | | | 202,136 | |
Merck & Company Incorporated | | | 3.88 | | | | 1-15-2021 | | | | 245,000 | | | | 260,226 | |
Merck & Company Incorporated | | | 4.15 | | | | 5-18-2043 | | | | 350,000 | | | | 377,565 | |
Merck & Company Incorporated | | | 5.00 | | | | 6-30-2019 | | | | 175,000 | | | | 185,531 | |
Merck & Company Incorporated | | | 5.85 | | | | 6-30-2039 | | | | 52,000 | | | | 69,237 | |
Mylan Incorporated | | | 2.55 | | | | 3-28-2019 | | | | 1,269,000 | | | | 1,275,020 | |
Mylan Incorporated | | | 5.40 | | | | 11-29-2043 | | | | 23,000 | | | | 25,090 | |
Mylan NV Company | | | 3.15 | | | | 6-15-2021 | | | | 280,000 | | | | 283,982 | |
Novartis Capital Corporation | | | 1.80 | | | | 2-14-2020 | | | | 180,000 | | | | 180,966 | |
Novartis Capital Corporation | | | 2.40 | | | | 9-21-2022 | | | | 350,000 | | | | 355,207 | |
Novartis Capital Corporation | | | 3.40 | | | | 5-6-2024 | | | | 600,000 | | | | 632,271 | |
Novartis Capital Corporation | | | 3.70 | | | | 9-21-2042 | | | | 175,000 | | | | 177,409 | |
Novartis Capital Corporation | | | 4.40 | | | | 4-24-2020 | | | | 350,000 | | | | 374,473 | |
The accompanying notes are an integral part of these financial statements.
| | | | |
| 210 | | Wells Fargo Target Date Funds | | Portfolio of investments—August 31, 2017 (unaudited) |
INVESTMENT GRADE CORPORATE BOND PORTFOLIO
| | | | | | | | | | | | | | | | |
| Security name | | Interest rate | | | Maturity date | | | Principal | | | Value | |
| | | | |
| Pharmaceuticals (continued) | | | | | | | | | | | | | | | | |
Pfizer Incorporated | | | 3.00 | % | | | 12-15-2026 | | | $ | 700,000 | | | $ | 712,815 | |
Pfizer Incorporated | | | 3.40 | | | | 5-15-2024 | | | | 350,000 | | | | 370,532 | |
Pfizer Incorporated | | | 4.00 | | | | 12-15-2036 | | | | 170,000 | | | | 183,719 | |
Pfizer Incorporated | | | 4.13 | | | | 12-15-2046 | | | | 420,000 | | | | 449,878 | |
Pfizer Incorporated | | | 4.30 | | | | 6-15-2043 | | | | 210,000 | | | | 229,612 | |
Pharmacia Corporation | | | 6.60 | | | | 12-1-2028 | | | | 350,000 | | | | 466,326 | |
Schering-Plough Corporation | | | 6.50 | | | | 12-1-2033 | | | | 175,000 | | | | 236,839 | |
Schering-Plough Corporation | | | 6.55 | | | | 9-15-2037 | | | | 140,000 | | | | 195,955 | |
Teva Pharmaceutical Finance LLC | | | 2.25 | | | | 3-18-2020 | | | | 175,000 | | | | 171,262 | |
Teva Pharmaceutical Finance LLC | | | 6.15 | | | | 2-1-2036 | | | | 280,000 | | | | 302,177 | |
Watson Pharmaceuticals Incorporated | | | 6.13 | | | | 8-15-2019 | | | | 91,000 | | | | 98,266 | |
Zoetis Incorporated | | | 3.25 | | | | 2-1-2023 | | | | 420,000 | | | | 434,512 | |
Zoetis Incorporated | | | 4.70 | | | | 2-1-2043 | | | | 350,000 | | | | 381,840 | |
| |
| | | | 16,240,268 | |
| | | | | | | | | | | | | | | | |
| | | | |
Industrials: 7.94% | | | | | | | | | | | | | | | | |
| | | | |
| Aerospace & Defense: 1.90% | | | | | | | | | | | | | | | | |
Boeing Company | | | 2.60 | | | | 10-30-2025 | | | | 1,400,000 | | | | 1,396,813 | |
Boeing Company | | | 4.88 | | | | 2-15-2020 | | | | 428,000 | | | | 461,491 | |
Boeing Company | | | 5.88 | | | | 2-15-2040 | | | | 21,000 | | | | 27,972 | |
Boeing Company | | | 6.00 | | | | 3-15-2019 | | | | 210,000 | | | | 223,916 | |
Boeing Company | | | 6.13 | | | | 2-15-2033 | | | | 126,000 | | | | 165,996 | |
General Dynamics Corporation | | | 2.25 | | | | 11-15-2022 | | | | 350,000 | | | | 351,373 | |
General Dynamics Corporation | | | 3.88 | | | | 7-15-2021 | | | | 140,000 | | | | 149,862 | |
Honeywell International Incorporated | | | 3.35 | | | | 12-1-2023 | | | | 140,000 | | | | 147,188 | |
Honeywell International Incorporated | | | 4.25 | | | | 3-1-2021 | | | | 35,000 | | | | 37,735 | |
Honeywell International Incorporated | | | 5.70 | | | | 3-15-2037 | | | | 175,000 | | | | 225,500 | |
L-3 Communications Corporation | | | 5.20 | | | | 10-15-2019 | | | | 350,000 | | | | 373,131 | |
Lockheed Martin Corporation | | | 2.50 | | | | 11-23-2020 | | | | 260,000 | | | | 264,493 | |
Lockheed Martin Corporation | | | 3.35 | | | | 9-15-2021 | | | | 175,000 | | | | 183,274 | |
Lockheed Martin Corporation | | | 3.55 | | | | 1-15-2026 | | | | 700,000 | | | | 731,075 | |
Lockheed Martin Corporation | | | 3.80 | | | | 3-1-2045 | | | | 350,000 | | | | 345,547 | |
Lockheed Martin Corporation | | | 4.07 | | | | 12-15-2042 | | | | 229,000 | | | | 236,129 | |
Lockheed Martin Corporation | | | 4.70 | | | | 5-15-2046 | | | | 350,000 | | | | 396,757 | |
Lockheed Martin Corporation | | | 6.15 | | | | 9-1-2036 | | | | 122,000 | | | | 160,782 | |
Northrop Grumman Corporation | | | 3.50 | | | | 3-15-2021 | | | | 210,000 | | | | 219,997 | |
Northrop Grumman Corporation | | | 4.75 | | | | 6-1-2043 | | | | 350,000 | | | | 402,145 | |
Northrop Grumman Corporation | | | 5.05 | | | | 8-1-2019 | | | | 59,000 | | | | 62,491 | |
Northrop Grumman Corporation | | | 5.05 | | | | 11-15-2040 | | | | 70,000 | | | | 81,915 | |
Northrop Grumman Corporation | | | 7.75 | | | | 2-15-2031 | | | | 210,000 | | | | 304,612 | |
Precision Castparts Corporation | | | 2.50 | | | | 1-15-2023 | | | | 175,000 | | | | 176,897 | |
Precision Castparts Corporation | | | 3.25 | | | | 6-15-2025 | | | | 210,000 | | | | 216,792 | |
Precision Castparts Corporation | | | 3.90 | | | | 1-15-2043 | | | | 140,000 | | | | 145,567 | |
Raytheon Company | | | 2.50 | | | | 12-15-2022 | | | | 245,000 | | | | 248,685 | |
Raytheon Company | | | 4.70 | | | | 12-15-2041 | | | | 350,000 | | | | 406,402 | |
Raytheon Company | | | 7.20 | | | | 8-15-2027 | | | | 84,000 | | | | 114,523 | |
Rockwell Collins Incorporated | | | 3.70 | | | | 12-15-2023 | | | | 245,000 | | | | 258,428 | |
Rockwell Collins Incorporated | | | 4.80 | | | | 12-15-2043 | | | | 175,000 | | | | 195,012 | |
Rockwell Collins Incorporated | | | 5.25 | | | | 7-15-2019 | | | | 35,000 | | | | 37,014 | |
The accompanying notes are an integral part of these financial statements.
| | | | | | |
| Portfolio of investments—August 31, 2017 (unaudited) | | Wells Fargo Target Date Funds | | | 211 | |
INVESTMENT GRADE CORPORATE BOND PORTFOLIO
| | | | | | | | | | | | | | | | |
| Security name | | Interest rate | | | Maturity date | | | Principal | | | Value | |
| | | | |
| Aerospace & Defense (continued) | | | | | | | | | | | | | | | | |
Textron Incorporated | | | 4.30 | % | | | 3-1-2024 | | | $ | 140,000 | | | $ | 149,852 | |
United Technologies Corporation | | | 3.10 | | | | 6-1-2022 | | | | 587,000 | | | | 606,920 | |
United Technologies Corporation | | | 3.75 | | | | 11-1-2046 | | | | 270,000 | | | | 259,572 | |
United Technologies Corporation | | | 4.50 | | | | 4-15-2020 | | | | 350,000 | | | | 373,384 | |
United Technologies Corporation | | | 4.50 | | | | 6-1-2042 | | | | 723,000 | | | | 777,346 | |
United Technologies Corporation | | | 5.70 | | | | 4-15-2040 | | | | 350,000 | | | | 436,478 | |
| |
| | | | 11,353,066 | |
| | | | | | | | | | | | | | | | |
| | | | |
| Air Freight & Logistics: 0.75% | | | | | | | | | | | | | | | | |
FedEx Corporation | | | 2.63 | | | | 8-1-2022 | | | | 337,000 | | | | 344,360 | |
FedEx Corporation | | | 3.88 | | | | 8-1-2042 | | | | 140,000 | | | | 135,720 | |
FedEx Corporation | | | 3.90 | | | | 2-1-2035 | | | | 330,000 | | | | 334,799 | |
FedEx Corporation | | | 4.00 | | | | 1-15-2024 | | | | 203,000 | | | | 219,480 | |
FedEx Corporation | | | 4.55 | | | | 4-1-2046 | | | | 350,000 | | | | 370,366 | |
FedEx Corporation | | | 4.90 | | | | 1-15-2034 | | | | 175,000 | | | | 196,833 | |
FedEx Corporation | | | 5.10 | | | | 1-15-2044 | | | | 210,000 | | | | 237,592 | |
FedEx Corporation | | | 8.00 | | | | 1-15-2019 | | | | 280,000 | | | | 303,149 | |
United Parcel Service Incorporated | | | 2.35 | | | | 5-16-2022 | | | | 900,000 | | | | 912,506 | |
United Parcel Service Incorporated | | | 2.45 | | | | 10-1-2022 | | | | 280,000 | | | | 284,413 | |
United Parcel Service Incorporated | | | 3.13 | | | | 1-15-2021 | | | | 630,000 | | | | 654,908 | |
United Parcel Service Incorporated | | | 5.13 | | | | 4-1-2019 | | | | 210,000 | | | | 220,999 | |
United Parcel Service Incorporated | | | 6.20 | | | | 1-15-2038 | | | | 206,000 | | | | 282,296 | |
| |
| | | | 4,497,421 | |
| | | | | | | | | | | | | | | | |
| | | | |
| Airlines: 0.44% | | | | | | | | | | | | | | | | |
American Airlines Incorporated | | | 3.20 | | | | 12-15-2029 | | | | 1,168,800 | | | | 1,185,046 | |
American Airlines Incorporated | | | 3.38 | | | | 11-1-2028 | | | | 28,926 | | | | 29,522 | |
American Airlines Incorporated | | | 4.95 | | | | 7-15-2024 | | | | 474,162 | | | | 508,301 | |
Continental Airlines Incorporated | | | 7.25 | | | | 5-10-2021 | | | | 91,121 | | | | 100,233 | |
Delta Air Lines Incorporated | | | 6.82 | | | | 2-10-2024 | | | | 38,742 | | | | 44,840 | |
United Airlines Incorporated | | | 4.00 | | | | 10-11-2027 | | | | 310,708 | | | | 325,871 | |
United Airlines Incorporated | | | 4.30 | | | | 2-15-2027 | | | | 196,034 | | | | 208,776 | |
US Airways Group Incorporated | | | 3.95 | | | | 5-15-2027 | | | | 84,583 | | | | 88,389 | |
US Airways Group Incorporated | | | 4.63 | | | | 12-3-2026 | | | | 129,196 | | | | 138,240 | |
| |
| | | | 2,629,218 | |
| | | | | | | | | | | | | | | | |
| | | | |
| Building Products: 0.23% | | | | | | | | | | | | | | | | |
Johnson Controls International plc | | | 3.90 | | | | 2-14-2026 | | | | 500,000 | | | | 531,992 | |
Johnson Controls International plc | | | 4.25 | | | | 3-1-2021 | | | | 120,000 | | | | 127,647 | |
Johnson Controls International plc | | | 5.00 | | | | 3-30-2020 | | | | 100,000 | | | | 106,972 | |
Masco Corporation | | | 3.50 | | | | 4-1-2021 | | | | 245,000 | | | | 253,048 | |
Masco Corporation | | | 4.38 | | | | 4-1-2026 | | | | 190,000 | | | | 203,851 | |
Owens Corning Incorporated | | | 4.20 | | | | 12-15-2022 | | | | 149,000 | | | | 158,852 | |
| |
| | | | 1,382,362 | |
| | | | | | | | | | | | | | | | |
| | | | |
| Commercial Services & Supplies: 0.40% | | | | | | | | | | | | | | | | |
Black & Decker Corporation | | | 3.40 | | | | 12-1-2021 | | | | 280,000 | | | | 293,677 | |
Cintas Corporation No. 2 | | | 3.25 | | | | 6-1-2022 | | | | 70,000 | | | | 72,502 | |
Equifax Incorporated | | | 3.30 | | | | 12-15-2022 | | | | 162,000 | | | | 167,669 | |
The accompanying notes are an integral part of these financial statements.
| | | | |
| 212 | | Wells Fargo Target Date Funds | | Portfolio of investments—August 31, 2017 (unaudited) |
INVESTMENT GRADE CORPORATE BOND PORTFOLIO
| | | | | | | | | | | | | | | | |
| Security name | | Interest rate | | | Maturity date | | | Principal | | | Value | |
| | | | |
| Commercial Services & Supplies (continued) | | | | | | | | | | | | | | | | |
Pitney Bowes Incorporated | | | 4.63 | % | | | 3-15-2024 | | | $ | 350,000 | | | $ | 359,197 | |
Republic Services Incorporated | | | 2.90 | | | | 7-1-2026 | | | | 260,000 | | | | 258,699 | |
Republic Services Incorporated | | | 4.75 | | | | 5-15-2023 | | | | 210,000 | | | | 234,176 | |
Republic Services Incorporated | | | 5.25 | | | | 11-15-2021 | | | | 35,000 | | | | 39,038 | |
Republic Services Incorporated | | | 5.50 | | | | 9-15-2019 | | | | 87,000 | | | | 93,189 | |
Waste Management Incorporated | | | 4.10 | | | | 3-1-2045 | | | | 350,000 | | | | 373,262 | |
Waste Management Incorporated | | | 4.60 | | | | 3-1-2021 | | | | 140,000 | | | | 151,279 | |
Waste Management Incorporated | | | 4.75 | | | | 6-30-2020 | | | | 350,000 | | | | 376,945 | |
| |
| | | | 2,419,633 | |
| | | | | | | | | | | | | | | | |
| | | | |
| Electrical Equipment: 0.33% | | | | | | | | | | | | | | | | |
Eaton Corporation | | | 4.15 | | | | 11-2-2042 | | | | 350,000 | | | | 360,879 | |
Eaton Corporation | | | 6.95 | | | | 3-20-2019 | | | | 140,000 | | | | 150,327 | |
Emerson Electric Company | | | 3.15 | | | | 6-1-2025 | | | | 210,000 | | | | 217,627 | |
Emerson Electric Company | | | 4.25 | | | | 11-15-2020 | | | | 140,000 | | | | 149,763 | |
Emerson Electric Company | | | 4.88 | | | | 10-15-2019 | | | | 140,000 | | | | 148,700 | |
Emerson Electric Company | | | 5.25 | | | | 10-15-2018 | | | | 35,000 | | | | 36,411 | |
Emerson Electric Company | | | 5.25 | | | | 11-15-2039 | | | | 350,000 | | | | 421,772 | |
Roper Industries Incorporated | | | 2.05 | | | | 10-1-2018 | | | | 350,000 | | | | 350,830 | |
Roper Industries Incorporated | | | 6.25 | | | | 9-1-2019 | | | | 140,000 | | | | 151,571 | |
| |
| | | | 1,987,880 | |
| | | | | | | | | | | | | | | | |
| | | | |
| Industrial Conglomerates: 1.11% | | | | | | | | | | | | | | | | |
3M Company | | | 2.00 | | | | 6-26-2022 | | | | 507,000 | | | | 507,782 | |
3M Company | | | 5.70 | | | | 3-15-2037 | | | | 227,000 | | | | 296,291 | |
GATX Corporation | | | 2.50 | | | | 3-15-2019 | | | | 117,000 | | | | 117,884 | |
GATX Corporation | | | 4.85 | | | | 6-1-2021 | | | | 70,000 | | | | 76,297 | |
General Electric Company | | | 2.70 | | | | 10-9-2022 | | | | 700,000 | | | | 716,521 | |
General Electric Company | | | 4.13 | | | | 10-9-2042 | | | | 2,825,000 | | | | 2,989,409 | |
General Electric Company | | | 4.50 | | | | 3-11-2044 | | | | 200,000 | | | | 223,078 | |
Honeywell International Incorporated | | | 2.50 | | | | 11-1-2026 | | | | 1,800,000 | | | | 1,749,339 | |
| |
| | | | 6,676,601 | |
| | | | | | | | | | | | | | | | |
| | | | |
| Machinery: 0.68% | | | | | | | | | | | | | | | | |
Caterpillar Incorporated | | | 3.80 | | | | 8-15-2042 | | | | 105,000 | | | | 107,696 | |
Caterpillar Incorporated | | | 3.90 | | | | 5-27-2021 | | | | 700,000 | | | | 745,964 | |
Caterpillar Incorporated | | | 4.30 | | | | 5-15-2044 | | | | 350,000 | | | | 386,470 | |
Cummins Incorporated | | | 3.65 | | | | 10-1-2023 | | | | 117,000 | | | | 124,455 | |
Cummins Incorporated | | | 4.88 | | | | 10-1-2043 | | | | 60,000 | | | | 70,013 | |
Deere & Company | | | 2.60 | | | | 6-8-2022 | | | | 350,000 | | | | 356,651 | |
Deere & Company | | | 3.90 | | | | 6-9-2042 | | | | 350,000 | | | | 369,288 | |
Deere & Company | | | 5.38 | | | | 10-16-2029 | | | | 210,000 | | | | 260,025 | |
Dover Corporation | | | 4.30 | | | | 3-1-2021 | | | | 350,000 | | | | 374,262 | |
Dover Corporation | | | 5.38 | | | | 10-15-2035 | | | | 140,000 | | | | 168,565 | |
Illinois Tool Works Incorporated | | | 3.38 | | | | 9-15-2021 | | | | 84,000 | | | | 88,485 | |
Illinois Tool Works Incorporated | | | 3.90 | | | | 9-1-2042 | | | | 214,000 | | | | 224,572 | |
Illinois Tool Works Incorporated | | | 4.88 | | | | 9-15-2041 | | | | 206,000 | | | | 245,277 | |
Illinois Tool Works Incorporated | | | 6.25 | | | | 4-1-2019 | | | | 108,000 | | | | 115,760 | |
Parker Hannifin Corporation | | | 3.50 | | | | 9-15-2022 | | | | 70,000 | | | | 73,712 | |
The accompanying notes are an integral part of these financial statements.
| | | | | | |
| Portfolio of investments—August 31, 2017 (unaudited) | | Wells Fargo Target Date Funds | | | 213 | |
INVESTMENT GRADE CORPORATE BOND PORTFOLIO
| | | | | | | | | | | | | | | | |
| Security name | | Interest rate | | | Maturity date | | | Principal | | | Value | |
| | | | |
| Machinery (continued) | | | | | | | | | | | | | | | | |
Parker Hannifin Corporation | | | 6.25 | % | | | 5-15-2038 | | | $ | 42,000 | | | $ | 56,977 | |
Stanley Black & Decker Incorporated | | | 2.90 | | | | 11-1-2022 | | | | 245,000 | | | | 250,761 | |
Stanley Black & Decker Incorporated (3 Month LIBOR +4.30%) ± | | | 5.75 | | | | 12-15-2053 | | | | 70,000 | | | | 73,150 | |
| |
| | | | 4,092,083 | |
| | | | | | | | | | | | | | | | |
| | | | |
| Professional Services: 0.11% | | | | | | | | | | | | | | | | |
Verisk Analytics Incorporated | | | 4.00 | | | | 6-15-2025 | | | | 420,000 | | | | 442,487 | |
Verisk Analytics Incorporated | | | 4.13 | | | | 9-12-2022 | | | | 175,000 | | | | 186,699 | |
| |
| | | | 629,186 | |
| | | | | | | | | | | | | | | | |
| | | | |
| Road & Rail: 1.87% | | | | | | | | | | | | | | | | |
BNSF Railway Company | | | 5.75 | | | | 5-1-2040 | | | | 385,000 | | | | 487,758 | |
Burlington Northern Santa Fe LLC | | | 3.00 | | | | 3-15-2023 | | | | 210,000 | | | | 217,532 | |
Burlington Northern Santa Fe LLC | | | 3.40 | | | | 9-1-2024 | | | | 210,000 | | | | 220,691 | |
Burlington Northern Santa Fe LLC | | | 3.75 | | | | 4-1-2024 | | | | 350,000 | | | | 375,258 | |
Burlington Northern Santa Fe LLC | | | 4.40 | | | | 3-15-2042 | | | | 470,000 | | | | 503,152 | |
Burlington Northern Santa Fe LLC | | | 4.45 | | | | 3-15-2043 | | | | 210,000 | | | | 228,715 | |
Burlington Northern Santa Fe LLC | | | 4.55 | | | | 9-1-2044 | | | | 210,000 | | | | 233,041 | |
Burlington Northern Santa Fe LLC | | | 4.70 | | | | 10-1-2019 | | | | 87,000 | | | | 92,167 | |
Burlington Northern Santa Fe LLC | | | 4.95 | | | | 9-15-2041 | | | | 140,000 | | | | 164,101 | |
Burlington Northern Santa Fe LLC | | | 5.05 | | | | 3-1-2041 | | | | 175,000 | | | | 205,444 | |
Burlington Northern Santa Fe LLC | | | 5.15 | | | | 9-1-2043 | | | | 210,000 | | | | 253,097 | |
CSX Corporation | | | 3.40 | | | | 8-1-2024 | | | | 278,000 | | | | 287,667 | |
CSX Corporation | | | 3.70 | | | | 10-30-2020 | | | | 175,000 | | | | 183,320 | |
CSX Corporation | | | 4.10 | | | | 3-15-2044 | | | | 280,000 | | | | 282,916 | |
CSX Corporation | | | 4.25 | | | | 6-1-2021 | | | | 140,000 | | | | 149,673 | |
CSX Corporation | | | 4.40 | | | | 3-1-2043 | | | | 390,000 | | | | 408,591 | |
CSX Corporation | | | 4.50 | | | | 8-1-2054 | | | | 350,000 | | | | 363,151 | |
CSX Corporation | | | 4.75 | | | | 5-30-2042 | | | | 161,000 | | | | 177,594 | |
CSX Corporation | | | 6.00 | | | | 10-1-2036 | | | | 210,000 | | | | 264,337 | |
CSX Corporation | | | 6.15 | | | | 5-1-2037 | | | | 224,000 | | | | 288,926 | |
CSX Corporation | | | 6.22 | | | | 4-30-2040 | | | | 140,000 | | | | 181,670 | |
Kansas City Southern | | | 3.00 | | | | 5-15-2023 | | | | 51,000 | | | | 51,606 | |
Kansas City Southern | | | 4.30 | | | | 5-15-2043 | | | | 140,000 | | | | 144,489 | |
Norfolk Southern Corporation | | | 2.90 | | | | 6-15-2026 | | | | 50,000 | | | | 50,060 | |
Norfolk Southern Corporation | | | 2.90 | | | | 2-15-2023 | | | | 400,000 | | | | 408,894 | |
Norfolk Southern Corporation | | | 3.00 | | | | 4-1-2022 | | | | 350,000 | | | | 360,398 | |
Norfolk Southern Corporation | | | 3.85 | | | | 1-15-2024 | | | | 140,000 | | | | 149,601 | |
Norfolk Southern Corporation | | | 3.95 | | | | 10-1-2042 | | | | 384,000 | | | | 392,660 | |
Norfolk Southern Corporation | | | 5.90 | | | | 6-15-2019 | | | | 545,000 | | | | 583,678 | |
Norfolk Southern Corporation | | | 6.00 | | | | 5-23-2111 | | | | 710,000 | | | | 927,914 | |
Ryder System Incorporated | | | 2.45 | | | | 11-15-2018 | | | | 245,000 | | | | 246,848 | |
Ryder System Incorporated | | | 2.50 | | | | 5-11-2020 | | | | 140,000 | | | | 141,703 | |
Union Pacific Corporation | | | 2.25 | | | | 2-15-2019 | | | | 140,000 | | | | 141,421 | |
Union Pacific Corporation | | | 2.75 | | | | 4-15-2023 | | | | 200,000 | | | | 204,809 | |
Union Pacific Corporation | | | 3.25 | | | | 1-15-2025 | | | | 175,000 | | | | 181,849 | |
Union Pacific Corporation | | | 3.75 | | | | 3-15-2024 | | | | 140,000 | | | | 150,007 | |
Union Pacific Corporation | | | 3.80 | | | | 10-1-2051 | | | | 809,000 | | | | 806,402 | |
Union Pacific Corporation | | | 4.15 | | | | 1-15-2045 | | | | 175,000 | | | | 186,601 | |
The accompanying notes are an integral part of these financial statements.
| | | | |
| 214 | | Wells Fargo Target Date Funds | | Portfolio of investments—August 31, 2017 (unaudited) |
INVESTMENT GRADE CORPORATE BOND PORTFOLIO
| | | | | | | | | | | | | | | | |
| Security name | | Interest rate | | | Maturity date | | | Principal | | | Value | |
| | | | |
| Road & Rail (continued) | | | | | | | | | | | | | | | | |
Union Pacific Corporation | | | 4.16 | % | | | 7-15-2022 | | | $ | 306,000 | | | $ | 332,561 | |
Union Pacific Corporation | | | 4.30 | | | | 6-15-2042 | | | | 175,000 | | | | 190,300 | |
| |
| | | | 11,220,602 | |
| | | | | | | | | | | | | | | | |
| | | | |
| Trading Companies & Distributors: 0.12% | | | | | | | | | | | | | | | | |
Air Lease Corporation | | | 3.38 | | | | 1-15-2019 | | | | 375,000 | | | | 382,061 | |
W.W. Grainger Incorporated | | | 4.60 | | | | 6-15-2045 | | | | 280,000 | | | | 306,512 | |
| |
| | | | 688,573 | |
| | | | | | | | | | | | | | | | |
| | | | |
Information Technology: 6.55% | | | | | | | | | | | | | | | | |
| | | | |
| Communications Equipment: 0.85% | | | | | | | | | | | | | | | | |
Cisco Systems Incorporated | | | 2.20 | | | | 2-28-2021 | | | | 700,000 | | | | 707,464 | |
Cisco Systems Incorporated | | | 2.45 | | | | 6-15-2020 | | | | 420,000 | | | | 428,562 | |
Cisco Systems Incorporated | | | 2.90 | | | | 3-4-2021 | | | | 210,000 | | | | 216,881 | |
Cisco Systems Incorporated | | | 2.95 | | | | 2-28-2026 | | | | 340,000 | | | | 344,617 | |
Cisco Systems Incorporated | | | 3.00 | | | | 6-15-2022 | | | | 140,000 | | | | 145,704 | |
Cisco Systems Incorporated | | | 5.50 | | | | 1-15-2040 | | | | 490,000 | | | | 615,995 | |
Harris Corporation | | | 4.40 | | | | 12-15-2020 | | | | 210,000 | | | | 223,519 | |
Motorola Incorporated | | | 3.50 | | | | 3-1-2023 | | | | 385,000 | | | | 390,802 | |
Motorola Incorporated | | | 7.50 | | | | 5-15-2025 | | | | 84,000 | | | | 103,369 | |
Qualcomm Incorporated | | | 2.25 | | | | 5-20-2020 | | | | 500,000 | | | | 505,135 | |
Qualcomm Incorporated | | | 3.45 | | | | 5-20-2025 | | | | 700,000 | | | | 725,715 | |
Qualcomm Incorporated | | | 4.80 | | | | 5-20-2045 | | | | 620,000 | | | | 683,355 | |
| |
| | | | 5,091,118 | |
| | | | | | | | | | | | | | | | |
| | | | |
| Electronic Equipment, Instruments & Components: 0.34% | | | | | | | | | | | | | | | | |
Agilent Technologies Incorporated | | | 3.88 | | | | 7-15-2023 | | | | 105,000 | | | | 110,454 | |
Amphenol Corporation | | | 4.00 | | | | 2-1-2022 | | | | 210,000 | | | | 222,865 | |
Avnet Incorporated | | | 5.88 | | | | 6-15-2020 | | | | 70,000 | | | | 75,543 | |
Corning Incorporated | | | 2.90 | | | | 5-15-2022 | | | | 350,000 | | | | 356,467 | |
Corning Incorporated | | | 4.25 | | | | 8-15-2020 | | | | 175,000 | | | | 185,158 | |
Corning Incorporated | | | 5.75 | | | | 8-15-2040 | | | | 105,000 | | | | 126,961 | |
Dell International LLC/EMC Corporation 144A | | | 3.48 | | | | 6-1-2019 | | | | 220,000 | | | | 224,841 | |
Keysight Technologies Incorporated | | | 3.30 | | | | 10-30-2019 | | | | 175,000 | | | | 177,713 | |
Keysight Technologies Incorporated | | | 4.55 | | | | 10-30-2024 | | | | 175,000 | | | | 187,137 | |
L-3 Communications Corporation | | | 4.95 | | | | 2-15-2021 | | | | 350,000 | | | | 377,430 | |
| |
| | | | 2,044,569 | |
| | | | | | | | | | | | | | | | |
| | | | |
| Internet Software & Services: 0.41% | | | | | | | | | | | | | | | | |
Alphabet Incorporated | | | 3.38 | | | | 2-25-2024 | | | | 87,000 | | | | 92,204 | |
Alphabet Incorporated | | | 3.63 | | | | 5-19-2021 | | | | 350,000 | | | | 371,535 | |
eBay Incorporated | | | 2.60 | | | | 7-15-2022 | | | | 245,000 | | | | 245,515 | |
eBay Incorporated | | | 2.88 | | | | 8-1-2021 | | | | 350,000 | | | | 357,071 | |
eBay Incorporated | | | 3.25 | | | | 10-15-2020 | | | | 140,000 | | | | 144,662 | |
eBay Incorporated | | | 3.45 | | | | 8-1-2024 | | | | 405,000 | | | | 414,496 | |
eBay Incorporated | | | 3.80 | | | | 3-9-2022 | | | | 638,000 | | | | 672,102 | |
eBay Incorporated | | | 4.00 | | | | 7-15-2042 | | | | 175,000 | | | | 158,945 | |
| |
| | | | 2,456,530 | |
| | | | | | | | | | | | | | | | |
The accompanying notes are an integral part of these financial statements.
| | | | | | |
| Portfolio of investments—August 31, 2017 (unaudited) | | Wells Fargo Target Date Funds | | | 215 | |
INVESTMENT GRADE CORPORATE BOND PORTFOLIO
| | | | | | | | | | | | | | | | |
| Security name | | Interest rate | | | Maturity date | | | Principal | | | Value | |
| | | | |
| IT Services: 1.33% | | | | | | | | | | | | | | | | |
Fidelity National Information Services Incorporated | | | 3.00 | % | | | 8-15-2026 | | | $ | 400,000 | | | $ | 393,766 | |
Fidelity National Information Services Incorporated | | | 3.50 | | | | 4-15-2023 | | | | 49,000 | | | | 51,059 | |
Fidelity National Information Services Incorporated | | | 4.50 | | | | 8-15-2046 | | | | 300,000 | | | | 313,116 | |
Fidelity National Information Services Incorporated | | | 5.00 | | | | 10-15-2025 | | | | 195,000 | | | | 221,130 | |
Fiserv Incorporated | | | 2.70 | | | | 6-1-2020 | | | | 280,000 | | | | 284,549 | |
Fiserv Incorporated | | | 3.50 | | | | 10-1-2022 | | | | 280,000 | | | | 290,230 | |
Fiserv Incorporated | | | 3.85 | | | | 6-1-2025 | | | | 210,000 | | | | 220,554 | |
IBM Corporation | | | 1.63 | | | | 5-15-2020 | | | | 350,000 | | | | 349,491 | |
IBM Corporation | | | 1.88 | | | | 8-1-2022 | | | | 280,000 | | | | 275,576 | |
IBM Corporation | | | 1.95 | | | | 2-12-2019 | | | | 350,000 | | | | 352,066 | |
IBM Corporation | | | 3.38 | | | | 8-1-2023 | | | | 210,000 | | | | 219,483 | |
IBM Corporation | | | 4.00 | | | | 6-20-2042 | | | | 350,000 | | | | 353,988 | |
IBM Corporation | | | 5.88 | | | | 11-29-2032 | | | | 175,000 | | | | 224,432 | |
IBM Corporation | | | 7.00 | | | | 10-30-2025 | | | | 210,000 | | | | 272,305 | |
IBM Corporation | | | 7.63 | | | | 10-15-2018 | | | | 350,000 | | | | 373,006 | |
Total System Services Incorporated | | | 3.75 | | | | 6-1-2023 | | | | 105,000 | | | | 109,738 | |
Visa Incorporated | | | 2.20 | | | | 12-14-2020 | | | | 700,000 | | | | 708,784 | |
Visa Incorporated | | | 3.15 | | | | 12-14-2025 | | | | 1,020,000 | | | | 1,050,198 | |
Visa Incorporated | | | 4.30 | | | | 12-14-2045 | | | | 700,000 | | | | 777,879 | |
Western Union Company | | | 5.25 | | | | 4-1-2020 | | | | 56,000 | | | | 59,941 | |
Western Union Company | | | 6.20 | | | | 11-17-2036 | | | | 122,000 | | | | 131,893 | |
Xerox Corporation | | | 4.50 | | | | 5-15-2021 | | | | 400,000 | | | | 422,353 | |
Xerox Corporation | | | 5.63 | | | | 12-15-2019 | | | | 140,000 | | | | 149,466 | |
Xerox Corporation | | | 6.75 | | | | 12-15-2039 | | | | 340,000 | | | | 367,830 | |
| |
| | | | 7,972,833 | |
| | | | | | | | | | | | | | | | |
| | | | |
| Semiconductors & Semiconductor Equipment: 1.26% | | | | | | | | | | | | | | | | |
Altera Corporation | | | 2.50 | | | | 11-15-2018 | | | | 175,000 | | | | 177,095 | |
Analog Devices Incorporated | | | 2.88 | | | | 6-1-2023 | | | | 105,000 | | | | 106,537 | |
Applied Materials Incorporated | | | 4.30 | | | | 6-15-2021 | | | | 210,000 | | | | 227,738 | |
Applied Materials Incorporated | | | 5.85 | | | | 6-15-2041 | | | | 140,000 | | | | 177,651 | |
Broadcom Corporation 144A | | | 2.38 | | | | 1-15-2020 | | | | 260,000 | | | | 261,711 | |
Broadcom Corporation 144A | | | 3.00 | | | | 1-15-2022 | | | | 700,000 | | | | 710,863 | |
Broadcom Corporation 144A | | | 3.88 | | | | 1-15-2027 | | | | 1,000,000 | | | | 1,028,945 | |
Intel Corporation | | | 2.60 | | | | 5-19-2026 | | | | 220,000 | | | | 215,851 | |
Intel Corporation | | | 3.30 | | | | 10-1-2021 | | | | 593,000 | | | | 623,393 | |
Intel Corporation | | | 4.25 | | | | 12-15-2042 | | | | 175,000 | | | | 187,625 | |
Intel Corporation | | | 4.80 | | | | 10-1-2041 | | | | 450,000 | | | | 520,169 | |
Intel Corporation | | | 4.90 | | | | 7-29-2045 | | | | 525,000 | | | | 620,649 | |
KLA-Tencor Corporation | | | 4.65 | | | | 11-1-2024 | | | | 700,000 | | | | 765,714 | |
Lam Research Corporation | | | 2.80 | | | | 6-15-2021 | | | | 350,000 | | | | 356,592 | |
Maxim Integrated Product Incorporated | | | 3.38 | | | | 3-15-2023 | | | | 140,000 | | | | 143,469 | |
Qualcomm Incorporated | | | 1.85 | | | | 5-20-2019 | | | | 700,000 | | | | 703,016 | |
Texas Instruments Incorporated | | | 1.65 | | | | 8-3-2019 | | | | 175,000 | | | | 174,983 | |
Texas Instruments Incorporated | | | 2.25 | | | | 5-1-2023 | | | | 175,000 | | | | 174,613 | |
Xilinx Incorporated | | | 2.13 | | | | 3-15-2019 | | | | 175,000 | | | | 175,554 | |
Xilinx Incorporated | | | 3.00 | | | | 3-15-2021 | | | | 175,000 | | | | 179,328 | |
| |
| | | | 7,531,496 | |
| | | | | | | | | | | | | | | | |
The accompanying notes are an integral part of these financial statements.
| | | | |
| 216 | | Wells Fargo Target Date Funds | | Portfolio of investments—August 31, 2017 (unaudited) |
INVESTMENT GRADE CORPORATE BOND PORTFOLIO
| | | | | | | | | | | | | | | | |
| Security name | | Interest rate | | | Maturity date | | | Principal | | | Value | |
| | | | |
| Software: 1.10% | | | | | | | | | | | | | | | | |
Adobe Systems Incorporated | | | 4.75 | % | | | 2-1-2020 | | | $ | 227,000 | | | $ | 243,269 | |
Autodesk Incorporated | | | 3.60 | | | | 12-15-2022 | | | | 175,000 | | | | 180,392 | |
CA Incorporated | | | 5.38 | | | | 12-1-2019 | | | | 350,000 | | | | 373,737 | |
Microsoft Corporation | | | 1.63 | | | | 12-6-2018 | | | | 280,000 | | | | 281,204 | |
Microsoft Corporation | | | 2.00 | | | | 11-3-2020 | | | | 490,000 | | | | 494,204 | |
Microsoft Corporation | | | 3.00 | | | | 10-1-2020 | | | | 280,000 | | | | 290,070 | |
Microsoft Corporation | | | 3.75 | | | | 5-1-2043 | | | | 33,000 | | | | 33,614 | |
Microsoft Corporation | | | 3.75 | | | | 2-12-2045 | | | | 350,000 | | | | 355,384 | |
Microsoft Corporation | | | 3.95 | | | | 8-8-2056 | | | | 750,000 | | | | 765,881 | |
Microsoft Corporation | | | 4.00 | | | | 2-12-2055 | | | | 350,000 | | | | 359,938 | |
Microsoft Corporation | | | 4.50 | | | | 2-6-2057 | | | | 250,000 | | | | 280,070 | |
Microsoft Corporation | | | 4.88 | | | | 12-15-2043 | | | | 140,000 | | | | 165,487 | |
Microsoft Corporation | | | 5.20 | | | | 6-1-2039 | | | | 77,000 | | | | 95,086 | |
Oracle Corporation | | | 2.50 | | | | 10-15-2022 | | | | 560,000 | | | | 567,375 | |
Oracle Corporation | | | 2.80 | | | | 7-8-2021 | | | | 250,000 | | | | 258,103 | |
Oracle Corporation | | | 3.88 | | | | 7-15-2020 | | | | 245,000 | | | | 259,906 | |
Oracle Corporation | | | 4.00 | | | | 7-15-2046 | | | | 350,000 | | | | 360,138 | |
Oracle Corporation | | | 4.30 | | | | 7-8-2034 | | | | 175,000 | | | | 192,076 | |
Oracle Corporation | | | 4.38 | | | | 5-15-2055 | | | | 200,000 | | | | 216,975 | |
Oracle Corporation | | | 4.50 | | | | 7-8-2044 | | | | 350,000 | | | | 385,429 | |
Oracle Corporation | | | 6.13 | | | | 7-8-2039 | | | | 140,000 | | | | 187,123 | |
Oracle Corporation | | | 6.50 | | | | 4-15-2038 | | | | 175,000 | | | | 242,245 | |
| |
| | | | 6,587,706 | |
| | | | | | | | | | | | | | | | |
| | | | |
| Technology Hardware, Storage & Peripherals: 1.26% | | | | | | | | | | | | | | | | |
Apple Incorporated | | | 1.70 | | | | 2-22-2019 | | | | 220,000 | | | | 220,814 | |
Apple Incorporated | | | 3.20 | | | | 5-11-2027 | | | | 750,000 | | | | 766,953 | |
Apple Incorporated | | | 3.25 | | | | 2-23-2026 | | | | 475,000 | | | | 491,202 | |
Apple Incorporated | | | 3.35 | | | | 2-9-2027 | | | | 200,000 | | | | 207,163 | |
Apple Incorporated | | | 3.45 | | | | 2-9-2045 | | | | 700,000 | | | | 670,947 | |
Apple Incorporated | | | 4.38 | | | | 5-13-2045 | | | | 350,000 | | | | 385,962 | |
Apple Incorporated | | | 4.65 | | | | 2-23-2046 | | | | 200,000 | | | | 229,308 | |
Diamond 1 Finance Corporation 144A | | | 4.42 | | | | 6-15-2021 | | | | 400,000 | | | | 421,503 | |
Diamond 1 Finance Corporation 144A | | | 8.35 | | | | 7-15-2046 | | | | 700,000 | | | | 906,162 | |
Hewlett Packard Enterprise Company | | | 4.90 | | | | 10-15-2025 | | | | 700,000 | | | | 743,071 | |
Hewlett Packard Enterprise Company | | | 6.35 | | | | 10-15-2045 | | | | 525,000 | | | | 557,472 | |
Hewlett-Packard Company | | | 3.75 | | | | 12-1-2020 | | | | 29,000 | | | | 30,345 | |
Hewlett-Packard Company | | | 4.05 | | | | 9-15-2022 | | | | 175,000 | | | | 186,428 | |
Hewlett-Packard Company | | | 4.65 | | | | 12-9-2021 | | | | 350,000 | | | | 378,918 | |
Hewlett-Packard Company | | | 6.00 | | | | 9-15-2041 | | | | 332,000 | | | | 353,894 | |
HP Enterprise Company | | | 3.60 | | | | 10-15-2020 | | | | 995,000 | | | | 1,032,392 | |
| |
| | | | 7,582,534 | |
| | | | | | | | | | | | | | | | |
| | | | |
Materials: 2.75% | | | | | | | | | | | | | | | | |
| | | | |
| Chemicals: 1.95% | | | | | | | | | | | | | | | | |
Air Products & Chemicals Incorporated | | | 3.00 | | | | 11-3-2021 | | | | 175,000 | | | | 181,397 | |
Air Products & Chemicals Incorporated | | | 3.35 | | | | 7-31-2024 | | | | 245,000 | | | | 257,047 | |
Air Products & Chemicals Incorporated | | | 4.38 | | | | 8-21-2019 | | | | 105,000 | | | | 110,335 | |
Dow Chemical Company | | | 3.50 | | | | 10-1-2024 | | | | 175,000 | | | | 182,382 | |
The accompanying notes are an integral part of these financial statements.
| | | | | | |
| Portfolio of investments—August 31, 2017 (unaudited) | | Wells Fargo Target Date Funds | | | 217 | |
INVESTMENT GRADE CORPORATE BOND PORTFOLIO
| | | | | | | | | | | | | | | | |
| Security name | | Interest rate | | | Maturity date | | | Principal | | | Value | |
| | | | |
| Chemicals (continued) | | | | | | | | | | | | | | | | |
Dow Chemical Company | | | 4.13 | % | | | 11-15-2021 | | | $ | 350,000 | | | $ | 373,936 | |
Dow Chemical Company | | | 4.25 | | | | 10-1-2034 | | | | 175,000 | | | | 182,702 | |
Dow Chemical Company | | | 4.38 | | | | 11-15-2042 | | | | 540,000 | | | | 553,865 | |
Dow Chemical Company | | | 5.25 | | | | 11-15-2041 | | | | 175,000 | | | | 200,432 | |
Dow Chemical Company | | | 7.38 | | | | 11-1-2029 | | | | 420,000 | | | | 566,021 | |
Dow Chemical Company | | | 8.55 | | | | 5-15-2019 | | | | 458,000 | | | | 508,488 | |
E.I. du Pont de Nemours & Company | | | 2.80 | | | | 2-15-2023 | | | | 210,000 | | | | 213,403 | |
E.I. du Pont de Nemours & Company | | | 3.63 | | | | 1-15-2021 | | | | 350,000 | | | | 367,872 | |
E.I. du Pont de Nemours & Company | | | 4.15 | | | | 2-15-2043 | | | | 210,000 | | | | 214,523 | |
E.I. du Pont de Nemours & Company | | | 4.50 | | | | 8-15-2019 | | | | 280,000 | | | | 294,864 | |
E.I. du Pont de Nemours & Company | | | 4.63 | | | | 1-15-2020 | | | | 140,000 | | | | 148,881 | |
E.I. du Pont de Nemours & Company | | | 4.90 | | | | 1-15-2041 | | | | 700,000 | | | | 797,254 | |
E.I. du Pont de Nemours & Company | | | 6.50 | | | | 1-15-2028 | | | | 175,000 | | | | 221,625 | |
Eastman Chemical Company | | | 2.70 | | | | 1-15-2020 | | | | 210,000 | | | | 212,686 | |
Eastman Chemical Company | | | 3.60 | | | | 8-15-2022 | | | | 280,000 | | | | 291,574 | |
Eastman Chemical Company | | | 4.80 | | | | 9-1-2042 | | | | 140,000 | | | | 150,735 | |
Ecolab Incorporated | | | 4.35 | | | | 12-8-2021 | | | | 350,000 | | | | 380,795 | |
Ecolab Incorporated | | | 5.50 | | | | 12-8-2041 | | | | 210,000 | | | | 262,239 | |
FMC Corporation | | | 3.95 | | | | 2-1-2022 | | | | 87,000 | | | | 90,323 | |
FMC Corporation | | | 4.10 | | | | 2-1-2024 | | | | 175,000 | | | | 182,678 | |
Monsanto Company | | | 3.38 | | | | 7-15-2024 | | | | 200,000 | | | | 205,401 | |
Monsanto Company | | | 4.70 | | | | 7-15-2064 | | | | 210,000 | | | | 215,025 | |
Monsanto Company | | | 5.50 | | | | 8-15-2025 | | | | 70,000 | | | | 80,455 | |
Mosaic Company | | | 3.75 | | | | 11-15-2021 | | | | 80,000 | | | | 83,377 | |
Mosaic Company | | | 4.25 | | | | 11-15-2023 | | | | 297,000 | | | | 311,217 | |
Mosaic Company | | | 5.45 | | | | 11-15-2033 | | | | 213,000 | | | | 222,731 | |
Mosaic Company | | | 5.63 | | | | 11-15-2043 | | | | 175,000 | | | | 182,858 | |
Praxair Incorporated | | | 2.20 | | | | 8-15-2022 | | | | 350,000 | | | | 350,819 | |
Praxair Incorporated | | | 2.45 | | | | 2-15-2022 | | | | 140,000 | | | | 141,804 | |
Praxair Incorporated | | | 2.70 | | | | 2-21-2023 | | | | 105,000 | | | | 105,939 | |
Praxair Incorporated | | | 4.05 | | | | 3-15-2021 | | | | 140,000 | | | | 149,270 | |
RPM International Incorporated | | | 6.13 | �� | | | 10-15-2019 | | | | 140,000 | | | | 151,925 | |
Sherwin-Williams Company | | | 3.13 | | | | 6-1-2024 | | | | 2,000,000 | | | | 2,031,210 | |
Sherwin-Williams Company | | | 3.45 | | | | 8-1-2025 | | | | 400,000 | | | | 407,534 | |
Sherwin-Williams Company | | | 4.00 | | | | 12-15-2042 | | | | 92,000 | | | | 88,610 | |
| |
| | | | 11,674,232 | |
| | | | | | | | | | | | | | | | |
| | | | |
| Containers & Packaging: 0.10% | | | | | | | | | | | | | | | | |
Bemis Company Incorporated | | | 6.80 | | | | 8-1-2019 | | | | 7,000 | | | | 7,630 | |
International Paper Company | | | 3.00 | | | | 2-15-2027 | | | | 260,000 | | | | 252,515 | |
Packaging Corporation of America | | | 3.65 | | | | 9-15-2024 | | | | 175,000 | | | | 181,239 | |
Packaging Corporation of America | | | 3.90 | | | | 6-15-2022 | | | | 140,000 | | | | 147,882 | |
| |
| | | | 589,266 | |
| | | | | | | | | | | | | | | | |
| | | | |
| Metals & Mining: 0.35% | | | | | | | | | | | | | | | | |
Barrick Gold Finance Company LLC | | | 4.40 | | | | 5-30-2021 | | | | 101,000 | | | | 109,242 | |
Barrick Gold Finance Company LLC | | | 5.70 | | | | 5-30-2041 | | | | 210,000 | | | | 253,325 | |
Newmont Mining Corporation | | | 3.50 | | | | 3-15-2022 | | | | 420,000 | | | | 437,355 | |
Newmont Mining Corporation | | | 4.88 | | | | 3-15-2042 | | | | 350,000 | | | | 378,163 | |
The accompanying notes are an integral part of these financial statements.
| | | | |
| 218 | | Wells Fargo Target Date Funds | | Portfolio of investments—August 31, 2017 (unaudited) |
INVESTMENT GRADE CORPORATE BOND PORTFOLIO
| | | | | | | | | | | | | | | | |
| Security name | | Interest rate | | | Maturity date | | | Principal | | | Value | |
| | | | |
| Metals & Mining (continued) | | | | | | | | | | | | | | | | |
Nucor Corporation | | | 4.00 | % | | | 8-1-2023 | | | $ | 132,000 | | | $ | 141,465 | |
Nucor Corporation | | | 5.20 | | | | 8-1-2043 | | | | 140,000 | | | | 167,058 | |
Nucor Corporation | | | 6.40 | | | | 12-1-2037 | | | | 140,000 | | | | 185,108 | |
Southern Copper Corporation | | | 5.38 | | | | 4-16-2020 | | | | 63,000 | | | | 68,124 | |
Southern Copper Corporation | | | 6.75 | | | | 4-16-2040 | | | | 308,000 | | | | 376,042 | |
| |
| | | | 2,115,882 | |
| | | | | | | | | | | | | | | | |
| | | | |
| Paper & Forest Products: 0.35% | | | | | | | | | | | | | | | | |
Georgia-Pacific LLC | | | 8.00 | | | | 1-15-2024 | | | | 140,000 | | | | 181,437 | |
International Paper Company | | | 3.65 | | | | 6-15-2024 | | | | 350,000 | | | | 365,865 | |
International Paper Company | | | 4.75 | | | | 2-15-2022 | | | | 52,000 | | | | 56,975 | |
International Paper Company | | | 4.80 | | | | 6-15-2044 | | | | 175,000 | | | | 188,322 | |
International Paper Company | | | 6.00 | | | | 11-15-2041 | | | | 374,000 | | | | 456,180 | |
International Paper Company | | | 7.30 | | | | 11-15-2039 | | | | 175,000 | | | | 242,941 | |
International Paper Company | | | 7.50 | | | | 8-15-2021 | | | | 315,000 | | | | 375,124 | |
MeadWestvaco Corporation | | | 7.95 | | | | 2-15-2031 | | | | 35,000 | | | | 49,615 | |
Plum Creek Timberlands LP | | | 3.25 | | | | 3-15-2023 | | | | 192,000 | | | | 196,537 | |
| |
| | | | 2,112,996 | |
| | | | | | | | | | | | | | | | |
| | | | |
Real Estate: 4.00% | | | | | | | | | | | | | | | | |
| | | | |
| Equity REITs: 4.00% | | | | | | | | | | | | | | | | |
Alexandria Real Estate Equities Incorporated | | | 4.50 | | | | 7-30-2029 | | | | 525,000 | | | | 563,796 | |
American Campus Communities Incorporated | | | 3.75 | | | | 4-15-2023 | | | | 70,000 | | | | 72,772 | |
American Tower Corporation | | | 3.45 | | | | 9-15-2021 | | | | 350,000 | | | | 363,174 | |
American Tower Corporation | | | 3.50 | | | | 1-31-2023 | | | | 295,000 | | | | 306,423 | |
American Tower Corporation | | | 4.00 | | | | 6-1-2025 | | | | 350,000 | | | | 366,692 | |
American Tower Corporation | | | 5.00 | | | | 2-15-2024 | | | | 245,000 | | | | 272,209 | |
American Tower Corporation | | | 5.90 | | | | 11-1-2021 | | | | 395,000 | | | | 448,701 | |
AvalonBay Communities Incorporated | | | 2.95 | | | | 9-15-2022 | | | | 245,000 | | | | 250,399 | |
AvalonBay Communities Incorporated | | | 3.45 | | | | 6-1-2025 | | | | 140,000 | | | | 144,740 | |
AvalonBay Communities Incorporated | | | 3.50 | | | | 11-15-2024 | | | | 105,000 | | | | 109,455 | |
AvalonBay Communities Incorporated | | | 3.63 | | | | 10-1-2020 | | | | 140,000 | | | | 145,966 | |
AvalonBay Communities Incorporated | | | 4.20 | | | | 12-15-2023 | | | | 175,000 | | | | 189,041 | |
Boston Properties LP | | | 3.13 | | | | 9-1-2023 | | | | 105,000 | | | | 108,142 | |
Boston Properties LP | | | 3.80 | | | | 2-1-2024 | | | | 1,510,000 | | | | 1,596,271 | |
Boston Properties LP | | | 3.85 | | | | 2-1-2023 | | | | 280,000 | | | | 298,079 | |
Boston Properties LP | | | 4.13 | | | | 5-15-2021 | | | | 210,000 | | | | 223,020 | |
Boston Properties LP | | | 5.63 | | | | 11-15-2020 | | | | 380,000 | | | | 417,179 | |
Boston Properties LP | | | 5.88 | | | | 10-15-2019 | | | | 350,000 | | | | 376,453 | |
CBL & Associates LP | | | 4.60 | | | | 10-15-2024 | | | | 92,000 | | | | 87,738 | |
CBL & Associates LP | | | 5.25 | | | | 12-1-2023 | | | | 47,000 | | | | 47,199 | |
CBL & Associates LP | | | 5.95 | | | | 12-15-2026 | | | | 200,000 | | | | 202,493 | |
Corporate Office Properties LP | | | 3.60 | | | | 5-15-2023 | | | | 70,000 | | | | 70,479 | |
Corporate Office Properties LP | | | 3.70 | | | | 6-15-2021 | | | | 350,000 | | | | 360,545 | |
Crown Castle International Corporation | | | 3.70 | | | | 6-15-2026 | | | | 350,000 | | | | 355,070 | |
Crown Castle International Corporation | | | 4.88 | | | | 4-15-2022 | | | | 50,000 | | | | 54,663 | |
Crown Castle International Corporation | | | 5.25 | | | | 1-15-2023 | | | | 350,000 | | | | 390,370 | |
Crown Castle International Corporation | | | 4.75 | | | | 5-15-2047 | | | | 900,000 | | | | 943,747 | |
DDR Corporation | | | 3.38 | | | | 5-15-2023 | | | | 175,000 | | | | 173,287 | |
The accompanying notes are an integral part of these financial statements.
| | | | | | |
| Portfolio of investments—August 31, 2017 (unaudited) | | Wells Fargo Target Date Funds | | | 219 | |
INVESTMENT GRADE CORPORATE BOND PORTFOLIO
| | | | | | | | | | | | | | | | |
| Security name | | Interest rate | | | Maturity date | | | Principal | | | Value | |
| | | | |
| Equity REITs (continued) | | | | | | | | | | | | | | | | |
DDR Corporation | | | 3.50 | % | | | 1-15-2021 | | | $ | 175,000 | | | $ | 178,273 | |
DDR Corporation | | | 4.63 | | | | 7-15-2022 | | | | 175,000 | | | | 185,254 | |
Digital Realty Trust LP | | | 3.63 | | | | 10-1-2022 | | | | 140,000 | | | | 146,511 | |
Digital Realty Trust LP | | | 3.95 | | | | 7-1-2022 | | | | 140,000 | | | | 148,554 | |
Digital Realty Trust LP | | | 5.25 | | | | 3-15-2021 | | | | 70,000 | | | | 76,419 | |
Digital Realty Trust LP | | | 5.88 | | | | 2-1-2020 | | | | 210,000 | | | | 226,741 | |
Duke Realty LP | | | 3.75 | | | | 12-1-2024 | | | | 455,000 | | | | 475,991 | |
Entertainment Properties Trust | | | 5.75 | | | | 8-15-2022 | | | | 105,000 | | | | 117,052 | |
Equity One Incorporated | | | 3.75 | | | | 11-15-2022 | | | | 175,000 | | | | 181,892 | |
ERP Operating LP | | | 4.63 | | | | 12-15-2021 | | | | 419,000 | | | | 456,347 | |
Essex Portfolio LP | | | 3.25 | | | | 5-1-2023 | | | | 70,000 | | | | 71,056 | |
Federal Realty Investment Trust | | | 4.50 | | | | 12-1-2044 | | | | 175,000 | | | | 186,485 | |
HCP Incorporated | | | 3.15 | | | | 8-1-2022 | | | | 70,000 | | | | 71,481 | |
HCP Incorporated | | | 3.75 | | | | 2-1-2019 | | | | 70,000 | | | | 71,402 | |
HCP Incorporated | | | 3.88 | | | | 8-15-2024 | | | | 200,000 | | | | 208,556 | |
HCP Incorporated | | | 4.25 | | | | 11-15-2023 | | | | 195,000 | | | | 208,913 | |
HCP Incorporated | | | 5.38 | | | | 2-1-2021 | | | | 45,000 | | | | 49,110 | |
HCP Incorporated | | | 6.75 | | | | 2-1-2041 | | | | 95,000 | | | | 125,240 | |
Health Care REIT Incorporated | | | 4.00 | | | | 6-1-2025 | | | | 210,000 | | | | 221,511 | |
Health Care REIT Incorporated | | | 4.13 | | | | 4-1-2019 | | | | 175,000 | | | | 180,193 | |
Health Care REIT Incorporated | | | 4.50 | | | | 1-15-2024 | | | | 140,000 | | | | 152,460 | |
Health Care REIT Incorporated | | | 4.95 | | | | 1-15-2021 | | | | 175,000 | | | | 189,046 | |
Health Care REIT Incorporated | | | 5.25 | | | | 1-15-2022 | | | | 70,000 | | | | 77,455 | |
Hospitality Properties Trust | | | 4.65 | | | | 3-15-2024 | | | | 350,000 | | | | 369,907 | |
Host Hotels & Resorts Company | | | 3.75 | | | | 10-15-2023 | | | | 70,000 | | | | 72,142 | |
Host Hotels & Resorts Company | | | 4.75 | | | | 3-1-2023 | | | | 175,000 | | | | 189,163 | |
Host Hotels & Resorts Company | | | 6.00 | | | | 10-1-2021 | | | | 350,000 | | | | 392,306 | |
Kilroy Realty Corporation | | | 3.80 | | | | 1-15-2023 | | | | 175,000 | | | | 181,704 | |
Kimco Realty Corporation | | | 2.80 | | | | 10-1-2026 | | | | 350,000 | | | | 332,600 | |
Kimco Realty Corporation | | | 6.88 | | | | 10-1-2019 | | | | 70,000 | | | | 76,765 | |
Liberty Property LP | | | 4.40 | | | | 2-15-2024 | | | | 109,000 | | | | 117,358 | |
Liberty Property LP | | | 4.75 | | | | 10-1-2020 | | | | 175,000 | | | | 186,428 | |
Mid-America Apartments LP | | | 4.30 | | | | 10-15-2023 | | | | 35,000 | | | | 37,514 | |
National Retail Properties Incorporated | | | 3.30 | | | | 4-15-2023 | | | | 70,000 | | | | 71,500 | |
National Retail Properties Incorporated | | | 3.80 | | | | 10-15-2022 | | | | 70,000 | | | | 73,433 | |
ProLogis LP | | | 3.35 | | | | 2-1-2021 | | | | 280,000 | | | | 290,735 | |
Realty Income Corporation | | | 3.88 | | | | 7-15-2024 | | | | 350,000 | | | | 364,633 | |
Realty Income Corporation | | | 4.65 | | | | 8-1-2023 | | | | 210,000 | | | | 230,116 | |
Simon Property Group LP | | | 2.20 | | | | 2-1-2019 | | | | 350,000 | | | | 352,345 | |
Simon Property Group LP | | | 3.30 | | | | 1-15-2026 | | | | 410,000 | | | | 417,235 | |
Simon Property Group LP | | | 3.38 | | | | 3-15-2022 | | | | 350,000 | | | | 364,992 | |
Simon Property Group LP | | | 3.75 | | | | 2-1-2024 | | | | 175,000 | | | | 184,593 | |
Simon Property Group LP | | | 4.13 | | | | 12-1-2021 | | | | 210,000 | | | | 224,717 | |
Simon Property Group LP | | | 4.38 | | | | 3-1-2021 | | | | 350,000 | | | | 374,614 | |
Simon Property Group LP | | | 4.75 | | | | 3-15-2042 | | | | 175,000 | | | | 193,847 | |
Simon Property Group LP | | | 6.75 | | | | 2-1-2040 | | | | 245,000 | | | | 337,680 | |
UDR Incorporated | | | 3.70 | | | | 10-1-2020 | | | | 175,000 | | | | 181,248 | |
UDR Incorporated | | | 4.63 | | | | 1-10-2022 | | | | 70,000 | | | | 75,146 | |
Ventas Realty LP | | | 2.70 | | | | 4-1-2020 | | | | 660,000 | | | | 668,361 | |
Ventas Realty LP | | | 3.85 | | | | 4-1-2027 | | | | 1,800,000 | | | | 1,848,952 | |
The accompanying notes are an integral part of these financial statements.
| | | | |
| 220 | | Wells Fargo Target Date Funds | | Portfolio of investments—August 31, 2017 (unaudited) |
INVESTMENT GRADE CORPORATE BOND PORTFOLIO
| | | | | | | | | | | | | | | | |
| Security name | | Interest rate | | | Maturity date | | | Principal | | | Value | |
| | | | |
| Equity REITs (continued) | | | | | | | | | | | | | | | | |
Ventas Realty LP | | | 4.25 | % | | | 3-1-2022 | | | $ | 700,000 | | | $ | 745,605 | |
Ventas Realty LP | | | 4.75 | | | | 6-1-2021 | | | | 105,000 | | | | 113,181 | |
Ventas Realty LP | | | 5.70 | | | | 9-30-2043 | | | | 175,000 | | | | 209,311 | |
VEREIT Operating Partnership LP | | | 3.00 | | | | 2-6-2019 | | | | 147,000 | | | | 148,797 | |
VEREIT Operating Partnership LP | | | 4.13 | | | | 6-1-2021 | | | | 80,000 | | | | 84,007 | |
VEREIT Operating Partnership LP | | | 4.60 | | | | 2-6-2024 | | | | 98,000 | | | | 103,598 | |
VEREIT Operating Partnership LP | | | 4.88 | | | | 6-1-2026 | | | | 119,000 | | | | 127,823 | |
Vornado Realty LP | | | 2.50 | | | | 6-30-2019 | | | | 350,000 | | | | 353,298 | |
Weyerhaeuser Company | | | 4.63 | | | | 9-15-2023 | | | | 210,000 | | | | 231,125 | |
Weyerhaeuser Company | | | 7.38 | | | | 10-1-2019 | | | | 70,000 | | | | 77,469 | |
Weyerhaeuser Company | | | 7.38 | | | | 3-15-2032 | | | | 200,000 | | | | 283,997 | |
WP Carey Incorporated | | | 4.60 | | | | 4-1-2024 | | | | 350,000 | | | | 370,616 | |
| |
| | | | 24,002,906 | |
| | | | | | | | | | | | | | | | |
| | | | |
Telecommunication Services: 0.79% | | | | | | | | | | | | | | | | |
| | | | |
| Diversified Telecommunication Services: 0.73% | | | | | | | | | | | | | | | | |
AT&T Incorporated | | | 3.00 | | | | 2-15-2022 | | | | 200,000 | | | | 202,558 | |
AT&T Incorporated | | | 3.90 | | | | 3-11-2024 | | | | 350,000 | | | | 364,859 | |
AT&T Incorporated | | | 4.30 | | | | 12-15-2042 | | | | 350,000 | | | | 324,989 | |
AT&T Incorporated | | | 4.50 | | | | 5-15-2035 | | | | 230,000 | | | | 225,155 | |
AT&T Incorporated | | | 5.00 | | | | 3-1-2021 | | | | 200,000 | | | | 217,105 | |
AT&T Incorporated | | | 5.15 | | | | 3-15-2042 | | | | 350,000 | | | | 357,177 | |
AT&T Incorporated | | | 6.00 | | | | 8-15-2040 | | | | 280,000 | | | | 317,169 | |
AT&T Incorporated | | | 6.30 | | | | 1-15-2038 | | | | 350,000 | | | | 410,912 | |
Qwest Corporation | | | 6.88 | | | | 9-15-2033 | | | | 178,000 | | | | 175,963 | |
Verizon Communications Incorporated | | | 3.85 | | | | 11-1-2042 | | | | 260,000 | | | | 225,386 | |
Verizon Communications Incorporated | | | 4.67 | | | | 3-15-2055 | | | | 655,000 | | | | 608,737 | |
Verizon Communications Incorporated | | | 4.75 | | | | 11-1-2041 | | | | 350,000 | | | | 345,770 | |
Verizon Communications Incorporated | | | 4.86 | | | | 8-21-2046 | | | | 581,000 | | | | 578,039 | |
| |
| | | | 4,353,819 | |
| | | | | | | | | | | | | | | | |
| | | | |
| Wireless Telecommunication Services: 0.06% | | | | | | | | | | | | | | | | |
CC Holdings GS V LLC | | | 3.85 | | | | 4-15-2023 | | | | 350,000 | | | | 368,814 | |
| | | | | | | | | | | | | | | | |
| | | | |
Utilities: 6.36% | | | | | | | | | | | | | | | | |
| | | | |
| Electric Utilities: 4.61% | | | | | | | | | | | | | | | | |
Alabama Power Company | | | 3.55 | | | | 12-1-2023 | | | | 175,000 | | | | 185,505 | |
Alabama Power Company | | | 3.85 | | | | 12-1-2042 | | | | 140,000 | | | | 144,023 | |
Alabama Power Company | | | 4.15 | | | | 8-15-2044 | | | | 105,000 | | | | 113,374 | |
American Electric Power Company Incorporated | | | 2.95 | | | | 12-15-2022 | | | | 140,000 | | | | 143,621 | |
Appalachian Power Company | | | 3.40 | | | | 6-1-2025 | | | | 175,000 | | | | 181,774 | |
Appalachian Power Company | | | 4.45 | | | | 6-1-2045 | | | | 175,000 | | | | 195,512 | |
Appalachian Power Company | | | 7.00 | | | | 4-1-2038 | | | | 70,000 | | | | 99,209 | |
Arizona Public Service Company | | | 3.15 | | | | 5-15-2025 | | | | 105,000 | | | | 106,966 | |
Arizona Public Service Company | | | 4.50 | | | | 4-1-2042 | | | | 70,000 | | | | 78,331 | |
Baltimore Gas & Electric Company | | | 3.50 | | | | 8-15-2046 | | | | 50,000 | | | | 48,119 | |
Carolina Power & Light Company | | | 2.80 | | | | 5-15-2022 | | | | 175,000 | | | | 179,848 | |
CenterPoint Energy Houston | | | 2.25 | | | | 8-1-2022 | | | | 210,000 | | | | 210,316 | |
CenterPoint Energy Houston | | | 3.55 | | | | 8-1-2042 | | | | 175,000 | | | | 173,322 | |
The accompanying notes are an integral part of these financial statements.
| | | | | | |
| Portfolio of investments—August 31, 2017 (unaudited) | | Wells Fargo Target Date Funds | | | 221 | |
INVESTMENT GRADE CORPORATE BOND PORTFOLIO
| | | | | | | | | | | | | | | | |
| Security name | | Interest rate | | | Maturity date | | | Principal | | | Value | |
| | | | |
| Electric Utilities (continued) | | | | | | | | | | | | | | | | |
CenterPoint Energy Houston | | | 4.50 | % | | | 4-1-2044 | | | $ | 175,000 | | | $ | 199,472 | |
Cleveland Electric Illuminating Company | | | 5.50 | | | | 8-15-2024 | | | | 500,000 | | | | 578,555 | |
Commonwealth Edison Company | | | 3.80 | | | | 10-1-2042 | | | | 70,000 | | | | 72,203 | |
Commonwealth Edison Company | | | 4.70 | | | | 1-15-2044 | | | | 175,000 | | | | 202,878 | |
Commonwealth Edison Company | | | 5.90 | | | | 3-15-2036 | | | | 175,000 | | | | 228,999 | |
Connecticut Light & Power Company | | | 4.15 | | | | 6-1-2045 | | | | 87,000 | | | | 94,272 | |
Consolidated Edison Company of New York Incorporated | | | 4.20 | | | | 3-15-2042 | | | | 175,000 | | | | 188,239 | |
Consolidated Edison Company of New York Incorporated | | | 4.30 | | | | 12-1-2056 | | | | 245,000 | | | | 266,306 | |
Consolidated Edison Company of New York Incorporated | | | 4.45 | | | | 3-15-2044 | | | | 350,000 | | | | 393,118 | |
Consolidated Edison Company of New York Incorporated | | | 6.20 | | | | 6-15-2036 | | | | 200,000 | | | | 266,352 | |
Consolidated Edison Company of New York Incorporated | | | 6.30 | | | | 8-15-2037 | | | | 175,000 | | | | 235,876 | |
Consolidated Edison Company of New York Incorporated | | | 6.75 | | | | 4-1-2038 | | | | 210,000 | | | | 299,864 | |
Consolidated Edison Company of New York Incorporated | | | 7.13 | | | | 12-1-2018 | | | | 140,000 | | | | 149,077 | |
DTE Electric Company | | | 3.65 | | | | 3-15-2024 | | | | 105,000 | | | | 111,884 | |
Duke Energy Carolinas LLC | | | 4.30 | | | | 6-15-2020 | | | | 50,000 | | | | 53,418 | |
Duke Energy Carolinas LLC | | | 6.10 | | | | 6-1-2037 | | | | 175,000 | | | | 230,667 | |
Duke Energy Carolinas LLC | | | 7.00 | | | | 11-15-2018 | | | | 70,000 | | | | 74,381 | |
Duke Energy Corporation | | | 3.05 | | | | 8-15-2022 | | | | 70,000 | | | | 71,809 | |
Duke Energy Corporation | | | 3.95 | | | | 10-15-2023 | | | | 140,000 | | | | 149,380 | |
Duke Energy Florida Incorporated | | | 3.85 | | | | 11-15-2042 | | | | 70,000 | | | | 71,979 | |
Duke Energy Indiana Incorporated | | | 3.75 | | | | 5-15-2046 | | | | 175,000 | | | | 176,935 | |
Duke Energy Indiana Incorporated | | | 4.90 | | | | 7-15-2043 | | | | 105,000 | | | | 126,412 | |
Duke Energy Indiana Incorporated | | | 6.45 | | | | 4-1-2039 | | | | 45,000 | | | | 62,807 | |
Duke Energy Progress Incorporated | | | 3.00 | | | | 9-15-2021 | | | | 175,000 | | | | 180,495 | |
Duke Energy Progress Incorporated | | | 4.10 | | | | 3-15-2043 | | | | 105,000 | | | | 113,156 | |
Duke Energy Progress Incorporated | | | 4.15 | | | | 12-1-2044 | | | | 175,000 | | | | 189,471 | |
Duke Energy Progress Incorporated | | | 4.38 | | | | 3-30-2044 | | | | 175,000 | | | | 194,715 | |
Emera US Finance LP | | | 3.55 | | | | 6-15-2026 | | | | 200,000 | | | | 203,774 | |
Entergy Arkansas Incorporated | | | 3.70 | | | | 6-1-2024 | | | | 175,000 | | | | 185,657 | |
Entergy Corporation | | | 5.13 | | | | 9-15-2020 | | | | 175,000 | | | | 188,792 | |
Entergy Gulf States Louisiana LLC | | | 5.59 | | | | 10-1-2024 | | | | 84,000 | | | | 98,159 | |
Entergy Louisiana LLC | | | 3.25 | | | | 4-1-2028 | | | | 350,000 | | | | 357,557 | |
Entergy Louisiana LLC | | | 5.40 | | | | 11-1-2024 | | | | 175,000 | | | | 203,903 | |
Entergy Texas Incorporated | | | 7.13 | | | | 2-1-2019 | | | | 140,000 | | | | 149,519 | |
Exelon Corporation | | | 4.95 | | | | 6-15-2035 | | | | 140,000 | | | | 158,249 | |
Exelon Corporation | | | 5.10 | | | | 6-15-2045 | | | | 280,000 | | | | 322,537 | |
Exelon Corporation | | | 5.63 | | | | 6-15-2035 | | | | 255,000 | | | | 308,692 | |
Exelon Generation Company LLC | | | 4.25 | | | | 6-15-2022 | | | | 157,000 | | | | 167,127 | |
FirstEnergy Corporation | | | 4.25 | | | | 3-15-2023 | | | | 168,000 | | | | 178,273 | |
FirstEnergy Corporation Series C | | | 7.38 | | | | 11-15-2031 | | | | 390,000 | | | | 526,344 | |
Florida Power & Light Company | | | 3.25 | | | | 6-1-2024 | | | | 350,000 | | | | 365,393 | |
Florida Power & Light Company | | | 4.05 | | | | 6-1-2042 | | | | 175,000 | | | | 189,052 | |
Florida Power & Light Company | | | 4.13 | | | | 2-1-2042 | | | | 560,000 | | | | 609,672 | |
Florida Power & Light Company | | | 5.25 | | | | 2-1-2041 | | | | 140,000 | | | | 175,191 | |
Florida Power & Light Company | | | 5.95 | | | | 2-1-2038 | | | | 224,000 | | | | 298,180 | |
Florida Power & Light Company | | | 5.96 | | | | 4-1-2039 | | | | 175,000 | | | | 234,171 | |
Florida Power Corporation | | | 5.65 | | | | 4-1-2040 | | | | 87,000 | | | | 112,526 | |
Georgia Power Company | | | 4.30 | | | | 3-15-2042 | | | | 175,000 | | | | 185,137 | |
Georgia Power Company | | | 4.30 | | | | 3-15-2043 | | | | 245,000 | | | | 259,613 | |
Georgia Power Company | | | 5.40 | | | | 6-1-2040 | | | | 175,000 | | | | 210,773 | |
The accompanying notes are an integral part of these financial statements.
| | | | |
| 222 | | Wells Fargo Target Date Funds | | Portfolio of investments—August 31, 2017 (unaudited) |
INVESTMENT GRADE CORPORATE BOND PORTFOLIO
| | | | | | | | | | | | | | | | |
| Security name | | Interest rate | | | Maturity date | | | Principal | | | Value | |
| | | | |
| Electric Utilities (continued) | | | | | | | | | | | | | | | | |
Georgia Power Company | | | 5.95 | % | | | 2-1-2039 | | | $ | 175,000 | | | $ | 221,179 | |
Great Plains Energy Incorporated | | | 4.85 | | | | 6-1-2021 | | | | 35,000 | | | | 37,456 | |
Interstate Power & Light Company | | | 6.25 | | | | 7-15-2039 | | | | 21,000 | | | | 27,784 | |
Jersey Central Power & Light Company | | | 7.35 | | | | 2-1-2019 | | | | 175,000 | | | | 187,261 | |
Kansas City Power & Light Company | | | 3.15 | | | | 3-15-2023 | | | | 140,000 | | | | 143,231 | |
Kansas City Power & Light Company | | | 7.15 | | | | 4-1-2019 | | | | 140,000 | | | | 151,205 | |
Kentucky Utilities Company | | | 3.25 | | | | 11-1-2020 | | | | 175,000 | | | | 181,475 | |
LG&E & KU Energy LLC | | | 3.75 | | | | 11-15-2020 | | | | 70,000 | | | | 73,219 | |
MidAmerican Energy Holdings Company | | | 4.80 | | | | 9-15-2043 | | | | 210,000 | | | | 247,749 | |
MidAmerican Energy Holdings Company | | | 5.95 | | | | 5-15-2037 | | | | 210,000 | | | | 270,036 | |
MidAmerican Energy Holdings Company | | | 6.13 | | | | 4-1-2036 | | | | 140,000 | | | | 182,759 | |
MidAmerican Energy Holdings Company | | | 6.75 | | | | 12-30-2031 | | | | 105,000 | | | | 145,146 | |
Nevada Power Company | | | 6.75 | | | | 7-1-2037 | | | | 140,000 | | | | 191,415 | |
NiSource Finance Corporation | | | 5.65 | | | | 2-1-2045 | | | | 140,000 | | | | 173,956 | |
Northeast Utilities | | | 2.80 | | | | 5-1-2023 | | | | 122,000 | | | | 123,616 | |
Northern States Power Company of Minnesota | | | 2.15 | | | | 8-15-2022 | | | | 175,000 | | | | 174,999 | |
Northern States Power Company of Minnesota | | | 2.60 | | | | 5-15-2023 | | | | 105,000 | | | | 106,544 | |
Northern States Power Company of Minnesota | | | 3.40 | | | | 8-15-2042 | | | | 175,000 | | | | 171,334 | |
Northern States Power Company of Minnesota | | | 5.35 | | | | 11-1-2039 | | | | 28,000 | | | | 35,201 | |
Northern States Power Company of Minnesota | | | 6.20 | | | | 7-1-2037 | | | | 210,000 | | | | 284,323 | |
NSTAR Electric Company | | | 2.38 | | | | 10-15-2022 | | | | 140,000 | | | | 140,886 | |
NSTAR Electric Company | | | 5.50 | | | | 3-15-2040 | | | | 70,000 | | | | 89,050 | |
Oglethorpe Power Corporation | | | 5.25 | | | | 9-1-2050 | | | | 240,000 | | | | 274,006 | |
Oglethorpe Power Corporation | | | 5.38 | | | | 11-1-2040 | | | | 210,000 | | | | 245,468 | |
Oglethorpe Power Corporation | | | 5.95 | | | | 11-1-2039 | | | | 105,000 | | | | 130,832 | |
Ohio Edison Company | | | 6.88 | | | | 7-15-2036 | | | | 175,000 | | | | 238,975 | |
Ohio Power Company | | | 5.38 | | | | 10-1-2021 | | | | 45,000 | | | | 50,425 | |
Oncor Electric Delivery Company LLC | | | 4.55 | | | | 12-1-2041 | | | | 140,000 | | | | 157,378 | |
Oncor Electric Delivery Company LLC | | | 5.25 | | | | 9-30-2040 | | | | 175,000 | | | | 213,903 | |
Oncor Electric Delivery Company LLC | | | 7.00 | | | | 5-1-2032 | | | | 122,000 | | | | 170,570 | |
Oncor Electric Delivery Company LLC | | | 7.50 | | | | 9-1-2038 | | | | 140,000 | | | | 211,113 | |
PacifiCorp | | | 3.60 | | | | 4-1-2024 | | | | 175,000 | | | | 185,741 | |
PacifiCorp | | | 4.10 | | | | 2-1-2042 | | | | 70,000 | | | | 74,704 | |
PacifiCorp | | | 5.75 | | | | 4-1-2037 | | | | 175,000 | | | | 224,154 | |
PECO Energy Company | | | 2.38 | | | | 9-15-2022 | | | | 300,000 | | | | 302,245 | |
PECO Energy Company | | | 4.15 | | | | 10-1-2044 | | | | 245,000 | | | | 265,619 | |
Potomac Electric Power Company | | | 3.60 | | | | 3-15-2024 | | | | 175,000 | | | | 185,700 | |
Potomac Electric Power Company | | | 6.50 | | | | 11-15-2037 | | | | 140,000 | | | | 193,443 | |
PPL Capital Funding Incorporated | | | 3.40 | | | | 6-1-2023 | | | | 350,000 | | | | 363,252 | |
PPL Capital Funding Incorporated | | | 3.95 | | | | 3-15-2024 | | | | 175,000 | | | | 185,258 | |
PPL Capital Funding Incorporated | | | 4.20 | | | | 6-15-2022 | | | | 140,000 | | | | 151,085 | |
PPL Capital Funding Incorporated | | | 4.70 | | | | 6-1-2043 | | | | 87,000 | | | | 96,662 | |
PPL Electric Utilities | | | 4.75 | | | | 7-15-2043 | | | | 105,000 | | | | 123,351 | |
PPL Electric Utilities | | | 6.25 | | | | 5-15-2039 | | | | 31,000 | | | | 42,600 | |
Progress Energy Incorporated | | | 4.10 | | | | 5-15-2042 | | | | 175,000 | | | | 187,661 | |
Progress Energy Incorporated | | | 6.00 | | | | 12-1-2039 | | | | 210,000 | | | | 270,431 | |
Progress Energy Incorporated | | | 6.30 | | | | 4-1-2038 | | | | 35,000 | | | | 47,973 | |
PSEG Power LLC | | | 5.13 | | | | 4-15-2020 | | | | 196,000 | | | | 210,685 | |
PSEG Power LLC | | | 8.63 | | | | 4-15-2031 | | | | 75,000 | | | | 99,583 | |
Public Service Company of Colorado | | | 2.25 | | | | 9-15-2022 | | | | 70,000 | | | | 70,266 | |
The accompanying notes are an integral part of these financial statements.
| | | | | | |
| Portfolio of investments—August 31, 2017 (unaudited) | | Wells Fargo Target Date Funds | | | 223 | |
INVESTMENT GRADE CORPORATE BOND PORTFOLIO
| | | | | | | | | | | | | | | | |
| Security name | | Interest rate | | | Maturity date | | | Principal | | | Value | |
| | | | |
| Electric Utilities (continued) | | | | | | | | | | | | | | | | |
Public Service Company of Colorado | | | 3.20 | % | | | 11-15-2020 | | | $ | 210,000 | | | $ | 217,635 | |
Public Service Company of Colorado | | | 3.60 | | | | 9-15-2042 | | | | 140,000 | | | | 139,988 | |
Public Service Company of Colorado | | | 4.30 | | | | 3-15-2044 | | | | 175,000 | | | | 193,754 | |
Public Service Company of Colorado | | | 5.13 | | | | 6-1-2019 | | | | 145,000 | | | | 153,351 | |
Public Service Company of New Hampshire | | | 3.50 | | | | 11-1-2023 | | | | 210,000 | | | | 222,120 | |
Public Service Electric & Gas Company | | | 2.38 | | | | 5-15-2023 | | | | 140,000 | | | | 140,075 | |
Public Service Electric & Gas Company | | | 3.65 | | | | 9-1-2042 | | | | 175,000 | | | | 177,183 | |
Public Service Electric & Gas Company | | | 3.80 | | | | 1-1-2043 | | | | 140,000 | | | | 145,607 | |
Public Service Electric & Gas Company | | | 3.95 | | | | 5-1-2042 | | | | 70,000 | | | | 74,431 | |
Public Service Electric & Gas Company | | | 5.80 | | | | 5-1-2037 | | | | 70,000 | | | | 91,775 | |
Southern California Edison Company | | | 3.88 | | | | 6-1-2021 | | | | 449,000 | | | | 477,923 | |
Southern California Edison Company | | | 3.90 | | | | 3-15-2043 | | | | 105,000 | | | | 110,846 | |
Southern California Edison Company | | | 4.05 | | | | 3-15-2042 | | | | 350,000 | | | | 376,131 | |
Southern California Edison Company | | | 5.35 | | | | 7-15-2035 | | | | 126,000 | | | | 154,161 | |
Southern California Edison Company | | | 5.50 | | | | 3-15-2040 | | | | 140,000 | | | | 178,611 | |
Southern California Edison Company | | | 6.00 | | | | 1-15-2034 | | | | 70,000 | | | | 90,479 | |
Southern California Edison Company | | | 6.05 | | | | 3-15-2039 | | | | 245,000 | | | | 329,705 | |
Southern Company | | | 2.45 | | | | 9-1-2018 | | | | 126,000 | | | | 126,859 | |
Southern Company | | | 2.75 | | | | 6-15-2020 | | | | 175,000 | | | | 178,095 | |
Southern Company | | | 2.95 | | | | 7-1-2023 | | | | 200,000 | | | | 202,375 | |
Southwestern Electric Power Company | | | 6.20 | | | | 3-15-2040 | | | | 35,000 | | | | 46,205 | |
TXU Electric Delivery Company | | | 7.25 | | | | 1-15-2033 | | | | 52,000 | | | | 73,667 | |
Union Electric Company | | | 3.90 | | | | 9-15-2042 | | | | 175,000 | | | | 184,388 | |
Union Electric Company | | | 8.45 | | | | 3-15-2039 | | | | 56,000 | | | | 91,145 | |
Virginia Electric & Power Company | | | 3.10 | | | | 5-15-2025 | | | | 70,000 | | | | 71,212 | |
Virginia Electric & Power Company | | | 3.45 | | | | 2-15-2024 | | | | 105,000 | | | | 109,793 | |
Virginia Electric & Power Company | | | 4.00 | | | | 1-15-2043 | | | | 227,000 | | | | 237,458 | |
Virginia Electric & Power Company | | | 4.00 | | | | 11-15-2046 | | | | 270,000 | | | | 284,442 | |
Virginia Electric & Power Company | | | 4.20 | | | | 5-15-2045 | | | | 105,000 | | | | 113,817 | |
Virginia Electric & Power Company | | | 4.45 | | | | 2-15-2044 | | | | 105,000 | | | | 117,010 | |
Virginia Electric & Power Company | | | 5.00 | | | | 6-30-2019 | | | | 140,000 | | | | 147,925 | |
Virginia Electric & Power Company | | | 6.00 | | | | 1-15-2036 | | | | 70,000 | | | | 91,620 | |
Virginia Electric & Power Company | | | 8.88 | | | | 11-15-2038 | | | | 210,000 | | | | 358,421 | |
Westar Energy Incorporated | | | 4.10 | | | | 4-1-2043 | | | | 210,000 | | | | 224,520 | |
Westar Energy Incorporated | | | 4.13 | | | | 3-1-2042 | | | | 350,000 | | | | 374,449 | |
Wisconsin Electric Power Company | | | 5.63 | | | | 5-15-2033 | | | | 70,000 | | | | 85,142 | |
Wisconsin Electric Power Company | | | 5.70 | | | | 12-1-2036 | | | | 105,000 | | | | 132,576 | |
Wisconsin Power & Light Company | | | 6.38 | | | | 8-15-2037 | | | | 175,000 | | | | 238,567 | |
| |
| | | | 27,627,299 | |
| | | | | | | | | | | | | | | | |
| | | | |
| Gas Utilities: 0.38% | | | | | | | | | | | | | | | | |
Atmos Energy Corporation | | | 4.13 | | | | 10-15-2044 | | | | 245,000 | | | | 263,677 | |
Atmos Energy Corporation | | | 4.15 | | | | 1-15-2043 | | | | 113,000 | | | | 121,481 | |
Atmos Energy Corporation | | | 5.50 | | | | 6-15-2041 | | | | 42,000 | | | | 52,134 | |
Atmos Energy Corporation | | | 8.50 | | | | 3-15-2019 | | | | 175,000 | | | | 192,460 | |
CenterPoint Energy Resources Corporation | | | 4.50 | | | | 1-15-2021 | | | | 45,000 | | | | 47,695 | |
CenterPoint Energy Resources Corporation | | | 5.85 | | | | 1-15-2041 | | | | 77,000 | | | | 96,225 | |
National Fuel Gas Company | | | 3.75 | | | | 3-1-2023 | | | | 218,000 | | | | 223,807 | |
One Gas Incorporated | | | 2.07 | | | | 2-1-2019 | | | | 70,000 | | | | 70,231 | |
One Gas Incorporated | | | 3.61 | | | | 2-1-2024 | | | | 70,000 | | | | 73,979 | |
The accompanying notes are an integral part of these financial statements.
| | | | |
| 224 | | Wells Fargo Target Date Funds | | Portfolio of investments—August 31, 2017 (unaudited) |
INVESTMENT GRADE CORPORATE BOND PORTFOLIO
| | | | | | | | | | | | | | | | |
| Security name | | Interest rate | | | Maturity date | | | Principal | | | Value | |
| | | | |
| Gas Utilities (continued) | | | | | | | | | | | | | | | | |
One Gas Incorporated | | | 4.66 | % | | | 2-1-2044 | | | $ | 35,000 | | | $ | 39,762 | |
Piedmont Natural Gas Company | | | 4.65 | | | | 8-1-2043 | | | | 35,000 | | | | 39,257 | |
Sempra Energy | | | 2.88 | | | | 10-1-2022 | | | | 140,000 | | | | 141,665 | |
Sempra Energy | | | 6.00 | | | | 10-15-2039 | | | | 520,000 | | | | 671,220 | |
Southern California Gas Company | | | 3.75 | | | | 9-15-2042 | | | | 140,000 | | | | 145,354 | |
Southern California Gas Company | | | 5.13 | | | | 11-15-2040 | | | | 70,000 | | | | 84,778 | |
| |
| | | | 2,263,725 | |
| | | | | | | | | | | | | | | | |
| | | | |
| Independent Power & Renewable Electricity Producers: 0.07% | | | | | | | | | | | | | | | | |
Constellation Energy Group Incorporated | | | 5.15 | | | | 12-1-2020 | | | | 70,000 | | | | 75,924 | |
Southern Power Company | | | 5.25 | | | | 7-15-2043 | | | | 314,000 | | | | 349,317 | |
| |
| | | | 425,241 | |
| | | | | | | | | | | | | | | | |
| | | | |
| Multi-Utilities: 1.26% | | | | | | | | | | | | | | | | |
Berkshire Hathaway Energy | | | 2.00 | | | | 11-15-2018 | | | | 175,000 | | | | 175,643 | |
Berkshire Hathaway Energy | | | 3.75 | | | | 11-15-2023 | | | | 350,000 | | | | 372,303 | |
Berkshire Hathaway Energy | | | 5.15 | | | | 11-15-2043 | | | | 280,000 | | | | 335,694 | |
Black Hills Corporation | | | 4.25 | | | | 11-30-2023 | | | | 210,000 | | | | 226,004 | |
CMS Energy Corporation | | | 5.05 | | | | 3-15-2022 | | | | 245,000 | | | | 271,675 | |
Consumers Energy Company | | | 3.95 | | | | 5-15-2043 | | | | 140,000 | | | | 148,253 | |
Consumers Energy Company | | | 6.70 | | | | 9-15-2019 | | | | 100,000 | | | | 109,658 | |
Dominion Resources Incorporated | | | 2.50 | | | | 12-1-2019 | | | | 132,000 | | | | 133,546 | |
Dominion Resources Incorporated | | | 2.75 | | | | 9-15-2022 | | | | 210,000 | | | | 211,817 | |
Dominion Resources Incorporated | | | 3.63 | | | | 12-1-2024 | | | | 210,000 | | | | 219,250 | |
Dominion Resources Incorporated | | | 4.05 | | | | 9-15-2042 | | | | 175,000 | | | | 175,097 | |
Dominion Resources Incorporated | | | 4.45 | | | | 3-15-2021 | | | | 70,000 | | | | 75,323 | |
Dominion Resources Incorporated | | | 4.70 | | | | 12-1-2044 | | | | 175,000 | | | | 193,610 | |
Dominion Resources Incorporated | | | 4.90 | | | | 8-1-2041 | | | | 42,000 | | | | 47,201 | |
Dominion Resources Incorporated | | | 5.95 | | | | 6-15-2035 | | | | 157,000 | | | | 196,969 | |
DTE Energy Company | | | 2.40 | | | | 12-1-2019 | | | | 210,000 | | | | 211,669 | |
DTE Energy Company | | | 3.30 | | | | 6-15-2022 | | | | 70,000 | | | | 72,135 | |
DTE Energy Company | | | 3.85 | | | | 12-1-2023 | | | | 170,000 | | | | 179,689 | |
Eversource Energy | | | 4.50 | | | | 11-15-2019 | | | | 70,000 | | | | 73,691 | |
Pacific Gas & Electric Company | | | 2.45 | | | | 8-15-2022 | | | | 175,000 | | | | 175,892 | |
Pacific Gas & Electric Company | | | 2.95 | | | | 3-1-2026 | | | | 350,000 | | | | 352,834 | |
Pacific Gas & Electric Company | | | 3.40 | | | | 8-15-2024 | | | | 205,000 | | | | 214,684 | |
Pacific Gas & Electric Company | | | 3.50 | | | | 6-15-2025 | | | | 105,000 | | | | 109,907 | |
Pacific Gas & Electric Company | | | 3.75 | | | | 8-15-2042 | | | | 140,000 | | | | 139,225 | |
Pacific Gas & Electric Company | | | 4.30 | | | | 3-15-2045 | | | | 140,000 | | | | 153,530 | |
Pacific Gas & Electric Company | | | 5.40 | | | | 1-15-2040 | | | | 310,000 | | | | 382,387 | |
Pacific Gas & Electric Company | | | 6.35 | | | | 2-15-2038 | | | | 70,000 | | | | 95,014 | |
Pacific Gas & Electric Company | | | 8.25 | | | | 10-15-2018 | | | | 175,000 | | | | 187,335 | |
Pacific Gas & Electric Corporation | | | 5.13 | | | | 11-15-2043 | | | | 175,000 | | | | 213,206 | |
Puget Energy Incorporated | | | 3.65 | | | | 5-15-2025 | | | | 140,000 | | | | 144,042 | |
Puget Energy Incorporated | | | 6.00 | | | | 9-1-2021 | | | | 175,000 | | | | 197,602 | |
Puget Sound Energy Incorporated | | | 5.80 | | | | 3-15-2040 | | | | 35,000 | | | | 45,539 | |
Puget Sound Energy Incorporated | | | 6.27 | | | | 3-15-2037 | | | | 231,000 | | | | 308,096 | |
San Diego Gas & Electric Company | | | 3.00 | | | | 8-15-2021 | | | | 300,000 | | | | 311,014 | |
San Diego Gas & Electric Company | | | 6.00 | | | | 6-1-2039 | | | | 371,000 | | | | 495,576 | |
The accompanying notes are an integral part of these financial statements.
| | | | | | |
| Portfolio of investments—August 31, 2017 (unaudited) | | Wells Fargo Target Date Funds | | | 225 | |
INVESTMENT GRADE CORPORATE BOND PORTFOLIO
| | | | | | | | | | | | | | | | |
| Security name | | Interest rate | | | Maturity date | | | Principal | | | Value | |
| | | | |
| Multi-Utilities (continued) | | | | | | | | | | | | | | | | |
Scana Corporation | | | 4.75 | % | | | 5-15-2021 | | | $ | 175,000 | | | $ | 185,319 | |
WEC Energy Group Incorporated | | | 2.45 | | | | 6-15-2020 | | | | 105,000 | | | | 106,332 | |
WEC Energy Group Incorporated | | | 3.55 | | | | 6-15-2025 | | | | 140,000 | | | | 146,214 | |
Xcel Energy Incorporated | | | 4.70 | | | | 5-15-2020 | | | | 175,000 | | | | 185,413 | |
| |
| | | | 7,578,388 | |
| | | | | | | | | | | | | | | | |
| | | | |
| Water Utilities: 0.04% | | | | | | | | | | | | | | | | |
American Water Capital Corporation | | | 3.40 | | | | 3-1-2025 | | | | 210,000 | | | | 219,651 | |
| | | | | | | | | | | | | | | | |
| |
Total Corporate Bonds and Notes (Cost $434,097,252) | | | | 454,996,492 | |
| | | | | | | | | | | | | | | | |
| | | | |
Yankee Corporate Bonds and Notes: 19.56% | | | | | | | | | | | | | | | | |
| | | | |
Consumer Discretionary: 0.14% | | | | | | | | | | | | | | | | |
| | | | |
| Auto Components: 0.03% | | | | | | | | | | | | | | | | |
Magna International Incorporated | | | 4.15 | | | | 10-1-2025 | | | | 175,000 | | | | 188,397 | |
| | | | | | | | | | | | | | | | |
| | | | |
| Media: 0.11% | | | | | | | | | | | | | | | | |
WPP Finance 2010 | | | 3.63 | | | | 9-7-2022 | | | | 245,000 | | | | 255,598 | |
WPP Finance 2010 | | | 3.75 | | | | 9-19-2024 | | | | 200,000 | | | | 206,336 | |
WPP Finance 2010 | | | 5.63 | | | | 11-15-2043 | | | | 140,000 | | | | 161,809 | |
| |
| | | | 623,743 | |
| | | | | | | | | | | | | | | | |
| | | | |
Consumer Staples: 0.24% | | | | | | | | | | | | | | | | |
| | | | |
| Beverages: 0.24% | | | | | | | | | | | | | | | | |
Coca-Cola Femsa SAB de CV | | | 3.88 | | | | 11-26-2023 | | | | 300,000 | | | | 320,060 | |
Coca-Cola Femsa SAB de CV | | | 4.63 | | | | 2-15-2020 | | | | 200,000 | | | | 212,777 | |
Diageo Capital plc | | | 2.63 | | | | 4-29-2023 | | | | 210,000 | | | | 214,063 | |
Diageo Capital plc | | | 3.88 | | | | 4-29-2043 | | | | 161,000 | | | | 166,315 | |
Diageo Capital plc | | | 5.88 | | | | 9-30-2036 | | | | 122,000 | | | | 159,152 | |
Fomento Economico Mexicano SAB de CV | | | 2.88 | | | | 5-10-2023 | | | | 200,000 | | | | 201,083 | |
Fomento Economico Mexicano SAB de CV | | | 4.38 | | | | 5-10-2043 | | | | 150,000 | | | | 153,268 | |
| |
| | | | 1,426,718 | |
| | | | | | | | | | | | | | | | |
| | | | |
Energy: 2.16% | | | | | | | | | | | | | | | | |
| | | | |
| Oil, Gas & Consumable Fuels: 2.16% | | | | | | | | | | | | | | | | |
BP Capital Markets plc | | | 2.24 | | | | 5-10-2019 | | | | 280,000 | | | | 282,444 | |
BP Capital Markets plc | | | 2.52 | | | | 1-15-2020 | | | | 700,000 | | | | 712,259 | |
BP Capital Markets plc | | | 3.25 | | | | 5-6-2022 | | | | 525,000 | | | | 546,435 | |
BP Capital Markets plc | | | 3.81 | | | | 2-10-2024 | | | | 350,000 | | | | 372,380 | |
BP Capital Markets plc | | | 4.50 | | | | 10-1-2020 | | | | 350,000 | | | | 376,752 | |
BP Capital Markets plc | | | 4.75 | | | | 3-10-2019 | | | | 315,000 | | | | 329,490 | |
Canadian National Resources Limited | | | 6.75 | | | | 2-1-2039 | | | | 110,000 | | | | 134,207 | |
Canadian Natural Resources Limited | | | 3.90 | | | | 2-1-2025 | | | | 210,000 | | | | 215,368 | |
Canadian Natural Resources Limited | | | 6.25 | | | | 3-15-2038 | | | | 1,150,000 | | | | 1,353,115 | |
Cenovus Energy Incorporated | | | 3.00 | | | | 8-15-2022 | | | | 145,000 | | | | 139,716 | |
Cenovus Energy Incorporated 144A | | | 4.25 | | | | 4-15-2027 | | | | 800,000 | | | | 772,225 | |
Cenovus Energy Incorporated | | | 4.45 | | | | 9-15-2042 | | | | 320,000 | | | | 267,950 | |
Cenovus Energy Incorporated | | | 5.70 | | | | 10-15-2019 | | | | 200,000 | | | | 210,220 | |
The accompanying notes are an integral part of these financial statements.
| | | | |
| 226 | | Wells Fargo Target Date Funds | | Portfolio of investments—August 31, 2017 (unaudited) |
INVESTMENT GRADE CORPORATE BOND PORTFOLIO
| | | | | | | | | | | | | | | | |
| Security name | | Interest rate | | | Maturity date | | | Principal | | | Value | |
| | | | |
| Oil, Gas & Consumable Fuels (continued) | | | | | | | | | | | | | | | | |
Cenovus Energy Incorporated | | | 6.75 | % | | | 11-15-2039 | | | $ | 240,000 | | | $ | 259,354 | |
Enbridge Incorporated | | | 3.50 | | | | 6-10-2024 | | | | 700,000 | | | | 711,822 | |
Husky Energy Incorporated | | | 4.00 | | | | 4-15-2024 | | | | 350,000 | | | | 359,814 | |
Husky Energy Incorporated | | | 6.80 | | | | 9-15-2037 | | | | 70,000 | | | | 87,834 | |
Husky Energy Incorporated | | | 7.25 | | | | 12-15-2019 | | | | 395,000 | | | | 438,309 | |
Petro-Canada | | | 5.95 | | | | 5-15-2035 | | | | 140,000 | | | | 169,871 | |
Suncor Energy Incorporated | | | 3.60 | | | | 12-1-2024 | | | | 420,000 | | | | 433,881 | |
Suncor Energy Incorporated | | | 5.95 | | | | 12-1-2034 | | | | 52,000 | | | | 63,391 | |
Suncor Energy Incorporated | | | 6.50 | | | | 6-15-2038 | | | | 280,000 | | | | 363,690 | |
Total Capital Canada Limited | | | 2.75 | | | | 7-15-2023 | | | | 245,000 | | | | 250,340 | |
Total Capital International SA | | | 2.13 | | | | 1-10-2019 | | | | 350,000 | | | | 352,427 | |
Total Capital International SA | | | 2.70 | | | | 1-25-2023 | | | | 385,000 | | | | 392,441 | |
Total Capital International SA | | | 2.88 | | | | 2-17-2022 | | | | 175,000 | | | | 180,040 | |
Total Capital International SA | | | 3.75 | | | | 4-10-2024 | | | | 350,000 | | | | 374,213 | |
Total Capital SA | | | 4.13 | | | | 1-28-2021 | | | | 70,000 | | | | 75,047 | |
Total Capital SA | | | 4.45 | | | | 6-24-2020 | | | | 350,000 | | | | 375,756 | |
TransCanada PipeLines Limited | | | 2.50 | | | | 8-1-2022 | | | | 640,000 | | | | 644,459 | |
TransCanada PipeLines Limited | | | 3.75 | | | | 10-16-2023 | | | | 175,000 | | | | 185,735 | |
TransCanada PipeLines Limited | | | 3.80 | | | | 10-1-2020 | | | | 210,000 | | | | 220,949 | |
TransCanada PipeLines Limited | | | 5.00 | | | | 10-16-2043 | | | | 350,000 | | | | 408,060 | |
TransCanada PipeLines Limited | | | 5.60 | | | | 3-31-2034 | | | | 70,000 | | | | 84,608 | |
TransCanada PipeLines Limited | | | 6.10 | | | | 6-1-2040 | | | | 210,000 | | | | 274,188 | |
TransCanada PipeLines Limited | | | 7.63 | | | | 1-15-2039 | | | | 350,000 | | | | 515,450 | |
| |
| | | | 12,934,240 | |
| | | | | | | | | | | | | | | | |
| | | | |
Financials: 11.11% | | | | | | | | | | | | | | | | |
| | | | |
| Banks: 9.00% | | | | | | | | | | | | | | | | |
Australia & New Zealand Banking Group Limited | | | 2.25 | | | | 6-13-2019 | | | | 700,000 | | | | 707,552 | |
Australia & New Zealand Banking Group Limited | | | 2.30 | | | | 6-1-2021 | | | | 750,000 | | | | 753,756 | |
Australia & New Zealand Banking Group Limited | | | 2.70 | | | | 11-16-2020 | | | | 1,300,000 | | | | 1,326,777 | |
Bancolombia SA | | | 5.95 | | | | 6-3-2021 | | | | 200,000 | | | | 221,500 | |
Bank of Montreal | | | 1.50 | | | | 7-18-2019 | | | | 1,600,000 | | | | 1,592,983 | |
Bank of Montreal | | | 1.90 | | | | 8-27-2021 | | | | 270,000 | | | | 268,516 | |
Bank of Montreal | | | 2.55 | | | | 11-6-2022 | | | | 700,000 | | | | 708,254 | |
Bank of Nova Scotia | | | 1.95 | | | | 1-15-2019 | | | | 525,000 | | | | 527,388 | |
Bank of Nova Scotia | | | 2.80 | | | | 7-21-2021 | | | | 1,805,000 | | | | 1,848,780 | |
Bank of Nova Scotia | | | 4.38 | | | | 1-13-2021 | | | | 350,000 | | | | 375,216 | |
Barclays plc | | | 2.75 | | | | 11-8-2019 | | | | 472,000 | | | | 477,684 | |
Barclays plc | | | 2.88 | | | | 6-8-2020 | | | | 300,000 | | | | 303,740 | |
Barclays plc | | | 3.25 | | | | 1-12-2021 | | | | 500,000 | | | | 510,982 | |
Barclays plc | | | 4.38 | | | | 1-12-2026 | | | | 800,000 | | | | 841,155 | |
Barclays plc | | | 5.20 | | | | 5-12-2026 | | | | 500,000 | | | | 534,812 | |
Barclays plc | | | 5.25 | | | | 8-17-2045 | | | | 500,000 | | | | 571,818 | |
BNP Paribas | | | 2.40 | | | | 12-12-2018 | | | | 420,000 | | | | 423,802 | |
BNP Paribas | | | 3.25 | | | | 3-3-2023 | | | | 300,000 | | | | 310,719 | |
BNP Paribas | | | 4.25 | | | | 10-15-2024 | | | | 400,000 | | | | 421,589 | |
BNP Paribas | | | 5.00 | | | | 1-15-2021 | | | | 1,105,000 | | | | 1,207,531 | |
BPCE SA | | | 2.50 | | | | 7-15-2019 | | | | 1,700,000 | | | | 1,717,932 | |
BPCE SA | | | 2.75 | | | | 12-2-2021 | | | | 330,000 | | | | 335,277 | |
The accompanying notes are an integral part of these financial statements.
| | | | | | |
| Portfolio of investments—August 31, 2017 (unaudited) | | Wells Fargo Target Date Funds | | | 227 | |
INVESTMENT GRADE CORPORATE BOND PORTFOLIO
| | | | | | | | | | | | | | | | |
| Security name | | Interest rate | | | Maturity date | | | Principal | | | Value | |
| | | | |
| Banks (continued) | | | | | | | | | | | | | | | | |
BPCE SA | | | 4.00 | % | | | 4-15-2024 | | | $ | 500,000 | | | $ | 534,472 | |
Cooperatieve Rabobank UA | | | 3.75 | | | | 7-21-2026 | | | | 780,000 | | | | 796,503 | |
Credit Suisse (New York) | | | 3.00 | | | | 10-29-2021 | | | | 700,000 | | | | 718,351 | |
Credit Suisse (New York) | | | 5.40 | | | | 1-14-2020 | | | | 300,000 | | | | 322,383 | |
Credit Suisse Group Funding (Guernsey) Limited | | | 3.45 | | | | 4-16-2021 | | | | 250,000 | | | | 258,009 | |
Credit Suisse Group Funding Limited | | | 3.75 | | | | 3-26-2025 | | | | 700,000 | | | | 717,478 | |
Credit Suisse Group Funding Limited | | | 4.55 | | | | 4-17-2026 | | | | 750,000 | | | | 806,217 | |
Credit Suisse Group Funding Limited | | | 4.88 | | | | 5-15-2045 | | | | 500,000 | | | | 558,876 | |
Deutsche Bank AG | | | 3.13 | | | | 1-13-2021 | | | | 350,000 | | | | 355,162 | |
HSBC Holdings plc | | | 3.90 | | | | 5-25-2026 | | | | 700,000 | | | | 734,600 | |
HSBC Holdings plc | | | 4.00 | | | | 3-30-2022 | | | | 200,000 | | | | 212,790 | |
HSBC Holdings plc | | | 4.88 | | | | 1-14-2022 | | | | 175,000 | | | | 192,145 | |
HSBC Holdings plc | | | 6.10 | | | | 1-14-2042 | | | | 280,000 | | | | 374,323 | |
HSBC Holdings plc | | | 6.50 | | | | 5-2-2036 | | | | 200,000 | | | | 259,227 | |
HSBC Holdings plc | | | 6.80 | | | | 6-1-2038 | | | | 245,000 | | | | 330,773 | |
Intesa Sanpaolo SpA | | | 5.25 | | | | 1-12-2024 | | | | 500,000 | | | | 555,358 | |
Lloyds Banking Group plc | | | 4.50 | | | | 11-4-2024 | | | | 3,100,000 | | | | 3,272,039 | |
Lloyds Banking Group plc | | | 4.58 | | | | 12-10-2025 | | | | 250,000 | | | | 263,343 | |
Lloyds Banking Group plc | | | 5.30 | | | | 12-1-2045 | | | | 300,000 | | | | 351,843 | |
Mitsubishi UFJ Financial Group Incorporated | | | 2.19 | | | | 9-13-2021 | | | | 700,000 | | | | 696,065 | |
Mitsubishi UFJ Financial Group Incorporated | | | 2.76 | | | | 9-13-2026 | | | | 560,000 | | | | 546,577 | |
Mitsubishi UFJ Financial Group Incorporated | | | 2.95 | | | | 3-1-2021 | | | | 612,000 | | | | 626,007 | |
Mitsubishi UFJ Financial Group Incorporated | | | 3.85 | | | | 3-1-2026 | | | | 525,000 | | | | 554,543 | |
Mizuho Financial Group | | | 2.95 | | | | 2-28-2022 | | | | 750,000 | | | | 762,654 | |
National Australia Bank Limited | | | 2.50 | | | | 7-12-2026 | | | | 1,600,000 | | | | 1,539,811 | |
National Australia Bank Limited | | | 3.00 | | | | 1-20-2023 | | | | 350,000 | | | | 358,496 | |
NIBC Bank NV | | | 4.88 | | | | 11-19-2019 | | | | 560,000 | | | | 596,063 | |
Perrigo Finance Unlimited Company | | | 4.38 | | | | 3-15-2026 | | | | 500,000 | | | | 518,938 | |
Rabobank Nederland NV | | | 3.88 | | | | 2-8-2022 | | | | 350,000 | | | | 373,600 | |
RaboBank Nederland NV | | | 4.50 | | | | 1-11-2021 | | | | 350,000 | | | | 375,879 | |
Rabobank Nederland NV | | | 4.63 | | | | 12-1-2023 | | | | 750,000 | | | | 815,368 | |
Rabobank Nederland NV | | | 5.75 | | | | 12-1-2043 | | | | 250,000 | | | | 312,630 | |
Royal Bank of Canada | | | 2.00 | | | | 12-10-2018 | | | | 250,000 | | | | 251,044 | |
Royal Bank of Canada | | | 2.15 | | | | 3-15-2019 | | | | 350,000 | | | | 353,020 | |
Royal Bank of Canada | | | 2.15 | | | | 3-6-2020 | | | | 300,000 | | | | 302,294 | |
Royal Bank of Canada | | | 2.50 | | | | 1-19-2021 | | | | 350,000 | | | | 355,465 | |
Royal Bank of Canada | | | 4.65 | | | | 1-27-2026 | | | | 1,350,000 | | | | 1,460,416 | |
Royal Bank of Scotland Group plc | | | 3.88 | | | | 9-12-2023 | | | | 200,000 | | | | 204,756 | |
Royal Bank of Scotland Group plc | | | 4.80 | | | | 4-5-2026 | | | | 3,000,000 | | | | 3,211,516 | |
Santander UK plc | | | 2.35 | | | | 9-10-2019 | | | | 240,000 | | | | 242,341 | |
Santander UK plc | | | 2.50 | | | | 3-14-2019 | | | | 1,300,000 | | | | 1,313,445 | |
Santander UK plc | | | 4.00 | | | | 3-13-2024 | | | | 525,000 | | | | 559,678 | |
Skandinaviska Enskilda | | | 2.63 | | | | 3-15-2021 | | | | 500,000 | | | | 507,771 | |
Sumitomo Mitsui Banking Corporation | | | 2.25 | | | | 7-11-2019 | | | | 750,000 | | | | 755,338 | |
Sumitomo Mitsui Banking Corporation | | | 3.95 | | | | 7-19-2023 | | | | 250,000 | | | | 267,646 | |
Sumitomo Mitsui Financial Group | | | 3.01 | | | | 10-19-2026 | | | | 655,000 | | | | 652,143 | |
Sumitomo Mitsui Financial Group | | | 3.78 | | | | 3-9-2026 | | | | 700,000 | | | | 737,737 | |
Svenska Handelsbanken AB | | | 2.50 | | | | 1-25-2019 | | | | 260,000 | | | | 262,811 | |
Svenska Handelsbanken AB | | | 1.88 | | | | 9-7-2021 | | | | 500,000 | | | | 495,389 | |
Svenska Handelsbanken AB | | | 2.25 | | | | 6-17-2019 | | | | 500,000 | | | | 504,392 | |
The accompanying notes are an integral part of these financial statements.
| | | | |
| 228 | | Wells Fargo Target Date Funds | | Portfolio of investments—August 31, 2017 (unaudited) |
INVESTMENT GRADE CORPORATE BOND PORTFOLIO
| | | | | | | | | | | | | | | | |
| Security name | | Interest rate | | | Maturity date | | | Principal | | | Value | |
| | | | |
| Banks (continued) | | | | | | | | | | | | | | | | |
Svenska Handelsbanken AB | | | 2.45 | % | | | 3-30-2021 | | | $ | 750,000 | | | $ | 759,333 | |
Toronto Dominion Bank | | | 1.80 | | | | 7-13-2021 | | | | 1,000,000 | | | | 991,686 | |
Toronto Dominion Bank | | | 2.13 | | | | 7-2-2019 | | | | 350,000 | | | | 352,734 | |
Toronto Dominion Bank | | | 2.50 | | | | 12-14-2020 | | | | 560,000 | | | | 569,395 | |
Toronto Dominion Bank | | | 2.63 | | | | 9-10-2018 | | | | 420,000 | | | | 424,465 | |
Toronto Dominion Bank (5 Year USD Swap Rate +2.21%) ± | | | 3.63 | | | | 9-15-2031 | | | | 525,000 | | | | 526,032 | |
Westpac Banking Corporation | | | 2.10 | | | | 5-13-2021 | | | | 350,000 | | | | 349,761 | |
Westpac Banking Corporation | | | 2.15 | | | | 3-6-2020 | | | | 290,000 | | | | 292,273 | |
Westpac Banking Corporation | | | 2.25 | | | | 1-17-2019 | | | | 175,000 | | | | 176,205 | |
Westpac Banking Corporation | | | 2.30 | | | | 5-26-2020 | | | | 700,000 | | | | 707,812 | |
Westpac Banking Corporation | | | 2.85 | | | | 5-13-2026 | | | | 700,000 | | | | 694,573 | |
| |
| | | | 53,959,757 | |
| | | | | | | | | | | | | | | | |
| | | | |
| Capital Markets: 0.63% | | | | | | | | | | | | | | | | |
Deutsche Bank AG (London) | | | 2.50 | | | | 2-13-2019 | | | | 350,000 | | | | 351,759 | |
Deutsche Bank AG (London) | | | 2.85 | | | | 5-10-2019 | | | | 420,000 | | | | 424,723 | |
Deutsche Bank AG (London) | | | 3.38 | | | | 5-12-2021 | | | | 420,000 | | | | 429,776 | |
Deutsche Bank AG (London) | | | 3.70 | | | | 5-30-2024 | | | | 1,500,000 | | | | 1,534,057 | |
Invesco Finance plc | | | 4.00 | | | | 1-30-2024 | | | | 175,000 | | | | 187,301 | |
Invesco Finance plc | | | 5.38 | | | | 11-30-2043 | | | | 175,000 | | | | 213,249 | |
Nomura Holdings Incorporated | | | 2.75 | | | | 3-19-2019 | | | | 350,000 | | | | 354,323 | |
Nomura Holdings Incorporated | | | 6.70 | | | | 3-4-2020 | | | | 249,000 | | | | 275,562 | |
| |
| | | | 3,770,750 | |
| | | | | | | | | | | | | | | | |
| | | | |
| Diversified Financial Services: 1.21% | | | | | | | | | | | | | | | | |
Barrick Australian Finance Proprietary Limited | | | 5.95 | | | | 10-15-2039 | | | | 135,000 | | | | 166,260 | |
BHP Billiton Finance USA Limited | | | 2.88 | | | | 2-24-2022 | | | | 1,300,000 | | | | 1,340,117 | |
BHP Billiton Finance USA Limited | | | 3.85 | | | | 9-30-2023 | | | | 200,000 | | | | 217,095 | |
BHP Billiton Finance USA Limited | | | 5.00 | | | | 9-30-2043 | | | | 350,000 | | | | 414,596 | |
Burlington Resources Finance Company | | | 7.20 | | | | 8-15-2031 | | | | 350,000 | | | | 474,398 | |
ConocoPhillips Canada Funding Company | | | 5.95 | | | | 10-15-2036 | | | | 210,000 | | | | 262,170 | |
GE Capital International Funding Company | | | 2.34 | | | | 11-15-2020 | | | | 300,000 | | | | 303,674 | |
GE Capital International Funding Company | | | 3.37 | | | | 11-15-2025 | | | | 550,000 | | | | 572,850 | |
Shell International Finance BV | | | 2.25 | | | | 1-6-2023 | | | | 175,000 | | | | 174,967 | |
Shell International Finance BV | | | 2.38 | | | | 8-21-2022 | | | | 175,000 | | | | 176,662 | |
Shell International Finance BV | | | 2.88 | | | | 5-10-2026 | | | | 230,000 | | | | 231,282 | |
Shell International Finance BV | | | 3.25 | | | | 5-11-2025 | | | | 350,000 | | | | 362,934 | |
Shell International Finance BV | | | 3.40 | | | | 8-12-2023 | | | | 175,000 | | | | 184,334 | |
Shell International Finance BV | | | 3.63 | | | | 8-21-2042 | | | | 175,000 | | | | 167,862 | |
Shell International Finance BV | | | 4.13 | | | | 5-11-2035 | | | | 350,000 | | | | 373,245 | |
Shell International Finance BV | | | 4.38 | | | | 3-25-2020 | | | | 350,000 | | | | 372,878 | |
Shell International Finance BV | | | 4.38 | | | | 5-11-2045 | | | | 350,000 | | | | 374,564 | |
Shell International Finance BV | | | 6.38 | | | | 12-15-2038 | | | | 245,000 | | | | 334,069 | |
UBS AG | | | 2.35 | | | | 3-26-2020 | | | | 500,000 | | | | 504,734 | |
UBS AG | | | 2.38 | | | | 8-14-2019 | | | | 225,000 | | | | 227,293 | |
| |
| | | | 7,235,984 | |
| | | | | | | | | | | | | | | | |
| | | | |
| Insurance: 0.27% | | | | | | | | | | | | | | | | |
AON plc | | | 4.00 | | | | 11-27-2023 | | | | 105,000 | | | | 113,046 | |
The accompanying notes are an integral part of these financial statements.
| | | | | | |
| Portfolio of investments—August 31, 2017 (unaudited) | | Wells Fargo Target Date Funds | | | 229 | |
INVESTMENT GRADE CORPORATE BOND PORTFOLIO
| | | | | | | | | | | | | | | | |
| Security name | | Interest rate | | | Maturity date | | | Principal | | | Value | |
| | | | |
| Insurance (continued) | | | | | | | | | | | | | | | | |
AON plc | | | 4.60 | % | | | 6-14-2044 | | | $ | 420,000 | | | $ | 453,962 | |
AXA SA | | | 8.60 | | | | 12-15-2030 | | | | 455,000 | | | | 658,044 | |
XLIT Limited | | | 2.30 | | | | 12-15-2018 | | | | 245,000 | | | | 246,408 | |
XLIT Limited | | | 5.25 | | | | 12-15-2043 | | | | 140,000 | | | | 160,830 | |
| |
| | | | 1,632,290 | |
| | | | | | | | | | | | | | | | |
| | | | |
Health Care: 1.60% | | | | | | | | | | | | | | | | |
| | | | |
| Health Care Equipment & Supplies: 0.06% | | | | | | | | | | | | | | | | |
Covidien International Finance SA | | | 6.55 | | | | 10-15-2037 | | | | 280,000 | | | | 380,221 | |
| | | | | | | | | | | | | | | | |
| | | | |
| Pharmaceuticals: 1.54% | | | | | | | | | | | | | | | | |
Actavis Funding SCS | | | 3.85 | | | | 6-15-2024 | | | | 350,000 | | | | 369,239 | |
Actavis Funding SCS | | | 4.75 | | | | 3-15-2045 | | | | 700,000 | | | | 765,234 | |
Actavis Funding SCS | | | 4.85 | | | | 6-15-2044 | | | | 350,000 | | | | 385,416 | |
Allergan Funding Company | | | 2.45 | | | | 6-15-2019 | | | | 310,000 | | | | 312,899 | |
AstraZeneca plc | | | 1.95 | | | | 9-18-2019 | | | | 1,000,000 | | | | 1,000,732 | |
AstraZeneca plc | | | 2.38 | | | | 11-16-2020 | | | | 350,000 | | | | 352,876 | |
AstraZeneca plc | | | 3.38 | | | | 11-16-2025 | | | | 500,000 | | | | 511,583 | |
AstraZeneca plc | | | 4.00 | | | | 9-18-2042 | | | | 385,000 | | | | 382,343 | |
AstraZeneca plc | | | 6.45 | | | | 9-15-2037 | | | | 180,000 | | | | 238,066 | |
Mylan NV | | | 3.95 | | | | 6-15-2026 | | | | 700,000 | | | | 713,124 | |
Novartis Securities Investment Limited | | | 5.13 | | | | 2-10-2019 | | | | 700,000 | | | | 734,979 | |
Sanofi Aventis | | | 4.00 | | | | 3-29-2021 | | | | 490,000 | | | | 524,196 | |
Shire Acquisitions Investment Ireland Limited | | | 2.40 | | | | 9-23-2021 | | | | 400,000 | | | | 397,131 | |
Shire Acquisitions Investments Ireland Limited | | | 1.90 | | | | 9-23-2019 | | | | 190,000 | | | | 189,430 | |
Shire plc ADR | | | 3.20 | | | | 9-23-2026 | | | | 560,000 | | | | 551,125 | |
Teva Pharmaceutical Finance BV | | | 2.20 | | | | 7-21-2021 | | | | 500,000 | | | | 475,832 | |
Teva Pharmaceutical Finance BV | | | 2.95 | | | | 12-18-2022 | | | | 350,000 | | | | 334,855 | |
Teva Pharmaceutical Finance BV | | | 3.15 | | | | 10-1-2026 | | | | 875,000 | | | | 800,685 | |
Teva Pharmaceuticals Industries Incorporated | | | 1.70 | | | | 7-19-2019 | | | | 190,000 | | | | 185,685 | |
| |
| | | | 9,225,430 | |
| | | | | | | | | | | | | | | | |
| | | | |
Industrials: 0.95% | | | | | | | | | | | | | | | | |
| | | | |
| Aerospace & Defense: 0.05% | | | | | | | | | | | | | | | | |
Embraer Netherlands Finance BV | | | 5.05 | | | | 6-15-2025 | | | | 290,000 | | | | 308,473 | |
| | | | | | | | | | | | | | | | |
| | | | |
| Industrial Conglomerates: 0.16% | | | | | | | | | | | | | | | | |
Koninklijke Philips Electronics NV | | | 3.75 | | | | 3-15-2022 | | | | 350,000 | | | | 370,784 | |
Koninklijke Philips Electronics NV | | | 6.88 | | | | 3-11-2038 | | | | 175,000 | | | | 239,580 | |
Tyco Electronics Group SA | | | 7.13 | | | | 10-1-2037 | | | | 245,000 | | | | 353,183 | |
| |
| | | | 963,547 | |
| | | | | | | | | | | | | | | | |
| | | | |
| Road & Rail: 0.29% | | | | | | | | | | | | | | | | |
Canadian National Railway Company | | | 5.55 | | | | 3-1-2019 | | | | 304,000 | | | | 321,287 | |
Canadian National Railway Company | | | 6.20 | | | | 6-1-2036 | | | | 140,000 | | | | 186,764 | |
Canadian National Railway Company | | | 6.38 | | | | 11-15-2037 | | | | 385,000 | | | | 533,753 | |
Canadian Pacific Railway Company | | | 4.45 | | | | 3-15-2023 | | | | 140,000 | | | | 152,911 | |
Canadian Pacific Railway Company | | | 5.95 | | | | 5-15-2037 | | | | 45,000 | | | | 57,128 | |
Canadian Pacific Railway Company | | | 6.13 | | | | 9-15-2115 | | | | 350,000 | | | | 447,187 | |
The accompanying notes are an integral part of these financial statements.
| | | | |
| 230 | | Wells Fargo Target Date Funds | | Portfolio of investments—August 31, 2017 (unaudited) |
INVESTMENT GRADE CORPORATE BOND PORTFOLIO
| | | | | | | | | | | | | | | | |
| Security name | | Interest rate | | | Maturity date | | | Principal | | | Value | |
| | | | |
| Road & Rail (continued) | | | | | | | | | | | | | | | | |
Canadian Pacific Railway Company | | | 7.25 | % | | | 5-15-2019 | | | $ | 45,000 | | | $ | 48,878 | |
| |
| | | | 1,747,908 | |
| | | | | | | | | | | | | | | | |
| | | | |
| Trading Companies & Distributors: 0.45% | | | | | | | | | | | | | | | | |
AerCap Ireland Capital Limited | | | 3.75 | | | | 5-15-2019 | | | | 577,000 | | | | 591,953 | |
AerCap Ireland Capital Limited | | | 3.95 | | | | 2-1-2022 | | | | 520,000 | | | | 542,436 | |
AerCap Ireland Capital Limited | | | 4.50 | | | | 5-15-2021 | | | | 795,000 | | | | 844,957 | |
AerCap Ireland Capital Limited | | | 4.63 | | | | 10-30-2020 | | | | 665,000 | | | | 708,853 | |
| |
| | | | 2,688,199 | |
| | | | | | | | | | | | | | | | |
| | | | |
Information Technology: 0.22% | | | | | | | | | | | | | | | | |
| | | | |
| Internet Software & Services: 0.16% | | | | | | | | | | | | | | | | |
Alibaba Group Holding Company | | | 3.13 | | | | 11-28-2021 | | | | 250,000 | | | | 257,151 | |
Alibaba Group Holding Limited | | | 3.60 | | | | 11-28-2024 | | | | 200,000 | | | | 209,171 | |
Baidu Incorporated | | | 2.75 | | | | 6-9-2019 | | | | 525,000 | | | | 529,676 | |
| |
| | | | 995,998 | |
| | | | | | | | | | | | | | | | |
| | | | |
| Technology Hardware, Storage & Peripherals: 0.06% | | | | | | | | | | | | | | | | |
Seagate HDD Cayman | | | 4.75 | | | | 1-1-2025 | | | | 350,000 | | | | 341,029 | |
| |
| | | | 341,029 | |
| | | | | | | | | | | | | | | | |
| | | | |
Materials: 1.39% | | | | | | | | | | | | | | | | |
| | | | |
| Chemicals: 0.52% | | | | | | | | | | | | | | | | |
Agrium Incorporated | | | 3.50 | | | | 6-1-2023 | | | | 210,000 | | | | 217,571 | |
Agrium Incorporated | | | 4.90 | | | | 6-1-2043 | | | | 140,000 | | | | 154,573 | |
Agrium Incorporated | | | 6.13 | | | | 1-15-2041 | | | | 115,000 | | | | 141,977 | |
Agrium Incorporated | | | 6.75 | | | | 1-15-2019 | | | | 210,000 | | | | 222,929 | |
LYB International Finance BV | | | 4.00 | | | | 7-15-2023 | | | | 700,000 | | | | 744,914 | |
LyondellBasell Industries NV | | | 4.63 | | | | 2-26-2055 | | | | 350,000 | | | | 353,775 | |
LyondellBasell Industries NV | | | 5.00 | | | | 4-15-2019 | | | | 400,000 | | | | 416,389 | |
LyondellBasell Industries NV | | | 5.75 | | | | 4-15-2024 | | | | 250,000 | | | | 287,740 | |
Potash Corporation of Saskatchewan Incorporated | | | 4.88 | | | | 3-30-2020 | | | | 178,000 | | | | 188,747 | |
Potash Corporation of Saskatchewan Incorporated | | | 5.63 | | | | 12-1-2040 | | | | 140,000 | | | | 167,278 | |
Potash Corporation of Saskatchewan Incorporated | | | 5.88 | | | | 12-1-2036 | | | | 157,000 | | | | 189,243 | |
Potash Corporation of Saskatchewan Incorporated | | | 6.50 | | | | 5-15-2019 | | | | 45,000 | | | | 48,175 | |
| |
| | | | 3,133,311 | |
| | | | | | | | | | | | | | | | |
| | | | |
| Metals & Mining: 0.76% | | | | | | | | | | | | | | | | |
Barrick Gold Corporation | | | 4.10 | | | | 5-1-2023 | | | | 154,000 | | | | 169,333 | |
Goldcorp Incorporated | | | 3.70 | | | | 3-15-2023 | | | | 210,000 | | | | 219,080 | |
Rio Tinto Finance (USA) Limited | | | 2.88 | | | | 8-21-2022 | | | | 8,000 | | | | 8,199 | |
Rio Tinto Finance (USA) Limited | | | 4.13 | | | | 8-21-2042 | | | | 175,000 | | | | 183,726 | |
Rio Tinto Finance (USA) Limited | | | 4.75 | | | | 3-22-2042 | | | | 875,000 | | | | 1,008,812 | |
Rio Tinto Finance (USA) Limited | | | 5.20 | | | | 11-2-2040 | | | | 330,000 | | | | 399,580 | |
Rio Tinto Finance (USA) Limited | | | 7.13 | | | | 7-15-2028 | | | | 350,000 | | | | 473,343 | |
Vale Overseas Limited | | | 4.38 | | | | 1-11-2022 | | | | 140,000 | | | | 147,770 | |
Vale Overseas Limited | | | 4.63 | | | | 9-15-2020 | | | | 210,000 | | | | 222,863 | |
Vale Overseas Limited | | | 6.88 | | | | 11-21-2036 | | | | 382,000 | | | | 436,817 | |
The accompanying notes are an integral part of these financial statements.
| | | | | | |
| Portfolio of investments—August 31, 2017 (unaudited) | | Wells Fargo Target Date Funds | | | 231 | |
INVESTMENT GRADE CORPORATE BOND PORTFOLIO
| | | | | | | | | | | | | | | | |
| Security name | | Interest rate | | | Maturity date | | | Principal | | | Value | |
| | | | |
| Metals & Mining (continued) | | | | | | | | | | | | | | | | |
Vale Overseas Limited | | | 6.88 | % | | | 11-10-2039 | | | $ | 91,000 | | | $ | 103,740 | |
Vale Overseas Limited | | | 8.25 | | | | 1-17-2034 | | | | 540,000 | | | | 674,347 | |
Vale SA | | | 5.63 | | | | 9-11-2042 | | | | 525,000 | | | | 534,187 | |
| |
| | | | 4,581,797 | |
| | | | | | | | | | | | | | | | |
| | | | |
| Paper & Forest Products: 0.11% | | | | | | | | | | | | | | | | |
Celulosa Arauco y Constitucion SA | | | 4.75 | | | | 1-11-2022 | | | | 350,000 | | | | 371,242 | |
Celulosa Arauco y Constitucion SA | | | 7.25 | | | | 7-29-2019 | | | | 245,000 | | | | 267,640 | |
| |
| | | | 638,882 | |
| | | | | | | | | | | | | | | | |
| | | | |
Telecommunication Services: 1.75% | | | | | | | | | | | | | | | | |
| | | | |
| Diversified Telecommunication Services: 1.02% | | | | | | | | | | | | | | | | |
British Telecommunications plc | | | 9.13 | | | | 12-15-2030 | | | | 455,000 | | | | 704,019 | |
Deutsche Telekom International Finance BV | | | 6.00 | | | | 7-8-2019 | | | | 350,000 | | | | 375,307 | |
Deutsche Telekom International Finance BV | | | 9.25 | | | | 6-1-2032 | | | | 350,000 | | | | 557,929 | |
France Telecom SA | | | 5.38 | | | | 7-8-2019 | | | | 420,000 | | | | 446,282 | |
France Telecom SA | | | 5.38 | | | | 1-13-2042 | | | | 350,000 | | | | 416,567 | |
Orange SA | | | 2.75 | | | | 2-6-2019 | | | | 350,000 | | | | 354,752 | |
Orange SA | | | 9.00 | | | | 3-1-2031 | | | | 427,000 | | | | 654,209 | |
Telefonica Emisiones SAU | | | 4.10 | | | | 3-8-2027 | | | | 750,000 | | | | 783,650 | |
Telefonica Emisiones SAU | | | 4.57 | | | | 4-27-2023 | | | | 300,000 | | | | 330,105 | |
Telefonica Emisiones SAU | | | 5.13 | | | | 4-27-2020 | | | | 511,000 | | | | 549,996 | |
Telefonica Emisiones SAU | | | 5.21 | | | | 3-8-2047 | | | | 500,000 | | | | 556,034 | |
Telefonica Europe BV | | | 8.25 | | | | 9-15-2030 | | | | 294,000 | | | | 419,106 | |
| |
| | | | 6,147,956 | |
| | | | | | | | | | | | | | | | |
| | | | |
| Wireless Telecommunication Services: 0.73% | | | | | | | | | | | | | | | | |
America Movil SAB de CV | | | 3.13 | | | | 7-16-2022 | | | | 220,000 | | | | 227,931 | |
America Movil SAB de CV | | | 4.38 | | | | 7-16-2042 | | | | 250,000 | | | | 259,134 | |
America Movil SAB de CV | | | 5.00 | | | | 3-30-2020 | | | | 700,000 | | | | 753,872 | |
America Movil SAB de CV | | | 6.13 | | | | 11-15-2037 | | | | 70,000 | | | | 86,056 | |
America Movil SAB de CV | | | 6.38 | | | | 3-1-2035 | | | | 395,000 | | | | 500,947 | |
Rogers Communications Incorporated | | | 3.00 | | | | 3-15-2023 | | | | 140,000 | | | | 142,438 | |
Rogers Communications Incorporated | | | 4.50 | | | | 3-15-2043 | | | | 140,000 | | | | 148,372 | |
Rogers Communications Incorporated | | | 5.00 | | | | 3-15-2044 | | | | 470,000 | | | | 540,227 | |
Vodafone Group plc | | | 2.50 | | | | 9-26-2022 | | | | 350,000 | | | | 353,199 | |
Vodafone Group plc | | | 2.95 | | | | 2-19-2023 | | | | 190,000 | | | | 193,683 | |
Vodafone Group plc | | | 4.38 | | | | 2-19-2043 | | | | 350,000 | | | | 355,852 | |
Vodafone Group plc | | | 5.45 | | | | 6-10-2019 | | | | 280,000 | | | | 296,941 | |
Vodafone Group plc | | | 6.25 | | | | 11-30-2032 | | | | 210,000 | | | | 260,419 | |
Vodafone Group plc | | | 7.88 | | | | 2-15-2030 | | | | 175,000 | | | | 238,830 | |
| |
| | | | 4,357,901 | |
| | | | | | | | | | | | | | | | |
| |
Total Yankee Corporate Bonds and Notes (Cost $113,003,284) | | | | 117,282,531 | |
| | | | | | | | | | | | | | | | |
The accompanying notes are an integral part of these financial statements.
| | | | |
| 232 | | Wells Fargo Target Date Funds | | Portfolio of investments—August 31, 2017 (unaudited) |
INVESTMENT GRADE CORPORATE BOND PORTFOLIO
| | | | | | | | | | | | | | | | |
| Security name | | Yield | | | | | | Shares | | | Value | |
| | | | |
Short-Term Investments: 0.44% | | | | | | | | | | | | | | | | |
| | | | |
| Investment Companies: 0.44% | | | | | | | | | | | | | | | | |
Wells Fargo Government Money Market Fund Select Class (l)(u) | | | 0.92 | % | | | | | | | 2,648,131 | | | $ | 2,648,131 | |
| | | | | | | | | | | | | | | | |
| |
Total Short-Term Investments (Cost $2,648,131) | | | | 2,648,131 | |
| | | | | | | | | | | | | | | | |
| | | | | | | | |
| Total investments in securities (Cost $549,748,667) * | | | 95.90 | % | | | 574,927,154 | |
Other assets and liabilities, net | | | 4.10 | | | | 24,557,349 | |
| | | | | | | | |
| Total net assets | | | 100.00 | % | | $ | 599,484,503 | |
| | | | | | | | |
| ± | Variable rate investment. The rate shown is the rate in effect at period end. |
| 144A | The security may be resold in transactions exempt from registration, normally to qualified institutional buyers, pursuant to Rule 144A under the Securities Act of 1933. |
| (l) | The issuer of the security is an affiliated person of the Portfolio as defined in the Investment Company Act of 1940. |
| (u) | The rate represents the 7-day annualized yield at period end. |
Investments In Affiliates
An affiliated investment is an investment in which the Portfolio owns at least 5% of the outstanding voting shares of the issuer or as a result of other relationships, such as the Portfolio and the issuer having the same investment manager. Transactions with issuers that were either affiliated persons of the Portfolio at the beginning of the period or the end of the period were as follows:
| | | | | | | | | | | | | | | | | | | | | | | | | | | | | | | | |
| | | Shares,
beginning of
period | | | Shares
purchased | | | Shares sold | | | Shares,
end of
period | | | Net
realized
gains
(losses) | | | Net change
in
unrealized
gains
(losses) | | | Income
from
affiliated
securities | | | Value,
end
of period | |
Investment companies - 0.44% | | | | | | | | | | | | | | | | | | | | | | | | | | | | | | | | |
Wells Fargo Government Money Market Fund Select Class | | | 0 | | | | 94,644,796 | | | | 91,996,665 | | | | 2,648,131 | | | $ | 0 | | | $ | 0 | | | $ | 11,991 | | | $ | 2,648,131 | |
The accompanying notes are an integral part of these financial statements.
| | | | | | |
| Portfolio of investments—August 31, 2017 (unaudited) | | Wells Fargo Target Date Funds | | | 233 | |
STRATEGIC RETIREMENT BOND PORTFOLIO
| | | | | | | | | | | | | | | | |
| Security name | | Interest rate | | | Maturity date | | | Principal | | | Value | |
| | | | |
Agency Securities: 1.89% | | | | | | | | | | | | | | | | |
FHLMC ¤ | | | 0.00 | % | | | 11-29-2019 | | | $ | 155,000 | | | $ | 149,212 | |
FHLMC | | | 1.38 | | | | 2-28-2019 | | | | 550,000 | | | | 549,650 | |
FHLMC | | | 2.05 | | | | 7-13-2021 | | | | 55,000 | | | | 55,012 | |
FHLMC | | | 2.13 | | | | 6-9-2023 | | | | 35,000 | | | | 35,492 | |
FHLMC | | | 3.00 | | | | 9-10-2021 | | | | 125,000 | | | | 131,452 | |
FHLMC | | | 3.25 | | | | 6-9-2023 | | | | 370,000 | | | | 396,397 | |
FNMA ¤ | | | 0.00 | | | | 10-9-2019 | | | | 480,000 | | | | 463,032 | |
FNMA | | | 1.38 | | | | 5-1-2020 | | | | 390,000 | | | | 389,520 | |
FNMA | | | 1.38 | | | | 10-7-2021 | | | | 45,000 | | | | 44,443 | |
FNMA | | | 1.50 | | | | 6-22-2020 | | | | 33,000 | | | | 33,053 | |
FNMA | | | 1.50 | | | | 11-30-2020 | | | | 234,000 | | | | 233,417 | |
FNMA | | | 2.13 | | | | 4-24-2026 | | | | 353,000 | | | | 350,034 | |
| |
Total Agency Securities (Cost $2,820,974) | | | | 2,830,714 | |
| | | | | | | | | | | | | | | | |
| | | | |
U.S. Treasury Securities: 95.09% | | | | | | | | | | | | | | | | |
TIPS | | | 0.13 | | | | 4-15-2019 | | | | 3,102,628 | | | | 3,108,809 | |
TIPS | | | 0.13 | | | | 4-15-2020 | | | | 5,096,015 | | | | 5,121,751 | |
TIPS | | | 0.13 | | | | 4-15-2021 | | | | 3,341,306 | | | | 3,356,968 | |
TIPS | | | 0.13 | | | | 1-15-2022 | | | | 4,150,390 | | | | 4,174,761 | |
TIPS | | | 0.13 | | | | 4-15-2022 | | | | 1,851,252 | | | | 1,857,065 | |
TIPS | | | 0.13 | | | | 7-15-2022 | | | | 4,274,487 | | | | 4,308,905 | |
TIPS | | | 0.13 | | | | 1-15-2023 | | | | 4,302,105 | | | | 4,309,196 | |
TIPS | | | 0.13 | | | | 7-15-2024 | | | | 2,948,284 | | | | 2,937,295 | |
TIPS | | | 0.13 | | | | 7-15-2026 | | | | 3,629,753 | | | | 3,565,505 | |
TIPS | | | 0.25 | | | | 1-15-2025 | | | | 3,278,319 | | | | 3,269,729 | |
TIPS | | | 0.38 | | | | 7-15-2023 | | | | 2,558,749 | | | | 2,604,769 | |
TIPS | | | 0.38 | | | | 7-15-2025 | | | | 3,945,716 | | | | 3,979,110 | |
TIPS | | | 0.38 | | | | 1-15-2027 | | | | 3,229,674 | | | | 3,225,832 | |
TIPS | | | 0.38 | | | | 7-15-2027 | | | | 1,001,350 | | | | 1,003,235 | |
TIPS | | | 0.63 | | | | 7-15-2021 | | | | 1,987,767 | | | | 2,047,746 | |
TIPS | | | 0.63 | | | | 1-15-2024 | | | | 4,252,699 | | | | 4,368,779 | |
TIPS | | | 0.63 | | | | 1-15-2026 | | | | 3,822,503 | | | | 3,910,433 | |
TIPS | | | 1.13 | | | | 1-15-2021 | | | | 3,561,925 | | | | 3,711,250 | |
TIPS | | | 1.25 | | | | 7-15-2020 | | | | 3,206,650 | | | | 3,345,970 | |
TIPS | | | 1.38 | | | | 1-15-2020 | | | | 1,534,831 | | | | 1,591,257 | |
TIPS | | | 1.88 | | | | 7-15-2019 | | | | 1,894,027 | | | | 1,972,295 | |
TIPS | | | 2.13 | | | | 1-15-2019 | | | | 1,141 | | | | 1,176 | |
TIPS | | | 2.38 | | | | 1-15-2025 | | | | 2,857,557 | | | | 3,292,761 | |
TIPS | | | 2.38 | | | | 1-15-2027 | | | | 1,260,786 | | | | 1,490,426 | |
U.S. Treasury Bond | | | 6.88 | | | | 8-15-2025 | | | | 20,000 | | | | 27,221 | |
U.S. Treasury Note | | | 0.75 | | | | 9-30-2018 | | | | 44,000 | | | | 43,756 | |
U.S. Treasury Note | | | 0.75 | | | | 10-31-2018 | | | | 18,000 | | | | 17,893 | |
U.S. Treasury Note | | | 0.88 | | | | 10-15-2018 | | | | 300,000 | | | | 298,734 | |
U.S. Treasury Note | | | 0.88 | | | | 4-15-2019 | | | | 690,000 | | | | 685,095 | |
U.S. Treasury Note | | | 0.88 | | | | 5-15-2019 | | | | 690,000 | | | | 684,906 | |
U.S. Treasury Note | | | 0.88 | | | | 6-15-2019 | | | | 691,000 | | | | 685,656 | |
U.S. Treasury Note | | | 0.88 | | | | 7-31-2019 | | | | 573,000 | | | | 568,210 | |
U.S. Treasury Note | | | 1.00 | | | | 9-15-2018 | | | | 299,000 | | | | 298,229 | |
U.S. Treasury Note | | | 1.00 | | | | 11-30-2018 | | | | 713,000 | | | | 710,660 | |
U.S. Treasury Note | | | 1.00 | | | | 6-30-2019 | | | | 532,000 | | | | 529,049 | |
The accompanying notes are an integral part of these financial statements.
| | | | |
| 234 | | Wells Fargo Target Date Funds | | Portfolio of investments—August 31, 2017 (unaudited) |
STRATEGIC RETIREMENT BOND PORTFOLIO
| | | | | | | | | | | | | | | | |
| Security name | | Interest rate | | | Maturity date | | | Principal | | | Value | |
|
U.S. Treasury Securities (continued) | |
U.S. Treasury Note | | | 1.00 | % | | | 10-15-2019 | | | $ | 690,000 | | | $ | 685,095 | |
U.S. Treasury Note | | | 1.13 | | | | 5-31-2019 | | | | 262,000 | | | | 261,202 | |
U.S. Treasury Note | | | 1.13 | | | | 4-30-2020 | | | | 689,000 | | | | 684,209 | |
U.S. Treasury Note | | | 1.13 | | | | 7-31-2021 | | | | 818,000 | | | | 803,525 | |
U.S. Treasury Note | | | 1.13 | | | | 9-30-2021 | | | | 820,000 | | | | 804,080 | |
U.S. Treasury Note | | | 1.25 | | | | 10-31-2018 | | | | 772,000 | | | | 771,879 | |
U.S. Treasury Note | | | 1.25 | | | | 12-15-2018 | | | | 688,000 | | | | 687,704 | |
U.S. Treasury Note | | | 1.25 | | | | 1-31-2019 | | | | 682,000 | | | | 681,680 | |
U.S. Treasury Note | | | 1.25 | | | | 4-30-2019 | | | | 832,000 | | | | 831,188 | |
U.S. Treasury Note | | | 1.25 | | | | 6-30-2019 | | | | 713,000 | | | | 712,109 | |
U.S. Treasury Note | | | 1.25 | | | | 10-31-2019 | | | | 569,000 | | | | 567,889 | |
U.S. Treasury Note | | | 1.25 | | | | 10-31-2021 | | | | 818,000 | | | | 805,538 | |
U.S. Treasury Note | | | 1.25 | | | | 7-31-2023 | | | | 753,000 | | | | 728,145 | |
U.S. Treasury Note | | | 1.38 | | | | 9-30-2018 | | | | 10,000 | | | | 10,011 | |
U.S. Treasury Note | | | 1.38 | | | | 2-28-2019 | | | | 674,000 | | | | 674,816 | |
U.S. Treasury Note | | | 1.38 | | | | 1-15-2020 | | | | 686,000 | | | | 686,107 | |
U.S. Treasury Note | | | 1.38 | | | | 1-31-2020 | | | | 538,000 | | | | 538,084 | |
U.S. Treasury Note | | | 1.38 | | | | 2-15-2020 | | | | 449,000 | | | | 449,000 | |
U.S. Treasury Note | | | 1.38 | | | | 3-31-2020 | | | | 275,000 | | | | 274,946 | |
U.S. Treasury Note | | | 1.38 | | | | 4-30-2020 | | | | 823,000 | | | | 822,550 | |
U.S. Treasury Note | | | 1.38 | | | | 5-31-2020 | | | | 99,000 | | | | 98,930 | |
U.S. Treasury Note | | | 1.38 | | | | 10-31-2020 | | | | 825,000 | | | | 822,325 | |
U.S. Treasury Note | | | 1.38 | | | | 4-30-2021 | | | | 814,000 | | | | 808,626 | |
U.S. Treasury Note | | | 1.38 | | | | 6-30-2023 | | | | 744,000 | | | | 725,400 | |
U.S. Treasury Note | | | 1.38 | | | | 8-31-2023 | | | | 750,000 | | | | 729,814 | |
U.S. Treasury Note | | | 1.38 | | | | 9-30-2023 | | | | 339,000 | | | | 329,717 | |
U.S. Treasury Note | | | 1.50 | | | | 1-31-2019 | | | | 768,000 | | | | 770,160 | |
U.S. Treasury Note | | | 1.50 | | | | 2-28-2019 | | | | 789,000 | | | | 791,188 | |
U.S. Treasury Note | | | 1.50 | | | | 11-30-2019 | | | | 822,000 | | | | 824,633 | |
U.S. Treasury Note | | | 1.50 | | | | 4-15-2020 | | | | 686,000 | | | | 687,903 | |
U.S. Treasury Note | | | 1.50 | | | | 5-15-2020 | | | | 687,000 | | | | 688,744 | |
U.S. Treasury Note | | | 1.50 | | | | 5-31-2020 | | | | 823,000 | | | | 824,961 | |
U.S. Treasury Note | | | 1.50 | | | | 8-15-2026 | | | | 1,192,000 | | | | 1,134,356 | |
U.S. Treasury Note | | | 1.63 | | | | 8-31-2019 | | | | 819,000 | | | | 823,671 | |
U.S. Treasury Note | | | 1.63 | | | | 3-15-2020 | | | | 684,000 | | | | 688,141 | |
U.S. Treasury Note | | | 1.63 | | | | 6-30-2020 | | | | 822,000 | | | | 826,592 | |
U.S. Treasury Note | | | 1.63 | | | | 7-31-2020 | | | | 819,000 | | | | 823,671 | |
U.S. Treasury Note | | | 1.63 | | | | 11-30-2020 | | | | 821,000 | | | | 824,432 | |
U.S. Treasury Note | | | 1.63 | | | | 8-15-2022 | | | | 669,000 | | | | 666,361 | |
U.S. Treasury Note | | | 1.63 | | | | 4-30-2023 | | | | 743,000 | | | | 735,454 | |
U.S. Treasury Note | | | 1.63 | | | | 5-31-2023 | | | | 20,000 | | | | 19,790 | |
U.S. Treasury Note | | | 1.63 | | | | 10-31-2023 | | | | 746,000 | | | | 735,976 | |
U.S. Treasury Note | | | 1.63 | | | | 2-15-2026 | | | | 1,186,000 | | | | 1,145,370 | |
U.S. Treasury Note | | | 1.63 | | | | 5-15-2026 | | | | 1,174,000 | | | | 1,131,351 | |
U.S. Treasury Note | | | 1.75 | | | | 9-30-2019 | | | | 275,000 | | | | 277,234 | |
U.S. Treasury Note | | | 1.75 | | | | 10-31-2020 | | | | 733,000 | | | | 739,127 | |
U.S. Treasury Note | | | 1.75 | | | | 2-28-2022 | | | | 748,000 | | | | 750,659 | |
U.S. Treasury Note | | | 1.75 | | | | 3-31-2022 | | | | 749,000 | | | | 751,194 | |
U.S. Treasury Note | | | 1.75 | | | | 5-31-2022 | | | | 812,000 | | | | 813,998 | |
U.S. Treasury Note | | | 1.75 | | | | 1-31-2023 | | | | 10,000 | | | | 9,982 | |
The accompanying notes are an integral part of these financial statements.
| | | | | | |
| Portfolio of investments—August 31, 2017 (unaudited) | | Wells Fargo Target Date Funds | | | 235 | |
STRATEGIC RETIREMENT BOND PORTFOLIO
| | | | | | | | | | | | | | | | |
| Security name | | Interest rate | | | Maturity date | | | Principal | | | Value | |
|
U.S. Treasury Securities (continued) | |
U.S. Treasury Note | | | 1.88 | % | | | 6-30-2020 | | | $ | 586,000 | | | $ | 593,508 | |
U.S. Treasury Note | | | 1.88 | | | | 4-30-2022 | | | | 805,000 | | | | 811,383 | |
U.S. Treasury Note | | | 1.88 | | | | 8-31-2022 | | | | 742,000 | | | | 747,159 | |
U.S. Treasury Note | | | 2.00 | | | | 7-31-2020 | | | | 434,000 | | | | 441,086 | |
U.S. Treasury Note | | | 2.00 | | | | 9-30-2020 | | | | 636,000 | | | | 646,285 | |
U.S. Treasury Note | | | 2.00 | | | | 11-30-2020 | | | | 674,000 | | | | 684,795 | |
U.S. Treasury Note | | | 2.00 | | | | 5-31-2021 | | | | 724,000 | | | | 735,284 | |
U.S. Treasury Note | | | 2.00 | | | | 10-31-2021 | | | | 744,000 | | | | 754,986 | |
U.S. Treasury Note | | | 2.00 | | | | 2-15-2022 | | | | 756,000 | | | | 767,251 | |
U.S. Treasury Note | | | 2.00 | | | | 2-15-2023 | | | | 285,000 | | | | 288,139 | |
U.S. Treasury Note | | | 2.00 | | | | 4-30-2024 | | | | 10,000 | | | | 10,050 | |
U.S. Treasury Note | | | 2.00 | | | | 5-31-2024 | | | | 739,000 | | | | 742,435 | |
U.S. Treasury Note | | | 2.00 | | | | 6-30-2024 | | | | 740,000 | | | | 742,977 | |
U.S. Treasury Note | | | 2.00 | | | | 2-15-2025 | | | | 1,207,000 | | | | 1,207,330 | |
U.S. Treasury Note | | | 2.00 | | | | 8-15-2025 | | | | 1,208,000 | | | | 1,205,216 | |
U.S. Treasury Note | | | 2.00 | | | | 11-15-2026 | | | | 10,000 | | | | 9,909 | |
U.S. Treasury Note | | | 2.13 | | | | 8-31-2020 | | | | 705,000 | | | | 718,990 | |
U.S. Treasury Note | | | 2.13 | | | | 1-31-2021 | | | | 692,000 | | | | 705,921 | |
U.S. Treasury Note | | | 2.13 | | | | 12-31-2021 | | | | 744,000 | | | | 758,589 | |
U.S. Treasury Note | | | 2.13 | | | | 2-29-2024 | | | | 733,000 | | | | 742,993 | |
U.S. Treasury Note | | | 2.25 | | | | 3-31-2021 | | | | 693,000 | | | | 709,973 | |
U.S. Treasury Note | | | 2.25 | | | | 7-31-2021 | | | | 738,000 | | | | 756,162 | |
U.S. Treasury Note | | | 2.25 | | | | 12-31-2023 | | | | 732,000 | | | | 748,098 | |
U.S. Treasury Note | | | 2.25 | | | | 1-31-2024 | | | | 729,000 | | | | 744,719 | |
U.S. Treasury Note | | | 2.25 | | | | 11-15-2025 | | | | 1,203,000 | | | | 1,221,468 | |
U.S. Treasury Note | | | 2.25 | | | | 2-15-2027 | | | | 225,000 | | | | 227,531 | |
U.S. Treasury Note | | | 2.25 | | | | 8-15-2027 | | | | 270,000 | | | | 272,964 | |
U.S. Treasury Note | | | 2.38 | | | | 12-31-2020 | | | | 668,000 | | | | 686,866 | |
U.S. Treasury Note | | | 2.38 | | | | 8-15-2024 | | | | 1,188,000 | | | | 1,221,366 | |
U.S. Treasury Note | | | 2.38 | | | | 5-15-2027 | | | | 453,000 | | | | 462,839 | |
U.S. Treasury Note | | | 2.50 | | | | 8-15-2023 | | | | 559,000 | | | | 579,897 | |
U.S. Treasury Note | | | 2.50 | | | | 5-15-2024 | | | | 1,172,000 | | | | 1,214,485 | |
U.S. Treasury Note | | | 2.63 | | | | 8-15-2020 | | | | 798,000 | | | | 825,338 | |
U.S. Treasury Note | | | 2.63 | | | | 11-15-2020 | | | | 275,000 | | | | 284,754 | |
U.S. Treasury Note | | | 2.75 | | | | 11-15-2023 | | | | 1,082,000 | | | | 1,138,763 | |
U.S. Treasury Note | | | 3.38 | | | | 11-15-2019 | | | | 823,000 | | | | 859,263 | |
U.S. Treasury Note | | | 3.50 | | | | 5-15-2020 | | | | 759,000 | | | | 801,160 | |
U.S. Treasury Note | | | 3.63 | | | | 8-15-2019 | | | | 710,000 | | | | 741,451 | |
U.S. Treasury Note | | | 3.63 | | | | 2-15-2020 | | | | 906,000 | | | | 955,335 | |
U.S. Treasury Note | | | 6.00 | | | | 2-15-2026 | | | | 396,000 | | | | 518,775 | |
U.S. Treasury Note | | | 6.50 | | | | 11-15-2026 | | | | 30,000 | | | | 41,159 | |
U.S. Treasury Note | | | 7.88 | | | | 2-15-2021 | | | | 352,000 | | | | 426,786 | |
U.S. Treasury Note | | | 8.00 | | | | 11-15-2021 | | | | 421,000 | | | | 529,884 | |
U.S. Treasury Note | | | 8.13 | | | | 5-15-2021 | | | | 339,000 | | | | 419,023 | |
U.S. Treasury Note | | | 8.13 | | | | 8-15-2021 | | | | 340,000 | | | | 425,053 | |
U.S. Treasury Note | | | 8.50 | | | | 2-15-2020 | | | | 358,000 | | | | 419,923 | |
U.S. Treasury Note | | | 8.75 | | | | 5-15-2020 | | | | 351,000 | | | | 419,637 | |
U.S. Treasury Note | | | 8.75 | | | | 8-15-2020 | | | | 376,000 | | | | 455,124 | |
| | | | |
Total U.S. Treasury Securities (Cost $140,965,830) | | | | | | | | | | | | | | | 142,006,031 | |
| | | | | | | | | | | | | | | | |
The accompanying notes are an integral part of these financial statements.
| | | | |
| 236 | | Wells Fargo Target Date Funds | | Portfolio of investments—August 31, 2017 (unaudited) |
STRATEGIC RETIREMENT BOND PORTFOLIO
| | | | | | | | | | | | | | | | |
| Security name | | Yield | | | | | | Shares | | | Value | |
| | | | |
Short-Term Investments: 0.34% | | | | | | | | | | | | | | | | |
| | | | |
| Investment Companies: 0.34% | | | | | | | | | | | | | | | | |
Wells Fargo Government Money Market Fund Select Class (l)(u) | | | 0.92 | % | | | | | | | 510,469 | | | $ | 510,469 | |
| | | | | | | | | | | | | | | | |
| | | | |
Total Short-Term Investments (Cost $510,469) | | | | | | | | | | | | | | | 510,469 | |
| | | | | | | | | | | | | | | | |
| | | | | | | | |
| Total investments in securities (Cost $144,297,273) | | | 97.32 | % | | | 145,347,214 | |
Other assets and liabilities, net | | | 2.68 | | | | 3,995,471 | |
| | | | | | | | |
| Total net assets | | | 100.00 | % | | $ | 149,342,685 | |
| | | | | | | | |
| ¤ | The security is issued in zero coupon form with no periodic interest payments. |
| ± | Variable rate investment. The rate shown is the rate in effect at period end. |
| (l) | The issuer of the security is an affiliated person of the Portfolio as defined in the Investment Company Act of 1940. |
| (u) | The rate represents the 7-day annualized yield at period end. |
Investments In Affiliates
An affiliated investment is an investment in which the Portfolio owns at least 5% of the outstanding voting shares of the issuer or as a result of other relationships, such as the Portfolio and the issuer having the same investment manager. Transactions with issuers that were either affiliated persons of the Portfolio at the beginning of the period or the end of the period were as follows:
| | | | | | | | | | | | | | | | | | | | | | | | | | | | | | | | |
| | | Shares,
beginning of
period | | | Shares
purchased | | | Shares sold | | | Shares,
end of
period | | | Net
realized
gains
(losses) | | | Net change
in
unrealized
gains
(losses) | | | Income
from
affiliated
securities | | | Value,
end
of period | |
Investment companies - 0.34% | | | | | | | | | | | | | | | | | | | | | | | | | | | | | | | | |
Wells Fargo Government Money Market Fund Select Class | | | 0 | | | | 15,657,781 | | | | 15,147,312 | | | | 510,469 | | | $ | 0 | | | $ | 0 | | | $ | 1,484 | | | $ | 510,469 | |
The accompanying notes are an integral part of these financial statements.
| | | | | | |
| Portfolio of investments—August 31, 2017 (unaudited) | | Wells Fargo Target Date Funds | | | 237 | |
U.S. REIT PORTFOLIO
| | | | | | | | | | | | | | | | |
| Security name | | | | | | | | Shares | | | Value | |
| | | | |
Common Stocks: 99.95% | | | | | | | | | | | | | | | | |
| | | | |
Real Estate: 99.95% | | | | | | | | | | | | | | | | |
| | | | |
| Equity REITs: 99.95% | | | | | | | | | | | | | | | | |
Acadia Realty Trust | | | | | | | | | | | 6,661 | | | $ | 191,104 | |
Alexandria Real Estate Equities Incorporated | | | | | | | | | | | 7,284 | | | | 883,624 | |
American Assets Trust Incorporated | | | | | | | | | | | 3,204 | | | | 130,146 | |
American Campus Communities Incorporated | | | | | | | | | | | 11,201 | | | | 533,056 | |
American Homes 4 Rent Class A | | | | | | | | | | | 18,173 | | | | 402,714 | |
Apartment Investment & Management Company Class A | | | | | | | | | | | 12,820 | | | | 581,130 | |
Apple Hospitality REIT Incorporated | | | | | | | | | | | 17,009 | | | | 309,224 | |
Armada Hoffler Properties Incorporated | | | | | | | | | | | 3,575 | | | | 47,798 | |
AvalonBay Communities Incorporated | | | | | | | | | | | 11,261 | | | | 2,114,028 | |
Boston Properties Incorporated | | | | | | | | | | | 12,284 | | | | 1,481,450 | |
Brandywine Realty Trust | | | | | | | | | | | 13,996 | | | | 240,451 | |
Brixmor Property Group Incorporated | | | | | | | | | | | 23,382 | | | | 437,711 | |
Camden Property Trust | | | | | | | | | | | 7,034 | | | | 629,404 | |
CBL & Associates Properties Incorporated | | | | | | | | | | | 13,090 | | | | 104,720 | |
Chatham Lodging Trust | | | | | | | | | | | 3,007 | | | | 60,982 | |
Chesapeake Lodging Trust | | | | | | | | | | | 4,690 | | | | 120,017 | |
Colony NorthStar Incorporated Class A | | | | | | | | | | | 42,257 | | | | 553,989 | |
Columbia Property Trust Incorporated | | | | | | | | | | | 10,045 | | | | 210,945 | |
CoreCivic Incorporated | | | | | | | | | | | 9,501 | | | | 254,627 | |
Corporate Office Properties Trust | | | | | | | | | | | 8,112 | | | | 270,616 | |
Cousins Properties Incorporated | | | | | | | | | | | 33,645 | | | | 314,581 | |
CubeSmart REIT | | | | | | | | | | | 14,451 | | | | 356,217 | |
DCT Industrial Trust Incorporated | | | | | | | | | | | 7,300 | | | | 425,955 | |
DDR Corporation | | | | | | | | | | | 23,339 | | | | 225,922 | |
DiamondRock Hospitality | | | | | | | | | | | 15,796 | | | | 173,597 | |
Digital Realty Trust Incorporated | | | | | | | | | | | 12,911 | | | | 1,527,888 | |
Douglas Emmett Incorporated | | | | | | | | | | | 11,861 | | | | 462,105 | |
Duke Realty Corporation | | | | | | | | | | | 28,693 | | | | 852,756 | |
DuPont Fabros Technology Incorporated | | | | | | | | | | | 6,234 | | | | 401,221 | |
Easterly Government Properties Incorporated | | | | | | | | | | | 3,004 | | | | 60,260 | |
EastGroup Properties Incorporated | | | | | | | | | | | 2,616 | | | | 232,458 | |
Education Realty Trust Incorporated | | | | | | | | | | | 6,002 | | | | 231,917 | |
Empire State Realty Trust Incorporated | | | | | | | | | | | 12,709 | | | | 258,628 | |
Equity Commonwealth † | | | | | | | | | | | 9,999 | | | | 309,370 | |
Equity Lifestyle Properties Incorporated | | | | | | | | | | | 6,602 | | | | 588,572 | |
Equity Residential | | | | | | | | | | | 29,726 | | | | 1,996,101 | |
Essex Property Trust Incorporated | | | | | | | | | | | 5,334 | | | | 1,418,697 | |
Extra Space Storage Incorporated | | | | | | | | | | | 9,785 | | | | 759,610 | |
Federal Realty Investment Trust | | | | | | | | | | | 5,713 | | | | 725,151 | |
Felcor Lodging Trust Incorporated | | | | | | | | | | | 10,010 | | | | 73,073 | |
First Industrial Realty Trust Incorporated | | | | | | | | | | | 9,489 | | | | 293,970 | |
First Potomac Realty Trust | | | | | | | | | | | 4,634 | | | | 51,576 | |
Forest City Realty Trust Incorporated | | | | | | | | | | | 21,115 | | | | 505,915 | |
Franklin Street Properties Corporation | | | | | | | | | | | 8,446 | | | | 84,207 | |
Gaming and Leisure Properties Incorporated | | | | | | | | | | | 15,488 | | | | 606,975 | |
GGP Incorporated | | | | | | | | | | | 49,856 | | | | 1,034,512 | |
Government Properties Income | | | | | | | | | | | 7,571 | | | | 140,442 | |
The accompanying notes are an integral part of these financial statements.
| | | | |
| 238 | | Wells Fargo Target Date Funds | | Portfolio of investments—August 31, 2017 (unaudited) |
U.S. REIT PORTFOLIO
| | | | | | | | | | | | | | | | |
| Security name | | | | | | | | Shares | | | Value | |
|
| Equity REITs (continued) | |
HCP Incorporated | | | | | | | | | | | 37,681 | | | $ | 1,123,272 | |
Healthcare Realty Trust Incorporated | | | | | | | | | | | 9,195 | | | | 306,011 | |
Healthcare Trust of America Incorporated Class A | | | | | | | | | | | 15,529 | | | | 482,486 | |
Hersha Hospitality Trust | | | | | | | | | | | 3,233 | | | | 59,940 | |
Highwoods Properties Incorporated | | | | | | | | | | | 8,101 | | | | 423,115 | |
Hospitality Properties Trust | | | | | | | | | | | 12,873 | | | | 352,205 | |
Host Hotels & Resorts Incorporated | | | | | | | | | | | 57,535 | | | | 1,042,534 | |
Hudson Pacific Properties Incorporated | | | | | | | | | | | 12,409 | | | | 409,497 | |
Independence Realty Trust Incorporated | | | | | | | | | | | 5,617 | | | | 57,799 | |
Invitation Homes Incorporated | | | | | | | | | | | 6,822 | | | | 157,861 | |
Iron Mountain Incorporated | | | | | | | | | | | 20,232 | �� | | | 797,545 | |
Jernigan Capital Incorporated | | | | | | | | | | | 1,011 | | | | 19,654 | |
Kilroy Realty Corporation | | | | | | | | | | | 7,822 | | | | 541,518 | |
Kimco Realty Corporation | | | | | | | | | | | 31,902 | | | | 625,917 | |
Kite Realty Group Trust | | | | | | | | | | | 6,598 | | | | 132,752 | |
Lamar Advertising Company Class A | | | | | | | | | | | 6,653 | | | | 442,824 | |
LaSalle Hotel Properties | | | | | | | | | | | 8,955 | | | | 254,143 | |
Liberty Property Trust | | | | | | | | | | | 11,833 | | | | 504,087 | |
Life Storage Incorporated | | | | | | | | | | | 3,662 | | | | 269,487 | |
LTC Properties Incorporated | | | | | | | | | | | 3,128 | | | | 152,115 | |
Mack-Cali Realty Corporation | | | | | | | | | | | 6,545 | | | | 149,815 | |
Mid-America Apartment Communities Incorporated | | | | | | | | | | | 9,104 | | | | 969,216 | |
Monogram Residential Trust Class I | | | | | | | | | | | 13,407 | | | | 160,884 | |
National Health Investors Incorporated | | | | | | | | | | | 3,164 | | | | 253,689 | |
National Storage Affiliates | | | | | | | | | | | 3,522 | | | | 78,611 | |
New York REIT Incorporated | | | | | | | | | | | 13,373 | | | | 110,194 | |
NorthStar Realty Europe Corporation | | | | | | | | | | | 4,022 | | | | 49,993 | |
Outfront Media Incorporated | | | | | | | | | | | 10,908 | | | | 239,976 | |
Paramount Group Incorporated | | | | | | | | | | | 15,752 | | | | 248,567 | |
Park Hotels & Resorts Incorporated | | | | | | | | | | | 11,459 | | | | 305,840 | |
Parkway Incorporated | | | | | | | | | | | 3,505 | | | | 80,475 | |
Pebblebrook Hotel Trust | | | | | | | | | | | 5,507 | | | | 184,980 | |
Pennsylvania Real Estate Investment Trust | | | | | | | | | | | 5,444 | | | | 54,603 | |
Piedmont Office Realty Trust Incorporated Class A | | | | | | | | | | | 11,494 | | | | 232,754 | |
Prologis Incorporated | | | | | | | | | | | 41,485 | | | | 2,628,490 | |
PS Business Parks Incorporated | | | | | | | | | | | 1,588 | | | | 214,555 | |
Public Storage Incorporated | | | | | | | | | | | 12,062 | | | | 2,476,811 | |
Quality Care Properties Incorporated † | | | | | | | | | | | 7,625 | | | | 104,615 | |
Ramco-Gershenson Properties Trust | | | | | | | | | | | 6,157 | | | | 80,965 | |
Regency Centers Corporation | | | | | | | | | | | 11,824 | | | | 760,520 | |
Retail Opportunity Investment Corporation | | | | | | | | | | | 8,487 | | | | 168,382 | |
Rexford Industrial Realty Incorporated | | | | | | | | | | | 5,332 | | | | 160,227 | |
RLJ Lodging Trust | | | | | | | | | | | 9,703 | | | | 195,807 | |
Ryman Hospitality Properties Incorporated | | | | | | | | | | | 3,563 | | | | 211,714 | |
Sabra Health Care REIT Incorporated | | | | | | | | | | | 2 | | | | 39 | |
SBA Communications Corporation † | | | | | | | | | | | 9,759 | | | | 1,498,502 | |
Senior Housing Properties Trust | | | | | | | | | | | 18,977 | | | | 374,226 | |
Seritage Growth Property Class A | | | | | | | | | | | 1,973 | | | | 94,822 | |
Simon Property Group Incorporated | | | | | | | | | | | 24,729 | | | | 3,878,741 | |
SL Green Realty Corporation | | | | | | | | | | | 7,954 | | | | 766,607 | |
The accompanying notes are an integral part of these financial statements.
| | | | | | |
| Portfolio of investments—August 31, 2017 (unaudited) | | Wells Fargo Target Date Funds | | | 239 | |
U.S. REIT PORTFOLIO
| | | | | | | | | | | | | | | | |
| Security name | | | | | | | | Shares | | | Value | |
|
| Equity REITs (continued) | |
STAG Industrial Incorporated | | | | | | | | | | | 7,121 | | | $ | 199,317 | |
Starwood Waypoint Homes | | | | | | | | | | | 9,931 | | | | 369,731 | |
Summit Hotel Properties Incorporated | | | | | | | | | | | 8,354 | | | | 123,973 | |
Sun Communities Incorporated | | | | | | | | | | | 6,173 | | | | 557,483 | |
Sunstone Hotel Investors Incorporated | | | | | | | | | | | 17,568 | | | | 277,575 | |
Tanger Factory Outlet Centers Incorporated | | | | | | | | | | | 7,513 | | | | 175,804 | |
Taubman Centers Incorporated | | | | | | | | | | | 4,650 | | | | 242,917 | |
Terreno Realty Corporation | | | | | | | | | | | 3,849 | | | | 139,526 | |
The Geo Group Incorporated | | | | | | | | | | | 9,698 | | | | 268,052 | |
The Macerich Company | | | | | | | | | | | 11,020 | | | | 581,525 | |
UDR Incorporated | | | | | | | | | | | 21,693 | | | | 842,122 | |
Uniti Group Incorporated | | | | | | | | | | | 13,012 | | | | 250,612 | |
Universal Health Realty Income Trust | | | | | | | | | | | 1,014 | | | | 76,770 | |
Urban Edge Properties | | | | | | | | | | | 7,761 | | | | 195,189 | |
Ventas Incorporated | | | | | | | | | | | 28,859 | | | | 1,975,110 | |
Vornado Realty Trust | | | | | | | | | | | 14,017 | | | | 1,044,126 | |
Washington Prime Group Incorporated | | | | | | | | | | | 14,784 | | | | 123,446 | |
Washington Real Estate Investment Trust | | | | | | | | | | | 6,040 | | | | 198,476 | |
Weingarten Realty Investors | | | | | | | | | | | 9,474 | | | | 303,547 | |
Welltower Incorporated | | | | | | | | | | | 29,925 | | | | 2,191,109 | |
Whitestone REIT | | | | | | | | | | | 2,916 | | | | 36,567 | |
Xenia Hotels & Resorts Incorporated | | | | | | | | | | | 8,561 | | | | 170,878 | |
| |
Total Common Stocks (Cost $53,250,995) | | | | 58,902,649 | |
| | | | | | | | | | | | | | | | |
| | | | |
| | | Yield | | | | | | | | | | |
| Short-Term Investments: 0.03% | | | | | | | | | | | | | | | | |
| | | | |
| Investment Companies: 0.03% | | | | | | | | | | | | | | | | |
Wells Fargo Government Money Market Fund Select Class (l)(u) | | | 0.92 | % | | | | | | | 19,143 | | | | 19,143 | |
| | | | | | | | | | | | | | | | |
| |
Total Short-Term Investments (Cost $19,143) | | | | 19,143 | |
| | | | | | | | | | | | | | | | |
| | | | | | | | |
| Total investments in securities (Cost $53,270,138) | | | 99.98 | % | | | 58,921,792 | |
Other assets and liabilities, net | | | 0.02 | | | | 13,905 | |
| | | | | | | | |
| Total net assets | | | 100.00 | % | | $ | 58,935,697 | |
| | | | | | | | |
| † | Non-income-earning security |
| (l) | The issuer of the security is an affiliated person of the Portfolio as defined in the Investment Company Act of 1940. |
| (u) | The rate represents the 7-day annualized yield at period end. |
Investments In Affiliates
An affiliated investment is an investment in which the Portfolio owns at least 5% of the outstanding voting shares of the issuer or as a result of other relationships, such as the Portfolio and the issuer having the same investment manager. Transactions with issuers that were either affiliated persons of the Portoflio at the beginning of the period or the end of the period were as follows:
| | | | | | | | | | | | | | | | | | | | | | | | | | | | | | | | |
| | | Shares,
beginning of
period | | | Shares
purchased | | | Shares
sold | | | Shares,
end of
period | | | Net
realized
gains
(losses) | | | Net change
in
unrealized
gains
(losses) | | | Income
from
affiliated
securities | | | Value,
end
of period | |
Investment companies - 0.03% | | | | | | | | | | | | | | | | | | | | | | | | | | | | | | | | |
Wells Fargo Government Money Market Fund Select Class | | | 0 | | | | 42,371,603 | | | | 42,352,460 | | | | 19,143 | | | $ | 0 | | | $ | 0 | | | $ | 1,535 | | | $ | 19,143 | |
The accompanying notes are an integral part of these financial statements.
| | | | |
| 240 | | Wells Fargo Target Date Funds | | Statements of assets and liabilities—August 31, 2017 (unaudited) |
| | | | | | | | |
| | | Bloomberg
Barclays US
Aggregate ex-
Corporate
Portfolio | | | Emerging
Markets
Bond
Portfolio | |
| | |
Assets | | | | | | | | |
Investments in unaffiliated securities, at value (see cost below) | | $ | 1,109,696,761 | | | $ | 91,418,705 | |
Investments in affiliated securities, at value (see cost below) | | | 97,959,223 | | | | 1,716,841 | |
Cash | | | 177,131 | | | | 0 | |
Segregated cash for futures transactions | | | 0 | | | | 0 | |
Segregated cash for credit default swap | | | 0 | | | | 0 | |
Foreign currency, at value (see cost below) | | | 0 | | | | 0 | |
Receivable for investments sold | | | 48,326,442 | | | | 4,243,117 | |
Principal paydown receivable | | | 9,500 | | | | 0 | |
Receivable for dividends and interest | | | 4,830,633 | | | | 1,394,610 | |
Receivable for daily variation margin on open futures contracts | | | 0 | | | | 0 | |
Unrealized gains on forward foreign currency contracts | | | 0 | | | | 0 | |
Prepaid expenses and other assets | | | 385 | | | | 656 | |
| | | | | | | | |
Total assets | | | 1,261,000,075 | | | | 98,773,929 | |
| | | | | | | | |
| | |
Liabilities | | | | | | | | |
Payable for investments purchased | | | 109,468,959 | | | | 1,199,915 | |
Advisory fee payable | | | 50,319 | | | | 21,269 | |
Due to custodian bank | | | 0 | | | | 0 | |
Custodian and accounting fees payable | | | 12,656 | | | | 1,548 | |
Professional fees payable | | | 23,808 | | | | 17,610 | |
Accrued expenses and other liabilities | | | 2,030 | | | | 4,322 | |
| | | | | | | | |
Total liabilities | | | 109,557,772 | | | | 1,244,664 | |
| | | | | | | | |
Total net assets | | $ | 1,151,442,303 | | | $ | 97,529,265 | |
| | | | | | | | |
| | |
Investments in unaffiliated securities, at cost | | $ | 1,100,738,749 | | | $ | 90,114,464 | |
| | | | | | | | |
Investments in affiliated securities, at cost | | $ | 97,959,223 | | | $ | 1,716,841 | |
| | | | | | | | |
Foreign currency, at cost | | $ | 0 | | | $ | 0 | |
| | | | | | | | |
The accompanying notes are an integral part of these financial statements.
| | | | | | |
| Statements of assets and liabilities—August 31, 2017 (unaudited) | | Wells Fargo Target Date Funds | | | 241 | |
| | | | | | | | | | | | | | | | | | | | | | | | | | | | | | |
Factor
Enhanced
Emerging
Markets
Portfolio | | | Factor
Enhanced
International
Portfolio | | | Factor
Enhanced
Large Cap Portfolio | | | Factor
Enhanced
Small Cap
Portfolio | | | High Yield
Corporate
Bond
Portfolio | | | Investment
Grade
Corporate
Bond
Portfolio | | | Strategic
Retirement
Bond
Portfolio | | | U.S. REIT
Portfolio | |
| | | | | | | |
| | | | | | | | | | | | | | | | | | | | | | | | | | | | | | |
| $ | 368,392,548 | | | $ | 1,225,420,402 | | | $ | 2,045,621,646 | | | $ | 511,717,289 | | | $ | 90,126,463 | | | $ | 572,279,023 | | | $ | 144,836,745 | | | $ | 58,902,649 | |
| | 13,203,143 | | | | 57,687,125 | | | | 105,054,093 | | | | 27,168,625 | | | | 4,196,265 | | | | 2,648,131 | | | | 510,469 | | | | 19,143 | |
| | 133,981 | | | | 0 | | | | 2,844,157 | | | | 0 | | | | 0 | | | | 0 | | | | 21,933 | | | | 0 | |
| | 500,773 | | | | 2,276,606 | | | | 3,182,633 | | | | 1,881,663 | | | | 0 | | | | 0 | | | | 0 | | | | 0 | |
| | 0 | | | | 0 | | | | 0 | | | | 0 | | | | 18,668 | | | | 0 | | | | 0 | | | | 0 | |
| | 779,538 | | | | 694,929 | | | | 0 | | | | 0 | | | | 0 | | | | 0 | | | | 0 | | | | 0 | |
| | 876,350 | | | | 0 | | | | 0 | | | | 0 | | | | 5,055,731 | | | | 24,831,962 | | | | 4,464,604 | | | | 0 | |
| | 0 | | | | 0 | | | | 0 | | | | 0 | | | | 0 | | | | 0 | | | | 0 | | | | 0 | |
| | 760,031 | | | | 3,450,010 | | | | 4,946,996 | | | | 416,455 | | | | 1,590,545 | | | | 6,283,036 | | | | 322,282 | | | | 29,821 | |
| | 6,108 | | | | 454,609 | | | | 647,752 | | | | 294,345 | | | | 0 | | | | 0 | | | | 0 | | | | 0 | |
| | 733 | | | | 0 | | | | 0 | | | | 0 | | | | 0 | | | | 0 | | | | 0 | | | | 0 | |
| | 74,115 | | | | 3,014,527 | | | | 21,576 | | | | 1,162 | | | | 1,534 | | | | 71,183 | | | | 1,669 | | | | 3,968 | |
| | | | | | | | | | | | | | | | | | | | | | | | | | | | | | |
| | 384,727,320 | | | | 1,292,998,208 | | | | 2,162,318,853 | | | | 541,479,539 | | | | 100,989,206 | | | | 606,113,335 | | | | 150,157,702 | | | | 58,955,581 | |
| | | | | | | | | | | | | | | | | | | | | | | | | | | | | | |
| | | | | | | |
| | | | | | | | | | | | | | | | | | | | | | | | | | | | | | |
| | 0 | | | | 5,344 | | | | 0 | | | | 0 | | | | 3,482,844 | | | | 6,399,120 | | | | 786,589 | | | | 0 | |
| | 50,319 | | | | 168,574 | | | | 187,268 | | | | 69,535 | | | | 21,181 | | | | 26,181 | | | | 6,504 | | | | 5,088 | |
| | 0 | | | | 1,487,079 | | | | 0 | | | | 1,663 | | | | 0 | | | | 0 | | | | 0 | | | | 0 | |
| | 141,082 | | | | 77,049 | | | | 30,683 | | | | 13,082 | | | | 1,699 | | | | 130,139 | | | | 1,033 | | | | 446 | |
| | 12,459 | | | | 15,979 | | | | 13,488 | | | | 11,519 | | | | 15,885 | | | | 56,037 | | | | 18,114 | | | | 13,488 | |
| | 434 | | | | 565 | | | | 386 | | | | 460 | | | | 371 | | | | 17,355 | | | | 2,777 | | | | 862 | |
| | | | | | | | | | | | | | | | | | | | | | | | | | | | | | |
| | 204,294 | | | | 1,754,590 | | | | 231,825 | | | | 96,259 | | | | 3,521,980 | | | | 6,628,832 | | | | 815,017 | | | | 19,884 | |
| | | | | | | | | | | | | | | | | | | | | | | | | | | | | | |
| $ | 384,523,026 | | | $ | 1,291,243,618 | | | $ | 2,162,087,028 | | | $ | 541,383,280 | | | $ | 97,467,226 | | | $ | 599,484,503 | | | $ | 149,342,685 | | | $ | 58,935,697 | |
| | | | | | | | | | | | | | | | | | | | | | | | | | | | | | |
| | | | | | | |
| $ | 360,660,707 | | | $ | 1,117,210,191 | | | $ | 1,642,768,516 | | | $ | 512,755,140 | | | $ | 90,772,914 | | | $ | 547,100,536 | | | $ | 143,786,804 | | | $ | 53,250,995 | |
| | | | | | | | | | | | | | | | | | | | | | | | | | | | | | |
| $ | 13,203,143 | | | $ | 57,687,125 | | | $ | 105,054,093 | | | $ | 27,168,625 | | | $ | 4,196,265 | | | $ | 2,648,131 | | | $ | 510,469 | | | $ | 19,143 | |
| | | | | | | | | | | | | | | | | | | | | | | | | | | | | | |
| $ | 779,440 | | | $ | 693,450 | | | $ | 0 | | | $ | 0 | | | $ | 0 | | | $ | 0 | | | $ | 0 | | | $ | 0 | |
| | | | | | | | | | | | | | | | | | | | | | | | | | | | | | |
The accompanying notes are an integral part of these financial statements.
| | | | |
| 242 | | Wells Fargo Target Date Funds | | Statements of operations—period ended August 31, 20171 (unaudited) |
| | | | | | | | |
| | | Bloomberg
Barclays US
Aggregate ex-
Corporate
Portfolio | | | Emerging Markets Bond Portfolio | |
| | |
Investment income | | | | | | | | |
Interest | | $ | 2,928,717 | | | $ | 713,097 | |
Income from affiliated securities | | | 156,388 | | | | 4,849 | |
Dividends* | | | 0 | | | | 0 | |
| | | | | | | | |
Total investment income | | | 3,085,105 | | | | 717,946 | |
| | | | | | | | |
| | |
Expenses | | | | | | | | |
Advisory fee | | | 78,796 | | | | 39,136 | |
Custody and accounting fees | | | 12,656 | | | | 1,548 | |
Professional fees | | | 29,021 | | | | 22,823 | |
Shareholder report expenses | | | 4,555 | | | | 4,413 | |
Trustees’ fees and expenses | | | 5,161 | | | | 5,161 | |
Other fees and expenses | | | 5,316 | | | | 5,371 | |
| | | | | | | | |
Total expenses | | | 135,505 | | | | 78,452 | |
| | | | | | | | |
Net investment income | | | 2,949,600 | | | | 639,494 | |
| | | | | | | | |
| | |
REALIZED AND UNREALIZED GAINS (LOSSES) ON INVESTMENTS | | | | | | | | |
| | |
Net realized gains (losses) on: | | | | | | | | |
Unaffiliated securities | | | 1,386,494 | | | | (56,422 | ) |
Futures transactions | | | 0 | | | | 0 | |
Forward foreign currency contract transactions | | | 0 | | | | 0 | |
Credit default swap transactions | | | 0 | | | | 0 | |
| | | | | | | | |
Net realized gain (losses) on investments | | | 1,386,494 | | | | (56,422 | ) |
| | | | | | | | |
| | |
Net change in unrealized gains (losses) on: | | | | | | | | |
Unaffiliated securities | | | 8,958,012 | | | | 1,304,241 | |
Futures transactions | | | 0 | | | | 0 | |
Forward foreign currency contract transactions | | | 0 | | | | 0 | |
| | | | | | | | |
Net change in unrealized gains (losses) on investments | | | 8,958,012 | | | | 1,304,241 | |
| | | | | | | | |
Net realized and unrealized gains (losses) on investments | | | 10,344,506 | | | | 1,247,819 | |
| | | | | | | | |
Net increase (decrease) in net assets resulting from operations | | $ | 13,294,106 | | | $ | 1,887,313 | |
| | | | | | | | |
| | |
* Net of foreign dividend withholding taxes in the amount of | | | $0 | | | | $0 | |
| 1 | For the period from May 23, 2017 (commencement of operations) to August 31, 2017 |
The accompanying notes are an integral part of these financial statements.
| | | | | | |
| Statements of operations—period ended August 31, 20171 (unaudited) | | Wells Fargo Target Date Funds | | | 243 | |
| | | | | | | | | | | | | | | | | | | | | | | | | | | | | | |
Factor Enhanced Emerging Markets Portfolio | | | Factor Enhanced International Portfolio | | | Factor Enhanced Large Cap Portfolio | | | Factor Enhanced Small Cap Portfolio | | | High Yield Corporate Bond Portfolio | | | Investment Grade Corporate Bond Portfolio | | | Strategic Retirement Bond Portfolio | | | U.S. REIT Portfolio | |
| | | | | | | |
| | | | | | | | | | | | | | | | | | | | | | | | | | | | | | |
| $ | 0 | | | $ | 0 | | | $ | 0 | | | $ | 0 | | | $ | 1,221,290 | | | $ | 2,838,885 | | | $ | 314,265 | | | $ | 0 | |
| | 10,982 | | | | 26,461 | | | | 81,912 | | | | 41,649 | | | | 8,405 | | | | 11,991 | | | | 1,484 | | | | 1,535 | |
| | 1,821,303 | | | | 4,256,961 | | | | 6,329,673 | | | | 925,115 | | | | 0 | | | | 0 | | | | 0 | | | | 175,213 | |
| | | | | | | | | | | | | | | | | | | | | | | | | | | | | | |
| | 1,832,285 | | | | 4,283,422 | | | | 6,411,585 | | | | 966,764 | | | | 1,229,695 | | | | 2,850,876 | | | | 315,749 | | | | 176,748 | |
| | | | | | | | | | | | | | | | | | | | | | | | | | | | | | |
| | | | | | | |
| | | | | | | | | | | | | | | | | | | | | | | | | | | | | | |
| | 77,367 | | | | 256,042 | | | | 281,277 | | | | 106,454 | | | | 50,060 | | | | 42,846 | | | | 10,449 | | | | 7,761 | |
| | 141,082 | | | | 77,049 | | | | 30,683 | | | | 13,082 | | | | 1,699 | | | | 5,758 | | | | 1,033 | | | | 446 | |
| | 21,192 | | | | 21,192 | | | | 18,701 | | | | 18,701 | | | | 21,098 | | | | 21,904 | | | | 23,327 | | | | 18,701 | |
| | 1,495 | | | | 1,495 | | | | 1,495 | | | | 1,601 | | | | 1,708 | | | | 4,555 | | | | 5,338 | | | | 1,601 | |
| | 5,161 | | | | 5,161 | | | | 5,161 | | | | 5,161 | | | | 5,161 | | | | 5,161 | | | | 5,161 | | | | 5,161 | |
| | 6,291 | | | | 3,289 | | | | 2,466 | | | | 2,466 | | | | 3,836 | | | | 1,781 | | | | 1,781 | | | | 2,466 | |
| | | | | | | | | | | | | | | | | | | | | | | | | | | | | | |
| | 252,588 | | | | 364,228 | | | | 339,783 | | | | 147,465 | | | | 83,562 | | | | 82,005 | | | | 47,089 | | | | 36,136 | |
| | | | | | | | | | | | | | | | | | | | | | | | | | | | | | |
| | 1,579,697 | | | | 3,919,194 | | | | 6,071,802 | | | | 819,299 | | | | 1,146,133 | | | | 2,768,871 | | | | 268,660 | | | | 140,612 | |
| | | | | | | | | | | | | | | | | | | | | | | | | | | | | | |
| | | | | | | |
| | | | | | | | | | | | | | | | | | | | | | | | | | | | | | |
| | | | | | | |
| | | | | | | | | | | | | | | | | | | | | | | | | | | | | | |
| | (38,605 | ) | | | (91,810,687 | ) | | | (396,848,098 | ) | | | (9,666,320 | ) | | | (523,805 | ) | | | 3,708,836 | | | | (56,063 | ) | | | (5,453,955 | ) |
| | (613,640 | ) | | | 93,884 | | | | 312,634 | | | | (505,336 | ) | | | 0 | | | | 0 | | | | 0 | | | | 0 | |
| | 13,846 | | | | 0 | | | | 0 | | | | 0 | | | | 0 | | | | 0 | | | | 0 | | | | 0 | |
| | 0 | | | | 0 | | | | 0 | | | | 0 | | | | 2,348 | | | | 0 | | | | 0 | | | | 0 | |
| | | | | | | | | | | | | | | | | | | | | | | | | | | | | | |
| | (638,399 | ) | | | (91,716,803 | ) | | | (396,535,464 | ) | | | (10,171,656 | ) | | | (521,457 | ) | | | 3,708,836 | | | | (56,063 | ) | | | (5,453,955 | ) |
| | | | | | | | | | | | | | | | | | | | | | | | | | | | | | |
| | | | | | | |
| | | | | | | | | | | | | | | | | | | | | | | | | | | | | | |
| | 7,732,358 | | | | 108,216,393 | | | | 402,853,130 | | | | (1,037,851 | ) | | | (646,451 | ) | | | 1,398,851 | | | | 1,049,941 | | | | 5,651,654 | |
| | (2,433 | ) | | | 42,927 | | | | 531,499 | | | | 220,113 | | | | 0 | | | | 0 | | | | 0 | | | | 0 | |
| | 733 | | | | 0 | | | | 0 | | | | 0 | | | | 0 | | | | 0 | | | | 0 | | | | 0 | |
| | | | | | | | | | | | | | | | | | | | | | | | | | | | | | |
| | 7,730,658 | | | | 108,259,320 | | | | 403,384,629 | | | | (817,738 | ) | | | (646,451 | ) | | | 1,398,851 | | | | 1,049,941 | | | | 5,651,654 | |
| | | | | | | | | | | | | | | | | | | | | | | | | | | | | | |
| | 7,092,259 | | | | 16,542,517 | | | | 6,849,165 | | | | (10,989,394 | ) | | | (1,167,908 | ) | | | 5,107,687 | | | | 993,878 | | | | 197,699 | |
| | | | | | | | | | | | | | | | | | | | | | | | | | | | | | |
| $ | 8,671,956 | | | $ | 20,461,711 | | | $ | 12,920,967 | | | $ | (10,170,095 | ) | | $ | (21,775 | ) | | $ | 7,876,558 | | | $ | 1,262,538 | | | $ | 338,311 | |
| | | | | | | | | | | | | | | | | | | | | | | | | | | | | | |
| | | | | | | |
| | $365,090 | | | | $199,806 | | | | $0 | | | | $0 | | | | $0 | | | | $0 | | | | $0 | | | | $0 | |
The accompanying notes are an integral part of these financial statements.
| | | | |
| 244 | | Wells Fargo Target Date Funds | | Statements of changes in net assets |
| | | | |
| | | Bloomberg Barclays US Aggregate
ex-Corporate Portfolio | |
| | | Period ended
August 31, 20171 (unaudited) | |
| |
Operations | | | | |
Net investment income | | $ | 2,949,600 | |
Net realized gains on investments | | | 1,386,494 | |
Net change in unrealized gains (losses) on investments | | | 8,958,012 | |
| | | | |
Net increase in net assets resulting from operations | | | 13,294,106 | |
| | | | |
| |
Capital share transactions | | | | |
Transactions in investors’ beneficial interests | | | | |
Contributions | | | 1,265,521,378 | |
Withdrawals | | | (127,373,181 | ) |
| | | | |
Net increase in net assets resulting from capital share transactions | | | 1,138,148,197 | |
| | | | |
Total increase in net assets | | | 1,151,442,303 | |
| | | | |
| |
Net assets | | | | |
Beginning of period | | | 0 | |
| | | | |
End of period | | $ | 1,151,442,303 | |
| | | | |
| 1 | For the period from May 23, 2017 (commencement of operations) to August 31, 2017 |
The accompanying notes are an integral part of these financial statements.
| | | | | | |
| Statements of changes in net assets | | Wells Fargo Target Date Funds | | | 245 | |
| | | | |
| | | Emerging Markets Bond Portfolio | |
| | | Period ended
August 31, 20171 (unaudited) | |
| |
Operations | | | | |
Net investment income | | $ | 639,494 | |
Net realized losses on investments | | | (56,422 | ) |
Net change in unrealized gains (losses) on investments | | | 1,304,241 | |
| | | | |
Net increase in net assets resulting from operations | | | 1,887,313 | |
| | | | |
| |
Capital share transactions | | | | |
Transactions in investors’ beneficial interests | | | | |
Contributions | | | 122,930,933 | |
Withdrawals | | | (27,288,981 | ) |
| | | | |
Net increase in net assets resulting from capital share transactions | | | 95,641,952 | |
| | | | |
Total increase in net assets | | | 97,529,265 | |
| | | | |
| |
Net assets | | | | |
Beginning of period | | | 0 | |
| | | | |
End of period | | $ | 97,529,265 | |
| | | | |
| 1 | For the period from May 23, 2017 (commencement of operations) to August 31, 2017 |
The accompanying notes are an integral part of these financial statements.
| | | | |
| 246 | | Wells Fargo Target Date Funds | | Statements of changes in net assets |
| | | | |
| | | Factor Enhanced Emerging Markets Portfolio | |
| | | Period ended
August 31, 20171 (unaudited) | |
| |
Operations | | | | |
Net investment income | | $ | 1,579,697 | |
Net realized losses on investments | | | (638,399 | ) |
Net change in unrealized gains (losses) on investments | | | 7,730,658 | |
| | | | |
Net increase in net assets resulting from operations | | | 8,671,956 | |
| | | | |
| |
Capital share transactions | | | | |
Transactions in investors’ beneficial interests | | | | |
Contributions | | | 414,306,942 | |
Withdrawals | | | (38,455,872 | ) |
| | | | |
Net increase in net assets resulting from capital share transactions | | | 375,851,070 | |
| | | | |
Total increase in net assets | | | 384,523,026 | |
| | | | |
| |
Net assets | | | | |
Beginning of period | | | 0 | |
| | | | |
End of period | | $ | 384,523,026 | |
| | | | |
| 1 | For the period from May 23, 2017 (commencement of operations) to August 31, 2017 |
The accompanying notes are an integral part of these financial statements.
| | | | | | |
| Statements of changes in net assets | | Wells Fargo Target Date Funds | | | 247 | |
| | | | |
| | | Factor Enhanced International Portfolio | |
| | | Period ended
August 31, 20171 (unaudited) | |
| |
Operations | | | | |
Net investment income | | $ | 3,919,194 | |
Net realized losses on investments | | | (91,716,803 | ) |
Net change in unrealized gains (losses) on investments | | | 108,259,320 | |
| | | | |
Net increase in net assets resulting from operations | | | 20,461,711 | |
| | | | |
| |
Capital share transactions | | | | |
Transactions in investors’ beneficial interests | | | | |
Contributions | | | 1,376,776,579 | |
Withdrawals | | | (105,994,672 | ) |
| | | | |
Net increase in net assets resulting from capital share transactions | | | 1,270,781,907 | |
| | | | |
Total increase in net assets | | | 1,291,243,618 | |
| | | | |
| |
Net assets | | | | |
Beginning of period | | | 0 | |
| | | | |
End of period | | $ | 1,291,243,618 | |
| | | | |
| 1 | For the period from May 23, 2017 (commencement of operations) to August 31, 2017 |
The accompanying notes are an integral part of these financial statements.
| | | | |
| 248 | | Wells Fargo Target Date Funds | | Statements of changes in net assets |
| | | | |
| | | Factor Enhanced Large Cap Portfolio | |
| | | Period ended
August 31, 20171 (unaudited) | |
| |
Operations | | | | |
Net investment income | | $ | 6,071,802 | |
Net realized losses on investments | | | (396,535,464 | ) |
Net change in unrealized gains (losses) on investments | | | 403,384,629 | |
| | | | |
Net increase in net assets resulting from operations | | | 12,920,967 | |
| | | | |
| |
Capital share transactions | | | | |
Transactions in investors’ beneficial interests | | | | |
Contributions | | | 2,267,470,892 | |
Withdrawals | | | (118,304,831 | ) |
| | | | |
Net increase in net assets resulting from capital share transactions | | | 2,149,166,061 | |
| | | | |
Total increase in net assets | | | 2,162,087,028 | |
| | | | |
| |
Net assets | | | | |
Beginning of period | | | 0 | |
| | | | |
End of period | | $ | 2,162,087,028 | |
| | | | |
| 1 | For the period from May 23, 2017 (commencement of operations) to August 31, 2017 |
The accompanying notes are an integral part of these financial statements.
| | | | | | |
| Statements of changes in net assets | | Wells Fargo Target Date Funds | | | 249 | |
| | | | |
| | | Factor Enhanced Small Cap Portfolio | |
| | | Period ended
August 31, 20171 (unaudited) | |
| |
Operations | | | | |
Net investment income | | $ | 819,299 | |
Net realized losses on investments | | | (10,171,656 | ) |
Net change in unrealized gains (losses) on investments | | | (817,738 | ) |
| | | | |
Net decrease in net assets resulting from operations | | | (10,170,095 | ) |
| | | | |
| |
Capital share transactions | | | | |
Transactions in investors’ beneficial interests | | | | |
Contributions | | | 588,140,536 | |
Withdrawals | | | (36,587,161 | ) |
| | | | |
Net increase in net assets resulting from capital share transactions | | | 551,553,375 | |
| | | | |
Total increase in net assets | | | 541,383,280 | |
| | | | |
| |
Net assets | | | | |
Beginning of period | | | 0 | |
| | | | |
End of period | | $ | 541,383,280 | |
| | | | |
| 1 | For the period from May 23, 2017 (commencement of operations) to August 31, 2017 |
The accompanying notes are an integral part of these financial statements.
| | | | |
| 250 | | Wells Fargo Target Date Funds | | Statements of changes in net assets |
| | | | |
| | | High Yield Corporate Bond Portfolio | |
| | | Period ended
August 31, 20171 (unaudited) | |
| |
Operations | | | | |
Net investment income | | $ | 1,146,133 | |
Net realized losses on investments | | | (521,457 | ) |
Net change in unrealized gains (losses) on investments | | | (646,451 | ) |
| | | | |
Net decrease in net assets resulting from operations | | | (21,775 | ) |
| | | | |
| |
Capital share transactions | | | | |
Transactions in investors’ beneficial interests | | | | |
Contributions | | | 153,843,880 | |
Withdrawals | | | (56,354,879 | ) |
| | | | |
Net increase in net assets resulting from capital share transactions | | | 97,489,001 | |
| | | | |
Total increase in net assets | | | 97,467,226 | |
| | | | |
| |
Net assets | | | | |
Beginning of period | | | 0 | |
| | | | |
End of period | | $ | 97,467,226 | |
| | | | |
| 1 | For the period from May 23, 2017 (commencement of operations) to August 31, 2017 |
The accompanying notes are an integral part of these financial statements.
| | | | | | |
| Statements of changes in net assets | | Wells Fargo Target Date Funds | | | 251 | |
| | | | |
| | | Investment Grade Corporate Bond Portfolio | |
| | | Period ended
August 31, 20171 (unaudited) | |
| |
Operations | | | | |
Net investment income | | $ | 2,768,871 | |
Net realized gains on investments | | | 3,708,836 | |
Net change in unrealized gains (losses) on investments | | | 1,398,851 | |
| | | | |
Net increase in net assets resulting from operations | | | 7,876,558 | |
| | | | |
| |
Capital share transactions | | | | |
Transactions in investors’ beneficial interests | | | | |
Contributions | | | 2,532,534,974 | |
Withdrawals | | | (1,940,927,029 | ) |
| | | | |
Net increase in net assets resulting from capital share transactions | | | 591,607,945 | |
| | | | |
Total increase in net assets | | | 599,484,503 | |
| | | | |
| |
Net assets | | | | |
Beginning of period | | | 0 | |
| | | | |
End of period | | $ | 599,484,503 | |
| | | | |
| 1 | For the period from May 23, 2017 (commencement of operations) to August 31, 2017 |
The accompanying notes are an integral part of these financial statements.
| | | | |
| 252 | | Wells Fargo Target Date Funds | | Statements of changes in net assets |
| | | | |
| | | Strategic Retirement Bond Portfolio | |
| | | Period ended
August 31, 20171 (unaudited) | |
| |
Operations | | | | |
Net investment income | | $ | 268,660 | |
Net realized losses on investments | | | (56,063 | ) |
Net change in unrealized gains (losses) on investments | | | 1,049,941 | |
| | | | |
Net increase in net assets resulting from operations | | | 1,262,538 | |
| | | | |
| |
Capital share transactions | | | | |
Transactions in investors’ beneficial interests | | | | |
Contributions | | | 166,967,217 | |
Withdrawals | | | (18,887,070 | ) |
| | | | |
Net increase in net assets resulting from capital share transactions | | | 148,080,147 | |
| | | | |
Total increase in net assets | | | 149,342,685 | |
| | | | |
| |
Net assets | | | | |
Beginning of period | | | 0 | |
| | | | |
End of period | | $ | 149,342,685 | |
| | | | |
| 1 | For the period from May 23, 2017 (commencement of operations) to August 31, 2017 |
The accompanying notes are an integral part of these financial statements.
| | | | | | |
| Statements of changes in net assets | | Wells Fargo Target Date Funds | | | 253 | |
| | | | |
| | | U.S. REIT Portfolio | |
| | | Period ended
August 31, 20171 (unaudited) | |
| |
Operations | | | | |
Net investment income | | $ | 140,612 | |
Net realized losses on investments | | | (5,453,955 | ) |
Net change in unrealized gains (losses) on investments | | | 5,651,654 | |
| | | | |
Net increase in net assets resulting from operations | | | 338,311 | |
| | | | |
| |
Capital share transactions | | | | |
Transactions in investors’ beneficial interests | | | | |
Contributions | | | 62,868,179 | |
Withdrawals | | | (4,270,793 | ) |
| | | | |
Net increase in net assets resulting from capital share transactions | | | 58,597,386 | |
| | | | |
Total increase in net assets | | | 58,935,697 | |
| | | | |
| |
Net assets | | | | |
Beginning of period | | | 0 | |
| | | | |
End of period | | $ | 58,935,697 | |
| | | | |
| 1 | For the period from May 23, 2017 (commencement of operations) to August 31, 2017 |
The accompanying notes are an integral part of these financial statements.
| | | | |
| 254 | | Wells Fargo Target Date Funds | | Financial highlights |
| | | | | | | | | | | | | | | | |
| | | Ratio to average net assets (annualized) | | | Total
return1 | | | Portfolio turnover
rate | |
| | | Net investment
income | | | Gross
expenses | | | |
| | | | |
Bloomberg Barclays US Aggregate ex-Corporate Portfolio | | | | | | | | | | | | | | | | |
Period ended August 31, 20172 | | | 1.87 | % | | | 0.09 | % | | | 1.11 | % | | | 207 | % |
| | | | |
Emerging Markets Bond Portfolio | | | | | | | | | | | | | | | | |
Period ended August 31, 20172 | | | 4.09 | % | | | 0.50 | % | | | 1.79 | % | | | 175 | % |
| | | | |
Factor Enhanced Emerging Markets Portfolio | | | | | | | | | | | | | | | | |
Period ended August 31, 20172 | | | 3.06 | % | | | 0.49 | % | | | 6.08 | % | | | 59 | % |
| | | | |
Factor Enhanced International Portfolio | | | | | | | | | | | | | | | | |
Period ended August 31, 20172 | | | 2.30 | % | | | 0.21 | % | | | 3.85 | % | | | 54 | % |
| | | | |
Factor Enhanced Large Cap Portfolio | | | | | | | | | | | | | | | | |
Period ended August 31, 20172 | | | 2.16 | % | | | 0.12 | % | | | 2.96 | % | | | 17 | % |
| | | | |
Factor Enhanced Small Cap Portfolio | | | | | | | | | | | | | | | | |
Period ended August 31, 20172 | | | 1.15 | % | | | 0.21 | % | | | 1.51 | % | | | 7 | % |
| | | | |
High Yield Corporate Bond Portfolio | | | | | | | | | | | | | | | | |
Period ended August 31, 20172 | | | 5.72 | % | | | 0.42 | % | | | (0.12 | )% | | | 102 | % |
| | | | |
Investment Grade Corporate Bond Portfolio | | | | | | | | | | | | | | | | |
Period ended August 31, 20172 | | | 3.23 | % | | | 0.10 | % | | | 1.57 | % | | | 51 | % |
| | | | |
Strategic Retirement Bond Portfolio | | | | | | | | | | | | | | | | |
Period ended August 31, 20172 | | | 1.29 | % | | | 0.23 | % | | | 0.37 | % | | | 222 | % |
| | | | |
U.S. REIT Portfolio | | | | | | | | | | | | | | | | |
Period ended August 31, 20172 | | | 1.81 | % | | | 0.47 | % | | | 0.04 | % | | | 14 | % |
| 1 | Returns for periods of less than one year are not annualized. |
| 2 | For the period from May 23, 2017 (commencement of operations) to August 31, 2017 |
The accompanying notes are an integral part of these financial statements.
| | | | | | |
| Notes to financial statements (unaudited) | | Wells Fargo Target Date Funds | | | 255 | |
1. ORGANIZATION
Wells Fargo Master Trust (the “Trust”), a Delaware statutory trust organized on March 10, 1999, is an open-end management investment company registered under the Investment Company Act of 1940, as amended (the “1940 Act”). As an investment company, the Trust follows the accounting and reporting guidance in Financial Accounting Standards Board Accounting Standards Codification Topic 946, Financial Services – Investment Companies. These financial statements report on the following portfolios: Wells Fargo Bloomberg Barclays US Aggregate ex-Corporate Portfolio (“Bloomberg Barclays US Aggregate ex-Corporate Portfolio”), Wells Fargo Emerging Market Bond Portfolio (“Emerging Market Bond Portfolio”), Wells Fargo Factor Enhanced Emerging Markets Portfolio (“Factor Enhanced Emerging Markets Portfolio”), Wells Fargo Factor Enhanced International Portfolio (“Factor Enhanced International Portfolio”), Wells Fargo Factor Enhanced Large Cap Portfolio (“Factor Enhanced Large Cap Portfolio”), Wells Fargo Factor Enhanced Small Cap Portfolio (“Factor Enhanced Small Cap Portfolio”), Wells Fargo High Yield Corporate Bond Portfolio (“High Yield Corporate Bond Portfolio”), Wells Fargo Investment Grade Corporate Bond Portfolio (“Investment Grade Corporate Bond Portfolio”), Wells Fargo Strategic Retirement Bond Portfolio (“Strategic Retirement Bond Portfolio”), and Wells Fargo U.S. REIT Portfolio (“U.S. REIT Portfolio”) (each, a “Portfolio”, collectively, the “Portfolios”). Each Portfolio is a diversified series of the Trust.
The Portfolios, which are master portfolios in a master/feeder structure, offer their shares to multiple feeder funds and other affiliated master portfolios rather than directly to the public.
2. SIGNIFICANT ACCOUNTING POLICIES
The following significant accounting policies, which are consistently followed in the preparation of the financial statements of each Portfolio, are in conformity with U.S. generally accepted accounting principles which require management to make estimates and assumptions that affect the reported amounts of assets and liabilities, disclosure of contingent assets and liabilities at the date of the financial statements, and the reported amounts of revenues and expenses during the reporting period. Actual results could differ from those estimates.
Securities valuation
All investments are valued each business day as of the close of regular trading on the New York Stock Exchange (generally 4 p.m. Eastern Time), although the Portfolios may deviate from this calculation time under unusual or unexpected circumstances.
Debt securities are valued at the evaluated bid price provided by an independent pricing service or, if a reliable price is not available, the quoted bid price from an independent broker-dealer.
Equity securities and futures that are listed on a foreign or domestic exchange or market are valued at the official closing price or, if none, the last sales price. If no sale occurs on the principal exchange or market that day, a fair value price will be determined in accordance with the Portfolio’s Valuation Procedures.
Non-listed swaps are valued at the evaluated price provided by an independent pricing service or, if a reliable price is not available, the quoted bid price from an independent broker-dealer.
The values of securities denominated in foreign currencies are translated into U.S. dollars at rates provided by an independent foreign currency pricing source at a time each business day specified by the Management Valuation Team of Wells Fargo Funds Management, LLC (“Funds Management”).
Many securities markets and exchanges outside the U.S. close prior to the close of the New York Stock Exchange and therefore may not fully reflect trading or events that occur after the close of the principal exchange in which the foreign securities are traded, but before the close of the New York Stock Exchange. If such trading or events are expected to materially affect the value of such securities, then fair value pricing procedures approved by the Board of Trustees of the Portfolios are applied. These procedures take into account multiple factors including movements in U.S. securities markets after foreign exchanges close. Foreign securities that are fair valued under these procedures are categorized as Level 2 and the application of these procedures may result in transfers between Level 1 and Level 2. Depending on market activity, such fair valuations may be frequent. Such fair value pricing may result in net asset values that are higher or lower than net asset values based on the last reported sales price or latest quoted bid price. On August 31, 2017, such fair value pricing was not used in pricing foreign securities.
Investments in registered open-end investment companies are valued at net asset value.
Investments which are not valued the methods discussed above are valued at their fair value, as determined in good faith by the Board of Trustees. The Board of Trustees has established a Valuation Committee comprised of the Trustees and has
| | | | |
| 256 | | Wells Fargo Target Date Funds | | Notes to financial statements (unaudited) |
delegated to it the authority to take any actions regarding the valuation of portfolio securities that the Valuation Committee deems necessary or appropriate, including determining the fair value of portfolio securities, unless the determination has been delegated to the Management Valuation Team. The Board of Trustees retains the authority to make or ratify any valuation decisions or approve any changes to the Valuation Procedures as it deems appropriate. On a quarterly basis, the Board of Trustees receives reports on any valuation actions taken by the Valuation Committee or the Management Valuation Team which may include items for ratification.
Valuations of fair valued securities are compared to the next actual sales price when available, or other appropriate market values, to assess the continued appropriateness of the fair valuation methodologies used. These securities are fair valued on a day-to-day basis, taking into consideration changes to appropriate market information and any significant changes to the inputs considered in the valuation process until there is a readily available price provided on an exchange or by an independent pricing service. Valuations received from an independent pricing service or independent broker-dealer quotes are periodically validated by comparisons to most recent trades and valuations provided by other independent pricing services in addition to the review of prices by the adviser and/or subadviser. Unobservable inputs used in determining fair valuations are identified based on the type of security, taking into consideration factors utilized by market participants in valuing the investment, knowledge about the issuer and the current market environment.
Foreign currency translation
The accounting records of each Portfolio are maintained in U.S. dollars. The values of other assets and liabilities denominated in foreign currencies are translated into U.S. dollars at rates provided by an independent foreign currency pricing source at a time each business day specified by the Management Valuation Team. Purchases and sales of securities, and income and expenses are converted at the rate of exchange on the respective dates of such transactions. Net realized foreign exchange gains or losses arise from sales of foreign currencies, currency gains or losses realized between the trade and settlement dates on securities transactions, and the difference between the amounts of dividends, interest and foreign withholding taxes recorded and the U.S. dollar equivalent of the amounts actually paid or received. Net unrealized foreign exchange gains and losses arise from changes in the fair value of assets and liabilities other than investments in securities resulting from changes in exchange rates. The changes in net assets arising from changes in exchange rates of securities and the changes in net assets resulting from changes in market prices of securities are not separately presented. Such changes are included in net realized and unrealized gains or losses from investments.
Participation notes
The Fund may invest in participation notes to gain exposure to securities in certain foreign markets. Participation notes are issued by banks or broker-dealers and are designed to offer a return linked to a particular underlying foreign security. Participation notes involve transaction costs, which may be higher than those applicable to the underlying foreign security. The holder of the participation note is entitled to receive from the bank or broker-dealer, an amount equal to the dividend paid by the issuer of the underlying foreign security; however, the holder is not entitled to the same rights (i.e. dividends, voting rights) as an owner of the underlying foreign security. Investments in participation notes involve risks beyond those normally associated with a direct investment in an underlying security. The Fund has no rights against the issuer of the underlying foreign security and participation notes expose the Fund to counterparty risk in the event the counterparty does not perform. There is also no assurance there will be a secondary trading market for the participation note or that the trading price of the participation note will equal the underlying value of the foreign security that it seeks to replicate.
Forward foreign currency contracts
Each Portfolio may be subject to foreign currency risk in the normal course of pursuing its investment objectives. A forward foreign currency contract is an agreement between two parties to purchase or sell a specific currency for an agreed-upon price at a future date. The Portfolio enters into forward foreign currency contracts to facilitate transactions in foreign-denominated securities and to attempt to minimize the risk to the Portfolio from adverse changes in the relationship between currencies. Forward foreign currency contracts are recorded at the forward rate and marked-to-market daily. When the contracts are closed, realized gains and losses arising from such transactions are recorded as realized gains or losses on forward foreign currency contract transactions. The Portfolio could be exposed to risks if the counterparties to the contracts are unable to meet the terms of their contracts or if the value of the foreign currency changes unfavorably. The Portfolio’s maximum risk of loss from counterparty credit risk is the unrealized gains on the contracts. This risk may be mitigated if there is a master netting arrangement between the Portfolio and the counterparty.
When-issued transactions
Each Portfolio may purchase securities on a forward commitment or when-issued basis. A Portfolio records a when-issued transaction on the trade date and will segregate assets in an amount at least equal in value to the Portfolio’s commitment
| | | | | | |
| Notes to financial statements (unaudited) | | Wells Fargo Target Date Funds | | | 257 | |
to purchase when-issued securities. Securities purchased on a when-issued basis are marked-to-market daily and the Portfolio begins earning interest on the settlement date. Losses may arise due to changes in the market value of the underlying securities or if the counterparty does not perform under the contract.
Futures contracts
Each Portfolio may enter into futures contracts and may be subject to equity price risk or interest rate risk in the normal course of pursuing its investment objectives. A Portfolio may buy and sell futures contracts in order to gain exposure to, or protect against, changes in security values or interest rates. The primary risks associated with the use of futures contracts are the imperfect correlation between changes in market values of securities held by the Portfolio and the prices of futures contracts, and the possibility of an illiquid market.
The aggregate principal amounts of the contracts are not recorded in the financial statements. Fluctuations in the value of the contracts are recorded in the Statements of Assets and Liabilities as an asset or liability and in the Statements of Operations as unrealized gains or losses until the contracts are closed, at which point they are recorded as net realized gains or losses on futures contracts. With futures contracts, there is minimal counterparty risk to the Portfolio since futures are exchange traded and the exchange’s clearinghouse, as counterparty to all exchange traded futures, guarantees the futures against default.
Credit default swaps
Each Portfolio may be subject to credit risk in the normal course of pursuing its investment objectives. A Portfolio may enter into credit default swap contracts for hedging or speculative purposes to provide or receive a measure of protection against default on a referenced entity, obligation or index or for investment gains. Credit default swaps involve an exchange of a stream of payments for protection against the loss in value of an underlying security or index. Under the terms of the swap, one party acts as a guarantor (referred to as the seller of protection) and receives a periodic stream of payments, provided that there is no credit event, from another party (referred to as the buyer of protection) that is a fixed percentage applied to a notional principal amount over the term of the swap. An index credit default swap references all the names in the index, and if a credit event is triggered, the credit event is settled based on that name’s weight in the index. A credit event includes bankruptcy, failure to pay, obligation default, obligation acceleration, repudiation/moratorium, and restructuring. A Portfolio may enter into credit default swaps as either the seller of protection or the buyer of protection. As the seller of protection, the Portfolio is subject to investment exposure on the notional amount of the swap and has assumed the risk of default of the underlying security or index. As the buyer of protection, the Portfolio could be exposed to risks if the seller of the protection defaults on its obligation to perform, or if there are unfavorable changes in the fluctuation of interest rates. The maximum potential amount of future payments (undiscounted) that the Portfolio as the seller of protection could be required to make under the credit default swap contract would be an amount equal to the notional amount of the swap contract. The Portfolio’s maximum risk of loss from counterparty risk, either as the protection seller or as the protection buyer, is the fair value of the contract. This risk is mitigated by having a master netting arrangement between the Portfolio and the counterparty and by having the counterparty post collateral to cover the Portfolio’s exposure to the counterparty.
If the Portfolio is the seller of protection and a credit event occurs, as defined under the terms of that particular swap agreement, the Portfolio will pay to the buyer of protection the notional amount of the swap and take delivery of the referenced obligation or underlying securities comprising the referenced index. If the Portfolio is the buyer of protection and a credit event occurs, as defined under the terms of that particular swap agreement, the Portfolio will receive from the seller of protection the notional amount of the swap and deliver the referenced obligation or underlying securities comprising the referenced index.
Any premiums paid or received on the transactions are recorded as an asset or liability on the Statements of Assets and Liabilities and amortized. The value of the swap contract is marked-to-market daily based on quotations from an independent pricing service or an independent broker-dealer and any change in value is recorded as an unrealized gain or loss. Periodic payments made or received are recorded as realized gains or losses. In addition, payments received or made as a result of a credit event or termination of the contract are recognized as realized gains or losses.
Certain credit default swap contracts entered into by the Portfolio provide for conditions that result in events of default or termination that enable the counterparty to the agreement to cause an early termination of the transactions under those agreements.
Security transactions and income recognition
Securities transactions are recorded on a trade date basis. Realized gains or losses are recorded on the basis of identified cost.
| | | | |
| 258 | | Wells Fargo Target Date Funds | | Notes to financial statements (unaudited) |
Interest income is accrued daily and bond discounts are accreted and premiums are amortized daily based on the effective interest method. To the extent debt obligations are placed on non-accrual status, any related interest income may be reduced by writing off interest receivables when the collection of all or a portion of interest has been determined to be doubtful based on consistently applied procedures and the fair value has decreased. If the issuer subsequently resumes interest payments or when the collectability of interest is reasonably assured, the debt obligation is removed from non-accrual status.
Dividend income is recognized on the ex-dividend date, except for certain dividends from foreign securities which are recorded as soon as the custodian verifies the ex-dividend date.
Income from foreign securities is recorded net of foreign taxes withheld where recovery of such taxes is not assured.
Federal and other taxes
Each Portfolio is treated as a separate entity for federal income tax purposes. Each Portfolio is not required to pay federal income taxes on its net investment income and net capital gain as it is treated as a partnership for federal income tax purposes. All interest, dividends, gains and losses of the Portfolio are deemed to have been “passed through” to the interestholders in proportion to their holdings of the Portfolio regardless of whether such interest, dividends and gains have been distributed by the Portfolio.
Each Portfolio’s income and federal tax returns and all financial records supporting those returns for the fiscal year since commencement of operations will be subject to examination by the federal revenue authorities.
As of August 31, 2017, the aggregate cost of all investments for federal income tax purposes and the unrealized gains (losses) were as follows:
| | | | | | | | | | | | | | | | |
| | | Tax cost | | | Gross unrealized
gains | | | Gross unrealized
losses | | | Net unrealized
gains (losses) | |
Bloomberg Barclays US Aggregate ex-Corporate Portfolio | | $ | 1,198,697,972 | | | | 9,129,974 | | | | (171,962 | ) | | $ | 8,958,012 | |
Emerging Markets Bond Portfolio | | | 91,831,305 | | | | 1,659,326 | | | | (355,085 | ) | | | 1,304,241 | |
Factor Enhanced Emerging Markets Portfolio | | | 373,863,850 | | | | 17,151,572 | | | | (9,421,431 | ) | | | 7,730,141 | |
Factor Enhanced International Portfolio | | | 1,174,897,316 | | | | 127,779,296 | | | | (19,526,158 | ) | | | 108,253,138 | |
Factor Enhanced Large Cap Portfolio | | | 1,747,807,420 | | | | 423,052,856 | | | | (19,653,038 | ) | | | 403,399,818 | |
Factor Enhanced Small Cap Portfolio | | | 539,665,994 | | | | 35,638,250 | | | | (36,198,217 | ) | | | (559,967 | ) |
High Yield Corporate Bond Portfolio | | | 94,926,478 | | | | 412,585 | | | | (1,016,335 | ) | | | (603,750 | ) |
Investment Grade Corporate Bond Portfolio | | | 549,748,667 | | | | 26,261,006 | | | | (1,082,519 | ) | | | 25,178,487 | |
Strategic Retirement Bond Portfolio | | | 144,297,273 | | | | 1,050,266 | | | | (325 | ) | | | 1,049,941 | |
U.S. REIT Portfolio | | | 53,242,472 | | | | 6,703,091 | | | | (1,023,771 | ) | | | 5,679,320 | |
3. FAIR VALUATION MEASUREMENTS
Fair value measurements of investments are determined within a framework that has established a fair value hierarchy based upon the various data inputs utilized in determining the value of each Portfolio’s investments. The three-level hierarchy gives the highest priority to unadjusted quoted prices in active markets for identical assets or liabilities (Level 1) and the lowest priority to unobservable inputs (Level 3). Each Portfolio’s investments are classified within the fair value hierarchy based on the lowest level of input that is significant to the fair value measurement. The inputs are summarized into three broad levels as follows:
| ∎ | | Level 1 – quoted prices in active markets for identical securities |
| ∎ | | Level 2 – other significant observable inputs (including quoted prices for similar securities, interest rates, prepayment speeds, credit risk, etc.) |
| ∎ | | Level 3 – significant unobservable inputs (including the Portfolio’s own assumptions in determining the fair value of investments) |
The inputs or methodologies used for valuing investments in securities are not necessarily an indication of the risk associated with investing in those securities.
| | | | | | |
| Notes to financial statements (unaudited) | | Wells Fargo Target Date Funds | | | 259 | |
The following is a summary of the inputs used in valuing each Portfolio’s assets and liabilities as of August 31, 2017:
| | | | | | | | | | | | | | | | |
| Bloomberg Barclays US Aggregate ex-Corporate Portfolio | | Quoted prices
(Level 1) | | | Other significant
observable inputs
(Level 2) | | | Significant
unobservable inputs
(Level 3) | | | Total | |
Assets | | | | | | | | | | | | | | | | |
Investments in: | | | | | | | | | | | | | | | | |
| | | | |
Agency securities | | $ | 0 | | | $ | 456,522,928 | | | $ | 0 | | | $ | 456,522,928 | |
| | | | |
Asset-backed securities | | | 0 | | | | 7,564,083 | | | | 0 | | | | 7,564,083 | |
| | | | |
Municipal obligations | | | 0 | | | | 9,364,713 | | | | 0 | | | | 9,364,713 | |
| | | | |
Non-agency mortgage-backed securities | | | 0 | | | | 18,179,423 | | | | 0 | | | | 18,179,423 | |
| | | | |
U.S. Treasury securities | | | 549,782,747 | | | | 0 | | | | 0 | | | | 549,782,747 | |
| | | | |
Yankee corporate bonds and notes | | | 0 | | | | 11,412,051 | | | | 0 | | | | 11,412,051 | |
| | | | |
Yankee government bonds | | | 0 | | | | 56,870,816 | | | | 0 | | | | 56,870,816 | |
| | | | |
Short-term investments | | | | | | | | | | | | | | | | |
Investment companies | | | 97,959,223 | | | | 0 | | | | 0 | | | | 97,959,223 | |
Total assets | | $ | 647,741,970 | | | $ | 559,914,014 | | | $ | 0 | | | $ | 1,207,655,984 | |
| | | | | | | | | | | | | | | | |
| Emerging Markets Bond Portfolio | | Quoted prices
(Level 1) | | | Other significant
observable inputs
(Level 2) | | | Significant
unobservable inputs
(Level 3) | | | Total | |
Assets | | | | | | | | | | | | | | | | |
Investments in: | | | | | | | | | | | | | | | | |
| | | | |
Participation notes | | $ | 0 | | | $ | 1,073,760 | | | $ | 0 | | | $ | 1,073,760 | |
| | | | |
Yankee corporate bonds and notes | | | 0 | | | | 13,729,623 | | | | 0 | | | | 13,729,623 | |
| | | | |
Yankee government bonds | | | 0 | | | | 76,615,322 | | | | 0 | | | | 76,615,322 | |
| | | | |
Short-term investments | | | | | | | | | | | | | | | | |
Investment companies | | | 1,716,841 | | | | 0 | | | | 0 | | | | 1,716,841 | |
Total assets | | $ | 1,716,841 | | | $ | 91,418,705 | | | $ | 0 | | | $ | 93,135,546 | |
| | | | |
| 260 | | Wells Fargo Target Date Funds | | Notes to financial statements (unaudited) |
| | | | | | | | | | | | | | | | |
| Factor Enhanced Emerging Markets Portfolio | | Quoted prices
(Level 1) | | | Other significant
observable inputs
(Level 2) | | | Significant
unobservable inputs
(Level 3) | | | Total | |
Assets | | | | | | | | | | | | | | | | |
Investments in: | | | | | | | | | | | | | | | | |
| | | | |
Common stocks | | | | | | | | | | | | | | | | |
Brazil | | $ | 15,458,075 | | | $ | 0 | | | $ | 0 | | | $ | 15,458,075 | |
Chile | | | 10,612,287 | | | | 0 | | | | 0 | | | | 10,612,287 | |
China | | | 47,936,556 | | | | 0 | | | | 0 | | | | 47,936,556 | |
Colombia | | | 2,237,874 | | | | 0 | | | | 0 | | | | 2,237,874 | |
Greece | | | 1,188,509 | | | | 0 | | | | 0 | | | | 1,188,509 | |
India | | | 10,271,954 | | | | 0 | | | | 0 | | | | 10,271,954 | |
Indonesia | | | 5,668,841 | | | | 0 | | | | 0 | | | | 5,668,841 | |
Luxembourg | | | 274,429 | | | | 0 | | | | 0 | | | | 274,429 | |
Malaysia | | | 18,034,431 | | | | 0 | | | | 0 | | | | 18,034,431 | |
Mexico | | | 16,535,362 | | | | 0 | | | | 0 | | | | 16,535,362 | |
Philippines | | | 6,422,556 | | | | 0 | | | | 0 | | | | 6,422,556 | |
Poland | | | 7,948,364 | | | | 0 | | | | 0 | | | | 7,948,364 | |
Russia | | | 7,454,307 | | | | 0 | | | | 0 | | | | 7,454,307 | |
South Africa | | | 14,252,888 | | | | 0 | | | | 0 | | | | 14,252,888 | |
South Korea | | | 69,599,089 | | | | 184,769 | | | | 0 | | | | 69,783,858 | |
Taiwan | | | 57,739,870 | | | | 0 | | | | 0 | | | | 57,739,870 | |
Thailand | | | 19,400,640 | | | | 0 | | | | 0 | | | | 19,400,640 | |
Turkey | | | 6,557,884 | | | | 0 | | | | 0 | | | | 6,557,884 | |
| | | | |
Exchange-traded funds | | | 34,531,191 | | | | 0 | | | | 0 | | | | 34,531,191 | |
| | | | |
Preferred stocks | | | | | | | | | | | | | | | | |
Brazil | | | 13,956,831 | | | | 0 | | | | 0 | | | | 13,956,831 | |
Chile | | | 518,403 | | | | 0 | | | | 0 | | | | 518,403 | |
Colombia | | | 1,079,770 | | | | 0 | | | | 0 | | | | 1,079,770 | |
Russia | | | 527,668 | | | | 0 | | | | 0 | | | | 527,668 | |
| | | | |
Short-term investments | | | | | | | | | | | | | | | | |
Investment companies | | | 13,203,143 | | | | 0 | | | | 0 | | | | 13,203,143 | |
| | | 381,410,922 | | | | 184,769 | | | | 0 | | | | 381,595,691 | |
| | | | |
Future contracts | | | 6,108 | | | | 0 | | | | 0 | | | | 6,108 | |
Forward foreign currency contracts | | | 733 | | | | 0 | | | | 0 | | | | 733 | |
Total assets | | $ | 381,417,763 | | | $ | 184,769 | | | $ | 0 | | | $ | 381,602,532 | |
| | | | | | |
| Notes to financial statements (unaudited) | | Wells Fargo Target Date Funds | | | 261 | |
| | | | | | | | | | | | | | | | |
| Factor Enhanced International Portfolio | | Quoted prices
(Level 1) | | | Other significant
observable inputs
(Level 2) | | | Significant
unobservable inputs
(Level 3) | | | Total | |
Assets | | | | | | | | | | | | | | | | |
Investments in: | | | | | | | | | | | | | | | | |
| | | | |
Common stocks | | | | | | | | | | | | | | | | |
Australia | | $ | 112,333,081 | | | $ | 0 | | | $ | 0 | | | $ | 112,333,081 | |
Austria | | | 5,300,044 | | | | 0 | | | | 0 | | | | 5,300,044 | |
Belgium | | | 7,882,358 | | | | 0 | | | | 0 | | | | 7,882,358 | |
Canada | | | 124,356,739 | | | | 0 | | | | 0 | | | | 124,356,739 | |
China | | | 2,636,654 | | | | 0 | | | | 0 | | | | 2,636,654 | |
Czech Republic | | | 720,277 | | | | 0 | | | | 0 | | | | 720,277 | |
Denmark | | | 24,288,891 | | | | 0 | | | | 0 | | | | 24,288,891 | |
Finland | | | 12,696,885 | | | | 0 | | | | 0 | | | | 12,696,885 | |
France | | | 109,879,982 | | | | 0 | | | | 0 | | | | 109,879,982 | |
Germany | | | 119,024,430 | | | | 0 | | | | 0 | | | | 119,024,430 | |
Hong Kong | | | 36,408,865 | | | | 0 | | | | 0 | | | | 36,408,865 | |
Ireland | | | 4,836,093 | | | | 0 | | | | 0 | | | | 4,836,093 | |
Italy | | | 12,446,090 | | | | 0 | | | | 0 | | | | 12,446,090 | |
Japan | | | 198,387,267 | | | | 0 | | | | 0 | | | | 198,387,267 | |
Luxembourg | | | 3,347,632 | | | | 0 | | | | 0 | | | | 3,347,632 | |
Netherlands | | | 45,290,914 | | | | 0 | | | | 0 | | | | 45,290,914 | |
New Zealand | | | 3,578,075 | | | | 0 | | | | 0 | | | | 3,578,075 | |
Norway | | | 7,161,532 | | | | 0 | | | | 0 | | | | 7,161,532 | |
Portugal | | | 2,429,831 | | | | 0 | | | | 0 | | | | 2,429,831 | |
Singapore | | | 19,748,045 | | | | 0 | | | | 0 | | | | 19,748,045 | |
Spain | | | 35,101,022 | | | | 0 | | | | 0 | | | | 35,101,022 | |
Sweden | | | 41,406,670 | | | | 0 | | | | 0 | | | | 41,406,670 | |
Switzerland | | | 94,922,089 | | | | 0 | | | | 0 | | | | 94,922,089 | |
Thailand | | | 640,325 | | | | 0 | | | | 0 | | | | 640,325 | |
United Kingdom | | | 193,533,832 | | | | 0 | | | | 0 | | | | 193,533,832 | |
| | | | |
Preferred stocks | | | | | | | | | | | | | | | | |
Germany | | | 7,050,380 | | | | 0 | | | | 0 | | | | 7,050,380 | |
| | | | |
Rights | | | | | | | | | | | | | | | | |
Sweden | | | 0 | | | | 12,399 | | | | 0 | | | | 12,399 | |
| | | | |
Short-term investments | | | | | | | | | | | | | | | | |
Investment companies | | | 57,687,125 | | | | 0 | | | | 0 | | | | 57,687,125 | |
| | | 1,283,095,128 | | | | 12,399 | | | | 0 | | | | 1,283,107,527 | |
Future contracts | | | 454,609 | | | | 0 | | | | 0 | | | | 454,609 | |
Total assets | | $ | 1,283,549,737 | | | $ | 12,399 | | | $ | 0 | | | $ | 1,283,562,136 | |
| | | | |
| 262 | | Wells Fargo Target Date Funds | | Notes to financial statements (unaudited) |
| | | | | | | | | | | | | | | | |
| Factor Enhanced Large Cap Portfolio | | Quoted prices
(Level 1) | | | Other significant
observable inputs
(Level 2) | | | Significant
unobservable inputs
(Level 3) | | | Total | |
Assets | | | | | | | | | | | | | | | | |
Investments in: | | | | | | | | | | | | | | | | |
| | | | |
Common stocks | | | | | | | | | | | | | | | | |
Consumer discretionary | | $ | 257,342,755 | | | $ | 0 | | | $ | 0 | | | $ | 257,342,755 | |
Consumer staples | | | 238,155,844 | | | | 0 | | | | 0 | | | | 238,155,844 | |
Energy | | | 89,414,267 | | | | 0 | | | | 0 | | | | 89,414,267 | |
Financials | | | 174,548,021 | | | | 0 | | | | 0 | | | | 174,548,021 | |
Health care | | | 342,639,297 | | | | 0 | | | | 0 | | | | 342,639,297 | |
Industrials | | | 255,184,369 | | | | 0 | | | | 0 | | | | 255,184,369 | |
Information technology | | | 320,640,891 | | | | 0 | | | | 0 | | | | 320,640,891 | |
Materials | | | 91,059,586 | | | | 0 | | | | 0 | | | | 91,059,586 | |
Real estate | | | 118,080,973 | | | | 0 | | | | 0 | | | | 118,080,973 | |
Telecommunication | | | 59,309,530 | | | | 0 | | | | 0 | | | | 59,309,530 | |
Utilities | | | 99,246,113 | | | | 0 | | | | 0 | | | | 99,246,113 | |
| | | | |
Short-term investments | | | | | | | | | | | | | | | | |
Investment companies | | | 105,054,093 | | | | 0 | | | | 0 | | | | 105,054,093 | |
| | | 2,150,675,739 | | | | 0 | | | | 0 | | | | 2,150,675,739 | |
Future contracts | | | 647,752 | | | | 0 | | | | 0 | | | | 647,752 | |
Total assets | | $ | 2,151,323,491 | | | $ | 0 | | | $ | 0 | | | $ | 2,151,323,491 | |
| | | | | | | | | | | | | | | | |
| Factor Enhanced Small Cap Portfolio | | Quoted prices
(Level 1) | | | Other significant
observable inputs
(Level 2) | | | Significant
unobservable inputs
(Level 3) | | | Total | |
Assets | | | | | | | | | | | | | | | | |
Investments in: | | | | | | | | | | | | | | | | |
| | | | |
Common stocks | | | | | | | | | | | | | | | | |
Consumer discretionary | | $ | 74,602,887 | | | $ | 0 | | | $ | 0 | | | $ | 74,602,887 | |
Consumer staples | | | 18,110,500 | | | | 0 | | | | 0 | | | | 18,110,500 | |
Energy | | | 13,601,342 | | | | 0 | | | | 0 | | | | 13,601,342 | |
Financials | | | 104,827,924 | | | | 0 | | | | 0 | | | | 104,827,924 | |
Health care | | | 65,767,819 | | | | 0 | | | | 0 | | | | 65,767,819 | |
Industrials | | | 77,760,430 | | | | 0 | | | | 0 | | | | 77,760,430 | |
Information technology | | | 73,395,318 | | | | 0 | | | | 0 | | | | 73,395,318 | |
Materials | | | 21,855,320 | | | | 0 | | | | 0 | | | | 21,855,320 | |
Real estate | | | 42,199,297 | | | | 0 | | | | 0 | | | | 42,199,297 | |
Telecommunication | | | 6,510,323 | | | | 0 | | | | 0 | | | | 6,510,323 | |
Utilities | | | 13,086,129 | | | | 0 | | | | 0 | | | | 13,086,129 | |
| | | | |
Short-term investments | | | | | | | | | | | | | | | | |
Investment companies | | | 27,168,625 | | | | 0 | | | | 0 | | | | 27,168,625 | |
| | | 538,885,914 | | | | 0 | | | | 0 | | | | 538,885,914 | |
Future contracts | | | 294,345 | | | | 0 | | | | 0 | | | | 294,345 | |
Total assets | | $ | 539,180,259 | | | $ | 0 | | | $ | 0 | | | $ | 539,180,259 | |
| | | | | | | | | | | | | | | | |
| High Yield Corporate Bond Portfolio | | Quoted prices
(Level 1) | | | Other significant
observable inputs
(Level 2) | | | Significant
unobservable inputs
(Level 3) | | | Total | |
Assets | | | | | | | | | | | | | | | | |
Investments in: | | | | | | | | | | | | | | | | |
| | | | |
Corporate bonds and notes | | $ | 0 | | | $ | 72,134,153 | | | $ | 0 | | | $ | 72,134,153 | |
| | | | |
Yankee corporate bonds and notes | | | 0 | | | | 17,992,310 | | | | 0 | | | | 17,992,310 | |
| | | | |
Short-term investments | | | | | | | | | | | | | | | | |
Investment companies | | | 4,196,265 | | | | 0 | | | | 0 | | | | 4,196,265 | |
Total assets | | $ | 4,196,265 | | | $ | 90,126,463 | | | $ | 0 | | | $ | 94,322,728 | |
| | | | | | |
| Notes to financial statements (unaudited) | | Wells Fargo Target Date Funds | | | 263 | |
| | | | | | | | | | | | | | | | |
| Investment Grade Corporate Bond Portfolio | | Quoted prices
(Level 1) | | | Other significant
observable inputs
(Level 2) | | | Significant
unobservable inputs
(Level 3) | | | Total | |
Assets | | | | | | | | | | | | | | | | |
Investments in: | | | | | | | | | | | | | | | | |
| | | | |
Corporate bonds and notes | | $ | 0 | | | $ | 454,996,492 | | | $ | 0 | | | $ | 454,996,492 | |
| | | | |
Yankee corporate bonds and notes | | | 0 | | | | 117,282,531 | | | | 0 | | | | 117,282,531 | |
| | | | |
Short-term investments | | | | | | | | | | | | | | | | |
Investment companies | | | 2,648,131 | | | | 0 | | | | 0 | | | | 2,648,131 | |
Total assets | | $ | 2,648,131 | | | $ | 572,279,023 | | | $ | 0 | | | $ | 574,927,154 | |
| | | | | | | | | | | | | | | | |
| Strategic Retirement Bond Portfolio | | Quoted prices
(Level 1) | | | Other significant
observable inputs
(Level 2) | | | Significant
unobservable inputs
(Level 3) | | | Total | |
Assets | | | | | | | | | | | | | | | | |
Investments in: | | | | | | | | | | | | | | | | |
| | | | |
Agency securities | | $ | 0 | | | $ | 2,830,714 | | | $ | 0 | | | $ | 2,830,714 | |
| | | | |
U.S. Treasury securities | | | 142,006,031 | | | | 0 | | | | 0 | | | | 142,006,031 | |
| | | | |
Short-term investments | | | | | | | | | | | | | | | | |
Investment companies | | | 510,469 | | | | 0 | | | | 0 | | | | 510,469 | |
Total assets | | $ | 142,516,500 | | | $ | 2,830,714 | | | $ | 0 | | | $ | 145,347,214 | |
| | | | | | | | | | | | | | | | |
| U.S. REIT Portfolio | | Quoted prices
(Level 1) | | | Other significant
observable inputs
(Level 2) | | | Significant
unobservable inputs
(Level 3) | | | Total | |
Assets | | | | | | | | | | | | | | | | |
Investments in: | | | | | | | | | | | | | | | | |
| | | | |
Common stocks | | | | | | | | | | | | | | | | |
Real estate | | $ | 58,902,649 | | | $ | 0 | | | $ | 0 | | | $ | 58,902,649 | |
| | | | |
Short-term investments | | | | | | | | | | | | | | | | |
Investment companies | | | 19,143 | | | | 0 | | | | 0 | | | | 19,143 | |
Total assets | | $ | 58,921,792 | | | $ | 0 | | | $ | 0 | | | $ | 58,921,792 | |
Forward foreign currency contracts are reported at their unrealized gains (losses) at measurement date, which represents the change in the contract’s value from trade date. Futures contracts are reported at their variation margin at measurement date, which represents the amount due to the Portfolio at that date. All other assets and liabilities are reported at their market value at measurement date.
The Portfolios recognize transfers between levels within the fair value hierarchy at the end of the reporting period. At August 31, 2017, the Portfolios did not have any transfers into/out of Level 1, Level 2, or Level 3.
4. TRANSACTIONS WITH AFFILIATES
Advisory fees
The Trust has entered into an advisory contract with Funds Management, an indirect wholly owned subsidiary of Wells Fargo & Company (“Wells Fargo”). The adviser is responsible for implementing investment policies and guidelines and for supervising the applicable subadvisers, who are responsible for day-to-day portfolio management of the Portfolios. Pursuant to the contract, Funds Management is entitled to receive an annual advisory fee which is calculated based on the average daily net assets of each Portfolio.
Funds Management has retained the services of subadvisers to provide daily portfolio management to the Portfolios. Funds Management has engaged Wells Capital Management Incorporated (“WellsCap”), Analytic Investors, LLC and First International Advisors, LLC (each an affiliate of Funds Management and an indirect, wholly owned subsidiary of Wells Fargo) as subadvisers.
| | | | |
| 264 | | Wells Fargo Target Date Funds | | Notes to financial statements (unaudited) |
The fees for subadvisory services are borne by Funds Management. The subadvisers are each entitled to receive from Funds Management an annual subadvisory fee which is calculated based on the average daily net assets of each Portfolio.
The annual advisory and subadvisory fee rates for each Portfolio are as follows:
| | | | | | | | | | | | | | | | | | | | |
| | | Advisory fee | | | Effective rate for
the period ended
August 31, 2017 | | | Subadviser | | Subadvisory Fee | |
| | | starting at | | | declining to | | | | | starting at | | declining to | |
Bloomberg Barclays US Aggregate ex-Corporate Portfolio | | | 0.05 | % | | | 0.03 | % | | | 0.05 | % | | WellsCap | | 0.04% | | | 0.03 | % |
Emerging Markets Bond Portfolio | | | 0.25 | | | | 0.21 | | | | 0.25 | | | First International Advisors, LLC | | 0.09 | | | 0.07 | |
Factor Enhanced Emerging Markets Portfolio | | | 0.15 | | | | 0.11 | | | | 0.15 | | | Analytic Investors, LLC | | 0.08 | | | 0.05 | |
Factor Enhanced International Portfolio | | | 0.15 | | | | 0.11 | | | | 0.15 | | | Analytic Investors, LLC | | 0.08 | | | 0.05 | |
Factor Enhanced Large Cap Portfolio | | | 0.10 | | | | 0.06 | | | | 0.10 | | | Analytic Investors, LLC | | 0.06 | | | 0.04 | |
Factor Enhanced Small Cap Portfolio | | | 0.15 | | | | 0.11 | | | | 0.15 | | | Analytic Investors, LLC | | 0.08 | | | 0.05 | |
High Yield Corporate Bond Portfolio | | | 0.25 | | | | 0.21 | | | | 0.25 | | | WellsCap | | 0.09 | | | 0.07 | |
Investment Grade Corporate Bond Portfolio | | | 0.05 | | | | 0.03 | | | | 0.05 | | | WellsCap | | 0.04 | | | 0.03 | |
Strategic Retirement Bond Portfolio | | | 0.05 | | | | 0.03 | | | | 0.05 | | | WellsCap | | 0.04 | | | 0.03 | |
U.S. REIT Portfolio | | | 0.10 | | | | 0.06 | | | | 0.10 | | | WellsCap | | 0.06 | | | 0.04 | |
Interfund transactions
The Portfolios may purchase or sell portfolio investment securities to certain other Wells Fargo affiliates pursuant to Rule 17a-7 of the 1940 Act and under procedures adopted by the Board of Trustees. The procedures have been designed to ensure that these interfund transactions, which do not incur broker commissions, are effected at current market prices. Pursuant to these procedures, the Portfolios had the following in interfund purchases and sales, during the period from May 23, 2017 (commencement of operations) to August 31, 2017:
| | | | | | | | |
| | | Purchases | | | Sales | |
Bloomberg Barclays US Aggregate ex-Corporate Portfolio | | $ | 163,871,963 | | | $ | 0 | |
Emerging Market Bond Portfolio | | | 0 | | | | 0 | |
Factor Enhanced Emerging Markets Portfolio | | | 35,206,126 | | | | 0 | |
Factor Enhanced International Portfolio | | | 406,246,019 | | | | 0 | |
Factor Enhanced Large Cap Portfolio | | | 993,928,569 | | | | 0 | |
Factor Enhanced Small Cap Portfolio | | | 92,323,909 | | | | 0 | |
High Yield Corporate Bond Portfolio | | | 0 | | | | 0 | |
Investment Grade Corporate Bond Portfolio | | | 513,417,528 | | | | 0 | |
Strategic Retirement Bond Portfolio | | | 0 | | | | 0 | |
U.S. REIT Portfolio | | | 18,613,862 | | | | 0 | |
| | | | | | |
| Notes to financial statements (unaudited) | | Wells Fargo Target Date Funds | | | 265 | |
5. INVESTMENT PORTFOLIO TRANSACTIONS
Purchases and sales of investments, excluding short-term securities, for the period from May 23, 2017 (commencement of operations) to August 31, 2017 were as follows:
| | | | | | | | | | | | | | | | |
| | | Purchase at cost | | | Sales proceeds | |
| | | U.S. government | | | Non-U.S.
government | | | U.S.
government | | | Non-U.S.
government | |
Bloomberg Barclays US Aggregate ex-Corporate Portfolio | | $ | 1,999,788,197 | | | $ | 115,788,778 | | | $ | 999,007,326 | | | $ | 11,262,127 | |
Emerging Markets Bond Portfolio | | | 72,064,405 | | | | 103,199,725 | | | | 72,090,045 | | | | 12,256,584 | |
Factor Enhanced Emerging Markets Portfolio | | | 0 | | | | 460,495,597 | | | | 0 | | | | 94,449,676 | |
Factor Enhanced International Portfolio | | | 0 | | | | 1,551,581,387 | | | | 0 | | | | 286,738,311 | |
Factor Enhanced Large Cap Portfolio | | | 0 | | | | 2,290,004,060 | | | | 0 | | | | 145,028,229 | |
Factor Enhanced Small Cap Portfolio | | | 0 | | | | 554,840,929 | | | | 0 | | | | 15,441,735 | |
High Yield Corporate Bond Portfolio | | | 43,443,126 | | | | 115,801,298 | | | | 43,458,079 | | | | 24,168,842 | |
Investment Grade Corporate Bond Portfolio | | | 0 | | | | 177,432,409 | | | | 54,737,246 | | | | 79,960,499 | |
Strategic Retirement Bond Portfolio | | | 287,584,847 | | | | 2,234,985 | | | | 143,795,649 | | | | 2,236,031 | |
U.S. REIT Portfolio | | | 0 | | | | 64,468,605 | | | | 0 | | | | 3,367,899 | |
6. DERIVATIVE TRANSACTIONS
During the period from May 23, 2017 (commencement of operations) to August 31, 2017, Factor Enhanced Emerging Markets Portfolio, Factor Enhanced International Portfolio, Factor Enhanced Large Cap Portfolio and Factor Enhanced Small Cap Portfolio entered into futures contracts to gain market exposure and Factor Enhanced Emerging Markets Portfolio entered into forward foreign currency contracts for economic hedging purposes. High Yield Corporate Bond Portfolio entered into credit default swaps contracts as a substitute for taking a position in the underlying security or basket of securities or to potentially enhance the Portfolio’s total return.
The table below discloses the volume of the each Portfolio’s derivative transactions and any segregated cash during the period from May 23, 2017 (commencement of operations) to August 31, 2017.
| | | | | | | | | | | | | | | | | | | | |
| | | Factor
Enhanced
Emerging
Markets
Portfolio | | | Factor
Enhanced
International
Portfolio | | | Factor
Enhanced
Large Cap
Portfolio | | | Factor
Enhanced
Small Cap
Portfolio | | | High Yield
Corporate Bond
Portfolio | |
Futures contracts | | | | | | | | | | | | | | | | | | | | |
Average notional balance on long futures | | $ | 7,134,646 | | | $ | 8,904,153 | | | $ | 22,414,059 | | | $ | 17,669,647 | | | | N/A | |
Segregated cash at August 31, 2017 | | | 500,773 | | | | 2,276,606 | | | | 3,182,633 | | | | 1,881,663 | | | | N/A | |
Forward contracts | | | | | | | | | | | | | | | | | | | | |
Average contract amounts to buy | | | 445,637 | | | | N/A | | | | N/A | | | | N/A | | | | N/A | |
Credit default swaps | | | | | | | | | | | | | | | | | | | | |
Average notional balance | | | N/A | | | | N/A | | | | N/A | | | | N/A | | | $ | 14,130 | |
Segregated cash at August 31, 2017 | | | N/A | | | | N/A | | | | N/A | | | | N/A | | | | 18,668 | |
A summary of the location of derivative instruments on the financial statements by primary risk exposure for Factor Enhanced Emerging Markets Portfolio is outlined following tables.
The fair value of derivative instruments as of August 31, 2017 was as follows:
| | | | | | | | | | | | |
| | | Asset derivatives | | | Liability derivatives | |
| | | Statement of Assets and Liabilities
location | | Fair value | | | Statement of Assets and Liabilities
location | | Fair value | |
Equity risk | | Receivable for daily variation margin on open futures contracts | | $ | 6,108 | * | | Payable for daily variation margin on open futures contracts | | $ | 0 | * |
Foreign currency risk | | Unrealized gains on forward foreign currency contracts | | | 733 | | | Unrealized losses on forward foreign currency contracts | | | 0 | |
| | | | | $ | 6,841 | | | | | $ | 0 | |
| * | Only the current day’s variation margin as of August 31, 2017 is reported separately on the Statement of Assets and Liabilities. |
| | | | |
| 266 | | Wells Fargo Target Date Funds | | Notes to financial statements (unaudited) |
The effect of derivative instruments on the Statement of Operations for the period from May 23, 2017 (commencement of operations) to August 31, 2017 was as follows for Factor Enhanced Emerging Markets Portfolio:
| | | | | | | | | | | | |
| | | Amount of realized gains (losses) on derivatives | | | Change in unrealized gains (losses) on derivatives | | | Total | |
Equity risk | | $ | (613,640 | ) | | $ | (2,433 | ) | | $ | (616,073 | ) |
Foreign currency risk | | | 13,846 | | | | 733 | | | | 14,579 | |
| | | $ | (599,794 | ) | | $ | (1,700 | ) | | $ | (601,494 | ) |
Factor Enhanced International Portfolio, Factor Enhanced Large Cap Portfolio and Factor Enhanced Small Cap Portfolio each entered into futures transactions. High Yield Corporate Bond Portfolio entered into credit default swap contracts. The fair value, realized gains or losses and change in unrealized gains or losses, on these derivative transactions are reflected in the corresponding financial statement captions.
For certain types of derivative transactions, the Portfolios have entered into International Swaps and Derivatives Association, Inc. master agreements (“ISDA Master Agreements”) or similar agreements with approved counterparties. The ISDA Master Agreements or similar agreements may have requirements to deliver/deposit securities or cash to/with an exchange or broker-dealer as collateral and allows the Portfolios to offset, with each counterparty, certain derivative financial instrument’s assets and/or liabilities with collateral held or pledged. Collateral requirements differ by type of derivative. Collateral or margin requirements are set by the broker or exchange clearinghouse for exchange traded derivatives while collateral terms are contract specific for over-the-counter traded derivatives. Cash collateral that has been pledged to cover obligations of the Portfolios under ISDA Master Agreements or similar agreements, if any, are reported separately in the Statements of Assets and Liabilities. Securities pledged as collateral, if any, are noted in the Portfolio of Investments. With respect to balance sheet offsetting, absent an event of default by the counterparty or a termination of the agreement, the reported amounts of financial assets and financial liabilities in the Statements of Assets and Liabilities are not offset across transactions between the Portfolios and the applicable counterparty. A reconciliation of the gross amounts on the Statements of Assets and Liabilities to the net amounts by derivative type, including any collateral exposure, is as follows:
| | | | | | | | | | | | | | | | | | |
| | | Counterparty | | Gross amounts
of assets in the
Statement of
Assets and
Liabilities | | | Amounts
subject to
netting
agreements | | | Collateral
received | | | Net amount
of assets | |
Factor Enhanced Emerging Markets Portfolio | | Morgan Stanley | | $ | 6,108 | | | $ | 0 | | | $ | 0 | | | $ | 6,108 | |
Factor Enhanced Emerging Markets Portfolio | | State Street Bank | | | 733 | | | | 0 | | | | 0 | | | | 733 | |
Factor Enhanced International Portfolio | | Morgan Stanley | | | 454,609 | | | | 0 | | | | 0 | | | | 454,609 | |
Factor Enhanced Large Cap Portfolio | | Morgan Stanley | | | 647,752 | | | | 0 | | | | 0 | | | | 647,752 | |
Factor Enhanced Small Cap Portfolio | | Morgan Stanley | | | 294,345 | | | | 0 | | | | 0 | | | | 294,345 | |
7. CONCENTRATION RISK
Concentration risks result from exposure to a limited number of sectors, countries or geographical regions. Portfolios that invest a substantial portion of their assets in a sector may be more affected by changes in that sector than would be a fund whose investments are not heavily weighted in any sector. Portfolios that focus their investments in particular countries or geographic regions may be particularly susceptible to economic and political events affecting those countries or regions. The Portfolio of Investments includes information on each Portfolio’s holdings, including sector, country and/or geographical composition, as relevant.
8. INDEMNIFICATION
Under the Trust’s organizational documents, the officers and Trustees have been granted certain indemnification rights against certain liabilities that may arise out of performance of their duties to the Trust. Additionally, in the normal course of business, the Trust may enter into contracts with service providers that contain a variety of indemnification clauses. The Trust’s maximum exposure under these arrangements is dependent on future claims that may be made against the Portfolios and, therefore, cannot be estimated.
| | | | | | |
| Other information (unaudited) | | Wells Fargo Target Date Funds | | | 267 | |
PROXY VOTING INFORMATION
A description of the policies and procedures used to determine how to vote proxies relating to portfolio securities is available without charge, upon request, by calling 1-800-222-8222, visiting our website at wellsfargofunds.com, or visiting the SEC website at sec.gov. Information regarding how the proxies related to portfolio securities were voted during the most recent 12-month period ended June 30 is available on the website at wellsfargofunds.com or by visiting the SEC website at sec.gov.
PORTFOLIO HOLDINGS INFORMATION
The complete portfolio holdings are publicly available on the website (wellsfargofunds.com) on a one-month delayed basis. In addition, top ten holdings information (excluding derivative positions) is publicly available on the website on a monthly, seven-day or more delayed basis. Each Fund and Portfolio files its complete schedule of portfolio holdings with the SEC for the first and third quarters of each fiscal year on Form N-Q, which is available by visiting the SEC website at sec.gov. In addition, each Form N-Q may be reviewed and copied at the SEC’s Public Reference Room in Washington, DC, and at regional offices in New York City, at 233 Broadway, and in Chicago, at 175 West Jackson Boulevard, Suite 900. Information about the Public Reference Room may be obtained by calling 1-800-SEC-0330.
| | | | |
| 268 | | Wells Fargo Target Date Funds | | Other information (unaudited) |
BOARD CONSIDERATION OF INVESTMENT ADVISORY, INVESTMENT MANAGEMENT AND SUB-ADVISORY AGREEMENTS:
Wells Fargo Target Today Fund, Wells Fargo Target 2010 Fund, Wells Fargo Target 2015 Fund, Wells Fargo Target 2020 Fund, Wells Fargo Target 2025 Fund, Wells Fargo Target 2030 Fund, Wells Fargo Target 2035 Fund, Wells Fargo Target 2040 Fund, Wells Fargo Target 2045 Fund, Wells Fargo Target 2050 Fund, Wells Fargo Target 2055 Fund, Wells Fargo Target 2060 Fund, Wells Fargo Diversified Fixed Income Portfolio, Wells Fargo Diversified Stock Portfolio, Wells Fargo Short-Term Investment Portfolio
Under the Investment Company Act of 1940 (the “1940 Act”), the Board of Trustees (each, a “Board” and collectively, the “Boards”) of each of Wells Fargo Funds Trust (“Funds Trust”) and Wells Fargo Master Trust (“Master Trust”) (collectively, the “Trusts”), must determine annually whether to approve the continuation of the Trusts’ investment management, advisory and sub-advisory agreements, as applicable. In this regard, at an in-person meeting held on May 16-17, 2017 (the “Meeting”), the Funds Trust Board, all the members of which have no direct or indirect interest in the investment management agreement and are not “interested persons” of the Trusts, as defined in the 1940 Act (the “Independent Trustees”), reviewed and approved for each of the funds of Funds Trust identified above (individually, a “Target Date Fund” and collectively, the “Target Date Funds”): (i) an investment management agreement (the “Target Date Fund Management Agreement”) with Wells Fargo Funds Management, LLC (“Funds Management”); and (ii) an investment sub-advisory agreement (the “Funds Trust Sub-Advisory Agreement”) with Global Index Advisors, Inc. (“GIA”).
At the Meeting, the Master Trust Board, all the members of which have no direct or indirect interest in the investment advisory and sub-advisory agreements and are Independent Trustees, reviewed and approved: (i) an investment advisory agreement (the “Master Portfolio Advisory Agreement”) with Funds Management for each of the portfolios of Master Trust identified in the table below (individually, a “Master Portfolio” and collectively, the “Master Portfolios”); and (ii) an investment sub-advisory agreement (each, a “Master Trust Sub-Advisory Agreement”, and together with the Funds Trust Sub-Advisory Agreement, the “Sub-Advisory Agreements”) with the sub-adviser identified in the chart below for the corresponding Master Portfolio identified in the chart:
| | |
| Master Portfolio | | Sub-Adviser |
Wells Fargo Diversified Fixed Income Portfolio | | SSgA Funds Management, Inc. (“SSgA”) |
Wells Fargo Diversified Stock Portfolio | | SSgA |
Wells Fargo Short-Term Investment Portfolio | | Wells Capital Management Incorporated (“Wells Capital Management”) |
The Target Date Funds and the Master Portfolios are collectively referred to as the “Funds.” Wells Capital Management, GIA and SSgA are collectively referred to as the “Sub-Advisers,” and the Target Date Fund Management Agreement, Master Portfolio Advisory Agreement and the Sub-Advisory Agreements are collectively referred to as the “Advisory Agreements.” The Target Date Funds are gateway blended funds that each invests all of its assets in the Master Portfolios.
At the Meeting, the Boards considered the factors and reached the conclusions described below relating to the selection of Funds Management and the Sub-Advisers and the approval of the Advisory Agreements. Prior to the Meeting, including at an in-person meeting in April 2017, the Trustees conferred extensively among themselves and with representatives of Funds Management about these matters. Also, the Boards have adopted a team-based approach, with each team consisting of a sub-set of Trustees, to assist the full Boards in the discharge of their duties in reviewing performance and other matters throughout the year. The Independent Trustees were assisted in their evaluation of the Advisory Agreements by independent legal counsel, from whom they received separate legal advice and with whom they met separately.
In providing information to the Boards, Funds Management and the Sub-Advisers were guided by a detailed set of requests for information submitted to them by independent legal counsel on behalf of the Independent Trustees at the start of the Boards’ annual contract renewal process earlier in 2017. In considering and approving the Advisory Agreements, the Trustees considered the information they believed relevant, including but not limited to the information discussed below. The Boards considered not only the specific information presented in connection with the Meetings, but also the knowledge gained over time through interaction with Funds Management and the Sub-Advisers about various topics. In this regard, the Boards reviewed reports of Funds Management at each of their quarterly meetings, which included, among other things, portfolio reviews and performance reports. In addition, the Boards and the teams mentioned above confer with portfolio managers at various times throughout the year. The Boards did not identify any particular information or consideration that was all-important or controlling, and each individual Trustee may have attributed different weights to various factors.
| | | | | | |
| Other information (unaudited) | | Wells Fargo Target Date Funds | | | 269 | |
The Boards noted that the Funds Trust Board considered and approved at the Meeting and at a previous Funds Trust Board meeting held on April 18-19, 2017, a comprehensive set of changes to enhance the structure and investment strategy of the Target Date Funds (the “Target Date Fund Enhancements”), to take effect later in 2017. The Target Date Enhancements include replacing GIA with Wells Capital Management as the Target Date Funds’ sub-adviser, changing the Target Date Funds’ investment strategies and mix of underlying investments, and reducing each Target Date Funds’ fees and expenses. The Funds Trust Board noted that because the Target Date Fund Enhancements would not take effect immediately, the Funds Trust Board would re-approve the Funds Trust Sub-Advisory Agreement with GIA with respect to the Target Date Funds, with such agreement continuing until the transition to Wells Capital Management as sub-adviser to the Target Date Funds becomes effective.
The Master Trust Board noted that it considered and approved at a Master Trust Board meeting held on March 27, 2017, the merger of the Diversified Fixed Income Portfolio into the newly created Wells Fargo U.S. Investment Grade Corporate Bond Portfolio, and the closure and liquidation of the Diversified Stock Portfolio and the Short-Term Investment Portfolio. The Master Trust Board noted that the Master Portfolio Advisory Agreement and Sub-Advisory Agreement with SSgA with respect to the Diversified Fixed Income Portfolio would continue until the date of the merger of the Diversified Fixed Income Portfolio, that the Master Portfolio Advisory Agreement and Sub-Advisory Agreement with SSgA with respect to the Diversified Stock Portfolio would continue until the date of its liquidation, and that the Master Portfolio Advisory Agreement and Sub-Advisory Agreement with Wells Capital Management with respect to the Short-Term Investment Portfolio would continue until the date of its liquidation.
After its deliberations, the Funds Trust Board unanimously approved the continuation of the Target Date Fund Management Agreement and the Funds Trust Sub-Advisory Agreement for a one-year term. Additionally, after its deliberations, the Master Trust Board unanimously approved the continuation of the Master Portfolio Advisory Agreement and each Master Trust Sub-Advisory Agreement for a one-year term. The Boards also determined that the compensation payable to Funds Management and each of the Sub-Advisers was reasonable. The Boards considered the approval of the Advisory Agreements for the Funds as part of their consideration of agreements for funds across the complex, but their approvals were made on a fund-by-fund basis. The following summarizes a number of important, but not necessarily all, factors considered by the Boards in support of their approvals.
Nature, extent and quality of services
The Boards received and considered various information regarding the nature, extent and quality of services provided to the Funds by Funds Management and the Sub-Advisers under the Advisory Agreements. This information included a description of the investment advisory services and Fund-level administrative services, as well as, among other things, a summary of the background and experience of senior management of Funds Management, a summary of certain organizational and/or personnel changes involving Funds Management and Wells Capital Management, and a description of Funds Management’s and the Sub-Advisers’ business continuity planning programs and of their approaches to data privacy and cybersecurity. The Board also considered qualifications, background, tenure and responsibilities of each of the portfolio managers primarily responsible for the day-to-day portfolio management of the Funds.
The Boards evaluated the ability of Funds Management and the Sub-Advisers to attract and retain qualified investment professionals, including research, advisory and supervisory personnel. The Boards further considered the compliance programs and compliance records of Funds Management and the Sub-Advisers. In addition, the Boards took into account the full range of services provided to the Funds by Funds Management and its affiliates.
Investment performance and expenses
The Boards considered the investment performance results for each of the Funds over various time periods ended December 31, 2016. The Boards considered these results in comparison to the investment performance of funds in a universe that was determined by Broadridge Inc. (“Broadridge”) to be similar to the respective Fund (each, a “Universe”), and in comparison to each Fund’s benchmark index and to other comparative data. Broadridge is an independent provider of investment company data. The Boards received a description of the methodology used by Broadridge to select the mutual funds in each performance Universe.
The Funds Trust Board noted that the investment performance of each Target Date Fund (Administrator Class) relative to its respective Universe was as follows: (i) the performance of the Wells Fargo Target Today Fund was lower than the average performance of its Universe for all periods under review except the ten-year period; (ii) the performance of the Wells Fargo Target 2010 Fund was lower than the average performance of its Universe for all periods under review except the ten-year period; (iii) the performance of the Wells Fargo Target 2015 Fund was lower than the average performance of
| | | | |
| 270 | | Wells Fargo Target Date Funds | | Other information (unaudited) |
its Universe for all periods under review; (iv) the performance of the Wells Fargo Target 2020 Fund was lower than the average performance of its Universe for all periods under review except the ten-year period; (v) the performance of the Wells Fargo Target 2025 Fund was lower than the average performance of its Universe for all periods under review; (vi) the performance of the Wells Fargo Target 2030 Fund was higher than or in range of the average performance of its Universe for all periods under review except the five-year period; (vii) the performance of the Wells Fargo Target 2035 Fund was higher than or in range of the average performance of its Universe for all periods under review except the five-year period; (viii) the performance of the Wells Fargo Target 2040 Fund was higher than or in range of the average performance of its Universe for all periods under review; (ix) the performance of the Wells Fargo Target 2045 Fund was higher than, equal to or in range of the average performance of its Universe for all periods under review; (x) the performance of the Wells Fargo Target 2050 Fund was higher than or in range of the average performance of its Universe for all periods under review; (xi) the performance of the Wells Fargo Target 2055 Fund was higher than or in range of the average performance of its Universe for all periods under review; and (xii) the performance of the Wells Fargo Target 2060 Fund was higher than the average performance of its Universe for the one-year period. The Funds Trust Board also noted that the performance of each Target Date Fund was lower than the performance of its respective benchmark index for all periods under review.
The Funds Trust Board received information concerning, and discussed factors contributing to, the underperformance for the periods noted above. Funds Management advised the Funds Trust Board that the nearer-dated Target Date Funds have relatively more conservative glidepaths than many competitor funds, and as a result had a lower allocation to equities compared to funds in each respective Target Date Fund’s Universe. Thus, the Funds Trust Board was advised that underperformance of the nearer-dated Target Date Funds relative to their respective Universes was to be expected during periods in which the equity markets posted strong gains. The Funds Trust Board noted that the Target Date Funds’ underperformance relative to their benchmarks was largely attributable to fees charged to the Target Date Funds (which are not charged to a benchmark index). The Funds Trust Board also noted the Target Date Enhancements include changes to the Target Date Funds’ investment strategies and mix of underlying investments.
The Master Trust Board noted that the investment performance of the Diversified Stock Portfolio was higher than or in range of the average performance of its Universe for all periods under review except the three- and five-year periods. The Master Trust Board also noted that the investment performance of the Diversified Stock Portfolio was higher than or in range of the performance of its benchmark, the Dow Jones Stock CMAC Index, for all periods under review. The Master Trust Board was advised that the underperformance of the Diversified Stock Portfolio relative to its Universe for the periods noted above was largely attributable to sector allocation. The Master Trust Board also noted that it previously approved the closure and liquidation of the Diversified Stock Portfolio in connection with the Target Date Enhancements.
The Master Trust Board noted that the investment performance of the Diversified Fixed Income Portfolio was lower than the average performance of its Universe for all periods under review. The Master Trust Board also noted that the investment performance of the Diversified Fixed Income Portfolio was in range of the performance of its benchmark, the Dow Jones Bond CMAC Index, for the three-year period under review, but lower than its benchmark for the one- and five-year periods under review. The Master Trust Board was advised that the underperformance of the Diversified Fixed Income Portfolio relative to its Universe and benchmark for the periods noted above was largely attributable to sector allocation. The Master Trust Board also noted that it had previously approved merging the Diversified Fixed Income Portfolio into the new Wells Fargo U.S. Investment Grade Corporate Bond Portfolio in connection with the Target Date Enhancements.
The Master Trust Board also noted that the investment performance of the Short-Term Investment Portfolio was lower than the average performance of its Universe for all periods under review. The Master Trust Board also noted that the investment performance of the Short-Term Investment Portfolio was higher than the performance of its benchmark, the Bloomberg Barclays U.S. Treasury Bill 1-3 Month Index, for the three-, five- and ten-year periods under review, but lower than its benchmark for the one-year period under review. The Master Trust Board was advised that the underperformance of the Short-Term Investment Portfolio relative to its Universe for the periods noted above was largely attributable to the fact that the Short-Term Investment Portfolio is managed using a strategy similar to that of a money market fund, while the other funds in the Universe are managed with strategies that are less similar to those utilized by money market funds. The Master Trust Board also noted that it previously approved the closure and liquidation of the Short-Term Investment Portfolio in connection with the Target Date Enhancements.
The Funds Trust Board also received and considered information regarding each Target Date Fund’s net operating expense ratios, which include fees and expenses of the corresponding Master Portfolio, and their various components, including actual management fees assessed at both the Target Date Fund level and the Master Portfolio level, custodian
| | | | | | |
| Other information (unaudited) | | Wells Fargo Target Date Funds | | | 271 | |
and other non-management fees, and Rule 12b-1 and non-Rule 12b-1 shareholder service fees. The Funds Trust Board considered these ratios in comparison to the median ratios of funds in class-specific expense groups that were determined by Broadridge to be similar to each Target Date Fund (the “Groups”). The Funds Trust Board received a description of the methodology used by Broadridge to select the mutual funds in the expense Groups and an explanation of how funds comprising expense groups and their expense ratios may vary from year-to-year. Based on the Broadridge reports, the Funds Trust Board noted that the net operating expense ratios of each Target Date Fund were lower than the median net operating expense ratios of its respective expense Groups for all share classes.
With respect to the Master Portfolios, the Master Trust Board reviewed the fee rates that are payable to Funds Management for investment advisory services (as discussed below), which are the only fees charged at the Master Portfolio level, relative to a corresponding expense Group.
The Boards took into account the Fund performance and expense information provided to them among the factors considered in deciding to re-approve the Advisory Agreements.
Investment management, advisory and sub-advisory fee rates
The Funds Trust Board reviewed and considered the fee rates that are payable by each Target Date Fund to Funds Management under the Target Date Fund Management Agreement, as well as the contractual fee rates payable by each Target Date Fund to Funds Management for class-level administrative services under a Class-Level Administration Agreement, which include, among other things, class-level transfer agency and sub-transfer agency costs (collectively, the “Management Rates”). The Master Trust Board reviewed and considered the contractual investment advisory fee rates that are payable by the Master Portfolios to Funds Management for investment advisory services under the Master Portfolio Advisory Agreement (the “Advisory Agreement Rates”). The Boards also reviewed and considered the contractual investment sub-advisory fee rates that are payable by Funds Management to the Sub-Advisers for investment sub-advisory services (the “Sub-Advisory Agreement Rates”).
Among other information reviewed by the Funds Trust Board was a comparison of each Target Date Fund’s Management Rate, each of which do not include the advisory fees paid at the Master Portfolio level, with the average contractual investment management fee rates of funds in the expense Groups at a common asset level, as well as transfer agency costs of the funds in the expense Groups. The Funds Trust Board noted that the Management Rates of each Target Date Fund were lower than the sum of the management fee rates and transfer agency costs of its respective expense Groups for all share classes.
The Master Trust Board reviewed a comparison of the Advisory Agreement Rates of each Master Portfolio with those of other funds in each Master Portfolio’s respective expense Group at a common asset level. The Master Trust Board noted that the Advisory Agreement Rates of each Master Portfolio were lower than the median rate for the Master Portfolio’s respective expense Group.
The Boards also received and considered information about the portions of the total management fees that were retained by Funds Management after payment of the fees to the Sub-Advisers for sub-advisory services. With respect to the Target Date Funds, the Diversified Fixed Income Portfolio and the Diversified Stock Portfolio, the Boards considered this amount in comparison to the median amount retained by advisers to funds in a sub-advised expense universe that was determined by Broadridge to be similar to the respective Fund. In assessing the reasonableness of these amounts, the Boards received and evaluated information about the nature and extent of responsibilities retained and risks assumed by Funds Management and not delegated to or assumed by the Sub-Advisers, and about Funds Management’s on-going oversight services. With respect to the Short-Term Investment Portfolio, given the affiliation between Funds Management and Wells Capital Management, the Master Trust Board ascribed limited relevance to the allocation of the advisory fee between them. With respect to GIA and SSgA, the Boards considered that the Sub-Advisory Agreement Rates paid to each of these Sub-Advisers had been negotiated by Funds Management on an arm’s-length basis.
Other than with respect to the Wells Fargo Diversified Stock Portfolio, the Boards also received and considered information about the nature and extent of services offered and fee rates charged by the Sub-Advisers to other types of clients with investment strategies similar to those of the Funds. In this regard, the Boards received information about the significantly greater scope of services, and compliance, reporting and other legal burdens and risks of managing mutual funds compared with those associated with managing assets of non-mutual fund clients such as collective funds or institutional separate accounts.
Based on its consideration of the factors and information it deemed relevant, including those described here, the Funds Trust Board determined that the compensation payable to Funds Management under the Target Date Fund Management Agreement and the compensation payable to GIA under the Funds Trust Sub-Advisory Agreement was reasonable. The
| | | | |
| 272 | | Wells Fargo Target Date Funds | | Other information (unaudited) |
Master Trust Board determined that the compensation payable to Funds Management under the Master Portfolio Advisory Agreement and to SSgA and Wells Capital Management under each Master Trust Sub-Advisory Agreement was reasonable.
Profitability
The Boards received and considered information concerning the profitability of Funds Management, as well as the profitability of Wells Fargo as a whole, from providing services to the Funds and the fund family as a whole. The Boards also received and considered information concerning the profitability of Wells Capital Management from providing services to the fund family as a whole, noting that Wells Capital Management’s profitability information with respect to providing services to the Funds was subsumed in the Wells Fargo and Funds Management profitability analysis. The Boards did not receive or consider profitability information with respect to GIA or SSgA, as the sub-advisory fees paid to them had been negotiated by Funds Management on an arm’s-length basis.
Funds Management reported on the methodologies and estimates used in calculating profitability , including a description of the methodology used to allocate certain expenses. Among other things, the Boards noted that the levels of profitability reported on a fund-by-fund basis varied widely, depending on factors such as the size and type of fund. Based on its review, the Boards did not deem the profits reported by Funds Management or Wells Fargo from its services to the Funds to be at a level that would prevent it from approving the continuation of the Advisory Agreements.
Economies of scale
With respect to possible economies of scale, the Funds Trust Board noted the existence of breakpoints in each Target Date Fund’s management fee structure, and the Master Trust Board noted the existence of breakpoints in each Master Portfolio’s advisory fee structure (except the Short-Term Investment Portfolio), which operate generally to reduce the Funds’ expense ratios as the Funds grow in size. They considered that, for a small fund or a fund that shrinks in size, breakpoints conversely can result in higher fee levels. The Boards also considered that, in addition to management fee breakpoints, competitive fee rates set at the outset without regard to breakpoints and fee waiver and expense reimbursement arrangements are means of sharing potential economies of scale with shareholders of the Funds. The Boards considered Funds Management’s view, which Funds Management indicated was supported by independent third-party industry studies that were summarized for the Boards, that any analyses of potential economies of scale in managing a particular fund are inherently limited in light of the joint and common costs and investments that Funds Management incurs across the fund family as a whole.
The Boards concluded that the Funds’ fee and expense arrangements, including contractual breakpoints, constituted a reasonable approach to sharing potential economies of scale with the Funds and their shareholders.
Other benefits to Funds Management and the Sub-Advisers
The Boards received and considered information regarding potential “fall-out” or ancillary benefits received by Funds Management and its affiliates, including Wells Capital Management, or GIA or SSgA as a result of their relationships with the Funds. Ancillary benefits could include, among others, benefits directly attributable to other relationships with the Funds and benefits potentially derived from an increase in Funds Management’s and the Sub-Advisers’ business as a result of their relationships with the Funds. The Boards noted that various affiliates of Funds Management may receive distribution-related fees, shareholder servicing payments and sub-transfer agency fees in respect of shares sold or held through them and services provided.
The Boards also reviewed information about soft dollar credits earned and utilized by Wells Capital Management, fees earned by Funds Management and Wells Capital Management from managing a private investment vehicle for the fund family’s securities lending collateral and commissions earned by an affiliated broker from portfolio transactions.
Based on their consideration of the factors and information they deemed relevant, including those described here, the Boards did not find that any ancillary benefits received by Funds Management and its affiliates, including Wells Capital Management, or GIA or SSgA were unreasonable.
Conclusion
At the Meeting, after considering the above-described factors and based on its deliberations and its evaluation of the information described above, the Funds Trust Board unanimously approved the continuation of the Target Date Fund Management Agreement and the Funds Trust Sub-Advisory Agreement for a one-year term. Additionally, after its deliberations, the Master Trust Board unanimously approved the continuation of the Master Portfolio Advisory Agreement and each Master Trust Sub-Advisory Agreement for a one-year term. The Boards also determined that the compensation payable to Funds Management and each of the Sub-Advisers was reasonable.
| | | | | | |
| Other information (unaudited) | | Wells Fargo Target Date Funds | | | 273 | |
BOARD OF TRUSTEES AND OFFICERS
Each of the Trustees and Officers1 listed in the table below acts in identical capacities for each fund in the Wells Fargo family of funds, which consists of 152 mutual funds comprising the Wells Fargo Funds Trust, Wells Fargo Variable Trust, Wells Fargo Master Trust and four closed-end funds (collectively the “Fund Complex”). This table should be read in conjunction with the Prospectus and the Statement of Additional Information2. The mailing address of each Trustee and Officer is 525 Market Street, 12th Floor, San Francisco, CA 94105. Each Trustee and Officer serves an indefinite term, however, each Trustee serves such term until reaching the mandatory retirement age established by the Trustees.
Independent Trustees
| | | | | | |
Name and
year of birth | | Position held and length of service* | | Principal occupations during past five years or longer | | Current other public company or
investment company
directorships |
William R. Ebsworth (Born 1957) | | Trustee, since 2015 | | Retired. From 1984 to 2013, equities analyst, portfolio manager, research director and chief investment officer at Fidelity Management and Research Company in Boston, Tokyo, and Hong Kong and retired in 2013 as Chief Investment Officer of Fidelity Strategic Advisers, Inc. where he led a team of investment professionals managing client assets. Prior thereto, Board member of Hong Kong Securities Clearing Co., Hong Kong Options Clearing Corp., the Thailand International Fund, Ltd., Fidelity Investments Life Insurance Company, and Empire Fidelity Investments Life Insurance Company. Board member of the Forté Foundation (non-profit organization) and the Vincent Memorial Hospital Endowment (non-profit organization), where he serves on the Investment Committee and as a Chair of the Audit Committee. Mr. Ebsworth is a CFA® charterholder. | | Asset Allocation Trust |
Jane A. Freeman (Born 1953) | | Trustee, since 2015 | | Retired. From 2012 to 2014 and 1999 to 2008, Chief Financial Officer of Scientific Learning Corporation. From 2008 to 2012, Ms. Freeman provided consulting services related to strategic business projects. Prior to 1999, Portfolio Manager at Rockefeller & Co. and Scudder, Stevens & Clark. Board member of the Harding Loevner Funds from 1996 to 2014, serving as both Lead Independent Director and chair of the Audit Committee. Board member of the Russell Exchange Traded Funds Trust from 2011 to 2012 and the chair of the Audit Committee. Ms. Freeman is a Board Member of Ruth Bancroft Garden (non-profit organization) and an inactive chartered financial analyst. | | Asset Allocation Trust |
Peter G. Gordon** (Born 1942) | | Trustee, since 1998; Chairman, since 2005 | | Co-Founder, Retired Chairman, President and CEO of Crystal Geyser Water Company. Trustee Emeritus, Colby College. | | Asset Allocation Trust |
Isaiah Harris, Jr. (Born 1952) | | Trustee, since 2009 | | Retired. Chairman of the Board of CIGNA Corporation since 2009, and Director since 2005. From 2003 to 2011, Director of Deluxe Corporation. Prior thereto, President and CEO of BellSouth Advertising and Publishing Corp. from 2005 to 2007, President and CEO of BellSouth Enterprises from 2004 to 2005 and President of BellSouth Consumer Services from 2000 to 2003. Emeritus member of the Iowa State University Foundation Board of Governors. Emeritus Member of the Advisory Board of Iowa State University School of Business. Advisory Board Member, Palm Harbor Academy (charter school). Advisory Board Member, Child Evangelism Fellowship (non-profit). Mr. Harris is a certified public accountant (inactive status). | | CIGNA Corporation; Asset Allocation Trust |
Judith M. Johnson (Born 1949) | | Trustee, since 2008; Audit Committee Chairman, since 2008 | | Retired. Prior thereto, Chief Executive Officer and Chief Investment Officer of Minneapolis Employees Retirement Fund from 1996 to 2008. Ms. Johnson is an attorney, certified public accountant and a certified managerial accountant. | | Asset Allocation Trust |
David F. Larcker (Born 1950) | | Trustee, since 2009 | | James Irvin Miller Professor of Accounting at the Graduate School of Business, Stanford University, Director of the Corporate Governance Research Initiative and Senior Faculty of The Rock Center for Corporate Governance since 2006. From 2005 to 2008, Professor of Accounting at the Graduate School of Business, Stanford University. Prior thereto, Ernst & Young Professor of Accounting at The Wharton School, University of Pennsylvania from 1985 to 2005. | | Asset Allocation Trust |
| | | | |
| 274 | | Wells Fargo Target Date Funds | | Other information (unaudited) |
| | | | | | |
Name and
year of birth | | Position held and length of service* | | Principal occupations during past five years or longer | | Current other public company or
investment company
directorships |
Olivia S. Mitchell (Born 1953) | | Trustee, since 2006 | | International Foundation of Employee Benefit Plans Professor, Wharton School of the University of Pennsylvania since 1993. Director of Wharton’s Pension Research Council and Boettner Center on Pensions & Retirement Research, and Research Associate at the National Bureau of Economic Research. Previously, Cornell University Professor from 1978 to 1993. | | Asset Allocation Trust |
Timothy J. Penny (Born 1951) | | Trustee, since 1996: Vice Chairman, since 2017 | | President and Chief Executive Officer of Southern Minnesota Initiative Foundation, a non-profit organization, since 2007 and Senior Fellow at the Humphrey Institute Policy Forum at the University of Minnesota since 1995. Member of the Board of Trustees of NorthStar Education Finance, Inc., a non-profit organization, since 2007. | | Asset Allocation Trust |
Michael S. Scofield (Born 1943) | | Trustee, since 2010 | | Served on the Investment Company Institute’s Board of Governors and Executive Committee from 2008-2011 as well the Governing Council of the Independent Directors Council from 2006-2011 and the Independent Directors Council Executive Committee from 2008-2011. Chairman of the IDC from 2008-2010. Trustee of the Evergreen Funds complex (and its predecessors) from 1984 to 2010. Chairman of the Evergreen Funds from 2000-2010. Former Trustee of the Mentor Funds. Retired Attorney, Law Offices of Michael S. Scofield. | | Asset Allocation Trust |
| * | Length of service dates reflect the Trustee’s commencement of service with the Trust’s predecessor entities, where applicable. |
| ** | Peter Gordon is expected to retire on December 31, 2017. |
Advisory Board Members
| | | | | | |
Name and
year of birth | | Position held and length of service | | Principal occupations during past five years or longer | | Current other public company or
investment company
directorships |
James G. Polisson (Born 1959) | | Advisory Board Member, since 2017 | | Retired. Chief Marketing Officer, Source (ETF) UK Services, Ltd, from 2015 to 2017. From 2012 to 2015, Principal of The Polisson Group, LLC, a management consulting, corporate advisory and principal investing company. Chief Executive Officer and Managing Director at Russell Investments, Global Exchange Traded Funds from 2010 to 2012. Managing Director of Barclays Global Investors from 1998 to 2010 and Global Chief Marketing Officer for iShares and Barclays Global Investors from 2000 to 2010. Prior thereto, Vice President, Fidelity Retail Mutual Fund Group from 1996 to 1998 and Risk Management Practice Manager, Fidelity Consulting from 1995 to 1996. Board member of the Russell Exchange Traded Fund Trust from 2011 to 2012. Director of Barclays Global Investors Holdings Deutschland GmbH from 2006 to 2009. Mr. Polisson is an attorney and has a retired status with the Massachusetts and District of Columbia Bar Associations. | | None |
Pamela Wheelock (Born 1959) | | Advisory Board Member, since 2017 | | Chief Operating Officer, Twin Cities Habitat for Humanity, since January, 2017. Vice President of University Services, University of Minnesota from 2012 to 2017. Prior thereto, Interim President and Chief Executive Officer of Blue Cross Blue Shield of Minnesota from 2010 to 2011, Chairman of the Board from 2009 to 2011 and Board Director from 2003 to 2015. Vice President, Leadership and Community Engagement, Bush Foundation, Saint Paul, Minnesota (a private foundation) from 2009 to 2011. Executive Vice President and Chief Financial Officer, Minnesota Sports and Entertainment from 2004 to 2009 and Senior Vice President from 2002 to 2004. Commissioner of Finance, State of Minnesota, from 1999 to 2002. Currently on the Board of Directors, Governance Committee and Finance Committee, for the Minnesota Philanthropy Partners (Saint Paul Foundation) since 2012 and Board Chair of the Minnesota Wild Foundation since 2010. | | None |
| | | | | | |
| Other information (unaudited) | | Wells Fargo Target Date Funds | | | 275 | |
Officers
| | | | | | |
Name and
year of birth | | Position held and length of service | | Principal occupations during past five years or longer | | |
Andrew Owen (Born 1960) | | President, since 2017 | | Executive Vice President of Wells Fargo & Company and Head of Affiliated Managers, Wells Fargo Asset Management, since 2014. In addition, Mr. Owen is currently President, Chief Executive Officer and Director of Wells Fargo Funds Management, LLC since 2017. Prior thereto, Executive Vice President responsible for marketing, investments and product development for Wells Fargo Funds Management, LLC, from 2009 to 2014. | | |
Jeremy DePalma1 (Born 1974) | | Treasurer, since 2012 | | Senior Vice President of Wells Fargo Funds Management, LLC since 2009. Senior Vice President of Evergreen Investment Management Company, LLC from 2008 to 2010 and head of the Fund Reporting and Control Team within Fund Administration from 2005 to 2010. | | |
C. David Messman (Born 1960) | | Secretary, since 2000; Chief Legal Officer, since 2003 | | Senior Vice President and Secretary of Wells Fargo Funds Management, LLC since 2001. Assistant General Counsel of Wells Fargo Bank, N.A. since 2013 and Vice President and Managing Counsel of Wells Fargo Bank, N.A. from 1996 to 2013. | | |
Michael H. Whitaker (Born 1967) | | Chief Compliance Officer, since 2016 | | Senior Vice President and Chief Compliance Officer since 2016. Senior Vice President and Chief Compliance Officer for Fidelity Investments from 2007 to 2016. | | |
David Berardi (Born 1975) | | Assistant Treasurer, since 2009 | | Vice President of Wells Fargo Funds Management, LLC since 2009. Vice President of Evergreen Investment Management Company, LLC from 2008 to 2010. Manager of Fund Reporting and Control for Evergreen Investment Management Company, LLC from 2004 to 2010. | | |
| 1 | Jeremy DePalma acts as Treasurer of 76 funds and Assistant Treasurer of 76 funds in the Fund Complex. |
| 2 | The Statement of Additional Information includes additional information about the Trustees and is available, without charge, upon request, by calling 1-800-222-8222 or by visiting the website at wellsfargofunds.com. |
| | | | |
| 276 | | Wells Fargo Target Date Funds | | Appendix |
On July 14, 2017, the Wells Fargo Target Blended Indexes were composed of the following indexes:
| | | | | | | | | | | | | | | | | | | | |
| | | Wells Fargo
Target Today
Blended
Index | | | Wells Fargo
Target 2010
Blended
Index | | | Wells Fargo
Target 2015
Blended
Index | | | Wells Fargo
Target 2020
Blended
Index | | | Wells Fargo
Target 2025
Blended
Index | |
Bloomberg Barclays U.S. Aggregate ex-Corporate Index | | | 34.50 | % | | | 32.52 | % | | | 30.06 | % | | | 27.22 | % | | | 23.63 | % |
Bloomberg Barclays U.S. Government Intermediate Bond Index | | | 5.83 | % | | | 5.50 | % | | | 5.08 | % | | | 3.00 | % | | | 1.03 | % |
Bloomberg Barclays U.S. Treasury Inflation Notes: 1-10 Year Index | | | 5.83 | % | | | 5.50 | % | | | 5.08 | % | | | 3.00 | % | | | 1.03 | % |
JP Morgan EMBI Global Diversified Index | | | 2.94 | % | | | 2.77 | % | | | 2.56 | % | | | 2.30 | % | | | 1.99 | % |
Wells Fargo Factor Enhanced Emerging Markets Index (Net) | | | 2.22 | % | | | 2.52 | % | | | 2.89 | % | | | 3.75 | % | | | 4.82 | % |
Wells Fargo Factor Enhanced International Index (Net) | | | 7.41 | % | | | 8.40 | % | | | 9.63 | % | | | 12.50 | % | | | 16.07 | % |
Wells Fargo Factor Enhanced Large Cap Index | | | 14.31 | % | | | 16.22 | % | | | 18.61 | % | | | 23.26 | % | | | 28.66 | % |
Wells Fargo Factor Enhanced Small Cap Index | | | 3.57 | % | | | 4.05 | % | | | 4.64 | % | | | 5.83 | % | | | 7.17 | % |
Wells Fargo U.S. High Yield Bond Index | | | 2.94 | % | | | 2.77 | % | | | 2.56 | % | | | 2.30 | % | | | 1.99 | % |
Wells Fargo U.S. Investment Grade Corporate Bond Index | | | 17.95 | % | | | 16.92 | % | | | 15.64 | % | | | 14.17 | % | | | 12.31 | % |
Wells Fargo U.S. REIT Index | | | 2.50 | % | | | 2.83 | % | | | 3.25 | % | | | 2.67 | % | | | 1.30 | % |
Average annual total returns (%) as of August 31, 2017
| | | | | | | | | | | | |
| | | 1 year | | | 5 year | | | 10 year | |
Bloomberg Barclays U.S. Aggregate ex-Corporate Index1 | | | 0.06 | | | | – | | | | – | |
Bloomberg Barclays U.S. Government Intermediate Bond Index2 | | | 0.09 | | | | 1.12 | | | | 3.21 | |
Bloomberg Barclays U.S. Treasury Inflation Notes: 1-10 Year Index3 | | | 1.12 | | | | 0.27 | | | | 3.43 | |
JP Morgan EMBI Global Diversified Index4 | | | 5.02 | | | | 5.25 | | | | 7.71 | |
Wells Fargo Factor Enhanced Emerging Markets Index (Net)5* | | | – | | | | – | | | | – | |
Wells Fargo Factor Enhanced International Index (Net)6* | | | – | | | | – | | | | – | |
Wells Fargo Factor Enhanced Large Cap Index7* | | | – | | | | – | | | | – | |
Wells Fargo Factor Enhanced Small Cap Index8* | | | – | | | | – | | | | – | |
Wells Fargo U.S. High Yield Bond Index9* | | | – | | | | – | | | | – | |
Wells Fargo U.S. Investment Grade Corporate Bond Index10* | | | – | | | | – | | | | – | |
Wells Fargo U.S. REIT Index11* | | | – | | | | – | | | | – | |
| * | The inception date of the index is April 2017. Performance results for the periods indicated are not yet available. |
| 1 | The Bloomberg Barclays U.S. Aggregate ex Corporate Bond Index is a broad-based benchmark that includes Treasuries, government-related securities, mortgage backed securities (agency fixed-rate and hybrid adjustable rate mortgage pass throughs), asset backed securities and commercial mortgage backed securities (agency and non-agency). You cannot invest directly in an index. |
| 2 | The Bloomberg Barclays U.S. Government Intermediate Bond Index is an unmanaged index composed of U.S. government securities with maturities in the 1- to 10-year range, including securities issued by the U.S. Treasury and U.S. government agencies. You cannot invest directly in an index. |
| 3 | Bloomberg Barclays U.S. Treasury Inflation Notes: 1-10 Year Index measures the performance of the US Treasury Inflation Protected Securities (TIPS) market with maturities more an 1 year and less than 10 years. Federal Reserve holdings of US TIPS are not index eligible and are excluded from the face amount outstanding of each bond in the index. You cannot invest directly in an index. |
| 4 | The J.P. Morgan Emerging Markets Bond Index (“EMBI”) Global Diversified Index is a composite index representing an unleveraged investment in emerging market bonds that is broadly based across the spectrum of emerging market bonds and includes reinvestment of income (to represent real assets). You cannot invest directly in an index. |
| 5 | The Wells Fargo Factor Enhanced Emerging Markets Index (Net) is an index of equity securities that is derived from a universe of companies domiciled in various emerging markets countries and that possess, in aggregate, diversified exposure to investment factors (or characteristics) that are commonly tied to a stock’s potential for enhanced risk-adjusted returns relative to the market. You cannot invest directly in an index. |
| | | | | | |
| Appendix | | Wells Fargo Target Date Funds | | | 277 | |
| | | | | | | | | | | | | | | | | | | | | | | | | | | | | | | | | |
Wells Fargo
Target 2030
Blended
Index | | Wells Fargo
Target 2035
Blended
Index | | Wells Fargo
Target 2040
Blended
Index | | Wells Fargo
Target 2045
Blended
Index | | Wells Fargo
Target 2050
Blended
Index | | Wells Fargo
Target 2055
Blended
Index | | Wells Fargo
Target 2060
Blended
Index |
| | | 18.78 | % | | | | 13.02 | % | | | | 9.47 | % | | | | 6.51 | % | | | | 5.92 | % | | | | 5.92 | % | | | | 5.92 | % |
| | | 0.13 | % | | | | 0.00 | % | | | | 0.00 | % | | | | 0.00 | % | | | | 0.00 | % | | | | 0.00 | % | | | | 0.00 | % |
| | | 0.13 | % | | | | 0.00 | % | | | | 0.00 | % | | | | 0.00 | % | | | | 0.00 | % | | | | 0.00 | % | | | | 0.00 | % |
| | | 1.58 | % | | | | 1.10 | % | | | | 0.80 | % | | | | 0.55 | % | | | | 0.50 | % | | | | 0.50 | % | | | | 0.50 | % |
| | | 5.88 | % | | | | 6.98 | % | | | | 7.63 | % | | | | 8.17 | % | | | | 8.28 | % | | | | 8.28 | % | | | | 8.28 | % |
| | | 19.77 | % | | | | 23.30 | % | | | | 25.47 | % | | | | 27.34 | % | | | | 27.72 | % | | | | 27.72 | % | | | | 27.72 | % |
| | | 33.73 | % | | | | 38.18 | % | | | | 40.72 | % | | | | 42.79 | % | | | | 43.20 | % | | | | 43.20 | % | | | | 43.20 | % |
| | | 8.43 | % | | | | 9.54 | % | | | | 10.18 | % | | | | 10.70 | % | | | | 10.80 | % | | | | 10.80 | % | | | | 10.80 | % |
| | | 1.59 | % | | | | 1.10 | % | | | | 0.80 | % | | | | 0.55 | % | | | | 0.50 | % | | | | 0.50 | % | | | | 0.50 | % |
| | | 9.78 | % | | | | 6.78 | % | | | | 4.93 | % | | | | 3.39 | % | | | | 3.08 | % | | | | 3.08 | % | | | | 3.08 | % |
| | | 0.20 | % | | | | 0.00 | % | | | | 0.00 | % | | | | 0.00 | % | | | | 0.00 | % | | | | 0.00 | % | | | | 0.00 | % |
| 6 | The Wells Fargo Factor Enhanced International Index (Net) is an index of equity securities that is derived from a universe of companies domiciled in various developed markets outside the US and that possess, in aggregate, diversified exposure to investment factors (or characteristics) that are commonly tied to a stock’s potential for enhanced risk-adjusted returns relative to the market. You cannot invest directly in an index. |
| 7 | The Wells Fargo Factor Enhanced Large Cap Index is an index of equity securities that is derived from a universe of the largest 1000 companies in the US market and that possess, in aggregate, diversified exposure to investment factors (or characteristics) that are commonly tied to a stock’s potential for enhanced risk-adjusted returns relative to the market. You cannot invest directly in an index. |
| 8 | The Wells Fargo Factor Enhanced Small Cap Index is an index of equity securities that is derived from a universe of the smallest 2000 companies in the US market and that possess, in aggregate, diversified exposure to investment factors (or characteristics) that are commonly tied to a stock’s potential for enhanced risk-adjusted returns relative to the market. You cannot invest directly in an index. |
| 9 | The Wells Fargo US High Yield Bond Index is a rules-based index designed to measure the performance of U.S. dollar denominated below investment-grade corporate debt issued by U.S. or foreign issuers that have a remaining maturity of at least one year, regardless of optionality; it is constructed to provide increased diversification and liquidity versus traditional passive high yield bond indexes. You cannot invest directly in an index. |
| 10 | The Wells Fargo US Investment Grade Corporate Bond Index is a rules-based index designed to measure the performance of publicly issued U.S. dollar denominated investment grade, fixed rate corporate bonds issued by U.S. or foreign issuers that have a remaining maturity of at least one year, regardless of optionality; it is constructed to provide increased diversification and liquidity versus traditional passive corporate credit indexes. You cannot invest directly in an index. |
| 11 | The Wells Fargo U.S. REIT Index is a float-adjusted, capitalization-weighted index of all applicable NYSE MKT or NASDAQ-listed classes of REIT Stock that satisfy specified market capitalization and other eligibility requirements |
| | | | |
| 278 | | Wells Fargo Target Date Funds | | List of abbreviations |
The following is a list of common abbreviations for terms and entities that may have appeared in this report.
| ACA | — ACA Financial Guaranty Corporation |
| ADR | — American depositary receipt |
| ADS | — American depositary shares |
| AGC | — Assured Guaranty Corporation |
| AGM | — Assured Guaranty Municipal |
| Ambac | — Ambac Financial Group Incorporated |
| AMT | — Alternative minimum tax |
| BAN | — Bond anticipation notes |
| BHAC | — Berkshire Hathaway Assurance Corporation |
| CAB | — Capital appreciation bond |
| CCAB | — Convertible capital appreciation bond |
| CDA | — Community Development Authority |
| CDO | — Collateralized debt obligation |
| CLO | — Collateralized loan obligation |
| DRIVER | — Derivative inverse tax-exempt receipts |
| DW&P | — Department of Water & Power |
| DWR | — Department of Water Resources |
| ECFA | — Educational & Cultural Facilities Authority |
| EDA | — Economic Development Authority |
| EDFA | — Economic Development Finance Authority |
| ETF | — Exchange-traded fund |
| FDIC | — Federal Deposit Insurance Corporation |
| FFCB | — Federal Farm Credit Banks |
| FGIC | — Financial Guaranty Insurance Corporation |
| FHA | — Federal Housing Administration |
| FHLB | — Federal Home Loan Bank |
| FHLMC | — Federal Home Loan Mortgage Corporation |
| FICO | — The Financing Corporation |
| FNMA | — Federal National Mortgage Association |
| GDR | — Global depositary receipt |
| GNMA | — Government National Mortgage Association |
| HCFR | — Healthcare facilities revenue |
| HEFA | — Health & Educational Facilities Authority |
| HEFAR | — Higher education facilities authority revenue |
| HFA | — Housing Finance Authority |
| HFFA | — Health Facilities Financing Authority |
| HUD | — Department of Housing and Urban Development |
| IDA | — Industrial Development Authority |
| IDAG | — Industrial Development Agency |
| KRW | — Republic of Korea won |
| LIBOR | — London Interbank Offered Rate |
| LIFER | — Long Inverse Floating Exempt Receipts |
| LLC | — Limited liability company |
| LLLP | — Limited liability limited partnership |
| LLP | — Limited liability partnership |
| MBIA | — Municipal Bond Insurance Association |
| MFHR | — Multifamily housing revenue |
| MSTR | — Municipal securities trust receipts |
| MUD | — Municipal Utility District |
| National | — National Public Finance Guarantee Corporation |
| PCFA | — Pollution Control Financing Authority |
| PCL | — Public Company Limited |
| PCR | — Pollution control revenue |
| PFA | — Public Finance Authority |
| PFFA | — Public Facilities Financing Authority |
| PFOTER | — Puttable floating option tax-exempt receipts |
| PJSC | — Public Joint Stock Company |
| plc | — Public limited company |
| PUTTER | — Puttable tax-exempt receipts |
| R&D | — Research & development |
| Radian | — Radian Asset Assurance |
| RAN | — Revenue anticipation notes |
| RDA | — Redevelopment Authority |
| RDFA | — Redevelopment Finance Authority |
| REIT | — Real estate investment trust |
| ROC | — Reset option certificates |
| SAVRS | — Select auction variable rate securities |
| SBA | — Small Business Authority |
| SDR | — Swedish depositary receipt |
| SFHR | — Single-family housing revenue |
| SFMR | — Single-family mortgage revenue |
| SPA | — Standby purchase agreement |
| SPDR | — Standard & Poor’s Depositary Receipts |
| SPEAR | — Short Puttable Exempt Adjustable Receipts |
| STRIPS | — Separate trading of registered interest and |
| TAN | — Tax anticipation notes |
| TIPS | — Treasury inflation-protected securities |
| TRAN | — Tax revenue anticipation notes |
| TTFA | — Transportation Trust Fund Authority |
| TVA | — Tennessee Valley Authority |
This page is intentionally left blank.
This page is intentionally left blank.

For more information
More information about Wells Fargo Funds is available free upon request. To obtain literature, please write, email, visit the Funds’ website, or call:
Wells Fargo Funds
P.O. Box 8266
Boston, MA 02266-8266
Email: fundservice@wellsfargo.com
Website: wellsfargofunds.com
Individual investors: 1-800-222-8222
Retail investment professionals: 1-888-877-9275
Institutional investment professionals: 1-866-765-0778
This report and the financial statements contained herein are submitted for the general information of the shareholders of Wells Fargo Funds. If this report is used for promotional purposes, distribution of the report must be accompanied or preceded by a current prospectus. Before investing, please consider the investment objectives, risks, charges, and expenses of the investment. For a current prospectus and, if available, a summary prospectus, containing this information, call 1-800-222-8222 or visit the Funds’ website at wellsfargofunds.com. Read the prospectus carefully before you invest or send money.
Wells Fargo Asset Management (WFAM) is a trade name used by the asset management businesses of Wells Fargo & Company. Wells Fargo Funds Management, LLC, a wholly owned subsidiary of Wells Fargo & Company, provides investment advisory and administrative services for Wells Fargo Funds. Other affiliates of Wells Fargo & Company provide subadvisory and other services for the funds. The funds are distributed by Wells Fargo Funds Distributor, LLC, Member FINRA, an affiliate of Wells Fargo & Company. Neither Wells Fargo Funds Distributor nor Wells Fargo Funds Management holds fund shareholder accounts or assets. This material is for general informational and educational purposes only and is NOT intended to provide investment advice or a recommendation of any kind—including a recommendation for any specific investment, strategy, or plan.
NOT FDIC INSURED ◾ NO BANK GUARANTEE ◾ MAY LOSE VALUE
© 2017 Wells Fargo Funds Management, LLC. All rights reserved.
| | |
 | | 305824 10-17 SOFLD/SAR101 08-17 |
| | | | |
| | Semi-Annual Report August 31, 2017 | |  |
Wells Fargo International Government Bond Portfolio


Contents
The views expressed and any forward-looking statements are as of August 31, 2017, unless otherwise noted, and are those of the Fund managers and/or Wells Fargo Funds Management, LLC. Discussions of individual securities, or the markets generally, or any Wells Fargo Fund are not intended as individual recommendations. Future events or results may vary significantly from those expressed in any forward-looking statements. The views expressed are subject to change at any time in response to changing circumstances in the market. Wells Fargo Funds Management, LLC and the Fund disclaim any obligation to publicly update or revise any views expressed or forward-looking statements.
NOT FDIC INSURED § NO BANK GUARANTEE § MAY LOSE VALUE
| | |
| Portfolio of investments — August 31, 2017 (unaudited) | | Wells Fargo International Government Bond Portfolio |
| | | | | | | | | | | | | | | | | | | | | | | | | |
| Security name | | | | Interest rate | | Maturity date | | Principal | | Value |
| | | | | |
Foreign Government Bonds @ : 98.51% | | | | | | | | | | | | | | | | | | | | | | | | | |
Australia Government Bond Series 124 (AUD) | | | | | | | | | 5.75 | % | | | | 5-15-2021 | | | | | 500,000 | | | | $ | 448,800 | |
Belgium Government Bond Series 73 (EUR) 144A | | | | | | | | | 3.00 | | | | | 6-22-2034 | | | | | 100,000 | | | | | 152,182 | |
Belgium Government Bond Series 76 (EUR) 144A | | | | | | | | | 1.90 | | | | | 6-22-2038 | | | | | 100,000 | | | | | 129,423 | |
Belgium Government Bond Series 84 (EUR) 144A | | | | | | | | | 1.45 | | | | | 6-22-2037 | | | | | 120,000 | | | | | 144,571 | |
Bonos y Obligaciones del Estado (EUR) 144A | | | | | | | | | 2.15 | | | | | 10-31-2025 | | | | | 320,000 | | | | | 409,922 | |
Bundesrepublik Deutschland (EUR) ¤ | | | | | | | | | 0.00 | | | | | 8-15-2026 | | | | | 120,000 | | | | | 140,182 | |
Bundesrepublik Deutschland (EUR) | | | | | | | | | 1.00 | | | | | 8-15-2025 | | | | | 220,000 | | | | | 281,759 | |
Canada (CAD) | | | | | | | | | 3.50 | | | | | 12-1-2045 | | | | | 250,000 | | | | | 250,322 | |
Canada (CAD) | | | | | | | | | 5.00 | | | | | 6-1-2037 | | | | | 130,000 | | | | | 150,226 | |
Czech Republic (CZK) | | | | | | | | | 2.40 | | | | | 9-17-2025 | | | | | 2,060,000 | | | | | 107,648 | |
Finnish Government Bond (EUR) 144A | | | | | | | | | 0.50 | | | | | 4-15-2026 | | | | | 100,000 | | | | | 120,414 | |
Finnish Government Bond (EUR) 144A | | | | | | | | | 4.00 | | | | | 7-4-2025 | | | | | 190,000 | | | | | 292,715 | |
France Government Bond (EUR) 144A | | | | | | | | | 2.00 | | | | | 5-25-2048 | | | | | 150,000 | | | | | 189,396 | |
France Government Bond (EUR) | | | | | | | | | 4.00 | | | | | 10-25-2038 | | | | | 170,000 | | | | | 299,687 | |
Italy Buoni Poliennali del Tesoro (EUR) | | | | | | | | | 0.35 | | | | | 11-1-2021 | | | | | 160,000 | | | | | 189,247 | |
Italy Buoni Poliennali del Tesoro (EUR) | | | | | | | | | 0.45 | | | | | 6-1-2021 | | | | | 100,000 | | | | | 119,366 | |
Italy Buoni Poliennali del Tesoro (EUR) 144A | | | | | | | | | 3.50 | | | | | 3-1-2030 | | | | | 140,000 | | | | | 186,918 | |
Italy Buoni Poliennali del Tesoro (EUR) | | | | | | | | | 5.25 | | | | | 11-1-2029 | | | | | 220,000 | | | | | 343,208 | |
Japan (JPY) | | | | | | | | | 0.10 | | | | | 9-15-2018 | | | | | 89,100,000 | | | | | 812,538 | |
Japan (JPY) | | | | | | | | | 0.20 | | | | | 3-20-2019 | | | | | 135,350,000 | | | | | 1,238,064 | |
Malaysia (MYR) | | | | | | | | | 3.90 | | | | | 11-30-2026 | | | | | 300,000 | | | | | 70,287 | |
Malaysia (MYR) | | | | | | | | | 4.07 | | | | | 9-30-2026 | | | | | 380,000 | | | | | 88,412 | |
Malaysia (MYR) | | | | | | | | | 4.13 | | | | | 4-15-2032 | | | | | 360,000 | | | | | 81,746 | |
Malaysia (MYR) | | | | | | | | | 4.25 | | | | | 9-30-2030 | | | | | 240,000 | | | | | 54,952 | |
Mexico (MXN) | | | | | | | | | 8.00 | | | | | 6-11-2020 | | | | | 6,970,000 | | | | | 402,749 | |
Netherlands Government Bond (EUR) 144A | | | | | | | | | 0.25 | | | | | 7-15-2025 | | | | | 100,000 | | | | | 119,551 | |
Netherlands Government Bond (EUR) 144A | | | | | | | | | 0.50 | | | | | 7-15-2026 | | | | | 250,000 | | | | | 301,680 | |
New Zealand (NZD) | | | | | | | | | 6.00 | | | | | 5-15-2021 | | | | | 170,000 | | | | | 138,415 | |
Norway (NOK) 144A | | | | | | | | | 1.75 | | | | | 2-17-2027 | | | | | 630,000 | | | | | 82,737 | |
Poland (PLN) | | | | | | | | | 2.50 | | | | | 7-25-2026 | | | | | 1,090,000 | | | | | 289,145 | |
Republic of Austria (EUR) 144A | | | | | | | | | 0.50 | | | | | 4-20-2027 | | | | | 100,000 | | | | | 118,237 | |
Republic of Austria (EUR) 144A | | | | | | | | | 0.75 | | | | | 10-20-2026 | | | | | 100,000 | | | | | 121,819 | |
Republic of Austria (EUR) 144A | | | | | | | | | 4.85 | | | | | 3-15-2026 | | | | | 100,000 | | | | | 164,805 | |
Republic of South Africa (ZAR) | | | | | | | | | 7.75 | | | | | 2-28-2023 | | | | | 3,860,000 | | | | | 295,430 | |
Russia (RUB) | | | | | | | | | 7.60 | | | | | 4-14-2021 | | | | | 11,160,000 | | | | | 192,592 | |
Singapore (SGD) | | | | | | | | | 3.25 | | | | | 9-1-2020 | | | | | 290,000 | | | | | 225,314 | |
Switzerland (CHF) | | | | | | | | | 1.25 | | | | | 5-28-2026 | | | | | 100,000 | | | | | 117,743 | |
Thailand (THB) | | | | | | | | | 3.45 | | | | | 3-8-2019 | | | | | 9,830,000 | | | | | 304,785 | |
United Kingdom Gilt (GBP) | | | | | | | | | 3.75 | | | | | 7-22-2052 | | | | | 220,000 | | | | | 445,164 | |
United Kingdom Gilt (GBP) | | | | | | | | | 4.25 | | | | | 3-7-2036 | | | | | 190,000 | | | | | 350,191 | |
| | | | | |
Total Foreign Government Bonds (Cost $9,858,579) | | | | | | | | | | | | | | | | | | | | | | | | 9,972,342 | |
| | | | | | | | | | | | | | | | | | | | | | | | | |
| | | | | |
| | | | | Yield | | | | Shares | | |
| | | | | |
Short-Term Investments : 0.65% | | | | | | | | | | | | | | | | | | | | | | | | | |
| | | | | |
Investment Companies : 0.65% | | | | | | | | | | | | | | | | | | | | | | | | | |
Wells Fargo Government Money Market Fund Select Class (l)(u) | | | | | | | | | 0.92 | | | | | | | | | | 65,308 | | | | | 65,308 | |
| | | | | | | | | | | | | | | | | | | | | | | | | |
| | | | | |
Total Short-Term Investments (Cost $65,308) | | | | | | | | | | | | | | | | | | | | | | | | 65,308 | |
| | | | | | | | | | | | | | | | | | | | | | | | | |
| | | | | |
Total investments in securities (Cost $9,923,887) | | | | 99.16 | % | | | | | | | | | | | | | | | | | | | 10,037,650 | |
| | | | | |
Other assets and liabilities, net | | | | 0.84 | | | | | | | | | | | | | | | | | | | | 85,372 | |
| | | | | | | | | | | | | | | | | | | | | | | | | |
| | | | | |
Total net assets | | | | 100.00 | % | | | | | | | | | | | | | | | | | | $ | 10,123,022 | |
| | | | | | | | | | | | | | | | | | | | | | | | | |
The accompanying notes are an integral part of these financial statements.
2
| | |
| Wells Fargo International Government Bond Portfolio | | Portfolio of investments — August 31, 2017 (unaudited) |
| @ | Foreign bond principal is denominated in the local currency of the issuer |
| 144A | The security may be resold in transactions exempt from registration, normally to qualified institutional buyers, pursuant to Rule 144A under the Securities Act of 1933. |
| ¤ | The security is issued in zero coupon form with no periodic interest payments. |
| (l) | The issuer of the security is an affiliated person of the Portfolio as defined in the Investment Company Act of 1940. |
| (u) | The rate represents the 7-day annualized yield at period end. |
Forward Foreign Currency Contracts
| | | | | | | | | | | | | | | | | | | | |
| Currency to be | | Currency to be | | | | | | Settlement | | | Unrealized | | | Unrealized | |
| received | | delivered | | | Counterparty¤¤ | | | date | | | gains | | | losses | |
800,000 EUR | | | 939,778 USD | | | | State Street Bank | | | | 9/6/2017 | | | | $12,629 | | | | $0 | |
1,250,000 SEK | | | 154,169 USD | | | | State Street Bank | | | | 9/6/2017 | | | | 3,156 | | | | 0 | |
1,265,000 DKK | | | 199,862 USD | | | | State Street Bank | | | | 9/6/2017 | | | | 2,635 | | | | 0 | |
231,841 USD | | | 3,065,000 ZAR | | | | State Street Bank | | | | 9/6/2017 | | | | 0 | | | | (3,730) | |
49,828 USD | | | 63,000 CAD | | | | State Street Bank | | | | 9/6/2017 | | | | 0 | | | | (625) | |
43,108 USD | | | 59,000 NZD | | | | State Street Bank | | | | 9/6/2017 | | | | 747 | | | | 0 | |
114,930 USD | | | 2,045,000 MXN | | | | State Street Bank | | | | 9/6/2017 | | | | 570 | | | | 0 | |
226,424 USD | | | 286,000 AUD | | | | State Street Bank | | | | 9/6/2017 | | | | 0 | | | | (929) | |
212,184 USD | | | 23,300,000 JPY | | | | State Street Bank | | | | 9/6/2017 | | | | 232 | | | | 0 | |
241,118 USD | | | 187,000 GBP | | | | State Street Bank | | | | 9/6/2017 | | | | 0 | | | | (699) | |
71,494 USD | | | 260,000 PLN | | | | State Street Bank | | | | 9/6/2017 | | | | 0 | | | | (1,390) | |
126,861 USD | | | 173,000 SGD | | | | State Street Bank | | | | 9/6/2017 | | | | 0 | | | | (726) | |
208,893 USD | | | 6,940,000 THB | | | | State Street Bank | | | | 9/6/2017 | | | | 0 | | | | (113) | |
753,300,000 KRW | | | 660,500 USD | | | | State Street Bank | | | | 9/11/2017 | | | | 7,592 | | | | 0 | |
836,000 MYR | | | 194,441 USD | | | | State Street Bank | | | | 9/11/2017 | | | | 0 | | | | (1,270) | |
11,425,000 RUB | | | 191,502 USD | | | | State Street Bank | | | | 9/11/2017 | | | | 0 | | | | (5,246) | |
| | | | | | | | | | | | | | | | |
| | | | | | | | | | | | | | $ | 27,561 | | | $ | (14,728) | |
| | | | | | | | | | | | | | | | |
| ¤¤ | Transactions can only be closed with the originating counterparty. |
Investments in Affiliates
An affiliated investment is an investment in which the Portfolio owns at least 5% of the outstanding voting shares of the issuer or as a result of other relationships, such as the Portfolio and the issuer having the same investment manager. Transactions with issuers that were either affiliated persons of the Portfolio at the beginning of the period or the end of the period were as follows:
| | | | | | | | | | | | | | | | | | | | | | | | | | | | | | | | |
| | | Shares,
beginning of
period | | | Shares
purchased | | | Shares
sold | | | Shares,
end of
period | | | Net
realized
gains
(losses) | | | Net change
in
unrealized
gains
(losses) | | | Income
from
affiliated
securities | | | Value,
end
of period | |
Investment companies - 0.65% | | | | | | | | | | | | | | | | | | | | | | | | | | | | | | | | |
| Wells Fargo Government Money Market Fund Select Class | | | 0 | | | | 10,000,000 | | | | 9,934,692 | | | | 65,308 | | | | $0 | | | | $0 | | | | $1,265 | | | | $65,308 | |
The accompanying notes are an integral part of these financial statements.
3
| | |
| Portfolio of investments — August 31, 2017 (unaudited) | | Wells Fargo International Government Bond Portfolio |
The following table shows the ten largest portfolio holdings as a percent of total long-term investments as of August 31, 2017:
| | | | |
Japan, 0.20%, 3-20-2019 | | | 12.23% | |
Japan, 0.10%, 9-15-2018 | | | 8.03% | |
Australia Government Bond Series 124, 5.75%, 5-15-2021 | | | 4.43% | |
United Kingdom Gilt, 3.75%, 7-22-2052 | | | 4.40% | |
Bonos y Obligaciones del Estado, 2.15%, 10-31-2025 | | | 4.05% | |
Mexico, 8.00%, 6-11-2020 | | | 3.98% | |
United Kingdom Gilt, 4.25%, 3-7-2036 | | | 3.46% | |
Italy Buoni Poliennali del Tesoro, 5.25%, 11-1-2029 | | | 3.39% | |
Thailand, 3.45%, 3-8-2019 | | | 3.01% | |
Netherlands Government Bond, 0.50%, 7-15-2026 | | | 2.98% | |
The following table shows the percent of total long-term investments by country allocation as of August 31, 2017:
| | | | |
Japan | | | 20.56% | |
Italy | | | 8.41% | |
United Kingdom | | | 7.98% | |
France | | | 4.91% | |
Australia | | | 4.50% | |
Belgium | | | 4.27% | |
Germany | | | 4.23% | |
Netherlands | | | 4.22% | |
Finland | | | 4.14% | |
Spain | | | 4.11% | |
Austria | | | 4.06% | |
Mexico | | | 4.04% | |
Canada | | | 4.02% | |
Thailand | | | 3.06% | |
South Africa | | | 2.96% | |
Malaysia | | | 2.96% | |
Poland | | | 2.90% | |
Singapore | | | 2.26% | |
Russia | | | 1.93% | |
New Zealand | | | 1.39% | |
Switzerland | | | 1.18% | |
Czech Republic | | | 1.08% | |
Norway | | | 0.83% | |
The accompanying notes are an integral part of these financial statements.
4
| | |
| Statement of assets and liabilities – August 31, 2017 (unaudited) | | Wells Fargo International Government Bond Portfolio |
| | | | |
| | |
| |
Assets | | | | |
Investments in unaffiliated securities, at value (cost $9,858,579) | | $ | 9,972,342 | |
Investments in affiliated securities, at value (cost $65,308) | | | 65,308 | |
Foreign currency, at value (cost $988) | | | 997 | |
Receivable for interest | | | 77,982 | |
Unrealized gains on forward foreign currency contracts | | | 27,561 | |
Total assets | | | 10,144,190 | |
Liabilities | | | | |
Unrealized losses on forward foreign currency contracts | | | 14,728 | |
Advisory fee payable | | | 1,034 | |
Professional fees payable | | | 3,790 | |
Accrued expenses and other liabilities | | | 1,616 | |
Total liabilities | | | 21,168 | |
Total net assets | | $ | 10,123,022 | |
The accompanying notes are an integral part of these financial statements.
5
| | |
| Statement of operations – period ended August 31, 20171 (unaudited) | | Wells Fargo International Government Bond Portfolio |
| | | | |
| | |
| |
Investment income | | | | |
Interest | | $ | 5,505 | |
Income from affiliated securities | | | 1,265 | |
Total investment income | | | 6,770 | |
Expenses | | | | |
Advisory fee | | | 1,034 | |
Custody and accounting fees | | | 164 | |
Professional fees | | | 3,790 | |
Shareholder report expenses | | | 308 | |
Trustees’ fees and expenses | | | 774 | |
Other fees and expenses | | | 370 | |
Total expenses | | | 6,440 | |
Net investment income | | | 330 | |
REALIZED AND UNREALIZED GAINS (LOSSES) ON INVESTMENTS | | | | |
Net realized losses on unaffiliated securities | | | (4,603) | |
Net change in unrealized gains (losses) on: | | | | |
Unaffiliated securities | | | 113,772 | |
Forward foreign currency contract transactions | | | 12,833 | |
Foreign currency and foreign currency translations | | | 690 | |
Net change in unrealized gains (losses) on investments | | | 127,295 | |
Net realized and unrealized gains (losses) on investments | | | 122,692 | |
Net increase in net assets resulting from operations | | $ | 123,022 | |
| 1. | For the period from August 16, 2017 (commencement of operations) to August 31, 2017 |
The accompanying notes are an integral part of these financial statements.
6
| | |
| Statement of changes in net assets | | Wells Fargo International Government Bond Portfolio |
| | | | |
| | | Period ended
August 31, 20171 (unaudited) | |
Operations | | | | |
Net investment income | | $ | 330 | |
Net realized losses on unaffiliated securities | | | (4,603) | |
Net change in unrealized gains (losses) on unaffiliated securities | | | 127,295 | |
Net increase in net assets resulting from operations | | | 123,022 | |
| |
Capital share transactions | | | | |
Transactions in investors’ beneficial interests Contributions | | | 10,000,000 | |
Net increase in net assets resulting from capital share transactions | | | 10,000,000 | |
Total increase in net assets | | | 10,123,022 | |
Net assets | | | | |
Beginning of period | | | 0 | |
End of period | | $ | 10,123,022 | |
| 1. | For the period from August 16, 2017 (commencement of operations) to August 31, 2017 |
The accompanying notes are an integral part of these financial statements.
7
| | |
| Wells Fargo International Government Bond Portfolio | | Financial Highlights |
| | | | | | | | |
| | | Ratio to average net assets (annualized) | | | | Portfolio turnover
rate |
| | | Net investment
income | | Gross
expenses | | Total
return1 | |
Period ended August 31, 20172 | | 0.08% | | 1.56% | | 1.20% | | 0% |
1 Returns for periods of less than one year are not annualized
2 For the period from August 16, 2017 (commencement of operations) to August 31, 2017
The accompanying notes are an integral part of these financial statements.
8
| | |
| Notes to financial statements (unaudited) | | Wells Fargo International Government Bond Portfolio |
1. ORGANIZATION
Wells Fargo Master Trust (the “Trust”), a Delaware statutory trust organized on March 10, 1999, is an open-end management investment company registered under the Investment Company Act of 1940, as amended (the “1940 Act”). As an investment company, the Trust follows the accounting and reporting guidance in Financial Accounting Standards Board Accounting Standards Codification Topic 946, Financial Services – Investment Companies. These financial statements report on the Wells Fargo International Government Bond Portfolio (the “Portfolio”) which is a diversified series of the Trust.
The Portfolio offers its shares to multiple feeder funds and other affiliated master portfolios rather than directly to the public.
2. SIGNIFICANT ACCOUNTING POLICIES
The following significant accounting policies, which are consistently followed in the preparation of the financial statements of the Portfolio, are in conformity with U.S. generally accepted accounting principles which require management to make estimates and assumptions that affect the reported amounts of assets and liabilities, disclosure of contingent assets and liabilities at the date of the financial statements, and the reported amounts of revenues and expenses during the reporting period. Actual results could differ from those estimates.
Securities valuation
All investments are valued each business day as of the close of regular trading on the New York Stock Exchange (generally 4 p.m. Eastern Time), although the Portfolio may deviate from this calculation time under unusual or unexpected circumstances.
Debt securities are valued at the evaluated bid price provided by an independent pricing service or, if a reliable price is not available, the quoted bid price from an independent broker-dealer.
The values of securities denominated in foreign currencies are translated into U.S. dollars at rates provided by an independent foreign currency pricing source at a time each business day specified by the Management Valuation Team of Wells Fargo Funds Management, LLC (“Funds Management”).
Investments in registered open-end investment companies are valued at net asset value.
Investments which are not valued using the methods discussed above are valued at their fair value, as determined in good faith by the Board of Trustees of the Portfolio. The Board of Trustees has established a Valuation Committee comprised of the Trustees and has delegated to it the authority to take any actions regarding the valuation of portfolio securities that the Valuation Committee deems necessary or appropriate, including determining the fair value of portfolio securities, unless the determination has been delegated to the Management Valuation Team. The Board of Trustees retains the authority to make or ratify any valuation decisions or approve any changes to the Valuation Procedures as it deems appropriate. On a quarterly basis, the Board of Trustees receives reports on any valuation actions taken by the Valuation Committee or the Management Valuation Team which may include items for ratification.
Valuations of fair valued securities are compared to the next actual sales price when available, or other appropriate market values, to assess the continued appropriateness of the fair valuation methodologies used. These securities are fair valued on a day-to-day basis, taking into consideration changes to appropriate market information and any significant changes to the inputs considered in the valuation process until there is a readily available price provided on an exchange or by an independent pricing service. Valuations received from an independent pricing service or independent broker-dealer quotes are periodically validated by comparisons to most recent trades and valuations provided by other independent pricing services in addition to the review of prices by the adviser and/or subadviser. Unobservable inputs used in determining fair valuations are identified based on the type of security, taking into consideration factors utilized by market participants in valuing the investment, knowledge about the issuer and the current market environment.
Foreign currency translation
The accounting records of the Portfolio are maintained in U.S. dollars. The values of other assets and liabilities denominated in foreign currencies are translated into U.S. dollars at rates provided by an independent foreign currency pricing source at a time each business day specified by the Management Valuation Team. Purchases and sales of securities, and income and expenses are converted at the rate of exchange on the respective dates of such transactions. Net realized foreign exchange gains or losses arise from sales of foreign currencies, currency gains or losses realized between the trade and settlement dates on securities transactions, and the difference between the amounts of dividends, interest and foreign withholding taxes recorded and the U.S. dollar equivalent of the amounts actually paid or received. Net unrealized foreign exchange gains and losses arise from changes in the fair value of assets and liabilities other than investments in securities resulting from changes in exchange rates. The changes in net assets arising from changes in exchange rates of securities and the changes in net assets resulting from changes in market prices of securities are not separately presented. Such changes are included in net realized and unrealized gains or losses from investments.
9
| | |
| Notes to financial statements (unaudited) | | Wells Fargo International Government Bond Portfolio |
Forward foreign currency contracts
The Portfolio is subject to foreign currency risk in the normal course of pursuing its investment objectives. A forward foreign currency contract is an agreement between two parties to purchase or sell a specific currency for an agreed-upon price at a future date. The Portfolio enters into forward foreign currency contracts to facilitate transactions in foreign-denominated securities and to attempt to minimize the risk to the Portfolio from adverse changes in the relationship between currencies. Forward foreign currency contracts are recorded at the forward rate and marked-to-market daily. When the contracts are closed, realized gains and losses arising from such transactions are recorded as realized gains or losses on forward foreign currency contract transactions. The Portfolio could be exposed to risks if the counterparties to the contracts are unable to meet the terms of their contracts or if the value of the foreign currency changes unfavorably. The Portfolio’s maximum risk of loss from counterparty credit risk is the unrealized gains on the contracts. This risk may be mitigated if there is a master netting arrangement between the Portfolio and the counterparty.
Security transactions and income recognition
Securities transactions are recorded on a trade date basis. Realized gains or losses are recorded on the basis of identified cost.
Interest income is accrued daily and bond discounts are accreted and premiums are amortized daily based on the effective interest method. To the extent debt obligations are placed on non-accrual status, any related interest income may be reduced by writing off interest receivables when the collection of all or a portion of interest has been determined to be doubtful based on consistently applied procedures and the fair value has decreased. If the issuer subsequently resumes interest payments or when the collectability of interest is reasonably assured, the debt obligation is removed from non-accrual status.
Federal and other taxes
The Portfolio is not required to pay federal income taxes on its net investment income and net capital gain as it is treated as a partnership for federal income tax purposes. All interest, dividends, gains and losses of the Portfolio are deemed to have been “passed through” to the interestholders in proportion to their holdings of the Portfolio regardless of whether such interest, dividends and gains have been distributed by the Portfolio.
The Portfolio’s income and federal excise tax returns and all financial records supporting those returns for the fiscal year since commencement of operations will be subject to examination by the federal and Delaware revenue authorities.
As of August 31, 2017, the aggregate cost of all investments for federal income tax purposes was $9,923,887 and the unrealized gains (losses) consisted of:
| | | | |
Gross unrealized gains | | | $151,223 | |
| |
Gross unrealized losses | | | (24,627 | ) |
| | | | |
| |
Net unrealized gains | | | $126,596 | |
3. FAIR VALUATION MEASUREMENTS
Fair value measurements of investments are determined within a framework that has established a fair value hierarchy based upon the various data inputs utilized in determining the value of the Portfolio’s investments. The three-level hierarchy gives the highest priority to unadjusted quoted prices in active markets for identical assets or liabilities (Level 1) and the lowest priority to unobservable inputs (Level 3). The Portfolio’s investments are classified within the fair value hierarchy based on the lowest level of input that is significant to the fair value measurement. The inputs are summarized into three broad levels as follows:
| | | | | | |
| | Level 1 | | – | | quoted prices in active markets for identical securities |
| | Level 2 | | – | | other significant observable inputs (including quoted prices for similar securities, interest rates, prepayment speeds, credit risk, etc.) |
| | Level 3 | | – | | significant unobservable inputs (including the Portfolio’s own assumptions in determining the fair value of investments) |
The inputs or methodologies used for valuing investments in securities are not necessarily an indication of the risk associated with investing in those securities.
10
| | |
| Notes to financial statements (unaudited) | | Wells Fargo International Government Bond Portfolio |
The following is a summary of the inputs used in valuing the Portfolio’s assets and liabilities as of August 31, 2017:
| | | | | | | | | | | | | | | | |
| | | Quoted
prices
(Level 1) | | | Other significant
observable inputs
(Level 2) | | | Significant
unobservable
inputs (Level 3) | | | Total | |
| | | | |
Assets | | | | | | | | | | | | | | | | |
| | | | |
Investments in : | | | | | | | | | | | | | | | | |
| | | | |
Foreign government bonds | | | $0 | | | | $9,972,342 | | | | $0 | | | | $9,972,342 | |
| | | | |
Short-term investments | | | | | | | | | | | | | | | | |
| | | | |
Investment companies | | | 65,308 | | | | 0 | | | | 0 | | | | 65,308 | |
| | | | |
| | | | |
| | | 65,308 | | | | 9,972,342 | | | | 0 | | | | 10,037,650 | |
Forward foreign currency contracts | | | 0 | | | | 27,561 | | | | 0 | | | | 27,561 | |
| | | | |
| | | | |
Total assets | | | $65,308 | | | | $9,999,903 | | | | $0 | | | | $10,065,211 | |
| | | | |
Liabilities | | | | | | | | | | | | | | | | |
| | | | |
Forward foreign currency contracts | | | $0 | | | | $14,728 | | | | $0 | | | | $14,728 | |
| | | | |
| | | | |
Total liabilities | | | $0 | | | | $14,728 | | | | $0 | | | | $14,728 | |
| | | | |
Forward foreign currency contracts are reported at their unrealized gains (losses) at measurement date, which represents the change in the contract’s value from trade date. All other assets and liabilities are reported at their market value at measurement date.
The Portfolio recognizes transfers between levels within the fair value hierarchy at the end of the reporting period. At August 31, 2017, the Portfolio did not have any transfers into/out of Level 1, Level 2, or Level 3.
4. TRANSACTIONS WITH AFFILIATES
Advisory fee
The Trust has entered into an advisory contract with Funds Management, an indirect wholly owned subsidiary of Wells Fargo & Company (“Wells Fargo”). The adviser is responsible for implementing investment policies and guidelines and for supervising the subadviser, who is responsible for day-to-day portfolio management of the Portfolio.
Pursuant to the contract, Funds Management is entitled to receive an annual advisory fee starting at 0.25% and declining to 0.21% as the average daily net assets of the Portfolio increase. For the period from August 16, 2017 (commencement of operations) to August 31, 2017, the advisory fee was equivalent to an annual rate of 0.25% of the Portfolio’s average daily net assets.
Funds Management has retained the services of a subadviser to provide daily portfolio management to the Portfolio. The fee for subadvisory services is borne by Funds Management. First International Advisors, LLC, an affiliate of Funds Management and an indirect wholly owned subsidiary of Wells Fargo, is the subadviser to the Portfolio and is entitled to receive a fee from Funds Management at an annual rate starting at 0.09% and declining to 0.07% as the average daily net assets of the Portfolio increase.
Interfund transactions
The Portfolio may purchase or sell portfolio investment securities to certain other Wells Fargo affiliates pursuant to Rule 17a-7 of the 1940 Act and under procedures adopted by the Board of Trustees. The procedures have been designed to ensure that these interfund transactions, which do not incur broker commissions, are effected at current market prices.
5. INVESTMENT PORTFOLIO TRANSACTIONS
Purchases and sales of investments, excluding U.S. government obligations (if any) and short-term securities, for the period from August 16, 2017 (commencement of operations) to August 31, 2017 were $9,860,807 and $0, respectively.
6. DERIVATIVE TRANSACTIONS
During the period from August 16, 2017 (commencement of operations) to August 31, 2017, the Portfolio entered into forward foreign currency contracts for economic hedging purposes. The Portfolio had average contract amounts of $73,150 and $71,384 in forward foreign currency contracts to buy and forward foreign currency contracts to sell, respectively, during the period from August 16, 2017 (commencement of operations) to August 31, 2017.
11
| | |
| Notes to financial statements (unaudited) | | Wells Fargo International Government Bond Portfolio |
For certain types of derivative transactions, the Portfolio has entered into International Swaps and Derivatives Association, Inc. master agreements (“ISDA Master Agreements”) or similar agreements with approved counterparties. The ISDA Master Agreements or similar agreements may have requirements to deliver/deposit securities or cash to/with an exchange or broker-dealer as collateral and allows the Portfolio to offset, with each counterparty, certain derivative financial instrument’s assets and/or liabilities with collateral held or pledged. Collateral requirements differ by type of derivative. Collateral or margin requirements are set by the broker or exchange clearing house for exchange traded derivatives while collateral terms are contract specific for over-the-counter traded derivatives. Cash collateral that has been pledged to cover obligations of the Portfolio under ISDA Master Agreements or similar agreements, if any, are reported separately in the Statement of Assets and Liabilities. Securities pledged as collateral, if any, are noted in the Portfolio of Investments. With respect to balance sheet offsetting, absent an event of default by the counterparty or a termination of the agreement, the reported amounts of financial assets and financial liabilities in the Statement of Assets and Liabilities are not offset across transactions between the Portfolio and the applicable counterparty. A reconciliation of the gross amounts on the Statement of Assets and Liabilities to the net amounts by derivative type, including any collateral exposure, is as follows:
| | | | | | | | | | | | | | | | |
| Counterparty | | Gross amounts of assets in
the Statement of Assets and
Liabilities | | | Amounts subject to netting
agreements | | | Collateral
received | | | Net amount of
assets | |
State Street Bank | | | $27,561 | | | | $(14,728) | | | | $0 | | | | $12,833 | |
| | | | |
| Counterparty | | Gross amounts of liabilities
in the Statement of Assets
and Liabilities | | | Amounts subject to netting
agreements | | | Collateral
pledged | | | Net amount of
liabilities | |
State Street Bank | | | $14,728 | | | | $(14,728) | | | | $0 | | | | $0 | |
7. INDEMNIFICATION
Under the Trust’s organizational documents, the officers and Trustees have been granted certain indemnification rights against certain liabilities that may arise out of performance of their duties to the Trust. Additionally, in the normal course of business, the Trust may enter into contracts with service providers that contain a variety of indemnification clauses. The Trust’s maximum exposure under these arrangements is dependent on future claims that may be made against the Portfolio and, therefore, cannot be estimated.
12
| | |
| Notes to financial statements (unaudited) | | Wells Fargo International Government Bond Portfolio |
PROXY VOTING INFORMATION
A description of the policies and procedures used to determine how to vote proxies relating to portfolio securities is available without charge, upon request, by calling 1-800-222-8222, visiting our website at wellsfargofunds.com, or visiting the SEC website at sec.gov. Information regarding how the proxies related to portfolio securities were voted during the most recent 12-month period ended June 30 is available on the website at wellsfargofunds.com or by visiting the SEC website at sec.gov.
PORTFOLIO HOLDINGS INFORMATION
The complete portfolio holdings for the Portfolio will be publicly available monthly on the Portfolio’s website (wellsfargofunds.com) on a one-month delayed basis. In addition, top ten holdings information (excluding derivative positions) for the Portfolio will be publicly available on the Portfolio’s website on a monthly, seven-day or more delayed basis. The Portfolio files its complete schedule of portfolio holdings with the SEC for the first and third quarters of each fiscal year on Form N-Q, which is available by visiting the SEC website at sec.gov. In addition, the Portfolio’s Form N-Q may be reviewed and copied at the SEC’s Public Reference Room in Washington, DC, and at regional offices in New York City, at 233 Broadway, and in Chicago, at 175 West Jackson Boulevard, Suite 900. Information about the Public Reference Room may be obtained by calling 1-800-SEC-0330.
13
| | | | |
Wells Fargo International Government Bond Portfolio | | | Other information | (unaudited) |
BOARD OF TRUSTEES AND OFFICERS
Each of the Trustees and Officers1 listed in the table below acts in identical capacities for each fund in the Wells Fargo family of funds, which consists of 152 mutual funds comprising the Wells Fargo Funds Trust, Wells Fargo Variable Trust, Wells Fargo Master Trust and four closed-end funds (collectively the “Fund Complex”). This table should be read in conjunction with the Prospectus and the Statement of Additional Information2. The mailing address of each Trustee and Officer is 525 Market Street, 12th Floor, San Francisco, CA 94105. Each Trustee and Officer serves an indefinite term, however, each Trustee serves such term until reaching the mandatory retirement age established by the Trustees.
Independent Trustees
| | | | | | |
Name and year of birth | | Position held and
length of service* | | Principal occupations during past five years or longer | | Current other
public company or
investment company
directorships |
| | | |
William R. Ebsworth (Born 1957) | | Trustee, since 2015 | | Retired. From 1984 to 2013, equities analyst, portfolio manager, research director and chief investment officer at Fidelity Management and Research Company in Boston, Tokyo, and Hong Kong and retired in 2013 as Chief Investment Officer of Fidelity Strategic Advisers, Inc. where he led a team of investment professionals managing client assets. Prior thereto, Board member of Hong Kong Securities Clearing Co., Hong Kong Options Clearing Corp., the Thailand International Fund, Ltd., Fidelity Investments Life Insurance Company, and Empire Fidelity Investments Life Insurance Company. Board member of the Forté Foundation (non-profit organization) and the Vincent Memorial Hospital Endowment (non-profit organization), where he serves on the Investment Committee and as a Chair of the Audit Committee. Mr. Ebsworth is a CFA® charterholder. | | Asset Allocation Trust |
| | | |
Jane A. Freeman (Born 1953) | | Trustee, since 2015 | | Retired. From 2012 to 2014 and 1999 to 2008, Chief Financial Officer of Scientific Learning Corporation. From 2008 to 2012, Ms. Freeman provided consulting services related to strategic business projects. Prior to 1999, Portfolio Manager at Rockefeller & Co. and Scudder, Stevens & Clark. Board member of the Harding Loevner Funds from 1996 to 2014, serving as both Lead Independent Director and chair of the Audit Committee. Board member of the Russell Exchange Traded Funds Trust from 2011 to 2012 and the chair of the Audit Committee. Ms. Freeman is a Board Member of Ruth Bancroft Garden (non-profit organization) and an inactive chartered financial analyst. | | Asset Allocation Trust |
| | | |
Peter G. Gordon** (Born 1942) | | Trustee, since 1998; Chairman, since 2005 | | Co-Founder, Retired Chairman, President and CEO of Crystal Geyser Water Company. Trustee Emeritus, Colby College. | | Asset Allocation Trust |
| | | |
Isaiah Harris, Jr. (Born 1952) | | Trustee, since 2009 | | Retired. Chairman of the Board of CIGNA Corporation since 2009, and Director since 2005. From 2003 to 2011, Director of Deluxe Corporation. Prior thereto, President and CEO of BellSouth Advertising and Publishing Corp. from 2005 to 2007, President and CEO of BellSouth Enterprises from 2004 to 2005 and President of BellSouth Consumer Services from 2000 to 2003. Emeritus member of the Iowa State University Foundation Board of Governors. Emeritus Member of the Advisory Board of Iowa State University School of Business. Advisory Board Member, Palm Harbor Academy (charter school). Advisory Board Member, Child Evangelism Fellowship (non-profit). Mr. Harris is a certified public accountant (inactive status). | | CIGNA Corporation; Asset Allocation Trust |
14
| | |
| Other information (unaudited) | | Wells Fargo International Government Bond Portfolio |
| | | | | | |
Name and year of birth | | Position held and length of service* | | Principal occupations during past five years or longer | | Current other public company or investment company
directorships |
| | | |
Judith M. Johnson (Born 1949) | | Trustee, since 2008; Audit Committee Chairman, since 2008 | | Retired. Prior thereto, Chief Executive Officer and Chief Investment Officer of Minneapolis Employees Retirement Fund from 1996 to 2008. Ms. Johnson is an attorney, certified public accountant and a certified managerial accountant. | | Asset Allocation Trust |
| | | |
David F. Larcker (Born 1950) | | Trustee, since 2009 | | James Irvin Miller Professor of Accounting at the Graduate School of Business, Stanford University, Director of the Corporate Governance Research Initiative and Senior Faculty of The Rock Center for Corporate Governance since 2006. From 2005 to 2008, Professor of Accounting at the Graduate School of Business, Stanford University. Prior thereto, Ernst & Young Professor of Accounting at The Wharton School, University of Pennsylvania from 1985 to 2005. | | Asset Allocation Trust |
| | | |
Olivia S. Mitchell (Born 1953) | | Trustee, since 2006 | | International Foundation of Employee Benefit Plans Professor, Wharton School of the University of Pennsylvania since 1993. Director of Wharton’s Pension Research Council and Boettner Center on Pensions & Retirement Research, and Research Associate at the National Bureau of Economic Research. Previously, Cornell University Professor from 1978 to 1993. | | Asset Allocation Trust |
| | | |
Timothy J. Penny (Born 1951) | | Trustee, since 1996: Vice Chairman, since 2017 | | President and Chief Executive Officer of Southern Minnesota Initiative Foundation, a non-profit organization, since 2007 and Senior Fellow at the Humphrey Institute Policy Forum at the University of Minnesota since 1995. Member of the Board of Trustees of NorthStar Education Finance, Inc., a non-profit organization, since 2007. | | Asset Allocation Trust |
| | | |
Michael S. Scofield (Born 1943) | | Trustee, since 2010 | | Served on the Investment Company Institute’s Board of Governors and Executive Committee from 2008-2011 as well the Governing Council of the Independent Directors Council from 2006-2011 and the Independent Directors Council Executive Committee from 2008-2011. Chairman of the IDC from 2008-2010. Trustee of the Evergreen Funds complex (and its predecessors) from 1984 to 2010. Chairman of the Evergreen Funds from 2000-2010. Former Trustee of the Mentor Funds. Retired Attorney, Law Offices of Michael S. Scofield. | | Asset Allocation Trust |
* Length of service dates reflect the Trustee’s commencement of service with the Trust’s predecessor entities, where applicable.
** Peter Gordon is expected to retire on December 31, 2017.
Advisory Board Members
| | | | | | |
Name and year of birth | | Position held and
length of service | | Principal occupations during past five years or longer | | Current other public company or investment company directorships |
| | | |
James G. Polisson (Born 1959) | | Advisory Board Member,
since 2017 | | Retired. Chief Marketing Officer, Source (ETF) UK Services, Ltd, from 2015 to 2017. From 2012 to 2015, Principal of The Polisson Group, LLC, a management consulting, corporate advisory and principal investing company. Chief Executive Officer and Managing Director at Russell Investments, Global Exchange Traded Funds from 2010 to 2012. Managing Director of Barclays Global Investors from 1998 to 2010 and Global Chief Marketing Officer for iShares and Barclays Global Investors from 2000 to 2010. Prior thereto, Vice President, Fidelity Retail Mutual Fund Group from 1996 to 1998 and Risk Management Practice Manager, Fidelity Consulting from 1995 to 1996. Board member of the Russell Exchange Traded Fund Trust from 2011 to 2012. Director of Barclays Global Investors Holdings Deutschland GmbH from 2006 to 2009. Mr. Polisson is an attorney and has a retired status with the Massachusetts and District of Columbia Bar Associations. | | None |
15
| | | | |
Wells Fargo International Government Bond Portfolio | | | Other information | (unaudited) |
| | | | | | |
Name and year of birth | | Position held and length of service | | Principal occupations during past five years or longer | | Current other public company or investment company
directorships |
| | | |
Pamela Wheelock (Born 1959) | | Advisory Board Member,
since 2017 | | Chief Operating Officer, Twin Cities Habitat for Humanity, since January, 2017. Vice President of University Services, University of Minnesota from 2012 to 2017. Prior thereto, Interim President and Chief Executive Officer of Blue Cross Blue Shield of Minnesota from 2010 to 2011, Chairman of the Board from 2009 to 2011 and Board Director from 2003 to 2015. Vice President, Leadership and Community Engagement, Bush Foundation, Saint Paul, Minnesota (a private foundation) from 2009 to 2011. Executive Vice President and Chief Financial Officer, Minnesota Sports and Entertainment from 2004 to 2009 and Senior Vice President from 2002 to 2004. Commissioner of Finance, State of Minnesota, from 1999 to 2002. Currently on the Board of Directors, Governance Committee and Finance Committee, for the Minnesota Philanthropy Partners (Saint Paul Foundation) since 2012 and Board Chair of the Minnesota Wild Foundation since 2010. | | None |
Officers
| | | | | | |
Name and year of birth | | Position held and
length of service | | Principal occupations during past five years or longer | | |
| | | |
Andrew Owen (Born 1960) | | President, since 2017 | | Executive Vice President of Wells Fargo & Company and Head of Affiliated Managers, Wells Fargo Asset Management, since 2014. In addition, Mr. Owen is currently President, Chief Executive Officer and Director of Wells Fargo Funds Management, LLC since 2017. Prior thereto, Executive Vice President responsible for marketing, investments and product development for Wells Fargo Funds Management, LLC, from 2009 to 2014. | | |
| | | |
Jeremy DePalma1 (Born 1974) | | Assistant Treasurer, since 2012 | | Senior Vice President of Wells Fargo Funds Management, LLC since 2009. Senior Vice President of Evergreen Investment Management Company, LLC from 2008 to 2010 and head of the Fund Reporting and Control Team within Fund Administration from 2005 to 2010. | | |
| | | |
C. David Messman (Born 1960) | | Secretary, since 2000; Chief Legal Officer, since 2003 | | Senior Vice President and Secretary of Wells Fargo Funds Management, LLC since 2001. Assistant General Counsel of Wells Fargo Bank, N.A. since 2013 and Vice President and Managing Counsel of Wells Fargo Bank, N.A. from 1996 to 2013. | | |
| | | |
Michael H. Whitaker (Born 1967) | | Chief Compliance Officer, since 2016 | | Senior Vice President and Chief Compliance Officer since 2016. Senior Vice President and Chief Compliance Officer for Fidelity Investments from 2007 to 2016. | | |
| | | |
David Berardi (Born 1975) | | Assistant Treasurer, since 2009 | | Vice President of Wells Fargo Funds Management, LLC since 2009. Vice President of Evergreen Investment Management Company, LLC from 2008 to 2010. Manager of Fund Reporting and Control for Evergreen Investment Management Company, LLC from 2004 to 2010. | | |
1 Jeremy DePalma acts as Treasurer of 76 funds and Assistant Treasurer of 76 funds in the Fund Complex.
2 The Statement of Additional Information includes additional information about the Trustees and is available, without charge, upon request, by calling 1-800-222-8222 or by visiting the website at wellsfargofunds.com.
16
| | | | |
Wells Fargo International Government Bond Portfolio | | | List of abbreviations | |
The following is a list of common abbreviations for terms and entities that may have appeared in this report.
| | | | | | |
| ACA | | — ACA Financial Guaranty Corporation | | LIQ | | — Liquidity agreement |
| ADR | | — American depositary receipt | | LLC | | — Limited liability company |
| ADS | | — American depositary shares | | LLLP | | — Limited liability limited partnership |
| AGC | | — Assured Guaranty Corporation | | LLP | | — Limited liability partnership |
| AGM | | — Assured Guaranty Municipal | | LOC | | — Letter of credit |
| Ambac | | — Ambac Financial Group Incorporated | | LP | | — Limited partnership |
| AMT | | — Alternative minimum tax | | MBIA | | — Municipal Bond Insurance Association |
| AUD | | — Australian dollar | | MFHR | | — Multifamily housing revenue |
| BAN | | — Bond anticipation notes | | MSTR | | — Municipal securities trust receipts |
| BHAC | | — Berkshire Hathaway Assurance Corporation | | MTN | | — Medium-term note |
| BRL | | — Brazilian real | | MUD | | — Municipal Utility District |
| CAB | | — Capital appreciation bond | | MXN | | — Mexican peso |
| CAD | | — Canadian dollar | | MYR | | — Malaysian ringgit |
| CCAB | | — Convertible capital appreciation bond | | National | | — National Public Finance Guarantee Corporation |
| CDA | | — Community Development Authority | | NGN | | — Nigerian naira |
| CDO | | — Collateralized debt obligation | | NOK | | — Norwegian krone |
| CHF | | — Swiss franc | | NZD | | — New Zealand dollar |
| CLO | | — Collateralized loan obligation | | PCFA | | — Pollution Control Financing Authority |
| CLP | | — Chilean peso | | PCL | | — Public Company Limited |
| COP | | — Colombian peso | | PCR | | — Pollution control revenue |
| DKK | | — Danish krone | | PFA | | — Public Finance Authority |
| DRIVER | | — Derivative inverse tax-exempt receipts | | PFFA | | — Public Facilities Financing Authority |
| DW&P | | — Department of Water & Power | | PFOTER | | — Puttable floating option tax-exempt receipts |
| DWR | | — Department of Water Resources | | PJSC | | — Public Joint Stock Company |
| ECFA | | — Educational & Cultural Facilities Authority | | plc | | — Public limited company |
| EDA | | — Economic Development Authority | | PLN | | — Polish zloty |
| EDFA | | — Economic Development Finance Authority | | PUTTER | | — Puttable tax-exempt receipts |
| ETF | | — Exchange-traded fund | | R&D | | — Research & development |
| EUR | | — Euro | | Radian | | — Radian Asset Assurance |
| FDIC | | — Federal Deposit Insurance Corporation | | RAN | | — Revenue anticipation notes |
| FFCB | | — Federal Farm Credit Banks | | RDA | | — Redevelopment Authority |
| FGIC | | — Financial Guaranty Insurance Corporation | | RDFA | | — Redevelopment Finance Authority |
| FHA | | — Federal Housing Administration | | REIT | | — Real estate investment trust |
| FHLB | | — Federal Home Loan Bank | | ROC | | — Reset option certificates |
| FHLMC | | — Federal Home Loan Mortgage Corporation | | RON | | — Romanian lei |
| FICO | | — The Financing Corporation | | RUB | | — Russian ruble |
| FNMA | | — Federal National Mortgage Association | | SAVRS | | — Select auction variable rate securities |
| FSA | | — Farm Service Agency | | SBA | | — Small Business Authority |
| GBP | | — Great British pound | | SDR | | — Swedish depositary receipt |
| GDR | | — Global depositary receipt | | SEK | | — Swedish krona |
| GNMA | | — Government National Mortgage Association | | SFHR | | — Single-family housing revenue |
| GO | | — General obligation | | SFMR | | — Single-family mortgage revenue |
| HCFR | | — Healthcare facilities revenue | | SGD | | — Singapore dollar |
| HEFA | | — Health & Educational Facilities Authority | | SPA | | — Standby purchase agreement |
| HEFAR | | — Higher education facilities authority revenue | | SPDR | | — Standard & Poor’s Depositary Receipts |
| HFA | | — Housing Finance Authority | | SPEAR | | — Short Puttable Exempt Adjustable Receipts |
| HFFA | | — Health Facilities Financing Authority | | STRIPS | | — Separate trading of registered interest and |
| HKD | | — Hong Kong dollar | | | | principal securities |
| HUD | | — Department of Housing and Urban Development | | TAN | | — Tax anticipation notes |
| HUF | | — Hungarian forint | | TBA | | — To be announced |
| IDA | | — Industrial Development Authority | | THB | | — Thai baht |
| IDAG | | — Industrial Development Agency | | TIPS | | — Treasury inflation-protected securities |
| IDR | | — Indonesian rupiah | | TRAN | | — Tax revenue anticipation notes |
| IEP | | — Irish pound | | TRY | | — Turkish lira |
| JPY | | — Japanese yen | | TTFA | | — Transportation Trust Fund Authority |
| KRW | | — Republic of Korea won | | TVA | | — Tennessee Valley Authority |
| LIBOR | | — London Interbank Offered Rate | | ZAR | | — South African rand |
| LIFER | | — Long Inverse Floating Exempt Receipts | | | | |
17

| | | | |
For more information More information about Wells Fargo Funds is available free upon request. To obtain literature, please write, email, visit the Funds’ website, or call: Wells Fargo Funds P.O. Box 8266 Boston, MA 02266-8266 Email: fundservice@wellsfargo.com Website: wellsfargofunds.com Individual investors: 1-800-222-8222 Retail investment professionals: 1-888-877-9275 Institutional investment professionals: 1-866-765-0778 | | This report and the financial statements contained herein are submitted for the general information of the shareholders of Wells Fargo Funds. If this report is used for promotional purposes, distribution of the report must be accompanied or preceded by a current prospectus. Before investing, please consider the investment objectives, risks, charges, and expenses of the investment. For a current prospectus and, if available, a summary prospectus, containing this information, call 1-800-222-8222 or visit the Funds’ website at wellsfargofunds.com. Read the prospectus carefully before you invest or send money. Wells Fargo Asset Management (WFAM) is a trade name used by the asset management businesses of Wells Fargo & Company. Wells Fargo Funds Management, LLC, a wholly owned subsidiary of Wells Fargo & Company, provides investment advisory and administrative services for Wells Fargo Funds. Other affiliates of Wells Fargo & Company provide subadvisory and other services for the funds. The funds are distributed by Wells Fargo Funds Distributor, LLC, Member FINRA, an affiliate of Wells Fargo & Company. Neither Wells Fargo Funds Distributor nor Wells Fargo Funds Management holds fund shareholder accounts or assets. This material is for general informational and educational purposes only and is NOT intended to provide investment advice or a recommendation of any kind—including a recommendation for any specific investment, strategy, or plan. |
| | NOT FDIC INSURED § NO BANK GUARANTEE § MAY LOSE VALUE | | |
| | |
| | © 2017 Wells Fargo Funds Management, LLC. All rights reserved. | | |
| | |
| |  | | 305825 10-17 SA/SAR 271 08-17 |
ITEM 2. CODE OF ETHICS
Not applicable.
ITEM 3. AUDIT COMMITTEE FINANCIAL EXPERT
Not applicable.
ITEM 4. PRINCIPAL ACCOUNTANT FEES AND SERVICES
Not applicable.
ITEM 5. AUDIT COMMITTEE OF LISTED REGISTRANTS
Not applicable.
ITEM 6. INVESTMENTS
A Portfolio of Investments for each series of Wells Fargo Master Trust is included as part of the report to shareholders filed under Item 1 of this Form.
ITEM 7. DISCLOSURE OF PROXY VOTING POLICIES AND PROCEDURES FOR CLOSED-END MANAGEMENT INVESTMENT COMPANIES
Not applicable.
ITEM 8. PORTFOLIO MANAGERS OF CLOSED-END MANAGEMENT INVESTMENT COMPANIES
Not applicable.
ITEM 9. PURCHASES OF EQUITY SECURITIES BY CLOSED-END MANAGEMEENT INVESTMENT COMPANY AND AFFILIATED PURCHASERS
Not applicable.
ITEM 10. SUBMISSION OF MATTERS TO A VOTE OF SECURITY HOLDERS
There have been no material changes to the procedures by which shareholders may recommend nominees to the registrant’s Board of Trustees that have been implemented since the registrant’s last provided disclosure in response to the requirements of this Item.
ITEM 11. CONTROLS AND PROCEDURES
(a) The President and Treasurer have concluded that the Wells Fargo Master Trust (the “Trust”) disclosure controls and procedures (as defined in Rule 30a-3(c) under the Investment Company Act of 1940) provide reasonable assurances that material information relating to the Trust is made known to them by the appropriate persons, based on their evaluation of these controls and procedures as of a date within 90 days of the filing of this report.
(b) There were no significant changes in the Trust’s internal controls over financial reporting (as defined in Rule 30a-3(d) under the Investment Company Act of 1940) that occurred during the second fiscal quarter of the period covered by this report that materially affected, or is reasonably likely to materially affect, the registrant’s internal control over financial reporting.
ITEM 12. EXHIBITS
(a)(1) Not applicable.
(a)(2) Certification pursuant to Rule 30a-2(a) under the Investment Company Act of 1940 (17 CFR 270.30a-2(a)) is filed and attached hereto as Exhibit 99.CERT.
(a)(3) Not applicable.
(b) Certification pursuant to Rule 30a-2(b) under the Investment Company Act of 1940 (17 CFR 270.30a-2(b)) is filed and attached hereto as Exhibit 99.906CERT.
SIGNATURES
Pursuant to the requirements of the Securities Exchange Act of 1934 and the Investment Company Act of 1940, the registrant has duly caused this report to be signed on its behalf by the undersigned, thereunto duly authorized.
| | |
| Wells Fargo Master Trust |
| |
| By: | | |
| | /s/ Andrew Owen |
| |
| | Andrew Owen |
| | President |
| |
| Date: | | October 26, 2017 |
Pursuant to the requirements of the Securities Exchange Act of 1934 and the Investment Company Act of 1940, this report has been signed below by the following persons on behalf of the registrant and in the capacities and on the date indicated.
| | |
| Wells Fargo Master Trust |
| |
| By: | | |
| | /s/ Andrew Owen |
| |
| | Andrew Owen |
| | President |
| |
| Date: | | October 26, 2017 |
| |
| By: | | |
| | /s/ Jeremy DePalma |
| |
| | Jeremy DePalma |
| | Treasurer |
| |
| Date: | | October 26, 2017 |