Exhibit 4.6
- 4 - PENGROWTH ENERGY TRUST
Management’s Discussion and Analysis
The following discussion and analysis of financial results should be read in conjunction with:
| | • | | The MD&A and the audited consolidated financial statements as at and for the year ended December 31, 2001 and 2000; and |
| | • | | The interim unaudited consolidated financial statements as at and for the three months ended June 30, 2002. |
NOTE REGARDING FORWARD-LOOKING STATEMENTS
| | This discussion and analysis contains forward-looking statements. These statements relate to future events or our future performance. In some cases, you can identify forward-looking statements by terminology such as “may”, “will”, “should”, “expect”, “plan”, “anticipate”, “believe”, “estimate”, “predict”, “potential”, “continue”, or the negative of these terms or other comparable terminology. These statements are only predictions. A number of factors may cause actual results to vary materially from these estimates. Actual events or results may differ materially. In addition, this discussion contains forward-looking statements attributed to third party industry sources. Readers should not place undue reliance on these forward-looking statements. |
Note Regarding Currency
All figures contained within this discussion and analysis are quoted in Canadian dollars unless otherwise indicated.
Distributable Income
Distributable income declined by 24% to $48.1 million for the second quarter of 2002, from $63.4 million in the second quarter of 2001; however, distributable income increased 45% compared to the first quarter of 2002. Distributable income per unit was $0.54 per unit in the second quarter of 2002 compared to $0.83 per unit in the second quarter of 2001. For the six months ended June 30, 2002, Pengrowth recorded $81.2 million in distributable income or $0.95 per unit, compared to $135.5 million or $1.97 per unit in the first six months of 2001. The lower distributable income in 2002 compared to the same period last year is due mainly to lower average commodity prices, offset in part by a 12% increase in total production.
The following is a summary of recent monthly distributions and future key dates:
| | | | | | | |
| Ex-Distribution | | Record Date | | Distribution | | Distribution Amount |
| Date * | | | | Payment Date | | per Trust Unit |
|
December 27, 2001
January 30, 2002
February 27, 2002
March 27, 2002
April 29, 2002
May 30, 2002
June 26, 2002
July 29, 2002
August 28, 2002
September 26, 2002
October 29, 2002
November 28, 2002 | | December 31, 2001
February 1, 2002
March 1, 2002
April 1, 2002
May 1, 2002
June 3, 2002
June 28, 2002
July 31, 2002
August 30, 2002
September 30, 2002
October 31, 2002
December 2, 2002 | | January 15, 2002
February 15, 2002
March 15, 2002
April 15, 2002
May 15, 2002
June 15, 2002
July 15, 2002
August 15, 2002
September 15, 2002
October 15, 2002
November 15, 2002
December 15, 2002 | | $0.13
0.13
0.13
0.13
0.15
0.21
0.17
0.16 |
Pengrowth Monthly Cash Distributions
(cents Canadian)
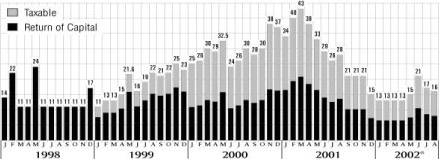
Including August 15, 2002 distribution
* Taxable amount for 2002 is estimated
PENGROWTH ENERGY TRUST - 5 -
Prices
Pengrowth’s average crude oil price was 11% lower in the first six months of 2002 compared to the first six months of 2001. This decline is due to a 13% decrease in the WTI benchmark price for crude oil after adjusting for the weaker Canadian exchange rate in 2002. Pengrowth’s average crude oil price for the first six months of 2002 includes a hedging loss of $0.11 per bbl compared to a hedging loss of $0.66 per bbl in the first half of 2001.
Pengrowth’s average natural gas price for the first six months of 2002 fell by 53% to $3.29 per mcf compared to $6.98 per mcf over the same period last year. By comparison the AECO and Nymex average prices fell by 57% and 53% respectively in the first six months of 2002 as compared to the same period last year. Included in the net realized price for natural gas for the period is a hedging loss of $0.03 per mcf for the first six months of 2002, compared to a hedging loss of $1.09 per mcf for the first half of 2001.
The combined effect of the decline in realized crude oil, natural gas and natural gas liquids prices resulted in an average price of $30.06 per boe in the second quarter of 2002, down 17% from the second quarter of 2001. For the first six months of 2002, Pengrowth’s average realized price was down 31% from the same period in the prior year.
| | | | | | | | | | | | | | | | | | | | | | | | | |
| Average Prices C$ | | Three months ended | | Six months ended |
|
| | | June 30, | | June 30, | | % | | June 30, | | June 30, | | % |
| | | 2002 | | 2001 | | Change | | 2002 | | 2001 | | Change |
| |
Crude oil (per bbl) | | $ | 38.63 | | | $ | 39.44 | | | | -2 | % | | $ | 35.61 | | | $ | 39.90 | | | | -11 | % |
Natural gas (per mcf) | | $ | 3.75 | | | $ | 5.72 | | | | -34 | % | | $ | 3.29 | | | $ | 6.98 | | | | -53 | % |
Natural gas liquids (per boe) | | $ | 28.04 | | | $ | 34.42 | | | | -19 | % | | $ | 25.48 | | | $ | 37.64 | | | | -32 | % |
|
Total per boe (6:1) | | $ | 30.06 | | | $ | 36.11 | | | | -17 | % | | $ | 27.17 | | | $ | 39.49 | | | | -31 | % |
|
| | | |
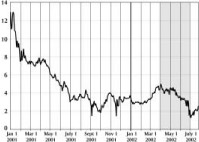
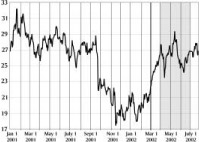
AECO Gas Price
($C / mcf) | | WTI Oil Price
($US / bbl) |
 | |  |
Production
Total BOE production has increased 11% in the second quarter of 2002, compared to the second quarter of 2001. For the six months ended June 30, 2002 total production is 12% higher than the same period last year.
| | | | | | | | | | | | | | | | | | | | | | | | | |
| Daily Production | | Three months ended | | Six months ended |
|
|
|
| | | June 30, | | June 30, | | % | | June 30, | | June 30, | | % |
| | | 2002 | | 2001 | | Change | | 2002 | | 2001 | | Change |
| |
Crude oil (bbls/d) | | | 18,096 | | | | 19,650 | | | | -8 | % | | | 18,302 | | | | 20,039 | | | | -9 | % |
Natural gas (mcf/d) | | | 103,856 | | | | 75,753 | | | | +37 | % | | | 106,936 | | | | 74,709 | | | | +43 | % |
Natural gas liquids (bbls/d) | | | 5,350 | | | | 4,418 | | | | +21 | % | | | 5,176 | | | | 4,385 | | | | +18 | % |
Sulphur (Lt) | | | 16 | | | | 147 | | | | | | | | 11 | | | | 57 | | | | | |
|
Total boe/d (6:1) | | | 40,771 | | | | 36,840 | | | | +11 | % | | | 41,312 | | | | 36,933 | | | | +12 | % |
|
- 6 - PENGROWTH ENERGY TRUST
Crude oil production was 8% lower in the second quarter of 2002 compared to the second quarter of 2001, and declined 9% in the first six months of 2002 compared to the first six months of 2001. This decline is attributable to dispositions of non-core properties in the first half of 2002 and 2001 as well as natural production declines at existing properties, offset in part by production additions from development activities.
Production Profie
(boe/day)
| | | |
 | | Natural gas production increased 37% in the second quarter of 2002 compared to the second quarter of 2001. This increase is attributable mainly to the Sable acquisition in June, 2001. The acquisition of other natural gas properties including Quirk Creek in May, 2002, and Kaybob Notikewan in March, 2001 also contributed to the increase in natural gas volumes. The disposition of Portage Gas Unit in April 2001, production declines at other properties, as well as an increase in gas volumes required for the miscible flood at Judy Creek partially offset the incremental volumes from recent acquisitions. For the first six months of 2002 natural gas production increased 43% over the same period last year |
Natural gas liquids production increased 21% in the second quarter of 2002 compared to the second quarter of 2001 due mainly to the acquisition of the Sable interest. For the first half of 2002 natural gas liquids production increased 18% over the same period last year.
For the first six months of 2002, Pengrowth’s production portfolio consisted of 44% crude oil, 43% natural gas, with natural gas liquids making up the remaining 13% of production.
Price Risk Management Program
In the first six months of 2002, Pengrowth realized a net hedging loss of $0.5 million related to fixed price gas contracts (as compared to monthly AECO average spot prices) and natural gas financial swap contracts compared to a hedging loss of $14.8 million for the same period last year. Net hedging losses realized on crude oil price swap transactions were $0.4 million compared to a $2.4 million hedging loss in the first half of 2001.
At June 30, 2002 Pengrowth had entered into financial swap transactions that fix the price on:
| • | | 4,000 barrels of oil per day for the remainder of 2002 at an average price of Cdn$36.12/bbl. |
| • | | 7,000 Mmbtu per day of natural gas until the end of 2004 at a fixed price of $US3.90 per Mmbtu |
| • | | 5,000 Mmbtu per day of natural gas for 2003 and 2004 at a fixed price of Cdn$7.05/Mmbtu and Cdn$6.90/Mmbtu respectively. |
Pengrowth also has sales commitments to deliver 8,720 mcf/d of natural gas at an average plantgate price of Cdn$2.99/mcf until the end of October 2002. Approximately 17% of Pengrowth’s estimated natural gas production for the second half of 2002 is now hedged.
Subsequent to quarter-end, Pengrowth entered into additional oil price swap transactions, fixing the price on an additional 1,000 barrels per day from August 1st to December 31, 2002, at a fixed price of Cdn$41.35/bbl and an additional 1,000 barrels per day for 2003 at a fixed price of Cdn$39.05. Approximately 27% of estimated third and fourth quarter oil production (4,832 barrels per day) is now hedged at an average price of Cdn$37.02 per bbl.
PENGROWTH ENERGY TRUST - 7 -
Interest Rate and Foreign Exchange Hedging
Pengrowth has entered into interest rate swaps on $125 million of its long term debt for three year periods ending in November 2004 ($75 million), December 2004 ($25 million) and March 2005 ($25 million), at an average interest rate of 4.09% (before stamping fees).
Subsequent to quarter end, Pengrowth entered into a foreign exchange hedge which fixes the U.S. dollar exchange rate at $1.55 Cdn/USD on US$750,000 per month for the calendar periods 2003 and 2004, to reduce exposure of the $US denominated natural gas hedge.
Operating Costs
Operating costs increased to $30.5 million (or $8.22/boe) for the second quarter of 2002, compared to $22.2 million (or $6.62/boe) for the second quarter of 2001. For the six months ended June 30, 2002, operating costs were $58.1 million ($7.77 / boe), compared to $43.8 million ($6.55/boe) for the first half of 2001. The increase in operating costs is attributable mainly to property acquisitions over the last year, offset in part by property dispositions. The Sable acquisition has increased Pengrowth’s average operating cost per boe, since Pengrowth pays processing fees to the owners of the offshore platforms and the gathering and processing facilities. Enhanced oil recovery projects at Goose River and Weyburn also contribute to higher operating costs per boe.
Amortization of Injectants for miscible floods
Amortization of injectants for the second quarter of 2002 was $11.3 million down 4% from $11.8 million for the second quarter of 2001. For the six-month period, amortized injectant costs were $23.4 million compared to $22.5 million for the first half of 2001. Injectant costs are amortized over a 30-month period, based on the estimated period of economic benefit. Based on current injection levels and prices for ethane and methane, the amortization amount is expected to continue to decline in the third and fourth quarters of 2002.
On-going initiatives to maximize the use of on-site solvents at Judy Creek and reduce the requirement for purchased injectants have been successful. As a result of the reduction in purchased injectant volumes, coupled with a much lower ethane price in 2002, Pengrowth’s total solvent purchases in the second quarter were reduced to $4.1 million, compared to $22.0 million for the same period in 2001. On a year to date basis, third party solvent purchases were $7.4 million for the first half of 2002, compared to $40.1 million in 2001.
Royalties
Royalties, including crown and freehold royalties, were 12.8% of oil and gas sales in the three months ended June 30, 2002, compared to 13.7% in the second quarter of 2001. For the six-month period, royalties were 13.6% and 17.5% in 2002 and 2001 respectively. The decline in the royalty percentage in 2002 over 2001 is due to lower commodity prices in 2002 (particularly natural gas), a reduction in hedging losses realized in 2002, and lower royalties on Sable revenues, offset in part by lower injection credits in 2002.
Depletion and depreciation
Depletion and depreciation for the second quarter of 2002 was $31.7 million, a 14% increase from $27.9 million for the second quarter of 2001. For the six months ended June 30, 2002, depletion and depreciation is $62.1 million, a 10% increase over the same period last year. This increase is in line with production increases over the same period. On a per boe basis, depletion and depreciation was $8.31 per boe for the first six months of 2002, down 2% from $8.49 per boe in the first half of 2001.
Interest
Interest expense for the three months ended June 30, 2002 was $3.1 million compared to $5.1 million for the second quarter of 2001. For the first six months of 2002, interest expense was $6.2 million compared to $9.9 million for the first half of 2001. This reduction is due in part to lower interest rates in 2002 as well as lower average debt in 2002.
- 8 - PENGROWTH ENERGY TRUST
General and Administrative
General and administrative expenses (G&A) were $3.0 million in the second quarter of 2002 compared to $1.5 million for the second quarter of 2001. The increase in 2002 includes incremental costs related to drafting, printing and mailing of the annual report and information circular. These costs were substantially higher in 2002 due to the much larger size of the information circular document and a larger number of mail-outs due to an increase in the number of unitholders, as well as legal costs to redraft the four agreements contained in the Information Circular. Administrative costs associated with the Sable property have also increased G&A. For the six months ended June 30, 2002, G&A expenses were $5.2 million compared to $3.6 million for the same period last year. On a per boe basis, year to date G&A is $0.70 per boe, compared to $0.54 per boe for the first half of 2001.
Management Fee
Management fees were $1.7 million for the second quarter of 2002 compared to $1.9 million for the second quarter of 2001. For the six-month period, management fees were $3.1 million in 2002 compared to $4.7 million in 2001. On a per boe basis, management fees for the first six months of 2002 are $0.42 per boe, compared to $0.71 per boe in 2001.
Net Income
Net income for the three months ended June 30, 2002 was $13.6 million or $0.16 per unit compared to $33.8 million ($0.50 per unit) in the second quarter of 2001. For the six months ended June 30, 2002, net income was $14.0 million ($0.17 per unit) compared to $75.8 million ($1.15 per unit) for the similar period last year. Most of this decline is attributable to lower commodity prices and higher operating expenses and depletion, offset in part by a 12% increase in production volumes in 2002.
| | | |
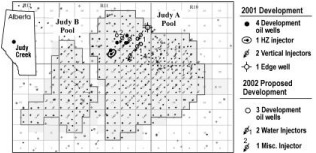
Acquisitions
On May 23, 2002 Pengrowth acquired additional interests in the Quirk Creek area of southwest Alberta, through the exercise of Rights of First Refusal, for a total purchase price of $32.7 million, before adjustments. The acquisition included an additional 55.9% working interest in three producing gas wells, and an additional 26.4 % working interest in ten producing gas wells. Pengrowth also acquired an additional 25.9% working interest in the Quirk Creek gas plant. Prior to this acquisition, Pengrowth held an average working interest of 5.5% in 13 producing gas wells at Quirk Creek and a 4.6% working interest in the gas plant | |  |
| |
| Gilbert Laustsen Jung Associates estimates the established reserves attributable to the acquired Quirk Creek Assets are 2.9 million boe. The estimated 2002 proved producing production volumes attributable to the acquired Quirk Creek Assets are 4 mmcfpd of gas and 193 bpd of liquids for a total of 856 boepd. The acquisition also provides significant natural gas processing revenue | |
The Quirk Creek purchase represents an excellent add-on interest for Pengrowth with potential opportunity for additional future gas development and processing services in the immediate area.
Dispositions
On April 30, 2002, Pengrowth closed the sale of non-core properties including interests in Strachan, North Pembina Cardium Unit, Minehead and Niton for total proceeds of $40.2 million, before adjustments.
Equity Issue
On June 4, 2002, Pengrowth successfully completed a public offering of 8.0 million units at $15.40 per unit to raise total gross proceeds of $123.2 million and net proceeds of approximately $116 million. The net proceeds from this issue were used to repay bank indebtedness incurred to fund prior acquisitions of petroleum and natural gas properties.
PENGROWTH ENERGY TRUST - 9 -
Financial Resources
Pengrowth’s long-term debt at June 30, 2002 was $219.1 million, compared to $345.5 million at December 31, 2001. The following is a reconciliation of long-term debt for the first six months of 2002:
| | | | | | |
| Long-term Debt Continuity | | millions |
|
| | Balance at December 31, 2001 | | $ | 345.5 | |
| | Difference between solvent purchases and expenses | | | (16.0 | ) |
| | Acquisitions, net of adjustments | | | 34.0 | |
| | Dispositions, net of adjustments | | | (44.6 | ) |
| | Capital expenditures, excluding acquisitions | | | 25.4 | |
| | Proceeds from the issue of trust units including option exercises and DRIP | | | (117.2 | ) |
| | Change in working capital and Remediation Trust Fund | | | (8.0 | ) |
|
| | Balance at June 30, 2002 | | $ | 219.1 | |
|
The ratio of debt to trailing 12-month distributable income at June 30, 2002 was 1.4 times, compared to 1.6 times at December 31, 2001. The ratio of long-term debt to long term debt plus equity has declined to 20% from 30% at year-end 2001. Distributable income covered interest expense by 12 times in the first six months of 2002. These favorable ratios reflect the successful debt-reduction initiatives over the last eight months, including the disposition of non-core assets and the completion of public equity offerings in December 2001 and June of 2002.
Reconciliation of Distributions to Funds Generated from Operations
The following table demonstrates Pengrowth’s current policy of distributing all of the funds generated by operations, after adjusting for the manner in which Pengrowth amortizes miscible injectant costs. A comparison of the “Distributions” amount shown on Pengrowth’s Consolidated Statement of Cash Flow to “Funds Generated from Operations” also requires an adjustment for the two-month time lag between when funds are generated by the business and when they are paid to unitholders.
| | | | | | |
| Reconciliation of Distributions to Funds Generated From Operations | | Six months ended |
| Consolidated Statement of Cash Flow | | June 30, 2002 |
|
| | | | millions |
Distributions per Statement of Cash Flow | | $ | 72.4 | |
Subtract: Distributions paid in 2002 but earned in 2001 (Distributions payable December 31, 2001) | | | (22.2 | ) |
Add: Distributions earned in the first six months but unpaid at June 30, 2002 (May and June distributions and any balance unpaid) | | | 31.0 | |
| | Total Adjusted Distributions for the period (Distributable Income) | | | 81.2 | |
Purchase of injectants for miscible floods | | | (7.4 | ) |
Amortization of injectants for miscible floods | | | 23.4 | |
Items included in Distributable Income but not in Net Income (e.g. remediation trust fund | | | | |
contributions in excess of expenses) | | | 0.3 | |
|
| | Funds Generated From Operations | | $ | 97.5 | |
|
Capital Spending
Capital expenditures for the six months ending June 30, 2002 totaled $25.4 million of which $19.2 million was spent on drilling, completion and tie-ins, and $6.2 million was spent on facilities. 2002 expenditures include $11.0 million at Judy Creek, $4.5 million at Sable, $2.0 million at Goose River, $1.7 million at McLeod River, and $1.4 million at Weyburn.
- 10 - PENGROWTH ENERGY TRUST
Review of Development Activities
Second quarter development activities at Pengrowth’s operated properties include the following:
At Judy Creek:
| | • | | Drilled three wells in “A” Pool, as part of Pengrowth’s ongoing Judy Creek development program. |
| | • | | Solvent injection was active in eight patterns during the second quarter – seven in “A” Pool and one in “B” Pool. |
| | • | | Workovers completed on 20 wells in “A” and “B” Pools resulting in total incremental production of approximately 215 bopd. |
At McLeod:
| | • | | Drilled a 60% WI gas well, which will be tied in during August. |
| | • | | Four additional drilling locations have been identified which are expected to be drilled in the third and fourth quarters of 2002. |
| | • | | Two farmout deals with two well commitments on Pengrowth lands were negotiated in the second quarter. |
At Enchant:
| | • | | Good Production Practice (GPP) was approved for the Arcs CC&EE Pool in June 2002, which is expected to increase oil production by approximately 20bbls/day (11bbls/day net). |
At Pengrowth’s partner-operated properties, second quarter development activities include the following:
At Sable:
| | • | | Sable raw gas production averaged 532 mmcf/d (44.6 mmcf/d net to Pengrowth) during the first half of 2002. This compares with average raw gas production of 488 mmcf/d (41.0 mmcf/d net to Pengrowth) during the first half of 2001. (Pengrowth acquired the Sable royalty interest on June 15, 2001.) |
At Goose River:
| | • | | Pengrowth has a 42% working interest • The two new oil wells tied in during the first quarter of 2002 continue to meet performance expectations. |
| | • | | Pengrowth has agreed to participate in the drilling of an additional two wells. The first well located at 4-8-67-18W5M was spudded on June 23, 2002 and has been cased as a potential oil well. Completion operations are currently underway. The second well located at 12-5-67-18W5 will commence drilling in July. |
At Weyburn:
| | • | | The CO2 miscible flood program operated by EnCana continues to exhibit positive performance indications with the incremental gross oil production from the flood estimated at 5,300 bopd (517 bopd net to Pengrowth’s 9.75% interest, current production rates are approximately 21,000 bpd (gross) and 2,000 bpd (net). |
| | • | | Expansion of the CO2 miscible flood has continued on schedule with two new injection patterns anticipated to commence injection in August, and injection into the next two patterns scheduled for September. |
PENGROWTH ENERGY TRUST - 11 -
2002 Tax Estimate Update Pengrowth forecasts that in the current commodity price environment, approximately 40 to 45% of distributions paid in 2002 will be taxable to unitholders, with the remainder of distributions treated as return of capital and thus tax deferred. The taxability may be reduced if Pengrowth makes additional acquisitions and issues new equity during the balance of the year.

PENGROWTH CORPORATION
James S. Kinnear
President and Chief
Executive Officer
Pengrowth Energy Trust
August 1, 2002
For further information about Pengrowth, please visit our website www.pengrowth.com or contact:
Dan Belot, Manager, Investor Relations, Calgary E-mail: pengrowth@pengrowth.com Telephone: (403) 213-8650 Toll Free: 1-800-223-4122 Facsimile: (403) 294-0051
Sally Elliott, Investor Relations, Toronto E-mail: sallye@pengrowth.com Telephone: (416) 362-1748 Toll Free: 1-888-744-1111 Facsimile: (416) 362-8191