UNITED STATES
SECURITIES AND EXCHANGE COMMISSION
Washington, D.C. 20549
FORM N-CSR
CERTIFIED SHAREHOLDER REPORT OF REGISTERED
MANAGEMENT INVESTMENT COMPANIES
Investment Company Act file number: 811-09521
AMG FUNDS
(Exact name of registrant as specified in charter)
600 Steamboat Road, Suite 300, Greenwich, Connecticut 06830
(Address of principal executive offices) (Zip code)
AMG Funds LLC
600 Steamboat Road, Suite 300, Greenwich, Connecticut 06830
(Name and address of agent for service)
Registrant’s telephone number, including area code: (203) 299-3500
Date of fiscal year end: September 30
Date of reporting period: OCTOBER 1, 2019 – SEPTEMBER 30, 2020
(Annual Shareholder Report)
| Item 1. | Reports to Shareholders |
| | | | |
 | | | | |
| | ANNUAL REPORT | | |
| | | | |
| | | | | | |
| |
| | AMG Funds |
| | September 30, 2020 
| | |
| | |
| | AMG SouthernSun Small Cap Fund |
| | Class N: SSSFX | | | Class I: SSSIX |
| | AMG SouthernSun U.S. Equity Fund |
| | Class N: SSEFX | | | Class I: SSEIX | | |
Beginning on January 1, 2021, as permitted by regulations adopted by the Securities and Exchange Commission, paper copies of the Funds’ shareholder reports like this one will no longer be sent by mail, unless you specifically request paper copies of the reports from the Funds or from your financial intermediary, such as a broker-dealer or bank. Instead, the reports will be made available on the Funds’ website (https://www.amgfunds.com/resources/order_literature.html), and you will be notified by mail each time a report is posted and provided with a website link to access the report.
If you already elected to receive shareholder reports electronically, you will not be affected by this change and you need not take any action. You may elect to receive shareholder reports and other communications from the Funds electronically at any time by contacting your financial intermediary or, if you invest directly with the Funds, by logging into your account at www.amgfunds.com.
You may elect to receive all future reports in paper free of charge. If you invest through a financial intermediary, you can contact your financial intermediary to request that you continue to receive paper copies of your shareholder reports. If you invest directly with the Funds, you can call 1.800.548.4539 to inform the Funds that you wish to continue receiving paper copies of your shareholder reports. Your election to receive reports in paper will apply to all funds in the AMG Funds Family of Funds held in your account if you invest through your financial intermediary or all funds in the AMG Funds Family of Funds held with the fund complex if you invest directly with the Funds.
| | | | |
| | | | |
| | | | | |
amgfunds.com | | | | 093020 AR076 |
| | | | |
| | | | | |
| | | AMG Funds | | |
| | | Annual Report — September 30, 2020 | | |
| | | | | | |
| | | |
| | | TABLE OF CONTENTS | | PAGE | |
| | | | |
| | | LETTER TO SHAREHOLDERS | | | 2 | |
| | | |
| | | ABOUT YOUR FUND’S EXPENSES | | | 3 | |
| | | |
| | | PORTFOLIO MANAGER’S COMMENTS, FUND SNAPSHOTS AND SCHEDULES OF PORTFOLIO INVESTMENTS | | | | |
| | | |
| | | AMG SouthernSun Small Cap Fund | | | 4 | |
| | | |
| | | AMG SouthernSun U.S. Equity Fund | | | 9 | |
| | | |
| | | FINANCIAL STATEMENTS | | | | |
| | | |
| | | Statement of Assets and Liabilities | | | 14 | |
| | | |
| | | Balance sheets, net asset value (NAV) per share computations and cumulative distributable earnings (loss) | | | | |
| | | |
| | | Statement of Operations | | | 16 | |
| | | |
| | | Detail of sources of income, expenses, and realized and unrealized gains (losses) during the fiscal year | | | | |
| | | |
| | | Statements of Changes in Net Assets | | | 17 | |
| | | |
| | | Detail of changes in assets for the past two fiscal years | | | | |
| | | |
| | | Financial Highlights | | | 18 | |
| | | |
| | | Historical net asset values per share, distributions, total returns, income and expense ratios, turnover ratios and net assets | | | | |
| | | |
| | | Notes to Financial Statements | | | 22 | |
| | | |
| | | Accounting and distribution policies, details of agreements and transactions with Fund management and affiliates, and descriptions of certain investment risks | | | | |
| | | |
| | | REPORT OF INDEPENDENT REGISTERED PUBLIC ACCOUNTING FIRM | | | 28 | |
| | | |
| | | OTHER INFORMATION | | | 29 | |
| | | |
| | | TRUSTEES AND OFFICERS | | | 30 | |
| | | |
| | | ANNUAL RENEWAL OF INVESTMENT MANAGEMENT AND SUBADVISORY AGREEMENTS | | | 32 | |
| | | | |
| | | Nothing contained herein is to be considered an offer, sale or solicitation of an offer to buy shares of any series of the AMG Funds Family of Funds. Such offering is made only by prospectus, which includes details as to offering price and other material information. | | |
| | | | |
| | | | | |
| | Letter to Shareholders | | |
| | | | |
Dear Shareholder:
The fiscal year ending September 30, 2020, was a volatile period for financial markets marked by a dramatic selloff and extraordinary rebound amid the unprecedented global effort to stop the COVID-19 pandemic. During the first half of the fiscal year, equities achieved new record highs against the backdrop of a healthy economy and strong investor sentiment. However, a broad-based selloff occurred amid a global flight to quality as investors assessed the scope of the unfolding COVID-19 health care crisis, a deteriorating economy, and skyrocketing unemployment. An oil price war initiated between Saudi Arabia and Russia only made matters worse. From its peak in mid-February 2020, the S&P 500® Index declined -33.79% over the span of a few weeks, bringing the eleven-year bull market to an abrupt end. In response to the crisis, global central banks and governments were quick to flood the market with massive fiscal and monetary stimulus which helped to stabilize the market and led to an impressive recovery in risk assets, albeit an uneven one. So despite the volatility, the S&P 500® Index still achieved a robust 15.15% return for the fiscal year.
During the year, there was very wide dispersion in performance across sectors, with information technology stocks returning 47.22%, while companies in the energy sector fell (45.24)%. Growth stocks significantly outperformed value stocks for the period with returns of 24.33% and (11.58)% for the Russell 1000® Growth and Russell 1000® Value Indexes, respectively. Large caps also outperformed small caps as measured by the 15.15% return for the S&P 500® Index compared to 0.39% for the Russell 2000® Index. Outside the U.S., emerging markets outperformed developed markets with the 9.56% return for the MSCI Emerging Markets Index compared to the 4.80% return for the MSCI EAFE Index.
Interest rates fell dramatically and led to strong returns for bond investors as the U.S. Federal Reserve slashed short-term rates in response to the slowing economy. The 10-year Treasury yield ended the year near a historic low yield of 0.69%. The Bloomberg Barclays U.S. Aggregate Bond Index, a broad measure of U.S. bond market performance, returned 6.98% over the period. Riskier high yield bonds lagged the broader bond market with a 3.25% return as measured by the return of the Bloomberg Barclays U.S. Corporate High Yield Bond Index.
AMG Funds appreciates the privilege of providing investment tools to you and your clients. Our foremost goal is to provide investment solutions that help our shareholders successfully reach their long-term investment goals. AMG Funds provides access to a distinctive array of actively managed return-oriented investment strategies. We thank you for your continued confidence and investment in AMG Funds. You can rest assured that under all market conditions our team is focused on delivering excellent investment management services for your benefit.
Respectfully,

Keitha Kinne
President
AMG Funds
| | | | | | | | | | | | | | |
| Average Annual Total Returns | | Periods ended September 30, 2020* | |
| | | | |
| Stocks: | | | | | 1 Year | | | | 3 Years | | | | 5 Years | |
| | | | |
| Large Cap | | (S&P 500® Index) | | | 15.15% | | | | 12.28% | | | | 14.15% | |
| | | | |
| Small Cap | | (Russell 2000® Index) | | | 0.39% | | | | 1.77% | | | | 8.00% | |
| | | | |
| International | | (MSCI All Country World Index ex USA) | | | 3.00% | | | | 1.16% | | | | 6.23% | |
| | |
| Bonds: | | | |
| | | | |
Investment Grade | | (Bloomberg Barclays U.S. Aggregate Bond Index) | | | 6.98% | | | | 5.24% | | | | 4.18% | |
| | | | |
| High Yield | | (Bloomberg Barclays U.S. Corporate High Yield Bond Index) | | | 3.25% | | | | 4.21% | | | | 6.79% | |
| | | | |
| Tax-exempt | | (Bloomberg Barclays Municipal Bond Index) | | | 4.09% | | | | 4.28% | | | | 3.84% | |
| | | | |
| Treasury Bills | | (ICE BofAML US 6-Month Treasury Bill Index) | | | 1.54% | | | | 1.92% | | | | 1.42% | |
*Source: FactSet. Past performance is no guarantee of future results.
| | | | |
| | | | | |
| | | About Your Fund’s Expenses | | |
| | | | | |
| | | | |
As a shareholder of a Fund, you may incur two types of costs: (1) transaction costs, which may include sales charges (loads) on purchase payments; redemption fees; and exchange fees; and (2) ongoing costs, including management fees; distribution (12b-1) fees; and other Fund expenses. This example is intended to help you understand your ongoing costs (in dollars) of investing in the Fund and to compare these costs with the ongoing costs of investing in other mutual funds. The example is based on $1,000 invested at the beginning of the period and held for the entire period as indicated below. ACTUAL EXPENSES The first line of the following table provides information about the actual account values and | | actual expenses. You may use the information in this line, together with the amount you invested, to estimate the expenses that you paid over the period. Simply divide your account value by $1,000 (for example, an $8,600 account value divided by $1,000 = 8.6), then multiply the result by the number in the first line under the heading entitled “Expenses Paid During Period” to estimate the expenses you paid on your account during this period. HYPOTHETICAL EXAMPLE FOR COMPARISON PURPOSES The second line of the following table provides information about hypothetical account values and hypothetical expenses based on the Fund’s actual expense ratio and an assumed annual rate of return of 5% before expenses, which is not the Fund’s | | actual return. The hypothetical account values and expenses may not be used to estimate the actual ending account balance or expenses you paid for the period. You may use this information to compare the ongoing costs of investing in the Fund and other funds by comparing this 5% hypothetical example with the 5% hypothetical examples that appear in the shareholder reports of other funds. Please note that the expenses shown in the table are meant to highlight your ongoing costs only and do not reflect any transactional costs, such as sales charges (loads), redemption fees, or exchange fees. Therefore, the second line of the table is useful in comparing ongoing costs only, and will not help you determine the relative total costs of owning different funds. |
| | | | | | | | | | | | | | |
Six Months Ended September 30, 2020 | | Expense
Ratio for
the Period | | Beginning
Account
Value
04/01/20 | | | Ending
Account
Value
09/30/20 | | | Expenses
Paid
During
the Period* | |
| AMG SouthernSun Small Cap Fund | |
| |
| Based on Actual Fund Return | | | | | |
| | | | |
| Class N | | 1.25% | | | $1,000 | | | | $1,350 | | | | $7.34 | |
| | | | |
| Class I | | 1.00% | | | $1,000 | | | | $1,351 | | | | $5.88 | |
| |
| Based on Hypothetical 5% Annual Return | | | | | |
| | | | |
| Class N | | 1.25% | | | $1,000 | | | | $1,019 | | | | $6.31 | |
| | | | |
| Class I | | 1.00% | | | $1,000 | | | | $1,020 | | | | $5.05 | |
| AMG SouthernSun U.S. Equity Fund | |
| | | |
| Based on Actual Fund Return | | | | | | | | | | | | |
| | | | |
| Class N | | 1.34% | | | $1,000 | | | | $1,426 | | | | $8.13 | |
| | | | |
| Class I | | 1.09% | | | $1,000 | | | | $1,428 | | | | $6.62 | |
| |
| Based on Hypothetical 5% Annual Return | | | | | |
| | | | |
| Class N | | 1.34% | | | $1,000 | | | | $1,018 | | | | $6.76 | |
| | | | |
| Class I | | 1.09% | | | $1,000 | | | | $1,020 | | | | $5.50 | |
| * | Expenses are equal to the Fund’s annualized expense ratio multiplied by the average account value over the period, multiplied by the number of days in the most recent fiscal half-year (183), then divided by 366. |
| | | | |
| | | | | |
| | | AMG SouthernSun Small Cap Fund | | |
| | | Portfolio Manager’s Comments (unaudited) | | |
| | | | | | | | |
DEAR FELLOW SHAREHOLDERS, At the onset of this past year, we expected market volatility. What we knew. In America, we had a presidential election year in front of us, trade tensions with China escalating, arguably stretched and aggressively levered equity markets, and increased labor market tightness casting some speculation on Fed policy. In Britain and Europe, there was a deadline set for Brexit. Across the globe many economies were beginning to turn inward due to a combination of economic and political tensions. Thus, last autumn, it would have been reasonable to presume that the next twelve months might well bring with it a meaningful increase of volatility in the marketplace. What we did not know. Few, if any, imagined what some have framed as the overlapping pandemics of 2020. COVID-19, local versus regional politics, race relations, and mental health have all seized center stage, not only in America and the West, but across the globe. How then ought we think about and respond to this convergence? Increased volatility combined with broad business uncertainty, has historically produced a fertile environment for SouthernSun strategies. This time has been no different. Beginning with the uptick in volatility in late 2018 our approach has yielded increasingly attractive opportunities to buy and/or add to what we believe are outstanding businesses with prudently geared balance sheets and resilient go-to-market propositions. Whilst aware that the events of the past six to nine months are likely to produce further known and unknown outcomes, we are confident our portfolio companies, for the most, are well positioned to not only survive but thrive. It is fair to say that what many may believe are the lasting implications of the overlapping pandemics may well be far too short sighted. Further, we believe it is too early to properly gauge permanent cultural shifts that are likely to impact business behavior in the intermediate to long term. Some of the popular theories revolve around things like work from home and/or the permanent hollowing of dense urban centers. It is true that in the past such phenomena have been catalysts for major shifts in entrenched trends and may well play out similarly this time as well. | | | | For now, we remain focused on the flexibility of our portfolio company’s business models to maneuver through turbulent times. When combined with forward thinking management we believe that, irrespective of the ultimate cultural, societal, and business operating outcomes of the past twelve months events, our approach to finding businesses that create excellent value over time is well tested, showing strong resilience during such moments. In closing, and apropos to the moment, we commend Louis MacNeice’s poem Snow to you for consideration: The room was suddenly rich and the great bay-window was Spawning snow and pink roses against it Soundlessly collateral and incompatible: World is suddener than we fancy it. World is crazier and more of it than we think, Incorrigibly plural. I peel and portion A tangerine and spit the pips and feel The drunkenness of things being various. And the fire flames with a bubbling sound for world Is more spiteful and gay than one supposes -On the tongue on the eyes on the ears in the palms of one’s hands -There is more than glass between the snow and the huge roses. FUND PERFORMANCE AMG SouthernSun Small Cap Fund’s (the “Fund”) Class N shares returned (0.72%) over the trailing-twelve-months, as of September 30, 2020, versus the Russell 2000® Index, which returned 0.39% and the Russell 2000® Value Index, which returned (14.88%), over the same period. Over the trailing twelve-month period ending September 30, 2020, our underperformance versus the Russell 2000® Index was driven by our underweight allocation within the health care sector, as well as our stock selection within the industrials sector, led by, The Brink’s Co. (BCO).This was offset, in part, by our underweight allocation to the financial sector, as well as our overweight allocation to the consumer discretionary sector. On an absolute and relative basis, Darling Ingredients Inc. (DAR) was the top contributor for the period, while BCO was the top detractor. | | | | BCO, the global leader in total cash management, was the leading detractor on an absolute and relative basis during the period. Revenues showed positive trends as lockdown measures began to ease and closed the month of June at 14% below prior year. The G4S acquisition is now 80% closed and cost realignments and synergies are on-track. Although BCO’s took on additional debt for the acquisition, there are no meaningful debt maturities until 2024 and covenants seem manageable. Furthermore, management reiterated expectations of positive free cash flow in 2020 and are cautiously optimistic that 2021 EBITDA could be significantly higher if positive revenue trends continue. In October, we spent some socially distanced time with management in Dallas and we came away with increased confidence in their ability to manage through operational difficulties of the pandemic, execute on the integration of G4S with significant synergies, and deliver on future growth initiatives. DAR, a global leader in creating sustainable food, feed, and fuel ingredients from edible and inedible bio-nutrients, was the leading contributor on an absolute and relative basis during the period. Results in the core feed, food, and fuel businesses were resilient with EBITDA up year over year. The renewable diesel joint venture with Valero, Diamond Green Diesel (DGD), performed well and construction on the 400-million-gallon capacity expansion project is progressing according to plan. Management expects DGD to produce 675 million gallons of renewable diesel by 2022. At projected profitability levels, the expansion would roughly double DAR’s share of the joint venture’s earnings and eclipse the EBITDA from core Darling. We continue to believe that DGD is a competitively advantaged low-cost producer of renewable diesel with strong long-term growth prospects. We thank you for your continued trust in our ability to help you reach your investment goals. The views expressed represent the opinions of SouthernSun Asset Management, LLC as of September 30, 2020, and are not intended as a forecast or guarantee of future results, and are subject to change without notice. |
| | | | |
| | | | | |
| | | AMG SouthernSun Small Cap Fund | | |
| | | Portfolio Manager’s Comments (continued) | | |
CUMULATIVE TOTAL RETURN PERFORMANCE
AMG SouthernSun Small Cap Fund’s cumulative total return is based on the daily change in net asset value (NAV), and assumes that all dividends and distributions were reinvested. This graph compares a hypothetical $10,000 investment made in the AMG SouthernSun Small Cap Fund’s Class N shares on September 30, 2010, to a $10,000 investment made in the Russell 2000® Index and Russell 2000® Value Index for the same time period. The graph and table do not reflect the deduction of taxes that a shareholder would pay on a Fund distribution or redemption of shares. The listed returns for the Fund are net of expenses and the returns for the index exclude expenses. Total returns would have been lower had certain expenses not been reduced.
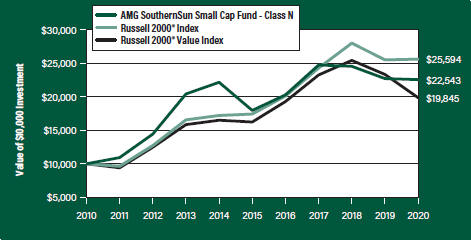
The table below shows the average annual total returns for the AMG SouthernSun Small Cap Fund, the Russell 2000® Index and the Russell 2000® Value Index for the same time periods ended September 30, 2020.
| | | | | | | | | | | | |
| Average Annual Total Returns1 | | One Year | | | Five
Years | | | Ten Years | |
|
AMG SouthernSun Small Cap Fund2, 3, 4, 5, 6, 7, 8 | |
| | | |
Class N | | | (0.72%) | | | | 4.65 | % | | | 8.47% | |
| | | |
Class I | | | (0.45%) | | | | 4.91 | % | | | 8.74% | |
| | | | |
Russell 2000® Index9 | | | 0.39% | | | | 8.00 | % | | | 9.85% | |
| | | |
Russell 2000® Value Index10 | | | (14.88%) | | | | 4.11 | % | | | 7.09% | |
The performance data shown represents past performance. Past performance is not a guarantee of future results. Current performance may be lower or higher than the performance data quoted. The investment return and principal value of an investment will fluctuate so that an investor’s shares, when redeemed, may be worth more or less than their original cost.
Investors should carefully consider the Fund’s investment objectives, risks, charges and expenses before investing. For performance information through the most recent month end, current net asset values per share for the Fund and other information, please call 800.548.4539 or visit our website at amgfunds.com for a free prospectus. Read it carefully before investing or sending money.
Distributed by AMG Distributors, Inc., member FINRA/SIPC.
| 1 | Total return equals income yield plus share price change and assumes reinvestment of all dividends and capital gain distributions. Returns are net of fees and may reflect offsets of Fund expenses as described in the prospectus. No adjustment has been made for taxes payable by shareholders on their reinvested dividends and capital gain distributions. Returns for periods greater than one year are annualized. The listed returns on the Fund are net of expenses and based on the published NAV as of September 30, 2020. All returns are in U.S. dollars ($). |
| | |
| 2 | | AMG SouthernSun Small Cap Fund’s inception date and returns for all periods beginning prior to March 31, 2014, reflects performance of the predecessor fund, SouthernSun Small Cap Fund, and was managed by SouthernSun Asset Management, LLC with the same investment objectives and substantially similar investment policies. |
| | |
| 3 | | From time to time, the Fund’s advisor has waived its fees and/or absorbed Fund expenses, which has resulted in higher returns. |
| | |
| 4 | | The Fund is subject to risks associated with investments in small-capitalization companies, such as erratic earnings patterns, competitive conditions, limited earnings history and a reliance on one or a limited number of products. |
| | |
| 5 | | A greater percentage of the Fund’s holdings may be focused in a smaller number of securities which may place the Fund at greater risk than a more diversified fund. |
| | |
| 6 | | Companies that are in similar businesses may be similarly affected by particular economic or market events; to the extent the Fund has substantial holdings within a particular sector, the risks associated with that sector increase. |
| | |
| 7 | | Market prices of investments held by the Fund may fall rapidly or unpredictably due to a variety of economic or political factors, market conditions, disasters or public health issues, or in response to events that affect particular industries or companies. |
| | |
| 8 | | The Fund invests in value stocks, which may perform differently from the market as a whole and may be undervalued by the market for a long period of time. |
| | |
| 9 | | The Russell 2000® Index is composed of the 2,000 smallest stocks in the Russell 3000® Index and is widely regarded in the industry as the premier measure of small-cap stock performance. Unlike the Fund, the Russell 2000® Index is unmanaged, is not available for investment and does not incur expenses. |
| | |
| 10 | | The Russell 2000® Value Index is an unmanaged, market-value weighted, value-oriented index comprised of small stocks that have relatively low price-to-book ratios and lower forecasted growth values. Unlike the Fund, the Russell 2000® Value Index is unmanaged, is not available for investment and does not incur expenses. |
| |
| The Russell Indices are a trademark of London Stock Exchange Group companies. |
| |
| Not FDIC insured, nor bank guaranteed. May lose value. |
| | | | |
| | | | | |
| | | AMG SouthernSun Small Cap Fund | | |
| | | Fund Snapshots (unaudited) September 30, 2020 | | |
PORTFOLIO BREAKDOWN
| | |
| Sector | | %of
Net Assets |
| | |
Industrials | | 38.7 |
| | |
Consumer Discretionary | | 23.0 |
| | |
Consumer Staples | | 11.1 |
| | |
Materials | | 9.3 |
| | |
Information Technology | | 7.8 |
| | |
Health Care | | 3.3 |
| | |
Energy | | 0.6 |
| | |
Short-Term Investments | | 6.1 |
| | |
Other Assets Less Liabilities | | 0.1 |
TOP TEN HOLDINGS
| | | | | | |
| Security Name | | | | | %of
Net Assets |
Darling Ingredients, Inc. | | | | | | 7.0 |
The Brink’s Co. | | | | | | 6.1 |
Dycom Industries, Inc. | | | | | | 6.1 |
AGCO Corp. | | | | | | 5.4 |
Extended Stay America, Inc. | | | | | | 5.4 |
The Timken Co. | | | | | | 5.2 |
Polaris, Inc. | | | | | | 4.4 |
Crane Co. | | | | | | 3.9 |
Broadridge Financial Solutions, Inc. | | | | | | 3.8 |
Sanderson Farms, Inc. | | | | | | 3.8 |
| | | | | | | |
Top Ten as a Group | | | | | | 51.1 |
| | | | | | | |
| | | | | | | |
Because a fund’s strategy may result in multiple investments in particular sectors of the economy, its performance may depend on the performance of those sectors and may fluctuate more widely than investments diversified across more sectors. For additional information on these and other risk considerations, please see the Fund’s prospectus.
Any sectors, industries, or securities discussed should not be perceived as investment recommendations. Mention of a specific security should not be considered a recommendation to buy or solicitation to sell that security. Specific securities mentioned in this report may have been sold from the Fund’s portfolio of investments by the time you receive this report.
| | | | |
| | | AMG SouthernSun Small Cap Fund | | |
| | | Schedule of Portfolio Investments | | |
| | | September 30, 2020 | | |
| | | | | | | | |
| | | Shares | | | Value | |
| | |
Common Stocks - 93.8% | | | | | | | | |
| |
Consumer Discretionary - 23.0% | | | | | |
| | |
Dorman Products, Inc.* | | | 23,943 | | | | $2,163,968 | |
| | |
Extended Stay America, Inc. | | | 758,463 | | | | 9,063,633 | |
| | |
frontdoor, Inc.* | | | 70,121 | | | | 2,728,408 | |
| | |
Murphy USA, Inc.* | | | 41,548 | | | | 5,329,362 | |
| | |
Polaris, Inc. | | | 77,682 | | | | 7,328,520 | |
| | |
ServiceMaster Global Holdings, Inc.* | | | 143,193 | | | | 5,710,537 | |
| | |
Thor Industries, Inc. | | | 66,016 | | | | 6,288,684 | |
| | |
Total Consumer Discretionary | | | | | | | 38,613,112 | |
| |
Consumer Staples - 11.1% | | | | | |
| | |
Darling Ingredients, Inc.* | | | 329,168 | | | | 11,859,923 | |
| | |
MGP Ingredients, Inc. | | | 9,203 | | | | 365,728 | |
| | |
Sanderson Farms, Inc. | | | 54,027 | | | | 6,373,565 | |
| | |
Total Consumer Staples | | | | | | | 18,599,216 | |
| |
Energy - 0.6% | | | | | |
| | |
Ovintiv, Inc. | | | 127,266 | | | | 1,038,491 | |
| |
Health Care - 3.3% | | | | | |
| | |
Hill-Rom Holdings, Inc. | | | 65,879 | | | | 5,501,555 | |
| |
Industrials - 38.7% | | | | | |
| | |
Aegion Corp.* | | | 208,699 | | | | 2,948,917 | |
| | |
AGCO Corp. | | | 122,956 | | | | 9,131,942 | |
| | |
The Brink’s Co. | | | 248,700 | | | | 10,219,083 | |
| | |
Clean Harbors, Inc.* | | | 110,634 | | | | 6,198,823 | |
| | |
Crane Co. | | | 130,751 | | | | 6,554,548 | |
| | |
Dycom Industries, Inc.*,1 | | | 193,276 | | | | 10,208,838 | |
| | |
Enerpac Tool Group Corp. | | | 255,980 | | | | 4,814,984 | |
| | |
The Timken Co. | | | 160,558 | | | | 8,705,455 | |
| | |
Trinity Industries, Inc.1 | | | 318,483 | | | | 6,210,418 | |
| | |
Total Industrials | | | | | | | 64,993,008 | |
| |
Information Technology - 7.8% | | | | | |
| | |
Belden, Inc. | | | 201,795 | | | | 6,279,860 | |
| | |
Broadridge Financial Solutions, Inc. | | | 48,630 | | | | 6,419,160 | |
| | | | | | | | |
| | | Shares | | | Value | |
| | |
NIC, Inc. | | | 18,920 | | | | $372,724 | |
| | |
Total Information Technology | | | | | | | 13,071,744 | |
| |
Materials - 9.3% | | | | | |
| | |
Ingevity Corp.* | | | 93,395 | | | | 4,617,449 | |
| | |
Koppers Holdings, Inc.* | | | 235,052 | | | | 4,914,937 | |
| | |
Stepan Co. | | | 56,502 | | | | 6,158,718 | |
| | |
Total Materials | | | | | | | 15,691,104 | |
| | |
Total Common Stocks
(Cost $143,505,610) | | | | | | | 157,508,230 | |
| | |
| | | Principal
Amount | | | | |
Short-Term Investments - 6.1% | | | | | | | | |
| |
Joint Repurchase Agreements - 0.3%2 | | | | | |
| | |
Citibank N.A., dated 09/30/20, due 10/01/20, 0.080% total to be received $468,211 (collateralized by various U.S. Government Agency Obligations and U.S. Treasuries, 0.000% - 4.500%, 06/15/22 - 01/01/50, totaling $477,928) | | $ | 468,210 | | | | 468,210 | |
| | |
| | | Shares | | | | |
| |
Other Investment Companies - 5.8% | | | | | |
| | |
Dreyfus Government Cash Management Fund, Institutional Shares, 0.02%3 | �� | | 3,220,206 | | | | 3,220,206 | |
| | |
Dreyfus Institutional Preferred Government Money Market Fund, Institutional Shares, 0.04%3 | | | 3,220,206 | | | | 3,220,206 | |
| | |
JPMorgan U.S. Government Money Market Fund, IM Shares, 0.06%3 | | | 3,317,789 | | | | 3,317,789 | |
| | |
Total Other Investment Companies | | | | | | | 9,758,201 | |
| | |
Total Short-Term Investments
(Cost $10,226,411) | | | | | | | 10,226,411 | |
| | |
Total Investments - 99.9%
(Cost $153,732,021) | | | | | | | 167,734,641 | |
| | |
Other Assets, less Liabilities - 0.1% | | | | | | | 172,488 | |
| | |
Net Assets - 100.0% | | | | | | $ | 167,907,129 | |
| * | Non-income producing security. |
| 1 | Some of these securities, amounting to $4,668,940 or 2.8% of net assets, were out on loan to various borrowers and are collateralized by cash and various U.S. Treasury Obligations. See Note 4 of Notes to Financial Statements. |
| 2 | Cash collateral received for securities lending activity was invested in these joint repurchase agreements. |
| 3 | Yield shown represents the September 30, 2020, seven day average yield, which refers to the sum of the previous seven days’ dividends paid, expressed as an annual percentage. |
|
|
| The accompanying notes are an integral part of these financial statements. |
| 7 |
| | | | |
| | | | | |
| | | AMG SouthernSun Small Cap Fund | | |
| | | Schedule of Portfolio Investments (continued) | | |
The following table summarizes the inputs used to value the Fund’s investments by the fair value hierarchy levels as of September 30, 2020:
| | | | | | | | | | | | | | | | |
| | | Level 1 | | | Level 2 | | | Level 3 | | | Total | |
| | | | |
Investments in Securities | | | | | | | | | | | | | | | | |
| | | | |
Common Stocks† | | $ | 157,508,230 | | | | — | | | | — | | | $ | 157,508,230 | |
| | | | |
Short-Term Investments | | | | | | | | | | | | | | | | |
| | | | |
Joint Repurchase Agreements | | | — | | | $ | 468,210 | | | | — | | | | 468,210 | |
| | | | |
Other Investment Companies | | | 9,758,201 | | | | — | | | | — | | | | 9,758,201 | |
| | | | | | | | | | | | | | | | |
| | | | |
Total Investments in Securities | | $ | 167,266,431 | | | $ | 468,210 | | | | — | | | $ | 167,734,641 | |
| | | | | | | | | | | | | | | | |
| † | All common stocks held in the Fund are Level 1 securities. For a detailed breakout of common stocks by major industry classification, please refer to the Fund’s Schedule of Portfolio Investments. |
For the fiscal year ended September 30, 2020, there were no transfers in or out of Level 3.
|
|
| The accompanying notes are an integral part of these financial statements. |
| 8 |
| | | | |
| | | | | |
| | | AMG SouthernSun U.S. Equity Fund | | |
| | | Portfolio Manager’s Comments (unaudited) | | |
| | | | | | | | |
DEAR FELLOW SHAREHOLDERS, At the onset of this past year, we expected market volatility. What we knew. In America, we had a presidential election year in front of us, trade tensions with China escalating, arguably stretched and aggressively levered equity markets, and increased labor market tightness casting some speculation on Fed policy. In Britain and Europe, there was a deadline set for Brexit. Across the globe many economies were beginning to turn inward due to a combination of economic and political tensions. Thus, last autumn, it would have been reasonable to presume that the next twelve months might well bring with it a meaningful increase of volatility in the marketplace. What we did not know. Few, if any, imagined what some have framed as the overlapping pandemics of 2020. COVID-19, local versus regional politics, race relations, and mental health have all seized center stage, not only in America and the West, but across the globe. How then ought we think about and respond to this convergence? Increased volatility combined with broad business uncertainty, has historically produced a fertile environment for SouthernSun strategies. This time has been no different. Beginning with the uptick in volatility in late 2018 our approach has yielded increasingly attractive opportunities to buy and/or add to what we believe are outstanding businesses with prudently geared balance sheets and resilient go-to-market propositions. Whilst aware that the events of the past six to nine months are likely to produce further known and unknown outcomes, we are confident our portfolio companies, for the most, are well positioned to not only survive but thrive. It is fair to say that what many may believe are the lasting implications of the overlapping pandemics may well be far too short sighted. Further, we believe it is too early to properly gauge permanent cultural shifts that are likely to impact business behavior in the intermediate to long term. Some of the popular theories revolve around things like work from home and/or the permanent hollowing of dense urban centers. It is true that in the past such phenomena have been catalysts for major shifts in entrenched trends and may well play out similarly this time as well. | | | | For now, we remain focused on the flexibility of our portfolio company’s business models to maneuver through turbulent times. When combined with forward thinking management we believe that, irrespective of the ultimate cultural, societal, and business operating outcomes of the past twelve months events, our approach to finding businesses that create excellent value over time is well tested, showing strong resilience during such moments. In closing, and apropos to the moment, we commend Louis MacNeice’s poem Snow to you for consideration: The room was suddenly rich and the great bay-window was Spawning snow and pink roses against it Soundlessly collateral and incompatible: World is suddener than we fancy it. World is crazier and more of it than we think, Incorrigibly plural. I peel and portion A tangerine and spit the pips and feel The drunkenness of things being various. And the fire flames with a bubbling sound for world Is more spiteful and gay than one supposes -On the tongue on the eyes on the ears in the palms of one’s hands -There is more than glass between the snow and the huge roses. FUND PERFORMANCE AMG SouthernSun U.S. Equity Fund’s (the “Fund”) Class N shares returned 1.64% over the trailing-twelve-months, as of September 30, 2020, versus the Russell 2500® Index, which returned 2.22% and the Russell 2500® Value Index, which returned (12.62%), over the same period. Over the trailing twelve-month period ending September 30, 2020, our underperformance versus the Russell 2500® Index was driven by stock selection within the information technology sector, led by, Knowles Corp. (KN), as well as our underweight allocation to the health care sector. This was offset, in part, by our stock selection within in the consumer staples and consumer discretionary sectors, led by Darling Ingredients, Inc. (DAR) and Thor Industries (THO), respectively. On a relative and absolute basis, DAR was the top contributor for the period, while The Brink’s Co. (BCO), was the top detractor. | | | | BCO, the global leader in total cash management, was the leading detractor on an absolute and relative basis during the period. Revenues showed positive trends as lockdown measures began to ease and closed the month of June at 14% below prior year. The G4S acquisition is now 80% closed and cost realignments and synergies are on-track. Although BCO’s took on additional debt for the acquisition, there are no meaningful debt maturities until 2024 and covenants seem manageable. Furthermore, management reiterated expectations of positive free cash flow in 2020 and are cautiously optimistic that 2021 EBITDA could be significantly higher if positive revenue trends continue. In October, we spent some socially distanced time with management in Dallas and we came away with increased confidence in their ability to manage through operational difficulties of the pandemic, execute on the integration of G4S with significant synergies, and deliver on future growth initiatives. DAR, a global leader in creating sustainable food, feed, and fuel ingredients from edible and inedible bio-nutrients, was the leading contributor on an absolute and relative basis during the period. Results in the core feed, food, and fuel businesses were resilient with EBITDA up year over year. The renewable diesel joint venture with Valero, Diamond Green Diesel (DGD), performed well and construction on the 400-million-gallon capacity expansion project is progressing according to plan. Management expects DGD to produce 675 million gallons of renewable diesel by 2022. At projected profitability levels, the expansion would roughly double DAR’s share of the joint venture’s earnings and eclipse the EBITDA from core Darling. We continue to believe that DGD is a competitively advantaged low-cost producer of renewable diesel with strong long-term growth prospects. We thank you for your continued trust in our ability to help you reach your investment goals. The views expressed represent the opinions of SouthernSun Asset Management, LLC as of September 30, 2020, and are not intended as a forecast or guarantee of future results, and are subject to change without notice. |
| | | | |
| | | | | |
| | | AMG SouthernSun U.S. Equity Fund | | |
| | | Portfolio Manager’s Comments (continued) | | |
CUMULATIVE TOTAL RETURN PERFORMANCE
AMG SouthernSun U.S. Equity Fund’s cumulative total return is based on the daily change in net asset value (NAV), and assumes that all dividends and distributions were reinvested. This graph compares a hypothetical $10,000 investment made in the AMG SouthernSun U.S. Equity Fund’s Class N shares on April 10, 2012, to a $10,000 investment made in the Russell 2500® Index and Russell 2500® Value Index for the same time period. The graph and table do not reflect the deduction of taxes that a shareholder would pay on a Fund distribution or redemption of shares. The listed returns for the Fund are net of expenses and the returns for the index exclude expenses. Total returns would have been lower had certain expenses not been reduced.
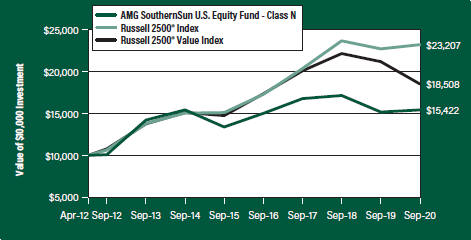
The table below shows the average annual total returns for the AMG SouthernSun U.S. Equity Fund, the Russell 2500® Index and the Russell 2500® Value Index for the same time periods ended September 30, 2020.
| | | | | | | | | | | | | | | | |
| Average Annual Total Returns1 | | One
Year | | | Five
Years | | | Since
Inception | | | Inception
Date | |
|
AMG SouthernSun U.S. Equity Fund2, 3, 4, 5, 6, 7, 8, 9 | |
| | | | |
Class N | | | 1.64% | | | | 2.86 | % | | | 5.25 | % | | | 04/10/12 | |
| | | | |
Class I | | | 1.86% | | | | 3.12 | % | | | 5.51 | % | | | 04/10/12 | |
| | | | | |
Russell 2500® Index10 | | | 2.22% | | | | 8.97 | % | | | 10.44 | % | | | 04/10/12 | † |
| | | | |
Russell 2500® Value Index11 | | | (12.62%) | | | | 4.65 | % | | | 7.53 | % | | | 04/10/12 | † |
The performance data shown represents past performance. Past performance is not a guarantee of future results. Current performance may be lower or higher than the performance data quoted. The investment return and principal value of an investment will fluctuate so that an investor’s shares, when redeemed, may be worth more or less than their original cost.
Investors should carefully consider the Fund’s investment objectives, risks, charges and expenses before investing. For performance information through the most recent month end, current net asset values per share for the Fund and other information, please call 800.548.4539 or visit our website at amgfunds.com for a free prospectus. Read it carefully before investing or sending money.
Distributed by AMG Distributors, Inc., member FINRA/SIPC.
| † | Date reflects the inception date of the Fund, not the index. |
| 1 | Total return equals income yield plus share price change and assumes reinvestment of all dividends and capital gain distributions. Returns are net of fees and may reflect offsets of Fund expenses as described in the prospectus. No adjustment has been made for taxes payable by shareholders on their reinvested dividends and capital gain distributions. Returns for periods greater than one year are annualized. The listed returns on the Fund are net of expenses and based on the published NAV as of September 30, 2020. All returns are in U.S. dollars ($). |
| | |
| | |
| 2 | | AMG SouthernSun U.S Equity Fund’s inception date and returns for all periods beginning prior to March 31, 2014, reflects performance of the predecessor fund, SouthernSun U.S. Equity Fund, and was managed by SouthernSun Asset Management, LLC with the same investment objectives and substantially similar investment policies. |
| | |
| 3 | | From time to time, the Fund’s advisor has waived its fees and/or absorbed Fund expenses, which has resulted in higher returns. |
| | |
| 4 | | The Fund is subject to risks associated with investments in mid-capitalization companies such as greater price volatility, lower trading volume, and less liquidity than the stocks of larger, more established companies. |
| | |
| 5 | | The Fund is subject to risks associated with investments in small-capitalization companies, such as erratic earnings patterns, competitive conditions, limited earnings history and a reliance on one or a limited number of products. |
| | |
| 6 | | A greater percentage of the Fund’s holdings may be focused in a smaller number of securities which may place the Fund at greater risk than a more diversified fund. |
| | |
| 7 | | Companies that are in similar businesses may be similarly affected by particular economic or market events; to the extent the Fund has substantial holdings within a particular sector, the risks associated with that sector increase. |
| | |
| 8 | | Market prices of investments held by the Fund may fall rapidly or unpredictably due to a variety of economic or political factors, market conditions, disasters or public health issues, or in response to events that affect particular industries or companies. |
| | |
| 9 | | The Fund invests in value stocks, which may perform differently from the market as a whole and may be undervalued by the market for a long period of time. |
| | |
| 10 | | The Russell 2500® Index is composed of the 2,500 smallest stocks in the Russell 3000® Index and is widely regarded in the industry as the premier measure of small/mid cap stock performance. Unlike the Fund, the Russell 2500® Index is unmanaged, is not available for investment and does not incur expenses. |
| | |
| 11 | | The Russell 2500® Value Index measures the performance of the Russell 2500® companies with lower price-to-book ratios and lower forecasted growth values. Unlike the Fund, the Russell 2500® Value Index is unmanaged, is not available for investment and does not incur expenses. |
| |
| The Russell Indices are trademarks of the London Stock Exchange Group companies. |
| |
Not FDIC insured, nor bank guaranteed. May lose value. |
| | | | |
| | | | | |
| | | AMG SouthernSun U.S. Equity Fund | | |
| | | Fund Snapshots (unaudited) September 30, 2020 | | |
PORTFOLIO BREAKDOWN
| | |
| Sector | | % of
Net Assets |
| | |
Industrials | | 40.2 |
| | |
Consumer Discretionary | | 23.5 |
| | |
Information Technology | | 10.0 |
| | |
Health Care | | 7.4 |
| | |
Consumer Staples | | 7.0 |
| | |
Financials | | 5.3 |
| | |
Materials | | 3.2 |
| | |
Energy | | 0.4 |
| | |
Short-Term Investments | | 2.7 |
| | |
Other Assets Less Liabilities | | 0.3 |
TOP TEN HOLDINGS
| | | | | | |
| Security Name | | | | | %of
Net Assets |
Darling Ingredients, Inc. | | | | | | 7.1 |
Dycom Industries, Inc. | | | | | | 6.1 |
The Brink’s Co. | | | | | | 6.1 |
Extended Stay America, Inc. | | | | | | 5.5 |
The Timken Co. | | | | | | 5.2 |
AGCO Corp. | | | | | | 5.0 |
Centene Corp. | | | | | | 4.7 |
Hanesbrands, Inc. | | | | | | 4.1 |
Crane Co. | | | | | | 4.0 |
Polaris, Inc. | | | | | | 3.9 |
| | | | | | | |
Top Ten as a Group | | | | | | 51.7 |
| | | | | | | |
| | | | | | | |
Because a fund’s strategy may result in multiple investments in particular sectors of the economy, its performance may depend on the performance of those sectors and may fluctuate more widely than investments diversified across more sectors. For additional information on these and other risk considerations, please see the Fund’s prospectus.
Any sectors, industries, or securities discussed should not be perceived as investment recommendations. Mention of a specific security should not be considered a recommendation to buy or solicitation to sell that security. Specific securities mentioned in this report may have been sold from the Fund’s portfolio of investments by the time you receive this report.
| | | | |
| | | AMG SouthernSun U.S. Equity Fund | | |
| | | Schedule of Portfolio Investments | | |
| | | September 30, 2020 | | |
| | | | | | | | |
| | | Shares | | | Value | |
| | |
Common Stocks - 97.0% | | | | | | | | |
| |
Consumer Discretionary - 23.5% | | | | | |
| | |
Extended Stay America, Inc. | | | 181,859 | | | | $2,173,215 | |
| | |
Hanesbrands, Inc.1 | | | 101,458 | | | | 1,597,963 | |
| | |
Murphy USA, Inc.* | | | 8,200 | | | | 1,051,814 | |
| | |
Polaris, Inc. | | | 16,103 | | | | 1,519,157 | |
| | |
ServiceMaster Global Holdings, Inc.* | | | 34,117 | | | | 1,360,586 | |
| | |
Thor Industries, Inc. | | | 15,875 | | | | 1,512,253 | |
| | |
Total Consumer Discretionary | | | | | | | 9,214,988 | |
| |
Consumer Staples - 7.0% | | | | | |
| | |
Darling Ingredients, Inc.* | | | 76,972 | | | | 2,773,301 | |
| |
Energy - 0.4% | | | | | |
| | |
Ovintiv, Inc. | | | 20,501 | | | | 167,288 | |
| |
Financials - 5.3% | | | | | |
| | |
First Horizon National Corp. | | | 115,810 | | | | 1,092,088 | |
| | |
SEI Investments Co. | | | 19,279 | | | | 977,831 | |
| | |
Total Financials | | | | | | | 2,069,919 | |
| |
Health Care - 7.4% | | | | | |
| | |
Centene Corp.* | | | 31,922 | | | | 1,862,010 | |
| | |
Molina Healthcare, Inc.* | | | 5,635 | | | | 1,031,431 | |
| | |
Total Health Care | | | | | | | 2,893,441 | |
| |
Industrials - 40.2% | | | | | |
| | |
AGCO Corp. | | | 26,403 | | | | 1,960,951 | |
| | |
The Brink’s Co. | | | 58,362 | | | | 2,398,095 | |
| | |
Clean Harbors, Inc.* | | | 25,185 | | | | 1,411,116 | |
| | |
Crane Co. | | | 31,092 | | | | 1,558,642 | |
| | |
Dycom Industries, Inc.*,1 | | | 45,765 | | | | 2,417,307 | |
| | |
IDEX Corp. | | | 6,115 | | | | 1,115,437 | |
| | |
The Timken Co. | | | 37,636 | | | | 2,040,624 | |
| | |
Trinity Industries, Inc.1 | | | 70,513 | | | | 1,375,003 | |
| | |
Univar Solutions, Inc.* | | | 11,690 | | | | 197,327 | |
| | |
Watsco, Inc. | | | 5,581 | | | | 1,299,759 | |
| | |
Total Industrials | | | | | | | 15,774,261 | |
| | | | | | | | |
| | | Shares | | | Value | |
| |
Information Technology - 10.0% | | | | | |
| | |
Broadridge Financial Solutions, Inc. | | | 11,275 | | | | $1,488,300 | |
| | |
Knowles Corp.* | | | 81,758 | | | | 1,218,194 | |
| | |
The Western Union Co.1 | | | 57,239 | | | | 1,226,632 | |
| | |
Total Information Technology | | | | | | | 3,933,126 | |
| |
Materials - 3.2% | | | | | |
| | |
Westrock Co. | | | 36,749 | | | | 1,276,661 | |
| | |
Total Common Stocks
(Cost $32,166,277) | | | | | | | 38,102,985 | |
| | |
| | | Principal
Amount | | | | |
Short-Term Investments - 2.7% | | | | | | | | |
| |
Joint Repurchase Agreements - 0.2%2 | | | | | |
| | |
Mizuho Securities USA, LLC, dated 09/30/20, due 10/01/20, 0.060% total to be received $88,845 (collateralized by a U.S. Treasury, 2.750%, 11/30/20, totaling $90,622) | | $ | 88,845 | | | | 88,845 | |
| | |
| | | Shares | | | | |
| |
Other Investment Companies - 2.5% | | | | | |
| | |
Dreyfus Government Cash Management Fund, Institutional Shares, 0.02%3 | | | 316,778 | | | | 316,778 | |
| | |
Dreyfus Institutional Preferred Government Money Market Fund, Institutional Shares, 0.04%3 | | | 316,779 | | | | 316,779 | |
| | |
JPMorgan U.S. Government Money Market Fund, IM Shares, 0.06%3 | | | 326,378 | | | | 326,378 | |
| |
Total Other Investment Companies | | | | 959,935 | |
| | |
Total Short-Term Investments
(Cost $1,048,780) | | | | | | | 1,048,780 | |
| |
Total Investments - 99.7%
(Cost $33,215,057) | | | | 39,151,765 | |
| |
Other Assets, less Liabilities - 0.3% | | | | 108,141 | |
| | |
Net Assets - 100.0% | | | | | | $ | 39,259,906 | |
| * | Non-income producing security. |
| 1 | Some of these securities, amounting to $3,672,974 or 9.4% of net assets, were out on loan to various borrowers and are collateralized by cash and various U.S. Treasury Obligations. See Note 4 of Notes to Financial Statements. |
| 2 | Cash collateral received for securities lending activity was invested in these joint repurchase agreements. |
| 3 | Yield shown represents the September 30, 2020, seven day average yield, which refers to the sum of the previous seven days’ dividends paid, expressed as an annual percentage. |
|
|
| The accompanying notes are an integral part of these financial statements. |
| 12 |
| | | | |
| | | | | |
| | | AMG SouthernSun U.S. Equity Fund | | |
| | | Schedule of Portfolio Investments (continued) | | |
The following table summarizes the inputs used to value the Fund’s investments by the fair value hierarchy levels as of September 30, 2020:
| | | | | | | | | | | | | | | | |
| | | Level 1 | | | Level 2 | | | Level 3 | | | Total | |
| | | | |
Investments in Securities | | | | | | | | | | | | | | | | |
| | | | |
Common Stocks† | | $ | 38,102,985 | | | | — | | | | — | | | $ | 38,102,985 | |
| | | | |
Short-Term Investments | | | | | | | | | | | | | | | | |
| | | | |
Joint Repurchase Agreements | | | — | | | $ | 88,845 | | | | — | | | | 88,845 | |
| | | | |
Other Investment Companies | | | 959,935 | | | | — | | | | — | | | | 959,935 | |
| | | | | | | | | | | | | | | | |
| | | | |
Total Investments in Securities | | $ | 39,062,920 | | | $ | 88,845 | | | | — | | | $ | 39,151,765 | |
| | | | | | | | | | | | | | | | |
| † | All common stocks held in the Fund are Level 1 securities. For a detailed breakout of common stocks by major industry classification, please refer to the Fund’s Schedule of Portfolio Investments. |
For the fiscal year ended September 30, 2020, there were no transfers in or out of Level 3.
|
|
| The accompanying notes are an integral part of these financial statements. |
| 13 |
| | | | |
| | | | | |
| | | Statement of Assets and Liabilities | | |
| | | September 30, 2020 | | |
| | | | | | | | |
| | | AMG
SouthernSun
Small
Cap Fund | | | AMG
SouthernSun
U.S.
Equity Fund | |
Assets: | | | | | | | | |
| | |
Investments at value1 (including securities on loan valued at $4,668,940, and $3,672,974, respectively) | | $ | 167,734,641 | | | $ | 39,151,765 | |
| | |
Receivable for investments sold | | | 936,798 | | | | 472,789 | |
| | |
Dividend and interest receivables | | | 41,609 | | | | 24,721 | |
| | |
Securities lending income receivable | | | 645 | | | | 510 | |
| | |
Receivable for Fund shares sold | | | 267,348 | | | | 25 | |
| | |
Prepaid expenses and other assets | | | 18,762 | | | | 15,795 | |
Total assets | | | 168,999,803 | | | | 39,665,605 | |
| | |
Liabilities: | | | | | | | | |
| | |
Payable upon return of securities loaned | | | 468,210 | | | | 88,845 | |
| | |
Payable for investments purchased | | | 365,427 | | | | 199,015 | |
| | |
Payable for Fund shares repurchased | | | 73,843 | | | | 33,842 | |
| | |
Accrued expenses: | | | | | | | | |
| | |
Investment advisory and management fees | | | 105,132 | | | | 29,107 | |
| | |
Administrative fees | | | 21,026 | | | | 4,954 | |
| | |
Distribution fees | | | 6,718 | | | | 1,001 | |
| | |
Other | | | 52,318 | | | | 48,935 | |
Total liabilities | | | 1,092,674 | | | | 405,699 | |
| | | | | | | | |
Net Assets | | | $167,907,129 | | | | $39,259,906 | |
1 Investments at cost | | | $153,732,021 | | | | $33,215,057 | |
|
|
| The accompanying notes are an integral part of these financial statements. |
| 14 |
| | | | |
| | | | | |
| | | Statement of Assets and Liabilities (continued) | | |
| | | | | |
| | | | | | | | |
| | | AMG
SouthernSun
Small
Cap Fund | | | AMG
SouthernSun
U.S.
Equity Fund | |
Net Assets Represent: | | | | | | | | |
Paid-in capital | | | $154,707,480 | | | | $35,864,768 | |
Total distributable earnings | | | 13,199,649 | | | | 3,395,138 | |
Net Assets | | | $167,907,129 | | | | $39,259,906 | |
| | |
Class N: | | | | | | | | |
Net Assets | | | $31,783,916 | | | | $4,587,814 | |
Shares outstanding | | | 1,493,582 | | | | 383,049 | |
Net asset value, offering and redemption price per share | | | $21.28 | | | | $11.98 | |
Class I: | | | | | | | | |
Net Assets | | | $136,123,213 | | | | $34,672,092 | |
Shares outstanding | | | 6,263,705 | | | | 2,904,168 | |
Net asset value, offering and redemption price per share | | | $21.73 | | | | $11.94 | |
|
|
| The accompanying notes are an integral part of these financial statements. |
| 15 |
| | | | |
| | | | | |
| | | Statement of Operations | | |
| | | For the fiscal year ended September 30, 2020 | | |
| | | | | | | | |
| | | AMG
SouthernSun
Small
Cap Fund | | | AMG
SouthernSun
U.S.
Equity Fund | |
Investment Income: | | | | | | | | |
Dividend income | | | $1,847,920 | | | | $1,084,112 | |
Interest income | | | 1,042 | | | | — | |
Securities lending income | | | 12,690 | | | | 13,126 | |
Foreign withholding tax | | | (4,065 | ) | | | (2,201 | ) |
Total investment income | | | 1,857,587 | | | | 1,095,037 | |
Expenses: | | | | | | | | |
Investment advisory and management fees | | | 1,156,050 | | | | 427,476 | |
Administrative fees | | | 231,210 | | | | 85,495 | |
Distribution fees - Class N | | | 87,974 | | | | 14,359 | |
Professional fees | | | 37,651 | | | | 31,517 | |
Registration fees | | | 35,567 | | | | 38,571 | |
Reports to shareholders | | | 35,566 | | | | 18,300 | |
Custodian fees | | | 24,282 | | | | 18,939 | |
Trustee fees and expenses | | | 14,415 | | | | 5,383 | |
Transfer agent fees | | | 8,203 | | | | 5,600 | |
Miscellaneous | | | 5,385 | | | | 8,521 | |
Total expenses before offsets | | | 1,636,303 | | | | 654,161 | |
Expense reimbursements | | | — | | | | (14,467 | ) |
Expense reductions | | | — | | | | (14,023 | ) |
Net expenses | | | 1,636,303 | | | | 625,671 | |
| | | | | | | | |
Net investment income | | | 221,284 | | | | 469,366 | |
Net Realized and Unrealized Gain (Loss): | | | | | | | | |
Net realized gain on investments | | | 728,048 | | | | 8,731,687 | |
Net change in unrealized appreciation/depreciation on investments | | | (1,667,764 | ) | | | (7,123,091 | ) |
| | | | | | | | |
Net realized and unrealized gain (loss) | | | (939,716 | ) | | | 1,608,596 | |
| | | | | | | | |
| | |
Net increase (decrease) in net assets resulting from operations | | | $(718,432 | ) | | | $2,077,962 | |
|
|
| The accompanying notes are an integral part of these financial statements. |
| 16 |
| | | | |
| | | | | |
| | | Statements of Changes in Net Assets | | |
| | | For the fiscal years ended September 30, | | |
| | | | | | | | | | | | | | | | |
| | | AMG
SouthernSun
Small Cap Fund | | | AMG
SouthernSun
U.S. Equity Fund | |
| | | | |
| | | 2020 | | | 2019 | | | 2020 | | | 2019 | |
Increase (Decrease) in Net Assets Resulting From Operations: | | | | | | | | | | | | | | | | |
Net investment income | | | $221,284 | | | | $321,758 | | | | $469,366 | | | | $1,259,012 | |
Net realized gain (loss) on investments | | | 728,048 | | | | 11,004,443 | | | | 8,731,687 | | | | (3,037,805 | ) |
Net change in unrealized appreciation/depreciation on investments | | | (1,667,764 | ) | | | (34,966,325 | ) | | | (7,123,091 | ) | | | (37,527,100 | ) |
Net increase (decrease) in net assets resulting from operations | | | (718,432 | ) | | | (23,640,124 | ) | | | 2,077,962 | | | | (39,305,893 | ) |
Distributions to Shareholders: | | | | | | | | | | | | | | | | |
Class N | | | (2,169,967 | ) | | | (1,879,621 | ) | | | (70,397 | ) | | | (303,270 | ) |
Class I | | | (6,062,517 | ) | | | (4,140,540 | ) | | | (955,671 | ) | | | (13,176,945 | ) |
Class C1 | | | — | | | | — | | | | — | | | | (411,195 | ) |
Total distributions to shareholders | | | (8,232,484 | ) | | | (6,020,161 | ) | | | (1,026,068 | ) | | | (13,891,410 | ) |
Capital Share Transactions:2 | | | | | | | | | | | | | | | | |
Net increase (decrease) from capital share transactions | | | 32,436,636 | | | | (60,021,678 | ) | | | (48,810,642 | ) | | | (153,779,289 | ) |
| | | | | | | | | | | | | | | | |
Total increase (decrease) in net assets | | | 23,485,720 | | | | (89,681,963 | ) | | | (47,758,748 | ) | | | (206,976,592 | ) |
Net Assets: | | | | | | | | | | | | | | | | |
Beginning of year | | | 144,421,409 | | | | 234,103,372 | | | | 87,018,654 | | | | 293,995,246 | |
End of year | | | $167,907,129 | | | | $144,421,409 | | | | $39,259,906 | | | | $87,018,654 | |
| 1 | Effective May 31, 2019, Class C shares were converted into Class N shares. |
| 2 | See Note 1(g) of the Notes to Financial Statements. |
|
|
| The accompanying notes are an integral part of these financial statements. |
| 17 |
| | | | |
| | | AMG SouthernSun Small Cap Fund | | |
| | | Financial Highlights | | |
| | | For a share outstanding throughout each fiscal year | | |
| | | | | | | | | | | | | | | | | | | | |
| | | For the fiscal years ended September 30, | |
| | | | | |
| Class N | | 2020 | | | 2019 | | | 2018 | | | 20171 | | | 2016 | |
Net Asset Value, Beginning of Year | | | $22.59 | | | | $25.59 | | | | $25.79 | | | | $21.16 | | | | $21.09 | |
Income (loss) from Investment Operations: | | | | | | | | | | | | | | | | | | | | |
Net investment income (loss)2,3 | | | (0.01 | ) | | | 0.00 | 4 | | | (0.05 | ) | | | (0.04 | ) | | | 0.00 | 4,5 |
Net realized and unrealized gain (loss) on investments | | | (0.02 | ) | | | (2.10 | ) | | | (0.15 | ) | | | 4.67 | | | | 2.42 | |
| | | | | |
Total income (loss) from investment operations | | | (0.03 | ) | | | (2.10 | ) | | | (0.20 | ) | | | 4.63 | | | | 2.42 | |
Less Distributions to Shareholders from: | | | | | | | | | | | | | | | | | | | | |
Net investment income | | | (0.01 | ) | | | — | | | | — | | | | — | | | | (0.02 | ) |
Net realized gain on investments | | | (1.27 | ) | | | (0.90 | ) | | | — | | | | — | | | | (2.33 | ) |
Total distributions to shareholders | | | (1.28 | ) | | | (0.90 | ) | | | — | | | | — | | | | (2.35 | ) |
Net Asset Value, End of Year | | | $21.28 | | | | $22.59 | | | | $25.59 | | | | $25.79 | | | | $21.16 | |
Total Return3,6 | | | (0.72 | )% | | | (7.46 | )% | | | (0.78 | )% | | | 21.88 | % | | | 12.97 | % |
Ratio of net expenses to average net assets | | | 1.25 | % | | | 1.24 | %7 | | | 1.21 | %7 | | | 1.21 | %7 | | | 1.20 | %7 |
Ratio of gross expenses to average net assets8 | | | 1.25 | % | | | 1.24 | % | | | 1.21 | % | | | 1.21 | % | | | 1.21 | % |
Ratio of net investment income (loss) to average net assets3 | | | (0.05 | )% | | | 0.02 | % | | | (0.20 | )% | | | (0.19 | )% | | | 0.01 | % |
Portfolio turnover | | | 25 | % | | | 29 | % | | | 20 | % | | | 21 | % | | | 16 | % |
| | | | | |
Net assets end of year (000’s) omitted | | | $31,784 | | | | $40,279 | | | | $60,916 | | | | $110,092 | | | | $139,603 | |
| | | | | | | | | | | | | | | | | | | | | |
| | | | |
| | | AMG SouthernSun Small Cap Fund | | |
| | | Financial Highlights | | |
| | | For a share outstanding throughout each fiscal year | | |
| | | | | | | | | | | | | | | | | | | | |
| | | For the fiscal years ended September 30, | |
| | | | | |
| Class I | | 2020 | | | 2019 | | | 2018 | | | 20171 | | | 2016 | |
| | | | | |
Net Asset Value, Beginning of Year | | | $23.04 | | | | $26.02 | | | | $26.16 | | | | $21.46 | | | | $21.43 | |
| | | | | |
Income (loss) from Investment Operations: | | | | | | | | | | | | | | | | | | | | |
| | | | | |
Net investment income2,3 | | | 0.04 | | | | 0.06 | | | | 0.01 | | | | 0.01 | | | | 0.06 | 5 |
| | | | | |
Net realized and unrealized gain (loss) on investments | | | (0.01 | ) | | | (2.14 | ) | | | (0.15 | ) | | | 4.74 | | | | 2.45 | |
| | | | | |
Total income (loss) from investment operations | | | 0.03 | | | | (2.08 | ) | | | (0.14 | ) | | | 4.75 | | | | 2.51 | |
| | | | | |
Less Distributions to Shareholders from: | | | | | | | | | | | | | | | | | | | | |
| | | | | |
Net investment income | | | (0.07 | ) | | | — | | | | — | | | | (0.05 | ) | | | (0.11 | ) |
| | | | | |
Net realized gain on investments | | | (1.27 | ) | | | (0.90 | ) | | | — | | | | — | | | | (2.37 | ) |
| | | | | |
Total distributions to shareholders | | | (1.34 | ) | | | (0.90 | ) | | | — | | | | (0.05 | ) | | | (2.48 | ) |
| | | | | |
Net Asset Value, End of Year | | | $21.73 | | | | $23.04 | | | | $26.02 | | | | $26.16 | | | | $21.46 | |
| | | | | |
Total Return3,6 | | | (0.45 | )% | | | (7.25 | )% | | | (0.54 | )% | | | 22.19 | % | | | 13.23 | % |
| | | | | |
Ratio of net expenses to average net assets | | | 1.00 | % | | | 0.99 | %7 | | | 0.96 | %7 | | | 0.96 | %7 | | | 0.95 | %7 |
| | | | | |
Ratio of gross expenses to average net assets8 | | | 1.00 | % | | | 0.99 | % | | | 0.96 | % | | | 0.96 | % | | | 0.96 | % |
| | | | | |
Ratio of net investment income to average net assets3 | | | 0.20 | % | | | 0.27 | % | | | 0.05 | % | | | 0.06 | % | | | 0.27 | % |
| | | | | |
Portfolio turnover | | | 25 | % | | | 29 | % | | | 20 | % | | | 21 | % | | | 16 | % |
| | | | | |
Net assets end of year (000’s) omitted | | | $136,123 | | | | $104,143 | | | | $173,188 | | | | $250,213 | | | | $210,363 | |
| | | | | | | | | | | | | | | | | | | | | |
| 1 | Effective October 1, 2016, Investor Class and Institutional Class were renamed Class N and Class I, respectively. |
| 2 | Per share numbers have been calculated using average shares. |
| 3 | Total returns and net investment income (loss) would have been lower had certain expenses not been offset. |
| 4 | Less than $0.005 per share. |
| 5 | Includes non-recurring dividends. Without these dividends, net investment income (loss) per share would have been $(0.01) and $0.05 for Class N and Class I shares, respectively. |
| 6 | The total return is calculated using the published Net Asset Value as of fiscal year end. |
| 7 | Includes reduction from broker recapture amounting to less than 0.01% for the fiscal years ended 2019, 2018, and 2017, respectively, and 0.01% for the fiscal year ended 2016. |
| 8 | Excludes the impact of expense reimbursement or fee waivers and expense reductions such as brokerage credits, but includes expense repayments and non-reimbursable expenses, if any, such as interest, taxes, and extraordinary expenses. (See Note 1(c) and 2 in the Notes to Financial Statements.) |
| | | | |
| | | AMG SouthernSun U.S. Equity Fund | | |
| | | Financial Highlights | | |
| | | For a share outstanding throughout each fiscal year | | |
| | | | | | | | | | | | | | | | | | | | |
| | | For the fiscal years ended September 30, | |
| | | | | |
| Class N | | 2020 | | | 2019 | | | 2018 | | | 20171 | | | 2016 | |
| | | | | |
Net Asset Value, Beginning of Year | | | $11.90 | | | | $14.40 | | | | $14.09 | | | | $12.63 | | | | $11.77 | |
| | | | | |
Income (loss) from Investment Operations: | | | | | | | | | | | | | | | | | | | | |
| | | | | |
Net investment income2,3 | | | 0.07 | | | | 0.07 | | | | 0.02 | | | | 0.01 | | | | 0.03 | |
| | | | | |
Net realized and unrealized gain (loss) on investments | | | 0.14 | | | | (1.85 | ) | | | 0.29 | | | | 1.47 | | | | 1.33 | |
| | | | | |
Total income (loss) from investment operations | | | 0.21 | | | | (1.78 | ) | | | 0.31 | | | | 1.48 | | | | 1.36 | |
| | | | | |
Less Distributions to Shareholders from: | | | | | | | | | | | | | | | | | | | | |
| | | | | |
Net investment income | | | (0.13 | ) | | | (0.05 | ) | | | (0.00 | )4 | | | (0.02 | ) | | | (0.02 | ) |
| | | | | |
Net realized gain on investments | | | — | | | | (0.67 | ) | | | — | | | | — | | | | (0.48 | ) |
| | | | | |
Total distributions to shareholders | | | (0.13 | ) | | | (0.72 | ) | | | (0.00 | )4 | | | (0.02 | ) | | | (0.50 | ) |
| | | | | |
Net Asset Value, End of Year | | | $11.98 | | | | $11.90 | | | | $14.40 | | | | $14.09 | | | | $12.63 | |
| | | | | |
Total Return3,5 | | | 1.64 | % | | | (11.50 | )% | | | 2.22 | % | | | 11.71 | % | | | 12.13 | % |
| | | | | |
Ratio of net expenses to average net assets6 | | | 1.32 | % | | | 1.19 | % | | | 1.19 | % | | | 1.20 | % | | | 1.20 | % |
| | | | | |
Ratio of gross expenses to average net assets7 | | | 1.37 | % | | | 1.25 | % | | | 1.20 | % | | | 1.20 | % | | | 1.20 | % |
| | | | | |
Ratio of net investment income to average net assets3 | | | 0.60 | % | | | 0.58 | % | | | 0.17 | % | | | 0.08 | % | | | 0.23 | % |
| | | | | |
Portfolio turnover | | | 11 | % | | | 18 | % | | | 46 | % | | | 18 | % | | | 16 | % |
| | | | | |
Net assets end of year (000’s) omitted | | | $4,588 | | | | $7,206 | | | | $8,516 | | | | $31,038 | | | | $45,902 | |
| | | | | | | | | | | | | | | | | | | | | |
| | | | |
| | | AMG SouthernSun U.S. Equity Fund | | |
| | | Financial Highlights | | |
| | | For a share outstanding throughout each fiscal year | | |
| | | | | | | | | | | | | | | | | | | | |
| | | For the fiscal years ended September 30, | |
| | | | | |
Class I | | | 2020 | | | | 2019 | | | | 2018 | | | | 20171 | | | | 2016 | |
| | | | | |
Net Asset Value, Beginning of Year | | | $11.86 | | | | $14.44 | | | | $14.14 | | | | $12.67 | | | | $11.83 | |
| | | | | |
Income (loss) from Investment Operations: | | | | | | | | | | | | | | | | | | | | |
| | | | | |
Net investment income2,3 | | | 0.10 | | | | 0.10 | | | | 0.06 | | | | 0.04 | | | | 0.06 | |
| | | | | |
Net realized and unrealized gain (loss) on investments | | | 0.13 | | | | (1.87 | ) | | | 0.29 | | | | 1.48 | | | | 1.34 | |
| | | | | |
Total income (loss) from investment operations | | | 0.23 | | | | (1.77 | ) | | | 0.35 | | | | 1.52 | | | | 1.40 | |
| | | | | |
Less Distributions to Shareholders from: | | | | | | | | | | | | | | | | | | | | |
| | | | | |
Net investment income | | | (0.15 | ) | | | (0.14 | ) | | | (0.05 | ) | | | (0.05 | ) | | | (0.08 | ) |
| | | | | |
Net realized gain on investments | | | — | | | | (0.67 | ) | | | — | | | | — | | | | (0.48 | ) |
| | | | | |
Total distributions to shareholders | | | (0.15 | ) | | | (0.81 | ) | | | (0.05 | ) | | | (0.05 | ) | | | (0.56 | ) |
| | | | | |
Net Asset Value, End of Year | | | $11.94 | | | | $11.86 | | | | $14.44 | | | | $14.14 | | | | $12.67 | |
| | | | | |
Total Return3,5 | | | 1.86 | % | | | (11.27 | )% | | | 2.46 | % | | | 12.02 | % | | | 12.42 | % |
| | | | | |
Ratio of net expenses to average net assets6 | | | 1.07 | % | | | 0.94 | % | | | 0.94 | % | | | 0.95 | % | | | 0.95 | % |
| | | | | |
Ratio of gross expenses to average net assets7 | | | 1.12 | % | | | 1.00 | % | | | 0.95 | % | | | 0.95 | % | | | 0.95 | % |
| | | | | |
Ratio of net investment income to average net assets3 | | | 0.85 | % | | | 0.81 | % | | | 0.42 | % | | | 0.33 | % | | | 0.49 | % |
| | | | | |
Portfolio turnover | | | 11 | % | | | 18 | % | | | 46 | % | | | 18 | % | | | 16 | % |
| | | | | |
Net assets end of year (000’s) omitted | | $ | 34,672 | | | $ | 79,813 | | | $ | 273,774 | | | $ | 770,603 | | | $ | 676,962 | |
| | | | | | | | | | | | | | | | | | | | | |
| 1 | Effective October 1, 2016, Investor Class and Institutional Class were renamed Class N and Class I, respectively. |
| 2 | Per share numbers have been calculated using average shares. |
| 3 | Total returns and net investment income would have been lower had certain expenses not been offset. |
| 4 | Less than $(0.005) per share. |
| 5 | The total return is calculated using the published Net Asset Value as of fiscal year end. |
| 6 | Includes reduction from broker recapture amounting to 0.02%, 0.06%, 0.01%, for the fiscal years ended 2020, 2019, and 2018, respectively, and less than 0.01% for the fiscal years ended 2017 and 2016, respectively. |
| 7 | Excludes the impact of expense reimbursement or fee waivers and expense reductions such as brokerage credits, but includes expense repayments and non-reimbursable expenses, if any, such as interest, taxes, and extraordinary expenses. (See Note 1(c) and 2 in the Notes to Financial Statements.) |
| | | | |
| | | | | |
| | | Notes to Financial Statements | | |
| | | September 30, 2020 | | |
1. ORGANIZATION AND SUMMARY OF SIGNIFICANT ACCOUNTING POLICIES
AMG Funds (the “Trust”) is an open-end management investment company, organized as a Massachusetts business trust, and registered under the Investment Company Act of 1940, as amended (the “1940 Act”). Currently, the Trust consists of a number of different funds, each having distinct investment management objectives, strategies, risks, and policies. Included in this report are AMG SouthernSun Small Cap Fund (“Small Cap”) and AMG SouthernSun U.S. Equity Fund (“U.S. Equity”), each a “Fund” and collectively, the “Funds”.
On September 17, 2020, the Board of Trustees of the Trust (the “Board”) approved and recommended submitting to each Fund’s shareholders a proposed Agreement and Plan of Reorganization (the “Plan”) that provides for the reorganization of each Fund into a corresponding series of Advisors’ Inner Circle Fund III. The Plan sets forth the terms by which each Fund would transfer all of its assets and liabilities to its corresponding new fund of Advisors’ Inner Circle Fund III in exchange for shares of the corresponding new fund, and subsequently distribute the corresponding new fund shares to applicable Fund shareholders in complete liquidation of each Fund. Shareholders of each Fund will vote separately on the proposal to reorganize their respective Fund. Each new fund has been created to continue the investment operations of the corresponding Fund. The new funds’ investment adviser will be the current subadviser to the Funds.
Each Fund offers different classes of shares. Each Fund offers Class N and Class I shares. Effective May 31, 2019, U.S. Equity Class C shares were converted to Class N shares. Each class represents an interest in the same assets of the respective Fund. Although all share classes generally have identical voting rights, each share class votes separately when required by law. Different share classes may have different net asset values per share to the extent the share classes pay different distribution amounts and/or the expenses of such share classes differ. Each share class has its own expense structure. Please refer to a current prospectus for additional information on each share class.
The Funds are non-diversified. A greater percentage of the Fund’s holdings may be focused in a smaller number of securities which may place the Funds at greater risk than a more diversified fund.
Market disruptions associated with the COVID-19 pandemic have had a global impact, and uncertainty exists as to the long-term implications. Such disruptions can adversely affect assets of the Funds and thus Fund performance.
The Funds’ financial statements are prepared in accordance with accounting principles generally accepted in the United States of America (“U.S. GAAP”), including accounting and reporting guidance pursuant to Accounting Standards Codification Topic 946 applicable to investment companies. U.S. GAAP requires management to make estimates and assumptions that affect the reported amounts of assets and liabilities and disclosure of contingent assets and liabilities at the date of the financial statements and the reported amounts of income and expenses during the reporting period. Actual results could differ from those estimates and such differences could be material. The following is a summary of significant accounting policies followed by the Funds in the preparation of their financial statements:
a. VALUATION OF INVESTMENTS
Equity securities traded on a national securities exchange or reported on the NASDAQ national market system (“NMS”) are valued at the last quoted sales price on the primary exchange or, if applicable, the NASDAQ official closing price or the
official closing price of the relevant exchange or, lacking any sales, at the last quoted bid price or the mean between the last quoted bid and ask prices (the “mean price”). Equity securities traded in the over-the-counter market (other than NMS securities) are valued at the mean price. Foreign equity securities (securities principally traded in markets other than U.S. markets) are valued at the official closing price on the primary exchange or, for markets that either do not offer an official closing price or where the official closing price may not be representative of the overall market, the last quoted sale price.
Fixed income securities purchased with a remaining maturity of 60 days or less are valued at amortized cost, provided that the amortized cost value is approximately the same as the fair value of the security valued without the use of amortized cost. Investments in other open-end registered investment companies are valued at their end of day net asset value per share.
The Funds’ portfolio investments are generally valued based on independent market quotations or prices or, if none, “evaluative” or other market based valuations provided by third party pricing services approved by the Board. Under certain circumstances, the value of certain Fund portfolio investments may be based on an evaluation of fair value, pursuant to procedures established by and under the general supervision of the Board. The Valuation Committee, which is comprised of the Independent Trustees of the Board, and the Pricing Committee, which is comprised of representatives from AMG Funds LLC (the “Investment Manager”) are the committees appointed by the Board to make fair value determinations. Each Fund may use the fair value of a portfolio investment to calculate its net asset value (“NAV”) in the event that the market quotation, price or market based valuation for the portfolio investment is not readily available or otherwise not determinable pursuant to the Board’s valuation procedures, if the Investment Manager or the Pricing Committee believes the quotation, price or market based valuation to be unreliable, or in certain other circumstances. When determining the fair value of an investment, the Pricing Committee and, if required under the Trust’s securities valuation procedures, the Valuation Committee, seeks to determine the price that the Fund might reasonably expect to receive from current sale of that portfolio investment in an arms-length transaction. Fair value determinations shall be based upon consideration of all available facts and information, including, but not limited to (i) attributes specific to the investment; (ii) fundamental and analytical data relating to the investment; and (iii) the value of other comparable securities or relevant financial instruments, including derivative securities, traded on other markets or among dealers.
The values assigned to fair value portfolio investments are based on available information and do not necessarily represent amounts that might ultimately be realized in the future, since such amounts depend on future developments inherent in long-term investments. Because of the inherent uncertainty of valuation, those estimated values may differ significantly from the values that would have been used had a ready market for the investments existed, and the differences could be material. The Board will be presented with a quarterly report showing as of the most recent quarter end, all outstanding securities fair valued by the Funds, including a comparison with the prior quarter end and the percentage of the Funds that the security represents at each quarter end.
With respect to foreign equity securities and certain foreign fixed income securities, the Board has adopted a policy that securities held in the Funds that can be fair valued by the applicable fair value pricing service are fair valued on each business day provided that each individual price exceeds a pre-established confidence level.
| | | | |
| | | | | |
| | | | | |
| | | Notes to Financial Statements (continued) | | |
U.S. GAAP defines fair value as the price that a fund would receive to sell an asset or pay to transfer a liability in an orderly transaction between market participants at the measurement date. U.S. GAAP also establishes a framework for measuring fair value, and a three level hierarchy for fair value measurements based upon the transparency of inputs to the valuation of an asset or liability. Inputs may be observable or unobservable and refer broadly to the assumptions that market participants would use in pricing the asset or liability. Observable inputs reflect the assumptions market participants would use in pricing the asset or liability based on market data obtained from sources independent of the Funds. Unobservable inputs reflect the Funds’ own assumptions about the assumptions that market participants would use in pricing the asset or liability developed based on the best information available in the circumstances. Each investment is assigned a level based upon the observability of the inputs which are significant to the overall valuation.
The three-tier hierarchy of inputs is summarized below:
Level 1 – inputs are quoted prices in active markets for identical investments (e.g., equity securities, open-end investment companies)
Level 2 – other observable inputs (including, but not limited to: quoted prices for similar assets or liabilities in markets that are active, quoted prices for identical or similar assets or liabilities in markets that are not active, inputs other than quoted prices that are observable for the assets or liabilities (such as interest rates, yield curves, volatilities, prepayment speeds, loss severities, credit risks and default rates) or other market corroborated inputs) (e.g., debt securities, government securities, foreign currency exchange contracts, swaps, foreign securities utilizing international fair value pricing, fair valued securities with observable inputs)
Level 3 – inputs are significant unobservable inputs (including the Fund’s own assumptions used to determine the fair value of investments) (e.g., fair valued securities with unobservable inputs)
Changes in inputs or methodologies used for valuing investments may result in a transfer in or out of levels within the fair value hierarchy. The inputs or methodologies used for valuing investments may not necessarily be an indication of the risk associated with investing in those investments.
b. SECURITY TRANSACTIONS
Security transactions are accounted for as of trade date. Realized gains and losses on securities sold are determined on the basis of identified cost.
c. INVESTMENT INCOME AND EXPENSES
Dividend income is recorded on the ex-dividend date. Interest income, which includes amortization of premium and accretion of discount on debt securities, is accrued as earned. Dividend and interest income on foreign securities is recorded gross of any withholding tax. Non-cash dividends included in dividend income, if any, are reported at the fair market value of the securities received. Other income and expenses are recorded on an accrual basis. Expenses that cannot be directly attributed to a Fund are apportioned among the funds in the Trust and other trusts or funds within the AMG Funds Family of Funds (collectively the “AMG Funds Family”) based upon their relative average net assets or number of shareholders. Investment income, realized and unrealized capital gains and losses, the common expenses of each Fund, and certain fund level expense reductions, if any, are allocated on a pro-rata basis to each class based on the relative net assets of each class to the total net assets of each Fund.
U.S. Equity had certain portfolio trades directed to various brokers under a brokerage recapture program. Credits received from the brokerage recapture program are earned and paid on a monthly basis, and are recorded as expense offsets, which serve to reduce the Funds’ overall expense ratio. For the fiscal year ended September 30, 2020, the impact on the expenses and expense ratios were as follows: U.S. Equity - $14,023, or 0.02%.
d. DIVIDENDS AND DISTRIBUTIONS
Fund distributions resulting from either net investment income or realized net capital gains, if any, will normally be declared and paid at least annually in December. Distributions to shareholders are recorded on the ex-dividend date. Distributions are determined in accordance with federal income tax regulations, which may differ from net investment income and net realized capital gains for financial statement purposes (U.S. GAAP). Differences may be permanent or temporary. Permanent differences are reclassified among capital accounts in the financial statements to reflect their tax character. Permanent book and tax basis differences, if any, relating to shareholder distributions will result in reclassifications to paid-in capital. Temporary differences arise when certain items of income, expense and gain or loss are recognized in different periods for financial statement and tax purposes; these differences will reverse at some time in the future. Temporary differences are due to wash sales and capital loss carryovers.
The tax character of distributions paid during the fiscal years ended September 30, 2020 and September 30, 2019 were as follows:
| | | | | | | | | | | | | | | | |
| | | Small Cap | | | U.S. Equity | |
Distributions paid from: | | | 2020 | | | | 2019 | | | | 2020 | | | | 2019 | |
Ordinary income* | | | $354,136 | | | | — | | | | $1,026,068 | | | | $2,269,365 | |
Long-term capital gains | | | 7,878,348 | | | | $6,020,161 | | | | — | | | | 11,622,045 | |
| | | | | | | | | | | | | | | | |
| | | $8,232,484 | | | | $6,020,161 | | | | $1,026,068 | | | | $13,891,410 | |
| | | | | | | | | | | | | | | | |
| * | For tax purposes, short-term capital gain distributions, if any, are considered ordinary income distributions. |
| | | | |
| | | | | |
| | | | | |
| | | Notes to Financial Statements (continued) | | |
As of September 30, 2020, the components of distributable earnings (excluding unrealized appreciation/depreciation) on a tax basis consisted of:
| | | | | | | | |
| | | Small Cap | | | U.S. Equity | |
| | |
Capital loss carryforward | | | — | | | | $1,635,556 | |
| | |
Undistributed ordinary income | | | $109,661 | | | | 234,928 | |
| | |
Undistributed long-term capital gains | | | 530,754 | | | | — | |
At September 30, 2020, the cost of investments and the aggregate gross unrealized appreciation and depreciation for federal income tax purposes were as follows:
| | | | | | | | | | | | | | | | |
| Fund | | Cost | | | Appreciation | | | Depreciation | | | Net Appreciation | |
| | | | |
Small Cap | | | $155,175,407 | | | | $31,645,115 | | | $ | (19,085,881 | ) | | | $12,559,234 | |
| | | | |
U.S. Equity | | | 34,355,999 | | | | 9,931,685 | | | | (5,135,919 | ) | | | 4,795,766 | |
e. FEDERAL TAXES
Each Fund currently qualifies as an investment company and intends to comply with the requirements under Subchapter M of the Internal Revenue Code of 1986, as amended, and to distribute substantially all of its taxable income and gains to its shareholders and to meet certain diversification and income requirements with respect to investment companies. Therefore, no provision for federal income or excise tax is included in the accompanying financial statements.
Additionally, based on each Fund’s understanding of the tax rules and rates related to income, gains and transactions for the foreign jurisdictions in which it invests, each Fund will provide for foreign taxes, and where appropriate, deferred foreign taxes.
Management has analyzed the Funds’ tax positions taken on federal income tax returns as of September 30, 2020, and for all open tax years (generally, the three prior taxable years), and has concluded that no provision for federal income tax is required in the Funds’ financial statements. Additionally, Management is not aware of any tax position for which it is reasonably possible that the total amounts of unrecognized tax benefits will change materially in the next twelve months.
f. CAPITAL LOSS CARRYOVERS AND DEFERRALS
As of September 30, 2020, the following Fund had capital loss carryovers for federal income tax purposes as shown in the following chart. These amounts may be used to offset future realized capital gains indefinitely, and retain their character as short-term and/or long-term.
| | | | | | | | | | | | |
| | | Capital Loss
Carryover Amounts | | | | |
| | | |
| Fund | | Short-Term | | | Long-Term | | | Total | |
| | | |
U.S. Equity | | | $1,635,556 | | | | — | | | | $1,635,556 | |
As of September 30, 2020, Small Cap had no capital loss carryovers for federal income tax purposes. Should the Fund incur net capital losses for the fiscal year ended September 30, 2021, such amounts may be used to offset future realized capital gains indefinitely, and retain their character as either short-term and/or long-term.
g. CAPITAL STOCK
The Trust’s Declaration of Trust authorizes for each Fund the issuance of an unlimited number of shares of beneficial interest, without par value. Each Fund records sales and repurchases of its capital stock on the trade date. Prior to March 1, 2019, the Funds deducted a 2.00% redemption fee from the proceeds of any redemption of shares (including a redemption by exchange) if the redemption occured within 60 days of the purchase of those shares. For the fiscal year ended September 30, 2019, Small Cap and U.S. Equity had redemption fees amounting to $2,290, and $3,675, respectively. These amounts are netted against the cost of shares repurchased in the Statements of Changes in Net Assets.
For the fiscal years ended September 30, 2020 and September 30, 2019, the capital stock transactions by class for the Funds were as follows:
| | | | | | | | | | | | | | | | | | | | | | | | | | | | | | | | |
| | | Small Cap | | | U.S. Equity | |
| | | September 30, 2020 | | | September 30, 2019 | | | September 30, 2020 | | | September 30,
2019 | |
| | | | | | | | |
| | | Shares | | | Amount | | | Shares | | | Amount | | | Shares | | | Amount | | | Shares | | | Amount | |
| | | | | | | | |
Class N: | | | | | | | | | | | | | | | | | | | | | | | | | | | | | | | | |
| | | | | | | | |
Proceeds from sale of shares | | | 197,912 | | | | $3,760,411 | | | | 95,253 | | | | $2,119,270 | | | | 3,259 | | | | $35,781 | | | | 26,574 | | | | $324,800 | |
| | | | | | | | |
Reinvestment of distributions | | | 89,110 | | | | 2,112,804 | | | | 98,931 | | | | 1,839,129 | | | | 5,327 | | | | 69,789 | | | | 29,173 | | | | 296,113 | |
| | | | | | | | |
Cost of shares repurchased | | | (576,664 | ) | | | (11,941,576 | ) | | | (791,545 | ) | | | (17,149,131 | ) | | | (231,019 | ) | | | (2,666,531 | ) | | | (419,017 | ) | | | (5,105,912 | ) |
| | | | | | | | |
Share Conversion | | | — | | | | — | | | | — | | | | — | | | | — | | | | — | | | | 377,354 | | | | 4,264,933 | |
| | | | | | | | | | | | | | | | | | | | | | | | | | | | | | | | |
| | | | | | | | |
Net increase (decrease) | | | (289,642 | ) | | | $(6,068,361 | ) | | | (597,361 | ) | | | $(13,190,732 | ) | | | (222,433 | ) | | | $(2,560,961 | ) | | | 14,084 | | | | $(220,066 | ) |
| | | | | | | | | | | | | | | | | | | | | | | | | | | | | | | | |
| | | | |
| | | | | |
| | | | | |
| | | Notes to Financial Statements (continued) | | |
| | | | | | | | | | | | | | | | | | | | | | | | | | | | | | | | |
| | | Small Cap | | U.S. Equity |
| | | | |
| | | September 30, 2020 | | September 30, 2019 | | September 30, 2020 | | September 30, 2019 |
| | | | | | | | |
| | | Shares | | Amount | | Shares | | Amount | | Shares | | Amount | | Shares | | Amount |
Class I: | | | | | | | | | | | | | | | | | | | | | | | | | | | | | | | | |
| | | | | | | | |
Proceeds from sale of shares | | | 3,010,584 | | | | $62,719,675 | | | | 1,507,885 | | | | $32,754,198 | | | | 314,387 | | | | $3,285,844 | | | | 2,236,387 | | | | $26,346,742 | |
| | | | | | | | |
Reinvestment of distributions | | | 230,350 | | | | 5,567,569 | | | | 195,057 | | | | 3,692,437 | | | | 69,928 | | | | 911,161 | | | | 1,067,897 | | | | 10,775,083 | |
| | | | | | | | |
Cost of shares repurchased | | | (1,496,555 | ) | | | (29,782,247 | ) | | | (3,839,294 | ) | | | (83,277,581 | ) | | | (4,211,691 | ) | | | (50,446,686 | ) | | | (15,534,484 | ) | | | (181,139,259 | ) |
| | | | | | | | | | | | | | | | | | | | | | | | | | | | | | | | |
| | | | | | | | |
Net increase (decrease) | | | 1,744,379 | | | | $38,504,997 | | | | (2,136,352 | ) | | | $(46,830,946 | ) | | | (3,827,376 | ) | | | $(46,249,681 | ) | | | (12,230,200 | ) | | | $(144,017,434 | ) |
| | | | | | | | | | | | | | | | | | | | | | | | | | | | | | | | |
Class C:1 | | | | | | | | | | | | | | | | | | | | | | | | | | | | | | | | |
| | | | | | | | |
Proceeds from sale of shares | | | — | | | | — | | | | — | | | | — | | | | — | | | | — | | | | 5,449 | | | | $61,092 | |
| | | | | | | | |
Reinvestment of distributions | | | — | | | | — | | | | — | | | | — | | | | — | | | | — | | | | 41,257 | | | | 402,258 | |
| | | | | | | | |
Cost of shares repurchased | | | — | | | | — | | | | — | | | | — | | | | — | | | | — | | | | (498,860 | ) | | | (5,740,206 | ) |
| | | | | | | | |
Share Conversion | | | — | | | | — | | | | — | | | | — | | | | — | | | | — | | | | (394,138 | ) | | | (4,264,933 | ) |
| | | | | | | | | | | | | | | | | | | | | | | | | | | | | | | | |
| | | | | | | | |
Net decrease | | | — | | | | — | | | | — | | | | — | | | | — | | | | — | | | | (846,292 | ) | | | $(9,541,789 | ) |
| | | | | | | | | | | | | | | | | | | | | | | | | | | | | | | | |
1 Effective May 31, 2019, Class C shares were converted into Class N shares.
h. REPURCHASE AGREEMENTS AND JOINT REPURCHASE AGREEMENTS
The Funds may enter into third-party repurchase agreements for temporary cash management purposes and third-party or bilateral joint repurchase agreements for reinvestment of cash collateral on securities lending transactions under the securities lending program offered by The Bank of New York Mellon (“BNYM”) (the “Program”) (collectively, “Repurchase Agreements”). The value of the underlying collateral, including accrued interest, must equal or exceed the value of the Repurchase Agreements during the term of the agreement. For joint repurchase agreements, the Funds participate on a pro rata basis with other clients of BNYM in its share of the underlying collateral under such joint repurchase agreements and in its share of proceeds from any repurchase or other disposition of the underlying collateral. The underlying collateral for all Repurchase Agreements is held in safekeeping by the Funds’ custodian or at the Federal Reserve Bank. If the seller defaults and the value of the collateral declines, or if bankruptcy proceedings commence with respect to the seller of the security, realization of the collateral by the Funds may be delayed or limited. Pursuant to the Program, the Funds are indemnified for such losses by BNYM on joint repurchase agreements.
At September 30, 2020, the market value of Repurchase Agreements outstanding for Small Cap and U.S. Equity were $468,210 and $88,845, respectively.
2. AGREEMENTS AND TRANSACTIONS WITH AFFILIATES
For each of the Funds, the Trust has entered into an investment advisory agreement under which the Investment Manager, a subsidiary and the U.S. retail distribution arm of Affiliated Managers Group, Inc. (“AMG”), serves as investment manager to the Funds and is responsible for the Funds’ overall administration and operations. The Investment Manager selects one or more subadvisers for the Funds (subject to Board approval) and monitors each subadviser’s investment performance, security holdings and investment strategies. Each Fund’s investment portfolio is managed by SouthernSun Asset Management, LLC (“SouthernSun”), who serves pursuant to a subadvisory agreement with the Investment Manager. As of August 13, 2020, SouthernSun has acquired AMG’s interest in SouthernSun.
As a result, AMG and the Investment Manager are no longer affiliated. Prior to August 13, 2020, AMG owned a majority interest in SouthernSun.
Investment management fees are paid directly by the Funds to the Investment Manager based on average daily net assets. For the fiscal year ended September 30, 2020, the Funds’ investment management fees were paid at the following annual rate of each Fund’s respective average daily net assets:
| | | | |
| |
Small Cap | | | 0.75% | |
| |
U.S. Equity | | | 0.75% | |
The Investment Manager has contractually agreed, through at least February 1, 2021, to waive management fees and/or pay or reimburse fund expenses in order to limit total annual Fund operating expenses after fee waiver and expense reimbursements (exclusive of taxes, interest (including interest incurred in connection with bank and custody overdrafts and in connection with securities sold short), shareholder servicing fees, distribution and service (12b-1) fees, brokerage commissions and other transaction costs, dividends payable with respect to securities sold short, acquired fund fees and expenses and extraordinary expenses) of Small Cap and U.S. Equity to 1.25% and 1.09%, respectively, of each Fund’s average daily net assets (this annual rate or such other annual rate that may be in effect from time to time, the “Expense Cap”), subject to later reimbursement by the Funds in certain circumstances.
In general, for a period of up to 36 months after the date any amounts are paid, waived or reimbursed by the Investment Manager, the Investment Manager may recover such amounts from a Fund, provided that such repayment would not cause the Fund’s total annual operating expenses after fee waiver and expense reimbursements (exclusive of the items noted in the parenthetical above) to exceed either (i) the Expense Cap in effect at the time such amounts were paid, waived or reimbursed, or (ii) the Expense Cap in effect at the time of such repayment by the Fund.
| | | | |
| | | | | |
| | | | | |
| | | Notes to Financial Statements (continued) | | |
The contractual expense limitation may only be terminated in the event the Investment Manager or a successor ceases to be the investment manager of a Fund or a successor fund, by mutual agreement between the Investment Manager and the Board, or in the event of a Fund’s liquidation unless the Fund is reorganized or is a party to a merger in which the surviving entity is successor to the accounting and performance information of a Fund.
At September 30, 2020, the Fund’s expiration of reimbursements subject to recoupment is as follows:
| | | | |
Expiration Period | | U.S. Equity | |
| |
2-3 years | | | $14,467 | |
| | | | |
| |
Total | | | $14,467 | |
| | | | |
The Trust, on behalf of the Funds, has entered into an amended and restated Administration Agreement under which the Investment Manager serves as the Funds’ administrator (the “Administrator”) and is responsible for all non-portfolio management aspects of managing the Funds’ operations, including administration and shareholder services to each Fund. Each Fund pays a fee to the Administrator at the rate of 0.15% per annum of the Fund’s average daily net assets for this service.
The Funds are distributed by AMG Distributors, Inc. (the “Distributor”), a wholly-owned subsidiary of the Investment Manager. The Distributor serves as the distributor and underwriter for each Fund and is a registered broker-dealer and member of the Financial Industry Regulatory Authority, Inc. (“FINRA”). Shares of each Fund will be continuously offered and will be sold directly to prospective purchasers and through brokers, dealers or other financial intermediaries who have executed selling agreements with the Distributor. Generally the Distributor bears all or a portion of the expenses of providing services pursuant to the distribution agreement, including the payment of the expenses relating to the distribution of prospectuses for sales purposes and any advertising or sales literature.
The Trust has adopted a distribution and service plan (the “Plan”) with respect to the Class N shares of each Fund, in accordance with the requirements of Rule 12b-1 under the 1940 Act and the requirements of the applicable rules of FINRA regarding asset-based sales charges. Pursuant to the Plan, each Fund may make payments to the Distributor for its expenditures in financing any activity primarily intended to result in the sale of each Fund’s Class N shares and for maintenance and personal service provided to existing shareholders of that class. The Plan authorized payments to the Distributor up to 0.25% annually of each Fund’s average daily net assets attributable to the Class N shares. The Plan further provides for periodic payments by the Trust or the Distributor to brokers, dealers and other financial intermediaries for providing shareholder services and for promotional and other sales related costs. The portion of payments made under the plan by Class N shares of each Fund for shareholder servicing may not exceed an annual rate of 0.25% of the average daily net asset value of each Fund’s shares of that class owned by clients of such broker, dealer or financial intermediary.
The Board provides supervision of the affairs of the Trust and other trusts within the AMG Funds Family. The Trustees of the Trust who are not affiliated with the Investment Manager receive an annual retainer and per meeting fees for regular, special and telephonic meetings, and they are reimbursed for out-of-pocket expenses incurred while carrying out their duties as Board members. The Chairman of the Board and the Audit Committee Chair receive additional annual
retainers. Certain Trustees and Officers of the Funds are Officers and/or Directors of the Investment Manager, AMG and/or the Distributor.
The Securities and Exchange Commission (the “SEC”) granted an exemptive order that permits the Funds to lend and borrow money for certain temporary purposes directly to and from other eligible funds in the AMG Funds Family. Participation in this interfund lending program is voluntary for both the borrowing and lending funds, and an interfund loan is only made if it benefits each participating fund. The Administrator manages the program according to procedures approved by the Board, and the Board monitors the operation of the program. An interfund loan must comply with certain conditions set out in the exemptive order, which are designed to assure fairness and protect all participating funds. The interest earned and interest paid on interfund loans are included on the Statement of Operations as interest income and miscellaneous expense, respectively. At September 30, 2020, the Funds had no interfund loans outstanding.
The following Funds utilized the interfund loan program during the fiscal year ended September 30, 2020:
| | | | | | | | | | | | | | | | |
| Fund | | Average Lent | | | Number of Days | | | Interest Earned | | | Average Interest Rate | |
| | | | |
Small Cap | | | $2,399,763 | | | | 10 | | | | $1,042 | | | | 1.585% | |
| | | | |
| Fund | | Average Borrowed | | | Number of Days | | | Interest Paid | | | Average Interest Rate | |
| | | | |
U.S. Equity | | | $7,040,065 | | | | 10 | | | | $3,536 | | | | 1.833% | |
3. PURCHASES AND SALES OF SECURITIES
Purchases and sales of securities (excluding short-term securities and U.S. Government Obligations) for the fiscal year ended September 30, 2020, were as follows:
| | | | | | | | |
| | | Long Term Securities | |
| | |
| Fund | | Purchases | | | Sales | |
| | |
Small Cap | | | $57,194,294 | | | | $35,341,418 | |
| | |
U.S. Equity | | | 6,124,556 | | | | 54,910,499 | |
The Funds had no purchases or sales of U.S. Government Obligations during the fiscal year ended September 30, 2020.
4. PORTFOLIO SECURITIES LOANED
The Funds participate in the Program providing for the lending of securities to qualified borrowers. Securities lending income includes earnings of such temporary cash investments, plus or minus any rebate to a borrower. These earnings (after any rebate) are then divided between BNYM, as a fee for its services under the Program, and the Funds, according to agreed-upon rates. Collateral on all securities loaned is accepted in cash, U.S. Treasury Obligations or U.S. Government Agency Obligations. Collateral is maintained at a minimum level of 102% (105% in the case of certain foreign securities) of the market value, plus interest, if applicable, of investments on loan. It is the Funds’ policy to obtain additional collateral from or return excess collateral to the borrower by the end of the next business day, following the valuation date of the securities loaned. Therefore, the value of the collateral held may be temporarily less than the value of the securities on loan. Lending securities entails a risk of loss to the Funds if and to the extent that the market value of the securities loaned were to increase and
| | | | |
| | | | | |
| | | | | |
| | | Notes to Financial Statements (continued) | | |
the borrower did not increase the collateral accordingly, and the borrower fails to return the securities. Under the terms of the Program, the Funds are indemnified for such losses by BNYM. Cash collateral is held in separate omnibus accounts managed by BNYM, who is authorized to exclusively enter into joint repurchase agreements for that cash collateral. Securities collateral is held in separate omnibus accounts managed by BNYM that cannot be sold or pledged. BNYM bears the risk of any deficiency in the amount of the cash collateral available for return to the borrower due to any loss on the collateral invested. Loans of securities are terminable at any time and the borrower, after notice, is required to return borrowed securities as soon as practical, which is normally within three business days.
The value of securities loaned on positions held, cash collateral and securities collateral received at September 30, 2020, were as follows:
| | | | | | | | | | | | | | | | |
| Fund | | Securities Loaned | | | Cash Collateral Received | | | Securities Collateral Received | | | Total Collateral Received | |
| | | | |
Small Cap | | | $4,668,940 | | | | $468,210 | | | | $4,304,166 | | | | $4,772,376 | |
| | | | |
U.S. Equity | | | 3,672,974 | | | | 88,845 | | | | 3,672,436 | | | | 3,761,281 | |
The following table summarizes the securities received as collateral for securities lending at September 30, 2020:
| | | | | | | | | | |
| Fund | | Collateral Type | | | Coupon Range | | Maturity Date Range | |
Small Cap | | | U.S. Treasury Obligations | | | 0.000%-3.875% | | | 10/08/20-05/15/49 | |
U.S. Equity | | | U.S. Treasury Obligations | | | 0.000%-8.000% | | | 10/08/20-02/15/50 | |
5. COMMITMENTS AND CONTINGENCIES
Under the Trust’s organizational documents, its trustees and officers are indemnified against certain liabilities arising out of the performance of their duties to the Trust. In addition, in the normal course of business, the Funds may enter into contracts and agreements that contain a variety of representations and warranties, which provide general indemnifications. The maximum exposure to the Funds under these arrangements is unknown, as this would involve future claims that may be made against a Fund that have not yet occurred. However, based on experience, the Funds had no prior claims or losses and expect the risks of loss to be remote.
6. MASTER NETTING AGREEMENTS
The Funds may enter into master netting agreements with their counterparties for the securities lending program and Repurchase Agreements, which provide the right, in the event of default (including bankruptcy or insolvency) for the non-defaulting party to liquidate the collateral and calculate net exposure to the defaulting party or request additional collateral. For financial reporting purposes, the Funds do not offset financial assets and financial liabilities that are subject to master netting agreements in the Statement of Assets and Liabilities. For securities lending transactions, see Note 4.
The following table is a summary of the Funds’ open Repurchase Agreements that are subject to a master netting agreement as of September 30, 2020:
| | | | | | | | | | | | | | | | | | | | |
| | | | | | Gross Amount Not Offset in the
Statement of Assets and Liabilities | | | | | | | |
| | | | | |
| Fund | | Gross Amounts of Assets Presented in the Statement of Assets and Liabilities | | | Offset Amount | | | Net Asset Balance | | | Collateral Received | | | Net Amount | |
| | | | | |
Small Cap | | | | | | | | | | | | | | | | | | | | |
| | | | | |
Citibank N.A. | | | $468,210 | | | | — | | | | $468,210 | | | | $468,210 | | | | — | |
| | | | | |
U.S. Equity | | | | | | | | | | | | | | | | | | | | |
| | | | | |
Mizuho Securities USA, LLC | | | $88,845 | | | | — | | | | $88,845 | | | | $88,845 | | | | — | |
| | |
7. SUBSEQUENT EVENTS The Funds have determined that no material events or transactions occurred through the issuance date of the Funds’ financial statements which require an additional disclosure in or adjustment of the Funds’ financial statements. | | |
| | | | |
| | | | | |
| | | | | |
| | | Report of Independent Registered Public Accounting Firm | | |
TO THE BOARD OF TRUSTEES OF AMG FUNDS AND SHAREHOLDERS OF AMG SOUTHERNSUN SMALL CAP FUND AND AMG SOUTHERNSUN U.S. EQUITY FUND
Opinions on the Financial Statements
We have audited the accompanying statements of assets and liabilities, including the schedules of portfolio investments, of AMG SouthernSun Small Cap Fund and AMG SouthernSun U.S. Equity Fund (two of the funds constituting AMG Funds, hereafter collectively referred to as the “Funds”) as of September 30, 2020, the related statements of operations for the year ended September 30, 2020, the statements of changes in net assets for each of the two years in the period ended September 30, 2020, including the related notes, and the financial highlights for each of the five years in the period ended September 30, 2020 (collectively referred to as the “financial statements”). In our opinion, the financial statements present fairly, in all material respects, the financial position of each of the Funds as of September 30, 2020, the results of each of their operations for the year then ended, the changes in each of their net assets for each of the two years in the period ended September 30, 2020 and each of the financial highlights for each of the five years in the period ended September 30, 2020 in conformity with accounting principles generally accepted in the United States of America.
Basis for Opinions
These financial statements are the responsibility of the Funds’ management. Our responsibility is to express an opinion on the Funds’ financial statements based on our audits. We are a public accounting firm registered with the Public Company Accounting Oversight Board (United States) (PCAOB) and are required to be independent with respect to the Funds in accordance with the U.S. federal securities laws and the applicable rules and regulations of the Securities and Exchange Commission and the PCAOB.
We conducted our audits of these financial statements in accordance with the standards of the PCAOB. Those standards require that we plan and perform the audit to obtain reasonable assurance about whether the financial statements are free of material misstatement, whether due to error or fraud.
Our audits included performing procedures to assess the risks of material misstatement of the financial statements, whether due to error or fraud, and performing procedures that respond to those risks. Such procedures included examining, on a test basis, evidence regarding the amounts and disclosures in the financial statements. Our audits also included evaluating the accounting principles used and significant estimates made by management, as well as evaluating the overall presentation of the financial statements. Our procedures included confirmation of securities owned as of September 30, 2020 by correspondence with the custodian and brokers; when replies were not received from brokers, we performed other auditing procedures. We believe that our audits provide a reasonable basis for our opinions.
PricewaterhouseCoopers LLP
Boston, MA
November 24, 2020
We have served as the auditor of one or more investment companies in AMG Funds Family since 1993.
| | | | |
| | | | | |
| | | Other Information (unaudited) | | |
| | | | | |
TAX INFORMATION
AMG SouthernSun Small Cap Fund and AMG SouthernSun U.S. Equity Fund each hereby designates the maximum amount allowable of its net taxable income as qualified dividends as provided in the Jobs and Growth Tax Relief Reconciliation Act of 2003. The 2019/2020 Form 1099-DIV you receive for each Fund will show the tax status of all distributions paid to you during the year.
Pursuant to section 852 of the Internal Revenue Code, AMG SouthernSun Small Cap Fund and AMG SouthernSun U.S. Equity Fund each hereby designates $7,878,348 and $0, respectively, as a capital gain distribution with respect to the taxable year ended September 30, 2020, or if subsequently determined to be different, the net capital gains of such fiscal year.
| | | | |
| | | | | |
| | | AMG Funds | | |
| | | Trustees and Officers | | |
| | | | |
The Trustees and Officers of the Trust, their
business addresses, principal occupations for
the past five years and ages are listed below.
The Trustees provide broad supervision over
the affairs of the Trust and the Funds. The
Trustees are experienced executives who meet
periodically throughout the year to oversee the
Funds’ activities, review contractual
arrangements with companies that provide
services to the Funds, and | | review the Funds’ performance. Unless
otherwise noted, the address of each
Trustee or Officer is the address of the Trust:
600 Steamboat Road, Suite 300, Greenwich,
Connecticut 06830. There is no stated term of office for Trustees.
Trustees serve until their resignation,
retirement or removal in | | accordance with the Trust’s organizational
documents and policies adopted by the
Board from time to time. The Chairman of
the Trustees, President, Treasurer and
Secretary of the Trust are elected by the
Trustees annually. Other officers hold office
at the pleasure of the Trustees. |
Independent Trustees
The following Trustees are not “interested persons” of the Trust within the meaning of the 1940 Act:
| | |
| | |
Number of Funds Overseen in Fund Complex | | Name, Age, Principal Occupation(s) During Past 5 Years and Other Directorships Held by Trustee |
| |
• Trustee since 2012 • Oversees 49 Funds in Fund Complex | | Bruce B. Bingham, 71 Partner, Hamilton Partners (real estate development firm) (1987-2020); Director of The Yacktman Funds (2000-2012). Trustee of AMG Funds since 2012. |
| |
• Trustee since 1999 • Oversees 49 Funds in Fund Complex | | Edward J. Kaier, 75 Attorney at Law and Partner, Teeters Harvey Marrone & Kaier LLP (2007-Present); Attorney at Law and Partner, Hepburn Willcox Hamilton & Putnam, LLP (1977-2007); Trustee of Third Avenue Trust (2002-2019); Trustee of Third Avenue Variable Trust (2002-2019). |
| |
• Trustee since 2013 • Oversees 52 Funds in Fund Complex | | Kurt A. Keilhacker, 57 Managing Partner, TechFund Capital (1997-Present); Managing Partner, TechFund Europe (2000-Present); Board Member, 6wind SA, (2002-2019); Managing Partner, Elementum Ventures (2013-Present); Director, Pantheon Funds (2014-Present); Director, MetricStory, Inc. (2017-Present); Trustee, Wheaton College (2018-Present); Trustee, Gordon College (2001-2016). |
| |
• Trustee since 2000 • Oversees 49 Funds in Fund Complex | | Steven J. Paggioli, 70 Independent Consultant (2002-Present); Trustee, Professionally Managed Portfolios (28 portfolios); Advisory Board Member, Sustainable Growth Advisors, LP; Independent Director, Muzinich BDC, Inc. (business development company) (2019-Present); Director, The Wadsworth Group; Independent Director, Chase Investment Counsel (2008–2019); Executive Vice President, Secretary and Director, Investment Company Administration, LLC and First Fund Distributors, INC. (1990-2001). |
| |
• Trustee since 2013 • Oversees 49 Funds in Fund Complex | | Richard F. Powers III, 74 Adjunct Professor, U.S. Naval War College (2016-Present); Adjunct Professor, Boston College (2011-2015); Director, Ameriprise Financial Inc. (2005-2009); President and CEO of Van Kampen Investments Inc. (1998-2003); President, Morgan Stanley Client Group (2000-2002); Executive Vice President and Chief Marketing Officer of the Morgan Stanley Individual Investor Group (1984-1998). |
| |
• Independent Chairman • Trustee since 2000 • Oversees 52 Funds in Fund Complex | | Eric Rakowski, 62 Professor of Law, University of California at Berkeley School of Law (1990-Present); Tax Attorney at Davis Polk & Wardwell and clerked for Judge Harry T. Edwards of the U.S. Court of Appeals for the District of Columbia Circuit and for Justice William J. Brennan Jr. of the U.S. Supreme Court; Director of Harding, Loevner Funds, Inc. (9 portfolios); Trustee of Third Avenue Trust (2002-2019); Trustee of Third Avenue Variable Trust (2002-2019). |
| |
• Trustee since 2013 • Oversees 52 Funds in Fund Complex | | Victoria L. Sassine, 55 Adjunct Professor, Babson College (2007–Present); Director, Board of Directors, PRG Group (2017-Present); Chairperson of the Board of Directors of Business Management Associates (2018 to 2019); CEO, Founder, Scale Smarter Partners, LLC (2018-Present); Teaching Fellow, Goldman Sachs 10,000 Small Business Initiative (2010-Present); Chairperson, Board of Directors, Business Management Associates (2018-Present). |
| |
• Trustee since 2004 • Oversees 49 Funds in Fund Complex | | Thomas R. Schneeweis, 73 Professor Emeritus, University of Massachusetts (2013-Present); President, TRS Associates (1982-Present); Board Member, Chartered Alternative Investment Association (“CAIA”) (2002-Present); Director, CAIA Foundation (2010-2019); Director, Institute for Global Asset and Risk Management (Education) (2010-Present); Co-Owner, Quantitative Investment Technologies (2014-Present); Co-Owner, Yes Wealth Management (2018-Present); Director of Research, Yes Wealth Management (2018-Present); Partner, S Capital Wealth Advisors (2015-2018); Partner, S Capital Management, LLC (2007-2015); President, Alternative Investment Analytics, LLC, (formerly Schneeweis Partners, LLC) (2001-2013); Finance Professor, University of Massachusetts (1977-2013). |
| | | | |
| | | | | |
| | | AMG Funds | | |
| | | Trustees and Officers (continued) | | |
Interested Trustees
Each Trustee in the following table is an “interested person” of the Trust within the meaning of the 1940 Act. Ms. Carsman is an interested person of the Trust within the meaning of the 1940 Act by virtue of her position with, and interest in securities of, AMG.
| | |
Number of Funds Overseen in Fund Complex | | Name, Age, Principal Occupation(s) During Past 5 Years and Other Directorships Held by Trustee |
| |
• Trustee since 2011 • Oversees 52 Funds in Fund Complex | | Christine C. Carsman, 68 Senior Policy Advisor, Affiliated Managers Group, Inc. (2019-Present); Deputy General Counsel, Affiliated Managers Group, Inc. (2011-2018); Vice President (2004 to 2007), Senior Vice President (2007 - 2016), Executive Vice President (2017 - 2018) and Chief Regulatory Counsel (2004 to 2018), Affiliated Managers Group, Inc. (2004 - 2011); Senior Counsel, Vice President and Director of Operational Risk Management and Compliance, Wellington Management Company, LLP (1995 - 2004); Director of Harding, Loevner Funds, Inc. (9 portfolios); Secretary and Chief Legal Officer, AMG Funds, AMG Funds I, AMG Funds II and AMG Funds III (2004-2011). |
| |
| Officers | | |
| | |
Position(s) Held with Fund and Length of Time Served | | Name, Age, Principal Occupation(s) During Past 5 Years |
| |
• President since 2018 • Principal Executive Officer since 2018 • Chief Executive Officer since 2018 • Chief Operating Officer since 2007 | | Keitha L. Kinne, 62 Chief Operating Officer, AMG Funds LLC (2007-Present); Chief Investment Officer, AMG Funds LLC (2008-Present); President and Principal, AMG Distributors, Inc. (2018-Present); Chief Operating Officer, AMG Distributors, Inc. (2007-Present); President, Chief Executive Officer and Principal Executive Officer, AMG Funds, AMG Funds I, AMG Funds II, AMG Funds III and AMG Funds IV (2018-Present); Chief Operating Officer, AMG Funds, AMG Funds I, AMG Funds II, and AMG Funds III (2007-Present); Chief Operating Officer, AMG Funds IV (2016-Present); Chief Operating Officer and Chief Investment Officer, Aston Asset Management, LLC (2016); President and Principal Executive Officer, AMG Funds, AMG Funds I, AMG Funds II and AMG Funds III (2012-2014); Managing Partner, AMG Funds LLC (2007-2014); President and Principal, AMG Distributors, Inc. (2012-2014); Managing Director, Legg Mason & Co., LLC (2006-2007); Managing Director, Citigroup Asset Management (2004-2006). |
| |
• Secretary since 2015 • Chief Legal Officer since 2015 | | Mark J. Duggan, 55 Senior Vice President and Senior Counsel, AMG Funds LLC (2015-Present); Secretary and Chief Legal Officer, AMG Funds, AMG Funds I, AMG Funds II, AMG Funds III and AMG Funds IV (2015-Present); Attorney, K&L Gates, LLP (2009-2015). |
| |
• Chief Financial Officer since 2017 • Treasurer since 2017 • Principal Financial Officer since 2017 • Principal Accounting Officer since 2017 | | Thomas G. Disbrow, 54 Vice President, Mutual Fund Treasurer & CFO, AMG Funds, AMG Funds LLC (2017-Present); Chief Financial Officer, Principal Financial Officer, Treasurer and Principal Accounting Officer, AMG Funds, AMG Funds I, AMG Funds II, AMG Funds III and AMG Funds IV (2017-Present); Managing Director - Global Head of Traditional Funds Product Control, UBS Asset Management (Americas), Inc. (2015-2017); Managing Director - Head of North American Funds Treasury, UBS Asset Management (Americas), Inc. (2011-2015). |
| |
• Deputy Treasurer since 2017 | | John A. Starace, 49 Director, Mutual Fund Accounting, AMG Funds LLC (2017-Present); Vice President, Deputy Treasurer of Mutual Funds Services, AMG Funds LLC (2014-2017); Deputy Treasurer, AMG Funds, AMG Funds I, AMG Funds II, AMG Funds III and AMG Funds IV (2017-Present); Vice President, Citi Hedge Fund Services (2010-2014); Audit Senior Manager (2005-2010) and Audit Manager (2001-2005), Deloitte & Touche LLP. |
| |
• Chief Compliance Officer since 2019 | | Patrick J. Spellman, 46 Vice President, Chief Compliance Officer, AMG Funds LLC (2017-Present); Chief Compliance Officer and Sarbanes-Oxley Code of Ethics Compliance Officer, AMG Funds, AMG Funds I, AMG Funds II, AMG Funds III and AMG Funds IV (2019-Present); Chief Compliance Officer, AMG Distributors, Inc., (2010-Present); Senior Vice President, Chief Compliance Officer, AMG Funds LLC (2011-2017); Anti-Money Laundering Compliance Officer, AMG Funds, AMG Funds I, AMG Funds II, and AMG Funds III (2014-2019); Anti-Money Laundering Officer, AMG Funds IV, (2016-2019); Compliance Manager, Legal and Compliance, Affiliated Managers Group, Inc. (2005-2011). |
| |
• Assistant Secretary since 2016 | | Maureen A. Meredith, 35 Vice President, Counsel, AMG Funds LLC (2019-Present); Director, Counsel, AMG Funds LLC (2017-2018); Vice President, Counsel, AMG Funds LLC (2015-2017); Assistant Secretary, AMG Funds, AMG Funds I, AMG Funds II, AMG Funds III and AMG Funds IV (2016-Present); Associate, Ropes & Gray LLP (2011-2015); Law Fellow, Massachusetts Appleseed Center for Law and Justice (2010-2011). |
| |
• Anti-Money Laundering Compliance Officer since 2019 | | Hector D. Roman, 42 Director, Legal and Compliance, AMG Funds LLC (2020-Present); Manager, Legal and Compliance, AMG Funds LLC (2017-2019); Director of Compliance, Morgan Stanley Investment Management (2015-2017); Senior Advisory, PricewaterhouseCoopers LLP (2014-2015); Risk Manager, Barclays Investment Bank (2008-2014); Anti-Money Laundering Compliance Officer, AMG Funds, AMG Funds I, AMG Funds II, AMG Funds III and AMG Funds IV (2019-Present). |
| | | | |
| | | | | |
| | | | | |
| | | Annual Renewal of Investment Management and Subadvisory Agreements | | |
| | | | |
AMG SouthernSun Small Cap Fund and AMG SouthernSun U.S. Equity Fund: Approval of Investment Management Agreement and Subadvisory Agreements on June 24-25, 2020 At meetings held via telephone and video conference on June 24 and June 25, 2020,1 the Board of Trustees (the “Board” or the “Trustees”), and separately a majority of the Trustees who are not “interested persons” of the AMG Funds (the “Trust”) (the “Independent Trustees”), approved (i) the Investment Management Agreement, as amended pursuant to letter agreements at any time prior to the date of the meeting, with AMG Funds LLC (the “Investment Manager”) for each of AMG SouthernSun Small Cap Fund and AMG SouthernSun U.S. Equity Fund (each, a “Fund,” and collectively, the “Funds”) and separately each of Amendment No. 1 thereto dated July 1, 2015, and Amendment No. 2 thereto dated October 1, 2016 (collectively, the “Investment Management Agreement”), (ii) the existing Subadvisory Agreement dated March 31, 2014, as amended at any time prior to the date of the meeting, between the Investment Manager and SouthernSun Asset Management, LLC (“SouthernSun” or the “Subadviser”) with respect to each Fund (the “Existing Subadvisory Agreement”), and (iii) a new Subadvisory Agreement between the Investment Manager and SouthernSun with respect to each Fund (the “New Subadvisory Agreement” and, together with the Existing Subadvisory Agreement, the “Subadvisory Agreements”). The New Subadvisory Agreement was presented for approval because the Existing Subadvisory Agreement was expected to terminate in connection with SouthernSun’s agreement with Affiliated Managers Group, Inc. (“AMG”) to acquire AMG’s interest in SouthernSun (the “Transaction”). The Independent Trustees were separately represented by independent legal counsel in connection with their consideration of the approval of these agreements. In considering the Investment Management Agreement and the Subadvisory Agreements, the Trustees reviewed a variety of materials relating to each Fund, the Investment Manager and the Subadviser, including the nature, extent and quality of services, comparative performance, fee and expense information for an appropriate peer group of similar mutual funds for each Fund (each, a “Peer Group”), performance information for the relevant benchmark index for each Fund (each, a “Fund Benchmark”), other relevant matters, and other information provided to them on a periodic basis throughout the year. Prior to voting, the Independent Trustees: (a) reviewed the foregoing information with their independent legal | | counsel; (b) received materials from their independent legal counsel discussing the legal standards applicable to their consideration of the Investment Management Agreement and Subadvisory Agreements; and (c) met with their independent legal counsel in private sessions at which no representatives of management were present. NATURE, EXTENT AND QUALITY OF SERVICES. In considering the nature, extent and quality of the services provided by the Investment Manager, the Trustees reviewed information relating to the Investment Manager’s operations and personnel. Among other things, the Investment Manager provided financial information, information about its supervisory and professional staff and descriptions of its organizational and management structure. The Trustees also took into account information provided periodically throughout the previous year by the Investment Manager in Board meetings relating to the performance of its duties with respect to the Funds and the Trustees’ knowledge of the Investment Manager’s management and the quality of the performance of the Investment Manager’s duties under the Investment Management Agreement and Administration Agreement. In the course of their deliberations regarding the Investment Manager, the Trustees evaluated, among other things: (a) the extent and quality of the Investment Manager’s oversight of the operation and management of the Funds; (b) the quality of the Investment Manager’s oversight of the performance by the Subadviser of its portfolio management duties; (c) the Investment Manager’s ability to supervise the Funds’ other service providers; and (d) the Investment Manager’s compliance program. The Trustees also took into account that, in performing its functions under the Investment Management Agreement and supervising the Subadviser, the Investment Manager: performs periodic detailed analyses and reviews of the performance by the Subadviser of its obligations to each Fund, including without limitation, analysis and review of portfolio and other compliance matters and review of the Subadviser’s investment performance with respect to each Fund; prepares and presents periodic reports to the Board regarding the investment performance of the Subadviser and other information regarding the Subadviser, at such times and in such forms as the Board may reasonably request; reviews and considers any changes in the personnel of the Subadviser responsible for performing the Subadviser’s obligations and makes appropriate reports to the Board; reviews and considers any changes in the ownership or senior management of the Subadviser and makes | | appropriate reports to the Board; performs periodic in-person or telephonic diligence meetings, including with respect to compliance matters, with representatives of the Subadviser; assists the Board and management of the Trust in developing and reviewing information with respect to the initial approval of each Subadvisory Agreement and annual consideration of each Subadvisory Agreement thereafter; prepares recommendations with respect to the continued retention of the Subadviser or the replacement of the Subadviser, including at the request of the Board; identifies potential successors to, or replacements of, the Subadviser or potential additional subadvisers, including performing appropriate due diligence, and developing and presenting to the Board a recommendation as to any such successor, replacement, or additional subadviser, including at the request of the Board; designates and compensates from its own resources such personnel as the Investment Manager may consider necessary or appropriate to the performance of its services; and performs such other review and reporting functions as the Board shall reasonably request consistent with the Investment Management Agreement and applicable law. The Trustees noted the affiliation of the Subadviser with the Investment Manager, noting any potential conflicts of interest. The Trustees also took into account the financial condition of the Investment Manager with respect to its ability to provide the services required under the Investment Management Agreement and the Investment Manager’s undertaking to maintain contractual expense limitations for the Funds. The Trustees also considered the Investment Manager’s risk management processes. The Trustees also reviewed information relating to the Subadviser’s operations and personnel and the investment philosophy, strategies and techniques (its “Investment Strategy”) used in managing each Fund. The Trustees reviewed information relating to the Transaction and the role of current SouthernSun personnel under the New Subadvisory Agreement following the Transaction and noted that the role of such personnel would be identical. Among other things, the Trustees reviewed information on portfolio management and other professional staff, information regarding the Subadviser’s organizational and management structure and the Subadviser’s brokerage policies and practices. The Trustees considered specific information provided regarding the experience of the individuals at the Subadviser with portfolio management responsibility for each Fund, including the information set forth in each Fund’s prospectus and statement of additional information. In the course of their deliberations, the |
| | | | |
| | | | | |
| | | | | |
| | | Annual Renewal of Investment Management and Subadvisory Agreements (continued) | | |
| | | | |
Trustees evaluated, among other things: (a) the services rendered by the Subadviser in the past; (b) the qualifications and experience of the Subadviser’s personnel; and (c) the Subadviser’s compliance program. The Trustees also took into account the financial condition of the Subadviser with respect to its ability to provide the services required under each Subadvisory Agreement. The Trustees also considered the Subadviser’s risk management processes. PERFORMANCE. The Board considered each Fund’s net performance during relevant time periods as compared to the Fund’s Peer Group and Fund Benchmark and considered the gross performance of the Fund as compared to the Subadviser’s relevant performance composite that utilizes the same investment strategy and approach and noted that the Board reviews on a quarterly basis detailed information about both the Fund’s performance results and portfolio composition, as well as the Subadviser’s Investment Strategy. The Board was mindful of the Investment Manager’s expertise, resources and attention to monitoring the Subadviser’s performance, investment style and risk-adjusted performance with respect to the Funds and its discussions with the Subadviser’s management regarding the factors that contributed to the performance of the Funds. With respect to AMG SouthernSun Small Cap Fund, among other information relating to the Fund’s performance (including the predecessor fund’s performance for periods prior to its acquisition by the Trust on March 31, 2014), the Trustees noted that the Fund’s performance for Class N shares (which share class has the earliest inception date of all the share classes of the Fund) for the 1-year, 3-year, 5-year and 10-year periods ended March 31, 2020 was above, below, below, and below, respectively, the median performance of the Peer Group and below the performance of the Fund Benchmark, the Russell 2000® Index. The Trustees took into account management’s discussion of the Fund’s performance, including the reasons for the Fund’s underperformance relative to the Fund Benchmark and its Peer Group. The Trustees concluded that the Fund’s overall performance has been satisfactory in light of the Fund’s investment objective, strategies and policies. With respect to AMG SouthernSun U.S. Equity Fund, among other information relating to the Fund’s performance (including the predecessor fund’s performance for periods prior to its acquisition by the Trust on March 31, 2014), the Trustees noted that the Fund’s performance for Class I shares (which | | share class has the largest amount of assets of all the share classes of the Fund) for the 1-year, 3-year and 5-year periods ended March 31, 2020 and for the period from the Fund’s inception on April 10, 2012 through March 31, 2020 was below the median performance of the Peer Group and below the performance of the Fund Benchmark, the Russell 2500® Index. The Trustees took into account management’s discussion of the Fund’s performance, including the reasons for the Fund’s underperformance relative to the Fund Benchmark and its Peer Group. The Trustees concluded that the Fund’s overall performance has been satisfactory in light of the Fund’s investment objective, strategies and policies. ADVISORY AND SUBADVISORY FEES; FUND EXPENSES; PROFITABILITY; AND ECONOMIES OF SCALE. In considering the reasonableness of the advisory fee payable to the Investment Manager, the Trustees reviewed information provided by the Investment Manager setting forth all revenues and other benefits, both direct and indirect (including any so-called “fallout benefits” such as reputational value derived from the Investment Manager serving as Investment Manager to a Fund), received by the Investment Manager and its affiliates attributable to managing each Fund and all the mutual funds in the AMG Funds Family of Funds; the cost of providing such services; the significant risks undertaken as Investment Manager and sponsor of the Funds, including investment, operational, enterprise, entrepreneurial, litigation, regulatory and compliance risks; and the resulting profitability to the Investment Manager and its affiliates from these relationships. The Trustees also considered the amount of the advisory fee retained by the Investment Manager after payment of the subadvisory fee with respect to each Fund. The Trustees also noted payments made or to be made from the Subadviser to the Investment Manager, and other payments made or to be made from the Investment Manager to the Subadviser. The Trustees also considered management’s discussion of the current asset levels of the Funds, and the impact on profitability of both the current asset levels and any future growth of assets of the Funds. In considering the cost of services to be provided by the Investment Manager under the Investment Management Agreement and the profitability to the Investment Manager of its relationship with the Funds, the Trustees noted the undertaking by the Investment Manager to maintain contractual expense limitations for the Funds. The Board also took into account management’s discussion of the advisory fee structure, and the services the | | Investment Manager provides in performing its functions under the Investment Management Agreement and supervising the Subadviser. Based on the foregoing, the Trustees concluded that the profitability to the Investment Manager is reasonable and that the Investment Manager is not realizing material benefits from economies of scale that would warrant adjustments to the advisory fee at this time. Also with respect to economies of scale, the Trustees noted that as each Fund’s assets increase over time, the Fund may realize other economies of scale to the extent the increase in assets is proportionally greater than the increase in certain other expenses. In considering the reasonableness of the subadvisory fees payable by the Investment Manager to the Subadviser, the Trustees reviewed information regarding the cost of providing subadvisory services to each Fund and the resulting profitability to the Subadviser from these relationships. The Trustees noted that, because the Subadviser is an affiliate of the Investment Manager, a portion of the Subadviser’s revenues or profits might be shared directly or indirectly with the Investment Manager. The Trustees further noted that, effective upon the closing of the Transaction, the Subadviser will no longer be affiliated with the Investment Manager. The Trustees also noted that the subadvisory fees are paid by the Investment Manager out of its advisory fee. The Board also took into account management’s discussion of the subadvisory fee structure, and the services the Subadviser provides in performing its functions under each Subadvisory Agreement. Based on the foregoing, the Trustees concluded that the profitability to the Subadviser is reasonable and that the Subadviser is not realizing material benefits from economies of scale that would warrant adjustments to the subadvisory fees at this time. Also with respect to economies of scale, the Trustees noted that as a Fund’s assets increase over time, the Fund may realize other economies of scale to the extent the increase in assets is proportionally greater than the increase in certain other expenses. With respect to AMG SouthernSun Small Cap Fund, the Trustees noted that the management fees (which include both the advisory and administration fees) and total expenses (net of applicable expense waivers/reimbursements) of Class I shares (the class of shares which is the primary focus of the Fund’s distribution) of the Fund as of March 31, 2020 were both higher than the average for the Fund’s Peer Group. The Trustees took into account the fact that the Investment Manager has contractually agreed, through February 1, 2021, to limit the Fund’s net annual operating expenses (subject to certain |
| | | | |
| | | | | |
| | | | | |
| | | Annual Renewal of Investment Management and Subadvisory Agreements (continued) | | |
| | | | | | | | |
excluded expenses) to 1.25%. The Trustees also took into account management’s discussion of the Fund’s expenses and competitiveness with comparably sized funds and select competitors. The Trustees concluded that, in light of the nature, extent and quality of the services provided by the Investment Manager and the Subadviser (which was an affiliate of the Investment Manager as of June 25, 2020), the foregoing expense limitation and the considerations noted above with respect to the Investment Manager and the Subadviser, the Fund’s advisory and subadvisory fees are reasonable. With respect to AMG SouthernSun U.S. Equity Fund, the Trustees noted that the management fees (which include both the advisory and administration fees) and total expenses (net of applicable expense waivers/reimbursements) of Class I shares of the Fund as of March 31, 2020 were both higher than the average for the Fund’s Peer Group. The Trustees took into account the fact that the Investment Manager has contractually agreed, through February 1, 2021, to limit the Fund’s net annual operating expenses (subject to certain excluded expenses) to 1.09%. The Board also took into account management’s discussion of the Fund’s expenses and competitiveness with comparably sized funds and select competitors. The Trustees concluded that, in light of the nature, extent and quality of the services | | | | provided by the Investment Manager and the Subadviser (which was an affiliate of the Investment Manager as of June 25, 2020), the foregoing expense limitation and the considerations noted above with respect to the Investment Manager and the Subadviser, the Fund’s advisory and subadvisory fees are reasonable. * * * * After consideration of the foregoing, the Trustees also reached the following conclusions (in addition to the conclusions discussed above) regarding the Investment Management Agreement and Subadvisory Agreements: (a) the Investment Manager and the Subadviser have demonstrated that they possess the capability and resources to perform the duties required of them under the Investment Management Agreement and each Subadvisory Agreement and (b) the Investment Manager and Subadviser maintain appropriate compliance programs. Based on all of the above-mentioned factors and their related conclusions, with no single factor or conclusion being determinative and with each Trustee not necessarily attributing the same weight to each factor, the Trustees concluded that approval of the Investment Management Agreement and each Subadvisory Agreement would be in the best | | | | interests of the applicable Fund and its shareholders. Accordingly, on June 24 and 25, 2020, the Trustees, and separately a majority of the Independent Trustees, voted to approve the Investment Management and the Subadvisory Agreements for each Fund. 1 The Trustees determined that the conditions surrounding COVID-19 constituted unforeseen or emergency circumstances and that reliance on the Securities and Exchange Commission’s (“SEC”) exemptive order, which provides relief from the in-person voting requirements of the Investment Company Act of 1940, as amended (the “1940 Act”), in certain circumstances (the “In-Person Relief”), was necessary or appropriate due to the circumstances related to current or potential effects of COVID-19. The Trustees unanimously wished to rely on the In-Person Relief with respect to the approval of those matters on the agenda for the June 24-25, 2020 meetings that would otherwise require in-person votes under the 1940 Act. The Trustees, including a majority of the Trustees who are not “interested persons” of AMG Funds, undertook to ratify the actions taken pursuant to the In-Person Relief at the Board’s next in-person meeting, consistent with the requirements of the In-Person Relief. See Investment Company Release No. 33897 (June 19, 2020). This exemptive order supersedes, in part, a similar, earlier exemptive order issued by the SEC (Investment Company Release No. 33824 (March 25, 2020)). |
THIS PAGE INTENTIONALLY LEFT BLANK
THIS PAGE INTENTIONALLY LEFT BLANK

| | | | |
INVESTMENT MANAGER AND ADMINISTRATOR AMG Funds LLC 600 Steamboat Road, Suite 300 Greenwich, CT 06830 800.548.4539 DISTRIBUTOR AMG Distributors, Inc. 600 Steamboat Road, Suite 300 Greenwich, CT 06830 800.548.4539 SUBADVISER SouthernSun Asset Management, LLC 6070 Poplar Avenue Suite 300 Memphis, TN 38119 CUSTODIAN The Bank of New York Mellon 111 Sanders Creek Parkway East Syracuse, NY 13057 | | LEGAL COUNSEL Ropes & Gray LLP Prudential Tower, 800 Boylston Street Boston, MA 02199-3600 TRANSFER AGENT BNY Mellon Investment Servicing (US) Inc. Attn: AMG Funds 4400 Computer Drive Westborough, MA 01581 800.548.4539 | | This report is prepared for the Funds’ shareholders. It is authorized for distribution to prospective investors only when preceded or accompanied by an effective prospectus. To receive a free copy of the prospectus or Statement of Additional Information, which includes additional information about Fund Trustees, please contact us by calling 800.548.4539. Distributed by AMG Distributors, Inc., member FINRA/SIPC. Current net asset values per share for each Fund are available on the Funds’ website at amgfunds.com. A description of the policies and procedures each Fund uses to vote its proxies is available: (i) without charge, upon request, by calling 800.548.4539, or (ii) on the Securities and Exchange Commission’s (SEC) website at sec.gov. For information regarding the Funds’ proxy voting record for the 12-month period ended June 30, call 800.548.4539 or visit the SEC website at sec.gov. The Funds file their complete schedule of portfolio holdings with the SEC for the first and third quarters of each fiscal year as an exhibit to their reports on Form N-PORT. The Funds’ portfolio holdings on Form N-PORT are available on the SEC’s website at sec.gov. To review a complete list of the Funds’ portfolio holdings, or to view the most recent semiannual report or annual report, please visit amgfunds.com. |
| | | | |
AFFILIATE SUBADVISED FUNDS BALANCED FUNDS AMG GW&K Global Allocation GW&K Investment Management, LLC AMG FQ Global Risk-Balanced First Quadrant, L.P. EQUITY FUNDS AMG FQ Tax-Managed U.S. Equity AMG FQ Long-Short Equity First Quadrant, L.P. AMG Frontier Small Cap Growth Frontier Capital Management Co., LLC AMG GW&K Small Cap Core AMG GW&K Small/Mid Cap AMG GW&K Mid Cap AMG GW&K Emerging Markets Equity AMG GW&K Emerging Wealth Equity AMG GW&K International Small Cap Fund GW&K Investment Management, LLC AMG Renaissance Large Cap Growth The Renaissance Group LLC AMG River Road Dividend All Cap Value AMG River Road Focused Absolute Value AMG River Road Long-Short AMG River Road Small-Mid Cap Value AMG River Road Small Cap Value River Road Asset Management, LLC | | AMG TimesSquare Emerging Markets Small Cap AMG TimesSquare Global Small Cap AMG TimesSquare International Small Cap AMG TimesSquare Mid Cap Growth AMG TimesSquare Small Cap Growth TimesSquare Capital Management, LLC AMG Yacktman AMG Yacktman Focused AMG Yacktman Focused Fund - Security Selection Only AMG Yacktman Special Opportunities Yacktman Asset Management LP FIXED INCOME FUNDS AMG GW&K Core Bond ESG AMG GW&K Enhanced Core Bond ESG AMG GW&K Municipal Bond AMG GW&K Municipal Enhanced Yield GW&K Investment Management, LLC OPEN-ARCHITECTURE FUNDS EQUITY FUNDS AMG Managers Brandywine AMG Managers Brandywine Blue Friess Associates, LLC AMG Managers CenterSquare Real Estate CenterSquare Investment Management LLC | | AMG Managers Emerging Opportunities WEDGE Capital Management L.L.P. Next Century Growth Investors LLC RBC Global Asset Management (U.S.) Inc. AMG Managers Fairpointe Mid Cap Fairpointe Capital LLC AMG Managers LMCG Small Cap Growth LMCG Investments, LLC AMG Managers Montag & Caldwell Growth Montag & Caldwell, LLC AMG Managers Pictet International Pictet Asset Management Limited AMG Managers Silvercrest Small Cap Silvercrest Asset Management Group LLC AMG Managers Skyline Special Equities Skyline Asset Management, L.P. AMG Managers Special Equity Ranger Investment Management, L.P. Lord, Abbett & Co. LLC Smith Asset Management Group, L.P. Federated MDTA LLC AMG SouthernSun Small Cap AMG SouthernSun U.S. Equity SouthernSun Asset Management, LLC FIXED INCOME FUNDS AMG Managers Doubleline Core Plus Bond DoubleLine Capital LP AMG Managers Global Income Opportunity AMG Managers Loomis Sayles Bond Loomis, Sayles & Company, L.P. |
| | | | | | |
| amgfunds.com | | | | 093020 | | AR076 |
Item 2. CODE OF ETHICS
Registrant has adopted a Code of Ethics. See attached Exhibit (a)(1).
Item 3. AUDIT COMMITTEE FINANCIAL EXPERT
Registrant’s Board of Trustees has determined that independent Trustee Mr. Steven J. Paggioli qualifies as an Audit Committee Financial Expert. Mr. Paggioli is “independent” as such term is defined in Form N-CSR.
Item 4. PRINCIPAL ACCOUNTANT FEES AND SERVICES
The aggregate fees billed by the Funds’ independent registered public accounting firm, PricewaterhouseCoopers LLP (“PwC”), to the Funds for the Funds’ two most recent fiscal years for professional services rendered for audits of annual financial statements, or services that are normally provided in connection with statutory and regulatory filings or engagements (“Audit Fees”) were as follows:
| | | | | | | | |
| | | Fiscal 2020 | | | Fiscal 2019 | |
AMG SouthernSun Small Cap Fund | | $ | 24,100 | | | $ | 24,560 | |
AMG SouthernSun U.S. Equity Fund | | $ | 22,746 | | | $ | 23,576 | |
There were no fees billed by PwC to the Funds in its two recent fiscal years for services rendered for assurance and related services that are reasonably related to the performance of the audit or review of the Fund’s financial statements, but are not reported as Audit Fees (“Audit-Related Fees”).
For the Funds’ two most recent fiscal years, there were no Audit-Related Fees billed by PwC for engagements related directly to the operations and financial reporting of one or more Funds by a Fund Service Provider. A Fund Service Provider is (a) any investment adviser to the Fund (not including any Subadvisor whose role is primarily portfolio management and is subcontracted with or overseen by another investment adviser) or (b) any entity that provides ongoing services to the Fund and is controlling, controlled by or under common control with a Fund investment adviser described in (a).
The aggregate fees billed by PwC to the Funds for the two most recent fiscal years for professional services rendered for tax compliance, tax advice, and tax planning (“Tax Fees”) were as follows:
| | | | | | | | |
| | | Fiscal 2020 | | | Fiscal 2019 | |
AMG SouthernSun Small Cap Fund | | $ | 6,250 | | | $ | 6,250 | |
AMG SouthernSun U.S. Equity Fund | | $ | 6,250 | | | $ | 6,250 | |
For the Funds’ two most recent fiscal years, Tax Fees billed by PwC for engagements by Fund Service Providers that related directly to the operations and financial reporting of the Funds were $0 for fiscal 2020 and $0 for fiscal 2019, respectively.
The services for which Tax Fees were charged comprise all services performed by professional staff in PwC’s tax division except those services related to the audit. Typically, this category would include fees for tax compliance, tax planning, and tax advice. Tax compliance, tax advice, and tax planning services include preparation of original and amended tax returns, claims for refund and tax payment-planning services, assistance with tax audits and appeals, tax advice related to mergers and acquisitions and requests for rulings or technical advice from taxing authorities.
There were no other fees billed by PwC to the Funds for all other non-audit services (“Other Fees”) during the Funds’ two most recent fiscal years. During the same period, there were no Other Fees billed by PwC for engagements by Fund Service Providers that related directly to the operations and financial reporting of the Funds.
| (e) | (1)According to policies adopted by the Audit Committee, services provided by PwC to the Funds must be pre-approved by the Audit Committee. On an annual basis, the Audit Committee reviews and pre-approves various types of services that PwC may perform for the Funds without specific approval of each engagement, subject to specified budget limitations. As contemplated by the Sarbanes-Oxley Act of 2002 and related SEC rules, the Audit Committee also pre-approves non-audit services provided by PwC to any Fund Service Provider for any engagement that relates directly to the operations and financial reporting of the Funds. Any engagement that is not already pre-approved or that will exceed a pre-approved budget must be submitted to the Audit Committee for pre-approval. The Chairman of the Audit Committee is authorized on behalf of the Board of Trustees and the Audit Committee to approve the engagement of PwC to perform non-audit services subject to certain conditions, including notification to the Audit Committee of such pre-approval not later than the next meeting of the Audit Committee following the date of such pre-approval. |
(e) (2) None.
(f) Not applicable.
(g) The aggregate fees billed by PwC in 2020 and 2019 for non-audit services rendered to the Funds and Fund Service Providers were $62,000
and $62,000, respectively. For the fiscal year ended September 30, 2020, this amount reflects the amounts disclosed above in Item 4(b),(c),(d), plus $49,500 in fees billed to the Fund Service Providers for non-audit services that did not relate directly to the operations and financial reporting of the Funds. For the fiscal year ended September 30, 2019, this amount reflects the amounts disclosed above in Item 4(b),(c),(d), plus $49,500 in fees billed to the Fund Service Providers for non-audit services that did not relate directly to the operations and financial reporting of the Funds.
(h) The Trust’s Audit Committee has considered whether the provision of non-audit services by registrant’s independent registered public accounting firm to the registrant’s investment advisor, and any entity controlling, controlled, or under common control with the investment advisor that provided ongoing services to the registrant that were not pre-approved by the Committee (because such services did not relate directly to the operations and financial reporting of the registrant) was compatible with maintaining the independence of the independent registered public accounting firm.
Item 5. AUDIT COMMITTEE OF LISTED REGISTRANTS
Not applicable.
Item 6. SCHEDULE OF INVESTMENTS
The schedule of investments in unaffiliated issuers as of the close of the reporting period is included as part of the shareholder report contained in Item 1 hereof.
Item 7. DISCLOSURE OF PROXY VOTING POLICIES AND PROCEDURES FOR CLOSED-END MANAGEMENT INVESTMENT COMPANIES
Not applicable.
Item 8. PORTFOLIO MANAGERS OF CLOSED-END MANAGEMENT INVESTMENT COMPANIES
Not applicable.
Item 9. PURCHASES OF EQUITY SECURITIES BY CLOSED-END MANAGEMENT INVESTMENT COMPANIES AND AFFILIATED PURCHASERS
Not applicable.
Item 10. SUBMISSION OF MATTERS TO A VOTE OF SECURITY HOLDERS
Not applicable.
Item 11. CONTROLS AND PROCEDURES
(a) The Registrant’s principal executive and principal financial officers have concluded, based on their evaluation of the registrant’s disclosure controls and procedures as of a date within 90 days of the filing of this report, that the Registrant’s disclosure controls and procedures are reasonably designed to ensure that information required to be disclosed by the Registrant on Form N-CSR is recorded, processed, summarized and reported within the required time periods and that information required to be disclosed by the registrant in the reports that it files or submits on Form N-CSR is accumulated
and communicated to the Registrant’s management, including its principal executive and principal financial officers, as appropriate to allow timely decisions regarding required disclosure.
(b) There were no changes in the Registrant’s internal control over financial reporting during the period covered by this report that have materially affected, or are reasonably likely to materially affect, the internal control over financial reporting.
Item 12. DISCLOSURE OF SECURITIES LENDING ACTIVITIES FOR CLOSED-END MANAGEMENT INVESTMENT COMPANIES
Not applicable.
Item 13. EXHIBITS
SIGNATURES
Pursuant to the requirements of the Securities Exchange Act of 1934 and the Investment Company Act of 1940, the registrant has duly caused this report to be signed on its behalf by the undersigned, thereunto duly authorized.
| | |
| AMG FUNDS |
| |
| By: | | /s/ Keitha L. Kinne |
| | Keitha L. Kinne, Principal Executive Officer |
| |
| Date: | | December 4, 2020 |
Pursuant to the requirements of the Securities Exchange Act of 1934 and the Investment Company Act of 1940, this report has been signed below by the following persons on behalf of the registrant and in the capacities and on the dates indicated.
| | |
| By: | | /s/ Keitha L. Kinne |
| | Keitha L. Kinne, Principal Executive Officer |
| |
| Date: | | December 4, 2020 |
| | |
| By: | | /s/ Thomas Disbrow |
| | Thomas Disbrow, Principal Financial Officer |
| |
| Date: | | December 4, 2020 |