UNITED STATES
SECURITIES AND EXCHANGE COMMISSION
Washington, D.C. 20549
FORM N-CSR
CERTIFIED SHAREHOLDER REPORT OF REGISTERED
MANAGEMENT INVESTMENT COMPANIES
Investment Company Act file number: 811-09521
AMG FUNDS
(Exact name of registrant as specified in charter)
One Stamford Plaza, 263 Tresser Boulevard, Suite 949, Stamford,
Connecticut 06901
(Address of principal executive offices) (Zip code)
AMG Funds LLC
One Stamford Plaza, 263 Tresser Boulevard, Suite 949, Stamford,
Connecticut 06901
(Name and address of agent for service)
Registrant’s telephone number, including area code: (203) 299-3500
Date of fiscal year end: DECEMBER 31
Date of reporting period: JANUARY 1, 2020 – DECEMBER 31, 2020
(Annual Shareholder Report)
Item 1. Reports to Shareholders
 | | Annual Report |
| | |
| | |
| | | AMG Funds |
| | | | |
| | | December 31, 2020 |
| | | | |
| | |  |
| | | | |
| | | AMG Yacktman Fund |
| | | Class I: YACKX |
| | | | |
| | | AMG Yacktman Focused Fund |
| | | Class N: YAFFX | Class I: YAFIX |
| | | | |
| | | AMG Yacktman Focused Fund - Security Selection Only |
| | | Class N: YFSNX | Class I: YFSIX |
| | | | |
| | | AMG Yacktman Special Opportunities Fund |
| | | Class I: YASSX | Class Z: YASLX |
| | | | |
| | | | |
| | | | |
| | |
| | |
| | AMG Funds |
| | Annual Report — December 31, 2020 |
| | |
| | |
| | TABLE OF CONTENTS | PAGE |
| | LETTER TO SHAREHOLDERS | 2 |
| | ABOUT YOUR FUND’S EXPENSES | 3 |
| | PORTFOLIO MANAGER’S COMMENTS, FUND SNAPSHOTS AND SCHEDULES OF PORTFOLIO INVESTMENTS | |
| | AMG Yacktman Fund | 4 |
| | AMG Yacktman Focused Fund | 13 |
| | AMG Yacktman Focused Fund - Security Selection Only | 22 |
| | AMG Yacktman Special Opportunities Fund | 30 |
| | FINANCIAL STATEMENTS | |
| | Statement of Assets and Liabilities | 41 |
| | Balance sheets, net asset value (NAV) per share computations and cumulative distributable earnings (loss) | |
| | Statement of Operations | 43 |
| | Detail of sources of income, expenses, and realized and unrealized gains (losses) during the fiscal year | |
| | Statements of Changes in Net Assets | 44 |
| | Detail of changes in assets for the past two fiscal years | |
| | Financial Highlights | 46 |
| | Historical net asset values per share, distributions, total returns, income and expense ratios, turnover ratios and net assets | |
| | Notes to Financial Statements | 53 |
| | Accounting and distribution policies, details of agreements and transactions with Fund management and affiliates, and descriptions of certain investment risks | |
| | REPORT OF INDEPENDENT REGISTERED PUBLIC ACCOUNTING FIRM | 61 |
| | OTHER INFORMATION | 62 |
| | TRUSTEES AND OFFICERS | 63 |
| Nothing contained herein is to be considered an offer, sale or solicitation of an offer to buy shares of any series of the AMG Funds Family of Funds. Such offering is made only by prospectus, which includes details as to offering price and other material information. |
| | Letter to Shareholders |
Dear Shareholder:
The fiscal year ending December 31, 2020, was a volatile period for financial markets that featured a dramatic selloff and extraordinary rebound amid the unprecedented global effort to stop the COVID-19 pandemic. Early in the year, equities achieved new record highs against the backdrop of a healthy economy and strong investor sentiment. However, a broad-based selloff occurred amid a global flight to quality as investors assessed the scope of the unfolding COVID-19 pandemic, a deteriorating economy, and skyrocketing unemployment. An oil price war initiated between Saudi Arabia and Russia only made matters worse. From its peak in mid-February 2020, the S&P 500® Index declined (33.79)% over the span of a few weeks, halting the eleven-year equity bull market. In response to the crisis, global central banks and governments were quick to flood the market with massive fiscal and monetary stimulus which helped to stabilize the market and led to an impressive recovery in risk assets, albeit a very uneven one. So despite the volatility, the S&P 500® Index still achieved an 18.40% return for 2020 while effective COVID-19 vaccines and further government stimulus bolstered investor optimism for a brighter future in 2021.
During the year there was very wide dispersion in performance across sectors, with information technology and consumer discretionary sectors leading the market with returns of 43.88% and 33.30%, respectively. On the other hand, companies in the energy sector fell (33.69)%, and financials and real estate also produced slightly negative returns. Growth stocks significantly outperformed value stocks for the period with returns of 38.49% and 2.80% for the Russell 1000® Growth and Russell 1000® Value Indexes, respectively. Small cap stocks endured a wild ride in 2020 as the Russell 2000® Index experienced both its best quarter (fourth quarter 2020) and worst quarter (first quarter 2020) on record. For the year as a whole, small cap returns were relatively in line with the broader market as the Russell 2000® Index gained 19.96% in 2020. Outside the U.S., emerging markets outperformed developed markets with an 18.31% return for the MSCI Emerging Markets Index compared to a 7.82% return for the MSCI EAFE Index.
Interest rates fell dramatically and led to strong returns for bond investors as the U.S. Federal Reserve (the Fed) slashed short-term rates in response to the slowing economy. The 10-year Treasury yield ended the year near a historic low yield of 0.93%. The Bloomberg Barclays U.S. Aggregate Bond Index, a broad measure of U.S. bond market performance, returned 7.51% over the period. Investment grade corporate bonds rebounded from the selloff early in the year and returned 9.89% in 2020. Riskier high yield bonds lagged the investment grade market with a 7.11% return as measured by the return of the Bloomberg Barclays U.S. Corporate High Yield Bond Index.
AMG Funds appreciates the privilege of providing investment tools to you and your clients. Our foremost goal is to provide investment solutions that help our shareholders successfully reach their long-term investment goals. AMG Funds provides access to a distinctive array of actively managed return-oriented investment strategies. We thank you for your continued confidence and investment in AMG Funds. You can rest assured that under all market conditions our team is focused on delivering excellent investment management services for your benefit.
Respectfully,

Keitha Kinne
President
AMG Funds
| Average Annual Total Returns | Periods ended
December 31, 2020* |
| Stocks: | | 1 Year | 3 Years | 5 Years |
| Large Cap | (S&P 500® Index) | 18.40% | 14.18% | 15.22% |
| Small Cap | (Russell 2000® Index) | 19.96% | 10.25% | 13.26% |
| International | (MSCI All Country World Index ex USA) | 10.65% | 4.88% | 8.93% |
| Bonds: | | | | |
| Investment Grade | (Bloomberg Barclays U.S. Aggregate Bond Index) | 7.51% | 5.34% | 4.44% |
| | | | | |
| High Yield | (Bloomberg Barclays U.S. Corporate High Yield Bond Index) | 7.11% | 6.24% | 8.59% |
| | | | | |
| Tax-exempt | (Bloomberg Barclays Municipal Bond Index) | 5.21% | 4.64% | 3.91% |
| | | | | |
| Treasury Bills | (ICE BofAML U.S. 6-Month Treasury Bill Index) | 1.05% | 1.84% | 1.43% |
*Source: FactSet. Past performance is no guarantee of future results.
| | |
| | |
| | About Your Fund’s Expenses |
As a shareholder of a Fund, you may incur two types of costs: (1) transaction costs, which may include sales charges (loads) on purchase payments; redemption fees; and exchange fees; and (2) ongoing costs, including management fees; distribution (12b-1) fees; and other Fund expenses. This example is intended to help you understand your ongoing costs (in dollars) of investing in the Fund and to compare these costs with the ongoing costs of investing in other mutual funds. The example is based on $1,000 invested at the beginning of the period and held for the entire period as indicated below. ACTUAL EXPENSES The first line of the following table provides information about the actual account values and | actual expenses. You may use the information in this line, together with the amount you invested, to estimate the expenses that you paid over the period. Simply divide your account value by $1,000 (for example, an $8,600 account value divided by $1,000 = 8.6), then multiply the result by the number in the first line under the heading entitled “Expenses Paid During Period” to estimate the expenses you paid on your account during this period. HYPOTHETICAL EXAMPLE FOR COMPARISON PURPOSES The second line of the following table provides information about hypothetical account values and hypothetical expenses based on the Fund’s actual expense ratio and an assumed annual rate of return of 5% before expenses, which is not the Fund’s | actual return. The hypothetical account values and expenses may not be used to estimate the actual ending account balance or expenses you paid for the period. You may use this information to compare the ongoing costs of investing in the Fund and other funds by comparing this 5% hypothetical example with the 5% hypothetical examples that appear in the shareholder reports of other funds. Please note that the expenses shown in the table are meant to highlight your ongoing costs only and do not reflect any transactional costs, such as sales charges (loads), redemption fees, or exchange fees. Therefore, the second line of the table is useful in comparing ongoing costs only, and will not help you determine the relative total costs of owning different funds. |
Six Months Ended
December 31, 2020 | Expense
Ratio for
the Period | Beginning
Account
Value
07/01/20 | Ending
Account
Value
12/31/20 | Expenses
Paid
During
the Period* |
| AMG Yacktman Fund |
| Based on Actual Fund Return | | | |
| Class I | 0.70% | $1,000 | $1,269 | $3.99 |
| Based on Hypothetical 5% Annual Return | | |
| Class I | 0.70% | $1,000 | $1,022 | $3.56 |
| | | | | |
| AMG Yacktman Focused Fund |
| Based on Actual Fund Return | | | |
| Class N | 1.25% | $1,000 | $1,280 | $7.16 |
| Class I | 1.06% | $1,000 | $1,281 | $6.08 |
| Based on Hypothetical 5% Annual Return | | |
| Class N | 1.25% | $1,000 | $1,019 | $6.34 |
| Class I | 1.06% | $1,000 | $1,020 | $5.38 |
| | | | | |
| AMG Yacktman Focused Fund - Security Selection Only |
| Based on Actual Fund Return |
| Class N | 1.24% | $1,000 | $1,343 | $7.30 |
| Class I | 1.08% | $1,000 | $1,344 | $6.36 |
| Based on Hypothetical 5% Annual Return | | |
| Class N | 1.24% | $1,000 | $1,019 | $6.29 |
| Class I | 1.08% | $1,000 | $1,020 | $5.48 |
Six Months Ended
December 31, 2020 | Expense
Ratio for the
Period | Beginning
Account
Value
07/01/20 | Ending
Account
Value
12/31/20 | Expenses
Paid
During
the Period* |
| AMG Yacktman Special Opportunities Fund |
| Based on Actual Fund Return | | | |
| Class I | 1.48%† | $1,000 | $1,325 | $8.65 |
| Class Z | 1.38%† | $1,000 | $1,326 | $8.07 |
| Based on Hypothetical 5% Annual Return |
| Class I | 1.48%† | $1,000 | $1,018 | $7.51 |
| Class Z | 1.38%† | $1,000 | $1,018 | $7.00 |
| * | Expenses are equal to the Fund’s annualized expense ratio multiplied by the average account value over the period, multiplied by the number of days in the most recent fiscal half-year (184), then divided by 366. |
| † | Includes a performance fee adjustment amounting to (0.26)% of average daily net assets which is not annualized. (See Note 2 of Notes to Financial Statements.) |
| | |
| | |
| | AMG Yacktman Fund |
| | Portfolio Manager’s Comments (unaudited) |
We hope you have managed through the difficulties of 2020 as safely and healthily as possible. In 2020, the AMG Yacktman Fund (the Fund) Class I shares delivered strong results compared to the Russell 1000® Value Index with the Fund appreciating 15.28%, significantly outperforming the Russell 1000® Value benchmark, which was up 2.80% (but modestly underperformed the secondary S&P 500® Index which returned 18.40% for the year). During the year we were able to make many new investments, especially during the steep declines of the first quarter, reducing cash meaningfully in 2020. While we were aggressive purchasers during the market drop, had the declines lasted for more than a few weeks or been even sharper we would have been able to put even more cash to work. Overall, we are pleased to have delivered the strong outperformance versus our value benchmark last year. Recently, Mutual Fund Observer looked at risk-adjusted returns for the 2,076 equity-oriented mutual funds that have a 20-year track record and placed the Fund at the top of their risk-adjusted list, declaring, “Yacktman and Yacktman Focused are almost freakishly successful, year and year, by almost every measure. They’re sort of the (pre-2020) New England Patriots of investing. Adam Sabban at Morningstar characterizes them as ‘half equity fund, half absolute-return hedge fund,’ which favors great core businesses but is willing to hold cash, buy during panics and shop overseas.”1 While investors have enjoyed high rates of return for the last decade, they have likely set up low returns for the major indices over the long term. Many have forgotten the pain that paying crazy prices in the late 1990s technology bubble led to and should be highly concerned about the valuations of today’s latest story stock. Like the last technology bubble, index funds will likely add many of these speculative companies at the wrong time and price, causing some benchmarks, which are supposed to be passive, to actively cause long-term pain for investors. Getting Growth at Value Prices Many of our favorite investments today continue to be in complicated, mispriced, owner-operated conglomerates like Samsung Electronics Co., Ltd., Bollore SA, News Corp., and Associated British Foods PLC. Each of these companies has business units that are powerful and growing rapidly, along with other businesses that are substantial contributors to cash flow and sell at significant discounts to what we think they are worth. Several of these companies are in the process of unlocking value through better | disclosure or separation of the stronger business units. Often these mispriced securities require a great deal of time and patience, which are qualities we take great pride in possessing, especially in an industry that affords few a true long-term approach. Contributors for the year included Samsung, Brenntag, and Microsoft Samsung was the top contributor to results last year, and is our largest position. The company has a strong market position in high growth markets, including foundry, sensors, and 5G equipment, and a good position in emerging industries like artificial intelligence, autonomous driving, and internet of things, yet it sells at an extremely low multiple of earnings and cash flow and has a significant amount of net excess net cash and securities on the balance sheet. Samsung’s core semiconductor business is set up for high growth over the next few years, and we think the stock could be in an early phase of positive re-rating, which is a period where a stock goes from a low multiple to a substantially higher one that better reflects the company’s business prospects. Brenntag AG, which is the global leader in distribution of chemicals to small and mid-sized businesses, produced strong returns last year as the company demonstrated remarkable business consistency, despite the significant economic headwinds. We think the shares remain attractive and the company has a strong market position and management team, which should enable Brenntag to produce strong results over time. Microsoft Corp. continued to deliver strong business and share price results last year. The company continues to benefit from strong customer growth, especially in its cloud business, and remains attractively priced, given the potential for solid long-term cash flow growth. Detractors included Weatherford, Macy’s, and Fox Weatherford International PLC’s equity and debt detracted from results due to general weakness in the energy sector. Although fundamentals were challenging during the year, management was able to downsize the business and navigate through the challenges reasonably well. We expect to see better results as the economy improves in 2021. | Macy’s, Inc. suffered from shutdowns in 2020 much like Weatherford. Its core retail business suffered and the value of its real estate was impaired, especially in cities like New York and San Francisco. Due to the huge price swings in the stock, we were able to purchase additional shares at low prices during the declines and then reduce our holding as the stock nearly doubled in the fourth quarter alone. Have the rules of investing changed? At times, a long-term change in rules can create a significant impact. Perhaps we are in an environment where securities sell at higher prices versus prior eras due to central banking, but the net result of the higher prices will be lower long-term returns. In 1968 baseball pitchers dominated hitters, causing low-scoring games that were less popular with fans. The following year, the height of the pitcher’s mound was reduced from 15 inches to 10 inches, where it remains today, and hitters and average runs per game increased from 3.42 to 4.07, although some of the increase likely came from new teams being added to the league (ESPN article, March 8, 2019). Fox Corp. declined last year due to advertising weakness and challenges with Fox News and lower viewership of sports. The shares sell at a low valuation and the company has significant value in tax shields, real estate, and gaming investments that we think are underappreciated. Conclusion Stock returns are largely a result of free cash flow, growth, and multiple change, with most of the returns in recent years from the last variable. With the high-priced index offering a low free-cash-flow yield and likely a continuation of low growth, long-term index returns look challenging. We believe our approach of finding individual securities that we believe are mispriced and offer solid risk-adjusted returns is more important than ever when equities are expensive as they are today. Even if the rules have changed—and we would not argue they have—we have moved to prices where those who stopped thinking about risk will likely regret that decision at some point in the future. We will continue to work hard to find mispriced opportunities to deliver results over the long term while also considering risk. The time to be most aware of potential risks is when others completely ignore them. We never forget that the price you pay matters both for potential return and to mitigate losses if things turn out worse than you expected. |
| | |
| | |
| | AMG Yacktman Fund |
| | Portfolio Manager’s Comments (CONTINUED) |
We wish everyone the best for the new year and, as always, will be objective, patient, and diligent when managing the AMG Yacktman Fund. 1 Source: 21st Century Champions, Jan. 2021. | The views expressed represent the opinions of Yacktman Asset Management LP as of December 31, 2020, are not intended as a forecast or guarantee of future results, and are subject to change without notice. | |
| | |
| | |
| | AMG Yacktman Fund |
| | Portfolio Manager’s Comments (CONTINUED) |
CUMULATIVE TOTAL RETURN PERFORMANCE
AMG Yacktman Fund’s cumulative total return is based on the daily change in net asset value (NAV), and assumes that all dividends and distributions were reinvested. The graph compares a hypothetical $10,000 investment made in the AMG Yacktman Fund’s Class I shares on December 31, 2010 to a $10,000 investment made in the Russell 1000® Value Index and the S&P 500® Index for the same time period. The graph and table do not reflect the deduction of taxes that a shareholder would pay on a Fund distribution or redemption of shares. The listed returns for the Fund are net of expenses and the returns for the index exclude expenses. Total returns would have been lower had certain expenses not been reduced.

The table below shows the average annual total returns for the AMG Yacktman Fund, the Russell 1000® Value Index and the S&P 500® Index for the same time periods ended December 31, 2020.
| Average Annual Total Returns1 | One Year | Five
Years | Ten Years |
| AMG Yacktman Fund2, 3, 4, 5, 6, 7, 8, 9, 10 | | | |
| Class I | 15.28% | 12.86% | 11.39% |
| Russell 1000® Value Index11 | 2.80% | 9.74% | 10.50% |
| S&P 500® Index12 | 18.40% | 15.22% | 13.88% |
Effective June 30, 2020, the Yacktman Fund’s primary and secondary benchmarks were changed to the Russell 1000® Value Index becoming the primary benchmark and S&P 500® Index the secondary benchmark from the S&P 500® Index as the primary benchmark and the Russell 1000® Value Index as the secondary benchmark previously.
The performance data shown represents past performance. Past performance is not a guarantee of future results. Current performance may be lower or higher than the performance data quoted. The investment return and principal value of an investment will fluctuate so that an investor’s shares, when redeemed, may be worth more or less than their original cost.
Investors should carefully consider the Fund’s investment objectives, risks, charges and expenses before investing. For performance information through the most recent month end, current net asset values per share for the Fund and other information, please call 800.548.4539 or visit our website at amgfunds.com for a free prospectus. Read it carefully before investing or sending money.
Distributed by AMG Distributors, Inc., member FINRA/SIPC.
| 1 | Total return equals income yield plus share price change and assumes reinvestment of all dividends and capital gain distributions. Returns are net of fees and may reflect offsets of Fund expenses as described in the prospectus. No adjustment has been made for taxes payable by shareholders on their reinvested dividends and |
| | | capital gain distributions. Returns for periods greater than one year are annualized. The listed returns on the Fund are net of expenses and based on the published NAV as of December 31, 2020. All returns are in U.S. dollars ($). |
| | | |
| | 2 | From time to time the Fund’s investment manager has waived its fees and/or absorbed Fund expenses, which has resulted in higher returns. |
| | | |
| | 3 | The Fund is subject to the risks associated with investments in debt securities, such as default risk and fluctuations in the perception of the debtor’s ability to pay its creditors. Changing interest rates may adversely affect the value of an investment. An increase in interest rates typically causes the value of bonds and other fixed income securities to fall. |
| | | |
| | 4 | High-yield bonds (also known as “junk bonds”) may be subject to greater levels of interest rate, credit, and liquidity risk than investments in higher rated securities. These securities are considered predominantly speculative with respect to the issuer’s continuing ability to make principal and interest payments. The issuers of the Fund’s holdings may be involved in bankruptcy proceedings, reorganizations, or financial restructurings, and are not as strong financially as higher-rated issuers. |
| | | |
| | 5 | Investments in international securities are subject to certain risks of overseas investing including currency fluctuations and changes in political and economic conditions, which could result in significant market fluctuations. These risks are magnified in emerging markets. |
| | | |
| | 6 | The Fund is subject to risks associated with investments in mid-capitalization companies such as greater price volatility, lower trading volume, and less liquidity than the stocks of larger, more established companies. |
| | | |
| | 7 | The Fund is subject to risks associated with investments in small-capitalization companies, such as erratic earnings patterns, competitive conditions, limited earnings history and a reliance on one or a limited number of products. |
| | | |
| | 8 | Companies that are in similar businesses may be similarly affected by particular economic or market events; to the extent the Fund has substantial holdings within a particular sector, the risks associated with that sector increase. |
| | | |
| | 9 | Market prices of investments held by the Fund may fall rapidly or unpredictably due to a variety of economic or political factors, market conditions, disasters or public health issues, or in response to events that affect particular industries or companies. |
| | |
| | |
| | AMG Yacktman Fund |
| | Portfolio Manager’s Comments (CONTINUED) |
10 The Fund invests in value stocks, which may perform differently from the market as a whole and may be undervalued by the market for a long period of time. 11 The Russell 1000® Value Index is a market capitalization weighted index that measures the performance of those Russell 1000® companies with lower price-to-book ratios and lower forecasted growth values. Unlike the Fund, the Russell 1000® | | Value Index is unmanaged, is not available for investment and does not incur expenses. 12 The S&P 500® Index is a capitalization-weighted index of 500 stocks. The S&P 500® Index is designed to measure performance of the broad domestic economy through changes in the aggregate market value of 500 stocks representing all major industries. Unlike the Fund, the S&P 500® Index is unmanaged, is not available for investment and does not incur expenses. | The Russell 1000® Value Index is a trademark of the London Stock Exchange Group companies. The S&P 500® Index is proprietary data of Standard & Poor’s, a division of McGraw-Hill Companies, Inc. Not FDIC insured, nor bank guaranteed. May lose value. |
| | | | |
| | AMG Yacktman Fund |
| | Fund Snapshots (unaudited) |
| | December 31, 2020 |
| PORTFOLIO BREAKDOWN | |
| | |
| Sector | % of
Net Assets |
| Consumer Staples | 19.2 |
| Information Technology | 17.7 |
| Communication Services | 17.1 |
| Consumer Discretionary | 9.5 |
| Financials | 9.1 |
| Industrials | 6.9 |
| Health Care | 3.3 |
| Energy | 1.6 |
| Materials | 1.2 |
| Short-Term Investments | 14.3 |
| Other Assets Less Liabilities | 0.1 |
| TOP TEN HOLDINGS | |
| | | |
| Security Name | % of
Net Assets |
| Samsung Electronics Co., Ltd., 1.340% (South Korea) | 10.1 |
| Bollore SA (France) | | 5.3 |
| Brenntag AG (Germany) | | 3.7 |
| Sysco Corp. | | 2.9 |
| PepsiCo, Inc. | | 2.9 |
| Alphabet, Inc., Class C | | 2.9 |
| News Corp., Class A | | 2.8 |
| The Walt Disney Co. | | 2.7 |
| The Procter & Gamble Co. | | 2.6 |
| Microsoft Corp. | | 2.6 |
| Top Ten as a Group | | 38.5 |
Because a fund’s strategy may result in multiple investments in particular sectors of the economy, its performance may depend on the performance of those sectors and may fluctuate more widely than investments diversified across more sectors. For additional information on these and other risk considerations, please see the Fund’s prospectus.
Any sectors, industries, or securities discussed should not be perceived as investment recommendations. Mention of a specific security should not be considered a recommendation to buy or solicitation to sell that security. Specific securities mentioned in this report may have been sold from the Fund’s portfolio of investments by the time you receive this report.
| | |
| | |
| | AMG Yacktman Fund |
| | Fund Snapshots (continued) |
| | For the six months ended December 31, 2020 |
| NEW EQUITY POSITIONS |
| |
| New Purchases | Current
Shares Held |
| The Charles Schwab Corp. | 1,825,000 |
| Hyundai Mobis Co., Ltd. (South Korea) | 550,000 |
| Tyson Foods, Inc., Class A | 1,460,000 |
| CORPORATE BONDS & NOTES SALES |
| | | |
| Sales | Net Principal
Sold | Current Principal
Held |
| Service Properties Trust, 4.350%, 10/01/24 | $13,505,000 | $20,678,000 |
| Service Properties Trust, 4.500%, 03/15/25 | 7,623,000 | — |
| Service Properties Trust, 4.650%, 03/15/24 | 11,665,000 | — |
| Six Flags Entertainment Corp., 5.500%, 04/15/27 | 18,720,000 | — |
| EQUITY PURCHASES & SALES |
| | | |
| Purchases | Net Shares
Purchased | Current Shares
Held |
| Ingredion, Inc. | 760,000 | 1,150,000 |
| KT&G Corp. (South Korea) | 600,000 | 1,100,000 |
| Sales | Net Shares
Sold | Current Shares
Held |
| Alphabet, Inc., Class C | 5,000 | 125,000 |
| Booking Holdings, Inc. | 5,000 | 85,000 |
| Continental AG (Germany) | 1,040,000 | 900,000 |
| Fox Corp., Class A | 2,100,000 | 4,200,000 |
| Johnson & Johnson | 50,000 | 1,000,000 |
| Macy’s, Inc. | 5,700,000 | 13,800,000 |
| Microsoft Corp. | 100,000 | 900,000 |
| Oracle Corp. | 100,000 | 1,000,000 |
| PepsiCo, Inc. | 100,000 | 1,500,000 |
| Qurate Retail, Inc., Series A | 1,900,000 | — |
| Samsung Electronics Co., Ltd., 1.340% (South Korea) | 4,600,000 | 11,400,000 |
| The Walt Disney Co. | 400,000 | 1,150,000 |
| | |
| | AMG Yacktman Fund |
| | Schedule of Portfolio Investments |
| | December 31, 2020 |
| | Shares | Value |
| Common Stocks - 72.8% | | |
| Communication Services - 17.1% | | |
| Alphabet, Inc., Class C* | 125,000 | $218,985,000 |
| Bollore SA (France) | 97,075,700 | 401,907,946 |
| Comcast Corp., Class A | 1,100,000 | 57,640,000 |
| Fox Corp., Class A1 | 4,200,000 | 122,304,000 |
| Fox Corp., Class B | 3,100,000 | 89,528,000 |
| News Corp., Class A | 11,700,000 | 210,249,000 |
| The Walt Disney Co.* | 1,150,000 | 208,357,000 |
| Total Communication Services | | 1,308,970,946 |
| Consumer Discretionary - 9.5% | | |
| Booking Holdings, Inc.* | 85,000 | 189,317,950 |
| Continental AG (Germany) | 900,000 | 133,951,750 |
| Hyundai Mobis Co., Ltd. (South Korea) | 550,000 | 129,451,389 |
| Macy’s, Inc. | 13,800,000 | 155,250,000 |
| Ralph Lauren Corp. | 404,000 | 41,910,960 |
| Rinnai Corp. (Japan) | 620,000 | 72,070,128 |
| Stanley Electric Co., Ltd. (Japan) | 166,668 | 5,376,618 |
| Total Consumer Discretionary | | 727,328,795 |
| Consumer Staples - 19.2% | | |
| Associated British Foods PLC (United Kingdom)* | 4,550,000 | 140,479,816 |
| Beiersdorf AG, ADR (Germany) | 4,305,280 | 100,958,816 |
| The Coca-Cola Co. | 3,000,000 | 164,520,000 |
| Colgate-Palmolive Co. | 1,100,000 | 94,061,000 |
| Hengan International Group Co., Ltd. (China) | 6,935,400 | 49,106,762 |
| Ingredion, Inc. | 1,150,000 | 90,470,500 |
| KT&G Corp. (South Korea)* | 1,100,000 | 84,222,202 |
| PepsiCo, Inc. | 1,500,000 | 222,450,000 |
| The Procter & Gamble Co. | 1,450,000 | 201,753,000 |
| Sysco Corp. | 3,000,000 | 222,780,000 |
| Tyson Foods, Inc., Class A | 1,460,000 | 94,082,400 |
| Total Consumer Staples | | 1,464,884,496 |
| Energy - 1.1% | | |
| ConocoPhillips | 650,000 | 25,993,500 |
| Exxon Mobil Corp. | 600,000 | 24,732,000 |
| Weatherford International PLC* | 5,443,901 | 32,663,406 |
| Total Energy | | 83,388,906 |
| Financials - 8.8% | | |
| The Bank of New York Mellon Corp. | 2,300,000 | 97,612,000 |
| The Charles Schwab Corp. | 1,825,000 | 96,798,000 |
| First Hawaiian, Inc. | 1,530,000 | 36,077,400 |
| FirstCash, Inc. | 460,000 | 32,218,400 |
| The Goldman Sachs Group, Inc. | 180,000 | 47,467,800 |
| | Shares | Value |
| State Street Corp. | 1,900,000 | $138,282,000 |
| U.S. Bancorp | 2,800,000 | 130,452,000 |
| Wells Fargo & Co. | 3,050,000 | 92,049,000 |
| Total Financials | | 670,956,600 |
| Health Care - 3.3% | | |
| Anthem, Inc. | 300,000 | 96,327,000 |
| Johnson & Johnson | 1,000,000 | 157,380,000 |
| Total Health Care | | 253,707,000 |
| Industrials - 5.0% | | |
| Aggreko PLC (United Kingdom) | 3,848,864 | 32,993,041 |
| Brenntag AG (Germany) | 3,600,000 | 279,941,521 |
| GrafTech International, Ltd. | 2,500,621 | 26,656,620 |
| MSC Industrial Direct Co., Inc., Class A | 530,000 | 44,726,700 |
| Valmont Industries, Inc. | 3,529 | 617,328 |
| Total Industrials | | 384,935,210 |
| Information Technology - 7.6% | | |
| Cisco Systems, Inc. | 1,400,000 | 62,650,000 |
| Cognizant Technology Solutions Corp., Class A | 2,300,000 | 188,485,000 |
| Corning, Inc. | 1,100,000 | 39,600,000 |
| Infosys, Ltd., Sponsored ADR (India) | 1,265,000 | 21,441,750 |
| Microsoft Corp. | 900,000 | 200,178,000 |
| Oracle Corp. | 1,000,000 | 64,690,000 |
| Total Information Technology | | 577,044,750 |
| Materials - 1.2% | | |
| Huntsman Corp. | 3,500,000 | 87,990,000 |
| Total Common Stocks | | |
| (Cost $3,830,597,729) | | 5,559,206,703 |
| | | |
| | Principal
Amount | |
| Corporate Bonds and Notes - 2.7% | | |
| Energy - 0.5% | | |
W&T Offshore, Inc.
9.750%, 11/01/232 | $51,359,000 | 36,336,492 |
| Financials - 0.3% | | |
Service Properties Trust
4.350%, 10/01/24 | 20,678,000 | 20,419,525 |
| Industrials - 1.9% | | |
| Macy’s Retail Holdings, LLC | | |
| 2.875%, 02/15/23 | 14,800,000 | 14,226,500 |
| 3.625%, 06/01/24 | 3,748,000 | 3,560,600 |
| Weatherford International, Ltd. (Bermuda) | | |
| 11.000%, 12/01/241,2 | 166,485,000 | 129,858,300 |
| Total Industrials | | 147,645,400 |
| Total Corporate Bonds and Notes | | |
| (Cost $253,352,851) | | 204,401,417 |
The accompanying notes are an integral part of these financial statements.
| | |
| | AMG Yacktman Fund |
| | Schedule of Portfolio Investments (continued) |
| | Shares | Value |
| Preferred Stock - 10.1% | | |
| Information Technology - 10.1% | | |
| Samsung Electronics Co., Ltd., 1.340% (South Korea) | 11,400,000 | $773,341,384 |
| Total Preferred Stock | | |
| (Cost $218,846,116) | | 773,341,384 |
| | | |
| | Principal
Amount | |
| Short-Term Investments - 14.3% | | |
| Joint Repurchase Agreements - 0.0%#,3 | | |
| Nomura Securities International, Inc., dated 12/31/20, due 01/04/21, 0.070% total to be received $309,511 (collateralized by various U.S. Government Agency Obligations and U.S. Treasuries, 0.000% - 8.500%, 01/31/21 - 01/15/56, totaling $315,699) | $309,509 | 309,509 |
| | | |
| | Shares | Value |
| Other Investment Companies - 14.3% | | |
| | | |
| Dreyfus Government Cash Management Fund, Institutional Shares, 0.03%4 | 375,295,256 | $375,295,256 |
| JPMorgan U.S. Government Money Market Fund, IM Shares, 0.03%4 | 712,350,265 | 712,350,265 |
| Total Other Investment Companies | | 1,087,645,521 |
| Total Short-Term Investments | | |
| (Cost $1,087,955,030) | | 1,087,955,030 |
| Total Investments - 99.9% | | |
| (Cost $5,390,751,726) | | 7,624,904,534 |
| Other Assets, less Liabilities - 0.1% | | 11,234,393 |
| Net Assets - 100.0% | | $7,636,138,927 |
| * | Non-income producing security. |
| 1 | Some of these securities, amounting to $1,731,047 or less than 0.1% of net assets, were out on loan to various borrowers and are collateralized by cash and various U.S. Treasury Obligations. See Note 4 of Notes to Financial Statements. |
| 2 | Security exempt from registration under Rule 144A of the Securities Act of 1933. This security may be resold in transactions exempt from registration, normally to qualified institutional buyers. At December 31, 2020, the value of these securities amounted to $166,194,792 or 2.2% of net assets. |
| 3 | Cash collateral received for securities lending activity was invested in these joint repurchase agreements. |
| 4 | Yield shown represents the December 31, 2020, seven day average yield, which refers to the sum of the previous seven days’ dividends paid, expressed as an annual percentage. |
ADR American Depositary Receipt
The accompanying notes are an integral part of these financial statements.
| | |
| | AMG Yacktman Fund |
| | Schedule of Portfolio Investments (continued) |
The following table summarizes the inputs used to value the Fund’s investments by the fair value hierarchy levels as of December 31, 2020:
| | | Level 1 | | Level 21 | | Level 3 | | Total |
| Investments in Securities | | | | | | | | |
| Common Stocks | | | | | | | | |
| Consumer Staples | | $1,191,075,716 | | $273,808,780 | | — | | $1,464,884,496 |
| Communication Services | | 907,063,000 | | 401,907,946 | | — | | 1,308,970,946 |
| Consumer Discretionary | | 386,478,910 | | 340,849,885 | | — | | 727,328,795 |
| Financials | | 670,956,600 | | — | | — | | 670,956,600 |
| Information Technology | | 577,044,750 | | — | | — | | 577,044,750 |
| Industrials | | 72,000,648 | | 312,934,562 | | — | | 384,935,210 |
| Health Care | | 253,707,000 | | — | | — | | 253,707,000 |
| Materials | | 87,990,000 | | — | | — | | 87,990,000 |
| Energy | | 83,388,906 | | — | | — | | 83,388,906 |
| Corporate Bonds and Notes† | | — | | 204,401,417 | | — | | 204,401,417 |
| Preferred Stock† | | — | | 773,341,384 | | — | | 773,341,384 |
| Short-Term Investments | | | | | | | | |
| Joint Repurchase Agreements | | — | | 309,509 | | — | | 309,509 |
| Other Investment Companies | | 1,087,645,521 | | — | | — | | 1,087,645,521 |
| Total Investments in Securities | | $5,317,351,051 | | $2,307,553,483 | | — | | $7,624,904,534 |
| † | All corporate bonds and notes and preferred stocks held in the Fund are level 2 securities. For a detailed breakout of corporate bonds and notes and preferred stocks by major industry classification, please refer to the Fund’s Schedule of Portfolio Investments. |
| 1 | An external pricing service is used to reflect any impact on security value due to market movements between the time the Fund valued such foreign securities and the earlier closing of foreign markets. |
For the fiscal year ended December 31, 2020, there were no transfers in or out of Level 3.
The country allocation in the Schedule of Portfolio Investments at December 31, 2020, was as follows:
| Country | % of Long-Term
Investments |
| Bermuda | 2.0 |
| China | 0.7 |
| France | 6.1 |
| Germany | 7.9 |
| India | 0.3 |
| Japan | 1.2 |
| South Korea | 15.1 |
| United Kingdom | 2.7 |
| United States | 64.0 |
| | 100.0 |
The accompanying notes are an integral part of these financial statements.
| | |
| | AMG Yacktman Focused Fund |
| | Portfolio Manager’s Comments (unaudited) |
We hope you have managed through the difficulties of 2020 as safely and healthily as possible. In 2020, the AMG Yacktman Focused Fund (the Fund) Class N shares delivered strong results compared to the Russell 1000® Value Index with the Fund appreciating 17.26%, significantly outperforming the Russell 1000® Value benchmark, which was up 2.80% (but modestly underperforming the secondary S&P 500® Index which returned 18.40% for the year). During the year we were able to make many new investments, especially during the steep declines of the first quarter, reducing cash meaningfully in 2020. While we were aggressive purchasers during the market drop, had the declines lasted for more than a few weeks or been even sharper we would have been able to put even more cash to work. Overall, we are pleased to have delivered the strong outperformance versus our value benchmark last year. Recently, Mutual Fund Observer looked at risk-adjusted returns for the 2,076 equity-oriented mutual funds that have a 20-year track record and placed the Fund at the top of their risk-adjusted list, declaring, “Yacktman and Yacktman Focused are almost freakishly successful, year and year, by almost every measure. They’re sort of the (pre-2020) New England Patriots of investing. Adam Sabban at Morningstar characterizes them as ‘half equity fund, half absolute-return hedge fund,’ which favors great core businesses but is willing to hold cash, buy during panics and shop overseas.”1 While investors have enjoyed high rates of return for the last decade, they have likely set up low returns for the major indices over the long term. Many have forgotten the pain that paying crazy prices in the late-1990s technology bubble led to and should be highly concerned about the valuations of today’s latest story stock. Like the last technology bubble, index funds will likely add many of these speculative companies at the wrong time and price, causing some benchmarks, which are supposed to be passive, to actively cause long-term pain for investors. Getting Growth at Value Prices Many of our favorite investments today continue to be in complicated, mispriced, owner-operated conglomerates like Samsung Electronics Co., Ltd., Bollore SA, News Corp., and Associated British Foods PLC. Each of these companies has business units that are powerful and growing rapidly, along with other businesses that are substantial contributors to cash flow and sell at significant discounts to what | we think they are worth. Several of these companies are in the process of unlocking value through better disclosure or separation of the stronger business units. Often these mispriced securities require a great deal of time and patience, which are qualities we take pride in possessing, especially in an industry that affords few a true long-term approach. Contributors for the year included Samsung, Brenntag, and Microsoft Samsung was the top contributor to results last year, and is our largest position. The company has a strong market position in high growth markets, including foundry, sensors, and 5G equipment, and a good position in emerging industries like artificial intelligence, autonomous driving, and internet of things, yet it sells at an extremely low multiple of earnings and cash flow and has a significant amount of net excess net cash and securities on the balance sheet. Samsung’s core semiconductor business is set up for high growth over the next few years, and we think the stock could be in an early phase of positive re-rating, which is a period where a stock goes from a low multiple to a substantially higher one that better reflects the company’s business prospects. Brenntag AG, which is the global leader in distribution of chemicals to small and mid-sized businesses, produced strong returns last year as the company demonstrated remarkable business consistency, despite the significant economic headwinds. We think the shares remain attractive and the company has a strong market position and management team, which should enable Brenntag to produce strong results over time. Microsoft Corp. continued to deliver strong business and share price results last year. The company continues to benefit from strong customer growth, especially in its cloud business, and remains attractively priced, given the potential for solid long-term cash flow growth. Detractors included Weatherford, Macy’s, and Fox Weatherford International PLC’s equity and debt detracted from results due to general weakness in the energy sector. Although fundamentals were challenging during the year, management was able to downsize the business and navigate through the challenges reasonably well. We expect to see better results as the economy improves in 2021. | Macy’s, Inc. suffered from shutdowns in 2020 much like Weatherford. Its core retail business suffered and the value of its real estate was impaired, especially in cities like New York and San Francisco. Due to the huge price swings in the stock, we were able to purchase additional shares at low prices during the declines and then reduce our holding as the stock nearly doubled in the fourth quarter alone. Have the rules of investing changed? At times, a long-term change in rules can create a significant impact. Perhaps we are in an environment where securities sell at higher prices versus prior eras due to central banking, but the net result of the higher prices will be lower long-term returns. In 1968 baseball pitchers dominated hitters, causing low-scoring games that were less popular with fans. The following year, the height of the pitcher’s mound was reduced from 15 inches to 10 inches, where it remains today, and hitters and average runs per game increased from 3.42 to 4.07, although some of the increase likely came from new teams being added to the league (ESPN article, March 8, 2019). Fox Corp. declined last year due to advertising weakness and challenges with Fox News and lower viewership of sports. The shares sell at a low valuation and the company has significant value in tax shields, real estate, and gaming investments that we think are underappreciated. Conclusion Stock returns are largely a result of free cash flow, growth, and multiple change, with most of the returns in recent years from the last variable. With the high-priced index offering a low free-cash-flow yield and likely a continuation of low growth, long-term index returns look challenging. We believe our approach of finding individual securities that we believe are mispriced and offer solid risk-adjusted returns is more important than ever when equities are expensive as they are today. Even if the rules have changed—and we would not argue they have—we have moved to prices where those who stopped thinking about risk will likely regret that decision at some point in the future. We will continue to work hard to find mispriced opportunities to deliver results over the long term while also considering risk. The time to be most aware of potential risks is when others completely ignore them. We never forget that the price you pay matters both for potential return and to mitigate losses if things turn out worse than you expected. |
| | |
| | AMG Yacktman Focused Fund |
| | Portfolio Manager’s Comments (continued) |
We wish everyone the best for the new year and, as always, will be objective, patient, and diligent when managing the AMG Yacktman Focused Fund. 1 Source: 21st Century Champions, Jan. 2021. | The views expressed represent the opinions of Yacktman Asset Management LP as of December 31, 2020, are not intended as a forecast or guarantee of future results, and are subject to change without notice. | |
| | |
| | AMG Yacktman Focused Fund |
| | Portfolio Manager’s Comments (continued) |
CUMULATIVE TOTAL RETURN PERFORMANCE
AMG Yacktman Focused Fund’s cumulative total return is based on the daily change in net asset value (NAV), and assumes that all dividends and distributions were reinvested. The graph compares a hypothetical $10,000 investment made in the AMG Yacktman Focused Fund’s Class N shares on December 31, 2010 to a $10,000 investment made in the Russell 1000® Value Index and the S&P 500® Index for the same time period. The graph and table do not reflect the deduction of taxes that a shareholder would pay on a Fund distribution or redemption of shares. The listed returns for the Fund are net of expenses and the returns for the index exclude expenses. Total returns would have been lower had certain expenses not been reduced.

The table below shows the average annual total returns for the AMG Yacktman Focused Fund, the Russell 1000® Value Index and the S&P 500® Index for the same time periods ended December 31, 2020.
| Average Annual Total Returns1 | One
Year | Five
Years | Ten
Years | Since
Inception | Inception
Date |
| AMG Yacktman Focused Fund2, 3, 4, 5, 6, 7, 8, 9, 10, 11, 12, 13 |
| Class N | 17.26% | 13.93% | 11.77% | 10.12% | 05/01/97 |
| Class I | 17.52% | 14.14% | — | 12.79% | 07/24/12 |
| Russell 1000® Value Index14 | 2.80% | 9.74% | 10.50% | 8.08% | 05/01/97† |
| S&P 500® Index15 | 18.40% | 15.22% | 13.88% | 8.79% | 05/01/97† |
Effective June 30, 2020, the Yacktman Fund’s primary and secondary benchmarks were changed to the Russell 1000® Value Index becoming the primary benchmark and S&P 500® Index the secondary benchmark from the S&P 500® Index as the primary benchmark and the Russell 1000® Value Index as the secondary benchmark previously.
The performance data shown represents past performance. Past performance is not a guarantee of future results. Current performance may be lower or higher than the performance data quoted. The investment return and principal value of an investment will fluctuate so that an investor’s shares, when redeemed, may be worth more or less than their original cost.
Investors should carefully consider the Fund’s investment objectives, risks, charges and expenses before investing. For performance information through the most recent month end, current net asset values per share for the Fund and other information, please call 800.548.4539 or visit our website at amgfunds.com for a free prospectus. Read it carefully before investing or sending money.
Distributed by AMG Distributors, Inc., member FINRA/SIPC.
| † | Date reflects the inception date of the Fund, not the index. |
| | 1 | Total return equals income yield plus share price change and assumes reinvestment of all dividends and capital gain distributions. Returns are net of fees and may reflect offsets of Fund expenses as described in the prospectus. No adjustment has been made for taxes payable by shareholders on their reinvested dividends and capital gain distributions. Returns for periods greater than one year are annualized. The listed returns on the Fund are net of expenses and based on the published NAV as of December 31, 2020. All returns are in U.S. dollars ($). |
| | | |
| | 2 | From time to time the Fund’s investment manager has waived its fees and/or absorbed Fund expenses, which has resulted in higher returns. |
| | | |
| | 3 | The Fund may suffer significant losses on assets that it sells short. Unlike the possible loss on a security that is purchased, there is no limit on the amount of loss on an appreciating security that is sold short. |
| | | |
| | 4 | The Fund is subject to the risks associated with investments in debt securities, such as default risk and fluctuations in the perception of the debtor’s ability to pay its creditors. Changing interest rates may adversely affect the value of an investment. An increase in interest rates typically causes the value of bonds and other fixed income securities to fall. |
| | | |
| | 5 | The Fund may invest in derivatives such as options and futures; the complexity and rapidly changing structure of derivatives markets may increase the possibility of market losses. |
| | | |
| | 6 | A greater percentage of the Fund’s holdings may be focused in a smaller number of securities which may place the Fund at greater risk than a more diversified fund. |
| | | |
| | 7 | High-yield bonds (also known as “junk bonds”) may be subject to greater levels of interest rate, credit, and liquidity risk than investments in higher rated securities. These securities are considered predominantly speculative with respect to the issuer’s continuing ability to make principal and interest payments. The issuers of the Fund’s holdings may be involved in bankruptcy proceedings, reorganizations, or financial restructurings, and are not as strong financially as higher-rated issuers. |
| | | |
| | 8 | Investments in international securities are subject to certain risks of overseas investing including currency fluctuations and changes in political and economic conditions, which could result in significant market fluctuations. These risks are magnified in emerging markets. |
| | | |
| | 9 | Companies that are in similar businesses may be similarly affected by particular economic or market events; to the extent the Fund has substantial holdings within a particular sector, the risks associated with that sector increase. |
| | |
| | AMG Yacktman Focused Fund |
| | Portfolio Manager’s Comments (continued) |
10 The Fund is subject to risks associated with investments in mid-capitalization companies such as greater price volatility, lower trading volume, and less liquidity than the stocks of larger, more established companies. 11 The Fund is subject to risks associated with investments in small-capitalization companies, such as erratic earnings patterns, competitive conditions, limited earnings history and a reliance on one or a limited number of products. 12 The Fund invests in value stocks, which may perform differently from the market as a whole and may be undervalued by the market for a long period of time. | | 13 Market prices of investments held by the Fund may fall rapidly or unpredictably due to a variety of economic or political factors, market conditions, disasters or public health issues, or in response to events that affect particular industries or companies. 14 The Russell 1000® Value Index is a market capitalization weighted index that measures the performance of those Russell 1000® companies with lower price-to-book ratios and lower forecasted growth values. Unlike the Fund, the Russell 1000® Value Index is unmanaged, is not available for investment and does not incur expenses. 15 The S&P 500® Index is a capitalization-weighted index of 500 stocks. The S&P 500® Index is | designed to measure performance of the broad domestic economy through changes in the aggregate market value of 500 stocks representing all major industries. Unlike the Fund, the S&P 500® Index is unmanaged, is not available for investment and does not incur expenses. The Russell 1000® Value Index is a trademark of the London Stock Exchange Group companies. The S&P 500® Index is proprietary data of Standard & Poor’s, a division of McGraw-Hill Companies, Inc. Not FDIC insured, nor bank guaranteed. May lose value. |
| | AMG Yacktman Focused Fund Fund Snapshots (unaudited) December 31, 2020 |
| PORTFOLIO BREAKDOWN |
| |
| Sector | % of
Net Assets |
| Consumer Staples | 19.5 | |
| Information Technology | 18.8 | |
| Communication Services | 16.3 | |
| Consumer Discretionary | 12.2 | |
| Industrials | 7.3 | |
| Financials | 5.7 | |
| Health Care | 1.9 | |
| Materials | 1.6 | |
| Energy | 1.5 | |
| Short-Term Investments | 15.0 | |
| Other Assets Less Liabilities | 0.2 | |
TOP TEN HOLDINGS
| Security Name | | % of
Net Assets |
| Samsung Electronics Co., Ltd., 1.340% (South Korea) | | 13.1 |
| Bollore SA (France) | | 5.4 |
| Brenntag AG (Germany) | | 3.5 |
| Associated British Foods PLC (United Kingdom) | | 3.1 |
| Sysco Corp. | | 2.9 |
| The Walt Disney Co. | | 2.7 |
| Fox Corp., Class B | | 2.7 |
| Alphabet, Inc., Class C | | 2.7 |
| PepsiCo, Inc. | | 2.6 |
| News Corp., Class A | | 2.6 |
| Top Ten as a Group | | 41.3 |
Because a fund’s strategy may result in multiple investments in particular sectors of the economy, its performance may depend on the performance of those sectors and may fluctuate more widely than investments diversified across more sectors. For additional information on these and other risk considerations, please see the Fund’s prospectus.
Any sectors, industries, or securities discussed should not be perceived as investment recommendations. Mention of a specific security should not be considered a recommendation to buy or solicitation to sell that security. Specific securities mentioned in this report may have been sold from the Fund’s portfolio of investments by the time you receive this report.
| | AMG Yacktman Focused Fund Fund Snapshots (continued) For the six months ended December 31, 2020 |
NEW EQUITY POSITIONS
| New Purchases | Current
Shares Held |
| The Charles Schwab Corp. | 855,000 |
| Hyundai Mobis Co., Ltd. (South Korea) | 260,000 |
| Tyson Foods, Inc., Class A | 700,000 |
CORPORATE BONDS & NOTES SALES
| Sales | Net Principal
Sold | Current Principal
Held |
| Service Properties Trust, 4.350%, | | |
| 10/01/24 | $3,495,000 | $12,174,000 |
| Service Properties Trust, 4.500%, | | |
| 03/15/25 | 3,505,000 | — |
| Service Properties Trust, 4.650%, | | |
| 03/15/24 | 5,335,000 | — |
| Six Flags Entertainment Corp., 5.500%, | | |
| 04/15/27 | 8,485,000 | — |
EQUITY PURCHASES & SALES
| Purchases | Net Shares
Purchased | Current Shares
Held |
| Ingredion, Inc. | 360,000 | 540,000 |
| KT&G Corp. (South Korea) | 665,000 | 900,000 |
| Yuasa Trading Co., Ltd. (Japan) | 81,500 | 332,500 |
| Sales | Net Shares
Sold | Current Shares
Held |
| Alphabet, Inc., Class C | 3,000 | 56,000 |
| Booking Holdings, Inc. | 6,000 | 40,000 |
| Cisco Systems, Inc. | 300,000 | 300,000 |
| Continental AG (Germany) | 470,000 | 400,000 |
| Fox Corp., Class B | 1,000,000 | 3,450,000 |
| Johnson & Johnson | 20,000 | 430,000 |
| Macy’s, Inc. | 2,500,000 | 6,500,000 |
| Microsoft Corp. | 20,000 | 410,000 |
| Oracle Corp. | 280,000 | 250,000 |
| Qurate Retail, Inc., Series A | 900,000 | — |
| Samsung Electronics Co., Ltd., 1.340% (South Korea) | 3,350,000 | 7,050,000 |
| The Walt Disney Co. | 100,000 | 550,000 |
| | AMG Yacktman Focused Fund Schedule of Portfolio Investments December 31, 2020 |
| | Shares | Value | |
| Common Stocks - 68.7% | | | |
| Communication Services - 16.3% | | | |
| Alphabet, Inc., Class C* | 56,000 | $98,105,280 | |
| Bollore SA (France) | 47,746,528 | 197,677,781 | |
| Fox Corp., Class B | 3,450,000 | 99,636,000 | |
| News Corp., Class A | 5,145,915 | 92,472,093 | |
| News Corp., Class B | 200,000 | 3,554,000 | |
| The Walt Disney Co.* | 550,000 | 99,649,000 | |
| Total Communication Services | | 591,094,154 | |
| Consumer Discretionary - 12.2% | | | |
| Booking Holdings, Inc.* | 40,000 | 89,090,800 | |
| Continental AG (Germany) | 400,000 | 59,534,111 | |
| Hyundai Home Shopping Network Corp. (South Korea) | 547,254 | 41,166,715 | |
| Hyundai Mobis Co., Ltd. (South Korea) | 260,000 | 61,195,202 | |
| Macy’s, Inc. | 6,500,000 | 73,125,000 | |
| Ralph Lauren Corp. | 183,000 | 18,984,420 | |
| Rinnai Corp. (Japan) | 276,000 | 32,082,831 | |
| Sodexo, S.A. (France) | 800,000 | 67,658,986 | |
| Stanley Electric Co., Ltd. (Japan) | 75,832 | 2,446,299 | |
| Total Consumer Discretionary | | 445,284,364 | |
| Consumer Staples - 19.1% | | | |
| Ambev S.A., ADR (Brazil) | 7,000,000 | 21,420,000 | |
| Associated British Foods PLC (United Kingdom)* | 3,700,000 | 114,236,334 | |
| The Coca-Cola Co. | 1,300,000 | 71,292,000 | |
| |
| Hengan International Group Co., Ltd. (China) | 5,872,300 | 41,579,381 | |
| Ingredion, Inc. | 540,000 | 42,481,800 | |
| |
| KT&G Corp. (South Korea)* | 900,000 | 68,909,074 | |
| PepsiCo, Inc. | 650,000 | 96,395,000 | |
| |
| The Procter & Gamble Co. | 630,000 | 87,658,200 | |
| |
| Sysco Corp. | 1,400,000 | 103,964,000 | |
| Tyson Foods, Inc., Class A | 700,000 | 45,108,000 | |
| |
| Total Consumer Staples | | 693,043,789 | |
| Energy - 1.0% | | | |
| ConocoPhillips | 300,000 | 11,997,000 | |
| Exxon Mobil Corp. | 250,000 | 10,305,000 | |
| |
| Weatherford International PLC* | 2,421,818 | 14,530,908 | |
| |
| Total Energy | | 36,832,908 | |
| |
| Financials - 5.4% | | | |
| The Bank of New York Mellon Corp. | 650,000 | 27,586,000 | |
| The Charles Schwab Corp. | 855,000 | 45,349,200 | |
| |
| First Hawaiian, Inc. | 696,000 | 16,411,680 | |
| |
| State Street Corp. | 800,000 | 58,224,000 | |
| | | | |
| | | Shares | Value | |
| U.S. Bancorp | | 750,000 | $34,942,500 | |
| Wells Fargo & Co. | | 500,000 | 15,090,000 | |
| Total Financials | | | 197,603,380 | |
| Health Care - 1.9% | | | |
| Johnson & Johnson | | 430,000 | 67,673,400 | |
| Industrials - 5.5% | | | |
| Aggreko PLC (United Kingdom) | 2,890,601 | 24,778,667 | |
| Brenntag AG (Germany) | 1,650,000 | 128,306,530 | |
| Mitsuboshi Belting, Ltd. (Japan) | 91,535 | 1,508,901 | |
| MSC Industrial Direct Co., Inc., Class A | 220,000 | 18,565,800 | |
| Societe BIC, S.A. (France) | 300,000 | 16,970,733 | |
| Yuasa Trading Co., Ltd. (Japan) | 332,500 | 10,693,680 | |
| Total Industrials | | | 200,824,311 | |
| Information Technology - 5.7% | | | |
| Cisco Systems, Inc. | | 300,000 | 13,425,000 | |
| Cognizant Technology Solutions Corp., Class A | 1,050,000 | 86,047,500 | |
| Microsoft Corp. | | 410,000 | 91,192,200 | |
| Oracle Corp. | | 250,000 | 16,172,500 | |
| Total Information Technology | | 206,837,200 | |
| Materials - 1.6% | | | | |
| Huntsman Corp. | | 1,600,000 | 40,224,000 | |
| Nihon Parkerizing Co., Ltd. (Japan) | 1,868,100 | 19,376,951 | |
| Total Materials | | | 59,600,951 | |
| Total Common Stocks | | | |
| (Cost $1,891,685,903) | | 2,498,794,457 | |
| | | | | |
| | | Principal | | |
| | | Amount | | |
| Corporate Bonds and Notes - 2.6% | | | |
| Energy - 0.5% | | | | |
| W&T Offshore, Inc. | | | | |
| 9.750%, 11/01/231 | | $22,824,000 | 16,147,980 | |
| Financials - 0.3% | | | |
| Service Properties Trust | | | |
| 4.350%, 10/01/24 | | 12,174,000 | 12,021,825 | |
| Industrials - 1.8% | | | |
| Macy’s Retail Holdings, LLC | | | |
| 2.875%, 02/15/23 | | 6,823,000 | 6,558,609 | |
| 3.625%, 06/01/24 | | 1,720,000 | 1,634,000 | |
| Weatherford International, Ltd. (Bermuda) | | | |
| 11.000%, 12/01/241 | | 74,388,000 | 58,022,640 | |
| Total Industrials | | | 66,215,249 | |
| Total Corporate Bonds and Notes | | |
| (Cost $115,601,423) | | | 94,385,054 | |
| | | | | |
| | | | | |
| | | | | |
| | | | | |
| | | | | |
The accompanying notes are an integral part of these financial statements.
| | AMG Yacktman Focused Fund Schedule of Portfolio Investments (continued) |
| | Shares | Value | |
| Preferred Stocks - 13.5% | | | |
| Consumer Staples - 0.4% | | | |
| Amorepacific Corp., 1.060% (South Korea) | 250,000 | $14,288,758 | |
| |
| Information Technology - 13.1% | | | |
| Samsung Electronics Co., Ltd., 1.340% (South | | | |
| Korea) | 7,050,000 | 478,250,593 | |
| Total Preferred Stocks | | | |
| (Cost $137,074,156) | | 492,539,351 | |
| Short-Term Investments - 15.0% | | | |
| Other Investment Companies - 15.0% | | | |
| Dreyfus Government Cash Management Fund, | | | |
| Institutional Shares, 0.03%2 | 228,482,486 | 228,482,486 | |
| JPMorgan U.S. Government Money Market Fund, | | | |
| IM Shares, 0.03%2 | 319,225,119 | 319,225,119 | |
| Total Short-Term Investments | | | |
| (Cost $547,707,605) | | 547,707,605 | |
| | | | |
| | Value | |
| Total Investments - 99.8% | | |
| (Cost $2,692,069,087) | $3,633,426,467 | |
| Other Assets, less Liabilities - 0.2% | 5,810,525 | |
| Net Assets - 100.0% | $3,639,236,992 | |
| | | |
| | | |
| | | |
| | | |
| | | |
| | | |
| | | |
| | | |
| | | |
| | | |
| | | |
| | | |
| | | |
| | | |
| | | |
| * | Non-income producing security. |
| 1 | Security exempt from registration under Rule 144A of the Securities Act of 1933. This security may be resold in transactions exempt from registration, normally to qualified institutional buyers. At December 31, 2020, the value of these securities amounted to $74,170,620 or 2.0% of net assets. |
| 2 | Yield shown represents the December 31, 2020, seven day average yield, which refers to the sum of the previous seven days’ dividends paid, expressed as an annual percentage. |
ADR American Depositary Receipt
The accompanying notes are an integral part of these financial statements.
| | AMG Yacktman Focused Fund Schedule of Portfolio Investments (continued) |
The following table summarizes the inputs used to value the Fund’s investments by the fair value hierarchy levels as of December 31, 2020:
| | | Level 1 | | Level 21 | | Level 3 | | Total |
| Investments in Securities | | | | | | | | |
| Common Stocks | | | | | | | | |
| Consumer Staples | | $468,319,000 | | $224,724,789 | | — | | $693,043,789 |
| Communication Services | | 393,416,373 | | 197,677,781 | | — | | 591,094,154 |
| Consumer Discretionary | | 181,200,220 | | 264,084,144 | | — | | 445,284,364 |
| Information Technology | | 206,837,200 | | — | | — | | 206,837,200 |
| Industrials | | 18,565,800 | | 182,258,511 | | — | | 200,824,311 |
| Financials | | 197,603,380 | | — | | — | | 197,603,380 |
| Health Care | | 67,673,400 | | — | | — | | 67,673,400 |
| Materials | | 40,224,000 | | 19,376,951 | | — | | 59,600,951 |
| Energy | | 36,832,908 | | — | | — | | 36,832,908 |
| Corporate Bonds and Notes† | | — | | 94,385,054 | | — | | 94,385,054 |
| Preferred Stocks† | | — | | 492,539,351 | | — | | 492,539,351 |
| Short-Term Investments | | | | | | | | |
| Other Investment Companies | | 547,707,605 | | — | | — | | 547,707,605 |
| Total Investments in Securities | | $2,158,379,886 | | $1,475,046,581 | | — | | $3,633,426,467 |
| † | All corporate bonds and notes and preferred stocks held in the Fund are level 2 securities. For a detailed breakout of corporate bonds and notes and preferred stocks by major industry classification, please refer to the Fund’s Schedule of Portfolio Investments. |
| 1 | An external pricing service is used to reflect any impact on security value due to market movements between the time the Fund valued such foreign securities and the earlier closing of foreign markets. |
For the fiscal year ended December 31, 2020, there were no transfers in or out of Level 3.
The country allocation in the Schedule of Portfolio Investments at December 31, 2020, was as follows:
| Country | % of Long-Term
Investments |
| | | |
| Bermuda | 1.9 | |
| Brazil | 0.7 | |
| China | 1.3 | |
| France | 9.2 | |
| Germany | 6.1 | |
| Japan | 2.1 | |
| South Korea | 21.5 | |
| United Kingdom | 4.5 | |
| United States | 52.7 | |
| | 100.0 | |
The accompanying notes are an integral part of these financial statements.
| | AMG Yacktman Focused Fund - Security Selection Only Portfolio Manager’s Comments (unaudited) |
We hope you have managed through the difficulties of 2020 as safely and healthily as possible. In 2020, the AMG Focused Fund – Security Selection Only (the Fund) Class N shares delivered strong results compared to the Russell 1000® Value Index with the Fund appreciating 18.32% compared to a 2.80% return for the benchmark (and with a return in line with the secondary benchmark, the S&P 500® Index, which returned 18.40%). We were able to use market declines to bargain hunt and add many new positions to the Fund. Due to its flexible mandate and smaller asset base, the Fund is able to own smaller market cap companies than some of our other funds, and we utilized that capability in 2020. While investors have enjoyed high rates of return for the last decade, they have likely set up low returns for the major indices over the long term. These high market prices do not concern us much for the Fund because we have a very flexible mandate that allows us to invest in bargains we are able to find without too much concern about market cap or geography. Getting Growth at Value Prices Many of our favorite investments today continue to be in complicated, mispriced, owner-operated conglomerates like Samsung Electronics Co., Ltd., Bollore SA, News Corp., and Associated British Foods PLC. Each of these companies has business units that are powerful and growing rapidly, along with other businesses that are substantial contributors to cash flow and sell at significant discounts to what we think they are worth. Several of these companies are in the process of unlocking value through better disclosure or separation of the stronger business units. Often these mispriced securities require a great deal of time and patience, which are qualities we take great pride in possessing, especially in an industry that affords few a true long-term approach. Contributors for the year included Samsung, HI-LEX Corp., and Waddell & Reed Samsung was the top contributor to results last year, and is our largest position. The company has a strong market position in high growth markets, including foundry, sensors, and 5G equipment, and a good position in emerging industries like artificial intelligence, autonomous driving, and internet of | things, yet it sells at an extremely low multiple of earnings and cash flow and has a significant amount of net excess net cash and securities on the balance sheet. Samsung’s core semiconductor business is set up for high growth over the next few years, and we think the stock could be in an early phase of positive re-rating, which is a period where a stock goes from a low multiple to a substantially higher one that better reflects the company’s business prospects. HI-LEX Corp., a small but super-inexpensive manufacturer of control cables for automobiles, had strong results in 2020. At the modest fund size, we are able to take positions in smaller market cap companies, and HI-LEX is an example of how that flexibility can provide strong rewards. Waddell & Reed Financial, Inc., a small diversified financial services company, was another contributor to results. We bought the shares at an extremely low valuation during the first quarter declines and were pleased when the company agreed to be acquired by Macquaire for a significant premium. Detractors included Weatherford, Amorepacific, and Macy’s Weatherford International PLC’s equity and debt detracted from results due to general weakness in the energy sector. Although fundamentals were challenging during the year, management was able to downsize the business and navigate through the challenges reasonably well. We expect to see better results as the economy improves in 2021. Amorepacific Corp. preferred declined last year as the discount to common shares increased. At the preferred price, Amorepacific trades at less than 1 X sales, which is a remarkable discount to global peers like Estee Lauder and L’Oreal, which are at approximately 6x price to sales. Macy’s, Inc. suffered from shutdowns in 2020 much like Weatherford. Its core retail business suffered and the value of its real estate was impaired, especially in cities like New York and San Francisco. Due to the huge price swings in the stock, we were able to purchase additional shares at low prices during the declines and then reduce our holding as the stock nearly doubled in the fourth quarter alone. | Have the rules of investing changed? At times, a long-term change in rules can create a significant impact. Perhaps we are in an environment where securities sell at higher prices versus prior eras due to central banking, but the net result of the higher prices will be lower long-term returns. In 1968 baseball pitchers dominated hitters, causing low-scoring games that were less popular with fans. The following year, the height of the pitcher’s mound was reduced from 15 inches to 10 inches, where it remains today, and hitters and average runs per game increased from 3.42 to 4.07, although some of the increase likely came from new teams being added to the league (ESPN article, March 8, 2019). Stock returns are largely a result of free cash flow, growth, and multiple change, with most of the returns in recent years from the last variable. With the high-priced index offering a low free-cash-flow yield and likely a continuation of low growth, long-term index returns look challenging. We believe our approach of finding individual securities that we believe are mispriced and offer solid risk-adjusted returns is more important than ever when equities are expensive as they are today. Even if the rules have changed—and we would not argue they have—we have moved to prices where those who stopped thinking about risk will likely regret that decision at some point in the future. We will continue to work hard to find mispriced opportunities to deliver results over the long term while also considering risk. The time to be most aware of potential risks is when others completely ignore them. We never forget that the price you pay matters both for potential return and to mitigate losses if things turn out worse than you expected. We wish everyone the best for the new year and, as always, will be objective, patient, and diligent when managing the AMG Yacktman Focused Fund – Security Selection Only. The views expressed represent the opinions of Yacktman Asset Management LP as of December 31, 2020, are not intended as a forecast or guarantee of future results, and are subject to change without notice. |
| | AMG Yacktman Focused Fund - Security Selection Only Portfolio Manager’s Comments (continued) |
CUMULATIVE TOTAL RETURN PERFORMANCE
AMG Yacktman Focused Fund - Security Selection Only’s cumulative total return is based on the daily change in net asset value (NAV), and assumes that all dividends and distributions were reinvested. The graph compares a hypothetical $10,000 investment made in the AMG Yacktman Focused Fund - Security Selection Only’s Class N shares on January 30, 2017 (inception date), to a $10,000 investment made in the Russell 1000® Value Index and the S&P 500® Index for the same time period. The graph and table do not reflect the deduction of taxes that a shareholder would pay on a Fund distribution or redemption of shares. The listed returns for the Fund are net of expenses and the returns for the index exclude expenses. Total returns would have been lower had certain expenses not been reduced.
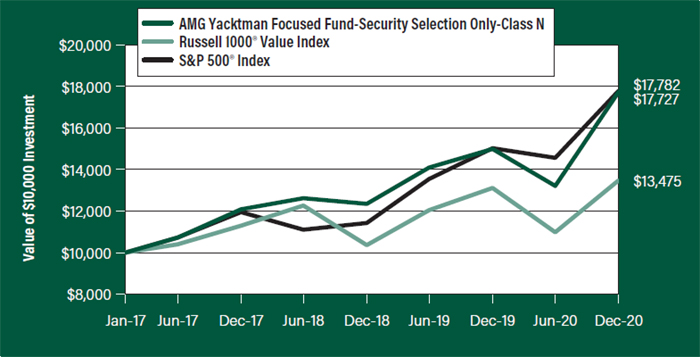
The table below shows the average annual total returns for the AMG Yacktman Focused Fund - Security Selection Only, the Russell 1000® Value Index and the S&P 500® Index for the same time periods ended December 31, 2020.
| Average Annual Total Returns1 | One
Year | Since
Inception | Inception
Date |
| AMG Yacktman Focused Fund - Security Selection Only2, 3, 4, 5, 6, 7, 8, 9, 10, 11, 12, 13, 14 |
| Class N | 18.32% | 15.74% | 01/30/17 |
| Class I | 18.47% | 15.76% | 01/30/17 |
| Russell 1000® Value Index15 | 2.80% | 7.91% | 01/30/17† |
| S&P 500® Index16 | 18.40% | 15.83% | 01/30/17† |
Effective June 30, 2020, the Yacktman Fund’s primary and secondary benchmarks were changed to the Russell 1000® Value Index becoming the primary benchmark and S&P 500® Index the secondary benchmark from the S&P 500® Index as the primary benchmark and the Russell 1000® Value Index as the secondary benchmark previously.
The performance data shown represents past performance. Past performance is not a guarantee of future results. Current performance may be lower or higher than the performance data quoted. The investment return and principal value of an investment will fluctuate so that an investor’s shares, when redeemed, may be worth more or less than their original cost.
Investors should carefully consider the Fund’s investment objectives, risks, charges and expenses before investing. For performance information through the most recent month end, current net asset values per share for the Fund and other information, please call 800.548.4539 or visit our website at amgfunds.com for a free prospectus. Read it carefully before investing or sending money.
Distributed by AMG Distributors, Inc., member FINRA/SIPC.
| † | Date reflects the inception date of the Fund, not the index. |
| 1 | Total return equals income yield plus share price change and assumes reinvestment of all dividends and capital gain distributions. Returns are net of fees and may reflect offsets of Fund expenses as described in the prospectus. No adjustment has been made for taxes payable by shareholders on their reinvested dividends and capital gain distributions. Returns for periods greater than one year are annualized. The listed returns on the Fund are net of expenses and based on the published NAV as of December 31, 2020. All returns are in U.S. dollars ($). |
| 2 | From time to time the Fund’s investment manager has waived its fees and/or absorbed Fund expenses, which has resulted in higher returns. |
| 3 | The Fund may invest greater than 5% of its assets in money market securities, cash, or cash equivalents as a temporary defensive measure in response to adverse market, economic, political or other conditions. |
| 4 | The Fund may suffer significant losses on assets that it sells short. Unlike the possible loss on a security that is purchased, there is no limit on the amount of loss on an appreciating security that is sold short. |
| 5 | The Fund is subject to the risks associated with investments in debt securities, such as default risk and fluctuations in the perception of the debtor’s ability to pay its creditors. Changing interest rates may adversely affect the value of an investment. An increase in interest rates typically causes the value of bonds and other fixed income securities to fall. |
| 6 | The Fund invests in value stocks, which may perform differently from the market as a whole and may be undervalued by the market for a long period of time. |
| 7 | The Fund may invest in derivatives such as options and futures; the complexity and rapidly changing structure of derivatives markets may increase the possibility of market losses. |
| 8 | A greater percentage of the Fund’s holdings may be focused in a smaller number of securities which may place the Fund at greater risk than a more diversified fund. |
| 9 | High-yield bonds (also known as “junk bonds”) may be subject to greater levels of interest rate, credit, and liquidity risk than investments in higher rated securities. These securities are considered predominantly speculative with respect to the issuer’s continuing ability to make principal and interest payments. The issuers of the Fund’s holdings may be involved in bankruptcy proceedings, reorganizations, or financial |
| | AMG Yacktman Focused Fund - Security Selection Only Portfolio Manager’s Comments (continued) |
restructurings, and are not as strong financially as higher-rated issuers. 10 Investments in international securities are subject to certain risks of overseas investing including currency fluctuations and changes in political and economic conditions, which could result in significant market fluctuations. These risks are magnified in emerging markets. 11 Companies that are in similar businesses may be similarly affected by particular economic or market events; to the extent the Fund has substantial holdings within a particular sector, the risks associated with that sector increase. 12 The Fund is subject to risks associated with investments in mid-capitalization companies such as greater price volatility, lower trading volume, and less liquidity than the stocks of larger, more established companies. | 13 The Fund is subject to risks associated with investments in small-capitalization companies, such as erratic earnings patterns, competitive conditions, limited earnings history and a reliance on one or a limited number of products. 14 Market prices of investments held by the Fund may fall rapidly or unpredictably due to a variety of economic or political factors, market conditions, disasters or public health issues, or in response to events that affect particular industries or companies. 15 The Russell 1000® Value Index is a market capitalization weighted index that measures the performance of those Russell 1000® companies with lower price-to-book ratios and lower forecasted growth values. Unlike the Fund, the Russell 1000® Value Index is unmanaged, is not available for investment and does not incur expenses. | 16 The S&P 500® Index is a capitalization-weighted index of 500 stocks. The S&P 500® Index is designed to measure performance of the broad domestic economy through changes in the aggregate market value of 500 stocks representing all major industries. Unlike the Fund, the S&P 500® Index is unmanaged, is not available for investment and does not incur expenses. The Russell 1000® Value Index is a trademark of the London Stock Exchange Group companies. The S&P 500® Index is proprietary data of Standard & Poor’s, a division of McGraw-Hill Companies, Inc. Not FDIC insured, nor bank guaranteed. May lose value. |
| | AMG Yacktman Focused Fund - Security Selection Only Fund Snapshots (unaudited) December 31, 2020 |
| PORTFOLIO BREAKDOWN |
| |
| Sector | % of
Net Assets |
| Information Technology | 21.6 | |
| Consumer Discretionary | 18.5 | |
| Communication Services | 16.9 | |
| Industrials | 15.0 | |
| Consumer Staples | 12.4 | |
| Financials | 6.3 | |
| Materials | 3.4 | |
| Health Care | 1.6 | |
| Energy | 0.7 | |
| Short-Term Investments | 3.5 | |
| Other Assets Less Liabilities | 0.1 | |
TOP TEN HOLDINGS
| Security Name | | % of
Net Assets |
| Samsung Electronics Co., Ltd., 1.340% (South Korea) | | 14.8 |
| HI-LEX Corp. (Japan) | | 6.9 |
| Bollore SA (France) | | 6.4 |
| Ocean Wilsons Holdings, Ltd. (Bermuda) | | 3.5 |
| Financiere de L’Odet SA (France) | | 3.2 |
| Fox Corp., Class B | | 2.6 |
| CAC Holdings Corp. (Japan) | | 2.5 |
| Brenntag AG (Germany) | | 2.3 |
| Waddell & Reed Financial, Inc., Class A | | 2.3 |
| Hyundai Home Shopping Network Corp. (South Korea) | | 2.2 |
| Top Ten as a Group | | 46.7 |
Because a fund’s strategy may result in multiple investments in particular sectors of the economy, its performance may depend on the performance of those sectors and may fluctuate more widely than investments diversified across more sectors. For additional information on these and other risk considerations, please see the Fund’s prospectus.
Any sectors, industries, or securities discussed should not be perceived as investment recommendations. Mention of a specific security should not be considered a recommendation to buy or solicitation to sell that security. Specific securities mentioned in this report may have been sold from the Fund’s portfolio of investments by the time you receive this report.
| | AMG Yacktman Focused Fund - Security Selection Only Fund Snapshots (continued) For the six months ended December 31, 2020 |
NEW EQUITY POSITIONS
| New Purchases | Current
Shares Held |
| The Charles Schwab Corp. | 30,000 |
| Hyundai Mobis Co., Ltd. (South Korea) | 5,000 |
| Ingredion, Inc. | 8,500 |
| KT&G Corp. (South Korea) | 32,000 |
| Trecora Resources | 90,000 |
CORPORATE BONDS & NOTES SALES
| Sales | Net Principal
Sold | Current Principal
Held | |
| Helix Energy Solutions Group, Inc., | | | |
| 4.125%, 09/15/23 | $1,500,000 | — | |
EQUITY PURCHASES & SALES
| Purchases | Net Shares
Purchased | Current Shares
Held | |
| Bollore SA (France) | 54,280 | 2,059,686 | |
| HI-LEX Corp. (Japan) | 367,800 | 617,800 | |
| Ocean Wilsons Holdings, Ltd. (Bermuda) | 50,000 | 400,000 | |
| Utoc Corp. (Japan) | 16,800 | 236,800 | |
| Sales | | |
Net Shares
Sold | Current Shares
Held |
| Arcosa, Inc. | 17,000 | — |
| Cisco Systems, Inc. | 10,000 | 10,000 |
| ConocoPhillips | 3,500 | — |
| Continental AG (Germany) | 16,000 | 10,000 |
| Fox Corp., Class B | 21,000 | 119,000 |
| Macy’s, Inc. | 60,000 | 250,000 |
| Oracle Corp. | 8,000 | 9,000 |
| PepsiCo, Inc. | 2,000 | 14,000 |
| Qurate Retail, Inc., Series A | 40,000 | — |
| Qwest Corp., 6.625% | 2,500 | — |
| Qwest Corp., 6.750% | 7,500 | — |
| Qwest Corp., 6.875%1 | 8,760 | — |
| Rinnai Corp. (Japan) | 16,200 | 20,000 |
| Samsung Electronics Co., Ltd., 1.340% | | |
| (South Korea) | 20,000 | 290,000 |
| The Walt Disney Co. | 2,000 | 16,000 |
| 1 Sales due to a corporate action. | | |
| | AMG Yacktman Focused Fund - Security Selection Only |
| | Schedule of Portfolio Investments |
| | December 31, 2020 |
| | | | Shares | Value | |
| Common Stocks - 77.8% | | | | |
| Communication Services - 16.9% | | | |
| Alphabet, Inc., Class C* | | 1,240 | $2,172,331 | |
| Bollore SA (France) | | | 2,059,686 | 8,527,409 | |
| Fox Corp., Class B | | | 119,000 | 3,436,720 | |
| News Corp., Class A | | | 150,000 | 2,695,500 | |
| Reading International, Inc., Class A*,1 | 320,000 | 1,606,400 | |
| Tohokushinsha Film Corp. (Japan) | | 200,000 | 1,213,812 | |
| The Walt Disney Co.* | | 16,000 | 2,898,880 | |
| Total Communication Services | | | 22,551,052 | |
| Consumer Discretionary - 18.5% | | | |
| Booking Holdings, Inc.* | | 1,000 | 2,227,270 | |
| Car Mate Manufacturing Co., Ltd. (Japan) | 52,500 | 421,441 | |
| Continental AG (Germany) | | 10,000 | 1,488,353 | |
| Daewon San Up Co., Ltd. (South Korea) | 96,817 | 493,794 | |
| Hankook AtlasBX Co., Ltd. (South Korea) | 17,985 | 935,235 | |
| HI-LEX Corp. (Japan) | | 617,800 | 9,201,506 | |
Hyundai Home Shopping Network Corp. (South Korea) | 39,314 | 2,957,362 | |
| Hyundai Mobis Co., Ltd. (South Korea) | 5,000 | 1,176,831 | |
| Macy’s, Inc. | | | 250,000 | 2,812,500 | |
| Ralph Lauren Corp. | | | 5,200 | 539,448 | |
| Rinnai Corp. (Japan) | | 20,000 | 2,324,843 | |
| Total Consumer Discretionary | | | 24,578,583 | |
| Consumer Staples - 10.0% | | | | |
| Associated British Foods PLC (United Kingdom)* | 65,000 | 2,006,855 | |
| The Coca-Cola Co. | | | 25,000 | 1,371,000 | |
| Hengan International Group Co., Ltd. (China) | 37,000 | 261,982 | |
| Ingredion, Inc. | | | 8,500 | 668,695 | |
| KT&G Corp. (South Korea)* | | 32,000 | 2,450,100 | |
| PepsiCo, Inc. | | | 14,000 | 2,076,200 | |
| The Procter & Gamble Co. | | 16,000 | 2,226,240 | |
| Sysco Corp. | | | 30,000 | 2,227,800 | |
| Total Consumer Staples | | | 13,288,872 | |
| Energy - 0.3% | | | | | |
| Exxon Mobil Corp. | | | 2,000 | 82,440 | |
| Weatherford International PLC* | | 57,005 | 342,030 | |
| Total Energy | | | 424,470 | |
| Financials - 6.3% | | | | |
| The Bank of New York Mellon Corp. | 10,000 | 424,400 | |
| |
| The Charles Schwab Corp. | | 30,000 | 1,591,200 | |
| First Hawaiian, Inc. | | | 24,900 | 587,142 | |
| State Street Corp. | | | 30,000 | 2,183,400 | |
| | | | | | |
| | | | |
| | Shares | Value | |
| U.S. Bancorp | 13,000 | $605,670 | |
| Waddell & Reed Financial, Inc., Class A | 120,000 | 3,056,400 | |
| Total Financials | | 8,448,212 | |
| Health Care - 1.6% | | | |
| Johnson & Johnson | 12,000 | 1,888,560 | |
| Kissei Pharmaceutical Co., Ltd. (Japan) | 9,400 | 204,109 | |
| Total Health Care | | 2,092,669 | |
| Industrials - 14.0% | | | |
| Aggreko PLC (United Kingdom) | 19,420 | 166,471 | |
| |
| Brenntag AG (Germany) | 40,000 | 3,110,461 | |
| |
| CB Industrial Product Holding Bhd (Malaysia) | 10,500,000 | 2,897,452 | |
| Financiere de L’Odet SA (France) | 4,500 | 4,314,513 | |
| Komelon Corp. (South Korea) | 80,000 | 656,722 | |
| Mitsuboshi Belting, Ltd. (Japan) | 2,965 | 48,876 | |
| MSC Industrial Direct Co., Inc., Class A | 7,000 | 590,730 | |
| Ocean Wilsons Holdings, Ltd. (Bermuda) | 400,000 | 4,632,312 | |
| Sam Yung Trading Co., Ltd. (South Korea) | 11,618 | 149,867 | |
| Utoc Corp. (Japan) | 236,800 | 1,085,293 | |
| Yuasa Trading Co., Ltd. (Japan) | 30,000 | 964,843 | |
| Total Industrials | | 18,617,540 | |
| Information Technology - 6.8% | | | |
| CAC Holdings Corp. (Japan) | 240,000 | 3,315,966 | |
| Cisco Systems, Inc. | 10,000 | 447,500 | |
| Cognizant Technology Solutions Corp., Class A | 30,000 | 2,458,500 | |
| INFOvine Co., Ltd. (South Korea) | 40,000 | 696,130 | |
| Microsoft Corp. | 7,000 | 1,556,940 | |
| Oracle Corp. | 9,000 | 582,210 | |
| Total Information Technology | | 9,057,246 | |
| Materials - 3.4% | | | |
| Kohsoku Corp. (Japan)1 | 90,000 | 1,430,283 | |
| Nihon Parkerizing Co., Ltd. (Japan) | 240,000 | 2,489,410 | |
| Trecora Resources* | 90,000 | 629,100 | |
| Total Materials | | 4,548,793 | |
| Total Common Stocks | | | |
| (Cost $87,428,876) | | 103,607,437 | |
| | | | |
| | Principal | | |
| | Amount | | |
| Corporate Bonds and Notes - 1.4% | | | |
| Energy - 0.4% | | | |
| W&T Offshore, Inc. | | | |
| 9.750%, 11/01/232 | $806,000 | 570,245 | |
| | | | |
| | | | |
| | | | |
| | | | |
The accompanying notes are an integral part of these financial statements.
| | AMG Yacktman Focused Fund - Security Selection Only |
| | Schedule of Portfolio Investments (continued) |
| | Principal | | |
| | Amount | Value | |
| Industrials - 1.0% | | | |
| Weatherford International, Ltd. (Bermuda) | | | |
| 11.000%, 12/01/242 | $1,721,000 | $1,342,380 | |
| Total Corporate Bonds and Notes | | | |
| (Cost $2,605,539) | | 1,912,625 | |
| Shares | | |
| Preferred Stocks - 17.2% | | | |
| Consumer Staples - 2.4% | | | |
| Amorepacific Corp., 1.060% (South Korea) | 25,000 | 1,428,876 | |
| LG Household & Health Care, Ltd., 1.470% (South Korea) | 2,100 | 1,389,177 | |
| QVC, Inc., 6.250% | 16,731 | 426,138 | |
| Total Consumer Staples | | 3,244,191 | |
| Information Technology - 14.8% | | | |
| Samsung Electronics Co., Ltd., 1.340% (South Korea) | 290,000 | 19,672,719 | |
| Total Preferred Stocks | | | |
| (Cost $12,665,580) | | 22,916,910 | |
| | | | |
| | Principal | | |
| | Amount | | |
| Short-Term Investments - 3.5% | | | |
| Joint Repurchase Agreements - 0.1%3 | | | |
| Citibank N.A., dated 12/31/20, due 01/04/21, | | | |
| 0.070% total to be received $128,530 | | | |
| (collateralized by various U.S. Government | | | |
| Agency Obligations and U.S. Treasuries, 1.375% | | | |
| - 6.000%, 07/01/24 - 02/15/50, totaling | | | |
| $131,206) | $128,529 | 128,529 | |
| | | | |
| | Shares | Value | |
| | |
| Other Investment Companies - 3.4% | | | |
| Dreyfus Government Cash Management Fund, Institutional Shares, 0.03%4 | 1,479,244 | $1,479,244 | |
| Dreyfus Institutional Preferred Government Money Market Fund, Institutional Shares, 0.03%4 | 1,479,247 | 1,479,247 | |
| JPMorgan U.S. Government Money Market Fund, IM Shares, 0.03%4 | 1,524,072 | 1,524,072 | |
| Total Other Investment Companies | | 4,482,563 | |
| | |
| Total Short-Term Investments | | | |
| (Cost $4,611,092) | | 4,611,092 | |
| Total Investments - 99.9% | | | |
| (Cost $107,311,087) | | 133,048,064 | |
| Other Assets, less Liabilities - 0.1% | | 141,291 | |
| Net Assets - 100.0% | | $133,189,355 | |
| | | | |
| | | | |
| | | | |
| | | | |
| | | | |
| | | | |
| | | | |
| | | | |
| | | | |
| | | | |
| | | | |
| | | | |
| | | | |
| | | | |
| | | | |
| | | | |
| * | Non-income producing security. |
| 1 | Some of these securities, amounting to $128,346 or 0.1% of net assets, were out on loan to various borrowers and are collateralized by cash and various U.S. Treasury Obligations. See Note 4 of Notes to Financial Statements. |
| 2 | Security exempt from registration under Rule 144A of the Securities Act of 1933. This security may be resold in transactions exempt from registration, normally to qualified institutional buyers. At December 31, 2020, the value of these securities amounted to $1,912,625 or 1.4% of net assets. |
| 3 | Cash collateral received for securities lending activity was invested in these joint repurchase agreements. |
| 4 | Yield shown represents the December 31, 2020, seven day average yield, which refers to the sum of the previous seven days’ dividends paid, expressed as an annual percentage. |
The accompanying notes are an integral part of these financial statements.
| | |
| | AMG Yacktman Focused Fund - Security Selection Only |
| | Schedule of Portfolio Investments (continued) |
The following table summarizes the inputs used to value the Fund’s investments by the fair value hierarchy levels as of December 31, 2020:
| | | Level 1 | | Level 21 | | Level 3 | | Total |
| Investments in Securities | | | | | | | | |
| Common Stocks | | | | | | | | |
| Consumer Discretionary | | $5,579,218 | | $18,999,365 | | — | | $24,578,583 |
| Communication Services | | 12,809,831 | | 9,741,221 | | — | | 22,551,052 |
| Industrials | | 3,488,182 | | 15,129,358 | | — | | 18,617,540 |
| Consumer Staples | | 8,569,935 | | 4,718,937 | | — | | 13,288,872 |
| Information Technology | | 5,045,150 | | 4,012,096 | | — | | 9,057,246 |
| Financials | | 8,448,212 | | — | | — | | 8,448,212 |
| Materials | | 629,100 | | 3,919,693 | | — | | 4,548,793 |
| Health Care | | 1,888,560 | | 204,109 | | — | | 2,092,669 |
| Energy | | 424,470 | | — | | — | | 424,470 |
| Corporate Bonds and Notes† | | — | | 1,912,625 | | — | | 1,912,625 |
| Preferred Stocks | | | | | | | | |
| Information Technology | | — | | 19,672,719 | | — | | 19,672,719 |
| Consumer Staples | | 426,138 | | 2,818,053 | | — | | 3,244,191 |
| Short-Term Investments | | | | | | | | |
| Joint Repurchase Agreements | | — | | 128,529 | | — | | 128,529 |
| Other Investment Companies | | 4,482,563 | | — | | — | | 4,482,563 |
| Total Investments in Securities | | $51,791,359 | | $81,256,705 | | — | | $133,048,064 |
| † | All corporate bonds and notes held in the Fund are level 2 securities. For a detailed breakout of corporate bonds and notes by major industry classification, please refer to the Fund’s Schedule of Portfolio Investments. |
| 1 | An external pricing service is used to reflect any impact on security value due to market movements between the time the Fund valued such foreign securities and the earlier closing of foreign markets. |
For the fiscal year ended December 31, 2020, there were no transfers in or out of Level 3.
The country allocation in the Schedule of Portfolio Investments at December 31, 2020, was as follows:
| Country | % of Long-Term
Investments |
| Bermuda | 4.6 | |
| China | 0.2 | |
| France | 10.0 | |
| Germany | 3.6 | |
| Japan | 17.7 | |
| Malaysia | 2.3 | |
| South Korea | 24.9 | |
| United Kingdom | 1.7 | |
| United States | 35.0 | |
| | 100.0 | |
The accompanying notes are an integral part of these financial statements.
| | |
| | AMG Yacktman Special Opportunities Fund |
| | Portfolio Manager’s Comments (unaudited) |
AMG Yacktman Special Opportunities Fund - Year-End Update - December 31, 2020 For the twelve months ending December 31, 2020, the AMG Yacktman Special Opportunities Fund (the Fund) Class I shares returned 12.66%, behind the 16.31% return of the MSCI All Country World All Cap Index (ACWI). Remember back to March—a 16.31% return for the year probably wouldn’t have even made the oddsmaker’s board if asked to make a prediction at the time. 2020 was a volatile year in the stock market, but let’s not forget the suffering around the world due to the impact of the COVID-19 virus. This was a tough year, no matter what the stock market said at the end. Our job is to manage the investment side, and on that front we are proud of the recovery from the March downturn and satisfied with the solid absolute performance. The market has been surprisingly resilient in the face of the year’s turmoil. We should acknowledge there are reasons for optimism with vaccines arriving in 2021, bringing the potential for a return to “normal.” We (and our families) look forward to that with relief. We imagine a big rush of demand in areas like travel and experiences, but we are not convinced that the pandemic’s economic and social damage will be brushed away so easily. How many people will look around in the second half of 2021 and find that “normal” means a lower standard compared to 2019? Yet in many areas, we are observing signs of speculative behavior that go far beyond any “re-opening” scenario. Exuberance is back, whether it’s the rise of special purpose acquisition companies (SPACs), enthusiasm for EV/battery companies, or the ever-higher sales multiples for technology companies (10x sales? Maybe the next investor will pay 20–50x?). Many of these companies benefited from 2020’s unique circumstances. The managers and retail investors who rode the wave are full of confidence. We’d characterize much of this as speculation or even gambling rather than rational investing where fundamentals and valuation matter. It stands to reason that future returns from here will likely be far below historical standards. Even many of the recovery plays (airlines, cruises, retail, and restaurants as examples) are now trading at normalized valuations above pre-pandemic levels, despite still facing many months of cash burn and lugging around expensive debt raised in the pandemic. It seems that the concept of risk or | downside protection is given scant attention in the face of rising prices. Why bother when stocks only go up? (Just don’t look at March.) We are determined not to get carried away by the crowd and remain focused on our core mission: buying above average businesses at below average prices and paying attention to risks. It might not be as popular, but we feel it’s necessary to protect capital over the longer term. Portfolio Year in Review One of our core tenets is that we are long-term investors. Almost 25% of current holdings have been in the Fund since inception. Our portfolio turnover is far below peers, yet we also strive to stay nimble and re-orient our thinking when facts or prices change. There were plenty of changes in both dimensions in 2020. This discipline led to a marked increase in Fund activity. We ended the year owning 51 positions versus 52 in 2019, so much of the activity was shifting the Fund toward achieving the best risk-adjusted returns. We remain concentrated with the top ten holdings at 50% of the portfolio, combined with a tail of smaller opportunities we hope to grow into larger weightings. Overall, one of our greatest assets is a strong investor base that understands our philosophy and believes in the long-term approach. Minimal withdrawals during March allowed us to buy aggressively almost every day during the initial drawdown. Much of this capital went into companies that we already owned and knew well. That conviction was rewarded, in some cases quite rapidly and profitably. For example, incremental purchases of our investment in GMO Pepabo (Pepabo) near the March lows more than tripled by the end of June. We also added a significant number of new ideas during the year, taking advantage of the selloff to refresh the holdings. Our investment performance in 2020 was not without flaws. We spent too much time on potential credit opportunities during the selloff when the future was murkiest, on the idea that debt must be repaid no matter what happens in the pandemic. We’ve had tremendous success in this area before and managed to deploy some capital, but the opportunity was quickly taken away by government actions propping up the debt markets. In hindsight, that research time would have been better used elsewhere. We also re-allocated away from some ideas that held up in March (for example, Naked Wines) toward companies that had far sharper stock price declines. | The pandemic turbocharged Naked Wines’ business and our trimming proved far too early. We also did not completely escape some of the more disrupted sectors with exposure to names like Reading International (cinemas) and Total Energy (oil & gas services). However, most of our companies muddled through a challenging environment. Profits will decline this year but the businesses remained cash flow positive with strong balance sheets. We are confident in their potential to bounce back quickly as life normalizes in 2021 and beyond. Overall, our actions added value relative to where the portfolio started the year. Valuations in our portfolio holdings are still conservative, and many still have a long way to go to reach pre-pandemic levels (and further still to our estimates of fair value). In an environment characterized by low expected returns and outsized risks, we believe our portfolio is well positioned. Surfing the Investment Landscape Reading far and wide is a core element of our investment process. Much of this reading might appear boring to an outsider—years of annual reports, financial footnotes, conference call transcripts, trade articles, and business biographies. Occasionally, we take a break and read beyond the investing and finance sphere. The standout this year was a book called Barbarian Days: A Surfing Life by William Finnegan. A memoir about the author’s life as a surfer since the 1960s, the book is a fascinating tale of adventure and discovery. Finnegan writes about his “search for the perfect wave,” a journey that carried him all over the world. It was a nice break from the markets, but we couldn’t help but relate some of the stories back to investing. In San Francisco, Finnegan surfed the cold winter ocean with a friend named Doc. Describing the conditions at Ocean Beach, Finnegan wrote, “on bigger days, when you’re looking out from the water’s edge across a stepladder of six or seven walls of cold, growling, onrushing white water, the idea of paddling out actually carries with it a whiff of lunacy. The project looks impossible, like trying to swim up a waterfall.” How many investment ideas look scary at first glance, only to find the ideal setup for those willing to look past the surface conditions? Many of our opportunities could qualify where complicated accounting or a convoluted corporate structure may turn off other investors. All else equal, we prefer simplicity. It’s easy to buy the household names that everyone recognizes. It’s sometimes harder, but more worthwhile, to uncover the hidden gems. |
| | |
| | AMG Yacktman Special Opportunities Fund |
| | Portfolio Manager’s Comments (continued) |
Or consider Kirra, a famous wave in Australia considered one of the world’s top ten surfing spots when Finnegan visited in the late 1970s. “The longest tube rides of my life,” he said. Yet a few years later, a major ocean dredging project caused the wave at Kirra to all but disappear. Investment opportunities, especially the best ones, are not immune to outside influences. A change in competitive dynamics can blindside a once-strong company. In other cases, prices catch up to the fundamental story, and future returns are quickly compressed. Great ideas, like surfing spots, are often rare. Our goal is to make the top ideas count. A favorite anecdote is from the initial part of Finnegan’s surfing trip around the world. Journeying through the South Pacific, Finnegan ended up in Fiji where he heard rumors about a great wave off an uninhabited island called Tavarua. The location was remote and to our non-surfer ears sounded unpleasant (no shelter, a lack of fresh water, and described as “very snaky”). The surfers also had to be patient, waiting on the island for a week or more with no surfing action. Then, with the right conditions and swell, Tavarua turned into a “dream wave,” the closest Finnegan had seen to perfection. “I had never, in a lifetime of surfing, been confronted with such abundance.” After surfing for weeks, Finnegan said, “by the time we left Tavarua that year, we figured nine surfers knew about the wave…in the small world of surfing, the wave was a major discovery.” His description of Tavarua mirrors our love of the investment process. In the age of the internet and widespread financial data, basic information on companies worldwide is accessible to most investors. Yet there are many structural reasons why opportunities show up in overlooked companies. To be clear, a “perfect” business isn’t a requirement for our process, as the very best companies are often also priced to perfection. Average businesses at amazing prices can qualify as well. However, there are times, usually after tireless exploration in forgotten or overlooked areas of the market, when the right company shows up at the right price—and the market just misses it. Looking around, it can feel like nobody else in the market is seeing the potential in the same way. Since the inception of the Fund, there have been a few cases where the investment setup was just perfect…and we were duly rewarded. We hope to find more Tavaruas (while avoiding the snakes). Contributors/Detractors: The top three contributors for the year were Naked Wines PLC, GMO Pepabo, Inc., and Italian Wine S.P.A. (IWB). Naked Wines was the largest contributor by a | wide margin, more than tripling its stock price during the year. As an online wine subscription business, the company was a massive beneficiary of the stay-at-home environment. In a stroke of favorable timing, management sold off the legacy retail wine business at the end of 2019. Heading into 2020, the company held a large cash position and the ability to focus on the online business…and just in time. Naked Wines is the fastest growing business we own, growing sales by more than 80% in the first half of 2020. Unlike some companies which saw a considerable pull forward in one-time demand from the pandemic, Naked Wines is set up as a subscription model. Many new subscribers during the pandemic will continue, even as churn rises as restaurants and bars re-open in 2021. The increase in future value from this subscriber boost is sizable. It won’t show up on any quantitative value screens, but Naked Wines still represents value in our book. The investment in Pepabo followed a similar setup as Naked Wines: A reinvestment in growth obscured reported profitability. After meeting Pepabo’s CEO in Tokyo in 2019, it was apparent the company’s culture was much more forward-thinking than other Japanese companies. Pepabo’s high margin businesses in web hosting and ecommerce tools were hidden by a new growth business called minne (think of it as the “Etsy of Japan”). COVID-19 accelerated minne’s growth to new levels. Pepabo’s stock fell more than -40% during the March selloff despite being an obvious beneficiary of the stay-at-home environment and enjoying the safety of an overcapitalized balance sheet. It was one of the clearest examples of “sell everything” during times of market panic which can disproportionately affect small cap stocks. Once the market realized the huge boon for Pepabo, it quickly changed course and the stock more than tripled. IWB is a leading Italian wine producer and distributor. IWB does not own the vineyards (the most capital intensive and volatile portion of the supply chain) but instead buys grapes in bulk, oversees the blending and bottling of the wine, and then handles marketing and distribution. Distribution is accomplished under both a wholesale division to large retail chains combined with a direct consumer business via online, catalog, and telesales. IWB is run by a talented management team who have managed to cut costs (a challenge in Italy) and turn around the underperforming direct business. We like the industry for its recession-resistant nature and IWB managed to sail through Italy’s difficult conditions to report a record year. | The top three detractors were Reading International, Inc. (Reading), Total Energy Services, Inc. (Total Energy), and Texhong Textile Group, Ltd. (Texhong). Unfortunately, Reading has been one of the biggest losers in the Fund’s history, as movie theaters and real estate were broadsided by the pandemic. Given that most of Reading’s cinemas are in Australia and New Zealand, the company is better positioned than most cinema peers. However, the business model remains dependent on the major studios releasing new movies. After much of movie content was pulled from the calendar in 2020, the 2021 slate looks promising, but the long-term outlook for theaters has never been murkier. Crucially, Reading also has a sizable real estate segment which we believe more than covers the current stock price, implying no value for the theater side. Even so, there is no escaping the damage caused by the pandemic and we have reduced our estimates of Reading’s fair value. We hope the pandemic was a wake-up call to the entrenched management team and may even help spur difficult decisions to unlock the company’s untapped value. Total Energy has steadily delivered during one of the most challenging environments in the history of the oil & gas industry. The low oil and gas prices also highlighted some of the inherent flaws around horizontal drilling in North American shale and many producers are finally focused on spending within cash flow. While we do not attempt to predict oil prices, basic economics dictates that prices should respond if supply falls short of demand. Oilfield service capacity is already being forced out of the market via consolidation and bankruptcy. Through it all, Total Energy has remained solidly cash flow positive and has continued to pay down debt. We believe Total Energy remains one of the cheapest securities we own on a normalized basis, with incredible torque to the upside as the industry recovers. Meanwhile, we have great respect for the company’s founder and CEO who has been aggressively buying more shares almost every week during 2020. We are happy to join him. Texhong is one of the largest cotton yarn producers in the world via its production bases in China and Vietnam. Texhong’s share price corrected sharply in 2020 as the pandemic caused disruptions in the apparel industry which rippled through the entire supply chain. Although management has reacted |
| | |
| | AMG Yacktman Special Opportunities Fund |
| | Portfolio Manager’s Comments (continued) |
| admirably to sell surplus inventory and control costs, Texhong was not immune to the global industry shock. Profits will be down significantly in 2020, but the company continues to execute its playbook of diversifying into downstream operations. This vertical integration will help cushion the more volatile profitability in the upstream segment. We believe this transition will eventually argue for a higher earnings multiple. Texhong is a long-time holding, but we have taken advantage of the stock price’s volatile nature to scale our weighting up and down. These price swings have caused Texhong to receive mentions in multiple letters as both a top contributor and detractor, including as one of our top contributors overall in the first five years of the Fund. Meanwhile, underlying value continues to grow strongly with book value compounding at healthy double-digit rates. We hope to see it make the top contributor list again in our ten-year review. | Conclusion We’ll close with one more quote from the book Barbarian Days on why the author continued to love surfing at Tavarua, “It didn’t become hideously overcrowded, effectively ruining it for everyone.” A large crowd can ruin a perfect wave, just like too many participants bidding up asset prices can impact returns for everyone else. In this current investment climate, almost everything seems overcrowded. While there are pockets of absurdly priced securities with no business models, even the very best businesses can be bad investments at the wrong price. 2019 capped off the worst decade for value investing in history, and then the first half of 2020 was even worse. Since November, there has been some rotation back into the smaller, more-value oriented companies we have favored. We still believe that | buying a business for less than its underlying value is a valid strategy, even if the “sell-it-to-the-next-investor-without-any-regard-for-fundamentals” crowd has been capturing the spotlight recently. Our objective remains steadfast: Produce attractive risk-adjusted returns over a full market cycle. We appreciate the AMG Yacktman Special Opportunities Fund shareholders who entrust us with their capital in pursuit of this goal. The views expressed represent the opinions of Yacktman Asset Management LP as of December 31, 2020, are not intended as a forecast or guarantee of future results, and are subject to change without notice. |
| | |
| | AMG Yacktman Special Opportunities Fund |
| | Portfolio Manager’s Comments (continued) |
CUMULATIVE TOTAL RETURN PERFORMANCE
AMG Yacktman Special Opportunities Fund’s cumulative total return is based on the daily change in net asset value (NAV), and assumes that all dividends and distributions were reinvested. The graph compares a hypothetical $10,000 investment made in the AMG Yacktman Special Opportunities Fund’s Class Z shares on June 30, 2014 (inception date), to a $10,000 investment made in the MSCI ACWI All Cap Index for the same time period. The graph and table do not reflect the deduction of taxes that a shareholder would pay on a Fund distribution or redemption of shares. The listed returns for the Fund are net of expenses and the returns for the index exclude expenses. Total returns would have been lower had certain expenses not been reduced.

The table below shows the average annual total returns for the AMG Yacktman Special Opportunities Fund and the MSCI ACWI All Cap Index for the same time periods ended December 31, 2020.
| Average Annual Total Returns1 | One
Year | Five
Years | Since
Inception | Inception
Date |
| AMG Yacktman Special Opportunities Fund2, 3, 4, 5, 6, 7, 8, 9, 10, 11, 12, 13, 14, 15, 16, 17, 18 |
| Class I | 12.66% | 13.41% | 9.19% | 06/30/15 |
| Class Z | 12.83% | 13.51% | 6.75% | 06/30/14 |
| MSCI ACWI All Cap Index19 | 16.31% | 12.14% | 8.45% | 06/30/14† |
The performance data shown represents past performance. Past performance is not a guarantee of future results. Current performance may be lower or higher than the performance data quoted. The investment return and principal value of an investment will fluctuate so that an investor’s shares, when redeemed, may be worth more or less than their original cost.
Investors should carefully consider the Fund’s investment objectives, risks, charges and expenses before investing. For performance information through the most recent month end, current net asset values per share for the Fund and other information, please call 800.548.4539 or visit our website at amgfunds.com for a free prospectus. Read it carefully before investing or sending money.
Distributed by AMG Distributors, Inc., member FINRA/SIPC.
| † | Date reflects the inception date of the Fund, not the index. |
| 1 | Total return equals income yield plus share price change and assumes reinvestment of all dividends and capital gain distributions. Returns are net of fees and may reflect offsets of Fund expenses as described in the prospectus. No adjustment has been made for taxes payable by shareholders on their reinvested dividends and capital gain distributions. Returns for periods greater than one year are annualized. The listed returns on the Fund are net of expenses and based on the published NAV as of December 31, 2020. All returns are in U.S. dollars ($). |
| 2 | During the period, the Fund’s investment manager has waived its fees and/or absorbed Fund expenses, which has resulted in higher returns. |
| 3 | The Fund’s investment management fees are subject to a performance adjustment, which could increase or reduce the investment management fees paid by the Fund. The prospect of a positive or negative performance adjustment may create an incentive for the Fund’s portfolio manager to take greater risks with the Fund’s portfolio. In addition, because performance adjustments are based upon past performance, a shareholder may pay a higher or lower management fee for performance that occurred prior to the shareholder’s investment in the Fund. The performance adjustment could increase the Investment Manager’s fee (and, in turn, the Subadviser’s fee) even if the Fund’s shares lose value during the performance period provided that the Fund outperformed its benchmark index, and could decrease the Investment Manager’s fee (and, in turn, the Subadviser’s fee) even if the Fund’s shares increase in value during the performance period provided that the Fund underperformed its benchmark index. |
| 4 | The Fund is subject to currency risk resulting from fluctuations in exchange rates that may affect the total loss or gain on a non-U.S. Dollar investment when converted back to U.S. Dollars. |
| 5 | The Fund is subject to the risks associated with investments in debt securities, such as default risk and fluctuations in the perception of the debtor’s ability to pay its creditors. Changing interest rates may adversely affect the value of an investment. An increase in interest rates typically causes the value of bonds and other fixed income securities to fall. |
| 6 | The Fund may invest in derivatives such as options and futures; the complexity and rapidly changing structure of derivatives markets may increase the possibility of market losses. |
| 7 | The Fund is subject to the risks associated with investments in emerging markets, such as erratic earnings patterns, economic and political instability, changing exchange controls, limitations on repatriation of foreign capital and changes in local governmental attitudes toward private investment, possibly leading to nationalization or confiscation of investor assets. |
| 8 | A greater percentage of the Fund’s holdings may be focused in a smaller number of securities which may place the Fund at greater risk than a more diversified fund. |
| 9 | High-yield bonds (also known as “junk bonds”) may be subject to greater levels of interest rate, credit, and liquidity risk than investments in higher rated securities. These securities are considered predominantly speculative with respect to the issuer’s continuing ability to make principal and interest payments. The issuers of the Fund’s |
| | |
| | AMG Yacktman Special Opportunities Fund |
| | Portfolio Manager’s Comments (continued) |
holdings may be involved in bankruptcy proceedings, reorganizations, or financial restructurings, and are not as strong financially as higher-rated issuers. 10 Investments in international securities are subject to certain risks of overseas investing including currency fluctuations and changes in political and economic conditions, which could result in significant market fluctuations. These risks are magnified in emerging markets. 11 The Fund invests in large-capitalization companies that may underperform other stock funds (such as funds that focus on small- and medium-capitalization companies) when stocks of large-capitalization companies are out of favor. 12 The Fund is subject to the special risks associated with investments in micro-cap companies, such as relatively short earnings history, competitive conditions, less publicly available corporate information, and reliance on a limited number of products. 13 The Fund is subject to risks associated with investments in mid-capitalization companies such as greater price volatility, lower trading volume, and less liquidity than the stocks of larger, more established companies. | 14 Companies that are in similar businesses may be similarly affected by particular economic or market events; to the extent the Fund has substantial holdings within a particular sector, the risks associated with that sector increase. 15 The Fund may suffer significant losses on assets that it sells short. Unlike the possible loss on a security that is purchased, there is no limit on the amount of loss on an appreciating security that is sold short. 16 The Fund is subject to risks associated with investments in small-capitalization companies, such as erratic earnings patterns, competitive conditions, limited earnings history and a reliance on one or a limited number of products. 17 Market prices of investments held by the Fund may fall rapidly or unpredictably due to a variety of economic or political factors, market conditions, disasters or public health issues, or in response to events that affect particular industries or companies. 18 The Fund invests in value stocks, which may perform differently from the market as a whole and may be undervalued by the market for a long period of time. | 19 The MSCI ACWI All Cap Index captures large, mid, small and micro cap representation across certain Developed Markets (DM) countries and large, mid and small cap representation across certain Emerging Markets (EM) countries. The index is comprehensive, covering a significant percentage of the global equity investment opportunity set. Please go to msci.com for most current list of countries represented by the index. Unlike the Fund, the MSCI ACWI All Cap Index is unmanaged, is not available for investment and does not incur expenses. All MSCI data is provided “as is”. The products described herein are not sponsored or endorsed and have not been reviewed or passed on by MSCI. In no event shall MSCI, its affiliates or any MSCI data provider have any liability of any kind in connection with the MSCI data or the products described herein. Copying or redistributing the MSCI data is strictly prohibited. Not FDIC Insured, nor bank guaranteed. May lose value. |
| | AMG Yacktman Special Opportunities Fund |
| | Fund Snapshots (unaudited) |
| | December 31, 2020 |
PORTFOLIO BREAKDOWN
| Sector | | % of
Net Assets |
| Industrials | | | 31.9 | |
| Consumer Staples | | | 13.7 | |
| Energy | | | 11.0 | |
| Consumer Discretionary | | | 11.0 | |
| Materials | | | 8.4 | |
| Financials | | | 7.0 | |
| Information Technology | | | 6.5 | |
| Communication Services | | | 5.7 | |
| Health Care | | | 1.3 | |
| Utilities | | | 0.3 | |
| Short-Term Investments | | | 3.0 | |
| Other Assets Less Liabilities | | | 0.2 | |
TOP TEN HOLDINGS
| Security Name | | % of
Net Assets | |
| Naked Wines PLC (United Kingdom) | | | 7.2 | |
| Omni Bridgeway, Ltd. (Australia) | | | 7.0 | |
| Colabor Group, Inc., 6.000%, 10/13/21 (Canada) | | | 6.4 | |
| Total Energy Services, Inc. (Canada) | | | 5.8 | |
| Trecora Resources (United States) | | | 4.7 | |
| Ocean Wilsons Holdings, Ltd. (Bermuda) | | | 4.5 | |
| B&S Group, S.A.R.L. (Luxembourg) | | | 3.7 | |
| Samsung Electronics Co., Ltd., 1.340% (South Korea) | | | 3.5 | |
| Texhong Textile Group, Ltd. (Hong Kong) | | | 3.4 | |
| Italian Wine Brands S.P.A (Italy) | | | 3.3 | |
| Top Ten as a Group | | | 49.5 | |
Because a fund’s strategy may result in multiple investments in particular sectors of the economy, its performance may depend on the performance of those sectors and may fluctuate more widely than investments diversified across more sectors. For additional information on these and other risk considerations, please see the Fund’s prospectus.
Any sectors, industries, or securities discussed should not be perceived as investment recommendations. Mention of a specific security should not be considered a recommendation to buy or solicitation to sell that security. Specific securities mentioned in this report may have been sold from the Fund’s portfolio of investments by the time you receive this report.
| | AMG Yacktman Special Opportunities Fund |
| | Fund Snapshots (continued) |
| | For the six months ended December 31, 2020 |
NEW EQUITY POSITIONS
| New Purchases | | Current
Shares Held | |
| Brickability Group PLC (United Kingdom) | | | 2,300,000 | |
| Evolution Petroleum Corp. | | | 165,000 | |
| NeoPharm Co., Ltd. (South Korea) | | | 22,000 | |
| Pumtech Korea Co., Ltd. (South Korea) | | | 28,000 | |
CORPORATE BONDS & NOTES PURCHASES
| Purchases | | Net Principal
Purchased | | | Current Principal
Held | |
| Colabor Group, Inc. (Canada) 6.000%, 10/13/21 | | | $411,000 | | | | $6,579,000 | |
EQUITY PURCHASES & SALES
| Purchases | | Net Shares
Purchased | | | Current Shares
Held | |
| Aggreko PLC (United Kingdom) | | | 17,000 | | | | 130,000 | |
| Bixolon Co., Ltd. (South Korea) | | | 40,133 | | | | 240,000 | |
| Cosco Capital, Inc. (Philippines) | | | 407,000 | | | | 5,500,000 | |
| Hargreaves Services PLC (United Kingdom) | | | 15,169 | | | | 450,169 | |
| Omni Bridgeway, Ltd. (Australia) | | | 535,000 | | | | 1,670,000 | |
| Sekisui Jushi Corp. (Japan) | | | 5,300 | | | | 20,000 | |
| Texhong Textile Group, Ltd. (Hong Kong) | | | 938,000 | | | | 3,148,000 | |
| Total Energy Services, Inc. (Canada) | | | 121,200 | | | | 1,766,900 | |
| Trecora Resources | | | 172,000 | | | | 530,000 | |
| Utoc Corp. (Japan) | | | 3,900 | | | | 84,900 | |
| Vivo Energy PLC (United Kingdom) | | | 575,000 | | | | 1,165,000 | |
| Sales | | Net Shares
Sold | | | Current Shares
Held | |
| Arcus ASA (Norway) | | | 15,000 | | | | 250,000 | |
| B&S Group, S.A.R.L. (Luxembourg) | | | 119,513 | | | | 327,706 | |
| Boustead Singapore, Ltd. (Singapore) | | | 522,000 | | | | 3,178,000 | |
| Cambria Automobiles PLC (United Kingdom) | | | 42,500 | | | | 525,000 | |
| GMO Pepabo, Inc. (Japan) | | | 15,000 | | | | — | |
| GrafTech International, Ltd. | | | 35,000 | | | | 145,000 | |
| Judges Scientific PLC (United Kingdom) | | | 6,000 | | | | — | |
| Lamprell PLC (United Arab Emirates) | | | 498,251 | | | | 1,400,000 | |
| Link Net Tbk PT (Indonesia) | | | 762,500 | | | | 7,037,500 | |
| Marshall Motor Holdings PLC (United Kingdom) | | | 229,000 | | | | — | |
| Samsung Electronics Co., Ltd., 1.340% (South Korea) | | | 7,000 | | | | 40,500 | |
| Spark Networks SE, ADR (Germany) | | | 70,600 | | | | 86,000 | |
| Tilly’s, Inc., Class A | | | 63,000 | | | | 19,000 | |
| Webstep A.S. (Norway) | | | 251,371 | | | | 163,629 | |
| | AMG Yacktman Special Opportunities Fund |
| | Schedule of Portfolio Investments |
| | December 31, 2020 |
| | | Shares | | Value |
| Common Stocks - 85.7% | | | | | | |
| Communication Services - 5.7% | | | | | | |
| Link Net Tbk PT (Indonesia) | | 7,037,500 | | | $1,208,243 | |
| Otelco, Inc., Class A (United States)* | | 34,031 | | | 390,335 | |
| Reading International, Inc., Class A (United States)* | | 482,000 | | | 2,419,640 | |
| Spark Networks SE, ADR (Germany)* | | 86,000 | | | 457,520 | |
| Total Communication Services | | | | | 4,475,738 | |
| Consumer Discretionary - 11.0% | | | | | | |
| B&S Group, S.A.R.L. (Luxembourg)1 | | 327,706 | | | 2,950,291 | |
| Cambria Automobiles PLC (United Kingdom) | | 525,000 | | | 419,993 | |
| Legacy Housing Corp. (United States)* | | 70,250 | | | 1,061,478 | |
| Texhong Textile Group, Ltd. (Hong Kong) | | 3,148,000 | | | 2,706,407 | |
| Tilly’s, Inc., Class A (United States) | | 19,000 | | | 155,040 | |
| Vivo Energy PLC (United Kingdom)*,1 | | 1,165,000 | | | 1,354,167 | |
| Total Consumer Discretionary | | | | | 8,647,376 | |
| Consumer Staples - 13.7% | | | | | | |
| Arcus ASA (Norway)1 | | 250,000 | | | 1,253,356 | |
| Cosco Capital, Inc. (Philippines) | | 5,500,000 | | | 648,471 | |
| Italian Wine Brands S.P.A (Italy) | | 103,000 | | | 2,619,991 | |
| Naked Wines PLC (United Kingdom)* | | 623,700 | | | 5,705,966 | |
| NeoPharm Co., Ltd. (South Korea)* | | 22,000 | | | 579,174 | |
| Total Consumer Staples | | | | | 10,806,958 | |
| Energy - 11.0% | | | | | | |
| Evolution Petroleum Corp. (United States) | | 165,000 | | | 470,250 | |
| Hargreaves Services PLC (United Kingdom) | | 450,169 | | | 1,564,043 | |
| Lamprell PLC (United Arab Emirates)* | | 1,400,000 | | | 957,250 | |
| Pardee Resources Co., Inc. (United States) | | 7,352 | | | 1,139,560 | |
| Total Energy Services, Inc. (Canada) | | 1,766,900 | | | 4,552,936 | |
| Total Energy | | | | | 8,684,039 | |
| Financials - 7.0% | | | | | | |
| Omni Bridgeway, Ltd. (Australia) | | 1,670,000 | | | 5,508,094 | |
| Health Care - 1.3% | | | | | | |
| HLS Therapeutics, Inc. (Canada) | | 14,660 | | | 207,306 | |
| WIN-Partners Co., Ltd. (Japan)* | | 67,000 | | | 802,410 | |
| Total Health Care | | | | | 1,009,716 | |
| Industrials - 24.3% | | | | | | |
| Aggreko PLC (United Kingdom) | | 130,000 | | | 1,114,379 | |
| AMERCO (United States) | | 5,100 | | | 2,315,196 | |
| Boustead Singapore, Ltd. (Singapore) | | 3,178,000 | | | 1,950,062 | |
| CB Industrial Product Holding Bhd (Malaysia) | | 6,380,800 | | | 1,760,768 | |
| Financiere de L’Odet SA (France) | | 800 | | | 767,024 | |
| Fjord1 A.S.A. (Norway)*,1 | | 215,000 | | | 1,076,123 | |
| | | Shares | | Value |
| GrafTech International, Ltd. (United States) | | 145,000 | | | $1,545,700 | |
| Komelon Corp. (South Korea) | | 70,000 | | | 574,632 | |
| Mitani Corp. (Japan) | | 7,200 | | | 464,395 | |
| Ocean Wilsons Holdings, Ltd. (Bermuda) | | 305,000 | | | 3,532,138 | |
| Promotora y Operadora de Infraestructura SAB de CV (Mexico) | | 53,000 | | | 287,619 | |
| Pumtech Korea Co., Ltd. (South Korea)* | | 28,000 | | | 406,726 | |
| Sam Yung Trading Co., Ltd. (South Korea) | | 199,000 | | | 2,567,002 | |
| Sekisui Jushi Corp. (Japan)* | | 20,000 | | | 422,922 | |
| Utoc Corp. (Japan) | | 84,900 | | | 389,111 | |
| Total Industrials | | | | | 19,173,797 | |
| Information Technology - 3.0% | | | | | | |
| Bixolon Co., Ltd. (South Korea) | | 240,000 | | | 1,021,047 | |
| Ifis Japan, Ltd. (Japan) | | 69,000 | | | 502,001 | |
| Reckon, Ltd. (Australia) | | 645,685 | | | 388,564 | |
| Webstep A.S. (Norway)1 | | 163,629 | | | 423,660 | |
| Total Information Technology | | | | | 2,335,272 | |
| Materials - 8.4% | | | | | | |
| Brickability Group PLC (United Kingdom) | | 2,300,000 | | | 2,060,139 | |
| Master Drilling Group, Ltd. (South Africa)* | | 1,178,934 | | | 599,400 | |
| SK Kaken Co., Ltd. (Japan) | | 800 | | | 300,615 | |
| Trecora Resources (United States)* | | 530,000 | | | 3,704,700 | |
| Total Materials | | | | | 6,664,854 | |
| Utilities - 0.3% | | | | | | |
| Maxim Power Corp. (Canada)* | | 140,000 | | | 245,267 | |
| Total Common Stocks | | | | | | |
| (Cost $62,265,884) | | | | | 67,551,111 | |
| | | | | | | |
| | | Principal
Amount | | | | |
| Corporate Bonds and Notes - 7.0% | | | | | | |
| Industrials - 7.0% | | | | | | |
| Colabor Group, Inc. (Canada) 6.000%, 10/13/212 | | $6,579,000 | | | 5,039,300 | |
| Helix Energy Solutions Group, Inc. (United States) 4.125%, 09/15/232 | | 500,000 | | | 476,306 | |
| Total Corporate Bonds and Notes | | | | | | |
| (Cost $4,729,435) | | | | | 5,515,606 | |
| | | | | | | |
| | | Shares | | | | |
| Closed-End Fund - 0.6% | | | | | | |
| Industrials - 0.6% | | | | | | |
Excelsior Capital, Ltd. (Australia)
(Cost $437,212) | | 375,377 | | | 426,861 | |
The accompanying notes are an integral part of these financial statements.
| | |
| | AMG Yacktman Special Opportunities Fund |
| | Schedule of Portfolio Investments (continued) |
| | | Shares | | | Value | |
| Preferred Stocks - 3.5% | | | | | | |
| Health Care - 0.0% | | | | | | |
| HLS Therapeutics, Inc. (Canada)3,4 | | 24,901 | | | $0 | |
| Information Technology - 3.5% | | | | | | |
| Samsung Electronics Co., Ltd., 1.340% (South Korea) | | 40,500 | | | 2,747,397 | |
| Total Preferred Stocks | | | | | | |
| (Cost $743,058) | | | | | 2,747,397 | |
| Short-Term Investments - 3.0% | | | | | | |
| Other Investment Companies - 3.0% | | | | | | |
| Dreyfus Government Cash Management Fund, Institutional Shares, 0.03%5 | | 791,209 | | | 791,209 | |
| | | | | | | |
| * | Non-income producing security. |
| 1 | Security exempt from registration under Rule 144A of the Securities Act of 1933. This security may be resold in transactions exempt from registration, normally to qualified institutional buyers. At December 31, 2020, the value of these securities amounted to $7,057,597 or 9.0% of net assets. |
| 2 | Convertible Security. A corporate bond, usually a junior debenture, that can be converted, at the option of the holder, for a specific number of shares of the company’s preferred stock or common stock. The market value of convertible bonds at December 31, 2020, amounted to $5,515,606 or 7.0% of net assets. |
| | | Shares | | | Value | |
| Dreyfus Institutional Preferred Government Money Market Fund, Institutional Shares, 0.03%5 | | 791,210 | | | $791,210 | |
| JPMorgan U.S. Government Money Market Fund, IM Shares, 0.03%5 | | 815,187 | | | 815,187 | |
| Total Other Investment Companies | | | | | 2,397,606 | |
| Total Short-Term Investments | | | | | | |
| (Cost $2,397,606) | | | | | 2,397,606 | |
| Total Investments - 99.8% | | | | | | |
| (Cost $70,573,195) | | | | | 78,638,581 | |
| Other Assets, less Liabilities - 0.2% | | | | | 150,075 | |
| Net Assets - 100.0% | | | | | $78,788,656 | |
| 3 | Preferred Shares of a liquidating trust. |
| 4 | Security’s value was determined by using significant unobservable inputs. |
| 5 | Yield shown represents the December 31, 2020, seven day average yield, which refers to the sum of the previous seven days’ dividends paid, expressed as an annual percentage. |
ADR American Depositary Receipt
The accompanying notes are an integral part of these financial statements.
| | |
| | AMG Yacktman Special Opportunities Fund |
| | Schedule of Portfolio Investments (continued) |
The following table summarizes the inputs used to value the Fund’s investments by the fair value hierarchy levels as of December 31, 2020:
| | | Level 1 | | | Level 21 | | | Level 3 | | | Total | |
| Investments in Securities | | | | | | | | | | | | |
| Common Stocks | | | | | | | | | | | | |
| Industrials | | $5,909,283 | | | $13,264,514 | | | — | | | $19,173,797 | |
| Consumer Staples | | 5,705,966 | | | 5,100,992 | | | — | | | 10,806,958 | |
| Energy | | 7,119,996 | | | 1,564,043 | | | — | | | 8,684,039 | |
| Consumer Discretionary | | 2,990,678 | | | 5,656,698 | | | — | | | 8,647,376 | |
| Materials | | 6,065,454 | | | 599,400 | | | — | | | 6,664,854 | |
| Financials | | — | | | 5,508,094 | | | — | | | 5,508,094 | |
| Communication Services | | 3,267,495 | | | 1,208,243 | | | — | | | 4,475,738 | |
| Information Technology | | 423,660 | | | 1,911,612 | | | — | | | 2,335,272 | |
| Health Care | | 207,306 | | | 802,410 | | | — | | | 1,009,716 | |
| Utilities | | 245,267 | | | — | | | — | | | 245,267 | |
| Corporate Bonds and Notes† | | — | | | 5,515,606 | | | — | | | 5,515,606 | |
| Closed-End Fund | | 426,861 | | | — | | | — | | | 426,861 | |
| Preferred Stocks | | | | | | | | | | | | |
| Information Technology | | — | | | 2,747,397 | | | — | | | 2,747,397 | |
| Health Care | | — | | | — | | | $0 | | | 0 | |
| Short-Term Investments | | | | | | | | | | | | |
| Other Investment Companies | | 2,397,606 | | | — | | | — | | | 2,397,606 | |
| Total Investments in Securities | | $34,759,572 | | | $43,879,009 | | | $0 | | | $78,638,581 | |
| † | All corporate bonds and notes held in the Fund are level 2 securities. For a detailed breakout of corporate bonds and notes by major industry classification, please refer to the Fund’s Schedule of Portfolio Investments. |
| 1 | An external pricing service is used to reflect any impact on security value due to market movements between the time the Fund valued such foreign securities and the earlier closing of foreign markets. |
At December 31, 2020, the Level 3 security is a Preferred Stock received as a result of a corporate action. The security’s value was determined by using significant unobservable inputs.
For the fiscal year ended December 31, 2020, there were no transfers in or out of Level 3.
The accompanying notes are an integral part of these financial statements.
| | |
| | AMG Yacktman Special Opportunities Fund |
| | Schedule of Portfolio Investments (continued) |
The country allocation in the Schedule of Portfolio Investments at December 31, 2020, was as follows:
| Country | | % of Long-Term
Investments |
| Australia | | 8.3 | |
| Bermuda | | 4.6 | |
| Canada | | 13.2 | |
| France | | 1.0 | |
| Germany | | 0.6 | |
| Hong Kong | | 3.5 | |
| Indonesia | | 1.6 | |
| Italy | | 3.4 | |
| Japan | | 3.8 | |
| Luxembourg | | 3.9 | |
| Malaysia | | 2.3 | |
| Mexico | | 0.4 | |
| Norway | | 3.6 | |
| Philippines | | 0.8 | |
| Singapore | | 2.6 | |
| South Africa | | 0.8 | |
| South Korea | | 10.4 | |
| United Arab Emirates | | 1.3 | |
| United Kingdom | | 16.0 | |
| United States | | 17.9 | |
| | | 100.0 | |
The accompanying notes are an integral part of these financial statements.
| | |
| | Statement of Assets and Liabilities |
| | December 31, 2020 |
| | | | | | | | | |
| | | AMG Yacktman Fund | | | AMG Yacktman Focused Fund | | | AMG Yacktman Focused Fund - Security Selection Only | | AMG Yacktman Special Opportunities Fund |
| Assets: | | | | | | | | |
| Investments at value1 (including securities on loan valued at $1,731,047, $0, $128,346, and $0, respectively) | | $7,624,904,534 | | | $3,633,426,467 | | | $133,048,064 | | | $78,638,581 | |
| Foreign currency2 | | 223,462 | | | 62,756 | | | 2,318 | | | 771 | |
| Receivable for investments sold | | — | | | — | | | — | | | 90,350 | |
| Dividend and interest receivables | | 17,310,710 | | | 10,707,745 | | | 632,773 | | | 167,327 | |
| Securities lending income receivable | | 491 | | | — | | | 881 | | | 347 | |
| Receivable for Fund shares sold | | 4,765,808 | | | 3,125,719 | | | 3,057 | | | 25,146 | |
| Receivable from affiliate | | — | | | — | | | 5,295 | | | 3,920 | |
| Prepaid expenses and other assets | | 87,735 | | | 32,838 | | | 8,628 | | | 3,836 | |
| Total assets | | 7,647,292,740 | | | 3,647,355,525 | | | 133,701,016 | | | 78,930,278 | |
| Liabilities: | | | | | | | | | | | | |
| Payable upon return of securities loaned | | 309,509 | | | — | | | 128,529 | | | — | |
| Payable for investments purchased | | — | | | — | | | 231,489 | | | — | |
| Payable for Fund shares repurchased | | 5,852,373 | | | 4,262,741 | | | — | | | 7,648 | |
| Accrued expenses: | | | | | | | | | | | | |
| Investment advisory and management fees | | 2,725,738 | | | 2,684,651 | | | 93,957 | | | 75,241 | |
| Administrative fees | | 950,790 | | | 452,768 | | | 16,199 | | | 9,646 | |
| Shareholder service fees | | 500,865 | | | 293,296 | | | 120 | | | 1,121 | |
| Other | | 814,538 | | | 425,077 | | | 41,367 | | | 47,966 | |
| Total liabilities | | 11,153,813 | | | 8,118,533 | | | 511,661 | | | 141,622 | |
| | | | | | | | | | | | | |
| Net Assets | | $7,636,138,927 | | | $3,639,236,992 | | | $133,189,355 | | | $78,788,656 | |
| 1 Investments at cost | | $5,390,751,726 | | | $2,692,069,087 | | | $107,311,087 | | | $70,573,195 | |
| 2 Foreign currency at cost | | $215,705 | | | $60,578 | | | $2,318 | | | $765 | |
The accompanying notes are an integral part of these financial statements.
| | |
| | |
| | Statement of Assets and Liabilities (continued) |
| | | | | | | | | |
| | | AMG Yacktman Fund | | AMG Yacktman Focused Fund | | AMG Yacktman Focused Fund - Security Selection Only | | AMG Yacktman Special Opportunities Fund |
| Net Assets Represent: | | | | | | | | | | | | |
| Paid-in capital | | $5,336,369,428 | | | $2,650,941,322 | | | $107,382,529 | | | $71,483,415 | |
| Total distributable earnings | | 2,299,769,499 | | | 988,295,670 | | | 25,806,826 | | | 7,305,241 | |
| Net Assets | | $7,636,138,927 | | | $3,639,236,992 | | | $133,189,355 | | | $78,788,656 | |
| | | | | | | | | | | | | |
| Class N: | | | | | | | | | | | | |
| Net Assets | | — | | | $1,943,997,902 | | | $431,178 | | | — | |
| Shares outstanding | | — | | | 101,816,927 | | | 27,478 | | | — | |
| Net asset value, offering and redemption price per share | | — | | | $19.09 | | | $15.69 | | | — | |
| Class I: | | | | | | | | | | | | |
| Net Assets | | $7,636,138,927 | | | $1,695,239,090 | | | $132,758,177 | | | $13,880,640 | |
| Shares outstanding | | 359,164,502 | | | 89,100,199 | | | 8,462,014 | | | 1,260,019 | |
| Net asset value, offering and redemption price per share | | $21.26 | | | $19.03 | | | $15.69 | | | $11.02 | |
| Class Z: | | | | | | | | | | | | |
| Net Assets | | — | | | — | | | — | | | $64,908,016 | |
| Shares outstanding | | — | | | — | | | — | | | 5,878,026 | |
| Net asset value, offering and redemption price per share | | — | | | — | | | — | | | $11.04 | |
The accompanying notes are an integral part of these financial statements.
| | |
| | Statement of Operations |
| | For the fiscal year ended December 31, 2020 |
| | | | | | | | | |
| | | AMG Yacktman Fund | | AMG Yacktman Focused Fund | | AMG Yacktman Focused Fund - Security Selection Only | | AMG Yacktman Special Opportunities Fund |
| Investment Income: | | | | | | | | | | | | |
| Dividend income | | $133,549,595 | | | $63,591,873 | | | $2,678,356 | | | $1,294,868 | 1 |
| Interest income | | 18,141,805 | | | 8,176,940 | | | 180,429 | | | 886,060 | |
| Securities lending income | | 478,050 | | | 144,596 | | | 9,610 | | | 3,949 | |
| Foreign withholding tax | | (7,976,723 | ) | | (5,116,500 | ) | | (234,180 | ) | | (81,687 | ) |
| Total investment income | | 144,192,727 | | | 66,796,909 | | | 2,634,215 | | | 2,103,190 | |
| Expenses: | | | | | | | | | | | | |
| Investment advisory and management fees | | 29,714,314 | | | 27,669,756 | | | 883,298 | | | 475,313 | |
| Administrative fees | | 10,344,398 | | | 4,770,648 | | | 152,293 | | | 92,567 | |
| Shareholder servicing fees - Class N | | — | | | 3,280,918 | | | 301 | | | — | |
| Shareholder servicing fees - Class I | | 6,196,031 | | | — | | | — | | | 10,906 | |
| Custodian fees | | 682,749 | | | 372,035 | | | 42,025 | | | 50,664 | |
| Trustee fees and expenses | | 610,451 | | | 281,333 | | | 9,233 | | | 5,474 | |
| Professional fees | | 447,745 | | | 224,944 | | | 33,462 | | | 41,218 | |
| Reports to shareholders | | 396,522 | | | 195,940 | | | 4,012 | | | 3,567 | |
| Transfer agent fees | | 389,918 | | | 218,611 | | | 3,736 | | | 2,576 | |
| Registration fees | | 113,631 | | | 122,069 | | | 34,189 | | | 23,012 | |
| Miscellaneous | | 270,521 | | | 107,722 | | | 4,039 | | | 3,798 | |
| Total expenses before offsets | | 49,166,280 | | | 37,243,976 | | | 1,166,588 | | | 709,095 | |
| Expense reimbursements | | — | | | (78,665 | ) | | (69,647 | ) | | (56,243 | ) |
| Fee waivers | | (429,275 | ) | | (192,995 | ) | | — | | | — | |
| Net expenses | | 48,737,005 | | | 36,972,316 | | | 1,096,941 | | | 652,852 | |
| | | | | | | | | | | | | |
| Net investment income | | 95,455,722 | | | 29,824,593 | | | 1,537,274 | | | 1,450,338 | |
| Net Realized and Unrealized Gain: | | | | | | | | | | | | |
| Net realized gain (loss) on investments | | 563,383,612 | | | 315,951,077 | | | 4,534,860 | | | (373,930 | ) |
| Net realized loss on foreign currency transactions | | (286,105 | ) | | (400,092 | ) | | (36,072 | ) | | (63,916 | ) |
| Net change in unrealized appreciation/depreciation on investments | | 216,041,475 | | | 151,851,061 | | | 16,407,314 | | | 8,351,437 | |
| Net change in unrealized appreciation/depreciation on foreign currency translations | | 181,953 | | | 100,190 | | | (1,562 | ) | | (554 | ) |
| Net realized and unrealized gain | | 779,320,935 | | | 467,502,236 | | | 20,904,540 | | | 7,913,037 | |
| | | | | | | | | | | | | |
| Net increase in net assets resulting from operations | | $874,776,657 | | | $497,326,829 | | | $22,441,814 | | | $9,363,375 | |
| 1 | Includes non-recurring dividends of $180,000. |
The accompanying notes are an integral part of these financial statements.
| | |
| | Statements of Changes in Net Assets |
| | For the fiscal years ended December 31, |
| | | AMG Yacktman Fund | | | AMG Yacktman Focused Fund | |
| | | 2020 | | | 2019 | | | 2020 | | | 2019 | |
| Increase in Net Assets Resulting From Operations: | | | | | | | | | | | | |
| Net investment income | | $95,455,722 | | | $138,360,828 | | | $29,824,593 | | | $47,281,894 | |
| Net realized gain on investments | | 563,097,507 | | | 761,011,236 | | | 315,550,985 | | | 571,878,908 | |
| Net change in unrealized appreciation/depreciation on investments | | 216,223,428 | | | 391,866,674 | | | 151,951,251 | | | 22,369,399 | |
| Net increase in net assets resulting from operations | | 874,776,657 | | | 1,291,238,738 | | | 497,326,829 | | | 641,530,201 | |
| Distributions to Shareholders: | | | | | | | | | | | | |
| Class N | | — | | | — | | | (208,983,961 | ) | | (292,238,208 | ) |
| Class I | | (754,755,439 | ) | | (717,307,575 | ) | | (182,831,695 | ) | | (218,295,712 | ) |
| Total distributions to shareholders | | (754,755,439 | ) | | (717,307,575 | ) | | (391,815,656 | ) | | (510,533,920 | ) |
| Capital Share Transactions:1 | | | | | | | | | | | | |
| Net increase (decrease) from capital share transactions | | (726,405,352 | ) | | 557,610,903 | | | (100,007,474 | ) | | 44,251,325 | |
| | | | | | | | | | | | | |
| Total increase (decrease) in net assets | | (606,384,134 | ) | | 1,131,542,066 | | | 5,503,699 | | | 175,247,606 | |
| Net Assets: | | | | | | | | | | | | |
| Beginning of year | | 8,242,523,061 | | | 7,110,980,995 | | | 3,633,733,293 | | | 3,458,485,687 | |
| End of year | | $7,636,138,927 | | | $8,242,523,061 | | | $3,639,236,992 | | | $3,633,733,293 | |
| 1 | See Note 1(g) of the Notes to Financial Statements. |
The accompanying notes are an integral part of these financial statements.
| | |
| | Statements of Changes in Net Assets (continued) |
| | For the fiscal years ended December 31, |
| | | AMG Yacktman Focused Fund - Security Selection Only | | | AMG Yacktman Special Opportunities Fund | |
| | | 2020 | | | 2019 | | | 2020 | | | 2019 | |
| Increase in Net Assets Resulting From Operations: | | | | | | | | | | | | |
| Net investment income | | $1,537,274 | | | $985,000 | | | $1,450,338 | | | $1,154,433 | |
| Net realized gain (loss) on investments | | 4,498,788 | | | 2,957,732 | | | (437,846 | ) | | 3,300,924 | |
| Net change in unrealized appreciation/depreciation on investments | | 16,405,752 | | | 10,826,805 | | | 8,350,883 | | | 294,127 | |
| Net increase in net assets resulting from operations | | 22,441,814 | | | 14,769,537 | | | 9,363,375 | | | 4,749,484 | |
| Distributions to Shareholders: | | | | | | | | | | | | |
| Class N | | (19,108 | ) | | (7,375 | ) | | — | | | — | |
| Class I | | (6,000,285 | ) | | (3,865,096 | ) | | (342,102 | ) | | (796,378 | ) |
| Class Z | | — | | | — | | | (1,668,303 | ) | | (3,349,490 | ) |
| Total distributions to shareholders | | (6,019,393 | ) | | (3,872,471 | ) | | (2,010,405 | ) | | (4,145,868 | ) |
| Capital Share Transactions:1 | | | | | | | | | | | | |
| Net increase from capital share transactions | | 20,542,613 | | | 25,315,856 | | | 11,753,088 | | | 22,248,028 | |
| | | | | | | | | | | | | |
| Total increase in net assets | | 36,965,034 | | | 36,212,922 | | | 19,106,058 | | | 22,851,644 | |
| Net Assets: | | | | | | | | | | | | |
| Beginning of year | | 96,224,321 | | | 60,011,399 | | | 59,682,598 | | | 36,830,954 | |
| End of year | | $133,189,355 | | | $96,224,321 | | | $78,788,656 | | | $59,682,598 | |
| 1 | See Note 1(g) of the Notes to Financial Statements. |
The accompanying notes are an integral part of these financial statements.
| | AMG Yacktman Fund |
| | Financial Highlights |
| | For a share outstanding throughout each fiscal year |
| | | For the fiscal years ended December 31, |
| Class I | | 2020 | | | 2019 | | | 2018 | | | 2017 | | | 20161 |
| Net Asset Value, Beginning of Year | | $20.48 | | | $19.05 | | | $22.85 | | | $21.39 | | | $20.87 | |
| Income from Investment Operations: | | | | | | | | | | | | | | | |
| Net investment income2,3 | | 0.27 | | | 0.35 | | | 0.40 | | | 0.32 | | | 0.33 | |
| Net realized and unrealized gain on investments | | 2.81 | | | 2.99 | | | 0.20 | | | 3.58 | | | 2.03 | |
| Total income from investment operations | | 3.08 | | | 3.34 | | | 0.60 | | | 3.90 | | | 2.36 | |
| Less Distributions to Shareholders from: | | | | | | | | | | | | | | | |
| Net investment income | | (0.28 | ) | | (0.37 | ) | | (0.44 | ) | | (0.34 | ) | | (0.41 | ) |
| Net realized gain on investments | | (2.02 | ) | | (1.54 | ) | | (3.96 | ) | | (2.10 | ) | | (1.43 | ) |
| Total distributions to shareholders | | (2.30 | ) | | (1.91 | ) | | (4.40 | ) | | (2.44 | ) | | (1.84 | ) |
| Net Asset Value, End of Year | | $21.26 | | | $20.48 | | | $19.05 | | | $22.85 | | | $21.39 | |
| Total Return3,4 | | 15.28 | % | | 17.66 | % | | 2.69 | % | | 18.23 | % | | 11.20 | % |
| Ratio of net expenses to average net assets | | 0.70 | % | | 0.70 | % | | 0.70 | % | | 0.71 | % | | 0.71 | % |
| Ratio of gross expenses to average net assets5 | | 0.71 | % | | 0.71 | % | | 0.71 | % | | 0.72 | % | | 0.72 | % |
| Ratio of net investment income to average net assets3 | | 1.38 | % | | 1.70 | % | | 1.70 | % | | 1.38 | % | | 1.51 | % |
| Portfolio turnover | | 27 | % | | 35 | % | | 12 | % | | 2 | % | | 4 | % |
| Net assets end of year (000’s) omitted | | $7,636,139 | | | $8,242,523 | | | $7,110,981 | | | $8,722,375 | | | $8,527,164 | |
| 1 | Effective October 1, 2016, the Service Class was renamed Class I. |
| 2 | Per share numbers have been calculated using average shares. |
| 3 | Total returns and net investment income would have been lower had certain expenses not been offset. |
| 4 | The total return is calculated using the published Net Asset Value as of fiscal year end. |
| 5 | Excludes the impact of expense reimbursement or fee waivers and expense reductions such as brokerage credits, but includes expense repayments and non-reimbursable expenses, if any, such as interest, taxes, and extraordinary expenses. (See Note 1(c) and 2 in the Notes to Financial Statements.) |
| | AMG Yacktman Focused Fund |
| | Financial Highlights |
| | For a share outstanding throughout each fiscal year |
| | | For the fiscal years ended December 31, |
| Class N | | 2020 | | | 2019 | | | 2018 | | | 20171 | | | 20162 |
| Net Asset Value, Beginning of Year | | $18.25 | | | $17.78 | | | $21.13 | | | $19.69 | | | $19.77 | |
| Income from Investment Operations: | | | | | | | | | | | | | | | |
| Net investment income3,4 | | 0.15 | | | 0.23 | | | 0.28 | | | 0.19 | | | 0.19 | |
| Net realized and unrealized gain on investments | | 2.95 | | | 3.13 | | | 0.31 | | | 3.75 | | | 2.05 | |
| Total income from investment operations | | 3.10 | | | 3.36 | | | 0.59 | | | 3.94 | | | 2.24 | |
| Less Distributions to Shareholders from: | | | | | | | | | | | | | | | |
| Net investment income | | (0.15 | ) | | (0.25 | ) | | (0.31 | ) | | (0.21 | ) | | (0.30 | ) |
| Net realized gain on investments | | (2.11 | ) | | (2.64 | ) | | (3.63 | ) | | (2.29 | ) | | (2.02 | ) |
| Total distributions to shareholders | | (2.26 | ) | | (2.89 | ) | | (3.94 | ) | | (2.50 | ) | | (2.32 | ) |
| Net Asset Value, End of Year | | $19.09 | | | $18.25 | | | $17.78 | | | $21.13 | | | $19.69 | |
| Total Return4,5 | | 17.26 | % | | 19.13 | % | | 2.88 | % | | 20.03 | % | | 11.29 | % |
| Ratio of net expenses to average net assets | | 1.24 | % | | 1.24 | % | | 1.23 | % | | 1.22 | % | | 1.23 | % |
| Ratio of gross expenses to average net assets6 | | 1.26 | % | | 1.26 | % | | 1.24 | % | | 1.23 | % | | 1.24 | % |
| Ratio of net investment income to average net assets4 | | 0.85 | % | | 1.20 | % | | 1.30 | % | | 0.89 | % | | 0.94 | % |
| Portfolio turnover | | 33 | % | | 31 | % | | 16 | % | | 2 | % | | 4 | % |
| Net assets end of year (000’s) omitted | | $1,943,998 | | | $2,078,758 | | | $2,166,407 | | | $2,803,230 | | | $3,479,880 | |
| | AMG Yacktman Focused Fund |
| | Financial Highlights |
| | For a share outstanding throughout each fiscal year |
| | | For the fiscal years ended December 31, |
| Class I | | 2020 | | | 2019 | | | 2018 | | | 2017 | | | 20162 |
| Net Asset Value, Beginning of Year | | $18.19 | | | $17.74 | | | $21.09 | | | $19.66 | | | $19.75 | |
| Income from Investment Operations: | | | | | | | | | | | | | | | |
| Net investment income3,4 | | 0.18 | | | 0.27 | | | 0.32 | | | 0.23 | | | 0.23 | |
| Net realized and unrealized gain on investments | | 2.96 | | | 3.11 | | | 0.32 | | | 3.74 | | | 2.04 | |
| Total income from investment operations | | 3.14 | | | 3.38 | | | 0.64 | | | 3.97 | | | 2.27 | |
| Less Distributions to Shareholders from: | | | | | | | | | | | | | | | |
| Net investment income | | (0.19 | ) | | (0.29 | ) | | (0.36 | ) | | (0.25 | ) | | (0.34 | ) |
| Net realized gain on investments | | (2.11 | ) | | (2.64 | ) | | (3.63 | ) | | (2.29 | ) | | (2.02 | ) |
| Total distributions to shareholders | | (2.30 | ) | | (2.93 | ) | | (3.99 | ) | | (2.54 | ) | | (2.36 | ) |
| Net Asset Value, End of Year | | $19.03 | | | $18.19 | | | $17.74 | | | $21.09 | | | $19.66 | |
| Total Return4,5 | | 17.52 | % | | 19.30 | % | | 3.11 | % | | 20.25 | % | | 11.46 | % |
| Ratio of net expenses to average net assets | | 1.06 | % | | 1.06 | % | | 1.05 | % | | 1.05 | % | | 1.05 | % |
| Ratio of gross expenses to average net assets6 | | 1.07 | % | | 1.07 | % | | 1.06 | % | | 1.06 | % | | 1.06 | % |
| Ratio of net investment income to average net assets4 | | 1.04 | % | | 1.39 | % | | 1.48 | % | | 1.06 | % | | 1.11 | % |
| Portfolio turnover | | 33 | % | | 31 | % | | 16 | % | | 2 | % | | 4 | % |
| Net assets end of year (000’s) omitted | | $1,695,239 | | | $1,554,975 | | | $1,292,079 | | | $1,578,775 | | | $1,051,228 | |
| 1 | Effective October 27, 2017, Class S was renamed Class N. |
| 2 | Effective October 1, 2016, the Service Class and Institutional Class were renamed Class S and Class I, respectively. |
| 3 | Per share numbers have been calculated using average shares. |
| 4 | Total returns and net investment income would have been lower had certain expenses not been offset. |
| 5 | The total return is calculated using the published Net Asset Value as of fiscal year end. |
| 6 | Excludes the impact of expense reimbursement or fee waivers and expense reductions such as brokerage credits, but includes expense repayments and non-reimbursable expenses, if any, such as interest, taxes, and extraordinary expenses. (See Note 1(c) and 2 in the Notes to Financial Statements.) |
| | AMG Yacktman Focused Fund - Security Selection Only |
| | Financial Highlights |
| | For a share outstanding throughout each fiscal period |
| | | | | | | | | For the fiscal |
| | | | | | | | | period ended |
| | | For the fiscal years ended December 31, | | December 31, |
| Class N | | 2020 | | | 2019 | | | 2018 | | | 20171 |
| Net Asset Value, Beginning of Period | | $13.90 | | | $11.94 | | | $11.77 | | | $10.00 | |
| Income from Investment Operations: | | | | | | | | | | | | |
| Net investment income2,3 | | 0.18 | | | 0.17 | | | 0.26 | | | 0.14 | |
| Net realized and unrealized gain on investments | | 2.35 | | | 2.37 | | | 0.00 | 4 | | 1.94 | |
| Total income from investment operations | | 2.53 | | | 2.54 | | | 0.26 | | | 2.08 | |
| Less Distributions to Shareholders from: | | | | | | | | | | | | |
| Net investment income | | (0.23 | ) | | (0.25 | ) | | (0.07 | ) | | (0.22 | ) |
| Net realized gain on investments | | (0.51 | ) | | (0.33 | ) | | (0.02 | ) | | (0.09 | ) |
| Total distributions to shareholders | | (0.74 | ) | | (0.58 | ) | | (0.09 | ) | | (0.31 | ) |
| Net Asset Value, End of Period | | $15.69 | | | $13.90 | | | $11.94 | | | $11.77 | |
| Total Return3,5 | | 18.32 | % | | 21.40 | % | | 2.17 | % | | 20.81 | %6 |
| Ratio of net expenses to average net assets | | 1.19 | % | | 1.12 | % | | 1.08 | % | | 1.08 | %7 |
| Ratio of gross expenses to average net assets8 | | 1.25 | % | | 1.22 | % | | 1.82 | % | | 3.77 | %9 |
| Ratio of net investment income to average net assets3 | | 1.40 | % | | 1.28 | % | | 2.14 | % | | 1.35 | %7 |
| Portfolio turnover | | 27 | % | | 23 | % | | 2 | % | | 12 | %6 |
| Net assets end of period (000’s) omitted | | $431 | | | $183 | | | $76 | | | $17 | |
| | AMG Yacktman Focused Fund - Security Selection Only |
| | Financial Highlights |
| | For a share outstanding throughout each fiscal period |
| | | | | | | | | For the fiscal |
| | | | | | | | | period ended |
| | | For the fiscal years ended December 31, | | December 31, |
| Class I | | 2020 | | | 2019 | | | 2018 | | | 20171 |
| Net Asset Value, Beginning of Period | | $13.89 | | | $11.94 | | | $11.77 | | | $10.00 | |
| Income from Investment Operations: | | | | | | | | | | | | |
| Net investment income2,3 | | 0.20 | | | 0.17 | | | 0.26 | | | 0.14 | |
| Net realized and unrealized gain on investments | | 2.35 | | | 2.36 | | | 0.00 | 4 | | 1.94 | |
| Total income from investment operations | | 2.55 | | | 2.53 | | | 0.26 | | | 2.08 | |
| Less Distributions to Shareholders from: | | | | | | | | | | | | |
| Net investment income | | (0.24 | ) | | (0.25 | ) | | (0.07 | ) | | (0.22 | ) |
| Net realized gain on investments | | (0.51 | ) | | (0.33 | ) | | (0.02 | ) | | (0.09 | ) |
| Total distributions to shareholders | | (0.75 | ) | | (0.58 | ) | | (0.09 | ) | | (0.31 | ) |
| Net Asset Value, End of Period | | $15.69 | | | $13.89 | | | $11.94 | | | $11.77 | |
| Total Return3,5 | | 18.47 | % | | 21.32 | % | | 2.17 | % | | 20.81 | %6 |
| Ratio of net expenses to average net assets | | 1.08 | % | | 1.08 | % | | 1.08 | % | | 1.08 | %7 |
| Ratio of gross expenses to average net assets8 | | 1.15 | % | | 1.19 | % | | 1.82 | % | | 3.77 | %9 |
| Ratio of net investment income to average net assets3 | | 1.51 | % | | 1.31 | % | | 2.14 | % | | 1.35 | %7 |
| Portfolio turnover | | 27 | % | | 23 | % | | 2 | % | | 12 | %6 |
| Net assets end of period (000’s) omitted | | $132,758 | | | $96,041 | | | $59,936 | | | $1,392 | |
| 1 | Commencement of operations was on January 30, 2017. |
| 2 | Per share numbers have been calculated using average shares. |
| 3 | Total returns and net investment income would have been lower had certain expenses not been offset. |
| 4 | Less than $0.005 per share. |
| 5 | The total return is calculated using the published Net Asset Value as of fiscal year end. |
| 8 | Excludes the impact of expense reimbursement or fee waivers and expense reductions such as brokerage credits, but includes expense repayments and non-reimbursable expenses, if any, such as interest, taxes, and extraordinary expenses. (See Note 1(c) and 2 in the Notes to Financial Statements.) |
| 9 | Ratio does not reflect the annualization of audit expenses. |
| | AMG Yacktman Special Opportunities Fund |
| | Financial Highlights |
| | For a share outstanding throughout each fiscal year |
| | | For the fiscal years ended December 31, |
| Class I | | 2020 | | | 2019 | | | 2018 | | | 2017 | | | 20161 |
| Net Asset Value, Beginning of Year | | $10.04 | | | $9.82 | | | $12.03 | | | $9.37 | | | $7.75 | |
| Income (loss) from Investment Operations: | | | | | | | | | | | | | | | |
| Net investment income2,3 | | 0.20 | 4 | | 0.24 | | | 0.16 | | | 0.06 | 5 | | 0.18 | |
| Net realized and unrealized gain (loss) on investments | | 1.06 | | | 0.73 | | | (1.41 | ) | | 3.18 | | | 1.75 | |
| Total income (loss) from investment operations | | 1.26 | | | 0.97 | | | (1.25 | ) | | 3.24 | | | 1.93 | |
| Less Distributions to Shareholders from: | | | | | | | | | | | | | | | |
| Net investment income | | (0.23 | ) | | (0.21 | ) | | (0.11 | ) | | (0.14 | ) | | (0.20 | ) |
| Net realized gain on investments | | (0.05 | ) | | (0.54 | ) | | (0.85 | ) | | (0.44 | ) | | — | |
| Paid in capital | | — | | | — | | | — | | | — | | | (0.11 | ) |
| Total distributions to shareholders | | (0.28 | ) | | (0.75 | ) | | (0.96 | ) | | (0.58 | ) | | (0.31 | ) |
| Net Asset Value, End of Year | | $11.02 | | | $10.04 | | | $9.82 | | | $12.03 | | | $9.37 | |
| Total Return3 | | 12.66 | %6 | | 10.20 | %6 | | (10.26 | )%6 | | 34.67 | %6 | | 24.88 | % |
| Ratio of net expenses to average net assets7 | | 1.14 | % | | 1.29 | % | | 1.84 | % | | 2.33 | % | | 1.90 | % |
| Ratio of gross expenses to average net assets7,8 | | 1.23 | % | | 1.47 | % | | 2.03 | % | | 2.59 | % | | 2.29 | % |
| Ratio of net investment income to average net assets3,7 | | 2.27 | % | | 2.32 | % | | 1.38 | % | | 0.50 | % | | 2.08 | % |
| Portfolio turnover | | 37 | % | | 24 | % | | 30 | % | | 36 | % | | 29 | % |
| Net assets end of year (000’s) omitted | | $13,881 | | | $11,701 | | | $7,678 | | | $8,377 | | | $700 | |
| | AMG Yacktman Special Opportunities Fund |
| | Financial Highlights |
| | For a share outstanding throughout each fiscal year |
| | | For the fiscal years ended December 31, |
| Class Z | | 2020 | | | 2019 | | | 2018 | | | 2017 | | | 20161 |
| Net Asset Value, Beginning of Year | | $10.06 | | | $9.84 | | | $12.05 | | | $9.38 | | | $7.75 | |
| Income (loss) from Investment Operations: | | | | | | | | | | | | | | | |
| Net investment income2,3 | | 0.21 | 4 | | 0.25 | | | 0.17 | | | 0.07 | 5 | | 0.20 | |
| Net realized and unrealized gain (loss) on investments | | 1.06 | | | 0.72 | | | (1.40 | ) | | 3.19 | | | 1.74 | |
| Total income (loss) from investment operations | | 1.27 | | | 0.97 | | | (1.23 | ) | | 3.26 | | | 1.94 | |
| Less Distributions to Shareholders from: | | | | | | | | | | | | | | | |
| Net investment income | | (0.24 | ) | | (0.21 | ) | | (0.13 | ) | | (0.15 | ) | | (0.20 | ) |
| Net realized gain on investments | | (0.05 | ) | | (0.54 | ) | | (0.85 | ) | | (0.44 | ) | | — | |
| Paid in capital | | — | | | — | | | — | | | — | | | (0.11 | ) |
| Total distributions to shareholders | | (0.29 | ) | | (0.75 | ) | | (0.98 | ) | | (0.59 | ) | | (0.31 | ) |
| Net Asset Value, End of Year | | $11.04 | | | $10.06 | | | $9.84 | | | $12.05 | | | $9.38 | |
| Total Return3 | | 12.83 | %6 | | 10.27 | %6 | | (10.14 | )%6 | | 34.81 | %6 | | 25.05 | %6 |
| Ratio of net expenses to average net assets7 | | 1.04 | % | | 1.19 | % | | 1.74 | % | | 2.23 | % | | 1.63 | % |
| Ratio of gross expenses to average net assets7,8 | | 1.13 | % | | 1.37 | % | | 1.93 | % | | 2.49 | % | | 2.01 | % |
| Ratio of net investment income to average net assets3,7 | | 2.37 | % | | 2.42 | % | | 1.48 | % | | 0.60 | % | | 2.34 | % |
| Portfolio turnover | | 37 | % | | 24 | % | | 30 | % | | 36 | % | | 29 | % |
| Net assets end of year (000’s) omitted | | $64,908 | | | $47,981 | | | $29,153 | | | $29,334 | | | $21,519 | |
| 1 | Effective October 1, 2016, the Service Class and Institutional Class were renamed Class I and Class Z, respectively. |
| 2 | Per share numbers have been calculated using average shares. |
| 3 | Total returns and net investment income would have been lower had certain expenses not been offset. |
| 4 | Includes non-recurring dividends. Without these dividends, net investment income per share would have been $0.17 and $0.18 for Class I and Class Z, respectively. |
| 5 | Includes non-recurring dividends. Without these dividends, net investment income per share would have been $0.04 and $0.05 for Class I and Class Z, respectively. |
| 6 | The total return is calculated using the published Net Asset Value as of fiscal year end. |
| 7 | Includes a performance adjustment amounting to (0.60)%, (0.45)%, 0.10%, 0.59% and (0.02)% for the fiscal years ended 2020, 2019, 2018, 2017 and 2016, respectively. (See Note 2 in the Notes to Financial Statements) |
| 8 | Excludes the impact of expense reimbursement or fee waivers and expense reductions such as brokerage credits, but includes expense repayments and non-reimbursable expenses, if any, such as interest, taxes, and extraordinary expenses. (See Note 1(c) and 2 in the Notes to Financial Statements.) |
| | |
| | Notes to Financial Statements |
| | December 31, 2020 |
1. ORGANIZATION AND SUMMARY OF SIGNIFICANT ACCOUNTING POLICIES
AMG Funds (the “Trust”) is an open-end management investment company, organized as a Massachusetts business trust, and registered under the Investment Company Act of 1940, as amended (the “1940 Act”). Currently, the Trust consists of a number of different funds, each having distinct investment management objectives, strategies, risks, and policies. Included in this report are AMG Yacktman Fund (“Yacktman Fund”), AMG Yacktman Focused Fund (“Yacktman Focused”), AMG Yacktman Focused Fund - Security Selection Only (“Yacktman Focused Selection Only”) and AMG Yacktman Special Opportunities Fund (“Yacktman Special Opportunities”), each a “Fund” and collectively, the “Funds”.
Each Fund offers different classes of shares. Yacktman Fund and Yacktman Special Opportunities have established Class N, Class I and Class Z shares. Currently, Yacktman Fund offers only Class I shares and Yacktman Special Opportunities offers Class I shares and Class Z shares. Yacktman Focused and Yacktman Focused Selection Only established and offer Class N and Class I shares. Each class represents an interest in the same assets of the respective Fund. Although all share classes generally have identical voting rights, each share class votes separately when required by law. Different share classes may have different net asset values per share to the extent the share classes pay different distribution amounts and/or the expenses of such share classes differ. Each share class has its own expense structure. Please refer to a current prospectus for additional information on each share class.
Yacktman Focused, Yacktman Focused Selection Only and Yacktman Special Opportunities are non-diversified. A greater percentage of the Funds’ holdings may be focused in a smaller number of securities which may place the Funds at greater risk than a more diversified fund.
Market disruptions associated with the COVID-19 pandemic have had a global impact, and uncertainty exists as to the long-term implications. Such disruptions can adversely affect assets of the Funds and thus Fund performance.
Certain instruments held by a Fund may pay an interest rate based on the London Interbank Offered Rate (“LIBOR”), which is the offered rate for short-term loans between certain major international banks. LIBOR is expected to be phased out by the end of the 2021. While the effect of the phase out cannot yet be determined, it may result in, among other things, increased volatility or illiquidity in markets for instruments based on LIBOR and changes in the value of some LIBOR-based investments or the effectiveness of new hedges placed against existing LIBOR-based investments. These effects could occur prior to the end of 2021. There also remains uncertainty and risk regarding the willingness and ability of issuers to include enhanced provisions in new and existing contracts or instruments. All of the aforementioned may adversely affect a Fund’s performance or net asset value.
The Funds’ financial statements are prepared in accordance with accounting principles generally accepted in the United States of America (“U.S. GAAP”), including accounting and reporting guidance pursuant to Accounting Standards Codification Topic 946 applicable to investment companies. U.S. GAAP requires management to make estimates and assumptions that affect the reported amounts of assets and liabilities and disclosure of contingent assets and liabilities at the date of the financial statements and the reported amounts of income and expenses during the reporting period. Actual results could differ from those estimates and such differences could be material. The following is a summary of significant accounting policies followed by the Funds in the preparation of their financial statements:
| a. | VALUATION OF INVESTMENTS |
Equity securities traded on a national securities exchange or reported on the NASDAQ national market system (“NMS”) are valued at the last quoted sales price on the primary exchange or, if applicable, the NASDAQ official closing price or the official closing price of the relevant exchange or, lacking any sales, at the last quoted bid price or the mean between the last quoted bid and ask prices (the “mean price”). Equity securities traded in the over-the-counter market (other than NMS securities) are valued at the mean price. Foreign equity securities (securities principally traded in markets other than U.S. markets) are valued at the official closing price on the primary exchange or, for markets that either do not offer an official closing price or where the official closing price may not be representative of the overall market, the last quoted sale price.
Fixed income securities purchased with a remaining maturity exceeding 60 days are valued at the evaluated mean price provided by an authorized pricing service or, if an evaluated price is not available, by reference to other securities which are considered comparable in credit rating, interest rate, due date and other features (generally referred to as “matrix pricing”) or other similar pricing methodologies.
Fixed income securities purchased with a remaining maturity of 60 days or less are valued at amortized cost, provided that the amortized cost value is approximately the same as the fair value of the security valued without the use of amortized cost. Investments in other open-end registered investment companies are valued at their end of day net asset value per share.
The Funds’ portfolio investments are generally valued based on independent market quotations or prices or, if none, “evaluative” or other market based valuations provided by third party pricing services approved by the Board of Trustees of the Trust (the “Board”). Under certain circumstances, the value of certain Fund portfolio investments may be based on an evaluation of fair value, pursuant to procedures established by and under the general supervision of the Board. The Valuation Committee, which is comprised of the Independent Trustees of the Board, and the Pricing Committee, which is comprised of representatives from AMG Funds LLC (the “Investment Manager”) are the committees appointed by the Board to make fair value determinations. Each Fund may use the fair value of a portfolio investment to calculate its net asset value (“NAV”) in the event that the market quotation, price or market based valuation for the portfolio investment is not readily available or otherwise not determinable pursuant to the Board’s valuation procedures, if the Investment Manager or the Pricing Committee believes the quotation, price or market based valuation to be unreliable, or in certain other circumstances. When determining the fair value of an investment, the Pricing Committee and, if required under the Trust’s securities valuation procedures, the Valuation Committee, seeks to determine the price that the Fund might reasonably expect to receive from current sale of that portfolio investment in an arms-length transaction. Fair value determinations shall be based upon consideration of all available facts and information, including, but not limited to (i) attributes specific to the investment; (ii) fundamental and analytical data relating to the investment; and (iii) the value of other comparable securities or relevant financial instruments, including derivative securities, traded on other markets or among dealers.
The values assigned to fair value portfolio investments are based on available information and do not necessarily represent amounts that might ultimately be realized in the future, since such amounts depend on future developments inherent in long-term investments. Because of the inherent uncertainty of valuation, those estimated values may differ significantly from the values that would have been used had a ready market for the investments existed, and the differences could be material. The Board will be presented with a quarterly report
| | |
| | |
| | Notes to Financial Statements (continued) |
showing as of the most recent quarter end, all outstanding securities fair valued by the Funds, including a comparison with the prior quarter end and the percentage of the Funds that the security represents at each quarter end.
With respect to foreign equity securities and certain foreign fixed income securities, the Board has adopted a policy that securities held in the Funds that can be fair valued by the applicable fair value pricing service are fair valued on each business day provided that each individual price exceeds a pre-established confidence level.
U.S. GAAP defines fair value as the price that a fund would receive to sell an asset or pay to transfer a liability in an orderly transaction between market participants at the measurement date. U.S. GAAP also establishes a framework for measuring fair value, and a three level hierarchy for fair value measurements based upon the transparency of inputs to the valuation of an asset or liability. Inputs may be observable or unobservable and refer broadly to the assumptions that market participants would use in pricing the asset or liability. Observable inputs reflect the assumptions market participants would use in pricing the asset or liability based on market data obtained from sources independent of the Funds. Unobservable inputs reflect the Funds’ own assumptions about the assumptions that market participants would use in pricing the asset or liability developed based on the best information available in the circumstances. Each investment is assigned a level based upon the observability of the inputs which are significant to the overall valuation.
The three-tier hierarchy of inputs is summarized below:
Level 1 – inputs are quoted prices in active markets for identical investments (e.g., equity securities, open-end investment companies)
Level 2 – other observable inputs (including, but not limited to: quoted prices for similar assets or liabilities in markets that are active, quoted prices for identical or similar assets or liabilities in markets that are not active, inputs other than quoted prices that are observable for the assets or liabilities (such as interest rates, yield curves, volatilities, prepayment speeds, loss severities, credit risks and default rates) or other market corroborated inputs) (e.g., debt securities, government securities, foreign currency exchange contracts, swaps, foreign securities utilizing international fair value pricing, fair valued securities with observable inputs)
Level 3 – inputs are significant unobservable inputs (including the Fund’s own assumptions used to determine the fair value of investments) (e.g., fair valued securities with unobservable inputs)
Changes in inputs or methodologies used for valuing investments may result in a transfer in or out of levels within the fair value hierarchy. The inputs or methodologies used for valuing investments may not necessarily be an indication of the risk associated with investing in those investments.
Security transactions are accounted for as of trade date. Realized gains and losses on securities sold are determined on the basis of identified cost.
| c. | INVESTMENT INCOME AND EXPENSES |
Dividend income is recorded on the ex-dividend date. Dividends from foreign securities are recorded on the ex-dividend date, and if after the fact, as soon as the Funds become aware of the ex-dividend date, except for Korean securities where dividends are recorded on confirmation date. Interest income, which includes amortization of premium and accretion of discount on debt securities, is accrued as earned. Dividend and interest income on foreign securities is recorded gross of any withholding tax. Non-cash dividends included in dividend income, if any, are reported at the fair market value of the securities received. Other income and expenses are recorded on an accrual basis. Expenses that cannot be directly attributed to a Fund are apportioned among the funds in the Trust and other trusts or funds within the AMG Funds Family of Funds (collectively the “AMG Funds Family”) based upon their relative average net assets or number of shareholders. Investment income, realized and unrealized capital gains and losses, the common expenses of each Fund, and certain fund level expense reductions, if any, are allocated on a pro-rata basis to each class based on the relative net assets of each class to the total net assets of each Fund.
| d. | DIVIDENDS AND DISTRIBUTIONS |
Fund distributions resulting from either net investment income or realized net capital gains, if any, will normally be declared and paid at least annually in December. Distributions to shareholders are recorded on the ex-dividend date. Distributions are determined in accordance with federal income tax regulations, which may differ from net investment income and net realized capital gains for financial statement purposes (U.S. GAAP). Differences may be permanent or temporary. Permanent differences are reclassified among capital accounts in the financial statements to reflect their tax character. Permanent book and tax basis differences, if any, relating to shareholder distributions will result in reclassifications to paid-in capital. Temporary differences arise when certain items of income, expense and gain or loss are recognized in different periods for financial statement and tax purposes; these differences will reverse at some time in the future. Permanent differences are due to tax equalization utilized and disallowed expenses. Temporary differences are due to mark-to-market of passive foreign investment companies, wash sale loss deferrals, write-off of defaulted security interest, qualified late-year loss deferrals and premium amortization on callable bonds.
The tax character of distributions paid during the fiscal years ended December 31, 2020 and December 31, 2019 were as follows:
| | Yacktman Fund | | Yacktman Focused | | Yacktman Focused Selection Only |
| Distributions paid from: | 2020 | | 2019 | | 2020 | | 2019 | | 2020 | | 2019 |
| Ordinary income * | $92,674,373 | | $137,511,761 | | $32,342,721 | | $51,817,707 | | $3,044,230 | | $3,561,611 |
| Long-term capital gains | 662,081,066 | | 579,795,814 | | 359,472,935 | | 458,718,910 | | 2,975,163 | | 310,860 |
| | $754,755,439 | | $717,307,575 | | $391,815,656 | | $510,536,617 | | $6,019,393 | | $3,872,471 |
| * | For tax purposes, short-term capital gain distributions, if any, are considered ordinary income distributions. |
| | |
| | |
| | Notes to Financial Statements (continued) |
| | Yacktman Special Opportunities |
| Distributions paid from: | 2020 | | 2019 |
| Ordinary income * | $1,744,583 | | $1,637,435 |
| Long-term capital gains | 265,822 | | 2,508,433 |
| | $2,010,405 | | $4,145,868 |
| * For tax purposes, short-term capital gain distributions, if any, are considered ordinary income distributions. |
As of December 31, 2020, the components of distributable earnings (excluding unrealized appreciation/depreciation) on a tax basis consisted of:
| | Yacktman Fund | | Yacktman Focused | | Yacktman Focused Selection Only | | Yacktman Special Opportunities | |
| Undistributed ordinary income | $11,894,273 | | $6,907,572 | | $2,419,791 | | $181,224 | |
| Undistributed long-term capital gains | 76,971,163 | | 52,150,049 | | 1,382,126 | | — | |
| Late-year loss deferral | — | | — | | — | | 491,378 | |
At December 31, 2020, the cost of investments and the aggregate gross unrealized appreciation and depreciation for federal income tax purposes were as follows:
| Fund | Cost | | Appreciation | | Depreciation | | Net Appreciation | |
| Yacktman Fund | $5,413,877,668 | | $2,672,522,648 | | $(461,285,625) | | $2,211,237,023 | |
| Yacktman Focused | 2,704,161,609 | | 1,180,653,272 | | (251,265,889) | | 929,387,383 | |
| Yacktman Focused Selection Only | 111,045,038 | | 32,264,065 | | (10,254,140) | | 22,009,925 | |
| Yacktman Special Opportunities | 71,025,395 | | 15,261,912 | | (7,646,517) | | 7,615,395 | |
Each Fund currently qualifies as an investment company and intends to comply with the requirements under Subchapter M of the Internal Revenue Code of 1986, as amended, and to distribute substantially all of its taxable income and gains to its shareholders and to meet certain diversification and income requirements with respect to investment companies. Therefore, no provision for federal income or excise tax is included in the accompanying financial statements.
Additionally, based on each Fund’s understanding of the tax rules and rates related to income, gains and transactions for the foreign jurisdictions in which it invests, each Fund will provide for foreign taxes, and where appropriate, deferred foreign taxes.
Management has analyzed the Funds’ tax positions taken on federal income tax returns as of December 31, 2020, and for all open tax years (generally, the three
prior taxable years), and has concluded that no provision for federal income tax is required in the Funds’ financial statements. Additionally, Management is not aware of any tax position for which it is reasonably possible that the total amounts of unrecognized tax benefits will change materially in the next twelve months.
| f. | CAPITAL LOSS CARRYOVERS AND DEFERRALS |
As of December 31, 2020, the Funds had no capital loss carryovers for federal income tax purposes. Should the Funds incur net capital losses for the fiscal year ended December 31, 2021, such amounts may be used to offset future realized capital gains indefinitely, and retain their character as short-term and/or long-term.
The Trust’s Declaration of Trust authorizes for each Fund the issuance of an unlimited number of shares of beneficial interest, without par value. Each Fund records sales and repurchases of its capital stock on the trade date. Prior to March 1, 2019, the Funds deducted a 2.00% redemption fee from the proceeds of any redemption of shares (including a redemption by exchange) if the redemption occurred within 60 days of the purchase of those shares. For the fiscal year ended December 31, 2019, Yacktman Fund, Yacktman Focused, Yacktman Focused Selection Only and Yacktman Special Opportunities had redemption fees amounting to $67,660, $48,523, $0 and $0, respectively. These amounts are netted against the cost of shares repurchased.
| | |
| | |
| | Notes to Financial Statements (continued) |
For the fiscal years ended December 31, 2020 and December 31, 2019, the capital stock transactions by class for the Funds were as follows:
| | Yacktman Fund | | Yacktman Focused |
| | December 31, 2020 | | December 31, 2019 | | December 31, 2020 | | December 31, 2019 |
| | Shares | | Amount | | Shares | | Amount | | Shares | | Amount | | Shares | | Amount |
| Class N: | | | | | | | | | | | | | | | |
| Proceeds from sale of shares | — | | — | | — | | — | | 11,740,917 | | $200,295,309 | | 11,913,239 | | $228,758,971 |
| Reinvestment of distributions | — | | — | | — | | — | | 11,008,080 | | 206,291,424 | | 16,070,712 | | 289,112,112 |
| Cost of shares repurchased | — | | — | | — | | — | | (34,866,916) | | (591,847,135) | | (35,872,111) | | (697,081,180) |
| Net decrease | — | | — | | — | | — | | (12,117,919) | | $(185,260,402) | | (7,888,160) | | $(179,210,097) |
| Class I: | | | | | | | | | | | | | | | |
| Proceeds from sale of shares | 71,412,641 | | $1,358,480,073 | | 91,432,518 | | $1,869,853,191 | | 27,935,904 | | $475,988,674 | | 30,519,803 | | $586,669,490 |
| Reinvestment of distributions | 32,825,661 | | 683,101,997 | | 32,693,802 | | 660,414,885 | | 8,817,752 | | 164,627,431 | | 9,892,324 | | 177,369,370 |
| Cost of shares repurchased | (147,630,684) | | (2,767,987,422) | | (94,878,053) | | (1,972,657,173) | | (33,155,340) | | (555,363,177) | | (27,756,664) | | (540,577,438) |
| Net increase (decrease) | (43,392,382) | | $(726,405,352) | | 29,248,267 | | $557,610,903 | | 3,598,316 | | $85,252,928 | | 12,655,463 | | $223,461,422 |
| | Yacktman Focused Selection Only | | Yacktman Special Opportunities |
| | December 31, 2020 | | December 31, 2019 | | December 31, 2020 | | December 31, 2019 |
| | Shares | | Amount | | Shares | | Amount | | Shares | | Amount | | Shares | | Amount |
| Class N: | | | | | | | | | | | | | | | |
| Proceeds from sale of shares | 16,796 | | $216,993 | | 10,111 | | $131,503 | | — | | — | | — | | — |
| Reinvestment of distributions | 1,246 | | 19,108 | | 542 | | 7,375 | | — | | — | | — | | — |
| Cost of shares repurchased | (3,756) | | (49,717) | | (3,796) | | (45,092) | | — | | — | | — | | — |
| Net increase | 14,286 | | $186,384 | | 6,857 | | $93,786 | | — | | — | | — | | — |
| Class I: | | | | | | | | | | | | | | | |
| Proceeds from sale of shares | 1,423,865 | | $18,017,089 | | 1,621,952 | | $21,528,514 | | 505,893 | | $4,252,612 | | 631,509 | | $6,501,856 |
| Reinvestment of distributions | 234,902 | | 3,598,698 | | 284,198 | | 3,865,096 | | 31,877 | | 340,442 | | 83,829 | | 796,377 |
| Cost of shares repurchased | (110,618) | | (1,259,558) | | (12,662) | | (171,540) | | (443,385) | | (3,989,165) | | (331,825) | | (3,447,181) |
| Net increase | 1,548,149 | | $20,356,229 | | 1,893,488 | | $25,222,070 | | 94,385 | | $603,889 | | 383,513 | | $3,851,052 |
| Class Z: | | | | | | | | | | | | | | | |
| Proceeds from sale of shares | — | | — | | — | | — | | 1,004,279 | | $10,009,323 | | 1,491,657 | | $15,442,999 |
| Reinvestment of distributions | — | | — | | — | | — | | 119,990 | | 1,283,898 | | 351,361 | | 3,344,956 |
| Cost of shares repurchased | — | | — | | — | | — | | (15,874) | | (144,022) | | (37,430) | | (390,979) |
| Net increase | — | | — | | — | | — | | 1,108,395 | | $11,149,199 | | 1,805,588 | | $18,396,976 |
At December 31, 2020, certain unaffiliated shareholders of record individually or collectively held greater than 10% of the net assets of the Funds as follows: Yacktman Focused Selection Only - one owns 34%; Yacktman Special Opportunities - three own 41%. Transactions by these shareholders may have a material impact on their respective Fund.
h. REPURCHASE AGREEMENTS AND JOINT REPURCHASE AGREEMENTS
The Funds may enter into third-party repurchase agreements for temporary cash management purposes and third-party or bilateral joint repurchase agreements for reinvestment of cash collateral on securities lending transactions under the securities lending program offered by The Bank of New York Mellon (“BNYM”) (the
“Program”) (collectively, “Repurchase Agreements”). The value of the underlying collateral, including accrued interest, must equal or exceed the value of the Repurchase Agreements during the term of the agreement. For joint repurchase agreements, the Funds participate on a pro rata basis with other clients of BNYM in its share of the underlying collateral under such joint repurchase agreements and in its share of proceeds from any repurchase or other disposition of the
| | |
| | |
| | Notes to Financial Statements (continued) |
underlying collateral. The underlying collateral for all Repurchase Agreements is held in safekeeping by the Funds’ custodian or at the Federal Reserve Bank. If the seller defaults and the value of the collateral declines, or if bankruptcy proceedings commence with respect to the seller of the security, realization of the collateral by the Funds may be delayed or limited. Pursuant to the Program, the Funds are indemnified for such losses by BNYM on joint repurchase agreements.
At December 31, 2020, the market value of Repurchase Agreements outstanding for Yacktman Fund and Yacktman Focused Fund - Security Selection Only were $309,509 and $128,529, respectively.
| i. | FOREIGN CURRENCY TRANSLATION |
The books and records of the Funds are maintained in U.S. dollars. The value of investments, assets and liabilities denominated in currencies other than U.S. dollars are translated into U.S. dollars based upon current foreign exchange rates. Purchases and sales of foreign investments, income and expenses are converted into U.S. dollars based on currency exchange rates prevailing on the respective dates of such transactions. Net realized and unrealized gain (loss) on foreign currency transactions represent: (1) foreign exchange gains and losses from the sale and holdings of foreign currencies; (2) gains and losses between trade date and settlement date on investment securities transactions and foreign currency exchange contracts; and (3) gains and losses from the difference between amounts of interest and dividends recorded and the amounts actually received.
The Funds do not isolate the net realized and unrealized gain or loss resulting from changes in exchange rates from the fluctuations in market prices of securities held. Such fluctuations are included with the net realized and unrealized gain or loss on investments.
| 2. | AGREEMENTS AND TRANSACTIONS WITH AFFILIATES |
For each of the Funds, the Trust has entered into an investment advisory agreement under which the Investment Manager, a subsidiary and the U.S. retail distribution arm of Affiliated Managers Group, Inc. (“AMG”), serves as investment manager to the Funds and is responsible for the Funds’ overall administration and operations. The Investment Manager selects one or more subadvisers for the Funds (subject to Board approval) and monitors each subadviser’s investment performance, security holdings and investment strategies. Each Fund’s investment portfolio is managed by Yacktman Asset Management LP (“Yacktman”) who serves pursuant to a subadvisory agreement with the Investment Manager. AMG indirectly owns a majority interest in Yacktman.
Investment management fees are paid directly by the Funds to the Investment Manager based on average daily net assets. For the fiscal year ended December 31, 2020, the Funds’ investment management fees were paid at the following annual rates of each Fund’s respective average daily net assets:
| Yacktman Fund | | | |
| on first $500 million | | 0.52% | |
| next $500 million | | 0.47% | |
| over $1 billion | | 0.42% | |
| Yacktman Focused | | 0.87% | |
| Yacktman Focused Selection Only | | 0.87% | |
| Yacktman Special Opportunities | | 1.37% | |
Yacktman Special Opportunities has a performance-based fee structure that consists of an investment management fee and a performance adjustment (“Performance Adjustment”). The monthly investment management fee is increased or reduced by the Performance Adjustment, based on the Fund’s performance relative to the MSCI ACWI All Cap Index over the then preceding twelve months. The Performance Adjustment Rate for the Fund may not exceed plus or minus 0.75%. For the fiscal year ended December 31, 2020, the Performance Adjustment decreased management fee by a net amount of $370,133, resulting in Yacktman Special Opportunities paying the Investment Manager at an effective rate of 0.77%.
The Investment Manager has contractually agreed, through at least May 1, 2021, to waive management fees and/or pay or reimburse fund expenses in order to limit total annual Fund operating expenses after fee waiver and expense reimbursements (exclusive of taxes, interest (including interest incurred in connection with bank and custody overdrafts, and in connection with securities sold short), brokerage commissions and other transaction costs, dividends payable with respect to securities sold short, acquired fund fees and expenses and extraordinary expenses) of the Class N shares of Yacktman Focused to the annual rate of 1.25% of Yacktman Focused Class N shares’ average daily net assets (this annual rate or such other annual rate that may be in effect from time to time, the “Expense Cap”), subject to later reimbursement by the Yacktman Focused Class N shares in certain circumstances.
The Investment Manager has contractually agreed, through at least May 1, 2021, to waive management fees and/or pay or reimburse fund expenses in order to limit total annual Fund operating expenses after fee waiver and expense reimbursements (exclusive of taxes, interest (including interest incurred in connection with bank and custody overdrafts, and in connection with securities sold short), shareholder servicing fees, distribution and service (12b-1) fees, brokerage commissions and other transaction costs, dividends payable with respect to securities sold short, acquired fund fees and expenses and extraordinary expenses) of Yacktman Focused Selection Only to the annual rate of 1.08% of the Fund’s average daily net assets (this annual rate or such other annual rate that may be in effect from time to time, the “Expense Cap”), subject to later reimbursement by the Fund in certain circumstances.
The Investment Manager has contractually agreed, through at least May 1, 2021, to waive management fees and/or pay or reimburse fund expenses in order to limit total annual Fund operating expenses after fee waiver and expense reimbursements (exclusive of investment management fees, administrative fees, taxes, interest (including interest incurred in connection with bank and custody overdrafts, and in connection with securities sold short), shareholder servicing fees, distribution and service (12b-1) fees, brokerage commissions and other transaction costs, dividends payable with respect to securities sold short, acquired fund fees and expenses and extraordinary expenses) of Yacktman Special Opportunities to an annual rate of 0.12% of the Fund’s average daily net assets (this annual rate or such other annual rate that may be in effect from time to time, the “Expense Cap”), subject to later reimbursement by the Fund in certain circumstances.
In general, for a period of up to 36 months after the date any amounts are paid, waived or reimbursed by the Investment Manager, the Investment Manager may recover such amounts from a Fund, provided that such repayment would not cause the Fund’s total annual operating expenses after fee waiver and expense reimbursements (exclusive of the items noted in the parenthetical above) to exceed either (i) the Expense Cap in effect at the time such amounts were paid,
| | |
| | |
| | Notes to Financial Statements (continued) |
waived or reimbursed, or (ii) the Expense Cap in effect at the time of such repayment by the Fund.
The contractual expense limitation may only be terminated in the event the Investment Manager or a successor ceases to be the investment manager of a Fund or a successor fund, by mutual agreement between the Investment Manager and the Board, or in the event of a Fund’s liquidation unless the Fund is reorganized or is a party to a merger in which the surviving entity is successor to the accounting and performance information of a Fund.
At December 31, 2020, the Funds’ expiration of reimbursements subject to recoupment is as follows:
Expiration Period | | Yacktman
Focused | | Yacktman
Focused
Selection Only | | Yacktman
Special
Opportunities |
| Less than 1 year | | — | | $117,191 | | $70,560 | |
| 1-2 years | | $99,833 | | 80,812 | | 81,819 | |
| 2-3 years | | 78,665 | | 69,647 | | 56,243 | |
| Total | | $178,498 | | $267,650 | | $208,622 | |
The Investment Manager has agreed to waive a portion of its management fee in consideration of shareholder servicing fees that it has received from JPMorgan Distribution Services, Inc., with respect to direct investments in the JPMorgan U.S. Government Money Market Fund, IM Capital Shares by Yacktman Fund and Yacktman Focused. For the fiscal year ended December 31, 2020, the investment management fees for Yacktman Fund and Yacktman Focused were reduced by $429,275 and $192,995, respectively, or 0.01% of average net assets.
The Trust, on behalf of the Funds, has entered into an amended and restated Administration Agreement under which the Investment Manager serves as the Funds’ administrator (the “Administrator”) and is responsible for all non-portfolio management aspects of managing the Funds’ operations, including administration and shareholder services to each Fund. Each Fund pays a fee to the Administrator at the rate of 0.15% per annum of the Fund’s average daily net assets for this service.
The Funds are distributed by AMG Distributors, Inc. (the “Distributor”), a wholly-owned subsidiary of the Investment Manager. The Distributor serves as the distributor and underwriter for each Fund and is a registered broker-dealer and member of the Financial Industry Regulatory Authority, Inc. (“FINRA”). Shares of each Fund will be continuously offered and will be sold directly to prospective purchasers and through brokers, dealers or other financial intermediaries who have executed selling agreements with the Distributor. Generally the Distributor bears all or a portion of the expenses of providing services pursuant to the distribution agreement, including the payment of the expenses relating to the distribution of prospectuses for sales purposes and any advertising or sales literature.
For Class N of Yacktman Focused and Yacktman Focused Selection Only and for Class I of Yacktman Fund and Yacktman Special Opportunities, the Board has approved reimbursement payments to the Investment Manager for shareholder servicing expenses (“shareholder servicing fees”) incurred. Shareholder servicing fees include payments to financial intermediaries, such as broker-dealers (including fund supermarket platforms), banks, and trust companies who provide shareholder recordkeeping, account servicing and other services. The Class N shares of Yacktman Focused and Yacktman Focused Selection Only and Class I
shares of Yacktman Fund and Yacktman Special Opportunities may reimburse the Investment Manager for the actual amount incurred up to a maximum annual rate of each Class’s average daily net assets as shown in the table below.
The impact on the annualized expense ratios for the fiscal year ended December 31, 2020, were as follows:
| Fund | | Maximum Annual
Amount
Approved | | Actual
Amount
Incurred |
| Yacktman Fund | | | | |
| Class I | | 0.20 | % | | 0.09 | % |
| Yacktman Focused | | | | | | |
| Class N | | 0.20 | % | | 0.19 | % |
| Yacktman Focused Selection Only | | | | | | |
| Class N | | 0.20 | % | | 0.11 | % |
| Yacktman Special Opportunities | | | | | | |
| Class I | | 0.10 | % | | 0.10 | % |
The Board provides supervision of the affairs of the Trust and other trusts within the AMG Funds Family. The Trustees of the Trust who are not affiliated with the Investment Manager receive an annual retainer and per meeting fees for regular, special and telephonic meetings, and they are reimbursed for out-of-pocket expenses incurred while carrying out their duties as Board members. The Chairman of the Board and the Audit Committee Chair receive additional annual retainers. Certain Trustees and Officers of the Funds are Officers and/or Directors of the Investment Manager, AMG and/or the Distributor.
The Securities and Exchange Commission (the “SEC”) granted an exemptive order that permits the Funds to lend and borrow money for certain temporary purposes directly to and from other eligible funds in the AMG Funds Family. Participation in this interfund lending program is voluntary for both the borrowing and lending funds, and an interfund loan is only made if it benefits each participating fund. The Administrator manages the program according to procedures approved by the Board, and the Board monitors the operation of the program. An interfund loan must comply with certain conditions set out in the exemptive order, which are designed to assure fairness and protect all participating funds. The interest earned and interest paid on interfund loans are included on the Statement of Operations as interest income and miscellaneous expense, respectively. At December 31, 2020, the Funds had no interfund loans outstanding.
The following Funds utilized the interfund loan program during the fiscal year ended December 31, 2020 as follows:
| Fund | | Average
Lent | | Number
of Days | | Interest
Earned | | Average
Interest Rate |
| Yacktman Fund | | $5,480,985 | | 20 | | $3,645 | | 1.214 | % |
| Yacktman Focused | | 7,560,156 | | 10 | | 2,002 | | 0.966 | % |
Yacktman Focused Selection Only | | 2,423,059 | | 3 | | 308 | | 1.545 | % |
| Yacktman Special Opportunities | | 1,379,065 | | 4 | | 251 | | 1.658 | % |
| | |
| | |
| | Notes to Financial Statements (continued) |
3. PURCHASES AND SALES OF SECURITIES
Purchases and sales of securities (excluding short-term securities and U.S. Government Obligations) for the fiscal year ended December 31, 2020, were as follows:
| | | Long Term Securities | |
| | | | | | | |
| Fund | | Purchases | | | Sales | |
| Yacktman Fund | | $1,487,232,128 | | | $1,923,175,077 | |
| Yacktman Focused | | 844,137,649 | | | 942,936,564 | |
| Yacktman Focused Selection Only | | 42,527,582 | | | 26,617,458 | |
| Yacktman Special Opportunities | | 31,549,791 | | | 21,709,179 | |
The Funds had no purchases or sales of U.S. Government Obligations during the fiscal year ended December 31, 2020.
4. PORTFOLIO SECURITIES LOANED
The Funds participate in the Program providing for the lending of securities to qualified borrowers. Securities lending income includes earnings of such temporary cash investments, plus or minus any rebate to a borrower. These earnings (after any rebate) are then divided between BNYM, as a fee for its services under the Program, and the Funds, according to agreed-upon rates. Collateral on all securities loaned is accepted in cash, U.S. Treasury Obligations or U.S. Government Agency Obligations. Collateral is maintained at a minimum level of 102% (105% in the case of certain foreign securities) of the market value, plus interest, if applicable, of investments on loan. It is the Funds’ policy to obtain additional collateral from or return excess collateral to the borrower by the end of the next business day, following the valuation date of the securities loaned. Therefore, the value of the collateral held may be temporarily less than the value of the securities on loan. Lending securities entails a risk of loss to the Funds if and to the extent that the market value of the securities loaned were to increase and the borrower did not increase the collateral accordingly, and the borrower fails to return the securities. Under the terms of the Program, the Funds are indemnified for such losses by BNYM. Cash collateral is held in separate omnibus accounts managed by BNYM, who is authorized to exclusively enter into joint repurchase agreements for that cash collateral. Securities collateral is held in separate omnibus accounts managed by BNYM that cannot be sold or pledged. BNYM bears the risk of any deficiency in the amount of the cash collateral available for return to the borrower due to any loss on the collateral invested. Loans of securities are terminable at any time and the borrower, after notice, is required to return borrowed securities as soon as practical, which is normally within three business days.
The value of securities loaned on positions held, cash collateral and securities collateral received at December 31, 2020, were as follows:
| Fund | | Securities
Loaned | | Cash
Collateral Received | | Securities
Collateral Received | | Total
Collateral Received |
| Yacktman Fund | | $1,731,047 | | $309,509 | | $1,460,643 | | $1,770,152 | |
| Yacktman Focused Selection Only | | 128,346 | | 128,529 | | 6,428 | | 134,957 | |
The following table summarizes the securities received as collateral for securities lending at December 31, 2020:
| Fund | | Collateral
Type | | Coupon
Range | | Maturity
Date Range | |
| Yacktman Fund | | U.S. Treasury Obligations | | 0.000%-8.125% | | 01/15/21-08/15/50 | |
| Yacktman Focused Selection Only | | U.S. Treasury Obligations | | 0.000%-3.875% | | 01/28/21-08/15/48 | |
5. FOREIGN SECURITIES
The Funds invest in securities of foreign entities and in instruments denominated in foreign currencies which involve risks not typically associated with investments in domestic securities. Non-domestic securities carry special risks, such as exposure to currency fluctuations, less developed or less efficient trading markets, political instability, a lack of company information, differing auditing and legal standards, and, potentially, less liquidity. A Fund’s investments in emerging market countries are exposed to additional risks. A Fund’s performance will be influenced by political, social and economic factors affecting companies in emerging market countries. Emerging market countries generally have economic structures that are less diverse and mature, and political systems that are less stable, than those of developed countries. Realized gains in certain countries may be subject to foreign taxes at the Fund level and the Fund would pay such foreign taxes at the appropriate rate for each jurisdiction.
6. COMMITMENTS AND CONTINGENCIES
Under the Trust’s organizational documents, its trustees and officers are indemnified against certain liabilities arising out of the performance of their duties to the Trust. In addition, in the normal course of business, the Funds may enter into contracts and agreements that contain a variety of representations and warranties, which provide general indemnifications. The maximum exposure to the Funds under these arrangements is unknown, as this would involve future claims that may be made against a Fund that have not yet occurred. However, based on experience, the Funds had no prior claims or losses and expect the risks of loss to be remote.
7. MASTER NETTING AGREEMENTS
The Funds may enter into master netting agreements with their counterparties for the securities lending program and Repurchase Agreements, which provide the right, in the event of default (including bankruptcy or insolvency) for the non-defaulting party to liquidate the collateral and calculate net exposure to the defaulting party or request additional collateral. For financial reporting purposes, the Funds do not offset financial assets and financial liabilities that are subject to master netting agreements in the Statement of Assets and Liabilities. For securities lending transactions, see Note 4.
The following table is a summary of the Funds’ open Repurchase Agreements that are subject to a master netting agreement as of December 31, 2020:
| | |
| | |
| | Notes to Financial Statements (continued) |
| | | | | Gross Amount Not Offset in the Statement of Assets and Liabilities | | | | |
| Fund | | Gross Amounts of
Assets Presented in
the Statement of
Assets and Liabilities | | Offset
Amount | | Net
Asset Balance | | Collateral
Received | | Net
Amount |
| Yacktman Fund | | | | | | | | | | |
| Nomura Securities International, Inc. | | $309,509 | | — | | $309,509 | | $309,509 | | — |
| Yacktman Focused Selection Only | | | | | | | | | | |
| Citibank N.A. | | $128,529 | | — | | $128,529 | | $128,529 | | — |
8. SUBSEQUENT EVENTS
The Funds have determined that no material events or transactions occurred through the issuance date of the Funds’ financial statements which require an additional disclosure in or adjustment of the Funds’ financial statements.
| | |
| | |
| | Report of Independent Registered Public Accounting Firm |
TO THE BOARD OF TRUSTEES OF AMG FUNDS AND SHAREHOLDERS OF AMG YACKTMAN FUND, AMG YACKTMAN FOCUSED FUND, AMG YACKTMAN FOCUSED FUND – SECURITY SELECTION ONLY, AND AMG YACKTMAN SPECIAL OPPORTUNITIES FUND
Opinion on the Financial Statements
We have audited the accompanying statement of assets and liabilities, including the schedule of portfolio investments, of AMG Yacktman Fund, AMG Yacktman Focused Fund, AMG Yacktman Focused Fund – Security Selection Only, and AMG Yacktman Special Opportunities Fund (four of the funds constituting AMG Funds, referred to hereafter as the “Funds”) as of December 31, 2020, the related statements of operations for the year ended December 31, 2020, the statements of changes in net assets for each of the two years in the period ended December 31, 2020, including the related notes, and the financial highlights for each of the periods indicated therein (collectively referred to as the “financial statements”). In our opinion, the financial statements present fairly, in all material respects, the financial position of each of the Funds as of December 31, 2020, the results of each of their operations for the year then ended, the changes in each of their net assets for each of the two years in the period December 31, 2020, and each of the financial highlights for each of the financial highlights for each of the periods indicated therein in conformity with accounting principles generally accepted in the United States of America.
Basis for Opinion
These financial statements are the responsibility of the Funds’ management. Our responsibility is to express an opinion on the Funds’ financial statements based on our audits. We are a public accounting firm registered with the Public Company Accounting Oversight Board (United States) (PCAOB) and are required to be independent with respect to the Funds in accordance with the U.S. federal securities laws and the applicable rules and regulations of the Securities and Exchange Commission and the PCAOB.
We conducted our audits of these financial statements in accordance with the standards of the PCAOB. Those standards require that we plan and perform the audit to obtain reasonable assurance about whether the financial statements are free of material misstatement, whether due to error or fraud.
Our audits included performing procedures to assess the risks of material misstatement of the financial statements, whether due to error or fraud, and performing procedures that respond to those risks. Such procedures included examining, on a test basis, evidence regarding the amounts and disclosures in the financial statements. Our audits also included evaluating the accounting principles used and significant estimates made by management, as well as evaluating the overall presentation of the financial statements. Our procedures included confirmation of securities owned as of December 31, 2020, by correspondence with the custodian and brokers; when replies were not received from brokers, we performed other auditing procedures. We believe that our audits provide a reasonable basis for our opinion.
PricewaterhouseCoopers LLP
Boston, Massachusetts
February 23, 2021
We have served as the auditor of one or more investment companies in the AMG Funds Family since 1993.
| | |
| | |
| | Other Information (unaudited) |
TAX INFORMATION
AMG Yacktman Fund, AMG Yacktman Focused Fund, AMG Yacktman Focused Fund - Security Selection Only and AMG Yacktman Special Opportunities Fund each hereby designates the maximum amount allowable of its net taxable income as qualified dividends as provided in the Jobs and Growth Tax Relief Reconciliation Act of 2003. The 2020 Form 1099-DIV you receive for each Fund will show the tax status of all distributions paid to you during the calendar year.
In accordance with federal tax law, the following Fund elected to provide foreign taxes paid and the income sourced from foreign countries. Accordingly, the following Fund hereby makes the following designations regarding its period ended December 31, 2020:
AMG Yacktman Special Opportunities Fund
►The total amount of taxes paid and income sourced from foreign countries was $81,687 and $928,244, respectively.
Pursuant to section 852 of the Internal Revenue Code, AMG Yacktman Fund, AMG Yacktman Focused Fund, AMG Yacktman Focused Fund - Security Selection Only and AMG Yacktman Special Opportunities Fund each hereby designates $749,129,812, $394,304,129, $2,975,163 and $265,822, respectively, as a capital gain distribution with respect to the taxable year ended December 31, 2020, or if subsequently determined to be different, the net capital gains of such year.
| | |
| | AMG Funds |
| | Trustees and Officers |
| The Trustees and Officers of the Trust, their business addresses, principal occupations for the past five years and ages are listed below. The Trustees provide broad supervision over the affairs of the Trust and the Funds. The Trustees are experienced executives who meet periodically throughout the year to oversee the Funds’ activities, review contractual arrangements with companies that provide services to the Funds, and | | | review the Funds’ performance. Unless otherwise noted, the address of each Trustee or Officer is the address of the Trust: One Stamford Plaza, 263 Tresser Blvd, Suite 949, Stamford, Connecticut 06901. There is no stated term of office for Trustees. Trustees serve until their resignation, retirement or removal in | | | accordance with the Trust’s organizational documents and policies adopted by the Board from time to time. The Chairman of the Trustees, President, Treasurer and Secretary of the Trust are elected by the Trustees annually. Other officers hold office at the pleasure of the Trustees. |
Independent Trustees
The following Trustees are not “interested persons” of the Trust within the meaning of the 1940 Act:
| Number of Funds Overseen in Fund Complex | Name, Age, Principal Occupation(s) During Past 5 Years and Other Directorships Held by Trustee |
● Trustee since 2012 ● Oversees 46 Funds in Fund Complex | Bruce B. Bingham, 72 Partner, Hamilton Partners (real estate development firm) (1987-2020); Director of The Yacktman Funds (2 portfolios) (2000-2012). |
● Trustee since 2013 ● Oversees 49 Funds in Fund Complex | Kurt A. Keilhacker, 57 Managing Partner, TechFund Capital (1997-Present); Managing Partner, TechFund Europe (2000-Present); Managing Partner, Elementum Ventures (2013-Present); Director, MetricStory, Inc. (2017-Present); Trustee, Wheaton College (2018-Present); Trustee, Gordon College (2001-2016); Trustee, Board Member, 6wind SA, (2002-2019). |
● Trustee since 2000 ● Oversees 46 Funds in Fund Complex | Steven J. Paggioli, 70 Independent Consultant (2002-Present); Trustee, Professionally Managed Portfolios (28 portfolios); Advisory Board Member, Sustainable Growth Advisors, LP; Independent Director, Muzinich BDC, Inc. (business development company) (2019-Present); Director, The Wadsworth Group; Independent Director, Chase Investment Counsel (2008–2019); Executive Vice President, Secretary and Director, Investment Company Administration, LLC and First Fund Distributors, INC. (1990-2001). |
● Trustee since 2013 ● Oversees 46 Funds in Fund Complex | Richard F. Powers III, 75 Adjunct Professor, U.S. Naval War College (2016-Present); Adjunct Professor, Boston College (2011-2015); Director, Ameriprise Financial Inc. (2005-2009); President and CEO of Van Kampen Investments Inc. (1998-2003); President, Morgan Stanley Client Group (2000-2002); Executive Vice President and Chief Marketing Officer of the Morgan Stanley Individual Investor Group (1984-1998). |
● Independent Chairman ● Trustee since 2000 ● Oversees 49 Funds in Fund Complex | Eric Rakowski, 62 Professor of Law, University of California at Berkeley School of Law (1990-Present); Tax Attorney at Davis Polk & Wardwell and clerked for Judge Harry T. Edwards of the U.S. Court of Appeals for the District of Columbia Circuit and for Justice William J. Brennan Jr. of the U.S. Supreme Court; Director of Harding, Loevner Funds, Inc. (9 portfolios); Trustee of Third Avenue Trust (3 portfolios) (2002-2019); Trustee of Third Avenue Variable Trust (1 portfolio) (2002-2019). |
● Trustee since 2013 ● Oversees 49 Funds in Fund Complex | Victoria L. Sassine, 55 Adjunct Professor, Babson College (2007–Present); Director, Board of Directors, PRG Group (2017-Present); CEO, Founder, Scale Smarter Partners, LLC (2018-Present); Adviser, EVOFEM Biosciences (2019-Present); Teaching Fellow, Goldman Sachs 10,000 Small Business Initiative (2010-Present); Chairperson of the Board of Directors of Business Management Associates (2018 to 2019). |
● Trustee since 2004 ● Oversees 46 Funds in Fund Complex | Thomas R. Schneeweis, 73 Professor Emeritus, University of Massachusetts (2013-Present); President, TRS Associates (1982-Present); Board Member, Chartered Alternative Investment Association (“CAIA”) (2002-Present); Director, CAIA Foundation (2010-2019); Director, Institute for Global Asset and Risk Management (Education) (2010-Present); Co-Owner, Quantitative Investment Technologies (2014-Present); Co-Owner, Yes Wealth Management (2018-Present); Director of Research, Yes Wealth Management (2018-Present); Partner, S Capital Wealth Advisors (2015-2018); Partner, S Capital Management, LLC (2007-2015); President, Alternative Investment Analytics, LLC, (formerly Schneeweis Partners, LLC) (2001-2013); Finance Professor, University of Massachusetts (1977-2013). |
| | |
| | AMG Funds |
| | Trustees and Officers (continued) |
Interested Trustees
Each Trustee in the following table is an “interested person” of the Trust within the meaning of the 1940 Act. Ms. Carsman is an interested person of the Trust within the meaning of the 1940 Act by virtue of her position with, and interest in securities of, AMG.
| Number of Funds Overseen in Fund Complex | Name, Age, Principal Occupation(s) During Past 5 Years and Other Directorships Held by Trustee |
● Trustee since 2011 ● Oversees 46 Funds in Fund Complex | Christine C. Carsman, 68 Senior Policy Advisor, Affiliated Managers Group, Inc. (2019-Present); Chair of the Board of Directors, AMG Funds plc (2015-2018); Director, AMG Funds plc (2010-2018); Executive Vice President, Deputy General Counsel and Chief Regulatory Counsel, Affiliated Managers Group, Inc. (2017-2018); Senior Vice President and Deputy General Counsel, Affiliated Managers Group, Inc. (2011-2016); Senior Vice President and Chief Regulatory Counsel, Affiliated Managers Group, Inc. (2007-2011); Vice President and Chief Regulatory Counsel, Affiliated Managers Group, Inc. (2004-2007); Senior Counsel, Vice President and Director of Operational Risk Management and Compliance, Wellington Management Company, LLP (1995-2004); Director of Harding, Loevner Funds, Inc. (9 portfolios) (2017-Present); Secretary and Chief Legal Officer, AMG Funds, AMG Funds I, AMG Funds II and AMG Funds III (2004-2011). |
| |
| Officers |
| Position(s) Held with Fund and Length of Time Served | Name, Age, Principal Occupation(s) During Past 5 Years |
● President since 2018 ● Principal Executive Officer since 2018 ● Chief Executive Officer since 2018 ● Chief Operating Officer since 2007 | Keitha L. Kinne, 62 Chief Operating Officer, AMG Funds LLC (2007-Present); Chief Investment Officer, AMG Funds LLC (2008-Present); President and Principal, AMG Distributors, Inc. (2018-Present); Chief Operating Officer, AMG Distributors, Inc. (2007-Present); President, Chief Executive Officer and Principal Executive Officer, AMG Funds, AMG Funds I, AMG Funds II, AMG Funds III and AMG Funds IV (2018-Present); Chief Operating Officer, AMG Funds, AMG Funds I, AMG Funds II, and AMG Funds III (2007-Present); Chief Operating Officer, AMG Funds IV (2016-Present); Chief Operating Officer and Chief Investment Officer, Aston Asset Management, LLC (2016); President and Principal Executive Officer, AMG Funds, AMG Funds I, AMG Funds II and AMG Funds III (2012-2014); Managing Partner, AMG Funds LLC (2007-2014); President and Principal, AMG Distributors, Inc. (2012-2014); Managing Director, Legg Mason & Co., LLC (2006-2007); Managing Director, Citigroup Asset Management (2004-2006). |
● Secretary since 2015 ● Chief Legal Officer since 2015 | Mark J. Duggan, 55 Senior Vice President and Senior Counsel, AMG Funds LLC (2015-Present); Secretary and Chief Legal Officer, AMG Funds, AMG Funds I, AMG Funds II, AMG Funds III and AMG Funds IV (2015-Present); Attorney, K&L Gates, LLP (2009-2015). |
● Chief Financial Officer since 2017 ● Treasurer since 2017 ● Principal Financial Officer since 2017 ● Principal Accounting Officer since 2017 | Thomas G. Disbrow, 54 Vice President, Mutual Fund Treasurer & CFO, AMG Funds, AMG Funds LLC (2017-Present); Chief Financial Officer, Principal Financial Officer, Treasurer and Principal Accounting Officer, AMG Funds, AMG Funds I, AMG Funds II, AMG Funds III and AMG Funds IV (2017-Present); Managing Director - Global Head of Traditional Funds Product Control, UBS Asset Management (Americas), Inc. (2015-2017); Managing Director - Head of North American Funds Treasury, UBS Asset Management (Americas), Inc. (2011-2015). |
| ● Deputy Treasurer since 2017 | John A. Starace, 50 Director, Mutual Fund Accounting, AMG Funds LLC (2017-Present); Vice President, Deputy Treasurer of Mutual Funds Services, AMG Funds LLC (2014-2017); Deputy Treasurer, AMG Funds, AMG Funds I, AMG Funds II, AMG Funds III and AMG Funds IV (2017-Present); Vice President, Citi Hedge Fund Services (2010-2014); Audit Senior Manager (2005-2010) and Audit Manager (2001-2005), Deloitte & Touche LLP. |
| ● Chief Compliance Officer since 2019 | Patrick J. Spellman, 46 Vice President, Chief Compliance Officer, AMG Funds LLC (2017-Present); Chief Compliance Officer and Sarbanes-Oxley Code of Ethics Compliance Officer, AMG Funds, AMG Funds I, AMG Funds II, AMG Funds III and AMG Funds IV (2019-Present); Chief Compliance Officer, AMG Distributors, Inc., (2010-Present); Senior Vice President, Chief Compliance Officer, AMG Funds LLC (2011-2017); Anti-Money Laundering Compliance Officer, AMG Funds, AMG Funds I, AMG Funds II, and AMG Funds III (2014-2019); Anti-Money Laundering Officer, AMG Funds IV, (2016-2019); Compliance Manager, Legal and Compliance, Affiliated Managers Group, Inc. (2005-2011). |
| ● Assistant Secretary since 2016 | Maureen A. Meredith, 35 Vice President, Counsel, AMG Funds LLC (2019-Present); Director, Counsel, AMG Funds LLC (2017-2018); Vice President, Counsel, AMG Funds LLC (2015-2017); Assistant Secretary, AMG Funds, AMG Funds I, AMG Funds II, AMG Funds III and AMG Funds IV (2016-Present); Associate, Ropes & Gray LLP (2011-2015); Law Fellow, Massachusetts Appleseed Center for Law and Justice (2010-2011). |
● Anti-Money Laundering Compliance Officer since 2019 | Hector D. Roman, 43 Director, Legal and Compliance, AMG Funds LLC (2020-Present); Manager, Legal and Compliance, AMG Funds LLC (2017-2019); Director of Compliance, Morgan Stanley Investment Management (2015-2017); Senior Advisory, PricewaterhouseCoopers LLP (2014-2015); Risk Manager, Barclays Investment Bank (2008-2014); Anti-Money Laundering Compliance Officer, AMG Funds, AMG Funds I, AMG Funds II, AMG Funds III and AMG Funds IV (2019-Present). |
| | INVESTMENT MANAGER AND ADMINISTRATOR AMG Funds LLC
One Stamford Plaza
263 Tresser Blvd, Suite 949
Stamford, CT 06901
800.548.4539 DISTRIBUTOR AMG Distributors, Inc.
One Stamford Plaza
263 Tresser Blvd, Suite 949
Stamford, CT 06901
800.548.4539 SUBADVISER Yacktman Asset Management LP
6300 Bridgepoint Parkway
Building One, Suite 500
Austin, TX 78730 CUSTODIAN The Bank of New York Mellon
111 Sanders Creek Parkway
East Syracuse, NY 13057 | | | LEGAL COUNSEL Ropes & Gray LLP
Prudential Tower, 800 Boylston Street
Boston, MA 02199-3600 TRANSFER AGENT BNY Mellon Investment Servicing (US) Inc.
Attn: AMG Funds
4400 Computer Drive
Westborough, MA 01581
800.548.4539 | | | This report is prepared for the Funds’ shareholders. It is authorized for distribution to prospective investors only when preceded or accompanied by an effective prospectus. To receive a free copy of the prospectus or Statement of Additional Information, which includes additional information about Fund Trustees, please contact us by calling 800.548.4539. Distributed by AMG Distributors, Inc., member FINRA/SIPC. Current net asset values per share for each Fund are available on the Funds’ website at amgfunds.com. A description of the policies and procedures each Fund uses to vote its proxies is available: (i) without charge, upon request, by calling 800.548.4539, or (ii) on the Securities and Exchange Commission’s (SEC) website at sec.gov. For information regarding the Funds’ proxy voting record for the 12-month period ended June 30, call 800.548.4539 or visit the SEC website at sec.gov. The Funds file their complete schedule of portfolio holdings with the SEC for the first and third quarters of each fiscal year as an exhibit to their reports on Form N-PORT. The Funds’ portfolio holdings on Form N-PORT are available on the SEC’s website at sec.gov and the Funds’ website at amgfunds.com. To review a complete list of the Funds’ portfolio holdings, or to view the most recent semi-annual report or annual report, please visit amgfunds.com. |
| | AFFILIATE SUBADVISED FUNDS | | | AMG TimesSquare Emerging Markets Small Cap | | | AMG Managers Emerging Opportunities | |
| | | | | AMG TimesSquare Global Small Cap | | | WEDGE Capital Management L.L.P. | |
| | BALANCED FUNDS | | | AMG TimesSquare International Small Cap | | | Next Century Growth Investors LLC | |
| | AMG GW&K Global Allocation | | | AMG TimesSquare Mid Cap Growth | | | RBC Global Asset Management (U.S.) Inc. | |
| | GW&K Investment Management, LLC | | | AMG TimesSquare Small Cap Growth | | | AMG Managers Fairpointe Mid Cap | |
| | | | | TimesSquare Capital Management, LLC | | | Fairpointe Capital LLC | |
| | AMG FQ Global Risk-Balanced | | | | | | AMG Managers LMCG Small Cap Growth | |
| | First Quadrant, L.P. | | | AMG Yacktman | | | LMCG Investments, LLC | |
| | | | | AMG Yacktman Focused | | | | |
| | EQUITY FUNDS | | | AMG Yacktman Focused Fund - Security Selection Only | | | AMG Managers Montag & Caldwell Growth | |
| | AMG FQ Tax-Managed U.S. Equity | | | AMG Yacktman Special Opportunities | | | Montag & Caldwell, LLC | |
| | AMG FQ Long-Short Equity | | | Yacktman Asset Management LP | | | | |
| | First Quadrant, L.P. | | | | | | AMG Managers Pictet International | |
| | | | | FIXED INCOME FUNDS | | | Pictet Asset Management Limited | |
| | AMG Frontier Small Cap Growth | | | AMG GW&K Core Bond ESG | | | | |
| | Frontier Capital Management Co., LLC | | | AMG GW&K Enhanced Core Bond ESG | | | AMG Managers Silvercrest Small Cap | |
| | | | | AMG GW&K High Income | | | Silvercrest Asset Management Group LLC | |
| | AMG GW&K Small Cap Core | | | AMG GW&K Municipal Bond | | | | |
| | AMG GW&K Small Cap Value | | | AMG GW&K Municipal Enhanced Yield | | | AMG Managers Special Equity | |
| | AMG GW&K Small/Mid Cap | | | GW&K Investment Management, LLC | | | Ranger Investment Management, L.P. | |
| | AMG GW&K Mid Cap | | | | | | Lord, Abbett & Co. LLC | |
| | AMG GW&K Emerging Markets Equity | | | OPEN-ARCHITECTURE FUNDS | | | Smith Asset Management Group, L.P. | |
| | AMG GW&K Emerging Wealth Equity | | | | | | Federated MDTA LLC | |
| | AMG GW&K International Small Cap | | | EQUITY FUNDS | | | | |
| | GW&K Investment Management, LLC | | | AMG Managers Brandywine | | | FIXED INCOME FUNDS | |
| | | | | AMG Managers Brandywine Blue | | | AMG Managers DoubleLine Core Plus Bond | |
| | AMG Renaissance Large Cap Growth | | | Friess Associates, LLC | | | DoubleLine Capital LP | |
| | The Renaissance Group LLC | | | | | | | |
| | | | | AMG Managers CenterSquare Real Estate | | | AMG Managers Loomis Sayles Bond | |
| | AMG River Road Dividend All Cap Value | | | CenterSquare Investment Management LLC | | | Loomis, Sayles & Company, L.P. | |
| | AMG River Road Focused Absolute Value | | | | | | | |
| | AMG River Road Long-Short | | | | | | | |
| | AMG River Road Small-Mid Cap Value | | | | | | | |
| | AMG River Road Small Cap Value | | | | | | | |
| | River Road Asset Management, LLC | | | | | | | |
| | | | | | | | | |
| | | | | | | | | |
| | | | | | | | | |
| | | | | | | | | |
| | | | | | | | | |
| | | | | | | | | |
| | | | | | | | | |
| | | | | | | | | |
| | | | | | | | | |
| | | | | | | | | |
| Annual Report |
| | | AMG Funds |
| | | |
| | | December 31, 2020 |
| | | |
| | |  |
| | | |
| | | AMG GW&K Enhanced Core Bond ESG Fund |
| | | Class N: MFDAX | Class I: MFDSX | Class Z: MFDYX |
| | | |
| | | AMG GW&K High Income Fund |
| | | (formerly AMG Managers Global Income Opportunity Fund) |
| | | Class N: MGGBX |
| | | |
| | | AMG GW&K Municipal Bond Fund |
| | | Class N: GWMTX | Class I: GWMIX |
| | | |
| | | AMG GW&K Municipal Enhanced Yield Fund |
| | | Class N: GWMNX | Class I: GWMEX | Class Z: GWMZX |
| | | |
| | | AMG GW&K Global Allocation Fund |
| | | (formerly AMG Chicago Equity Partners Balanced Fund) |
| | | Class N: MBEAX | Class I: MBESX | Class Z: MBEYX |
| | | |
| | | AMG GW&K Small Cap Core Fund |
| | | Class N: GWETX | Class I: GWEIX | Class Z: GWEZX |
| | | |
| | | AMG GW&K Small/Mid Cap Fund |
| | | Class N: GWGVX | Class I: GWGIX | Class Z: GWGZX |
| | | |
| | | AMG GW&K Small Cap Value Fund |
| | | (formerly AMG Managers Skyline Special Equities Fund) |
| | | Class N: SKSEX | Class I: SKSIX | Class Z: SKSZX |
| | | |
| amgfunds.com | | 123120 | AR019 |
| | |
| | AMG Funds |
| | Annual Report — December 31, 2020 |
| | | | |
| | TABLE OF CONTENTS | | PAGE |
| | LETTER TO SHAREHOLDERS | | 2 |
| | | | |
| | ABOUT YOUR FUND’S EXPENSES | | 3 |
| | | | |
| | PORTFOLIO MANAGER’S COMMENTS, FUND SNAPSHOTS AND SCHEDULES OF PORTFOLIO INVESTMENTS | | |
| | | | |
| | AMG GW&K Enhanced Core Bond ESG Fund | | 5 |
| | | | |
| | AMG GW&K High Income Fund | | |
| | (formerly AMG Managers Global Income Opportunity Fund) | | 14 |
| | | | |
| | AMG GW&K Municipal Bond Fund | | 21 |
| | | | |
| | AMG GW&K Municipal Enhanced Yield Fund | | 29 |
| | | | |
| | AMG GW&K Global Allocation Fund | | |
| | (formerly AMG Chicago Equity Partners Balanced Fund) | | 36 |
| | | | |
| | AMG GW&K Small Cap Core Fund | | 46 |
| | | | |
| | AMG GW&K Small/Mid Cap Fund | | 52 |
| | | | |
| | AMG GW&K Small Cap Value Fund | | |
| | (formerly AMG Managers Skyline Special Equities Fund) | | 58 |
| | | | |
| | FINANCIAL STATEMENTS | | |
| | Statement of Assets and Liabilities | | 63 |
| | Balance sheets, net asset value (NAV) per share computations and cumulative distributable earnings (loss) | | |
| | | | |
| | Statement of Operations | | 67 |
| | Detail of sources of income, expenses, and realized and unrealized gains (losses) during the fiscal year | | |
| | | | |
| | Statements of Changes in Net Assets | | 69 |
| | Detail of changes in assets for the past two fiscal years | | |
| | | | |
| | Financial Highlights | | 72 |
| | Historical net asset values per share, distributions, total returns, income and expense ratios, turnover ratios and net assets | | |
| | | | |
| | Notes to Financial Statements | | 93 |
| | Accounting and distribution policies, details of agreements and transactions with Fund management and affiliates, and descriptions of certain investment risks | | |
| | | | |
| | REPORT OF INDEPENDENT REGISTERED PUBLIC ACCOUNTING FIRM | | 105 |
| | | | |
| | OTHER INFORMATION | | 106 |
| | | | |
| | TRUSTEES AND OFFICERS | | 107 |
| | | | |
| | APPROVAL OF SUBADVISORY AGREEMENTS | | 109 |
| Nothing contained herein is to be considered an offer, sale or solicitation of an offer to buy shares of any series of the AMG Funds Family of Funds. Such offering is made only by prospectus, which includes details as to offering price and other material information. |
| Letter to Shareholders |
Dear Shareholder:
The fiscal year ending December 31, 2020, was a volatile period for financial markets that featured a dramatic selloff and extraordinary rebound amid the unprecedented global effort to stop the COVID-19 pandemic. Early in the year, equities achieved new record highs against the backdrop of a healthy economy and strong investor sentiment. However, a broad-based selloff occurred amid a global flight to quality as investors assessed the scope of the unfolding COVID-19 pandemic, a deteriorating economy, and skyrocketing unemployment. An oil price war initiated between Saudi Arabia and Russia only made matters worse. From its peak in mid-February 2020, the S&P 500® Index declined (33.79)% over the span of a few weeks, halting the eleven-year equity bull market. In response to the crisis, global central banks and governments were quick to flood the market with massive fiscal and monetary stimulus which helped to stabilize the market and led to an impressive recovery in risk assets, albeit a very uneven one. So despite the volatility, the S&P 500® Index still achieved an 18.40% return for 2020 while effective COVID-19 vaccines and further government stimulus bolstered investor optimism for a brighter future in 2021.
During the year there was very wide dispersion in performance across sectors, with information technology and consumer discretionary sectors leading the market with returns of 43.88% and 33.30%, respectively. On the other hand, companies in the energy sector fell (33.69)%, and financials and real estate also produced slightly negative returns. Growth stocks significantly outperformed value stocks for the period with returns of 38.49% and 2.80% for the Russell 1000® Growth and Russell 1000® Value Indexes, respectively. Small cap stocks endured a wild ride in 2020 as the Russell 2000® Index experienced both its best quarter (fourth quarter 2020) and worst quarter (first quarter 2020) on record. For the year as a whole, small cap returns were relatively in line with the broader market as the Russell 2000® Index gained 19.96% in 2020. Outside the U.S., emerging markets outperformed developed markets with an 18.31% return for the MSCI Emerging Markets Index compared to a 7.82% return for the MSCI EAFE Index.
Interest rates fell dramatically and led to strong returns for bond investors as the U.S. Federal Reserve (the Fed) slashed short-term rates in response to the slowing economy. The 10-year Treasury yield ended the year near a historic low yield of 0.93%. The Bloomberg Barclays U.S. Aggregate Bond Index, a broad measure of U.S. bond market performance, returned 7.51% over the period. Investment grade corporate bonds rebounded from the selloff early in the year and returned 9.89% in 2020. Riskier high yield bonds lagged the investment grade market with a 7.11% return as measured by the return of the Bloomberg Barclays U.S. Corporate High Yield Bond Index.
AMG Funds appreciates the privilege of providing investment tools to you and your clients. Our foremost goal is to provide investment solutions that help our shareholders successfully reach their long-term investment goals. AMG Funds provides access to a distinctive array of actively managed return-oriented investment strategies. We thank you for your continued confidence and investment in AMG Funds. You can rest assured that under all market conditions our team is focused on delivering excellent investment management services for your benefit.
Respectfully,

Keitha Kinne
President
AMG Funds
| Average Annual Total Returns | | Periods ended
December 31, 2020* |
| Stocks: | | | | 1 Year | | 3 Years | | 5 Years |
| | | | | | | | | |
| Large Cap | | (S&P 500® Index) | | 18.40% | | 14.18% | | 15.22% |
| | | | | | | | | |
| Small Cap | | (Russell 2000® Index) | | 19.96% | | 10.25% | | 13.26% |
| | | | | | | | | |
| International | | (MSCI All Country World Index ex USA) | | 10.65% | | 4.88% | | 8.93% |
| Bonds: | | | | | | | | |
| | | | | | | | | |
| Investment Grade | | (Bloomberg Barclays U.S. Aggregate Bond Index) | | 7.51% | | 5.34% | | 4.44% |
| | | | | | | | | |
| High Yield | | (Bloomberg Barclays U.S. Corporate High Yield Bond Index) | | 7.11% | | 6.24% | | 8.59% |
| | | | | | | | | |
| Tax-exempt | | (Bloomberg Barclays Municipal Bond Index) | | 5.21% | | 4.64% | | 3.91% |
| | | | | | | | | |
| Treasury Bills | | (ICE BofAML U.S. 6-Month Treasury Bill Index) | | 1.05% | | 1.84% | | 1.43% |
*Source: FactSet. Past performance is no guarantee of future results.
| | |
| | |
| | About Your Fund’s Expenses |
As a shareholder of a Fund, you may incur two types of costs: (1) transaction costs, which may include sales charges (loads) on purchase payments; redemption fees; and exchange fees; and (2) ongoing costs, including management fees; distribution (12b-1) fees; and other Fund expenses. This example is intended to help you understand your ongoing costs (in dollars) of investing in the Fund and to compare these costs with the ongoing costs of investing in other mutual funds. The example is based on $1,000 invested at the beginning of the period and held for the entire period as indicated below. ACTUAL EXPENSES The first line of the following table provides information about the actual account values and | | | actual expenses. You may use the information in this line, together with the amount you invested, to estimate the expenses that you paid over the period. Simply divide your account value by $1,000 (for example, an $8,600 account value divided by $1,000 = 8.6), then multiply the result by the number in the first line under the heading entitled “Expenses Paid During Period” to estimate the expenses you paid on your account during this period. HYPOTHETICAL EXAMPLE FOR COMPARISON PURPOSES The second line of the following table provides information about hypothetical account values and hypothetical expenses based on the Fund’s actual expense ratio and an assumed annual rate of return of 5% before expenses, which is not the Fund’s | | | actual return. The hypothetical account values and expenses may not be used to estimate the actual ending account balance or expenses you paid for the period. You may use this information to compare the ongoing costs of investing in the Fund and other funds by comparing this 5% hypothetical example with the 5% hypothetical examples that appear in the shareholder reports of other funds. Please note that the expenses shown in the table are meant to highlight your ongoing costs only and do not reflect any transactional costs, such as sales charges (loads), redemption fees, or exchange fees. Therefore, the second line of the table is useful in comparing ongoing costs only, and will not help you determine the relative total costs of owning different funds. |
Six Months Ended
December 31, 2020 | Expense
Ratio for
the Period | Beginning
Account Value
07/01/20 | Ending
Account Value
12/31/20 | Expenses
Paid
During
the Period* |
| AMG GW&K Enhanced Core Bond ESG Fund |
| Based on Actual Fund Return |
| Class N | 0.73% | $1,000 | $1,038 | $3.74 |
| Class I | 0.55% | $1,000 | $1,039 | $2.82 |
| Class Z | 0.48% | $1,000 | $1,039 | $2.46 |
| Based on Hypothetical 5% Annual Return |
| Class N | 0.73% | $1,000 | $1,021 | $3.71 |
| Class I | 0.55% | $1,000 | $1,022 | $2.80 |
| Class Z | 0.48% | $1,000 | $1,023 | $2.44 |
| |
| AMG GW&K High Income Fund |
| Based on Actual Fund Return |
| Class N | 0.88% | $1,000 | $1,076 | $4.59 |
| Based on Hypothetical 5% Annual Return |
| Class N | 0.88% | $1,000 | $1,021 | $4.47 |
Six Months Ended
December 31, 2020 | Expense
Ratio for
the Period | Beginning
Account Value
07/01/20 | Ending
Account Value
12/31/20 | Expenses Paid
During
the Period* |
| AMG GW&K Municipal Bond Fund |
| Based on Actual Fund Return | | | | |
| Class N | 0.71% | $1,000 | $1,023 | $3.61 |
| Class I | 0.39% | $1,000 | $1,025 | $1.99 |
| Based on Hypothetical 5% Annual Return |
| Class N | 0.71% | $1,000 | $1,022 | $3.61 |
| Class I | 0.39% | $1,000 | $1,023 | $1.98 |
| | | | | |
| AMG GW&K Municipal Enhanced Yield Fund |
| Based on Actual Fund Return |
| Class N | 0.99% | $1,000 | $1,060 | $5.13 |
| Class I | 0.64% | $1,000 | $1,061 | $3.32 |
| Class Z | 0.59% | $1,000 | $1,062 | $3.06 |
| Based on Hypothetical 5% Annual Return |
| Class N | 0.99% | $1,000 | $1,020 | $5.03 |
| Class I | 0.64% | $1,000 | $1,022 | $3.25 |
| Class Z | 0.59% | $1,000 | $1,022 | $3.00 |
| | |
| | |
| | About Your Fund’s Expenses (continued) |
Six Months Ended
December 31, 2020 | Expense
Ratio for
the Period | Beginning
Account Value
07/01/20 | Ending
Account Value
12/31/20 | Expenses Paid
During
the Period* |
| AMG GW&K Global Allocation Fund |
| Based on Actual Fund Return |
| Class N | 1.07% | $1,000 | $1,219 | $5.97 |
| Class I | 0.92% | $1,000 | $1,219 | $5.13 |
| Class Z | 0.82% | $1,000 | $1,221 | $4.58 |
| Based on Hypothetical 5% Annual Return |
| Class N | 1.07% | $1,000 | $1,020 | $5.43 |
| Class I | 0.92% | $1,000 | $1,021 | $4.67 |
| Class Z | 0.82% | $1,000 | $1,021 | $4.17 |
| | | | | |
| AMG GW&K Small Cap Core Fund |
| Based on Actual Fund Return |
| Class N | 1.30% | $1,000 | $1,310 | $7.55 |
| Class I | 0.95% | $1,000 | $1,313 | $5.52 |
| Class Z | 0.90% | $1,000 | $1,313 | $5.23 |
| Based on Hypothetical 5% Annual Return |
| Class N | 1.30% | $1,000 | $1,019 | $6.60 |
| Class I | 0.95% | $1,000 | $1,020 | $4.82 |
| Class Z | 0.90% | $1,000 | $1,021 | $4.57 |
| | | | | |
| AMG GW&K Small/Mid Cap Fund |
| Based on Actual Fund Return |
| Class N | 1.11% | $1,000 | $1,303 | $6.43 |
| Class I | 0.93% | $1,000 | $1,305 | $5.39 |
| Class Z | 0.84% | $1,000 | $1,305 | $4.87 |
| Based on Hypothetical 5% Annual Return |
| Class N | 1.11% | $1,000 | $1,020 | $5.63 |
| Class I | 0.93% | $1,000 | $1,020 | $4.72 |
| Class Z | 0.84% | $1,000 | $1,021 | $4.27 |
Six Months Ended
December 31, 2020 | Expense
Ratio for
the Period | Beginning
Account Value
07/01/20 | Ending
Account Value
12/31/20 | Expenses Paid
During
the Period* |
| AMG GW&K Small Cap Value Fund |
| Based on Actual Fund Return |
| Class N | 1.17% | $1,000 | $1,345 | $6.90 |
| Class I | 0.99% | $1,000 | $1,346 | $5.84 |
| Class Z | 0.92% | $1,000 | $1,346 | $5.43 |
| Based on Hypothetical 5% Annual Return |
| Class N | 1.17% | $1,000 | $1,019 | $5.94 |
| Class I | 0.99% | $1,000 | $1,020 | $5.03 |
| Class Z | 0.92% | $1,000 | $1,021 | $4.67 |
| * | Expenses are equal to the Fund’s annualized expense ratio multiplied by the average account value over the period, multiplied by the number of days in the most recent fiscal half-year (184), then divided by 366. |
| | |
| | AMG GW&K Enhanced Core Bond ESG Fund |
| | Portfolio Manager’s Comments (unaudited) |
THE YEAR IN REVIEW AMG GW&K Enhanced Core Bond ESG Fund’s (the “Fund”) Class N shares returned 9.41% for the year ended December 31, 2020, compared to the return of 7.51% for the Bloomberg Barclays U.S. Aggregate Bond Index (the Index). At the start of 2020, fixed income markets experienced an extraordinarily volatile quarter as COVID-19 evolved into a global pandemic and investors aggressively shed risk assets amid a massive, system-wide deleveraging. Measures enacted to slow the spread of the virus effectively shut down entire segments of the world economy, and the implications for growth, liquidity, and inflation were profound. Expectations for second quarter growth pointed to declines of as much as a third of Gross Domestic Product (GDP), companies began hoarding cash by drawing down lines of credit, and break-evens fell to their lowest level in two decades. Adding to the tumult was the start of a crude price war between Russia and Saudi Arabia, which exacerbated the selloff inspired by an already dire outlook for demand and helped oil post its worst quarter on record. Sentiment was similarly dismal, as investors struggled to handicap the ultimate duration and severity of the slowdown. They pulled record amounts of cash from investment grade mutual funds and caused dislocations in even the safest corners of the fixed income market, desperate to raise cash by selling anything they could. Fiscal and monetary authorities took significant steps to mitigate the fallout from the virus, but given the unprecedented nature of the threat it posed, the long-term efficacy of these efforts remained an open question. In the second quarter, fixed income markets enjoyed a second straight quarter of gains benefiting from ongoing support from the U.S. Federal Reserve (the Fed) and renewed investor optimism amid the country’s gradual reopening. Data suggested the bottom was likely in, as green shoots across the economy drove the recovery narrative. The consumer proved remarkably resilient, with a V-shaped rebound unfolding in the retail, housing, and auto sectors. Business activity also bounced, as manufacturing sentiment and new orders pointed to a steady pace of progress in returning to pre-pandemic levels. Adding to the turnaround’s momentum were expectations of additional fiscal stimulus, which would not only provide an obvious boost to the economy but also, more importantly, narrow the range of potential adverse outcomes. | | | Despite the unprecedented size and scope of the Fed’s intervention, alarming news of rising case counts, renewed lockdowns across the country, and uncertain progress on the development of treatments and vaccines tempered the rally in the closing weeks. The potential for a significant second wave in the fall loomed as well, and posed a serious threat to investor optimism. On the one hand, the Fed’s relatively downbeat economic outlook ensures that it is likely to provide necessary support for the indefinite future. On the other hand, it paints a challenging picture for the nation’s recovery. The key question fixed income markets faced was which of these two forces would prevail in the coming quarters. Fixed income markets were remarkably subdued in the third quarter, trading in an extremely narrow range despite major economic advances and significant developments epidemiologically and politically. For much of the period, this calm was striking for its apparent insensitivity to the steady progress of the U.S. recovery. The consumer continued to display astonishing resilience, the housing sector soared, and the labor market made major strides in its path back to normalcy. Encouraging results in the hunt for a COVID-19 vaccine and improved outcomes for those infected also seemed to have little impact. Toward the end of the quarter, this muted trading was all the more notable, considering the looming uncertainty investors faced heading into year end. Signs had already begun to emerge that the virus’s second wave was forming; negotiators were far apart in their efforts to agree on a second round of stimulus; and there was increasing concern that a protracted vote count could result in a weeks-long delay in determining the outcome of the election. Yet the bond market exited the quarter essentially where it started. Of course, the cause of this apparent tranquility is no mystery: The Fed remains absolutely dominant across all corners of the fixed income market. And as its influence continues to overwhelm fundamentals and distort pricing mechanisms, it has become increasingly challenging and all the more important for investors to be discerning in their yield curve positioning and sector allocation. The fourth quarter represented a major inflection point for fixed income markets, as the most dominant trading narratives of 2020 were either resolved or significantly advanced. The closely contested U.S. election was decided, another round of fiscal | | | stimulus was passed, and, most importantly, several COVID-19 vaccines were approved for worldwide distribution. But while some of 2020’s most salient overhangs have been removed, the year ahead promises challenges of its own. On the political front, the incoming administration certainly has its work cut out for itself at advancing meaningful legislation, with implications ranging from additional stimulus to changes in the regulatory landscape. The speed at which vaccines are distributed is likewise a point of uncertainty, to say nothing of how effective it will ultimately be at slowing the spread of the virus. Meanwhile, the economy continues its slow climb out of the recent downturn, as businesses and consumers adapt to a post-COVID-19 world. Importantly for the fixed income markets, the possibility of adverse outcomes is likely to be mitigated by the Fed. The central bank continues to exert massive influence over capital markets, and policymakers remain clear in their intentions to ensure their smooth functioning. FUND REVIEW The Fund outperformed during its fiscal year, helped by its overweight to spread product. Investment grade corporates scored eight months of positive returns in 2020, with March’s (7.09)% plunge followed up with robust gains. Additionally, high yield corporates battled back from an extremely tough first quarter, which included a (11.46)% drop in March, to end the year with solid gains. The sector’s trough came on March 23 when it was down almost (20)% for the year. However, like its investment grade counterpart, it roared back to make up for the losses and then some. The Fund’s above-benchmark allocation to investment grade corporate bonds and the Fund’s out-of-benchmark allocation to high yield corporates contributed to returns. Security selection was another key positive, with solid selection in the investment grade corporate space. Good selection was most notable in the banking and communications segments, while that for capital goods and basic industry lagged. Selection within mortgage backed securities (MBS) was also a plus, as the Fund’s lack of Ginnie Mae exposure, preference for specified pools, and tactical trades to capture the Fed’s technical demand all worked well. On the other hand, selection within the taxable municipal bond sector subtracted from performance. The yield curve effect was net modestly positive. The Fund gained from its underweight to the long end of the yield curve, |
| | |
| | AMG GW&K Enhanced Core Bond ESG Fund |
| | Portfolio Manager’s Comments (continued) |
which experienced the smallest decrease in rates. However, the Fund’s moderately shorter duration detracted from returns, as rates plunged during the year. OUTLOOK We believe corporate credit remains the most compelling segment of the fixed income market as both a beneficiary of the ongoing recovery and a defense against rising interest rates. Yields available in the Treasury market sit close to historic lows at the | | | same time as the sector’s sensitivity to interest rates is near historic highs, providing a particularly asymmetrical risk profile. Credit, meanwhile, is poised to benefit not only from an improving fundamental picture, but also a notable drop-off in issuance next year that is likely to fuel a constructive supply/demand imbalance in a world where positive yields are increasingly scarce. We are consequently overweight credit, focusing on sectors most exposed to the recovery and the credits within them that we believe are best positioned to thrive in a post-COVID-19 world. We also have | | | out-of-benchmark exposure to fixed-to-floating hybrid securities, which continue to offer attractive total return prospects while being backed by conservatively managed balance sheets. We have maintained our securitized exposure close to neutral, given still-heightened prepayment uncertainty, while within the space we prefer higher-coupon, seasoned pools with more attractive convexity profiles. This commentary reflects the viewpoints of the portfolio manager, GW&K, and is not intended as a forecast or guarantee of future results. |
| | |
| | AMG GW&K Enhanced Core Bond ESG Fund |
| | Portfolio Manager’s Comments (continued) |
CUMULATIVE TOTAL RETURN PERFORMANCE
AMG GW&K Enhanced Core Bond ESG Fund’s cumulative total return is based on the daily change in net asset value (NAV), and assumes that all dividends and distributions were reinvested. The graph compares a hypothetical $10,000 investment made in the AMG GW&K Enhanced Core Bond ESG Fund’s Class N shares on December 31, 2010, to a $10,000 investment made in the Bloomberg Barclays U.S. Aggregate Bond Index for the same time period. The graph and table do not reflect the deduction of taxes that a shareholder would pay on a Fund distribution or redemption of shares. The listed returns for the Fund are net of expenses and the returns for the index exclude expenses. Total returns would have been lower had certain expenses not been reduced.
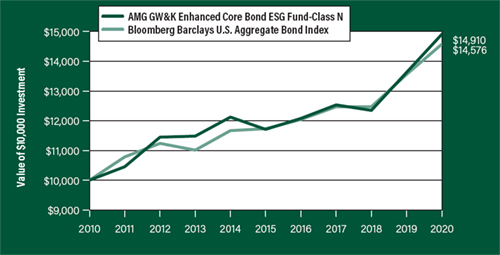
The table below shows the average annual total returns for the AMG GW&K Enhanced Core Bond ESG Fund and the Bloomberg Barclays U.S. Aggregate Bond Index for the same time periods ended December 31, 2020.
| Average Annual Total Returns1 | One
Year | Five
Years | Ten
Years | Since
Inception | Inception
Date |
| AMG GW&K Enhanced Core Bond ESG Fund2, 3, 4, 5, 6, 7, 8, 9 | | | | | |
| Class N | 9.41% | 4.95% | 4.08% | 5.48% | 01/02/97 |
| Class I | 9.57% | 5.14% | — | 3.53% | 11/30/12 |
| Class Z | 9.65% | 5.20% | 4.33% | 5.85% | 01/02/97 |
| Bloomberg Barclays U.S. Aggregate Bond Index10 | 7.51% | 4.44% | 3.84% | 5.24% | 01/02/97† |
The performance data shown represents past performance. Past performance is not a guarantee of future results. Current performance may be lower or higher than the performance data quoted. The investment return and principal value of an investment will fluctuate so that an investor’s shares, when redeemed, may be worth more or less than their original cost.
Investors should carefully consider the Fund’s investment objectives, risks, charges and expenses before investing. For performance information through the most recent month end, current net asset values per share for the Fund and other information, please call 800.548.4539 or visit our website at amgfunds.com for a free prospectus. Read it carefully before investing or sending money.
Distributed by AMG Distributors, Inc., member FINRA/SIPC.
| † | Date reflects the inception date of the Fund, not the index. |
| | |
| 1 | Total return equals income yield plus share price change and assumes reinvestment of all dividends and capital gain distributions. Returns are net of fees and may reflect offsets of Fund expenses as described in the prospectus. No adjustment has been made for taxes payable by shareholders on their reinvested dividends and |
| | | capital gain distributions. Returns for periods greater than one year are annualized. The listed returns on the Fund are net of expenses and based on the published NAV as of December 31, 2020. All returns are in U.S. dollars ($). |
| | | |
| | 2 | From time to time, the Fund’s advisor has waived its fees and/or absorbed Fund expenses, which has resulted in higher returns. |
| | | |
| | 3 | The Fund is subject to the risks associated with investments in debt securities, such as default risk and fluctuations in the perception of the debtor’s ability to pay its creditors. Changing interest rates may adversely affect the value of an investment. An increase in interest rates typically causes the value of bonds and other fixed income securities to fall. |
| | | |
| | 4 | To the extent that the Fund invests in asset-backed or mortgage-backed securities, its exposure to prepayment and extension risks may be greater than investments in other fixed income securities. |
| | | |
| | 5 | High-yield bonds (also known as “junk bonds”) may be subject to greater levels of interest rate, credit, and liquidity risk than investments in higher rated securities. These securities are considered predominantly speculative with respect to the issuer’s continuing ability to make principal and interest payments. The issuers of the Fund’s holdings may be involved in bankruptcy proceedings, reorganizations, or financial restructurings, and are not as strong financially as higher-rated issuers. |
| | | |
| | 6 | Investments in international securities are subject to certain risks of overseas investing including currency fluctuations and changes in political and economic conditions, which could result in significant market fluctuations. These risks are magnified in emerging markets. |
| | | |
| | 7 | Market prices of investments held by the Fund may fall rapidly or unpredictably due to a variety of economic or political factors, market conditions, disasters or public health issues, or in response to events that affect particular industries or companies. |
| | | |
| | 8 | Obligations of certain government agencies are not backed by the full faith and credit of the U.S. government. If one of these agencies defaulted on a loan, there is no guarantee that the U.S. government would provide financial support. Additionally, debt securities of the U.S. government may be affected by changing interest rates and subject to prepayment risk. |
| | |
| | AMG GW&K Enhanced Core Bond ESG Fund |
| | Portfolio Manager’s Comments (continued) |
| 9 Applying the Fund’s ESG investment criteria may result in the selection or exclusion of securities of certain issuers for reasons other than performance, and the Fund may underperform funds that do not utilize an ESG investment strategy. The application of this strategy may affect the Fund’s exposure to certain companies, sectors, regions, countries or types of investments, which could negatively impact the Fund’s performance depending on whether such investments are in or out of favor. Applying ESG criteria to investment decisions is qualitative and subjective by nature, and there is no guarantee that the criteria utilized by the Subadviser or any judgment exercised by the Subadviser will reflect the beliefs or values of any particular investor. | | | 10 The Bloomberg Barclays U.S. Aggregate Bond Index is an index of the U.S. investment-grade fixed-rate bond market, including both government and corporate bonds. Unlike the Fund, the Bloomberg Barclays U.S. Aggregate Bond Index is unmanaged, is not available for investment and does not incur expenses. Bloomberg Index Services Limited. BLOOMBERG® is a trademark and service mark of Bloomberg Finance L.P. and its affiliates (collectively “Bloomberg”). BARCLAYS® is a trademark and service mark of Barclays Bank Plc (collectively with its affiliates, “Barclays”), used under license. Bloomberg or | | | Bloomberg’s licensors, including Barclays, own all proprietary rights in the Bloomberg Barclays Indices. Neither Bloomberg nor Barclays approves or endorses this material, or guarantees the accuracy or completeness of any information herein, or makes any warranty, express or implied, as to the results to be obtained therefrom and, to the maximum extent allowed by law, neither shall have any liability or responsibility for injury or damages arising in connection therewith. Not FDIC insured, nor bank guaranteed. May lose value. |
| | AMG GW&K Enhanced Core Bond ESG Fund |
| | Fund Snapshots (unaudited) |
| | December 31, 2020 |
PORTFOLIO BREAKDOWN
| Category | % of
Net Assets |
| Corporate Bonds and Notes | 54.1 | |
| U.S. Government and Agency Obligations | 34.6 | |
| Municipal Bonds | 8.1 | |
| Foreign Government Obligations | 0.6 | |
| Short-Term Investments | 4.3 | |
| Other Assets Less Liabilities | (1.7 | ) |
| Rating | % of
Market Value1 |
| U.S. Government and Agency Obligations | 35.5 | |
| Aaa/AAA | 2.6 | |
| Aa/AA | 7.8 | |
| A | 8.5 | |
| Baa/BBB | 28.2 | |
| Ba/BB | 16.6 | |
| B | 0.8 | |
| |
| 1 Includes market value of long-term fixed-income securities only. |
TOP TEN HOLDINGS
| Security Name | | % of
Net Assets |
| U.S. Treasury Bonds, 4.500%, 02/15/36 | | 3.5 | |
| FNMA, 4.000%, 10/01/43 | | 3.2 | |
| FNMA, 4.500%, 04/01/41 | | 2.5 | |
| FNMA, 2.000%, 08/01/50 | | 2.2 | |
| FHLMC Multifamily Structured Pass Through Certificates, Series K071, Class A2, 3.286%, 11/25/27 | | 2.2 | |
| California State General Obligation, School Improvements, 7.550%, 04/01/39 | | 1.8 | |
| FHLMC, 5.000%, 10/01/36 | | 1.6 | |
| FNMA, 2.500%, 02/01/35 | | 1.6 | |
| The Goldman Sachs Group, Inc., Series S, 4.400%, 02/10/25 | | 1.5 | |
| FNMA, 3.500%, 01/01/47 | | 1.5 | |
| Top Ten as a Group | | 21.6 | |
Credit quality ratings shown above reflect the highest rating assigned by either Standard & Poor’s (“S&P”), Moody’s Investors Service, Inc. (“Moody’s”) or Fitch. These rating agencies are independent, nationally recognized statistical rating organizations and are widely used. Investment grade ratings are credit ratings of BBB/Baa or higher. Below investment grade ratings are credit ratings of BB/Ba or lower. Investments designated N/R are not rated by any of the rating agencies. Unrated investments do not necessarily indicate low credit quality. Credit quality ratings are subject to change.
Because a fund’s strategy may result in multiple investments in particular sectors of the economy, its performance may depend on the performance of those sectors and may fluctuate more widely than investments diversified across more sectors. For additional information on these and other risk considerations, please see the Fund’s prospectus.
Any sectors, industries, or securities discussed should not be perceived as investment recommendations. Mention of a specific security should not be considered a recommendation to buy or solicitation to sell that security. Specific securities mentioned in this report may have been sold from the Fund’s portfolio of investments by the time you receive this report.
| | AMG GW&K Enhanced Core Bond ESG Fund |
| | Schedule of Portfolio Investments |
| | December 31, 2020 |
| | Principal
Amount | Value |
| Corporate Bonds and Notes - 54.1% | | |
| Financials - 14.1% | | |
| Aircastle, Ltd. (Bermuda) | | |
| 5.000%, 04/01/23 | $475,000 | $506,628 |
| Ally Financial, Inc. | | |
| 8.000%, 11/01/31 | 392,000 | 576,553 |
| Bank of America Corp. | | |
| Series MM, (4.300% to 01/28/25 then 3 month LIBOR + 2.664%), 4.300%, 01/28/251,2,3 | 531,000 | 548,157 |
| The Bank of New York Mellon Corp. | | |
| MTN, 2.450%, 08/17/26 | 485,000 | 528,263 |
| Boston Properties, LP | | |
| 3.400%, 06/21/29 | 489,000 | 546,642 |
| The Charles Schwab Corp. | | |
| Series G, (5.375% to 01/06/25 then | | |
| U.S. Treasury Yield Curve CMT 5 year + 4.971%), 5.375%, 01/06/251,2,3 | 707,000 | 789,189 |
| CIT Group, Inc. | | |
| 6.125%, 03/09/28 | 451,000 | 550,698 |
| Crown Castle International Corp. | | |
| 4.300%, 02/15/29 | 406,000 | 482,522 |
| The Goldman Sachs Group, Inc. | | |
| Series S, (4.400% to 02/10/25 then | | |
| U.S. Treasury Yield Curve CMT 5 year + 2.850%), 4.400%, 02/10/251,2,3,4 | 818,000 | 838,450 |
| Host Hotels & Resorts LP | | |
| Series I, 3.500%, 09/15/30 | 515,000 | 543,669 |
| Iron Mountain, Inc. | | |
| 4.500%, 02/15/315 | 230,000 | 241,213 |
| JPMorgan Chase & Co. | | |
| 2.950%, 10/01/26 | 119,000 | 132,091 |
| (4.000% to 01/04/25 then SOFRRATE + 2.475%), 4.000%, 01/04/251,2,3 | 415,000 | 422,003 |
| Starwood Property Trust, Inc. | | |
| 5.500%, 11/01/235 | 270,000 | 282,487 |
| Truist Financial Corp. | | |
| Series N, (4.800% to 09/01/24 then | | |
| U.S. Treasury Yield Curve CMT 5 year + 3.003%), 4.800%, 09/01/241,2,3 | 259,000 | 273,792 |
| Visa, Inc. | | |
| 4.300%, 12/14/45 | 377,000 | 518,109 |
| Total Financials | | 7,780,466 |
| Industrials - 38.3% | | |
| AECOM | | |
| 5.125%, 03/15/27 | 205,000 | 228,860 |
| 5.875%, 10/15/24 | 294,000 | 328,627 |
| Aramark Services, Inc. | | |
| 4.750%, 06/01/26 | 264,000 | 272,171 |
| ArcelorMittal, S.A. (Luxembourg) | | |
| 4.550%, 03/11/26 | 489,000 | 549,670 |
| | Principal
Amount | Value |
| Berry Global, Inc. | | |
| 5.625%, 07/15/275 | $242,000 | $260,679 |
| BorgWarner, Inc. | | |
| 2.650%, 07/01/274 | 490,000 | 527,353 |
| Campbell Soup Co. | | |
| 2.375%, 04/24/30 | 525,000 | 555,469 |
| CenturyLink, Inc. | | |
| 5.625%, 04/01/25 | 246,000 | 265,834 |
| Charter Communications Operating LLC/Charter | | |
| Communications Operating Capital | | |
| 4.908%, 07/23/25 | 470,000 | 546,203 |
| Cheniere Corpus Christi Holdings LLC | | |
| 5.875%, 03/31/25 | 232,000 | 270,227 |
| Comcast Corp. | | |
| 4.150%, 10/15/28 | 651,000 | 784,175 |
| CommonSpirit Health | | |
| 3.347%, 10/01/29 | 458,000 | 503,829 |
| Crown Americas LLC / Crown | | |
| Americas Capital Corp. IV | | |
| 4.500%, 01/15/234 | 238,000 | 251,716 |
| Crown Americas LLC / Crown | | |
| Americas Capital Corp. V | | |
| 4.250%, 09/30/26 | 266,000 | 293,671 |
| CVS Health Corp. | | |
| 5.125%, 07/20/45 | 402,000 | 542,066 |
| Dana, Inc. | | |
| 5.375%, 11/15/27 | 15,000 | 15,928 |
| 5.625%, 06/15/28 | 487,000 | 525,164 |
| Dell, Inc. | | |
| 7.100%, 04/15/284 | 408,000 | 537,536 |
| Elanco Animal Health, Inc. | | |
| 5.900%, 08/28/286 | 463,000 | 547,787 |
| Fidelity National Information Services, Inc. | | |
| Series 10Y, 4.250%, 05/15/28 | 428,000 | 510,077 |
| The Ford Foundation | | |
| Series 2020, 2.415%, 06/01/50 | 488,000 | 499,863 |
| The George Washington University | | |
| Series 2018, 4.126%, 09/15/48 | 435,000 | 552,333 |
| HCA, Inc. | | |
| 5.375%, 02/01/25 | 476,000 | 535,983 |
| Howmet Aerospace, Inc. | | |
| 6.875%, 05/01/254 | 470,000 | 550,487 |
| Johnson Controls International plc/Tyco Fire & Security Finance SCA (Ireland) | | |
| 1.750%, 09/15/30 | 548,000 | 559,847 |
| Lennar Corp. | | |
| 4.750%, 05/30/25 | 232,000 | 265,495 |
| Lowe’s Cos., Inc. | | |
| 4.000%, 04/15/25 | 457,000 | 519,756 |
| MGM Resorts International | | |
| 5.750%, 06/15/25 | 243,000 | 269,129 |
The accompanying notes are an integral part of these financial statements.
| | |
| | |
| | AMG GW&K Enhanced Core Bond ESG Fund |
| | Schedule of Portfolio Investments (continued) |
| | Principal
Amount | | Value |
| Industrials - 38.3% (continued) | | | |
| Microsoft Corp. | | | |
| 2.525%, 06/01/50 | $372,000 | | $393,104 |
| Murphy Oil USA, Inc. | | | |
| 5.625%, 05/01/27 | 247,000 | | 262,082 |
| Newell Brands, Inc. | | | |
| 4.700%, 04/01/266 | 463,000 | | 510,657 |
| Parker-Hannifin Corp. | | | |
| 3.250%, 06/14/29 | 467,000 | | 530,541 |
| Penn National Gaming, Inc. | | | |
| 5.625%, 01/15/27 | 125,000 | | 130,638 |
| PulteGroup, Inc. | | | |
| 5.000%, 01/15/274 | 290,000 | | 342,744 |
| 5.500%, 03/01/26 | 165,000 | | 196,645 |
| Raytheon Technologies Corp. | | | |
| 3.950%, 08/16/25 | 460,000 | | 527,798 |
| RELX Capital, Inc. | | | |
| 3.000%, 05/22/30 | 80,000 | | 88,941 |
| 4.000%, 03/18/29 | 390,000 | | 463,452 |
| Service Corp. International | | | |
| 3.375%, 08/15/30 | 520,000 | | 541,884 |
| Sprint Corp. | | | |
| 7.125%, 06/15/24 | 438,000 | | 513,012 |
| Starbucks Corp. | | | |
| 2.550%, 11/15/30 | 508,000 | | 549,870 |
| Steel Dynamics, Inc. | | | |
| 2.400%, 06/15/25 | 495,000 | | 526,667 |
| Sysco Corp. | | | |
| 2.400%, 02/15/30 | 497,000 | | 518,195 |
| Toll Brothers Finance Corp. | | | |
| 4.375%, 04/15/23 | 251,000 | | 267,001 |
| United Rentals North America Inc. | | | |
| 3.875%, 02/15/31 | 517,000 | | 543,328 |
| Verizon Communications, Inc. | | | |
| 3.875%, 02/08/29 | 447,000 | | 526,887 |
| VF Corp. | | | |
| 2.800%, 04/23/27 | 496,000 | | 542,993 |
| Wyndham Destinations, Inc. | | | |
| 5.650%, 04/01/246 | 516,000 | | 559,161 |
| Xylem, Inc. | | | |
| 2.250%, 01/30/31 | 477,000 | | 503,033 |
| Total Industrials | | | 21,108,568 |
| Utilities - 1.7% | | | |
| Dominion Energy, Inc. | | | |
| Series B, (4.650% to 12/15/24 then U.S. Treasury Yield Curve CMT 5 year + 2.993%), 4.650%, 12/15/241,2,3 | 515,000 | | 544,374 |
| | Principal
Amount | | Value |
| National Rural Utilities Cooperative Finance Corp. | | | |
| 1.350%, 03/15/31 | $408,000 | | $403,194 |
| Total Utilities | | | 947,568 |
| Total Corporate Bonds and Notes | | | |
| (Cost $28,030,829) | | | 29,836,602 |
| Municipal Bonds - 8.1% | | | |
| California State General Obligation, School Improvements | | | |
| 7.550%, 04/01/39 | 570,000 | | 1,002,020 |
| County of Miami-Dade FL Aviation Revenue, Series C | | | |
| 4.280%, 10/01/41 | 700,000 | | 771,533 |
| JobsOhio Beverage System Series B, 4.532%, 01/01/35 | 5,000 | | 6,414 |
| JobsOhio Beverage System, Series B 3.985%, 01/01/29 | 325,000 | | 374,095 |
| Los Angeles Unified School District, School Improvements | | | |
| 5.750%, 07/01/34 | 550,000 | | 776,655 |
| Massachusetts School Building Authority Series B, 1.753%, 08/15/30 | 518,000 | | 525,351 |
| Metropolitan Transportation Authority | | | |
| 6.687%, 11/15/40 | 75,000 | | 98,278 |
| Metropolitan Transportation Authority, Transit Improvement | | | |
| 6.668%, 11/15/39 | 290,000 | | 379,717 |
University of California, University & College Improvements
Series BD, 3.349%, 07/01/29 | 440,000 | | 507,764 |
| Total Municipal Bonds | | | |
| (Cost $4,127,526) | | | 4,441,827 |
| U.S. Government and Agency Obligations - 34.6% | | | |
| Fannie Mae - 21.1% | | | |
| FNMA | | | |
| 2.000%, 08/01/50 to 09/01/50 | 1,281,754 | | 1,332,835 |
| 2.500%, 11/01/34 to 05/01/50 | 1,293,251 | | 1,368,421 |
| 3.500%, 11/01/33 to 11/01/48 | 3,064,710 | | 3,326,957 |
| 4.000%, 12/01/33 to 03/01/50 | 3,137,534 | | 3,432,099 |
| 4.500%, 01/01/40 to 07/01/49 | 1,734,190 | | 1,942,283 |
| 5.000%, 11/01/43 | 200,072 | | 232,325 |
| Total Fannie Mae | | | 11,634,920 |
| Freddie Mac - 10.0% | | | |
| FHLMC | | | |
| 1.500%, 11/01/50 | 516,262 | | 521,940 |
| 2.000%, 08/01/50 | 196,982 | | 204,757 |
| 2.500%, 11/01/34 to 08/01/50 | 785,462 | | 832,730 |
| 5.000%, 10/01/36 | 767,075 | | 891,839 |
| FHLMC Gold Pool | | | |
| 3.500%, 02/01/30 to 04/01/46 | 1,339,120 | | 1,457,724 |
The accompanying notes are an integral part of these financial statements.
| | |
| | |
| | AMG GW&K Enhanced Core Bond ESG Fund |
| | Schedule of Portfolio Investments (continued) |
| | Principal
Amount | | Value |
| Freddie Mac - 10.0% (continued) | | | |
FHLMC Multifamily Structured Pass Through Certificates
Series K050, Class A2 | | | |
| 3.334%, 08/25/253 | $46,000 | | $51,565 |
| Series K071, Class A2 | | | |
| 3.286%, 11/25/27 | 1,035,000 | | 1,198,038 |
| Series K076, Class A2 | | | |
| 3.900%, 04/25/28 | 291,000 | | 349,179 |
| Total Freddie Mac | | | 5,507,772 |
| U.S. Treasury Obligations - 3.5% | | | |
| U.S. Treasury Bonds | | | |
| 4.500%, 02/15/36 | 1,319,000 | | 1,936,199 |
| Total U.S. Treasury Obligations | | | 1,936,199 |
| Total U.S. Government and Agency Obligations | | | |
| (Cost $18,402,686) | | | 19,078,891 |
| Foreign Government Obligation - 0.6% | | | |
| The Korea Development Bank (South Korea) | | | |
| 0.500%, 10/27/23 | | | |
| (Cost $345,180) | 346,000 | | 347,297 |
| Total Foreign Government Obligation | | | |
| (Cost $345,180) | | | 347,297 |
| Short-Term Investments - 4.3% | | | |
| Joint Repurchase Agreements - 4.3%7 | | | |
| Citigroup Global Markets, Inc., dated 12/31/20, due 01/04/21, 0.070% total to be received $1,000,008 (collateralized by various U.S. Government Agency Obligations and U.S. Treasuries, 0.000% - 4.000%, 09/15/21 - 01/01/51, totaling $1,020,000) | 1,000,000 | | 1,000,000 |
| | Principal
Amount | | Value |
| Morgan, Stanley & Co. LLC, dated 12/31/20, due 01/04/21, 0.070% total to be received $379,189 (collateralized by various U.S. Government Agency Obligations and U.S. Treasuries, 0.000% - 9.000%, 02/04/21 - 12/20/50, totaling $386,770) | $379,186 | | $379,186 |
| RBC Dominion Securities, Inc., dated 12/31/20, due 01/04/21, 0.080% total to be received $1,000,009 (collateralized by various U.S. Government Agency Obligations and U.S. Treasuries, 0.000% - 6.000%, 01/05/21 - 12/20/50, totaling $1,020,000) | 1,000,000 | | 1,000,000 |
| Total Joint Repurchase Agreements | | | 2,379,186 |
| Total Short-Term Investments | | | |
| (Cost $2,379,186) | | | 2,379,186 |
| Total Investments - 101.7% | | | |
| (Cost $53,285,407) | | | 56,083,803 |
| Other Assets, less Liabilities - (1.7)% | | | (938,221) |
| Net Assets - 100.0% | | | $55,145,582 |
| 1 | Fixed to variable rate investment. The rate shown reflects the fixed rate in effect at December 31, 2020. Rate will reset at a future date. |
| 2 | Perpetuity Bond. The date shown represents the next call date. |
| 3 | Variable rate security. The rate shown is based on the latest available information as of December 31, 2020. Certain variable rate securities are not based on a published reference rate and spread but are determined by the issuer or agent and are based on current market conditions. These securities do not indicate a reference rate and spread in their description above. |
| 4 | Some of these securities, amounting to $2,928,951 or 5.3% of net assets, were out on loan to various borrowers and are collateralized by cash and various U.S. Treasury Obligations. See Note 4 of Notes to Financial Statements. |
| 5 | Security exempt from registration under Rule 144A of the Securities Act of 1933. This security may be resold in transactions exempt from registration, normally to qualified institutional buyers. At December 31, 2020, the value of these securities amounted to $784,379 or 1.4% of net assets. |
| 6 | Step Bond: A debt instrument with either deferred interest payments or an interest rate that resets at specific times during its term. |
| 7 | Cash collateral received for securities lending activity was invested in these joint repurchase agreements. |
| CMT | Constant Maturity Treasury |
| FHLMC | Freddie Mac |
| FNMA | Fannie Mae |
| LIBOR | London Interbank Offered Rate |
| MTN | Medium-Term Note |
| SOFRRATE | Secured Overnight Financing Rate |
The accompanying notes are an integral part of these financial statements.
| | |
| | |
| | AMG GW&K Enhanced Core Bond ESG Fund |
| | Schedule of Portfolio Investments (continued) |
The following table summarizes the inputs used to value the Fund’s investments by the fair value hierarchy levels as of December 31, 2020:
| | | Level 1 | | Level 2 | | Level 3 | | Total |
| Investments in Securities | | | | | | | | |
| Corporate Bonds and Notes† | | — | | $29,836,602 | | — | | $29,836,602 |
| Municipal Bonds† | | — | | 4,441,827 | | — | | 4,441,827 |
| U.S. Government and Agency Obligations† | | — | | 19,078,891 | | — | | 19,078,891 |
| Foreign Government Obligation | | — | | 347,297 | | — | | 347,297 |
| Short-Term Investments | | | | | | | | |
| Joint Repurchase Agreements | | — | | 2,379,186 | | — | | 2,379,186 |
| Total Investments in Securities | | — | | $56,083,803 | | — | | $56,083,803 |
| † | All corporate bonds and notes, municipal bonds, and U.S. government and agency obligations held in the Fund are Level 2 securities. For a detailed breakout of corporate bonds and notes, municipal bonds, and U.S. government and agency obligations by major industry or agency classification, please refer to the Fund’s Schedule of Portfolio Investments. |
For the fiscal year ended December 31, 2020, there were no transfers in or out of Level 3.
The accompanying notes are an integral part of these financial statements.
| | |
| | |
| | AMG GW&K High Income Fund |
| | Portfolio Manager’s Comments (unaudited) |
THE YEAR IN REVIEW AMG GW&K High Income Fund (the “Fund”) Class N shares returned 12.16% during the year ended December 31, 2020, compared to the 6.79% return for the Bloomberg Barclays U.S. High Yield 1–5 Year Ba Index. The Fund’s legacy benchmark, the Bloomberg Barclays Global Aggregate Bond Index, returned 9.20% during the period. Effective December 4, 2020, the Fund’s subadviser changed from Loomis, Sayles & Company, L.P. (“Loomis Sayles”) to GW&K Investment Management, LLC (“GW&K”). Also effective December 4, 2020, the Fund changed its name from AMG Manager Global Income Opportunity Fund and changed its investment objective, benchmark, principal investment strategies, and principal risks. PERFORMANCE Despite a negative return in the first quarter, the Fund generated strong performance for the full year and outperformed both the legacy benchmark (Bloomberg Barclays Global Aggregate Bond Index) and its new benchmark (Bloomberg Barclays U.S. High Yield 1–5 Year Ba Index). In the first quarter, the Fund underperformed primarily due to spread sector allocation and currency positioning, while duration and yield curve positioning was positive. The Fund subsequently outperformed in the | | | following three quarters due to spread sector allocation with notable contributions from an overweight in the investment grade bond sector. The Fund’s currency and yield curve positioning were also modest contributors to relative performance during the period. HIGH INCOME INVESTMENT STRATEGY GW&K believes that by actively managing a diversified portfolio of non-investment grade corporate bonds, we can generate higher total return over the long term while assuming manageable levels of risk. We look to invest in companies that we believe offer the best risk-adjusted value. The Fund seeks to achieve a high level of current income while minimizing price volatility. It seeks to minimize interest rate risk by investing in bonds with maturities less than five years and seeks to minimize credit risk by targeting bonds with an average rating of BB. OUTLOOK Yields across the curve have struggled to break decisively out of their recent range, even as investors gained increasing confidence that a durable recovery is underway. Among the reasons for this apparent reticence is a lack of conviction that the U.S. Federal Reserve (Fed) will be able to reach and sustain a long-term inflation target of 2%. | | | Furthermore, even in the event that they do, investors are skeptical that the still-fragile recovery could sustain meaningfully higher rates. As a result, we believe there is a fairly even balance of upside and downside risks to rates and we have kept our duration close to its benchmark. With respect to curve positioning, we favor an underweight to the long end, where breakevens are especially unappealing, in favor of the more balanced risk/return profile of intermediate maturities. We believe corporate credit remains the most compelling segment of the fixed income market as both a beneficiary of the ongoing recovery and a defense against rising interest rates. Yields available in the Treasury market sit close to historic lows at the same time as the sector’s sensitivity to interest rates is near historic highs, providing a particularly asymmetrical risk profile. Credit, meanwhile, is poised to benefit not only from an improving fundamental picture, but also a notable drop-off in issuance next year that is likely to fuel a constructive supply/demand imbalance in a world where positive yields are increasingly scarce. This commentary reflects the results from GW&K and Loomis Sayles during the period and the viewpoints of the current portfolio manager, GW&K, and is not intended as a forecast or guarantee of future result. | |
| | | | | | | | |
| | | | | | | | |
| | |
| | |
| | AMG GW&K High Income Fund |
| | Portfolio Manager’s Comments (continued) |
CUMULATIVE TOTAL RETURN PERFORMANCE
AMG GW&K High Income Fund’s cumulative total return is based on the daily change in net asset value (NAV), and assumes that all dividends and distributions were reinvested. The graph compares a hypothetical $10,000 investment made in the AMG GW&K High Income Fund’s Class N shares on December 31, 2010, to a $10,000 investment made in the Bloomberg Barclays U.S. High Yield 1-5 Year Ba Index and Bloomberg Barclays Global Aggregate Bond Index for the same time period. The graph and table do not reflect the deduction of taxes that a shareholder would pay on a Fund distribution or redemption of shares. The listed returns for the Fund are net of expenses and the returns for the index exclude expenses. Total returns would have been lower had certain expenses not been reduced.
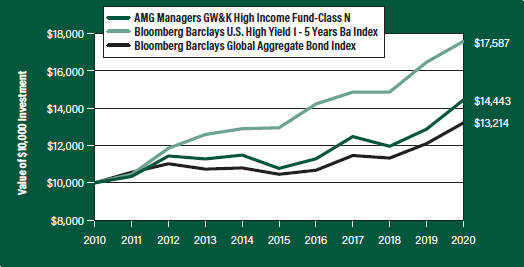
The table below shows the average annual total returns for the AMG GW&K High Income Fund and the Bloomberg Barclays U.S. High Yield 1-5 Year Ba Index and Bloomberg Barclays Global Aggregate Bond Index for the same time periods ended December 31, 2020.
| Average Annual Total Returns1 | One Year | Five
Years | Ten Years |
| AMG GW&K High Income Fund2, 3, 4, 5 | | | |
| Class N | 12.16% | 6.04% | 3.74% |
| Bloomberg Barclays U.S. High Yield 1-5 Year Ba Index6 | 6.79% | 6.31% | 5.81% |
| Bloomberg Barclays Global Aggregate Bond Index7 | 9.20% | 4.79% | 2.83% |
The performance data shown represents past performance. Past performance is not a guarantee of future results. Current performance may be lower or higher than the performance data quoted. The investment return and principal value of an investment will fluctuate so that an investor’s shares, when redeemed, may be worth more or less than their original cost.
Investors should carefully consider the Fund’s investment objectives, risks, charges and expenses before investing. For performance information through the most recent month end, current net asset values per share for the Fund and other information, please call 800.548.4539 or visit our website at amgfunds.com for a free prospectus. Read it carefully before investing or sending money.
Distributed by AMG Distributors, Inc., member FINRA/SIPC.
| 1 | Total return equals income yield plus share price change and assumes reinvestment of all dividends and capital gain distributions. Returns are net of fees and may reflect offsets of Fund expenses as described in the prospectus. No adjustment has been made for taxes payable by shareholders on their reinvested dividends and capital gain distributions. Returns for periods greater than one year are annualized. The listed returns on the Fund are net of expenses and based on the published NAV as of December 31, 2020. All returns are in U.S. dollars($). |
| 2 | From time to time the Fund’s advisor has waived it’s fees and/or absorbed Fund expenses, which has resulted in higher returns. |
| | |
| 3 | The Fund is subject to the risks associated with investments in debt securities, such as default risk and fluctuations in the perception of the debtor’s ability to pay its creditors. Changing interest rates may adversely affect the value of an investment. An increase in interest rates typically causes the value of bonds and other fixed income securities to fall. |
| | |
| 4 | Market prices of investments held by the Fund may fall rapidly or unpredictably due to a variety of economic or political factors, market conditions, disasters or public health issues, or in response to events that affect particular industries or companies. |
| | |
| 5 | High-yield bonds (also known as “junk bonds”) may be subject to greater levels of interest rate, credit, and liquidity risk than investments in higher rated securities. These securities are considered predominantly speculative with respect to the issuer’s continuing ability to make principal and interest payments. The issuers of the Fund’s holdings may be involved in bankruptcy proceedings, reorganizations, or financial restructurings, and are not as strong financially as higher-rated issuers. |
| | |
| 6 | On December 4, 2020, the primary benchmark changed from the Bloomberg Barclays Global Aggregate Bond Index to the Bloomberg Barclays U.S. High Yield Ba 1-5 Year Index. The Bloomberg Barclays U.S. High Yield Ba 1-5 Year Index, a subset of the Bloomberg Barclays High Yield Index, is an unmanaged index comprised of fixed rate, publicly issued, non-investment grade debt registered with the Securities and Exchange Commission (SEC) where the middle rating of Moody’s, S&P and Fitch is BB and maturities range from 1 to 5 years. Unlike the Fund, the Bloomberg Barclays U.S. High Yield Ba 1-5 Year Index is unmanaged, is not available for investment and does not incur expenses. |
| | |
| 7 | The Bloomberg Barclays Global Aggregate Bond Index, the Fund’s prior benchmark provides a broad-based measure of the global investment-grade fixed income markets. The three major components of this index are the U.S. Aggregate, the Pan-European Aggregate, and the Asian-Pacific Aggregate Indices. The Index also includes Eurodollar and Euro-Yen corporate bonds, Canadian government, agency and corporate securities, and USD investment grade 144A securities. Unlike the Fund, the Bloomberg Barclays Global Aggregate Bond Index is unmanaged, is not available for investment and does not incur expenses. |
| | |
Bloomberg Index Services Limited. BLOOMBERG® is a trademark and service mark of Bloomberg Finance L.P. and its affiliates (collectively “Bloomberg”).
| | |
| | |
| | AMG GW&K High Income Fund |
| | Portfolio Manager’s Comments (continued) |
| BARCLAYS® is a trademark and service mark of Barclays Bank Plc (collectively with its affiliates, “Barclays”), used under license. Bloomberg or Bloomberg’s licensors, including Barclays, own all proprietary rights in the Bloomberg Barclays Indices. Neither Bloomberg nor Barclays approves or | | | endorses this material, or guarantees the accuracy or completeness of any information herein, or makes any warranty, express or implied, as to the results to be obtained therefrom and, to the maximum extent allowed by law, neither shall have any liability or | | | responsibility for injury or damages arising in connection therewith. Not FDIC insured, nor bank guaranteed. May lose value | |
| | | | | | | | |
| | | | | | | | |
| | |
| | AMG GW&K High Income Fund |
| | Fund Snapshots (unaudited) |
| | December 31, 2020 |
PORTFOLIO BREAKDOWN
| Category | % of
Net Assets |
| Corporate Bonds and Notes | 96.8 |
| Other Assets Less Liabilities | 3.2 |
| Rating | % of Market Value1 |
| Baa/BBB | 24.7 |
| Ba/BB | 60.1 |
| B | 15.2 |
| 1 | Includes market value of long-term fixed-income securities only. |
TOP TEN HOLDINGS
| Security Name | | % of
Net Assets |
| QEP Resources, Inc., 5.625%, 03/01/26 | | 2.7 |
| Apache Corp., 4.625%, 11/15/25 | | 2.6 |
| Kohl’s Corp., 9.500%, 05/15/25 | | 2.5 |
| Ford Motor Co., 4.346%, 12/08/26 | | 2.5 |
| Allegheny Technologies, Inc., 7.875%, 08/15/23 | | 2.5 |
| Methanex Corp., 4.250%, 12/01/24 (Canada) | | 2.5 |
| Howmet Aerospace, Inc., 6.875%, 05/01/25 | | 2.5 |
| Aramark Services, Inc., 4.750%, 06/01/26 | | 2.5 |
| Delta Air Lines, Inc., 7.375%, 01/15/26 | | 2.5 |
| Service Properties Trust, 7.500%, 09/15/25 | | 2.5 |
| Top Ten as a Group | | 25.3 |
Credit quality ratings shown above reflect the highest rating assigned by either Standard & Poor’s (“S&P”), Moody’s Investors Service, Inc. (“Moody’s”) or Fitch. These rating agencies are independent, nationally recognized statistical rating organizations and are widely used. Investment grade ratings are credit ratings of BBB/Baa or higher. Below investment grade ratings are credit ratings of BB/Ba or lower. Investments designated N/R are not rated by any of the rating agencies. Unrated investments do not necessarily indicate low credit quality. Credit quality ratings are subject to change.
Because a fund’s strategy may result in multiple investments in particular sectors of the economy, its performance may depend on the performance of those sectors and may fluctuate more widely than investments diversified across more sectors. For additional information on these and other risk considerations, please see the Fund’s prospectus.
Any sectors, industries, or securities discussed should not be perceived as investment recommendations. Mention of a specific security should not be considered a recommendation to buy or solicitation to sell that security. Specific securities mentioned in this report may have been sold from the Fund’s portfolio of investments by the time you receive this report.
| | |
| | AMG GW&K High Income Fund |
| | Schedule of Portfolio Investments |
| | December 31, 2020 |
| | Principal
Amount | | Value |
| Corporate Bonds and Notes - 96.8% | | | |
| Financials - 20.2% | | | |
| Aircastle, Ltd. (Bermuda) | | | |
| 5.000%, 04/01/23 | $237,000 | | $252,619 |
| CIT Group, Inc. | | | |
| 5.000%, 08/01/23 | 160,000 | | 174,800 |
| Citigroup, Inc. | | | |
| Series V | | | |
| (4.700% to 01/30/25 then SOFRRATE + 3.234%), 4.700%, 01/30/251,2,3 | 246,000 | | 252,787 |
| The Goldman Sachs Group, Inc. | | | |
| Series S | | | |
| (4.400% to 02/10/25 then U.S. Treasury Yield Curve CMT 5 year + 2.850%), 4.400%, 02/10/251,2,3 | 250,000 | | 255,625 |
| JPMorgan Chase & Co. | | | |
| Series HH | | | |
| (4.600% to 02/01/25 then SOFRRATE + 3.125%), 4.600%, 02/01/251,2,3 | 245,000 | | 252,963 |
| Service Properties Trust | | | |
| 7.500%, 09/15/25 | 223,000 | | 256,967 |
| SLM Corp. | | | |
| 4.200%, 10/29/25 | 241,000 | | 254,556 |
| Starwood Property Trust, Inc. | | | |
| 4.750%, 03/15/25 | 246,000 | | 252,150 |
| Wynn Las Vegas LLC / Wynn Las Vegas Capital Corp. | | | |
| 5.500%, 03/01/254 | 120,000 | | 125,250 |
| Total Financials | | | 2,077,717 |
| Industrials - 76.6% | | | |
| AECOM | | | |
| 5.875%, 10/15/24 | 227,000 | | 253,169 |
| Allegheny Technologies, Inc. | | | |
| 7.875%, 08/15/235 | 236,000 | | 258,264 |
| American Axle & Manufacturing, Inc. | | | |
| 6.250%, 04/01/25 | 243,000 | | 251,505 |
| Apache Corp. | | | |
| 4.625%, 11/15/25 | 251,000 | | 265,312 |
| Aramark Services, Inc. | | | |
| 4.750%, 06/01/26 | 250,000 | | 257,362 |
| Ball Corp. | | | |
| 5.250%, 07/01/25 | 215,000 | | 245,364 |
| CDW LLC / CDW Finance Corp. | | | |
| 5.500%, 12/01/24 | 228,000 | | 254,902 |
| CenturyLink, Inc. | | | |
| 5.625%, 04/01/25 | 65,000 | | 70,119 |
Crown Americas LLC / Crown
Americas Capital Corp. IV | | | |
| 4.500%, 01/15/23 | 234,000 | | 246,900 |
| | Principal
Amount | | Value |
| CSC Holdings LLC | | | |
| 5.250%, 06/01/24 | $234,000 | | $253,282 |
| DCP Midstream Operating LP | | | |
| 5.375%, 07/15/25 | 137,000 | | 150,538 |
| Delta Air Lines, Inc. | | | |
| 7.375%, 01/15/26 | 225,000 | | 257,018 |
| Donnelley Financial Solutions, Inc. | | | |
| 8.250%, 10/15/24 | 184,000 | | 195,040 |
| Ford Motor Co. | | | |
| 4.346%, 12/08/26 | 243,000 | | 258,795 |
| Freeport-McMoRan, Inc. | | | |
| 3.875%, 03/15/23 | 119,000 | | 124,153 |
| Graphic Packaging International LLC | | | |
| 4.875%, 11/15/22 | 93,000 | | 97,418 |
| HCA, Inc. | | | |
| 5.375%, 02/01/25 | 223,000 | | 250,770 |
| Howmet Aerospace, Inc. | | | |
| 6.875%, 05/01/25 | 220,000 | | 257,400 |
| Kohl’s Corp. | | | |
| 9.500%, 05/15/25 | 200,000 | | 259,421 |
| Methanex Corp. (Canada) | | | |
| 4.250%, 12/01/24 | 245,000 | | 257,936 |
| MGM Resorts International | | | |
| 6.000%, 03/15/23 | 234,000 | | 251,257 |
| Netflix, Inc. | | | |
| 5.875%, 02/15/25 | 220,000 | | 253,103 |
| Newell Brands, Inc. | | | |
| 4.875%, 06/01/25 | 231,000 | | 254,169 |
| Newfield Exploration Co. | | | |
| 5.625%, 07/01/24 | 235,000 | | 251,717 |
| NuStar Logistics LP | | | |
| 4.750%, 02/01/22 | 123,000 | | 124,845 |
| Occidental Petroleum Corp. | | | |
| 3.450%, 07/15/24 | 173,000 | | 165,215 |
| Penske Automotive Group, Inc. | | | |
| 3.500%, 09/01/25 | 243,000 | | 246,949 |
| QEP Resources, Inc. | | | |
| 5.625%, 03/01/26 | 250,000 | | 274,137 |
| QVC, Inc. | | | |
| 4.450%, 02/15/25 | 236,000 | | 252,001 |
| Sprint Corp. | | | |
| 7.125%, 06/15/24 | 211,000 | | 246,870 |
| Tenet Healthcare Corp. | | | |
| 4.875%, 01/01/264 | 120,000 | | 125,533 |
Teva Pharmaceutical Finance
Netherlands III BV (Netherlands) | | | |
| 2.200%, 07/21/21 | 249,000 | | 248,378 |
| United Airlines Holdings, Inc. | | | |
| 5.000%, 02/01/24 | 254,000 | | 252,095 |
The accompanying notes are an integral part of these financial statements.
| | |
| | |
| | AMG GW&K High Income Fund |
| | Schedule of Portfolio Investments (continued) |
| | Principal
Amount | | Value |
| Industrials - 76.6% (continued) | | | |
| VeriSign, Inc. | | | |
| 5.250%, 04/01/25 | $86,000 | | $97,718 |
| WPX Energy, Inc. | | | |
| 5.250%, 09/15/24 | 117,000 | | 127,445 |
| Wyndham Destinations, Inc. | | | |
| 5.650%, 04/01/245 | 236,000 | | 254,880 |
| Total Industrials | | | 7,890,980 |
| Total Corporate Bonds and Notes | | | |
| (Cost $9,978,707) | | | 9,968,697 |
| 1 | Fixed to variable rate investment. The rate shown reflects the fixed rate in effect at December 31, 2020. Rate will reset at a future date. |
| 2 | Perpetuity Bond. The date shown represents the next call date. |
| 3 | Variable rate security. The rate shown is based on the latest available information as of December 31, 2020. Certain variable rate securities are not based on a published reference rate and spread but are determined by the issuer or agent and are based on current market conditions. These securities do not indicate a reference rate and spread in their description above. |
| 4 | Security exempt from registration under Rule 144A of the Securities Act of 1933. This security may be resold in transactions exempt from registration, normally to qualified institutional buyers. At December 31, 2020, the value of these securities amounted to $250,783 or 2.4% of net assets. |
| | Value |
| Total Investments - 96.8% | |
| (Cost $9,978,707) | $9,968,697 |
| Other Assets, less Liabilities - 3.2% | 333,161 |
| Net Assets - 100.0% | $10,301,858 |
| 5 | Step Bond: A debt instrument with either deferred interest payments or an interest rate that resets at specific times during its term. |
| CMT | Constant Maturity Treasury |
| SOFRRATE | Secured Overnight Financing Rate |
The accompanying notes are an integral part of these financial statements.
| | AMG GW&K High Income Fund Schedule of Portfolio Investments (continued) |
The following table summarizes the inputs used to value the Fund’s investments by the fair value hierarchy levels as of December 31, 2020:
| | | Level 1 | | Level 2 | | Level 3 | | Total | |
| Investments in Securities | | | | | | | | | | | | | |
| Corporate Bonds and Notes† | | | — | | $ | 9,968,697 | | | — | | $ | 9,968,697 | |
| Total Investments in Securities | | | — | | $ | 9,968,697 | | | — | | $ | 9,968,697 | |
| † | All corporate bonds and notes held in the Fund are level 2 securities. For a detailed breakout of corporate bonds and notes by major industry classification, please refer to the Fund’s Schedule of Portfolio Investments. |
For the fiscal year ended December 31, 2020, there were no transfers in or out of Level 3.
For the fiscal year ended December 31, 2020, the effect of derivative instruments on the Statement of Operations for the Fund and the amount of realized gain/loss and unrealized appreciation/depreciation on derivatives recognized in income was as follows:
| | Realized Gain/(Loss) | Change in Unrealized Appreciation/Depreciation |
| | | | | |
| Derivatives not accounted for as hedging instruments | Statement of Operations
Location | Realized
Gain/(Loss) | Statement of Operations
Location | Change in
Unrealized
Appreciation/
Depreciation |
| Foreign currency exchange contracts | Net realized gain on forward contracts | $134,979 | Net change in unrealized appreciation/ depreciation on forward contracts | $10,553 |
| | | | | |
| Interest rate contracts | Net realized gain on futures contracts | 34,964 | Net change in unrealized appreciation/ depreciation on futures contracts | 4,541 |
| | Totals | $169,943 | | $15,094 |
The accompanying notes are an integral part of these financial statements.
| | AMG GW&K Municipal Bond Fund Portfolio Manager’s Comments (unaudited) |
THE YEAR IN REVIEW For the year ended December 31, 2020, AMG GW&K Municipal Bond Fund (the “Fund”) Class N shares returned 4.31%, underperforming its benchmark, the Bloomberg Barclays 10-Year Municipal Bond Index (the “Index”), which returned 5.62%. The municipal bond market withstood historic volatility in the first quarter as COVID-19 exploded across the globe and wreaked havoc on financial markets. After falling to all-time lows amid a global flight to safety, tax-exempt yields went on a wild ride, spiking more than 200 basis points over a ten-day stretch in March only to abruptly reverse course and recapture nearly three-fourths of that sharp selloff. The generic 10-year AAA yield finished March up 40 basis points for the month, but still down 13 basis points from the beginning of the year. Credit spreads, which had been on a years-long run of tightening leading up to the crisis, widened sharply amid the turmoil, led by high yield and low investment grade securities, but also extending to certain sectors and credits viewed as particularly vulnerable to a prolonged economic shutdown. As the quarter came to a close, municipal bonds had regained some much needed stability thanks to unprecedented government intervention, but with the primary market still in limbo, price discovery remained opaque, trading depth shallow, and volatility elevated. The municipal bond market posted impressive returns in the second quarter, completing a remarkable turnaround from the most tumultuous selloff in its history. Tax-exempt yields fell sharply across the curve, dropping back near all-time lows and narrowing a gap against Treasuries that had recently ballooned to all-time highs. The path toward normalcy passed many markers along the way. Short-term financing costs, which had spiked in March, dropped to record lows by June. Mutual funds not only stemmed the tide of massive net redemptions, but also began seeing a surge of inflows. The new issue market, which was effectively closed in March and most of April, eventually kicked into high gear, providing much needed price discovery and reflecting a growing confidence that the worst may have passed. The healing was broad based but not quite universal. Credit quality took on new importance as investors became more skeptical of certain issuers and sectors perceived as vulnerable to the pandemic fallout. Also states are beginning to fear that additional federal aid may become a casualty of election-year politics, an outcome that could spell trouble in some corners of the municipal bond space. | The municipal bond market posted solid returns in the third quarter, extending a post-crisis rebound on the back of a robust technical environment. Over the first six weeks of the period, tax-exempt yields rallied to all-time lows across the entire curve. The major catalyst was a flood of money pouring into the market, driven by a combination of seasonally high reinvestment demand and attractive valuations versus taxable alternatives. Industry mutual funds took in $26 billion of net new cash, the highest quarterly inflows on record. Supply, on the other hand, was relatively modest. Headline volumes were actually well above average, but those numbers were inflated by a record jump in taxable issuance. Tax-exempt supply remained at more manageable levels. In addition, dealer inventories dropped to all-time lows, setting the stage for a supply/demand dynamic that favored sellers. Lower rated credits continued to outperform, benefiting from a better-than-expected outlook for state finances and a still heavy appetite for incremental yield. Over the second half of August and into September, investors turned more cautious amid a building forward calendar and uncertainty over federal relief aid, pushing rates up off their lows, but still down for the quarter. Municipal bonds posted solid gains in the fourth quarter, driven by strong technical tailwinds. Coming into October, municipal bonds were out-yielding Treasuries on an absolute basis across most of the curve, a dynamic that reflected heavy issuance in the third quarter and lingering concerns over the financial shape of state and local governments. But it had already become clear that tax revenues across the country were recovering much faster than feared, meaning credit fundamentals were improving even before factoring in any federal relief. And after October, when municipalities floated a record volume of deals to get ahead of any federal election chaos, issuance fell off a cliff, leaving a market that was starving for yield chasing a fast-dwindling supply of bonds. As we approached year end, heavy seasonal reinvestment demand and accelerating fund flows only added to the imbalance, as did the urgency of knowing that the supply drought would likely extend well into February. And so municipal yields continued to grind lower. While all this was going on, Treasury yields were moving higher, as a number of positive developments reduced the need for safe-haven assets. The November U.S. election proved decisive, removing the chance that a contested result could destabilize markets. Federal stimulus talks proceeded in starts and stops, ultimately culminating | with a deal in late December. And perhaps most importantly, multiple highly effective COVID-19 vaccines were approved for emergency use, providing confidence that the end of the crisis was finally in sight. All these factors put upward pressure on rates, though any runaway selloff in Treasuries was kept in check by a still-vigilant U.S Federal Reserve (the “Fed”) and a worrisome surge in coronavirus cases, which led to another series of widespread lockdowns. With municipal bonds and Treasuries heading in opposite directions, relative value ratios plunged, and by the end of the year had moved back to pre-virus levels. In fact, the 10-year municipal bond/Treasury ratio began the quarter at 127% and ended it at 78%. The Fund underperformed the Bloomberg Barclays 10-Year Municipal Bond Index for the year. A shift in yield curve positioning in the fourth quarter modestly helped performance late in the year, but the Fund’s overall shorter duration detracted from performance for the year as rates declined. The Fund’s higher quality positioning benefited relative performance for the year. As we enter 2021, it is important to revisit the lessons of last year. As we saw in March and April, the municipal bond market tends to be one-directional. With no effective way to short municipal bonds, price discovery is at the mercy of long-only investors, and when demand dries up, air pockets of volatility can emerge. But underneath the trading dynamics, which were ultimately cured by aggressive Fed liquidity, municipal credits once again demonstrated their resilience in the face of adversity and their importance as a hedge against riskier asset types. State tax receipts, expected to collapse amid the shutdown, held up remarkably well, buoyed by federal stimulus and the rebound in financial markets. Revenue sectors like toll roads, health care, and higher education rebounded quickly after early setbacks. Water systems and electric utilities were barely affected, showing how airtight essential service industries can be. Even areas most plagued by the crisis, like airports, showed only modest pressure, as large cash cushions and flexible airline agreement contracts provide a crucial bridge to recovery. So, while yields are once again back near absolute lows, municipal bonds remain a stable, sleep-at-night component of a successful asset allocation strategy. This commentary reflects the viewpoints of GW&K Investment Management, LLC and is not intended as a forecast or guarantee of future results. |
| | AMG GW&K Municipal Bond Fund Portfolio Manager’s Comments (continued) |
CUMULATIVE TOTAL RETURN PERFORMANCE
AMG GW&K Municipal Bond Fund’s cumulative total return is based on the daily change in net asset value (NAV), and assumes that all dividends and distributions were reinvested. The graph compares a hypothetical $10,000 investment made in the AMG GW&K Municipal Bond Fund’s Class N shares on December 31, 2010, to a $10,000 investment made in the Bloomberg Barclays 10-Year Municipal Bond Index for the same time period. The graph and table do not reflect the deduction of taxes that a shareholder would pay on a Fund distribution or redemption of shares. The listed returns for the Fund are net of expenses and the returns for the index exclude expenses. Total returns would have been lower had certain expenses not been reduced.

The table below shows the average annual total returns for the AMG GW&K Municipal Bond Fund and the Bloomberg Barclays 10-Year Municipal Bond Index for the same time periods ended December 31, 2020.
| Average Annual Total Returns1 | | One Year | | Five
Years | | Ten Years |
| AMG GW&K Municipal Bond Fund2, 3, 4, 5, 6, 7 | | | | | | |
| Class N | | 4.31% | | 3.09% | | 4.05% |
| Class I | | 4.70% | | 3.43% | | 4.48% |
| Bloomberg Barclays 10-Year Municipal Bond Index8 | | 5.62% | | 4.05% | | 4.80% |
The performance data shown represents past performance. Past performance is not a guarantee of future results. Current performance may be lower or higher than the performance data quoted. The investment return and principal value of an investment will fluctuate so that an investor’s shares, when redeemed, may be worth more or less than their original cost.
Investors should carefully consider the Fund’s investment objectives, risks, charges and expenses before investing. For performance information through the most recent month end, current net asset values per share for the Fund and other information, please call 800.548.4539 or visit our website at amgfunds.com for a free prospectus. Read it carefully before investing or sending money.
Distributed by AMG Distributors, Inc., member FINRA/SIPC.
| 1 | Total return equals income yield plus share price change and assumes reinvestment of all dividends and capital gain distributions. Returns are net of fees and may reflect offsets of Fund expenses as described in the prospectus. No adjustment has been made for taxes payable by shareholders on their reinvested dividends and capital gain distributions. Returns for periods greater than one year are annualized. The listed returns on the Fund are net of expenses and based on the published NAV as of December 31, 2020. All returns are in U.S. dollars ($). |
| 2 | From time to time, the Fund’s advisor has waived its fees and/or absorbed Fund expenses, which has resulted in higher returns. |
| 3 | The Fund is subject to the risks associated with investments in debt securities, such as default risk and |
| | | fluctuations in the perception of the debtor’s ability to pay its creditors. Changing interest rates may adversely affect the value of an investment. An increase in interest rates typically causes the value of bonds and other fixed income securities to fall. |
| 4 | Factors unique to the municipal bond market may negatively affect the value of municipal bonds. |
| 5 | Investment income may be subject to certain state and local taxes, and depending on your tax status, the federal alternative minimum tax. Capital gains are not exempt from federal income tax. |
| 6 | Market prices of investments held by the Fund may fall rapidly or unpredictably due to a variety of economic or political factors, market conditions, disasters or public health issues, or in response to events that affect particular industries or companies. |
| 7 | Companies that are in similar businesses may be similarly affected by particular economic or market events; to the extent the Fund has substantial holdings within a particular sector, the risks associated with that sector increase. |
| 8 | The Bloomberg Barclays 10-Year Municipal Bond Index is the 10 Year (8-12) component of the Municipal Bond index. It is a rules-based, market-value-weighted index engineered for the tax-exempt bond market. The Index tracks general obligation bonds, revenue bonds, insured bonds, and prerefunded bonds rated Baa3/BBB- or higher by at least two of the ratings agencies: Moody’s, S&P, Fitch. Unlike the Fund, the Bloomberg Barclays 10-Year Municipal Bond Index is unmanaged, is not available for investment and does not incur expenses. |
Bloomberg Index Services Limited. BLOOMBERG® is a trademark and service mark of Bloomberg Finance L.P. and its affiliates (collectively “Bloomberg”). BARCLAYS® is a trademark and service mark of Barclays Bank Plc (collectively with its affiliates, “Barclays”), used under license. Bloomberg or Bloomberg’s licensors, including Barclays, own all proprietary rights in the Bloomberg Barclays Indices. Neither Bloomberg nor Barclays approves or endorses this material, or guarantees the accuracy or completeness of any information herein, or makes any warranty, express or implied, as to the results to be obtained therefrom and, to the maximum extent allowed by law, neither shall have any liability or responsibility for injury or damages arising in connection therewith.
Not FDIC insured, nor bank guaranteed. May lose value.
| | AMG GW&K Municipal Bond Fund Fund Snapshots (unaudited) December 31, 2020 |
PORTFOLIO BREAKDOWN
| Category | % of
Net Assets |
| Transportation | 26.9 |
| General Obligation | 21.0 |
| Utilities | 20.0 |
| Water | 7.5 |
| Medical | 7.4 |
| Education | 5.8 |
| Power | 2.8 |
| Tobacco Settlement | 0.8 |
| Industrial Development | 0.5 |
| Short-Term Investments | 7.3 |
| | |
| | |
| | |
| Rating | % of Market Value1 |
| Aaa/AAA | 24.7 |
| Aa/AA | 48.1 |
| A | 24.1 |
| Baa/BBB | 3.1 |
| 1 Includes market value of long-term fixed-income securities only. | |
TOP TEN HOLDINGS
| Security Name | | % of Net Assets |
| State of Texas, 4.000%, 08/26/21 | | 4.4 |
| State of Maryland, Series B, 5.000%, 08/01/25 | | 2.3 |
| New York State Dormitory Authority, Series B, 5.000%, 03/31/21 | | 2.0 |
| Wisconsin State Revenue, Department of Transportation, Series 2, 5.000%, 07/01/29 | | 2.0 |
| North Carolina State Limited Obligation, Series B, 5.000%, 05/01/28 | | 1.5 |
| Iowa Finance Authority, State Revolving Fund Green Bond, 5.000%, 08/01/30 | | 1.5 |
Metropolitan Transportation Authority,
Transit Revenue, Green Bond,
Series B, 5.000%, 11/15/27 | | 1.3 |
| State of California, General Obligation, 5.000%, 11/01/30 | | 1.2 |
| State of Maryland, Department of Transportation, 5.000%, 09/01/29 | | 1.2 |
| State of Maryland, Department of Transportation, 5.000%, 10/01/28 | | 1.2 |
| Top Ten as a Group | | 18.6 |
Credit quality ratings shown above reflect the highest rating assigned by either Standard & Poor’s (“S&P”), Moody’s Investors Service, Inc. (“Moody’s”) or Fitch. These rating agencies are independent, nationally recognized statistical rating organizations and are widely used. Investment grade ratings are credit ratings of BBB/Baa or higher. Below investment grade ratings are credit ratings of BB/Ba or lower. Investments designated N/R are not rated by any of the rating agencies. Unrated investments do not necessarily indicate low credit quality. Credit quality ratings are subject to change.
Because a fund’s strategy may result in multiple investments in particular sectors of the economy, its performance may depend on the performance of those sectors and may fluctuate more widely than investments diversified across more sectors. For additional information on these and other risk considerations, please see the Fund’s prospectus.
Any sectors, industries, or securities discussed should not be perceived as investment recommendations. Mention of a specific security should not be considered a recommendation to buy or solicitation to sell that security. Specific securities mentioned in this report may have been sold from the Fund’s portfolio of investments by the time you receive this report.
| | AMG GW&K Municipal Bond Fund Schedule of Portfolio Investments December 31, 2020 |
| | Principal
Amount | Value |
| Municipal Bonds - 92.7% | | |
| Alabama - 0.8% | | |
Alabama Public School and College Authority, Series A 5.000%, 11/01/34 | $7,500,000 | $10,280,925 |
| Arizona - 2.2% | | |
Arizona Department of Transportation State Highway Fund Revenue 5.000%, 07/01/28 | 5,040,000 | 6,274,548 |
Arizona Water Infrastructure Finance Authority, Water Quality Revenue, Series A 5.000%, 10/01/26 | 10,000,000 | 11,714,500 |
Salt River Project Agricultural Improvement & Power District 5.000%, 01/01/27 1 | 3,000,000 | 3,702,210 |
| 5.000%, 01/01/28 1 | 2,625,000 | 3,326,400 |
| 5.000%, 01/01/29 1 | 2,500,000 | 3,249,975 |
| Total Arizona | | 28,267,633 |
| California - 11.0% | | |
California Municipal Finance Authority, Community Medical Centers, Series A | | |
| 5.000%, 02/01/27 | 950,000 | 1,173,421 |
| 5.000%, 02/01/30 | 1,630,000 | 1,964,280 |
| 5.000%, 02/01/31 | 900,000 | 1,081,026 |
| 5.000%, 02/01/32 | 1,855,000 | 2,220,175 |
California State Public Works Board 5.000%, 02/01/31 1 | 3,500,000 | 4,541,775 |
| California State Public Works Board, Series A | | |
| 5.000%, 02/01/30 1 | 3,500,000 | 4,462,150 |
| 5.000%, 02/01/32 1 | 3,500,000 | 4,611,425 |
City of Los Angeles Department of Airports, Series C
5.000%, 05/15/30 | 10,515,000 | 14,080,111 |
Los Angeles County Metropolitan Transportation Authority, Series R | | |
| 5.000%, 06/01/29 | 6,940,000 | 9,450,337 |
| 5.000%, 06/01/31 | 6,000,000 | 8,284,500 |
| 5.000%, 06/01/32 | 10,035,000 | 13,754,172 |
Los Angeles Unified School District, Series A 5.000%, 07/01/28 | 5,000,000 | 6,625,550 |
| San Diego County Water Authority, Series A | | |
| 5.000%, 05/01/28 1 | 1,770,000 | 2,328,028 |
| 5.000%, 05/01/29 1 | 2,455,000 | 3,309,659 |
| 5.000%, 05/01/30 1 | 1,800,000 | 2,479,338 |
| 5.000%, 05/01/31 1 | 1,300,000 | 1,831,960 |
| San Francisco City & County Airport Commission, | | |
| San Francisco International Airport, Series A | | |
| 5.000%, 05/01/34 | 5,000,000 | 6,358,700 |
| 5.000%, 05/01/35 | 5,800,000 | 7,361,302 |
| State of California | | |
| 5.000%, 08/01/29 | 7,235,000 | 8,993,539 |
| 5.000%, 09/01/29 | 5,075,000 | 6,323,704 |
| 5.000%, 11/01/30 | 11,575,000 | 16,166,108 |
| 5.000%, 04/01/32 | 5,000,000 | 7,166,550 |
| | | |
| | Principal
Amount | Value |
| State of California, Series C | | |
| 5.000%, 09/01/26 | $7,715,000 | $9,385,375 |
| Total California | | 143,953,185 |
| Colorado - 1.3% | | |
| Colorado Health Facilities Authority, Series A | | |
| 5.000%, 01/01/27 | 2,500,000 | 3,137,875 |
| 5.000%, 01/01/28 | 2,535,000 | 3,261,176 |
| 5.000%, 01/01/29 | 4,125,000 | 5,425,406 |
| 5.000%, 08/01/33 | 4,250,000 | 5,424,955 |
| Total Colorado | | 17,249,412 |
| Connecticut - 2.8% | | |
State of Connecticut Special Tax Revenue 5.000%, 05/01/28 | 3,000,000 | 3,905,730 |
State of Connecticut Special Tax Revenue, Transportation Infrastructure 5.000%, 01/01/30 | 10,180,000 | 12,966,673 |
State of Connecticut Special Tax Revenue, Series B
5.000%, 10/01/35 | 7,500,000 | 9,543,150 |
| State of Connecticut, Series A | | |
| 5.000%, 01/15/31 | 7,650,000 | 10,225,220 |
| Total Connecticut | | 36,640,773 |
| District of Columbia - 2.8% | | |
| District of Columbia, Series A | | |
| 5.000%, 06/01/30 | 6,020,000 | 7,446,800 |
| District of Columbia, Series B | | |
| 5.000%, 10/01/28 | 7,100,000 | 9,493,055 |
| 5.000%, 06/01/31 | 10,080,000 | 13,159,238 |
Washington Convention & Sports Authority, Series A 5.000%, 10/01/27 | 5,475,000 | 6,600,277 |
| Total District of Columbia | | 36,699,370 |
| Florida - 3.8% | | |
Escambia County Health Facilities Authority 5.000%, 08/15/37 | 6,000,000 | 7,447,260 |
Florida’s Turnpike Enterprise, Department of Transportation, Series C | | |
| 5.000%, 07/01/28 | 7,075,000 | 8,773,354 |
Lee Memorial Health System, Series A 5.000%, 04/01/34 | 5,645,000 | 7,266,300 |
Orange County Health Facilities Authority, Series A 5.000%, 10/01/31 | 4,525,000 | 5,500,138 |
Orange County Health Facilities Authority, Series G | | |
| 5.000%, 10/01/26 | 3,000,000 | 3,741,300 |
State of Florida, Capital Outlay, Series B 5.000%, 06/01/27 | 9,045,000 | 10,479,537 |
The accompanying notes are an integral part of these financial statements.
| | AMG GW&K Municipal Bond Fund Schedule of Portfolio Investments (continued) |
| | | Principal
Amount | | Value | |
| Florida - 3.8% (continued) | | | | | | | |
State of Florida, Department of Transportation, Fuel Sales Tax Revenue, Series B 5.000%, 07/01/26 | | | $5,780,000 | | | $5,915,194 | |
| Total Florida | | | | | | 49,123,083 | |
| Georgia - 1.9% | | | | | | | |
Atlanta Water & Wastewater Revenue
5.000%, 11/01/25 | | | 5,100,000 | | | 6,139,584 | |
Georgia State University & College Improvements, Series A 5.000%, 07/01/27 | | | 4,600,000 | | | 4,929,912 | |
Private Colleges & Universities Authority, Series B
5.000%, 09/01/30 | | | 10,360,000 | | | 14,298,043 | |
| Total Georgia | | | | | | 25,367,539 | |
| Illinois - 7.0% | | | | | | | |
Chicago O’Hare International Airport, Series A 5.000%, 01/01/35 | | | 5,010,000 | | | 6,442,509 | |
Chicago O’Hare International Airport, Series B 5.000%, 01/01/28 | | | 10,670,000 | | | 12,462,560 | |
Chicago O’Hare International Airport, Senior Lien, Series A 5.000%, 01/01/36 | | | 10,000,000 | | | 12,286,900 | |
| 5.000%, 01/01/38 | | | 5,500,000 | | | 6,720,175 | |
Illinois Finance Authority 5.000%, 01/01/29 | | | 2,310,000 | | | 3,090,780 | |
| 5.000%, 07/01/29 | | | 8,755,000 | | | 11,850,418 | |
Illinois State Finance Authority Revenue, Clean Water Initiative Revenue
5.000%, 07/01/27 | | | 11,000,000 | | | 13,565,420 | |
Illinois State Toll Highway Authority, Series A
5.000%, 12/01/31 | | | 9,735,000 | | | 11,673,628 | |
Illinois State Toll Highway Authority, Senior Revenue Bonds, Series A
5.000%, 01/01/30 | | | 10,110,000 | | | 13,231,665 | |
| Total Illinois | | | | | | 91,324,055 | |
| Indiana - 1.1% | | | | | | | |
Indiana Finance Authority, Series C
5.000%, 06/01/29 | | | 4,800,000 | | | 6,433,872 | |
Indiana Transportation Finance Authority, Series C
5.500%, 12/01/25 | | | 6,070,000 | | | 7,597,030 | |
| Total Indiana | | | | | | 14,030,902 | |
| Iowa - 1.5% | | | | | | | |
Iowa Finance Authority, State Revolving Fund Green Bond
5.000%, 08/01/30 | | | 15,025,000 | | | 19,202,251 | |
| | | Principal
Amount | | Value | |
| Kentucky - 0.5% | | | | | | | |
Louisville/Jefferson County Metropolitan Government, Norton Healthcare Inc., Series A
5.000%, 10/01/29 | | | $5,505,000 | | | $6,720,449 | |
| Maryland - 5.9% | | | | | | | |
Maryland State Transportation Authority
5.000%, 07/01/33 | | | 6,350,000 | | | 8,630,285 | |
State of Maryland, Department of Transportation
5.000%, 10/01/28 | | | 12,365,000 | | | 15,472,324 | |
| 5.000%, 09/01/29 | | | 12,205,000 | | | 15,685,622 | |
State of Maryland, Series B 5.000%, 08/01/25 | | | 24,125,000 | | | 29,417,060 | |
State of Maryland, State & Local Facilities Loan of 2019, 1st Series
5.000%, 03/15/30 | | | 6,000,000 | | | 8,064,720 | |
| Total Maryland | | | | | | 77,270,011 | |
| Massachusetts - 2.7% | | | | | | | |
Commonwealth of Massachusetts
5.000%, 07/01/29 | | | 6,010,000 | | | 8,182,134 | |
Commonwealth of Massachusetts, Series A 5.000%, 07/01/25 | | | 7,700,000 | | | 9,339,715 | |
Massachusetts Bay Transportation Authority 5.000%, 07/01/22 | | | 10,020,000 | | | 10,744,045 | |
Massachusetts Water Resources Authority, Series C 5.000%, 08/01/31 | | | 6,080,000 | | | 7,580,848 | |
| Total Massachusetts | | | | | | 35,846,742 | |
| Michigan - 3.0% | | | | | | | |
Lansing Board of Water & Light, Series A
5.500%, 07/01/41 | | | 5,000,000 | | | 5,131,700 | |
Michigan Finance Authority, Henry Ford Health System 5.000%, 11/15/29 | | | 11,450,000 | | | 14,116,362 | |
Michigan State Building Authority Revenue, Series I
5.000%, 04/15/27 | | | 5,700,000 | | | 6,950,466 | |
State of Michigan
5.000%, 03/15/27 | | | 10,000,000 | | | 12,656,000 | |
| Total Michigan | | | | | | 38,854,528 | |
| Minnesota - 0.8% | | | | | | | |
City of Minneapolis MN, Fairview Health Services, Series A 5.000%, 11/15/35 | | | 3,165,000 | | | 3,990,084 | |
Minneapolis-St Paul Metropolitan Airports Commission, Series A
5.000%, 01/01/25 | | | 5,000,000 | | | 5,913,600 | |
| Total Minnesota | | | | | | 9,903,684 | |
The accompanying notes are an integral part of these financial statements.
| | AMG GW&K Municipal Bond Fund Schedule of Portfolio Investments (continued) |
| | | | Principal | | | |
| | | | Amount | | | Value |
| Mississippi - 0.8% | | | | | | |
| State of Mississippi, Series A | | | | | | |
| 5.000%, 10/01/28 | | | $10,000,000 | | | $10,361,100 |
| Missouri - 1.6% | | | | | | |
| University of Missouri, Series A | | | | | | |
| 5.000%, 11/01/26 | | | 5,520,000 | | | 6,507,362 |
| University of Missouri, Series B | | | | | | |
| 5.000%, 11/01/30 | | | 10,010,000 | | | 13,934,621 |
| Total Missouri | | | | | | 20,441,983 |
| Nebraska - 0.5% | | | | | | |
| University of Nebraska Facilities Corp. | | | | | | |
| 5.000%, 07/15/25 | | | 5,010,000 | | | 6,080,837 |
| New Jersey - 1.9% | | | | | | |
| New Jersey State Turnpike Authority Revenue, Series B | | | | | | |
| 5.000%, 01/01/28 | | | 4,010,000 | | | 5,174,464 |
| State of New Jersey | | | | | | |
| 5.000%, 06/01/25 | | | 4,335,000 | | | 5,161,511 |
| 5.000%, 06/01/29 | | | 11,500,000 | | | 14,905,265 |
| Total New Jersey | | | | | | 25,241,240 |
| New Mexico - 0.2% | | | | | | |
| New Mexico Finance Authority | | | | | | |
| 5.000%, 06/01/22 | | | 2,845,000 | | | 3,039,911 |
| New York - 10.2% | | | | | | |
| City of New York | | | | | | |
| 5.000%, 08/01/34 | | | 3,250,000 | | | 4,347,167 |
| City of New York, Series C | | | | | | |
| 5.000%, 08/01/33 | | | 1,500,000 | | | 2,018,130 |
| Long Island Power Authority | | | | | | |
| 5.000%, 09/01/35 | | | 5,015,000 | | | 6,444,626 |
| Metropolitan Transportation Authority, | | | | | | |
| Transit Revenue, Green Bond, | | | | | | |
| Series B | | | | | | |
| 5.000%, 11/15/27 | | | 14,225,000 | | | 16,877,678 |
| Metropolitan Transportation Authority, | | | | | | |
| Transit Revenue, Series F | | | | | | |
| 5.000%, 11/15/24 | | | 4,950,000 | | | 5,237,595 |
| 5.000%, 11/15/27 | | | 5,000,000 | | | 5,287,650 |
| 5.000%, 11/15/28 | | | 4,750,000 | | | 5,378,662 |
| New York City Transitional Finance Authority Building Aid Revenue, | | | | | | |
| Series S-3, Sub-Series S-3A | | | | | | |
| 5.000%, 07/15/31 | | | 5,080,000 | | | 6,533,236 |
| New York City Transitional Finance Authority, Future Tax Secured Revenue, Series C | | | | | | |
| 5.000%, 11/01/26 | | | 9,585,000 | | | 11,433,275 |
| New York State Dormitory Authority, Series A | | | | | | |
| 5.000%, 12/15/25 | | | 8,645,000 | | | 9,445,268 |
| 5.000%, 12/15/27 | | | 5,640,000 | | | 6,155,158 |
| 5.000%, 03/15/31 | | | 7,670,000 | | | 9,938,096 |
| | | | | | | |
| | | | Principal | | | |
| | | | Amount | | | Value |
| New York State Dormitory Authority, Series D | | | | | | |
| 5.000%, 02/15/27 | | | $5,355,000 | | | $5,636,191 |
| New York State Dormitory Authority, Series E | | | | | | |
| 5.000%, 03/15/32 | | | 8,410,000 | | | 10,136,489 |
| New York Transportation Development Corp. | | | | | | |
| 5.000%, 12/01/30 | | | 1,000,000 | | | 1,313,600 |
| 5.000%, 12/01/31 | | | 1,100,000 | | | 1,436,193 |
| 5.000%, 12/01/32 | | | 1,400,000 | | | 1,815,534 |
| 5.000%, 12/01/33 | | | 1,000,000 | | | 1,292,120 |
| Port Authority of New York & New Jersey | | | | | | |
| 5.000%, 07/15/31 | | | 10,000,000 | | | 13,306,300 |
| 5.000%, 07/15/32 | | | 6,545,000 | | | 8,650,003 |
| Total New York | | | | | | 132,682,971 |
| North Carolina - 1.5% | | | | | | |
| North Carolina State Limited Obligation, Series B | | | | | | |
| 5.000%, 05/01/28 | | | 15,300,000 | | | 19,585,989 |
| Ohio - 2.6% | | | | | | |
| Ohio State General Obligation, Series A | | | | | | |
| 5.000%, 09/01/26 | | | 7,090,000 | | | 8,947,155 |
| Ohio State General Obligation, Series T | | | | | | |
| 5.000%, 05/01/30 | | | 5,000,000 | | | 6,365,050 |
| Ohio Water Development Authority, | | | | | | |
| Water Pollution Control Loan Fund, | | | | | | |
| Series 2015A | | | | | | |
| 5.000%, 06/01/25 | | | 5,000,000 | | | 6,047,900 |
| State of Ohio, Series A | | | | | | |
| 5.000%, 08/01/21 | | | 12,545,000 | | | 12,898,016 |
| Total Ohio | | | | | | 34,258,121 |
| Oregon - 1.7% | | | | | | |
| Oregon State Lottery, Series C | | | | | | |
| 5.000%, 04/01/27 | | | 10,000,000 | | | 11,910,800 |
| Oregon State Lottery, Series D | | | | | | |
| 5.000%, 04/01/28 | | | 9,225,000 | | | 10,953,488 |
| Total Oregon | | | | | | 22,864,288 |
| Pennsylvania - 2.0% | | | | | | |
| Allegheny County Hospital Development | | | | | | |
| Authority, | | | | | | |
| University Pittsburgh Medical Center | | | | | | |
| 5.000%, 07/15/31 | | | 5,520,000 | | | 7,241,909 |
| Commonwealth Financing Authority, | | | | | | |
| Pennsylvania Tobacco | | | | | | |
| 5.000%, 06/01/32 | | | 7,890,000 | | | 9,960,809 |
| Lancaster County Hospital Authority, | | | | | | |
| University of Pennsylvania Health Revenue | | | | | | |
| 5.000%, 08/15/26 | | | 6,970,000 | | | 8,761,569 |
| Total Pennsylvania | | | | | | 25,964,287 |
| Texas - 9.3% | | | | | | |
| Central Texas Turnpike System Transportation Commission, Series C | | | | | | |
| 5.000%, 08/15/31 | | | 11,175,000 | | | 12,788,558 |
| | | | | | | |
The accompanying notes are an integral part of these financial statements.
| | AMG GW&K Municipal Bond Fund Schedule of Portfolio Investments (continued) |
| | | | Principal | | | | |
| | | | Amount | | | Value | |
| Texas - 9.3% (continued) | | | | | | | |
| Central Texas Turnpike System, Series A | | | | | | | |
| 5.000%, 08/15/39 | | | $8,000,000 | | | $10,484,080 | |
| City of Corpus Christi TX Utility System Revenue, | | | | | | | |
| Junior Lien | | | | | | | |
| 5.000%, 07/15/29 | | | 3,125,000 | | | 4,074,969 | |
| City of San Antonio TX Electric & Gas | | | | | | | |
| Systems Revenue | | | | | | | |
| 5.000%, 02/01/26 | | | 9,350,000 | | | 11,567,165 | |
| Dallas Area Rapid Transit, Senior Lien | | | | | | | |
| 5.250%, 12/01/28 | | | 8,865,000 | | | 12,000,019 | |
| Dallas Fort Worth International Airport, Series A | | | | | | | |
| 5.000%, 11/01/29 | | | 3,535,000 | | | 4,720,321 | |
| 5.000%, 11/01/30 | | | 2,000,000 | | | 2,721,140 | |
| 5.000%, 11/01/31 | | | 3,245,000 | | | 4,384,839 | |
| Lower Colorado River Authority, | | | | | | | |
| LCRA Transmission Services Corporation | | | | | | | |
| 5.000%, 05/15/29 | | | 3,815,000 | | | 4,370,769 | |
| North Texas Municipal Water District | | | | | | | |
| Water System Revenue, | | | | | | | |
| Refunding and Improvement | | | | | | | |
| 5.000%, 09/01/29 | | | 7,350,000 | | | 9,163,098 | |
| North Texas Tollway Authority Revenue, Special Projects System, 1st Tier, | | | | | | | |
| Series A | | | | | | | |
| 5.000%, 01/01/25 | | | 6,460,000 | | | 7,323,379 | |
| North Texas Tollway Authority, 2nd Tier, Series B | | | | | | | |
| 5.000%, 01/01/31 | | | 2,000,000 | | | 2,381,460 | |
| 5.000%, 01/01/32 | | | 3,010,000 | | | 3,678,973 | |
| North Texas Tollway Authority, Series A | | | | | | | |
| 5.000%, 01/01/26 | | | 7,795,000 | | | 8,824,330 | |
| Texas Private Activity Bond Surface | | | | | | | |
| Transportation Corp. | | | | | | | |
| 4.000%, 12/31/37 | | | 5,000,000 | | | 5,853,350 | |
| 4.000%, 12/31/38 | | | 3,735,000 | | | 4,360,351 | |
| Texas Transportation Commission Fund, Series A | | | | | | | |
| 5.000%, 04/01/27 | | | 12,550,000 | | | 13,304,631 | |
| Total Texas | | | | | | 122,001,432 | |
| Utah - 2.0% | | | | | | | |
| Salt Lake City Corp. Airport Revenue, Series A | | | | | | | |
| 5.000%, 07/01/29 | | | 3,450,000 | | | 4,332,234 | |
| 5.000%, 07/01/30 | | | 6,585,000 | | | 8,225,653 | |
| State of Utah, Series B | | | | | | | |
| 5.000%, 07/01/22 | | | 7,500,000 | | | 8,041,950 | |
| Utah Transit Authority, Series A | | | | | | | |
| 5.000%, 06/15/27 | | | 5,020,000 | | | 6,007,233 | |
| Total Utah | | | | | | 26,607,070 | |
| Virginia - 1.8% | | | | | | | |
| Virginia College Building Authority, Series A | | | | | | | |
| 5.000%, 09/01/21 | | | 10,000,000 | | | 10,319,700 | |
| | | | | | | | |
| | | | Principal | | | |
| | | | Amount | | | Value |
| Virginia Public Building Authority, Series B | | | | | | |
| 5.000%, 08/01/25 | | | $10,430,000 | | | $12,691,328 |
| Total Virginia | | | | | | 23,011,028 |
| Washington - 4.2% | | | | | | |
| Energy Northwest Electric Revenue, | | | | | | |
| Bonneville Power | | | | | | |
| 5.000%, 07/01/25 | | | 10,305,000 | | | 12,468,638 |
| Energy Northwest Nuclear Revenue, | | | | | | |
| Project 3, Series A | | | | | | |
| 5.000%, 07/01/25 | | | 7,965,000 | | | 9,637,331 |
| State of Washington School Improvements, Series C | | | | | | |
| 5.000%, 02/01/28 | | | 7,370,000 | | | 9,055,003 |
| State of Washington, Series R-2015C | | | | | | |
| 5.000%, 07/01/28 | | | 10,265,000 | | | 12,145,137 |
| University of Washington, | | | | | | |
| University & College Improvements | | | | | | |
| Revenue, Series C | | | | | | |
| 5.000%, 07/01/27 | | | 7,270,000 | | | 7,941,385 |
| Washington Health Care Facilities Authority, Series A | | | | | | |
| 5.000%, 08/01/38 | | | 3,005,000 | | | 3,783,445 |
| Total Washington | | | | | | 55,030,939 |
| West Virginia - 0.4% | | | | | | |
| West Virginia Hospital Finance Authority, | | | | | | |
| Cabell Huntington Hospital Obligation | | | | | | |
| 5.000%, 01/01/35 | | | 3,745,000 | | | 4,590,584 |
| Wisconsin - 2.9% | | | | | | |
| State of Wisconsin | | | | | | |
| 5.000%, 05/01/29 1 | | | 3,500,000 | | | 4,702,215 |
| 5.000%, 05/01/30 1 | | | 2,390,000 | | | 3,284,601 |
| 5.000%, 05/01/31 1 | | | 2,700,000 | | | 3,707,100 |
| Wisconsin State Revenue, Department of | | | | | | |
| Transportation, Series 2 | | | | | | |
| 5.000%, 07/01/29 | | | 20,405,000 | | | 26,077,182 |
| Total Wisconsin | | | | | | 37,771,098 |
| Total Municipal Bonds | | | | | | |
| (Cost $1,133,132,282) | | | | | | 1,210,267,420 |
| Short-Term Investments - 7.3% | | | | | | |
| Municipal Bonds - 7.3% | | | | | | |
| California - 0.9% | | | | | | |
| City of Los Angeles | | | | | | |
| 4.000%, 06/24/21 | | | 6,070,000 | | | 6,182,052 |
| County of Los Angeles, Series A | | | | | | |
| 4.000%, 06/30/21 | | | 5,020,000 | | | 5,115,681 |
| Total California | | | | | | 11,297,733 |
| New York - 2.0% | | | | | | |
| New York State Dormitory Authority, Series B | | | | | | |
| 5.000%, 03/31/21 | | | 26,000,000 | | | 26,306,540 |
| | | | | | | | |
The accompanying notes are an integral part of these financial statements.
| | AMG GW&K Municipal Bond Fund Schedule of Portfolio Investments (continued) |
| | | Principal | | | | | | |
| | | Amount | | Value | | | | Value |
| Texas - 4.4% | | | | | | Total Investments - 100.0% | | |
| State of Texas | | | | | | (Cost $1,228,525,480) | | $1,305,706,754 |
| 4.000%, 08/26/21 | | $56,425,000 | | $57,835,061 | | Other Assets, less Liabilities - 0.0% | | 113,424 |
| Total Municipal Bonds | | | | | | Net Assets - 100.0% | | $1,305,820,178 |
| (Cost $95,393,198) | | | | 95,439,334 | | | | |
| Total Short-Term Investments | | | | | | | | |
| (Cost $95,393,198) | | | | 95,439,334 | | | | |
| | | | | | | | | |
| 1 | All or part of a security is delayed delivery transaction. The market value for delayed delivery securities at December 31, 2020, amounted to $45,536,836, or 3.5% of net assets. |
The following table summarizes the inputs used to value the Fund’s investments by the fair value hierarchy levels as of December 31, 2020:
| | | Level 1 | | | Level 2 | | | Level 3 | | | Total |
| Investments in Securities | | | | | | | | | | | |
| Municipal Bonds† | | — | | | $1,210,267,420 | | | — | | | $1,210,267,420 |
| Short-Term Investments | | | | | | | | | | | |
| Municipal Bonds† | | — | | | 95,439,334 | | | — | | | 95,439,334 |
| Total Investments in Securities | | — | | | $1,305,706,754 | | | — | | | $1,305,706,754 |
| † | All municipal bonds held in the Fund are Level 2 securities. For a detailed breakout of municipal bonds by major classification, please refer to the Fund’s Schedule of Portfolio Investments. |
For the fiscal year ended December 31, 2020, there were no transfers in or out of Level 3.
The accompanying notes are an integral part of these financial statements.
| |
AMG GW&K Municipal Enhanced Yield Fund Portfolio Manager’s Comments (unaudited) |
THE YEAR IN REVIEW For the year ended December 31, 2020, AMG GW&K Municipal Enhanced Yield Fund’s (the “Fund”) Class N shares returned 5.95%, compared to the Bloomberg Barclays U.S. Municipal Bond BAA Index (the Index), which returned 4.55%. The municipal bond market withstood historic volatility in the first quarter as COVID-19 exploded across the globe and wreaked havoc on financial markets. After falling to all-time lows amid a global flight to safety, tax-exempt yields went on a wild ride, spiking more than 200 basis points over a ten-day stretch in March only to abruptly reverse course and recapture nearly three-fourths of that sharp selloff. The generic 10-year AAA yield finished March up 40 basis points for the month, but still down 13 basis points from the beginning of the year. Credit spreads, which had been on a years-long run of tightening leading up to the crisis, widened sharply amid the turmoil, led by high yield and low investment grade securities, but also extending to certain sectors and credits viewed as particularly vulnerable to a prolonged economic shutdown. As the quarter came to a close, municipal bonds had regained some much needed stability thanks to unprecedented government intervention, but with the primary market still in limbo, price discovery remained opaque, trading depth shallow, and volatility elevated. The municipal bond market posted impressive returns in the second quarter, completing a remarkable turnaround from the most tumultuous selloff in its history. Tax-exempt yields fell sharply across the curve, dropping back near all-time lows and narrowing a gap against Treasuries that had recently ballooned to all-time highs. The path toward normalcy passed many markers along the way. Short-term financing costs, which had spiked in March, dropped to record lows by June. Mutual funds not only stemmed the tide of massive net redemptions, but also began seeing a surge of inflows. The new issue market, which was effectively closed in March and most of April, eventually kicked into high gear, providing much needed price discovery and reflecting a growing confidence that the worst may have passed. The healing was broad based but not quite universal. Credit quality took on new importance as investors became more skeptical of certain issuers and sectors perceived as vulnerable to the pandemic fallout. And states are beginning to fear that additional federal aid may become a casualty of election-year politics, an outcome that could spell trouble in some corners of the municipal bond space. | The municipal bond market posted solid returns in the third quarter, extending a post-crisis rebound on the back of a robust technical environment. Over the first six weeks of the period, tax-exempt yields rallied to all-time lows across the entire curve. The major catalyst was a flood of money pouring into the market, driven by a combination of seasonally high reinvestment demand and attractive valuations versus taxable alternatives. Industry mutual funds took in $26 billion of net new cash, the highest quarterly inflows on record. Supply, on the other hand, was relatively modest. Headline volumes were actually well above average, but those numbers were inflated by a record jump in taxable issuance. Tax-exempt supply remained at more manageable levels. In addition, dealer inventories dropped to all-time lows, setting the stage for a supply/demand dynamic that favored sellers. Lower rated credits continued to outperform, benefiting from a better-than-expected outlook for state finances and a still heavy appetite for incremental yield. Over the second half of August and into September, investors turned more cautious amid a building forward calendar and uncertainty over federal relief aid, pushing rates up off their lows, but still down for the quarter. Municipal bonds posted solid gains in the fourth quarter, driven by strong technical tailwinds. Coming into October, municipal bonds were out-yielding Treasuries on an absolute basis across most of the curve, a dynamic that reflected heavy issuance in the third quarter and lingering concerns over the financial shape of state and local governments. But it had already become clear that tax revenues across the country were recovering much faster than feared, meaning credit fundamentals were improving even before factoring in any federal relief. And after October, when municipalities floated a record volume of deals to get ahead of any federal election chaos, issuance fell off a cliff, leaving a market that was starving for yield chasing a fast-dwindling supply of bonds. As we approached year end, heavy seasonal reinvestment demand and accelerating fund flows only added to the imbalance, as did the urgency of knowing that the supply drought would likely extend well into February. And so municipal yields continued to grind lower. While all this was going on, Treasury yields were moving higher, as a number of positive developments reduced the need for safe-haven assets. The November U.S. election proved decisive, removing the chance that a contested result could destabilize markets. Federal stimulus talks proceeded in starts and stops, ultimately culminating with a deal in late December. And perhaps most | importantly, multiple highly effective COVID-19 vaccines were approved for emergency use, providing confidence that the end of the crisis was finally in sight. All these factors put upward pressure on rates, though any runaway selloff in Treasuries was kept in check by a still-vigilant U.S. Federal Reserve (the “Fed”) and a worrisome surge in coronavirus cases, which led to another series of widespread lockdowns. With municipal bonds and Treasuries heading in opposite directions, relative value ratios plunged, and by the end of the year had moved back to pre-virus levels. In fact, the 10-year municipal bond/Treasury ratio began the quarter at 127% and ended it at 78%. The Fund outperformed the Bloomberg Barclays U.S. Municipal Bond BAA Index for the year. The primary drivers of outperformance for the year included the Fund’s longer duration positioning, positive security selection, as well as a higher quality bias relative to the Bloomberg Barclays U.S. Municipal Bond BAA Index. The Fund has over 50% of its holdings in credits rated A or higher versus the BBB rated bonds in the Index. As we enter 2021, it is important to revisit the lessons of last year. As we saw in March and April, the municipal bond market tends to be one-directional. With no effective way to short municipal bonds, price discovery is at the mercy of long-only investors, and when demand dries up, air pockets of volatility can emerge. But underneath the trading dynamics, which were ultimately cured by aggressive Fed liquidity, municipal credits once again demonstrated their resilience in the face of adversity and their importance as a hedge against riskier asset types. State tax receipts, expected to collapse amid the shutdown, held up remarkably well, buoyed by federal stimulus and the rebound in financial markets. Revenue sectors like toll roads, health care, and higher education rebounded quickly after early setbacks. Water systems and electric utilities were barely affected, showing how airtight essential service industries can be. Even areas most plagued by the crisis, like airports, showed only modest pressure, as large cash cushions and flexible airline agreement contracts provide a crucial bridge to recovery. So, while yields are once again back near absolute lows, municipal bonds remain a stable, sleep-at-night component of a successful asset allocation strategy. The views expressed represent the opinions of GW&K Investment Management, LLC, are not intended as a forecast or guarantee of future results, and are subject to change without notice. |
| |
| AMG GW&K Municipal Enhanced Yield Fund |
| Portfolio Manager’s Comments (continued) |
CUMULATIVE TOTAL RETURN PERFORMANCE
AMG GW&K Municipal Enhanced Yield Fund’s cumulative total return is based on the daily change in net asset value (NAV), and assumes that all dividends and distributions were reinvested. The graph compares a hypothetical $10,000 investment made in the AMG GW&K Municipal Enhanced Yield Fund’s Class N shares on December 31, 2010, to a $10,000 investment made in the Bloomberg Barclays U.S. Municipal Bond BAA Index for the same time period. The graph and table do not reflect the deduction of taxes that a shareholder would pay on a Fund distribution or redemption of shares. The listed returns for the Fund are net of expenses and the returns for the index exclude expenses. Total returns would have been lower had certain expenses not been reduced.
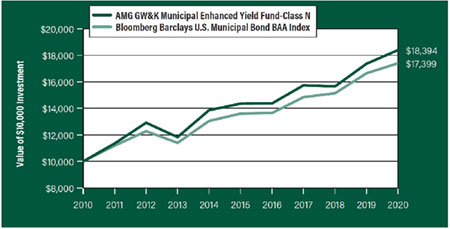
The table below shows the average annual total returns for the AMG GW&K Municipal Enhanced Yield Fund and the Bloomberg Barclays U.S. Municipal Bond BAA Index for the same time periods ended December 31, 2020.
| Average Annual Total Returns1 | | One
Year | | | Five
Years | | Ten
Years | | Since
Inception | | | Inception
Date |
| AMG GW&K Municipal Enhanced Yield Fund2, 3, 4, 5, 6, 7, 8, 9, 10 |
| Class N | | 5.95 | % | | 5.08% | | 6.28% | | 6.67 | % | | 07/27/09 |
| Class I | | 6.31 | % | | 5.50% | | 6.73% | | 5.11 | % | | 12/30/05 |
| Class Z | | 6.37 | % | | — | | — | | 6.66 | % | | 02/24/17 |
Bloomberg Barclays U.S. Municipal Bond BAA Index11 | | 4.55 | % | | 5.04% | | 5.69% | | 6.02 | % | | 07/27/09† |
| | | | | | | | | | | | | |
| The performance data shown represents past performance. Past performance is not a guarantee of future results. Current performance may be lower or higher than the performance data quoted. The investment return and principal value of an investment will fluctuate so that an investor’s shares, when redeemed, may be worth more or less than their original cost. |
Investors should carefully consider the Fund’s investment objectives, risks, charges and expenses before investing. For performance information through the most recent month end, current net asset values per share for the Fund and other information, please call 800.548.4539 or visit our website at amgfunds.com for a free prospectus. Read it carefully before investing or sending money.
Distributed by AMG Distributors, Inc., member FINRA/SIPC.
| † | Date reflects the inception date of the Fund, not the index. |
| 1 | Total return equals income yield plus share price change and assumes reinvestment of all dividends and capital gain distributions. Returns are net of fees and may reflect offsets of Fund expenses as described in the prospectus. No adjustment has been made for taxes payable by shareholders on their reinvested dividends and |
| | capital gain distributions. Returns for periods greater than one year are annualized. The listed returns on the Fund are net of expenses and based on the published NAV as of December 31, 2020. All returns are in U.S. dollars ($). |
| | |
| 2 | From time to time, the Fund’s advisor has waived its fees and/or absorbed Fund expenses, which has resulted in higher returns. |
| | |
| 3 | The Fund is subject to the risks associated with investments in debt securities, such as default risk and fluctuations in the perception of the debtor’s ability to pay its creditors. Changing interest rates may adversely affect the value of an investment. An increase in interest rates typically causes the value of bonds and other fixed income securities to fall. |
| | |
| 4 | Companies that are in similar businesses may be similarly affected by particular economic or market events; to the extent the Fund has substantial holdings within a particular sector, the risks associated with that sector increase. |
| | |
| 5 | The Fund may invest in derivatives such as options and futures; the complexity and rapidly changing structure of derivatives markets may increase the possibility of market losses. |
| | |
| 6 | High-yield bonds (also known as “junk bonds”) may be subject to greater levels of interest rate, credit, and liquidity risk than investments in higher rated securities. These securities are considered predominantly speculative with respect to the issuer’s continuing ability to make principal and interest payments. The issuers of the Fund’s holdings may be involved in bankruptcy proceedings, reorganizations, or financial restructurings, and are not as strong financially as higher-rated issuers. |
| | |
| 7 | The use of leverage in a Fund’s strategy, such as futures and forward commitment transactions, can magnify relatively small market movements into relatively larger losses for the Fund. |
| | |
| 8 | Factors unique to the municipal bond market may negatively affect the value of municipal bonds. |
| | |
| 9 | Investment income may be subject to certain state and local taxes, and depending on your tax status, the federal alternative minimum tax. Capital gains are not exempt from federal income tax. |
| | |
| 10 | Market prices of investments held by the Fund may fall rapidly or unpredictably due to a variety of economic or political factors, market conditions, disasters or public health issues, or in response to events that affect particular industries or companies. |
| | |
| 11 | The Bloomberg Barclays U.S. Municipal Bond BAA Index is a subset of the Bloomberg Barclays U.S. Municipal Bond Index with an index rating of Baa1, Baa2, or Baa3. The Bloomberg Barclays U.S. Municipal Bond Index is a rules-based, |
| |
| AMG GW&K Municipal Enhanced Yield Fund |
| Portfolio Manager’s Comments (continued) |
market-value-weighted index engineered for the long-term, tax-exempt bond market. Unlike the Fund, the Bloomberg Barclays U.S. Municipal Bond BAA Index is unmanaged, is not available for investment and does not incur expenses. Bloomberg Index Services Limited. BLOOMBERG® is a trademark and service mark of Bloomberg Finance L.P. and its affiliates (collectively “Bloomberg”). | BARCLAYS® is a trademark and service mark of Barclays Bank Plc (collectively with its affiliates, “Barclays”), used under license. Bloomberg or Bloomberg’s licensors, including Barclays, own all proprietary rights in the Bloomberg Barclays Indices. Neither Bloomberg nor Barclays approves or endorses this material, or guarantees the accuracy or completeness of any information herein, or makes | any warranty, express or implied, as to the results to be obtained therefrom and, to the maximum extent allowed by law, neither shall have any liability or responsibility for injury or damages arising in connection therewith. Not FDIC insured, nor bank guaranteed. May lose value. |
AMG GW&K Municipal Enhanced Yield Fund Fund Snapshots (unaudited)
December 31, 2020 |
| PORTFOLIO BREAKDOWN |
| |
| | % of |
| Category | Net Assets |
| Transportation | 30.8 |
| Medical | 29.4 |
| Utilities | 14.8 |
| General Obligation | 10.9 |
| Tobacco Settlement | 4.7 |
| Education | 3.7 |
| Housing | 2.7 |
| Industrial Development | 1.3 |
| Other Assets | 1.7 |
| Rating | % of
Market Value1 |
| Aa/AA | 14.8 |
| A | 40.7 |
| Baa/BBB | 43.8 |
| Ba/BB | 0.7 |
| 1 | Includes market value of long-term fixed-income securities only. |
| | | % of |
| Security Name | | Net Assets |
| Texas Private Activity Bond Surface Transportation Corp., 5.000%, 06/30/58 | | 3.3 |
| West Virginia Hospital Finance Authority, Cabell Huntington Hospital Obligation, 5.000%, 01/01/43 | | 2.9 |
| Colorado Health Facilities Authority, Series A, 5.000%, 08/01/44 | | 2.7 |
| Central Plains Energy Project Project #3, Series A, 5.000%, 09/01/42 | | 2.5 |
| Chicago O’Hare International Airport, Senior Lien, Series A, 5.000%, 01/01/48 | | 2.5 |
| Central Texas Regional Mobility Authority, Series B, 5.000%, 01/01/45 | | 2.4 |
| New York Transportation Development Corp., Laguardia Airport Terminal B, 5.000%, 07/01/46 | | 2.3 |
| City of Minneapolis MN, Fairview Health Services, Series A, Revenue, 5.000%, 11/15/49 | | 2.2 |
| Public Authority for Colorado Energy Natural Gas Purchase Revenue, Series 2008, Revenue, 6.500%, 11/15/38 | | 2.1 |
| New Orleans Aviation Board, General Airport North Terminal, Series B, Revenue, 5.000%, 01/01/48 | | 2.1 |
| Top Ten as a Group | | 25.0 |
Credit quality ratings shown above reflect the highest rating assigned by either Standard & Poor’s (“S&P”), Moody’s Investors Service, Inc. (“Moody’s”) or Fitch. These rating agencies are independent, nationally recognized statistical rating organizations and are widely used. Investment grade ratings are credit ratings of BBB/Baa or higher. Below investment grade ratings are credit ratings of BB/Ba or lower. Investments designated N/R are not rated by any of the rating agencies. Unrated investments do not necessarily indicate low credit quality. Credit quality ratings are subject to change.
Because a fund’s strategy may result in multiple investments in particular sectors of the economy, its performance may depend on the performance of those sectors and may fluctuate more widely than investments diversified across more sectors. For additional information on these and other risk considerations, please see the Fund’s prospectus.
Any sectors, industries, or securities discussed should not be perceived as investment recommendations. Mention of a specific security should not be considered a recommendation to buy or solicitation to sell that security. Specific securities mentioned in this report may have been sold from the Fund’s portfolio of investments by the time you receive this report.
AMG GW&K Municipal Enhanced Yield Fund Schedule of Portfolio Investments
December 31, 2020 |
| | Principal | |
| | Amount | Value |
| Municipal Bonds - 98.3% | | |
| Arizona - 0.7% | | |
| Arizona Industrial Development Authority | | |
| 4.000%, 02/01/50 | $2,000,000 | $2,341,760 |
| California - 5.9% | | |
| California Health Facilities Financing Authority | | |
| 4.000%, 04/01/49 | 1,000,000 | 1,146,030 |
| California Municipal Finance Authority, | | |
| Community Medical Centers, Series A | | |
| 5.000%, 02/01/42 | 2,375,000 | 2,778,607 |
| California Municipal Finance Authority, Series I | | |
| 5.000%, 05/15/43 | 3,000,000 | 3,506,520 |
| 5.000%, 05/15/48 | 4,600,000 | 5,344,694 |
| State of California | | |
| 5.000%, 03/01/36 | 5,000,000 | 6,694,550 |
| Total California | | 19,470,401 |
| Colorado - 4.8% | | |
| Colorado Health Facilities Authority, Series A | | |
| 5.000%, 08/01/44 | 7,215,000 | 8,846,888 |
| Public Authority for Colorado Energy Natural Gas | | |
| Purchase Revenue, Series 2008 | | |
| 6.500%, 11/15/38 | 4,355,000 | 6,927,673 |
| Total Colorado | | 15,774,561 |
| Connecticut - 4.5% | | |
| State of Connecticut Special Tax Revenue | | |
| 4.000%, 05/01/39 | 1,000,000 | 1,180,650 |
| 5.000%, 05/01/40 | 1,000,000 | 1,302,630 |
| State of Connecticut Special Tax Revenue, | | |
| Transportation Infrastructure | | |
| 5.000%, 01/01/38 | 5,165,000 | 6,405,272 |
| State of Connecticut, Series E | | |
| 5.000%, 09/15/35 | 2,435,000 | 3,091,013 |
| 5.000%, 09/15/37 | 2,200,000 | 2,777,060 |
| Total Connecticut | | 14,756,625 |
| Florida - 7.0% | | |
| City of Tampa, Series H | | |
| 4.000%, 07/01/45 | 2,775,000 | 3,203,987 |
| 5.000%, 07/01/50 | 2,250,000 | 2,803,230 |
| Escambia County Health Facilities Authority | | |
| 4.000%, 08/15/50 | 5,050,000 | 5,573,837 |
| Hillsborough County Industrial Development | | |
| Authority | | |
| 4.000%, 08/01/50 | 5,000,000 | 5,723,200 |
| Miami Beach Health Facilities Authority Mt. Sinai | | |
| Medical Center | | |
| 5.000%, 11/15/39 | 5,220,000 | 5,794,409 |
| Total Florida | | 23,098,663 |
| | Principal | |
| | Amount | Value |
| Illinois - 9.4% | | |
| Chicago O’Hare International Airport, Senior Lien, Series A | | |
| 5.000%, 01/01/48 | $6,750,000 | $8,068,748 |
| Chicago O’Hare International Airport, Series A | | |
| 4.000%, 01/01/37 | 2,000,000 | 2,355,100 |
| Metropolitan Pier & Exposition Authority | | |
| 5.000%, 06/15/50 | 5,000,000 | 5,791,200 |
| Metropolitan Pier and Exposition Authority | | |
| Revenue, McCormick Place Expansion | | |
| Project, Series B | | |
| 5.000%, 06/15/52 | 6,055,000 | 6,229,505 |
| State of Illinois | | |
| 5.500%, 05/01/39 | 4,000,000 | 4,843,800 |
| 5.750%, 05/01/45 | 3,000,000 | 3,646,650 |
| Total Illinois | | 30,935,003 |
| Louisiana - 3.8% | | |
| Louisiana Public Facilities Authority | | |
| 4.000%, 05/15/49 | 5,000,000 | 5,751,450 |
| New Orleans Aviation Board, General Airport | | |
| North Terminal, Series B | | |
| 5.000%, 01/01/48 | 5,845,000 | 6,777,102 |
| Total Louisiana | | 12,528,552 |
| Maine - 1.2% | | |
| Maine Health & Higher Educational Facilities | | |
| Authority, Series A | | |
| 4.000%, 07/01/45 | 1,500,000 | 1,747,260 |
| 4.000%, 07/01/50 | 2,000,000 | 2,311,420 |
| Total Maine | | 4,058,680 |
| Massachusetts - 0.8% | | |
| Commonwealth of Massachusetts | | |
| 5.000%, 07/01/45 | 2,000,000 | 2,625,840 |
| Minnesota - 3.7% | | |
| City of Minneapolis MN, Fairview Health Services, Series A | | |
| 5.000%, 11/15/49 | 5,910,000 | 7,206,654 |
| Duluth Economic Development Authority, | | |
| Essentia Health Obligated Group | | |
| 5.000%, 02/15/48 | 4,050,000 | 4,813,060 |
| Total Minnesota | | 12,019,714 |
| Nebraska - 2.5% | | |
| Central Plains Energy Project | | |
| Project #3, Series A | | |
| 5.000%, 09/01/42 | 5,560,000 | 8,151,182 |
| New Jersey - 9.1% | | |
| New Jersey Economic Development Authority | | |
| 5.000%, 11/01/44 | 3,000,000 | 3,597,510 |
| New Jersey Economic Development Authority, Series DDD | | |
| 5.000%, 06/15/42 | 5,365,000 | 6,237,564 |
The accompanying notes are an integral part of these financial statements.
AMG GW&K Municipal Enhanced Yield Fund Schedule of Portfolio Investments (continued) |
| | Principal | |
| | Amount | Value |
| New Jersey - 9.1% (continued) | | |
| New Jersey Transportation Trust Fund Authority | | |
| 4.000%, 06/15/45 | $2,000,000 | $2,238,500 |
| 4.000%, 06/15/50 | 2,000,000 | 2,220,800 |
| 5.000%, 06/15/45 | 1,000,000 | 1,218,410 |
| 5.000%, 06/15/50 | 2,000,000 | 2,417,700 |
| New Jersey Transportation Trust Fund Authority, Series BB | | |
| 5.000%, 06/15/44 | 2,000,000 | 2,370,980 |
| Tobacco Settlement Financing Corp. | | |
| Series A | | |
| 5.000%, 06/01/46 | 2,500,000 | 3,002,375 |
| 5.250%, 06/01/46 | 3,285,000 | 4,004,481 |
| Tobacco Settlement Financing Corp. | | |
| Series B | | |
| 5.000%, 06/01/46 | 2,050,000 | 2,394,461 |
| Total New Jersey | | 29,702,781 |
| New York - 17.6% | | |
| City of New York, Series A | | |
| 5.000%, 08/01/45 | 4,405,000 | 5,536,028 |
| City of New York, Series D | | |
| 5.000%, 03/01/43 | 5,235,000 | 6,707,710 |
| Metropolitan Transportation Authority, Series B | | |
| 5.000%, 11/15/29 | 1,115,000 | 1,380,560 |
| Metropolitan Transportation Authority, Series C | | |
| 4.750%, 11/15/45 | 3,025,000 | 3,553,710 |
| 5.000%, 11/15/50 | 2,185,000 | 2,608,147 |
| 5.250%, 11/15/55 | 3,020,000 | 3,686,695 |
| Monroe County Industrial Development Corp., | | |
| Series A | | |
| 4.000%, 07/01/50 | 5,000,000 | 5,914,900 |
| New York State Dormitory Authority, Series A | | |
| 5.000%, 03/15/45 | 4,960,000 | 6,129,320 |
| New York State Thruway Authority, Series B | | |
| 4.000%, 01/01/45 | 5,000,000 | 5,850,400 |
| New York Transportation Development Corp. | | |
| 4.000%, 12/01/39 | 1,700,000 | 2,015,299 |
| 4.000%, 12/01/40 | 2,000,000 | 2,365,880 |
| New York Transportation Development Corp., | | |
| Laguardia Airport Terminal B | | |
| 5.000%, 07/01/46 | 6,820,000 | 7,464,558 |
| Triborough Bridge & Tunnel Authority, Series A | | |
| 5.000%, 11/15/49 | 3,500,000 | 4,524,975 |
| Total New York | | 57,738,182 |
| Oklahoma - 4.3% | | |
| Norman Regional Hospital Authority | | |
| 5.000%, 09/01/45 | 4,335,000 | 5,195,021 |
| Oklahoma Development Finance Authority, | | |
| Health Ou Medicine Project, Series B | | |
| 5.250%, 08/15/48 | 2,975,000 | 3,534,359 |
| 5.500%, 08/15/52 | 4,500,000 | 5,402,340 |
| Total Oklahoma | | 14,131,720 |
| | Principal | |
| | Amount | Value |
| Pennsylvania - 1.3% | | |
| Geisinger Authority, Series G | | |
| 4.000%, 04/01/50 | $3,510,000 | $4,089,712 |
| Rhode Island - 1.8% | | |
| Tobacco Settlement Financing Corp. | | |
| Series A | | |
| 5.000%, 06/01/35 | 2,000,000 | 2,267,140 |
| 5.000%, 06/01/40 | 3,285,000 | 3,613,993 |
| Total Rhode Island | | 5,881,133 |
| South Carolina - 1.3% | | |
| South Carolina Jobs-Economic Development Authority, Series I | | |
| 5.000%, 12/01/46 | 3,325,000 | 4,235,452 |
| Texas - 12.4% | | |
| Central Texas Regional Mobility Authority | | |
| 5.000%, 01/01/46 | 3,750,000 | 4,325,138 |
| Central Texas Regional Mobility Authority, | | |
| Series B | | |
| 5.000%, 01/01/45 | 6,405,000 | 8,044,616 |
| Central Texas Turnpike System, Series C | | |
| 5.000%, 08/15/42 | 2,065,000 | 2,325,582 |
| Texas Private Activity Bond Surface | | |
| Transportation Corp. | | |
| 5.000%, 06/30/58 | 9,180,000 | 11,017,928 |
| Texas Private Activity Bond Surface | | |
| Transportation Corp., Senior Lien-Blueridge Transport | | |
| 5.000%, 12/31/40 | 3,955,000 | 4,423,509 |
| 5.000%, 12/31/45 | 3,880,000 | 4,302,687 |
| Texas Private Activity Bond Surface | | |
| Transportation Corp., Series A | | |
| 4.000%, 12/31/39 | 5,500,000 | 6,407,995 |
| Total Texas | | 40,847,455 |
| Virginia - 2.0% | | |
| Virginia Small Business Financing Authority, Transform 66 P3 Project | | |
| 5.000%, 12/31/49 | 2,500,000 | 2,917,675 |
| 5.000%, 12/31/52 | 3,170,000 | 3,693,367 |
| Total Virginia | | 6,611,042 |
| Washington - 1.3% | | |
| Washington Health Care Facilities Authority | | |
| 4.000%, 09/01/45 | 1,000,000 | 1,160,250 |
| 5.000%, 09/01/45 | 2,465,000 | 3,135,455 |
| Total Washington | | 4,295,705 |
| West Virginia - 2.9% | | |
| West Virginia Hospital Finance Authority, Cabell Huntington Hospital Obligation | | |
| 5.000%, 01/01/43 | 8,000,000 | 9,601,760 |
| Total Municipal Bonds | | |
| (Cost $298,407,906) | | 322,895,923 |
The accompanying notes are an integral part of these financial statements.
AMG GW&K Municipal Enhanced Yield Fund Schedule of Portfolio Investments (continued) |
| | | Value | |
| Total Investments - 98.3% | | | | |
| (Cost $298,407,906) | | | $322,895,923 | |
| Other Assets, less Liabilities - 1.7% | | | 5,687,831 | |
| Net Assets - 100.0% | | | $328,583,754 | |
The following table summarizes the inputs used to value the Fund’s investments by the fair value hierarchy levels as of December 31, 2020:
| | | Level 1 | | Level 2 | | Level 3 | | Total | |
| Investments in Securities | | | | | | | | | |
| Municipal Bonds† | | | — | | $ | 322,895,923 | | | — | | $ | 322,895,923 | |
| Total Investments in Securities | | | — | | $ | 322,895,923 | | | — | | $ | 322,895,923 | |
| † | All municipal bonds held in the Fund are Level 2 securities. For a detailed breakout of municipal bonds by major classification, please refer to the Fund’s Schedule of Portfolio Investments. |
For the fiscal year ended December 31, 2020, there were no transfers in or out of Level 3.
| The accompanying notes are an integral part of these financial statements. |
| |
AMG GW&K Global Allocation Fund Portfolio Manager’s Comments (unaudited) |
THE YEAR IN REVIEW For the year ended December 31, 2020, AMG GW&K Global Allocation Fund (the “Fund”) Class N shares returned 18.92%, compared to the 14.46% return for its blended benchmark which consists of 60% the MSCI All Country World (ACWI) Index and 40% the Bloomberg Barclays Global Aggregate Bond Index. The Fund’s prior benchmark, which consists of 60% the Russell 1000® Index and 40% the Bloomberg Barclays U.S. Aggregate Bond Index, returned 17.19% during the period. Effective April 17, 2020, the Fund’s subadviser changed from Chicago Equity Partners, LLC to GW&K Investment Management, LLC (GW&K). Also effective April 17, 2020, the Fund changed its name from AMG Chicago Equity Partners Balanced Fund and changed its investment objective, benchmark, principal investment strategies, and principal risks. For the year-to-date period through April 17, 2020, prior to the transition, the Fund underperformed its benchmark primarily due to its underweight to fixed income for most of the quarter combined with the underperformance of both the equity and fixed income segments during the very volatile month of March. Following the transition to GW&K, as subadvisor to the Fund, and the transition to a Global Allocation investment mandate, the Fund outperformed its benchmark through the remainder of the year, leading to outperformance for the full year. Since the Fund’s transition in April, the asset allocation framework for the Fund favored equities over fixed income. At the end of December, the equity/fixed income asset allocation stood at 70%/30%. This had a positive impact on the Fund’s relative performance compared to the blended 60% MSCI ACWI/40% Barclays Global Aggregate Bond Index benchmark. The allocation reflects GW&K’s judgment that equities are likely to continue to outperform bonds in coming quarters, extending the trend seen in 2020. The tilt toward equities is based on both quantitative and qualitative judgments. First, relative asset class valuations continue to favor equities, with almost all developed nations’ government bonds offering negative yields in inflation-adjusted terms. Second, GW&K continues to believe that the severe global recession triggered by the coronavirus pandemic ended in May and that the most likely scenario for the global economy is continued recovery for the next several years. Third, we expect most governments to emphasize pro-growth policies | which should be favorable for both corporate earnings and risk assets. The late-December passage of a $900 billion U.S. fiscal support package and prospects for further fiscal support under the new Democratic administration illustrated the pro-growth policy tilt. Fourth-quarter news of highly effective vaccines and the commencement of mass immunization programs in most major nations also support a constructive view of growth prospects for 2021 and beyond. A key valuation metric for global equities is the long-term earnings yield of the MSCI ACWI. That stood at 4.0% at the end of September, and is based on the inverse of the corresponding Shiller PE ratio1 of 24.8 times. By way of comparison, the long-term earnings yield of MSCI ACWI has averaged 5.1% since 2005, corresponding to an average Shiller PE ratio of 19.2 times. Those figures suggest that equities are somewhat expensive relative to their own history. For asset allocation purposes, however, a relevant comparison of the long-term earnings yield is to the real yield of U.S. Treasuries. At the end of December, the yield on 10-Year U.S. Treasury Inflation-Protected Securities (TIPS) stood at -1.1%. The gap between the long-term earnings yield of 4.0% for global equities and -1.1% for TIPS securities suggests the potential for global equities to outperform bonds by about 5.1% per annum over the next five to ten years. In short, we believe investors continue to have strong incentives to favor equities over fixed income, notwithstanding the potential for greater volatility in equities. Key risks would be if the broad-based economic recovery that is evident in global economic data gives way to renewed economic weakness or if government policies were to turn significantly more restrictive. Those risks will be monitored carefully, but we currently view such risks to be low enough to justify a significant tilt toward equities. EQUITY Following a sharp first quarter decline, global equities ended 2020 on a solid note. Vaccine approvals inspired hope that the pandemic will soon be brought under control, while a U.S. bipartisan agreement on a fifth virus relief package and a U.K.-EU Brexit trade deal provided further market support. There was a noted risk-on, pro-cyclical shift in investor sentiment as the year progressed. The U.S. Dollar Index was down 6.7% and several commodities staged a strong rally. While the Fund’s equity sleeve underperformed in the first quarter due to a preference for value over growth, the equity component performed strongly | through the remainder of the year due to strong stock selection across a wide range of sectors and markets. Information technology (IT) was a notable contributor, thanks to ongoing strength in Taiwan Semiconductor Manufacturing Co, Ltd. ADR, which delivered exceptionally strong earnings, and digital payment company Adyen, N.V. Infineon Technologies AG, an auto and industrial power semiconductor developer, was also a top IT contributor. U.S. animal health diagnostics company IDEXX Laboratories, Inc. topped the Fund’s health care outperformance. Goosehead Insurance, Inc. Class A in the U.S. and HDFC Bank, Limited ADR in India were notable contributors in financials. Conversely, real estate detracted, as the Fund’s only position, American Tower Corp, lagged during the fourth quarter risk-on rally. Lack of exposure to materials as metal prices rallied also weighed modestly on results. On a geographic level, the U.S. was the Fund’s top country due to exceptional stock selection, with outsized gains in the above holdings, as well as PayPal Holdings, Inc. and SiteOne Landscaping Supply, Inc. India also performed well, led by online travel platform MakeMyTrip, Ltd. Meanwhile China, a sizable overweight at 18.6% versus 5.8% for the Index, detracted from results due to higher exposure and a pullback in Alibaba, the country’s leading ecommerce company. The expression, or some would say the curse, “may you live in interesting times” certainly applied to 2020. The COVID-19 pandemic surely wreaked havoc with economies around the world, but thanks to an aggressive monetary response, several rounds of fiscal stimulus, and heroic work on vaccine development, stock markets have generally looked through the pandemic in anticipation of a return to growth in 2021 and beyond. While the recent surge in COVID-19 cases has surely slowed progress this winter, especially in the U.S. and Europe, it has not been enough to diminish the optimism. FIXED INCOME The year closed at an important inflection point for fixed income markets, which saw the resolution of several major overhangs: the closely contested election was decided, an additional round of fiscal stimulus was passed, and several COVID-19 vaccines were approved. These developments substantially advanced the recovery narrative and provided additional clarity for the year ahead. Following a flat third quarter, treasuries weakened as the year |
| | | |
| |
| AMG GW&K Global Allocation Fund |
| Portfolio Manager’s Comments (continued) |
closed, with the yield curve extending its post-pandemic steepening. The front end was anchored by U.S Federal Reserve (the “Fed”) policy, while recovery optimism weighed on intermediate and long rates. Corporates capped an extraordinary year by closing the period at record-low yields, buoyed by improving credit fundamentals, a constructive outlook for profitability, and steady flows into the asset class. Mortgages outperformed due to slower prepayment speeds and the Fed’s continued buying of 40% of gross supply. Prior to the Fund’s transition in April, the fixed income sleeve underperformed the Bloomberg Barclays U.S. Aggregate Bond Index due to its overweight allocation to corporate bonds as the market moved towards the safety of U.S. Treasuries. Following the transition, the fixed income sleeve underperformed the Bloomberg Barclays Global Aggregate Index primarily due to currency effect since the dollar weakened and all of the Fund’s holdings are dollar-denominated compared to the | Index which has a substantial non-dollar allocation. Removing the currency effect, the Fund benefited from both favorable top-down sector allocation as well as strong security selection. Our significant overweight exposure to spread product contributed due to modest spread tightening and superior carry. Our security selection within corporates was a positive factor as well. We added value within the investment grade space, as well as through our out-of-benchmark allocation to high yield and preferred securities. Our selection within the mortgage space was also a modest positive. Yield curve positioning was a slight drag on performance due to our being shorter than the benchmark amid a decline in global rates. The fixed income sleeve is positioned to benefit from the ongoing global economic recovery. With respect to yield curve positioning, this means we remain underweight the long end, which we expect to show further weakness as the reflation trade plays out. Instead, we favor intermediate maturities, which are | less sensitive to interest rates and offer attractive total returns through a combination of their carry and roll. From a sector allocation perspective, we favor credit on the recovery narrative, as well as what we expect to be compelling supply/demand technicals, as issuance declines relative to last year at the same time as negative yields elsewhere drive capital to the space. Regionally, 32% of our holdings’ revenue is derived from outside the U.S. to improve portfolio diversification and expand the universe of investment opportunities. 1 Shiller PE ratio is a price to earnings valuation measure that uses cyclically adjusted real earnings per share in the equation This commentary reflects the viewpoints of the portfolio manager, GW&K as of December 31, 2020, is not intended as a forecast or guarantee of future results, and is subject to change without notice. |
| | |
| | |
| | AMG GW&K Global Allocation Fund |
| | Portfolio Manager’s Comments (continued) |
CUMULATIVE TOTAL RETURN PERFORMANCE
AMG GW&K Global Allocation Fund’s cumulative total return is based on the daily change in net asset value (NAV), and assumes that all dividends and distributions were reinvested. The graph compares a hypothetical $10,000 investment made in the AMG GW&K Global Allocation Fund’s Class N shares on December 31, 2010, to a $10,000 investment made in the 60% MSCI ACWI/40% Bloomberg Barclays Global Aggregate Bond Index and 60% Russell 1000® Index/40% Bloomberg Barclays U.S. Aggregate Bond Index for the same time period. The graph and table do not reflect the deduction of taxes that a shareholder would pay on a Fund distribution or redemption of shares. The listed returns for the Fund are net of expenses and the returns for the index exclude expenses. Total returns would have been lower had certain expenses not been reduced.
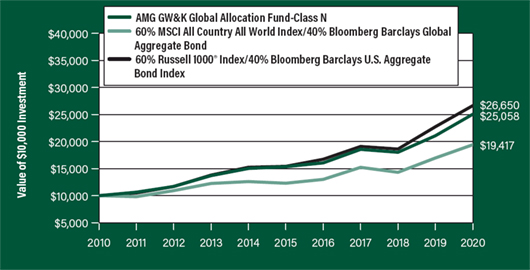
The table below shows the average annual total returns for the AMG GW&K Global Allocation Fund and the 60% MSCI ACWI/40% Bloomberg Barclays Global Aggregate Bond Index and 60% Russell 1000® Index/40% Bloomberg Barclays U.S. Aggregate Bond Index for the same time periods ended December 31, 2020.
| Average Annual Total Returns1 | One
Year | Five
Years | Ten
Years | Since
Inception | Inception
Date |
| AMG GW&K Global Allocation Fund1, 2, 3, 4, 5, 6, 7, 8 | | | | |
| Class N | 18.92% | 10.30% | 9.62% | 8.36% | 01/02/97 |
| Class I | 19.08% | 10.47% | — | 10.02% | 11/30/12 |
| Class Z | 19.28% | 10.57% | 9.90% | 8.73% | 01/02/97 |
| 60% MSCI ACWI/40% Bloomberg Barclays Global Aggregate Bond Index 9 | 14.46% | 9.56% | 6.86% | — | 01/02/97† |
| 60% Russell 1000® Index/40% Bloomberg Barclays U.S. Aggregate Bond Index10 | 17.19% | 11.56% | 10.30% | 8.22% | 01/02/97† |
The performance data shown represents past performance. Past performance is not a guarantee of future results. Current performance may be lower or higher than the performance data quoted. The investment return and principal value of an investment will fluctuate so that an investor’s shares, when redeemed, may be worth more or less than their original cost.
Investors should carefully consider the Fund’s investment objectives, risks, charges and expenses before investing. For performance information through the most recent month end, current net asset values per share for the Fund and other information, please call 800.548.4539 or visit our website at amgfunds.com for a free prospectus. Read it carefully before investing or sending money.
Distributed by AMG Distributors, Inc., member FINRA/SIPC.
| † | Date reflects inception date of the Fund, not the index. |
| 1 | Total return equals income yield plus share price change and assumes reinvestment of all dividends and capital gain distributions. Returns are net of fees and may reflect offsets of Fund expenses as described in the prospectus. No adjustment has been made for taxes payable by shareholders on their reinvested dividends and capital gain distributions. Returns for periods greater than one year are annualized. The listed returns on the Fund are net of expenses and based on the published NAV as of December 31, 2020. All returns are in U.S. dollars ($). |
| 2 | From time to time, the Fund’s advisor has waived its fees and/or absorbed Fund expenses, which has resulted in higher returns. |
| 3 | To the extent that the Fund invests in asset-backed or mortgage-backed securities, its exposure to prepayment and extension risks may be greater than investments in other fixed income securities. |
| 4 | The Fund is subject to the risks associated with investments in debt securities, such as default risk and fluctuations in the perception of the debtor’s ability to pay its creditors. Changing interest rates may adversely affect the value of an investment. An increase in interest rates typically causes the value of bonds and other fixed income securities to fall. |
| 5 | Investments in international securities are subject to certain risks of overseas investing including currency fluctuations and changes in political and economic conditions, which could result in significant market fluctuations. These risks are magnified in emerging markets. |
| 6 | Market prices of investments held by the Fund may fall rapidly or unpredictably due to a variety of economic or political factors, market conditions, disasters or public health issues, or in response to events that affect particular industries or companies. |
| 7 | The Fund invests in value stocks, which may perform differently from the market as a whole and may be undervalued by the market for a long period of time. |
| 8 | The Fund’s investments may not be allocated in the best performing asset classes. |
| 9 | On April 17, 2020 the benchmark changed from 60% Russell 1000® Index & 40% Bloomberg Barclays U.S. Aggregate Bond Index. The benchmark is composed of 60% MSCI ACWI and 40% Bloomberg Barclays Global Aggregate Bond Index. The MSCI All Country World Index (ACWI) is a free-float adjusted market capitalization weighted index that is designed to measure the equity market performance of developed and emerging markets. Please go to msci.com for most current list of countries represented by the Index. The Bloomberg Barclays Global Aggregate Bond Index provides a broad-based measure of the global investment-grade fixed income markets. The three major components of this index are the U.S. Aggregate, the Pan-European Aggregate, and the Asian-Pacific Aggregate Indices. The Index also |
| | |
| | |
| | AMG GW&K Global Allocation Fund |
| | Portfolio Manager’s Comments (continued) |
includes Eurodollar and Euro-Yen corporate bonds, Canadian government, agency and corporate securities, and USD investment grade 144A securities. Unlike the Fund, the indices are unmanaged, is not available for investment and does not incur expenses. 10 The Russell 1000® Index measures the performance of approximately 1,000 of the largest securities based on a combination of their market cap and current index membership. The Russell 1000® represents approximately 92% of the U.S. market. The Bloomberg Barclays U.S. Aggregate Bond Index represents securities that are Securities and Exchange Commission-registered, taxable, and dollar denominated. The index covers the U.S. investment grade fixed rate bond market, with index components for government and corporate securities, mortgage pass-through securities, and asset-backed securities. | | | Unlike the Fund, the indices are unmanaged, is not available for investment and does not incur expenses. Bloomberg Index Services Limited. BLOOMBERG® is a trademark and service mark of Bloomberg Finance L.P. and its affiliates (collectively “Bloomberg”). BARCLAYS® is a trademark and service mark of Barclays Bank Plc (collectively with its affiliates, “Barclays”), used under license. Bloomberg or Bloomberg’s licensors, including Barclays, own all proprietary rights in the Bloomberg Barclays Indices. Neither Bloomberg nor Barclays approves or endorses this material, or guarantees the accuracy or completeness of any information herein, or makes any warranty, express or implied, as to the results to be obtained therefrom and, to the maximum extent | | | allowed by law, neither shall have any liability or responsibility for injury or damages arising in connection therewith. All MSCI data is provided “as is”. The products described here in are not sponsored or endorsed and have not been reviewed or passed on by MSCI. In no event shall MSCI, its affiliates or any MSCI data provider have any liability of any kind in connection with the MSCI data or the products described herein. Copying or redistributing the MSCI data is strictly prohibited. Not FDIC insured, nor bank guaranteed. May lose value. | |
| | | | | | | | |
| | | | | | | | |
| | |
| | AMG GW&K Global Allocation Fund |
| | Fund Snapshots (unaudited) |
| | December 31, 2020 |
PORTFOLIO BREAKDOWN
| Sector | % of
Net Assets |
| Information Technology | 19.5 |
| Industrials | 19.0 |
| Consumer Discretionary | 17.8 |
| Financials | 12.1 |
| U.S. Government and Agency Obligations | 8.2 |
| Health Care | 7.5 |
| Communication Services | 3.6 |
| Utilities | 2.4 |
| Foreign Government Obligations | 2.2 |
| Real Estate | 1.7 |
| Consumer Staples | 1.5 |
| Municipal Bonds | 1.4 |
| Supranational Banks | 0.5 |
| Short-Term Investments | 1.7 |
| Other Assets Less Liabilities | 0.9 |
| Rating | % of Market Value1 |
| U.S. Government and Agency Obligations | 30.7 |
| Aaa/AAA | 2.5 |
| Aa/AA | 10.6 |
| A | 7.9 |
| Baa/BBB | 29.1 |
| Ba/BB | 17.7 |
| B | 1.5 |
| 1 | Includes market value of long-term fixed-income securities only. |
TOP TEN HOLDINGS
| Security Name | | % of
Net Assets |
| Taiwan Semiconductor Manufacturing Co., Ltd. ADR (Taiwan) | | 2.8 |
| Infineon Technologies AG (Germany) | | 2.6 |
| HDFC Bank, Ltd., ADR (India) | | 2.6 |
| Moncler SpA (Italy) | | 2.6 |
| Adyen, N.V. (Netherlands) | | 2.6 |
| MakeMyTrip, Ltd. (India) | | 2.4 |
| PayPal Holdings, Inc. | | 2.2 |
| Mastercard, Inc., Class A | | 2.1 |
| LVMH Moet Hennessy Louis Vuitton SE (France) | | 2.1 |
| Sands China, Ltd. (Macau) | | 2.1 |
| Top Ten as a Group | | 24.1 |
Credit quality ratings shown above reflect the highest rating assigned by either Standard & Poor’s (“S&P”), Moody’s Investors Service, Inc. (“Moody’s”) or Fitch. These rating agencies are independent, nationally recognized statistical rating organizations and are widely used. Investment grade ratings are credit ratings of BBB/Baa or higher. Below investment grade ratings are credit ratings of BB/Ba or lower. Investments designated N/R are not rated by any of the rating agencies. Unrated investments do not necessarily indicate low credit quality. Credit quality ratings are subject to change.
Because a fund’s strategy may result in multiple investments in particular sectors of the economy, its performance may depend on the performance of those sectors and may fluctuate more widely than investments diversified across more sectors. For additional information on these and other risk considerations, please see the Fund’s prospectus.
Any sectors, industries, or securities discussed should not be perceived as investment recommendations. Mention of a specific security should not be considered a recommendation to buy or solicitation to sell that security. Specific securities mentioned in this report may have been sold from the Fund’s portfolio of investments by the time you receive this report.
| | |
| | AMG GW&K Global Allocation Fund |
| | Schedule of Portfolio Investments |
| | December 31, 2020 |
| | Shares | | Value | |
| Common Sto+cks - 70.7% | | | | |
| Communication Services - 3.6% | | | | |
| Alphabet, Inc., Class A* | 1,570 | | $2,751,645 | |
| Tencent Holdings, Ltd. (China) | 38,500 | | 2,770,221 | |
| Total Communication Services | | | 5,521,866 | |
| Consumer Discretionary - 17.8% | | | | |
| Alibaba Group Holding, Ltd. (China)* | 81,500 | | 2,370,389 | |
| Amazon.com, Inc.* | 861 | | 2,804,217 | |
| Huazhu Group, Ltd., ADR (China)1 | 58,580 | | 2,637,857 | |
| LVMH Moet Hennessy Louis Vuitton SE (France) | 5,151 | | 3,224,533 | |
| MakeMyTrip, Ltd. (India)*,1 | 126,581 | | 3,737,937 | |
| Moncler SpA (Italy)* | 64,350 | | 3,956,278 | |
| Sands China, Ltd. (Macau) | 716,400 | | 3,128,805 | |
| TAL Education Group, ADR (China)* | 37,660 | | 2,693,067 | |
| Yum China Holdings, Inc. (China) | 46,400 | | 2,660,201 | |
| Total Consumer Discretionary | | | 27,213,284 | |
| Consumer Staples - 1.5% | | | | |
| Kusuri no Aoki Holdings Co., Ltd. (Japan)1 | 26,400 | | 2,296,012 | |
| Financials - 8.1% | | | | |
| AIA Group, Ltd. (Hong Kong) | 255,800 | | 3,117,210 | |
| CME Group, Inc. | 11,680 | | 2,126,344 | |
| Goosehead Insurance, Inc., Class A1 | 24,895 | | 3,105,900 | |
| HDFC Bank, Ltd., ADR (India)* | 54,940 | | 3,969,965 | |
| Total Financials | | | 12,319,419 | |
| Health Care - 7.5% | | | | |
| IDEXX Laboratories, Inc.* | 6,010 | | 3,004,219 | |
| STERIS PLC | 14,550 | | 2,757,807 | |
| UnitedHealth Group, Inc. | 8,790 | | 3,082,477 | |
| Zoetis, Inc. | 16,180 | | 2,677,790 | |
| Total Health Care | | | 11,522,293 | |
| Industrials - 9.2% | | | | |
| Casella Waste Systems, Inc., Class A* | 44,910 | | 2,782,174 | |
| HEICO Corp., Class A* | 25,860 | | 3,027,172 | |
| MISUMI Group, Inc. (Japan) | 85,900 | | 2,819,868 | |
| Roper Technologies, Inc. | 6,180 | | 2,664,136 | |
| Verisk Analytics, Inc. | 13,720 | | 2,848,135 | |
| Total Industrials | | | 14,141,485 | |
| Information Technology - 19.5% | | | | |
| Adyen, N.V. (Netherlands)*,2 | 1,695 | | 3,938,403 | |
| ANSYS, Inc.* | 7,900 | | 2,874,020 | |
| Black Knight, Inc.* | 29,500 | | 2,606,325 | |
| Halma PLC (United Kingdom) | 80,150 | | 2,684,245 | |
| Infineon Technologies AG (Germany) | 104,590 | | 3,994,148 | |
| | Shares | | Value | |
| Mastercard, Inc., Class A | 9,110 | | $3,251,724 | |
| PayPal Holdings, Inc.* | 14,660 | | 3,433,372 | |
| ServiceNow, Inc.* | 5,217 | | 2,871,593 | |
| Taiwan Semiconductor Manufacturing Co., Ltd. | | | | |
| ADR (Taiwan) | 38,730 | | 4,223,119 | |
| Total Information Technology | | | 29,876,949 | |
| Real Estate - 1.7% | | | | |
| American Tower Corp., REIT | 11,470 | | 2,574,556 | |
| Utilities - 1.8% | | | | |
| NextEra Energy, Inc. | 35,780 | | 2,760,427 | |
| Total Common Stocks | | | | |
| (Cost $73,036,367) | | | 108,226,291 | |
| | | | | |
| | Principal
Amount | | | |
| Corporate Bonds and Notes - 14.9% | | | | |
| Financials - 4.0% | | | | |
| Aircastle, Ltd. (Bermuda) | | | | |
| 5.250%, 08/11/25 | $196,000 | | 216,083 | |
| Ally Financial, Inc. | | | | |
| 8.000%, 11/01/31 | 138,000 | | 202,970 | |
| Bank of America Corp. | | | | |
| Series MM, (4.300% to 01/28/25 then 3 month LIBOR + 2.664%), 4.300%, 01/28/253,4,5 | 165,000 | | 170,331 | |
| Boston Properties, LP | | | | |
| 3.400%, 06/21/29 | 225,000 | | 251,522 | |
| CIT Group, Inc. | | | | |
| 6.125%, 03/09/28 | 183,000 | | 223,454 | |
| Citigroup, Inc. | | | | |
| Series V, (4.700% to 01/30/25 then SOFRRATE + 3.234%), 4.700%, 01/30/253,4,5 | 290,000 | | 298,545 | |
| Fifth Third Bancorp | | | | |
| Series H, (5.100% to 06/30/23 then 3 month LIBOR + 3.033%), 5.100%, 06/30/233,4,5 | 323,000 | | 328,540 | |
| The Goldman Sachs Group, Inc. | | | | |
| Series S, (4.400% to 02/10/25 then U.S. Treasury Yield Curve CMT 5 year + 2.850%), 4.400%, 02/10/251,3,4,5 | 596,000 | | 610,900 | |
| Host Hotels & Resorts LP | | | | |
| Series I, 3.500%, 09/15/30 | 198,000 | | 209,022 | |
| Iron Mountain, Inc. | | | | |
| 4.500%, 02/15/312 | 206,000 | | 216,043 | |
| JPMorgan Chase & Co. | | | | |
| Series HH, (4.600% to 02/01/25 then SOFRRATE + 3.125%), 4.600%, 02/01/253,4,5 | 326,000 | | 337,003 | |
| M&T Bank Corp. | | | | |
| Series G, (5.000% to 08/01/24 then U.S. Treasury Yield Curve CMT 5 year + 3.174%), 5.000%, 08/01/243,4,5 | 536,000 | | 566,820 | |
| Morgan Stanley, GMTN | | | | |
| 4.431%, 01/23/30 | 211,000 | | 256,840 | |
The accompanying notes are an integral part of these financial statements.
| | |
| | |
| | AMG GW&K Global Allocation Fund |
| | Schedule of Portfolio Investments (continued) |
| | Principal
Amount | | Value | |
| Financials - 4.0% (continued) | | | | |
| Northern Trust Corp. | | | | |
| Series D, (4.600% to 10/01/26 then 3 month LIBOR + 3.202%), 4.600%, 10/01/263,4,5 | $270,000 | | $288,900 | |
| The PNC Financial Services Group, Inc. | | | | |
| Series R, (4.850% to 06/01/23 then 3 month LIBOR + 3.040%), 4.850%, 06/01/233,4,5 | 311,000 | | 324,791 | |
| Sprint Capital Corp. | | | | |
| 6.875%, 11/15/28 | 158,000 | | 208,616 | |
| State Street Corp. | | | | |
| Series H, (5.625% to 12/15/23 then 3 month LIBOR + 2.539%), 5.625%, 12/15/231,3,4,5 | 304,000 | | 321,419 | |
| Truist Financial Corp. | | | | |
| Series N, (4.800% to 09/01/24 then U.S. Treasury Yield Curve CMT 5 year + 3.003%), 4.800%, 09/01/243,4,5 | 559,000 | | 590,926 | |
| US Bancorp | | | | |
| Series J, (5.300% to 04/15/27 then 3 month LIBOR + 2.914%), 5.300%, 04/15/273,4,5 | 281,000 | | 316,757 | |
| Visa, Inc. | | | | |
| 4.150%, 12/14/35 | 198,000 | | 257,946 | |
| Total Financials | | | 6,197,428 | |
| Industrials - 9.8% | | | | |
| AECOM | | | | |
| 5.125%, 03/15/27 | 178,000 | | 198,717 | |
| Anheuser-Busch InBev Worldwide, Inc. | | | | |
| 4.375%, 04/15/38 | 215,000 | | 266,544 | |
| Antofagasta PLC (United Kingdom) | | | | |
| 2.375%, 10/14/301,2 | 200,000 | | 201,000 | |
| Aramark Services, Inc. | | | | |
| 4.750%, 06/01/26 | 197,000 | | 203,097 | |
| ArcelorMittal, S.A. (Luxembourg) | | | | |
| 4.550%, 03/11/26 | 183,000 | | 205,705 | |
| AT&T, Inc. | | | | |
| 4.250%, 03/01/27 | 221,000 | | 258,648 | |
| Ball Corp. | | | | |
| 4.875%, 03/15/26 | 178,000 | | 201,348 | |
| Berry Global, Inc. | | | | |
| 1.500%, 01/15/272,6 | 166,000 | | 207,306 | |
| 5.625%, 07/15/272 | 185,000 | | 199,280 | |
| BorgWarner, Inc. | | | | |
| 2.650%, 07/01/271 | 251,000 | | 270,134 | |
| CDW LLC/CDW Finance Corp. | | | | |
| 4.250%, 04/01/28 | 195,000 | | 206,202 | |
| Centene Corp. | | | | |
| 3.375%, 02/15/30 | 194,000 | | 204,409 | |
| CenturyLink, Inc. | | | | |
| 5.625%, 04/01/25 | 189,000 | | 204,238 | |
| Cheniere Corpus Christi Holdings LLC | | | | |
| 5.875%, 03/31/25 | 222,000 | | 258,579 | |
| | Principal
Amount | | Value | |
| Cisco Systems, Inc. | | | | |
| 5.500%, 01/15/40 | $177,000 | | $265,267 | |
| CommonSpirit Health | | | | |
| 3.347%, 10/01/29 | 180,000 | | 198,011 | |
| Crown Americas LLC / Crown | | | | |
| Americas Capital Corp. V | | | | |
| 4.250%, 09/30/26 | 183,000 | | 202,037 | |
| CSC Holdings LLC | | | | |
| 5.250%, 06/01/24 | 191,000 | | 207,097 | |
| CVS Health Corp. | | | | |
| 5.125%, 07/20/45 | 203,000 | | 273,730 | |
| Dell, Inc. | | | | |
| 7.100%, 04/15/281 | 171,000 | | 225,291 | |
| Delta Air Lines, Inc. | | | | |
| 3.800%, 04/19/23 | 216,000 | | 221,902 | |
| Diamondback Energy, Inc. | | | | |
| 3.500%, 12/01/29 | 390,000 | | 417,268 | |
| Elanco Animal Health, Inc. | | | | |
| 5.900%, 08/28/287 | 177,000 | | 209,413 | |
| Energy Transfer Operating LP | | | | |
| 5.250%, 04/15/29 | 237,000 | | 276,896 | |
| Ford Motor Co. | | | | |
| 8.500%, 04/21/23 | 172,000 | | 193,862 | |
| Freeport-McMoRan, Inc. | | | | |
| 4.550%, 11/14/24 | 194,000 | | 212,309 | |
| General Electric Co. | | | | |
| Series D, (5.000% to 01/21/21 then 3 month LIBOR + 3.330%), 5.000%, 03/15/213,4,5 | 435,000 | | 405,202 | |
| General Motors Co. | | | | |
| 6.125%, 10/01/25 | 226,000 | | 274,359 | |
| The George Washington University | | | | |
| Series 2018, 4.126%, 09/15/48 | 149,000 | | 189,190 | |
| Griffon Corp. | | | | |
| 5.750%, 03/01/28 | 190,000 | | 201,162 | |
| HB Fuller Co. | | | | |
| 4.250%, 10/15/28 | 198,000 | | 203,321 | |
| HCA, Inc. | | | | |
| 3.500%, 09/01/30 | 201,000 | | 213,746 | |
| Howmet Aerospace, Inc. | | | | |
| 5.125%, 10/01/24 | 246,000 | | 271,112 | |
| Kaiser Foundation Hospitals | | | | |
| 3.150%, 05/01/27 | 72,000 | | 81,427 | |
| Kraft Heinz Foods Co. | | | | |
| 4.625%, 01/30/29 | 175,000 | | 200,375 | |
| Lamar Media Corp. | | | | |
| 3.750%, 02/15/28 | 224,000 | | 230,625 | |
| Las Vegas Sands Corp. | | | | |
| 3.200%, 08/08/24 | 196,000 | | 207,736 | |
| Lennar Corp. | | | | |
| 4.750%, 05/30/25 | 180,000 | | 205,987 | |
The accompanying notes are an integral part of these financial statements.
| | |
| | |
| | AMG GW&K Global Allocation Fund |
| | Schedule of Portfolio Investments (continued) |
| | Principal
Amount | | Value | |
| Industrials - 9.8% (continued) | | | | |
| Meritor, Inc. | | | | |
| 6.250%, 06/01/252 | $190,000 | | $205,675 | |
| MGM Resorts International | | | | |
| 5.750%, 06/15/25 | 180,000 | | 199,354 | |
| Microsoft Corp. | | | | |
| 2.525%, 06/01/50 | 240,000 | | 253,615 | |
| Murphy Oil USA, Inc. | | | | |
| 5.625%, 05/01/27 | 186,000 | | 197,357 | |
| Nestle Holdings, Inc. | | | | |
| 1.000%, 09/15/272 | 275,000 | | 275,864 | |
| Netflix, Inc. | | | | |
| 3.000%, 06/15/252,6 | 155,000 | | 203,217 | |
| 4.375%, 11/15/26 | 189,000 | | 209,908 | |
| Newell Brands, Inc. | | | | |
| 4.700%, 04/01/267 | 185,000 | | 204,042 | |
| Northrop Grumman Corp. | | | | |
| 3.200%, 02/01/27 | 227,000 | | 255,771 | |
| Nuance Communications, Inc. | | | | |
| 5.625%, 12/15/26 | 189,000 | | 200,339 | |
| Penske Automotive Group, Inc. | | | | |
| 3.500%, 09/01/25 | 191,000 | | 194,342 | |
| Pernod Ricard International Finance LLC | | | | |
| 1.250%, 04/01/282 | 400,000 | | 396,831 | |
| PulteGroup, Inc. | | | | |
| 5.500%, 03/01/26 | 185,000 | | 220,481 | |
| Quebecor Media, Inc. (Canada) | | | | |
| 5.750%, 01/15/23 | 177,000 | | 191,602 | |
| Service Corp. International | | | | |
| 4.625%, 12/15/27 | 193,000 | | 205,907 | |
| Silgan Holdings, Inc. | | | | |
| 4.125%, 02/01/28 | 201,000 | | 209,291 | |
| Smith & Nephew PLC (United Kingdom) | | | | |
| 2.032%, 10/14/30 | 400,000 | | 407,839 | |
| Southwest Airlines Co. | | | | |
| 5.250%, 05/04/25 | 233,000 | | 270,060 | |
| Toll Brothers Finance Corp. | | | | |
| 4.375%, 04/15/23 | 191,000 | | 203,176 | |
| TreeHouse Foods, Inc. | | | | |
| 4.000%, 09/01/28 | 203,000 | | 210,359 | |
| United Rentals North America Inc. | | | | |
| 3.875%, 02/15/31 | 205,000 | | 215,440 | |
| Valvoline, Inc. | | | | |
| 4.375%, 08/15/25 | 203,000 | | 209,754 | |
| VeriSign, Inc. | | | | |
| 5.250%, 04/01/25 | 183,000 | | 208,277 | |
| Verizon Communications, Inc. | | | | |
| 3.875%, 02/08/29 | 218,000 | | 256,961 | |
| Walmart, Inc. | | | | |
| 4.050%, 06/29/48 | 196,000 | | 266,461 | |
| | Principal
Amount | | Value | |
| Wyndham Destinations, Inc. | | | | |
| 5.650%, 04/01/247 | $195,000 | | $211,311 | |
| Wynn Macau, Ltd. (Cayman Islands) | | | | |
| 5.500%, 01/15/262 | 200,000 | | 208,250 | |
| Total Industrials | | | 14,964,016 | |
| Supranational Banks - 0.5% | | | | |
| Inter-American Development Bank | | | | |
| 0.625%, 07/15/25 | 773,000 | | 779,637 | |
| Utilities - 0.6% | | | | |
| Dominion Energy, Inc. | | | | |
| Series B, (4.650% to 12/15/24 then U.S. Treasury Yield Curve CMT 5 year + 2.993%), 4.650%, 12/15/243,4,5 | 587,000 | | 620,481 | |
| Northern States Power Co. | | | | |
| 2.900%, 03/01/50 | 239,000 | | 270,574 | |
| Total Utilities | | | 891,055 | |
| Total Corporate Bonds and Notes | | | | |
| (Cost $21,532,522) | | | 22,832,136 | |
| Municipal Bonds - 1.4% | | | | |
| California State General Obligation, School Improvements | | | | |
| 7.550%, 04/01/39 | 235,000 | | 413,114 | |
| JobsOhio Beverage System | | | | |
| Series B, 4.532%, 01/01/35 | 315,000 | | 404,104 | |
| Los Angeles Unified School District, School Improvements | | | | |
| 5.750%, 07/01/34 | 300,000 | | 423,630 | |
| Metropolitan Transportation Authority | | | | |
| 6.687%, 11/15/40 | 320,000 | | 419,318 | |
| New Jersey Transportation Trust Fund Authority | | | | |
| 5.754%, 12/15/28 | 335,000 | | 398,613 | |
| Total Municipal Bonds | | | | |
| (Cost $1,947,295) | | | 2,058,779 | |
| U.S. Government and Agency Obligations - 8.2% | | | | |
| Fannie Mae - 4.5% | | | | |
| FNMA | | | | |
| 2.500%, 01/01/35 to 02/01/35 | 805,473 | | 850,402 | |
| 3.500%, 02/01/35 to 01/01/48 | 821,832 | | 879,624 | |
| 4.000%, 12/01/21 to 09/01/49 | 1,641,657 | | 1,801,172 | |
| 4.500%, 05/01/47 to 09/01/49 | 2,081,074 | | 2,305,617 | |
| 5.000%, 09/01/33 to 10/01/49 | 853,436 | | 985,389 | |
| 5.500%, 02/01/37 | 8,455 | | 9,930 | |
| Total Fannie Mae | | | 6,832,134 | |
| Freddie Mac - 1.7% | | | | |
| FHLMC Gold Pool | | | | |
| 3.500%, 05/01/44 to 01/01/46 | 1,291,259 | | 1,408,178 | |
| 4.000%, 02/01/44 | 198,440 | | 219,506 | |
| 5.000%, 07/01/38 | 78,321 | | 91,132 | |
The accompanying notes are an integral part of these financial statements.
| | |
| | |
| | AMG GW&K Global Allocation Fund |
| | Schedule of Portfolio Investments (continued) |
| | Principal
Amount | | Value | |
| Freddie Mac - 1.7% (continued) | | | | |
| FHLMC Multifamily Structured Pass Through Certificates | | | | |
| Series K073, 3.350%, 01/01/28 | $821,000 | | $953,431 | |
| Total Freddie Mac | | | 2,672,247 | |
| U.S. Treasury Obligations - 2.0% | | | | |
| U.S. Treasury Bonds | | | | |
| 3.500%, 02/15/39 | 785,000 | | 1,066,220 | |
| 4.500%, 02/15/36 | 729,000 | | 1,070,121 | |
| U.S. Treasury Notes | | | | |
| 1.500%, 02/15/30 | 835,000 | | 883,502 | |
| Total U.S. Treasury Obligations | | | 3,019,843 | |
| Total U.S. Government and Agency Obligations | | | | |
| (Cost $12,500,509) | | | 12,524,224 | |
| Foreign Government Obligations - 2.2% | | | | |
| Abu Dhabi Government International Bond (United Arab Emirates) | | | | |
| 2.500%, 04/16/252 | 350,000 | | 374,532 | |
| China Government International Bond (China) | | | | |
| 1.200%, 10/21/301,2 | 800,000 | | 800,225 | |
| Finland Government International Bond (Finland) | | | | |
| 0.875%, 05/20/302 | 400,000 | | 394,109 | |
| Japan Finance Organization for Municipalities (Japan) | | | | |
| 1.000%, 05/21/25 | 732,000 | | 742,525 | |
| Kingdom of Belgium Government International Bond (Belgium) | | | | |
| 1.000%, 05/28/302 | 200,000 | | 198,411 | |
| The Korea Development Bank (South Korea) | | | | |
| 0.500%, 10/27/23 | 269,000 | | 270,009 | |
| Philippine Government International Bond (Philippines) | | | | |
| 1.648%, 06/10/31 | 200,000 | | 203,000 | |
| | Principal
Amount | | Value | |
| Province of Ontario Canada (Canada) | | | | |
| 1.050%, 05/21/27 | $205,000 | | $207,622 | |
| Province of Quebec Canada (Canada) | | | | |
| 1.350%, 05/28/301 | 205,000 | | 207,988 | |
| Total Foreign Government Obligations | | | | |
| (Cost $3,371,374) | | | 3,398,421 | |
| Short-Term Investments - 1.7% | | | | |
| Joint Repurchase Agreements - 1.7%8 | | | | |
| Citigroup Global Markets, Inc., dated 12/31/20, due 01/04/21, 0.070% total to be received $1,000,008 (collateralized by various U.S. Government Agency Obligations and U.S. Treasuries, 0.000% - 4.000%, 09/15/21 - 01/01/51, totaling $1,020,000) | 1,000,000 | | 1,000,000 | |
| Daiwa Capital Markets America, dated 12/31/20, due 01/04/21, 0.070% total to be received $576,549 (collateralized by various U.S. Government Agency Obligations and U.S. Treasuries, 0.000% - 6.500%, 01/26/21 - 01/01/51, totaling $588,076) | 576,545 | | 576,545 | |
| RBC Dominion Securities, Inc., dated 12/31/20, due 01/04/21, 0.080% total to be received $1,000,009 (collateralized by various U.S. Government Agency Obligations and U.S. Treasuries, 0.000% - 6.000%, 01/05/21 - 12/20/50, totaling $1,020,000) | 1,000,000 | | 1,000,000 | |
| Total Joint Repurchase Agreements | | | 2,576,545 | |
| Total Short-Term Investments | | | | |
| (Cost $2,576,545) | | | 2,576,545 | |
| Total Investments - 99.1% | | | | |
| (Cost $114,964,612) | | | 151,616,396 | |
| Other Assets, less Liabilities - 0.9% | | | 1,399,839 | |
| Net Assets - 100.0% | | | $153,016,235 | |
| * | Non-income producing security. |
| 1 | Some of these securities, amounting to $8,270,264 or 5.4% of net assets, were out on loan to various borrowers and are collateralized by cash and various U.S. Treasury Obligations. See Note 4 of Notes to Financial Statements. |
| 2 | Security exempt from registration under Rule 144A of the Securities Act of 1933. This security may be resold in transactions exempt from registration, normally to qualified institutional buyers. At December 31, 2020, the value of these securities amounted to $7,819,146 or 5.1% of net assets. |
| 3 | Fixed to variable rate investment. The rate shown reflects the fixed rate in effect at December 31, 2020. Rate will reset at a future date. |
| 4 | Perpetuity Bond. The date shown represents the next call date. |
| 5 | Variable rate security. The rate shown is based on the latest available information as of December 31, 2020. Certain variable rate securities are not based on a published reference rate and spread but are determined by the issuer or agent and are based on current market conditions. These securities do not indicate a reference rate and spread in their description above. |
| 6 | Principal amount stated in EURO dollars. |
| 7 | Step Bond: A debt instrument with either deferred interest payments or an interest rate that resets at specific times during its term. |
| 8 | Cash collateral received for securities lending activity was invested in these joint repurchase agreements. |
| ADR | American Depositary Receipt |
| CMT | Constant Maturity Treasury |
| FHLMC | Freddie Mac |
| FNMA | Fannie Mae |
| GMTN | Global Medium-Term Notes |
| LIBOR | London Interbank Offered Rate |
| REIT | Real Estate Investment Trust |
| SOFRRATE | Secured Overnight Financing Rate |
The accompanying notes are an integral part of these financial statements.
| |
AMG GW&K Global Allocation Fund
Schedule of Portfolio Investments (continued) |
The following table summarizes the inputs used to value the Fund’s investments by the fair value hierarchy levels as of December 31, 2020:
| | | | Level 1 | | | Level 21 | | | Level 3 | | | Total | |
| Investments in Securities | | | | | | | | | | | | | |
| Common Stocks | | | | | | | | | | | | | |
| Information Technology | | | $19,260,153 | | | $10,616,796 | | | — | | | $29,876,949 | |
| Consumer Discretionary | | | 11,873,078 | | | 15,340,206 | | | — | | | 27,213,284 | |
| Industrials | | | 11,321,617 | | | 2,819,868 | | | — | | | 14,141,485 | |
| Financials | | | 9,202,209 | | | 3,117,210 | | | — | | | 12,319,419 | |
| Health Care | | | 11,522,293 | | | — | | | — | | | 11,522,293 | |
| Communication Services | | | 2,751,645 | | | 2,770,221 | | | — | | | 5,521,866 | |
| Utilities | | | 2,760,427 | | | — | | | — | | | 2,760,427 | |
| Real Estate | | | 2,574,556 | | | — | | | — | | | 2,574,556 | |
| Consumer Staples | | | — | | | 2,296,012 | | | — | | | 2,296,012 | |
| Corporate Bonds and Notes† | | | — | | | 22,832,136 | | | — | | | 22,832,136 | |
| Municipal Bonds† | | | — | | | 2,058,779 | | | — | | | 2,058,779 | |
| U.S. Government and Agency Obligations† | | | — | | | 12,524,224 | | | — | | | 12,524,224 | |
| Foreign Government Obligations | | | — | | | 3,398,421 | | | — | | | 3,398,421 | |
| Short-Term Investments | | | | | | | | | | | | | |
| Joint Repurchase Agreements | | | — | | | 2,576,545 | | | — | | | 2,576,545 | |
| Total Investments in Securities | | | $71,265,978 | | | $80,350,418 | | | — | | | $151,616,396 | |
| † | All corporate bonds and notes, municipal bonds, and U.S. government and agency obligations held in the Fund are Level 2 securities. For a detailed breakout of corporate bonds and notes, municipal bonds, and U.S. government and agency obligations by major industry or agency classification, please refer to the Fund’s Schedule of Portfolio Investments. |
| 1 | An external pricing service is used to reflect any impact on security value due to market movements between the time the Fund valued such foreign securities and the earlier closing of foreign markets. |
For the fiscal year ended December 31, 2020, there were no transfers in or out of Level 3.
The country allocation in the Schedule of Portfolio Investments at December 31, 2020, was as follows:
| Country | % of Long-Term
Investments |
| Belgium | 0.1 | |
| Bermuda | 0.1 | |
| Canada | 0.4 | |
| Cayman Islands | 0.1 | |
| China | 9.4 | |
| Finland | 0.3 | |
| France | 2.2 | |
| Germany | 2.7 | |
| Hong Kong | 2.1 | |
| India | 5.2 | |
| Italy | 2.7 | |
| Japan | 3.9 | |
| Country | % of Long-Term
Investments |
| Luxembourg | 0.1 | |
| Macau | 2.1 | |
| Netherlands | 2.6 | |
| Philippines | 0.1 | |
| South Korea | 0.2 | |
| Taiwan | 2.8 | |
| United Arab Emirates | 0.3 | |
| United Kingdom | 2.2 | |
| United States | 60.4 | |
| | 100.0 | |
The accompanying notes are an integral part of these financial statements.
| |
AMG GW&K Small Cap Core Fund |
| | Portfolio Manager’s Comments (unaudited) |
THE YEAR IN REVIEW For the year ended December 31, 2020, AMG GW&K Small Cap Core Fund’s (the “Fund”) Class N shares returned 17.73%, compared to the Russell 2000® Index, which returned 19.96%. We are all familiar with the proverb “a watched pot never boils.” But what happens if we take that pot, cover it, and turn the heat up to high? As heat and pressure build inside the pot, the lid might start to rattle and shift. Eventually, steam and other contents start to force their way out around the edges of the lid as it clatters more erratically. Finally, depending on the contents inside the pot, we might end up with quite a mess if the heat is not turned down or the lid is not removed to let the pressure escape. As U.S. small cap investors, it feels a bit as if we are living through this kitchen experiment right now. The U.S. Federal Reserve (the “Fed”) and other global central banks are attempting to keep economies moving and markets lubricated during a terrible global pandemic. Rock bottom interest rates, expanding central bank balance sheets, and other conditions have supplied the heat to keep markets functioning and the economy from stalling. Through the end of 2020, these policy actions, along with fiscal stimulus throughout 2020, seemed to have imperfectly accomplished these objectives. Enough heat had been applied to the pot. With the addition of very positive vaccine news and the push to add further fiscal stimulus into 2021, suddenly more heat was added to the experiment and the lid on the pot began to rattle. The Russell 2000® Index produced a sharp fourth quarter burst of 31.4%, its best quarter ever, and finished the year up 19.96%. While the magnitude of the move is impressive, the type of stocks that have outperformed is more interesting. The additional heat applied in the fourth quarter created ideal conditions for speculation. There is much in the way of evidence for this speculative environment. In periods when investors crave risk, the Wall Street machine always rises to the occasion. Innovation in both technology and finance will race to help fulfill this desire for greater risk. Three areas that combined to help fan this speculative flame included: 1) low barrier trading platforms, 2) special purpose acquisition corporations (“SPACs”), and 3) narrowly targeted thematic investments. There is obviously nothing inherently wrong with any of these three investment products, but each has the capacity to enable and embolden irrational exuberance under the right conditions. The Robinhood trading platform, while allowing easy and free trading for investing | newcomers, is alleged to encourage continuous and repeated engagement in trading and approve customers for option activity far in excess of their qualifications and resources. SPACs have perhaps in the past been unfairly stigmatized as a pathway to public markets given the lower scrutiny levels they receive and the characters often attracted to less due diligence. This year the market for SPACs set records, and several have been moonshots, some of which ended up back on earth. Nikola is a noteworthy example, perhaps propelled in part by the greater democratization of trading with platforms like Robinhood. The example of Nikola leads to the final category of speculation: narrowly focused thematic investing. There is nothing as exciting as chasing a glowing theme, be it electrification, alternative energy, genomics, bitcoin, or more broadly, “innovation.” These themes all have tremendous merit and long-term opportunity for companies and investors. However, they will take time to commercialize with many flops and misses along the way. Just as in the internet dawn of the late 1990s, successful investment companies have come along to help investors participate with narrowly targeted vehicles. Many have produced amazing returns in 2020. The money arriving late to the party will likely meaningfully underperform the market as these trends are sorted out in the real world. We see evidence in these three areas of the lid on our pot bouncing from heat and pressure. For the year, style performance was very much tilted toward Growth. The Russell 2000® Growth finished up 34.3% compared to only 4.6% return in the Russell 2000® Value Index. Value oriented sectors showed very little of the excitement driving the overall market. Energy finished down -37.0%, real estate -5.4%, utilities -4.9%, and financials -3.7%. Meanwhile, secular growth areas like health care (+46.1%) and information technology (+38.4%) led small caps during the year. Health care technology (+123.2%), life sciences tools/services (+114.7%), biotechnology (+51.9%), and software (+57.3%) were some of the strongest industries that drove this return. However, this trend softened somewhat in the last several months of the year. Consumer discretionary (+32.7%) was another winner on the year, recovering dramatically from a disastrous first quarter when it declined -44.3%. 2020 was a year where growth was the new safety trade and also performed quite well in the recovery. Looking at factor analysis for the year, non-earners were up 44.6% and accounted for 81.4% of the performance of the Russell 2000® Index, while accounting for only 28.4% of all benchmark stocks. | Of the remaining stocks with earnings, those that reside in the bottom 60% of valuation levels actually produced a negative average contribution to return for the year. Negative equity stocks finished up 32.8% and the lowest return of equity (“ROE”) quintile was up 48.6% on the year. Combined, these groups were nearly 79% of the benchmark performance. High beta (+36.7%) outperformed while low earnings variation (+0.2%) lagged meaningfully. Finally, Index stocks without a five-year earnings track record returned 46.7%. To sum up, investors were mostly interested in companies without earnings in this speculative year. Small cap stocks with earnings and modest valuations, as well as those in the middle of the ROE barbell, did not participate in the rally. Examining relative performance requires looking at cash allocation, factor and sector analysis to get the full picture of how the Fund returned 17.73% but still underperformed the benchmark. Our cash exposure averaged just 2.1% during the year, but this still amounted to a meaningful performance drag. Switching to factor allocation, the Fund was decidedly out of balance with the investor preferences described above during the year. Our exposure to stocks with characteristics such as higher than average cap, lower beta, positive earnings, higher than average returns, and less volatile earnings histories relative to the Index cost us approximately 310 basis points of performance when averaged together. Taking our factor allocation out, stock selection was broadly very positive. Shifting to sector attribution, we saw positive contribution from financials, information technology, and real estate during the year. Financials helped performance due to strong stock selection in the banking industry (Glacier Bancorp, Pacific Premier Bancorp, Seacoast Banking Corporation of Florida), a lack of exposure to mortgage real estate investment trusts (REITs), and good performance from capital markets names (Houlihan Lokey, Stifel Financial, Cohen & Steers). Information technology contributed to performance by besting the Index in software due to both allocation and selection (HubSpot, Paylocity, Rapid7, Cerence) as well as in semiconductors (Macom Technology Solutions, Entegris). In real estate, the Fund benefited from an underweight position and strong performance from QTS Realty Trust, Inc. (QTS). On the flip side, we lost ground in industrials, health care, consumer staples, and energy. The industrials sector presents a good representation of our trouble spots, with problems in selection stemming from both owned stocks and lack of exposure to hot segments. The electrical equipment industry within |
| |
AMG GW&K Small Cap Core Fund
Portfolio Manager’s Comments (continued) |
| the sector was up 173.9% on the year, generating 123 basis points of return for the benchmark based on alternative energy plays that exhibited stupendous performance. We owned nothing in the industry. Meanwhile, we also sold AAR Corp (AIR) after a pandemic induced collapse in the airline industry they serve, which hurt relative performance. While the funds were reinvested elsewhere, the mark on the sector cannot be reversed. ICF International (ICFI) and Heartland Express (HTLD) also underperformed. We underperformed in health care, mostly as a result to our underexposure to biotechnology. In consumer staples, our largest position Performance Food Group (PFGC) was hurt by the pandemic shutdown of food away from home venues and dropped 7.5%. In addition, we did not have exposure to the beverage industry, which jumped 90.0%. Finally, the energy sector also hurt relative performance, primarily due to the ill-timed sale of Matador Resources (MTDR) near the bottom of the energy sector’s rollercoaster performance. | Looking forward into 2021 and beyond, we see both strong fundamentals as well as risks to watch. Similar to the covered pot on the stove, it remains to be seen how the experiment will end. We believe the strong end to the year represents the excellent forward prospects investors see for the economy as we emerge from the pandemic in 2021. Consumer net worth is hitting records, inventories are too low, and spending in many parts of the economy (outside of masks and heat lamps) is poised to accelerate. The fundamental strength is naturally augmented by forthcoming fiscal stimulus. The strong fundamentals and wall of liquidity have also encouraged some investors to increase speculative behavior in several areas of the market where long-term opportunity is high but near-term earnings support is non-existent. Will the Fed lift the cover off the pot or lower the heat as the economy accelerates to limit the negative impact of speculative bubbles forming? We acknowledge there are holes we are digging as a country that impact our longer-term growth | prospects, as debt climbs and political will appears to be faltering. Finally, markets appear to be assuming best outcomes for vaccine uptake and performance. However, we are very grateful that markets are looking forward to better times. Capital markets would be on the floor convulsing if they were looking backward at 2020. Thankfully, we leave the past year behind. Given the good forward economic and earnings prospects we see, low inflation and interest rates, and current valuations, we believe the U.S. small cap asset class has attractive capital appreciation potential over our 3–5 year time horizon. This commentary reflects the viewpoints of the portfolio manager, GW&K Investment Management, LLC, and is not intended as a forecast or guarantee of future results. |
| |
AMG GW&K Small Cap Core Fund
Portfolio Manager’s Comments (continued) |
CUMULATIVE TOTAL RETURN PERFORMANCE
AMG GW&K Small Cap Core Fund’s cumulative total return is based on the daily change in net asset value (NAV), and assumes that all dividends and distributions were reinvested. The graph compares a hypothetical $10,000 investment made in the AMG GW&K Small Cap Core Fund’s Class N shares on December 31, 2010, to a $10,000 investment made in the Russell 2000® Index for the same time period. The graph and table do not reflect the deduction of taxes that a shareholder would pay on a Fund distribution or redemption of shares. The listed returns for the Fund are net of expenses and the returns for the index exclude expenses. Total returns would have been lower had certain expenses not been reduced.
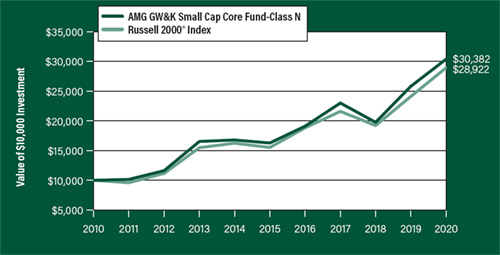
The table below shows the average annual total returns for the AMG GW&K Small Cap Core Fund and the Russell 2000® Index for the same time periods ended December 31, 2020.
| Average Annual Total Returns1 | One
Year | Five
Years | Ten
Years | Since
Inception | Inception
Date |
| AMG GW&K Small Cap Core Fund2, 3, 4, 5, 6 | | | | | |
| Class N | 17.73% | 13.31% | 11.75% | 8.74% | 12/10/96 |
| Class I | 18.16% | 13.72% | 12.20% | 14.45% | 07/27/09 |
| Class Z | 18.21% | — | — | 11.80% | 02/24/17 |
| Russell 2000® Index7 | 19.96% | 13.26% | 11.20% | 8.75% | 12/10/96† |
The performance data shown represents past performance. Past performance is not a guarantee of future results. Current performance may be lower or higher than the performance data quoted. The investment return and principal value of an investment will fluctuate so that an investor’s shares, when redeemed, may be worth more or less than their original cost.
Investors should carefully consider the Fund’s investment objectives, risks, charges and expenses before investing. For performance information through the most recent month end, current net asset values per share for the Fund and other information, please call 800.548.4539 or visit our website at amgfunds.com for a free prospectus. Read it carefully before investing or sending money.
Distributed by AMG Distributors, Inc., member FINRA/SIPC.
| † | Date reflects the inception date of the Fund, not the index. |
| 1 | Total return equals income yield plus share price change and assumes reinvestment of all dividends and capital gain distributions. Returns are net of fees and may reflect offsets of Fund expenses as described in the prospectus. No adjustment has been made for taxes payable by shareholders on their reinvested dividends and |
| capital gain distributions. Returns for periods greater than one year are annualized. The listed returns on the Fund are net of expenses and based on the published NAV as of December 31, 2020. All returns are in U.S. dollars ($). |
| 2 | From time to time, the Fund’s advisor has waived its fees and/or absorbed Fund expenses, which has resulted in higher returns. |
| 3 | Market prices of investments held by the Fund may fall rapidly or unpredictably due to a variety of economic or political factors, market conditions, disasters or public health issues, or in response to events that affect particular industries or companies. |
| 4 | The Fund invests in growth stocks, which may be more sensitive to market movements because their prices tend to reflect future investor expectations rather than just current profits. Growth stocks may underperform value stocks given periods. |
| 5 | The Fund is subject to risks associated with investments in small-capitalization companies, such as erratic earnings patterns, competitive conditions, limited earnings history, and a reliance on one or a limited number of products. |
| 6 | The Fund invests in value stocks, which may perform differently from the market as a whole and may be undervalued by the market for a long period of time. |
| 7 | The Russell 2000® Index is composed of the 2,000 smallest stocks in the Russell 3000® Index and is widely regarded in the industry as the premier measure of small-cap stock performance. Unlike the Fund, the Russell 2000® Index is unmanaged, is not available for investment and does not incur expenses. |
The Russell Indices are trademarks of the London Stock Exchange Group companies.
Not FDIC insured, nor bank guaranteed. May lose value.
| | AMG GW&K Small Cap Core Fund
Fund Snapshots (unaudited)
December 31, 2020 |
PORTFOLIO BREAKDOWN
| | % of |
| Sector | Net Assets |
| Health Care | 22.0 |
| Information Technology | 15.6 |
| Consumer Discretionary | 15.5 |
| Financials | 14.3 |
| Industrials | 14.1 |
| Real Estate | 5.4 |
| Materials | 5.3 |
| Consumer Staples | 3.2 |
| Utilities | 2.3 |
| Energy | 0.8 |
| Short-Term Investments | 0.1 |
| Other Assets Less Liabilities | 1.4 |
TOP TEN HOLDINGS
| | % of |
| Security Name | Net Assets |
| Lithia Motors, Inc., Class A | 2.2 |
| Texas Roadhouse, Inc. | 2.0 |
| Avient Corp. | 1.8 |
| Endava PLC, ADR (United Kingdom) | 1.8 |
| MACOM Technology Solutions Holdings, Inc. | 1.7 |
| Ritchie Bros. Auctioneers, Inc. (Canada) | 1.7 |
| Performance Food Group Co. | 1.7 |
| Grand Canyon Education, Inc. | 1.7 |
| Stifel Financial Corp. | 1.7 |
| Globus Medical, Inc., Class A | 1.7 |
| Top Ten as a Group | | 18.0 |
Because a fund’s strategy may result in multiple investments in particular sectors of the economy, its performance may depend on the performance of those sectors and may fluctuate more widely than investments diversified across more sectors. For additional information on these and other risk considerations, please see the Fund’s prospectus.
Any sectors, industries, or securities discussed should not be perceived as investment recommendations. Mention of a specific security should not be considered a recommendation to buy or solicitation to sell that security. Specific securities mentioned in this report may have been sold from the Fund’s portfolio of investments by the time you receive this report.
| | AMG GW&K Small Cap Core Fund |
| | Schedule of Portfolio Investments |
| | December 31, 2020 |
| | | Shares | | Value | |
| Common Stocks - 98.5% | | | | | | | |
| Consumer Discretionary - 15.5% | | | | | | | |
| Boot Barn Holdings, Inc.*,1 | | | 114,808 | | | $4,978,075 | |
| Churchill Downs, Inc. | | | 31,794 | | | 6,193,153 | |
| Chuy’s Holdings, Inc.* | | | 108,170 | | | 2,865,423 | |
| Five Below, Inc.* | | | 40,650 | | | 7,112,937 | |
| Grand Canyon Education, Inc.* | | | 109,419 | | | 10,188,003 | |
| Helen of Troy, Ltd.* | | | 24,827 | | | 5,516,311 | |
| Lithia Motors, Inc., Class A1 | | | 44,748 | | | 13,096,397 | |
| Ollie’s Bargain Outlet Holdings, Inc.*,1 | | | 69,380 | | | 5,673,203 | |
| Oxford Industries, Inc. | | | 66,832 | | | 4,378,164 | |
| Patrick Industries, Inc.1 | | | 130,375 | | | 8,911,131 | |
| Skyline Champion Corp.* | | | 282,443 | | | 8,738,787 | |
| Texas Roadhouse, Inc.* | | | 152,747 | | | 11,938,706 | |
| Wolverine World Wide, Inc. | | | 138,945 | | | 4,342,031 | |
| Total Consumer Discretionary | | | | | | 93,932,321 | |
| Consumer Staples - 3.2% | | | | | | | |
| Central Garden & Pet Co.* | | | 41,644 | | | 1,607,875 | |
| Central Garden & Pet Co., Class A* | | | 202,677 | | | 7,363,255 | |
| Performance Food Group Co.* | | | 214,867 | | | 10,229,818 | |
| Total Consumer Staples | | | | | | 19,200,948 | |
| Energy - 0.8% | | | | | | | |
| WPX Energy, Inc.* | | | 610,500 | | | 4,975,575 | |
| Financials - 14.3% | | | | | | | |
| Ameris Bancorp | | | 220,439 | | | 8,392,113 | |
| AMERISAFE, Inc. | | | 97,230 | | | 5,583,919 | |
| Cathay General Bancorp | | | 215,790 | | | 6,946,280 | |
| Cohen & Steers, Inc. | | | 106,584 | | | 7,919,191 | |
| Glacier Bancorp, Inc. | | | 192,591 | | | 8,861,112 | |
| Horace Mann Educators Corp. | | | 187,381 | | | 7,877,497 | |
| Houlihan Lokey, Inc. | | | 105,882 | | | 7,118,447 | |
| Meridian Bancorp, Inc. | | | 213,583 | | | 3,184,523 | |
| OceanFirst Financial Corp.* | | | 205,718 | | | 3,832,526 | |
| Pacific Premier Bancorp, Inc.* | | | 244,018 | | | 7,645,084 | |
| Seacoast Banking Corp. of Florida* | | | 303,581 | | | 8,940,460 | |
| Stifel Financial Corp. | | | 201,826 | | | 10,184,140 | |
| Total Financials | | | | | | 86,485,292 | |
| Health Care - 22.0% | | | | | | | |
| AtriCure, Inc.* | | | 151,199 | | | 8,417,248 | |
| Castle Biosciences, Inc.* | | | 49,015 | | | 3,291,357 | |
| Covetrus, Inc.* | | | 308,694 | | | 8,871,866 | |
| CryoLife, Inc.* | | | 247,317 | | | 5,839,154 | |
| CryoPort, Inc.*,1 | | | 114,763 | | | 5,035,801 | |
| | | Shares | | Value | |
| Emergent BioSolutions, Inc.* | | | 96,827 | | | $8,675,699 | |
| Globus Medical, Inc., Class A* | | | 156,149 | | | 10,184,038 | |
| Haemonetics Corp.* | | | 50,145 | | | 5,954,719 | |
| Halozyme Therapeutics, Inc.*,1 | | | 136,400 | | | 5,825,644 | |
| HealthEquity, Inc.* | | | 112,315 | | | 7,829,479 | |
| ICU Medical, Inc.* | | | 19,521 | | | 4,187,059 | |
| Integra LifeSciences Holdings Corp.* | | | 109,446 | | | 7,105,234 | |
| LHC Group, Inc.* | | | 33,685 | | | 7,185,684 | |
| Medpace Holdings, Inc.* | | | 54,197 | | | 7,544,222 | |
| Phreesia, Inc.* | | | 157,052 | | | 8,521,642 | |
| Progyny, Inc.* | | | 155,375 | | | 6,586,346 | |
| Supernus Pharmaceuticals, Inc.* | | | 205,276 | | | 5,164,744 | |
| Syneos Health, Inc.* | | | 148,428 | | | 10,112,400 | |
| Veracyte, Inc.*,1 | | | 141,807 | | | 6,940,035 | |
| Total Health Care | | | | | | 133,272,371 | |
| Industrials - 14.1% | | | | | | | |
| Alamo Group, Inc. | | | 53,675 | | | 7,404,466 | |
| Allegiant Travel Co. | | | 36,280 | | | 6,865,627 | |
| Heartland Express, Inc. | | | 262,262 | | | 4,746,942 | |
| Helios Technologies, Inc. | | | 143,425 | | | 7,643,118 | |
| ICF International, Inc. | | | 83,978 | | | 6,242,085 | |
| Primoris Services Corp.* | | | 259,353 | | | 7,160,736 | |
| RBC Bearings, Inc.* | | | 50,215 | | | 8,990,494 | |
| Ritchie Bros. Auctioneers, Inc. (Canada) | | | 149,150 | | | 10,373,383 | |
| The Shyft Group, Inc. | | | 99,222 | | | 2,815,920 | |
| SiteOne Landscape Supply, Inc.*,1 | | | 32,109 | | | 5,093,451 | |
| UFP Industries, Inc. | | | 164,198 | | | 9,121,199 | |
| US Ecology, Inc. | | | 114,721 | | | 4,167,814 | |
| WillScot Mobile Mini Holdings Corp.* | | | 190,470 | | | 4,413,190 | |
| Total Industrials | | | | | | 85,038,425 | |
| Information Technology - 15.6% | | | | | | | |
| Brooks Automation, Inc. | | | 81,119 | | | 5,503,924 | |
| CACI International, Inc., Class A* | | | 21,395 | | | 5,334,415 | |
| Cerence, Inc.*,1 | | | 51,256 | | | 5,150,203 | |
| The Descartes Systems Group, Inc. (Canada)* | | | 69,334 | | | 4,054,652 | |
| Endava PLC, ADR (United Kingdom)* | | | 144,104 | | | 11,059,982 | |
| MACOM Technology Solutions Holdings, Inc.* | | | 191,298 | | | 10,529,042 | |
| Novanta, Inc.* | | | 62,480 | | | 7,386,386 | |
| Paylocity Holding Corp.* | | | 48,677 | | | 10,023,081 | |
| Proofpoint, Inc.* | | | 41,269 | | | 5,629,504 | |
| Rapid7, Inc.*,1 | | | 109,776 | | | 9,897,404 | |
| Rogers Corp.* | | | 19,660 | | | 3,053,001 | |
| Silicon Laboratories, Inc.* | | | 75,331 | | | 9,592,650 | |
| The accompanying notes are an integral part of these financial statements. |
| | |
| | AMG GW&K Small Cap Core Fund |
| | Schedule of Portfolio Investments (continued) |
| | | Shares | | Value | |
| Information Technology - 15.6% | | | | | | | |
| (continued) | | | | | | | |
| Viavi Solutions, Inc.* | | | 496,100 | | | $7,429,098 | |
| Total Information Technology | | | | | | 94,643,342 | |
| Materials - 5.3% | | | | | | | |
| Avient Corp. | | | 275,245 | | | 11,086,869 | |
| Balchem Corp. | | | 60,886 | | | 7,015,285 | |
| Compass Minerals International, Inc.1 | | | 67,036 | | | 4,137,462 | |
| Minerals Technologies, Inc. | | | 94,993 | | | 5,900,965 | |
| Silgan Holdings, Inc. | | | 98,462 | | | 3,650,971 | |
| Total Materials | | | | | | 31,791,552 | |
| Real Estate - 5.4% | | | | | | | |
| Agree Realty Corp., REIT 1 | | | 72,777 | | | 4,845,493 | |
| National Health Investors, Inc., REIT | | | 89,355 | | | 6,180,685 | |
| QTS Realty Trust, Inc., Class A, REIT 1 | | | 123,362 | | | 7,633,641 | |
| Ryman Hospitality Properties, Inc., REIT | | | 59,887 | | | 4,057,943 | |
| STAG Industrial, Inc., REIT | | | 315,813 | | | 9,891,263 | |
| Total Real Estate | | | | | | 32,609,025 | |
| Utilities - 2.3% | | | | | | | |
| IDACORP, Inc. | | | 67,471 | | | 6,479,240 | |
| * | Non-income producing security. |
| 1 | Some of these securities, amounting to $58,647,390 or 9.7% of net assets, were out on loan to various borrowers and are collateralized by cash and various U.S. Treasury Obligations. See Note 4 of Notes to Financial Statements. |
| 2 | Cash collateral received for securities lending activity was invested in these joint repurchase agreements. |
| | | Shares | | Value | |
| NorthWestern Corp. | | | 126,604 | | | $7,382,279 | |
| Total Utilities | | | | | | 13,861,519 | |
| Total Common Stocks | | | | | | | |
| (Cost $425,780,546) | | | | | | 595,810,370 | |
| | | | | | | | |
| | | | Principal | | | | |
| | | | Amount | | | | |
| Short-Term Investments - 0.1% | | | | | | | |
| Joint Repurchase Agreements - 0.1%2 | | | | | | | |
| Citigroup Global Markets, Inc., dated 12/31/20, due 01/04/21, 0.070% total to be received$674,286 (collateralized by various U.S. Government Agency Obligations and U.S. Treasuries, 0.000% - 4.000%, 09/15/21 -01/01/51, totaling $687,767) | | | $674,281 | | | 674,281 | |
| Total Short-Term Investments | | | | | | | |
| (Cost $674,281) | | | | | | 674,281 | |
| Total Investments - 98.6% | | | | | | | |
| (Cost $426,454,827) | | | | | | 596,484,651 | |
| Other Assets, less Liabilities - 1.4% | | | | | | 8,403,853 | |
| Net Assets - 100.0% | | | | | | $604,888,504 | |
ADR American Depositary Receipt
REIT Real Estate Investment Trust
The following table summarizes the inputs used to value the Fund’s investments by the fair value hierarchy levels as of December 31, 2020:
| | | Level 1 | | Level 2 | | Level 3 | | Total |
| Investments in Securities | | | | | | | | |
| Common Stocks† | | $595,810,370 | | — | | — | | $595,810,370 |
| Short-Term Investments | | | | | | | | |
| Joint Repurchase Agreements | | — | | $674,281 | | — | | 674,281 |
| Total Investments in Securities | | $595,810,370 | | $674,281 | | — | | $596,484,651 |
| † | All common stocks held in the Fund are Level 1 securities. For a detailed breakout of common stocks by major industry classification, please refer to the Fund’s Schedule of Portfolio Investments. |
For the fiscal year ended December 31, 2020, there were no transfers in or out of Level 3.
| The accompanying notes are an integral part of these financial statements. |
| | |
| | AMG GW&K Small/Mid Cap Fund |
| | Portfolio Manager’s Comments (unaudited) |
REVIEW For the year ended December 31, 2020, AMG GW&K Small/Mid Cap Fund’s (the “Fund”) Class I shares returned 23.31%, compared to the Russell 2500® Index, which returned 19.99%. We are all familiar with the proverb “a watched pot never boils.” But what happens if we take that pot, cover it, and turn the heat up to high? As heat and pressure build inside the pot, the lid might start to rattle and shift. Eventually, steam and other contents start to force their way out around the edges of the lid as it clatters more erratically. Finally, depending on the contents inside the pot, we might end up with quite a mess if the heat is not turned down or the lid is not removed to let the pressure escape. As U.S. small/mid cap investors, it feels a bit as if we are living through this kitchen experiment right now. The U.S. Federal Reserve (the “Fed”) and other global central banks, are attempting to keep economies moving and markets lubricated during a terrible global pandemic. Rock bottom interest rates, expanding central bank balance sheets, and other conditions have supplied the heat to keep markets functioning and the economy from stalling. Through the end of 2020, these policy actions, along with fiscal stimulus throughout 2020, seemed to have imperfectly accomplished these objectives. Enough heat had been applied to the pot. With the addition of very positive vaccine news in the fourth quarter and the push to add further fiscal stimulus into 2021, suddenly more heat was added to the experiment and the lid on the pot began to rattle. The Russell 2500® Index produced a sharp fourth quarter burst of 27.4%, its best quarter ever, and finished the year up 20.0%. While the magnitude of the move is impressive, the type of stocks that have outperformed is more interesting. There is much in the way of evidence for this speculative environment. In periods when investors crave risk, the Wall Street machine always rises to the occasion. Innovation in both technology and finance will race to help fulfill this desire for greater risk. Three areas that combined to help fan this speculative flame included: 1) low barrier trading platforms, 2) special purpose acquisition corporations (SPACs), and 3) narrowly targeted thematic investments. There is obviously nothing inherently wrong with any of these three investment products, but each has the capacity to enable and embolden irrational exuberance under the right conditions. The Robinhood trading platform, while allowing easy and free trading for investing newcomers, is alleged to encourage continuous and | repeated engagement in trading and approve customers for option activity far in excess of their qualifications and resources. SPACs have perhaps in the past been unfairly stigmatized as a pathway to public markets given the lower scrutiny levels they receive and the characters often attracted to less due diligence. This year the market for SPACs set records, and several have been moonshots, some of which ended up back on earth. Nikola is a noteworthy example, perhaps propelled in part by the greater democratization of trading with platforms like Robinhood. The example of Nikola leads to the final category of speculation: narrowly focused thematic investing. There is nothing as exciting as chasing a glowing theme, be it electrification, alternative energy, genomics, bitcoin, or more broadly, “innovation.” These themes all have tremendous merit and long-term opportunity for companies and investors. However, they will take time to commercialize with many flops and misses along the way. Just as in the internet dawn of the late 1990s, successful investment companies have come along to help investors participate with narrowly targeted vehicles. Many have produced amazing returns in 2020. The money arriving late to the party will likely meaningfully underperform the market as these trends are sorted out in the real world. We see evidence in these three areas of the lid on our pot bouncing from heat and pressure. For the year, style performance was very much tilted toward Growth. The Russell 2500® Growth finished up 40.1% compared to only 4.8% return in the Russell 2500® Value Index. Value oriented sectors showed very little of the excitement driving the overall market. Energy finished down (-39.0%), real estate (-8.7%), utilities (-4.9%), and financials (-2.1%). Meanwhile, secular growth areas like health care and information technology were up 49.2% and 52.1%, respectively, which led small and mid caps during the year. Health care technology was up 135.8%, life sciences tools/services (+58.0%), biotechnology (+52.0%), as well as software (+72.8%) and semiconductors (+74.1%) in technology were some of the strongest industries that drove this return. However, this trend softened somewhat in the last several months of the year as Value areas of the market found their footing. Consumer discretionary (+26.5%) was another winner on the year, recovering dramatically from a disastrous first quarter when it declined (-40.9%). As we discussed in past communications, 2020 was a year where growth was the new safety trade and also performed quite well in the recovery. Looking at factor analysis for the year, non-earners were up 49.2% and accounted for 72.0% of the Russell 2500 Index performance. Of the benchmark | stocks with earnings (77.2% of the Index), those that reside in the bottom 60% of valuation levels actually produced a negative average contribution to return for the year. Negative equity stocks finished up 38.4% and the lowest Return on Equity (“ROE”) quintile was up 45.3% on the year. Combined, these groups were nearly 75% of the benchmark performance. High beta (+31.9%) outperformed low beta (+10.7%) dramatically. Finally, Index stocks without a five-year earnings track record returned 59.8%. To sum up, investors were mostly interested in companies without earnings in this speculative year. Small/mid cap stocks with earnings and modest valuations, as well as those in the middle of the ROE barbell, did not participate in the rally. Examining relative performance requires looking at cash allocation, factor and sector analysis to get the full picture of how the Fund returned 23% and outperformed in an environment which would seem to have been challenging. Our cash exposure averaged just 1.9% during the year, but this still amounted to a meaningful drag. Switching to factor allocation, the Fund was decidedly out of balance with the investor preferences described above during the year. Our exposure to stocks with characteristics such as higher than average cap, lower beta, positive earnings, higher than average returns, and less volatile earnings histories relative to the Index cost us approximately 290 basis points of performance when averaged together. Combining these negative allocation factors would mean that stock selection in the Fund was sharply positive during the year, far beyond our actual outperformance. Shifting to sector attribution, we saw positive contribution from financials, real estate, information technology, consumer staples, industrials, and materials during the year. Financials outperformed due to strong stock selection in the capital markets industry (MarketAxess Holdings, Artisan Partners), selection and allocation in insurance (Kinsale Capital Group, underweight), and a lack of exposure to poorly performing mortgage REITs. In real estate, the Fund benefited from an underweight position, good performance from CoreSite Realty Corp. (COR), and not owning some of the large detractors in the benchmark. Information technology outperformed the Index in electronic equipment with Zebra Technologies Corp, Class A (ZBRA) and Cognex Corp. (CGNX). Cerence, Inc. (CRNC), Hubspot (HUBS), and EPAM systems (EPAM) also contributed. Consumer staples added to performance on the strength of BJ |
| | |
| | AMG GW&K Small/Mid Cap Fund |
| | Portfolio Manager’s Comments (continued) |
Wholesale Club, Inc. (BJ +63.9%). The industrials sector got a boost from our holdings of Richie Brothers Auctioneers, Inc. (RBA), Gibraltar Industries, Inc. (ROCK), and Exponent, Inc. (EXPO). And finally, good stock selection in materials with Quaker Chemical Corp. (KWR) and RPM International, Inc. (RPM) helped relative returns. On the flip side, we lost ground in health care and consumer discretionary. In health care, stock selection and an underweight allocation to biotechnology hurt relative performance (Neurocrine Biosciences -10.8%). The consumer discretionary sector was hurt by the sale of BJ Restaurants (BJRI) near the bottom of the market in March. While the funds were reinvested elsewhere, the impact remains. Cavco Industries, Inc. (CVCO), Polaris, Inc. (PII), and Carter’s, Inc. (CRI) were other laggards that held back performance in this sector for 2020. | Looking forward into 2021 and beyond, we see both strong fundamentals as well as risks to watch. Similar to the covered pot on the stove, it remains to be seen how the experiment will end. We believe the just completed very strong fourth quarter represents the excellent forward prospects investors see for the economy as we emerge from the pandemic in 2021. Consumer net worth is hitting records, inventories are too low, and spending in many parts of the economy (outside of masks and heat lamps) is poised to accelerate. The fundamental strength is naturally augmented by forthcoming fiscal stimulus. The strong fundamentals and wall of liquidity have also encouraged some investors to increase speculative behavior in several areas of the market where long-term opportunity is high but near-term earnings support is non-existent. Will the Fed lift the cover off the pot or lower the heat as the economy accelerates to limit the negative impact of speculative bubbles forming? We acknowledge there | are holes we are digging as a country that impact our longer-term growth prospects, as debt climbs and political will appears to be faltering. Finally, markets appear to be assuming best outcomes for vaccine uptake and performance. However, we are very grateful that markets are looking forward to better times. Capital markets would be on the floor convulsing if they were looking backward at 2020. Thankfully, we leave the past year behind. Given the good forward economic and earnings prospects we see, low inflation and interest rates, and current valuations, we believe the U.S. small/mid cap asset class has attractive capital appreciation potential over our 3–5 year time horizon. The commentary reflects the viewpoints of the portfolio manager, GW&K Investment Management, LLC, and is not intended as a forecast or guarantee of future results. |
| |
| AMG GW&K Small/Mid Cap Fund |
| Portfolio Manager’s Comments (continued) |
CUMULATIVE TOTAL RETURN PERFORMANCE
AMG GW&K Small/Mid Cap Fund’s cumulative total return is based on the daily change in net asset value (NAV), and assumes that all dividends and distributions were reinvested. The graph compares a hypothetical $10,000 investment made in the AMG GW&K Small/Mid Cap Fund’s Class I shares on June 30, 2015, to a $10,000 investment made in the Russell 2500® Index for the same time period. The graph and table do not reflect the deduction of taxes that a shareholder would pay on a Fund distribution or redemption of shares. The listed returns for the Fund are net of expenses and the returns for the index exclude expenses. Total returns would have been lower had certain expenses not been reduced.

The table below shows the average annual total returns for the AMG GW&K Small/Mid Cap Fund and the Russell 2500® Index for the same time periods ended December 31, 2020.
| Average Annual Total Returns1 | | One
Year | | | Five
Years | | | Since
Inception | | | Inception
Date | |
| AMG GW&K Small/Mid Cap Fund2, 3, 4, 5, 6, 7 | | | | | | | | | | | | |
| Class N | | 23.10 | % | | — | | | 13.19 | % | | 02/24/17 | |
| Class I | | 23.31 | % | | 13.41% | | | 9.85 | % | | 06/30/15 | |
| Class Z | | 23.37 | % | | — | | | 13.45 | % | | 02/24/17 | |
| Russell 2500® Index8 | | 19.99 | % | | 13.64% | | | 10.76 | % | | 06/30/15 | † |
| |
The performance data shown represents past performance. Past performance is not a guarantee of future results. Current performance may be lower or higher than the performance data quoted. The investment return and principal value of an investment will fluctuate so that an investor’s shares, when redeemed, may be worth more or less than their original cost. |
| Investors should carefully consider the Fund’s investment objectives, risks, charges and expenses before investing. For performance information through the most recent month end, current net asset values per share for the Fund and other information, please call 800.548.4539 or visit our website at amgfunds.com for a free prospectus. Read it carefully before investing or sending money. |
Distributed by AMG Distributors, Inc., member FINRA/SIPC.
| † | Date reflects the inception date of the Fund, not the index |
| | |
| 1 | Total return equals income yield plus share price change and assumes reinvestment of all dividends and capital gain distributions. Returns are net of fees and may reflect offsets of Fund expenses as described in the prospectus. No adjustment has been made for taxes payable by shareholders on their reinvested dividends and |
| | |
| | capital gain distributions. Returns for periods greater than one year are annualized. The listed returns on the Fund are net of expenses and based on the published NAV as of December 31, 2020. All returns are in U.S. dollars ($). |
| | |
| 2 | From time to time, the Fund’s advisor has waived its fees and/or absorbed Fund expenses, which has resulted in higher returns. |
| | |
| 3 | The Fund is subject to risks associated with investments in small-capitalization companies, such as erratic earnings patterns, competitive conditions, limited earnings history, and a reliance on one or a limited number of products. |
| | |
| 4 | The Fund is subject to risks associated with investments in mid-capitalization companies such as greater price volatility, lower trading volume, and less liquidity than the stocks of larger, more established companies. |
| | |
| 5 | The Fund invests in growth stocks, which may be more sensitive to market movements because their prices tend to reflect future investor expectations rather than just current profits. Growth stocks may underperform value stocks during given periods. |
| | |
| 6 | The Fund invests in value stocks, which may perform differently from the market as a whole and may be undervalued by the market for a long period of time. |
| | |
| 7 | Market prices of investments held by the Fund may fall rapidly or unpredictably due to a variety of economic or political factors, market conditions, disasters or public health issues, or in response to events that affect particular industries or companies. |
| | |
| 8 | The Russell 2500® Index is composed of the 2,500 smallest stocks in the Russell 3000® Index and is widely regarded in the industry as the premier measure of small/mid cap stock performance. Unlike the Fund, the Russell 2500® Index is unmanaged, is not available for investment and does not incur expenses. |
| |
| The Russell Indices are trademarks of the London Stock Exchange Group companies. |
| |
| Not FDIC insured, nor bank guaranteed. May lose value. |
| AMG GW&K Small/Mid Cap Fund |
| Fund Snapshots (unaudited) |
| December 31, 2020 |
| PORTFOLIO BREAKDOWN |
| | | | |
| Sector | | % of
Net Assets | |
| Information Technology | | 18.7 | |
| Industrials | | 15.8 | |
| Health Care | | 15.8 | |
| Consumer Discretionary | | 13.4 | |
| Financials | | 13.1 | |
| Real Estate | | 7.3 | |
| Materials | | 6.8 | |
| Consumer Staples | | 3.3 | |
| Utilities | | 2.5 | |
| Energy | | 1.4 | |
| Other Assets Less Liabilities | | 1.9 | |
| TOP TEN HOLDINGS |
| | | | |
| Security Name | | % of
Net Assets | |
| HubSpot, Inc. | | 2.4 | |
| Zebra Technologies Corp., Class A | | 2.3 | |
| Lithia Motors, Inc., Class A | | 2.0 | |
| Exponent, Inc. | | 1.9 | |
| Catalent, Inc. | | 1.9 | |
| Cerence, Inc. | | 1.9 | |
| Gibraltar Industries, Inc. | | 1.8 | |
| RPM International, Inc. | | 1.8 | |
| Ingersoll Rand, Inc. | | 1.8 | |
| Acadia Healthcare Co., Inc. | | 1.7 | |
| Top Ten as a Group | | 19.5 | |
Because a fund’s strategy may result in multiple investments in particular sectors of the economy, its performance may depend on the performance of those sectors and may fluctuate more widely than investments diversified across more sectors. For additional information on these and other risk considerations, please see the Fund’s prospectus.
Any sectors, industries, or securities discussed should not be perceived as investment recommendations. Mention of a specific security should not be considered a recommendation to buy or solicitation to sell that security. Specific securities mentioned in this report may have been sold from the Fund’s portfolio of investments by the time you receive this report.
AMG GW&K Small/Mid Cap Fund |
| Schedule of Portfolio Investments |
| December 31, 2020 |
| | | Shares | | | Value | |
| Common Stocks - 98.1% | | | | | | |
| Consumer Discretionary - 13.4% | | | | | | |
| Bright Horizons Family Solutions, Inc.* | | 16,030 | | | $2,773,030 | |
| Burlington Stores, Inc.* | | 14,688 | | | 3,841,646 | |
| Carter’s, Inc.* | | 23,580 | | | 2,218,171 | |
| Cavco Industries, Inc.* | | 16,232 | | | 2,847,904 | |
| Dorman Products, Inc.* | | 34,955 | | | 3,034,793 | |
| Five Below, Inc.* | | 19,194 | | | 3,358,566 | |
| Grand Canyon Education, Inc.* | | 18,804 | | | 1,750,841 | |
| Lithia Motors, Inc., Class A1 | | 18,348 | | | 5,369,909 | |
| Polaris, Inc.* | | 28,097 | | | 2,677,082 | |
| Pool Corp.* | | 7,222 | | | 2,690,195 | |
| Texas Roadhouse, Inc.* | | 47,006 | | | 3,673,989 | |
| Vail Resorts, Inc.1 | | 7,550 | | | 2,106,148 | |
| Total Consumer Discretionary | | | | | 36,342,274 | |
| Consumer Staples - 3.3% | | | | | | |
| BJ’s Wholesale Club Holdings, Inc.* | | 102,102 | | | 3,806,362 | |
| Lancaster Colony Corp. | | 18,038 | | | 3,314,122 | |
| Performance Food Group Co.* | | 39,583 | | | 1,884,547 | |
| Total Consumer Staples | | | | | 9,005,031 | |
| Energy - 1.4% | | | | | | |
| Dril-Quip, Inc.* | | 23,341 | | | 691,360 | |
| Parsley Energy, Inc., Class A* | | 227,930 | | | 3,236,606 | |
| Total Energy | | | | | 3,927,966 | |
| Financials - 13.1% | | | | | | |
| Artisan Partners Asset Management, Inc., Class A | | 31,511 | | | 1,586,264 | |
| Atlantic Union Bankshares Corp. | | 55,379 | | | 1,824,184 | |
| Glacier Bancorp, Inc. | | 46,794 | | | 2,152,992 | |
| Kemper Corp.* | | 33,608 | | | 2,582,103 | |
| Kinsale Capital Group, Inc.* | | 13,273 | | | 2,656,325 | |
| MarketAxess Holdings, Inc. | | 5,633 | | | 3,213,964 | |
| Pinnacle Financial Partners, Inc. | | 58,154 | | | 3,745,117 | |
| Piper Sandler Cos | | 27,804 | | | 2,805,424 | |
| Signature Bank | | 27,182 | | | 3,677,453 | |
| TCF Financial Corp. | | 83,234 | | | 3,081,323 | |
| Voya Financial, Inc.1 | | 63,775 | | | 3,750,608 | |
| Western Alliance Bancorp. | | 74,177 | | | 4,446,911 | |
| Total Financials | | | | | 35,522,668 | |
| Health Care - 15.8% | | | | | | |
| Acadia Healthcare Co., Inc.* | | 94,123 | | | 4,730,622 | |
| Bio-Rad Laboratories, Inc., Class A* | | 8,004 | | | 4,665,852 | |
| Catalent, Inc.* | | 48,565 | | | 5,054,159 | |
| Chemed Corp. | | 4,835 | | | 2,575,169 | |
| | | Shares | | | Value | |
| Globus Medical, Inc., Class A* | | 42,935 | | | $2,800,221 | |
| Horizon Therapeutics PLC* | | 46,885 | | | 3,429,638 | |
| Integer Holdings Corp.* | | 27,275 | | | 2,214,457 | |
| Jazz Pharmaceuticals PLC (Ireland)* | | 19,673 | | | 3,247,029 | |
| Molina Healthcare, Inc.* | | 14,238 | | | 3,028,138 | |
| Neurocrine Biosciences, Inc.* | | 32,400 | | | 3,105,540 | |
| STERIS PLC | | 18,797 | | | 3,562,783 | |
| Syneos Health, Inc.* | | 62,667 | | | 4,269,503 | |
| Total Health Care | | | | | 42,683,111 | |
| Industrials - 15.8% | | | | | | |
| Exponent, Inc. | | 58,293 | | | 5,248,119 | |
| Federal Signal Corp. | | 85,445 | | | 2,834,211 | |
| Gibraltar Industries, Inc.* | | 69,066 | | | 4,968,608 | |
| Graco, Inc. | | 45,191 | | | 3,269,569 | |
| Hexcel Corp.1 | | 52,538 | | | 2,547,568 | |
| Ingersoll Rand, Inc.* | | 104,839 | | | 4,776,465 | |
| Nordson Corp. | | 20,883 | | | 4,196,439 | |
| RBC Bearings, Inc.* | | 24,140 | | | 4,322,025 | |
| Ritchie Bros. Auctioneers, Inc. (Canada) | | 65,964 | | | 4,587,796 | |
| Schneider National, Inc., Class B | | 77,682 | | | 1,608,017 | |
| The Toro Co. | | 46,143 | | | 4,376,202 | |
| Total Industrials | | | | | 42,735,019 | |
| Information Technology - 18.7% | | | | | | |
| Booz Allen Hamilton Holding Corp. | | 48,391 | | | 4,218,727 | |
| Cerence, Inc.*,1 | | 50,228 | | | 5,046,909 | |
| Cognex Corp. | | 44,019 | | | 3,534,065 | |
| Entegris, Inc. | | 46,750 | | | 4,492,675 | |
| Envestnet, Inc.* | | 26,620 | | | 2,190,560 | |
| EPAM Systems, Inc.* | | 11,313 | | | 4,054,014 | |
| Gartner, Inc.* | | 22,636 | | | 3,626,061 | |
| HubSpot, Inc.* | | 16,525 | | | 6,551,171 | |
| Power Integrations, Inc. | | 28,646 | | | 2,344,962 | |
| Rapid7, Inc.*,1 | | 51,345 | | | 4,629,265 | |
| Silicon Laboratories, Inc.* | | 28,941 | | | 3,685,347 | |
| Zebra Technologies Corp., Class A* | | 16,143 | | | 6,204,239 | |
| Total Information Technology | | | | | 50,577,995 | |
| Materials - 6.8% | | | | | | |
| AptarGroup, Inc. | | 25,804 | | | 3,532,310 | |
| Eagle Materials, Inc. | | 30,006 | | | 3,041,108 | |
| Element Solutions, Inc. | | 160,906 | | | 2,852,864 | |
| Quaker Chemical Corp.*,1 | | 16,862 | | | 4,272,662 | |
| RPM International, Inc. | | 52,808 | | | 4,793,910 | |
| Total Materials | | | | | 18,492,854 | |
The accompanying notes are an integral part of these financial statements.
| |
| AMG GW&K Small/Mid Cap Fund |
| Schedule of Portfolio Investments (continued) |
| | | Shares | | | Value | |
| Real Estate - 7.3% | | | | | | |
| American Campus Communities, Inc., REIT | | 55,616 | | | $2,378,696 | |
| CoreSite Realty Corp., REIT | | 18,976 | | | 2,377,313 | |
| Easterly Government Properties, Inc., REIT | | 149,156 | | | 3,378,384 | |
| Hudson Pacific Properties, Inc., REIT | | 97,178 | | | 2,334,216 | |
| Physicians Realty Trust, REIT | | 159,271 | | | 2,835,024 | |
| Summit Hotel Properties, Inc., REIT * | | 223,731 | | | 2,015,816 | |
| Sun Communities, Inc., REIT | | 28,423 | | | 4,318,875 | |
| Total Real Estate | | | | | 19,638,324 | |
| Utilities - 2.5% | | | | | | |
| IDACORP, Inc. | | 33,635 | | | 3,229,969 | |
| | | | | | | |
| * | Non-income producing security. |
| 1 | Some of these securities, amounting to $16,713,653 or 6.2% of net assets, were out on loan to various borrowers and are collateralized by various U.S. Treasury Obligations. See Note 4 of Notes to Financial Statements. |
| | | | Shares | | | Value | |
| OGE Energy Corp. | | | 32,864 | | | $1,047,047 | |
| Portland General Electric Co. | | | 56,355 | | | 2,410,303 | |
| Total Utilities | | | | | | 6,687,319 | |
| Total Common Stocks | | | | | | | |
| (Cost $193,513,818) | | | | | | 265,612,561 | |
| Total Investments - 98.1% | | | | | | | |
| (Cost $193,513,818) | | | | | | 265,612,561 | |
| Other Assets, less Liabilities - 1.9% | | | | | | 5,156,733 | |
| Net Assets - 100.0% | | | | | | $270,769,294 | |
REIT Real Estate Investment Trust
The following table summarizes the inputs used to value the Fund’s investments by the fair value hierarchy levels as of December 31, 2020:
| | | | Level 1 | | Level 2 | | Level 3 | | | Total | |
| Investments in Securities | | | | | | | | | | | |
| Common Stocks† | | | $265,612,561 | | — | | — | | | $265,612,561 | |
| Total Investments in Securities | | | $265,612,561 | | — | | — | | | $265,612,561 | |
| † | All common stocks held in the Fund are Level 1 securities. For a detailed breakout of common stocks by major industry classification, please refer to the Fund’s Schedule of Portfolio Investments. |
For the fiscal year ended December 31, 2020, there were no transfers in or out of Level 3.
The accompanying notes are an integral part of these financial statements.
| |
| AMG GW&K Small Cap Value Fund |
| Portfolio Manager’s Comments (unaudited) |
| | | |
For the fiscal year ended December 31, 2020, AMG Managers GW&K Small Cap Value Fund’s (the “Fund”) Class N shares returned 3.29%, compared to a 4.63% return for the Russell 2000 Value® Index. Effective December 4, 2020, the Fund’s subadviser changed from Skyline Asset Management, L.P. (“Skyline”) to GW&K Investment Management, LLC (“GW&K”). Also effective December 4, 2020, the Fund changed its name to AMG GW&K Small Cap Value Fund, from AMG Managers Skyline Special Equities Fund and changed its investment objective, principal investment strategies, and principal risks INVESTMENT STRATEGY GW&K believes quality small cap companies trading at low valuation levels offer attractive opportunities for stock price appreciation over time. Given the tendency of money managers to focus on short-term fundamentals and stock price performance, we believe that a company’s underlying value is often overlooked and not recognized by the market. Through our fundamental research process and proprietary screening, we seek to identify well-managed, undervalued companies with improving fundamental and financial characteristics. It is our objective to provide shareholders with a fully diversified portfolio of small cap value stocks that participate in rising markets and protects returns when markets decline. We seek to outperform the Russell 2000® Value Index and our small cap value competitors over a full market cycle. PERFORMANCE After a steep decline in the first quarter due to market volatility associated with the COVID-19 pandemic, the Fund rebounded with positive | performance in the following three quarters and ended the fiscal year with a small positive return. However, the Fund modestly underperformed its benchmark during the period. The Fund’s negative relative performance was primarily driven by stock selection, while sector allocation was a positive. An overweight and strong stock selection in the industrials sector was the top contributor to relative performance. The Fund had notable contributions from TPI Composites Inc. (+138%) and BMC Stock Holdings Inc. (+66%) in the industrials sector. The Fund also benefited from an underweight and strong stock selection in financials. Lack of exposure to the energy sector was also beneficial. On the other side of the ledger, an overweight in information technology helped performance, but was more than offset by weak stock selection in the sector. The Fund’s 5% return within information technology lagged the 27% return for the benchmark and was the top detractor from relative performance. Notable detractors in the sector included Benchmark Electronics (-20%) and Knowles Corp. (-15%). In similar fashion, the Fund’s overweight to the materials sector was beneficial, but the Fund’s -5% return lagged the 20% return for the benchmark. An underweight and weak stock selection in consumer discretionary as well as weak stock selection in the health care sector were other notable detractors. OUTLOOK Looking forward into 2021 and beyond, we see both strong fundamentals as well as risks to watch. We believe the just completed very strong fourth quarter represents the excellent forward prospects investors see for the economy as we emerge from the pandemic in 2021. Consumer net worth is hitting records, inventories are too low, and spending in | many parts of the economy (outside of masks and heat lamps) are poised to accelerate. The fundamental strength is naturally augmented by forthcoming fiscal stimulus. The strong fundamentals and wall of liquidity have also encouraged some investors to increase speculative behavior in several areas of the market where long-term opportunity is high but near-term earnings support is nonexistent. Will the U.S. Federal Reserve (the Fed) effectively manage monetary policy as the economy accelerates to limit the negative impact of speculative bubbles forming? We acknowledge there are holes we are digging as a country that impact our longer-term growth prospects, as debt climbs and political will appears to be faltering. Finally, markets appear to be assuming best outcomes for vaccine uptake and performance. However, we are very grateful that markets are looking forward to better times. Capital markets would be on the floor convulsing if they were looking backward at 2020. Thankfully, we leave the past year behind. Given the good forward economic and earnings prospects we see, low inflation and interest rates, and current valuations, we believe the U.S. small cap asset class has attractive capital appreciation potential over our 3–5 year time horizon. This commentary reflects results from Skyline and GW&K, and the viewpoints represent those of the current portfolio manager, GW&K, are not intended as a forecast or guarantee of future results, and are subject to change without notice. |
| | | |
| |
AMG GW&K Small Cap Value Fund
Portfolio Manager’s Comments (continued) |
| |
| |
CUMULATIVE TOTAL RETURN PERFORMANCE
AMG GW&K Small Cap Value Fund’s cumulative total return is based on the daily change in net asset value (NAV), and assumes that all dividends and distributions were reinvested. The graph compares a hypothetical $10,000 investment made in the AMG GW&K Small Cap Value Fund’s Class N shares on December 31, 2010, to a $10,000 investment made in the Russell 2000® Value Index and Russell 2000® Index for the same time period. The graph and table do not reflect the deduction of taxes that a shareholder would pay on a Fund distribution or redemption of shares. The listed returns for the Fund are net of expenses and the returns for the index exclude expenses. Total returns would have been lower had certain expenses not been reduced.
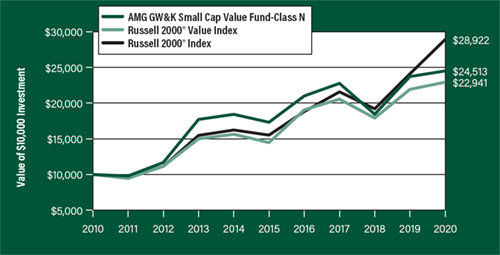
The table below shows the average annual total returns for the AMG GW&K Small Cap Value Fund and the Russell 2000® Value Index and Russell 2000® Index for the same time periods ended December 31, 2020.
| Average Annual Total Returns1 | One
Year | Five
Years | Ten
Years | | Since
Inception | | Inception
Date | |
| AMG GW&K Small Cap Value Fund2, 3, 4, 5, 6, 7 | |
| Class N | 3.29% | 7.19% | 9.38% | | 11.23% | | 04/23/87 | |
| Class I | 3.50% | — | — | | 4.06% | | 02/24/17 | |
| Class Z | 3.57% | — | — | | 4.13% | | 02/24/17 | |
| Russell 2000® Value Index8 | 4.63% | 9.65% | 8.66% | | — | | — | |
| Russell 2000® Index9 | 19.96% | 13.26% | 11.20% | | 9.30% | | 04/23/87 | † |
| | | | | | | | | |
The performance data shown represents past performance. Past performance is not a guarantee of future results. Current performance may be lower or higher than the performance data quoted. The investment return and principal value of an investment will fluctuate so that an investor’s shares, when redeemed, may be worth more or less than their original cost.
Investors should carefully consider the Fund’s investment objectives, risks, charges and expenses before investing. For performance information through the most recent month end, current net asset values per share for the Fund and other information, please call 800.548.4539 or visit our website at amgfunds.com for a free prospectus. Read it carefully before investing or sending money.
Distributed by AMG Distributors, Inc., member FINRA/SIPC.
| † | Date reflects the inception date of the Fund, not the index. |
| 1 | Total return equals income yield plus share price change and assumes reinvestment of all dividends and capital gain distributions. Returns are net of fees and may reflect offsets of Fund expenses as described in the prospectus. No adjustment has been made for taxes payable by shareholders on their reinvested dividends and |
capital gain distributions. Returns for periods greater than one year are annualized. The listed returns on the Fund are net of expenses and based on the published NAV as of December 31, 2020. All returns are in U.S. dollars ($).
| 2 | From time to time, the Fund’s advisor has waived its fees and/or absorbed Fund expenses, which has resulted in higher returns. |
| 3 | The Fund is subject to risks associated with investments in small-capitalization companies, such as erratic earnings patterns, competitive conditions, limited earnings history and a reliance on one or a limited number of products. |
| 4 | The Fund is subject to special risk considerations similar to those associated with the direct ownership of real estate. Real estate valuations may be subject to factors such as changing general and local economic, financial, competitive, and environmental conditions. |
| 5 | Companies that are in similar businesses may be similarly affected by particular economic or market events; to the extent the Fund has substantial holdings within a particular sector, the risks associated with that sector increase. |
| 6 | Market prices of investments held by the Fund may fall rapidly or unpredictably due to a variety of economic or political factors, market conditions, disasters or public health issues, or in response to events that affect particular industries or companies. |
| 7 | The Fund invests in value stocks, which may perform differently from the market as a whole and may be undervalued by the market for a long period of time. |
| 8 | The Russell 2000® Value Index is an unmanaged, market-value weighted, value-oriented index comprised of small stocks that have relatively low price-to-book ratios and lower forecasted growth values. Unlike the Fund, the Russell 2000® Value Index is unmanaged, is not available for investment and does not incur expenses. |
| 9 | The Russell 2000® Index is composed of the 2000 smallest stocks in the Russell 3000® Index and is widely regarded in the industry as the premier measure of small-cap stock performance. Unlike the Fund, the Russell 2000® Index is unmanaged, is not available for investment and does not incur expenses. |
The Russell Indices are trademarks of the London Stock Exchange Group companies.
Not FDIC insured, nor bank guaranteed. May lose value.
AMG GW&K Small Cap Value Fund
Fund Snapshots (unaudited)
December 31, 2020 |
| |
| |
| Sector | % of
Net Assets |
| Financials | 29.6 | |
| Industrials | 17.9 | |
| Consumer Discretionary | 13.2 | |
| Real Estate | 9.4 | |
| Health Care | 6.3 | |
| Information Technology | 5.9 | |
| Materials | 5.1 | |
| Utilities | 4.0 | |
| Consumer Staples | 2.7 | |
| Energy | 2.4 | |
| Communication Services | 2.0 | |
| Other Assets Less Liabilities | 1.5 | |
TOP TEN HOLDINGS
| Security Name | | % of
Net Assets |
| Walker & Dunlop, Inc. | | 2.4 |
| Group 1 Automotive, Inc. | | 2.3 |
| Gibraltar Industries, Inc. | | 2.1 |
| Ameris Bancorp | | 2.1 |
| Piper Sandler Cos | | 2.0 |
| Gray Television, Inc. | | 2.0 |
| Schnitzer Steel Industries, Inc., Class A | | 2.0 |
| Columbus McKinnon Corp. | | 1.9 |
| Four Corners Property Trust, Inc. | | 1.9 |
| Tenet Healthcare Corp. | | 1.9 |
| Top Ten as a Group | | 20.6 |
Because a fund’s strategy may result in multiple investments in particular sectors of the economy, its performance may depend on the performance of those sectors and may fluctuate more widely than investments diversified across more sectors. For additional information on these and other risk considerations, please see the Fund’s prospectus.
Any sectors, industries, or securities discussed should not be perceived as investment recommendations. Mention of a specific security should not be considered a recommendation to buy or solicitation to sell that security. Specific securities mentioned in this report may have been sold from the Fund’s portfolio of investments by the time you receive this report.
AMG GW&K Small Cap Value Fund
Schedule of Portfolio Investments
December 31, 2020 |
| |
| |
| | | Shares | | Value | |
| Common Stocks - 98.5% | | | | | | | |
| Communication Services - 2.0% | | | | | | | |
| Gray Television, Inc.* | | | 371,527 | | | $6,646,618 | |
| Consumer Discretionary - 13.2% | | | | | | | |
| Boot Barn Holdings, Inc.* | | | 98,865 | | | 4,286,786 | |
| Callaway Golf Co. | | | 222,960 | | | 5,353,269 | |
| Deckers Outdoor Corp.* | | | 14,996 | | | 4,300,553 | |
| Denny’s Corp.* | | | 361,881 | | | 5,312,413 | |
| Group 1 Automotive, Inc. | | | 58,364 | | | 7,653,855 | |
| Johnson Outdoors, Inc., Class A | | | 45,478 | | | 5,122,187 | |
| MDC Holdings, Inc. | | | 57,493 | | | 2,794,160 | |
| Patrick Industries, Inc. | | | 65,139 | | | 4,452,251 | |
| Stoneridge, Inc.* | | | 177,273 | | | 5,358,963 | |
| Total Consumer Discretionary | | | | | | 44,634,437 | |
| Consumer Staples - 2.7% | | | | | | | |
| BJ’s Wholesale Club Holdings, Inc.* | | | 76,858 | | | 2,865,266 | |
| Central Garden & Pet Co.* | | | 166,285 | | | 6,420,264 | |
| Total Consumer Staples | | | | | | 9,285,530 | |
| Energy - 2.4% | | | | | | | |
| Matador Resources Co.* | | | 187,222 | | | 2,257,897 | |
| ProPetro Holding Corp.* | | | 312,165 | | | 2,306,900 | |
| Renewable Energy Group, Inc.* | | | 24,117 | | | 1,707,966 | |
| Solaris Oilfield Infrastructure, Inc., Class A | | | 228,829 | | | 1,862,668 | |
| Total Energy | | | | | | 8,135,431 | |
| Financials - 29.6% | | | | | | | |
| Ameris Bancorp | | | 183,803 | | | 6,997,380 | |
| Atlantic Union Bankshares Corp. | | | 190,853 | | | 6,286,698 | |
| Cathay General Bancorp | | | 122,505 | | | 3,943,436 | |
| City Holding Co. | | | 54,368 | | | 3,781,294 | |
| Community Bank System, Inc. | | | 88,627 | | | 5,522,348 | |
| Enterprise Financial Services Corp. | | | 105,354 | | | 3,682,122 | |
| Federal Agricultural Mortgage Corp., Class C | | | 50,061 | | | 3,717,029 | |
| First Financial Bancorp | | | 198,923 | | | 3,487,120 | |
| First Interstate BancSystem, Inc., Class A | | | 106,778 | | | 4,353,339 | |
| Flagstar Bancorp, Inc. | | | 120,322 | | | 4,904,325 | |
| International Bancshares Corp. | | | 122,236 | | | 4,576,516 | |
| James River Group Holdings, Ltd. (Bermuda) | | | 80,085 | | | 3,936,178 | |
| OceanFirst Financial Corp.* | | | 297,427 | | | 5,541,065 | |
| Pacific Premier Bancorp, Inc.* | | | 201,596 | | | 6,316,003 | |
| Piper Sandler Cos | | | 66,588 | | | 6,718,729 | |
| Selective Insurance Group, Inc. | | | 95,639 | | | 6,405,900 | |
| Stifel Financial Corp. | | | 112,839 | | | 5,693,856 | |
| Valley National Bancorp | | | 281,187 | | | 2,741,573 | |
| | | | | | | | |
| | | Shares | | Value | |
| Walker & Dunlop, Inc. | | | 87,525 | | | $8,054,051 | |
| WesBanco, Inc. | | | 100,884 | | | 3,022,485 | |
| Total Financials | | | | | | 99,681,447 | |
| Health Care - 6.3% | | | | | | | |
| Covetrus, Inc.* | | | 121,838 | | | 3,501,624 | |
| Emergent BioSolutions, Inc.* | | | 52,091 | | | 4,667,353 | |
| Integer Holdings Corp.* | | | 50,073 | | | 4,065,427 | |
| Supernus Pharmaceuticals, Inc.* | | | 109,236 | | | 2,748,378 | |
| Tenet Healthcare Corp.* | | | 161,629 | | | 6,453,846 | |
| Total Health Care | | | | | | 21,436,628 | |
| Industrials - 17.9% | | | | | | | |
| Allegiant Travel Co. | | | 20,163 | | | 3,815,646 | |
| American Woodmark Corp.* | | | 45,637 | | | 4,283,032 | |
| CBIZ, Inc.* | | | 145,198 | | | 3,863,719 | |
| Columbus McKinnon Corp. | | | 171,924 | | | 6,608,758 | |
| Comfort Systems USA, Inc. | | | 60,047 | | | 3,162,075 | |
| Douglas Dynamics, Inc. | | | 133,680 | | | 5,717,494 | |
| Federal Signal Corp. | | | 183,052 | | | 6,071,835 | |
| Gibraltar Industries, Inc.* | | | 98,930 | | | 7,117,024 | |
| ICF International, Inc. | | | 65,934 | | | 4,900,874 | |
| Lydall, Inc.* | | | 128,577 | | | 3,861,167 | |
| Primoris Services Corp.* | | | 134,896 | | | 3,724,479 | |
| SkyWest, Inc. | | | 93,683 | | | 3,776,362 | |
| UFP Industries, Inc. | | | 60,512 | | | 3,361,442 | |
| Total Industrials | | | | | | 60,263,907 | |
| Information Technology - 5.9% | | | | | | | |
| American Software, Inc., Class A | | | 155,748 | | | 2,674,193 | |
| CACI International, Inc., Class A* | | | 23,715 | | | 5,912,861 | |
| Power Integrations, Inc. | | | 59,635 | | | 4,881,721 | |
| Silicon Laboratories, Inc.* | | | 26,564 | | | 3,382,660 | |
| Viavi Solutions, Inc.* | | | 205,619 | | | 3,079,145 | |
| Total Information Technology | | | | | | 19,930,580 | |
| Materials - 5.1% | | | | | | | |
| Minerals Technologies, Inc. | | | 63,038 | | | 3,915,921 | |
| Orion Engineered Carbons, S.A. (Luxembourg) | | | 206,379 | | | 3,537,336 | |
| Schnitzer Steel Industries, Inc., Class A | | | 208,111 | | | 6,640,822 | |
| Worthington Industries, Inc. | | | 58,869 | | | 3,022,334 | |
| Total Materials | | | | | | 17,116,413 | |
| Real Estate - 9.4% | | | | | | | |
| Agree Realty Corp., REIT | | | 72,173 | | | 4,805,278 | |
| Four Corners Property Trust, Inc., REIT | | | 221,910 | | | 6,606,261 | |
| Getty Realty Corp., REIT * | | | 182,319 | | | 5,021,065 | |
| Independence Realty Trust, Inc., REIT | | | 475,073 | | | 6,380,231 | |
| | | | | | | | |
| |
| The accompanying notes are an integral part of these financial statements. |
|
AMG GW&K Small Cap Value Fund
Schedule of Portfolio Investments (continued) |
| |
| |
| | | Shares | | Value | |
| Real Estate - 9.4% (continued) | | | | | | | |
| Lexington Realty Trust, REIT | | | 253,215 | | | $2,689,143 | |
| Summit Hotel Properties, Inc., REIT * | | | 326,672 | | | 2,943,315 | |
| Xenia Hotels & Resorts, Inc., REIT * | | | 214,404 | | | 3,258,941 | |
| Total Real Estate | | | | | | 31,704,234 | |
| Utilities - 4.0% | | | | | | | |
| IDACORP, Inc. | | | 54,667 | | | 5,249,672 | |
| NorthWestern Corp. | | | 77,462 | | | 4,516,809 | |
| | | | | | | | |
* Non-income producing security.
| | | Shares | | Value | |
| Southwest Gas Holdings, Inc. | | | 59,543 | | | $3,617,237 | |
| Total Utilities | | | | | | 13,383,718 | |
| Total Common Stocks | | | | | | | |
| (Cost $317,466,452) | | | | | | 332,218,943 | |
| Total Investments - 98.5% | | | | | | | |
| (Cost $317,466,452) | | | | | | 332,218,943 | |
| Other Assets, less Liabilities - 1.5% | | | | | | 4,920,159 | |
| Net Assets - 100.0% | | | | | | $337,139,102 | |
| | | | | | | | |
REIT Real Estate Investment Trust
The following table summarizes the inputs used to value the Fund’s investments by the fair value hierarchy levels as of December 31, 2020:
| | | Level 1 | | Level 2 | | Level 3 | | Total | |
| Investments in Securities | | | | | | | | | |
| Common Stocks† | | $ | 332,218,943 | | | — | | | — | | $ | 332,218,943 | |
| Total Investments in Securities | | $ | 332,218,943 | | | — | | | — | | $ | 332,218,943 | |
| † | All common stocks held in the Fund are Level 1 securities. For a detailed breakout of common stocks by major industry classification, please refer to the Fund’s Schedule of Portfolio Investments. |
For the fiscal year ended December 31, 2020, there were no transfers in or out of Level 3.
| The accompanying notes are an integral part of these financial statements. |
| | |
| | |
| | Statement of Assets and Liabilities |
| | December 31, 2020 |
| | | | AMG
GW&K Enhanced
Core Bond
ESG Fund | | AMG
GW&K High
Income Fund | | AMG
GW&K Municipal Bond Fund | | AMG
GW&K Municipal Enhanced
Yield Fund |
| Assets: | | | | | | | | | | | | | |
| Investments at value1 (including securities on loan valued at $2,928,951, $0, $0, and $0, respectively) | | | $56,083,803 | | | $9,968,697 | | | $1,305,706,754 | | | $322,895,923 | |
| Cash | | | 1,195,980 | | | 188,062 | | | 26,919,653 | | | 2,561,917 | |
| Receivable for investments sold | | | — | | | 218,287 | | | — | | | — | |
| Dividend and interest receivables | | | 410,161 | | | 145,696 | | | 16,405,207 | | | 3,210,811 | |
| Securities lending income receivable | | | 1,552 | | | — | | | — | | | — | |
| Receivable for Fund shares sold | | | 61,551 | | | 76,007 | | | 2,006,953 | | | 140,945 | |
| Receivable from affiliate | | | 14,555 | | | 10,197 | | | 69,866 | | | 25,047 | |
| Prepaid expenses and other assets | | | 14,374 | | | 6,902 | | | 29,507 | | | 25,829 | |
| Total assets | | | 57,781,976 | | | 10,613,848 | | | 1,351,137,940 | | | 328,860,472 | |
| Liabilities: | | | | | | | | | | | | | |
| Payable upon return of securities loaned | | | 2,379,186 | | | — | | | — | | | — | |
| Payable for investments purchased | | | — | | | 258,504 | | | — | | | — | |
| Payable for delayed delivery investments purchased | | | — | | | — | | | 44,435,060 | | | — | |
| Payable for Fund shares repurchased | | | 178,892 | | | 1,068 | | | 289,754 | | | 31,617 | |
| Accrued expenses: | | | | | | | | | | | | | |
| Investment advisory and management fees | | | 13,820 | | | 3,523 | | | 228,285 | | | 124,788 | |
| Administrative fees | | | 6,910 | | | 1,303 | | | 165,655 | | | 41,596 | |
| Distribution fees | | | 3,327 | | | — | | | 3,878 | | | 1,040 | |
| Shareholder service fees | | | 1,264 | | | 1,959 | | | 56,891 | | | 14,276 | |
| Other | | | 52,995 | | | 45,633 | | | 138,239 | | | 63,401 | |
| Total liabilities | | | 2,636,394 | | | 311,990 | | | 45,317,762 | | | 276,718 | |
| | | | | | | | | | | | | | |
| Net Assets | | | $55,145,582 | | | $10,301,858 | | | $1,305,820,178 | | | $328,583,754 | |
| 1 Investments at cost | | | $53,285,407 | | | $9,978,707 | | | $1,228,525,480 | | | $298,407,906 | |
The accompanying notes are an integral part of these financial statements.
| | |
| | |
| | |
| | Statement of Assets and Liabilities (continued) |
| | | | AMG
GW&K Enhanced
Core Bond
ESG Fund | | AMG
GW&K High
Income Fund | | AMG
GW&K Municipal Bond Fund | | AMG
GW&K Municipal Enhanced
Yield Fund |
| Net Assets Represent: | | | | | | | | | | | | | |
| Paid-in capital | | | $55,768,164 | | | $10,365,725 | | | $1,227,763,665 | | | $303,179,087 | |
| Total distributable earnings (loss) | | | (622,582 | ) | | (63,867 | ) | | 78,056,513 | | | 25,404,667 | |
| Net Assets | | | $55,145,582 | | | $10,301,858 | | | $1,305,820,178 | | | $328,583,754 | |
| | | | | | | | | | | | | | |
| Class N: | | | | | | | | | | | | | |
| Net Assets | | | $15,793,769 | | | $10,301,858 | | | $18,152,784 | | | $5,015,428 | |
| Shares outstanding | | | 1,449,610 | | | 463,381 | | | 1,458,020 | | | 469,258 | |
| Net asset value, offering and redemption price per share | | | $10.90 | | | $22.23 | | | $12.45 | | | $10.69 | |
| Class I: | | | | | | | | | | | | | |
| Net Assets | | | $27,800,094 | | | — | | | $1,287,667,394 | | | $323,438,655 | |
| Shares outstanding | | | 2,542,231 | | | — | | | 102,845,111 | | | 31,101,646 | |
| Net asset value, offering and redemption price per share | | | $10.94 | | | — | | | $12.52 | | | $10.40 | |
| Class Z: | | | | | | | | | | | | | |
| Net Assets | | | $11,551,719 | | | — | | | — | | | $129,671 | |
| Shares outstanding | | | 1,056,820 | | | — | | | — | | | 12,471 | |
| Net asset value, offering and redemption price per share | | | $10.93 | | | — | | | — | | | $10.40 | |
The accompanying notes are an integral part of these financial statements.
| | |
| | |
| | |
| | Statement of Assets and Liabilities (continued) |
| | | | AMG
GW&K Global
Allocation Fund | | AMG
GW&K Small Cap Core Fund | | AMG
GW&K Small/Mid
Cap Fund | | AMG
GW&K Small Cap Value Fund |
| Assets: | | | | | | | | | | | | | |
| Investments at value1 (including securities on loan valued at $8,270,264, $58,647,390, $16,713,653, and $0, respectively) | | | $151,616,396 | | | $596,484,651 | | | $265,612,561 | | | $332,218,943 | |
| Cash | | | 3,924,815 | | | 3,899,343 | | | 5,907,959 | | | 4,076,738 | |
| Foreign currency2 | | | 996,953 | | | — | | | — | | | — | |
| Receivable for investments sold | | | — | | | 4,640,017 | | | 614,662 | | | 1,914,548 | |
| Dividend and interest receivables | | | 384,957 | | | 448,690 | | | 94,066 | | | 448,650 | |
| Securities lending income receivable | | | 1,871 | | | 5,552 | | | 1,002 | | | — | |
| Receivable for Fund shares sold | | | 42,426 | | | 858,606 | | | 329,544 | | | 92,291 | |
| Receivable from affiliate | | | 9,364 | | | — | | | 7,836 | | | — | |
| Prepaid expenses and other assets | | | 23,476 | | | 17,272 | | | 12,185 | | | 13,111 | |
| Total assets | | | 157,000,258 | | | 606,354,131 | | | 272,579,815 | | | 338,764,281 | |
| Liabilities: | | | | | | | | | | | | | |
| Payable upon return of securities loaned | | | 2,576,545 | | | 674,281 | | | — | | | — | |
| Payable for investments purchased | | | 1,199,941 | | | — | | | 1,537,011 | | | — | |
| Payable for Fund shares repurchased | | | 4,924 | | | 257,183 | | | 52,811 | | | 1,182,982 | |
| Accrued expenses: | | | | | | | | | | | | | |
| Investment advisory and management fees | | | 76,357 | | | 362,903 | | | 138,590 | | | 250,543 | |
| Administrative fees | | | 19,089 | | | 75,289 | | | 33,530 | | | 44,893 | |
| Distribution fees | | | 10,730 | | | 1,796 | | | 46 | | | — | |
| Shareholder service fees | | | 12,351 | | | 20,645 | | | 8,802 | | | 59,412 | |
| Other | | | 84,086 | | | 73,530 | | | 39,731 | | | 87,349 | |
| Total liabilities | | | 3,984,023 | | | 1,465,627 | | | 1,810,521 | | | 1,625,179 | |
| | | | | | | | | | | | | | |
| Net Assets | | | $153,016,235 | | | $604,888,504 | | | $270,769,294 | | | $337,139,102 | |
| 1 Investments at cost | | | $114,964,612 | | | $426,454,827 | | | $193,513,818 | | | $317,466,452 | |
| 2 Foreign currency at cost | | | $983,352 | | | — | | | — | | | — | |
The accompanying notes are an integral part of these financial statements.
| | |
| | |
| | |
| | Statement of Assets and Liabilities (continued) |
| | | | AMG
GW&K Global
Allocation Fund | | AMG
GW&K Small Cap Core Fund | | AMG
GW&K Small/Mid
Cap Fund | | AMG
GW&K Small Cap Value Fund |
| Net Assets Represent: | | | | | | | | | | | | | |
| Paid-in capital | | | $117,669,185 | | | $423,787,511 | | | $196,369,358 | | | $318,179,443 | |
| Total distributable earnings | | | 35,347,050 | | | 181,100,993 | | | 74,399,936 | | | 18,959,659 | |
| Net Assets | | | $153,016,235 | | | $604,888,504 | | | $270,769,294 | | | $337,139,102 | |
| | | | | | | | | | | | | | |
| Class N: | | | | | | | | | | | | | |
| Net Assets | | | $51,414,521 | | | $8,667,249 | | | $223,853 | | | $243,654,912 | |
| Shares outstanding | | | 2,636,969 | | | 289,157 | | | 13,958 | | | 9,120,604 | |
| Net asset value, offering and redemption price per share | | | $19.50 | | | $29.97 | | | $16.04 | | | $26.71 | |
| Class I: | | | | | | | | | | | | | |
| Net Assets | | | $97,868,989 | | | $470,373,466 | | | $165,840,431 | | | $83,003,254 | |
| Shares outstanding | | | 4,965,221 | | | 15,368,627 | | | 10,327,396 | | | 3,098,650 | |
| Net asset value, offering and redemption price per share | | | $19.71 | | | $30.61 | | | $16.06 | | | $26.79 | |
| Class Z: | | | | | | | | | | | | | |
| Net Assets | | | $3,732,725 | | | $125,847,789 | | | $104,705,010 | | | $10,480,936 | |
| Shares outstanding | | | 189,408 | | | 4,111,282 | | | 6,513,820 | | | 392,205 | |
| Net asset value, offering and redemption price per share | | | $19.71 | | | $30.61 | | | $16.07 | | | $26.72 | |
The accompanying notes are an integral part of these financial statements.
| | |
| | |
| | Statement of Operations |
| | For the fiscal year ended December 31, 2020 |
| | | | AMG
GW&K Enhanced
Core Bond
ESG Fund | | AMG
GW&K High
Income Fund | | AMG
GW&K Municipal
Bond Fund | | AMG
GW&K Municipal Enhanced
Yield Fund |
| Investment Income: | | | | | | | | | | | | | |
| Dividend income | | | $2,337 | | | $787 | | | $67,066 | | | $41,742 | |
| Interest income | | | 1,063,182 | | | 293,490 | | | 22,668,922 | | | 9,518,279 | |
| Securities lending income | | | 8,317 | | | 321 | | | — | | | — | |
| Foreign withholding tax | | | — | | | (1,452 | ) | | — | | | — | |
| Total investment income | | | 1,073,836 | | | 293,146 | | | 22,735,988 | | | 9,560,021 | |
| Expenses: | | | | | | | | | | | | | |
| Investment advisory and management fees | | | 124,241 | | | 49,607 | | | 2,407,999 | | | 1,363,263 | |
| Administrative fees | | | 62,120 | | | 13,871 | | | 1,740,374 | | | 454,421 | |
| Distribution fees - Class N | | | 36,581 | | | — | | | 47,565 | | | 20,322 | |
| Shareholder servicing fees - Class N | | | — | | | 1,958 | | | 23,087 | | | 12,192 | |
| Shareholder servicing fees - Class I | | | 11,118 | | | — | | | 570,612 | | | 147,349 | |
| Professional fees | | | 50,966 | | | 44,829 | | | 105,564 | | | 55,667 | |
| Registration fees | | | 50,035 | | | 19,699 | | | 87,308 | | | 61,044 | |
| Custodian fees | | | 18,993 | | | 21,194 | | | 85,963 | | | 35,512 | |
| Reports to shareholders | | | 16,937 | | | 3,135 | | | 43,769 | | | 12,148 | |
| Transfer agent fees | | | 3,982 | | | 1,051 | | | 41,105 | | | 10,887 | |
| Trustee fees and expenses | | | 3,793 | | | 840 | | | 107,114 | | | 27,880 | |
| Miscellaneous | | | 3,514 | | | 1,165 | | | 31,155 | | | 9,878 | |
| Total expenses before offsets | | | 382,280 | | | 157,349 | | | 5,291,615 | | | 2,210,563 | |
| Expense reimbursements | | | (135,792 | ) | | (75,430 | ) | | (704,935 | ) | | (242,883 | ) |
| Net expenses | | | 246,488 | | | 81,919 | | | 4,586,680 | | | 1,967,680 | |
| | | | | | | | | | | | | | |
| Net investment income | | | 827,348 | | | 211,227 | | | 18,149,308 | | | 7,592,341 | |
| Net Realized and Unrealized Gain: | | | | | | | | | | | | | |
| Net realized gain on investments | | | 851,301 | | | 838,877 | | | 4,459,854 | | | 3,972,374 | |
| Net realized gain on forwards contracts | | | — | | | 134,979 | | | — | | | — | |
| Net realized gain on futures contracts | | | — | | | 34,964 | | | — | | | — | |
| Net realized loss on foreign currency transactions | | | — | | | (13,582 | ) | | — | | | — | |
| Net change in unrealized appreciation/depreciation on investments | | | 1,758,021 | | | (182,406 | ) | | 30,387,730 | | | 8,743,902 | |
| Net change in unrealized appreciation/depreciation on forwards contracts | | | — | | | 10,553 | | | — | | | — | |
| Net change in unrealized appreciation/depreciation on futures contracts | | | — | | | 4,541 | | | — | | | — | |
| Net change in unrealized appreciation/depreciation on foreign currency translations | | | — | | | (2,382 | ) | | — | | | — | |
| Net realized and unrealized gain | | | 2,609,322 | | | 825,544 | | | 34,847,584 | | | 12,716,276 | |
| | | | | | | | | | | | | | |
| Net increase in net assets resulting from operations | | | $3,436,670 | | | $1,036,771 | | | $52,996,892 | | | $20,308,617 | |
The accompanying notes are an integral part of these financial statements.
| | |
| | |
| | |
| | Statement of Operations (continued) |
| | | | AMG
GW&K Global
Allocation Fund | | AMG
GW&K Small Cap
Core Fund | | AMG
GW&K Small/Mid
Cap Fund | | AMG
GW&K Small Cap
Value Fund |
| Investment Income: | | | | | | | | | | | | | |
| Dividend income | | | $1,471,878 | | | $5,284,158 | | | $2,114,205 | | | $5,027,463 | |
| Interest income | | | 1,388,846 | | | 270 | | | — | | | 195 | |
| Securities lending income | | | 20,161 | | | 91,998 | | | 16,067 | | | 34,569 | |
| Foreign withholding tax | | | (36,702 | ) | | (23,275 | ) | | (7,884 | ) | | (13,365 | ) |
| Total investment income | | | 2,844,183 | | | 5,353,151 | | | 2,122,388 | | | 5,048,862 | |
| Expenses: | | | | | | | | | | | | | |
| Investment advisory and management fees | | | 1,020,236 | | | 3,249,852 | | | 1,322,175 | | | 2,541,225 | |
| Administrative fees | | | 255,059 | | | 696,397 | | | 309,120 | | | 523,827 | |
| Distribution fees - Class N | | | 127,668 | | | 19,971 | | | 430 | | | — | |
| Shareholder servicing fees - Class N | | | — | | | 11,983 | | | 27 | | | 621,004 | |
| Shareholder servicing fees - Class I | | | 113,974 | | | 177,432 | | | 102,418 | | | 62,275 | |
| Custodian fees | | | 84,528 | | | 45,279 | | | 28,405 | | | 38,143 | |
| Registration fees | | | 59,064 | | | 59,775 | | | 34,419 | | | 60,310 | |
| Professional fees | | | 53,664 | | | 57,915 | | | 44,934 | | | 51,517 | |
| Reports to shareholders | | | 52,591 | | | 22,089 | | | 10,482 | | | 58,582 | |
| Trustee fees and expenses | | | 46,866 | | | 41,256 | | | 18,573 | | | 28,957 | |
| Transfer agent fees | | | 18,732 | | | 20,435 | | | 7,272 | | | 32,762 | |
| Miscellaneous | | | 13,135 | | | 14,584 | | | 7,488 | | | 16,975 | |
| Total expenses before offsets | | | 1,845,517 | | | 4,416,968 | | | 1,885,743 | | | 4,035,577 | |
| Expense reimbursements | | | (203,900 | ) | | (29,131 | ) | | (48,533 | ) | | (144,468 | ) |
| Expense reductions | | | (4,875 | ) | | (36,922 | ) | | (10,121 | ) | | — | |
| Net expenses | | | 1,636,742 | | | 4,350,915 | | | 1,827,089 | | | 3,891,109 | |
| | | | | | | | | | | | | | |
| Net investment income | | | 1,207,441 | | | 1,002,236 | | | 295,299 | | | 1,157,753 | |
| Net Realized and Unrealized Gain (Loss): | | | | | | | | | | | | | |
| Net realized gain (loss) on investments | | | (948,464 | ) | | 29,838,323 | | | 4,655,713 | | | 106,326,548 | |
| Net realized loss on foreign currency transactions | | | (22,604 | ) | | — | | | — | | | — | |
| Net change in unrealized appreciation/depreciation on investments | | | 15,219,388 | | | 72,950,806 | | | 45,255,119 | | | (122,030,123 | ) |
| Net change in unrealized appreciation/depreciation on foreign currency translations | | | 13,723 | | | — | | | — | | | — | |
| Net realized and unrealized gain (loss) | | | 14,262,043 | | | 102,789,129 | | | 49,910,832 | | | (15,703,575 | ) |
| | | | | | | | | | | | | | |
| Net increase (decrease) in net assets resulting from operations | | | $15,469,484 | | | $103,791,365 | | | $50,206,131 | | | $ (14,545,822 | ) |
The accompanying notes are an integral part of these financial statements.
| | |
| | |
| | Statements of Changes in Net Assets |
| | For the fiscal years ended December 31, |
| | | AMG
GW&K Enhanced
Core Bond ESG Fund | | AMG
GW&K High
Income Fund | | AMG
GW&K Municipal
Bond Fund | |
| | | 2020 | | | 2019 | | 2020 | | | 2019 | | 2020 | | | 2019 | |
| Increase in Net Assets Resulting From Operations: | | | | | | | | | | | | | | | | |
| Net investment income | | $827,348 | | | $912,976 | | $211,227 | | | $261,207 | | $18,149,308 | | | $18,764,133 | |
| Net realized gain (loss) on investments | | 851,301 | | | 404,962 | | 995,238 | | | (352,820 | ) | 4,459,854 | | | 5,823,265 | |
| Net change in unrealized appreciation/depreciation on investments | | 1,758,021 | | | 2,227,923 | | (169,694 | ) | | 809,506 | | 30,387,730 | | | 47,803,351 | |
| Net increase in net assets resulting from operations | | 3,436,670 | | | 3,545,861 | | 1,036,771 | | | 717,893 | | 52,996,892 | | | 72,390,749 | |
| Distributions to Shareholders: | | | | | | | | | | | | | | | | |
| Class N | | (270,732 | ) | | (379,255 | ) | (825,025 | ) | | (29,806 | ) | (291,376 | ) | | (308,006 | ) |
| Class I | | (319,421 | ) | | (192,619 | ) | — | | | — | | (21,463,147 | ) | | (18,444,080 | ) |
| Class C1 | | — | | | (16,702 | ) | — | | | — | | — | | | — | |
| Class Z | | (225,439 | ) | | (338,179 | ) | — | | | — | | — | | | — | |
| Total distributions to shareholders | | (815,592 | ) | | (926,755 | ) | (825,025 | ) | | (29,806 | ) | (21,754,523 | ) | | (18,752,086 | ) |
| Capital Share Transactions:2 | | | | | | | | | | | | | | | | |
| Net increase (decrease) from capital share transactions | | 19,163,432 | | | (5,633,199 | ) | 452,271 | | | (1,415,728 | ) | 241,352,504 | | | 21,588,783 | |
| | | | | | | | | | | | | | | | | |
| Total increase (decrease) in net assets | | 21,784,510 | | | (3,014,093 | ) | 664,017 | | | (727,641 | ) | 272,594,873 | | | 75,227,446 | |
| Net Assets: | | | | | | | | | | | | | | | | |
| Beginning of year | | 33,361,072 | | | 36,375,165 | | 9,637,841 | | | 10,365,482 | | 1,033,225,305 | | | 957,997,859 | |
| End of year | | $55,145,582 | | | $33,361,072 | | $10,301,858 | | | $9,637,841 | | $1,305,820,178 | | | $1,033,225,305 | |
| 1 | Effective May 31, 2019, Class C shares were converted into Class N shares. |
| 2 | See Note 1(g) of the Notes to Financial Statements. |
The accompanying notes are an integral part of these financial statements.
| | |
| | |
| | Statements of Changes in Net Assets (continued) |
| | For the fiscal years ended December 31, |
| | | AMG
GW&K Municipal
Enhanced Yield Fund | | AMG
GW&K Global
Allocation Fund | | AMG
GW&K Small Cap Core Fund | |
| | | 2020 | | | 2019 | | 2020 | | | 2019 | | 2020 | | | 2019 | |
| Increase in Net Assets Resulting From Operations: | | | | | | | | | | | | | | | | |
| Net investment income | | $7,592,341 | | | $7,164,664 | | $1,207,441 | | | $4,245,714 | | $1,002,236 | | | $851,757 | |
| Net realized gain (loss) on investments | | 3,972,374 | | | 2,874,832 | | (971,068 | ) | | 13,203,990 | | 29,838,323 | | | 22,218,128 | |
| Net change in unrealized appreciation/depreciation on investments | | 8,743,902 | | | 15,319,807 | | 15,233,111 | | | 23,461,975 | | 72,950,806 | | | 92,751,979 | |
| Net increase in net assets resulting from operations | | 20,308,617 | | | 25,359,303 | | 15,469,484 | | | 40,911,679 | | 103,791,365 | | | 115,821,864 | |
| Distributions to Shareholders: | | | | | | | | | | | | | | | | |
| From net investment income and/or realized gain on investments: | | | | | | | | | | | | | | | | |
| Class N | | (230,199 | ) | | (199,815 | ) | (1,802,668 | ) | | (4,102,350 | ) | (206,153 | ) | | (519,512 | ) |
| Class I | | (11,227,601 | ) | | (8,694,071 | ) | (4,171,934 | ) | | (10,291,326 | ) | (11,703,788 | ) | | (17,342,704 | ) |
| Class Z | | (4,636 | ) | | (4,178 | ) | (215,224 | ) | | (493,265 | ) | (3,120,957 | ) | | (5,682,701 | ) |
| From paid-in capital: | | | | | | | | | | | | | | | | |
| Class N | | — | | | — | | (11,312 | ) | | — | | — | | | — | |
| Class I | | — | | | — | | (26,180 | ) | | — | | — | | | — | |
| Class Z | | — | | | — | | (1,351 | ) | | — | | — | | | — | |
| Total distributions to shareholders | | (11,462,436 | ) | | (8,898,064 | ) | (6,228,669 | ) | | (14,886,941 | ) | (15,030,898 | ) | | (23,544,917 | ) |
| Capital Share Transactions:1 | | | | | | | | | | | | | | | | |
| Net increase (decrease) from capital share transactions | | 40,667,096 | | | 51,350,874 | | (107,931,884 | ) | | (24,570,919 | ) | 64,165,490 | | | (49,229,890 | ) |
| | | | | | | | | | | | | | | | | |
| Total increase (decrease) in net assets | | 49,513,277 | | | 67,812,113 | | (98,691,069 | ) | | 1,453,819 | | 152,925,957 | | | 43,047,057 | |
| Net Assets: | | | | | | | | | | | | | | | | |
| Beginning of year | | 279,070,477 | | | 211,258,364 | | 251,707,304 | | | 250,253,485 | | 451,962,547 | | | 408,915,490 | |
| End of year | | $328,583,754 | | | $279,070,477 | | $153,016,235 | | | $251,707,304 | | $604,888,504 | | | $451,962,547 | |
| 1 | See Note 1(g) of the Notes to Financial Statements. |
The accompanying notes are an integral part of these financial statements.
| | |
| | |
| | Statements of Changes in Net Assets (continued) |
| | For the fiscal years ended December 31, |
| | | AMG
GW&K Small/Mid
Cap Fund | | AMG
GW&K Small Cap
Value Fund | |
| | | 2020 | | | 2019 | | 2020 | | | 2019 | |
| Increase (Decrease) in Net Assets Resulting From Operations: | | | | | | | | | | | |
| Net investment income | | $295,299 | | | $362,287 | | $1,157,753 | | | $1,391,142 | |
| Net realized gain (loss) on investments | | 4,655,713 | | | (1,633,170 | ) | 106,326,548 | | | 74,784,563 | |
| Net change in unrealized appreciation/depreciation on investments | | 45,255,119 | | | 42,609,178 | | (122,030,123 | ) | | 94,756,214 | |
| Net increase (decrease) in net assets resulting from operations | | 50,206,131 | | | 41,338,295 | | (14,545,822 | ) | | 170,931,919 | |
| Distributions to Shareholders: | | | | | | | | | | | |
| Class N | | — | | | (280 | ) | (78,448,514 | ) | | (24,262,547 | ) |
| Class I | | (194,295 | ) | | (248,675 | ) | (32,924,631 | ) | | (8,703,483 | ) |
| Class Z | | (187,001 | ) | | (316,750 | ) | (3,178,095 | ) | | (789,359 | ) |
| Total distributions to shareholders | | (381,296 | ) | | (565,705 | ) | (114,551,240 | ) | | (33,755,389 | ) |
| Capital Share Transactions:1 | | | | | | | | | | | |
| Net increase (decrease) from capital share transactions | | 22,104,665 | | | 38,228,007 | | (27,451,765 | ) | | (392,753,505 | ) |
| | | | | | | | | | | | |
| Total increase (decrease) in net assets | | 71,929,500 | | | 79,000,597 | | (156,548,827 | ) | | (255,576,975 | ) |
| Net Assets: | | | | | | | | | | | |
| Beginning of year | | 198,839,794 | | | 119,839,197 | | 493,687,929 | | | 749,264,904 | |
| End of year | | $270,769,294 | | | $198,839,794 | | $337,139,102 | | | $493,687,929 | |
| 1 | See Note 1(g) of the Notes to Financial Statements. |
The accompanying notes are an integral part of these financial statements.
| | AMG GW&K Enhanced Core Bond ESG Fund |
| | Financial Highlights |
| | For a share outstanding throughout each fiscal year |
| | | For the fiscal years ended December 31, |
| Class N | | 2020 | | 2019 | | 2018 | | 2017 | | 20161 |
| Net Asset Value, Beginning of Year | | $10.15 | | | $9.43 | | | $9.81 | | | $9.67 | | | $9.58 | |
| Income (loss) from Investment Operations: | | | | | | | | | | | | | | | |
| Net investment income2,3 | | 0.20 | | | 0.24 | | | 0.23 | | | 0.21 | | | 0.22 | |
| Net realized and unrealized gain (loss) on investments | | 0.75 | | | 0.73 | | | (0.38 | ) | | 0.15 | | | 0.09 | |
| Total income (loss) from investment operations | | 0.95 | | | 0.97 | | | (0.15 | ) | | 0.36 | | | 0.31 | |
| Less Distributions to Shareholders from: | | | | | | | | | | | | | | | |
| Net investment income | | (0.20 | ) | | (0.25 | ) | | (0.23 | ) | | (0.22 | ) | | (0.22 | ) |
| Net Asset Value, End of Year | | $10.90 | | | $10.15 | | | $9.43 | | | $9.81 | | | $9.67 | |
| Total Return3 | | 9.41 | %4 | | 10.35 | %4 | | (1.48 | )%4 | | 3.76 | %4 | | 3.26 | % |
| Ratio of net expenses to average net assets | | 0.73 | % | | 0.73 | % | | 0.73 | % | | 0.75 | % | | 0.84 | % |
| Ratio of gross expenses to average net assets5 | | 1.06 | % | | 1.16 | % | | 0.99 | % | | 1.04 | % | | 1.05 | % |
| Ratio of net investment income to average net assets3 | | 1.86 | % | | 2.43 | % | | 2.45 | % | | 2.19 | % | | 2.27 | % |
| Portfolio turnover | | 101 | % | | 71 | % | | 26 | % | | 39 | % | | 88 | % |
| Net assets end of year (000’s) omitted | | $15,794 | | | $14,779 | | | $12,884 | | | $16,027 | | | $16,115 | |
| AMG GW&K Enhanced Core Bond ESG Fund |
| Financial Highlights |
| For a share outstanding throughout each fiscal year |
| | | For the fiscal years ended December 31, |
| Class I | | 2020 | | | 2019 | | | 2018 | | | 20176 | | | 20161 | |
| Net Asset Value, Beginning of Year | | $10.19 | | | $9.47 | | | $9.85 | | | $9.70 | | | $9.62 | |
| Income (loss) from Investment Operations: | | | | | | | | | | | | | | | |
| Net investment income2,3 | | 0.22 | | | 0.26 | | | 0.25 | | | 0.23 | | | 0.24 | |
| Net realized and unrealized gain (loss) on investments | | 0.75 | | | 0.73 | | | (0.38 | ) | | 0.16 | | | 0.08 | |
| Total income (loss) from investment operations | | 0.97 | | | 0.99 | | | (0.13 | ) | | 0.39 | | | 0.32 | |
| Less Distributions to Shareholders from: | | | | | | | | | | | | | | | |
| Net investment income | | (0.22 | ) | | (0.27 | ) | | (0.25 | ) | | (0.24 | ) | | (0.24 | ) |
| Net Asset Value, End of Year | | $10.94 | | | $10.19 | | | $9.47 | | | $9.85 | | | $9.70 | |
| Total Return3,4 | | 9.57 | % | | 10.51 | % | | (1.27 | )% | | 4.03 | % | | 3.31 | % |
| Ratio of net expenses to average net assets | | 0.55 | % | | 0.55 | % | | 0.54 | % | | 0.61 | % | | 0.69 | % |
| Ratio of gross expenses to average net assets5 | | 0.88 | % | | 0.98 | % | | 0.80 | % | | 0.90 | % | | 0.90 | % |
| Ratio of net investment income to average net assets3 | | 2.04 | % | | 2.62 | % | | 2.64 | % | | 2.32 | % | | 2.39 | % |
| Portfolio turnover | | 101 | % | | 71 | % | | 26 | % | | 39 | % | | 88 | % |
| Net assets end of year (000’s) omitted | | $27,800 | | | $8,502 | | | $5,967 | | | $6,864 | | | $37,952 | |
| AMG GW&K Enhanced Core Bond ESG Fund |
| Financial Highlights |
| For a share outstanding throughout each fiscal year |
| | | For the fiscal years ended December 31, |
| Class Z | | 2020 | | | 2019 | | | 2018 | | | 20176 | | | 20161 | |
| Net Asset Value, Beginning of Year | | $10.18 | | | $9.46 | | | $9.84 | | | $9.70 | | | $9.61 | |
| Income (loss) from Investment Operations: | | | | | | | | | | | | | | | |
| Net investment income2,3 | | 0.22 | | | 0.27 | | | 0.26 | | | 0.24 | | | 0.25 | |
| Net realized and unrealized gain (loss) on investments | | 0.75 | | | 0.72 | | | (0.38 | ) | | 0.15 | | | 0.09 | |
| Total income (loss) from investment operations | | 0.97 | | | 0.99 | | | (0.12 | ) | | 0.39 | | | 0.34 | |
| Less Distributions to Shareholders from: | | | | | | | | | | | | | | | |
| Net investment income | | (0.22 | ) | | (0.27 | ) | | (0.26 | ) | | (0.25 | ) | | (0.25 | ) |
| Net Asset Value, End of Year | | $10.93 | | | $10.18 | | | $9.46 | | | $9.84 | | | $9.70 | |
| Total Return3,4 | | 9.65 | % | | 10.59 | % | | (1.23 | )% | | 4.01 | % | | 3.52 | % |
| Ratio of net expenses to average net assets | | 0.48 | % | | 0.48 | % | | 0.48 | % | | 0.50 | % | | 0.59 | % |
| Ratio of gross expenses to average net assets5 | | 0.81 | % | | 0.91 | % | | 0.74 | % | | 0.79 | % | | 0.80 | % |
| Ratio of net investment income to average net assets3 | | 2.11 | % | | 2.72 | % | | 2.70 | % | | 2.43 | % | | 2.51 | % |
| Portfolio turnover | | 101 | % | | 71 | % | | 26 | % | | 39 | % | | 88 | % |
| Net assets end of year (000’s) omitted | | $11,552 | | | $10,080 | | | $15,254 | | | $21,271 | | | $51,357 | |
| 1 | Effective October 1, 2016, the Investor Class, Service Class and Institutional Class were renamed Class N, Class S and Class I, respectively. |
| 2 | Per share numbers have been calculated using average shares. |
| 3 | Total returns and net investment income would have been lower had certain expenses not been offset. |
| 4 | The total return is calculated using the published Net Asset Value as of fiscal year end. |
| 5 | Excludes the impact of expense reimbursement or fee waivers and expense reductions such as brokerage credits, but includes expense repayments and non-reimbursable expenses, if any, such as interest, taxes, and extraordinary expenses. (See Note 1(c) and 2 in the Notes to Financial Statements.) |
| 6 | Effective February 27, 2017, Class I shares were renamed Class Z and Class S shares were renamed Class I. |
| AMG GW&K High Income Fund |
| Financial Highlights |
| For a share outstanding throughout each fiscal year |
| | | For the fiscal years ended December 31, |
| Class N | | 2020 | | | 2019 | | | 2018 | | | 20171 | | | 20162 | |
| Net Asset Value, Beginning of Year | | $21.52 | | | $20.04 | | | $21.06 | | | $19.05 | | | $18.18 | |
| Income (loss) from Investment Operations: | | | | | | | | | | | | | | | |
| Net investment income3,4 | | 0.51 | | | 0.57 | | | 0.69 | | | 0.75 | | | 0.72 | |
| Net realized and unrealized gain (loss) on investments | | 2.09 | | | 0.98 | | | (1.57 | ) | | 1.26 | | | 0.15 | |
| Total income (loss) from investment operations | | 2.60 | | | 1.55 | | | (0.88 | ) | | 2.01 | | | 0.87 | |
| Less Distributions to Shareholders from: | | | | | | | | | | | | | | | |
| Net investment income | | (0.48 | ) | | (0.07 | ) | | (0.14 | ) | | — | | | — | |
| Net realized gain on investments | | (1.41 | ) | | — | | | — | | | — | | | — | |
| Total distributions to shareholders | | (1.89 | ) | | (0.07 | ) | | (0.14 | ) | | — | | | — | |
| Net Asset Value, End of Year | | $22.23 | | | $21.52 | | | $20.04 | | | $21.06 | | | $19.05 | |
| Total Return4,5 | | 12.16 | % | | 7.67 | % | | (4.18 | )% | | 10.55 | % | | 4.79 | % |
| Ratio of net expenses to average net assets | | 0.89 | % | | 0.89 | % | | 0.89 | % | | 0.89 | % | | 0.89 | % |
| Ratio of gross expenses to average net assets6 | | 1.70 | % | | 1.87 | % | | 1.52 | % | | 1.39 | % | | 1.46 | % |
| Ratio of net investment income to average net assets4 | | 2.28 | % | | 2.70 | % | | 3.34 | % | | 3.71 | % | | 3.75 | % |
| Portfolio turnover | | 157 | % | | 52 | % | | 60 | % | | 55 | % | | 34 | % |
| Net assets end of year (000’s) omitted | | $10,302 | | | $9,638 | | | $10,365 | | | $14,074 | | | $15,434 | |
| 1 | Effective February 27, 2017, Class S was renamed Class N. |
| 2 | Effective October 1, 2016, the shares were reclassified and redesignated as Class S shares. |
| 3 | Per share numbers have been calculated using average shares. |
| 4 | Total returns and net investment income would have been lower had certain expenses not been offset. |
| 5 | The total return is calculated using the published Net Asset Value as of fiscal year end. |
| 6 | Excludes the impact of expense reimbursement or fee waivers and expense reductions such as brokerage credits, but includes expense repayments and non-reimbursable expenses, if any, such as interest, taxes, and extraordinary expenses. (See Note 1(c) and 2 in the Notes to Financial Statements.) |
| AMG GW&K Municipal Bond Fund |
| Financial Highlights |
| For a share outstanding throughout each fiscal year |
| | | For the fiscal years ended December 31, |
| Class N | | 2020 | | | 2019 | | | 2018 | | | 2017 | | | 20161 | |
| Net Asset Value, Beginning of Year | | $12.12 | | | $11.48 | | | $11.60 | | | $11.25 | | | $11.70 | |
| Income (loss) from Investment Operations: | | | | | | | | | | | | | | | |
| Net investment income2,3 | | 0.15 | | | 0.19 | | | 0.17 | | | 0.15 | | | 0.13 | |
| Net realized and unrealized gain (loss) on investments | | 0.33 | | | 0.64 | | | (0.11 | ) | | 0.36 | | | (0.25 | ) |
| Total income (loss) from investment operations | | 0.48 | | | 0.83 | | | 0.06 | | | 0.51 | | | (0.12 | ) |
| Less Distributions to Shareholders from: | | | | | | | | | | | | | | | |
| Net investment income | | (0.15 | ) | | (0.19 | ) | | (0.18 | ) | | (0.15 | ) | | (0.12 | ) |
| Net realized gain on investments | | — | | | — | | | (0.00 | )4 | | (0.01 | ) | | (0.21 | ) |
| Total distributions to shareholders | | (0.15 | ) | | (0.19 | ) | | (0.18 | ) | | (0.16 | ) | | (0.33 | ) |
| Net Asset Value, End of Year | | $12.45 | | | $12.12 | | | $11.48 | | | $11.60 | | | $11.25 | |
| Total Return3,5 | | 4.31 | % | | 7.29 | % | | 0.54 | % | | 4.58 | % | | (1.05 | )% |
| Ratio of net expenses to average net assets | | 0.71 | % | | 0.71 | % | | 0.71 | % | | 0.71 | % | | 0.71 | % |
| Ratio of gross expenses to average net assets6 | | 0.77 | % | | 0.78 | % | | 0.77 | % | | 0.78 | % | | 0.95 | % |
| Ratio of net investment income to average net assets3 | | 1.25 | % | | 1.59 | % | | 1.53 | % | | 1.31 | % | | 1.08 | % |
| Portfolio turnover | | 17 | % | | 18 | % | | 35 | % | | 27 | % | | 66 | % |
| Net assets end of year (000’s) omitted | | $18,153 | | | $18,711 | | | $17,445 | | | $29,513 | | | $31,406 | |
| AMG GW&K Municipal Bond Fund |
| Financial Highlights |
| For a share outstanding throughout each fiscal year |
| | | For the fiscal years ended December 31, |
| Class I | | 2020 | | | 2019 | | | 2018 | | | 20177 | | | 20161 | |
| Net Asset Value, Beginning of Year | | $12.18 | | | $11.54 | | | $11.66 | | | $11.31 | | | $11.77 | |
| Income (loss) from Investment Operations: | | | | | | | | | | | | | | | |
| Net investment income2,3 | | 0.19 | | | 0.23 | | | 0.21 | | | 0.19 | | | 0.17 | |
| Net realized and unrealized gain (loss) on investments | | 0.34 | | | 0.64 | | | (0.12 | ) | | 0.36 | | | (0.25 | ) |
| Total income (loss) from investment operations | | 0.53 | | | 0.87 | | | 0.09 | | | 0.55 | | | (0.08 | ) |
| Less Distributions to Shareholders from: | | | | | | | | | | | | | | | |
| Net investment income | | (0.19 | ) | | (0.23 | ) | | (0.21 | ) | | (0.19 | ) | | (0.17 | ) |
| Net realized gain on investments | | — | | | — | | | (0.00 | )4 | | (0.01 | ) | | (0.21 | ) |
| Total distributions to shareholders | | (0.19 | ) | | (0.23 | ) | | (0.21 | ) | | (0.20 | ) | | (0.38 | ) |
| Net Asset Value, End of Year | | $12.52 | | | $12.18 | | | $11.54 | | | $11.66 | | | $11.31 | |
| Total Return3,5 | | 4.70 | % | | 7.58 | % | | 0.87 | % | | 4.90 | % | | (0.70 | )% |
| Ratio of net expenses to average net assets | | 0.39 | % | | 0.39 | % | | 0.39 | % | | 0.37 | % | | 0.34 | % |
| Ratio of gross expenses to average net assets6 | | 0.45 | % | | 0.46 | % | | 0.45 | % | | 0.45 | % | | 0.58 | % |
| Ratio of net investment income to average net assets3 | | 1.57 | % | | 1.91 | % | | 1.85 | % | | 1.64 | % | | 1.45 | % |
| Portfolio turnover | | 17 | % | | 18 | % | | 35 | % | | 27 | % | | 66 | % |
| Net assets end of year (000’s) omitted | | $1,287,667 | | | $1,014,514 | | | $940,553 | | | $1,045,399 | | | $728,365 | |
| 1 | Effective October 1, 2016, the Investor Class, Service Class and Institutional Class were renamed Class N, Class S and Class I, respectively. |
| 2 | Per share numbers have been calculated using average shares. |
| 3 | Total returns and net investment income would have been lower had certain expenses not been offset. |
| 4 | Less than $(0.005) per share. |
| 5 | The total return is calculated using the published Net Asset Value as of fiscal year end. |
| 6 | Excludes the impact of expense reimbursement or fee waivers and expense reductions such as brokerage credits, but includes expense repayments and non-reimbursable expenses, if any, such as interest, taxes, and extraordinary expenses. (See Note 1(c) and 2 in the Notes to Financial Statements.) |
| 7 | Effective June 23, 2017, Class S shares were converted to Class I shares. |
| AMG GW&K Municipal Enhanced Yield Fund |
| Financial Highlights |
| For a share outstanding throughout each fiscal year |
| | | For the fiscal years ended December 31, |
| Class N | | 2020 | | | 2019 | | | 2018 | | | 2017 | | | 20161 | |
| Net Asset Value, Beginning of Year | | $10.42 | | | $9.69 | | | $10.02 | | | $9.40 | | | $10.08 | |
| Income (loss) from Investment Operations: | | | | | | | | | | | | | | | |
| Net investment income2,3 | | 0.23 | | | 0.26 | | | 0.27 | | | 0.26 | | | 0.25 | |
| Net realized and unrealized gain (loss) on investments | | 0.37 | | | 0.78 | | | (0.33 | ) | | 0.62 | | | (0.23 | ) |
| Total income (loss) from investment operations | | 0.60 | | | 1.04 | | | (0.06 | ) | | 0.88 | | | 0.02 | |
| Less Distributions to Shareholders from: | | | | | | | | | | | | | | | |
| Net investment income | | (0.21 | ) | | (0.25 | ) | | (0.15 | ) | | (0.26 | ) | | (0.25 | ) |
| Net realized gain on investments | | (0.12 | ) | | (0.06 | ) | | — | | | — | | | (0.45 | ) |
| Paid in capital | | — | | | — | | | (0.12 | ) | | — | | | — | |
| Total distributions to shareholders | | (0.33 | ) | | (0.31 | ) | | (0.27 | ) | | (0.26 | ) | | (0.70 | ) |
| Net Asset Value, End of Year | | $10.69 | | | $10.42 | | | $9.69 | | | $10.02 | | | $9.40 | |
| Total Return3,4 | | 5.95 | % | | 10.92 | % | | (0.55 | )% | | 9.51 | % | | 0.10 | % |
| Ratio of net expenses to average net assets | | 0.99 | % | | 0.99 | % | | 0.99 | % | | 1.01 | % | | 1.14 | % |
| Ratio of gross expenses to average net assets5 | | 1.07 | % | | 1.08 | % | | 1.08 | % | | 1.11 | % | | 1.30 | % |
| Ratio of net investment income to average net assets3 | | 2.17 | % | | 2.56 | % | | 2.79 | % | | 2.67 | % | | 2.38 | % |
| Portfolio turnover | | 81 | % | | 40 | % | | 89 | % | | 67 | % | | 172 | % |
| Net assets end of year (000’s) omitted | | $5,015 | | | $5,722 | | | $7,283 | | | $8,828 | | | $4,184 | |
| AMG GW&K Municipal Enhanced Yield Fund |
| Financial Highlights |
| For a share outstanding throughout each fiscal year |
| | | For the fiscal years ended December 31, |
| Class I | | 2020 | | | 2019 | | | 2018 | | | 20176 | | | 20161 | |
| Net Asset Value, Beginning of Year | | $10.15 | | | $9.45 | | | $10.01 | | | $9.40 | | | $10.07 | |
| Income (loss) from Investment Operations: | | | | | | | | | | | | | | | |
| Net investment income2,3 | | 0.25 | | | 0.29 | | | 0.31 | | | 0.30 | | | 0.30 | |
| Net realized and unrealized gain (loss) on investments | | 0.37 | | | 0.76 | | | (0.32 | ) | | 0.61 | | | (0.22 | ) |
| Total income (loss) from investment operations | | 0.62 | | | 1.05 | | | (0.01 | ) | | 0.91 | | | 0.08 | |
| Less Distributions to Shareholders from: | | | | | | | | | | | | | | | |
| Net investment income | | (0.25 | ) | | (0.29 | ) | | (0.31 | ) | | (0.30 | ) | | (0.30 | ) |
| Net realized gain on investments | | (0.12 | ) | | (0.06 | ) | | — | | | — | | | (0.45 | ) |
| Paid in capital | | — | | | — | | | (0.24 | ) | | — | | | — | |
| Total distributions to shareholders | | (0.37 | ) | | (0.35 | ) | | (0.55 | ) | | (0.30 | ) | | (0.75 | ) |
| Net Asset Value, End of Year | | $10.40 | | | $10.15 | | | $9.45 | | | $10.01 | | | $9.40 | |
| Total Return3,4 | | 6.31 | % | | 11.28 | % | | (0.07 | )% | | 9.79 | % | | 0.70 | % |
| Ratio of net expenses to average net assets | | 0.64 | % | | 0.64 | % | | 0.64 | % | | 0.64 | % | | 0.64 | % |
| Ratio of gross expenses to average net assets5 | | 0.72 | % | | 0.73 | % | | 0.73 | % | | 0.74 | % | | 0.80 | % |
| Ratio of net investment income to average net assets3 | | 2.52 | % | | 2.91 | % | | 3.14 | % | | 3.05 | % | | 2.89 | % |
| Portfolio turnover | | 81 | % | | 40 | % | | 89 | % | | 67 | % | | 172 | % |
| Net assets end of year (000’s) omitted | | $323,439 | | | $273,228 | | | $203,867 | | | $226,638 | | | $195,193 | |
| AMG GW&K Municipal Enhanced Yield Fund |
| Financial Highlights |
| For a share outstanding throughout each fiscal period |
| | | For the fiscal years ended December 31, | | For the fiscal
period ended
December 31, |
| Class Z | | 2020 | | | 2019 | | | 2018 | | | 20177 | |
| Net Asset Value, Beginning of Period | | $10.15 | | | $9.44 | | | $10.01 | | | $9.49 | |
| Income (loss) from Investment Operations: | | | | | | | | | | | | |
| Net investment income2,3 | | 0.26 | | | 0.30 | | | 0.31 | | | 0.25 | |
| Net realized and unrealized gain (loss) on investments | | 0.37 | | | 0.76 | | | (0.32 | ) | | 0.52 | |
| Total income (loss) from investment operations | | 0.63 | | | 1.06 | | | (0.01 | ) | | 0.77 | |
| Less Distributions to Shareholders from: | | | | | | | | | | | | |
| Net investment income | | (0.26 | ) | | (0.29 | ) | | (0.32 | ) | | (0.25 | ) |
| Net realized gain on investments | | (0.12 | ) | | (0.06 | ) | | — | | | — | |
| Paid in capital | | — | | | — | | | (0.24 | ) | | — | |
| Total distributions to shareholders | | (0.38 | ) | | (0.35 | ) | | (0.56 | ) | | (0.25 | ) |
| Net Asset Value, End of Period | | $10.40 | | | $10.15 | | | $9.44 | | | $10.01 | |
| Total Return3,4 | | 6.37 | % | | 11.45 | % | | (0.09 | )% | | 8.23 | %8 |
| Ratio of net expenses to average net assets | | 0.59 | % | | 0.59 | % | | 0.59 | % | | 0.59 | %9 |
| Ratio of gross expenses to average net assets5 | | 0.67 | % | | 0.68 | % | | 0.68 | % | | 0.69 | %9 |
| Ratio of net investment income to average net assets3 | | 2.57 | % | | 2.96 | % | | 3.19 | % | | 3.07 | %9 |
| Portfolio turnover | | 81 | % | | 40 | % | | 89 | % | | 67 | % |
| Net assets end of period (000’s) omitted | | $130 | | | $120 | | | $108 | | | $108 | |
| 1 | Effective October 1, 2016, the Investor Class, Service Class and Institutional Class were renamed Class N, Class S and Class I, respectively. |
| 2 | Per share numbers have been calculated using average shares. |
| 3 | Total returns and net investment income would have been lower had certain expenses not been offset. |
| 4 | The total return is calculated using the published Net Asset Value as of fiscal year end. |
| 5 | Excludes the impact of expense reimbursement or fee waivers and expense reductions such as brokerage credits, but includes expense repayments and non-reimbursable expenses, if any, such as interest, taxes, and extraordinary expenses. (See Note 1(c) and 2 in the Notes to Financial Statements.) |
| 6 | Effective June 23, 2017, Class S shares were converted to Class I shares. |
| 7 | Commencement of operations was February 27, 2017. |
| AMG GW&K Global Allocation Fund |
| Financial Highlights |
| For a share outstanding throughout each fiscal year |
| | | For the fiscal years ended December 31, |
| Class N | | 2020 | | | 2019 | | | 2018 | | | 2017 | | | 20161 | |
| Net Asset Value, Beginning of Year | | $17.04 | | | $15.45 | | | $17.03 | | | $15.45 | | | $14.92 | |
| Income (loss) from Investment Operations: | | | | | | | | | | | | | | | |
| Net investment income2,3 | | 0.10 | | | 0.25 | | | 0.18 | | | 0.10 | | | 0.14 | 4 |
| Net realized and unrealized gain (loss) on investments | | 2.93 | | | 2.35 | | | (0.67 | ) | | 2.30 | | | 0.54 | |
| Total income (loss) from investment operations | | 3.03 | | | 2.60 | | | (0.49 | ) | | 2.40 | | | 0.68 | |
| Less Distributions to Shareholders from: | | | | | | | | | | | | | | | |
| Net investment income | | (0.09 | ) | | (0.27 | ) | | (0.16 | ) | | (0.11 | ) | | (0.14 | ) |
| Net realized gain on investments | | (0.48 | ) | | (0.74 | ) | | (0.93 | ) | | (0.71 | ) | | (0.01 | ) |
| Paid in capital | | (0.00 | )5 | | — | | | — | | | — | | | — | |
| Total distributions to shareholders | | (0.57 | ) | | (1.01 | ) | | (1.09 | ) | | (0.82 | ) | | (0.15 | ) |
| Net Asset Value, End of Year | | $19.50 | | | $17.04 | | | $15.45 | | | $17.03 | | | $15.45 | |
| Total Return3,6 | | 18.92 | % | | 16.96 | % | | (2.89 | )% | | 15.54 | % | | 4.59 | % |
| Ratio of net expenses to average net assets7 | | 1.07 | % | | 1.08 | % | | 1.08 | % | | 1.09 | % | | 1.08 | % |
| Ratio of gross expenses to average net assets8 | | 1.19 | % | | 1.16 | % | | 1.15 | % | | 1.14 | % | | 1.25 | % |
| Ratio of net investment income to average net assets3 | | 0.60 | % | | 1.51 | % | | 1.02 | % | | 0.63 | % | | 0.94 | % |
| Portfolio turnover | | 156 | % | | 123 | % | | 80 | % | | 75 | % | | 119 | % |
| Net assets end of year (000’s) omitted | | $51,415 | | | $69,774 | | | $75,271 | | | $74,315 | | | $92,502 | |
| AMG GW&K Global Allocation Fund |
| Financial Highlights |
| For a share outstanding throughout each fiscal year |
| | | For the fiscal years ended December 31, |
| Class I | | 2020 | | | 2019 | | | 2018 | | | 2017 | | | 20161 | |
| Net Asset Value, Beginning of Year | | $17.22 | | | $15.60 | | | $17.19 | | | $15.59 | | | $15.05 | |
| Income (loss) from Investment Operations: | | | | | | | | | | | | | | | |
| Net investment income2,3 | | 0.13 | | | 0.28 | | | 0.21 | | | 0.13 | | | 0.17 | 4 |
| Net realized and unrealized gain (loss) on investments | | 2.95 | | | 2.38 | | | (0.68 | ) | | 2.31 | | | 0.54 | |
| Total income (loss) from investment operations | | 3.08 | | | 2.66 | | | (0.47 | ) | | 2.44 | | | 0.71 | |
| Less Distributions to Shareholders from: | | | | | | | | | | | | | | | |
| Net investment income | | (0.11 | ) | | (0.30 | ) | | (0.19 | ) | | (0.13 | ) | | (0.16 | ) |
| Net realized gain on investments | | (0.48 | ) | | (0.74 | ) | | (0.93 | ) | | (0.71 | ) | | (0.01 | ) |
| Paid in capital | | (0.00 | )5 | | — | | | — | | | — | | | — | |
| Total distributions to shareholders | | (0.59 | ) | | (1.04 | ) | | (1.12 | ) | | (0.84 | ) | | (0.17 | ) |
| Net Asset Value, End of Year | | $19.71 | | | $17.22 | | | $15.60 | | | $17.19 | | | $15.59 | |
| Total Return3,6 | | 19.08 | % | | 17.17 | % | | (2.77 | )% | | 15.71 | % | | 4.79 | % |
| Ratio of net expenses to average net assets7 | | 0.92 | % | | 0.93 | % | | 0.92 | % | | 0.94 | % | | 0.93 | % |
| Ratio of gross expenses to average net assets8 | | 1.04 | % | | 1.01 | % | | 0.99 | % | | 0.99 | % | | 1.10 | % |
| Ratio of net investment income to average net assets3 | | 0.75 | % | | 1.66 | % | | 1.18 | % | | 0.78 | % | | 1.09 | % |
| Portfolio turnover | | 156 | % | | 123 | % | | 80 | % | | 75 | % | | 119 | % |
| Net assets end of year (000’s) omitted | | $97,869 | | | $173,575 | | | $166,554 | | | $114,913 | | | $75,890 | |
| | |
| | AMG GW&K Global Allocation Fund |
| | Financial Highlights |
| | For a share outstanding throughout each fiscal year |
| | For the fiscal years ended December 31, | |
| Class Z | | | 2020 | | | 2019 | | | 2018 | | | 2017 | | | 20161 | |
| Net Asset Value, Beginning of Year | | | $17.21 | | | $15.60 | | | $17.19 | | | $15.58 | | | $15.05 | |
| Income (loss) from Investment Operations: | | | | | | | | | | | | | | | | |
| Net investment income2,3 | | | 0.14 | | | 0.30 | | | 0.22 | | | 0.15 | | | 0.18 | 4 |
| Net realized and unrealized gain (loss) on investments | | | 2.97 | | | 2.37 | | | (0.67 | ) | | 2.32 | | | 0.54 | |
| Total income (loss) from investment operations | | | 3.11 | | | 2.67 | | | (0.45 | ) | | 2.47 | | | 0.72 | |
| Less Distributions to Shareholders from: | | | | | | | | | | | | | | | | |
| Net investment income | | | (0.13 | ) | | (0.32 | ) | | (0.21 | ) | | (0.15 | ) | | (0.18 | ) |
| Net realized gain on investments | | | (0.48 | ) | | (0.74 | ) | | (0.93 | ) | | (0.71 | ) | | (0.01 | ) |
| Paid in capital | | | (0.00 | )5 | | — | | | — | | | — | | | — | |
| Total distributions to shareholders | | | (0.61 | ) | | (1.06 | ) | | (1.14 | ) | | (0.86 | ) | | (0.19 | ) |
| Net Asset Value, End of Year | | | $19.71 | | | $17.21 | | | $15.60 | | | $17.19 | | | $15.58 | |
| Total Return3,6 | | | 19.28 | % | | 17.21 | % | | (2.68 | )% | | 15.90 | % | | 4.82 | % |
| Ratio of net expenses to average net assets7 | | | 0.82 | % | | 0.83 | % | | 0.83 | % | | 0.84 | % | | 0.83 | % |
| Ratio of gross expenses to average net assets8 | | | 0.94 | % | | 0.91 | % | | 0.90 | % | | 0.89 | % | | 1.00 | % |
| Ratio of net investment income to average net assets3 | | | 0.85 | % | | 1.76 | % | | 1.27 | % | | 0.88 | % | | 1.20 | % |
| Portfolio turnover | | | 156 | % | | 123 | % | | 80 | % | | 75 | % | | 119 | % |
| Net assets end of year (000’s) omitted | | | $3,733 | | | $8,358 | | | $8,429 | | | $7,060 | | | $5,796 | |
| 1 | Effective October 1, 2016, the Investor Class, Service Class and Institutional Class were renamed Class N, Class I and Class Z, respectively. |
| 2 | Per share numbers have been calculated using average shares. |
| 3 | Total returns and net investment income would have been lower had certain expenses not been offset. |
| 4 | Includes non-recurring dividends. Without these dividends, net investment income per share would have been $0.12, $0.15, and $0.16 for Class N, Class I, and Class Z shares, respectively. |
| 5 | Less than $0.005 per share. |
| 6 | The total return is calculated using the published Net Asset Value as of fiscal year end. |
| 7 | Includes reduction from broker recapture amounting to less than 0.01% for the fiscal year ended December 31, 2020, 0.01% for the fiscal years ended December 31, 2019 and 2018, less than 0.01%, 0.01% and 0.01% for the fiscal years ended 2017, 2016 and 2015, respectively. |
| 8 | Excludes the impact of expense reimbursement or fee waivers and expense reductions such as brokerage credits, but includes expense repayments and non-reimbursable expenses, if any, such as interest, taxes, and extraordinary expenses. (See Note 1(c) and 2 in the Notes to Financial Statements.) |
| | |
| | AMG GW&K Small Cap Core Fund |
| | Financial Highlights |
| | For a share outstanding throughout each fiscal year |
| | For the fiscal years ended December 31, | |
| Class N | | | 2020 | | | 2019 | | | 2018 | | | 2017 | | | 20161 | |
| Net Asset Value, Beginning of Year | | | $26.09 | | | $21.03 | | | $28.04 | | | $24.57 | | | $21.80 | |
| Income (loss) from Investment Operations: | | | | | | | | | | | | | | | | |
| Net investment income (loss)2,3 | | | (0.03 | ) | | (0.04 | ) | | (0.04 | ) | | (0.06 | )4 | | 0.00 | 5,6 |
| Net realized and unrealized gain (loss) on investments | | | 4.64 | | | 6.47 | | | (3.95 | ) | | 5.06 | | | 3.81 | |
| Total income (loss) from investment operations | | | 4.61 | | | 6.43 | | | (3.99 | ) | | 5.00 | | | 3.81 | |
| Less Distributions to Shareholders from: | | | | | | | | | | | | | | | | |
| Net realized gain on investments | | | (0.73 | ) | | (1.37 | ) | | (3.02 | ) | | (1.53 | ) | | (1.04 | ) |
| Net Asset Value, End of Year | | | $29.97 | | | $26.09 | | | $21.03 | | | $28.04 | | | $24.57 | |
| Total Return3,7 | | | 17.73 | % | | 30.66 | % | | (14.08 | )% | | 20.32 | % | | 17.44 | % |
| Ratio of net expenses to average net assets8 | | | 1.29 | % | | 1.29 | % | | 1.28 | % | | 1.32 | % | | 1.33 | % |
| Ratio of gross expenses to average net assets9 | | | 1.30 | % | | 1.31 | % | | 1.28 | % | | 1.33 | % | | 1.42 | % |
| Ratio of net investment income (loss) to average net assets3 | | | (0.14 | )% | | (0.15 | )% | | (0.13 | )% | | (0.21 | )% | | 0.01 | % |
| Portfolio turnover | | | 37 | % | | 20 | % | | 25 | % | | 23 | % | | 19 | % |
| Net assets end of year (000’s) omitted | | | $8,667 | | | $10,239 | | | $12,655 | | | $24,989 | | | $35,760 | |
| | |
| | AMG GW&K Small Cap Core Fund |
| | Financial Highlights |
| | For a share outstanding throughout each fiscal year |
| | | | For the fiscal years ended December 31, | |
| Class I | | | 2020 | | | 2019 | | | 2018 | | | 201710 | | | 20161 | |
| Net Asset Value, Beginning of Year | | | $26.57 | | | $21.37 | | | $28.42 | | | $24.84 | | | $22.04 | |
| Income (loss) from Investment Operations: | | | | | | | | | | | | | | | | |
| Net investment income2,3 | | | 0.05 | | | 0.05 | | | 0.06 | | | 0.07 | 4 | | 0.10 | 5 |
| Net realized and unrealized gain (loss) on investments | | | 4.76 | | | 6.58 | | | (4.03 | ) | | 5.10 | | | 3.86 | |
| Total income (loss) from investment operations | | | 4.81 | | | 6.63 | | | (3.97 | ) | | 5.17 | | | 3.96 | |
| Less Distributions to Shareholders from: | | | | | | | | | | | | | | | | |
| Net investment income | | | (0.04 | ) | | (0.06 | ) | | (0.06 | ) | | (0.06 | ) | | (0.10 | ) |
| Net realized gain on investments | | | (0.73 | ) | | (1.37 | ) | | (3.02 | ) | | (1.53 | ) | | (1.06 | ) |
| Total distributions to shareholders | | | (0.77 | ) | | (1.43 | ) | | (3.08 | ) | | (1.59 | ) | | (1.16 | ) |
| Net Asset Value, End of Year | | | $30.61 | | | $26.57 | | | $21.37 | | | $28.42 | | | $24.84 | |
| Total Return3,7 | | | 18.16 | % | | 31.13 | % | | (13.83 | )% | | 20.79 | % | | 17.90 | % |
| Ratio of net expenses to average net assets8 | | | 0.94 | % | | 0.94 | % | | 0.95 | % | | 0.95 | % | | 0.94 | % |
| Ratio of gross expenses to average net assets9 | | | 0.95 | % | | 0.96 | % | | 0.95 | % | | 0.96 | % | | 1.03 | % |
| Ratio of net investment income to average net assets3 | | | 0.21 | % | | 0.20 | % | | 0.20 | % | | 0.24 | % | | 0.43 | % |
| Portfolio turnover | | | 37 | % | | 20 | % | | 25 | % | | 23 | % | | 19 | % |
| Net assets end of year (000’s) omitted | | | $470,373 | | | $331,703 | | | $311,252 | | | $403,309 | | | $367,972 | |
| | |
| | AMG GW&K Small Cap Core Fund |
| | Financial Highlights |
| | For a share outstanding throughout each fiscal period |
| | | | For the fiscal years ended December 31, | | | For the fiscal period ended December 31, | |
| Class Z | | | 2020 | | | 2019 | | | 2018 | | | 201711 | |
| Net Asset Value, Beginning of Period | | | $26.57 | | | $21.37 | | | $28.42 | | | $26.13 | |
| Income (loss) from Investment Operations: | | | | | | | | | | | | | |
| Net investment income2,3 | | | 0.07 | | | 0.06 | | | 0.07 | | | 0.14 | 4 |
| Net realized and unrealized gain (loss) on investments | | | 4.75 | | | 6.59 | | | (4.03 | ) | | 3.75 | |
| Total income (loss) from investment operations | | | 4.82 | | | 6.65 | | | (3.96 | ) | | 3.89 | |
| Less Distributions to Shareholders from: | | | | | | | | | | | | | |
| Net investment income | | | (0.05 | ) | | (0.08 | ) | | (0.07 | ) | | (0.07 | ) |
| Net realized gain on investments | | | (0.73 | ) | | (1.37 | ) | | (3.02 | ) | | (1.53 | ) |
| Total distributions to shareholders | | | (0.78 | ) | | (1.45 | ) | | (3.09 | ) | | (1.60 | ) |
| Net Asset Value, End of Period | | | $30.61 | | | $26.57 | | | $21.37 | | | $28.42 | |
| Total Return3,7 | | | 18.21 | % | | 31.13 | % | | (13.73 | )% | | 14.87 | %12 |
| Ratio of net expenses to average net assets8 | | | 0.89 | % | | 0.89 | % | | 0.90 | % | | 0.90 | %13 |
| Ratio of gross expenses to average net assets9 | | | 0.90 | % | | 0.91 | % | | 0.90 | % | | 0.91 | %13 |
| Ratio of net investment income to average net assets3 | | | 0.26 | % | | 0.25 | % | | 0.25 | % | | 0.56 | %13 |
| Portfolio turnover | | | 37 | % | | 20 | % | | 25 | % | | 23 | % |
| Net assets end of period (000’s) omitted | | | $125,848 | | | $110,020 | | | $85,009 | | | $108,047 | |
| 1 | Effective October 1, 2016, the Investor Class, Service Class and Institutional Class were renamed Class N, Class S and Class I, respectively. |
| 2 | Per share numbers have been calculated using average shares. |
| 3 | Total returns and net investment income (loss) would have been lower had certain expenses not been offset. |
| 4 | Includes non-recurring dividends. Without these dividends, net investment income per share would have been $(0.12), $0.01, and $0.09 for Class N, Class I and Class Z shares, respectively. |
| 5 | Includes non-recurring dividends. Without these dividends, net investment income per share would have been $(0.06) and $0.04 for class N and Class I, respectively. |
| 6 | Less than $0.005 per share. |
| 7 | The total return is calculated using the published Net Asset Value as of fiscal year end. |
| 8 | Includes reduction from broker recapture amounting to 0.01% for the fiscal year ended 2020, 2019, less than 0.01% for the fiscal year ended 2018 and period ended December 31, 2017. |
| 9 | Excludes the impact of expense reimbursement or fee waivers and expense reductions such as brokerage credits, but includes expense repayments and non-reimbursable expenses, if any, such as interest, taxes, and extraordinary expenses. (See Note 1(c) and 2 in the Notes to Financial Statements.) |
| 10 | Effective June 23, 2017, Class S shares were converted to Class I shares. |
| 11 | Commencement of operations was on February 27, 2017. |
| | |
| | AMG GW&K Small/Mid Cap Fund |
| | Financial Highlights |
| | For a share outstanding throughout each fiscal period |
| | | | For the fiscal years ended December 31, | | | For the fiscal period ended December 31, | |
| Class N | | | 2020 | | | 2019 | | | 2018 | | | 20171 | |
| Net Asset Value, Beginning of Period | | | $13.03 | | | $9.99 | | | $11.15 | | | $10.35 | |
| Income (loss) from Investment Operations: | | | | | | | | | | | | | |
| Net investment income (loss)2,3 | | | (0.01 | ) | | 0.00 | 4 | | (0.01 | ) | | 0.01 | 5 |
| Net realized and unrealized gain (loss) on investments | | | 3.02 | | | 3.07 | | | (0.91 | ) | | 0.94 | |
| Total income (loss) from investment operations | | | 3.01 | | | 3.07 | | | (0.92 | ) | | 0.95 | |
| Less Distributions to Shareholders from: | | | | | | | | | | | | | |
| Net investment income | | | — | | | (0.01 | ) | | — | | | — | |
| Net realized gain on investments | | | — | | | (0.02 | ) | | (0.24 | ) | | (0.15 | ) |
| Total distributions to shareholders | | | — | | | (0.03 | ) | | (0.24 | ) | | (0.15 | ) |
| Net Asset Value, End of Period | | | $16.04 | | | $13.03 | | | $9.99 | | | $11.15 | |
| Total Return3,6 | | | 23.10 | % | | 30.64 | % | | (8.25 | )% | | 9.17 | %7 |
| Ratio of net expenses to average net assets8 | | | 1.10 | % | | 1.09 | % | | 1.09 | % | | 1.10 | %9 |
| Ratio of gross expenses to average net assets10 | | | 1.13 | % | | 1.14 | % | | 1.16 | % | | 1.71 | %9 |
| Ratio of net investment income (loss) to average net assets3 | | | (0.07 | )% | | 0.02 | % | | (0.09 | )% | | 0.12 | %9 |
| Portfolio turnover | | | 29 | % | | 18 | % | | 53 | % | | 38 | % |
| Net assets end of period (000’s) omitted | | | $224 | | | $172 | | | $89 | | | $11 | |
| | AMG GW&K Small/Mid Cap Fund |
| | Financial Highlights |
| | For a share outstanding throughout each fiscal year |
| | | For the fiscal years ended December 31, |
| Class I | | 2020 | | 2019 | | 2018 | | 2017 | | 201611 | |
| Net Asset Value, Beginning of Year | | | $13.04 | | | $9.99 | | | $11.15 | | | $9.80 | | | $8.95 | |
| Income (loss) from Investment Operations: | | | | | | | | | | | | | | | | |
| Net investment income (loss)2,3 | | | 0.01 | | | 0.02 | | | 0.01 | | | 0.035 | | | (0.03 | ) |
| Net realized and unrealized gain (loss) on investments | | | 3.03 | | | 3.07 | | | (0.92 | ) | | 1.48 | | | 0.89 | |
| Total income (loss) from investment operations | | | 3.04 | | | 3.09 | | | (0.91 | ) | | 1.51 | | | 0.86 | |
| Less Distributions to Shareholders from: | | | | | | | | | | | | | | | | |
| Net investment income | | | (0.02 | ) | | (0.02 | ) | | (0.01 | ) | | (0.01 | ) | | (0.01 | ) |
| Net realized gain on investments | | | — | | | (0.02 | ) | | (0.24 | ) | | (0.15 | ) | | — | |
| Total distributions to shareholders | | | (0.02 | ) | | (0.04 | ) | | (0.25 | ) | | (0.16 | ) | | (0.01 | ) |
| Net Asset Value, End of Year | | | $16.06 | | | $13.04 | | | $9.99 | | | $11.15 | | | $9.80 | |
| Total Return3,6 | | | 23.31 | % | | 30.86 | % | | (8.15 | )% | | 15.44 | % | | 9.55 | % |
| Ratio of net expenses to average net assets8 | | | 0.92 | % | | 0.94 | % | | 0.94 | % | | 0.94 | % | | 0.95 | % |
| Ratio of gross expenses to average net assets10 | | | 0.95 | % | | 0.99 | % | | 1.01 | % | | 1.62 | % | | 4.60 | % |
| Ratio of net investment income (loss) to average net assets3 | | | 0.11 | % | | 0.17 | % | | 0.06 | % | | 0.26 | % | | (0.38 | )% |
| Portfolio turnover | | | 29 | % | | 18 | % | | 53 | % | | 38 | % | | 48 | % |
| Net assets end of year (000’s) omitted | | | $165,840 | | | $102,784 | | | $54,376 | | | $24,266 | | | $2 | |
| | AMG GW&K Small/Mid Cap Fund |
| | Financial Highlights |
| | For a share outstanding throughout each fiscal period |
| | | For the fiscal years ended December 31, | | For the fiscal
period ended
December 31, | |
| Class Z | | | 2020 | | | 2019 | | | 2018 | | | 20171 | |
| Net Asset Value, Beginning of Period | | | $13.05 | | | $10.00 | | | $11.15 | | | $10.35 | |
| Income (loss) from Investment Operations: | | | | | | | | | | | | | |
| Net investment income2,3 | | | 0.02 | | | 0.03 | | | 0.02 | | | 0.03 | 5 |
| Net realized and unrealized gain (loss) on investments | | | 3.03 | | | 3.07 | | | (0.91 | ) | | 0.94 | |
| Total income (loss) from investment operations | | | 3.05 | | | 3.10 | | | (0.89 | ) | | 0.97 | |
| Less Distributions to Shareholders from: | | | | | | | | | | | | | |
| Net investment income | | | (0.03 | ) | | (0.03 | ) | | (0.02 | ) | | (0.02 | ) |
| Net realized gain on investments | | | — | | | (0.02 | ) | | (0.24 | ) | | (0.15 | ) |
| Total distributions to shareholders | | | (0.03 | ) | | (0.05 | ) | | (0.26 | ) | | (0.17 | ) |
| Net Asset Value, End of Period | | | $16.07 | | | $13.05 | | | $10.00 | | | $11.15 | |
| Total Return3,6 | | | 23.37 | % | | 30.94 | % | | (7.98 | )% | | 9.34 | %7 |
| Ratio of net expenses to average net assets8 | | | 0.83 | % | | 0.84 | % | | 0.84 | % | | 0.85 | %9 |
| Ratio of gross expenses to average net assets10 | | | 0.86 | % | | 0.89 | % | | 0.91 | % | | 1.46 | %9 |
| Ratio of net investment income to average net assets3 | | | 0.19 | % | | 0.27 | % | | 0.16 | % | | 0.37 | %9 |
| Portfolio turnover | | | 29 | % | | 18 | % | | 53 | % | | 38 | % |
| Net assets end of period (000’s) omitted | | | $104,705 | | | $95,884 | | | $65,375 | | | $6,980 | |
| 1 | Commencement of operations was on February 27, 2017. |
| 2 | Per share numbers have been calculated using average shares. |
| 3 | Total returns and net investment income (loss) would have been lower had certain expenses not been offset. |
| 4 | Less than $0.005 per share. |
| 5 | Includes non-recurring dividends. Without these dividends, net investment income per share would have been $(0.01), $0.00, and $0.01 for Class N, Class I and Class Z, respectively. |
| 6 | The total return is calculated using the published Net Asset Value as of fiscal year end. |
| 8 | Includes reduction from broker recapture amounting to 0.01% for the fiscal year ended 2020, 2019, 2018, and less than 0.01% for the fiscal year ended 2017. |
| 10 | Excludes the impact of expense reimbursement or fee waivers and expense reductions such as brokerage credits, but includes expense repayments and non-reimbursable expenses, if any, such as interest, taxes, and extraordinary expenses. (See Note 1(c) and 2 in the Notes to Financial Statements.) |
| 11 | Effective October 1, 2016, Institutional Class was renamed Class I. |
| | AMG GW&K Small Cap Value Fund |
| | Financial Highlights |
| | For a share outstanding throughout each fiscal year |
| | | For the fiscal years ended December 31, |
| Class N | | | 2020 | | | 2019 | | | 2018 | | | 20171 | | | 20162 | |
| Net Asset Value, Beginning of Year | | | $37.16 | | | $30.93 | | | $43.98 | | | $43.30 | | | $35.71 | |
| Income (loss) from Investment Operations: | | | | | | | | | | | | | | | | |
| Net investment income (loss)3,4 | | | 0.08 | | | 0.07 | | | (0.01 | ) | | (0.08 | ) | | (0.01 | ) |
| Net realized and unrealized gain (loss) on investments | | | 1.00 | | | 8.79 | | | (8.40 | ) | | 3.73 | | | 7.61 | |
| Total income (loss) from investment operations | | | 1.08 | | | 8.86 | | | (8.41 | ) | | 3.65 | | | 7.60 | |
| Less Distributions to Shareholders from: | | | | | | | | | | | | | | | | |
| Net investment income | | | (0.08 | ) | | (0.09 | ) | | — | | | — | | | — | |
| Net realized gain on investments | | | (11.45 | ) | | (2.54 | ) | | (4.64 | ) | | (2.97 | ) | | (0.01 | ) |
| Total distributions to shareholders | | | (11.53 | ) | | (2.63 | ) | | (4.64 | ) | | (2.97 | ) | | (0.01 | ) |
| Net Asset Value, End of Year | | | $26.71 | | | $37.16 | | | $30.93 | | | $43.98 | | | $43.30 | |
| Total Return4,5 | | | 3.29 | % | | 28.64 | % | | (19.00 | )% | | 8.39 | % | | 21.31 | % |
| Ratio of net expenses to average net assets | | | 1.17 | % | | 1.17 | % | | 1.17 | % | | 1.25 | % | | 1.32 | % |
| Ratio of gross expenses to average net assets6 | | | 1.21 | % | | 1.20 | % | | 1.18 | % | | 1.27 | % | | 1.42 | % |
| Ratio of net investment income (loss) to average net assets4 | | | 0.28 | % | | 0.19 | % | | (0.03 | )% | | (0.18 | ) % | | (0.03 | )% |
| Portfolio turnover | | | 115 | % | | 20 | % | | 24 | % | | 33 | % | | 34 | % |
| Net assets end of year (000’s) omitted | | | $243,655 | | | $359,550 | | | $425,540 | | | $923,139 | | | $1,502,587 | |
| | AMG GW&K Small Cap Value Fund |
| | Financial Highlights |
| | For a share outstanding throughout each fiscal period |
| | | For the fiscal years ended December 31, | | | For the fiscal
period ended
December 31, | |
| Class I | | | 2020 | | | 2019 | | | 2018 | | | 20177 | |
| Net Asset Value, Beginning of Period | | | $37.23 | | | $31.05 | | | $44.06 | | | $43.64 | |
| Income (loss) from Investment Operations: | | | | | | | | | | | | | |
| Net investment income3,4 | | | 0.14 | | | 0.13 | | | 0.06 | | | 0.02 | |
| Net realized and unrealized gain (loss) on investments | | | 1.02 | | | 8.83 | | | (8.43 | ) | | 3.37 | |
| Total income (loss) from investment operations | | | 1.16 | | | 8.96 | | | (8.37 | ) | | 3.39 | |
| Less Distributions to Shareholders from: | | | | | | | | | | | | | |
| Net investment income | | | (0.15 | ) | | (0.24 | ) | | — | | | — | |
| Net realized gain on investments | | | (11.45 | ) | | (2.54 | ) | | (4.64 | ) | | (2.97 | ) |
| Total distributions to shareholders | | | (11.60 | ) | | (2.78 | ) | | (4.64 | ) | | (2.97 | ) |
| Net Asset Value, End of Period | | | $26.79 | | | $37.23 | | | $31.05 | | | $44.06 | |
| Total Return4,5 | | | 3.50 | % | | 28.86 | % | | (18.88 | )% | | 7.73 | %8 |
| Ratio of net expenses to average net assets | | | 0.99 | % | | 1.01 | % | | 1.01 | % | | 1.13 | %9 |
| Ratio of gross expenses to average net assets6 | | | 1.03 | % | | 1.04 | % | | 1.02 | % | | 1.15 | %9 |
| Ratio of net investment income to average net assets4 | | | 0.46 | % | | 0.35 | % | | 0.13 | % | | 0.06 | %9 |
| Portfolio turnover | | | 115 | % | | 20 | % | | 24 | % | | 33 | % |
| Net assets end of period (000’s) omitted | | | $83,003 | | | $122,323 | | | $306,757 | | | $362,723 | |
| | AMG GW&K Small Cap Value Fund |
| | Financial Highlights |
| | For a share outstanding throughout each fiscal period |
| | | For the fiscal years ended December 31, | | | For the fiscal
period ended
December 31, | |
| Class Z | | | 2020 | | | 2019 | | | 2018 | | | 20177 | |
| Net Asset Value, Beginning of Period | | | $37.16 | | | $31.10 | | | $44.08 | | | $43.64 | |
| Income (loss) from Investment Operations: | | | | | | | | | | | | | |
| Net investment income3,4 | | | 0.16 | | | 0.16 | | | 0.10 | | | 0.08 | |
| Net realized and unrealized gain (loss) on investments | | | 1.02 | | | 8.84 | | | (8.44 | ) | | 3.33 | |
| Total income (loss) from investment operations | | | 1.18 | | | 9.00 | | | (8.34 | ) | | 3.41 | |
| Less Distributions to Shareholders from: | | | | | | | | | | | | | |
| Net investment income | | | (0.17 | ) | | (0.40 | ) | | — | | | — | |
| Net realized gain on investments | | | (11.45 | ) | | (2.54 | ) | | (4.64 | ) | | (2.97 | ) |
| Total distributions to shareholders | | | (11.62 | ) | | (2.94 | ) | | (4.64 | ) | | (2.97 | ) |
| Net Asset Value, End of Period | | | $26.72 | | | $37.16 | | | $31.10 | | | $44.08 | |
| Total Return4,5 | | | 3.57 | % | | 28.94 | % | | (18.80 | )% | | 7.78 | %8 |
| Ratio of net expenses to average net assets | | | 0.92 | % | | 0.92 | % | | 0.92 | % | | 0.98 | %9 |
| Ratio of gross expenses to average net assets6 | | | 0.96 | % | | 0.95 | % | | 0.93 | % | | 1.00 | %9 |
| Ratio of net investment income to average net assets4 | | | 0.53 | % | | 0.44 | % | | 0.22 | % | | 0.21 | %9 |
| Portfolio turnover | | | 115 | % | | 20 | % | | 24 | % | | 33 | % |
| Net assets end of period (000’s) omitted | | | $10,481 | | | $11,815 | | | $16,969 | | | $9,929 | |
| 1 | Effective February 27, 2017, Class S was renamed Class N. |
| 2 | Effective October 1, 2016, the Fund’s shares were reclassified and redesignated to Class S. |
| 3 | Per share numbers have been calculated using average shares. |
| 4 | Total returns and net investment income (loss) would have been lower had certain expenses not been offset. |
| 5 | The total return is calculated using the published Net Asset Value as of fiscal year end. |
| 6 | Excludes the impact of expense reimbursement or fee waivers and expense reductions such as brokerage credits, but includes expense repayments and non-reimbursable expenses, if any, such as interest, taxes, and extraordinary expenses. (See Note 1(c) and 2 in the Notes to Financial Statements.) |
| 7 | Commencement of operations was on February 27, 2017. |
| |
Notes to Financial Statements
December 31, 2020 |
1. ORGANIZATION AND SUMMARY OF SIGNIFICANT ACCOUNTING POLICIES
AMG Funds, AMG Funds II and AMG Funds III (the “Trusts”) are open-end management investment companies, organized as Massachusetts business trusts, and registered under the Investment Company Act of 1940, as amended (the “1940 Act”). Currently, the Trusts consist of a number of different funds, each having distinct investment management objectives, strategies, risks, and policies. Included in this report are AMG Funds: AMG GW&K Municipal Bond Fund (“Municipal Bond”), AMG GW&K Municipal Enhanced Yield Fund (“Municipal Enhanced”), AMG GW&K Small Cap Core Fund (“Small Cap Core”), AMG GW&K Small/Mid Cap Fund (“Small/Mid Cap”), AMG GW&K Small Cap Value (“Small Cap Value”) (formerly AMG Managers Skyline Special Equities Fund), AMG Funds II: AMG GW&K Global Allocation Fund (“Global Allocation”) (formerly AMG Chicago Equity Partners Balanced Fund), and AMG GW&K Enhanced Core Bond ESG Fund (“Enhanced Core Bond ESG”) and AMG Funds III: AMG GW&K High Income Fund (“High Income”) (formerly AMG Managers Global Income Opportunity Fund), each a “Fund” and collectively, the “Funds”.
Each Fund offers different classes of shares. All Funds offer Class N shares; all Funds except for High Income offer Class I shares; and all Funds except for High Income and Muni Bond offer Class Z shares. Effective May 31, 2019, Enhanced Core Bond ESG Class C shares were converted to Class N shares. Each class represents an interest in the same assets of the respective Fund. Although all share classes generally have identical voting rights, each share class votes separately when required by law. Different share classes may have different net asset values per share to the extent the share classes pay different distribution amounts and/or the expenses of such share classes differ. Each share class has its own expense structure. Please refer to a current prospectus for additional information on each share class.
Effective April 17, 2020, the Board replaced Chicago Equity Partners, LLC as subadviser to Global Allocation with GW&K Investment Management, LLC, (“GW&K”) on an interim basis. Subsequently, effective June 19, 2020, shareholders of Global Allocation approved GW&K as the permanent subadviser to Global Allocation. On December 3, 2020, the Board approved GW&K as the subadviser to High Income and Small Cap Value on an interim basis to replace Loomis, Sayles & Company, L.P. and Skyline Asset Management, L.P., respectively. GW&K became the interim subadviser on December 4, 2020, which is subject to shareholder approval. In conjunction with the respective change in investment strategy for Global Allocation, Small Cap Value and High Income, the Funds sold substantially all open positions around the date of the subadviser change, including open futures contracts and forward foreign exchange contracts for High Income.
On October 8, 2020, the Board proposed a merger between GW&K Mid Cap Fund and AMG GW&K Small/Mid Cap Fund, which is subject to shareholder approval.
Market disruptions associated with the COVID-19 pandemic have had a global impact, and uncertainty exists as to the long-term implications. Such disruptions can adversely affect assets of the Funds and thus Fund performance.
Certain instruments held by a Fund may pay an interest rate based on the London Interbank Offered Rate (“LIBOR”), which is the offered rate for short-term loans between certain major international banks. LIBOR is expected to be phased out by the end of 2021. While the effect of the phase out cannot yet be determined, it may result in, among other things, increased volatility or illiquidity in markets for instruments based on LIBOR and changes in the value of some LIBOR-based investments or the effectiveness of new hedges placed against existing LIBOR-based investments. These effects could occur prior to the end of 2021. There
also remains uncertainty and risk regarding the willingness and ability of issuers to include enhanced provisions in new and existing contracts or instruments. All of the aforementioned may adversely affect a Fund’s performance or net asset value.
The Funds’ financial statements are prepared in accordance with accounting principles generally accepted in the United States of America (“U.S. GAAP”), including accounting and reporting guidance pursuant to Accounting Standards Codification Topic 946 applicable to investment companies. U.S. GAAP requires management to make estimates and assumptions that affect the reported amounts of assets and liabilities and disclosure of contingent assets and liabilities at the date of the financial statements and the reported amounts of income and expenses during the reporting period. Actual results could differ from those estimates and such differences could be material. The following is a summary of significant accounting policies followed by the Funds in the preparation of their financial statements:
a. VALUATION OF INVESTMENTS
Equity securities traded on a national securities exchange or reported on the NASDAQ national market system (“NMS”) are valued at the last quoted sales price on the primary exchange or, if applicable, the NASDAQ official closing price or the official closing price of the relevant exchange or, lacking any sales, at the last quoted bid price or the mean between the last quoted bid and ask prices (the “mean price”). Equity securities traded in the over-the-counter market (other than NMS securities) are valued at the mean price. Foreign equity securities (securities principally traded in markets other than U.S. markets) are valued at the official closing price on the primary exchange or, for markets that either do not offer an official closing price or where the official closing price may not be representative of the overall market, the last quoted sale price.
Fixed income securities purchased with a remaining maturity exceeding 60 days are valued at the evaluated mean price provided by an authorized pricing service or, if an evaluated price is not available, by reference to other securities which are considered comparable in credit rating, interest rate, due date and other features (generally referred to as “matrix pricing”) or other similar pricing methodologies. Investments in certain mortgage-backed and stripped mortgage-backed securities, preferred stocks, convertible securities, derivatives and other debt securities not traded on an organized securities market are valued on the basis of valuations provided by dealers or by a pricing service which uses information with respect to transactions in such securities and various relationships between such securities and yield to maturity in determining value.
Fixed income securities purchased with a remaining maturity of 60 days or less are valued at amortized cost, provided that the amortized cost value is approximately the same as the fair value of the security valued without the use of amortized cost. Investments in other open-end registered investment companies are valued at their end of day net asset value per share.
Futures contracts for which market quotations are readily available are valued at the settlement price as of the close of the futures exchange.
The Funds’ portfolio investments are generally valued based on independent market quotations or prices or, if none, “evaluative” or other market based valuations provided by third party pricing services approved by the Board of Trustees of the Trust (the “Board”). Under certain circumstances, the value of certain Fund portfolio investments may be based on an evaluation of fair value, pursuant to procedures established by and under the general supervision of the Board. The Valuation Committee, which is comprised of the Independent Trustees
| |
Notes to Financial Statements (continued) |
of the Board, and the Pricing Committee, which is comprised of representatives from AMG Funds LLC (the “Investment Manager”) are the committees appointed by the Board to make fair value determinations. Each Fund may use the fair value of a portfolio investment to calculate its net asset value (“NAV”) in the event that the market quotation, price or market based valuation for the portfolio investment is not readily available or otherwise not determinable pursuant to the Board’s valuation procedures, if the Investment Manager or the Pricing Committee believes the quotation, price or market based valuation to be unreliable, or in certain other circumstances. When determining the fair value of an investment, the Pricing Committee and, if required under the Trusts’ securities valuation procedures, the Valuation Committee, seeks to determine the price that the Fund might reasonably expect to receive from current sale of that portfolio investment in an arms-length transaction. Fair value determinations shall be based upon consideration of all available facts and information, including, but not limited to (i) attributes specific to the investment; (ii) fundamental and analytical data relating to the investment; and (iii) the value of other comparable securities or relevant financial instruments, including derivative securities, traded on other markets or among dealers.
The values assigned to fair value portfolio investments are based on available information and do not necessarily represent amounts that might ultimately be realized in the future, since such amounts depend on future developments inherent in long-term investments. Because of the inherent uncertainty of valuation, those estimated values may differ significantly from the values that would have been used had a ready market for the investments existed, and the differences could be material. The Board will be presented with a quarterly report showing as of the most recent quarter end, all outstanding securities fair valued by the Funds, including a comparison with the prior quarter end and the percentage of the Funds that the security represents at each quarter end.
With respect to foreign equity securities and certain foreign fixed income securities, the Board has adopted a policy that securities held in the Funds that can be fair valued by the applicable fair value pricing service are fair valued on each business day provided that each individual price exceeds a pre-established confidence level.
U.S. GAAP defines fair value as the price that a fund would receive to sell an asset or pay to transfer a liability in an orderly transaction between market participants at the measurement date. U.S. GAAP also establishes a framework for measuring fair value, and a three level hierarchy for fair value measurements based upon the transparency of inputs to the valuation of an asset or liability. Inputs may be observable or unobservable and refer broadly to the assumptions that market participants would use in pricing the asset or liability. Observable inputs reflect the assumptions market participants would use in pricing the asset or liability based on market data obtained from sources independent of the Funds. Unobservable inputs reflect the Funds’ own assumptions about the assumptions that market participants would use in pricing the asset or liability developed based on the best information available in the circumstances. Each investment is assigned a level based upon the observability of the inputs which are significant to the overall valuation.
The three-tier hierarchy of inputs is summarized below:
Level 1 – inputs are quoted prices in active markets for identical investments (e.g., equity securities, open-end investment companies)
Level 2 – other observable inputs (including, but not limited to: quoted prices for similar assets or liabilities in markets that are active, quoted prices for identical or similar assets or liabilities in markets that are not active, inputs other than quoted prices that are observable for the assets or liabilities (such as interest rates, yield
curves, volatilities, prepayment speeds, loss severities, credit risks and default rates) or other market corroborated inputs) (e.g., debt securities, government securities, foreign currency exchange contracts, swaps, foreign securities utilizing international fair value pricing, fair valued securities with observable inputs)
Level 3 – inputs are significant unobservable inputs (including the Fund’s own assumptions used to determine the fair value of investments) (e.g., fair valued securities with unobservable inputs)
Changes in inputs or methodologies used for valuing investments may result in a transfer in or out of levels within the fair value hierarchy. The inputs or methodologies used for valuing investments may not necessarily be an indication of the risk associated with investing in those investments.
b. SECURITY TRANSACTIONS
Security transactions are accounted for as of trade date. Realized gains and losses on securities sold are determined on the basis of identified cost.
c. INVESTMENT INCOME AND EXPENSES
Dividend income is recorded on the ex-dividend date. Dividends from foreign securities are recorded on the ex-dividend date, and if after the fact, as soon as the Funds become aware of the ex-dividend date. Interest income, which includes amortization of premium and accretion of discount on debt securities, is accrued as earned. Dividend and interest income on foreign securities is recorded gross of any withholding tax. Non-cash dividends included in dividend income, if any, are reported at the fair market value of the securities received. Upon notification from issuers, distributions received from a real estate investment trust (REIT) may be redesignated as a reduction of cost of investments and/or realized gain. Other income and expenses are recorded on an accrual basis. Expenses that cannot be directly attributed to a Fund are apportioned among the funds in the Trusts and other trusts or funds within the AMG Funds Family of Funds (collectively the “AMG Funds Family”) based upon their relative average net assets or number of shareholders. Investment income, realized and unrealized capital gains and losses, the common expenses of each Fund, and certain fund level expense reductions, if any, are allocated on a pro-rata basis to each class based on the relative net assets of each class to the total net assets of each Fund.
Global Allocation, Small Cap Core and Small/Mid Cap had certain portfolio trades directed to various brokers under a brokerage recapture program. Credits received from the brokerage recapture program are earned and paid on a monthly basis, and are recorded as expense offsets, which serve to reduce the Fund’s overall expense ratio. For the fiscal year ended December 31, 2020, the impact on the expenses and expense ratios were as follows: Global Allocation $4,875 or less than 0.01%, Small Cap Core $36,922 or 0.01%, and Small/Mid Cap $10,121 or 0.01%.
d. DIVIDENDS AND DISTRIBUTIONS
Fund distributions resulting from either net investment income or realized net capital gains, if any, will normally be declared and paid at least annually in December. Distributions to shareholders are recorded on the ex-dividend date. Distributions are determined in accordance with federal income tax regulations, which may differ from net investment income and net realized capital gains for financial statement purposes (U.S. GAAP). Differences may be permanent or temporary. Permanent differences are reclassified among capital accounts in the financial statements to reflect their tax character. Permanent book and tax basis differences, if any, relating to shareholder distributions will result in
| |
Notes to Financial Statements (continued) |
reclassifications to paid-in capital. Temporary differences arise when certain items of income, expense and gain or loss are recognized in different periods for financial statement and tax purposes; these differences will reverse at some time in the future. Permanent differences are primarily due to the equalization utilized
and prior year true-up on REITs. Temporary differences are primarily due to the deferral of qualified late year losses, wash sales loss deferrals, capital loss carryovers and market-to-market of foreign currency.
The tax character of distributions paid during the fiscal years ended December 31, 2020 and December 31, 2019 were as follows:
| | | Enhanced Core Bond ESG | | High Income | | Municipal Bond |
| Distributions paid from: | | 2020 | | 2019 | | 2020 | | 2019 | | 2020 | | 2019 |
| Ordinary income * | | $815,592 | | | $926,765 | | | $364,445 | | | $29,806 | | | $154,232 | | | $659,218 | |
| Tax-exempt income | | — | | | — | | | — | | | — | | | 18,075,720 | | | 18,092,868 | |
| Long-term capital gains | | — | | | — | | | 460,580 | | | — | | | 3,524,571 | | | — | |
| Paid-in capital | | — | | | — | | | — | | | — | | | — | | | — | |
| | | $815,592 | | | $926,765 | | | $825,025 | | | $29,806 | | | $21,754,523 | | | $18,752,086 | |
| | | Municipal Enhanced | | Global Allocation | | Small Cap Core |
| Distributions paid from: | | 2020 | | 2019 | | 2020 | | 2019 | | 2020 | | 2019 |
| Ordinary income * | | $1,182,108 | | | $766,280 | | | $1,199,737 | | | $4,414,354 | | | $4,358,429 | | | $994,828 | |
| Tax-exempt income | | 7,549,526 | | | 7,002,372 | | | — | | | — | | | — | | | — | |
| Long-term capital gains | | 2,730,802 | | | 1,129,412 | | | 4,990,089 | | | 10,472,587 | | | 10,672,469 | | | 22,550,089 | |
| Paid-in capital | | — | | | — | | | 38,843 | | | — | | | — | | | — | |
| | | $11,462,436 | | | $8,898,064 | | | $6,228,669 | | | $14,886,941 | | | $15,030,898 | | | $23,544,917 | |
| | | Small/Mid Cap | | Small Cap Value |
| Distributions paid from: | | 2020 | | 2019 | | 2020 | | 2019 |
| Ordinary income * | | $357,747 | | | $326,001 | | | $6,081,044 | | | $1,715,345 | |
| Long-term capital gains | | 23,549 | | | 239,704 | | | 108,470,196 | | | 32,040,044 | |
| | | $381,296 | | | $565,705 | | | $114,551,240 | | | $33,755,389 | |
| * For tax purposes, short-term capital gain distributions, if any, are considered ordinary income distributions. |
| |
Notes to Financial Statements (continued) |
As of December 31, 2020, the components of distributable earnings (excluding unrealized appreciation/depreciation) on a tax basis consisted of:
| | | Enhanced Core Bond ESG | | High Income | | Municipal Bond | | Municipal Enhanced | |
| Capital loss carryforward | | | $3,427,805 | | | — | | | — | | | — | |
| Undistributed ordinary income | | | 11,756 | | | — | | | $350,964 | | | $306,625 | |
| Undistributed tax-exempt income | | | — | | | — | | | 25,252 | | | 10,701 | |
| Undistributed long-term capital gains | | | — | | | — | | | 500,029 | | | 621,794 | |
| Late-year loss deferral | | | — | | | $53,756 | | | — | | | — | |
| | | Global Allocation | | Small Cap Core | | Small/Mid Cap | | Small Cap Value | |
| Capital loss carryforward | | | $1,215,727 | | | — | | | $646,338 | | | — | |
| Undistributed ordinary income | | | — | | | $4,437,440 | | | — | | | $97,383 | |
| Undistributed tax-exempt income | | | — | | | — | | | — | | | — | |
| Undistributed long-term capital gains | | | — | | | 8,663,042 | | | 3,928,875 | | | 4,511,398 | |
| Late-year loss deferral | | | 1,883 | | | — | | | — | | | — | |
At December 31, 2020, the cost of investments and the aggregate gross unrealized appreciation and depreciation for federal income tax purposes were as follows:
| Fund | | Cost | | Appreciation | | Depreciation | | Net Appreciation (Depreciation) |
| Enhanced Core Bond ESG | | $53,290,336 | | | $2,812,569 | | | $(19,102 | ) | | $2,793,467 | |
| High Income | | 9,978,707 | | | 18,149 | | | (28,260 | ) | | (10,111 | ) |
| Municipal Bond | | 1,228,526,486 | | | 77,219,847 | | | (39,579 | ) | | 77,180,268 | |
| Municipal Enhanced | | 298,430,376 | | | 24,488,017 | | | (22,470 | ) | | 24,465,547 | |
| Global Allocation | | 115,065,538 | | | 37,000,374 | | | (435,714 | ) | | 36,564,660 | |
| Small Cap Core | | 428,484,140 | | | 174,968,837 | | | (6,968,326 | ) | | 168,000,511 | |
| Small/Mid Cap | | 194,495,162 | | | 76,587,922 | | | (5,470,523 | ) | | 71,117,399 | |
| Small Cap Value | | 317,868,065 | | | 17,643,160 | | | (3,292,282 | ) | | 14,350,878 | |
e. FEDERAL TAXES
Each Fund currently qualifies as an investment company and intends to comply with the requirements under Subchapter M of the Internal Revenue Code of 1986, as amended, and to distribute substantially all of its taxable income and gains to its shareholders and to meet certain diversification and income requirements with respect to investment companies. Therefore, no provision for federal income or excise tax is included in the accompanying financial statements.
Additionally, based on each Fund’s understanding of the tax rules and rates related to income, gains and transactions for the foreign jurisdictions in which it invests, each Fund will provide for foreign taxes, and where appropriate, deferred foreign taxes.
Management has analyzed the Funds’ tax positions taken on federal income tax returns as of December 31, 2020, and for all open tax years (generally, the three prior taxable years), and has concluded that no provision for federal income tax is required in the Funds’ financial statements. Additionally, Management is not aware of any tax position for which it is reasonably possible that the total amounts of unrecognized tax benefits will change materially in the next twelve months.
f. CAPITAL LOSS CARRYOVERS AND DEFERRALS
As of December 31, 2020, the following Funds had capital loss carryovers for federal income tax purposes as shown in the following chart. These amounts may be used to offset future realized capital gains indefinitely, and retain their character as short-term and/or long-term.
| | | Capital Loss
Carryover Amounts | | | |
| | | | | | | | |
| Fund | | Short-Term | | Long-Term | | Total | |
| Enhanced Core Bond ESG | | | 1,167,553 | | | 2,260,252 | | | 3,427,805 | |
| Global Allocation | | | 1,215,727 | | | — | | | 1,215,727 | |
| Small/Mid Cap* | | | — | | | 646,338 | | | 646,338 | |
* Amounts may be limited due to sections 381-384 of the Internal Revenue Code.
| |
Notes to Financial Statements (continued) |
As of December 31, 2020, High Income, Municipal Bond, Municipal Enhanced, Global Allocation, Small Cap Core and Small Cap Value had no accumulated net realized capital loss carryovers from securities transactions for federal income tax purposes. Should the Funds incur net capital losses for the year ending December 31, 2021, such amounts may be used to offset future realized capital gains, for an unlimited time period.
For the fiscal year ended December 31, 2020, the following Funds utilized capital loss carryovers as follows:
| | | Capital Loss
Carryover Utilized | |
| Fund | | Short-Term | | Long-Term | |
| Enhanced Core Bond ESG | | | $346,462 | | | $502,937 | |
| Small/Mid Cap | | | 499,380 | | | 639,229 | |
| High Income | | | 319,209 | | | 601 | |
g. CAPITAL STOCK
The Trust’s Declaration of Trust authorizes for each Fund the issuance of an unlimited number of shares of beneficial interest, without par value. Each Fund records sales and repurchases of its capital stock on the trade date. For the fiscal year ended December 31, 2019, Small Cap Core transferred securities and cash to certain shareholders in connection with redemptions in-kind transactions in the amount of $47,933,644. For the purposes of U.S. GAAP, the transactions were treated as a sale of securities and the resulting gain or loss was recognized based on the market value of the securities on the date of the transfer. For tax purposes, no gains or losses were recognized.
For the fiscal years ended December 31, 2020 and December 31, 2019, the capital stock transactions by class for the Funds were as follows:
| | | Enhanced Core Bond ESG | | High Income |
| | | December 31, 2020 | | December 31, 2019 | | December 31, 2020 | | December 31, 2019 |
| | | Shares | | Amount | | Shares | | Amount | | Shares | | Amount | | Shares | | Amount |
| Class N: | | | | | | | | | | | | | | | | | | | | | | | | |
| Proceeds from sale of shares | | 325,128 | | | $3,475,322 | | | 385,161 | | | $3,841,569 | | | 122,058 | | | $2,754,401 | | | 47,899 | | | $1,005,926 | |
| Reinvestment of distributions | | 20,814 | | | 219,293 | | | 30,307 | | | 301,677 | | | 36,046 | | | 798,071 | | | 1,347 | | | 28,845 | |
| Cost of shares repurchased | | (352,412 | ) | | (3,703,576 | ) | | (514,970 | ) | | (5,145,719 | ) | | (142,591 | ) | | (3,100,201 | ) | | (118,585 | ) | | (2,450,499 | ) |
| Share Conversion | | — | | | — | | | 190,000 | | | 1,871,729 | | | — | | | — | | | — | | | — | |
| Net increase (decrease) | | (6,470 | ) | | $(8,961 | ) | | 90,498 | | | $869,256 | | | 15,513 | | | $452,271 | | | (69,339 | ) | | $(1,415,728 | ) |
| Class I: | | | | | | | | | | | | | | | | | | | | | | | | |
| Proceeds from sale of shares | | 1,930,056 | | | $20,740,872 | | | 442,100 | | | $4,378,909 | | | — | | | — | | | — | | | — | |
| Reinvestment of distributions | | 28,452 | | | 303,557 | | | 16,552 | | | 165,239 | | | — | | | — | | | — | | | — | |
| Cost of shares repurchased | | (250,872 | ) | | (2,616,750 | ) | | (254,280 | ) | | (2,503,281 | ) | | — | | | — | | | — | | | — | |
| Net increase | | 1,707,636 | | | $18,427,679 | | | 204,372 | | | $2,040,867 | | | — | | | — | | | — | | | — | |
| Class C:1 | | | | | | | | | | | | | | | | | | | | | | | | |
| Proceeds from sale of shares | | — | | | — | | | 81 | | | $779 | | | — | | | — | | | — | | | — | |
| Reinvestment of distributions | | — | | | — | | | 1,516 | | | 14,667 | | | — | | | — | | | — | | | — | |
| Cost of shares repurchased | | — | | | — | | | (52,291 | ) | | (505,697 | ) | | — | | | — | | | — | | | — | |
| Share Conversion | | — | | | — | | | (190,108 | ) | | (1,871,729 | ) | | — | | | — | | | — | | | — | |
| Net decrease | | — | | | — | | | (240,802 | ) | | $(2,361,980 | ) | | — | | | — | | | — | | | — | |
| Class Z: | | | | | | | | | | | | | | | | | | | | | | | | |
| Proceeds from sale of shares | | 325,068 | | | $3,463,674 | | | 141,124 | | | $1,392,522 | | | — | | | — | | | — | | | — | |
| Reinvestment of distributions | | 20,445 | | | 216,232 | | | 26,209 | | | 260,974 | | | — | | | — | | | — | | | — | |
| Cost of shares repurchased | | (278,702 | ) | | (2,935,192 | ) | | (789,299 | ) | | (7,834,838 | ) | | — | | | — | | | — | | | — | |
| Net increase (decrease) | | 66,811 | | | $744,714 | | | (621,966 | ) | | $(6,181,342 | ) | | — | | | — | | | — | | | — | |
| |
Notes to Financial Statements (continued) |
| | | Municipal Bond | | Municipal Enhanced |
| | | December 31, 2020 | | December 31, 2019 | | December 31, 2020 | | December 31, 2019 |
| | | Shares | | Amount | | Shares | | Amount | | Shares | | Amount | | Shares | | Amount |
| Class N: | | | | | | | | | | | | | | | | | | | | | | | | |
| Proceeds from sale of shares | | 841,918 | | | $10,312,713 | | | 587,077 | | | $6,987,998 | | | 1,891,900 | | | $19,211,900 | | | 1,153,398 | | | $11,800,890 | |
| Reinvestment of distributions | | 22,319 | | | 274,465 | | | 25,450 | | | 304,213 | | | 17,895 | | | 186,782 | | | 19,060 | | | 194,890 | |
| Cost of shares repurchased | | (950,262 | ) | | (11,578,005 | ) | | (588,678 | ) | | (7,045,640 | ) | | (1,989,572 | ) | | (20,374,161 | ) | | (1,375,096 | ) | | (14,098,046 | ) |
| Net increase (decrease) | | (86,025 | ) | | $(990,827 | ) | | 23,849 | | | $246,571 | | | (79,777 | ) | | $(975,479 | ) | | (202,638 | ) | | $(2,102,266 | ) |
| Class I: | | | | | | | | | | | | | | | | | | | | | | | | |
| Proceeds from sale of shares | | 50,063,425 | | | $614,578,625 | | | 25,467,262 | | | $305,694,822 | | | 11,477,762 | | | $114,640,533 | | | 8,484,080 | | | $84,587,165 | |
| Reinvestment of distributions | | 1,402,065 | | | 17,349,323 | | | 1,156,277 | | | 13,901,387 | | | 570,856 | | | 5,821,974 | | | 459,497 | | | 4,602,583 | |
| Cost of shares repurchased | | (31,883,833 | ) | | (389,584,617 | ) | | (24,889,281 | ) | | (298,253,997 | ) | | (7,868,907 | ) | | (78,826,067 | ) | | (3,603,519 | ) | | (35,740,786 | ) |
| Net increase | | 19,581,657 | | | $242,343,331 | | | 1,734,258 | | | $21,342,212 | | | 4,179,711 | | | $41,636,440 | | | 5,340,058 | | | $53,448,962 | |
| Class Z: | | | | | | | | | | | | | | | | | | | | | | | | |
| Proceeds from sale of shares | | — | | | — | | | — | | | — | | | 146 | | | $1,500 | | | — | | | — | |
| Reinvestment of distributions | | — | | | — | | | — | | | — | | | 455 | | | 4,635 | | | 418 | | | $4,178 | |
| Net increase | | — | | | — | | | — | | | — | | | 601 | | | $6,135 | | | 418 | | | $4,178 | |
| | | Global Allocation | | Small Cap Core |
| | | December 31, 2020 | | December 31, 2019 | | December 31, 2020 | | December 31, 2019 |
| | | Shares | | Amount | | Shares | | Amount | | Shares | | Amount | | Shares | | Amount |
| Class N: | | | | | | | | | | | | | | | | | | | | | | | | |
| Proceeds from sale of shares | | 359,114 | | | $6,076,127 | | | 755,483 | | | $12,585,390 | | | 81,195 | | | $1,849,925 | | | 37,380 | | | $923,528 | |
| Reinvestment of distributions | | 114,659 | | | 1,674,037 | | | 219,225 | | | 3,700,415 | | | 7,028 | | | 206,122 | | | 20,023 | | | 515,592 | |
| Cost of shares repurchased | | (1,932,600 | ) | | (31,474,792 | ) | | (1,751,239 | ) | | (29,287,443 | ) | | (191,533 | ) | | (4,505,002 | ) | | (266,629 | ) | | (6,460,696 | ) |
| Net decrease | | (1,458,827 | ) | | $(23,724,628 | ) | | (776,531 | ) | | $(13,001,638 | ) | | (103,310 | ) | | $(2,448,955 | ) | | (209,226 | ) | | $(5,021,576 | ) |
| Class I: | | | | | | | | | | | | | | | | | | | | | | | | |
| Proceeds from sale of shares | | 2,038,932 | | | $33,784,181 | | | 2,971,394 | | | $49,904,550 | | | 6,647,636 | | | $153,200,697 | | | 2,631,723 | | | $65,737,211 | |
| Reinvestment of distributions | | 112,082 | | | 1,651,265 | | | 320,513 | | | 5,466,578 | | | 348,162 | | | 10,423,972 | | | 614,371 | | | 16,108,801 | |
| Cost of shares repurchased | | (7,267,874 | ) | | (114,947,733 | ) | | (3,884,175 | ) | | (66,016,224 | ) | | (4,112,470 | ) | | (96,834,817 | ) | | (5,324,375 | ) | | (130,505,862 | )2 |
| Net increase (decrease) | | (5,116,860 | ) | | $(79,512,287 | ) | | (592,268 | ) | | $(10,645,096 | ) | | 2,883,328 | | | $66,789,852 | | | (2,078,281 | ) | | $(48,659,850 | ) |
| Class Z: | | | | | | | | | | | | | | | | | | | | | | | | |
| Proceeds from sale of shares | | 85,028 | | | $1,346,330 | | | 55,790 | | | $947,599 | | | 222,490 | | | $5,627,757 | | | 355,072 | | | $9,136,099 | |
| Reinvestment of distributions | | 14,496 | | | 214,292 | | | 28,546 | | | 486,627 | | | 104,205 | | | 3,120,958 | | | 216,732 | | | 5,682,701 | |
| Cost of shares repurchased | | (395,703 | ) | | (6,255,591 | ) | | (139,084 | ) | | (2,358,411 | ) | | (356,478 | ) | | (8,924,122 | ) | | (408,010 | ) | | (10,367,264 | ) |
| Net increase (decrease) | | (296,179 | ) | | $(4,694,969 | ) | | (54,748 | ) | | $(924,185 | ) | | (29,783 | ) | | $(175,407 | ) | | 163,794 | | | $4,451,536 | |
| | | | | | | | | | | | | | | | | | | | | | | | | |
| |
Notes to Financial Statements (continued) |
| | | | | | | | | | | | | | | | | |
| | | Small/Mid Cap | | Small Cap Value |
| | | December 31, 2020 | | December 31, 2019 | | December 31, 2020 | | December 31, 2019 |
| | | Shares | | Amount | | Shares | | Amount | | Shares | | Amount | | Shares | | Amount |
| Class N: | | | | | | | | | | | | | | | | | | | | | | | | |
| Proceeds from sale of shares | | 727 | | | $10,000 | | | 4,335 | | | $52,000 | | | 874,807 | | | $25,658,252 | | | 1,057,605 | | | $37,582,901 | |
| Reinvestment of distributions | | — | | | — | | | 22 | | | 280 | | | 2,953,511 | | | 77,884,081 | | | 651,093 | | | 24,090,437 | |
| Cost of shares repurchased | | — | | | — | | | — | | | — | | | (4,383,180 | ) | | (125,831,759 | ) | | (5,790,451 | ) | | (205,246,902 | ) |
| Net increase (decrease) | | 727 | | | $10,000 | | | 4,357 | | | $52,280 | | | (554,862 | ) | | $(22,289,426 | ) | | (4,081,753 | ) | | $(143,573,564 | ) |
| Class I: | | | | | | | | | | | | | | | | | | | | | | | | |
| Proceeds from sale of shares | | 4,771,671 | | | $58,055,212 | | | 3,410,892 | | | $38,761,509 | | | 669,037 | | | $19,414,296 | | | 2,028,039 | | | $69,243,080 | |
| Reinvestment of distributions | | 11,292 | | | 178,297 | | | 17,872 | | | 230,903 | | | 1,212,187 | | | 32,050,234 | | | 230,009 | | | 8,526,416 | |
| Cost of shares repurchased | | (2,334,832 | ) | | (26,093,366 | ) | | (989,978 | ) | | (11,582,617 | ) | | (2,068,313 | ) | | (58,336,031 | ) | | (8,850,520 | ) | | (318,805,182 | ) |
| Net increase (decrease) | | 2,448,131 | | | $32,140,143 | | | 2,438,786 | | | $27,409,795 | | | (187,089 | ) | | $(6,871,501 | ) | | (6,592,472 | ) | | $(241,035,686 | ) |
| Class Z: | | | | | | | | | | | | | | | | | | | | | | | | |
| Proceeds from sale of shares | | 740,790 | | | $9,664,314 | | | 2,176,455 | | | $26,780,755 | | | 34,276 | | | $1,038,772 | | | 92,524 | | | $3,363,298 | |
| Reinvestment of distributions | | 11,828 | | | 187,001 | | | 24,497 | | | 316,750 | | | 120,519 | | | 3,178,096 | | | 21,334 | | | 789,359 | |
| Cost of shares repurchased | | (1,583,660 | ) | | (19,896,793 | ) | | (1,393,119 | ) | | (16,331,573 | ) | | (80,517 | ) | | (2,507,706 | ) | | (341,573 | ) | | (12,296,912 | ) |
| Net increase (decrease) | | (831,042 | ) | | $(10,045,478 | ) | | 807,833 | | | $10,765,932 | | | 74,278 | | | $1,709,162 | | | (227,715 | ) | | $(8,144,255 | ) |
| | | | | | | | | | | | | | | | | | | | | | | | | |
| 1 | Effective May 31, 2019, Class C shares were converted into Class N shares. |
| 2 | Includes redemption in-kind in the amount of $47,933,644. |
At December 31, 2020, certain unaffiliated shareholders of record, individually or collectively held greater than 10% of the net assets of the Funds as follows: Small/Mid Cap - two own 36%. Transactions by this shareholder may have a material impact on the Fund.
h. REPURCHASE AGREEMENTS AND JOINT REPURCHASE AGREEMENTS
The Funds may enter into third-party repurchase agreements for temporary cash management purposes and third-party or bilateral joint repurchase agreements for reinvestment of cash collateral on securities lending transactions under the securities lending program offered by The Bank of New York Mellon (“BNYM”) (the “Program”) (collectively, “Repurchase Agreements”). The value of the underlying collateral, including accrued interest, must equal or exceed the value of the Repurchase Agreements during the term of the agreement. For joint repurchase agreements, the Funds participate on a pro rata basis with other clients of BNYM in its share of the underlying collateral under such joint repurchase agreements and in its share of proceeds from any repurchase or other disposition of the underlying collateral. The underlying collateral for all Repurchase Agreements is held in safekeeping by the Funds’ custodian or at the Federal Reserve Bank. If the seller defaults and the value of the collateral declines, or if bankruptcy proceedings commence with respect to the seller of the security, realization of the collateral by the Funds may be delayed or limited. Pursuant to the Program, the Funds are indemnified for such losses by BNYM on joint repurchase agreements.
At December 31, 2020, the market value of Repurchase Agreements outstanding for Enhanced Core Bond ESG, Global Allocation, and Small Cap Core were $2,379,186, $2,576,545, and $674,281, respectively.
i. FOREIGN CURRENCY TRANSLATION
The books and records of the Funds are maintained in U.S. dollars. The value of investments, assets and liabilities denominated in currencies other than U.S. dollars are translated into U.S. dollars based upon current foreign exchange rates. Purchases and sales of foreign investments, income and expenses are converted into U.S. dollars based on currency exchange rates prevailing on the respective dates of such transactions. Net realized and unrealized gain (loss) on foreign currency transactions represent: (1) foreign exchange gains and losses from the sale and holdings of foreign currencies; (2) gains and losses between trade date and settlement date on investment securities transactions and foreign currency exchange contracts; and (3) gains and losses from the difference between amounts of interest and dividends recorded and the amounts actually received.
The Funds do not isolate the net realized and unrealized gain or loss resulting from changes in exchange rates from the fluctuations in market prices of securities held. Such fluctuations are included with the net realized and unrealized gain or loss on investments.
| |
Notes to Financial Statements (continued) |
j. DELAYED DELIVERY TRANSACTIONS AND WHEN-ISSUED SECURITIES
The Funds (except Small Cap Value) may enter into securities transactions on a delayed delivery or when issued basis. Payment and delivery may take place after the customary settlement period for that security. The price of the underlying securities and the date when the securities will be delivered and paid for are fixed at the time the transaction is negotiated. During the time a delayed delivery sell is outstanding, the contract is marked to market daily and equivalent deliverable securities are held for the transaction. The value of the securities purchased on a delayed delivery or when-issued basis are identified as such in each Fund’s Schedule of Portfolio Investments. With respect to purchase commitments, the Fund identifies securities as segregated in its records with a value at least equal to the amount of the commitment. Losses may arise due to changes in the value of the underlying securities or if the counterparty does not perform under the contract, or if the issuer does not issue the securities due to political, economic, or other factors.
2. AGREEMENTS AND TRANSACTIONS WITH AFFILIATES
For each of the Funds, the Trusts have entered into an investment advisory agreement under which the Investment Manager, a subsidiary and the U.S. retail distribution arm of Affiliated Managers Group, Inc. (“AMG”), serves as investment manager to the Funds and is responsible for the Funds’ overall administration and operations. The Investment Manager selects one or more subadvisers for the Funds (subject to Board approval) and monitors each subadviser’s investment performance, security holdings and investment strategies. Each Fund’s investment portfolio is managed by GW&K Investment Management, LLC, (“GW&K”) who serves pursuant to a subadvisory agreement with the Investment Manager. AMG indirectly owns a majority interest in GW&K.
Investment management fees are paid directly by the Funds to the Investment Manager based on average daily net assets. For the fiscal year ended December 31, 2020, the Funds’ investment management fees were paid at the following annual rates of each Fund’s respective average daily net assets:
| Enhanced Core Bond ESG | 0.30% |
| High Income | 0.39%1 |
| Municipal Bond | |
| on first $25 million | 0.35% |
| on next $25 million | 0.30% |
| on next $50 million | 0.25% |
| on balance over $100 million | 0.20% |
| Municipal Enhanced | 0.45% |
| Global Allocation | 0.60% |
| Small Cap Core | 0.70% |
| Small/Mid Cap | 0.62%2 |
| Small Cap Value | 0.70%3 |
| 1 | Prior to December 4, 2020, the annual rate for the investment management fees for High Income was 0.55% of the Fund’s average daily net assets. |
| 2 | Prior to October 8, 2020, the annual rate for the investment management fees for Small Mid/Cap was 0.65% of the Fund’s average daily net assets. |
| 3 | Prior to December 4, 2020, the annual rate for the investment management fees for Small Cap Value was 0.73% of the Fund’s average daily net assets. |
The Investment Manager has contractually agreed, through at least May 1, 2021 for Enhanced Core Bond ESG, Municipal Bond, Municipal Enhanced, and Small Cap Core and through at least May 1, 2022 for High Income, Global Allocation, Small/Mid Cap, and Small Cap Value , to waive management fees and/or pay or reimburse fund expenses in order to limit total annual Fund operating expenses after fee waiver and expense reimbursements (exclusive of taxes, interest (including interest incurred in connection with bank and custody overdrafts, and in connection with securities sold short), shareholder servicing fees, distribution and service (12b-1) fees, brokerage commissions and other transaction costs, dividends payable with respect to securities sold short, acquired fund fees and expenses and extraordinary expenses) of Enhanced Core Bond ESG, High Income, Municipal Bond, Municipal Enhanced, Global Allocation, Small Cap Core, Small/Mid Cap and Small Cap Value to the annual rate of 0.48%. 0.59%, 0.34%, 0.59%, 0.81%, 0.90%, 0.82% and 0.90%, respectively, of each Fund’s average daily net assets (this annual rate or such other annual rate that may be in effect from time to time, the “Expense Cap”), subject to later reimbursement by the Funds in certain circumstances. Prior to April 17, 2020, Global Allocation expense limitation was 0.84%. Prior to October 8, 2020, Small/Mid Cap expense limitation was 0.85%. Prior to December 4, 2020, High Income and Small Cap Value expense limitation was 0.89% and 0.92%, respectively.
In general, for a period of up to 36 months after the date any amounts are paid, waived or reimbursed by the Investment Manager, the Investment Manager may recover such amounts from a Fund, provided that such repayment would not cause the Fund’s total annual operating expenses after fee waiver and expense reimbursements (exclusive of the items noted in the parenthetical above) to exceed either (i) the Expense Cap in effect at the time such amounts were paid, waived or reimbursed, or (ii) the Expense Cap in effect at the time of such repayment by the Fund.
The contractual expense limitation may only be terminated in the event the Investment Manager or a successor ceases to be the investment manager of a Fund or a successor fund, by mutual agreement between the Investment Manager and the Board, or in the event of a Fund’s liquidation unless the Fund is reorganized or is a party to a merger in which the surviving entity is successor to the accounting and performance information of a Fund.
At December 31, 2020, the Funds’ expiration of reimbursements subject to recoupment is as follows:
Expiration
Period | | Enhanced Core Bond ESG | | High Income | | Municipal Bond | |
| Less than 1 year | | | $110,054 | | | $81,291 | | | $604,775 | |
| 1-2 years | | | 153,359 | | | 94,471 | | | 651,229 | |
| 2-3 years | | | 135,792 | | | 75,430 | | | 704,935 | |
| Total | | | $399,205 | | | $251,192 | | | $1,960,939 | |
| |
Notes to Financial Statements (continued) |
Expiration
Period | | Municipal Enhanced | | Global Allocation | | Small Cap Core | |
| Less than 1 year | | | $186,327 | | | $132,068 | | | $3,686 | |
| 1-2 years | | | 220,347 | | | 179,640 | | | 48,563 | |
| 2-3 years | | | 242,883 | | | 203,900 | | | 29,131 | |
| Total | | | $649,557 | | | $515,608 | | | $81,380 | |
Expiration
Period | | Small/Mid Cap | | Small Cap Value | |
| Less than 1 year | | | $67,647 | | | $147,194 | |
| 1-2 years | | | 68,437 | | | 165,098 | |
| 2-3 years | | | 48,533 | | | 144,468 | |
| Total | | | $184,617 | | | $456,760 | |
The Trusts, on behalf of the Funds, have entered into an amended and restated Administration Agreement under which the Investment Manager serves as the Funds’ administrator (the “Administrator”) and is responsible for all non-portfolio management aspects of managing the Funds’ operations, including administration and shareholder services to each Fund. Each Fund pays a fee to the Administrator at the rate of 0.15% per annum of the Fund’s average daily net assets for this service.
The Funds are distributed by AMG Distributors, Inc. (the “Distributor”), a wholly-owned subsidiary of the Investment Manager. The Distributor serves as the distributor and underwriter for each Fund and is a registered broker-dealer and member of the Financial Industry Regulatory Authority, Inc. (“FINRA”). Shares of each Fund will be continuously offered and will be sold directly to prospective purchasers and through brokers, dealers or other financial intermediaries who have executed selling agreements with the Distributor. Generally the Distributor bears all or a portion of the expenses of providing services pursuant to the distribution agreement, including the payment of the expenses relating to the distribution of prospectuses for sales purposes and any advertising or sales literature.
The Trusts have adopted a distribution and service plan (the “Plan”) with respect to the Class N shares, in accordance with the requirements of Rule 12b-1 under the 1940 Act and the requirements of the applicable rules of FINRA regarding asset-based sales charges. Pursuant to the Plan, each Fund, except High Income and Small Cap Value, may make payments to the Distributor for its expenditures in financing any activity primarily intended to result in the sale of each Fund’s Class N shares and for maintenance and personal service provided to existing shareholders of that class. The Plan authorized payments to the Distributor up to 0.25% annually of each Fund’s, except High Income and Small Cap Value, average daily net assets attributable to the Class N shares. The portion of payments made under the plan by Class N shares of each Fund, except High Income and Small Cap Value, for shareholder servicing may not exceed an annual rate of 0.25% of the average daily net asset value of each Fund’s shares of that class owned by clients of such broker, dealer or financial intermediary.
For Enhanced Core Bond ESG’s and Global Allocation’s Class I shares, for High Income’s Class N shares, and for each of the Class N and Class I shares of Municipal Bond, Municipal Enhanced, Small Cap Core, Small/Mid Cap, and Small Cap Value, the Board has approved reimbursement payments to the Investment
Manager for shareholder servicing expenses (“shareholder servicing fees”) incurred. Shareholder servicing fees include payments to financial intermediaries, such as broker-dealers (including fund supermarket platforms), banks, and trust companies who provide shareholder recordkeeping, account servicing and other services. The Class N and Class I shares may reimburse the Investment Manager for the actual amount incurred up to a maximum annual rate of each Class’s average daily net assets as shown in the table below.
The impact on the annualized expense ratios for the fiscal year ended December 31, 2020, were as follows:
| Fund | Maximum Annual
Amount
Approved | Actual
Amount
Incurred |
| Enhanced Core Bond ESG | | |
| Class I | 0.10% | 0.07% |
| High Income | | |
| Class N1 | 0.25% | 0.02% |
| Municipal Bond | | |
| Class N | 0.15% | 0.12% |
| Class I | 0.05% | 0.05% |
| Municipal Enhanced | | |
| Class N | 0.15% | 0.15% |
| Class I | 0.05% | 0.05% |
| Global Allocation | | |
| Class I | 0.10% | 0.10% |
| Small Cap Core | | |
| Class N | 0.15% | 0.15% |
| Class I | 0.05% | 0.05% |
| Small/Mid Cap | | |
| Class N2 | 0.00% | 0.02% |
| Class I2 | 0.05% | 0.09% |
| Small Cap Value | | |
| Class N | 0.25% | 0.25% |
| Class I3 | 0.05% | 0.07% |
| 1 | Prior to December 4, 2020, Class N shares did not incur shareholder servicing fees. |
| 2 | Prior to October 8, 2020, the maximum annual amount approved was 0.15% and 0.10% for Class N and Class I shares, respectively. |
| 3 | Prior to December 4, 2020, the maximum annual amount approved was 0.15%. |
The Board provides supervision of the affairs of the Trusts and other trusts within the AMG Funds Family. The Trustees of the Trusts who are not affiliated with the Investment Manager receive an annual retainer and per meeting fees for regular, special and telephonic meetings, and they are reimbursed for out-of-pocket expenses incurred while carrying out their duties as Board members. The Chairman of the Board and the Audit Committee Chair receive additional annual retainers. Certain Trustees and Officers of the Funds are Officers and/or Directors of the Investment Manager, AMG and/or the Distributor.
| |
Notes to Financial Statements (continued) |
The Securities and Exchange Commission (the “SEC”) granted an exemptive order that permits the Funds to lend and borrow money for certain temporary purposes directly to and from other eligible funds in the AMG Funds Family. Participation in this interfund lending program is voluntary for both the borrowing and lending funds, and an interfund loan is only made if it benefits each participating fund. The Administrator manages the program according to procedures approved by the Board, and the Board monitors the operation of the program. An interfund loan must comply with certain conditions set out in the exemptive order, which are designed to assure fairness and protect all participating funds. The interest earned and interest paid on interfund loans are included on the Statement of Operations as interest income and miscellaneous expense, respectively. At December 31, 2020, the Funds had no interfund loans outstanding.
The following Funds utilized the interfund loan program during the fiscal year ended December 31, 2020 as follows:
| Fund | | Average
Lent | | Number
of Days | | Interest
Earned | | Average
Interest Rate | |
| Municipal Bond | | | $3,082,989 | | | 11 | | | $886 | | | 0.954 | % |
| Municipal Enhanced | | | 634,261 | | | 4 | | | 95 | | | 1.368 | % |
| Global Allocation | | | 870,308 | | | 7 | | | 160 | | | 0.958 | % |
| Small Cap Core | | | 3,532,151 | | | 3 | | | 270 | | | 0.930 | % |
| Small Cap Value | | | 2,450,140 | | | 3 | | | 195 | | | 0.970 | % |
| Fund | | Average
Borrowed | | Number
of Days | | Interest
Paid | | Average
Interest Rate | |
| Municipal Bond | | | $5,585,478 | | | 1 | | | $149 | | | 0.973 | % |
| Municipal Enhanced | | | 3,275,164 | | | 1 | | | 87 | | | 0.966 | % |
| Global Allocation | | | 6,270,940 | | | 12 | | | 1,922 | | | 0.932 | % |
| Small Cap Value | | | 2,999,209 | | | 5 | | | 397 | | | 0.969 | % |
3. PURCHASES AND SALES OF SECURITIES
Purchases and sales of securities (excluding short-term securities and U.S. Government Obligations) for the fiscal year ended December 31, 2020, were as follows:
| | | Long Term Securities | |
| Fund | | Purchases | | Sales | |
| Enhanced Core Bond ESG | | | $46,147,869 | | | $32,483,408 | |
| High Income | | | 13,077,053 | | | 11,381,214 | |
| Municipal Bond | | | 409,245,901 | | | 175,656,653 | |
| Municipal Enhanced | | | 268,251,547 | | | 237,830,937 | |
| Global Allocation | | | 218,809,112 | | | 296,265,282 | |
| Small Cap Core | | | 216,932,036 | | | 168,486,521 | |
| Small/Mid Cap | | | 82,358,532 | | | 58,939,579 | |
| Small Cap Value | | | 390,783,833 | | | 512,708,533 | |
Purchases and sales of U.S. Government Obligations for the fiscal year ended December 31, 2020 were as follows:
| | | U.S. Government Obligations | |
| Fund | | Purchases | | Sales | |
| Enhanced Core Bond ESG | | | $13,400,002 | | | $8,540,454 | |
| High Income | | | 775,043 | | | 2,716,015 | |
| Global Allocation | | | 39,618,584 | | | 75,575,338 | |
4. PORTFOLIO SECURITIES LOANED
The Funds participate in the Program providing for the lending of securities to qualified borrowers. Securities lending income includes earnings of such temporary cash investments, plus or minus any rebate to a borrower. These earnings (after any rebate) are then divided between BNYM, as a fee for its services under the Program, and the Funds, according to agreed-upon rates. Collateral on all securities loaned is accepted in cash, U.S. Treasury Obligations or U.S. Government Agency Obligations. Collateral is maintained at a minimum level of 102% (105% in the case of certain foreign securities) of the market value, plus interest, if applicable, of investments on loan. It is the Funds’ policy to obtain additional collateral from or return excess collateral to the borrower by the end of the next business day, following the valuation date of the securities loaned. Therefore, the value of the collateral held may be temporarily less than the value of the securities on loan. Lending securities entails a risk of loss to the Funds if and to the extent that the market value of the securities loaned were to increase and the borrower did not increase the collateral accordingly, and the borrower fails to return the securities. Under the terms of the Program, the Funds are indemnified for such losses by BNYM. Cash collateral is held in separate omnibus accounts managed by BNYM, who is authorized to exclusively enter into joint repurchase agreements for that cash collateral. Securities collateral is held in separate omnibus accounts managed by BNYM that cannot be sold or pledged. BNYM bears the risk of any deficiency in the amount of the cash collateral available for return to the borrower due to any loss on the collateral invested. Loans of securities are terminable at any time and the borrower, after notice, is required to return borrowed securities as soon as practical, which is normally within three business days.
The value of securities loaned on positions held, cash collateral and securities collateral received at December 31, 2020, were as follows:
| Fund | | Securities
Loaned | | Cash
Collateral
Received | | Securities
Collateral
Received | | Total
Collateral
Received | |
| Enhanced Core Bond ESG | | | $2,928,951 | | | $2,379,186 | | | $659,095 | | | $3,038,281 | |
| Global Allocation | | | 8,270,264 | | | 2,576,545 | | | 6,105,109 | | | 8,681,654 | |
| Small Cap Core | | | 58,647,390 | | | 674,281 | | | 59,438,228 | | | 60,112,509 | |
| Small/Mid Cap | | | 16,713,653 | | | — | | | 17,116,018 | | | 17,116,018 | |
| |
Notes to Financial Statements (continued) |
The following table summarizes the securities received as collateral for securities lending at December 31, 2020:
| Fund | Collateral
Type | Coupon
Range | Maturity
Date Range |
| Enhanced Core Bond ESG | U.S. Treasury Obligations | 0.000%-6.000% | 01/15/21-05/15/50 |
| Global Allocation | U.S. Treasury Obligations | 0.000%-8.125% | 01/15/21-08/15/50 |
| Small Cap Core | U.S. Treasury Obligations | 0.000%-8.125% | 01/15/21-08/15/50 |
| Small/Mid Cap | U.S. Treasury Obligations | 0.000%-8.125% | 01/15/21-08/15/50 |
5. FOREIGN SECURITIES
Certain Funds invest in securities of foreign entities and in instruments denominated in foreign currencies which involve risks not typically associated with investments in domestic securities. Non-domestic securities carry special risks, such as exposure to currency fluctuations, less developed or less efficient trading markets, political instability, a lack of company information, differing auditing and legal standards, and, potentially, less liquidity. Realized gains in certain countries may be subject to foreign taxes at the Fund level and the Fund would pay such foreign taxes at the appropriate rate for each jurisdiction.
6. COMMITMENTS AND CONTINGENCIES
Under the Trusts’ organizational documents, its trustees and officers are indemnified against certain liabilities arising out of the performance of their duties to the Trusts. In addition, in the normal course of business, the Funds may enter into contracts and agreements that contain a variety of representations and warranties, which provide general indemnifications. The maximum exposure to the Funds under these arrangements is unknown, as this would involve future claims that may be made against a Fund that have not yet occurred. However, based on experience, the Funds had no prior claims or losses and expect the risks of loss to be remote.
7. RISKS ASSOCIATED WITH HIGH YIELD SECURITIES
Investing in high yield securities involves greater risks and considerations not typically associated with U.S. Government and other high quality/investment grade securities. High yield securities are generally below investment grade securities and do not have an established retail secondary market. Economic downturns may disrupt the high yield market and impair the issuer’s ability to repay principal and interest. Also, an increase in interest rates would likely have an adverse impact on the value of such obligations and could cause the securities to become less liquid.
8. FORWARD COMMITMENTS
Certain transactions, such as futures and forward transactions, or delayed delivery securities may have a similar effect on a Fund’s net asset value as if a Fund had created a degree of leverage in its portfolio. However, if a Fund enters into such a transaction, a Fund will establish a segregated account with its custodian in which it will maintain cash, U.S. government securities or other liquid securities equal in value to its obligations in respect to such transaction. Securities and other assets held in the segregated account may not be sold while the transaction is outstanding, unless other suitable assets are substituted.
9. DERIVATIVE INSTRUMENTS
The following disclosures contain information on how and why High Income used derivative instruments previous to the change in subadviser, the credit risk and how derivative instruments affect the Funds’ financial position, and results of operations. The location and fair value amounts of these instruments on the Statement of Assets and Liabilities, and the realized gains and losses and changes in unrealized appreciation and depreciation on the Statement of Operations, each categorized by type of derivative contract, are included in a table at the end of the applicable Fund’s Schedule of Portfolio Investments. For the fiscal year ended December 31, 2020, the average quarterly balances of derivative financial instruments outstanding were as follows:
| | | High Income | |
| Foreign Currency Exchange Contracts | | | | |
| Average U.S. Dollar amount purchased/sold | | | $287,304,441 | |
| Financial Futures Contracts | | | | |
| Average number of contracts purchased | | | 3 | |
| Average notional value of contracts purchased | | | $436,650 | |
10. FORWARD FOREIGN CURRENCY CONTRACTS
During the fiscal year ended December 31, 2020, High Income invested in forward foreign currency contracts, before the subadviser change, to facilitate transactions in foreign securities and to hedge against foreign currency exchange rate risk on its non- U.S. dollar denominated investment securities.
A forward foreign currency contract is an agreement between a fund and another party to buy or sell a currency at a set price at a future date. The market value of the contract will fluctuate with changes in currency exchange rates. The contract is marked-to-market daily, and the change in market value is recorded as an unrealized appreciation or depreciation. Risks may arise upon entering into these contracts from the potential inability of counterparties to meet the terms of their contracts and from unanticipated movements in the value of a foreign currency relative to the U.S. dollar.
At December 31, 2020, there were no open forward foreign currency contracts.
11. FUTURES CONTRACTS
Before the subadviser change, High Income purchased futures contracts to achieve a desired level of investment, whether to accommodate portfolio turnover or cash flows from capital shares transactions. There are certain risks associated with futures contracts. Prices may not move as expected or the Fund may not be able to close out the contract when it desires to do so, resulting in losses.
On entering into a futures contract, either cash or securities in an amount equal to a certain percentage of the contract value (initial margin) must be deposited with the futures broker. Subsequent variation margin payments are made or received by the Funds depending on the fluctuations in the value of the futures contracts and the value of cash or securities on deposit with the futures broker. The Funds must have total value at the futures broker consisting of either net unrealized gains, cash or securities collateral to meet the initial margin requirement, and any value over the initial margin requirement may be transferred to the Fund.
| |
Notes to Financial Statements (continued) |
Variation margin on future contracts is recorded as unrealized appreciation or depreciation until the futures contract is closed or expired. The Funds recognize a realized gain or loss when the contract is closed or expires equal to the difference between the value of the contract at the time it was opened and the value at the time it was closed. Fluctuations in the value of the contracts are recorded in the
Statement of Assets and Liabilities as an asset (liability) and in the Statement of Operations as unrealized appreciation (depreciation) until the contracts are closed, when they are recorded as realized gains (losses) on futures contracts.
At December 31, 2020, there were no open futures contracts.
12. MASTER NETTING AGREEMENTS
The Funds may enter into master netting agreements with their counterparties for the securities lending program and Repurchase Agreements, which provide the right, in the event of default (including bankruptcy or insolvency) for the non-defaulting party to liquidate the collateral and calculate net exposure to the defaulting party or request additional collateral. For financial reporting purposes, the Funds do not offset financial assets and financial liabilities that are subject to master netting agreements in the Statement of Assets and Liabilities. For securities lending transactions, see Note 4.
At December 31, 2020 there were no open foreign currency contracts or futures contracts.
The following table is a summary of the Funds’ open Repurchase Agreements that are subject to a master netting agreement as of December 31, 2020:
| | | | | | Gross Amount Not Offset in the
Statement of Assets and Liabilities | | | | | | | |
| Fund | | Gross Amounts of
Assets Presented in
the Statement of
Assets and Liabilities | | Offset
Amount | | Net
Asset
Balance | | Collateral
Received | | Net
Amount | |
| Enhanced Core Bond ESG | | | | | | | | | | | | | | | | |
| Citigroup Global Markets, Inc. | | | $1,000,000 | | | — | | | $1,000,000 | | | $1,000,000 | | | — | |
| Morgan, Stanley & Co. LLC | | | 379,186 | | | — | | | 379,186 | | | 379,186 | | | — | |
| RBC Dominion Securities, Inc. | | | 1,000,000 | | | — | | | 1,000,000 | | | 1,000,000 | | | — | |
| Total | | | $2,379,186 | | | — | | | $2,379,186 | | | $2,379,186 | | | — | |
| Global Allocation | | | | | | | | | | | | | | | | |
| Citigroup Global Markets, Inc. | | | $1,000,000 | | | — | | | $1,000,000 | | | $1,000,000 | | | — | |
| Daiwa Capital Markets America | | | 576,545 | | | — | | | 576,545 | | | 576,545 | | | — | |
| RBC Dominion Securities, Inc. | | | 1,000,000 | | | — | | | 1,000,000 | | | 1,000,000 | | | — | |
| Total | | | $2,576,545 | | | — | | | $2,576,545 | | | $2,576,545 | | | — | |
| Small Cap Core | | | | | | | | | | | | | | | | |
| Citigroup Global Markets, Inc. | | | $674,281 | | | — | | | $674,281 | | | $674,281 | | | — | |
13. SUBSEQUENT EVENTS
The Funds have determined that no material events or transactions occurred through the issuance date of the Funds’ financial statements which require an additional disclosure in or adjustment of the Funds’ financial statements.
| | |
| | |
| | Report of Independent Registered Public Accounting Firm |
TO THE BOARD OF TRUSTEES OF AMG FUNDS, AMG FUNDS II, AND AMG Funds III AND SHAREHOLDERS OF AMG GW&K ENHANCED CORE BOND ESG FUND, AMG GW&K GLOBAL ALLOCATION FUND, AMG GW&K HIGH INCOME FUND, AMG GW&K MUNICIPAL BOND FUND, AMG GW&K MUNICIPAL ENHANCED YIELD FUND, AMG GW&K SMALL CAP CORE FUND AMG GW&K SMALL/MID CAP FUND AND AMG GW&K SMALL CAP VALUE FUND
Opinions on the Financial Statements
We have audited the accompanying statements of assets and liabilities, including the schedules of portfolio investments, of AMG GW&K Enhanced Core Bond ESG Fund, AMG GW&K Global Allocation Fund (formerly AMG Chicago Equity Partners Balanced Fund) (two of the funds constituting AMG Funds II), AMG GW&K High Income Fund (formerly AMG Managers Global Income Opportunity Fund) (one of the funds constituting AMG Funds III), AMG GW&K Municipal Bond Fund, AMG GW&K Municipal Enhanced Yield Fund, AMG GW&K Small Cap Core Fund, AMG GW&K Small/Mid Cap Fund and AMG GW&K Small Cap Value Fund (formerly AMG Skyline Special Equities Fund) (five of the funds constituting AMG Funds) (collectively referred to hereafter as the “Funds”) as of December 31, 2020, the related statements of operations for the year ended December 31, 2020, the statement of changes in net assets for each of the two years in the period ended December 31, 2020, including the related notes, and the financial highlights for each of the periods indicated therein (collectively referred to as the “financial statements”). In our opinion, each of the Funds’ financial statements present fairly, in all material respects, the financial position of the Funds as of December 31, 2020, the results of each of their operations for the year then ended, the changes in each of their net assets for each of the two years in the period ended December 31, 2020, and each of the financial highlights for each of the periods indicated therein in conformity with accounting principles generally accepted in the United States of America.
Basis for Opinions
These financial statements are the responsibility of the Funds’ management. Our responsibility is to express an opinion on the Funds’ financial statements based on our audits. We are a public accounting firm registered with the Public Company Accounting Oversight Board (United States) (PCAOB) and are required to be independent with respect to the Funds in accordance with the U.S. federal securities laws and the applicable rules and regulations of the Securities and Exchange Commission and the PCAOB.
We conducted our audits of these financial statements in accordance with the standards of the PCAOB. Those standards require that we plan and perform the audit to obtain reasonable assurance about whether the financial statements are free of material misstatement, whether due to error or fraud.
Our audits included performing procedures to assess the risks of material misstatement of the financial statements, whether due to error or fraud, and performing procedures that respond to those risks. Such procedures included examining, on a test basis, evidence regarding the amounts and disclosures in the financial statements. Our audits also included evaluating the accounting principles used and significant estimates made by management, as well as evaluating the overall presentation of the financial statements. Our procedures included confirmation of securities owned as of December 31, 2020, by correspondence with the custodian and brokers; when replies were not received from brokers, we performed other auditing procedures. We believe that our audits provide a reasonable basis for our opinion.
PricewaterhouseCoopers LLP
Boston, Massachusetts
February 23, 2021
We have served as the auditor of one or more investment companies in AMG Funds Family since 1993.
| | |
| | |
| | Other Information (unaudited) |
TAX INFORMATION
The Funds each hereby designate the maximum amount allowable of its net taxable income as qualified dividends as provided in the Jobs and Growth Tax Relief Reconciliation Act of 2003. The 2020 Form 1099-DIV you receive for each Fund will show the tax status of all distributions paid to you during the year.
Pursuant to section 852 of the Internal Revenue Code, AMG GW&K Enhanced Core Bond ESG Fund, AMG GW&K High Income Fund, AMG GW&K Municipal Bond Fund, AMG GW&K Municipal Enhanced Yield Fund, AMG GW&K Global Allocation Fund, AMG GW&K Small Cap Core Fund, AMG Small/Mid Cap Fund, and AMG GW&K Small Cap Value Fund each hereby designate $0, $460,580, $3,524,571, $2,730,802, $4,990,089, $10,672,469, $23,549 and $111,263,992, respectively, as a capital gain distribution with respect to the taxable year ended December 31, 2020, or if subsequently determined to be different, the net capital gains of such fiscal year.
| | |
| | AMG Funds |
| | Trustees and Officers |
| The Trustees and Officers of the Trust, their business addresses, principal occupations for the past five years and ages are listed below. The Trustees provide broad supervision over the affairs of the Trust and the Funds. The Trustees are experienced executives who meet periodically throughout the year to oversee the Funds’ activities, review contractual arrangements with companies that provide services to the Funds, and | review the Funds’ performance. Unless otherwise noted, the address of each Trustee or Officer is the address of the Trust: One Stamford Plaza, 263 Tresser Blvd, Suite 949, Stamford, Connecticut 06901. There is no stated term of office for Trustees. Trustees serve until their resignation, retirement or removal in | accordance with the Trust’s organizational documents and policies adopted by the Board from time to time. The Chairman of the Trustees, President, Treasurer and Secretary of the Trust are elected by the Trustees annually. Other officers hold office at the pleasure of the Trustees. |
Independent Trustees
The following Trustees are not “interested persons” of the Trust within the meaning of the 1940 Act:
Number of Funds Overseen in
Fund Complex | Name, Age, Principal Occupation(s) During Past 5 Years and Other Directorships Held by Trustee |
● Trustee since 2012 ● Oversees 49 Funds in Fund Complex | Bruce B. Bingham, 72
Partner, Hamilton Partners (real estate development firm) (1987-2020); Director of The Yacktman Funds (2 portfolios) (2000-2012). |
● Trustee since 2003 ● Oversees 52 Funds in Fund Complex | Kurt A. Keilhacker, 57
Managing Partner, TechFund Capital (1997-Present); Managing Partner, TechFund Europe (2000-Present); Managing Partner, Elementum Ventures (2013-Present); Director, MetricStory, Inc. (2017-Present); Trustee, Wheaton College (2018-Present); Trustee, Gordon College (2001-2016); Trustee, Board Member, 6wind SA, (2002-2019). |
● Trustee since 2000 ● Oversees 49 Funds in Fund Complex | Steven J. Paggioli, 70
Independent Consultant (2002-Present); Trustee, Professionally Managed Portfolios (28 portfolios); Advisory Board Member, Sustainable Growth Advisors, LP; Independent Director, Muzinich BDC, Inc. (business development company) (2019-Present); Director, The Wadsworth Group; Independent Director, Chase Investment Counsel(2008–2019); Executive Vice President, Secretary and Director, Investment Company Administration, LLC and First Fund Distributors, INC. (1990-2001). |
● Trustee since 2013 ● Oversees 49 Funds in Fund Complex | Richard F. Powers III, 75 Adjunct Professor, U.S. Naval War College (2016-Present); Adjunct Professor, Boston College (2011-2015); Director, Ameriprise Financial Inc. (2005-2009); President and CEO of Van Kampen Investments Inc. (1998-2003); President, Morgan Stanley Client Group (2000-2002); Executive Vice President and Chief Marketing Officer of the Morgan Stanley Individual Investor Group (1984-1998). |
● Independent Chairman ● Trustee since 2000 ● Oversees 52 Funds in Fund Complex | Eric Rakowski, 62
Professor of Law, University of California at Berkeley School of Law (1990-Present); Tax Attorney at Davis Polk & Wardwell and clerked for Judge Harry T. Edwards of the U.S. Court of Appeals for the District of Columbia Circuit and for Justice William J. Brennan Jr. of the U.S. Supreme Court; Director of Harding, Loevner Funds, Inc. (9 portfolios); Trustee of Third Avenue Trust (3 portfolios) (2002-2019); Trustee of Third Avenue Variable Trust (1 portfolio) (2002-2019). |
● Trustee since 2013 ● Oversees 52 Funds in Fund Complex | Victoria L. Sassine, 55
Adjunct Professor, Babson College (2007–Present); Director, Board of Directors, PRG Group (2017-Present); CEO, Founder, Scale Smarter Partners, LLC (2018-Present); Adviser, EVOFEM Biosciences (2019-Present); Teaching Fellow, Goldman Sachs 10,000 Small Business Initiative (2010-Present); Chairperson of the Board of Directors of Business Management Associates (2018 to 2019). |
● Trustee since 2004 - AMG Funds ● Trustee since 2000 - AMG Funds II ● Oversees 49 Funds in Fund Complex | Thomas R. Schneeweis, 73
Professor Emeritus, University of Massachusetts (2013-Present); President, TRS Associates (1982-Present); Board Member, Chartered Alternative Investment Association (“CAIA”) (2002-Present); Director, CAIA Foundation (2010-2019); Director, Institute for Global Asset and Risk Management (Education) (2010-Present); Co-Owner, Quantitative Investment Technologies (2014-Present); Co-Owner, Yes Wealth Management (2018-Present); Director of Research, Yes Wealth Management (2018-Present); Partner, S Capital Wealth Advisors (2015-2018); Partner, S Capital Management, LLC (2007-2015); President, Alternative Investment Analytics, LLC, (formerly Schneeweis Partners, LLC) (2001-2013); Finance Professor, University of Massachusetts (1977-2013). |
| | |
| | AMG Funds |
| | Trustees and Officers (continued) |
Interested Trustees
Each Trustee in the following table is an “interested person” of the Trust within the meaning of the 1940 Act. Ms. Carsman is an interested person of the Trust within the meaning of the 1940 Act by virtue of her position with, and interest in securities of, AMG.
| Number of Funds Overseen in | |
| Fund Complex | Name, Age, Principal Occupation(s) During Past 5 Years and Other Directorships Held by Trustee |
● Trustee since 2011 ● Oversees 52 Funds in Fund Complex | Christine C. Carsman, 68
Senior Policy Advisor, Affiliated Managers Group, Inc. (2019-Present); Chair of the Board of Directors, AMG Funds plc (2015-2018); Director, AMG Funds plc (2010-2018); Executive Vice President, Deputy General Counsel and Chief Regulatory Counsel, Affiliated Managers Group, Inc. (2017-2018); Senior Vice President and Deputy General Counsel, Affiliated Managers Group, Inc. (2011-2016); Senior Vice President and Chief Regulatory Counsel, Affiliated Managers Group, Inc. (2007-2011); Vice President and Chief Regulatory Counsel, Affiliated Managers Group, Inc. (2004-2007); Senior Counsel, Vice President and Director of Operational Risk Management and Compliance, Wellington Management Company, LLP (1995-2004); Director of Harding, Loevner Funds, Inc. (9 portfolios) (2017-Present); Secretary and Chief Legal Officer, AMG Funds, AMG Funds I, AMG Funds II and AMG Funds III (2004-2011). |
| Officers |
Position(s) Held with Fund and
Length of Time Served | Name, Age, Principal Occupation(s) During Past 5 Years |
● President since 2018 ● Principal Executive Officer since 2018 ● Chief Executive Officer since 2018 ● Chief Operating Officer since 2007 | Keitha L. Kinne, 62
Chief Operating Officer, AMG Funds LLC (2007-Present); Chief Investment Officer, AMG Funds LLC (2008-Present); President and Principal, AMG Distributors, Inc. (2018-Present); Chief Operating Officer, AMG Distributors, Inc. (2007-Present); President, Chief Executive Officer and Principal Executive Officer, AMG Funds, AMG Funds I, AMG Funds II, AMG Funds III and AMG Funds IV (2018-Present); Chief Operating Officer, AMG Funds, AMG Funds I, AMG Funds II, and AMG Funds III (2007-Present); Chief Operating Officer, AMG Funds IV (2016-Present); Chief Operating Officer and Chief Investment Officer, Aston Asset Management, LLC (2016); President and Principal Executive Officer, AMG Funds, AMG Funds I, AMG Funds II and AMG Funds III (2012-2014); Managing Partner, AMG Funds LLC (2007-2014); President and Principal, AMG Distributors, Inc. (2012-2014); Managing Director, Legg Mason & Co., LLC (2006-2007); Managing Director, Citigroup Asset Management (2004-2006). |
● Secretary since 2015 ● Chief Legal Officer since 2015 | Mark J. Duggan, 55
Senior Vice President and Senior Counsel, AMG Funds LLC (2015-Present); Secretary and Chief Legal Officer, AMG Funds, AMG Funds I, AMG Funds II, AMG Funds III and AMG Funds IV (2015-Present); Attorney, K&L Gates, LLP (2009-2015). |
● Chief Financial Officer since 2017 ● Treasurer since 2017 ● Principal Financial Officer since 2017 ● Principal Accounting Officer since 2017 | Thomas G. Disbrow, 54
Vice President, Mutual Fund Treasurer & CFO, AMG Funds, AMG Funds LLC (2017-Present); Chief Financial Officer, Principal Financial Officer, Treasurer and Principal Accounting Officer, AMG Funds, AMG Funds I, AMG Funds II, AMG Funds III and AMG Funds IV (2017-Present); Managing Director - Global Head of Traditional Funds Product Control, UBS Asset Management (Americas), Inc. (2015-2017); Managing Director - Head of North American Funds Treasury, UBS Asset Management (Americas), Inc. (2011-2015). |
| ● Deputy Treasurer since 2017 | John A. Starace, 50
Director, Mutual Fund Accounting, AMG Funds LLC (2017-Present); Vice President, Deputy Treasurer of Mutual Funds Services, AMG Funds LLC (2014-2017); Deputy Treasurer, AMG Funds, AMG Funds I, AMG Funds II, AMG Funds III and AMG Funds IV (2017-Present); Vice President, Citi Hedge Fund Services (2010-2014); Audit Senior Manager (2005-2010) and Audit Manager (2001-2005), Deloitte & Touche LLP. |
| ● Chief Compliance Officer since 2019 | Patrick J. Spellman, 46
Vice President, Chief Compliance Officer, AMG Funds LLC (2017-Present); Chief Compliance Officer and Sarbanes-Oxley Code of Ethics Compliance Officer, AMG Funds, AMG Funds I, AMG Funds II, AMG Funds III and AMG Funds IV (2019-Present); Chief Compliance Officer, AMG Distributors, Inc., (2010-Present); Senior Vice President, Chief Compliance Officer, AMG Funds LLC (2011-2017); Anti-Money Laundering Compliance Officer, AMG Funds, AMG Funds I, AMG Funds II, and AMG Funds III (2014-2019); Anti-Money Laundering Officer, AMG Funds IV, (2016-2019); Compliance Manager, Legal and Compliance, Affiliated Managers Group, Inc. (2005-2011). |
| ● Assistant Secretary since 2016 | Maureen A. Meredith, 35
Vice President, Counsel, AMG Funds LLC (2019-Present); Director, Counsel, AMG Funds LLC (2017-2018); Vice President, Counsel, AMG Funds LLC (2015-2017); Assistant Secretary, AMG Funds, AMG Funds I, AMG Funds II, AMG Funds III and AMG Funds IV (2016-Present); Associate, Ropes & Gray LLP (2011-2015); Law Fellow, Massachusetts Appleseed Center for Law and Justice (2010-2011). |
| ● Anti-Money Laundering Compliance Officer since 2019 | Hector D. Roman, 43
Director, Legal and Compliance, AMG Funds LLC (2020-Present); Manager, Legal and Compliance, AMG Funds LLC (2017-2019); Director of Compliance, Morgan Stanley Investment Management (2015-2017); Senior Advisory, PricewaterhouseCoopers LLP (2014-2015); Risk Manager, Barclays Investment Bank (2008-2014); Anti-Money Laundering Compliance Officer, AMG Funds, AMG Funds I, AMG Funds II, AMG Funds III and AMG Funds IV (2019-Present). |
| | |
| | |
| | Approval of Subadvisory Agreements |
AMG Managers Skyline Special Equities Fund: Approval of Subadvisory Agreements on December 3, 2020 At a telephonic meeting held on December 3, 20201, the Board of Trustees (the “Board” or the “Trustees”), and separately a majority of the Trustees who are not “interested persons” of AMG Funds (the “Trust”) (the “Independent Trustees”), unanimously voted to approve the interim subadvisory agreement between AMG Funds LLC (the “Investment Manager”) and GW&K Investment Management, LLC (“GW&K”) with respect to AMG Managers Skyline Special Equities Fund (the “Fund”) (the “Interim Subadvisory Agreement”), the new subadvisory agreement between the Investment Manager and GW&K with respect to the Fund (the “New Subadvisory Agreement” and together with the Interim Subadvisory Agreement, the “Agreements”), and the presentation of the New Subadvisory Agreement for shareholder approval at a special meeting to be held for such purpose. The Independent Trustees were separately represented by independent legal counsel in their consideration of the Agreements. In considering the Agreements, the Trustees considered the information relating to the Fund and GW&K provided to them in connection with the meeting on December 3, 2020 and other meetings of the Board throughout the last twelve months, as well as in prior years. In considering the Agreements, the Trustees also considered information relating to the eleven other funds that GW&K sub-advises in the AMG Funds Family of Funds, which, as of December 3, 2020, consisted of 49 funds (the “AMG Funds Complex”). Prior to voting, the Independent Trustees: (a) reviewed the foregoing information; (b) received materials from their independent legal counsel discussing the legal standards applicable to their consideration of the Agreements; and (c) met with their independent legal counsel in a private session at which no representatives of management were present. NATURE, EXTENT AND QUALITY OF SERVICES In considering the nature, extent and quality of the services to be provided by GW&K, the Trustees reviewed information relating to GW&K’s financial condition, operations and personnel and the investment philosophy, strategies and techniques (the “Investment Strategy”) that are intended to be used by GW&K in managing the Fund. Among other things, at this meeting and/or prior meetings, the Trustees reviewed information on portfolio management and other professional staff, information regarding GW&K’s organizational and management structure, GW&K’s compliance policies | and procedures, and GW&K’s brokerage policies and practices. The Trustees considered specific information provided regarding the experience of the individuals at GW&K that are expected to have portfolio management responsibility for the Fund. The Trustees noted that one proposed portfolio manager joined GW&K in 2005 and the other proposed portfolio manager joined GW&K in 2008. The Trustees further noted that one of the proposed portfolio managers serves as co-portfolio manager on other funds subadvised by GW&K in the AMG Funds Complex. In the course of their deliberations, the Trustees evaluated, among other things: (a) the expected services to be rendered by GW&K to the Fund; (b) the qualifications and experience of GW&K’s personnel; and (c) GW&K’s compliance program. The Trustees additionally considered GW&K’s risk management processes. The Trustees also took into account the financial condition of GW&K with respect to its ability to provide the services required under the Agreements and noted that, as of September 30, 2020, GW&K managed approximately $47 billion in assets. PERFORMANCE Because GW&K was proposing to manage the Fund with its small cap value investment strategy, the Trustees noted that they could not draw any conclusions regarding the performance of the Fund. The Trustees, however, considered the performance of GW&K with respect to its Small Cap Value Composite. The Trustees further considered the performance of the other funds in the AMG Funds Complex sub-advised by GW&K. SUBADVISORY FEES, PROFITABILITY AND ECONOMIES OF SCALE The Trustees noted that the Investment Manager, and not the Fund, is responsible for paying the fees charged by GW&K. In considering the anticipated profitability of GW&K with respect to the provision of subadvisory services to the Fund, the Trustees considered information regarding GW&K’s organization, management and financial stability. The Trustees noted that, because GW&K is an affiliate of the Investment Manager, a portion of GW&K’s revenues or anticipated profits might be shared directly or indirectly with the Investment Manager. The Trustees also noted that the subadvisory fee rate to be paid to GW&K under each Agreement was lower than the rate paid to Skyline Asset Management, L.P. (“Skyline”) under the former subadvisory agreement between the Investment Manager and Skyline with respect to the Fund. | The Board took into account management’s discussion of the proposed subadvisory fee structure, and the services GW&K is expected to provide in performing its functions under the Agreements. The Trustees also were provided, in advance of their June 25, 2020 meeting, with the profitability of GW&K with respect to the other funds it sub-advises in the AMG Funds Complex. Based on the foregoing, the Trustees concluded that the profitability to GW&K is expected to be reasonable and that GW&K is not expected to realize material benefits from economies of scale that would warrant adjustments to the subadvisory fees at this time. Also with respect to economies of scale, the Trustees noted that as the Fund’s assets increase over time, the Fund may realize other economies of scale to the extent the increase in assets is proportionally greater than the increase in certain other expenses. In addition, the Trustees considered other potential benefits of the subadvisory relationship to GW&K, including, among others, the potential broadening of GW&K’s small cap value investment capabilities, as well as the indirect benefits that GW&K may receive from GW&K’s relationship with the Fund, including any so-called “fallout benefits” to GW&K, such as reputational value derived from GW&K serving as subadviser to the Fund, which bears GW&K’s name. Taking into account all of the foregoing, the Trustees concluded that, in light of the nature, extent and quality of the services to be provided by GW&K, and the other considerations noted above with respect to GW&K, the Fund’s subadvisory fees are reasonable. * * * * After consideration of the foregoing, the Trustees reached the following conclusions (in addition to the conclusions discussed above) regarding each Agreement: (a) GW&K has demonstrated that it possesses the capability and resources to perform the duties required of it under each Agreement; (b) GW&K’s Investment Strategy is appropriate for pursuing the Fund’s investment objectives; (c) GW&K is reasonably likely to execute its investment strategy consistently over time; and (d) GW&K maintains appropriate compliance programs. Based on all of the above-mentioned factors and their related conclusions, with no single factor or conclusion being determinative and with each Trustee not necessarily attributing the same weight to each factor, the Trustees concluded that approval of each Agreement would be in the best interests of the Fund and its shareholders. Accordingly, on December 3, 2020, the Trustees, and separately a majority of the Independent Trustees, unanimously voted to approve each Agreement. |
| | |
| | |
| | Approval of Subadvisory Agreements (continued) |
AMG Managers Global Income Opportunity Fund: Approval of Subadvisory Agreements on December 3, 2020 At a telephonic meeting held on December 3, 20201, the Board of Trustees (the “Board” or the “Trustees”), and separately a majority of the Trustees who are not “interested persons” of AMG Funds III (the “Trust”) (the “Independent Trustees”), unanimously voted to approve the interim subadvisory agreement between AMG Funds LLC (the “Investment Manager”) and GW&K Investment Management, LLC (“GW&K”) with respect to AMG Managers Global Income Opportunity Fund (the “Fund”) (the “Interim Subadvisory Agreement”), the new subadvisory agreement between the Investment Manager and GW&K with respect to the Fund (the “New Subadvisory Agreement” and together with the Interim Subadvisory Agreement, the “Agreements”), and the presentation of the New Subadvisory Agreement for shareholder approval at a special meeting to be held for such purpose. The Independent Trustees were separately represented by independent legal counsel in their consideration of the Agreements. In considering the Agreements, the Trustees considered the information relating to the Fund and GW&K provided to them in connection with the meeting on December 3, 2020 and other meetings of the Board throughout the last twelve months, as well as in prior years. In considering the Agreements, the Trustees also considered information relating to the eleven other funds that GW&K sub-advises in the AMG Funds Family of Funds, which, as of December 3, 2020, consisted of 49 funds (the “AMG Funds Complex”). Prior to voting, the Independent Trustees: (a) reviewed the foregoing information; (b) received materials from their independent legal counsel discussing the legal standards applicable to their consideration of the Agreements; and (c) met with their independent legal counsel in a private session at which no representatives of management were present. NATURE, EXTENT AND QUALITY OF SERVICES In considering the nature, extent and quality of the services to be provided by GW&K, the Trustees reviewed information relating to GW&K’s financial condition, operations and personnel and the investment philosophy, strategies and techniques (the “Investment Strategy”) that are intended to be used by GW&K in managing the Fund. Among other things, at this meeting and/or prior meetings, the Trustees reviewed information on portfolio management and other professional staff, information regarding GW&K’s organizational and management structure, GW&K’s compliance policies | and procedures, and GW&K’s brokerage policies and practices. The Trustees considered specific information provided regarding the experience of the individuals at GW&K that are expected to have portfolio management responsibility for the Fund. The Trustees noted that one proposed portfolio manager joined GW&K in 2005, and one proposed portfolio manager joined GW&K in 2013. The Trustees further noted that one of the proposed portfolio managers serves as a portfolio manager on other funds subadvised by GW&K in the AMG Funds Complex. In the course of their deliberations, the Trustees evaluated, among other things: (a) the expected services to be rendered by GW&K to the Fund; (b) the qualifications and experience of GW&K’s personnel; and (c) GW&K’s compliance program. The Trustees additionally considered GW&K’s risk management processes. The Trustees also took into account the financial condition of GW&K with respect to its ability to provide the services required under the Agreements and noted that, as of September 30, 2020, GW&K managed approximately $47 billion in assets. PERFORMANCE Because GW&K was proposing to manage the Fund with its high income investment strategy, the Trustees noted that they could not draw any conclusions regarding the performance of the Fund. The Trustees, however, considered the performance of GW&K with respect to its Short Term Focused High Income Composite. The Trustees further considered the performance of the other funds in the AMG Funds Complex sub-advised by GW&K. SUBADVISORY FEES, PROFITABILITY AND ECONOMIES OF SCALE The Trustees noted that the Investment Manager, and not the Fund, is responsible for paying the fees charged by GW&K. In considering the anticipated profitability of GW&K with respect to the provision of subadvisory services to the Fund, the Trustees considered information regarding GW&K’s organization, management and financial stability. The Trustees noted that, because GW&K is an affiliate of the Investment Manager, a portion of GW&K’s revenues or anticipated profits might be shared directly or indirectly with the Investment Manager. The Trustees also noted that the subadvisory fee rate to be paid to GW&K under each Agreement was lower than the rate paid to Loomis, Sayles & Company, L.P. (“Loomis”) under the former subadvisory agreement between the Investment Managers and Loomis with respect to the Fund. | The Board took into account management’s discussion of the proposed subadvisory fee structure, and the services GW&K is expected to provide in performing its functions under the Agreements. The Trustees also were provided, in advance of their June 25, 2020 meeting, with the profitability of GW&K with respect to the other funds it sub-advises in the AMG Funds Complex. Based on the foregoing, the Trustees concluded that the profitability to GW&K is expected to be reasonable and that GW&K is not expected to realize material benefits from economies of scale that would warrant adjustments to the subadvisory fees at this time. Also with respect to economies of scale, the Trustees noted that as the Fund’s assets increase over time, the Fund may realize other economies of scale to the extent the increase in assets is proportionally greater than the increase in certain other expenses. In addition, the Trustees considered other potential benefits of the subadvisory relationship to GW&K, including, among others, the potential broadening of GW&K’s short term high income investment capabilities, as well as the indirect benefits that GW&K may receive from GW&K’s relationship with the Fund, including any so-called “fallout benefits” to GW&K, such as reputational value derived from GW&K serving as subadviser to the Fund, which bears GW&K’s name. Taking into account all of the foregoing, the Trustees concluded that, in light of the nature, extent and quality of the services to be provided by GW&K, and the other considerations noted above with respect to GW&K, the Fund’s subadvisory fees are reasonable. * * * * After consideration of the foregoing, the Trustees reached the following conclusions (in addition to the conclusions discussed above) regarding each Agreement: (a) GW&K has demonstrated that it possesses the capability and resources to perform the duties required of it under each Agreement; (b) GW&K’s Investment Strategy is appropriate for pursuing the Fund’s investment objectives; (c) GW&K is reasonably likely to execute its investment strategy consistently over time; and (d) GW&K maintains appropriate compliance programs. Based on all of the above-mentioned factors and their related conclusions, with no single factor or conclusion being determinative and with each Trustee not necessarily attributing the same weight to each factor, the Trustees concluded that approval of each Agreement would be in the best interests of the Fund and its shareholders. Accordingly, on |
| | |
| | |
| | Approval of Subadvisory Agreements (continued) |
December 3, 2020, the Trustees, and separately a majority of the Independent Trustees, unanimously voted to approve each Agreement. 1 The Trustees determined that the conditions surrounding the COVID-19 virus constituted unforeseen or emergency circumstances and that reliance on the Securities and Exchange | Commission’s (“SEC”) exemptive order, which provides relief from the in-person voting requirements of the 1940 Act in certain circumstances (the “In-Person Relief”), was necessary or appropriate due to the circumstances related to current or potential effects of COVID-19. The Trustees unanimously wished to rely on the In-Person Relief with respect to the approval of those matters on the | agenda for the December 3, 2020 meeting that would otherwise require in-person votes under the 1940 Act. See Investment Company Release No. 33897 (June 19, 2020). This exemptive order supersedes, in part, a similar, earlier exemptive order issued by the SEC (Investment Company Release No. 33824 (March 25, 2020)). |
THIS PAGE INTENTIONALLY LEFT BLANK
INVESTMENT MANAGER AND ADMINISTRATOR AMG Funds LLC One Stamford Plaza 263 Tresser Blvd, Suite 949 Stamford, CT 06901 800.548.4539 DISTRIBUTOR AMG Distributors, Inc. One Stamford Plaza 263 Tresser Blvd, Suite 949 Stamford, CT 06901 800.548.4539 SUBADVISER GW&K Investment Management, LLC 222 Berkeley St. Boston, MA 02116 | CUSTODIAN The Bank of New York Mellon 111 Sanders Creek Parkway East Syracuse, NY 13057 LEGAL COUNSEL Ropes & Gray LLP Prudential Tower, 800 Boylston Street Boston, MA 02199-3600 TRANSFER AGENT BNY Mellon Investment Servicing (US) Inc. Attn: AMG Funds 4400 Computer Drive Westborough, MA 01581 800.548.4539 | This report is prepared for the Funds’ shareholders. It is authorized for distribution to prospective investors only when preceded or accompanied by an effective prospectus. To receive a free copy of the prospectus or Statement of Additional Information, which includes additional information about Fund Trustees, please contact us by calling 800.548.4539. Distributed by AMG Distributors, Inc., member FINRA/SIPC. Current net asset values per share for each Fund are available on the Funds’ website at amgfunds.com. A description of the policies and procedures each Fund uses to vote its proxies is available: (i) without charge, upon request, by calling 800.548.4539, or (ii) on the Securities and Exchange Commission’s (SEC) website at sec.gov. For information regarding each Fund’s proxy voting record for the 12-month period ended June 30, call 800.548.4539 or visit the SEC website at sec.gov. The Funds file their complete schedule of portfolio holdings with the SEC for the first and third quarters of each fiscal year as an exhibit to their reports on Form N-PORT. The Funds’ portfolio holdings on Form N-PORT are available on the SEC’s website at sec.gov and the Fund’s website at amgfunds.com. To review a complete list of the Funds’ portfolio holdings, or to view the most recent semi-annual report or annual report, please visit amgfunds.com. |
| | AFFILIATE SUBADVISED FUNDS | | | AMG TimesSquare Emerging Markets Small Cap | | | AMG Managers Emerging Opportunities | |
| | | | | AMG TimesSquare Global Small Cap | | | WEDGE Capital Management L.L.P. | |
| | BALANCED FUNDS | | | AMG TimesSquare International Small Cap | | | Next Century Growth Investors LLC | |
| | AMG GW&K Global Allocation | | | AMG TimesSquare Mid Cap Growth | | | RBC Global Asset Management (U.S.) Inc. | |
| | GW&K Investment Management, LLC | | | AMG TimesSquare Small Cap Growth | | | AMG Managers Fairpointe Mid Cap | |
| | | | | TimesSquare Capital Management, LLC | | | Fairpointe Capital LLC | |
| | AMG FQ Global Risk-Balanced | | | | | | | |
| | First Quadrant, L.P. | | | AMG Yacktman | | | AMG Managers LMCG Small Cap Growth | |
| | | | | AMG Yacktman Focused | | | LMCG Investments, LLC | |
| | EQUITY FUNDS | | | AMG Yacktman Focused Fund - Security Selection | | | | |
| | AMG FQ Tax-Managed U.S. Equity | | | Only | | | AMG Managers Montag & Caldwell Growth | |
| | AMG FQ Long-Short Equity | | | AMG Yacktman Special Opportunities | | | Montag & Caldwell, LLC | |
| | First Quadrant, L.P. | | | Yacktman Asset Management LP | | | AMG Managers Pictet International | |
| | | | | | | | | |
| | AMG Frontier Small Cap Growth | | | FIXED INCOME FUNDS | | | Pictet Asset Management Limited | |
| | Frontier Capital Management Co., LLC | | | AMG GW&K Core Bond ESG | | | AMG Managers Silvercrest Small Cap | |
| | AMG GW&K Small Cap Core | | | AMG GW&K Enhanced Core Bond ESG | | | Silvercrest Asset Management Group LLC | |
| | AMG GW&K Small Cap Value | | | AMG GW&K High Income | | | AMG Managers Special Equity | |
| | AMG GW&K Small/Mid Cap | | | AMG GW&K Municipal Bond | | | Ranger Investment Management, L.P. | |
| | AMG GW&K Mid Cap | | | AMG GW&K Municipal Enhanced Yield | | | Lord, Abbett & Co. LLC | |
| | AMG GW&K Emerging Markets Equity | | | GW&K Investment Management, LLC | | | Smith Asset Management Group, L.P. | |
| | AMG GW&K Emerging Wealth Equity | | | | | | Federated MDTA LLC | |
| | AMG GW&K International Small Cap | | | OPEN-ARCHITECTURE FUNDS | | | | |
| | GW&K Investment Management, LLC | | | | | | FIXED INCOME FUNDS | |
| | | | | EQUITY FUNDS | | | AMG Managers DoubleLine Core Plus Bond | |
| | AMG Renaissance Large Cap Growth | | | AMG Managers Brandywine | | | DoubleLine Capital LP | |
| | The Renaissance Group LLC | | | AMG Managers Brandywine Blue | | | | |
| | | | | Friess Associates, LLC | | | AMG Managers Loomis Sayles Bond | |
| | AMG River Road Dividend All Cap Value | | | | | | Loomis, Sayles & Company, L.P. | |
| | AMG River Road Focused Absolute Value | | | AMG Managers CenterSquare Real Estate | | | | |
| | AMG River Road Long-Short | | | CenterSquare Investment Management LLC | | | | |
| | AMG River Road Small-Mid Cap Value | | | | | | | |
| | AMG River Road Small Cap Value | | | | | | | |
| | River Road Asset Management, LLC | | | | | | | |
| | | | | | | | | |
| | | | | | | | | |
| | | | | | | | | |
| | | | | | | | | |
| | | | | | | | | |
| | | | | | | | | |
| | | | | | | | | |
| | | | | | | | | |
| | | | | | | | | |
| | | | | | | | | |
| | Annual Report |
| | | AMG Funds | | |
| | | | | |
| | | December 31, 2020 |
| | | | | |
| | |  | | |
| | | | | |
| | | AMG Renaissance Large Cap Growth Fund |
| | | Class N: MRLTX | Class I: MRLSX | Class Z: MRLIX |
| | | | | |
| | | | | |
| | | | | |
| | | | | |
| | |
| | |
| | AMG Funds |
| | Annual Report — December 31, 2020 |
| | TABLE OF CONTENTS | PAGE |
| | LETTER TO SHAREHOLDERS | 2 |
| | ABOUT YOUR FUND’S EXPENSES | 3 |
| | PORTFOLIO MANAGER’S COMMENTS, FUND SNAPSHOTS AND SCHEDULE OF PORTFOLIO INVESTMENTS | 4 |
| | FINANCIAL STATEMENTS | |
| | Statement of Assets and Liabilities | 9 |
| | Balance sheet, net asset value (NAV) per share computations and cumulative distributable earnings (loss) | |
| | | |
| | Statement of Operations | 11 |
| | Detail of sources of income, expenses, and realized and unrealized gains (losses) during the fiscal year | |
| | | |
| | Statements of Changes in Net Assets | 12 |
| | Detail of changes in assets for the past two fiscal years | |
| | | |
| | Financial Highlights | 13 |
| | Historical net asset values per share, distributions, total returns, income and expense ratios, turnover ratios and net assets | |
| | | |
| | Notes to Financial Statements | 16 |
| | Accounting and distribution policies, details of agreements and transactions with Fund management and affiliates, and descriptions of certain investment risks | |
| | | |
| | REPORT OF INDEPENDENT REGISTERED PUBLIC ACCOUNTING FIRM | 21 |
| | | |
| | OTHER INFORMATION | 22 |
| | | |
| | TRUSTEES AND OFFICERS | 23 |
| | Nothing contained herein is to be considered an offer, sale or solicitation of an offer to buy shares of any series of the AMG Funds Family of Funds. Such offering is made only by prospectus, which includes details as to offering price and other material information. |
| | Letter to Shareholders |
Dear Shareholder:
The fiscal year ending December 31, 2020, was a volatile period for financial markets that featured a dramatic selloff and extraordinary rebound amid the unprecedented global effort to stop the COVID-19 pandemic. Early in the year, equities achieved new record highs against the backdrop of a healthy economy and strong investor sentiment. However, a broad-based selloff occurred amid a global flight to quality as investors assessed the scope of the unfolding COVID-19 pandemic, a deteriorating economy, and skyrocketing unemployment. An oil price war initiated between Saudi Arabia and Russia only made matters worse. From its peak in mid-February 2020, the S&P 500® Index declined (33.79)% over the span of a few weeks, halting the eleven-year equity bull market. In response to the crisis, global central banks and governments were quick to flood the market with massive fiscal and monetary stimulus which helped to stabilize the market and led to an impressive recovery in risk assets, albeit a very uneven one. So despite the volatility, the S&P 500® Index still achieved an 18.40% return for 2020 while effective COVID-19 vaccines and further government stimulus bolstered investor optimism for a brighter future in 2021.
During the year there was very wide dispersion in performance across sectors, with information technology and consumer discretionary sectors leading the market with returns of 43.88% and 33.30%, respectively. On the other hand, companies in the energy sector fell (33.69)%, and financials and real estate also produced slightly negative returns. Growth stocks significantly outperformed value stocks for the period with returns of 38.49% and 2.80% for the Russell 1000® Growth and Russell 1000® Value Indexes, respectively. Small cap stocks endured a wild ride in 2020 as the Russell 2000® Index experienced both its best quarter (fourth quarter 2020) and worst quarter (first quarter 2020) on record. For the year as a whole, small cap returns were relatively in line with the broader market as the Russell 2000® Index gained 19.96% in 2020. Outside the U.S., emerging markets outperformed developed markets with an 18.31% return for the MSCI Emerging Markets Index compared to a 7.82% return for the MSCI EAFE Index.
Interest rates fell dramatically and led to strong returns for bond investors as the U.S. Federal Reserve (the Fed) slashed short-term rates in response to the slowing economy. The 10-year Treasury yield ended the year near a historic low yield of 0.93%. The Bloomberg Barclays U.S. Aggregate Bond Index, a broad measure of U.S. bond market performance, returned 7.51% over the period. Investment grade corporate bonds rebounded from the selloff early in the year and returned 9.89% in 2020. Riskier high yield bonds lagged the investment grade market with a 7.11% return as measured by the return of the Bloomberg Barclays U.S. Corporate High Yield Bond Index.
AMG Funds appreciates the privilege of providing investment tools to you and your clients. Our foremost goal is to provide investment solutions that help our shareholders successfully reach their long-term investment goals. AMG Funds provides access to a distinctive array of actively managed return-oriented investment strategies. We thank you for your continued confidence and investment in AMG Funds. You can rest assured that under all market conditions our team is focused on delivering excellent investment management services for your benefit.
Respectfully,

Keitha Kinne
President
AMG Funds
| Average Annual Total Returns | | Periods ended
December 31, 2020* |
| Stocks: | | | | 1 Year | | 3 Years | | 5 Years |
| Large Cap | | (S&P 500® Index) | | 18.40% | | 14.18% | | 15.22% |
| | | | | | | | | |
| Small Cap | | (Russell 2000® Index) | | 19.96% | | 10.25% | | 13.26% |
| | | | | | | | | |
| International | | (MSCI All Country World Index ex USA) | | 10.65% | | 4.88% | | 8.93% |
| Bonds: | | | | | | | | |
| | | | | | | | | |
| Investment Grade | | (Bloomberg Barclays U.S. Aggregate Bond Index) | | 7.51% | | 5.34% | | 4.44% |
| | | | | | | | | |
| High Yield | | (Bloomberg Barclays U.S. Corporate High Yield Bond Index) | | 7.11% | | 6.24% | | 8.59% |
| | | | | | | | | |
| Tax-exempt | | (Bloomberg Barclays Municipal Bond Index) | | 5.21% | | 4.64% | | 3.91% |
| | | | | | | | | |
| Treasury Bills | | (ICE BofAML U.S. 6-Month Treasury Bill Index) | | 1.05% | | 1.84% | | 1.43% |
*Source: FactSet. Past performance is no guarantee of future results.
| | |
| | |
| | |
| | About Your Fund’s Expenses |
As a shareholder of a Fund, you may incur two types of costs: (1) transaction costs, which may include sales charges (loads) on purchase payments; redemption fees; and exchange fees; and (2) ongoing costs, including management fees; distribution (12b-1) fees; and other Fund expenses. This example is intended to help you understand your ongoing costs (in dollars) of investing in the Fund and to compare these costs with the ongoing costs of investing in other mutual funds. The example is based on $1,000 invested at the beginning of the period and held for the entire period as indicated below. ACTUAL EXPENSES The first line of the following table provides information about the actual account values and | | actual expenses. You may use the information in this line, together with the amount you invested, to estimate the expenses that you paid over the period. Simply divide your account value by $1,000 (for example, an $8,600 account value divided by $1,000 = 8.6), then multiply the result by the number in the first line under the heading entitled “Expenses Paid During Period” to estimate the expenses you paid on your account during this period. HYPOTHETICAL EXAMPLE FOR COMPARISON PURPOSES The second line of the following table provides information about hypothetical account values and hypothetical expenses based on the Fund’s actual expense ratio and an assumed annual rate of return of 5% before expenses, which is not the Fund’s | | actual return. The hypothetical account values and expenses may not be used to estimate the actual ending account balance or expenses you paid for the period. You may use this information to compare the ongoing costs of investing in the Fund and other funds by comparing this 5% hypothetical example with the 5% hypothetical examples that appear in the shareholder reports of other funds. Please note that the expenses shown in the table are meant to highlight your ongoing costs only and do not reflect any transactional costs, such as sales charges (loads), redemption fees, or exchange fees. Therefore, the second line of the table is useful in comparing ongoing costs only, and will not help you determine the relative total costs of owning different funds. |
| | | | | |
| | | | | |
Six Months Ended
December 31, 2020 | | Expense
Ratio for
the Period | | Beginning
Account Value
07/01/20 | | Ending
Account Value
12/31/20 | | Expenses Paid
During
the Period* |
| AMG Renaissance Large Cap Growth Fund |
| Based on Actual Fund Return |
| Class N | | 1.00% | | $1,000 | | $1,217 | | $5.57 |
| Class I | | 0.75% | | $1,000 | | $1,218 | | $4.18 |
| Class Z | | 0.66% | | $1,000 | | $1,218 | | $3.68 |
| Based on Hypothetical 5% Annual Return |
| Class N | | 1.00% | | $1,000 | | $1,020 | | $5.08 |
| Class I | | 0.75% | | $1,000 | | $1,021 | | $3.81 |
| Class Z | | 0.66% | | $1,000 | | $1,022 | | $3.35 |
| * | Expenses are equal to the Fund’s annualized expense ratio multiplied by the average account value over the period, multiplied by the number of days in the most recent fiscal half-year (184), then divided by 366. |
| | |
| | |
| | AMG Renaissance Large Cap Growth Fund |
| | Portfolio Manager’s Comments (unaudited) |
The AMG Renaissance Large Cap Growth Fund (Class N shares) (the Fund) rose 23.54% for the fiscal year ending December 31, 2020, behind the primary benchmark, the Russell 1000® Growth Index, which rose 38.49%. MARKET OVERVIEW The stock market posted strong gains during the fourth quarter, continuing its recovery from the market decline earlier in the year. The S&P 500® Index recorded an all-time high in December, with the energy, financials, and technology sectors leading the market for the quarter, while the consumer staples and utilities sectors were relative laggards. Bond yields crept upward, as 10-year Treasury yields rose 0.24% to 0.87% over the quarter but yields remain near all-time lows. The financial markets have been buffeted by contradictory news regarding the COVID-19 pandemic over the past several months. Reported cases and hospitalizations have surged across the country, resulting in renewed lockdowns of schools, restaurants, and many other businesses. However, the progress toward development of effective vaccines has been remarkable, with the first vaccine distributed in December and more to follow over the next several months. The financial markets have clearly focused on the positive news regarding vaccines and the implications for a significant economic recovery over the next several quarters. Forecasts for S&P 500 earnings indicate expectations of a continued earnings decline on a year-over-year basis for the fourth quarter of 2020. However, for 2021 as a whole, expectations are for an earnings recovery of 22% vs. 2020 levels, which is consistent with many economists’ forecasts of GDP growth of 5–6% in 2021. Clearly there are still significant risks to the economy as long as the pandemic continues to be active. However, the unprecedented stimulus programs initiated by Congress (totaling over $3 trillion with the passage of the most recent program), extraordinarily low interest rates initiated by the U.S. Federal Reserve (the Fed), and ongoing progress in the development and distribution of vaccines should help the economy recover over the next year. One caveat is that the risk appetite of some investors has markedly increased over the past year (more on this in the pages that follow). While this has raised the risk level of some sectors and industries, it has created opportunities in other areas of the market that have not been the subject of speculative | | interest. We remain focused on identifying companies with strong fundamentals that are selling at reasonable valuations and believe that our portfolio represents good investment opportunity as we enter 2021.
Among the many unpredictable events this year, 2020 may be remembered for the unusual dominance of a handful of stocks on market index returns. The so-called FANGMA stocks, comprised of Facebook (FB), Amazon (AMZN), Netflix (NFLX), Google/Alphabet (GOOGL), Microsoft (MSFT) and Apple (AAPL), represented over 20% of the S&P 500® Index at year-end and accounted for over 60% of the index’s 18.40% return for the year (and also more than half of the Russell 1000® Growth Index return, given their higher weight in that index). While in many cases these companies exhibit strong fundamentals, their large size resulted in many indices becoming top-heavy. We believe that many good investment opportunities continue to exist beyond the most popular and highly weighted stocks in many market indices.
Another unusual facet of the markets in 2020 was the outperformance of the most highly valued stocks. Historically, stocks with attractive valuation metrics such as free cash flow yield (free cash flow/price) have outperformed lower-ranked issues, but in 2020 this dynamic was reversed. Stocks offering lower free cash flow yields were among the strongest performers in the market, particularly in growth-oriented indices. In part, this represents a higher level of risk tolerance on the part of some investors, who may be more willing to invest in less profitable companies to achieve supposedly better returns.
A good example of this is Tesla (TSLA), which was an extraordinary performer in 2020 despite generating only nominal free cash flow. For perspective, the market capitalization of Tesla at year-end was larger than the market capitalization of all the major car manufacturers, including Volkswagen, Toyota, Honda, General Motors, Ford, Daimler, and BMW combined, despite the fact that those other car companies sold roughly 17x as many cars as Tesla during the third quarter of 2020. (Tesla’s addition to the S&P 500 on December 21 made it the 6th largest stock in the index.) According to CEO Elon Musk, Tesla was “about a month from bankruptcy” up to mid-year 2019, and the story of how the company recovered from that scenario is undoubtedly impressive. Even so, it is debatable at best whether the stock is valued appropriately relative to its competitors. | | The top-heavy concentration in market indices and the underperformance of attractively valued stocks have been headwinds for our investment approach over the past year, but we remain committed to our disciplined investment approach. We are confident in the long-term effectiveness of our investment process, particularly as the market environment normalizes going forward. In terms of the overall market, the sharp recovery from the market’s tumble earlier this year has rightly raised concerns about whether the recovery has been too strong and too fast. However, a comparison of this year’s market action with the last significant market decline and recovery in 2008–2009 suggests that the current recovery is not unprecedented. The market decline in 2008 and early 2009 was long and steady, while the decline earlier this year was very sharp and quick. However, comparing the 2009 recovery with 2020 illustrates that, in fact, the stock market recovery has been virtually the same in both cases. Significant action by the Fed (quantitative easing) and the federal government (stimulus programs) helped spark both recoveries, even in the face of near-term declines in corporate profits. PERFORMANCE REVIEW For the year 2020, our selection in health care along with our underweight in consumer staples made the most positive contribution to relative returns for the year. Notable performers over the period include Horizon Therapeutics PLC (+166%), NVIDIA Corp. (+122%), and Apple, Inc. (+82%). On the negative side, our selections in the consumer discretionary and information technology sectors detracted the most from our relative returns for the year. Notable underperformers include Synchrony Financial (-63%), Southwest Airlines Co. (-54%), and Crown Holdings, Inc. (-35%). OUTLOOK Looking forward, it is worth noting that the 2009 recovery was followed by many years of further market gains, despite volatility along the way. While the current market environment surely presents risks, a longer-term perspective of investment opportunities, particularly given recent advances in the development of COVID vaccines, suggests that stocks continue to offer good investment potential. This commentary reflects the viewpoints of Renaissance Investment Management and is not intended as a forecast or guarantee of future results. |
| | | | | |
| | | | | |
| | |
| | |
| | AMG Renaissance Large Cap Growth Fund |
| | Portfolio Manager’s Comments (continued) |
CUMULATIVE TOTAL RETURN PERFORMANCE
AMG Renaissance Large Cap Growth Fund’s cumulative total return is based on the daily change in net asset value (NAV), and assumes that all dividends and distributions were reinvested. This graph compares a hypothetical $10,000 investment made in the AMG Renaissance Large Cap Growth Fund’s Class N shares on December 31, 2010, to a $10,000 investment made in the Russell 1000® Growth Index for the same time period. The graph and table do not reflect the deduction of taxes that a shareholder would pay on a Fund distribution or redemption of shares. The listed returns for the Fund are net of expenses and the returns for the index exclude expenses. Total returns would have been lower had certain expenses not been reduced.

The table below shows the average annual total returns for the AMG Renaissance Large Cap Growth Fund and the Russell 1000® Growth Index for the same time periods ended December 31, 2020.
| Average Annual Total Returns1 | | One Year | | Five
Years | | Ten Years |
| AMG Renaissance Large Cap Growth Fund2, 3, 4, 5, 6 | | | | | | |
| Class N | | 23.54% | | 15.52% | | 13.78% |
| Class I | | 23.90% | | 15.83% | | 14.13% |
| Class Z | | 23.90% | | 15.95% | | 14.28% |
| Russell 1000® Growth Index7 | | 38.49% | | 21.00% | | 17.21% |
The performance data shown represents past performance. Past performance is not a guarantee of future results. Current performance may be lower or higher than the performance data quoted. The investment return and principal value of an investment will fluctuate so that an investor’s shares, when redeemed, may be worth more or less than their original cost.
Investors should carefully consider the Fund’s investment objectives, risks, charges and expenses before investing. For performance information through the most recent month end, current net asset values per share for the Fund and other information, please call 800.548.4539 or visit our website at amgfunds.com for a free prospectus. Read it carefully before investing or sending money.
Distributed by AMG Distributors, Inc., member FINRA/SIPC.
| 1 | Total return equals income yield plus share price change and assumes reinvestment of all dividends and capital gain distributions. Returns are net of fees and may reflect offsets of Fund expenses as described in the prospectus. No adjustment has been made for taxes payable by shareholders on their reinvested dividends and capital gain distributions. Returns for periods greater than one year are annualized. The listed returns on the Fund are net of expenses and based on the published NAV as of December 31, 2020. All returns are in U.S. dollars ($). |
| 2 | From time to time, the Fund’s investment manager has waived its fees and/or absorbed Fund expenses, which has resulted in higher returns. |
| 3 | The Fund invests in growth stocks, which may be more sensitive to market movements because their prices tend to reflect future investor expectations rather than just current profits. Growth stocks may underperform value stocks during given periods. |
| 4 | Companies that are in similar businesses may be similarly affected by particular economic or market events; to the extent the Fund has substantial holdings within a particular sector, the risks associated with that sector increase. |
| 5 | The Fund invests in large-capitalization companies that may underperform other stock funds (such as funds that focus on small- and medium-capitalization companies) when stocks of large-capitalization companies are out of favor. |
| 6 | Market prices of investments held by the Fund may fall rapidly or unpredictably due to a variety of economic or political factors, market conditions, disasters or public health issues, or in response to events that affect particular industries or companies. |
| 7 | The Russell 1000® Growth Index is a market capitalization weighted index that measures the performance of those Russell 1000® companies with higher price-to-book ratios and higher forecasted growth values. Unlike the Fund, the Russell 1000® Growth Index is unmanaged, is not available for investment and does not incur expenses. |
The Russell 1000® Growth Index is a trademark of the London Stock Exchange Group companies.
Not FDIC insured, nor bank guaranteed. May lose value.
| | |
| | AMG Renaissance Large Cap Growth Fund |
| | Fund Snapshots (unaudited) |
| | December 31, 2020 |
PORTFOLIO BREAKDOWN
| Sector | % of
Net Assets |
| Information Technology | 40.7 | |
| Health Care | 16.7 | |
| Consumer Discretionary | 11.1 | |
| Communication Services | 10.8 | |
| Industrials | 9.9 | |
| Financials | 3.3 | |
| Consumer Staples | 3.2 | |
| Materials | 1.9 | |
| Real Estate | 1.8 | |
| Short-Term Investments | 0.7 | |
| Other Assets Less Liabilities | (0.1 | ) |
TOP TEN HOLDINGS
| Security Name | | % of
Net Assets |
| Apple, Inc. | | 3.1 | |
| Facebook, Inc., Class A | | 2.5 | |
| Alphabet, Inc., Class A | | 2.5 | |
| Amazon.com, Inc. | | 2.5 | |
| Microsoft Corp. | | 2.4 | |
| IAC/InteractiveCorp. | | 2.4 | |
| Cadence Design Systems, Inc. | | 2.1 | |
| ServiceNow, Inc. | | 2.0 | |
| Ross Stores, Inc. | | 2.0 | |
| PayPal Holdings, Inc. | | 1.9 | |
| Top Ten as a Group | | 23.4 | |
Because a fund’s strategy may result in multiple investments in particular sectors of the economy, its performance may depend on the performance of those sectors and may fluctuate more widely than investments diversified across more sectors. For additional information on these and other risk considerations, please see the Fund’s prospectus.
Any sectors, industries, or securities discussed should not be perceived as investment recommendations. Mention of a specific security should not be considered a recommendation to buy or solicitation to sell that security. Specific securities mentioned in this report may have been sold from the Fund’s portfolio of investments by the time you receive this report.
| | |
| | AMG Renaissance Large Cap Growth Fund |
| | Schedule of Portfolio Investments |
| | December 31, 2020 |
| | | Shares | | Value |
| Common Stocks - 99.4% | | | | |
| Communication Services - 10.8% | | | | |
| Alphabet, Inc., Class A* | | 1,360 | | $2,383,591 |
| Comcast Corp., Class A | | 31,950 | | 1,674,180 |
| Electronic Arts, Inc. | | 10,697 | | 1,536,089 |
| Facebook, Inc., Class A* | | 8,744 | | 2,388,511 |
| IAC/InteractiveCorp.* | | 11,706 | | 2,216,531 |
| Total Communication Services | | | | 10,198,902 |
| Consumer Discretionary - 11.1% | | | | |
| Amazon.com, Inc.* | | 722 | | 2,351,503 |
| Dollar General Corp. | | 7,592 | | 1,596,598 |
| The Home Depot, Inc. | | 5,749 | | 1,527,049 |
| Lowe’s Cos., Inc. | | 9,405 | | 1,509,597 |
| O’Reilly Automotive, Inc.* | | 3,561 | | 1,611,602 |
| Ross Stores, Inc. | | 15,019 | | 1,844,483 |
| Total Consumer Discretionary | | | | 10,440,832 |
| Consumer Staples - 3.2% | | | | |
| Church & Dwight Co., Inc. | | 17,173 | | 1,498,001 |
| The Procter & Gamble Co. | | 11,036 | | 1,535,549 |
| Total Consumer Staples | | | | 3,033,550 |
| Financials - 3.3% | | | | |
| The Progressive Corp. | | 16,709 | | 1,652,186 |
| S&P Global, Inc. | | 4,535 | | 1,490,791 |
| Total Financials | | | | 3,142,977 |
| Health Care - 16.7% | | | | |
| AbbVie, Inc. | | 15,244 | | 1,633,394 |
| HCA Healthcare, Inc. | | 10,816 | | 1,778,799 |
| Horizon Therapeutics PLC* | | 20,053 | | 1,466,877 |
| Johnson & Johnson | | 9,329 | | 1,468,198 |
| Merck & Co., Inc. | | 16,027 | | 1,311,009 |
| PerkinElmer, Inc. | | 12,145 | | 1,742,807 |
| Thermo Fisher Scientific, Inc. | | 3,232 | | 1,505,401 |
| UnitedHealth Group, Inc. | | 4,901 | | 1,718,683 |
| Vertex Pharmaceuticals, Inc.* | | 6,055 | | 1,431,039 |
| Zoetis, Inc. | | 9,832 | | 1,627,196 |
| Total Health Care | | | | 15,683,403 |
| Industrials - 9.9% | | | | |
| Cintas Corp. | | 4,534 | | 1,602,588 |
| Illinois Tool Works, Inc. | | 7,892 | | 1,609,021 |
| Lockheed Martin Corp. | | 3,484 | | 1,236,750 |
| Roper Technologies, Inc. | | 3,863 | | 1,665,301 |
| Union Pacific Corp. | | 7,905 | | 1,645,979 |
| | | Shares | | Value |
| Waste Management, Inc. | | 13,495 | | $1,591,465 |
| Total Industrials | | | | 9,351,104 |
| Information Technology - 40.7% | | | | |
| Accenture PLC, Class A (Ireland) | | 6,516 | | 1,702,044 |
| Adobe, Inc.* | | 3,258 | | 1,629,391 |
| Akamai Technologies, Inc.* | | 13,033 | | 1,368,335 |
| Amphenol Corp., Class A | | 12,477 | | 1,631,617 |
| Apple, Inc. | | 22,268 | | 2,954,741 |
| Booz Allen Hamilton Holding Corp. | | 18,162 | | 1,583,363 |
| Cadence Design Systems, Inc.* | | 14,799 | | 2,019,028 |
| CDW Corp. | | 11,434 | | 1,506,887 |
| Fortinet, Inc.* | | 9,958 | | 1,479,062 |
| Genpact, Ltd. | | 39,251 | | 1,623,421 |
| Global Payments, Inc. | | 8,175 | | 1,761,059 |
| KLA Corp. | | 6,551 | | 1,696,119 |
| Lam Research Corp. | | 3,678 | | 1,737,009 |
| Mastercard, Inc., Class A | | 4,656 | | 1,661,913 |
| Microsoft Corp. | | 10,141 | | 2,255,561 |
| Motorola Solutions, Inc. | | 9,075 | | 1,543,295 |
| NVIDIA Corp. | | 3,282 | | 1,713,860 |
| PayPal Holdings, Inc.* | | 7,642 | | 1,789,756 |
| salesforce.com, Inc.* | | 6,196 | | 1,378,796 |
| ServiceNow, Inc.* | | 3,461 | | 1,905,038 |
| Texas Instruments, Inc. | | 10,279 | | 1,687,092 |
| Visa, Inc., Class A | | 7,752 | | 1,695,595 |
| Total Information Technology | | | | 38,322,982 |
| Materials - 1.9% | | | | |
| Martin Marietta Materials, Inc. | | 6,135 | | 1,742,156 |
| Real Estate - 1.8% | | | | |
| CBRE Group, Inc., Class A* | | 27,071 | | 1,697,893 |
| Total Common Stocks | | | | |
| (Cost $58,867,176) | | | | 93,613,799 |
| Short-Term Investments - 0.7% | | | | |
| Other Investment Companies - 0.7% | | | | |
| Dreyfus Government Cash Management Fund, Institutional Shares, 0.03%1 | | 202,474 | | 202,474 |
| Dreyfus Institutional Preferred Government | | | | |
| Money Market Fund, Institutional Shares, 0.03%1 | | 202,474 | | 202,474 |
| JPMorgan U.S. Government Money Market Fund, IM Shares, 0.03%1 | | 208,609 | | 208,609 |
| Total Short-Term Investments | | | | |
| (Cost $613,557) | | | | 613,557 |
| Total Investments - 100.1% | | | | |
| (Cost $59,480,733) | | | | 94,227,356 |
The accompanying notes are an integral part of these financial statements.
| | |
| | |
| | AMG Renaissance Large Cap Growth Fund |
| | Schedule of Portfolio Investments (continued) |
| | Value |
| Other Assets, less Liabilities - (0.1)% | $(58,098) | |
| Net Assets - 100.0% | $94,169,258 | |
| | | |
| * | Non-income producing security. |
| 1 | Yield shown represents the December 31, 2020, seven day average yield, which refers to the sum of the previous seven days’ dividends paid, expressed as an annual percentage. |
The following table summarizes the inputs used to value the Fund’s investments by the fair value hierarchy levels as of December 31, 2020:
| | | Level 1 | | | Level 2 | | | Level 3 | | | Total | |
| Investments in Securities | | | | | | | | | | | | |
| Common Stocks† | | $93,613,799 | | | — | | | — | | | $93,613,799 | |
| Short-Term Investments | | | | | | | | | | | | |
| Other Investment Companies | | 613,557 | | | — | | | — | | | 613,557 | |
| Total Investments in Securities | | $94,227,356 | | | — | | | — | | | $94,227,356 | |
| † | All common stocks held in the Fund are Level 1 securities. For a detailed breakout of common stocks by major industry classification, please refer to the Fund’s Schedule of Portfolio Investments. |
For the fiscal year ended December 31, 2020, there were no transfers in or out of Level 3.
The accompanying notes are an integral part of these financial statements.
| | |
| | |
| | Statement of Assets and Liabilities |
| | December 31, 2020 |
| | | AMG Renaissance
Large Cap
Growth Fund |
| | | |
| Assets: | | |
| | | |
| Investments at value1 | | $94,227,356 | |
| Dividend and interest receivables | | 34,989 | |
| Securities lending income receivable | | 6 | |
| Receivable for Fund shares sold | | 21,141 | |
| Receivable from affiliate | | 16,886 | |
| Prepaid expenses and other assets | | 6,779 | |
| Total assets | | 94,307,157 | |
| Liabilities: | | | |
| Payable for Fund shares repurchased | | 16,124 | |
| Accrued expenses: | | | |
| Investment advisory and management fees | | 40,549 | |
| Administrative fees | | 11,752 | |
| Distribution fees | | 14,080 | |
| Shareholder service fees | | 6,803 | |
| Other | | 48,591 | |
| Total liabilities | | 137,899 | |
| | | | |
| Net Assets | | $94,169,258 | |
| 1 Investments at cost | | $59,480,733 | |
The accompanying notes are an integral part of these financial statements.
| | |
| | |
| | |
| | Statement of Assets and Liabilities (continued) |
| | | AMG Renaissance
Large Cap
Growth Fund |
| Net Assets Represent: | | | |
| Paid-in capital | | $58,730,356 | |
| Total distributable earnings | | 35,438,902 | |
| Net Assets | | $94,169,258 | |
| | | | |
| Class N: | | | |
| Net Assets | | $67,687,789 | |
| Shares outstanding | | 4,421,648 | |
| Net asset value, offering and redemption price per share | | $15.31 | |
| Class I: | | | |
| Net Assets | | $9,413,813 | |
| Shares outstanding | | 608,266 | |
| Net asset value, offering and redemption price per share | | $15.48 | |
| Class Z: | | | |
| Net Assets | | $17,067,656 | |
| Shares outstanding | | 1,121,089 | |
| Net asset value, offering and redemption price per share | | $15.22 | |
The accompanying notes are an integral part of these financial statements.
| | |
| | |
| | Statement of Operations |
| | For the fiscal year ended December 31, 2020 |
| | | AMG Renaissance
Large Cap
Growth Fund |
| Investment Income: | | | |
| Dividend income | | $951,023 | |
| Securities lending income | | 1,502 | |
| Total investment income | | 952,525 | |
| Expenses: | | | |
| Investment advisory and management fees | | 453,921 | |
| Administrative fees | | 130,474 | |
| Distribution fees - Class N | | 153,429 | |
| Shareholder servicing fees - Class N | | 55,097 | |
| Shareholder servicing fees - Class I | | 7,402 | |
| Registration fees | | 40,641 | |
| Professional fees | | 34,909 | |
| Reports to shareholders | | 29,839 | |
| Custodian fees | | 20,067 | |
| Transfer agent fees | | 16,788 | |
| Trustee fees and expenses | | 7,721 | |
| Miscellaneous | | 5,062 | |
| Total expenses before offsets | | 955,350 | |
| Expense reimbursements | | (164,987 | ) |
| Expense reductions | | (3,446 | ) |
| Net expenses | | 786,917 | |
| | | | |
| Net investment income | | 165,608 | |
| Net Realized and Unrealized Gain: | | | |
| Net realized gain on investments | | 3,147,006 | |
| Net change in unrealized appreciation/depreciation on investments | | 14,856,787 | |
| Net realized and unrealized gain | | 18,003,793 | |
| | | | |
| Net increase in net assets resulting from operations | | $18,169,401 | |
The accompanying notes are an integral part of these financial statements.
| | |
| | |
| | Statements of Changes in Net Assets |
| | For the fiscal year ended December 31, |
| | | AMG Renaissance
Large Cap
Growth Fund |
| | | 2020 | | 2019 |
| Increase in Net Assets Resulting From Operations: | | | | |
| Net investment income | | $165,608 | | $620,460 |
| Net realized gain on investments | | 3,147,006 | | 8,267,390 |
| Net change in unrealized appreciation/depreciation on investments | | 14,856,787 | | 22,737,875 |
| Net increase in net assets resulting from operations | | 18,169,401 | | 31,625,725 |
| Distributions to Shareholders: | | | | |
| Class N | | (3,165,685) | | (5,201,740) |
| Class I | | (455,440) | | (694,954) |
| Class Z | | (857,588) | | (1,801,441) |
| Total distributions to shareholders | | (4,478,713) | | (7,698,135) |
| Capital Share Transactions:1 | | | | |
| Net decrease from capital share transactions | | (12,204,255) | | (36,235,855) |
| | | | | |
| Total increase (decrease) in net assets | | 1,486,433 | | (12,308,265) |
| Net Assets: | | | | |
| | | | | |
| Beginning of year | | 92,682,825 | | 104,991,090 |
| End of year | | $94,169,258 | | $92,682,825 |
| 1 | See Note 1(g) of the Notes to Financial Statements. |
The accompanying notes are an integral part of these financial statements.
| | |
| | AMG Renaissance Large Cap Growth Fund |
| | Financial Highlights |
| | For a share outstanding throughout each fiscal year |
| | | For the fiscal years ended December 31, |
| Class N | | 2020 | | | 2019 | | | 2018 | | | 2017 | | | 20161 | |
| Net Asset Value, Beginning of Year | | $13.01 | | | $10.48 | | | $14.03 | | | $11.86 | | | $11.10 | |
| Income (loss) from Investment Operations: | | | | | | | | | | | | | | | |
| Net investment income2,3 | | 0.01 | | | 0.06 | | | 0.06 | | | 0.08 | | | 0.04 | |
| Net realized and unrealized gain (loss) on investments | | 3.04 | | | 3.61 | | | (1.09 | ) | | 2.54 | | | 0.94 | |
| Total income (loss) from investment operations | | 3.05 | | | 3.67 | | | (1.03 | ) | | 2.62 | | | 0.98 | |
| Less Distributions to Shareholders from: | | | | | | | | | | | | | | | |
| Net investment income | | (0.02 | ) | | (0.08 | ) | | (0.07 | ) | | (0.07 | ) | | (0.05 | ) |
| Net realized gain on investments | | (0.73 | ) | | (1.06 | ) | | (2.45 | ) | | (0.38 | ) | | (0.17 | ) |
| Total distributions to shareholders | | (0.75 | ) | | (1.14 | ) | | (2.52 | ) | | (0.45 | ) | | (0.22 | ) |
| Net Asset Value, End of Year | | $15.31 | | | $13.01 | | | $10.48 | | | $14.03 | | | $11.86 | |
| Total Return3,4 | | 23.54 | % | | 35.16 | % | | (7.23 | )% | | 22.03 | % | | 8.81 | % |
| Ratio of net expenses to average net assets5 | | 1.00 | % | | 1.00 | %6 | | 1.00 | % | | 1.02 | % | | 1.15 | % |
| Ratio of gross expenses to average net assets7 | | 1.19 | % | | 1.17 | % | | 1.12 | % | | 1.16 | % | | 1.44 | % |
| Ratio of net investment income to average net assets3 | | 0.10 | % | | 0.48 | % | | 0.45 | % | | 0.59 | % | | 0.39 | % |
| Portfolio turnover | | 28 | % | | 40 | % | | 38 | % | | 33 | % | | 37 | % |
| Net assets end of year (000’s) omitted | | $67,688 | | | $63,900 | | | $54,595 | | | $70,781 | | | $3,069 | |
| | |
| | AMG Renaissance Large Cap Growth Fund |
| | Financial Highlights |
| | For a share outstanding throughout each fiscal year |
| | | For the fiscal years ended December 31, |
| Class I | | 2020 | | | 2019 | | | 2018 | | | 2017 | | | 20161 | |
| Net Asset Value, Beginning of Year | | $13.14 | | | $10.58 | | | $14.17 | | | $11.94 | | | $11.17 | |
| Income (loss) from Investment Operations: | | | | | | | | | | | | | | | |
| Net investment income2,3 | | 0.05 | | | 0.09 | | | 0.10 | | | 0.11 | | | 0.08 | |
| Net realized and unrealized gain (loss) on investments | | 3.07 | | | 3.64 | | | (1.11 | ) | | 2.58 | | | 0.94 | |
| Total income (loss) from investment operations | | 3.12 | | | 3.73 | | | (1.01 | ) | | 2.69 | | | 1.02 | |
| Less Distributions to Shareholders from: | | | | | | | | | | | | | | | |
| Net investment income | | (0.05 | ) | | (0.11 | ) | | (0.13 | ) | | (0.08 | ) | | (0.08 | ) |
| Net realized gain on investments | | (0.73 | ) | | (1.06 | ) | | (2.45 | ) | | (0.38 | ) | | (0.17 | ) |
| Total distributions to shareholders | | (0.78 | ) | | (1.17 | ) | | (2.58 | ) | | (0.46 | ) | | (0.25 | ) |
| Net Asset Value, End of Year | | $15.48 | | | $13.14 | | | $10.58 | | | $14.17 | | | $11.94 | |
| Total Return3,4 | | 23.90 | % | | 35.42 | % | | (7.00 | )% | | 22.46 | % | | 9.12 | % |
| Ratio of net expenses to average net assets5 | | 0.75 | % | | 0.75 | %6 | | 0.74 | % | | 0.76 | % | | 0.81 | % |
| Ratio of gross expenses to average net assets7 | | 0.94 | % | | 0.92 | % | | 0.86 | % | | 0.90 | % | | 1.10 | % |
| Ratio of net investment income to average net assets3 | | 0.35 | % | | 0.73 | % | | 0.71 | % | | 0.85 | % | | 0.73 | % |
| Portfolio turnover | | 28 | % | | 40 | % | | 38 | % | | 33 | % | | 37 | % |
| Net assets end of year (000’s) omitted | | $9,414 | | | $8,410 | | | $11,247 | | | $13,635 | | | $14,173 | |
| | |
| | AMG Renaissance Large Cap Growth Fund |
| | Financial Highlights |
| | For a share outstanding throughout each fiscal year |
| | | For the fiscal years ended December 31, |
| Class Z | | 2020 | | | 2019 | | | 2018 | | | 2017 | | | 20161 | |
| Net Asset Value, Beginning of Year | | $12.94 | | | $10.43 | | | $14.00 | | | $11.81 | | | $11.04 | |
| Income (loss) from Investment Operations: | | | | | | | | | | | | | | | |
| Net investment income2,3 | | 0.06 | | | 0.10 | | | 0.11 | | | 0.13 | | | 0.10 | |
| Net realized and unrealized gain (loss) on investments | | 3.01 | | | 3.60 | | | (1.09 | ) | | 2.53 | | | 0.94 | |
| Total income (loss) from investment operations | | 3.07 | | | 3.70 | | | (0.98 | ) | | 2.66 | | | 1.04 | |
| Less Distributions to Shareholders from: | | | | | | | | | | | | | | | |
| Net investment income | | (0.06 | ) | | (0.13 | ) | | (0.14 | ) | | (0.09 | ) | | (0.10 | ) |
| Net realized gain on investments | | (0.73 | ) | | (1.06 | ) | | (2.45 | ) | | (0.38 | ) | | (0.17 | ) |
| Total distributions to shareholders | | (0.79 | ) | | (1.19 | ) | | (2.59 | ) | | (0.47 | ) | | (0.27 | ) |
| Net Asset Value, End of Year | | $15.22 | | | $12.94 | | | $10.43 | | | $14.00 | | | $11.81 | |
| Total Return3,4 | | 23.90 | % | | 35.58 | % | | (6.88 | )% | | 22.50 | % | | 9.38 | % |
| Ratio of net expenses to average net assets5 | | 0.66 | % | | 0.66 | %6 | | 0.66 | % | | 0.65 | % | | 0.65 | % |
| Ratio of gross expenses to average net assets7 | | 0.85 | % | | 0.83 | % | | 0.78 | % | | 0.79 | % | | 0.94 | % |
| Ratio of net investment income to average net assets3 | | 0.44 | % | | 0.82 | % | | 0.79 | % | | 0.96 | % | | 0.89 | % |
| Portfolio turnover | | 28 | % | | 40 | % | | 38 | % | | 33 | % | | 37 | % |
| Net assets end of year (000’s) omitted | | $17,068 | | | $20,372 | | | $39,149 | | | $100,840 | | | $54,467 | |
| 1 | Effective October 1, 2016, the Investor Class, Service Class and Institutional Class were renamed Class N, Class I and Class Z, respectively. |
| 2 | Per share numbers have been calculated using average shares. |
| 3 | Total returns and net investment income would have been lower had certain expenses not been offset. |
| 4 | The total return is calculated using the published Net Asset Value as of fiscal year end. |
| 5 | Includes reduction from broker recapture amounting to less than 0.01% for the fiscal year ended December 31, 2020, 0.01% for the fiscal years ended 2019 and 2018, and less than 0.01%, and 0.01% for the fiscal years ended 2017 and 2016, respectively. |
| 6 | Includes interest expense of 0.01% of average net assets. |
| 7 | Excludes the impact of expense reimbursement or fee waivers and expense reductions such as brokerage credits, but includes expense repayments and non-reimbursable expenses, if any, such as interest, taxes, and extraordinary expenses. (See Note 1(c) and 2 in the Notes to Financial Statements.) |
| | |
| | |
| | Notes to Financial Statements |
| | December 31, 2020 |
1. ORGANIZATION AND SUMMARY OF SIGNIFICANT ACCOUNTING POLICIES
AMG Funds (the “Trust”) is an open-end management investment company, organized as a Massachusetts business trust, and registered under the Investment Company Act of 1940, as amended (the “1940 Act”). Currently, the Trust consists of a number of different funds, each having distinct investment management objectives, strategies, risks, and policies. Included in this report is AMG Renaissance Large Cap Growth Fund (the “Fund”).
The Fund offers Class N, Class I, and Class Z shares. Each class represents an interest in the same assets of the Fund. Although all share classes generally have identical voting rights, each share class votes separately when required by law. Different share classes may have different net asset values per share to the extent the share classes pay different distribution amounts and/or the expenses of such share classes differ. Each share class has its own expense structure. Please refer to a current prospectus for additional information on each share class.
Stocks in the information technology sector comprise a significant portion of the Fund’s portfolio at December 31, 2020. The information technology sector may be affected by technological obsolescence, short product cycles, falling prices and profits, competitive pressures and general market conditions.
Market disruptions associated with the COVID-19 pandemic have had a global impact, and uncertainty exists as to the long-term implications. Such disruptions can adversely affect assets of the Fund and thus Fund performance.
The Fund’s financial statements are prepared in accordance with accounting principles generally accepted in the United States of America (“U.S. GAAP”), including accounting and reporting guidance pursuant to Accounting Standards Codification Topic 946 applicable to investment companies. U.S. GAAP requires management to make estimates and assumptions that affect the reported amounts of assets and liabilities and disclosure of contingent assets and liabilities at the date of the financial statements and the reported amounts of income and expenses during the reporting period. Actual results could differ from those estimates and such differences could be material. The following is a summary of significant accounting policies followed by the Fund in the preparation of its financial statements:
a. VALUATION OF INVESTMENTS
Equity securities traded on a national securities exchange or reported on the NASDAQ national market system (“NMS”) are valued at the last quoted sales price on the primary exchange or, if applicable, the NASDAQ official closing price or the official closing price of the relevant exchange or, lacking any sales, at the last quoted bid price or the mean between the last quoted bid and ask prices (the “mean price”). Equity securities traded in the over-the-counter market (other than NMS securities) are valued at the mean price. Foreign equity securities (securities principally traded in markets other than U.S. markets) are valued at the official closing price on the primary exchange or, for markets that either do not offer an official closing price or where the official closing price may not be representative of the overall market, the last quoted sale price.
Fixed income securities purchased with a remaining maturity of 60 days or less are valued at amortized cost, provided that the amortized cost value is approximately the same as the fair value of the security valued without the use of amortized cost. Investments in other open-end registered investment companies are valued at their end of day net asset value per share.
The Fund’s portfolio investments are generally valued based on independent market quotations or prices or, if none, “evaluative” or other market based valuations provided by third party pricing services approved by the Board of Trustees of the Trust (the “Board”). Under certain circumstances, the value of certain Fund portfolio investments may be based on an evaluation of fair value, pursuant to procedures established by and under the general supervision of the Board. The Valuation Committee, which is comprised of the Independent Trustees of the Board, and the Pricing Committee, which is comprised of representatives from AMG Funds LLC (the “Investment Manager”) are the committees appointed by the Board to make fair value determinations. The Fund may use the fair value of a portfolio investment to calculate its net asset value (“NAV”) in the event that the market quotation, price or market based valuation for the portfolio investment is not readily available or otherwise not determinable pursuant to the Board’s valuation procedures, if the Investment Manager or the Pricing Committee believes the quotation, price or market based valuation to be unreliable, or in certain other circumstances. When determining the fair value of an investment, the Pricing Committee and, if required under the Trust’s securities valuation procedures, the Valuation Committee, seeks to determine the price that the Fund might reasonably expect to receive from current sale of that portfolio investment in an arms-length transaction. Fair value determinations shall be based upon consideration of all available facts and information, including, but not limited to (i) attributes specific to the investment; (ii) fundamental and analytical data relating to the investment; and (iii) the value of other comparable securities or relevant financial instruments, including derivative securities, traded on other markets or among dealers.
The values assigned to fair value portfolio investments are based on available information and do not necessarily represent amounts that might ultimately be realized in the future, since such amounts depend on future developments inherent in long-term investments. Because of the inherent uncertainty of valuation, those estimated values may differ significantly from the values that would have been used had a ready market for the investments existed, and the differences could be material. The Board will be presented with a quarterly report showing as of the most recent quarter end, all outstanding securities fair valued by the Fund, including a comparison with the prior quarter end and the percentage of the Fund that the security represents at each quarter end.
With respect to foreign equity securities and certain foreign fixed income securities, the Board has adopted a policy that securities held in the Fund that can be fair valued by the applicable fair value pricing service are fair valued on each business day provided that each individual price exceeds a pre-established confidence level.
U.S. GAAP defines fair value as the price that a fund would receive to sell an asset or pay to transfer a liability in an orderly transaction between market participants at the measurement date. U.S. GAAP also establishes a framework for measuring fair value, and a three level hierarchy for fair value measurements based upon the transparency of inputs to the valuation of an asset or liability. Inputs may be observable or unobservable and refer broadly to the assumptions that market participants would use in pricing the asset or liability. Observable inputs reflect the assumptions market participants would use in pricing the asset or liability based on market data obtained from sources independent of the Fund. Unobservable inputs reflect the Fund’s own assumptions about the assumptions that market participants would use in pricing the asset or liability developed based on the best information available in the circumstances. Each investment is assigned a level based upon the observability of the inputs which are significant to the overall valuation.
The three-tier hierarchy of inputs is summarized below:
| | |
| | |
| | |
| | Notes to Financial Statements (continued) |
Level 1 – inputs are quoted prices in active markets for identical investments (e.g., equity securities, open-end investment companies)
Level 2 – other observable inputs (including, but not limited to: quoted prices for similar assets or liabilities in markets that are active, quoted prices for identical or similar assets or liabilities in markets that are not active, inputs other than quoted prices that are observable for the assets or liabilities (such as interest rates, yield curves, volatilities, prepayment speeds, loss severities, credit risks and default rates) or other market corroborated inputs) (e.g., debt securities, government securities, foreign currency exchange contracts, swaps, foreign securities utilizing international fair value pricing, fair valued securities with observable inputs)
Level 3 – inputs are significant unobservable inputs (including the Fund’s own assumptions used to determine the fair value of investments) (e.g., fair valued securities with unobservable inputs)
Changes in inputs or methodologies used for valuing investments may result in a transfer in or out of levels within the fair value hierarchy. The inputs or methodologies used for valuing investments may not necessarily be an indication of the risk associated with investing in those investments.
b. SECURITY TRANSACTIONS
Security transactions are accounted for as of trade date. Realized gains and losses on securities sold are determined on the basis of identified cost.
c. INVESTMENT INCOME AND EXPENSES
Dividend income is recorded on the ex-dividend date. Interest income, which includes amortization of premium and accretion of discount on debt securities, is accrued as earned. Dividend and interest income on foreign securities is recorded gross of any withholding tax. Non-cash dividends included in dividend income, if any, are reported at the fair market value of the securities received. Other income and expenses are recorded on an accrual basis. Expenses that cannot be directly attributed to a Fund are apportioned among the funds in the Trust and other trusts or funds within the AMG Funds Family of Funds (collectively the “AMG Funds Family”) based upon their relative average net assets or number of shareholders. Investment income, realized and unrealized capital gains and losses, the common expenses of each Fund, and certain fund level expense reductions, if any, are allocated on a pro-rata basis to each class based on the relative net assets of each class to the total net assets of each Fund.
The Fund had certain portfolio trades directed to various brokers under a brokerage recapture program. Credits received from the brokerage recapture program are earned and paid on a monthly basis, and are recorded as expense offsets, which serve to reduce the Fund’s overall expense ratio. For the fiscal year ended December 31, 2020, the impact on the expenses and expense ratios was $3,446 or less than 0.01%.
d. DIVIDENDS AND DISTRIBUTIONS
Fund distributions resulting from either net investment income or realized net capital gains, if any, will normally be declared and paid at least annually in December. Distributions to shareholders are recorded on the ex-dividend date. Distributions are determined in accordance with federal income tax regulations, which may differ from net investment income and net realized capital gains for financial statement purposes (U.S. GAAP). Differences may be permanent or temporary. Permanent differences are reclassified among capital accounts in the financial statements to reflect their tax character. Permanent book and tax basis
differences, if any, relating to shareholder distributions will result in reclassifications to paid-in capital. Temporary differences arise when certain items of income, expense and gain or loss are recognized in different periods for financial statement and tax purposes; these differences will reverse at some time in the future. Temporary differences are primarily due to wash sale loss deferrals.
The tax character of distributions paid during the fiscal years ended December 31, 2020 and December 31, 2019 were as follows:
| Distributions paid from: | | 2020 | | 2019 |
| Ordinary income * | | $1,676,946 | | | $1,506,030 | |
| Long-term capital gains | | 2,801,767 | | | 6,192,105 | |
| | | $4,478,713 | | | $7,698,135 | |
| * | For tax purposes, short-term capital gain distributions, if any, are considered ordinary income distributions. |
As of December 31, 2020, the components of distributable earnings (excluding unrealized appreciation/depreciation) on a tax basis consisted of:
| Undistributed ordinary income | | $37,975 | |
| Undistributed long-term capital gains | | 738,786 | |
At December 31, 2020, the cost of investments and the aggregate gross unrealized appreciation and depreciation for federal income tax purposes were as follows:
| Cost | | Appreciation | | Depreciation | | Net Appreciation |
| $59,565,215 | | | $35,130,473 | | | $(468,332 | ) | | $34,662,141 | |
e. FEDERAL TAXES
The Fund currently qualifies as an investment company and intends to comply with the requirements under Subchapter M of the Internal Revenue Code of 1986, as amended, and to distribute substantially all of its taxable income and gains to its shareholders and to meet certain diversification and income requirements with respect to investment companies. Therefore, no provision for federal income or excise tax is included in the accompanying financial statements.
Additionally, based on the Fund’s understanding of the tax rules and rates related to income, gains and transactions for the foreign jurisdictions in which it invests, the Fund will provide for foreign taxes, and where appropriate, deferred foreign taxes.
Management has analyzed the Fund’s tax positions taken on federal income tax returns as of December 31, 2020, and for all open tax years (generally, the three prior taxable years), and has concluded that no provision for federal income tax is required in the Fund’s financial statements. Additionally, Management is not aware of any tax position for which it is reasonably possible that the total amounts of unrecognized tax benefits will change materially in the next twelve months.
f. CAPITAL LOSS CARRYOVERS AND DEFERRALS
As of December 31, 2020, the Fund had no capital loss carryovers for federal income tax purposes. Should the Fund incur net capital losses for the fiscal year ended December 31, 2021, such amounts may be used to offset future realized capital gains indefinitely, and retain their character as short-term and/or long-term.
| | |
| | |
| | |
| | Notes to Financial Statements (continued) |
g. CAPITAL STOCK
The Trust’s Declaration of Trust authorizes for the Fund the issuance of an unlimited number of shares of beneficial interest, without par value. The Fund records sales and repurchases of its capital stock on the trade date.
For the fiscal years ended December 31, 2020 and December 31, 2019, the capital stock transactions by class for the Fund were as follows:
| | | December 31, 2020 | | December 31, 2019 |
| | | Shares | | Amount | | Shares | | Amount |
| Class N: | | | | | | | | | | | | |
| Proceeds from sale of shares | | 138,072 | | | $1,853,574 | | | 149,532 | | | $1,906,803 | |
| Reinvestment of distributions | | 183,443 | | | 2,751,642 | | | 356,090 | | | 4,572,197 | |
| Cost of shares repurchased | | (812,630 | ) | | (10,739,022 | ) | | (801,668 | ) | | (10,043,926 | ) |
| Net decrease | | (491,115 | ) | | $(6,133,806 | ) | | (296,046 | ) | | $(3,564,926 | ) |
| Class I: | | | | | | | | | | | | |
| Proceeds from sale of shares | | 73,197 | | | $1,017,666 | | | 118,889 | | | $1,530,013 | |
| Reinvestment of distributions | | 29,973 | | | 454,395 | | | 53,415 | | | 692,791 | |
| Cost of shares repurchased | | (134,946 | ) | | (1,747,645 | ) | | (595,542 | ) | | (7,384,534 | ) |
| Net decrease | | (31,776 | ) | | $(275,584 | ) | | (423,238 | ) | | $(5,161,730 | ) |
| Class Z: | | | | | | | | | | | | |
| Proceeds from sale of shares | | 65,584 | | | $863,276 | | | 688,479 | | | $8,668,606 | |
| Reinvestment of distributions | | 54,130 | | | 807,081 | | | 119,232 | | | 1,522,591 | |
| Cost of shares repurchased | | (573,413 | ) | | (7,465,222 | ) | | (2,986,652 | ) | | (37,700,396 | ) |
| Net decrease | | (453,699 | ) | | $(5,794,865 | ) | | (2,178,941 | ) | | $(27,509,199 | ) |
h. REPURCHASE AGREEMENTS AND JOINT REPURCHASE AGREEMENTS
The Fund may enter into third-party repurchase agreements for temporary cash management purposes and third-party or bilateral joint repurchase agreements for reinvestment of cash collateral on securities lending transactions under the securities lending program offered by The Bank of New York Mellon (“BNYM”) (the “Program”) (collectively, “Repurchase Agreements”). The value of the underlying collateral, including accrued interest, must equal or exceed the value of the Repurchase Agreements during the term of the agreement. For joint repurchase agreements, the Fund participates on a pro rata basis with other clients of BNYM in its share of the underlying collateral under such joint repurchase agreements and in its share of proceeds from any repurchase or other disposition of the underlying collateral. The underlying collateral for all Repurchase Agreements is held in safekeeping by the Fund’s custodian or at the Federal Reserve Bank. If the seller defaults and the value of the collateral declines, or if bankruptcy proceedings commence with respect to the seller of the security, realization of the collateral by the Fund may be delayed or limited. Pursuant to the Program, the Fund is indemnified for such losses by BNYM on joint repurchase agreements.
At December 31, 2020, the Fund had no Repurchase Agreements outstanding.
2. AGREEMENTS AND TRANSACTIONS WITH AFFILIATES
The Trust has entered into an investment advisory agreement under which the Investment Manager, a subsidiary and the U.S. retail distribution arm of Affiliated
Managers Group, Inc. (“AMG”), serves as investment manager to the Fund and is responsible for the Fund’s overall administration and operations. The Investment Manager selects one or more subadvisers for the Fund (subject to Board approval) and monitors each subadviser’s investment performance, security holdings and investment strategies. The Fund’s investment portfolio is managed by The Renaissance Group LLC (“Renaissance”) who serves pursuant to a subadvisory agreement with the Investment Manager. AMG indirectly owns a majority interest in Renaissance.
Investment management fees are paid directly by the Fund to the Investment Manager based on average daily net assets. For the fiscal year ended December 31, 2020, the Fund’s investment management fee was paid at the following annual rates of the Fund’s average daily net assets:
| on the first $50 million | | 0.55% |
| on the next $25 million | | 0.50% |
| on the next $25 million | | 0.45% |
| on balance over $100 million | | 0.40% |
The Investment Manager has contractually agreed, through at least May 1, 2021, to waive management fees and/or pay or reimburse fund expenses in order to limit total annual Fund operating expenses after fee waiver and expense
| | |
| | |
| | |
| | Notes to Financial Statements (continued) |
reimbursements (exclusive of taxes, interest (including interest incurred in connection with bank and custody overdrafts, and in connection with securities sold short), shareholder servicing fees, distribution and service (12b-1) fees, brokerage commissions and other transaction costs, dividends payable with respect to securities sold short, acquired fund fees and expenses and extraordinary expenses) to the annual rate of 0.66% of the Fund’s average daily net assets (this annual rate or such other annual rate that may be in effect from time to time, the “Expense Cap”), subject to later reimbursement by the Fund in certain circumstances.
In general, for a period of up to 36 months after the date any amounts are paid, waived or reimbursed by the Investment Manager, the Investment Manager may recover such amounts from the Fund, provided that such repayment would not cause the Fund’s total annual operating expenses after fee waiver and expense reimbursements (exclusive of the items noted in the parenthetical above) to exceed either (i) the Expense Cap in effect at the time such amounts were paid, waived or reimbursed, or (ii) the Expense Cap in effect at the time of such repayment by the Fund.
The contractual expense limitation may only be terminated in the event the Investment Manager or a successor ceases to be the investment manager of the Fund or a successor fund, by mutual agreement between the Investment Manager and the Board, or in the event of the Fund’s liquidation unless the Fund is reorganized or is a party to a merger in which the surviving entity is successor to the accounting and performance information of the Fund.
At December 31, 2020, the Fund’s expiration of reimbursements subject to recoupment is as follows:
| Expiration | | |
| Period | | |
| Less than 1 year | | $167,279 | |
| 1-2 years | | 159,989 | |
| 2-3 years | | 164,987 | |
| Total | | $492,255 | |
The Trust, on behalf of the Fund, has entered into an amended and restated Administration Agreement under which the Investment Manager serves as the Fund’s administrator (the “Administrator”) and is responsible for all non-portfolio management aspects of managing the Fund’s operations, including administration and shareholder services to the Fund. The Fund pays a fee to the Administrator at the rate of 0.15% per annum of the Fund’s average daily net assets for this service.
The Fund is distributed by AMG Distributors, Inc. (the “Distributor”), a wholly-owned subsidiary of the Investment Manager. The Distributor serves as the distributor and underwriter for the Fund and is a registered broker-dealer and member of the Financial Industry Regulatory Authority, Inc. (“FINRA”). Shares of the Fund will be continuously offered and will be sold directly to prospective purchasers and through brokers, dealers or other financial intermediaries who have executed selling agreements with the Distributor. Generally the Distributor bears all or a portion of the expenses of providing services pursuant to the distribution agreement, including the payment of the expenses relating to the distribution of prospectuses for sales purposes and any advertising or sales literature.
The Fund has adopted a distribution and service plan (the “Plan”) with respect to the Class N shares, in accordance with the requirements of Rule 12b-1 under the 1940 Act and the requirements of the applicable rules of FINRA regarding
asset-based sales charges. Pursuant to the Plan, the Fund may make payments to the Distributor for its expenditures in financing any activity primarily intended to result in the sale of the Fund’s Class N shares and for maintenance and personal service provided to existing shareholders of that class. The Plan authorized payments to the Distributor up to 0.25% annually of the Fund’s average daily net assets attributable to the Class N shares.
For each of the Class N and Class I shares, the Board has approved reimbursement payments to the Investment Manager for shareholder servicing expenses (“shareholder servicing fees”) incurred. Shareholder servicing fees include payments to financial intermediaries, such as broker-dealers (including fund supermarket platforms), banks, and trust companies who provide shareholder recordkeeping, account servicing and other services. The Class N and Class I shares may reimburse the Investment Manager for the actual amount incurred up to a maximum annual rate of each Class’s average daily net assets as shown in the table below.
The impact on the annualized expense ratios for the fiscal year ended December 31, 2020, were as follows:
| | | Maximum Annual Amount
Approved | | | Actual
Amount
Incurred | |
| Class N | | 0.15 | % | | 0.09 | % |
| Class I | | 0.15 | % | | 0.09 | % |
The Board provides supervision of the affairs of the Trust and other trusts within the AMG Funds Family. The Trustees of the Trust who are not affiliated with the Investment Manager receive an annual retainer and per meeting fees for regular, special and telephonic meetings, and they are reimbursed for out-of-pocket expenses incurred while carrying out their duties as Board members. The Chairman of the Board and the Audit Committee Chair receive additional annual retainers. Certain Trustees and Officers of the Fund are Officers and/or Directors of the Investment Manager, AMG and/or the Distributor.
The Securities and Exchange Commission (the “SEC”) granted an exemptive order that permits the Fund to lend and borrow money for certain temporary purposes directly to and from other eligible funds in the AMG Funds Family. Participation in this interfund lending program is voluntary for both the borrowing and lending funds, and an interfund loan is only made if it benefits each participating fund. The Administrator manages the program according to procedures approved by the Board, and the Board monitors the operation of the program. An interfund loan must comply with certain conditions set out in the exemptive order, which are designed to assure fairness and protect all participating funds. The interest earned and interest paid on interfund loans are included on the Statement of Operations as interest income and miscellaneous expense, respectively. At December 31, 2020, the Fund had no interfund loans outstanding.
The Fund utilized the interfund loan program during the fiscal year ended December 31, 2020 as follows:
Average
Borrowed | | Number
of Days | | Interest
Paid | | Average
Interest Rate |
| $2,152,166 | | | 5 | | | $288 | | | 0.978 | % |
| | |
| | |
| | |
| | Notes to Financial Statements (continued) |
3. PURCHASES AND SALES OF SECURITIES
Purchases and sales of securities (excluding short-term securities and U.S. Government Obligations) for the fiscal year ended December 31, 2020, were $23,839,387 and $39,495,801, respectively.
The Fund had no purchases or sales of U.S. Government Obligations during the fiscal year ended December 31, 2020.
4. PORTFOLIO SECURITIES LOANED
The Fund participates in the Program providing for the lending of securities to qualified borrowers. Securities lending income includes earnings of such temporary cash investments, plus or minus any rebate to a borrower. These earnings (after any rebate) are then divided between BNYM, as a fee for its services under the Program, and the Fund, according to agreed-upon rates. Collateral on all securities loaned is accepted in cash, U.S. Treasury Obligations or U.S. Government Agency Obligations. Collateral is maintained at a minimum level of 102% (105% in the case of certain foreign securities) of the market value, plus interest, if applicable, of investments on loan. It is the Fund’s policy to obtain additional collateral from or return excess collateral to the borrower by the end of the next business day, following the valuation date of the securities loaned. Therefore, the value of the collateral held may be temporarily less than the value of the securities on loan. Lending securities entails a risk of loss to the Fund if and to the extent that the market value of the securities loaned were to increase and the borrower did not increase the collateral accordingly, and the borrower fails to return the securities. Under the terms of the Program, the Fund is indemnified for such losses by BNYM. Cash collateral is held in separate omnibus accounts managed by BNYM, who is authorized to exclusively enter into joint repurchase agreements for that cash collateral. Securities collateral is held in separate omnibus accounts managed by BNYM that cannot be sold or pledged. BNYM bears the risk of any deficiency in the amount of the cash collateral available for return to the borrower due to any loss on the collateral invested. Loans of securities are terminable at any time and the borrower, after notice, is required to return borrowed securities as soon as practical, which is normally within three business days.
The Fund did not have any securities on loan at December 31, 2020.
5. COMMITMENTS AND CONTINGENCIES
Under the Trust’s organizational documents, its trustees and officers are indemnified against certain liabilities arising out of the performance of their duties to the Trust. In addition, in the normal course of business, the Fund may enter into contracts and agreements that contain a variety of representations and warranties, which provide general indemnifications. The maximum exposure to the Fund under these arrangements is unknown, as this would involve future claims that may be made against the Fund that have not yet occurred. However, based on experience, the Fund had no prior claims or losses and expects the risks of loss to be remote.
6. MASTER NETTING AGREEMENTS
The Fund may enter into master netting agreements with its counterparties for the securities lending program and Repurchase Agreements, which provide the right, in the event of default (including bankruptcy or insolvency) for the non-defaulting party to liquidate the collateral and calculate net exposure to the defaulting party or request additional collateral. For financial reporting purposes, the Fund does not offset financial assets and financial liabilities that are subject to master netting agreements in the Statement of Assets and Liabilities. For securities lending transactions, see Note 4.
7. SUBSEQUENT EVENTS
The Fund has determined that no material events or transactions occurred through the issuance date of the Fund’s financial statements which require an additional disclosure in or adjustment of the Fund’s financial statements.
| | |
| | |
| | |
| | Report of Independent Registered Public Accounting Firm |
TO THE BOARD OF TRUSTEES OF AMG FUNDS AND SHAREHOLDERS OF AMG RENAISSANCE LARGE CAP GROWTH FUND
Opinions on the Financial Statements
We have audited the accompanying statement of assets and liabilities, including the schedule of portfolio investments, of AMG Renaissance Large Cap Growth Fund (one of the funds constituting AMG Funds, referred to hereafter as the “Fund”) as of December 31, 2020, the related statement of operations for the year ended December 31, 2020, the statement of changes in net assets for each of the two years in the period ended December 31, 2020, including the related notes, and the financial highlights for each of the five years in the period December 31, 2020 (collectively referred to as the “financial statements”). In our opinion, the financial statements present fairly, in all material respects, the financial position of the Fund as of December 31, 2020, the results of its operations for the year then ended, the changes in its net assets for each of the two years in the period ended December 31, 2020 and the financial highlights for each of the five years in the period ended December 31, 2020, in conformity with accounting principles generally accepted in the United States of America.
Basis for Opinions
These financial statements are the responsibility of the Fund’s management. Our responsibility is to express an opinion on the Fund’s financial statements based on our audits. We are a public accounting firm registered with the Public Company Accounting Oversight Board (United States) (PCAOB) and are required to be independent with respect to the Fund in accordance with the U.S. federal securities laws and the applicable rules and regulations of the Securities and Exchange Commission and the PCAOB.
We conducted our audits of these financial statements in accordance with the standards of the PCAOB. Those standards require that we plan and perform the audit to obtain reasonable assurance about whether the financial statements are free of material misstatement, whether due to error or fraud.
Our audits included performing procedures to assess the risks of material misstatement of the financial statements, whether due to error or fraud, and performing procedures that respond to those risks. Such procedures included examining, on a test basis, evidence regarding the amounts and disclosures in the financial statements. Our audits also included evaluating the accounting principles used and significant estimates made by management, as well as evaluating the overall presentation of the financial statements. Our procedures included confirmation of securities owned as of December 31, 2020 by correspondence with the custodian. We believe that our audits provide a reasonable basis for our opinion.
PricewaterhouseCoopers LLP
Boston, Massachusetts
February 23, 2021
We have served as the auditor of one or more investment companies in the AMG Funds Family since 1993.
| | |
| | |
| | |
| | Other Information (unaudited) |
TAX INFORMATION
AMG Renaissance Large Cap Growth Fund hereby designates the maximum amount allowable of its net taxable income as qualified dividends as provided in the Jobs and Growth Tax Relief Reconciliation Act of 2003. The 2020 Form 1099-DIV you receive for the Fund will show the tax status of all distributions paid to you during the year.
Pursuant to section 852 of the Internal Revenue Code, AMG Renaissance Large Cap Growth Fund hereby designates $2,801,767 as a capital gain distribution with respect to the taxable fiscal year ended December 31, 2020, or if subsequently determined to be different, the net capital gains of such year.
| | |
| | |
| | AMG Funds |
| | Trustees and Officers |
| The Trustees and Officers of the Trust, their business addresses, principal occupations for the past five years and ages are listed below. The Trustees provide broad supervision over the affairs of the Trust and the Funds. The Trustees are experienced executives who meet periodically throughout the year to oversee the Funds’ activities, review contractual arrangements with companies that provide services to the Funds, and | | review the Funds’ performance. Unless otherwise noted, the address of each Trustee or Officer is the address of the Trust: One Stamford Plaza, 263 Tresser Blvd, Suite 949, Stamford, Connecticut 06901. There is no stated term of office for Trustees. Trustees serve until their resignation, retirement or removal in | | accordance with the Trust’s organizational documents and policies adopted by the Board from time to time. The Chairman of the Trustees, President, Treasurer and Secretary of the Trust are elected by the Trustees annually. Other officers hold office at the pleasure of the Trustees. |
Independent Trustees
The following Trustees are not “interested persons” of the Trust within the meaning of the 1940 Act:
Number of Funds Overseen in
Fund Complex | Name, Age, Principal Occupation(s) During Past 5 Years and Other Directorships Held by Trustee |
• Trustee since 2012 • Oversees 46 Funds in Fund Complex | Bruce B. Bingham, 72 Partner, Hamilton Partners (real estate development firm) (1987-2020); Director of The Yacktman Funds (2 portfolios) (2000-2012). |
• Trustee since 2013 • Oversees 49 Funds in Fund Complex | Kurt A. Keilhacker, 57 Managing Partner, TechFund Capital (1997-Present); Managing Partner, TechFund Europe (2000-Present); Managing Partner, Elementum Ventures (2013-Present); Director, MetricStory, Inc. (2017-Present); Trustee, Wheaton College (2018-Present); Trustee, Gordon College (2001-2016); Trustee, Board Member, 6wind SA, (2002-2019). |
• Trustee since 2000 • Oversees 46 Funds in Fund
Complex | Steven J. Paggioli, 70 Independent Consultant (2002-Present); Trustee, Professionally Managed Portfolios (28 portfolios); Advisory Board Member, Sustainable Growth Advisors, LP; Independent Director, Muzinich BDC, Inc. (business development company) (2019-Present); Director, The Wadsworth Group; Independent Director, Chase Investment Counsel (2008–2019); Executive Vice President, Secretary and Director, Investment Company Administration, LLC and First Fund Distributors, INC. (1990-2001). |
• Trustee since 2013 • Oversees 46 Funds in Fund
Complex | Richard F. Powers III, 75 Adjunct Professor, U.S. Naval War College (2016-Present); Adjunct Professor, Boston College (2011-2015); Director, Ameriprise Financial Inc. (2005-2009); President and CEO of Van Kampen Investments Inc. (1998-2003); President, Morgan Stanley Client Group (2000-2002); Executive Vice President and Chief Marketing Officer of the Morgan Stanley Individual Investor Group (1984-1998). |
• Independent Chairman • Trustee since 2000 • Oversees 49 Funds in Fund
Complex | Eric Rakowski, 62 Professor of Law, University of California at Berkeley School of Law (1990-Present); Tax Attorney at Davis Polk & Wardwell and clerked for Judge Harry T. Edwards of the U.S. Court of Appeals for the District of Columbia Circuit and for Justice William J. Brennan Jr. of the U.S. Supreme Court; Director of Harding, Loevner Funds, Inc. (9 portfolios); Trustee of Third Avenue Trust (3 portfolios) (2002-2019); Trustee of Third Avenue Variable Trust (1 portfolio) (2002-2019). |
• Trustee since 2013 • Oversees 49 Funds in Fund
Complex | Victoria L. Sassine, 55 Adjunct Professor, Babson College (2007–Present); Director, Board of Directors, PRG Group (2017-Present); CEO, Founder, Scale Smarter Partners, LLC (2018-Present); Adviser, EVOFEM Biosciences (2019-Present); Teaching Fellow, Goldman Sachs 10,000 Small Business Initiative (2010-Present); Chairperson of the Board of Directors of Business Management Associates (2018 to 2019). |
• Trustee since 2004 • Oversees 46 Funds in Fund
Complex | Thomas R. Schneeweis, 73 Professor Emeritus, University of Massachusetts (2013-Present); President, TRS Associates (1982-Present); Board Member, Chartered Alternative Investment Association (“CAIA”) (2002-Present); Director, CAIA Foundation (2010-2019); Director, Institute for Global Asset and Risk Management (Education) (2010-Present); Co-Owner, Quantitative Investment Technologies (2014-Present); Co-Owner, Yes Wealth Management (2018-Present); Director of Research, Yes Wealth Management (2018-Present); Partner, S Capital Wealth Advisors (2015-2018); Partner, S Capital Management, LLC (2007-2015); President, Alternative Investment Analytics, LLC, (formerly Schneeweis Partners, LLC) (2001-2013); Finance Professor, University of Massachusetts (1977-2013). |
| | |
| | |
| | AMG Funds |
| | Trustees and Officers (continued) |
Interested Trustees
Each Trustee in the following table is an “interested person” of the Trust within the meaning of the 1940 Act. Ms. Carsman is an interested person of the Trust within the meaning of the 1940 Act by virtue of her position with, and interest in securities of, AMG.
Number of Funds Overseen in
Fund Complex | Name, Age, Principal Occupation(s) During Past 5 Years and Other Directorships Held by Trustee |
• Trustee since 2011 • Oversees 46 Funds in Fund
Complex | Christine C. Carsman, 68 Senior Policy Advisor, Affiliated Managers Group, Inc. (2019-Present); Chair of the Board of Directors, AMG Funds plc (2015-2018); Director, AMG Funds plc (2010-2018); Executive Vice President, Deputy General Counsel and Chief Regulatory Counsel, Affiliated Managers Group, Inc. (2017-2018); Senior Vice President and Deputy General Counsel, Affiliated Managers Group, Inc. (2011-2016); Senior Vice President and Chief Regulatory Counsel, Affiliated Managers Group, Inc. (2007-2011); Vice President and Chief Regulatory Counsel, Affiliated Managers Group, Inc. (2004-2007); Senior Counsel, Vice President and Director of Operational Risk Management and Compliance, Wellington Management Company, LLP (1995-2004); Director of Harding, Loevner Funds, Inc. (9 portfolios) (2017-Present); Secretary and Chief Legal Officer, AMG Funds, AMG Funds I, AMG Funds II and AMG Funds III (2004-2011). |
Officers
Position(s) Held with Fund and
Length of Time Served | Name, Age, Principal Occupation(s) During Past 5 Years |
• President since 2018 • Principal Executive Officer since 2018 • Chief Executive Officer since 2018 • Chief Operating Officer since 2007 | Keitha L. Kinne, 62 Chief Operating Officer, AMG Funds LLC (2007-Present); Chief Investment Officer, AMG Funds LLC (2008-Present); President and Principal, AMG Distributors, Inc. (2018-Present); Chief Operating Officer, AMG Distributors, Inc. (2007-Present); President, Chief Executive Officer and Principal Executive Officer, AMG Funds, AMG Funds I, AMG Funds II, AMG Funds III and AMG Funds IV (2018-Present); Chief Operating Officer, AMG Funds, AMG Funds I, AMG Funds II, and AMG Funds III (2007-Present); Chief Operating Officer, AMG Funds IV (2016-Present); Chief Operating Officer and Chief Investment Officer, Aston Asset Management, LLC (2016); President and Principal Executive Officer, AMG Funds, AMG Funds I, AMG Funds II and AMG Funds III (2012-2014); Managing Partner, AMG Funds LLC (2007-2014); President and Principal, AMG Distributors, Inc. (2012-2014); Managing Director, Legg Mason & Co., LLC (2006-2007); Managing Director, Citigroup Asset Management (2004-2006). |
• Secretary since 2015 • Chief Legal Officer since 2015 | Mark J. Duggan, 55 Senior Vice President and Senior Counsel, AMG Funds LLC (2015-Present); Secretary and Chief Legal Officer, AMG Funds, AMG Funds I, AMG Funds II, AMG Funds III and AMG Funds IV (2015-Present); Attorney, K&L Gates, LLP (2009-2015). |
• Chief Financial Officer since 2017 • Treasurer since 2017 • Principal Financial Officer since 2017 • Principal Accounting Officer since 2017 | Thomas G. Disbrow, 54 Vice President, Mutual Fund Treasurer & CFO, AMG Funds, AMG Funds LLC (2017-Present); Chief Financial Officer, Principal Financial Officer, Treasurer and Principal Accounting Officer, AMG Funds, AMG Funds I, AMG Funds II, AMG Funds III and AMG Funds IV (2017-Present); Managing Director - Global Head of Traditional Funds Product Control, UBS Asset Management (Americas), Inc. (2015-2017); Managing Director - Head of North American Funds Treasury, UBS Asset Management (Americas), Inc. (2011-2015). |
| • Deputy Treasurer since 2017 | John A. Starace, 50 Director, Mutual Fund Accounting, AMG Funds LLC (2017-Present); Vice President, Deputy Treasurer of Mutual Funds Services, AMG Funds LLC (2014-2017); Deputy Treasurer, AMG Funds, AMG Funds I, AMG Funds II, AMG Funds III and AMG Funds IV (2017-Present); Vice President, Citi Hedge Fund Services (2010-2014); Audit Senior Manager (2005-2010) and Audit Manager (2001-2005), Deloitte & Touche LLP. |
| • Chief Compliance Officer since 2019 | Patrick J. Spellman, 46
Vice President, Chief Compliance Officer, AMG Funds LLC (2017-Present); Chief Compliance Officer and Sarbanes-Oxley Code of Ethics Compliance Officer, AMG Funds, AMG Funds I, AMG Funds II, AMG Funds III and AMG Funds IV (2019-Present); Chief Compliance Officer, AMG Distributors, Inc., (2010-Present); Senior Vice President, Chief Compliance Officer, AMG Funds LLC (2011-2017); Anti-Money Laundering Compliance Officer, AMG Funds, AMG Funds I, AMG Funds II, and AMG Funds III (2014-2019); Anti-Money Laundering Officer, AMG Funds IV, (2016-2019); Compliance Manager, Legal and Compliance, Affiliated Managers Group, Inc. (2005-2011). |
| • Assistant Secretary since 2016 | Maureen A. Meredith, 35 Vice President, Counsel, AMG Funds LLC (2019-Present); Director, Counsel, AMG Funds LLC (2017-2018); Vice President, Counsel, AMG Funds LLC (2015-2017); Assistant Secretary, AMG Funds, AMG Funds I, AMG Funds II, AMG Funds III and AMG Funds IV (2016-Present); Associate, Ropes & Gray LLP (2011-2015); Law Fellow, Massachusetts Appleseed Center for Law and Justice (2010-2011). |
| • Anti-Money Laundering Compliance Officer since 2019 | Hector D. Roman, 43 Director, Legal and Compliance, AMG Funds LLC (2020-Present); Manager, Legal and Compliance, AMG Funds LLC (2017-2019); Director of Compliance, Morgan Stanley Investment Management (2015-2017); Senior Advisory, PricewaterhouseCoopers LLP (2014-2015); Risk Manager, Barclays Investment Bank (2008-2014); Anti-Money Laundering Compliance Officer, AMG Funds, AMG Funds I, AMG Funds II, AMG Funds III and AMG Funds IV (2019-Present). |
INVESTMENT MANAGER AND ADMINISTRATOR AMG Funds LLC
One Stamford Plaza
263 Tresser Blvd, Suite 949
Stamford, CT 06901
800.548.4539 DISTRIBUTOR AMG Distributors, Inc.
One Stamford Plaza
263 Tresser Blvd, Suite 949
Stamford, CT 06901
800.548.4539 SUBADVISER The Renaissance Group LLC
625 Eden Park Drive, Suite 1200
Cincinnati, OH 45202 | | CUSTODIAN The Bank of New York Mellon
111 Sanders Creek Parkway
East Syracuse, NY 13057 LEGAL COUNSEL Ropes & Gray LLP Prudential Tower, 800 Boylston Street
Boston, MA 02199-3600 TRANSFER AGENT BNY Mellon Investment Servicing (US) Inc.
Attn: AMG Funds
4400 Computer Drive
Westborough, MA 01581
800.548.4539 | | This report is prepared for the Fund’s shareholders. It is authorized for distribution to prospective investors only when preceded or accompanied by an effective prospectus. To receive a free copy of the prospectus or Statement of Additional Information, which includes additional information about Fund Trustees, please contact us by calling 800.548.4539. Distributed by AMG Distributors, Inc., member FINRA/SIPC.
Current net asset values per share for the Fund are available on the Fund’s website at amgfunds.com. A description of the policies and procedures the Fund uses to vote its proxies is available: (i) without charge, upon request, by calling 800.548.4539, or (ii) on the Securities and Exchange Commission’s (SEC) website at sec.gov. For information regarding the Fund’s proxy voting record for the 12-month period ended June 30, call 800.548.4539 or visit the SEC website at sec.gov. The Fund files its complete schedule of portfolio holdings with the SEC for the first and third quarters of each fiscal year as an exhibit to their reports on Form N-PORT. The Fund’s portfolio holdings on Form N-PORT are available on the SEC’s website at sec.gov and the Fund’s website at amgfunds.com. To review a complete list of the Fund’s portfolio holdings, or to view the most recent semi-annual report or annual report, please visit amgfunds.com. |
| | | | | |
| | | | | |
| AFFILIATE SUBADVISED FUNDS BALANCED FUNDS AMG GW&K Global Allocation GW&K Investment Management, LLC AMG FQ Global Risk-Balanced First Quadrant, L.P. EQUITY FUNDS AMG FQ Tax-Managed U.S. Equity AMG FQ Long-Short Equity First Quadrant, L.P. AMG Frontier Small Cap Growth Frontier Capital Management Co., LLC AMG GW&K Small Cap Core AMG GW&K Small Cap Value AMG GW&K Small/Mid Cap AMG GW&K Mid Cap AMG GW&K Emerging Markets Equity AMG GW&K Emerging Wealth Equity AMG GW&K International Small Cap GW&K Investment Management, LLC AMG Renaissance Large Cap Growth The Renaissance Group LLC AMG River Road Dividend All Cap Value
AMG River Road Focused Absolute Value
AMG River Road Long-Short
AMG River Road Small-Mid Cap Value
AMG River Road Small Cap Value River Road Asset Management, LLC | | AMG TimesSquare Emerging Markets Small Cap AMG TimesSquare Global Small Cap AMG TimesSquare International Small Cap AMG TimesSquare Mid Cap Growth
AMG TimesSquare Small Cap Growth TimesSquare Capital Management, LLC AMG Yacktman AMG Yacktman Focused AMG Yacktman Focused Fund - Security Selection Only AMG Yacktman Special Opportunities Yacktman Asset Management LP FIXED INCOME FUNDS AMG GW&K Core Bond ESG AMG GW&K Enhanced Core Bond ESG AMG GW&K High Income AMG GW&K Municipal Bond AMG GW&K Municipal Enhanced Yield GW&K Investment Management, LLC OPEN-ARCHITECTURE FUNDS EQUITY FUNDS AMG Managers Brandywine AMG Managers Brandywine Blue Friess Associates, LLC AMG Managers CenterSquare Real Estate CenterSquare Investment Management LLC | | AMG Managers Emerging Opportunities WEDGE Capital Management L.L.P. Next Century Growth Investors LLC RBC Global Asset Management (U.S.) Inc. AMG Managers Fairpointe Mid Cap Fairpointe Capital LLC AMG Managers LMCG Small Cap Growth LMCG Investments, LLC AMG Managers Montag & Caldwell Growth Montag & Caldwell, LLC AMG Managers Pictet International Pictet Asset Management Limited AMG Managers Silvercrest Small Cap Silvercrest Asset Management Group LLC AMG Managers Special Equity Ranger Investment Management, L.P.
Lord, Abbett & Co. LLC Smith Asset Management Group, L.P.
Federated MDTA LLC FIXED INCOME FUNDS AMG Managers DoubleLine Core Plus Bond DoubleLine Capital LP AMG Managers Loomis Sayles Bond Loomis, Sayles & Company, L.P. |
| | | | | | |
| | | | | | |
| | | | | | |
| | | | | | |
| | | | | | |
| Annual Report |
| | | AMG Funds | |
| | | | |
| | | December 31, 2020 | |
| | | | |
| | |  | |
| | | | |
| | | AMG TimesSquare Small Cap Growth Fund | |
| | | Class N: TSCPX | Class I: TSQIX | Class Z: TSCIX | |
| | | | |
| | | AMG TimesSquare Mid Cap Growth Fund | |
| | | Class N: TMDPX | Class I: TQMIX | Class Z: TMDIX | |
| | | | |
| | | AMG TimesSquare International Small Cap Fund | |
| | | Class N: TCMPX | Class I: TQTIX | Class Z: TCMIX | |
| | | | |
| | | AMG TimesSquare Emerging Markets Small Cap Fund |
| | | Class N: TQENX | Class I: TQEIX | Class Z: TQEZX | |
| | | | |
| | | AMG TimesSquare Global Small Cap Fund | |
| | | Class N: TSYNX | Class I: TSYIX | Class Z: TSYZX | |
| | | | | | |
| | | | | | |
| |
| AMG Funds |
| Annual Report — December 31, 2020 |
| | | | |
| | TABLE OF CONTENTS | PAGE | |
| | LETTER TO SHAREHOLDERS | 2 | |
| | ABOUT YOUR FUND’S EXPENSES | 3 | |
| | PORTFOLIO MANAGER’S COMMENTS, FUND SNAPSHOTS AND SCHEDULES OF PORTFOLIO INVESTMENTS | | |
| |
| | AMG TimesSquare Small Cap Growth Fund | 5 | |
| | AMG TimesSquare Mid Cap Growth Fund | 14 | |
| | AMG TimesSquare International Small Cap Fund | 21 | |
| | AMG TimesSquare Emerging Markets Small Cap Fund | 30 | |
| | AMG TimesSquare Global Small Cap Fund | 38 | |
| | | | |
| | FINANCIAL STATEMENTS | | |
| | Statement of Assets and Liabilities | 46 | |
| | Balance sheets, net asset value (NAV) per share computations | | |
| | and cumulative distributable earnings (loss) | | |
| | | | |
| | Statement of Operations | 48 | |
| | Detail of sources of income, expenses, and realized and | | |
| | unrealized gains (losses) during the fiscal year | | |
| | | | |
| | Statements of Changes in Net Assets | 49 | |
| | Detail of changes in assets for the past two fiscal years | | |
| | | | |
| | Financial Highlights | 51 | |
| | Historical net asset values per share, distributions, total returns, income | | |
| | and expense ratios, turnover ratios and net assets | | |
| | | | |
| | Notes to Financial Statements | 66 | |
| | Accounting and distribution policies, details of agreements and | | |
| | transactions with Fund management and affiliates, and descriptions of | | |
| | certain investment risks | | |
| | | | |
| | REPORT OF INDEPENDENT REGISTERED PUBLIC ACCOUNTING FIRM | 76 | |
| | | | |
| | OTHER INFORMATION | 77 | |
| | | | |
| | TRUSTEES AND OFFICERS | 78 | |
| | | | |
| | | | |
| | Nothing contained herein is to be considered an offer, sale or solicitation of an offer to buy shares of any series of the AMG Funds Family of Funds. Such offering is made only by prospectus, which includes details as to offering price and other material information. | |
| | Letter to Shareholders |
Dear Shareholder:
The fiscal year ending December 31, 2020, was a volatile period for financial markets that featured a dramatic selloff and extraordinary rebound amid the unprecedented global effort to stop the COVID-19 pandemic. Early in the year, equities achieved new record highs against the backdrop of a healthy economy and strong investor sentiment. However, a broad-based selloff occurred amid a global flight to quality as investors assessed the scope of the unfolding COVID-19 pandemic, a deteriorating economy, and skyrocketing unemployment. An oil price war initiated between Saudi Arabia and Russia only made matters worse. From its peak in mid-February 2020, the S&P 500® Index declined (33.79)% over the span of a few weeks, halting the eleven-year equity bull market. In response to the crisis, global central banks and governments were quick to flood the market with massive fiscal and monetary stimulus which helped to stabilize the market and led to an impressive recovery in risk assets, albeit a very uneven one. So despite the volatility, the S&P 500® Index still achieved an 18.40% return for 2020 while effective COVID-19 vaccines and further government stimulus bolstered investor optimism for a brighter future in 2021.
During the year there was very wide dispersion in performance across sectors, with information technology and consumer discretionary sectors leading the market with returns of 43.88% and 33.30%, respectively. On the other hand, companies in the energy sector fell (33.69)%, and financials and real estate also produced slightly negative returns. Growth stocks significantly outperformed value stocks for the period with returns of 38.49% and 2.80% for the Russell 1000® Growth and Russell 1000® Value Indexes, respectively. Small cap stocks endured a wild ride in 2020 as the Russell 2000® Index experienced both its best quarter (fourth quarter 2020) and worst quarter (first quarter 2020) on record. For the year as a whole, small cap returns were relatively in line with the broader market as the Russell 2000® Index gained 19.96% in 2020. Outside the U.S., emerging markets outperformed developed markets with an 18.31% return for the MSCI Emerging Markets Index compared to a 7.82% return for the MSCI EAFE Index.
Interest rates fell dramatically and led to strong returns for bond investors as the U.S. Federal Reserve (the Fed) slashed short-term rates in response to the slowing economy. The 10-year Treasury yield ended the year near a historic low yield of 0.93%. The Bloomberg Barclays U.S. Aggregate Bond Index, a broad measure of U.S. bond market performance, returned 7.51% over the period. Investment grade corporate bonds rebounded from the selloff early in the year and returned 9.89% in 2020. Riskier high yield bonds lagged the investment grade market with a 7.11% return as measured by the return of the Bloomberg Barclays U.S. Corporate High Yield Bond Index.
AMG Funds appreciates the privilege of providing investment tools to you and your clients. Our foremost goal is to provide investment solutions that help our shareholders successfully reach their long-term investment goals. AMG Funds provides access to a distinctive array of actively managed return-oriented investment strategies. We thank you for your continued confidence and investment in AMG Funds. You can rest assured that under all market conditions our team is focused on delivering excellent investment management services for your benefit.
Respectfully,

Keitha Kinne
President
AMG Funds
| Average Annual Total Returns | Periods ended
December 31, 2020* |
| Stocks: | | 1 Year | 3 Years | 5 Years |
| Large Cap | (S&P 500® Index) | 18.40% | 14.18% | 15.22% |
| Small Cap | (Russell 2000® Index) | 19.96% | 10.25% | 13.26% |
| | (MSCI All Country World | | | |
| International | Index ex USA) | 10.65% | 4.88% | 8.93% |
| Bonds: | | | | |
| | (Bloomberg Barclays U.S. | | | |
| Investment Grade | Aggregate Bond Index) | 7.51% | 5.34% | 4.44% |
| | (Bloomberg Barclays U.S. | | | |
| High Yield | Corporate High Yield Bond Index) | 7.11% | 6.24% | 8.59% |
| | (Bloomberg Barclays | | | |
| Tax-exempt | Municipal Bond Index) | 5.21% | 4.64% | 3.91% |
| | (ICE BofAML U.S. 6-Month | | | |
| Treasury Bills | Treasury Bill Index) | 1.05% | 1.84% | 1.43% |
*Source: FactSet. Past performance is no guarantee of future results.
| About Your Fund’s Expenses |
As a shareholder of a Fund, you may incur two types of costs: (1) transaction costs, which may include sales charges (loads) on purchase payments; redemption fees; and exchange fees; and (2) ongoing costs, including management fees; distribution (12b-1) fees; and other Fund expenses. This example is intended to help you understand your ongoing costs (in dollars) of investing in the Fund and to compare these costs with the ongoing costs of investing in other mutual funds. The example is based on $1,000 invested at the beginning of the period and held for the entire period as indicated below. ACTUAL EXPENSES The first line of the following table provides information about the actual account values and | actual expenses. You may use the information in this line, together with the amount you invested, to estimate the expenses that you paid over the period. Simply divide your account value by $1,000 (for example, an $8,600 account value divided by $1,000 = 8.6), then multiply the result by the number in the first line under the heading entitled “Expenses Paid During Period” to estimate the expenses you paid on your account during this period. HYPOTHETICAL EXAMPLE FOR COMPARISON PURPOSES The second line of the following table provides information about hypothetical account values and hypothetical expenses based on the Fund’s actual expense ratio and an assumed annual rate of return of 5% before expenses, which is not the Fund’s | actual return. The hypothetical account values and expenses may not be used to estimate the actual ending account balance or expenses you paid for the period. You may use this information to compare the ongoing costs of investing in the Fund and other funds by comparing this 5% hypothetical example with the 5% hypothetical examples that appear in the shareholder reports of other funds. Please note that the expenses shown in the table are meant to highlight your ongoing costs only and do not reflect any transactional costs, such as sales charges (loads), redemption fees, or exchange fees. Therefore, the second line of the table is useful in comparing ongoing costs only, and will not help you determine the relative total costs of owning different funds. |
| |
Six Months Ended
December 31, 2020 | | Expense
Ratio for
the Period | | Beginning
Account
Value
07/01/20 | | Ending
Account
Value
12/31/20 | | Expenses
Paid
During
the Period* |
| AMG TimesSquare Small Cap Growth Fund |
| Based on Actual Fund Return |
| Class N | | 1.19 | % | | $1,000 | | | $1,339 | | | $7.00 | |
| Class I | | 1.05 | % | | $1,000 | | | $1,341 | | | $6.18 | |
| Class Z | | 0.99 | % | | $1,000 | | | $1,342 | | | $5.83 | |
| Based on Hypothetical 5% Annual Return |
| Class N | | 1.19 | % | | $1,000 | | | $1,019 | | | $6.04 | |
| Class I | | 1.05 | % | | $1,000 | | | $1,020 | | | $5.33 | |
| Class Z | | 0.99 | % | | $1,000 | | | $1,020 | | | $5.03 | |
| | | | | | | | | | | | | |
| AMG TimesSquare Mid Cap Growth Fund |
| Based on Actual Fund Return |
| Class N | | 1.18 | % | | $1,000 | | | $1,287 | | | $6.78 | |
| Class I | | 1.03 | % | | $1,000 | | | $1,289 | | | $5.93 | |
| Class Z | | 0.98 | % | | $1,000 | | | $1,289 | | | $5.64 | |
| Based on Hypothetical 5% Annual Return |
| Class N | | 1.18 | % | | $1,000 | | | $1,019 | | | $5.99 | |
| Class I | | 1.03 | % | | $1,000 | | | $1,020 | | | $5.23 | |
| Class Z | | 0.98 | % | | $1,000 | | | $1,020 | | | $4.98 | |
| | | | | | | | | |
Six Months Ended
December 31, 2020 | | Expense
Ratio for
the Period | | Beginning
Account
Value
07/01/20 | | Ending
Account
Value
12/31/20 | | Expenses
Paid
During
the Period* |
| AMG TimesSquare International Small Cap Fund |
| Based on Actual Fund Return |
| Class N | | 1.22 | % | | $1,000 | | | $1,288 | | | $7.02 | |
| Class I | | 1.08 | % | | $1,000 | | | $1,289 | | | $6.21 | |
| Class Z | | 0.97 | % | | $1,000 | | | $1,289 | | | $5.58 | |
| Based on Hypothetical 5% Annual Return |
| Class N | | 1.22 | % | | $1,000 | | | $1,019 | | | $6.19 | |
| Class I | | 1.08 | % | | $1,000 | | | $1,020 | | | $5.48 | |
| Class Z | | 0.97 | % | | $1,000 | | | $1,020 | | | $4.93 | |
| | | | | | | | | | | | | |
| AMG TimesSquare Emerging Markets Small Cap Fund |
| Based on Actual Fund Return |
| Class N | | 1.65 | % | | $1,000 | | | $1,304 | | | $9.55 | |
| Class I | | 1.25 | % | | $1,000 | | | $1,306 | | | $7.25 | |
| Class Z | | 1.25 | % | | $1,000 | | | $1,307 | | | $7.25 | |
| Based on Hypothetical 5% Annual Return |
| Class N | | 1.65 | % | | $1,000 | | | $1,017 | | | $8.36 | |
| Class I | | 1.25 | % | | $1,000 | | | $1,019 | | | $6.34 | |
| Class Z | | 1.25 | % | | $1,000 | | | $1,019 | | | $6.34 | |
| About Your Fund’s Expenses (continued) |
| | | | | | | | | |
Six Months Ended
December 31, 2020 | | Expense
Ratio for
the Period | | Beginning
Account
Value
07/01/20 | | Ending
Account
Value
12/31/20 | | Expenses
Paid
During
the Period* |
| AMG TimesSquare Global Small Cap Fund |
| Based on Actual Fund Return |
| Class N | | 1.25 | % | | $1,000 | | | $1,255 | | | $7.09 | |
| Class I | | 1.00 | % | | $1,000 | | | $1,257 | | | $5.67 | |
| Class Z | | 1.00 | % | | $1,000 | | | $1,257 | | | $5.67 | |
| Based on Hypothetical 5% Annual Return |
| Class N | | 1.25 | % | | $1,000 | | | $1,019 | | | $6.34 | |
| Class I | | 1.00 | % | | $1,000 | | | $1,020 | | | $5.08 | |
| Class Z | | 1.00 | % | | $1,000 | | | $1,020 | | | $5.08 | |
| * | Expenses are equal to the Fund’s annualized expense ratio multiplied by the average account value over the period, multiplied by the number of days in the most recent fiscal half-year (184), then divided by 366. |
AMG TimesSquare Small Cap Growth Fund
Portfolio Manager’s Comments (unaudited) |
The Year In Review For the year ended December 31, 2020, AMG TimesSquare Small Cap Growth Fund’s (the “Fund”) Class N shares returned 34.96%, while its benchmark, the Russell 2000® Growth Index, returned 34.63%. We close the books on 2020, a year where the most important statistic may have been COVID-19’s global death toll of 1.8 million people, 20% of whom were from the U.S. Somewhat surprising this year, in the face of that casualty rate and widespread shutdowns, was the doggedness of the global equity markets that looked past the social and economic damage taking place in 2020. Markets instead focused on the potential halcyon days waiting in 2021. The major global market indexes declined by an average of (29)% from the start of the year to the lows of mid-March, followed by an ascent of 62%, and ended the year with an above typical annual gain of 15%. Global volatility levels spiked in March to peaks not seen since the 2008 Global Financial Crisis, though quickly receded to moderate levels. Economic activities worldwide quickly fell to record low contraction levels in April; though by summer they returned to economic expansion territory with staggered reopenings of businesses, and ended the year slightly higher than they began it. Central banks assisted with significant monetary stimulus—or quantitative easing to the nth degree—which led most governments’ responses as levels of fiscal support varied. Stable economic growth seemed fleeting in the U.S. this year. The annual rate of gross domestic product growth slipped by (5)% in the first quarter before tumbling (31)% in the second quarter—the steepest quarterly drop on record. While there was a sharp recovery in the third quarter of 33%, that still left a significant dent in productivity even if an above average growth rate is reported for the fourth quarter. Despite the optimism shown by the gains for equities and expectations of economic expansion, measures of consumer confidence and sentiment deteriorated as the year came to an end, with the December resurgence of COVID-19 cases curbing their enthusiasm. Another factor likely was the contentious election and equally disruptive aftermath. After all the shouting, counting, and more shouting, the Presidential administration and the Senate changed parties. The U.S. market’s craving for growth was apparent in the cross currents among equity returns. For the full year, growth stocks were the clear winners across all | size segments and larger capitalization stocks had higher returns. Within small-to-mid cap growth, the market preferred lower quality, higher valuations—even stocks without earnings did very well—and higher risk. Thus it was not surprising that information technology and health care were among the best performing sectors. Amidst this environment, the Fund outperformed the Russell 2000® Growth Index in 2020. There was relative weakness in the industrials, consumer discretionary, and information technology sectors. That was offset by strength from our positions in the financials and health care sectors. The industrials sector contracted sharply as the economy shut down during the spring, and rebounded with cyclical fervor when fears were replaced with hopes for economic reopenings. During the plunge in March we sold our position in Viad Corp., which organizes high-end tourism and travel, along with experiential corporate marketing events. Earlier in the year we had trimmed the position following good results, but then the pandemic took its initial toll on all travel-related companies. We did not believe that Viad would recover as quickly as others so we exited with an (81)% return, which made it the Fund’s greatest detractor in 2020. CIRCOR International was another company that saw its fortunes fall early in the year. A manufacturer of precision pumps and valves for the energy, industrial and aerospace industries, all of CIRCOR’s end markets were under pressure for the first half of 2020. Its businesses stabilized in the fall, though by then we felt there were better opportunities elsewhere. When we completed our sales in early November, CIRCOR’s shares were down (39)% for the partial year. With more of the population sheltering at home, there were greater desires to improve those homes. That led to a 64% gain for The AZEK Co, Inc. since we established a position from its IPO in June. A manufacturer of wood-alternative decking, railing, trim and moulding, AZEK saw steady revenue growth since becoming a public company while at the same time improving its margins. No sector was whipsawed as much this year as consumer discretionary: falling (52)% until the March lows before rocketing 183% during the balance of 2020. As might be expected, our weakest holdings were in travel-related industries. For example, there was a (40)% decline from OneSpaWorld Holdings, Ltd., which offers health and wellness services aboard cruise ships as well as at destination resorts. With cruise ships idled by the | pandemic early in the year, the company withdrew all guidance. By the end of March, it seemed that the worst was past for OneSpaWorld and the company later raised capital to provide a few years’ of liquidity to ride out the storm. In light of market reaction, we reduced the Fund’s positon in OneSpaWorld for now. We believed quicker action was called for with Hudson Ltd., which operates retail businesses in travel centers under brands Hudson News, Hudson Booksellers, Dufry, and World Duty Free. The company responded to the shutdown by closing 700 of its stores in airports, commuter hubs, and tourist locations. With no visibility for a resumption of activity, we sold our shares in April that were down (67)% by that point in the year. Leaving the strategy on better terms was Chegg Software and its 74% gain through June. Serving college students with online study aids, tutoring, and textbook rentals, Chegg saw its shares hold most of their value during the first quarter sell-off as well as participate in the second quarter’s rebound. Demand for digital study tools, such as those offered by Chegg, remained strong and received a boost by campus closures due to the coronavirus. That propelled its market capitalization beyond the strategy’s limit and we had to sell. There were also challenges this year for our information technology holdings. The falloff in travel was felt here by WNS Holdings, Ltd. ADR, whose calendar year performance of 10% lagged the 43% benchmark average return for this sector. Providing business process management services—including customer interaction, finance and accounting, and data analytics—WNS has significant end market exposure to various travel businesses. However, its contracts are long-term in nature and WNS’s business model benefits from any customer interaction—not only those where sales are made. Far better was the 126% gain for SailPoint Technologies Holdings, Inc., which develops identity governance systems for enterprise-wide use across various platforms and environments. We added to our position in SailPoint early in the year and again in July following our determination that its sales goals were on track. Then in August, SailPoint reported revenues and earnings that far outpaced sell-side estimates, with strength across all its products and regions. The subsequent quarter saw revenues, billing, and earnings all outstrip expectations with a significant demand increase for IGA (Identity Governance and Administration) modernization projects. |
AMG TimesSquare Small Cap Growth Fund
Portfolio Manager’s Comments (continued) |
Results were better in the financials sector. One steady position was Houlihan Lokey, Inc., a boutique corporate advisory firm focused on financial restructurings. At the start of the year, the company’s management noted there were no material shifts in deal closings despite the macroeconomic uncertainty caused by COVID-19. They were confident that in the event there was a significant reduction in merger and acquisition (M&A) activities, those losses could be offset by increased restructuring revenues. That was apparent when the next quarter’s results included restructuring revenues that were higher than expected. Later in the year, as M&A activity reaccelerated, so did the upward pace of Houlihan’s shares, which ended the year ahead by 41%. The health care sector gave the Fund its largest boost this year. That included the top overall contributor, iRhythm Technologies. Developing biosensors and data analytics for cardiac monitoring, iRhythm’s business was relatively insulated from the pandemic and the company expanded its home | enrollment program to all health care providers and patients. Quarter after quarter the company exceeded expectations, particularly assisted in August from improved pricing terms from the Centers for Medicare & Medicaid Services. Eventually iRhythm’s shares reached our price target and we exited the position in December after a gain of 254% in 2020. Another example was the 140% climb for Acceleron Pharma, Inc., a biotechnology developer of treatments that promote red blood cell production and thus can be used for anemia and related diseases. The lion’s share of its gains occurred early in the year when Acceleron’s phase II pulmonary arterial hypertension trial achieved its primary and secondary goals. Other key trials were in progress—and later approved—for Myelodysplastic Syndrome (a condition that affects the production of blood cells in bone marrow) and Beta Thalassemia (a blood disorder that reduces the production of hemoglobin). Turning the page to 2021 allows us to look forward optimistically, but does not extinguish the concerns that plagued 2020. The start of the new year marked | the end of the Brexit transition for the U.K. from the European Union; so beginning later this month all the new agreements will go into effect for trade, travel, and other aspects. While distribution began for COVID-19 vaccines, case rates continued to climb and the coronavirus showed signs of mutating. Although we have not yet returned to our New York City office, all of us at TimesSquare Capital Management, LLC continue working collectively to steward your investments. We hope that 2021 will be brighter for all of us, though from an investment perspective we remain vigilant. As always, we are available for any questions you might have as we endeavor to protect the assets you have entrusted with us. This commentary reflects viewpoints of TimesSquare Capital Management, LLC and is not intended as a forecast or guarantee of future results. |
| | |
| | AMG TimesSquare Small Cap Growth Fund |
| | Portfolio Manager’s Comments (continued) |
CUMULATIVE TOTAL RETURN PERFORMANCE
AMG Times Square Small Cap Growth Fund’s cumulative total return is based on the daily change in net asset value (NAV), and assumes that all dividends and distributions were reinvested. This graph compares a hypothetical $10,000 investment made in the AMG Times Square Small Cap Growth Fund’s Class N shares on December 31, 2010 to a $10,000 investment made in the Russell 2000® Growth Index for the same time period. The graph and table do not reflect the deduction of taxes that a shareholder would pay on a Fund distribution or redemption of shares. The listed returns for the Fund are net of expenses and the returns for the index exclude expenses. Total returns would have been lower had certain expenses not been reduced.

The table below shows the average annual total returns for the AMG TimesSquare Small Cap Growth Fund and the Russell 2000® Growth Index for the same time periods ended December 31, 2020.
| Average Annual Total Returns1 | One Year | Five Years | Ten Years | Since Inception | Inception Date | |
| AMG TimesSquare Small Cap Growth Fund2, 3, 4, 5, 6 | | | | | |
| Class N | 34.96% | 16.65% | 13.72% | 10.21% | 01/21/00 | |
| Class I | 35.19% | — | — | 18.57% | 02/24/17 | |
| Class Z | 35.35% | 16.90% | 13.93% | 10.38% | 01/21/00 | |
| Russell 2000® Growth Index7 | 34.63% | 16.36% | 13.48% | 6.42% | 01/21/00 | † |
The performance data shown represents past performance. Past performance is not a guarantee of future results. Current performance may be lower or higher than the performance data quoted. The investment return and principal value of an investment will fluctuate so that an investor’s shares, when redeemed, may be worth more or less than their original cost.
Investors should carefully consider the Fund’s investment objectives, risks, charges and expenses before investing. For performance information through the most recent month end, current net asset values per share for the Fund and other information, please call 800.548.4539 or visit our website at amgfunds.com for a free prospectus. Read it carefully before investing or sending money.
Distributed by AMG Distributors, Inc., member FINRA/SIPC.
| † | Date reflects inception date of the Fund, not the index. |
| 1 | Total return equals income yield plus share price change and assumes reinvestment of all dividends and capital gain distributions. Returns are net of fees and may reflect offsets of Fund expenses as described in the prospectus. No adjustment has been made for taxes payable by shareholders on their reinvested dividends and |
| | capital gain distributions. Returns for periods greater than one year are annualized. The listed returns on the Fund are net of expenses and based on the published NAV as of December 31, 2020. All returns are in U.S. dollars ($). |
| 2 | From time to time, the Fund’s investment manager has waived its fees and/or absorbed Fund expenses, which has resulted in higher returns. |
| 3 | The Fund is subject to risks associated with investments in small-capitalization companies, such as erratic earnings patterns, competitive conditions, limited earnings history and a reliance on one or a limited number of products. |
| 4 | The Fund invests in growth stocks, which may be more sensitive to market movements because their prices tend to reflect future investor expectations rather than just current profits. Growth stocks may underperform value stocks during given periods. |
| 5 | Market prices of investments held by the Fund may fall rapidly or unpredictably due to a variety of economic or political factors, market conditions, disasters or public health issues, or in response to events that affect particular industries or companies. |
| 6 | Companies that are in similar businesses may be similarly affected by particular economic or market events; to the extent the Fund has substantial holdings within a particular sector, the risks associated with that sector increase. |
| 7 | The Russell 2000® Growth Index measures the performance of the Russell 2000® companies with higher price-to-book ratios and higher forecasted growth values. Unlike the Fund, the Russell 2000® Growth Index is unmanaged, is not available for investment, and does not incur expenses. |
The Russell 2000® Growth Index is a trademark of the London Stock Exchange Group companies.
Not FDIC insured, nor bank guaranteed. May lose value.
| | AMG TimesSquare Small Cap Growth Fund |
| | Fund Snapshots (unaudited) |
| | December 31, 2020 |
PORTFOLIO BREAKDOWN
| Sector | % of
Net Assets |
| Information Technology | 28.5 | |
| Health Care | 22.5 | |
| Industrials | 14.1 | |
| Consumer Discretionary | 11.9 | |
| Financials | 8.7 | |
| Communication Services | 4.6 | |
| Consumer Staples | 2.2 | |
| Real Estate | 2.2 | |
| Utilities | 1.2 | |
| Materials | 0.9 | |
| Short-Term Investments1 | 7.9 | |
| Other Assets Less Liabilities2 | (4.7 | ) |
| 1 | Includes reinvestment of cash collateral into joint repurchase agreements on security lending transactions. |
| 2 | Includes repayment of cash collateral on security lending transactions. |
TOP TEN HOLDINGS
| Security Name | | % of Net Assets |
| Q2 Holdings, Inc. | | 2.0 | |
| Sailpoint Technologies Holdings, Inc. | | 1.8 | |
| Wheels Up | | 1.6 | |
| Acceleron Pharma, Inc. | | 1.6 | |
| WNS Holdings, Ltd., ADR (India) | | 1.5 | |
| NIC, Inc. | | 1.5 | |
| Phreesia, Inc. | | 1.5 | |
| LendingTree, Inc. | | 1.5 | |
| National Vision Holdings, Inc. | | 1.4 | |
| Onto Innovation, Inc. | | 1.4 | |
| Top Ten as a Group | | 15.8 | |
Because a fund’s strategy may result in multiple investments in particular sectors of the economy, its performance may depend on the performance of those sectors and may fluctuate more widely than investments diversified across more sectors. For additional information on these and other risk considerations, please see the Fund’s prospectus.
Any sectors, industries, or securities discussed should not be perceived as investment recommendations. Mention of a specific security should not be considered a recommendation to buy or solicitation to sell that security. Specific securities mentioned in this report may have been sold from the Fund’s portfolio of investments by the time you receive this report.
| | AMG TimesSquare Small Cap Growth Fund |
| | Schedule of Portfolio Investments |
| | December 31, 2020 |
| | Shares | | Value | |
| Common Stocks - 95.0% | | | | |
| Communication Services - 4.6% | | | | |
| Bandwidth, Inc., Class A*,1 | 35,500 | | $5,455,285 | |
| Cardlytics, Inc.* | 8,600 | | 1,227,822 | |
| Cogent Communications Holdings, Inc. | 20,000 | | 1,197,400 | |
| CuriosityStream, Inc.* | 218,669 | | 3,050,433 | |
| CuriosityStream, Inc.*,2,3,4 | 52,622 | | 587,261 | |
| Shenandoah Telecommunications Co. | 65,000 | | 2,811,250 | |
| Vonage Holdings Corp.* | 459,200 | | 5,912,200 | |
| Total Communication Services | | | 20,241,651 | |
| Consumer Discretionary - 10.3% | | | | |
| 1-800-Flowers.com, Inc., Class A*,1 | 115,000 | | 2,990,000 | |
| At Home Group, Inc.*,1 | 186,000 | | 2,875,560 | |
| Callaway Golf Co. | 143,000 | | 3,433,430 | |
| Hilton Grand Vacations, Inc.* | 100,000 | | 3,135,000 | |
| Leslie’s, Inc.*,1 | 150,000 | | 4,162,500 | |
| Malibu Boats, Inc., Class A* | 50,000 | | 3,122,000 | |
| National Vision Holdings, Inc.*,1 | 140,000 | | 6,340,600 | |
| Ollie’s Bargain Outlet Holdings, Inc.*,1 | 23,500 | | 1,921,595 | |
| OneSpaWorld Holdings, Ltd. (Bahamas)1 | 150,000 | | 1,521,000 | |
| Planet Fitness, Inc., Class A* | 53,000 | | 4,114,390 | |
| Rush Street Interactive, Inc.* | 210,200 | | 4,550,830 | |
| Wingstop, Inc. | 30,000 | | 3,976,500 | |
| YETI Holdings, Inc.* | 54,500 | | 3,731,615 | |
| Total Consumer Discretionary | | | 45,875,020 | |
| Consumer Staples - 2.2% | | | | |
| BJ’s Wholesale Club Holdings, Inc.*,1 | 104,000 | | 3,877,120 | |
| The Simply Good Foods Co.* | 133,000 | | 4,170,880 | |
| Vital Farms, Inc.*,1 | 76,000 | | 1,923,560 | |
| Total Consumer Staples | | | 9,971,560 | |
| Financials - 8.5% | | | | |
| CIIG Merger Corp., Class A*,1 | 65,100 | | 1,830,612 | |
| Evercore, Inc., Class A | 32,000 | | 3,508,480 | |
| Focus Financial Partners, Inc., Class A* | 100,000 | | 4,350,000 | |
| Green Dot Corp., Class A* | 78,000 | | 4,352,400 | |
| Hamilton Lane, Inc., Class A | 59,000 | | 4,604,950 | |
| Houlihan Lokey, Inc. | 45,000 | | 3,025,350 | |
| LendingTree, Inc.*,1 | 24,000 | | 6,570,960 | |
| Selective Insurance Group, Inc. | 67,000 | | 4,487,660 | |
| South Mountain Merger Corp., Class A* | 174,300 | | 2,811,459 | |
| TPG Pace Beneficial Finance Corp., Class A*,1 | 90,000 | | 2,328,300 | |
| Total Financials | | | 37,870,171 | |
| | Shares | | Value | |
| Health Care - 22.5% | | | | |
| Acceleron Pharma, Inc.* | 54,000 | | $6,908,760 | |
| Adaptive Biotechnologies Corp.* | 91,000 | | 5,380,830 | |
| Addus HomeCare Corp.* | 50,000 | | 5,854,500 | |
| Arcus Biosciences, Inc.* | 87,000 | | 2,258,520 | |
| AtriCure, Inc.* | 90,000 | | 5,010,300 | |
| BioLife Solutions, Inc.* | 53,000 | | 2,114,170 | |
| Blueprint Medicines Corp.* | 53,000 | | 5,943,950 | |
| Bridgebio Pharma, Inc.*,1 | 62,500 | | 4,444,375 | |
| Certara, Inc.* | 30,900 | | 1,041,948 | |
| ChemoCentryx, Inc.* | 54,500 | | 3,374,640 | |
| CRISPR Therapeutics AG (Switzerland)* | 7,200 | | 1,102,392 | |
| Inspire Medical Systems, Inc.* | 30,000 | | 5,642,700 | |
| Intra-Cellular Therapies, Inc.*,1 | 92,000 | | 2,925,600 | |
| LHC Group, Inc.* | 18,000 | | 3,839,760 | |
| Mersana Therapeutics, Inc.* | 37,100 | | 987,231 | |
| MorphoSys AG, ADR (Germany)*,1 | 88,000 | | 2,493,920 | |
| NanoString Technologies, Inc.*,1 | 72,500 | | 4,848,800 | |
| Outset Medical, Inc.* | 45,400 | | 2,580,536 | |
| Phreesia, Inc.* | 123,000 | | 6,673,980 | |
| PTC Therapeutics, Inc.* | 75,000 | | 4,577,250 | |
| Pulmonx Corp.* | 32,200 | | 2,222,444 | |
| Quotient, Ltd. (Switzerland)*,1 | 380,000 | | 1,979,800 | |
| Shockwave Medical, Inc.*,1 | 30,000 | | 3,111,600 | |
| Silk Road Medical, Inc.* | 62,500 | | 3,936,250 | |
| STAAR Surgical Co.* | 45,000 | | 3,564,900 | |
| Tandem Diabetes Care, Inc.* | 41,500 | | 3,970,720 | |
| Tarsus Pharmaceuticals, Inc.*,1 | 52,200 | | 2,157,426 | |
| Taysha Gene Therapies, Inc.*,1 | 44,000 | | 1,167,760 | |
| Total Health Care | | | 100,115,062 | |
| Industrials - 14.1% | | | | |
| Albany International Corp., Class A | 39,000 | | 2,863,380 | |
| ASGN, Inc.* | 73,000 | | 6,097,690 | |
| Axon Enterprise, Inc.* | 33,500 | | 4,104,755 | |
| The AZEK Co., Inc.* | 158,700 | | 6,102,015 | |
| Builders FirstSource, Inc.* | 97,100 | | 3,962,651 | |
| Casella Waste Systems, Inc., Class A* | 86,000 | | 5,327,700 | |
| Clean Harbors, Inc.* | 64,000 | | 4,870,400 | |
| EMCOR Group, Inc. | 50,000 | | 4,573,000 | |
| Exponent, Inc. | 39,000 | | 3,511,170 | |
| Proto Labs, Inc.* | 14,000 | | 2,147,600 | |
| Rexnord Corp. | 156,000 | | 6,160,440 | |
| TPI Composites, Inc.* | 54,000 | | 2,850,120 | |
The accompanying notes are an integral part of these financial statements.
| | |
| | AMG TimesSquare Small Cap Growth Fund |
| | Schedule of Portfolio Investments (continued) |
| | Shares | | Value | |
| Industrials - 14.1% (continued) | | | | |
| TriNet Group, Inc.* | 68,000 | | $5,480,800 | |
| WillScot Mobile Mini Holdings Corp.* | 200,000 | | 4,634,000 | |
| Total Industrials | | | 62,685,721 | |
| Information Technology - 28.5% | | | | |
| 2U, Inc.*,1 | 113,000 | | 4,521,130 | |
| Allegro MicroSystems, Inc.*,1 | 111,700 | | 2,977,922 | |
| Bottomline Technologies, Inc.* | 82,500 | | 4,351,050 | |
| Brooks Automation, Inc. | 46,000 | | 3,121,100 | |
| CMC Materials, Inc. | 19,000 | | 2,874,700 | |
| Envestnet, Inc.* | 54,000 | | 4,443,660 | |
| Evo Payments, Inc., Class A* | 135,000 | | 3,646,350 | |
| ExlService Holdings, Inc.* | 67,000 | | 5,703,710 | |
| I3 Verticals, Inc., Class A* | 145,000 | | 4,814,000 | |
| JFrog, Ltd. (Israel)*,1 | 49,000 | | 3,078,670 | |
| Kulicke & Soffa Industries, Inc. (Singapore) | 120,000 | | 3,817,200 | |
| Littelfuse, Inc. | 21,500 | | 5,475,190 | |
| Medallia, Inc.*,1 | 175,000 | | 5,813,500 | |
| MKS Instruments, Inc. | 30,000 | | 4,513,500 | |
| New Relic, Inc.* | 80,000 | | 5,232,000 | |
| NIC, Inc. | 259,000 | | 6,689,970 | |
| nLight, Inc.* | 95,000 | | 3,101,750 | |
| Onto Innovation, Inc.* | 130,000 | | 6,181,500 | |
| Priority Technology Holdings, Inc.* | 402,245 | | 2,831,805 | |
| Q2 Holdings, Inc.* | 71,000 | | 8,983,630 | |
| Repay Holdings Corp.* | 214,400 | | 5,842,400 | |
| Sailpoint Technologies Holdings, Inc.*,1 | 150,000 | | 7,986,000 | |
| Smartsheet, Inc., Class A* | 87,000 | | 6,028,230 | |
| Sumo Logic, Inc.*,1 | 43,400 | | 1,240,372 | |
| Talend, S.A., ADR * | 62,500 | | 2,396,250 | |
| Vertex, Inc., Class A*,1 | 132,000 | | 4,600,200 | |
| WNS Holdings, Ltd., ADR (India)* | 94,000 | | 6,772,700 | |
| Total Information Technology | | | 127,038,489 | |
| Materials - 0.9% | | | | |
| Avient Corp. | 94,000 | | 3,786,320 | |
| Real Estate - 2.2% | | | | |
| Innovative Industrial Properties, Inc., REIT | 25,000 | | 4,578,250 | |
| Kennedy-Wilson Holdings, Inc. | 300,000 | | 5,367,000 | |
| Total Real Estate | | | 9,945,250 | |
| Utilities - 1.2% | | | | |
| Sunnova Energy International, Inc.* | 119,000 | | 5,370,470 | |
| Total Common Stocks | | | | |
| (Cost $281,275,361) | | | 422,899,714 | |
| | Shares | | Value | |
| Preferred Stock - 1.6% | | | | |
| Consumer Discretionary - 1.6% | | | | |
| Wheels Up *,2,4 | 2,243,589 | | $7,291,664 | |
| Total Preferred Stock | | | | |
| (Cost $6,999,997) | | | 7,291,664 | |
| Warrants - 0.2% | | | | |
| Financials - 0.2% | | | | |
South Mountain Merger Corp. (exercise price
$11.50), 06/20/24* | | | | |
| (Cost $122,503) | 143,594 | | 611,711 | |
| | | | | |
| | Principal
Amount | | | |
| Short-Term Investments - 7.9% | | | | |
| Joint Repurchase Agreements - 5.1%5 | | | | |
| Amherst Pierpont Securities LLC, dated 12/31/20, due 01/04/21, 0.100% total to be received $1,326,614 (collateralized by various U.S. Government Agency Obligations and U.S. Treasuries, 0.000% - 4.628%, 02/03/21 - 11/20/70, totaling $1,353,131) | $1,326,599 | | 1,326,599 | |
| Cantor Fitzgerald Securities, Inc., dated 12/31/20, due 01/04/21, 0.070% total to be received $3,936,810 (collateralized by various U.S. Government Agency Obligations, 0.000% - 9.500%, 01/25/21 - 10/15/62, totaling $4,015,515) | 3,936,779 | | 3,936,779 | |
| CF Securities LLC, dated 12/31/20, due 01/04/21, 0.070% total to be received $1,347,390 (collateralized by various U.S. Government Agency Obligations and U.S. Treasuries, 0.000% - 4.750%, 01/14/21 - 01/20/69, totaling $1,374,328) | 1,347,380 | | 1,347,380 | |
| Citadel Securities LLC, dated 12/31/20, due 01/04/21, 0.130% total to be received $2,975,481 (collateralized by various U.S. Treasuries, 0.000% - 7.875%, 01/31/21 - 05/15/49, totaling $3,034,993) | 2,975,438 | | 2,975,438 | |
| JVB Financial Group LLC, dated 12/31/20, due 01/04/21, 0.130% total to be received $1,539,299 (collateralized by various U.S. Government Agency Obligations and U.S. Treasuries, 0.125% - 7.000%, 07/01/22 - 12/01/50, totaling $1,570,063) | 1,539,277 | | 1,539,277 | |
| Mirae Asset Securities USA, Inc., dated 12/31/20, due 01/04/21, 0.130% total to be received $1,758,826 (collateralized by various U.S. Government Agency Obligations and U.S. Treasuries, 0.000% - 8.125%, 02/18/21 - 01/15/62, totaling $1,794,003) | 1,758,801 | | 1,758,801 | |
The accompanying notes are an integral part of these financial statements.
| | |
| | AMG TimesSquare Small Cap Growth Fund |
| | Schedule of Portfolio Investments (continued) |
| | Principal
Amount | | Value | |
| Joint Repurchase Agreements - 5.1%5 | | | | |
| (continued) | | | | |
| Palafox Trading LLC, dated 12/31/20, due 01/04/21, 0.130% total to be received $1,668,406 (collateralized by various U.S. Treasuries, 0.250% - 1.125%, 02/28/25 - 05/31/25, totaling $1,702,366) | $1,668,382 | | $1,668,382 | |
| RBC Dominion Securities, Inc., dated 12/31/20, due 01/04/21, 0.080% total to be received $4,245,999 (collateralized by various U.S. Government Agency Obligations and U.S. Treasuries, 0.000% - 6.000%, 01/05/21 - 12/20/50, totaling $4,330,880) | 4,245,961 | | 4,245,961 | |
| State of Wisconsin Investment Board, dated 12/31/20, due 01/04/21, 0.160% total to be received $3,907,438 (collateralized by various U.S. Treasuries, 0.125% - 3.875%, 07/15/22 - 02/15/47, totaling $3,995,450) | 3,907,369 | | 3,907,369 | |
| Total Joint Repurchase Agreements | | | 22,705,986 | |
| * | Non-income producing security. |
| 1 | Some of these securities, amounting to $62,717,606 or 14.1% of net assets, were out on loan to various borrowers and are collateralized by cash and various U.S. Treasury Obligations. See Note 4 of Notes to Financial Statements. |
| 2 | This security is restricted and not available for re-sale. For CuriosityStream, Inc., the Fund converted preferred shares to escrow and unrestricted common shares as part of an Initial Public Offering on October 15, 2020. The market value of the escrow shares and unrestricted common shares were $470,611 and $11,611,224, respectively on the date of conversion, which equates to $8.96 and $11.20 per share, respectively. At December 31, 2020, the cost of the escrow shares was $437,692 and market value was $587,261 which equates to 0.1% of net assets. For Wheels Up, the Fund purchased preferred shares on September 28, 2017 for $6,999,997 and the current market value as of December 31, 2020 is $7,291,664, which equates to $3.25 per share and 1.7% of net assets. The total value of restricted securities held is $7,878,925, which represents 1.8% of net assets. |
| | Shares | | Value | |
| Other Investment Companies - 2.8% | | | | |
| Dreyfus Government Cash Management Fund Institutional Shares, 0.03%6 | 4,141,408 | | $4,141,408 | |
| Dreyfus Institutional Preferred Government Money Market Fund, Institutional Shares, 0.03%6 | 4,141,408 | | 4,141,408 | |
| JPMorgan U.S. Government Money Market Fund, IM Shares, 0.03%6 | 4,266,905 | | 4,266,905 | |
| Total Other Investment Companies | | | 12,549,721 | |
| Total Short-Term Investments | | | | |
| (Cost $35,255,707) | | | 35,255,707 | |
| Total Investments - 104.7% | | | | |
| (Cost $323,653,568) | | | 466,058,796 | |
| Other Assets, less Liabilities - (4.7)% | | | (20,722,802) | |
| Net Assets - 100.0% | | | $445,335,994 | |
| 4 | Security’s value was determined by using significant unobservable inputs. |
| 5 | Cash collateral received for securities lending activity was invested in these joint repurchase agreements. |
| 6 | Yield shown represents the December 31, 2020, seven day average yield, which refers to the sum of the previous seven days’ dividends paid, expressed as an annual percentage. |
ADR American Depositary Receipt
REIT Real Estate Investment Trust
The accompanying notes are an integral part of these financial statements.
| | |
| | AMG TimesSquare Small Cap Growth Fund |
| | Schedule of Portfolio Investments (continued) |
The following table summarizes the inputs used to value the Fund’s investments by the fair value hierarchy levels as of December 31, 2020:
| | | Level 1 | | Level 2 | | Level 3 | | Total |
| Investments in Securities | | | | | | | | | | | | |
| Common Stocks | | | | | | | | | | | | |
| Information Technology | | $127,038,489 | | | — | | | — | | | $127,038,489 | |
| Health Care | | 100,115,062 | | | — | | | — | | | 100,115,062 | |
| Industrials | | 62,685,721 | | | — | | | — | | | 62,685,721 | |
| Consumer Discretionary | | 45,875,020 | | | — | | | — | | | 45,875,020 | |
| Financials | | 37,870,171 | | | — | | | — | | | 37,870,171 | |
| Communication Services | | 19,654,390 | | | — | | | $587,261 | | | 20,241,651 | |
| Consumer Staples | | 9,971,560 | | | — | | | — | | | 9,971,560 | |
| Real Estate | | 9,945,250 | | | — | | | — | | | 9,945,250 | |
| Utilities | | 5,370,470 | | | — | | | — | | | 5,370,470 | |
| Materials | | 3,786,320 | | | — | | | — | | | 3,786,320 | |
| Preferred Stock† | | — | | | — | | | 7,291,664 | | | 7,291,664 | |
| Warrants†† | | 611,711 | | | — | | | — | | | 611,711 | |
| Short-Term Investments | | | | | | | | | | | | |
| Joint Repurchase Agreements | | — | | | $22,705,986 | | | — | | | 22,705,986 | |
| Other Investment Companies | | 12,549,721 | | | — | | | — | | | 12,549,721 | |
| Total Investments in Securities | | $435,473,885 | | | $22,705,986 | | | $7,878,925 | | | $466,058,796 | |
| † | All preferred stocks held in the Fund are Level 3 securities. For a detailed breakout of preferred stocks by major industry classification, please refer to the Fund’s Schedule of Portfolio Investments. |
| †† | All warrants held in the Fund are Level 1 securities. For a detailed breakout of warrants by major industry classification, please refer to the Fund’s Schedule of Portfolio Investments. |
For the fiscal year ended December 31, 2020, there were no transfers in or out of Level 3.
The following table below is a reconciliation of investments in which significant unobservable inputs (Level 3) were used in determining fair value at December 31, 2020:
| | | Common
Stock | | | Preferred
Stock | |
| Balance as of December 31, 2019 | | — | | | $18,700,090 | |
| Realized gain (loss) | | — | | | — | |
| Change in unrealized appreciation/depreciation | | $149,569 | | | (407,102 | ) |
| Purchases* | | 437,692 | | | — | |
| Sales* | | — | | | (11,001,324 | ) |
| Balance as of December 31, 2020 | | $587,261 | | | $7,291,664 | |
| | | | | | | |
| Net change in unrealized appreciation/depreciation on investments still held at December 31, 2020 | | $149,569 | | | $(516,026 | ) |
* A preferred stock valued at $11,001,324 was converted to common shares via an Initial Public Offering (“IPO”); in which, a portion of the common stock received was held in escrow. The amounts reflected under the captions Purchases and Sales represent the initial value of the common shares held in escrow and the value of the preferred stock immediately prior to the IPO, respectively. Prior to the IPO, the preferred stock was valued using unobservable inputs.
The accompanying notes are an integral part of these financial statements.
| | |
| | AMG TimesSquare Small Cap Growth Fund |
| | Schedule of Portfolio Investments (continued) |
The following table summarizes the quantitative inputs and assumptions used for investments categorized in Level 3 of the fair value hierarchy as of December 31, 2020. The table below is not intended to be all-inclusive, but rather provides information on the significant Level 3 inputs as they relate to the Fund’s fair value measurements:
Quantitative Information about Level 3 Fair Value Measurements
| | | Fair Value as of
December 31, 2020 | | | Valuation
Technique(s) | | Unobservable
Inputs(s) | | Range | | Median | | | Impact to Valuation from an Increase in Input(a) |
| Common Stock | | $587,261 | | | Market Approach - | | Discount Rate | | 20% | | N/A | | | Decrease |
| | | | | | last trade in active market | | | | | | | | | |
| Preferred Stock | | 7,291,664 | | | Discounted Cash Flow | | Growth Rate | | 3% | | N/A | | | Increase |
| | | | | | | Discount Rate | | 20% | | N/A | | | Decrease |
| Total | | $7,878,925 | | | | | | | | | | | | |
| (a) | Represents the directional change in the fair value of the Level 3 investments that could have resulted from an increase in the corresponding input as of period end. A decrease to the unobservable input would have had the opposite effect. Significant changes in these inputs may have resulted in a significantly higher or lower fair value measurement at period end. |
The accompanying notes are an integral part of these financial statements.
| | |
| | AMG TimesSquare Mid Cap Growth Fund |
| | Portfolio Manager’s Comments (unaudited) |
The Year In Review For the year ended December 31, 2020, AMG TimesSquare Mid Cap Growth Fund’s (the “Fund”) Class N shares returned 33.03%, while its benchmark, the Russell Midcap® Growth Index, returned 35.59%. We close the books on 2020, a year where the most important statistic may have been COVID-19’s global death toll of 1.8 million people, 20% of whom were from the U.S. Somewhat surprising this year, in the face of that casualty rate and widespread shutdowns, was the doggedness of the global equity markets that looked past the social and economic damage taking place in 2020. Markets instead focused on the potential halcyon days waiting in 2021. The major global market indexes declined by an average of (29)% from the start of the year to the lows of mid-March, followed by an ascent of 62%, and ended the year with an above typical annual gain of 15%. A significant portion of that occurred in the fourth quarter with Emerging Markets climbing 20%, followed by 16% for Non-U.S. and 12% for U.S. equities. Global volatility levels spiked in March to peaks not seen since the 2008 Global Financial Crisis, though quickly receded to moderate levels. Economic activities worldwide quickly fell to record low contraction levels in April; though by summer they returned to economic expansion territory with staggered reopenings of businesses, and ended the year slightly higher than they began it. Central banks assisted with significant monetary stimulus—or quantitative easing to the nth degree—which led most governments’ responses as levels of fiscal support varied. Stable economic growth seemed fleeting in the U.S. this year. The annual rate of gross domestic product growth slipped by 5% in the first quarter before tumbling 31% in the second quarter—the steepest quarterly drop on record. While there was a sharp recovery in the third quarter of 33%, that still left a significant dent in productivity even if an above average growth rate is reported for the fourth quarter. Despite the optimism shown by the gains for equities and expectations of economic expansion, measures of consumer confidence and sentiment deteriorated as the year came to an end, with the December resurgence of COVID-19 cases curbing their enthusiasm. Another factor likely was the contentious election and equally disruptive aftermath. After all the shouting, counting, and more shouting, the Presidential administration and the Senate changed parties. | The U.S. market’s craving for growth was apparent in the cross currents among equity returns. While value stocks rebounded with better performance in the fourth quarter and smaller capitalization stocks were prized, for the full year growth stocks were the clear winners across all size segments and larger capitalization stocks had higher returns. Within small-to-mid cap growth stocks this quarter, the market preferred lower quality, higher valuations, and higher risk. Thus it was not surprising that information technology was one of the best performing sectors while consumer staples was the worst. Amidst this rapidly shifting environment, the Fund underperformed the Russell Midcap® Growth Index for the year. There was relative weakness in the financials, health care, and real estate sectors that was partially offset by strength from our positions in information technology and communication services. COVID-19 created headwinds for some of our holdings in the financials sector. Aircraft leasing and aviation finance company AerCap Holdings, Inc. descended 58% due to the sudden and substantial reduction in global air travel. That stock was sold out of the Fund during the first quarter due to limited visibility of when the industry might recover. Assured Guaranty Ltd. offers credit protection products to public finance, infrastructure, and structured finance markets. Municipalities across the country came under pressure from the greater need for services, though with lower income from taxes and fees. The position was liquidated from the Fund in the second quarter, though it fell 47% for the time it was held. The market downturn also created investment opportunities. Case in point was the addition of Discover Financial Services to the Fund. Its Direct Banking segment offers Discover-branded credit cards as well as consumer products and services. Their payment services business operates an automated teller machine, debit, and electric funds transfer network. Discover’s share price appreciated by 101% since it was added. They conservatively built up reserves for potential net charge-offs and later in the year reported stable to improving trends in both credit metrics and loan balances. The portfolio experienced some challenges within health care. Reata Pharmaceuticals, Inc. is a clinical-state biopharmaceutical company focused on developing therapeutics for patients with serious or life-threatening diseases. Friedreich ataxia is one such rare and inherited disease for which Reata | developed a drug for this unmet medical need that advanced to phase II trials. Its potential approval came into question when the Food & Drug Administration (FDA) asked the company to run another study. That caused the stock to decline by 27% and we sold the position during the third quarter. Global Blood Therapeutics, Inc. is a biotechnology developer of treatments for blood disorders. Their Oxbryta drug was approved for treating sickle cell disease and generated better than expected commercial sales in the early part of the year. We decided to sell out of the position during the third quarter on prescription volume concerns on lower doctor’s office visits due to a resurgence of COVID-19. The stock retreated (30)% for the time it was held. Partially countering these detractors was the 28% rise in Vertex Pharmaceuticals, Inc., a pharmaceutical developer of treatments for cystic fibrosis. The company exceeded projections for revenues and earnings. Neither its supply chain nor its patient demand were impacted by the pandemic. We sold the position out of the Fund in June as its market cap reached $75 billion and beyond product norms. Another positive came from Immunomedics, Inc., which is a biopharmaceutical company focused on monoclonal antibody-based products for targeted cancer treatment. Its leading drug Trodelvy entered into trials for label expansion to treat urothelial and colorectal cancers. That revenue potential also caught the eye of Gilead Sciences, which announced plans to acquire the company in September. We decided to exit the position and book the 193% in profits. The pandemic had quite an impact on the real estate sector. CBRE Group, Inc. provides commercial real estate management and investment services. The industry experienced a severe decline in commercial real estate leasing and investment sales activity. While CBRE does possess more durable and resilient parts to its business such as facilities management, the commercial real estate market recovery is likely to be slow and drawn out. We therefore decided to liquidate the position in the June-July timeframe and the stock was down 29% for the period it was held. Better news came from SBA Communications Corp., a wireless infrastructure company operating towers in North and Latin America. While AT&T and Verizon wireless spending held steady, site leasing activity from the new T-Mobile has been slower than anticipated. Management remains confident the pace of investment will increase and noted |
| | |
| | AMG TimesSquare Mid Cap Growth Fund |
| | Portfolio Manager’s Comments (continued) |
discussions with Dish Network have been very constructive as they begin setting up their network. SBA is also well positioned to benefit from the 5G upgrade cycle, which is in the early stages. While the stock was up 18%, that lagged the index sector return of 25%. The information technology sector was home to the portfolio’s largest contributors. CrowdStrike Holdings, Inc. Class A, a provider of cloud-based network security services that supports a range of devices and endpoints, surged ahead by 293%. The stock was added to the Fund in January and we increased the position over time. CrowdStrike’s solutions became more important to businesses as they adapted to a work from home environment. The company has been experiencing record demand for its professional services due to a heightened cyber threat environment. Throughout the year, they continually posted strong results while raising the customer counts and subscription levels. Another strong performer was Twilio, Inc. Class A with its 216% return. They offer a cloud communications platform. We added this position to the Fund during the first quarter and built it up since then. Quarterly results consistently exceeded consensus estimates. In the COVID era, the company’s systems came into high demand for remote contact centers, contactless delivery, remote learning, telemedicine, contact tracing, and mass notifications. Twilio continues to see an acceleration of projects tied to digital transformation in customer engagement. Avalara, Inc. is an outsourced provider of tax compliance | services for small to mid-sized businesses. Its solid 125% stock price appreciation is a function of growth in demand for their tax determination and cross border services. Avalara is benefiting from the acceleration in e-commerce, cloud, and omnichannel adoption among its customers. Also, governments around the world are laser-focused on shoring up their revenue sources due to the pandemic. We trimmed the position on strength. WEX, Inc. provides payment processing and information management services for the U.S. commercial and government fleet industry. Part of their fleet revenue comes from collecting a volume-based fee from fuel purchases among its customers. The sheer drop in oil prices and reduced business activities took a toll on its business. The position was liquidated from the Fund during the second quarter and slid (49)% for the time it was held. In communication services, Pinterest, Inc. is an image-based social media network where users and businesses can explore and promote their interests. Throughout the year, Pinterest substantially grew is global customer base while also managing to beat elevated expectation for revenues and earnings. They are generating strong returns on investments across technology, sales, and advertising products. Shares of Pinterest Class A climbed 253% for the year. A less mobile population turned to various forms of entertainment. One such example is Zynga Inc., a mobile games developer and operator, which scored a 61% gain. This company develops, | markets, and operates social games as live services played on mobile platforms. Among their games are CSR Racing, Empires & Puzzles, Merge Dragons!, Merge Magic!, Toon Blast, Toy Blast, Words With Friends, and Zynga Poker. Zynga’s games are now available in more than 150 countries. During 2020, they experienced the highest level of revenues and bookings in their history, record online game user revenues, and the best average mobile daily active users in more than six years. Turning the page to 2021 allows us to look forward optimistically, but does not extinguish the concerns that plagued 2020. The start of the year marked the end of the Brexit transition for the U.K. from the European Union; so beginning later this month all the new agreements will go into effect for trade, travel, and other aspects. While distribution began for COVID-19 vaccines, case rates continued to climb and the coronavirus showed signs of mutating. Although we have not yet returned to our New York City office, all of us at TimesSquare Capital Management LLC continue working collectively to steward your investments. We hope that 2021 will be brighter for all of us, though from an investment perspective we remain vigilant. As always, we are available for any questions you might have as we endeavor to protect the assets you have entrusted with us. This commentary reflects the viewpoints of TimesSquare Capital Management LLC, and is not intended as a forecast or guarantee of future results. |
| | |
| | |
| | AMG TimesSquare Mid Cap Growth Fund |
| | Portfolio Manager’s Comments (continued) |
CUMULATIVE TOTAL RETURN PERFORMANCE
AMG TimesSquare Mid Cap Growth Fund’s cumulative total return is based on the daily change in net asset value (NAV), and assumes that all dividends and distributions were reinvested. This graph compares a hypothetical $10,000 investment made in the AMG TimesSquare Mid Cap Growth Fund’s Class N shares on December 31, 2010 to a $10,000 investment made in the Russell Midcap® Growth Index for the same time period. The graph and table do not reflect the deduction of taxes that a shareholder would pay on a Fund distribution or redemption of shares. The listed returns for the Fund are net of expenses and the returns for the index exclude expenses. Total returns would have been lower had certain expenses not been reduced.
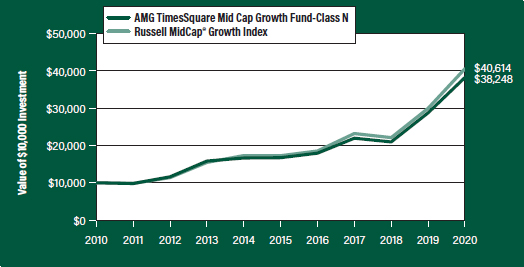
The table below shows the average annual total returns for the AMG TimesSquare Mid Cap Growth Fund and the Russell Midcap® Growth Index for the same time periods ended December 31, 2020.
| Average Annual Total Returns1 | | One
Year | | Five
Years | | Ten
Years | | Since
Inception | | Inception
Date | |
| AMG TimesSquare Mid Cap Growth Fund2, 3, 4, 5, 6 |
| Class N | | | 33.03 | % | | 17.99 | % | | 14.35 | % | | 11.77 | % | | 03/04/05 | |
| Class I | | | 33.27 | % | | — | | | — | | | 19.97 | % | | 02/24/17 | |
| Class Z | | | 33.36 | % | | 18.23 | % | | 14.58 | % | | 11.99 | % | | 03/04/05 | |
| Russell Midcap® Growth Index7 | | | 35.59 | % | | 18.66 | % | | 15.04 | % | | 11.64 | % | | 03/04/05 | † |
The performance data shown represents past performance. Past performance is not a guarantee of future results. Current performance may be lower or higher than the performance data quoted. The investment return and principal value of an investment will fluctuate so that an investor’s shares, when redeemed, may be worth more or less than their original cost.
Investors should carefully consider the Fund’s investment objectives, risks, charges and expenses before investing. For performance information through the most recent month end, current net asset values per share for the Fund and other information, please call 800.548.4539 or visit our website at amgfunds.com for a free prospectus. Read it carefully before investing or sending money.
Distributed by AMG Distributors, Inc., member FINRA/SIPC.
| † | Date reflects inception date of the Fund, not the index. |
| 1 | Total return equals income yield plus share price change and assumes reinvestment of all dividends and capital gain distributions. Returns are net of fees and may reflect offsets of Fund expenses as described in the prospectus. No adjustment has been made for taxes payable by shareholders on their reinvested dividends and |
| | | capital gain distributions. Returns for periods greater than one year are annualized. The listed returns on the Fund are net of expenses and based on the published NAV as of December 31, 2020. All returns are in U.S. dollars ($). |
| 2 | From time to time, the Fund’s investment manager has waived its fees and/or absorbed Fund expenses, which has resulted in higher returns. |
| 3 | The Fund is subject to risks associated with investments in mid-capitalization companies such as greater price volatility, lower trading volume, and less liquidity than the stocks of larger, more established companies. |
| 4 | The Fund invests in growth stocks, which may be more sensitive to market movements because their prices tend to reflect future investor expectations rather than just current profits. Growth stocks may underperform value stocks during given periods. |
| 5 | Market prices of investments held by the Fund may fall rapidly or unpredictably due to a variety of economic or political factors, market conditions, disasters or public health issues, or in response to events that affect particular industries or companies. |
| 6 | Companies that are in similar businesses may be similarly affected by particular economic or market events; to the extent the Fund has substantial holdings within a particular sector, the risks associated with that sector increase. |
| 7 | The Russell Midcap® Growth Index measures the performance of those Russell Midcap® companies with higher price/book ratios and higher forecasted growth values. The stocks are also members of the Russell 1000® Growth Index. Unlike the Fund, the Russell Midcap® Growth Index is unmanaged, is not available for investment, and does not incur expenses. |
The Russell Midcap® Growth Index is a trademark of the London Stock Exchange Group companies.
Not FDIC insured, nor bank guaranteed. May lose value.
| | |
| | AMG TimesSquare Mid Cap Growth Fund |
| | Fund Snapshots (unaudited) |
| | December 31, 2020 |
PORTFOLIO BREAKDOWN
| Sector | | % of
Net Assets |
| Information Technology | | 38.9 |
| Health Care | | 16.6 |
| Industrials | | 15.4 |
| Consumer Discretionary | | 9.0 |
| Communication Services | | 7.0 |
| Financials | | 5.8 |
| Materials | | 2.7 |
| Real Estate | | 2.1 |
| Consumer Staples | | 1.0 |
| Short-Term Investments | | 1.6 |
| Other Assets Less Liabilities | | (0.1) |
TOP TEN HOLDINGS
| Security Name | | % of
Net Assets |
| Crowdstrike Holdings, Inc., Class A | | 3.4 |
| Twilio, Inc., Class A | | 3.3 |
| RenaissanceRe Holdings, Ltd. (Bermuda) | | 3.1 |
| Charles River Laboratories International, Inc. | | 2.5 |
| Pinterest, Inc., Class A | | 2.3 |
| CoStar Group, Inc. | | 2.3 |
| SBA Communications Corp. | | 2.1 |
| Zendesk, Inc. | | 2.0 |
| Waste Connections, Inc. | | 1.9 |
| Zynga, Inc., Class A | | 1.9 |
| Top Ten as a Group | | 24.8 |
Because a fund’s strategy may result in multiple investments in particular sectors of the economy, its performance may depend on the performance of those sectors and may fluctuate more widely than investments diversified across more sectors. For additional information on these and other risk considerations, please see the Fund’s prospectus.
Any sectors, industries, or securities discussed should not be perceived as investment recommendations. Mention of a specific security should not be considered a recommendation to buy or solicitation to sell that security. Specific securities mentioned in this report may have been sold from the Fund’s portfolio of investments by the time you receive this report.
| | |
| | AMG TimesSquare Mid Cap Growth Fund |
| | Schedule of Portfolio Investments |
| | December 31, 2020 |
| | Shares | | Value | |
| Common Stocks - 98.5% | | | | |
| Communication Services - 7.0% | | | | |
| Altice USA, Inc., Class A* | 628,700 | | $23,808,869 | |
| IAC/InteractiveCorp.* | 176,400 | | 33,401,340 | |
| Pinterest, Inc., Class A* | 716,200 | | 47,197,580 | |
| Zynga, Inc., Class A* | 3,920,200 | | 38,692,374 | |
| Total Communication Services | | | 143,100,163 | |
| Consumer Discretionary - 9.0% | | | | |
| Brunswick Corp. | 337,000 | | 25,692,880 | |
| Burlington Stores, Inc.* | 140,400 | | 36,721,620 | |
| CarMax, Inc.* | 209,900 | | 19,827,154 | |
| ContextLogic, Inc., Class A*,1 | 502,600 | | 9,167,424 | |
| Domino’s Pizza, Inc. | 44,400 | | 17,025,624 | |
| Lululemon Athletica, Inc. (Canada)* | 74,200 | | 25,823,826 | |
| O’Reilly Automotive, Inc.* | 73,400 | | 33,218,638 | |
| Pool Corp.* | 42,300 | | 15,756,750 | |
| Total Consumer Discretionary | | | 183,233,916 | |
| Consumer Staples - 1.0% | | | | |
| Lamb Weston Holdings, Inc. | 252,600 | | 19,889,724 | |
| Financials - 5.8% | | | | |
| Discover Financial Services | 244,500 | | 22,134,585 | |
| The Progressive Corp. | 333,200 | | 32,946,816 | |
| RenaissanceRe Holdings, Ltd. (Bermuda) | 381,200 | | 63,210,584 | |
| Total Financials | | | 118,291,985 | |
| Health Care - 16.6% | | | | |
| AmerisourceBergen Corp. | 282,100 | | 27,578,096 | |
| Ascendis Pharma A/S, ADR (Denmark)* | 157,900 | | 26,334,562 | |
| Blueprint Medicines Corp.* | 172,400 | | 19,334,660 | |
| Catalent, Inc.* | 341,900 | | 35,581,533 | |
| Centene Corp.* | 338,500 | | 20,320,155 | |
| Charles River Laboratories International, Inc.* | 202,400 | | 50,571,664 | |
| Chemed Corp. | 64,525 | | 34,366,660 | |
| Encompass Health Corp. | 292,900 | | 24,219,901 | |
| Guardant Health, Inc.* | 74,800 | | 9,640,224 | |
| PRA Health Sciences, Inc.* | 139,700 | | 17,523,968 | |
| Royalty Pharma PLC, Class A1 | 580,400 | | 29,049,020 | |
| Seagen, Inc.* | 139,800 | | 24,484,572 | |
| STERIS PLC | 99,380 | | 18,836,485 | |
| Total Health Care | | | 337,841,500 | |
| Industrials - 15.4% | | | | |
| AMETEK, Inc. | 177,300 | | 21,442,662 | |
| Carlisle Cos., Inc. | 145,100 | | 22,661,718 | |
| Cintas Corp. | 49,100 | | 17,354,886 | |
| | Shares | | Value | |
| Copart, Inc.* | 238,800 | | $30,387,300 | |
| CoStar Group, Inc.* | 49,600 | | 45,844,288 | |
| L3Harris Technologies, Inc. | 135,900 | | 25,687,818 | |
| Nordson Corp. | 107,500 | | 21,602,125 | |
| Robert Half International, Inc.* | 320,700 | | 20,037,336 | |
| TransUnion | 388,500 | | 38,546,970 | |
| Verisk Analytics, Inc. | 146,700 | | 30,453,453 | |
| Waste Connections, Inc. | 386,900 | | 39,684,333 | |
| Total Industrials | | | 313,702,889 | |
| Information Technology - 38.9% | | | | |
| Amphenol Corp., Class A | 160,300 | | 20,962,431 | |
| Atlassian Corp. PLC, Class A (Australia)* | 65,700 | | 15,365,259 | |
| Avalara, Inc.* | 163,000 | | 26,877,070 | |
| Bill.com Holdings, Inc.* | 122,100 | | 16,666,650 | |
| Booz Allen Hamilton Holding Corp. | 402,500 | | 35,089,950 | |
| Coupa Software, Inc.* | 94,000 | | 31,857,540 | |
| Crowdstrike Holdings, Inc., Class A* | 322,400 | | 68,290,768 | |
| CyberArk Software, Ltd. (Israel)* | 119,900 | | 19,374,641 | |
| Elastic, N.V.* | 187,450 | | 27,392,069 | |
| Entegris, Inc. | 239,100 | | 22,977,510 | |
| FleetCor Technologies, Inc.* | 75,200 | | 20,516,816 | |
| Gartner, Inc.* | 190,800 | | 30,564,252 | |
| Genpact, Ltd. | 119,375 | | 4,937,350 | |
| Global Payments, Inc. | 161,200 | | 34,725,704 | |
| HubSpot, Inc.* | 53,150 | | 21,070,786 | |
| Jack Henry & Associates, Inc. | 158,500 | | 25,675,415 | |
| Keysight Technologies, Inc.* | 212,000 | | 28,003,080 | |
| Lam Research Corp. | 57,100 | | 26,966,617 | |
| Marvell Technology Group, Ltd. | 442,900 | | 21,055,466 | |
| McAfee Corp., Class A1 | 916,200 | | 15,291,378 | |
| Microchip Technology, Inc. | 198,800 | | 27,456,268 | |
| Monolithic Power Systems, Inc. | 55,100 | | 20,179,273 | |
| New Relic, Inc.* | 241,800 | | 15,813,720 | |
| Nice, Ltd., Sponsored ADR (Israel)* | 107,100 | | 30,367,134 | |
| Paylocity Holding Corp.* | 25,200 | | 5,188,932 | |
| SolarEdge Technologies, Inc. (Israel)* | 43,700 | | 13,945,544 | |
| SS&C Technologies Holdings, Inc. | 385,900 | | 28,074,225 | |
| Synopsys, Inc.* | 107,500 | | 27,868,300 | |
| Twilio, Inc., Class A* | 198,350 | | 67,141,475 | |
| Unity Software, Inc.*,1 | 18,800 | | 2,885,236 | |
| Zendesk, Inc.*,1 | 284,800 | | 40,760,576 | |
| Total Information Technology | | | 793,341,435 | |
The accompanying notes are an integral part of these financial statements.
| | |
| | |
| | AMG TimesSquare Mid Cap Growth Fund |
| | Schedule of Portfolio Investments (continued) |
| | Shares | | Value | |
| Materials - 2.7% | | | | |
| FMC Corp. | 182,700 | | $20,997,711 | |
| Martin Marietta Materials, Inc. | 50,300 | | 14,283,691 | |
| RPM International, Inc. | 208,300 | | 18,909,474 | |
| Total Materials | | | 54,190,876 | |
| Real Estate - 2.1% | | | | |
| SBA Communications Corp., REIT | 150,500 | | 42,460,565 | |
| Total Common Stocks | | | | |
| (Cost $1,175,872,832) | | | 2,006,053,053 | |
| | | | | |
| | Principal
Amount | | | |
| Short-Term Investments - 1.6% | | | | |
| Joint Repurchase Agreements - 0.6%2 | | | | |
| Cantor Fitzgerald Securities, Inc., dated 12/31/20, due 01/04/21, 0.070% total to be received $2,391,443 (collateralized by various U.S. Government Agency Obligations, 0.000% - 9.500%, 01/25/21 - 10/15/62, totaling $2,439,253) | $2,391,424 | | 2,391,424 | |
Citadel Securities LLC, dated 12/31/20, due 01/04/21, 0.130% total to be received $2,359,913 (collateralized by various
U.S. Treasuries, 0.000% - 7.875%, 01/31/21 - 05/15/49, totaling $2,407,113) | 2,359,879 | | 2,359,879 | |
Citigroup Global Markets, Inc., dated 12/31/20, due 01/04/21, 0.070% total to be received $1,847,186 (collateralized by various
U.S. Government Agency Obligations and U.S. Treasuries, 0.000% - 4.000%, 09/15/21 - 01/01/51, totaling $1,884,116) | 1,847,172 | | 1,847,172 | |
JVB Financial Group LLC, dated 12/31/20, due 01/04/21, 0.130% total to be received $1,040,391 (collateralized by various
U.S. Government Agency Obligations and U.S. Treasuries, 0.125% - 7.000%, 07/01/22 - 12/01/50, totaling $1,061,184) | 1,040,376 | | 1,040,376 | |
| | Principal
Amount | | Value | |
| Mirae Asset Securities USA, Inc., dated 12/31/20, due 01/04/21, 0.130% total to be received $1,068,411 (collateralized by various U.S. Government Agency Obligations and U.S. Treasuries, 0.000% - 8.125%, 02/18/21 - 01/15/62, totaling $1,089,780) | $1,068,396 | | $1,068,396 | |
| RBC Dominion Securities, Inc., dated 12/31/20, due 01/04/21, 0.080% total to be received $2,712,130 (collateralized by various U.S. Government Agency Obligations and U.S. Treasuries, 0.000% - 6.000%, 01/05/21 - 12/20/50, totaling $2,766,348) | 2,712,106 | | 2,712,106 | |
| Total Joint Repurchase Agreements | | | 11,419,353 | |
| | | | | |
| | Shares | | | |
| Other Investment Companies - 1.0% | | | | |
| Dreyfus Government Cash Management Fund, | | | | |
| Institutional Shares, 0.03%3 | 6,893,882 | | 6,893,882 | |
| Dreyfus Institutional Preferred Government | | | | |
| Money Market Fund, Institutional Shares, 0.03%3 | 6,893,882 | | 6,893,882 | |
| JPMorgan U.S. Government Money Market Fund, IM Shares, 0.03%3 | 7,102,787 | | 7,102,787 | |
| Total Other Investment Companies | | | 20,890,551 | |
| Total Short-Term Investments | | | | |
| (Cost $32,309,904) | | | 32,309,904 | |
| Total Investments - 100.1% | | | | |
| (Cost $1,208,182,736) | | | 2,038,362,957 | |
| Other Assets, less Liabilities - (0.1)% | | | (1,133,231 | ) |
| Net Assets - 100.0% | | | $2,037,229,726 | |
| * | Non-income producing security. |
| 1 | Some of these securities, amounting to $88,886,890 or 4.4% of net assets, were out on loan to various borrowers and are collateralized by cash and various U.S. Treasury Obligations. See Note 4 of Notes to Financial Statements. |
| 2 | Cash collateral received for securities lending activity was invested in these joint repurchase agreements. |
| 3 | Yield shown represents the December 31, 2020, seven day average yield, which refers to the sum of the previous seven days’ dividends paid, expressed as an annual percentage. |
| ADR | American Depositary Receipt |
| REIT | Real Estate Investment Trust |
The accompanying notes are an integral part of these financial statements.
| | |
| | |
| | AMG TimesSquare Mid Cap Growth Fund |
| | Schedule of Portfolio Investments (continued) |
The following table summarizes the inputs used to value the Fund’s investments by the fair value hierarchy levels as of December 31, 2020:
| | | | Level 1 | | | Level 2 | | | Level 3 | | | Total | |
| Investments in Securities | | | | | | | | | | | | | |
| Common Stocks† | | | $2,006,053,053 | | | — | | | — | | | $2,006,053,053 | |
| Short-Term Investments | | | | | | | | | | | | | |
| Joint Repurchase Agreements | | | — | | | $11,419,353 | | | — | | | 11,419,353 | |
| Other Investment Companies | | | 20,890,551 | | | — | | | — | | | 20,890,551 | |
| Total Investments in Securities | | | $2,026,943,604 | | | $11,419,353 | | | — | | | $2,038,362,957 | |
| † | All common stocks held in the Fund are Level 1 securities. For a detailed breakout of common stocks by major industry classification, please refer to the Fund’s Schedule of Portfolio Investments. |
For the fiscal year ended December 31, 2020, there were no transfers in or out of Level 3.
The accompanying notes are an integral part of these financial statements.
| | |
| | |
| | AMG TimesSquare International Small Cap Fund |
| | Portfolio Manager’s Comments (unaudited) |
Year In Review For the year ended December 31, 2020, AMG TimesSquare International Small Cap Fund’s (the “Fund”) Class N shares returned 13.55%, while its benchmark, the MSCI EAFE Small Cap Index returned 12.34%. We close the books on 2020, a year where the most important statistic may have been COVID-19’s global death toll of 1.8 million people. Somewhat surprising this year, in the face of that casualty rate and widespread shutdowns, was the doggedness of the global equity markets that looked past the social and economic damage taking place in 2020. Markets instead focused on the potential halcyon days awaiting us in 2021. Global volatility levels spiked in March to peaks not seen since the 2008 Global Financial Crisis, though quickly receded to moderate levels. Economic activities worldwide quickly fell to record low contraction levels in April; though by summer they returned to economic expansion territory with staggered reopenings of businesses, ending the year slightly higher than they began it. Central banks assisted with significant monetary stimulus—or quantitative easing to the nth degree—which led most governments’ responses as levels of fiscal support varied. Across the world in Japan, Yoshihide Suga was elected Japan’s prime minister and early signs suggest that he may implement some much needed reform in the healthcare systems and in promoting greater digitalization. Results from the much-anticipated U.S. election received a positive reception from markets on expectations of a return to more traditional foreign policy. Also incrementally positive was that after drawn out negotiations, the United Kingdom and European Union finally agreed to a Brexit deal. Finally, the announcements of multiple COVID-19 vaccines provided some light at the end of the tunnel for 2020. Investors welcomed the news and looked to areas that had been hit the hardest and are set to benefit from a recovery in global trade and travel. Fund Performance Attribution Amidst this rapidly shifting environment, the Fund outperformed the MSCI EAFE Small Cap benchmark in 2020. There was relative weakness in Asia Pacific Ex-Japan, Europe, and the Emerging Markets that was offset by strength from our positions in Japan. Throughout the year, small cap stocks outperformed their large cap peers with the MSCI EAFE Small Cap | | | Index rising 12.34%, better than the 7.8% increase for the MSCI EAFE Index. Growth outpaced value in both the international large and small cap universe. Regional Performance: Europe The Fund experienced relative weakness in Europe. Italy, the United Kingdom, and Sweden positively contributed to the Fund, while holdings in France and Belgium detracted. In Belgium, Barco N.V., a provider of visualization solutions to the entertainment, enterprise and healthcare industries, retreated by 38%. Shares corrected on concerns of the pandemic’s impact on its cinema projector business. France-based Rubis SCA which provides bulk storage and distribution of petroleum and liquefied petroleum gas was weighed down by 2% as fuel distribution volumes were negatively impacted by COVID-19 related lockdowns and on concerns of its exposure to declining oil prices. Moving over to Spain, Prosegur Compania de Seguridad S.A. provides security services in Europe and Latin America with the later contributing to over half of the company’s total revenues. Although COVID-19 effects curtailed their activity levels and caused shares to drop by 25%, Prosegur maintained a strong cash position and expects business to recover as the situation eases. Turning to areas of strength and more positive was online financial services firm FinecoBank Banca Fineco S.P.A which moved ahead by 36%. The company reported strong year to date inflows into its managed products and strong momentum in its brokerage business. Leveraging its advantageous industry position, the company will benefit from the industry’s structural digital migration. Also strong was Sweden-based Nordic Entertainment Group AB, the region’s leading entertainment provider. Nordic reported solid results as its premium content streaming business had strong subscriber intake and Class B shares climbed 70%. United Kingdom-based Keywords Studios, a provider of outsourced creative and technical services to the video game industry moved forward by 97% on strong results as increased play by gamers during the pandemic will increase the cadence of content development over coming years. The company is making acquisitions in order to strengthen its offering and resources. Offsetting those gains was the Fund’s top detractor, Melrose Industries PLC, a United Kingdom based industrial holding company that focuses on acquiring fundamentally good, but mismanaged assets in structurally growing industries. Shares weighed on performance earlier in the year on back | | | of their exposure to the more cyclical aerospace and automotive end markets. Melrose shares recovered in fourth quarter as fundamentals proved to be better than feared but shares still closed the year down 23%. Regional Performance: Japan Japan was the Fund’s top regional contributor, benefitting from strong stock selection. Consumer staples and health care holdings were resilient amidst COVID-19 worries. Discount supermarket chain Kobe Bussan Co., Ltd. posted an 80% gain. Running a low-cost, franchise model where self-produced, private-brand products drive customer traffic, the company benefitted from COVID-19 stimulated household demand coupled with new store openings. Even with normalization following the pandemic-driven demand, it continued to be a winner within a deflationary economy. Drugstore operator Sugi Holdings Co., Ltd. share price rose 27% on solid same store sales growth and resilient demand for its products. Management announced a new three-year plan that included an expansion in operating margins. Also positive and new to the Fund was MedPeer, Inc., a relative first-mover in Japan’s online healthcare space. MedPeer provides a community site exclusively for physicians to engage with pharmaceutical companies and recruiters. Beyond just drug-marketing, MedPeer developed an app in collaboration with Sugi Holdings in which customers can receive advice from pharmacists and doctors via online chat. Shares gained 193% as the demand for telemedicine accelerated. While consumer staples and health care holdings remained resilient amidst COVID-19 worries, performance was hurt by weakness in select cyclical names. en-japan, Inc., a provider of internet job recruitment and consultation services, lowered full year guidance which was coupled with a slowing economy and this resulted in a (29)% sell-off. Other weaker areas included ABC Mart, Japan’s largest mass-market shoe retailer. Earnings fell short of expectations as online sales growth was not sufficient to offset weakness at brick-and-mortar sites. Shares declined 23% before we exited our position in fourth quarter. Other holdings rebounded as restrictions started to ease across the country. Chief amongst these was Sushiro Global Holdings, Ltd., Japan’s leader in conveyor belt sushi restaurants, where the share price rose by 79%. While same-store sales declined precipitously in March and April, a recovery in customer traffic coupled with additional take-out | |
| | | | | | | | |
| | | | | | | | |
| | |
| | |
| | AMG TimesSquare International Small Cap Fund |
| | Portfolio Manager’s Comments (continued) |
sales drove improving fundamentals in May as the government eases the state of emergency. Home renovation provider Katitas, Co., Ltd. climbed 47%. Katitas procures lower-cost pre-owned vacant houses, adds value to them through renovation and sells them at half the price of comparable newly built houses. Its home renovation model is proving resilient in a post-COVID-19 economy as central city buyers gradually relocate to rural settings. Regional Performance: Asia/Pacific ex Japan The Fund’s Australian financial services holdings in Asia/Pacific Ex-Japan also faced some headwinds. Challenger, Ltd. offers annuities and other fixed income products to the underpenetrated Australian market. Regulatory and structural changes in the financial advice industry weighed on Challenger’s local annuity sales. Declining interest rates also negatively impacted profitability and the company’s investment returns. Though shares recovered in fourth quarter on a strong beat to street expectations, the company finished the year with a 13% decline. | | | Regional Performance: Emerging Markets The Fund’s holdings in the Emerging Markets had a negative impact on performance. In the Americas, Mexico-based Regional SAB de CV is a leading bank focused on small-to-medium-sized enterprises and relationship banking. While the Fund owned it during the year, shares dropped 58% on rising concerns of a decline in asset quality and low interest rates impacting profitability. Recognizing those risks, we sold out of the name in second quarter. Offering better performance was China-based property management company A-Living Smart City Services Co., Ltd. Services. Their core business proved to be resilient and non-cyclical as they continued to be paid for properties that were closed due to extended quarantine measures. Conclusion Turning the page to 2021 allows us to look forward optimistically, but does not extinguish the concerns that plagued 2020. The start of the new year marked the end of the Brexit transition for the U.K. from the European Union; so beginning later this month all | | | the new agreements will go into effect for trade, travel, and other aspects. While distribution began for COVID-19 vaccines, case rates continued to climb and the coronavirus showed signs of mutating. Although we have not yet returned to our New York City office, all of us at TimesSquare Capital Management, LLC continue working collectively to steward your investments. We hope that 2021 will be brighter for all of us, though from an investment perspective we remain vigilant. As always, we are available for any questions you might have as we endeavor to protect the assets you have entrusted with us. This commentary reflects the viewpoints of TimesSquare Capital Management, LLC, and is not intended as a forecast or guarantee of future results. | |
| | | | | | | | |
| | | | | | | | |
| | |
| | |
| | AMG TimesSquare International Small Cap Fund |
| | Portfolio Manager’s Comments (continued) |
CUMULATIVE TOTAL RETURN PERFORMANCE
AMG TimesSquare International Small Cap Fund’s cumulative total return is based on the daily change in net asset value (NAV), and assumes that all dividends and distributions were reinvested. This graph compares a hypothetical $10,000 investment made in the AMG TimesSquare International Small Cap Fund’s Class N shares on January 2, 2013 (inception date), to a $10,000 investment made in the MSCI EAFE Small Cap Index for the same time period. The graph and table do not reflect the deduction of taxes that a shareholder would pay on a Fund distribution or redemption of shares. The listed returns for the Fund are net of expenses and the returns for the index exclude expenses. Total returns would have been lower had certain expenses not been reduced.

The table below shows the average annual total returns for the AMG TimesSquare International Small Cap Fund and the MSCI EAFE Small Cap Index for the same time periods ended December 31, 2020.
| Average Annual Total Returns1 | | One
Year | | Five
Years | | Since
Inception | | Inception
Date |
| AMG TimesSquare International Small Cap Fund2, 3, 4, 5, 6, 7, 8, 9, 10 |
| Class N | | 13.55 | % | | 8.89 | % | | 10.30 | % | | 01/02/13 | |
| Class I | | 13.75 | % | | — | | | 10.30 | % | | 02/24/17 | |
| Class Z | | 13.90 | % | | 9.15 | % | | 10.53 | % | | 01/02/13 | |
| MSCI EAFE Small Cap Index11 | | 12.34 | % | | 9.40 | % | | 9.57 | % | | 01/02/13 | † |
The performance data shown represents past performance. Past performance is not a guarantee of future results. Current performance may be lower or higher than the performance data quoted. The investment return and principal value of an investment will fluctuate so that an investor’s shares, when redeemed, may be worth more or less than their original cost.
Investors should carefully consider the Fund’s investment objectives, risks, charges and expenses before investing. For performance information through the most recent month end, current net asset values per share for the Fund and other information, please call 800.548.4539 or visit our website at amgfunds.com for a free prospectus. Read it carefully before investing or sending money.
Distributed by AMG Distributors, Inc., member FINRA/SIPC.
| † | Date reflects inception date of the Fund, not the index. |
| 1 | Total return equals income yield plus share price change and assumes reinvestment of all dividends and capital gain distributions. Returns are net of fees and may reflect offsets of Fund expenses as described in the prospectus. No adjustment has been made for taxes payable by shareholders on their reinvested dividends and |
| | | capital gain distributions. Returns for periods greater than one year are annualized. The listed returns on the Fund are net of expenses and based on the published NAV as of December 31, 2020. All returns are in U.S. dollars ($). |
| 2 | From time to time, the Fund’s investment manager has waived its fees and/or absorbed Fund expenses, which has resulted in higher returns. |
| 3 | Investments in international securities are subject to certain risks of overseas investing including currency fluctuations and changes in political and economic conditions, which could result in significant market fluctuations. These risks are magnified in emerging markets. |
| 4 | The Fund is subject to the risks associated with investments in emerging markets, such as erratic earnings patterns, economic and political instability, changing exchange controls, limitations on repatriation of foreign capital and changes in local governmental attitudes toward private investment, possibly leading to nationalization or confiscation of investor assets. |
| 5 | The Fund is subject to risks associated with investments in small-capitalization companies, such as erratic earnings patterns, competitive conditions, limited earnings history and a reliance on one or a limited number of products. |
| 6 | Companies that are in similar businesses may be similarly affected by particular economic or market events; to the extent the Fund has substantial holdings within a particular sector, the risks associated with that sector increase. |
| 7 | The Fund is subject to currency risk resulting from fluctuations in exchange rates that may affect the total loss or gain on a non-U.S. Dollar investment when converted back to U.S. Dollars. |
| 8 | The Fund may invest in derivatives such as options and futures; the complexity and rapidly changing structure of derivatives markets may increase the possibility of market losses. |
| 9 | The Fund invests in growth stocks, which may be more sensitive to market movements because their prices tend to reflect future investor expectations rather than just current profits. Growth stocks may underperform value stocks during given periods. |
| 10 | Market prices of investments held by the Fund may fall rapidly or unpredictably due to a variety of economic or political factors, market conditions, disasters or public health issues, or in response to events that affect particular industries or companies. |
| 11 | The MSCI EAFE Small Cap Index covers all investable small-cap securities with a market capitalization below that of the companies in the MSCI Standard Indices of developed markets, excluding the U.S. and Canada. Please go to |
| | |
| | |
| | AMG TimesSquare International Small Cap Fund |
| | Portfolio Manager’s Comments (continued) |
msci.com for most current list of countries represented by the index. Unlike the Fund, the MSCI EAFE Small Cap Index is unmanaged, is not available for investment and does not incur expenses. | | | All MSCI data is provided ‘as is.’ The products described herein are not sponsored or endorsed and have not been reviewed or passed on by MSCI. In no event shall MSCI, its affiliates or any MSCI data provider have any liability of any kind in connection with the MSCI data or the products described herein. | | | Copying or redistributing the MSCI data is strictly prohibited. Not FDIC insured, nor bank guaranteed. May lose value. | |
| | |
| | AMG TimesSquare International Small Cap Fund |
| | Fund Snapshots (unaudited) |
| | December 31, 2020 |
PORTFOLIO BREAKDOWN
| Sector | % of
Net Assets |
| Industrials | 20.2 | |
| Information Technology | 19.3 | |
| Financials | 18.0 | |
| Communication Services | 10.3 | |
| Health Care | 10.0 | |
| Consumer Discretionary | 6.7 | |
| Consumer Staples | 6.4 | |
| Real Estate | 3.5 | |
| Utilities | 2.3 | |
| Materials | 1.7 | |
| Energy | 0.5 | |
| Short-Term Investments | 4.1 | |
| Other Assets Less Liabilities | (3.0) | |
TOP TEN HOLDINGS
| Security Name | | % of
Net Assets |
| Sushiro Global Holdings, Ltd. (Japan) | | 3.3 | |
| FinecoBank Banca Fineco S.P.A. (Italy) | | 3.1 | |
| Nordic Entertainment Group AB, Class B (Sweden) | | 3.0 | |
| St James’s Place PLC (United Kingdom) | | 3.0 | |
| Electrocomponents PLC (United Kingdom) | | 2.9 | |
| Kobe Bussan Co., Ltd. (Japan) | | 2.5 | |
| Keywords Studios PLC (Ireland) | | 2.5 | |
| Steadfast Group, Ltd. (Australia) | | 2.3 | |
| Rubis SCA (France) | | 2.2 | |
| Melrose Industries PLC (United Kingdom) | | 2.0 | |
| Top Ten as a Group | | 26.8 | |
Because a fund’s strategy may result in multiple investments in particular sectors of the economy, its performance may depend on the performance of those sectors and may fluctuate more widely than investments diversified across more sectors. For additional information on these and other risk considerations, please see the Fund’s prospectus.
Any sectors, industries, or securities discussed should not be perceived as investment recommendations. Mention of a specific security should not be considered a recommendation to buy or solicitation to sell that security. Specific securities mentioned in this report may have been sold from the Fund’s portfolio of investments by the time you receive this report.
| | |
| | AMG TimesSquare International Small Cap Fund |
| | Schedule of Portfolio Investments |
| | December 31, 2020 |
| | Shares | | Value | |
| Common Stocks - 98.9% | | | | |
| Communication Services - 10.3% | | | | |
| Auto Trader Group PLC (United Kingdom)1 | 2,247,940 | | $18,297,641 | |
| Codemasters Group Holdings PLC (United Kingdom)* | 588,700 | | 5,265,582 | |
| giftee, Inc. (Japan)*,2 | 280,600 | | 9,131,328 | |
| HUYA, Inc., ADR (China)*,2 | 602,903 | | 12,015,857 | |
| IPSOS (France) | 243,345 | | 8,212,118 | |
| Kakaku.com, Inc. (Japan) | 460,300 | | 12,599,955 | |
| Karnov Group AB (Sweden) | 813,842 | | 5,885,507 | |
| Modern Times Group MTG AB, Class B (Sweden)*,2 | 352,281 | | 6,263,167 | |
| Nordic Entertainment Group AB, Class B (Sweden)* | 582,404 | | 32,462,744 | |
| Total Communication Services | | | 110,133,899 | |
| Consumer Discretionary - 6.7% | | | | |
| Afya, Ltd., Class A (Brazil)*,2 | 240,200 | | 6,077,060 | |
| CIE Automotive, S.A. (Spain) | 403,978 | | 10,883,985 | |
| Dalata Hotel Group PLC (Ireland)* | 1,650,021 | | 7,629,607 | |
| Knaus Tabbert AG (Germany)* | 41,800 | | 3,237,519 | |
| momo.com, Inc. (Taiwan) | 397,200 | | 9,013,828 | |
| Sushiro Global Holdings, Ltd. (Japan) | 911,304 | | 34,959,364 | |
| Total Consumer Discretionary | | | 71,801,363 | |
| Consumer Staples - 6.4% | | | | |
| Kobe Bussan Co., Ltd. (Japan) | 890,098 | | 27,348,261 | |
| Pola Orbis Holdings, Inc. (Japan) | 407,300 | | 8,270,860 | |
| Sugi Holdings Co., Ltd. (Japan) | 187,597 | | 12,531,286 | |
| Viscofan, S.A. (Spain) | 97,641 | | 6,924,385 | |
| Zur Rose Group AG (Switzerland)* | 43,000 | | 13,797,645 | |
| Total Consumer Staples | | | 68,872,437 | |
| Energy - 0.5% | | | | |
| Gaztransport Et Technigaz, S.A. (France) | 54,935 | | 5,322,024 | |
| Financials - 18.0% | | | | |
| Aruhi Corp. (Japan) | 496,147 | | 8,717,010 | |
| Challenger, Ltd. (Australia)2 | 3,161,610 | | 15,710,455 | |
| Conduit Holdings, Ltd. (Bermuda)* | 1,497,700 | | 10,311,183 | |
| doValue S.P.A. (Italy)*,1 | 594,500 | | 7,008,514 | |
| FinecoBank Banca Fineco S.P.A. (Italy)* | 2,044,313 | | 33,714,850 | |
| Lancashire Holdings, Ltd. (United Kingdom) | 1,117,096 | | 11,080,387 | |
| Nordnet AB publ (Sweden)* | 803,087 | | 12,601,309 | |
| St James’s Place PLC (United Kingdom) | 2,070,900 | | 32,045,267 | |
| Steadfast Group, Ltd. (Australia) | 7,972,683 | | 24,532,439 | |
| Tamburi Investment Partners S.P.A. (Italy) | 776,915 | | 6,513,777 | |
| Topdanmark AS (Denmark) | 305,711 | | 13,269,752 | |
| | Shares | | Value | |
| Zenkoku Hosho Co., Ltd. (Japan) | 378,909 | | $17,357,421 | |
| Total Financials | | | 192,862,364 | |
| Health Care - 10.0% | | | | |
| Amplifon S.P.A. (Italy)* | 487,795 | | 20,275,774 | |
| As One Corp. (Japan) | 32,900 | | 5,627,160 | |
| Ascom Holding AG (Switzerland)* | 215,093 | | 3,205,024 | |
| Mani, Inc. (Japan) | 559,733 | | 15,268,147 | |
| MedPeer, Inc. (Japan)*,2 | 232,600 | | 18,435,185 | |
| Nippon Shinyaku Co., Ltd. (Japan) | 120,900 | | 7,935,859 | |
| Orpea SA (France)* | 166,548 | | 21,839,788 | |
| UDG Healthcare PLC (Ireland) | 1,413,640 | | 15,089,078 | |
| Total Health Care | | | 107,676,015 | |
| Industrials - 20.2% | | | | |
| A-Living Smart City Services Co., Ltd. (China)1 | 2,636,200 | | 11,700,893 | |
| Befesa, S.A. (Luxembourg)1 | 270,361 | | 17,052,624 | |
| Boa Vista Servicos, S.A. (Brazil) | 1,968,950 | | 4,795,198 | |
| Bodycote PLC (United Kingdom) | 696,039 | | 7,097,085 | |
| Electrocomponents PLC (United Kingdom) | 2,613,551 | | 31,076,096 | |
| en-japan, Inc. (Japan) | 429,669 | | 12,907,040 | |
| Harmonic Drive Systems, Inc. (Japan)2 | 155,549 | | 13,919,564 | |
| Howden Joinery Group PLC (United Kingdom)* | 1,659,763 | | 15,635,665 | |
| Interpump Group S.P.A. (Italy) | 309,157 | | 15,304,240 | |
| Intrum AB (Sweden)2 | 426,895 | | 11,131,643 | |
| IPH, Ltd. (Australia) | 2,616,140 | | 12,955,706 | |
| Melrose Industries PLC (United Kingdom)* | 8,997,822 | | 21,922,228 | |
| Polypipe Group PLC (United Kingdom)* | 1,880,166 | | 15,351,875 | |
| Prosegur Cia de Seguridad, S.A. (Spain) | 5,696,504 | | 17,089,831 | |
| Stabilus, S.A. (Luxembourg) | 124,011 | | 8,766,744 | |
| Total Industrials | | | 216,706,432 | |
| Information Technology - 19.3% | | | | |
| Accton Technology Corp. (Taiwan) | 1,218,800 | | 13,741,599 | |
| Barco, N.V. (Belgium) | 442,539 | | 9,626,884 | |
| Brockhaus Capital Management AG (Germany)*,1 | 64,800 | | 2,434,260 | |
| Chinasoft International, Ltd. (China) | 9,503,600 | | 10,621,364 | |
| Datalogic S.P.A. (Italy)2 | 48,743 | | 832,722 | |
| Disco Corp. (Japan) | 34,560 | | 11,647,858 | |
| Douzone Bizon Co., Ltd. (South Korea) | 84,200 | | 8,067,230 | |
| Elecom Co., Ltd. (Japan) | 282,638 | | 14,595,930 | |
| Horiba, Ltd. (Japan) | 148,948 | | 8,748,442 | |
| Keywords Studios PLC (Ireland)* | 679,371 | | 26,529,419 | |
| Link Administration Holdings, Ltd. (Australia) | 3,149,376 | | 13,454,716 | |
| LINK Mobility Group Holding A.S.A. (Norway)* | 885,800 | | 4,799,751 | |
| Nemetschek SE (Germany) | 71,632 | | 5,323,574 | |
The accompanying notes are an integral part of these financial statements.
| | |
| | |
| | AMG TimesSquare International Small Cap Fund |
| | Schedule of Portfolio Investments (continued) |
| | Shares | | Value | |
| Information Technology - 19.3% (continued) | | | | |
| Pexip Holding A.S.A. (Norway)* | 593,770 | | $4,548,593 | |
| Plaid, Inc. (Japan)* | 72,500 | | 2,608,469 | |
| Pushpay Holdings, Ltd. (New Zealand)* | 5,637,700 | | 7,360,413 | |
| SimCorp A/S (Denmark) | 53,935 | | 8,018,856 | |
| Solutions 30 SE (Luxembourg)*,2 | 543,300 | | 6,990,191 | |
| Systena Corp. (Japan) | 675,700 | | 14,187,704 | |
| Tokai Carbon Korea Co., Ltd. (South Korea) | 64,200 | | 7,411,864 | |
| Tri Chemical Laboratories, Inc. (Japan) | 109,700 | | 17,742,930 | |
| Yeahka, Ltd. (China)*,2 | 1,605,800 | | 7,802,188 | |
| Total Information Technology | | | 207,094,957 | |
| Materials - 1.7% | | | | |
| Toyo Gosei Co., Ltd. (Japan) | 103,300 | | 11,839,168 | |
| Verallia, S.A. (France)1 | 191,605 | | 6,794,183 | |
| Total Materials | | | 18,633,351 | |
| Real Estate - 3.5% | | | | |
| Katitas Co., Ltd. (Japan) | 625,852 | | 20,194,546 | |
| Real Matters, Inc. (Canada)* | 509,300 | | 7,686,113 | |
| Safestore Holdings PLC, REIT (United Kingdom) | 911,200 | | 9,738,943 | |
| Total Real Estate | | | 37,619,602 | |
| Utilities - 2.3% | | | | |
| Rubis SCA (France) | 521,330 | | 24,100,152 | |
| Total Common Stocks | | | | |
| (Cost $777,671,910) | | | 1,060,822,596 | |
| | | | | |
| | Principal
Amount | | | |
| Short-Term Investments - 4.1% | | | | |
| Joint Repurchase Agreements - 3.1%3 | | | | |
| Amherst Pierpont Securities LLC, dated 12/31/20, due 01/04/21, 0.100% total to be received $1,921,188 (collateralized by various U.S. Government Agency Obligations and U.S. Treasuries, 0.000% - 4.628%, 02/03/21 - 11/20/70, totaling $1,959,590) | $1,921,167 | | 1,921,167 | |
| Bethesda Securities LLC, dated 12/31/20, due 01/04/21, 0.100% total to be received $1,207,603 (collateralized by various U.S. Government Agency Obligations, 2.500% - 5.500%, 07/01/24 - 10/01/50, totaling $1,231,742) | 1,207,590 | | 1,207,590 | |
| Cantor Fitzgerald Securities, Inc., dated 12/31/20, due 01/04/21, 0.070% total to be received $5,701,249 (collateralized by various U.S. Government Agency Obligations, 0.000% - 9.500%, 01/25/21 - 10/15/62, totaling $5,815,229) | 5,701,205 | | 5,701,205 | |
| | Principal
Amount | | Value | |
| | | | | |
| CF Securities LLC, dated 12/31/20, due 01/04/21, 0.070% total to be received $1,951,278 (collateralized by various U.S. Government Agency Obligations and U.S. Treasuries, 0.000% - 4.750%, 01/14/21 - 01/20/69, totaling $1,990,288) | $1,951,263 | | $1,951,263 | |
| Citadel Securities LLC, dated 12/31/20, due 01/04/21, 0.130% total to be received $3,883,182 (collateralized by various U.S. Treasuries, 0.000% - 7.875%, 01/31/21 - 05/15/49, totaling $3,960,849) | 3,883,126 | | 3,883,126 | |
| Citigroup Global Markets, Inc., dated 12/31/20, due 01/04/21, 0.070% total to be received $5,606,080 (collateralized by various U.S. Government Agency Obligations and U.S. Treasuries, 0.000% - 4.000%, 09/15/21 - 01/01/51, totaling $5,718,157) | 5,606,036 | | 5,606,036 | |
| JVB Financial Group LLC, dated 12/31/20, due 01/04/21, 0.130% total to be received $2,229,196 (collateralized by various U.S. Government Agency Obligations and U.S. Treasuries, 0.125% - 7.000%, 07/01/22 - 12/01/50, totaling $2,273,747) | 2,229,164 | | 2,229,164 | |
| Mirae Asset Securities USA, Inc., dated 12/31/20, due 01/04/21, 0.130% total to be received $2,547,114 (collateralized by various U.S. Government Agency Obligations and U.S. Treasuries, 0.000% - 8.125%, 02/18/21 - 01/15/62, totaling $2,598,056) | 2,547,077 | | 2,547,077 | |
Palafox Trading LLC, dated 12/31/20, due 01/04/21, 0.130% total to be received $2,177,371 (collateralized by various U.S. Treasuries,
0.250% - 1.125%, 02/28/25 - 05/31/25, totaling $2,221,691) | 2,177,340 | | 2,177,340 | |
State of Wisconsin Investment Board, dated 12/31/20, due 01/04/21, 0.160% total to be received $5,658,717 (collateralized by various
U.S. Treasuries, 0.125% - 3.875%, 07/15/22 - 02/15/47, totaling $5,786,174) | 5,658,616 | | 5,658,616 | |
| Total Joint Repurchase Agreements | | | 32,882,584 | |
| | | | | |
| | Shares | | | |
| Other Investment Companies - 1.0% | | | | |
| Dreyfus Government Cash Management Fund, Institutional Shares, 0.03%4 | 3,663,389 | | 3,663,389 | |
| Dreyfus Institutional Preferred Government Money Market Fund, Institutional Shares, 0.03%4 | 3,663,388 | | 3,663,388 | |
| JPMorgan U.S. Government Money Market Fund, IM Shares, 0.03%4 | 3,774,400 | | 3,774,400 | |
| Total Other Investment Companies | | | 11,101,177 | |
| Total Short-Term Investments | | | | |
| (Cost $43,983,761) | | | 43,983,761 | |
The accompanying notes are an integral part of these financial statements.
| | |
| | |
| | AMG TimesSquare International Small Cap Fund |
| | Schedule of Portfolio Investments (continued) |
| | Value | |
| Total Investments - 103.0% | | |
(Cost $821,655,671) | $1,104,806,357 | |
| Other Assets, less Liabilities - (3.0)% | (31,939,263) | |
| Net Assets - 100.0% | $1,072,867,094 | |
| * | Non-income producing security. |
| 1 | Security exempt from registration under Rule 144A of the Securities Act of 1933. This security may be resold in transactions exempt from registration, normally to qualified institutional buyers. At December 31, 2020, the value of these securities amounted to $63,288,115 or 5.9% of net assets. |
| 2 | Some of these securities, amounting to $46,177,802 or 4.3% of net assets, were out on loan to various borrowers and are collateralized by cash and various U.S. Treasury Obligations. See Note 4 of Notes to Financial Statements. |
| 3 | Cash collateral received for securities lending activity was invested in these joint repurchase agreements. |
| 4 | Yield shown represents the December 31, 2020, seven day average yield, which refers to the sum of the previous seven days’ dividends paid, expressed as an annual percentage. |
| ADR | American Depositary Receipt |
| REIT | Real Estate Investment Trust |
The following table summarizes the inputs used to value the Fund’s investments by the fair value hierarchy levels as of December 31, 2020:
| | | | Level 1 | | | Level 21 | | | Level 3 | | | Total | |
| Investments in Securities | | | | | | | | | | | | | |
| Common Stocks | | | | | | | | | | | | | |
| Industrials | | | $4,795,198 | | | $211,911,234 | | | — | | | $216,706,432 | |
| Information Technology | | | 9,842,480 | | | 197,252,477 | | | — | | | 207,094,957 | |
| Financials | | | 29,921,006 | | | 162,941,358 | | | — | | | 192,862,364 | |
| Communication Services | | | 50,364,108 | | | 59,769,791 | | | — | | | 110,133,899 | |
| Health Care | | | — | | | 107,676,015 | | | — | | | 107,676,015 | |
| Consumer Discretionary | | | 16,944,186 | | | 54,857,177 | | | — | | | 71,801,363 | |
| Consumer Staples | | | 6,924,385 | | | 61,948,052 | | | — | | | 68,872,437 | |
| Real Estate | | | 7,686,113 | | | 29,933,489 | | | — | | | 37,619,602 | |
| Utilities | | | — | | | 24,100,152 | | | — | | | 24,100,152 | |
| Materials | | | — | | | 18,633,351 | | | — | | | 18,633,351 | |
| Energy | | | — | | | 5,322,024 | | | — | | | 5,322,024 | |
| Short-Term Investments | | | | | | | | | | | | | |
| Joint Repurchase Agreements | | | — | | | 32,882,584 | | | — | | | 32,882,584 | |
| Other Investment Companies | | | 11,101,177 | | | — | | | — | | | 11,101,177 | |
| Total Investment in Securities | | | $137,578,653 | | | $967,227,704 | | | — | | | $1,104,806,357 | |
| 1 | An external pricing service is used to reflect any impact on security value due to market movements between the time the Fund valued such foreign securities and the earlier closing of foreign markets. |
For the fiscal year ended December 31, 2020, there were no transfers in or out of Level 3.
The accompanying notes are an integral part of these financial statements
| | |
| | |
| | AMG TimesSquare International Small Cap Fund |
| | Schedule of Portfolio Investments (continued) |
The country allocation in the Schedule of Portfolio Investments at December 31, 2020, was as follow:
| Country | % of Long-Term
Investments |
| Australia | 6.3 | |
| Belgium | 0.9 | |
| Bermuda | 1.0 | |
| Brazil | 1.0 | |
| Canada | 0.7 | |
| China | 4.0 | |
| Denmark | 2.0 | |
| France | 6.3 | |
| Germany | 1.0 | |
| Ireland | 4.6 | |
| Italy | 7.9 | |
| Japan | 28.9 | |
| Luxembourg | 3.1 | |
| New Zealand | 0.7 | |
| Norway | 0.9 | |
| South Korea | 1.5 | |
| Spain | 3.3 | |
| Sweden | 6.4 | |
| Switzerland | 1.6 | |
| Taiwan | 2.1 | |
| United Kingdom | 15.8 | |
| | 100.0 | |
The accompanying notes are an integral part of these financial statements.
| | |
| | |
| | AMG TimesSquare Emerging Markets Small Cap Fund |
| | Portfolio Manager’s Comments (unaudited) |
Year In Review For the year ended December 31, 2020, AMG TimesSquare Emerging Markets Small Cap Fund’s (the “Fund”) Class N shares returned 23.86%, while its benchmark, the MSCI Emerging Markets Small Cap Index, returned 19.29%. We close the books on 2020, a year where the most important statistic may have been COVID-19’s global death toll of 1.8 million people. Somewhat surprising this year, in the face of that casualty rate and widespread shutdowns, was the resilience of the global equity markets that looked past the social and economic damage taking place in 2020. Markets instead focused on the potential halcyon days awaiting us in 2021. Global volatility levels spiked in March to peaks not seen since the 2008 Global Financial Crisis, though quickly receded to moderate levels. Economic activities worldwide quickly fell to record low contraction levels in April; though by summer they returned to economic expansion territory with staggered reopenings of businesses, ending the year slightly higher than they began it. Central banks assisted with significant monetary stimulus—or quantitative easing to the nth degree—which led most governments’ responses as levels of fiscal support varied. Results from the much-anticipated US election received a positive reception from markets on expectations of a return to more traditional foreign policy. The announcements of multiple COVID-19 vaccines provided some light at the end of the tunnel for 2020. Investors welcomed the news and looked to areas that had been hit the hardest and are set to benefit from a recovery in global trade and travel. Amidst this backdrop, value stocks had their best quarter since 2009 and outperformed growth stocks, though growth stocks remained well ahead for the full year. Global emerging market equities outperformed their developed peers and returned 18% for 2020—a year that included a drop of 29% from the beginning to the lows of March, followed by an ascent of 67%. Emerging markets benefited from growing optimism of a cyclical recovery, a falling dollar, increasing global trade, and relatively better handling of COVID-19 in some regions. With multiple approved COVID-19 vaccines, the successful distribution of vaccines will be crucial for much of the world to return to growth in 2021. However, key questions remain regarding the logistical requirements for | | | certain vaccines, vaccination rates and compliance, and whether the vaccines will be effective against new strains of the virus that are now appearing. Portfolio Performance Attribution The Fund outperformed the MSCI Emerging Markets Small Cap Index for the year. Relative strength in Asia and Latin America more than offset relative weakness in EMEA and the Frontier markets. Regional Performance: Asia Holdings in Asia outperformed the benchmark’s regional return; China, Taiwan, and Korea exhibited strength, while India and Indonesia detracted from performance. In China, Information Technology and Communication Services sectors housed some of the Fund’s largest contributors. Shares of leading Chinese online community and entertainment platform Bilibili (the “YouTube of China”) recorded better traffic with users staying home amid COVID-19. We exited the position in December and booked a 234% gain for the year. Software company Kingsoft Corp., Ltd. returned 147% as it saw healthy revenue growth in its cloud office software and services and strong showing of its games. At the beginning of the year, we initiated a position in Chinasoft International, Ltd., one of the largest information technology (IT) services providers in the country, offering services similar to Accenture and Infosys in other countries. After experiencing a slow-down early in the year due to the COVID-19 outbreak, the Chinese IT services industry saw accelerating momentum in the second half of the year, which lifted Chinasoft shares up 89% for the year. In the long run, Chinasoft could benefit from the government’s initiative to accelerate localization of hardware and software solutions to reduce reliance on foreign vendors. We trimmed our position on price strength. Somewhat offsetting these gains was the real estate information and analytics service platform, China Index Holdings, Ltd., which declined 47%. Despite reporting solid results after suffering from a COVID-19 related slowdown in the first quarter, the company was somewhat overlooked by investors due to its small market capitalization and lack of sell-side coverage. We believe in the value of China Index’s data to its customers and see this as a recurring subscription database business with significant opportunities to expand into new adjacent products and services. Another detractor was Shanghai Kindly Medical Instruments Co., Ltd., a manufacturer of cardiovascular devices in China. The company’s core Percutaneous Coronary Intervention | | | (PCI) business faced headwinds as elective surgeries significantly declined in China during the pandemic earlier in the year. As conditions continued to normalize, the recovery of PCI procedures has started gaining momentum. Class H shares slid 32% for the year since they were added to the Fund. Across the strait in Taiwan, leading business-to-consumer e-commerce player, momo.com, Inc., posted strong sales which outpaced that of other e-retailers and was rewarded with a 135% rise. Looking forward, we expect it to benefit from a growing product variety and higher e-commerce penetration rates in the retail market. Accton Technology Corp. is a leading manufacturer and original design manufacturer of white-box network devices. The company reported better-than-expected earnings, benefitting from COVID-19 intensifying network demand, and its share price jumped 94%. We believe the company could continue to benefit from higher speed requirements driven by growth in data and cloud computing. The move towards customized hardware with open-source or custom software solutions could also provide a tailwind. We trimmed the name on price strength. Technology peer Alchip is a leading Taiwanese fabless integrated circuit design firm that develops chipsets for specialized applications such as language processing, autonomous driving, and virtual reality. With U.S./China trade tensions accelerating the growth of fabless startups in China and the move to Chinese semiconductor localization, this trend is positive for Alchip which derives a majority of its sales from China. We exited the name in the third quarter as it approached our price target. Shares climbed 139% while they were held in the Fund during the year. Moving over to Korea, Hansol Chemical Co, Ltd., a specialty technology materials supplier to manufacturers of semiconductors, displays, batteries, and other electronics, ascended 99%. The company was buoyed by strong sales of iPhone12s and QLED TVs by its two major clients, Apple and Samsung Electronics, respectively. Hansol Chemical is transforming into a full-range, comprehensive materials supplier for major sectors of the IT industry and the electric vehicle battery market. The Fund’s holdings had mixed results in India. IndiaMART InterMESH, Ltd. is the country’s largest online business-to-business classified marketplace. New to the Fund in July, the company benefits from the digitalization wave in the country. Shares of | |
| | | | | | | | |
| | | | | | | | |
| | |
| | |
| | AMG TimesSquare Emerging Markets Small Cap Fund |
| | Portfolio Manager’s Comments (continued) |
IndiaMART surged 191% since the stock was added to the Fund in July. We trimmed the position on price strength. On the contrary, COVID-19 lockdowns and declining margins weighed on logistics provider Container Corporation of India. In addition, the Ministry of Railways increased Land License Fees, though Container Corporation remains confident of its own calculation. Shares retreated 34% before we sold out of the name. In Southeast Asia, Media Nusantara Citra Tbk PT is Indonesia’s largest media content company, commanding nearly half the audience share of the “Free to Air” market with an increasing presence in digital advertising. Management signaled a revenue recovery in the fourth quarter. We had been accumulating shares as the company started showing signs of revenue recovery earlier in the quarter. Its shares surged 71% following its impressive prime time share gains in December but remained down 34% for the year. Another detractor was Bank Tabungan Negara Tbk PT, a leading a commercial bank. Shares dropped (50)% on the challenging near-term outlook for financials before we sold the name. Regional Performance: Latin America Our holdings in Latin America also benefitted the Fund, with strong performance from Brazil and Argentina, while Mexico detracted. In Brazil, Cogna Educacao is a provider of in-class and distance-learning education services. In the second quarter we exited from the name on liquidity and balance sheet concerns driven by COVID-19, and shares declined 69% while they were held in the Fund in 2020. Mexico-based Regional SAB de CV is a | | | bank servicing small and mid-size enterprises (SME) in Northern Mexico. Their shares lost 54% due to significant headwinds from COVID-19 to their SME client base. On the positive side, the push for merchants to go online benefitted Locaweb Servicos de Internet, S.A., one of Brazil’s leading web hosting platform with a growing e-commerce and software-as-a-service platform. Shares of Locaweb scored an impressive 286% gain since they were added to the Fund in May. In Argentina, online travel agency Despegar.com Corp. started seeing signs of recovery following second quarter lows, driven by domestic travel in Brazil and Mexico. Positive COVID-19 vaccine news also provided a boost and its share price soared 96% since they were added to the Fund in September, which led us to trim the position. Regional Performance: EMEA and Frontier Markets EMEA and Frontier Markets showed mixed results during the year. Egypt based Egypt Kuwait Holding, Co., S.A.E. is an investment company with exposure to fertilizers, petrochemicals, energy, and infrastructure sectors. The company reported declining revenue from its fertilizer and petrochemical segments, but improving results from its energy and energy related segments. Shares traded down 19%. South Africa based drug store chain Dis-Chem Pharmacies, Ltd. operates big box stores located in regional malls, while consumers have preferred closer and more convenient stores during the lockdown. The company reported light earnings due to inventory clearance and higher operational costs. Employment and wage pressure further weakened consumer sentiment and dragged | | | shares down by 25%. Notable on the positive side was Masan Group Corp, a consumer-oriented holding company with a long and successful track record in Vietnam. Its business remained resilient amidst the pandemic. During the fourth quarter, the company’s subsidiary, Masan High-Tech Materials, entered into a strategic alliance with Mitsubishi Materials Corporation. The partnership is expected to expand Masan’s sales network in the Asia Pacific region. Shares of Masan rose 58% and we pared our exposure on price strength. Conclusion Turning the page to 2021 allows us to look forward optimistically but does not extinguish the concerns that plagued 2020. The start of the new year marked the end of the Brexit transition for the U.K. from the European Union; so, beginning later this month all the new agreements will go into effect for trade, travel, and other aspects. While distribution began for COVID-19 vaccines, case rates continued to climb and the coronavirus showed signs of mutating. Although we have not yet returned to our New York City office, all of us at TimesSquare Capital Management, LLC continue working collectively to steward your investments. We hope that 2021 will be brighter for all of us, though from an investment perspective we remain vigilant. As always, we are available for any questions you might have as we endeavor to protect and grow the assets you have entrusted with us. This commentary reflects the viewpoints of TimesSquare Capital Management, LLC, and is not intended as a forecast or guarantee of future results. | |
| | | | | | | | |
| | | | | | | | |
| |
AMG TimesSquare Emerging Markets Small Cap Fund
Portfolio Manager’s Comments (continued)
|
CUMULATIVE TOTAL RETURN PERFORMANCE
AMG TimesSquare Emerging Markets Small Cap Fund’s cumulative total return is based on the daily change in net asset value (NAV), and assumes that all dividends and distributions were reinvested. This graph compares a hypothetical $10,000 investment made in the AMG TimesSquare Emerging Markets Small Cap Fund’s Class I shares on December 14, 2016 (inception date), to a $10,000 investment made in the MSCI Emerging Markets Small Cap Index for the same time period. The graph and table do not reflect the deduction of taxes that a shareholder would pay on a Fund distribution or redemption of shares. The listed returns for the Fund are net of expenses and the returns for the index exclude expenses. Total returns would have been lower had certain expenses not been reduced.

The table below shows the average annual total returns for the AMG TimesSquare Emerging Markets Small Cap Fund and the MSCI Emerging Markets Small Cap Index for the same time periods ended December 31, 2020.
| | One | Since | Inception |
| Average Annual Total Returns1 | Year | Inception | Date |
| AMG TimesSquare Emerging Markets Small Cap Fund2, 3, 4, 5, 6, 7, 8, 9, 10 | | | |
| Class N | 23.86% | 9.83% | 02/24/17 |
| Class I | 24.49% | 12.22% | 12/14/16 |
| Class Z | 24.40% | 12.20% | 12/14/16 |
| MSCI Emerging Markets Small Cap Index11 | 19.29% | 9.44% | 12/14/16† |
| The performance data shown represents past performance. Past performance is not a guarantee of future results. Current performance may be lower or higher than the performance data quoted. The investment return and principal value of an investment will fluctuate so that an investor’s shares, when redeemed, may be worth more or less than their original cost. |
Investors should carefully consider the Fund’s investment objectives, risks, charges and expenses before investing. For performance information through the most recent month end, current net asset values per share for the Fund and other information, please call 800,548,4539 or visit our website at amgfunds.com for a free prospectus. Read it carefully before investing or sending money.
Distributed by AMG Distributors, Inc., member FINRA/SIPC.
| † | Date reflects the inception date of the Fund, not the index. |
| | |
| 1 | Total return equals income yield plus share price change and assumes reinvestment of all dividends and capital gain distributions. Returns are net of fees and may reflect offsets of Fund expenses as described in the prospectus. No adjustment has been made for taxes payable by shareholders on their reinvested dividends and |
| | capital gain distributions. Returns for periods greater than one year are annualized. The listed returns on the Fund are net of expenses and based on the published NAV as of December 31, 2020. All returns are in U.S. dollars ($). |
| | |
| 2 | From time to time, the Fund’s investment manager has waived its fees and/or absorbed Fund expenses, which has resulted in higher returns. |
| | |
| 3 | Investments in international securities are subject to certain risks of overseas investing including currency fluctuations and changes in political and economic conditions, which could result in significant market fluctuations. These risks are magnified in emerging markets. |
| | |
| 4 | The Fund is subject to the risks associated with investments in emerging markets, such as erratic earnings patterns, economic and political instability, changing exchange controls, limitations on repatriation of foreign capital and changes in local governmental attitudes toward private investment, possibly leading to nationalization or confiscation of investor assets. |
| | |
| 5 | The Fund is subject to risks associated with investments in small-capitalization companies, such as erratic earnings patterns, competitive conditions, limited earnings history and a reliance on one or a limited number of products. |
| | |
| 6 | The Fund is subject to currency risk resulting from fluctuations in exchange rates that may affect the total loss or gain on a non-U.S. Dollar investment when converted back to U.S. Dollars. |
| | |
| 7 | The Fund may invest in derivatives, such as options and futures; the complexity and rapidly changing structure of derivatives markets may increase the possibility of market losses. |
| | |
| 8 | Companies that are in similar businesses may be similarly affected by particular economic or market events; to the extent the Fund has substantial holdings within a particular sector, the risks associated with that sector increase. |
| | |
| 9 | The Fund invests in growth stocks, which may be more sensitive to market movements because their prices tend to reflect future investor expectations rather than just current profits. Growth stocks may underperform value stocks during given periods. |
| | |
| 10 | Market prices of investments held by the Fund may fall rapidly or unpredictably due to a variety of economic or political factors, market conditions, disasters or public health issues, or in response to events that affect particular industries or companies. |
| | |
| 11 | MSCI Emerging Markets Small Cap Index includes small cap representation across 24 Emerging Markets countries. The small cap segment tends to capture more local economic and sector characteristics relative to larger Emerging Markets |
| |
AMG TimesSquare Emerging Markets Small Cap Fund
Portfolio Manager’s Comments (continued) |
| capitalization segments. Please go to msci.com for most current list of countries represented by the index. Unlike the Fund, the MSCI Emerging Markets Small Cap Index is unmanaged, is not available for investment, and does not incur expenses. | All MSCI data is provided ‘as is.’ The products described herein are not sponsored or endorsed and have not been reviewed or passed on by MSCI. In no event shall MSCI, its affiliates or any MSCI data provider have any liability of any kind in connection with the MSCI data or the products described herein. | Copying or redistributing the MSCI data is strictly prohibited. Not FDIC insured, nor bank guaranteed. May lose value. |
| | AMG TimesSquare Emerging Markets Small Cap Fund
Fund Snapshots (unaudited)
December 31, 2020 |
| PORTFOLIO BREAKDOWN |
| |
| | % of |
| Sector | Net Assets |
| Information Technology | 23.6 | |
| Consumer Discretionary | 16.6 | |
| Industrials | 15.7 | |
| Communication Services | 12.0 | |
| Financials | 9.7 | |
| Health Care | 7.2 | |
| Consumer Staples | 6.6 | |
| Materials | 4.0 | |
| Energy | 3.3 | |
| Real Estate | 1.5 | |
| Short-Term Investments | 1.9 | |
| Other Assets Less Liabilities | (2.1 | ) |
TOP TEN HOLDINGS |
| |
| | % of |
| Security Name | Net Assets |
| Hansol Chemical Co., Ltd. (South Korea) | 2.3 | |
| Bank of Georgia Group PLC (Georgia) | 2.1 | |
| OPAP, S.A. (Greece) | 2.1 | |
| Accton Technology Corp. (Taiwan) | 2.0 | |
| Cashbuild, Ltd. (South Africa) | 1.9 | |
| HUYA, Inc., ADR (China) | 1.9 | |
| Megacable Holdings SAB de CV (Mexico) | 1.8 | |
| AKR Corporindo Tbk PT (Indonesia) | 1.8 | |
| Chinasoft International, Ltd. (China) | 1.8 | |
| Petrobras Distribuidora, S.A. (Brazil) | 1.8 | |
| Top Ten as a Group | | 19.5 | |
Because a fund’s strategy may result in multiple investments in particular sectors of the economy, its performance may depend on the performance of those sectors and may fluctuate more widely than investments diversified across more sectors. For additional information on these and other risk considerations, please see the Fund’s prospectus.
Any sectors, industries, or securities discussed should not be perceived as investment recommendations. Mention of a specific security should not be considered a recommendation to buy or solicitation to sell that security. Specific securities mentioned in this report may have been sold from the Fund’s portfolio of investments by the time you receive this report.
| | AMG TimesSquare Emerging Markets Small Cap Fund
Schedule of Portfolio Investments
December 31, 2020 |
| | Shares | Value |
| Common Stocks - 99.6% | | |
| Communication Services - 12.0% | | |
| Converge ICT Solutions, Inc. (Philippines)* | 297,900 | $92,428 |
| GrameenPhone, Ltd. (Bangladesh) | 9,900 | 40,546 |
| HUYA, Inc., ADR (China)*,1 | 6,800 | 135,524 |
| Link Net Tbk PT (Indonesia) | 493,200 | 84,676 |
| Media Nusantara Citra Tbk PT (Indonesia)* | 1,250,000 | 101,567 |
| Megacable Holdings SAB de CV (Mexico) | 36,500 | 132,357 |
| Plan B Media PCL (Thailand) | 513,000 | 106,994 |
| PVR, Ltd. (India) | 4,423 | 80,134 |
| Sarana Menara Nusantara Tbk PT (Indonesia) | 1,301,000 | 88,945 |
| Total Communication Services | | 863,171 |
| Consumer Discretionary - 16.6% | | |
| Afya, Ltd., Class A (Brazil)* | 3,300 | 83,490 |
| Amber Enterprises India, Ltd. (India) | 1,600 | 51,693 |
| Cashbuild, Ltd. (South Africa) | 8,700 | 140,313 |
| Despegar.com Corp. (Argentina)*,1 | 7,000 | 89,670 |
| Detsky Mir PJSC (Russia)2 | 42,500 | 77,998 |
| Dixon Technologies India, Ltd. (India) | 300 | 55,342 |
| Fu Shou Yuan International Group, Ltd. (China) | 98,200 | 92,305 |
| Grupo SBF, S.A. (Brazil)* | 15,000 | 85,826 |
| JUMBO SA (Greece) | 3,700 | 63,806 |
| momo.com, Inc. (Taiwan) | 4,100 | 93,043 |
| OPAP, S.A. (Greece) | 11,200 | 149,743 |
| Petrobras Distribuidora, S.A. (Brazil) | 30,000 | 127,816 |
| Varroc Engineering, Ltd. (India)2 | 15,000 | 81,780 |
| Total Consumer Discretionary | | 1,192,825 |
| Consumer Staples - 6.0% | | |
| Delfi, Ltd. (Singapore) | 161,100 | 85,395 |
| Dis-Chem Pharmacies, Ltd. (South Africa)*,2 | 76,700 | 109,661 |
| InRetail Peru Corp. (Peru)2 | 1,900 | 74,480 |
| Laobaixing Pharmacy Chain JSC, Class A (China) | 9,900 | 95,060 |
| Puregold Price Club, Inc. (Philippines) | 76,500 | 65,383 |
| Total Consumer Staples | | 429,979 |
| Energy - 3.3% | | |
| Aegis Logistics, Ltd. (India) | 31,000 | 107,154 |
| AKR Corporindo Tbk PT (Indonesia) | 569,200 | 128,965 |
| Total Energy | | 236,119 |
| Financials - 9.7% | | |
| Banco Inter, S.A., (Units) (Brazil) | 3,417 | 64,765 |
| Bank of Georgia Group PLC (Georgia)* | 9,100 | 152,420 |
| City Union Bank, Ltd. (India) | 39,600 | 97,687 |
| JM Financial, Ltd. (India) | 85,600 | 98,843 |
| | Shares | Value |
| MCB Bank, Ltd. (Pakistan) | 49,100 | $56,929 |
| Regional SAB de CV (Mexico)* | 17,000 | 78,629 |
| Security Bank Corp. (Philippines) | 38,000 | 106,023 |
| Transaction Capital, Ltd. (South Africa) | 26,400 | 44,946 |
| Total Financials | | 700,242 |
| Health Care - 7.2% | | |
| Cleopatra Hospital (Egypt)* | 220,200 | 66,634 |
| Dian Diagnostics Group Co., Ltd., Class A (China) | 17,500 | 91,687 |
| Metropolis Healthcare, Ltd. (India)2 | 2,900 | 77,833 |
| New Frontier Health Corp. (Hong Kong)* | 11,800 | 101,480 |
| Odontoprev, S.A. (Brazil) | 30,000 | 84,036 |
| Shanghai Kindly Medical Instruments Co., Ltd., | | |
| Class H (China) | 12,700 | 66,938 |
| Universal Vision Biotechnology Co., Ltd. (Taiwan) | 4,000 | 34,074 |
| Total Health Care | | 522,682 |
| Industrials - 15.7% | | |
| A-Living Smart City Services Co., Ltd. (China)2 | 23,600 | 104,750 |
| Bizlink Holding, Inc. (United States) | 12,000 | 104,328 |
| Boa Vista Servicos, S.A. (Brazil) | 27,000 | 65,756 |
| Cera Sanitaryware, Ltd. (India) | 2,300 | 106,810 |
| China Conch Venture Holdings, Ltd. (China) | 12,900 | 62,772 |
| China Index Holdings, Ltd., ADR (China)* | 34,500 | 67,965 |
| Grupo Aeroportuario del Pacifico, S.A.B de CV, | | |
| Class B (Mexico)* | 7,300 | 81,439 |
| IndiaMart InterMesh, Ltd. (India)2 | 1,400 | 123,155 |
| NICE Information Service Co., Ltd. (South Korea) | 5,000 | 114,365 |
| Rumo, S.A. (Brazil)* | 30,174 | 111,769 |
| TCI Express, Ltd. (India) | 10,000 | 126,912 |
| Voltronic Power Technology Corp. (Taiwan) | 1,500 | 59,936 |
| Total Industrials | | 1,129,957 |
| Information Technology - 23.6% | | |
| Accton Technology Corp. (Taiwan) | 13,000 | 146,571 |
| Allied Electronics Corp., Ltd., Class A (South Africa) | 110,000 | 82,441 |
| Beijing Sinnet Technology Co., Ltd., Class A (China) | 29,800 | 78,352 |
| Chinasoft International, Ltd. (China) | 115,000 | 128,526 |
| Douzone Bizon Co., Ltd. (South Korea) | 800 | 76,648 |
| eCloudvalley Digital Technology Co., Ltd. (Taiwan) | 12,100 | 73,325 |
| Elite Material Co., Ltd. (Taiwan) | 17,000 | 95,289 |
| Ennoconn Corp. (Taiwan) | 11,884 | 106,589 |
| Ezwel Co., Ltd. (South Korea) | 7,500 | 75,061 |
| Kingsoft Corp., Ltd. (China) | 12,000 | 77,589 |
| Koh Young Technology, Inc. (South Korea) | 1,100 | 106,428 |
The accompanying notes are an integral part of these financial statements.
| |
AMG TimesSquare Emerging Markets Small Cap Fund
Schedule of Portfolio Investments (continued) |
| | Shares | Value |
| Information Technology - 23.6% | | |
| (continued) | | |
| Locaweb Servicos de Internet, S.A. (Brazil)2 | 5,600 | $86,757 |
| Sinbon Electronics Co., Ltd. (Taiwan) | 15,900 | 122,573 |
| Tokai Carbon Korea Co., Ltd. (South Korea) | 1,000 | 115,450 |
| Venustech Group, Inc., Class A (China) | 22,300 | 99,749 |
| Webcash Corp. (South Korea) | 600 | 39,578 |
| WONIK IPS Co., Ltd. (South Korea)* | 2,500 | 102,017 |
| Yeahka, Ltd. (China)*,1 | 18,500 | 89,887 |
| Total Information Technology | | 1,702,830 |
| Materials - 4.0% | | |
| Duratex, S.A. (Brazil) | 20,500 | 75,540 |
| Egypt Kuwait Holding Co., S.A.E. (Egypt) | 50,400 | 51,117 |
| Hansol Chemical Co., Ltd. (South Korea) | 900 | 163,178 |
| Total Materials | | 289,835 |
| Real Estate - 1.5% | | |
| The Phoenix Mills, Ltd. (India)* | 10,000 | 106,118 |
| Total Common Stocks | | |
| (Cost $5,670,996) | | 7,173,758 |
| Participation Notes - 0.6% | | |
| Consumer Staples - 0.6% | | |
| Masan Group Corp., 11/24/21 (JP Morgan) (Vietnam) | 12,000 | 46,242 |
| Total Participation Notes | | |
| (Cost $29,784) | | 46,242 |
| | |
| * | Non-income producing security. |
| 1 | Some of these securities, amounting to $180,957 or 2.5% of net assets, were out on loan to various borrowers and are collateralized by cash and various U.S. Treasury Obligations. See Note 4 of Notes to Financial Statements. |
| 2 | Security exempt from registration under Rule 144A of the Securities Act of 1933. This security may be resold in transactions exempt from registration, normally to qualified institutional buyers. At December 31, 2020, the value of these securities amounted to $736,414 or 10.2% of net assets. |
| | Principal | |
| | Amount | Value |
| Short-Term Investments - 1.9% | | |
| Joint Repurchase Agreements - 1.9%3 | | |
| Citibank N.A., dated 12/31/20, due 01/04/21, 0.070% total to be received $135,725 (collateralized by various U.S. Government Agency Obligations and U.S. Treasuries, 1.375% - 6.000%, 07/01/24 - 02/15/50, totaling $138,551) | $135,724 | $135,724 |
| Total Short-Term Investments | | |
| (Cost $135,724) | | 135,724 |
| Total Investments - 102.1% | | |
| (Cost $5,836,504) | | 7,355,724 |
| Other Assets, less Liabilities - (2.1)% | | (150,687) |
| Net Assets - 100.0% | | $7,205,037 |
| 3 | Cash collateral received for securities lending activity was invested in these joint repurchase agreements. |
| ADR | American Depositary Receipt |
The accompanying notes are an integral part of these financial statements.
| |
AMG TimesSquare Emerging Markets Small Cap Fund |
| | Schedule of Portfolio Investments (continued) |
The following table summarizes the inputs used to value the Fund’s investments by the fair value hierarchy levels as of December 31, 2020:
| | | Level 1 | | Level 21 | | Level 3 | | Total |
| Investments in Securities | | | | | | | | |
| Common Stocks | | | | | | | | |
| Information Technology | | $86,757 | | $1,616,073 | | — | | $1,702,830 |
| Consumer Discretionary | | 527,115 | | 665,710 | | — | | 1,192,825 |
| Industrials | | 326,929 | | 803,028 | | — | | 1,129,957 |
| Communication Services | | 400,855 | | 462,316 | | — | | 863,171 |
| Financials | | 200,323 | | 499,919 | | — | | 700,242 |
| Health Care | | 252,150 | | 270,532 | | — | | 522,682 |
| Consumer Staples | | 184,141 | | 245,838 | | — | | 429,979 |
| Materials | | 75,540 | | 214,295 | | — | | 289,835 |
| Energy | | — | | 236,119 | | — | | 236,119 |
| Real Estate | | — | | 106,118 | | — | | 106,118 |
| Participation Notes | | | | | | | | |
| Consumer Staples | | — | | 46,242 | | — | | 46,242 |
| Short-Term Investments | | | | | | | | |
| Joint Repurchase Agreements | | — | | 135,724 | | — | | 135,724 |
| Total Investments in Securities | | $2,053,810 | | $5,301,914 | | — | | $7,355,724 |
| 1 | An external pricing service is used to reflect any impact on security value due to market movements between the time the Fund valued such foreign securities and the earlier closing of foreign markets. |
For the fiscal year ended December 31, 2020, there were no transfers in or out of Level 3.
The country allocation in the Schedule of Portfolio Investments at December 31, 2020, was as follows:
| Country | % of Long-Term
Investments |
| Argentina | 1.2 | |
| Bangladesh | 0.6 | |
| Brazil | 10.9 | |
| China | 16.5 | |
| Egypt | 1.6 | |
| Georgia | 2.1 | |
| Greece | 3.0 | |
| Hong Kong | 1.4 | |
| India | 15.4 | |
| Indonesia | 5.6 | |
| Mexico | 4.1 | |
| Pakistan | 0.8 | |
| Country | % of Long-Term
Investments |
| Peru | 1.0 | |
| Philippines | 3.7 | |
| Russia | 1.1 | |
| Singapore | 1.2 | |
| South Africa | 5.2 | |
| South Korea | 11.0 | |
| Taiwan | 10.1 | |
| Thailand | 1.5 | |
| United States | 1.4 | |
| Vietnam | 0.6 | |
| | 100.0 | |
The accompanying notes are an integral part of these financial statements.
| | |
| | AMG TimesSquare Global Small Cap Fund |
| | Portfolio Manager’s Comments (unaudited) |
Year In Review For the year ended December 31, 2020, AMG TimesSquare Global Small Cap Fund’s (the “Fund”) Class N shares returned 11.16%, while its benchmark, the MSCI World Small Cap Index, returned 15.96%. We close the books on 2020, a year where the most important statistic may have been COVID-19’s global death toll of 1.8 million people. Somewhat surprising this year, in the face of that casualty rate and widespread shutdowns, was the resilience of the global equity markets that looked past the social and economic damage taking place in 2020. Markets instead focused on the potential halcyon days awaiting us in 2021. Global volatility levels spiked in March to peaks not seen since the 2008 Global Financial Crisis, though quickly receded to moderate levels. Economic activities worldwide quickly fell to record low contraction levels in April; though by summer they returned to economic expansion territory with staggered reopenings of businesses, ending the year slightly higher than they began it. Central banks assisted with significant monetary stimulus—or quantitative easing to the nth degree—which led most governments’ responses as levels of fiscal support varied. Results from the much-anticipated US election received a positive reception from markets on expectations of a return to more traditional foreign policy. Also incrementally positive was that after drawn out negotiations, the United Kingdom and European Union finally agreed to a Brexit deal. The announcements of multiple COVID-19 vaccines provided some light at the end of the tunnel for 2020. Investors welcomed the news and looked to areas that had been hit the hardest and are set to benefit from a recovery in global trade and travel. Amidst this backdrop, value stocks rallied in the fourth quarter and outperformed growth stocks, though growth stocks remained well ahead for the full year. Fund Performance Attribution The Fund underperformed the MSCI World Small Cap Index in the year of 2020. The Fund benefited from relative strength in Japan, which was offset by relative weakness in other regions. Regional Performance: Europe The Fund experienced relative weakness in Europe. Strong performance in Italy and the United Kingdom was countered by holdings in Belgium and Denmark. In the United Kingdom, Keywords Studios PLC is a provider of outsourced creative and technical services to the video game industry. Shares leaped | 97% as strong results were delivered across its service lines throughout the year. Management expected increased game play during the pandemic to generate pressure on clients to increase the cadence of content development over coming years. The company upgraded its guidance and expects strong demand for its services. It continues to make acquisitions to strengthen its offering and resources. Less positive was the 23% loss from Melrose Industries PLC, an industrial holding company that focuses on acquiring fundamentally good, but mismanaged assets in structurally growing industries. After seeing a significant deterioration in its end markets as a result of COVID-19 earlier in the year, Melrose recovered some ground in the fourth quarter on back of the company’s update where fundamentals proved to be better than feared. Their Autos business is expected to see a continual sales recovery into 2021 while its Heating, Ventilation, and Air Conditioning business, Nortek, has also maintained strong momentum. In neighboring France, the share price of Teleperformance, global leader in call center outsourcing, improved by 37%. The company benefited from a solid financial structure and was able to minimize the negative effects even during the toughest period of COVID-19. It also stands to benefit from structural tailwinds arising from the shift to more online channels. As its market capitalization approaches the strategy’s limit, we have started trimming our position. Also faring well was FinecoBank Banca Fineco S.P.A., an online financial services firm with one of the Italy’s largest financial advisory networks. The company saw robust inflows into its managed products and strong momentum in its brokerage business. The outflows from bank deposits also confirmed that the bank’s focus on rotating client deposits to managed products has started to bear fruit. Leveraging its advantageous industry position, the company benefitted from the industry’s structural digital migration. Shares of FinecoBank finished the year with a 36% gain. On the negative side, Belgium’s Barco N.V. is a provider of visualization solutions to the entertainment, enterprise, and healthcare industries. The company’s cinema projector business was under pressure due to the pandemic. In navigating the environment, the company is managing costs and redeploying resources to higher growth areas such as healthcare. We trimmed our position over the uncertainty. Shares of Barco traded down 37% during the year. In Spain, Prosegur Compania de | Seguridad provides security services in Europe and Latin America. COVID-19 restrictions eroded their activity levels and led shares down 25%. Prosegur maintained a strong cash position and expects business to recover as the situation eases. Regional Performance: The Americas The Fund’s performance was mixed in the region, home to some of the Fund’s largest contributors and detractors. The pandemic had substantial impact to various industries and led us to exit some of our positions. With the significant reduction in air travel around the world, aircraft leasing company AerCap lost 50% for the period it was held during the year. In the second quarter we liquidated our position in J2 Global, a provider of internet and cloud services for small to medium-size businesses and small office/home office organizations. COVID-19 put a pause on the company’s merger and acquisition growth initiatives and pressured its digital media advertising revenue in the near term. J2 Global slid 30% while it was held in the Fund in 2020. Meanwhile, shares of commercial property management service provider, Cushman & Wakefield, sold off by (43)% before we exited in the third quarter due to concerns over the commercial real estate services industry. On the positive side, the Fund’s largest contributor was early-stage contract research company, Charles River Laboratories International, Inc. with its 64% gain. Management noted record bookings in its Discovery and Safety Assessment business with large pharmaceutical companies outsourcing more projects as internal labs were shut down amid the pandemic. As academic labs around the world re-opened later in the year, its Research Models business recovered faster than expected. Enterprise software solutions and services provider NICE, Ltd. ascended 83%. The company saw acceleration in its Contact Center as a Service (CCaaS) segment with robust revenue growth. With the relatively low penetration rate of cloud adoption in the contact center space, we believe there is a long runway for NICE as the leading CCaaS vendor. Regional Performance: Japan Japan was home to strong relative performance for the Fund in 2020. Discount supermarket operator Kobe Bussan Co., Ltd. jumped 79% during the year. The company benefitted from COVID-19 stimulated household demand earlier in the year. Even with normalization following the pandemic-driven |
| | |
| | AMG TimesSquare Global Small Cap Fund |
| | Portfolio Manager’s Comments (continued) |
demand, it continued to be a winner within a deflationary economy. Shares of Japan’s leading conveyor belt sushi restaurants, Sushiro Global Holding, Ltd., rose by 78%. The company benefited from higher take-out and delivery sales, a recovery in dine-in sales, and acceleration in its overseas build-out in Taiwan, Singapore, and Korea. Meanwhile, performance was hurt by weakness in select cyclical names. en-japan, Inc., a provider of internet job recruitment and consultation services, lowered full year guidance which was coupled with a slowing economy and this resulted in a (29)% sell-off. We increased our position on price weakness as en-japan’s fundamentals remain solid, and the gradual reopening of the economy should foster earnings recovery. Regional Performance: Developed Asia Pacific Ex- Japan The Fund’s Australian financial services holdings in Asia/Pacific Ex-Japan faced some challenges. Notable with its 53% decline while in the Fund was Challenger, Ltd. which offers annuities and other | fixed income products to the underpenetrated Australian market. Regulatory and structural changes in the financial advice industry weighed on Challenger’s local annuity sales. Declining interest rates also negatively impacted profitability and the company’s investment returns. Regional Performance: Emerging Markets The Fund’s small but overweight position in Emerging Markets had a negative impact on performance. Brazil’s leading dental benefits provider Odontoprev, S.A. faced headwinds from COVID-19. Concerns surrounding postponed elective procedures, higher delinquency, contract cancellations, and future unemployment led its shares 48% lower for the time it was held in the Fund during the year. Conclusion Turning the page to 2021 allows us to look forward optimistically but does not extinguish the concerns that plagued 2020. The start of the new year marked the end of the Brexit transition for the U.K. from the | European Union; so, beginning later this month all the new agreements will go into effect for trade, travel, and other aspects. While distribution began for COVID-19 vaccines, case rates continued to climb and the coronavirus showed signs of mutating. Although we have not yet returned to our New York City office, all of us at TimesSquare Capital Management, LLC continue working collectively to steward your investments. We hope that 2021 will be brighter for all of us, though from an investment perspective we remain vigilant. As always, we are available for any questions you might have as we endeavor to protect and grow the assets you have entrusted with us. This commentary reflects the viewpoints of TimesSquare Capital Management, LLC, and is not intended as a forecast or guarantee of future results. |
| | |
| | AMG TimesSquare Global Small Cap Fund |
| | Portfolio Manager’s Comments (continued) |
CUMULATIVE TOTAL RETURN PERFORMANCE
AMG TimesSquare Global Small Cap Fund’s cumulative total return is based on the daily change in net asset value (NAV), and assumes that all dividends and distributions were reinvested. This graph compares a hypothetical $10,000 investment made in the AMG TimesSquare Global Small Cap Fund’s Class N shares on May 30, 2018 (inception date), to a $10,000 investment made in the MSCI World Small Cap Index for the same time period. The graph and table do not reflect the deduction of taxes that a shareholder would pay on a Fund distribution or redemption of shares. The listed returns for the Fund are net of expenses and the returns for the index exclude expenses. Total returns would have been lower had certain expenses not been reduced.

The table below shows the average annual total returns for the AMG TimesSquare Global Small Cap Fund and the MSCI World Small Cap Index for the same time periods ended December 31, 2020.
| Average Annual Total Returns1 | One
Year | Since
Inception | Inception
Date |
| AMG TimesSquare Global Small Cap Fund2, 3, 4, 5, 6, 7, 8, 9, 10 | |
| Class N | 11.16% | 7.85% | 05/30/18 |
| Class I | 11.43% | 8.11% | 05/30/18 |
| Class Z | 11.33% | 8.11% | 05/30/18 |
| MSCI World Small Cap Index11 | 15.96% | 8.00% | 05/30/18† |
The performance data shown represents past performance. Past performance is not a guarantee of future results. Current performance may be lower or higher than the performance data quoted. The investment return and principal value of an investment will fluctuate so that an investor’s shares, when redeemed, may be worth more or less than their original cost.
Investors should carefully consider the Fund’s investment objectives, risks, charges and expenses before investing. For performance information through the most recent month end, current net asset values per share for the Fund and other information, please call 800.548.4539 or visit our website at amgfunds.com for a free prospectus. Read it carefully before investing or sending money.
Distributed by AMG Distributors, Inc., member FINRA/SIPC.
| † | Date reflects inception date of the Fund, not the index. |
| 1 | Total return equals income yield plus share price change and assumes reinvestment of all dividends and |
capital gain distributions. Returns are net of fees and may reflect offsets of Fund expenses as described in the prospectus. No adjustment has been made for taxes payable by shareholders on their reinvested dividends and capital gain distributions. Returns for periods greater than one year are annualized. The listed returns on the Fund are net of expenses and based on the published NAV as of December 31, 2020. All returns are in U.S. dollars ($).
| 2 | From time to time, the Fund’s investment manager has waived its fees and/or absorbed Fund expenses, which has resulted in higher returns. |
| 3 | Investments in international securities are subject to certain risks of overseas investing including currency fluctuations and changes in political and economic conditions, which could result in significant market fluctuations. These risks are magnified in emerging markets. |
| 4 | The Fund is subject to the risks associated with investments in emerging markets, such as erratic earnings patterns, economic and political instability, changing exchange controls, limitations on repatriation of foreign capital and changes in local governmental attitudes toward private investment, possibly leading to nationalization or confiscation of investor assets. |
| 5 | The Fund is subject to risks associated with investments in small-capitalization companies, such as erratic earnings patterns, competitive conditions, limited earnings history and a reliance on one or a limited number of products. |
| 6 | The Fund is subject to currency risk resulting from fluctuations in exchange rates that may affect the total loss or gain on a non-U.S. Dollar investment when converted back to U.S. Dollars. |
| 7 | The Fund may invest in derivatives such as options and futures; the complexity and rapidly changing structure of derivatives markets may increase the possibility of market losses. |
| 8 | The Fund invests in growth stocks, which may be more sensitive to market movements because their prices tend to reflect future investor expectations rather than just current profits. Growth stocks may underperform value stocks during given periods. |
| 9 | Market prices of investments held by the Fund may fall rapidly or unpredictably due to a variety of economic or political factors, market conditions, disasters or public health issues, or in response to events that affect particular industries or companies. |
| 10 | Companies that are in similar businesses may be similarly affected by particular economic or market events; to the extent the Fund has substantial holdings within a particular sector, the risks associated with that sector increase. |
| 11 | The MSCI World Small Cap Index (the “Index”) captures small cap representation across 23 Developed Markets countries. With over 4,000 constituents, the Index covers approximately 14% of the free float-adjusted market capitalization in each |
| | |
| | AMG TimesSquare Global Small Cap Fund |
| | Portfolio Manager’s Comments (continued) |
| country. Please go to msci.com for most current list of countries represented by the Index. Unlike the Fund, the MSCI World Small Cap Index is unmanaged, is not available for investment, and does not incur expenses. | All MSCI data is provided ‘as is.’ The products described herein are not sponsored or endorsed and have not been reviewed or passed on by MSCI. In no event shall MSCI, its affiliates or any MSCI data provider have any liability of any kind in connection with the MSCI data or the products described herein. | Copying or redistributing the MSCI data is strictly prohibited. Not FDIC insured, nor bank guaranteed. May lose value. |
| | AMG TimesSquare Global Small Cap Fund |
| | Fund Snapshots (unaudited) |
| | December 31, 2020 |
PORTFOLIO BREAKDOWN
| Sector | | % of
Net Assets | |
| Industrials | | | 21.6 | |
| Information Technology | | | 20.8 | |
| Financials | | | 14.1 | |
| Health Care | | | 11.7 | |
| Consumer Discretionary | | | 11.3 | |
| Communication Services | | | 6.5 | |
| Consumer Staples | | | 4.3 | |
| Real Estate | | | 3.3 | |
| Materials | | | 1.9 | |
| Utilities | | | 1.2 | |
| Energy | | | 0.9 | |
| Short-Term Investments | | | 4.3 | |
| Other Assets Less Liabilities | | | (1.9) | |
TOP TEN HOLDINGS
| Security Name | | % of
Net Assets | |
| Charles River Laboratories International, Inc. | | | 2.7 | |
| TransUnion | | | 2.6 | |
| St James’s Place PLC (United Kingdom) | | | 2.4 | |
| Teleperformance (France) | | | 2.2 | |
| RenaissanceRe Holdings, Ltd. (Bermuda) | | | 2.2 | |
| Pan Pacific International Holdings Corp. (Japan) | | | 2.1 | |
| Zynga, Inc., Class A | | | 2.1 | |
| Encompass Health Corp. | | | 2.0 | |
| Nice, Ltd., Sponsored ADR (Israel) | | | 1.9 | |
| Sushiro Global Holdings, Ltd. (Japan) | | | 1.8 | |
| Top Ten as a Group | | | 22.0 | |
Because a fund’s strategy may result in multiple investments in particular sectors of the economy, its performance may depend on the performance of those sectors and may fluctuate more widely than investments diversified across more sectors. For additional information on these and other risk considerations, please see the Fund’s prospectus.
Any sectors, industries, or securities discussed should not be perceived as investment recommendations. Mention of a specific security should not be considered a recommendation to buy or solicitation to sell that security. Specific securities mentioned in this report may have been sold from the Fund’s portfolio of investments by the time you receive this report.
| | AMG TimesSquare Global Small Cap Fund Schedule of Portfolio Investments December 31, 2020 |
| | Shares | | Value | | | Shares | | Value | |
| Common Stocks - 97.6% | | | | |
| Communication Services - 6.5% | | | | |
| Auto Trader Group PLC (United Kingdom)1 | 2,300 | | $18,721 | |
| giftee, Inc. (Japan)*,2 | 400 | | 13,017 | |
| HUYA, Inc., ADR (China)*,2 | 700 | | 13,951 | |
| Kakaku.com, Inc. (Japan) | 500 | | 13,687 | |
| Karnov Group AB (Sweden) | 1,000 | | 7,232 | |
| Nordic Entertainment Group AB, Class B (Sweden)* | 600 | | 33,443 | |
| Zynga, Inc., Class A (United States)* | 4,900 | | 48,363 | |
| Total Communication Services | | | 148,414 | |
| Consumer Discretionary - 11.3% | | | | |
| Afya, Ltd., Class A (Brazil)* | 300 | | 7,590 | |
| Brunswick Corp. (United States) | 400 | | 30,496 | |
| Callaway Golf Co. (United States) | 900 | | 21,609 | |
| CIE Automotive, S.A. (Spain) | 500 | | 13,471 | |
| Dalata Hotel Group PLC (Ireland)* | 2,000 | | 9,248 | |
| Floor & Decor Holdings, Inc., Class A (United States)* | 200 | | 18,570 | |
| Hilton Grand Vacations, Inc. (United States)* | 600 | | 18,810 | |
| momo.com, Inc. (Taiwan) | 500 | | 11,346 | |
| National Vision Holdings, Inc. (United States)*,2 | 800 | | 36,232 | |
| Pan Pacific International Holdings Corp. (Japan) | 2,100 | | 48,518 | |
| Sushiro Global Holdings, Ltd. (Japan) | 1,100 | | 42,198 | |
| Total Consumer Discretionary | | | 258,088 | |
| Consumer Staples - 4.3% | | | | |
| Kobe Bussan Co., Ltd. (Japan) | 1,000 | | 30,725 | |
| Performance Food Group Co. (United States)* | 500 | | 23,805 | |
| Pola Orbis Holdings, Inc. (Japan) | 500 | | 10,153 | |
| Sugi Holdings Co., Ltd. (Japan) | 150 | | 10,020 | |
| Viscofan, S.A. (Spain) | 100 | | 7,092 | |
| Zur Rose Group AG (Switzerland)* | 50 | | 16,044 | |
| Total Consumer Staples | | | 97,839 | |
| Energy - 0.9% | | | | |
| Gaztransport Et Technigaz, S.A. (France) | 100 | | 9,688 | |
| Koninklijke Vopak, N.V. (Netherlands) | 200 | | 10,504 | |
| Total Energy | | | 20,192 | |
| Financials - 14.1% | | | | |
| Aruhi Corp. (Japan) | 300 | | 5,271 | |
| Conduit Holdings, Ltd. (Bermuda)* | 1,600 | | 11,015 | |
| doValue S.P.A. (Italy)*,1 | 700 | | 8,252 | |
| Evercore, Inc., Class A (United States) | 350 | | 38,374 | |
| FinecoBank Banca Fineco S.P.A. (Italy)* | 2,300 | | 37,932 | |
| Lancashire Holdings, Ltd. (United Kingdom) | 1,400 | | 13,886 | |
| Nordnet AB publ (Sweden)* | 900 | | $14,122 | |
| RenaissanceRe Holdings, Ltd. (Bermuda) | 300 | | 49,746 | |
| Signature Bank (United States) | 200 | | 27,058 | |
| St James’s Place PLC (United Kingdom) | 3,600 | | 55,707 | |
| Steadfast Group, Ltd. (Australia) | 9,300 | | 28,617 | |
| Topdanmark AS (Denmark) | 300 | | 13,022 | |
| Zenkoku Hosho Co., Ltd. (Japan) | 400 | | 18,323 | |
| Total Financials | | | 321,325 | |
| Health Care - 11.7% | | | | |
| Amplifon S.P.A. (Italy)* | 500 | | 20,783 | |
| Ascom Holding AG (Switzerland)* | 200 | | 2,980 | |
| Charles River Laboratories International, Inc. (United States)* | 250 | | 62,465 | |
| Chemed Corp. (United States) | 50 | | 26,631 | |
| Encompass Health Corp. (United States) | 550 | | 45,480 | |
| Mani, Inc. (Japan) | 600 | | 16,367 | |
| MedPeer, Inc. (Japan)* | 200 | | 15,851 | |
| Nippon Shinyaku Co., Ltd. (Japan) | 400 | | 26,256 | |
| Notre Dame Intermedica Participacoes, S.A. (Brazil) | 500 | | 7,541 | |
| Orpea SA (France)* | 200 | | 26,226 | |
| UDG Healthcare PLC (Ireland) | 1,600 | | 17,078 | |
| Total Health Care | | | 267,658 | |
| Industrials - 21.6% | | | | |
| A-Living Smart City Services Co., Ltd. (China)1 | 3,200 | | 14,204 | |
| The AZEK Co., Inc. (United States)* | 600 | | 23,070 | |
| Befesa, S.A. (Luxembourg)1 | 300 | | 18,922 | |
| Boa Vista Servicos, S.A. (Brazil) | 3,000 | | 7,306 | |
| Clean Harbors, Inc. (United States)* | 350 | | 26,635 | |
| Electrocomponents PLC (United Kingdom) | 3,000 | | 35,671 | |
| EMCOR Group, Inc. (United States) | 200 | | 18,292 | |
| en-japan, Inc. (Japan) | 550 | | 16,522 | |
| Harmonic Drive Systems, Inc. (Japan) | 200 | | 17,897 | |
| Howden Joinery Group PLC (United Kingdom)* | 1,900 | | 17,899 | |
| Interpump Group S.P.A. (Italy) | 300 | | 14,851 | |
| Intrum AB (Sweden) | 400 | | 10,430 | |
| IPH, Ltd. (Australia) | 2,800 | | 13,866 | |
| ITT, Inc. (United States) | 300 | | 23,106 | |
| KION Group AG (Germany) | 166 | | 14,396 | |
| Melrose Industries PLC (United Kingdom)* | 10,000 | | 24,364 | |
| Polypipe Group PLC (United Kingdom)* | 1,900 | | 15,514 | |
| Prosegur Cia de Seguridad, S.A. (Spain) | 6,200 | | 18,601 | |
| Rexnord Corp. (United States) | 600 | | 23,694 | |
The accompanying notes are an integral part of these financial statements.
| | AMG TimesSquare Global Small Cap Fund Schedule of Portfolio Investments (continued) |
| | |
| | Shares | | Value | | | Shares | | Value | |
| Industrials - 21.6% (continued) | | | | |
| Stabilus, S.A. (Luxembourg) | 100 | | $7,069 | |
| Teleperformance (France) | 150 | | 49,797 | |
| TransUnion (United States) | 600 | | 59,532 | |
| WillScot Mobile Mini Holdings Corp. (United States)* | 1,000 | | 23,170 | |
| Total Industrials | | | 494,808 | |
| Information Technology - 20.8% | | | | |
| Accton Technology Corp. (Taiwan) | 1,400 | | 15,785 | |
| Barco, N.V. (Belgium) | 500 | | 10,877 | |
| Booz Allen Hamilton Holding Corp. (United States) | 350 | | 30,513 | |
| Chinasoft International, Ltd. (China) | 11,500 | | 12,853 | |
| Disco Corp. (Japan) | 50 | | 16,852 | |
| Douzone Bizon Co., Ltd. (South Korea) | 100 | | 9,581 | |
| Elecom Co., Ltd. (Japan) | 300 | | 15,492 | |
| Gartner, Inc. (United States)* | 200 | | 32,038 | |
| Inphi Corp. (United States)* | 100 | | 16,047 | |
| Jack Henry & Associates, Inc. (United States) | 200 | | 32,398 | |
| Keywords Studios PLC (Ireland)* | 800 | | 31,240 | |
| Link Administration Holdings, Ltd. (Australia) | 3,300 | | 14,098 | |
| LINK Mobility Group Holding A.S.A. (Norway)* | 1,800 | | 9,753 | |
| Littelfuse, Inc. (United States) | 150 | | 38,199 | |
| MKS Instruments, Inc. (United States) | 150 | | 22,567 | |
| Monolithic Power Systems, Inc. (United States) | 50 | | 18,311 | |
| Nemetschek SE (Germany) | 100 | | 7,432 | |
| Nice, Ltd., Sponsored ADR (Israel)* | 150 | | 42,531 | |
| Plaid, Inc. (Japan)* | 100 | | 3,598 | |
| Pushpay Holdings, Ltd. (New Zealand)* | 6,500 | | 8,486 | |
| SimCorp A/S (Denmark) | 100 | | 14,868 | |
| Solutions 30 SE (Luxembourg)*,2 | 600 | | 7,720 | |
| Systena Corp. (Japan) | 700 | | 14,698 | |
| Tri Chemical Laboratories, Inc. (Japan) | 100 | | 16,174 | |
| WEX, Inc. (United States)* | 110 | | 22,388 | |
| * | Non-income producing security. |
| 1 | Security exempt from registration under Rule 144A of the Securities Act of 1933. This security may be resold in transactions exempt from registration, normally to qualified institutional buyers. At December 31, 2020, the value of these securities amounted to $67,191 or 2.9% of net assets. |
| 2 | Some of these securities, amounting to $98,427 or 4.3% of net assets, were out on loan to various borrowers and are collateralized by cash and various U.S. Treasury Obligations. See Note 4 of Notes to Financial Statements. |
| Yeahka, Ltd. (China)*,2 | 2,300 | | $11,175 | |
| Total Information Technology | | | 475,674 | |
| Materials - 1.9% | | | | |
| RPM International, Inc. (United States) | 400 | | 36,312 | |
| Verallia, S.A. (France)1 | 200 | | 7,092 | |
| Total Materials | | | 43,404 | |
| Real Estate - 3.3% | | | | |
| Katitas Co., Ltd. (Japan) | 700 | | 22,587 | |
| Kennedy-Wilson Holdings, Inc. (United States)2 | 1,800 | | 32,202 | |
| Real Matters, Inc. (Canada)* | 600 | | 9,055 | |
| Safestore Holdings PLC, REIT (United Kingdom) | 1,000 | | 10,688 | |
| Total Real Estate | | | 74,532 | |
| Utilities - 1.2% | | | | |
| Rubis SCA (France) | 600 | | 27,737 | |
| Total Common Stocks | | | | |
| (Cost $1,667,056) | | | 2,229,671 | |
| | | | | |
| | Principal | | | |
| | Amount | | | |
| Short-Term Investments - 4.3% | | | | |
| Joint Repurchase Agreements - 1.0%3 | | | | |
| Bank of America Securities, Inc., dated 12/31/20, due 01/04/21, 0.080% total to be received $21,863 (collateralized by various U.S. Government Agency Obligations, 1.500% - 3.500%, 02/01/48 - 01/01/51, totaling $22,300) | $21,863 | | 21,863 | |
| | Shares | | | |
| Other Investment Companies - 3.3% | | | | |
| Dreyfus Institutional Preferred Government Money Market Fund, Institutional Shares, 0.03%4 | 76,702 | | 76,702 | |
| Total Short-Term Investments | | | | |
| (Cost $98,565) | | | 98,565 | |
| Total Investments - 101.9% | | | | |
| (Cost $1,765,621) | | | 2,328,236 | |
| Other Assets, less Liabilities - (1.9)% | | | (43,025 | ) |
| Net Assets - 100.0% | | | $2,285,211 | |
| 3 | Cash collateral received for securities lending activity was invested in these joint repurchase agreements. |
| 4 | Yield shown represents the December 31, 2020, seven day average yield, which refers to the sum of the previous seven days’ dividends paid, expressed as an annual percentage. |
ADR American Depositary Receipt
REIT Real Estate Investment Trust
The accompanying notes are an integral part of these financial statements.
| | AMG TimesSquare Global Small Cap Fund Schedule of Portfolio Investments (continued) | |
| | | |
The following table summarizes the inputs used to value the Fund’s investments by the fair value hierarchy levels as of December 31, 2020:
| | Level 1 | | Level 21 | | Level 3 | | Total |
| Investments in Securities | | | | | | | |
| Common Stocks | | | | | | | |
| Industrials | $204,805 | | $290,003 | | — | | $494,808 |
| Information Technology | 268,343 | | 207,331 | | — | | 475,674 |
| Financials | 148,567 | | 172,758 | | — | | 321,325 |
| Health Care | 142,117 | | 125,541 | | — | | 267,658 |
| Consumer Discretionary | 142,555 | | 115,533 | | — | | 258,088 |
| Communication Services | 102,989 | | 45,425 | | — | | 148,414 |
| Consumer Staples | 30,897 | | 66,942 | | — | | 97,839 |
| Real Estate | 41,257 | | 33,275 | | — | | 74,532 |
| Materials | 36,312 | | 7,092 | | — | | 43,404 |
| Utilities | — | | 27,737 | | — | | 27,737 |
| Energy | 10,504 | | 9,688 | | — | | 20,192 |
| Short-Term Investments | | | | | | | |
| Joint Repurchase Agreements | — | | 21,863 | | — | | 21,863 |
| Other Investment Companies | 76,702 | | — | | — | | 76,702 |
| Total Investment in Securities | $1,205,048 | | $1,123,188 | | — | | $2,328,236 |
| 1 | An external pricing service is used to reflect any impact on security value due to market movements between the time the Fund valued such foreign securities and the earlier closing of foreign markets. |
For the fiscal year ended December 31, 2020, there were no transfers in or out of Level 3.
The country allocation in the Schedule of Portfolio Investments at December 31, 2020, was as follows:
| Country | % of Long-Term Investments |
| Australia | 2.5 |
| Belgium | 0.5 |
| Bermuda | 2.7 |
| Brazil | 1.0 |
| Canada | 0.4 |
| China | 2.3 |
| Denmark | 1.3 |
| France | 5.4 |
| Germany | 1.0 |
| Ireland | 2.6 |
| Israel | 1.9 |
| Italy | 3.7 |
| Japan | 16.8 |
| Country | % of Long-Term Investments |
| Luxembourg | 1.5 |
| Netherlands | 0.5 |
| New Zealand | 0.4 |
| Norway | 0.4 |
| South Korea | 0.4 |
| Spain | 1.8 |
| Sweden | 2.9 |
| Switzerland | 0.9 |
| Taiwan | 1.2 |
| United Kingdom | 8.6 |
| United States | 39.3 |
| | 100.0 |
The accompanying notes are an integral part of these financial statements.
| | Statement of Assets and Liabilities December 31, 2020 | |
| | | |
| | | AMG
TimesSquare
Small Cap
Growth Fund | | | AMG
TimesSquare
Mid Cap
Growth Fund | | | AMG
TimesSquare
International Small
Cap Fund | | | AMG
TimesSquare
Emerging
Markets Small
Cap Fund | | | AMG
TimesSquare
Global Small
Cap Fund | |
| Assets: | | | | | | | | | | |
| Investments at value1 (including securities on loan valued at $62,717,606, $88,886,890, $46,177,802, $180,957, and $98,427, respectively) | | $466,058,796 | | | $2,038,362,957 | | | $1,104,806,357 | | | $7,355,724 | | | $2,328,236 | |
| Foreign currency2 | | — | | | — | | | 4,331,945 | | | 26,094 | | | 12,858 | |
| Receivable for investments sold | | 2,108,301 | 3 | | 16,917,426 | | | 687,430 | | | 125,706 | | | — | |
| Dividend and interest receivables | | 168,496 | | | 517,573 | | | 878,034 | | | 9,343 | | | 1,240 | |
| Securities lending income receivable | | 47,610 | | | 52,203 | | | 126,880 | | | 704 | | | 126 | |
| Receivable for Fund shares sold | | 297,108 | | | 907,109 | | | 1,346,400 | | | — | | | — | |
| Receivable from affiliate | | — | | | — | | | — | | | 17,994 | | | 6,027 | |
| Prepaid expenses and other assets | | 11,979 | | | 14,929 | | | 30,196 | | | 2,831 | | | 2,349 | |
| Total assets | | 468,692,290 | | | 2,056,772,197 | | | 1,112,207,242 | | | 7,538,396 | | | 2,350,836 | |
| Liabilities: | | | | | | | | | | | | | | | |
| Payable upon return of securities loaned | | 22,705,986 | | | 11,419,353 | | | 32,882,584 | | | 135,724 | | | 21,863 | |
| Payable for investments purchased | | 94,273 | | | 5,180,153 | | | 3,168,081 | | | 30,818 | | | 4,240 | |
| Payable for Fund shares repurchased | | 86,830 | | | 987,902 | | | 2,190,981 | | | — | | | — | |
| Payable for foreign capital gains tax | | — | | | — | | | — | | | 28,953 | | | — | |
| Due to custodian | | — | | | — | | | — | | | 82,765 | | | — | |
| Accrued expenses: | | | | | | | | | | | | | | | |
| Investment advisory and management fees | | 312,048 | | | 1,347,565 | | | 656,845 | | | 5,610 | | | 1,312 | |
| Administrative fees | | 55,303 | | | 255,867 | | | 131,369 | | | 886 | | | 281 | |
| Distribution fees | | — | | | — | | | — | | | 9 | | | 13 | |
| Shareholder service fees | | 18,738 | | | 125,557 | | | 112,633 | | | 5 | | | — | |
| Other | | 83,118 | | | 226,074 | | | 197,655 | | | 48,589 | | | 37,916 | |
| Total liabilities | | 23,356,296 | | | 19,542,471 | | | 39,340,148 | | | 333,359 | | | 65,625 | |
| | | | | | | | | | | | | | | | |
| Net Assets | | $445,335,994 | | | $2,037,229,726 | | | $1,072,867,094 | | | $7,205,037 | | | $2,285,211 | |
| 1 Investments at cost | | $323,653,568 | | | $1,208,182,736 | | | $821,655,671 | | | $5,836,504 | | | $1,765,621 | |
| 2 Foreign currency at cost | | — | | | — | | | $4,289,031 | | | $26,153 | | | $12,750 | |
| 3 $1,756,930 of this receivable is due from an affiliate. See Note 2 of the Notes to Financial Statements. | | | | | | | |
The accompanying notes are an integral part of these financial statements.
| | | |
| | Statement of Assets and Liabilities (continued) | |
| | | |
| | | AMG TimesSquare Small Cap Growth Fund | | | AMG TimesSquare Mid Cap Growth Fund | | | AMG TimesSquare International Small Cap Fund | | | AMG TimesSquare Emerging Markets Small Cap Fund | | | AMG TimesSquare Global Small Cap Fund | |
| Net Assets Represent: | | | | | | | | | | | | | | | |
| Paid-in capital | | $284,931,237 | | | $1,144,190,107 | | | $994,408,253 | | | $5,433,011 | | | $1,898,277 | |
| Total distributable earnings | | 160,404,757 | | | 893,039,619 | | | 78,458,841 | | | 1,772,026 | | | 386,934 | |
| Net Assets | | $445,335,994 | | | $2,037,229,726 | | | $1,072,867,094 | | | $7,205,037 | | | $2,285,211 | |
| | | | | | | | | | | | | | | | |
| Class N: | | | | | | | | | | | | | | | |
| Net Assets | | $112,739,881 | | | $613,500,744 | | | $45,388,617 | | | $42,819 | | | $62,515 | |
| Shares outstanding | | 6,851,441 | | | 31,204,245 | | | 2,461,312 | | | 3,135 | | | 5,189 | |
| Net asset value, offering and redemption price per share | | $16.45 | | | $19.66 | | | $18.44 | | | $13.66 | | | $12.05 | |
| Class I: | | | | | | | | | | | | | | | |
| Net Assets | | $12,061,551 | | | $526,800,254 | | | $629,502,443 | | | $395,931 | | | $36,709 | |
| Shares outstanding | | 699,388 | | | 25,602,565 | | | 34,050,194 | | | 28,895 | | | 3,037 | |
| Net asset value, offering and redemption price per share | | $17.25 | | | $20.58 | | | $18.49 | | | $13.70 | | | $12.09 | |
| Class Z: | | | | | | | | | | | | | | | |
| Net Assets | | $320,534,562 | | | $896,928,728 | | | $397,976,034 | | | $6,766,287 | | | $2,185,987 | |
| Shares outstanding | | 18,533,173 | | | 43,436,946 | | | 21,514,444 | | | 493,990 | | | 180,799 | |
| Net asset value, offering and redemption price per share | | $17.30 | | | $20.65 | | | $18.50 | | | $13.70 | | | $12.09 | |
The accompanying notes are an integral part of these financial statements.
| | Statement of Operations For the fiscal year ended December 31, 2020 | |
| | | |
| | | AMG TimesSquare Small Cap Growth Fund | | | AMG TimesSquare Mid Cap Growth Fund | | | AMG TimesSquare International Small Cap Fund | | | AMG TimesSquare Emerging Markets Small Cap Fund | | | AMG TimesSquare Global Small Cap Fund | |
| Investment Income: | | | | | | | | | | | | | | | |
| Dividend income | | $1,183,550 | 1 | | $12,540,5812 | | | $13,421,930 | | | $171,2803 | | | $21,495 | |
| Interest income | | 87 | | | 320 | | | 768 | | | — | | | — | |
| Securities lending income | | 363,871 | | | 204,966 | | | 1,105,290 | | | 1,505 | | | 587 | |
| Foreign withholding tax | | — | | | (42,600 | ) | | (1,306,955 | ) | | (12,399 | ) | | (1,804 | ) |
| Total investment income | | 1,547,508 | | | 12,703,267 | | | 13,221,033 | | | 160,386 | | | 20,278 | |
| Expenses: | | | | | | | | | | | | | | | |
| Investment advisory and management fees | | 3,277,124 | | | 14,443,956 | | | 7,103,944 | | | 52,966 | | | 13,254 | |
| Administrative fees | | 622,239 | | | 2,742,523 | | | 1,420,789 | | | 8,363 | | | 2,840 | |
| Distribution fees - Class N | | — | | | — | | | — | | | 85 | | | 109 | |
| Shareholder servicing fees - Class N | | 187,023 | | | 1,109,808 | | | 122,040 | | | 51 | | | — | |
| Shareholder servicing fees - Class I | | 7,110 | | | 297,012 | | | 530,177 | | | — | | | — | |
| Professional fees | | 58,576 | | | 133,722 | | | 89,470 | | | 42,961 | | | 33,045 | |
| Registration fees | | 52,321 | | | 75,690 | | | 104,157 | | | 24,167 | | | 36,380 | |
| Custodian fees | | 50,485 | | | 143,574 | | | 288,470 | | | 47,428 | | | 28,257 | |
| Trustee fees and expenses | | 34,741 | | | 161,523 | | | 82,425 | | | 493 | | | 168 | |
| Reports to shareholders | | 21,998 | | | 151,918 | | | 104,439 | | | 2,164 | | | 1,338 | |
| Transfer agent fees | | 14,557 | | | 64,149 | | | 49,786 | | | 791 | | | 448 | |
| Miscellaneous | | 21,625 | | | 55,922 | | | 35,008 | | | 2,490 | | | 2,338 | |
| Total expenses before offsets | | 4,347,799 | | | 19,379,797 | | | 9,930,705 | | | 181,959 | | | 118,177 | |
| Expense reimbursements | | (46,456 | ) | | — | | | — | | | (111,885 | ) | | (99,133 | ) |
| Expense reductions | | (118,340 | ) | | (170,862 | ) | | — | | | — | | | — | |
| Net expenses | | 4,183,003 | | | 19,208,935 | | | 9,930,705 | | | 70,074 | | | 19,044 | |
| | | | | | | | | | | | | | | | |
| Net investment income (loss) | | (2,635,495 | ) | | (6,505,668 | ) | | 3,290,328 | | | 90,312 | | | 1,234 | |
| Net Realized and Unrealized Gain: | | | | | | | | | | | | | | | |
| Net realized gain (loss) on investments | | 103,888,9954 | | | 425,100,1204 | | | (36,855,462 | ) | | 639,696 | | | (70,079 | ) |
| Net realized gain (loss) on foreign currency transactions | | — | | | — | | | (1,664,381 | ) | | 6 | | | (147 | ) |
| Net change in unrealized appreciation/depreciation on investments | | 15,244,685 | | | 121,000,209 | | | 143,963,030 | | | 641,071 | | | 283,744 | |
| Net change in unrealized appreciation/depreciation on foreign currency translations | | — | | | — | | | 82,217 | | | (21,277 | ) | | 104 | |
| Net realized and unrealized gain | | 119,133,680 | | | 546,100,329 | | | 105,525,404 | | | 1,259,496 | | | 213,622 | |
| | | | | | | | | | | | | | | | |
| Net increase in net assets resulting from operations | | $116,498,185 | | | $539,594,661 | | | $108,815,732 | | | $1,349,808 | | | $214,856 | |
| 1 | Includes non-recurring dividends of $150,000. |
| 2 | Includes non-recurring dividends of $1,757,925. |
| 3 | Includes non-recurring dividends of $10,036. |
| 4 | Includes realized gains of $17,655,459 and $48,407,313 for AMG TimesSquare Small Cap Growth Fund and AMG TimesSquare Mid Cap Growth Fund, respectively, relating to redemptions in-kind. See note 1(g) of the Notes to Financial Statements. |
The accompanying notes are an integral part of these financial statements.
| | Statements of Changes in Net Assets For the fiscal years ended December 31, | |
| | | |
| | | AMG
TimesSquare
Small Cap Growth Fund | | AMG
TimesSquare
Mid Cap Growth Fund | | AMG
TimesSquare
International Small Cap Fund |
| | | 2020 | | 2019 | | 2020 | | 2019 | | 2020 | | 2019 |
| Increase in Net Assets Resulting From Operations: | | | | | | | | | | | | | | | | | | |
| Net investment income (loss) | | $(2,635,495 | ) | | $(3,964,668 | ) | | $(6,505,668 | ) | | $(4,756,421 | ) | | $3,290,328 | | | $18,164,665 | |
| Net realized gain (loss) on investments | | 103,888,995 | | | 220,002,674 | | | 425,100,120 | | | 302,007,376 | | | (38,519,843 | ) | | (79,413,283 | ) |
| Net change in unrealized appreciation/depreciation on investments | | 15,244,685 | | | 8,299,000 | | | 121,000,209 | | | 294,070,538 | | | 144,045,247 | | | 350,246,524 | |
| Net increase in net assets resulting from operations | | 116,498,185 | | | 224,337,006 | | | 539,594,661 | | | 591,321,493 | | | 108,815,732 | | | 288,997,906 | |
| Distributions to Shareholders: | | | | | | | | | | | | | | | | | | |
| Class N | | (14,186,731 | ) | | (11,213,171 | ) | | (101,447,820 | ) | | (70,479,715 | ) | | — | | | (1,046,826 | ) |
| Class I | | (1,430,225 | ) | | (1,201,634 | ) | | (82,109,733 | ) | | (63,966,855 | ) | | (174,954 | ) | | (11,052,714 | ) |
| Class Z | | (37,842,742 | ) | | (41,084,469 | ) | | (140,525,298 | ) | | (121,196,702 | ) | | (411,538 | ) | | (7,392,335 | ) |
| Total distributions to shareholders | | (53,459,698 | ) | | (53,499,274 | ) | | (324,082,851 | ) | | (255,643,272 | ) | | (586,492 | ) | | (19,491,875 | ) |
| Capital Share Transactions:1 | | | | | | | | | | | | | | | | | | |
| Net decrease from capital share transactions | | (102,684,467 | ) | | (562,555,053 | ) | | (63,463,055 | ) | | (127,664,618 | ) | | (166,022,077 | ) | | (138,593,303 | ) |
| | | | | | | | | | | | | | | | | | | |
| Total increase (decrease) in net assets | | (39,645,980 | ) | | (391,717,321 | ) | | 152,048,755 | | | 208,013,603 | | | (57,792,837 | ) | | 130,912,728 | |
| Net Assets: | | | | | | | | | | | | | | | | | | |
| Beginning of year | | 484,981,974 | | | 876,699,295 | | | 1,885,180,971 | | | 1,677,167,368 | | | 1,130,659,931 | | | 999,747,203 | |
| End of year | | $445,335,994 | | | $484,981,974 | | | $2,037,229,726 | | | $1,885,180,971 | | | $1,072,867,094 | | | $1,130,659,931 | |
| 1 | See Note 1(g) of the Notes to Financial Statements. |
The accompanying notes are an integral part of these financial statements.
| | Statements of Changes in Net Assets (continued) For the fiscal years ended December 31, | |
| | | |
| | | AMG
TimesSquare
Emerging
Markets Small Cap Fund | | | AMG
TimesSquare
Global Small
Cap Fund | |
| | | 2020 | | | 2019 | | | 2020 | | | 2019 | |
| Increase in Net Assets Resulting From Operations: | | | | | | | | | | | | |
| Net investment income | | $90,312 | | | $40,496 | | | $1,234 | | | $12,734 | |
| Net realized gain (loss) on investments | | 639,702 | | | (266,982 | ) | | (70,226 | ) | | (55,671 | ) |
| Net change in unrealized appreciation/depreciation on investments | | 619,794 | | | 1,134,121 | | | 283,848 | | | 615,930 | |
| Net increase in net assets resulting from operations | | 1,349,808 | | | 907,635 | | | 214,856 | | | 572,993 | |
| Distributions to Shareholders: | | | | | | | | | | | | |
| From net investment income and/or realized gain on investments: | | | | | | | | | | | | |
| Class N | | (4 | ) | | (77 | ) | | — | | | (400 | ) |
| Class I | | (1,290 | ) | | (1,456 | ) | | — | | | (396 | ) |
| Class Z | | (22,085 | ) | | (25,771 | ) | | — | | | (24,398 | ) |
| From paid-in capital: | | | | | | | | | | | | |
| Class N | | — | | | (10 | ) | | — | | | — | |
| Class I | | — | | | (189 | ) | | — | | | — | |
| Class Z | | — | | | (3,339 | ) | | — | | | — | |
| Total distributions to shareholders | | (23,379 | ) | | (30,842 | ) | | — | | | (25,194 | ) |
| Capital Share Transactions:1 | | | | | | | | | | | | |
| Net increase (decrease) from capital share transactions | | 56,507 | | | (872,229 | ) | | (39,132 | ) | | 70,876 | |
| | | | | | | | | | | | | |
| Total increase in net assets | | 1,382,936 | | | 4,564 | | | 175,724 | | | 618,675 | |
| Net Assets: | | | | | | | | | | | | |
| Beginning of year | | 5,822,101 | | | 5,817,537 | | | 2,109,487 | | | 1,490,812 | |
| End of year | | $7,205,037 | | | $5,822,101 | | | $2,285,211 | | | $2,109,487 | |
| 1 | See Note 1(g) of the Notes to Financial Statements. |
The accompanying notes are an integral part of these financial statements.
| | AMG TimesSquare Small Cap Growth Fund Financial Highlights For a share outstanding throughout each fiscal year | |
| | | | | For the fiscal years ended December 31, | | |
| Class N | | 2020 | | | 2019 | | | 2018 | | | 20171 | | | 20162 | |
| Net Asset Value, Beginning of Year | | $13.96 | | | $12.21 | | | $16.90 | | | $15.52 | | | $14.84 | |
| Income (loss) from Investment Operations: | | | | | | | | | | | | | | | |
| Net investment loss3,4 | | (0.11 | )5 | | (0.09 | ) | | (0.10 | ) | | (0.08 | )6 | | (0.06 | )7 |
| Net realized and unrealized gain (loss) on investments | | 4.92 | | | 3.47 | | | (0.70 | ) | | 3.32 | | | 1.28 | |
| Total income (loss) from investment operations | | 4.81 | | | 3.38 | | | (0.80 | ) | | 3.24 | | | 1.22 | |
| Less Distributions to Shareholders from: | | | | | | | | | | | | | | | |
| Net investment income | | — | | | — | | | — | | | — | | | (0.03 | ) |
| Net realized gain on investments | | (2.32 | ) | | (1.63 | ) | | (3.89 | ) | | (1.86 | ) | | (0.51 | ) |
| Total distributions to shareholders | | (2.32 | ) | | (1.63 | ) | | (3.89 | ) | | (1.86 | ) | | (0.54 | ) |
| Net Asset Value, End of Year | | $16.45 | | | $13.96 | | | $12.21 | | | $16.90 | | | $15.52 | |
| Total Return4,8 | | 34.96 | % | | 27.98 | % | | (4.38 | )% | | 20.87 | % | | 8.20 | % |
| Ratio of net expenses to average net assets9 | | 1.16 | % | | 1.17 | % | | 1.09 | % | | 1.23 | % | | 1.23 | % |
| Ratio of gross expenses to average net assets10 | | 1.20 | % | | 1.19 | % | | 1.10 | % | | 1.24 | % | | 1.24 | % |
| Ratio of net investment loss to average net assets4 | | (0.79 | )% | | (0.63 | )% | | (0.55 | )% | | (0.48 | )% | | (0.38 | )% |
| Portfolio turnover | | 71 | % | | 62 | % | | 63 | % | | 58 | % | | 62 | % |
| Net assets end of year (000’s) omitted | | $112,740 | | | $105,862 | | | $99,996 | | | $318,627 | | | $313,713 | |
| | AMG TimesSquare Small Cap Growth Fund Financial Highlights For a share outstanding throughout each fiscal period | |
| | | | | | | | | For the fiscal | |
| | | | | | | | | period ended | |
| | | For the fiscal years ended December 31, | | December 31, | |
| Class I | | 2020 | | | 2019 | | | 2018 | | | 201711 | |
| Net Asset Value, Beginning of Period | | $14.53 | | | $12.64 | | | $17.32 | | | $16.52 | |
| Income (loss) from Investment Operations: | | | | | | | | | | | | |
| Net investment loss3,4 | | (0.10 | )5 | | (0.07 | ) | | (0.09 | ) | | (0.05 | )6 |
| Net realized and unrealized gain (loss) on investments | | 5.14 | | | 3.59 | | | (0.70 | ) | | 2.71 | |
| Total income (loss) from investment operations | | 5.04 | | | 3.52 | | | (0.79 | ) | | 2.66 | |
| Less Distributions to Shareholders from: | | | | | | | | | | | | |
| Net realized gain on investments | | (2.32 | ) | | (1.63 | ) | | (3.89 | ) | | (1.86 | ) |
| Net Asset Value, End of Period | | $17.25 | | | $14.53 | | | $12.64 | | | $17.32 | |
| Total Return4,8 | | 35.19 | % | | 28.13 | % | | (4.21 | )% | | 16.11 | %12 |
| Ratio of net expenses to average net assets13 | | 1.03 | % | | 1.01 | % | | 1.00 | % | | 1.10 | %14 |
| Ratio of gross expenses to average net assets10 | | 1.07 | % | | 1.03 | % | | 1.01 | % | | 1.11 | %14 |
| Ratio of net investment loss to average net assets4 | | (0.66 | )% | | (0.47 | )% | | (0.46 | )% | | (0.35 | )%14 |
| Portfolio turnover | | 71 | % | | 62 | % | | 63 | % | | 58 | % |
| Net assets end of period (000’s) omitted | | $12,062 | | | $11,333 | | | $174,914 | | | $2,065 | |
| | AMG TimesSquare Small Cap Growth Fund Financial Highlights For a share outstanding throughout each fiscal year | |
| | | | | For the fiscal years ended December 31, | | |
| Class Z | | 2020 | | | 2019 | | | 2018 | | | 20171 | | | 20162 | |
| Net Asset Value, Beginning of Year | | $14.55 | | | $12.65 | | | $17.33 | | | $15.84 | | | $15.14 | |
| Income (loss) from Investment Operations: | | | | | | | | | | | | | | | |
| Net investment loss3,4 | | (0.09 | )5 | | (0.07 | ) | | (0.08 | ) | | (0.05 | )6 | | (0.03 | )7 |
| Net realized and unrealized gain (loss) on investments | | 5.16 | | | 3.60 | | | (0.71 | ) | | 3.40 | | | 1.31 | |
| Total income (loss) from investment operations | | 5.07 | | | 3.53 | | | (0.79 | ) | | 3.35 | | | 1.28 | |
| Less Distributions to Shareholders from: | | | | | | | | | | | | | | | |
| Net investment income | | — | | | — | | | — | | | — | | | (0.06 | ) |
| Net realized gain on investments | | (2.32 | ) | | (1.63 | ) | | (3.89 | ) | | (1.86 | ) | | (0.52 | ) |
| Total distributions to shareholders | | (2.32 | ) | | (1.63 | ) | | (3.89 | ) | | (1.86 | ) | | (0.58 | ) |
| Net Asset Value, End of Year | | $17.30 | | | $14.55 | | | $12.65 | | | $17.33 | | | $15.84 | |
| Total Return4,8 | | 35.35 | % | | 28.19 | % | | (4.21 | )% | | 21.14 | % | | 8.45 | % |
| Ratio of net expenses to average net assets9 | | 0.96 | % | | 0.97 | % | | 0.96 | % | | 1.03 | % | | 1.03 | % |
| Ratio of gross expenses to average net assets10 | | 1.00 | % | | 0.99 | % | | 0.97 | % | | 1.04 | % | | 1.04 | % |
| Ratio of net investment loss to average net assets4 | | (0.59 | )% | | (0.43 | )% | | (0.42 | )% | | (0.28 | )% | | (0.20 | )% |
| Portfolio turnover | | 71 | % | | 62 | % | | 63 | % | | 58 | % | | 62 | % |
| Net assets end of year (000’s) omitted | | $320,535 | | | $367,787 | | | $601,789 | | | $866,289 | | | $766,180 | |
| 1 | Effective February 27, 2017, the Class I and Class S were renamed Class Z and Class N, respectively. |
| 2 | Effective October 1, 2016, the Institutional Class and Premier Class were renamed Class I and Class S, respectively. |
| 3 | Per share numbers have been calculated using average shares. |
| 4 | Total returns and net investment loss would have been lower had certain expenses not been offset. |
| 5 | Includes non-recurring dividends. Without these dividends, net investment loss per share would have been $(0.12), $(0.10), and $(0.09) for Class N, Class I and Class Z, respectively. |
| 6 | Includes non-recurring dividends. Without these dividends, net investment loss per share would have been $(0.12), $(0.09), and $(0.09) for Class N, Class I and Class Z, respectively. |
| 7 | Includes non-recurring dividends. Without these dividends, net investment loss per share would have been $(0.08) and $(0.05) for Class N and Class Z, respectively. |
| 8 | The total return is calculated using the published Net Asset Value as of fiscal year end. |
| 9 | Includes reduction from broker recapture amounting to 0.03% for the fiscal year ended December 31, 2020, 0.02% for the fiscal year ended 2019 and 0.01% for each fiscal year ended 2018, 2017 and 2016. |
| 10 | Excludes the impact of expense reimbursement or fee waivers and expense reductions such as brokerage credits, but includes expense repayments and non-reimbursable expenses, if any, such as interest, taxes, and extraordinary expenses. (See Note 1(c) and 2 in the Notes to Financial Statements.) |
| 11 | Commencement of operations was on February 27, 2017. |
| 13 | Includes reduction from broker recapture amounting to 0.03% for the fiscal year ended December 31, 2020, 0.02% for the fiscal year ended 2019, 0.01% for the fiscal year ended 2018 and 0.01% for the fiscal period ended 2017. |
| | AMG TimesSquare Mid Cap Growth Fund Financial Highlights For a share outstanding throughout each fiscal year | |
| | | | | For the fiscal years ended December 31, | | |
| Class N | | 2020 | | | 2019 | | | 2018 | | | 20171 | | | 20162 | |
| Net Asset Value, Beginning of Year | | $17.69 | | | $15.00 | | | $18.40 | | | $17.26 | | | $17.02 | |
| Income (loss) from Investment Operations: | | | | | | | | | | | | | | | |
| Net investment loss3,4 | | (0.09 | )5 | | (0.07 | ) | | (0.08 | ) | | (0.12 | )6 | | (0.06 | )7 |
| Net realized and unrealized gain (loss) on investments | | 5.84 | | | 5.62 | | | (0.78 | ) | | 3.98 | | | 1.31 | |
| Total income (loss) from investment operations | | 5.75 | | | 5.55 | | | (0.86 | ) | | 3.86 | | | 1.25 | |
| Less Distributions to Shareholders from: | | | | | | | | | | | | | | | |
| Net realized gain on investments | | (3.78 | ) | | (2.86 | ) | | (2.54 | ) | | (2.72 | ) | | (1.01 | ) |
| Net Asset Value, End of Year | | $19.66 | | | $17.69 | | | $15.00 | | | $18.40 | | | $17.26 | |
| Total Return4,8 | | 33.03 | % | | 37.15 | % | | (4.55 | )% | | 22.40 | % | | 7.26 | % |
| Ratio of net expenses to average net assets9 | | 1.17 | % | | 1.17 | % | | 1.17 | % | | 1.23 | % | | 1.23 | % |
| Ratio of gross expenses to average net assets10 | | 1.18 | % | | 1.18 | % | | 1.18 | % | | 1.24 | % | | 1.24 | % |
| Ratio of net investment loss to average net assets4 | | (0.48 | )% | | (0.38 | )% | | (0.39 | )% | | (0.66 | )% | | (0.36 | )% |
| Portfolio turnover | | 74 | % | | 65 | % | | 59 | % | | 54 | % | | 47 | % |
| Net assets end of year (000’s) omitted | | $613,501 | | | $518,267 | | | $375,505 | | | $519,337 | | | $815,473 | |
| | AMG TimesSquare Mid Cap Growth Fund Financial Highlights For a share outstanding throughout each fiscal period |
| | | | | | | | | For the fiscal | |
| | | | | | | | | period ended | |
| | | For the fiscal years ended December 31, | | December 31, | |
| Class I | | 2020 | | | 2019 | | | 2018 | | | 201711 | |
| Net Asset Value, Beginning of Period | | $18.35 | | | $15.46 | | | $18.86 | | | $18.73 | |
| Income (loss) from Investment Operations: | | | | | | | | | | | | |
| Net investment loss3,4 | | (0.07 | )5 | | (0.05 | ) | | (0.05 | ) | | (0.09 | )6 |
| Net realized and unrealized gain (loss) on investments | | 6.08 | | | 5.80 | | | (0.81 | ) | | 2.94 | |
| Total income (loss) from investment operations | | 6.01 | | | 5.75 | | | (0.86 | ) | | 2.85 | |
| Less Distributions to Shareholders from: | | | | | | | | | | | | |
| Net realized gain on investments | | (3.78 | ) | | (2.86 | ) | | (2.54 | ) | | (2.72 | ) |
| Net Asset Value, End of Period | | $20.58 | | | $18.35 | | | $15.46 | | | $18.86 | |
| Total Return4,8 | | 33.27 | % | | 37.33 | % | | (4.45 | )% | | 15.24 | %12 |
| Ratio of net expenses to average net assets13 | | 1.04 | % | | 1.07 | % | | 1.02 | % | | 1.08 | %14 |
| Ratio of gross expenses to average net assets10 | | 1.05 | % | | 1.08 | % | | 1.03 | % | | 1.09 | %14 |
| Ratio of net investment loss to average net assets4 | | (0.35 | )% | | (0.28 | )% | | (0.24 | )% | | (0.52 | )%14 |
| Portfolio turnover | | 74 | % | | 65 | % | | 59 | % | | 54 | % |
| Net assets end of period (000’s) omitted | | $526,800 | | | $472,524 | | | $353,282 | | | $397,061 | |
| | AMG TimesSquare Mid Cap Growth Fund Financial Highlights For a share outstanding throughout each fiscal year | |
| | | | | For the fiscal years ended December 31, |
| Class Z | | 2020 | | | 2019 | | | 2018 | | | 20171 | | | 20162 | |
| Net Asset Value, Beginning of Year | | $18.39 | | | $15.48 | | | $18.87 | | | $17.61 | | | $17.33 | |
| Income (loss) from Investment Operations: | | | | | | | | | | | | | | | |
| Net investment loss3,4 | | (0.05 | )5 | | (0.03 | ) | | (0.04 | ) | | (0.09 | )6 | | (0.03 | )7 |
| Net realized and unrealized gain (loss) on investments | | 6.09 | | | 5.80 | | | (0.81 | ) | | 4.07 | | | 1.35 | |
| Total income (loss) from investment operations | | 6.04 | | | 5.77 | | | (0.85 | ) | | 3.98 | | | 1.32 | |
| Less Distributions to Shareholders from: | | | | | | | | | | | | | | | |
| Net investment income | | — | | | — | | | — | | | — | | | (0.01 | ) |
| Net realized gain on investments | | (3.78 | ) | | (2.86 | ) | | (2.54 | ) | | (2.72 | ) | | (1.03 | ) |
| Total distributions to shareholders | | (3.78 | ) | | (2.86 | ) | | (2.54 | ) | | (2.72 | ) | | (1.04 | ) |
| Net Asset Value, End of Year | | $20.65 | | | $18.39 | | | $15.48 | | | $18.87 | | | $17.61 | |
| Total Return4,8 | | 33.36 | % | | 37.41 | % | | (4.39 | )% | | 22.63 | % | | 7.53 | % |
| Ratio of net expenses to average net assets9 | | 0.97 | % | | 0.97 | % | | 0.97 | % | | 1.03 | % | | 1.03 | % |
| Ratio of gross expenses to average net assets10 | | 0.98 | % | | 0.98 | % | | 0.98 | % | | 1.04 | % | | 1.04 | % |
| Ratio of net investment loss to average net assets4 | | (0.28 | )% | | (0.18 | )% | | (0.19 | )% | | (0.46 | )% | | (0.16 | )% |
| Portfolio turnover | | 74 | % | | 65 | % | | 59 | % | | 54 | % | | 47 | % |
| Net assets end of year (000’s) omitted | | $896,929 | | | $894,390 | | | $948,380 | | | $1,171,466 | | | $1,026,198 | |
| 1 | Effective February 27, 2017, the Class I and Class S were renamed Class Z and Class N, respectively. |
| 2 | Effective October 1, 2016, the Institutional Class and Premier Class were renamed Class I and Class S, respectively. |
| 3 | Per share numbers have been calculated using average shares. |
| 4 | Total returns and net investment loss would have been lower had certain expenses not been offset. |
| 5 | Includes non-recurring dividends. Without these dividends, net investment loss per share would have been $(0.11), $(0.08) and $(0.07) for Class N, Class I and Class Z, respectively. |
| 6 | Includes non-recurring dividends. Without these dividends, net investment loss per share would have been $(0.14), $(0.11) and $(0.11) for Class N, Class I and Class Z, respectively. |
| 7 | Includes non-recurring dividends. Without these dividends, net investment loss per share would have been $(0.07) and $(0.04) for Class N and Class Z, respectively. |
| 8 | The total return is calculated using the published Net Asset Value as of fiscal year end. |
| 9 | Includes reduction from broker recapture amounting to 0.01% for each fiscal year ended 2020, 2019, 2018, 2017 and 2016. |
| 10 | Excludes the impact of expense reimbursement or fee waivers and expense reductions such as brokerage credits, but includes expense repayments and non-reimbursable expenses, if any, such as interest, taxes, and extraordinary expenses. (See Note 1(c) and 2 in the Notes to Financial Statements.) |
| 11 | Commencement of operations was on February 27, 2017. |
| 13 | Includes reduction from broker recapture amounting to 0.01% for each fiscal year ended 2020, 2019 and 2018 and 0.01% for the fiscal period ended 2017. |
| | AMG TimesSquare International Small Cap Fund Financial Highlights For a share outstanding throughout each fiscal year |
| | | | | For the fiscal years ended December 31, | | |
| Class N | | 2020 | | | 2019 | | | 2018 | | | 20171 | | | 20162 | |
| Net Asset Value, Beginning of Year | | $16.24 | | | $12.72 | | | $16.99 | | | $12.35 | | | $12.65 | |
| Income (loss) from Investment Operations: | | | | | | | | | | | | | | | |
| Net investment income3,4 | | 0.02 | | | 0.215 | | | 0.18 | | | 0.086 | | | 0.04 | |
| Net realized and unrealized gain (loss) on investments | | 2.18 | | | 3.55 | | | (4.35 | ) | | 4.69 | | | (0.11 | ) |
| Total income (loss) from investment operations | | 2.20 | | | 3.76 | | | (4.17 | ) | | 4.77 | | | (0.07 | ) |
| Less Distributions to Shareholders from: | | | | | | | | | | | | | | | |
| Net investment income | | — | | | (0.24 | ) | | (0.10 | ) | | (0.06 | ) | | (0.07 | ) |
| Net realized gain on investments | | — | | | — | | | — | | | (0.07 | ) | | (0.16 | ) |
| Total distributions to shareholders | | — | | | (0.24 | ) | | (0.10 | ) | | (0.13 | ) | | (0.23 | ) |
| Net Asset Value, End of Year | | $18.44 | | | $16.24 | | | $12.72 | | | $16.99 | | | $12.35 | |
| Total Return4,7 | | 13.55 | % | | 29.56 | % | | (24.54 | )% | | 38.63 | % | | (0.55 | )% |
| Ratio of net expenses to average net assets | | 1.23 | % | | 1.23 | % | | 1.23 | % | | 1.29 | % | | 1.30 | % |
| Ratio of gross expenses to average net assets8 | | 1.23 | % | | 1.23 | % | | 1.23 | % | | 1.30 | % | | 1.39 | % |
| Ratio of net investment income to average net assets4 | | 0.17 | % | | 1.43 | % | | 1.07 | % | | 0.53 | % | | 0.32 | % |
| Portfolio turnover | | 57 | % | | 40 | % | | 46 | % | | 48 | % | | 58 | % |
| Net assets end of year (000’s) omitted | | $45,389 | | | $70,532 | | | $88,913 | | | $238,935 | | | $28,864 | |
| | AMG TimesSquare International Small Cap Fund Financial Highlights For a share outstanding throughout each fiscal period |
| | | | | | | | | For the fiscal |
| | | | | | | | | period ended |
| | | For the fiscal years ended December 31, | | December 31, |
| Class I | | 2020 | | | 2019 | | | 2018 | | | 20179 |
| Net Asset Value, Beginning of Period | | $16.26 | | | $12.74 | | | $17.08 | | | $13.18 | |
| Income (loss) from Investment Operations: | | | | | | | | | | | | |
| Net investment income3,4 | | 0.05 | | | 0.245 | | | 0.20 | | | 0.116 | |
| Net realized and unrealized gain (loss) on investments | | 2.19 | | | 3.55 | | | (4.37 | ) | | 3.94 | |
| Total income (loss) from investment operations | | 2.24 | | | 3.79 | | | (4.17 | ) | | 4.05 | |
| Less Distributions to Shareholders from: | | | | | | | | | | | | |
| Net investment income | | (0.01 | ) | | (0.27 | ) | | (0.17 | ) | | (0.08 | ) |
| Net realized gain on investments | | — | | | — | | | — | | | (0.07 | ) |
| Total distributions to shareholders | | (0.01 | ) | | (0.27 | ) | | (0.17 | ) | | (0.15 | ) |
| Net Asset Value, End of Period | | $18.49 | | | $16.26 | | | $12.74 | | | $17.08 | |
| Total Return4,7 | | 13.75 | % | | 29.78 | % | | (24.42 | )% | | 30.72 | %10 |
| Ratio of net expenses to average net assets | | 1.08 | % | | 1.06 | % | | 1.06 | % | | 1.09 | %11 |
| Ratio of gross expenses to average net assets8 | | 1.08 | % | | 1.06 | % | | 1.06 | % | | 1.10 | %11 |
| Ratio of net investment income to average net assets4 | | 0.32 | % | | 1.60 | % | | 1.24 | % | | 0.77 | %11 |
| Portfolio turnover | | 57 | % | | 40 | % | | 46 | % | | 48 | % |
| Net assets end of period (000’s) omitted | | $629,502 | | | $658,599 | | | $538,749 | | | $182,528 | |
| | AMG TimesSquare International Small Cap Fund Financial Highlights For a share outstanding throughout each fiscal year |
| | | | | For the fiscal years ended December 31, | | |
| Class Z | | 2020 | | | 2019 | | | 2018 | | | 20171 | | | 20162 | |
| Net Asset Value, Beginning of Year | | $16.26 | | | $12.75 | | | $17.08 | | | $12.41 | | | $12.69 | |
| Income (loss) from Investment Operations: | | | | | | | | | | | | | | | |
| Net investment income3,4 | | 0.06 | | | 0.255 | | | 0.21 | | | 0.116 | | | 0.28 | |
| Net realized and unrealized gain (loss) on investments | | 2.20 | | | 3.55 | | | (4.36 | ) | | 4.71 | | | (0.32 | ) |
| Total income (loss) from investment operations | | 2.26 | | | 3.80 | | | (4.15 | ) | | 4.82 | | | (0.04 | ) |
| Less Distributions to Shareholders from: | | | | | | | | | | | | | | | |
| Net investment income | | (0.02 | ) | | (0.29 | ) | | (0.18 | ) | | (0.08 | ) | | (0.08 | ) |
| Net realized gain on investments | | — | | | — | | | — | | | (0.07 | ) | | (0.16 | ) |
| Total distributions to shareholders | | (0.02 | ) | | (0.29 | ) | | (0.18 | ) | | (0.15 | ) | | (0.24 | ) |
| Net Asset Value, End of Year | | $18.50 | | | $16.26 | | | $12.75 | | | $17.08 | | | $12.41 | |
| Total Return4,7 | | 13.90 | % | | 29.77 | % | | (24.29 | )% | | 38.86 | % | | (0.29 | )% |
| Ratio of net expenses to average net assets | | 0.98 | % | | 0.98 | % | | 0.98 | % | | 1.04 | % | | 1.05 | % |
| Ratio of gross expenses to average net assets8 | | 0.98 | % | | 0.98 | % | | 0.98 | % | | 1.05 | % | | 1.19 | % |
| Ratio of net investment income to average net assets4 | | 0.42 | % | | 1.68 | % | | 1.32 | % | | 0.70 | % | | 2.23 | % |
| Portfolio turnover | | 57 | % | | 40 | % | | 46 | % | | 48 | % | | 58 | % |
| Net assets end of year (000’s) omitted | | $397,976 | | | $401,528 | | | $372,085 | | | $252,951 | | | $99,533 | |
| 1 | Effective February 27, 2017, the Class I and Class S were renamed Class Z and Class N, respectively. |
| 2 | Effective October 1, 2016, the Institutional Class and Premier Class were renamed Class I and Class S, respectively. |
| 3 | Per share numbers have been calculated using average shares. |
| 4 | Total returns and net investment income would have been lower had certain expenses not been offset. |
| 5 | Includes non-recurring dividends. Without these dividends, net investment income per share would have been $0.16, $0.18 and $0.20 for Class N, Class I and Class Z, respectively. |
| 6 | Includes non-recurring dividends. Without these dividends, net investment income per share would have been $0.02, $0.05 and $0.05 for Class N, Class I and Class Z, respectively. |
| 7 | The total return is calculated using the published Net Asset Value as of fiscal year end. |
| 8 | Excludes the impact of expense reimbursement or fee waivers and expense reductions such as brokerage credits, but includes expense repayments and non-reimbursable expenses, if any, such as interest, taxes, and extraordinary expenses. (See Note 1(c) and 2 in the Notes to Financial Statements.) |
| 9 | Commencement of operations was on February 27, 2017. |
| | AMG TimesSquare Emerging Markets Small Cap Fund Financial Highlights For a share outstanding throughout each fiscal period |
| | | | | | | | | For the fiscal |
| | | | | | | | | period ended |
| | | For the fiscal years ended December 31, | | December 31, |
| Class N | | 2020 | | | 2019 | | | 2018 | | | 20171 | |
| Net Asset Value, Beginning of Period | | $11.03 | | | $9.49 | | | $12.32 | | | $10.94 | |
| Income (loss) from Investment Operations: | | | | | | | | | | | | |
| Net investment income2,3 | | 0.134 | | | 0.03 | | | 0.08 | | | 0.03 | |
| Net realized and unrealized gain (loss) on investments | | 2.50 | | | 1.53 | | | (2.34 | ) | | 2.33 | |
| Total income (loss) from investment operations | | 2.63 | | | 1.56 | | | (2.26 | ) | | 2.36 | |
| Less Distributions to Shareholders from: | | | | | | | | | | | | |
| Net investment income | | (0.00 | )5 | | (0.02 | ) | | (0.01 | ) | | (0.15 | ) |
| Net realized gain on investments | | — | | | — | | | (0.56 | ) | | (0.83 | ) |
| Paid in capital | | — | | | (0.00 | )5 | | — | | | — | |
| Total distributions to shareholders | | (0.00 | )5 | | (0.02 | ) | | (0.57 | ) | | (0.98 | ) |
| Net Asset Value, End of Period | | $13.66 | | | $11.03 | | | $9.49 | | | $12.32 | |
| Total Return3,6 | | 23.86 | % | | 16.49 | % | | (18.30 | )% | | 21.72 | %7 |
| Ratio of net expenses to average net assets | | 1.65 | % | | 1.67 | %8 | | 1.67 | % | | 1.65 | %9 |
| Ratio of gross expenses to average net assets10 | | 3.66 | % | | 4.29 | % | | 3.87 | % | | 5.02 | %9 |
| Ratio of net investment income to average net assets3 | | 1.22 | % | | 0.31 | % | | 0.68 | % | | 0.28 | %9 |
| Portfolio turnover | | 129 | % | | 103 | % | | 84 | % | | 81 | % |
| Net assets end of period (000’s) omitted | | $43 | | | $39 | | | $31 | | | $43 | |
| | AMG TimesSquare Emerging Markets Small Cap Fund Financial Highlights For a share outstanding throughout each fiscal period |
| | | | | | | | | | | For the fiscal |
| | | | | | | | | | | period ended |
| | | For the fiscal years ended December 31, | | December 31, |
| Class I | | 2020 | | | 2019 | | | 2018 | | | 2017 | | | 201611 |
| Net Asset Value, Beginning of Period | | $11.05 | | | $9.51 | | | $12.35 | | | $10.05 | | | $10.00 | |
| Income (loss) from Investment Operations: | | | | | | | | | | | | | | | |
| Net investment income2,3 | | 0.184 | | | 0.07 | | | 0.11 | | | 0.06 | | | 0.01 | |
| Net realized and unrealized gain (loss) on investments | | 2.51 | | | 1.53 | | | (2.33 | ) | | 3.23 | | | 0.04 | |
| Total income (loss) from investment operations | | 2.69 | | | 1.60 | | | (2.22 | ) | | 3.29 | | | 0.05 | |
| Less Distributions to Shareholders from: | | | | | | | | | | | | | | | |
| Net investment income | | (0.04 | ) | | (0.05 | ) | | (0.06 | ) | | (0.16 | ) | | — | |
| Net realized gain on investments | | — | | | — | | | (0.56 | ) | | (0.83 | ) | | — | |
| Paid in capital | | — | | | (0.01 | ) | | — | | | — | | | — | |
| Total distributions to shareholders | | (0.04 | ) | | (0.06 | ) | | (0.62 | ) | | (0.99 | ) | | — | |
| Net Asset Value, End of Period | | $13.70 | | | $11.05 | | | $9.51 | | | $12.35 | | | $10.05 | |
| Total Return3,6 | | 24.49 | % | | 16.83 | % | | (17.90 | )% | | 32.85 | % | | 0.50 | %7 |
| Ratio of net expenses to average net assets | | 1.25 | % | | 1.27 | %8 | | 1.27 | % | | 1.25 | % | | 1.34 | %9 |
| Ratio of gross expenses to average net assets10 | | 3.26 | % | | 3.89 | % | | 3.47 | % | | 4.59 | % | | 7.09 | %9,12 |
| Ratio of net investment income to average net assets3 | | 1.62 | % | | 0.71 | % | | 1.08 | % | | 0.53 | % | | 1.27 | %9 |
| Portfolio turnover | | 129 | % | | 103 | % | | 84 | % | | 81 | % | | 0 | %7 |
| Net assets end of period (000’s) omitted | | $396 | | | $310 | | | $273 | | | $13 | | | $10 | |
| | AMG TimesSquare Emerging Markets Small Cap Fund Financial Highlights For a share outstanding throughout each fiscal period |
| | | | | | | | | | | For the fiscal |
| | | | | | | | | | | period ended |
| | | For the fiscal years ended December 31, | | December 31, |
| Class Z | | 2020 | | | 2019 | | | 2018 | | | 2017 | | | 201611 |
| Net Asset Value, Beginning of Period | | $11.05 | | | $9.51 | | | $12.35 | | | $10.05 | | | $10.00 | |
| Income (loss) from Investment Operations: | | | | | | | | | | | | | | | |
| Net investment income2,3 | | 0.184 | | | 0.07 | | | 0.12 | | | 0.06 | | | 0.01 | |
| Net realized and unrealized gain (loss) on investments | | 2.51 | | | 1.53 | | | (2.34 | ) | | 3.23 | | | 0.04 | |
| Total income (loss) from investment operations | | 2.69 | | | 1.60 | | | (2.22 | ) | | 3.29 | | | 0.05 | |
| Less Distributions to Shareholders from: | | | | | | | | | | | | | | | |
| Net investment income | | (0.04 | ) | | (0.05 | ) | | (0.06 | ) | | (0.16 | ) | | — | |
| Net realized gain on investments | | — | | | — | | | (0.56 | ) | | (0.83 | ) | | — | |
| Paid in capital | | — | | | (0.01 | ) | | — | | | — | | | — | |
| Total distributions to shareholders | | (0.04 | ) | | (0.06 | ) | | (0.62 | ) | | (0.99 | ) | | — | |
| Net Asset Value, End of Period | | $13.70 | | | $11.05 | | | $9.51 | | | $12.35 | | | $10.05 | |
| Total Return3,6 | | 24.40 | % | | 16.83 | % | | (17.90 | )% | | 32.85 | % | | 0.50 | %7 |
| Ratio of net expenses to average net assets | | 1.25 | % | | 1.27 | %8 | | 1.27 | % | | 1.25 | % | | 1.34 | %9 |
| Ratio of gross expenses to average net assets10 | | 3.26 | % | | 3.89 | % | | 3.47 | % | | 4.59 | % | | 7.09 | %9,12 |
| Ratio of net investment income to average net assets3 | | 1.62 | % | | 0.71 | % | | 1.08 | % | | 0.53 | % | | 1.27 | %9 |
| Portfolio turnover | | 129 | % | | 103 | % | | 84 | % | | 81 | % | | 0 | %7 |
| Net assets end of period (000’s) omitted | | $6,766 | | | $5,473 | | | $5,513 | | | $6,850 | | | $4,237 | |
| 1 | Commencement of operations was on February 27, 2017. |
| 2 | Per share numbers have been calculated using average shares. |
| 3 | Total returns and net investment income would have been lower had certain expenses not been offset. |
| 4 | Includes non-recurring dividends. Without these dividends, net investment income per share would have been $0.11, $0.16 and $0.16 for Class N, Class I and Class Z, respectively. |
| 5 | Less than $(0.005) per share. |
| 6 | The total return is calculated using the published Net Asset Value as of fiscal year end. |
| 8 | Includes interest expense totaling 0.02% relating to interfund lending and bank overdrafts. |
| 10 | Excludes the impact of expense reimbursement or fee waivers and expense reductions such as brokerage credits, but includes expense repayments and non-reimbursable expenses, if any, such as interest, taxes, and extraordinary expenses. (See Note 1(c) and 2 in the Notes to Financial Statements.) |
| 11 | Commencement of operations was on December 15, 2016. |
| 12 | Ratio does not reflect the annualization of audit, excise tax and organization expenses. |
| | AMG TimesSquare Global Small Cap Fund Financial Highlights For a share outstanding throughout each fiscal period |
| | | | | | | For the fiscal |
| | | | | | | period ended |
| | | For the fiscal years ended December 31, | | December 31, |
| Class N | | 2020 | | | 2019 | | | 20181 |
| Net Asset Value, Beginning of Period | | $10.84 | | | $7.95 | | | $10.00 | |
| Income (loss) from Investment Operations: | | | | | | | | | |
| Net investment income (loss)2,3 | | (0.02 | ) | | 0.04 | | | 0.004 | |
| Net realized and unrealized gain (loss) on investments | | 1.23 | | | 2.95 | | | (2.05 | ) |
| Total income (loss) from investment operations | | 1.21 | | | 2.99 | | | (2.05 | ) |
| Less Distributions to Shareholders from: | | | | | | | | | |
| Net investment income | | — | | | (0.10 | ) | | — | |
| Net Asset Value, End of Period | | $12.05 | | | $10.84 | | | $7.95 | |
| Total Return3,5 | | 11.16 | % | | 37.60 | % | | (20.50 | )%6 |
| Ratio of net expenses to average net assets | | 1.25 | % | | 1.27 | %7 | | 1.25 | %8 |
| Ratio of gross expenses to average net assets9 | | 6.48 | % | | 7.45 | % | | 11.67 | %8,10 |
| Ratio of net investment income (loss) to average net assets3 | | (0.18 | )% | | 0.42 | % | | 0.07 | %8 |
| Portfolio turnover | | 42 | % | | 80 | % | | 22 | %6 |
| Net assets end of period (000’s) omitted | | $63 | | | $44 | | | $24 | |
| | AMG TimesSquare Global Small Cap Fund Financial Highlights For a share outstanding throughout each fiscal period |
| | | | | | | For the fiscal |
| | | | | | | period ended |
| | | For the fiscal years ended December 31, | | December 31, |
| Class I | | 2020 | | | 2019 | | | 20181 |
| Net Asset Value, Beginning of Period | | $10.85 | | | $7.96 | | | $10.00 | |
| Income (loss) from Investment Operations: | | | | | | | | | |
| Net investment income2,3 | | 0.01 | | | 0.06 | | | 0.02 | |
| Net realized and unrealized gain (loss) on investments | | 1.23 | | | 2.96 | | | (2.06 | ) |
| Total income (loss) from investment operations | | 1.24 | | | 3.02 | | | (2.04 | ) |
| Less Distributions to Shareholders from: | | | | | | | | | |
| Net investment income | | — | | | (0.13 | ) | | — | |
| Net Asset Value, End of Period | | $12.09 | | | $10.85 | | | $7.96 | |
| Total Return3,5 | | 11.43 | % | | 37.96 | % | | (20.40 | )%6 |
| Ratio of net expenses to average net assets | | 1.00 | % | | 1.02 | %7 | | 1.00 | %8 |
| Ratio of gross expenses to average net assets9 | | 6.23 | % | | 7.20 | % | | 11.42 | %8,10 |
| Ratio of net investment income to average net assets3 | | 0.07 | % | | 0.67 | % | | 0.32 | %8 |
| Portfolio turnover | | 42 | % | | 80 | % | | 22 | %6 |
| Net assets end of period (000’s) omitted | | $37 | | | $33 | | | $24 | |
| | AMG TimesSquare Global Small Cap Fund Financial Highlights For a share outstanding throughout each fiscal period |
| | | | | | | For the fiscal |
| | | | | | | period ended |
| | | For the fiscal years ended December 31, | | December 31, |
| Class Z | | 2020 | | | 2019 | | | 20181 |
| Net Asset Value, Beginning of Period | | $10.86 | | | $7.96 | | | $10.00 | |
| Income (loss) from Investment Operations: | | | | | | | | | |
| Net investment income2,3 | | 0.01 | | | 0.06 | | | 0.02 | |
| Net realized and unrealized gain (loss) on investments | | 1.22 | | | 2.97 | | | (2.06 | ) |
| Total income (loss) from investment operations | | 1.23 | | | 3.03 | | | (2.04 | ) |
| Less Distributions to Shareholders from: | | | | | | | | | |
| Net investment income | | — | | | (0.13 | ) | | — | |
| Net Asset Value, End of Period | | $12.09 | | | $10.86 | | | $7.96 | |
| Total Return3,5 | | 11.33 | % | | 38.09 | % | | (20.40 | )%6 |
| Ratio of net expenses to average net assets | | 1.00 | % | | 1.02 | %7 | | 1.00 | %8 |
| Ratio of gross expenses to average net assets9 | | 6.23 | % | | 7.20 | % | | 11.42 | %8,10 |
| Ratio of net investment income to average net assets3 | | 0.07 | % | | 0.67 | % | | 0.32 | %8 |
| Portfolio turnover | | 42 | % | | 80 | % | | 22 | %6 |
| Net assets end of period (000’s) omitted | | $2,186 | | | $2,032 | | | $1,443 | |
| 1 | Commencement of operations was on May 31, 2018. |
| 2 | Per share numbers have been calculated using average shares. |
| 3 | Total returns and net investment income (loss) would have been lower had certain expenses not been offset. |
| 4 | Less than $0.005 per share. |
| 5 | The total return is calculated using the published Net Asset Value as of period end. |
| 7 | Includes interest expense on interfund lending and excise tax expense totaling 0.02% |
| 9 | Excludes the impact of expense reimbursement or fee waivers and expense reductions such as brokerage credits, but includes expense repayments and non-reimbursable expenses, if any, such as interest, taxes, and extraordinary expenses. (See Note 1(c) and 2 in the Notes to Financial Statements.) |
| 10 | Ratio does not reflect the annualization of audit, registration and organization expenses. |
| | |
| | Notes to Financial Statements |
| | December 31, 2020 |
1. ORGANIZATION AND SUMMARY OF SIGNIFICANT ACCOUNTING POLICIES
AMG Funds (the “Trust”) is an open-end management investment company, organized as a Massachusetts business trust, and registered under the Investment Company Act of 1940, as amended (the “1940 Act”). Currently, the Trust consists of a number of different funds, each having distinct investment management objectives, strategies, risks, and policies. Included in this report are AMG TimesSquare Small Cap Growth Fund (“Small Cap”), AMG TimesSquare Mid Cap Growth Fund (“Mid Cap”), AMG TimesSquare International Small Cap Fund (“International Small Cap”), AMG TimesSquare Emerging Markets Small Cap Fund (“Emerging Markets Small Cap”) and AMG TimesSquare Global Small Cap Fund (“Global Small Cap”), each a “Fund” and collectively, the “Funds”.
Each Fund offers different classes of shares. Each Fund offers Class N, Class I and Class Z shares. Each class represents an interest in the same assets of the respective Fund. Although all share classes generally have identical voting rights, each share class votes separately when required by law. Different share classes may have different net asset values per share to the extent the share classes pay different distribution amounts and/or the expenses of such share classes differ. Each share class has its own expense structure. Please refer to a current prospectus for additional information on each share class.
Market disruptions associated with the COVID-19 pandemic have had a global impact, and uncertainty exists as to the long-term implications. Such disruptions can adversely affect assets of the Funds and thus Fund performance.
The Funds’ financial statements are prepared in accordance with accounting principles generally accepted in the United States of America (“U.S. GAAP”), including accounting and reporting guidance pursuant to Accounting Standards Codification Topic 946 applicable to investment companies. U.S. GAAP requires management to make estimates and assumptions that affect the reported amounts of assets and liabilities and disclosure of contingent assets and liabilities at the date of the financial statements and the reported amounts of income and expenses during the reporting period. Actual results could differ from those estimates and such differences could be material. The following is a summary of significant accounting policies followed by the Funds in the preparation of their financial statements:
a. VALUATION OF INVESTMENTS
Equity securities traded on a national securities exchange or reported on the NASDAQ national market system (“NMS”) are valued at the last quoted sales price on the primary exchange or, if applicable, the NASDAQ official closing price or the official closing price of the relevant exchange or, lacking any sales, at the last quoted bid price or the mean between the last quoted bid and ask prices (the “mean price”). Equity securities traded in the over-the-counter market (other than NMS securities) are valued at the mean price. Foreign equity securities (securities principally traded in markets other than U.S. markets) are valued at the official closing price on the primary exchange or, for markets that either do not offer an official closing price or where the official closing price may not be representative of the overall market, the last quoted sale price.
Fixed income securities purchased with a remaining maturity of 60 days or less are valued at amortized cost, provided that the amortized cost value is approximately the same as the fair value of the security valued without the use of amortized cost. Investments in other open-end registered investment companies are valued at their end of day net asset value per share.
The Funds’ portfolio investments are generally valued based on independent market quotations or prices or, if none, “evaluative” or other market based valuations provided by third party pricing services approved by the Board of Trustees of the Trust (the “Board”). Under certain circumstances, the value of certain Fund portfolio investments may be based on an evaluation of fair value, pursuant to procedures established by and under the general supervision of the Board. The Valuation Committee, which is comprised of the Independent Trustees of the Board, and the Pricing Committee, which is comprised of representatives from AMG Funds LLC (the “Investment Manager”) are the committees appointed by the Board to make fair value determinations. Each Fund may use the fair value of a portfolio investment to calculate its net asset value (“NAV”) in the event that the market quotation, price or market based valuation for the portfolio investment is not readily available or otherwise not determinable pursuant to the Board’s valuation procedures, if the Investment Manager or the Pricing Committee believes the quotation, price or market based valuation to be unreliable, or in certain other circumstances. When determining the fair value of an investment, the Pricing Committee and, if required under the Trust’s securities valuation procedures, the Valuation Committee, seeks to determine the price that the Fund might reasonably expect to receive from current sale of that portfolio investment in an arms-length transaction. Fair value determinations shall be based upon consideration of all available facts and information, including, but not limited to (i) attributes specific to the investment; (ii) fundamental and analytical data relating to the investment; and (iii) the value of other comparable securities or relevant financial instruments, including derivative securities, traded on other markets or among dealers.
The values assigned to fair value portfolio investments are based on available information and do not necessarily represent amounts that might ultimately be realized in the future, since such amounts depend on future developments inherent in long-term investments. Because of the inherent uncertainty of valuation, those estimated values may differ significantly from the values that would have been used had a ready market for the investments existed, and the differences could be material. The Board will be presented with a quarterly report showing as of the most recent quarter end, all outstanding securities fair valued by the Funds, including a comparison with the prior quarter end and the percentage of the Funds that the security represents at each quarter end.
With respect to foreign equity securities and certain foreign fixed income securities, the Board has adopted a policy that securities held in the Funds that can be fair valued by the applicable fair value pricing service are fair valued on each business day provided that each individual price exceeds a pre-established confidence level.
U.S. GAAP defines fair value as the price that a fund would receive to sell an asset or pay to transfer a liability in an orderly transaction between market participants at the measurement date. U.S. GAAP also establishes a framework for measuring fair value, and a three level hierarchy for fair value measurements based upon the transparency of inputs to the valuation of an asset or liability. Inputs may be observable or unobservable and refer broadly to the assumptions that market participants would use in pricing the asset or liability. Observable inputs reflect the assumptions market participants would use in pricing the asset or liability based on market data obtained from sources independent of the Funds. Unobservable inputs reflect the Funds’ own assumptions about the assumptions that market participants would use in pricing the asset or liability developed based on the best information available in the circumstances. Each investment is assigned a level based upon the observability of the inputs which are significant to the overall valuation.
| | |
| | |
| | Notes to Financial Statements (continued) |
The three-tier hierarchy of inputs is summarized below:
Level 1 – inputs are quoted prices in active markets for identical investments (e.g., equity securities, open-end investment companies)
Level 2 – other observable inputs (including, but not limited to: quoted prices for similar assets or liabilities in markets that are active, quoted prices for identical or similar assets or liabilities in markets that are not active, inputs other than quoted prices that are observable for the assets or liabilities (such as interest rates, yield curves, volatilities, prepayment speeds, loss severities, credit risks and default rates) or other market corroborated inputs) (e.g., debt securities, government securities, foreign currency exchange contracts, swaps, foreign securities utilizing international fair value pricing, fair valued securities with observable inputs)
Level 3 – inputs are significant unobservable inputs (including the Fund’s own assumptions used to determine the fair value of investments) (e.g., fair valued securities with unobservable inputs)
Changes in inputs or methodologies used for valuing investments may result in a transfer in or out of levels within the fair value hierarchy. The inputs or methodologies used for valuing investments may not necessarily be an indication of the risk associated with investing in those investments.
b. SECURITY TRANSACTIONS
Security transactions are accounted for as of trade date. Realized gains and losses on securities sold are determined on the basis of identified cost.
c. INVESTMENT INCOME AND EXPENSES
Dividend income is recorded on the ex-dividend date. Dividends from foreign securities are recorded on the ex-dividend date, and if after the fact, as soon as the Funds become aware of the ex-dividend date, except for Korean securities where dividends are recorded on confirmation date. Interest income, which includes amortization of premium and accretion of discount on debt securities, is accrued as earned. Dividend and interest income on foreign securities is recorded gross of any withholding tax. Non-cash dividends included in dividend income, if any, are reported at the fair market value of the securities received. Upon notification from issuers, distributions received from a real estate investment trust (REIT) may be
redesignated as a reduction of cost of investments and/or realized gain. Other income and expenses are recorded on an accrual basis. Expenses that cannot be directly attributed to a Fund are apportioned among the funds in the Trust and other trusts or funds within the AMG Funds Family of Funds (collectively the “AMG Funds Family”) based upon their relative average net assets or number of shareholders. Investment income, realized and unrealized capital gains and losses, the common expenses of each Fund, and certain fund level expense reductions, if any, are allocated on a pro-rata basis to each class based on the relative net assets of each class to the total net assets of each Fund.
Small Cap and Mid Cap had certain portfolio trades directed to various brokers under a brokerage recapture program. Credits received from the brokerage recapture program are earned and paid on a monthly basis, and are recorded as expense offsets, which serve to reduce the Funds’ overall expense ratio. For the fiscal year ended December 31, 2020, the impact on the expenses and expense ratios were as follows: Small Cap - $118,340 or 0.03% and Mid Cap - $170,862 or 0.01%.
d. DIVIDENDS AND DISTRIBUTIONS
Fund distributions resulting from either net investment income or realized net capital gains, if any, will normally be declared and paid at least annually in December. Distributions to shareholders are recorded on the ex-dividend date. Distributions are determined in accordance with federal income tax regulations, which may differ from net investment income and net realized capital gains for financial statement purposes (U.S. GAAP). Differences may be permanent or temporary. Permanent differences are reclassified among capital accounts in the financial statements to reflect their tax character. Permanent book and tax basis differences, if any, relating to shareholder distributions will result in reclassifications to paid-in capital. Temporary differences arise when certain items of income, expense and gain or loss are recognized in different periods for financial statement and tax purposes; these differences will reverse at some time in the future. Permanent differences are primarily due to tax equalization utilized and redemptions in kind. Temporary differences are due to mark-to-market on passive foreign investment companies, mark to market of foreign currency, wash sale loss deferrals, and capital loss carryovers.
The tax character of distributions paid during the fiscal years ended December 31, 2020 and December 31, 2019 were as follows:
| | | Small Cap | | Mid Cap | | International Small Cap |
| Distributions paid from: | | 2020 | | 2019 | | 2020 | | 2019 | | 2020 | | 2019 |
| Ordinary income * | | — | | $550,972 | | $11,788,773 | | $5,255,029 | | $586,492 | | $19,491,875 |
| Long-term capital gains | | $53,459,698 | | 52,948,302 | | 312,294,078 | | 250,388,243 | | — | | — |
| | | $53,459,698 | | $53,499,274 | | $324,082,851 | | $255,643,272 | | $586,492 | | $19,491,875 |
| | | Emerging Markets Small Cap | | Global Small Cap | | |
| Distributions paid from: | | 2020 | | 2019 | | 2020 | | 2019 |
| Ordinary income * | | $23,379 | | $27,304 | | — | | $25,194 |
| Paid-in capital | | — | | 3,538 | | — | | — |
| | | $23,379 | | $30,842 | | — | | $25,194 |
| * | For tax purposes, short-term capital gain distributions, if any, are considered ordinary income distributions. |
| | |
| | |
| | Notes to Financial Statements (continued) |
As of December 31, 2020, the components of distributable earnings (excluding unrealized appreciation/depreciation) on a tax basis consisted of:
| | | Small Cap | | Mid Cap | | International
Small Cap | | Emerging Markets
Small Cap | | Global Small Cap |
| Capital loss carryforward | | — | | — | | $176,093,447 | | — | | $151,549 |
| Undistributed ordinary income | | $2,487,017 | | $1,657,909 | | 3,433,118 | | $396,371 | | 1,239 |
| Undistributed long-term capital gains | | 19,140,318 | | 84,053,393 | | — | | 8,493 | | — |
At December 31, 2020, the cost of investments and the aggregate gross unrealized appreciation and depreciation for federal income tax purposes were as follows:
| Fund | | Cost | | Appreciation | | Depreciation | | Net Appreciation |
| Small Cap | | $327,281,374 | | $146,010,084 | | $(7,232,662) | | $138,777,422 |
| Mid Cap | | 1,231,034,640 | | 837,673,438 | | (30,345,121) | | 807,328,317 |
| International Small Cap | | 853,770,036 | | 315,360,437 | | (64,241,267) | | 251,119,170 |
| Emerging Markets Small Cap | | 5,959,400 | | 1,651,790 | | (284,628) | | 1,367,162 |
| Global Small Cap | | 1,791,136 | | 595,396 | | (58,152) | | 537,244 |
e. FEDERAL TAXES
Each Fund currently qualifies as an investment company and intends to comply with the requirements under Subchapter M of the Internal Revenue Code of 1986, as amended, and to distribute substantially all of its taxable income and gains to its shareholders and to meet certain diversification and income requirements with respect to investment companies. Therefore, no provision for federal income or excise tax is included in the accompanying financial statements.
Additionally, based on each Fund’s understanding of the tax rules and rates related to income, gains and transactions for the foreign jurisdictions in which it invests, each Fund will provide for foreign taxes, and where appropriate, deferred foreign taxes.
Management has analyzed the Funds’ tax positions taken on federal income tax returns as of December 31, 2020, and for all open tax years (generally, the three prior taxable years), and has concluded that no provision for federal income tax is required in the Funds’ financial statements. Additionally, Management is not aware of any tax position for which it is reasonably possible that the total amounts of unrecognized tax benefits will change materially in the next twelve months.
f. CAPITAL LOSS CARRYOVERS AND DEFERRALS
As of December 31, 2020, the following Funds had capital loss carryovers for federal income tax purposes as shown in the following chart. These amounts may be used to offset future realized capital gains indefinitely, and retain their character as short-term and/or long-term.
| | Capital Loss
Carryover Amounts | | |
| Fund | Short-Term | Long-Term | Total | |
| International Small Cap | $92,510,135 | $83,583,312 | $176,093,447 | |
| Global Small Cap | 74,022 | 77,527 | 151,549 | |
As of December 31, 2020, Small Cap, Mid Cap and Emerging Markets Small Cap had no capital loss carryovers for federal income tax purposes. Should the Funds incur net capital losses for the fiscal year ended December 31, 2021, such amounts may be used to offset future realized capital gains indefinitely, and retain their character as either short-term and/or long-term.
For the fiscal year ended December 31, 2020, the following Fund utilized capital loss carryovers in the amount of:
| | Capital Loss Carryover Utilized |
| Fund | Short-Term | Long-Term |
| Emerging Markets Small Cap | $125,682 | $186,311 |
g. CAPITAL STOCK
The Trust’s Declaration of Trust authorizes for each Fund the issuance of an unlimited number of shares of beneficial interest, without par value. Each Fund records sales and repurchases of its capital stock on the trade date. For the fiscal year ended December 31, 2020, Small Cap and Mid Cap transferred securities and cash to certain shareholders in connection with redemptions in-kind transactions in the amount of $55,031,433 and $95,449,270, respectively. For the fiscal year ended December 31, 2019, Small Cap and International Small Cap transferred securities and cash to certain shareholders in connection with redemptions in-kind transactions in the amount of $281,724,693 and $22,929,233, respectively. For the purposes of U.S. GAAP, the transactions were treated as sales of securities and the resulting gain or loss was recognized based on the market value of the securities on the date of the transfer. For tax purposes, no gains or losses were recognized. Prior to March 1, 2019, International Small Cap and Emerging Markets Small Cap deducted a 2.00% redemption fee from the proceeds of any redemption (including a redemption by exchange) of shares if the
| | |
| | |
| | Notes to Financial Statements (continued) |
redemption occurred within 60 days of the purchase of those shares. For the fiscal year ended December 31, 2019, International Small Cap had redemption fees amounting to $2,655. These amounts are netted against the cost of shares repurchased. For the fiscal year ended December 31, 2019, Emerging Markets Small Cap received no redemption fees.
For the fiscal years ended December 31, 2020 and December 31, 2019, the capital stock transactions by class for the Funds were as follows:
| | Small Cap | | Mid Cap |
| | December 31, 2020 | | December 31, 2019 | | December 31, 2020 | | December 31, 2019 |
| | Shares | | Amount | | Shares | | Amount | | Shares | | Amount | | Shares | | Amount |
| Class N: | | | | | | | | | | | | | | | |
| Proceeds from sale of shares | 932,300 | | $12,452,477 | | 905,278 | | $13,055,000 | | 9,115,475 | | $162,122,304 | | 9,809,288 | | $179,985,713 |
| Reinvestment of distributions | 889,249 | | 14,165,736 | | 819,363 | | 11,192,499 | | 5,288,327 | | 101,324,348 | | 4,015,288 | | 70,387,987 |
| Cost of shares repurchased | (2,552,868) | | (35,672,455) | | (2,328,867) | | (33,570,961) | | (12,504,810) | | (234,341,365) | | (9,560,066) | | (177,065,853) |
| Net increase (decrease) | (731,319) | | $(9,054,242) | | (604,226) | | $(9,323,462) | | 1,898,992 | | $29,105,287 | | 4,264,510 | | $73,307,847 |
| Class I: | | | | | | | | | | | | | | | |
| Proceeds from sale of shares | 1,032,547 | | $14,380,169 | | 1,681,977 | | $25,010,540 | | 2,840,070 | | $52,527,341 | | 4,401,134 | | $85,873,380 |
| Reinvestment of distributions | 85,693 | | 1,430,225 | | 84,503 | | 1,201,633 | | 4,088,964 | | 81,983,738 | | 3,511,970 | | 63,882,738 |
| Cost of shares repurchased | (1,198,986) | | (15,164,745) | | (14,826,800) | | (227,352,813) | | (7,078,438) | | (131,765,381) | | (5,006,169) | | (94,671,055) |
| Net increase (decrease) | (80,746) | | $645,649 | | (13,060,320) | | $(201,140,640) | | (149,404) | | $2,745,698 | | 2,906,935 | | $55,085,063 |
| Class Z: | | | | | | | | | | | | | | | |
| Proceeds from sale of shares | 4,865,181 | | $66,148,869 | | 3,505,845 | | $52,326,072 | | 6,540,814 | | $122,425,292 | | 6,593,529 | | $126,622,266 |
| Reinvestment of distributions | 2,134,074 | | 35,724,402 | | 2,754,888 | | 39,229,609 | | 6,883,868 | | 138,503,425 | | 6,367,710 | | 116,083,352 |
| Cost of shares repurchased | (13,742,210) | | (196,149,145) | 1 | (28,558,852) | | (443,646,632) | 2 | (18,618,705) | | (356,242,757) | 3 | (25,593,054) | | (498,763,146) |
| Net decrease | (6,742,955) | | $(94,275,874) | | (22,298,119) | | $(352,090,951) | | (5,194,023) | | $(95,314,040) | | (12,631,815) | | $(256,057,528) |
| 1 | Includes redemption in-kind in the amount of $55,031,433. |
| 2 | Includes redemption in-kind in the amount of $281,724,693. |
| 3 | Includes redemption in-kind in the amount of $95,449,270. |
| | International Small Cap | | Emerging Markets Small Cap |
| | December 31, 2020 | | December 31, 2019 | | December 31, 2020 | | December 31, 2019 |
| | Shares | | Amount | | Shares | | Amount | | Shares | | Amount | | Shares | | Amount |
| Class N: | | | | | | | | | | | | | | | |
| Proceeds from sale of shares | 716,803 | | $10,362,361 | | 1,014,625 | | $14,806,211 | | 247 | | $2,000 | | 739 | | $7,750 |
| Reinvestment of distributions | — | | — | | 64,114 | | 1,045,702 | | — | | 4 | | 8 | | 87 |
| Cost of shares repurchased | (2,599,344) | | (36,081,457) | | (3,723,202) | | (54,038,359) | | (662) | | (6,476) | | (482) | | (5,103) |
| Net increase (decrease) | (1,882,541) | | $(25,719,096) | | (2,644,463) | | $(38,186,446) | | (415) | | $(4,472) | | 265 | | $2,734 |
| Class I: | | | | | | | | | | | | | | | |
| Proceeds from sale of shares | 14,959,904 | | $202,194,415 | | 14,704,599 | | $209,796,429 | | 760 | | $10,010 | | — | | — |
| Reinvestment of distributions | 9,542 | | 169,659 | | 650,752 | | 10,626,788 | | 96 | | 1,290 | | 152 | | $1,645 |
| Cost of shares repurchased | (21,429,597) | | (292,725,839) | | (17,123,427) | | (250,520,336) | | — | | — | | (840) | | (8,091) |
| Net increase (decrease) | (6,460,151) | | $(90,361,765) | | (1,768,076) | | $(30,097,119) | | 856 | | $11,300 | | (688) | | $(6,446) |
| | |
| | |
| | Notes to Financial Statements (continued) |
| | International Small Cap | | Emerging Markets Small Cap |
| | December 31, 2020 | | December 31, 2019 | | December 31, 2020 | | December 31, 2019 |
| | Shares | | Amount | | Shares | | Amount | | Shares | | Amount | | Shares | | Amount |
| Class Z: | | | | | | | | | | | | | | | |
| Proceeds from sale of shares | 5,068,141 | | $71,756,305 | | 3,426,838 | | $50,299,126 | | 33,815 | | $416,719 | | 296 | | $3,000 |
| Reinvestment of distributions | 21,843 | | 388,594 | | 440,172 | | 7,192,415 | | 1,031 | | 13,888 | | 1,875 | | 20,215 |
| Cost of shares repurchased | (8,263,110) | | (122,086,115) | | (8,369,040) | | (127,801,279) | 1 | (36,125) | | (380,928) | | (86,865) | | (891,732) |
| Net increase (decrease) | (3,173,126) | | $(49,941,216) | | (4,502,030) | | $(70,309,738) | | (1,279) | | $49,679 | | (84,694) | | $(868,517) |
| 1 | Includes redemption in-kind in the amount of $22,929,233. |
| | Global Small Cap |
| | December 31, 2020 | | December 31, 2019 |
| | Shares | | Amount | | Shares | | Amount |
| Class N: | | | | | | | |
| Proceeds from sale of shares | 1,111 | | $11,570 | | 1,041 | | $10,000 |
| Reinvestment of distributions | — | | — | | 37 | | 400 |
| Net increase | 1,111 | | $11,570 | | 1,078 | | $10,400 |
| Class I: | | | | | | | |
| Reinvestment of distributions | — | | — | | 37 | | $396 |
| Class Z: | | | | | | | |
| Proceeds from sale of shares | 2,276 | | $19,500 | | 84,055 | | $809,220 |
| Reinvestment of distributions | — | | — | | 2,245 | | 24,397 |
| Cost of shares repurchased | (8,691) | | (70,202) | | (80,326) | | (773,537) |
| Net increase (decrease) | (6,415) | | $(50,702) | | 5,974 | | $60,080 |
At December 31, 2020, certain shareholders of record individually or collectively held greater than 10% of the net assets of the Funds as follows: Small Cap - one owns 10%; Mid Cap - one owns 22%; Emerging Markets Small Cap - three own 76%; Global Small Cap - three own 75%. Transactions by these shareholders may have a material impact on the Funds.
h. REPURCHASE AGREEMENTS AND JOINT REPURCHASE AGREEMENTS
The Funds may enter into third-party repurchase agreements for temporary cash management purposes and third-party or bilateral joint repurchase agreements for reinvestment of cash collateral on securities lending transactions under the securities lending program offered by The Bank of New York Mellon (“BNYM”) (the “Program”) (collectively, “Repurchase Agreements”). The value of the underlying collateral, including accrued interest, must equal or exceed the value of the Repurchase Agreements during the term of the agreement. For joint repurchase agreements, the Funds participate on a pro rata basis with other clients of BNYM in its share of the underlying collateral under such joint repurchase agreements and in its share of proceeds from any repurchase or other disposition of the underlying collateral. The underlying collateral for all Repurchase Agreements is held in safekeeping by the Funds’ custodian or at the Federal Reserve Bank. If the seller defaults and the value of the collateral declines, or if bankruptcy proceedings commence with respect to the seller of the security, realization of the collateral by the Funds may be delayed or limited. Pursuant to the Program, the Funds are indemnified for such losses by BNYM on joint repurchase agreements.
At December 31, 2020, the market value of Repurchase Agreements outstanding for Small Cap, Mid Cap, International Small Cap, Emerging Markets Small Cap and Global Small Cap were $22,705,986, $11,419,353, $32,882,584, $135,724 and $21,863, respectively.
i. FOREIGN CURRENCY TRANSLATION
The books and records of the Funds are maintained in U.S. dollars. The value of investments, assets and liabilities denominated in currencies other than U.S. dollars are translated into U.S. dollars based upon current foreign exchange rates. Purchases and sales of foreign investments, income and expenses are converted into U.S. dollars based on currency exchange rates prevailing on the respective dates of such transactions. Net realized and unrealized gain (loss) on foreign currency transactions represent: (1) foreign exchange gains and losses from the sale and holdings of foreign currencies; (2) gains and losses between trade date and settlement date on investment securities transactions and foreign currency exchange contracts; and (3) gains and losses from the difference between amounts of interest and dividends recorded and the amounts actually received.
| | |
| | |
| | Notes to Financial Statements (continued) |
The Funds do not isolate the net realized and unrealized gain or loss resulting from changes in exchange rates from the fluctuations in market prices of securities held. Such fluctuations are included with the net realized and unrealized gain or loss on investments.
2. AGREEMENTS AND TRANSACTIONS WITH AFFILIATES
For each of the Funds, the Trust has entered into an investment advisory agreement under which the Investment Manager, a subsidiary and the U.S. retail distribution arm of Affiliated Managers Group, Inc. (“AMG”), serves as investment manager to the Funds and is responsible for the Funds’ overall administration and operations. The Investment Manager selects one or more subadvisers for the Funds (subject to Board approval) and monitors each subadviser’s investment performance, security holdings and investment strategies. Each Fund’s investment portfolio is managed by TimesSquare Capital Management, LLC (“TimesSquare”) who serves pursuant to a subadvisory agreement with the Investment Manager. AMG indirectly owns a majority interest in TimesSquare.
Investment management fees are paid directly by the Funds to the Investment Manager based on average daily net assets. For the fiscal year ended December 31, 2020, the Funds’ investment management fees were paid at the following annual rates of each Fund’s respective average daily net assets:
| Small Cap | | | 0.79 | % | |
| Mid Cap | | | 0.79 | % | |
| International Small Cap | | | 0.75 | % | |
| Emerging Markets Small Cap | | | 0.95 | % | |
| Global Small Cap | | | 0.70 | % | |
The Investment Manager has contractually agreed, through at least May 1, 2021, to waive management fees and/or pay or reimburse fund expenses in order to limit total annual Fund operating expenses after fee waiver and expense reimbursements (exclusive of taxes, interest (including interest incurred in connection with bank and custody overdrafts, and in connection with securities sold short), shareholder servicing fees, distribution and service (12b-1) fees, brokerage commissions and other transaction costs, dividends payable with respect to securities sold short, acquired fund fees and expenses and extraordinary expenses) of Small Cap, Mid Cap, International Small Cap, Emerging Markets Small Cap and Global Small Cap to the annual rate of 0.99%, 1.13%, 1.05%, 1.25% and 1.00%, respectively, of each Fund’s average daily net assets (this annual rate or such other annual rate that may be in effect from time to time, the “Expense Cap”), subject to later reimbursement by the Funds in certain circumstances.
In general, for a period of up to 36 months after the date any amounts are paid, waived or reimbursed by the Investment Manager, the Investment Manager may recover such amounts from a Fund, provided that such repayment would not cause the Fund’s total annual operating expenses after fee waiver and expense reimbursements (exclusive of the items noted in the parenthetical above) to exceed either (i) the Expense Cap in effect at the time such amounts were paid, waived or reimbursed, or (ii) the Expense Cap in effect at the time of such repayment by the Fund.
The contractual expense limitation may only be terminated in the event the Investment Manager or a successor ceases to be the investment manager of a Fund or a successor fund, by mutual agreement between the Investment Manager
and the Board, or in the event of a Fund’s liquidation unless the Fund is reorganized or is a party to a merger in which the surviving entity is successor to the accounting and performance information of a Fund.
At December 31, 2020, the Funds’ expiration of reimbursements subject to recoupment is as follows:
Expiration
Period | Small Cap | | Emerging Markets
Small Cap | | Global
Small Cap |
| Less than 1 year | — | | $140,393 | | $148,223 |
| 1-2 years | — | | 150,992 | | 118,313 |
| 2-3 years | $46,456 | | 111,885 | | 99,133 |
| Total | $46,456 | | $403,270 | | $365,669 |
The Trust, on behalf of the Funds, has entered into an amended and restated Administration Agreement under which the Investment Manager serves as the Funds’ administrator (the “Administrator”) and is responsible for all non-portfolio management aspects of managing the Funds’ operations, including administration and shareholder services to each Fund. Each Fund pays a fee to the Administrator at the rate of 0.15% per annum of the Fund’s average daily net assets for this service.
The Funds are distributed by AMG Distributors, Inc. (the “Distributor”), a wholly-owned subsidiary of the Investment Manager. The Distributor serves as the distributor and underwriter for each Fund and is a registered broker-dealer and member of the Financial Industry Regulatory Authority, Inc. (“FINRA”). Shares of each Fund will be continuously offered and will be sold directly to prospective purchasers and through brokers, dealers or other financial intermediaries who have executed selling agreements with the Distributor. Generally the Distributor bears all or a portion of the expenses of providing services pursuant to the distribution agreement, including the payment of the expenses relating to the distribution of prospectuses for sales purposes and any advertising or sales literature.
The Trust has adopted a distribution and service plan (the “Plan”) with respect to the Class N shares of Emerging Markets Small Cap and Global Small Cap, in accordance with the requirements of Rule 12b-1 under the 1940 Act and the requirements of the applicable rules of FINRA regarding asset-based sales charges. Pursuant to the Plan, Emerging Markets Small Cap and Global Small Cap may make payments to the Distributor for its expenditures in financing any activity primarily intended to result in the sale of Emerging Markets Small Cap and Global Small Cap’s Class N shares and for maintenance and personal service provided to existing shareholders of that class. The Plan authorized payments to the Distributor up to 0.25% annually of Emerging Markets Small Cap and Global Small Cap’s average daily net assets attributable to the Class N shares.
For each of the Class N and Class I shares, the Board has approved reimbursement payments to the Investment Manager for shareholder servicing expenses (“shareholder servicing fees”) incurred. Shareholder servicing fees include payments to financial intermediaries, such as broker-dealers (including fund supermarket platforms), banks, and trust companies who provide shareholder recordkeeping, account servicing and other services. The Class N and Class I shares may reimburse the Investment Manager for the actual amount incurred up to a maximum annual rate of each Class’s average daily net assets as shown in the table below.
| | |
| | |
| | Notes to Financial Statements (continued) |
The impact on the annualized expense ratios for the fiscal year ended December 31, 2020, were as follows:
| Fund | | Maximum Annual
Amount
Approved | | Actual
Amount
Incurred |
| Small Cap | | | | | | | | |
| Class N | | | 0.20 | % | | | 0.20 | % |
| Class I | | | 0.10 | % | | | 0.07 | % |
| Mid Cap | | | | | | | | |
| Class N | | | 0.20 | % | | | 0.20 | % |
| Class I* | | | 0.05 | % | | | 0.07 | % |
| International Small Cap | | | | | | | | |
| Class N | | | 0.25 | % | | | 0.25 | % |
| Class I | | | 0.10 | % | | | 0.10 | % |
| Emerging Markets Small Cap | | | | | | | | |
| Class N | | | 0.15 | % | | | 0.15 | % |
| Class I | | | 0.15 | % | | | — | |
| Global Small Cap | | | | | | | | |
| Class N | | | 0.15 | % | | | — | |
| Class I | | | 0.15 | % | | | — | |
* Prior to May 1, 2020, the maximum annual amount approved was 0.10%.
The Board provides supervision of the affairs of the Trust and other trusts within the AMG Funds Family. The Trustees of the Trust who are not affiliated with the Investment Manager receive an annual retainer and per meeting fees for regular, special and telephonic meetings, and they are reimbursed for out-of-pocket expenses incurred while carrying out their duties as Board members. The Chairman of the Board and the Audit Committee Chair receive additional annual retainers. Certain Trustees and Officers of the Funds are Officers and/or Directors of the Investment Manager, AMG and/or the Distributor.
The Securities and Exchange Commission (the “SEC”) granted an exemptive order that permits the Funds to lend and borrow money for certain temporary purposes directly to and from other eligible funds in the AMG Funds Family. Participation in this interfund lending program is voluntary for both the borrowing and lending funds, and an interfund loan is only made if it benefits each participating fund. The Administrator manages the program according to procedures approved by the Board, and the Board monitors the operation of the program. An interfund loan must comply with certain conditions set out in the exemptive order, which are designed to assure fairness and protect all participating funds. The interest earned and interest paid on interfund loans are included on the Statement of Operations as interest income and miscellaneous expense, respectively. At December 31, 2020, the Funds had no interfund loans outstanding.
The following Funds utilized the interfund loan program during the fiscal year ended December 31, 2020 as follows:
| Fund | Average
Lent | Number
of Days | Interest Earned | Average
Interest Rate |
| Small Cap | $3,275,164 | 1 | $87 | 0.970% |
| Mid Cap | 2,059,995 | 4 | 320 | 1.419% |
| Fund | Average
Lent | Number
of Days | Interest
Earned | Average
Interest Rate |
| International Small Cap | 5,820,000 | 2 | $768 | 2.408% |
| Fund | Average
Borrowed | Number
of Days | Interest
Paid | Average
Interest Rate |
| Small Cap | $1,576,496 | 2 | $131 | 1.520% |
| International Small Cap | 2,832,448 | 4 | 408 | 1.314% |
| Emerging Markets Small Cap | 164,158 | 5 | 56 | 2.478% |
For the fiscal year ended December 31, 2020, Small Cap executed security transactions with other funds affiliated with TimesSquare. Each of the transactions were executed at the closing price of the security transacted and with no commissions under Rule 17a-7 procedures approved by the Board. The amount sold during the fiscal year ended December 31, 2020, is reflected in the following chart:
| | Number of
Transactions | Total
Quantity | Cost/Proceeds |
| Sales* | 1 | 820,000 | 10,832,200 |
* Realized gain was $4,011,711.
At December 31, 2020, $1,756,930 of the sale was unsettled and included in Receivable for investments sold on the Statement of Assets and Liabilities.
3. PURCHASES AND SALES OF SECURITIES
Purchases and sales of securities (excluding short-term securities and U.S. Government Obligations) for the fiscal year ended December 31, 2020, were as follows:
| | Long Term Securities | |
| | | |
| Fund | Purchases | Sales | |
| Small Cap | $292,449,012 | $407,594,099 | |
| Mid Cap | 1,316,389,137 | 1,588,487,138 | |
| International Small Cap | 528,985,716 | 679,934,668 | |
| Emerging Markets Small Cap | 7,176,359 | 7,057,569 | |
| Global Small Cap | 780,894 | 811,814 | |
The Funds had no purchases or sales of U.S. Government Obligations during the fiscal year ended December 31, 2020.
4. PORTFOLIO SECURITIES LOANED
The Funds participate in the Program providing for the lending of securities to qualified borrowers. Securities lending income includes earnings of such temporary cash investments, plus or minus any rebate to a borrower. These earnings (after any rebate) are then divided between BNYM, as a fee for its services under the Program, and the Funds, according to agreed-upon rates. Collateral on all securities loaned is accepted in cash, U.S. Treasury Obligations or U.S. Government Agency Obligations. Collateral is maintained at a minimum level of 102% (105% in the case of certain foreign securities) of the market value, plus interest, if applicable, of investments on loan. It is the Funds’ policy to obtain
| | |
| | |
| | Notes to Financial Statements (continued) |
additional collateral from or return excess collateral to the borrower by the end of the next business day, following the valuation date of the securities loaned. Therefore, the value of the collateral held may be temporarily less than the value of the securities on loan. Lending securities entails a risk of loss to the Funds if and to the extent that the market value of the securities loaned were to increase and the borrower did not increase the collateral accordingly, and the borrower fails to return the securities. Under the terms of the Program, the Funds are indemnified for such losses by BNYM. Cash collateral is held in separate omnibus accounts managed by BNYM, who is authorized to exclusively enter into joint repurchase agreements for that cash collateral. Securities collateral is held in separate omnibus accounts managed by BNYM that cannot be sold or pledged. BNYM bears the risk of any deficiency in the amount of the cash collateral available for return to the borrower due to any loss on the collateral invested. Loans of securities are terminable at any time and the borrower, after notice, is required to return borrowed securities as soon as practical, which is normally within three business days.
The value of securities loaned on positions held, cash collateral and securities collateral received at December 31, 2020, were as follows:
| Fund | Securities
Loaned | Cash
Collateral
Received | Securities
Collateral
Received | Total
Collateral
Received |
| Small Cap | $62,717,606 | $22,705,986 | $41,942,866 | $64,648,852 |
| Mid Cap | 88,886,890 | 11,419,353 | 78,282,747 | 89,702,100 |
| International Small Cap | 46,177,802 | 32,882,584 | 15,724,073 | 48,606,657 |
| Emerging Markets Small Cap | 180,957 | 135,724 | 50,819 | 186,543 |
| Global Small Cap | 98,427 | 21,863 | 79,546 | 101,409 |
The following table summarizes the securities received as collateral for securities lending at December 31, 2020:
| Fund | Collateral
Type | Coupon
Range | Maturity
Date Range |
| Small Cap | U.S. Treasury Obligations | 0.000%-8.125% | 01/15/21-11/15/50 |
| Mid Cap | U.S. Treasury Obligations | 0.000%-8.125% | 01/15/21-08/15/50 |
| Fund | Collateral
Type | Coupon
Range | Maturity
Date Range |
| International Small Cap | U.S. Treasury Obligations | 0.000%-4.750% | 01/28/21-05/15/49 |
| Emerging Markets Small Cap | U.S. Treasury Obligations | 0.125%-3.625% | 02/15/21-08/15/47 |
| Global Small Cap | U.S. Treasury Obligations | 0.000%-8.125% | 01/15/21-08/15/50 |
5. FOREIGN SECURITIES
Certain Funds invest in securities of foreign entities and in instruments denominated in foreign currencies which involve risks not typically associated with investments in domestic securities. Non-domestic securities carry special risks, such as exposure to currency fluctuations, less developed or less efficient trading markets, political instability, a lack of company information, differing auditing and legal standards, and, potentially, less liquidity. A Fund’s investments in emerging market countries are exposed to additional risks. A Fund’s performance will be influenced by political, social and economic factors affecting companies in emerging market countries. Emerging market countries generally have economic structures that are less diverse and mature, and political systems that are less stable, than those of developed countries. Realized gains in certain countries may be subject to foreign taxes at the Fund level and the Fund would pay such foreign taxes at the appropriate rate for each jurisdiction.
6. COMMITMENTS AND CONTINGENCIES
Under the Trust’s organizational documents, its trustees and officers are indemnified against certain liabilities arising out of the performance of their duties to the Trust. In addition, in the normal course of business, the Funds may enter into contracts and agreements that contain a variety of representations and warranties, which provide general indemnifications. The maximum exposure to the Funds under these arrangements is unknown, as this would involve future claims that may be made against a Fund that have not yet occurred. However, based on experience, the Funds had no prior claims or losses and expect the risks of loss to be remote.
7. MASTER NETTING AGREEMENTS
The Funds may enter into master netting agreements with their counterparties for the securities lending program and Repurchase Agreements, which provide the right, in the event of default (including bankruptcy or insolvency) for the non-defaulting party to liquidate the collateral and calculate net exposure to the defaulting party or request additional collateral. For financial reporting purposes, the Funds do not offset financial assets and financial liabilities that are subject to master netting agreements in the Statement of Assets and Liabilities. For securities lending transactions, see Note 4.
| | |
| | |
| | Notes to Financial Statements (continued) |
The following table is a summary of the Funds’ open Repurchase Agreements that are subject to a master netting agreement as of December 31, 2020:
| | | | | Gross Amount Not Offset in the
Statement of Assets and Liabilities | | | | |
| Fund | | Gross Amounts of
Assets Presented in
the Statement of
Assets and Liabilities | | Offset
Amount | | Net
Asset
Balance | | Collateral
Received | | Net
Amount |
| Small Cap | | | | | | | | | | | | | | | | | | | | |
| Amherst Pierpont Securities LLC | | | $1,326,599 | | | | — | | | | $1,326,599 | | | | $1,326,599 | | | | — | |
| Cantor Fitzgerald Securities, Inc. | | | 3,936,779 | | | | — | | | | 3,936,779 | | | | 3,936,779 | | | | — | |
| CF Securities LLC | | | 1,347,380 | | | | — | | | | 1,347,380 | | | | 1,347,380 | | | | — | |
| Citadel Securities LLC | | | 2,975,438 | | | | — | | | | 2,975,438 | | | | 2,975,438 | | | | — | |
| JVB Financial Group LLC | | | 1,539,277 | | | | — | | | | 1,539,277 | | | | 1,539,277 | | | | — | |
| Mirae Asset Securities USA, Inc. | | | 1,758,801 | | | | — | | | | 1,758,801 | | | | 1,758,801 | | | | — | |
| Palafox Trading LLC | | | 1,668,382 | | | | — | | | | 1,668,382 | | | | 1,668,382 | | | | — | |
| RBC Dominion Securities, Inc. | | | 4,245,961 | | | | — | | | | 4,245,961 | | | | 4,245,961 | | | | — | |
| State of Wisconsin Investment Board | | | 3,907,369 | | | | — | | | | 3,907,369 | | | | 3,907,369 | | | | — | |
| Total | | | $22,705,986 | | | | — | | | | $22,705,986 | | | | $22,705,986 | | | | — | |
| Mid Cap | | | | | | | | | | | | | | | | | | | | |
| Cantor Fitzgerald Securities, Inc. | | | $2,391,424 | | | | — | | | | $2,391,424 | | | | $2,391,424 | | | | — | |
| Citadel Securities LLC | | | 2,359,879 | | | | — | | | | 2,359,879 | | | | 2,359,879 | | | | — | |
| Citigroup Global Markets, Inc. | | | 1,847,172 | | | | — | | | | 1,847,172 | | | | 1,847,172 | | | | — | |
| JVB Financial Group LLC | | | 1,040,376 | | | | — | | | | 1,040,376 | | | | 1,040,376 | | | | — | |
| Mirae Asset Securities USA, Inc. | | | 1,068,396 | | | | — | | | | 1,068,396 | | | | 1,068,396 | | | | — | |
| RBC Dominion Securities, Inc. | | | 2,712,106 | | | | — | | | | 2,712,106 | | | | 2,712,106 | | | | — | |
| Total | | | $11,419,353 | | | | — | | | | $11,419,353 | | | | $11,419,353 | | | | — | |
| International Small Cap | | | | | | | | | | | | | | | | | | | | |
| Amherst Pierpont Securities LLC | | | $1,921,167 | | | | — | | | | $1,921,167 | | | | $1,921,167 | | | | — | |
| Bethesda Securities LLC | | | 1,207,590 | | | | — | | | | 1,207,590 | | | | 1,207,590 | | | | — | |
| Cantor Fitzgerald Securities, Inc. | | | 5,701,205 | | | | — | | | | 5,701,205 | | | | 5,701,205 | | | | — | |
| CF Securities LLC | | | 1,951,263 | | | | — | | | | 1,951,263 | | | | 1,951,263 | | | | — | |
| Citadel Securities LLC | | | 3,883,126 | | | | — | | | | 3,883,126 | | | | 3,883,126 | | | | — | |
| Citigroup Global Markets, Inc. | | | 5,606,036 | | | | — | | | | 5,606,036 | | | | 5,606,036 | | | | — | |
| JVB Financial Group LLC | | | 2,229,164 | | | | — | | | | 2,229,164 | | | | 2,229,164 | | | | — | |
| Mirae Asset Securities USA, Inc. | | | 2,547,077 | | | | — | | | | 2,547,077 | | | | 2,547,077 | | | | — | |
| Palafox Trading LLC | | | 2,177,340 | | | | — | | | | 2,177,340 | | | | 2,177,340 | | | | — | |
| State of Wisconsin Investment Board | | | 5,658,616 | | | | — | | | | 5,658,616 | | | | 5,658,616 | | | | — | |
| Total | | | $32,882,584 | | | | — | | | | $32,882,584 | | | | $32,882,584 | | | | — | |
| | |
| | |
| | Notes to Financial Statements (continued) |
| | | | | Gross Amount Not Offset in the
Statement of Assets and Liabilities | | | | |
| Fund | | Gross Amounts of
Assets Presented in
the Statement of
Assets and Liabilities | | Offset
Amount | | Net
Asset
Balance | | Collateral
Received | | Net
Amount |
| Emerging Markets Small Cap | | | | | | | | | | | | | | | | | | | | |
| Citibank N.A. | | | $135,724 | | | | — | | | | $135,724 | | | | $135,724 | | | | — | |
| Global Small Cap | | | | | | | | | | | | | | | | | | | | |
| Bank of America Securities, Inc. | | | $21,863 | | | | — | | | | $21,863 | | | | $21,863 | | | | — | |
8. SUBSEQUENT EVENTS
The Funds have determined that no material events or transactions occurred through the issuance date of the Funds’ financial statements which require an additional disclosure in or adjustment of the Funds’ financial statements except for on February 1, 2021, it was announced that Aspirational Consumer Lifestyle Corp
(“Aspirational”) would be acquiring Wheels Up, a private company in which Small Cap holds preferred shares. The merger will make Wheels Up a publicly traded company and is expected to be completed on or around June 30, 2021, subject to approval by Aspirational’s and Wheels Up’s respective shareholders, and other customary closing conditions, including any applicable regulatory approvals.
| | |
| | |
| | Report of Independent Registered Public Accounting Firm |
TO THE BOARD OF TRUSTEES OF AMG FUNDS AND SHAREHOLDERS OF AMG TIMESSQUARE SMALL CAP GROWTH FUND, AMG TIMESSQUARE MID CAP GROWTH FUND, AMG TIMESSQUARE INTERNATIONAL SMALL CAP FUND, AMG TIMESSQUARE EMERGING MARKETS SMALL CAP FUND AND AMG TIMESSQUARE GLOBAL SMALL CAP FUND
Opinion on the Financial Statements
We have audited the accompanying statements of assets and liabilities, including the schedules of portfolio investments, of AMG TimesSquare Small Cap Growth Fund, AMG TimesSquare Mid Cap Growth Fund, AMG TimesSquare International Small Cap Fund, AMG TimesSquare Emerging Markets Small Cap Fund and AMG TimesSquare Global Small Cap Fund (five of the funds constituting AMG Funds, referred to hereafter as the “Funds”) as of December 31, 2020, the related statements of operations for the year ended December 31, 2020, the statements of changes in net assets for each of the two years in the period ended December 31, 2020, including the related notes, and the financial highlights for each of the periods indicated therein (collectively referred to as the “financial statements”). In our opinion, the financial statements present fairly, in all material respects, the financial position of the Funds as of December 31, 2020, the results of each of their operations for the year then ended, the changes in each of their net assets for each of the two years in the period December 31, 2020, and each of the financial highlights for each of the periods indicated therein in conformity with accounting principles generally accepted in the United States of America.
Basis for Opinion
These financial statements are the responsibility of the Funds’ management. Our responsibility is to express an opinion on the Funds’ financial statements based on our audits. We are a public accounting firm registered with the Public Company Accounting Oversight Board (United States) (PCAOB) and are required to be independent with respect to the Funds in accordance with the U.S. federal securities laws and the applicable rules and regulations of the Securities and Exchange Commission and the PCAOB.
We conducted our audits of these financial statements in accordance with the standards of the PCAOB. Those standards require that we plan and perform the audits to obtain reasonable assurance about whether the financial statements are free of material misstatement, whether due to error or fraud.
Our audits included performing procedures to assess the risks of material misstatement of the financial statements, whether due to error or fraud, and performing procedures that respond to those risks. Such procedures included examining, on a test basis, evidence regarding the amounts and disclosures in the financial statements. Our audits also included evaluating the accounting principles used and significant estimates made by management, as well as evaluating the overall presentation of the financial statements. Our procedures included confirmation of securities owned as of December 31, 2020 by correspondence with the custodian and brokers; when replies were not received from brokers, we performed other auditing procedures. We believe that our audits provide a reasonable basis for our opinion.
PricewaterhouseCoopers LLP
Boston, Massachusetts
February 23, 2021
We have served as the auditor of one or more investment companies in the AMG Funds Family since 1993.
| | |
| | |
| | Other Information (unaudited) |
TAX INFORMATION
AMG TimesSquare Small Cap Growth Fund, AMG TimesSquare Mid Cap Growth Fund, AMG TimesSquare International Small Cap Fund, AMG TimesSquare Emerging Markets Small Cap Fund and AMG TimesSquare Global Small Cap Fund each hereby designates the maximum amount allowable of its net taxable income as qualified dividends as provided in the Jobs and Growth Tax Relief Reconciliation Act of 2003. The 2020 Form 1099-DIV you receive for each Fund will show the tax status of all distributions paid to you during the year.
In accordance with federal tax law, the following Funds elect to provide foreign taxes paid and the income sourced from foreign countries. Accordingly, each Fund hereby makes the following designations regarding its taxable period ended December 31, 2020:
AMG TimesSquare International Small Cap Fund
► The total amount of taxes paid and income sourced from foreign countries was $1,122,375 and $13,330,609, respectively.
AMG TimesSquare Emerging Markets Small Cap Fund
► The total amount of taxes paid and income sourced from foreign countries was $3,792 and $170,993, respectively.
Pursuant to section 852 of the Internal Revenue Code, AMG TimesSquare Small Cap Growth Fund, AMG TimesSquare Mid Cap Growth Fund, AMG TimesSquare International Small Cap Fund, AMG TimesSquare Emerging Markets Small Cap Fund and AMG TimesSquare Global Small Cap Fund each hereby designates as a capital gain distribution with respect to the taxable period ended December 31, 2020, $67,616,835, $354,000,243, $0, $0 and $0, respectively, or, if subsequently determined to be different, the net capital gains of such period.
| | |
| | AMG Funds |
| | Trustees and Officers |
| The Trustees and Officers of the Trust, their business addresses, principal occupations for the past five years and ages are listed below. The Trustees provide broad supervision over the affairs of the Trust and the Funds. The Trustees are experienced executives who meet periodically throughout the year to oversee the Funds’ activities, review contractual arrangements with companies that provide services to the Funds, and | review the Funds’ performance. Unless otherwise noted, the address of each Trustee or Officer is the address of the Trust: One Stamford Plaza, 263 Tresser Blvd, Suite 949, Stamford, Connecticut 06901. There is no stated term of office for Trustees. Trustees serve until their resignation, retirement or removal in | accordance with the Trust’s organizational documents and policies adopted by the Board from time to time. The Chairman of the Trustees, President, Treasurer and Secretary of the Trust are elected by the Trustees annually. Other officers hold office at the pleasure of the Trustees. |
Independent Trustees
The following Trustees are not “interested persons” of the Trust within the meaning of the 1940 Act:
| Number of Funds Overseen in | |
| Fund Complex | Name, Age, Principal Occupation(s) During Past 5 Years and Other Directorships Held by Trustee |
● Trustee since 2012 ● Oversees 46 Funds in Fund Complex | Bruce B. Bingham, 72 Partner, Hamilton Partners (real estate development firm) (1987-2020); Director of The Yacktman Funds (2 portfolios) (2000-2012). |
● Trustee since 2013 ● Oversees 49 Funds in Fund Complex | Kurt A. Keilhacker, 57 Managing Partner, TechFund Capital (1997-Present); Managing Partner, TechFund Europe (2000-Present); Managing Partner, Elementum Ventures (2013-Present); Director, MetricStory, Inc. (2017-Present); Trustee, Wheaton College (2018-Present); Trustee, Gordon College (2001-2016); Trustee, Board Member, 6wind SA, (2002-2019). |
● Trustee since 2000 ● Oversees 46 Funds in Fund Complex | Steven J. Paggioli, 70 Independent Consultant (2002-Present); Trustee, Professionally Managed Portfolios (28 portfolios); Advisory Board Member, Sustainable Growth Advisors, LP; Independent Director, Muzinich BDC, Inc. (business development company) (2019-Present); Director, The Wadsworth Group; Independent Director, Chase Investment Counsel (2008–2019); Executive Vice President, Secretary and Director, Investment Company Administration, LLC and First Fund Distributors, INC. (1990-2001). |
● Trustee since 2013 ● Oversees 46 Funds in Fund Complex | Richard F. Powers III, 75 Adjunct Professor, U.S. Naval War College (2016-Present); Adjunct Professor, Boston College (2011-2015); Director, Ameriprise Financial Inc. (2005-2009); President and CEO of Van Kampen Investments Inc. (1998-2003); President, Morgan Stanley Client Group (2000-2002); Executive Vice President and Chief Marketing Officer of the Morgan Stanley Individual Investor Group (1984-1998). |
● Independent Chairman ● Trustee since 2000 ● Oversees 49 Funds in Fund Complex | Eric Rakowski, 62 Professor of Law, University of California at Berkeley School of Law (1990-Present); Tax Attorney at Davis Polk & Wardwell and clerked for Judge Harry T. Edwards of the U.S. Court of Appeals for the District of Columbia Circuit and for Justice William J. Brennan Jr. of the U.S. Supreme Court; Director of Harding, Loevner Funds, Inc. (9 portfolios); Trustee of Third Avenue Trust (3 portfolios) (2002-2019); Trustee of Third Avenue Variable Trust (1 portfolio) (2002-2019). |
● Trustee since 2013 ● Oversees 49 Funds in Fund Complex | Victoria L. Sassine, 55 Adjunct Professor, Babson College (2007–Present); Director, Board of Directors, PRG Group (2017-Present); CEO, Founder, Scale Smarter Partners, LLC (2018-Present); Adviser, EVOFEM Biosciences (2019-Present); Teaching Fellow, Goldman Sachs 10,000 Small Business Initiative (2010-Present); Chairperson of the Board of Directors of Business Management Associates (2018 to 2019). |
● Trustee since 2004 ● Oversees 46 Funds in Fund Complex | Thomas R. Schneeweis, 73 Professor Emeritus, University of Massachusetts (2013-Present); President, TRS Associates (1982-Present); Board Member, Chartered Alternative Investment Association (“CAIA”) (2002-Present); Director, CAIA Foundation (2010-2019); Director, Institute for Global Asset and Risk Management (Education) (2010-Present); Co-Owner, Quantitative Investment Technologies (2014-Present); Co-Owner, Yes Wealth Management (2018-Present); Director of Research, Yes Wealth Management (2018-Present); Partner, S Capital Wealth Advisors (2015-2018); Partner, S Capital Management, LLC (2007-2015); President, Alternative Investment Analytics, LLC, (formerly Schneeweis Partners, LLC) (2001-2013); Finance Professor, University of Massachusetts (1977-2013). |
| | |
| | AMG Funds |
| | Trustees and Officers (continued) |
Interested Trustees
Each Trustee in the following table is an “interested person” of the Trust within the meaning of the 1940 Act. Ms. Carsman is an interested person of the Trust within the meaning of the 1940 Act by virtue of her position with, and interest in securities of, AMG.
| Number of Funds Overseen in | |
| Fund Complex | Name, Age, Principal Occupation(s) During Past 5 Years and Other Directorships Held by Trustee |
● Trustee since 2011 ● Oversees 46 Funds in Fund Complex | Christine C. Carsman, 68 Senior Policy Advisor, Affiliated Managers Group, Inc. (2019-Present); Chair of the Board of Directors, AMG Funds plc (2015-2018); Director, AMG Funds plc (2010-2018); Executive Vice President, Deputy General Counsel and Chief Regulatory Counsel, Affiliated Managers Group, Inc. (2017-2018); Senior Vice President and Deputy General Counsel, Affiliated Managers Group, Inc. (2011-2016); Senior Vice President and Chief Regulatory Counsel, Affiliated Managers Group, Inc. (2007-2011); Vice President and Chief Regulatory Counsel, Affiliated Managers Group, Inc. (2004-2007); Senior Counsel, Vice President and Director of Operational Risk Management and Compliance, Wellington Management Company, LLP (1995-2004); Director of Harding, Loevner Funds, Inc. (9 portfolios) (2017-Present); Secretary and Chief Legal Officer, AMG Funds, AMG Funds I, AMG Funds II and AMG Funds III (2004-2011). |
| Officers | |
Position(s) Held with Fund and Length of Time Served | Name, Age, Principal Occupation(s) During Past 5 Years |
● President since 2018 ● Principal Executive Officer since 2018 ● Chief Executive Officer since 2018 ● Chief Operating Officer since 2007 | Keitha L. Kinne, 62 Chief Operating Officer, AMG Funds LLC (2007-Present); Chief Investment Officer, AMG Funds LLC (2008-Present); President and Principal, AMG Distributors, Inc. (2018-Present); Chief Operating Officer, AMG Distributors, Inc. (2007-Present); President, Chief Executive Officer and Principal Executive Officer, AMG Funds, AMG Funds I, AMG Funds II, AMG Funds III and AMG Funds IV (2018-Present); Chief Operating Officer, AMG Funds, AMG Funds I, AMG Funds II, and AMG Funds III (2007-Present); Chief Operating Officer, AMG Funds IV (2016-Present); Chief Operating Officer and Chief Investment Officer, Aston Asset Management, LLC (2016); President and Principal Executive Officer, AMG Funds, AMG Funds I, AMG Funds II and AMG Funds III (2012-2014); Managing Partner, AMG Funds LLC (2007-2014); President and Principal, AMG Distributors, Inc. (2012-2014); Managing Director, Legg Mason & Co., LLC (2006-2007); Managing Director, Citigroup Asset Management (2004-2006). |
● Secretary since 2015 ● Chief Legal Officer since 2015 | Mark J. Duggan, 55 Senior Vice President and Senior Counsel, AMG Funds LLC (2015-Present); Secretary and Chief Legal Officer, AMG Funds, AMG Funds I, AMG Funds II, AMG Funds III and AMG Funds IV (2015-Present); Attorney, K&L Gates, LLP (2009-2015). |
● Chief Financial Officer since 2017 ● Treasurer since 2017 ● Principal Financial Officer since 2017 ● Principal Accounting Officer since 2017 | Thomas G. Disbrow, 54 Vice President, Mutual Fund Treasurer & CFO, AMG Funds, AMG Funds LLC (2017-Present); Chief Financial Officer, Principal Financial Officer, Treasurer and Principal Accounting Officer, AMG Funds, AMG Funds I, AMG Funds II, AMG Funds III and AMG Funds IV (2017-Present); Managing Director - Global Head of Traditional Funds Product Control, UBS Asset Management (Americas), Inc. (2015-2017); Managing Director - Head of North American Funds Treasury, UBS Asset Management (Americas), Inc. (2011-2015). |
| ● Deputy Treasurer since 2017 | John A. Starace, 50 Director, Mutual Fund Accounting, AMG Funds LLC (2017-Present); Vice President, Deputy Treasurer of Mutual Funds Services, AMG Funds LLC (2014-2017); Deputy Treasurer, AMG Funds, AMG Funds I, AMG Funds II, AMG Funds III and AMG Funds IV (2017-Present); Vice President, Citi Hedge Fund Services (2010-2014); Audit Senior Manager (2005-2010) and Audit Manager (2001-2005), Deloitte & Touche LLP. |
| ● Chief Compliance Officer since 2019 | Patrick J. Spellman, 46 Vice President, Chief Compliance Officer, AMG Funds LLC (2017-Present); Chief Compliance Officer and Sarbanes-Oxley Code of Ethics Compliance Officer, AMG Funds, AMG Funds I, AMG Funds II, AMG Funds III and AMG Funds IV (2019-Present); Chief Compliance Officer, AMG Distributors, Inc., (2010-Present); Senior Vice President, Chief Compliance Officer, AMG Funds LLC (2011-2017); Anti-Money Laundering Compliance Officer, AMG Funds, AMG Funds I, AMG Funds II, and AMG Funds III (2014-2019); Anti-Money Laundering Officer, AMG Funds IV, (2016-2019); Compliance Manager, Legal and Compliance, Affiliated Managers Group, Inc. (2005-2011). |
| ● Assistant Secretary since 2016 | Maureen A. Meredith, 35 Vice President, Counsel, AMG Funds LLC (2019-Present); Director, Counsel, AMG Funds LLC (2017-2018); Vice President, Counsel, AMG Funds LLC (2015-2017); Assistant Secretary, AMG Funds, AMG Funds I, AMG Funds II, AMG Funds III and AMG Funds IV (2016-Present); Associate, Ropes & Gray LLP (2011-2015); Law Fellow, Massachusetts Appleseed Center for Law and Justice (2010-2011). |
| ● Anti-Money Laundering Compliance Officer since 2019 | Hector D. Roman, 43 Director, Legal and Compliance, AMG Funds LLC (2020-Present); Manager, Legal and Compliance, AMG Funds LLC (2017-2019); Director of Compliance, Morgan Stanley Investment Management (2015-2017); Senior Advisory, PricewaterhouseCoopers LLP (2014-2015); Risk Manager, Barclays Investment Bank (2008-2014); Anti-Money Laundering Compliance Officer, AMG Funds, AMG Funds I, AMG Funds II, AMG Funds III and AMG Funds IV (2019-Present). |
THIS PAGE INTENTIONALLY LEFT BLANK
INVESTMENT MANAGER AND ADMINISTRATOR AMG Funds LLC
One Stamford Plaza
263 Tresser Blvd, Suite 949
Stamford, CT 06901
800.548.4539 DISTRIBUTOR AMG Distributors, Inc.
One Stamford Plaza
263 Tresser Blvd, Suite 949
Stamford, CT 06901
800.548.4539 SUBADVISER TimesSquare Capital Management, LLC
7 Times Square
42nd Floor
New York, NY 10036 CUSTODIAN The Bank of New York Mellon
111 Sanders Creek Parkway
East Syracuse, NY 13057 | LEGAL COUNSEL Ropes & Gray LLP
Prudential Tower, 800 Boylston Street
Boston, MA 02199-3600 TRANSFER AGENT BNY Mellon Investment Servicing (US) Inc.
Attn: AMG Funds
4400 Computer Drive
Westborough, MA 01581
800.548.4539 | This report is prepared for the Funds’ shareholders. It is authorized for distribution to prospective investors only when preceded or accompanied by an effective prospectus. To receive a free copy of the prospectus or Statement of Additional Information, which includes additional information about Fund Trustees, please contact us by calling 800.548.4539. Distributed by AMG Distributors, Inc., member FINRA/SIPC. Current net asset values per share for each Fund are available on the Funds’ website at amgfunds.com. A description of the policies and procedures each Fund uses to vote its proxies is available: (i) without charge, upon request, by calling 800.548.4539, or (ii) on the Securities and Exchange Commission’s (SEC) website at sec.gov. For information regarding the Funds’ proxy voting record for the 12-month period ended June 30, call 800.548.4539 or visit the SEC website at sec.gov. The Funds file their complete schedule of portfolio holdings with the SEC for the first and third quarters of each fiscal year as an exhibit to their reports on Form N-PORT. The Funds’ portfolio holdings on Form N-PORT are available on the SEC’s website at sec.gov and the Funds’ website at amgfunds.com. To review a complete list of the Funds’ portfolio holdings, or to view the most recent semi-annual report or annual report, please visit amgfunds.com. |
amgfunds.com
| | AFFILIATE SUBADVISED FUNDS | | | AMG TimesSquare Emerging Markets Small Cap | | | AMG Managers Emerging Opportunities | |
| | | | | AMG TimesSquare Global Small Cap | | | WEDGE Capital Management L.L.P. | |
| | BALANCED FUNDS | | | AMG TimesSquare International Small Cap | | | Next Century Growth Investors LLC | |
| | AMG GW&K Global Allocation | | | AMG TimesSquare Mid Cap Growth | | | RBC Global Asset Management (U.S.) Inc. | |
| | GW&K Investment Management, LLC | | | AMG TimesSquare Small Cap Growth | | | AMG Managers Fairpointe Mid Cap | |
| | | | | TimesSquare Capital Management, LLC | | | Fairpointe Capital LLC | |
| | AMG FQ Global Risk-Balanced | | | | | | | |
| | First Quadrant, L.P. | | | AMG Yacktman | | | AMG Managers LMCG Small Cap Growth | |
| | | | | AMG Yacktman Focused | | | LMCG Investments, LLC | |
| | EQUITY FUNDS | | | AMG Yacktman Focused Fund - Security Selection | | | | |
| | AMG FQ Tax-Managed U.S. Equity | | | Only | | | AMG Managers Montag & Caldwell Growth | |
| | AMG FQ Long-Short Equity | | | AMG Yacktman Special Opportunities | | | Montag & Caldwell, LLC | |
| | First Quadrant, L.P. | | | Yacktman Asset Management LP | | | AMG Managers Pictet International | |
| | AMG Frontier Small Cap Growth | | | | | | Pictet Asset Management Limited | |
| | Frontier Capital Management Co., LLC | | | FIXED INCOME FUNDS | | | | |
| | | | | AMG GW&K Core Bond ESG | | | AMG Managers Silvercrest Small Cap | |
| | AMG GW&K Small Cap Core | | | AMG GW&K Enhanced Core Bond ESG | | | Silvercrest Asset Management Group LLC | |
| | AMG GW&K Small Cap Value | | | AMG GW&K High Income | | | AMG Managers Special Equity | |
| | AMG GW&K Small/Mid Cap | | | AMG GW&K Municipal Bond | | | Ranger Investment Management, L.P. | |
| | AMG GW&K Mid Cap | | | AMG GW&K Municipal Enhanced Yield | | | Lord, Abbett & Co. LLC | |
| | AMG GW&K Emerging Markets Equity | | | GW&K Investment Management, LLC | | | Smith Asset Management Group, L.P. | |
| | AMG GW&K Emerging Wealth Equity | | | | | | Federated MDTA LLC | |
| | AMG GW&K International Small Cap | | | OPEN-ARCHITECTURE FUNDS | | | | |
| | GW&K Investment Management, LLC | | | | | | FIXED INCOME FUNDS | |
| | | | | EQUITY FUNDS | | | AMG Managers DoubleLine Core Plus Bond | |
| | AMG Renaissance Large Cap Growth | | | AMG Managers Brandywine | | | DoubleLine Capital LP | |
| | The Renaissance Group LLC | | | AMG Managers Brandywine Blue | | | AMG Managers Loomis Sayles Bond | |
| | | | | Friess Associates, LLC | | | Loomis, Sayles & Company, L.P. | |
| | AMG River Road Dividend All Cap Value | | | | | | | |
| | AMG River Road Focused Absolute Value | | | AMG Managers CenterSquare Real Estate | | | | |
| | AMG River Road Long-Short | | | CenterSquare Investment Management LLC | | | | |
| | AMG River Road Small-Mid Cap Value | | | | | | | |
| | AMG River Road Small Cap Value | | | | | | | |
| | River Road Asset Management, LLC | | | | | | | |
| | | | | | | | | |
| | | | | | | | | |
| | | | | | | | | |
| | | | | | | | | |
| | | | | | | | | |
| | | | | | | | | |
| | | | | | | | | |
| | | | | | | | | |
Item 2. CODE OF ETHICS
Registrant has adopted a Code of Ethics. See attached Exhibit (a)(1).
Item 3. AUDIT COMMITTEE FINANCIAL EXPERT
Registrant’s Board of Trustees has determined that independent Trustee Mr. Steven J. Paggioli qualifies as an Audit Committee Financial Expert. Mr. Paggioli is “independent” as such term is defined in Form N-CSR.
Item 4. PRINCIPAL ACCOUNTANT FEES AND SERVICES
The aggregate fees billed by the Funds’ independent registered public accounting firm, PricewaterhouseCoopers LLP (“PwC”), to the Funds for the Funds’ two most recent fiscal years for professional services rendered for audits of annual financial statements, or services that are normally provided in connection with statutory and regulatory filings or engagements (“Audit Fees”) were as follows:
| | | | | | | | |
Fund - AMG Funds | | Fiscal 2020 | | | Fiscal 2019 | |
AMG GW&K Municipal Enhanced Yield Fund | | $ | 35,073 | | | $ | 32,108 | |
AMG GW&K Small Cap Core Fund | | $ | 28,423 | | | $ | 25,418 | |
AMG GW&K Municipal Bond Fund | | $ | 43,516 | | | $ | 38,047 | |
AMG GW&K Small/Mid Cap Fund | | $ | 28,244 | | | $ | 26,518 | |
AMG GW&K Small Cap Value Fund | | $ | 29,649 | | | $ | 26,578 | |
AMG TimesSquare Mid Cap Growth Fund | | $ | 38,540 | | | $ | 33,621 | |
AMG TimesSquare Small Cap Growth Fund | | $ | 34,892 | | | $ | 31,379 | |
AMG Times Square International Small Cap Fund | | $ | 37,176 | | | $ | 48,670 | |
AMG TimesSquare Emerging Markets Small Cap Fund | | $ | 35,239 | | | $ | 45,655 | |
AMG TimesSquare Global Small Cap Fund | | $ | 25,510 | | | $ | 20,685 | |
AMG Renaissance Large Cap Growth Fund | | $ | 24,481 | | | $ | 22,499 | |
AMG Yacktman Focused Fund | | $ | 53,766 | | | $ | 43,193 | |
AMG Yacktman Fund | | $ | 75,453 | | | $ | 61,997 | |
AMG Yacktman Special Opportunities Fund | | $ | 31,878 | | | $ | 26,946 | |
AMG Yacktman Focused Fund-Security Selection Only | | $ | 21,744 | | | $ | 24,879 | |
There were no fees billed by PwC to the Funds in its two recent fiscal years for services rendered for assurance and related services that are reasonably related to the performance of the audit or review of the Fund’s financial statements, but are not reported as Audit Fees (“Audit-Related Fees”).
For the Funds’ two most recent fiscal years, there were no Audit-Related Fees billed by PwC for engagements related directly to the operations and financial reporting of one or more Funds by a Fund Service Provider. A Fund Service Provider is (a) any investment adviser to the Fund (not including any Subadvisor whose role is primarily portfolio management and is subcontracted with or overseen by another investment adviser) or (b) any entity that provides ongoing services to the Fund and is controlling, controlled by or under common control with a Fund investment adviser described in (a).
The aggregate fees billed by PwC to the Funds for the two most recent fiscal years for professional services rendered for tax compliance, tax advice, and tax planning (“Tax Fees”) were as follows:
| | | | | | | | |
Fund - AMG Funds | | Fiscal 2020 | | | Fiscal 2019 | |
AMG GW&K Municipal Enhanced Yield Fund | | $ | 6,250 | | | $ | 6,250 | |
AMG GW&K Small Cap Core Fund | | $ | 6,250 | | | $ | 6,250 | |
AMG GW&K Municipal Bond Fund | | $ | 6,250 | | | $ | 6,250 | |
AMG GW&K Small/Mid Cap Fund | | $ | 6,250 | | | $ | 6,250 | |
AMG GW&K Small Cap Value Fund | | $ | 6,250 | | | $ | 6,250 | |
AMG TimesSquare Mid Cap Growth Fund | | $ | 6,250 | | | $ | 6,250 | |
AMG TimesSquare Small Cap Growth Fund | | $ | 6,250 | | | $ | 6,250 | |
AMG Times Square International Small Cap Fund | | $ | 7,450 | | | $ | 7,450 | |
AMG TimesSquare Emerging Markets Small Cap Fund | | $ | 7,450 | | | $ | 7,450 | |
AMG TimesSquare Global Small Cap Fund | | $ | 7,450 | | | $ | 7,450 | |
AMG Renaissance Large Cap Growth Fund | | $ | 6,250 | | | $ | 6,250 | |
AMG Yacktman Focused Fund | | $ | 6,250 | | | $ | 6,250 | |
AMG Yacktman Fund | | $ | 6,250 | | | $ | 6,250 | |
AMG Yacktman Special Opportunities Fund | | $ | 6,250 | | | $ | 6,250 | |
AMG Yacktman Focused Fund-Security Selection Only | | $ | 6,250 | | | $ | 6,250 | |
For the Funds’ two most recent fiscal years, Tax Fees billed by PwC for engagements by Fund Service Providers that related directly to the operations and financial reporting of the Funds were $0 for fiscal 2020 and $0 for fiscal 2019, respectively.
The services for which Tax Fees were charged comprise all services performed by professional staff in PwC’s tax division except those services related to the audit. Typically, this category would include fees for tax compliance, tax planning, and tax advice. Tax compliance, tax advice, and tax planning services include preparation of original and amended tax returns, claims for refund and tax payment-planning services, assistance with tax audits and appeals, tax advice related to
mergers and acquisitions and requests for rulings or technical advice from taxing authorities.
There were no other fees billed by PwC to the Funds for all other non-audit services (“Other Fees”) during the Funds’ two most recent fiscal years. During the same period, there were no Other Fees billed by PwC for engagements by Fund Service Providers that related directly to the operations and financial reporting of the Funds.
(e)(1)According to policies adopted by the Audit Committee, services provided by PwC to the Funds must be pre-approved by the Audit Committee. On an annual basis, the Audit Committee reviews and pre-approves various types of services that PwC may perform for the Funds without specific approval of each engagement, subject to specified budget limitations. As contemplated by the Sarbanes-Oxley Act of 2002 and related SEC rules, the Audit Committee also pre-approves non-audit services provided by PwC to any Fund Service Provider for any engagement that relates directly to the operations and financial reporting of the Funds. Any engagement that is not already pre-approved or that will exceed a pre-approved budget must be submitted to the Audit Committee for pre-approval. The Chairman of the Audit Committee is authorized on behalf of the Board of Trustees and the Audit Committee to approve the engagement of PwC to perform non-audit services subject to certain conditions, including notification to the Audit Committee of such pre-approval not later than the next meeting of the Audit Committee following the date of such pre-approval.
(e)(2) None.
(f) Not applicable.
(g) The aggregate fees billed by PwC in 2020 and 2019 for non-audit services rendered to the Funds and Fund Service Providers were $146,850 and $146,850, respectively. For the fiscal year ended December 31, 2020, this amount reflects the amounts disclosed above in Item 4(b),(c),(d), plus $49,500 in fees billed to the Fund Service Providers for non-audit services that did not relate directly to the operations and financial reporting of the Funds. For the fiscal year ended December 31, 2019, this amount reflects the amounts disclosed above in Item 4(b),(c),(d), with $49,500 in additional fees billed to the Fund Service Providers for non-audit services that did not relate directly to the operations and financial reporting of the Funds.
(h) The Trust’s Audit Committee has considered whether the provision of non-audit services by registrant’s independent registered public accounting firm to the registrant’s investment adviser, and any entity controlling, controlled by, or under common control with the investment adviser that provided ongoing services to the registrant that were not pre-approved by the Committee (because such services did not relate directly to the operations and financial reporting of the registrant) was compatible with maintaining the independence of the independent registered public accounting firm.
Item 5. AUDIT COMMITTEE OF LISTED REGISTRANTS
Not applicable.
Item 6. SCHEDULE OF INVESTMENTS
The schedule of investments in securities of unaffiliated issuers as of the close of the reporting period is included as part of the report to shareholders filed under Item 1 of this form.
Item 7. DISCLOSURE OF PROXY VOTING POLICIES AND PROCEDURES FOR CLOSED-END MANAGEMENT INVESTMENT COMPANIES
Not applicable.
Item 8. PORTFOLIO MANAGERS OF CLOSED-END MANAGEMENT INVESTMENT COMPANIES
Not applicable.
Item 9. PURCHASES OF EQUITY SECURITIES BY CLOSED-END MANAGEMENT INVESTMENT COMPANIES AND AFFILIATED PURCHASERS
Not applicable.
Item 10. SUBMISSION OF MATTERS TO A VOTE OF SECURITY HOLDERS
Not applicable.
Item 11. CONTROLS AND PROCEDURES
(a) The Registrant’s principal executive and principal financial officers have concluded, based on their evaluation of the registrant’s disclosure controls and procedures as of a date within 90 days of the filing of this report, that the Registrant’s disclosure controls and procedures are reasonably designed to ensure that information required to be disclosed by the Registrant on Form N-CSR is recorded, processed, summarized and reported within the required time periods and that information required to be disclosed by the registrant in the reports that it files or submits on Form N-CSR is accumulated and communicated to the Registrant’s management, including its principal executive and principal financial officers, as appropriate to allow timely decisions regarding required disclosure.
(b) There were no changes in the Registrant’s internal control over financial reporting during the period covered by this report that have materially affected, or are reasonably likely to materially affect, the internal control over financial reporting.
Item 12. DISCLOSURE OF SECURITIES LENDING ACTIVITIES FOR CLOSED-END MANAGEMENT INVESTMENT COMPANIES
Not applicable.
SIGNATURES
Pursuant to the requirements of the Securities Exchange Act of 1934 and the Investment Company Act of 1940, the registrant has duly caused this report to be signed on its behalf by the undersigned, thereunto duly authorized.
| | |
| AMG FUNDS |
| |
| By: | | /s/ Keitha L. Kinne |
| | Keitha L. Kinne, Principal Executive Officer |
| |
| Date: | | March 4, 2021 |
Pursuant to the requirements of the Securities Exchange Act of 1934 and the Investment Company Act of 1940, this report has been signed below by the following persons on behalf of the registrant and in the capacities and on the dates indicated.
| | |
| By: | | /s/ Keitha L. Kinne |
| | Keitha L. Kinne, Principal Executive Officer |
| |
| Date: | | March 4, 2021 |
| |
| By: | | /s/ Thomas Disbrow |
| | Thomas Disbrow, Principal Financial Officer |
| |
| Date: | | March 4, 2021 |