UNITED STATES
SECURITIES AND EXCHANGE COMMISSION
Washington, D.C. 20549
FORM N-CSR
CERTIFIED SHAREHOLDER REPORT OF REGISTERED
MANAGEMENT INVESTMENT COMPANIES
Investment Company Act file number: 811-09521
AMG Funds
(Exact name of registrant as specified in charter)
680 Washington Boulevard, Suite 500, Stamford, Connecticut 06901
(Address of principal executive offices) (Zip code)
AMG Funds LLC
680 Washington Boulevard, Suite 500, Stamford, Connecticut 06901
(Name and address of agent for service)
Registrant’s telephone number, including area code: (203) 299-3500
Date of fiscal year end: October 31
Date of reporting period: November 1, 2020 – October 31, 2021
(Annual Shareholder Report)
| Item 1. | Reports to Shareholders |
| | |
 | | ANNUAL REPORT |
| | | | | | | | |
| | | | | AMG Funds October 31, 2021 
AMG GW&K Core Bond ESG Fund |
| | | | | |
| | | | | Class N: MBGVX | | Class I: MBDFX | | Class Z: MBDLX |
| | | | | |
| | | |
| | | | | AMG GW&K Emerging Markets Equity Fund |
| | | | | |
| | | | | Class N: TLEVX | | Class I: TLESX | | Class Z: TLEIX |
| | | |
| | | | | AMG GW&K Emerging Wealth Equity Fund |
| | | | | |
| | | | | Class N: TYWVX | | Class I: TYWSX | | Class Z: TYWIX |
| | | | | AMG GW&K Small/Mid Cap Growth Fund (formerly AMG GW&K Small Cap Fund II, which was formerly AMG Managers LMCG Small Cap Growth Fund) |
| | | | | |
| | | | | Class N: ACWDX | | Class I: ACWIX | | Class Z: ACWZX |
| | | | | |
| | | | | | | | | |
| | |
| amgfunds.com | | 103121 AR069 |
| | |
| | | AMG Funds Annual Report — October 31, 2021 |
| | | | | | |
| | | |
| | | | | | | |
| | | TABLE OF CONTENTS | | PAGE | |
| | | | |
| | | LETTER TO SHAREHOLDERS | | | 2 | |
| | | |
| | | ABOUT YOUR FUND’S EXPENSES | | | 3 | |
| | | |
| | | PORTFOLIO MANAGER’S COMMENTS, FUND SNAPSHOTS AND SCHEDULES OF PORTFOLIO INVESTMENTS | | | | |
| | | |
| | | AMG GW&K Core Bond ESG Fund | | | 4 | |
| | | |
| | | AMG GW&K Emerging Markets Equity Fund | | | 12 | |
| | | |
| | | AMG GW&K Emerging Wealth Equity Fund | | | 19 | |
| | | |
| | | AMG GW&K Small/Mid Cap Growth Fund | | | 25 | |
| | | |
| | | FINANCIAL STATEMENTS | | | | |
| | | |
| | | Statement of Assets and Liabilities | | | 31 | |
| | | |
| | | Balance sheets, net asset value (NAV) per share computations
and cumulative distributable earnings (loss) | | | | |
| | | |
| | | Statement of Operations | | | 33 | |
| | | |
| | | Detail of sources of income, expenses, and realized and
unrealized gains (losses) during the fiscal year | | | | |
| | | |
| | | Statements of Changes in Net Assets | | | 34 | |
| | | |
| | | Detail of changes in assets for the past two fiscal years | | | | |
| | | |
| | | Financial Highlights | | | 36 | |
| | | |
| | | Historical net asset values per share, distributions, total returns, income
and expense ratios, turnover ratios and net assets | | | | |
| | | |
| | | Notes to Financial Statements | | | 48 | |
| | | |
| | | Accounting and distribution policies, details of agreements and
transactions with Fund management and affiliates, and descriptions
of certain investment risks | | | | |
| | | |
| | | REPORT OF INDEPENDENT REGISTERED PUBLIC ACCOUNTING FIRM | | | 57 | |
| | | |
| | | OTHER INFORMATION | | | 58 | |
| | | |
| | | TRUSTEES AND OFFICERS | | | 60 | |
| | | |
| | | ANNUAL RENEWAL OF INVESTMENT MANAGEMENT AND SUBADVISORY AGREEMENTS | | | 63 | |
| | | | | | | |
|
| Nothing contained herein is to be considered an offer, sale or solicitation of an offer to buy shares of any series of the AMG Funds Family of Funds. Such offering is made only by prospectus, which includes details as to offering price and other material information. | |
| | |
 | | Letter to Shareholders |
Dear Shareholder:
The fiscal year ended October 31, 2021, was marked by the continued extraordinary recovery amid an unprecedented global effort to stop the COVID-19 pandemic. Equities rallied to new record highs amid better-than-expected corporate earnings, colossal fiscal and monetary stimulus programs, and an improving economic backdrop. Since the market bottom on March 23, 2020, the S&P 500® Index has gained over 111%. Businesses and consumers contended with disrupted supply chains and rising prices on a wide range of goods such as lumber and gasoline, and outbreaks of coronavirus variants kept the world on edge. Volatility increased in September as investors grew more concerned about rising inflation and more hawkish global central bank policies, but equities were resilient and finished the fiscal year with a strong rally.
The S&P 500® gained 42.91% during the period and all sectors produced double-digit returns, but there was very wide dispersion in performance. Energy and financials led the market with returns of 111.38% and 72.14%, respectively. On the other hand, utilities and consumer staples lagged with returns of 10.64% and
19.02%, respectively. Value stocks edged out Growth stocks as the Russell 1000® Value Index returned 43.76% compared to the 43.21% return for the Russell 1000® Growth Index. Small cap stocks outperformed as the Russell 2000® Index experienced its best quarter (fourth quarter 2020) on record. Within small caps, the Value-Growth disparity was much more pronounced as the Russell 2000® Value Index returned 64.30% compared to 38.45% for the Russell 2000® Growth Index. Outside the U.S., foreign developed markets lagged their U.S. counterparts with a 34.18% return for the MSCI EAFE Index. A major regulatory crackdown in China shook investor confidence in Chinese equities and caused emerging markets to underperform with a 16.96% return for the MSCI Emerging Markets Index.
Interest rates lifted off from near-historic lows as the vaccine rollout initiated a return to normalcy and the economic outlook improved. The 10-year Treasury yield rose 69 basis points to 1.55% and ended the fiscal year not far off its post-pandemic high. The Bloomberg U.S. Aggregate Bond Index, a broad measure of U.S. bond market performance, lost 0.48% over the period. Healthy risk appetite drove credit spreads tighter and helped investment-grade corporate bonds produce a modestly positive 2.18% return. The global search for yield helped high-yield bonds outperform the investment-grade market with a 10.53% return as measured by the return of the Bloomberg U.S. Corporate High Yield Bond Index. Municipal bonds benefited from a strong technical backdrop and drove a 2.64% return for the Bloomberg Municipal Bond Index.
AMG Funds appreciates the privilege of providing investment tools to you and your clients. Our foremost goal is to provide investment solutions that help our shareholders successfully reach their long-term investment goals. AMG Funds provides access to a distinctive array of actively managed return-oriented investment strategies. We thank you for your continued confidence and investment in AMG Funds. You can rest assured that under all market conditions our team is focused on delivering excellent investment management services for your benefit.
Respectfully,

Keitha Kinne
President
AMG Funds
| | | | | | | | | | | | | | |
Average Annual Total Returns | | Periods ended October 31, 2021* | |
| | | | |
| Stocks: | | | | 1 Year | | | 3 Years | | | 5 Years | |
| | | | |
Large Cap | | (S&P 500® Index) | | | 42.91 | % | | | 21.48% | | | | 18.93% | |
| | | | |
Small Cap | | (Russell 2000® Index) | | | 50.80 | % | | | 16.47% | | | | 15.52% | |
| | | | |
International | | (MSCI All Country World Index ex USA) | | | 29.66 | % | | | 12.00% | | | | 9.77% | |
| Bonds: | | | | | | | | | | | |
| | | | |
Investment Grade | | (Bloomberg U.S. Aggregate Bond Index) | | | (0.48 | )% | | | 5.63% | | | | 3.10% | |
| | | | |
High Yield | | (Bloomberg U.S. Corporate High Yield Bond Index) | | | 10.53 | % | | | 7.43% | | | | 6.40% | |
| | | | |
Tax-exempt | | (Bloomberg Municipal Bond Index) | | | 2.64 | % | | | 5.17% | | | | 3.41% | |
| | | | |
Treasury Bills | | (ICE BofAML U.S. 6-Month Treasury Bill Index) | | | 0.11 | % | | | 1.37% | | | | 1.32% | |
*Source: FactSet. Past performance is no guarantee of future results.
2
|
About Your Fund’s Expenses |
| | | | | | | | |
As a shareholder of a Fund, you may incur two types of costs: (1) transaction costs, which may include sales charges (loads) on purchase payments; redemption fees; and exchange fees; and (2) ongoing costs, including management fees; distribution (12b-1) fees; and other Fund expenses. This example is intended to help you understand your ongoing costs (in dollars) of investing in the Fund and to compare these costs with the ongoing costs of investing in other mutual funds. The example is based on $1,000 invested at the beginning of the period and held for the entire period as indicated below. ACTUAL EXPENSES The first line of the following table provides information about the actual account values and | | | | actual expenses. You may use the information in this line, together with the amount you invested, to estimate the expenses that you paid over the period. Simply divide your account value by $1,000 (for example, an $8,600 account value divided by $1,000 = 8.6), then multiply the result by the number in the first line under the heading entitled “Expenses Paid During Period” to estimate the expenses you paid on your account during this period. HYPOTHETICAL EXAMPLE FOR COMPARISON PURPOSES The second line of the following table provides information about hypothetical account values and hypothetical expenses based on the Fund’s actual expense ratio and an assumed annual rate of return of 5% before expenses, which is not the Fund’s | | | | actual return. The hypothetical account values and expenses may not be used to estimate the actual ending account balance or expenses you paid for the period. You may use this information to compare the ongoing costs of investing in the Fund and other funds by comparing this 5% hypothetical example with the 5% hypothetical examples that appear in the shareholder reports of other funds. Please note that the expenses shown in the table are meant to highlight your ongoing costs only and do not reflect any transactional costs, such as sales charges (loads), redemption fees, or exchange fees. Therefore, the second line of the table is useful in comparing ongoing costs only, and will not help you determine the relative total costs of owning different funds. |
| |
| | | | | | | | |
| | | | |
Six Months Ended October 31, 2021 | | Expense
Ratio for
the Period | | Beginning
Account
Value
05/01/21 | | Ending
Account
Value
10/31/21 | | Expenses
Paid
During
the Period* |
AMG GW&K Core Bond ESG Fund |
|
Based on Actual Fund Return |
| | | | |
Class N | | 0.88% | | $1,000 | | $1,007 | | $4.45 |
| | | | |
Class I | | 0.56% | | $1,000 | | $1,008 | | $2.83 |
| | | | |
Class Z | | 0.48% | | $1,000 | | $1,009 | | $2.43 |
|
Based on Hypothetical 5% Annual Return |
| | | | |
Class N | | 0.88% | | $1,000 | | $1,021 | | $4.48 |
| | | | |
Class I | | 0.56% | | $1,000 | | $1,022 | | $2.85 |
| | | | |
Class Z | | 0.48% | | $1,000 | | $1,023 | | $2.45 |
AMG GW&K Emerging Markets Equity Fund |
|
Based on Actual Fund Return |
| | | | |
Class N | | 1.27% | | $1,000 | | $904 | | $6.09 |
| | | | |
Class I | | 0.96% | | $1,000 | | $905 | | $4.61 |
| | | | |
Class Z | | 0.87% | | $1,000 | | $905 | | $4.18 |
|
Based on Hypothetical 5% Annual Return |
| | | | |
Class N | | 1.27% | | $1,000 | | $1,019 | | $6.46 |
| | | | |
Class I | | 0.96% | | $1,000 | | $1,020 | | $4.89 |
| | | | |
Class Z | | 0.87% | | $1,000 | | $1,021 | | $4.43 |
AMG GW&K Emerging Wealth Equity Fund |
|
Based on Actual Fund Return |
| | | | |
Class N | | 1.24% | | $1,000 | | $860 | | $5.81 |
| | | | |
Class I | | 0.94% | | $1,000 | | $861 | | $4.41 |
| | | | |
Class Z | | 0.84% | | $1,000 | | $862 | | $3.94 |
|
Based on Hypothetical 5% Annual Return |
| | | | |
Class N | | 1.24% | | $1,000 | | $1,019 | | $6.31 |
| | | | |
Class I | | 0.94% | | $1,000 | | $1,020 | | $4.79 |
| | | | |
Class Z | | 0.84% | | $1,000 | | $1,021 | | $4.28 |
| | | | | | | | |
| | | | |
Six Months Ended October 31, 2021 | | Expense
Ratio for
the Period | | Beginning
Account
Value
05/01/21 | | Ending
Account
Value
10/31/21 | | Expenses
Paid
During
the Period* |
AMG GW&K Small/Mid Cap Growth Fund |
|
Based on Actual Fund Return |
| | | | |
Class N | | 1.07% | | $1,000 | | $1,109 | | $5.69 |
| | | | |
Class I | | 0.93% | | $1,000 | | $1,110 | | $4.95 |
| | | | |
Class Z** | | 0.82% | | $1,000 | | $1,031 | | $1.39 |
|
Based on Hypothetical 5% Annual Return |
| | | | |
Class N | | 1.07% | | $1,000 | | $1,020 | | $5.45 |
| | | | |
Class I | | 0.93% | | $1,000 | | $1,021 | | $4.74 |
| | | | |
Class Z** | | 0.82% | | $1,000 | | $1,021 | | $4.18 |
| * | Expenses are equal to the Fund’s annualized expense ratio multiplied by the average account value over the period, multiplied by the number of days in the most recent fiscal half-year (184), then divided by 365. |
| ** | Commencement of operations was August 31, 2021. Expenses are equal to the Fund’s annualized expense ratio multiplied by the average account value over the period, multiplied by the number of days since inception (61), then divided by 365. |
3
|
AMG GW&K Core Bond ESG Fund Portfolio Manager’s Comments (unaudited) |
| | | | | | | | |
THE YEAR IN REVIEW For the 12 months ending October 31, 2021, AMG GW&K Core Bond ESG Fund’s (the “Fund”) Class I shares returned 0.15%, compared to the return of (0.48%) for the Bloomberg U.S. Aggregate Bond Index (the “Index”). OVERVIEW GW&K Investment Management, LLC (“GWK”) believes that responsible corporate behavior with respect to ESG (environmental, social, and governance) factors can lead to positive and sustainable long-term financial performance and aligns with our pursuit of quality investments. GW&K has been incorporating ESG factors into our equity and fixed income analysis process for several years, and as a signatory of the UN Principles for Responsible Investment, we are committed to incorporating the assessment of ESG issues into our fundamental research process. We believe ESG investing adds value to our investment process by improving our assessment of risk and enhancing our ability to identify high-quality credits; aids our up-in-quality bias by improving identification of credits with less long-term volatility; limits our exposure to credit ratings downgrades and negative events that are difficult to quantify; and deepens our fundamental credit analysis and leads to better outcomes by providing a more nuanced and complete picture. ESG considerations have long informed our process. We focus on business and credit fundamentals, relative valuation, and technical considerations. We believe ESG factors are important considerations in analyzing a company’s business and financial policy and that they highlight non-financial risks that can significantly affect a company’s financial health over the long term. Just as with credit risks, investors require additional compensation for ESG risks, leading to potential inefficiencies in valuation. MARKET OVERVIEW The beginning of the fiscal year in late 2020 represented a major inflection point for fixed income markets, as the most dominant trading narratives of 2020 were either resolved or significantly advanced. The closely contested U.S. election was decided, another round of fiscal stimulus was passed, and, most importantly, several COVID-19 vaccines were approved for worldwide distribution. But while some of 2020’s most salient overhangs have been removed, the year ahead promised challenges of its own. On the political front, the incoming administration certainly had its work cut out for itself | | | | in advancing meaningful legislation, with implications ranging from additional stimulus to changes in the regulatory landscape. The speed at which vaccines were distributed is likewise a point of uncertainty, to say nothing of how effective it will ultimately be at slowing the spread of the virus. Meanwhile, the economy continued its slow climb out of the recent downturn as businesses and consumers adapt to a post-COVID-19 world. Importantly for the bond market, the possibility of adverse outcomes is likely to be mitigated by the U.S. Federal Reserve (Fed). The central bank continues to exert massive influence over capital markets, and policymakers remain clear in their intentions to ensure their smooth functioning. Fixed income markets posted their worst returns since 1981 in the first quarter of 2021 amid a sharp rebound in growth expectations and burgeoning fears of higher inflation. The success of the nationwide vaccine rollout, a rapidly healing labor market, and swelling consumer confidence continued to drive the reflation narrative. Further support came in the form of a $1.9 trillion fiscal stimulus package on top of a commitment to ultra-loose monetary policy from the Fed. And beyond that, investors were confronted with the possibility of yet more fiscal support with a proposal of infrastructure spending. This combination of factors amounted to nothing less than a wholesale regime shift for a bond market that until just a few months ago struggled with an anemic growth outlook and fears of deflation. Fixed income markets rebounded solidly in the second quarter of 2021 following their worst selloff in decades. The most prominent catalyst behind the first-quarter rout—the threat of sharply faster economic growth and elevated inflation—proved far less menacing in light of lackluster data and a less dovish the Fed. In addition to the overhang of COVID-19, including fears of new variants and the elusiveness of herd immunity, signs began to emerge that the pace of the recovery had peaked. Nonfarm payrolls posted successive disappointing results, the manufacturing resurgence stalled, and retail sales slipped. Some of the more sensational commodity price spikes began to roll over as well, casting further doubt on the persistence of recent inflationary pressures. None of this suggests that the recovery is off track, but the bond market’s stubborn resilience points to a marked revision of the timeframe for normalization. Fixed income markets were essentially unchanged in the third quarter of 2021 despite a steady succession of headlines related to COVID-19, geopolitics, and | | | | price increases. Bond investors’ largely sanguine response to these challenges suggests they have been able to look beyond near-term headwinds toward the next stage of the recovery. The Delta variant drove a massive surge in cases across much of the U.S., even as new prevention and treatment options continued to emerge and data suggest cases have crested. Chinese authorities enacted assertive regulatory changes and pursued efforts to reduce systemic leverage, while nevertheless framing both as necessary to achieve long-term stability and prosperity. Supply-chain constraints, energy shortages, and limited labor availability threatened to weigh on growth around the world, but there have been few indications that these market failures reflect any weakness in aggregate demand. On balance, these various obstacles seem to have been relegated to the category of one-time items, and the bond market has demonstrated little concern that they represent a meaningful threat to the current trading regime. The Treasury yield curve flattened significantly in the month of October. The front end moved sharply higher amid elevated inflation fears, as the yield on the two-year jumped to a new post-pandemic high. Rates farther out the curve were more subdued, with the long end even enjoying a slight rally, as investors tempered their longer-term growth outlook. Inflation breakevens closed at the top of a multi-decade range. FUND REVIEW The Fund modestly outperformed the Index for the one-year period ended October 31, 2021. The above-benchmark allocation to spread product was the main contributor to returns. Specifically, an overweight to investment-grade corporate bonds helped as did an overweight to taxable municipals. An out of benchmark allocation to fixed-to-floating bonds also added to performance. The Fund’s notable underweight was to the Treasury sector, which underperformed. Security selection also helped returns, with positive results experienced in consumer cyclicals and consumer non-cyclicals as well as agency mortgage-backed securities (MBS) and taxable municipals. On the negative side, selection in capital goods, communications, and agency Collateralized MBS detracted. The Fund’s duration positioning also contributed. Rates rose during the period and the Fund’s shorter duration compared to the Index proved favorable. On the other hand, yield curve positioning subtracted from performance, as the Fund had modest underweights |
4
|
AMG GW&K Core Bond ESG Fund Portfolio Manager’s Comments (continued) |
| | | | | | | | |
to the short and long ends of the curve. The former saw yields fall in some spots, while the latter did not rise as much as other maturities. ESG continues to be a growing area of focus for the corporate bond market. The range of companies publishing sustainability reports and setting related goals and targets increased significantly this year. Large companies in even some of the highest emitting industries, like autos, oil & gas, and steel, set long-term reduction targets and committed to significant sustainability investments. Following this trend, 2021 will be another record-shattering year for ESG-labeled bond issuance, with green bonds dominating the market as investors clamor for ESG-related investments. While we continue to selectively add ESG-labeled bonds, we remain focused on avoiding corporate issuers with weaker ESG-related practices. We conducted the following trades based on ESG factors over the period: We purchased a Republic of Chile bond, a green bond that also allowed for diversification. The position was subsequently sold on potential for elevated political risk. We sold Cheniere on ESG concerns regarding its carbon profile. | | | | We exited T-Mobile due to ESG concerns surrounding its data breach. OUTLOOK The increasingly hawkish tone of commentary from central banks around the world has raised the temperature of rhetoric on both sides of the transitory versus structural inflation debate. In the former camp are those who caution that responding too hastily to one-time supply side-related shortages would result in a policy error; those in the latter camp fret that authorities are already behind the curve and that tapering should have begun months ago. The slope of the yield curve offers little clarity and points to a stalemate for now, sitting at or very near its multi-decade average (depending on which tenors you consider). While we recognize merits on both sides of the argument, we continue to see more risk to the upside in rates than the downside and thus remain broadly shorter than our benchmarks. We also see a more appealing risk profile in intermediate maturities in comparison to the long end, which would experience the greatest volatility in the event of a sharp move higher in rates. Our outlook for corporate credit remains constructive and we believe the space offers the most compelling value in the fixed income market. Insofar as Treasury yields sit near historic lows, corporates offer an attractive yield advantage, and in the event that | | | | rates begin to rise they offer a potential buffer. Additionally, as the recovery continues to unfold, we see opportunities in credit-improvement stories that could benefit from spread compression and that would generate further excess returns. The higher-rated segments of the high yield market in particular are rich in these opportunities, given the number of issuers downgraded from Investment Grade (“IG”) last year that are poised to regain their former IG status. We also anticipate further outperformance in select segments of the consumer-oriented sectors, while remaining wary of potential challenges posed by supply chain stresses. We are still neutral on the mortgage space in advance of the Fed’s tapering, but the recent uptick in mortgage rates offers a first step toward improving our confidence in the prepayment outlook. Our preference for higher-coupon, seasoned pools has already begun paying off as duration for the benchmark has lengthened into the rates selloff. Given that we expect this trend to persist, we maintain this preference within the MBS space. The views expressed represent the opinions of GW&K Investment Management, LLC as of October 31, 2021, and are not intended as a forecast or guarantee of future results, and are subject to change without notice. |
5
|
AMG GW&K Core Bond ESG Fund Portfolio Manager’s Comments (continued) |
|
CUMULATIVE TOTAL RETURN PERFORMANCE AMG GW&K Core Bond ESG Fund’s cumulative total return is based on the daily change in net asset value (NAV), and assumes that all dividends and distributions were reinvested. This graph compares a hypothetical $10,000 investment made in the AMG GW&K Core Bond ESG Fund’s Class I shares on October 31, 2011, to a $10,000 investment made in the Bloomberg U.S. Aggregate Bond Index for the same time period. The graph and table do not reflect the deduction of taxes that a shareholder would pay on a Fund distribution or redemption of shares. The listed returns for the Fund are net of expenses and the returns for the index exclude expenses. Total returns would have been lower had certain expenses not been reduced. 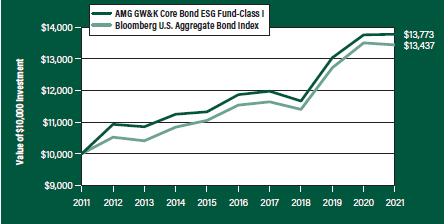
The table below shows the average annual total returns for the AMG GW&K Core Bond ESG Fund and the Bloomberg U.S. Aggregate Bond Index for the same time periods ended October 31, 2021. |
| | | | | | | | | | | | | | | | | | | | |
| Average Annual Total Returns1 | | One
Year | | | Five
Years | | | Ten
Years | | | Since
Inception | | | Inception
Date | |
AMG GW&K Core Bond ESG Fund2, 3, 4, 5, 6, 7, 8, 9 | | | | | |
| | | | | |
Class N | | | (0.27 | %) | | | 2.69 | % | | | – | | | | 2.63 | % | | | 05/08/15 | |
| | | | | |
Class I | | | 0.15 | % | | | 3.03 | % | | | 3.25% | | | | 5.64 | % | | | 04/30/93 | |
| | | | | |
Class Z | | | 0.13 | % | | | 3.11 | % | | | – | | | | 3.05 | % | | | 05/08/15 | |
| | | | | |
Bloomberg U.S. Aggregate Bond Index10 | | | (0.48 | %) | | | 3.10 | % | | | 3.00% | | | | 5.13 | % | | | 04/30/93 | † |
The performance data shown represents past performance. Past performance is not a guarantee of future results. Current performance may be lower or higher than the performance data quoted. The investment return and principal value of an investment will fluctuate so that an investor’s shares, when redeemed, may be worth more or less than their original cost.
Investors should carefully consider the Fund’s investment objectives, risks, charges and expenses before investing. For performance information through the most recent month end, current net asset values per share for the Fund and other information, please call 800.548.4539 or visit our website at amgfunds.com for a free prospectus. Read it carefully before investing or sending money.
Distributed by AMG Distributors, Inc., member FINRA/SIPC.
| † | Date reflects inception date of the Fund, not the index. |
| 1 | Total return equals income yield plus share price change and assumes reinvestment of all dividends and capital gain distributions. Returns are net of fees and may reflect offsets of Fund expenses as described in the prospectus. No adjustment has been made for taxes payable by shareholders on their reinvested dividends and |
|
capital gain distributions. Returns for periods greater than one year are annualized. The listed returns on the Fund are net of expenses and based on the published NAV as of October 31, 2021. All returns are in U.S. dollars($). 2 From time to time, the Fund’s advisor has waived its fees and/or absorbed Fund expenses, which has resulted in higher returns. 3 To the extent that the Fund invests in asset-backed or mortgage-backed securities, its exposure to prepayment and extension risks may be greater than investments in other fixed income securities. 4 Active and frequent trading of a fund may result in higher transaction costs and increased tax liability. 5 The Fund is subject to the risks associated with investments in debt securities, such as default risk and fluctuations in the perception of the debtor’s ability to pay its creditors. Changing interest rates may adversely affect the value of an investment. An increase in interest rates typically causes the value of bonds and other fixed income securities to fall. 6 The Fund may invest in derivatives such as options and futures; the complexity and rapidly changing structure of derivatives markets may increase the possibility of market losses. |
7 Many bonds have call provisions which allow the debtors to pay them back before maturity. This is especially true with mortgage securities, which can be paid back anytime. Typically debtors prepay their debt when it is to their advantage (when interest rates drop making a new loan at current rates more attractive), and thus likely to the disadvantage of bondholders, who may have to reinvest prepayment proceeds in securities with lower yields. Prepayment risk will vary depending on the provisions of the security and current interest rates relative to the interest rate of the debt. 8 Market prices of investments held by the Fund may fall rapidly or unpredictably due to a variety of economic or political factors, market conditions, disasters or public health issues, or in response to events that affect particular industries or companies. 9 Applying the Fund’s ESG investment criteria may result in the selection or exclusion of securities of certain issuers for reasons other than performance, and the Fund may underperform funds that do not utilize an ESG investment strategy. The application of this strategy may affect the Fund’s exposure to certain companies, sectors, regions, countries or types of investments, which could negatively impact the Fund’s performance depending on whether such investments are in or out of favor. Applying ESG criteria to investment decisions is qualitative and subjective by nature, and there is no guarantee that the criteria utilized by the Subadviser or any judgment exercised by the |
| |
6
|
AMG GW&K Core Bond ESG Fund Portfolio Manager’s Comments (continued) |
| | | | | | | | |
Subadviser will reflect the beliefs or values of any particular investor. 10 The Bloomberg U.S. Aggregate Bond Index is an index of the U.S. investment-grade fixed-rate bond market, including both government and corporate bonds. Unlike the Fund, the Bloomberg U.S. Aggregate Bond Index is unmanaged, is not available for investment, and does not incur expenses. | | | | “Bloomberg®” and Bloomberg U.S. Aggregate Bond Index are service marks of Bloomberg Finance L.P. and its affiliates, including Bloomberg Index Services Limited (“BISL”), the administrator of the index (collectively, “Bloomberg”) and have been licensed for use for certain purposes by AMG Funds LLC. Bloomberg is not affiliated with AMG Funds LLC, and Bloomberg does not approve, endorse, review, or recommend the AMG GW&K Core Bond ESG Fund. | | | | Bloomberg does not guarantee the timeliness, accurateness, or completeness of any data or information relating to the AMG GW&K Core Bond ESG Fund. Not FDIC insured, nor bank guaranteed. May lose value. |
7
|
AMG GW&K Core Bond ESG Fund Fund Snapshots (unaudited) October 31, 2021 |
PORTFOLIO BREAKDOWN
| | | | | |
| Category | | % of
Net Assets |
| | |
U.S. Government and Agency Obligations | | | | 46.6 | |
| | |
Corporate Bonds and Notes | | | | 40.5 | |
| | |
Municipal Bonds | | | | 7.6 | |
| | |
Foreign Government Obligations | | | | 0.7 | |
| | |
Other Assets Less Liabilities | | | | 4.6 | |
| |
| Rating | | % of Market Value1 |
| | |
U.S. Government and Agency Obligations | | | | 48.9 | |
| | |
Aaa/AAA | | | | 3.4 | |
| | |
Aa/AA | | | | 13.4 | |
| | |
A | | | | 8.7 | |
| | |
Baa/BBB | | | | 25.6 | |
|
| |
TOP TEN HOLDINGS
| | |
| Security Name | | % of
Net Assets |
| | |
U.S. Treasury Bonds, 2.250%, 05/15/41 | | 3.5 |
| | |
United States Treasury Notes, 2.000%, 11/30/22 | | 3.0 |
| | |
U.S. Treasury Bonds, 6.250%, 08/15/23 | | 2.8 |
| | |
FHLMC, 3.500%, 10/01/45 | | 2.7 |
| | |
U.S. Treasury Bonds, 1.875%, 02/15/51 | | 2.2 |
| | |
California State General Obligation, School Improvements, 7.550%, 04/01/39 | | 2.1 |
| | |
The Bank of Nova Scotia, 0.594%, 03/02/26 (Canada) | | 2.0 |
| | |
FHLMC, 3.000%, 11/01/49 | | 2.0 |
| | |
Verizon Communications, Inc., 3.875%, 02/08/29 | | 1.9 |
| | |
FHLMC, 2.500%, 10/01/34 | | 1.8 |
| | | |
| | |
Top Ten as a Group | | 24.0 |
| | |
| 1 | Includes market value of long-term fixed-income securities only. |
Credit quality ratings shown above reflect the highest rating assigned by either Standard & Poor’s (“S&P”) or Moody’s Investors Service, Inc. (“Moody’s”). These rating agencies are independent, nationally recognized statistical rating organizations and are widely used. Investment grade ratings are credit ratings of BBB/Baa or higher. Below investment grade ratings are credit ratings of BB/Ba or lower. Investments designated N/R are not rated by any of the rating agencies. Unrated investments do not necessarily indicate low credit quality. Credit quality ratings are subject to change.
Because a fund’s strategy may result in multiple investments in particular sectors of the economy, its performance may depend on the performance of those sectors and may fluctuate more widely than investments diversified across more sectors. For additional information on these and other risk considerations, please see the Fund’s prospectus.
Any sectors, industries, or securities discussed should not be perceived as investment recommendations. Mention of a specific security should not be considered a recommendation to buy or solicitation to sell that security. Specific securities mentioned in this report may have been sold from the Fund’s portfolio of investments by the time you receive this report.
8
|
AMG GW&K Core Bond ESG Fund Schedule of Portfolio Investments October 31, 2021 |
| | | | | | | | |
| | | Principal
Amount | | | Value | |
Corporate Bonds and Notes - 40.5% | | | | | |
| | |
Financials - 16.5% | | | | | | | | |
| | |
Air Lease Corp.
MTN, 3.000%, 02/01/30 | | | $2,113,000 | | | | $2,137,099 | |
| | |
Ally Financial, Inc.
8.000%, 11/01/31 | | | 1,404,000 | | | | 2,010,281 | |
| | |
American Express Co. | | | | | | | | |
(3.550% to 09/15/26 then U.S. Treasury Yield Curve CMT 5 year + 2.854%), 3.550%, 09/15/261,2,3 | | | 1,423,000 | | | | 1,430,115 | |
| | |
Bank of America Corp. | | | | | | | | |
MTN, (4.330% to 03/15/49 then 3 month LIBOR + 1.520%), 4.330%, 03/15/501,3 | | | 1,600,000 | | | | 1,990,795 | |
| | |
The Bank of New York Mellon Corp. | | | | | | | | |
MTN, 2.450%, 08/17/26 | | | 937,000 | | | | 979,113 | |
Series G, (4.700% to 09/20/25 then U.S. Treasury Yield Curve CMT 5 year + 4.358%), 4.700%, 09/20/251,2,3 | | | 910,000 | | | | 990,262 | |
| | |
The Bank of Nova Scotia (Canada) | | | | | | | | |
(SOFR + 0.545%), 0.594%, 03/02/263 | | | 3,986,000 | | | | 3,985,123 | |
| | |
Boston Properties, LP 3.400%, 06/21/29 | | | 1,841,000 | | | | 1,973,935 | |
| | |
The Charles Schwab Corp. | | | | | | | | |
Series I, (4.000% to 06/01/26 then U.S. Treasury Yield Curve CMT 5 year + 3.168%), 4.000%, 06/01/261,2,3 | | | 1,975,000 | | | | 2,032,571 | |
| | |
Crown Castle International Corp.
4.000%, 03/01/27 | | | 1,800,000 | | | | 1,981,047 | |
| | |
The Goldman Sachs Group, Inc.
3.500%, 11/16/26 | | | 2,726,000 | | | | 2,920,775 | |
| | |
JPMorgan Chase & Co. | | | | | | | | |
(SOFR + 0.580%), 0.629%, 03/16/243 | | | 1,962,000 | | | | 1,968,607 | |
(SOFR + 0.765%), 0.814%, 09/22/273 | | | 1,928,000 | | | | 1,940,773 | |
| | |
MetLife, Inc. | | | | | | | | |
Series G, (3.850% to 09/15/25 then U.S. Treasury Yield Curve CMT 5 year + 3.576%), 3.850%, 09/15/251,2,3 | | | 2,009,000 | | | | 2,084,338 | |
| | |
The Toronto-Dominion Bank, MTN (Canada) | | | | | | | | |
(SOFR + 0.350%), 0.399%, 09/10/243 | | | 1,951,000 | | | | 1,954,371 | |
| | |
Wells Fargo & Co. | | | | | | | | |
MTN, (5.013% to 04/04/50 then SOFR + 4.502%), 5.013%, 04/04/511,3 | | | 1,411,000 | | | | 1,948,827 | |
| | |
Total Financials | | | | | | | 32,328,032 | |
| | |
Industrials - 22.5% | | | | | | | | |
| | |
Ashtead Capital, Inc.
1.500%, 08/12/264 | | | 986,000 | | | | 967,528 | |
| | |
AT&T, Inc.
4.300%, 12/15/42 | | | 1,710,000 | | | | 1,935,581 | |
| | |
Block Financial LLC
3.875%, 08/15/30 | | | 1,767,000 | | | | 1,882,539 | |
| | |
Broadcom Corp./Broadcom Cayman Finance, Ltd.
3.875%, 01/15/27 | | | 1,808,000 | | | | 1,959,937 | |
| | | | | | | | |
| | | Principal
Amount | | | Value | |
| | |
Charter Communications Operating LLC/Charter Communications Operating Capital 2.250%, 01/15/29 | | | $2,000,000 | | | | $1,963,350 | |
| | |
Comcast Corp.
4.150%, 10/15/28 | | | 1,656,000 | | | | 1,889,650 | |
| | |
CommonSpirit Health
3.347%, 10/01/29 | | | 2,317,000 | | | | 2,470,593 | |
| | |
CVS Health Corp.
5.125%, 07/20/45 | | | 1,735,000 | | | | 2,282,812 | |
| | |
Dell International LLC/EMC Corp.
6.200%, 07/15/30 | | | 1,512,000 | | | | 1,929,690 | |
| | |
Discovery Communications LLC
3.950%, 03/20/28 | | | 1,766,000 | | | | 1,944,659 | |
| | |
Fiserv, Inc.
4.200%, 10/01/28 | | | 1,703,000 | | | | 1,928,084 | |
| | |
The Ford Foundation | | | | | | | | |
Series 2020, 2.415%, 06/01/50 | | | 2,207,000 | | | | 2,161,857 | |
| | |
GLP Capital LP/GLP Financing II, Inc. 5.375%, 04/15/26 | | | 2,610,000 | | | | 2,943,271 | |
| | |
HCA, Inc.
4.125%, 06/15/29 | | | 1,762,000 | | | | 1,951,560 | |
4.500%, 02/15/27 | | | 874,000 | | | | 969,902 | |
| | |
Microsoft Corp.
2.525%, 06/01/50 | | | 2,195,000 | | | | 2,158,960 | |
| | |
Parker-Hannifin Corp.
3.250%, 06/14/29 | | | 1,773,000 | | | | 1,899,937 | |
| | |
ServiceNow, Inc.
1.400%, 09/01/30 | | | 2,080,000 | | | | 1,946,733 | |
| | |
Smith & Nephew PLC (United Kingdom)
2.032%, 10/14/30 | | | 1,010,000 | | | | 981,752 | |
| | |
Sysco Corp.
2.400%, 02/15/30 | | | 2,324,000 | | | | 2,353,051 | |
| | |
Verizon Communications, Inc.
3.875%, 02/08/29 | | | 3,403,000 | | | | 3,792,188 | |
| | |
Walgreens Boots Alliance, Inc.
4.800%, 11/18/44 | | | 1,593,000 | | | | 1,929,537 | |
| | |
Total Industrials | | | | | | | 44,243,171 | |
| | |
Utilities - 1.5% | | | | | | | | |
Dominion Energy, Inc. | | | | | | | | |
| | |
Series B, (4.650% to 12/15/24 then U.S. Treasury Yield Curve CMT 5 year + 2.993%), 4.650%, 12/15/241,2,3 | | | 978,000 | | | | 1,041,570 | |
| | |
National Rural Utilities Cooperative Finance Corp.
1.350%, 03/15/31 | | | 2,024,000 | | | | 1,866,557 | |
| | |
Total Utilities | | | | | | | 2,908,127 | |
| | |
Total Corporate Bonds and Notes | | | | | | | | |
(Cost $78,090,151) | | | | | | | 79,479,330 | |
| | |
Municipal Bonds - 7.6% | | | | | | | | |
| | |
California State General Obligation, School Improvements 7.550%, 04/01/39 | | | 2,410,000 | | | | 4,058,434 | |
The accompanying notes are an integral part of these financial statements.
9
|
AMG GW&K Core Bond ESG Fund Schedule of Portfolio Investments (continued) |
| | | | | | | | |
| | | Principal
Amount | | | Value | |
| |
Municipal Bonds - 7.6% (continued) | | | | | |
| | |
JobsOhio Beverage System | | | | | | | | |
| | |
Series B, 4.532%, 01/01/35 | | | $1,705,000 | | | | $2,085,404 | |
| | |
Los Angeles Unified School District, School Improvements
5.750%, 07/01/34 | | | 2,635,000 | | | | 3,479,937 | |
| | |
Massachusetts School Building Authority Series B,
1.753%, 08/15/30 | | | 2,017,000 | | | | 1,989,370 | |
| | |
University of California, University & College Improvements Series BD, 3.349%, 07/01/29 | | | 2,935,000 | | | | 3,253,498 | |
| | |
Total Municipal Bonds | | | | | | | | |
(Cost $13,515,528) | | | | | | | 14,866,643 | |
| | |
U.S. Government and Agency Obligations - 46.6% | | | | | | | | |
| | |
Fannie Mae - 18.5% | | | | | | | | |
| | |
FNMA
2.000%, 02/01/36 to 10/01/50 | | | 2,356,564 | | | | 2,407,874 | |
3.000%, 06/01/38 | | | 506,000 | | | | 536,799 | |
3.500%, 03/01/30 to 03/01/48 | | | 9,354,688 | | | | 10,083,594 | |
4.000%, 03/01/44 to 01/01/51 | | | 9,809,275 | | | | 10,741,556 | |
4.500%, 04/01/39 to 06/01/41 | | | 9,694,635 | | | | 10,827,526 | |
5.000%, 07/01/47 | | | 1,498,060 | | | | 1,699,049 | |
Total Fannie Mae | | | | | | | 36,296,398 | |
| | |
Freddie Mac - 10.9% | | | | | | | | |
| | |
FHLMC
2.500%, 10/01/34 to 08/01/50 | | | 5,058,018 | | | | 5,287,019 | |
3.000%, 11/01/49 to 03/01/50 | | | 4,976,618 | | | | 5,287,481 | |
3.500%, 10/01/45 | | | 4,812,983 | | | | 5,211,500 | |
4.000%, 07/01/48 to 09/01/50 | | | 1,806,785 | | | | 1,967,470 | |
5.000%, 07/01/44 | | | 1,582,897 | | | | 1,797,638 | |
| 1 | Fixed to variable rate investment. The rate shown reflects the fixed rate in effect at October 31, 2021. Rate will reset at a future date. |
| 2 | Perpetuity Bond. The date shown represents the next call date. |
| 3 | Variable rate security. The rate shown is based on the latest available information as of October 31, 2021. Certain variable rate securities are not based on a published reference rate and spread but are determined by the issuer or agent and are based on current market conditions. These securities do not indicate a reference rate and spread in their description above. |
| 4 | Security exempt from registration under Rule 144A of the Securities Act of 1933. This security may be resold in transactions exempt from registration, normally to qualified institutional buyers. At October 31, 2021, the value of this security amounted to $967,528 or 0.5% of net assets. |
| | | | | | | | |
| | | Principal
Amount | | | Value | |
| | |
FHLMC Gold Pool 3.500%, 07/01/32 to 05/01/44 | | | $1,685,017 | | | | $1,822,361 | |
| | |
Total Freddie Mac | | | | | | | 21,373,469 | |
| | |
U.S. Treasury Obligations - 17.2% | | | | | | | | |
| | |
U.S. Treasury Bonds
1.875%, 02/15/51 | | | 4,292,000 | | | | 4,222,255 | |
2.250%, 05/15/41 | | | 6,587,000 | | | | 6,875,181 | |
3.125%, 05/15/48 | | | 1,598,000 | | | | 1,991,445 | |
4.500%, 02/15/36 | | | 2,589,000 | | | | 3,557,953 | |
6.250%, 08/15/23 | | | 4,918,000 | | | | 5,429,203 | |
6.750%, 08/15/26 | | | 1,506,000 | | | | 1,897,325 | |
| | |
U.S. Treasury Floating Rate Note | | | | | | | | |
(U.S. Treasury 3 month Bill Money Market Yield + 0.049%), 0.099%, 01/31/233 | | | 1,964,000 | | | | 1,964,606 | |
| | |
United States Treasury Notes 2.000%, 11/30/22 | | | 5,852,000 | | | | 5,967,440 | |
2.875%, 05/15/28 | | | 1,763,000 | | | | 1,924,356 | |
| | |
Total U.S. Treasury Obligations | | | | | | | 33,829,764 | |
Total U.S. Government and Agency Obligations | | | | | | | | |
(Cost $89,913,118) | | | | | | | 91,499,631 | |
| | |
Foreign Government Obligation - 0.7% | | | | | | | | |
The Korea Development Bank (South Korea) | | | | | | | | |
0.500%, 10/27/23
(Cost $1,382,683) | | | 1,385,000 | | | | 1,378,156 | |
| | |
Total Investments - 95.4% | | | | | | | | |
(Cost $182,901,480) | | | | | | | 187,223,760 | |
| | |
Other Assets, less Liabilities - 4.6% | | | | | | | 8,931,825 | |
| | |
Net Assets - 100.0% | | | | | | $ | 196,155,585 | |
| | |
| CMT | | Constant Maturity Treasury |
| FHLMC | | Freddie Mac |
| FNMA | | Fannie Mae |
| LIBOR | | London Interbank Offered Rate |
| MTN | | Medium-Term Note |
| SOFR | | Secured Overnight Financing Rate |
The accompanying notes are an integral part of these financial statements.
10
|
AMG GW&K Core Bond ESG Fund Schedule of Portfolio Investments (continued) |
The following table summarizes the inputs used to value the Fund’s investments by the fair value hierarchy levels as of October 31, 2021:
| | | | | | | | | | | | | | | | |
| | | Level 1 | | | Level 2 | | | Level 3 | | | Total | |
Investments in Securities | | | | | | | | | | | | | | | | |
| | | | |
Corporate Bonds and Notes† | | | – | | | | $79,479,330 | | | | – | | | | $79,479,330 | |
| | | | |
Municipal Bonds† | | | – | | | | 14,866,643 | | | | – | | | | 14,866,643 | |
| | | | |
U.S. Government and Agency Obligations† | | | – | | | | 91,499,631 | | | | – | | | | 91,499,631 | |
| | | | |
Foreign Government Obligation | | | – | | | | 1,378,156 | | | | – | | | | 1,378,156 | |
| | | | |
Total Investments in Securities | | | – | | | | $187,223,760 | | | | – | | | | $187,223,760 | |
| | | | | | | | | | | | | | | | |
| | † | All corporate bonds and notes, municipal bonds, and U.S. government and agency obligations held in the Fund are Level 2 securities. For a detailed breakout of corporate bonds and notes, municipal bonds, and U.S. government and agency obligations by major industry or agency classification, please refer to the Fund’s Schedule of Portfolio Investments. |
For the fiscal year ended October 31, 2021, there were no transfers in or out of Level 3.
The accompanying notes are an integral part of these financial statements.
11
|
AMG GW&K Emerging Markets Equity Fund Portfolio Manager’s Comments (unaudited) |
| | | | |
MARKET OVERVIEW Emerging markets (“EM”) advanced during the fiscal year ended October 2021, as global business activity accelerated thanks to effective COVID-19 vaccines, improved virus treatments, and pent-up demand. Commodity prices also rallied on favorable supply and demand dynamics. The MSCI Emerging Markets Index (“MSCI EM Index”) gained 16.96% but trailed developed markets (DM) considerably, as the MSCI World Index advanced 40.4%. That represents the second worst one-year underperformance of EM versus DM since 1999, eclipsed only by the “taper tantrum” period of late 2013. The performance gap appears to reflect EM’s incomplete and uneven recovery from the pandemic along with tighter financial conditions in EM. There was a notable change in regional leadership this year, as commodity-rich countries finished in the lead and an otherwise resilient Asia fell victim to disappointing returns from index heavyweight China. What seemed like a ceaseless flow of worrying news from the country—Beijing’s far-reaching regulatory offensive, the demise of heavily indebted real estate developer China Evergrande, and surprising power shortages—saw the MSCI China Index fall (9.2)%. South Korea and Taiwan delivered a second consecutive year of strong performance due to ongoing demand for semiconductors, and India quickly recovered from a dire outbreak of the Delta variant to end the year as the top Asian market. The EMEA region’s oil producing countries—Russia and the Gulf Corporation Council markets—were standout performers as Brent crude oil soared past $80/bbl. Eastern Europe rallied on unexpectedly good earnings across the continent. Higher commodity prices also drove gains in Latin America, though Brazil struggled later in the period as inflation took hold amid aggressive fiscal spending. Energy and materials outperformed substantially as commodity prices rallied, financials gained on a more favorable margin outlook in several markets, and record earnings in the semiconductor industry supported information technology. China-specific factors triggered negative returns in the consumer discretionary, communication services, and real estate sectors. | | FUND REVIEW For the fiscal year ending October 31, 2021, AMG GW&K Emerging Markets Equity Fund (the “Fund”) Class Z shares returned 10.15%, underperforming the 16.96% return for the MSCI EM Index. Sector exposure was a key factor in the performance shortfall, as investors shifted from structural growth companies in consumer-related industries to value cyclicals like mining and energy producers, where the Fund is typically underweight. Pressure on the Fund’s positions in China, where regulatory changes engulfed a number of industries, also detracted from relative performance. Proposed changes to casino licensing conditions caused a sharp fall in Macau-based Sands China Ltd., and Tencent Holdings Ltd., Tencent Music Entertainment Group, and Kuaishou Technology Class B also declined on uncertainty surrounding expected regulatory changes governing video gaming and social media content. Sands China and Kuaishou Technology were sold during the period. Similar concerns and signs of decelerating consumption weighed on Alibaba Group Holdings Ltd. Aside from the situation in China, several holdings performed quite well during the period. Russian gas producer Novatek PJSC gained on record prices for natural gas in Europe and Asia. Sberbank of Russia PJSC, the country’s largest financial services company, reported better-than-expected earnings and increased its profit target for 2021. Taiwan Semiconductor Manufacturing Co., LTD. reported consistently strong earnings throughout the past year due to robust worldwide demand for semiconductors. Samsung Electronics Co., Ltd. also advanced on record sales in its semiconductor division. Financials, led by Sberbank of Russia and India’s HDFC Bank, Ltd. and Housing Development Finance Corp. Ltd., was the Fund’s top performing sector. OUTLOOK AND PORTFOLIO POSITIONING EM equity performance stands in stark contrast to DM over the past 12 months. The uneven post-pandemic economic recovery across countries, | | earlier tightening of monetary policy in several markets, and China-specific factors have all contributed to this divergence in returns. As a result, EM are trading at a 33% discount to DM based on forward PE multiples. Undoubtedly, earnings growth will be the most important driver of future performance, but the ever-widening discount, particularly relative to the U.S. market, should provide a measure of downside support. Over the next three years, bottom-up analysts project EM earnings compounding at about 9% annually compared to 10% for DM earnings. The relatively modest advantage for DM earnings appears to reflect EM’s incomplete recoveries from the pandemic. The notable valuation discount suggests to us that any positive surprises for EM, like monetary and fiscal policy stimulus from China or an easing of its regulatory environment, could easily provide fuel for EM equities to substantially recover lost ground from DM equities over the year ahead. With respect to the Fund’s structure, trading and market activity during the fiscal year resulted in increased exposures to the financials, consumer discretionary, and energy sectors while our weights in industrials, consumer staples, and communication services decreased. At the close of the period, the Fund had overweight positions in the consumer discretionary, information technology, financials, consumer staples, and communication services sectors and underweight positions in the materials, energy, real estate, industrials, utilities, and health care sectors relative to the benchmark. Geographically, the portfolio finished the fiscal year with 76% in Asia, 12% in the EMEA region, and 12% in Latin America. The views expressed represent the opinions of GW&K Investment Management, LLC as of October 31, 2021, and are not intended as a forecast or guarantee of future results, and are subject to change without notice. |
12
|
AMG GW&K Emerging Markets Equity Fund Portfolio Manager’s Comments (continued) |
CUMULATIVE TOTAL RETURN PERFORMANCE
AMG GW&K Emerging Markets Equity Fund’s cumulative total return is based on the daily change in net asset value (NAV), and assumes that all dividends and distributions were reinvested. This graph compares a hypothetical $10,000 investment made in the AMG GW&K Emerging Markets Equity Fund’s Class Z shares on October 31, 2011, to a $10,000 investment made in the MSCI Emerging Markets Index for the same time period. The graph and table do not reflect the deduction of taxes that a shareholder would pay on a Fund distribution or redemption of shares. The listed returns for the Fund are net of expenses and the returns for the index exclude expenses. Total returns would have been lower had certain expenses not been reduced.
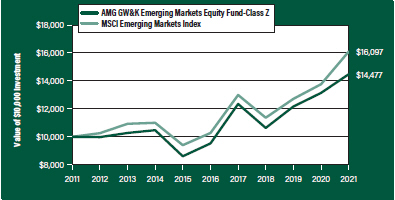
The table below shows the average annual total returns for the AMG GW&K Emerging Markets Equity Fund and the MSCI Emerging Markets Index for the same time periods ended October 31, 2021.
| | | | | | | | | | | | | | | | | | | | |
| Average Annual Total Returns1 | | One
Year | | | Five
Years | | | Ten
Years | | | Since
Inception | | | Inception
Date | |
| | |
AMG GW&K Emerging Markets Equity Fund2, 3, 4, 5, 6, 7, 8, 9, 10, 11, 12 | | | | | | | | | |
| | | | | |
Class N | | | 9.85% | | | | 8.29% | | | | – | | | | 2.58% | | | | 03/01/12 | |
| | | | | |
Class I | | | 10.13% | | | | 8.63% | | | | 3.67% | | | | 2.00% | | | | 03/01/11 | |
| | | | | |
Class Z | | | 10.15% | | | | 8.72% | | | | 3.77% | | | | 2.10% | | | | 03/01/11 | |
| | | | | |
MSCI Emerging Markets Index13 | | | 16.96% | | | | 9.39% | | | | 4.88% | | | | 3.69% | | | | 03/01/11† | |
The performance data shown represents past performance. Past performance is not a guarantee of future results. Current performance may be lower or higher than the performance data quoted. The investment return and principal value of an investment will fluctuate so that an investor’s shares, when redeemed, may be worth more or less than their original cost.
Investors should carefully consider the Fund’s investment objectives, risks, charges and expenses before investing. For performance information through the most recent month end, current net asset values per share for the Fund and other information, please call 800.548.4539 or visit our website at amgfunds.com for a free prospectus. Read it carefully before investing or sending money.
Distributed by AMG Distributors, Inc., member FINRA/SIPC.
| † | Date reflects inception date of the Fund, not the index. |
| 1 | Total return equals income yield plus share price change and assumes reinvestment of all dividends and capital gain distributions. Returns are net of fees and may reflect offsets of Fund expenses as described in the prospectus. No adjustment has been made for taxes payable by shareholders on their reinvested dividends and |
|
capital gain distributions. Returns for periods greater than one year are annualized. The listed returns on the Fund are net of expenses and based on the published NAV as of October 31, 2021. All returns are in U.S. dollars ($). |
|
2 From time to time, the Fund’s advisor has waived its fees and/or absorbed Fund expenses, which has resulted in higher returns. |
|
3 The Fund is subject to currency risk resulting from fluctuations in exchange rates that may affect the total loss or gain on a non-U.S. Dollar investment when converted back to U.S. Dollars. |
|
4 Market prices of investments held by the Fund may fall rapidly or unpredictably due to a variety of economic or political factors, market conditions, disasters or public health issues, or in response to events that affect particular industries or companies. |
|
5 The Fund may invest in derivatives such as options and futures; the complexity and rapidly changing structure of derivatives markets may increase the possibility of market losses. |
|
6 The Fund is subject to the risks associated with investments in emerging markets, such as erratic earnings patterns, economic and political instability, changing exchange controls, limitations on repatriation of foreign capital and changes in local governmental attitudes toward private investment, possibly leading to nationalization or confiscation of investor assets. |
|
7 The Fund invests in growth stocks, which may be more sensitive to market movements because their prices tend to reflect future investor expectations rather than just current profits. Growth stocks may underperform value stocks during given periods. |
|
8 Investments in international securities are subject to certain risks of overseas investing including currency fluctuations and changes in political and economic conditions, which could result in significant market fluctuations. These risks are magnified in emerging markets. |
|
9 Investing in initial public offerings (IPOs) is risky and the prices of stocks purchased in IPOs tend to fluctuate more widely than stocks of companies that have been publicly traded for a longer period of time. Stocks purchased in IPOs generally do not have a trading history, and information about the companies may be available for very limited periods. |
|
10 The Fund is subject to risks associated with investments in mid-capitalization companies such as greater price volatility, lower trading volume, and less liquidity than the stocks of larger, more established companies. |
|
11 Companies that are in similar industry sectors may be similarly affected by particular economic or |
|
|
13
|
AMG GW&K Emerging Markets Equity Fund Portfolio Manager’s Comments (continued) |
| | | | | | | | |
market events; to the extent the Fund has substantial holdings within a particular sector, the risks associated with that sector increase. 12 The Fund is subject to risks associated with investments in small-capitalization companies, such as erratic earnings patterns, competitive conditions, limited earnings history and a reliance on one or a limited number of products. | | | | 13 The MSCI Emerging Markets Index is a free float-adjusted market capitalization index that is designed to measure equity market performance of emerging markets. Please go to msci.com for most current list of countries represented by the index. Unlike the Fund, the MSCI Emerging Markets Index is unmanaged, is not available for investment and does not incur expenses. | | | | All MSCI data is provided “as is.” The products described herein are not sponsored or endorsed and have not been reviewed or passed on by MSCI. In no event shall MSCI, its affiliates or any MSCI data provider have any liability of any kind in connection with the MSCI data or the products described herein. Copying or redistributing the MSCI data is strictly prohibited. Not FDIC insured, nor bank guaranteed. May lose value. |
14
|
AMG GW&K Emerging Markets Equity Fund Fund Snapshots (unaudited) October 31, 2021 |
PORTFOLIO BREAKDOWN
| | |
Sector | | %of
Net Assets |
| | |
Financials | | 25.6 |
| | |
Information Technology | | 22.8 |
| | |
Consumer Discretionary | | 20.8 |
| | |
Communication Services | | 9.1 |
| | |
Consumer Staples | | 7.7 |
| | |
Energy | | 4.5 |
| | |
Health Care | | 3.2 |
| | |
Industrials | | 1.3 |
| | |
Real Estate | | 0.7 |
| | |
Short-Term Investments | | 3.4 |
| | |
Other Assets Less Liabilities | | 0.9 |
| | | | |
TOP TEN HOLDINGS | | | | |
| Security Name | | %of
Net Assets | |
| | |
Taiwan Semiconductor Manufacturing Co., Ltd. (Taiwan) | | | 8.2 | |
| | |
Samsung Electronics Co., Ltd. (South Korea) | | | 4.5 | |
| | |
Alibaba Group Holding, Ltd., Sponsored ADR (China) | | | 4.0 | |
| | |
Sberbank of Russia PJSC, Sponsored ADR (Russia) | | | 3.7 | |
| | |
Housing Development Finance Corp., Ltd. (India) | | | 3.5 | |
| | |
HDFC Bank, Ltd. (India) | | | 3.5 | |
| | |
Baidu, Inc., Sponsored ADR (China) | | | 3.0 | |
| | |
China International Capital Corp., Ltd., Class H (China) | | | 2.9 | |
| | |
Tencent Holdings, Ltd. (China) | | | 2.8 | |
| | |
Reliance Industries, Ltd. (India) | | | 2.5 | |
| | | | | |
| | |
Top Ten as a Group | | | 38.6 | |
| | | | | |
| | | | | |
Because a fund’s strategy may result in multiple investments in particular sectors of the economy, its performance may depend on the performance of those sectors and may fluctuate more widely than investments diversified across more sectors. For additional information on these and other risk considerations, please see the Fund’s prospectus.
Any sectors, industries, or securities discussed should not be perceived as investment recommendations. Mention of a specific security should not be considered a recommendation to buy or solicitation to sell that security. Specific securities mentioned in this report may have been sold from the Fund’s portfolio of investments by the time you receive this report.
15
|
AMG GW&K Emerging Markets Equity Fund Schedule of Portfolio Investments October 31, 2021 |
| | | | | | | | |
| | | Shares | | | Value | |
| | |
Common Stocks - 95.7% | | | | | | | | |
| | |
Communication Services - 9.1% | | | | | | | | |
| | |
Baidu, Inc., Sponsored ADR (China)* | | | 10,777 | | | | $1,748,461 | |
| | |
MultiChoice Group (South Africa) | | | 70,458 | | | | 560,297 | |
| | |
NetEase, Inc., ADR (China) | | | 5,965 | | | | 582,124 | |
| | |
Tencent Holdings, Ltd. (China) | | | 26,906 | | | | 1,636,686 | |
| | |
Tencent Music Entertainment Group, ADR (China)* | | | 104,272 | | | | 819,578 | |
| | |
Total Communication Services | | | | | | | 5,347,146 | |
| | |
Consumer Discretionary - 20.8% | | | | | | | | |
| | |
Alibaba Group Holding, Ltd., Sponsored ADR (China)* | | | 14,291 | | | | 2,357,158 | |
| | |
Feng TAY Enterprise Co., Ltd. (Taiwan) | | | 87,355 | | | | 679,716 | |
| | |
Galaxy Entertainment Group, Ltd. (Hong Kong)* | | | 148,000 | | | | 796,348 | |
| | |
Huazhu Group, Ltd., ADR (China)* | | | 12,200 | | | | 565,592 | |
| | |
JD Health International, Inc. (China)*,1,2 | | | 14,800 | | | | 129,921 | |
| | |
JD.com, Inc., ADR (China)* | | | 6,450 | | | | 504,906 | |
| | |
MakeMyTrip, Ltd. (India)* | | | 27,648 | | | | 875,612 | |
| | |
Midea Group Co., Ltd., Class A (China) | | | 75,485 | | | | 809,698 | |
| | |
Naspers, Ltd., N Shares (South Africa) | | | 6,799 | | | | 1,151,436 | |
| | |
Ozon Holdings PLC, ADR (Russia)* | | | 10,089 | | | | 454,005 | |
| | |
Pepco Group, N.V. (United Kingdom)*,1 | | | 3,830 | | | | 45,311 | |
| | |
Prosus, N.V. (Netherlands)2 | | | 12,612 | | | | 1,110,903 | |
| | |
Shenzhou International Group Holdings, Ltd. (China) | | | 10,660 | | | | 229,661 | |
| | |
Trip.com Group, Ltd., ADR (China)* | | | 37,077 | | | | 1,058,919 | |
| | |
Yum China Holdings, Inc. (China) | | | 24,617 | | | | 1,405,138 | |
| | |
Total Consumer Discretionary | | | | | | | 12,174,324 | |
| | |
Consumer Staples - 7.7% | | | | | | | | |
| | |
Angel Yeast Co., Ltd., Class A (China) | | | 34,000 | | | | 295,697 | |
| | |
Bid Corp., Ltd. (South Africa) | | | 46,393 | | | | 995,711 | |
| | |
CP All PCL (Thailand) | | | 156,468 | | | | 302,305 | |
| | |
Dino Polska, S.A. (Poland)*,1 | | | 3,851 | | | | 344,014 | |
| | |
Fomento Economico Mexicano, S.A.B de CV (Mexico) | | | 52,196 | | | | 429,905 | |
| | |
LG Household & Health Care, Ltd. (South Korea) | | | 212 | | | | 212,188 | |
| | |
Orion Corp. (South Korea) | | | 5,685 | | | | 574,946 | |
| | |
Vietnam Dairy Products JSC (Vietnam) | | | 44,800 | | | | 178,597 | |
| | |
Wal-Mart de Mexico, S.A.B. de CV (Mexico) | | | 340,138 | | | | 1,185,064 | |
| | |
Total Consumer Staples | | | | | | | 4,518,427 | |
| | |
Energy - 4.5% | | | | | | | | |
| | |
Novatek PJSC, Sponsored GDR (Russia) | | | 4,641 | | | | 1,178,210 | |
| | |
Reliance Industries, Ltd. (India) | | | 42,488 | | | | 1,441,838 | |
| | |
Total Energy | | | | | | | 2,620,048 | |
| | | | | | | | |
| | | Shares | | | Value | |
Financials - 25.6% | | | | | | | | |
| | |
AIA Group, Ltd. (Hong Kong) | | | 82,968 | | | | $929,823 | |
| | |
B3, S.A. - Brasil Bolsa Balcao (Brazil) | | | 175,900 | | | | 372,133 | |
| | |
Banco Bradesco, S.A., ADR (Brazil) | | | 236,385 | | | | 827,348 | |
| | |
Bank Mandiri Persero Tbk PT (Indonesia) | | | 1,297,416 | | | | 655,938 | |
| | |
Bank Rakyat Indonesia Persero Tbk PT (Indonesia) | | | 2,413,636 | | | | 724,535 | |
| | |
BDO Unibank, Inc. (Philippines) | | | 314,090 | | | | 773,041 | |
| | |
China International Capital Corp., Ltd., Class H (China)1 | | | 697,200 | | | | 1,726,106 | |
| | |
China Merchants Bank Co., Ltd., Class H (China) | | | 44,000 | | | | 368,726 | |
| | |
Grupo Financiero Banorte, S.A.B de CV, Class O (Mexico) | | | 157,742 | | | | 997,112 | |
| | |
HDFC Bank, Ltd. (India) | | | 97,940 | | | | 2,074,746 | |
| | |
Housing Development Finance Corp., Ltd. (India) | | | 54,569 | | | | 2,080,535 | |
| | |
Itau Unibanco Holding, S.A., Sponsored ADR (Brazil) | | | 57,600 | | | | 234,432 | |
| | |
OTP Bank Plc (Hungary)* | | | 16,673 | | | | 1,001,838 | |
| | |
Sberbank of Russia PJSC, Sponsored ADR (Russia) | | | 108,485 | | | | 2,175,670 | |
| | |
XP, Inc., Class A (Brazil)* | | | 2,614 | | | | 85,765 | |
| | |
Total Financials | | | | | | | 15,027,748 | |
| | |
Health Care - 3.2% | | | | | | | | |
| | |
China Resources Sanjiu Medical & | | | | | | | | |
| | |
Pharmaceutical Co., Ltd., Class A (China) | | | 167,700 | | | | 632,226 | |
| | |
Fleury, S.A. (Brazil) | | | 136,422 | | | | 453,467 | |
| | |
Jinxin Fertility Group, Ltd. (China)*,1 | | | 100,000 | | | | 141,043 | |
| | |
Lepu Medical Technology Beijing Co., Ltd., Class A (China) | | | 53,500 | | | | 178,156 | |
| | |
Odontoprev, S.A. (Brazil) | | | 199,311 | | | | 470,396 | |
| | |
Total Health Care | | | | | | | 1,875,288 | |
| | |
Industrials - 1.3% | | | | | | | | |
| | |
Grupo Aeroportuario del Pacifico, S.A.B de CV, Class B (Mexico)2 | | | 59,655 | | | | 753,366 | |
| |
Information Technology - 22.8% | | | | | |
| | |
Advantech Co., Ltd. (Taiwan) | | | 24,727 | | | | 323,380 | |
| | |
Beijing Kingsoft Office Software, Inc., Class A (China) | | | 18,800 | | | | 870,927 | |
| | |
Delta Electronics, Inc. (Taiwan) | | | 62,100 | | | | 548,180 | |
| | |
GDS Holdings, Ltd., ADR (China)* | | | 3,450 | | | | 204,930 | |
| | |
Infosys, Ltd., Sponsored ADR (India) | | | 27,276 | | | | 607,709 | |
| | |
MediaTek, Inc. (Taiwan) | | | 39,000 | | | | 1,283,595 | |
| | |
Pagseguro Digital, Ltd., Class A (Brazil)*,2 | | | 9,488 | | | | 343,466 | |
| | |
Samsung Electronics Co., Ltd. (South Korea) | | | 43,767 | | | | 2,620,467 | |
| | |
SK Hynix, Inc. (South Korea) | | | 13,184 | | | | 1,162,178 | |
The accompanying notes are an integral part of these financial statements.
16
|
AMG GW&K Emerging Markets Equity Fund Schedule of Portfolio Investments (continued) |
| | | | | | | | |
| | |
| | | Shares | | | Value | |
| |
Information Technology - 22.8% (continued) | | | | | |
| | |
Sunny Optical Technology Group Co., Ltd. (China)2 | | | 8,576 | | | | $230,124 | |
| | |
Taiwan Semiconductor Manufacturing Co., Ltd. (Taiwan) | | | 226,632 | | | | 4,809,201 | |
| | |
Tata Consultancy Services, Ltd. (India) | | | 8,460 | | | | 384,545 | |
| | |
Total Information Technology | | | | | | | 13,388,702 | |
| | |
Real Estate - 0.7% | | | | | | | | |
| | |
Greentown Service Group Co., Ltd. (China) | | | 376,023 | | | | 372,235 | |
| | |
Total Common Stocks | | | | | | | | |
(Cost $43,493,634) | | | | | | | 56,077,284 | |
| | |
| | | Principal
Amount | | | | |
| | |
Short-Term Investments - 3.4% | | | | | | | | |
| |
Joint Repurchase Agreements - 3.4%3 | | | | | |
| | |
Bank of America Securities, Inc., dated 10/29/21, due 11/01/21, 0.050% total to be received $1,000,004 (collateralized by various U.S. Government Agency Obligations, 1.500% - 5.000%, 09/01/28 - 01/01/59, totaling $1,020,000) | | $ | 1,000,000 | | | | 1,000,000 | |
| * | Non-income producing security. |
| 1 | Security exempt from registration under Rule 144A of the Securities Act of 1933. This security may be resold in transactions exempt from registration, normally to qualified institutional buyers. At October 31, 2021, the value of these securities amounted to $2,386,395 or 4.1% of net assets. |
| 2 | Some of these securities, amounting to $2,242,295 or 3.8% of net assets, were out on loan to various borrowers and are collateralized by cash and various U.S. Treasury Obligations. See Note 4 of Notes to Financial Statements. |
| | | | | | | | |
| | | Principal
Amount | | | Value | |
| | |
HSBC Securities USA, Inc., dated 10/29/21, due 11/01/21, 0.050% total to be received $15,149 (collateralized by various U.S. Treasuries, 0.000% - 5.500%, 11/30/22 - 05/15/48, totaling $15,452) | | | $15,149 | | | | $15,149 | |
| | |
RBC Dominion Securities, Inc., dated 10/29/21, due 11/01/21, 0.050% total to be received $1,000,004 (collateralized by various U.S. Government Agency Obligations and U.S. Treasuries, 0.000% - 6.000%, 11/01/21 - 07/20/51, totaling $1,020,000) | | | 1,000,000 | | | | 1,000,000 | |
| |
Total Short-Term Investments | | | | | |
(Cost $2,015,149) | | | | | | | 2,015,149 | |
| | |
Total Investments - 99.1% | | | | | | | | |
(Cost $45,508,783) | | | | | | | 58,092,433 | |
| |
Other Assets, less Liabilities - 0.9% | | | | 540,984 | |
| | |
Net Assets - 100.0% | | | | | | $ | 58,633,417 | |
| 3 | Cash collateral received for securities lending activity was invested in these joint repurchase agreements. |
ADR American Depositary Receipt
GDR Global Depositary Receipt
The accompanying notes are an integral part of these financial statements.
17
|
AMG GW&K Emerging Markets Equity Fund Schedule of Portfolio Investments (continued) |
The following table summarizes the inputs used to value the Fund’s investments by the fair value hierarchy levels as of October 31, 2021:
| | | | | | | | | | | | | | | | |
| | | Level 1 | | | Level 21 | | | Level 3 | | | Total | |
| | | | |
Investments in Securities | | | | | | | | | | | | | | | | |
| | | | |
Common Stocks | | | | | | | | | | | | | | | | |
| | | | |
Financials | | $ | 2,516,790 | | | $ | 12,510,958 | | | | – | | | $ | 15,027,748 | |
| | | | |
Information Technology | | | 1,156,105 | | | | 12,232,597 | | | | – | | | | 13,388,702 | |
| | | | |
Consumer Discretionary | | | 7,266,641 | | | | 4,907,683 | | | | – | | | | 12,174,324 | |
| | | | |
Communication Services | | | 3,710,460 | | | | 1,636,686 | | | | – | | | | 5,347,146 | |
| | | | |
Consumer Staples | | | 3,133,291 | | | | 1,385,136 | | | | – | | | | 4,518,427 | |
| | | | |
Energy | | | – | | | | 2,620,048 | | | | – | | | | 2,620,048 | |
| | | | |
Health Care | | | 923,863 | | | | 951,425 | | | | – | | | | 1,875,288 | |
| | | | |
Industrials | | | 753,366 | | | | – | | | | – | | | | 753,366 | |
| | | | |
Real Estate | | | – | | | | 372,235 | | | | – | | | | 372,235 | |
| | | | |
Short-Term Investments | | | | | | | | | | | | | | | | |
| | | | |
Joint Repurchase Agreements | | | – | | | | 2,015,149 | | | | – | | | | 2,015,149 | |
| | | | | | | | | | | | | | | | |
| | | | |
Total Investments in Securities | | $ | 19,460,516 | | | $ | 38,631,917 | | | | – | | | $ | 58,092,433 | |
| | | | | | | | | | | | | | | | |
| 1 | An external pricing service is used to reflect any impact on security value due to market movements between the time the Fund valued such foreign securities and the earlier closing of foreign markets. |
For the fiscal year ended October 31, 2021, there were no transfers in or out of Level 3.
The country allocation in the Schedule of Portfolio Investments at October 31, 2021, was as follows:
| | | | | |
| Country | | % of Long-Term
Investments |
| |
Brazil | | | | 5.0 | |
| |
China | | | | 30.1 | |
| |
Hong Kong | | | | 3.1 | |
| |
Hungary | | | | 1.8 | |
| |
India | | | | 13.3 | |
| |
Indonesia | | | | 2.5 | |
| |
Mexico | | | | 6.0 | |
| |
Netherlands | | | | 2.0 | |
| |
Philippines | | | | 1.4 | |
| |
Poland | | | | 0.6 | |
| | |
| Country | | % of Long-Term
Investments |
| |
Russia | | 6.8 |
| |
South Africa | | 4.8 |
| |
South Korea | | 8.1 |
| |
Taiwan | | 13.6 |
| |
Thailand | | 0.5 |
| |
United Kingdom | | 0.1 |
| |
Vietnam | | 0.3 |
| | |
| |
| | | 100.0 |
| | |
The accompanying notes are an integral part of these financial statements.
18
|
AMG GW&K Emerging Wealth Equity Fund Portfolio Manager’s Comments (unaudited) |
| | | | |
MARKET OVERVIEW Emerging markets (“EM”) advanced during the fiscal year ended October 2021, as global business activity accelerated thanks to effective COVID-19 vaccines, improved virus treatments, and pent-up demand. Commodity prices also rallied on favorable supply and demand dynamics. The MSCI Emerging Markets Index (“MSCI EM Index”) gained 16.96%, but trailed developed markets (“DM)” considerably, as the MSCI World Index advanced 40.4%. That represents the second-worst one-year underperformance of EM versus DM since 1999, eclipsed only by the “taper tantrum” period of late 2013. The performance gap appears to reflect EM’s incomplete and uneven recovery from the pandemic along with tighter financial conditions in EM. There was a notable change in regional leadership this year, as commodity rich countries finished in the lead and an otherwise resilient Asia fell victim to disappointing returns from index heavyweight China. What seemed like a ceaseless flow of worrying news from the country—Beijing’s far-reaching regulatory offensive, the demise of heavily indebted real estate developer China Evergrande, and surprising power shortages—saw the MSCI China Index fall (9.2)%. South Korea and Taiwan delivered a second consecutive year of strong performance due to ongoing demand for semiconductors, and India quickly recovered from a dire outbreak of the Delta variant to end the year as the top Asian market. The EMEA (Europe, the Middle East and Africa) region’s oil producing countries—Russia and the Gulf Corporation Council markets—were standout performers as Brent crude oil soared past $80/bbl. Eastern Europe rallied on unexpectedly good earnings across the continent. Higher commodity prices also drove gains in Latin America, though Brazil struggled later in the period as inflation took hold amid aggressive fiscal spending. Energy and materials outperformed substantially as commodity prices rallied, financials gained on a more favorable margin outlook in several markets, and record earnings in the semiconductor industry supported information technology. China-specific factors triggered negative returns in the consumer discretionary, communication services, and real estate sectors. | | FUND REVIEW For the fiscal year ending October 31, 2021, AMG GW&K Emerging Wealth Equity Fund (the “Fund”) Class N shares returned 0.98%, underperforming the MSCI EM Index, which returned 16.96%. Our strategic focus on the benefits of wealth creation in emerging markets, particularly in China at an average Fund weight of 51%, was the main cause of the performance shortfall. Investors shifted from structural growth companies in consumer-related industries that we believe are compelling long-term investments to value cyclicals like mining and energy producers, where the Fund has no exposure. Pressure on the Fund’s positions in China, where regulatory changes engulfed a number of industries, also detracted from relative performance. Proposed changes to casino licensing conditions caused a sharp fall in Macau-based Sands China Ltd. To promote “common prosperity,” a concept that aims to reduce China’s cost of living and promote larger families, the General office of the Chinese Communist Party (CCP) and the State Council announced new regulations for after-school tutoring that will likely shift the industry to nonprofit status. TAL Education Group and New Oriental Education and Technology fell precipitously with after-school tutoring stocks following the regulatory announcement. Both stocks were sold during the period. Tencent Music Entertainment Group also declined on uncertainty surrounding expected regulatory changes governing video gaming and social media content. A zero tolerance policy toward COVID-19 weighed on certain consumer companies in China, including hot pot restaurant operator Haidilao International Holdings, Ltd. Aside from the situation in China, several holdings performed quite well during the period, particularly in India, a market of strategic importance to the Fund. Jubilant Foodworks, Ltd, which operates Domino’s and Dunkin Donuts outlets, advanced on exceptional performance in delivery, which more than offset the impact of limited in person dining. India’s MakeMyTrip, Ltd. reported a marked improvement in transaction volumes thanks to a nascent recovery in travel across India. HDFC Bank, Ltd issued a favorable outlook for loan growth citing robust economic activity and the bank’s strong capital position. In developed markets, Infineon | | Technologies AG, a global leader in power semiconductors, raised 2021 guidance due to resilient end customer demand. OUTLOOK AND PORTFOLIO POSITIONING EM equity performance stands in stark contrast to DM over the past 12 months. The uneven post-pandemic economic recovery across countries, earlier tightening of monetary policy in several markets, and China-specific factors have all contributed to this divergence in returns. As a result, EM are trading at a 33% discount to DM based on forward PE multiples. Undoubtedly, earnings growth will be the most important driver of future performance, but the ever-widening discount, particularly relative to the U.S. market, should provide a measure of downside support. Over the next three years, bottom-up analysts project EM earnings compounding at about 9% annually compared to 10% for DM earnings. The relatively modest advantage for DM earnings appears to reflect EM’s incomplete recoveries from the pandemic. The notable valuation discount suggests to us that any positive surprises for EM, like monetary and fiscal policy stimulus from China or an easing of its regulatory environment, could easily provide fuel for EM equities to substantially recover lost ground from DM equities over the year ahead. With respect to the Fund’s structure, trading and market activity during the fiscal year resulted in increased exposure to communication services and information technology, while health care declined marginally. At the close of the period, the Fund had overweight positions in the consumer discretionary, health care, and financials sectors and underweight positions in the information technology, communication services, materials, energy, and industrials sectors relative to the benchmark. Geographically, the Fund finished the fiscal year with exposures of 79% in EM Asia, 19% in DM, 1% in EM Latin America and 1% in EM EMEA. The views expressed represent the opinions of GW&K Investment Management, LLC as of October 31, 2021, and are not intended as a forecast or guarantee of future results, and are subject to change without notice. |
19
|
AMG GW&K Emerging Wealth Equity Fund Portfolio Manager’s Comments (continued) |
CUMULATIVE TOTAL RETURN PERFORMANCE
AMG GW&K Emerging Wealth Equity Fund’s cumulative total return is based on the daily change in net asset value (NAV), and assumes that all dividends and distributions were reinvested. This graph compares a hypothetical $10,000 investment made in the AMG GW&K Emerging Wealth Equity Fund’s Class N shares on March 19, 2015 (inception date), to a $10,000 investment made in the MSCI Emerging Markets Index for the same time period. The graph and table do not reflect the deduction of taxes that a shareholder would pay on a Fund distribution or redemption of shares. The listed returns for the Fund are net of expenses and the returns for the index exclude expenses. Total returns would have been lower had certain expenses not been reduced.
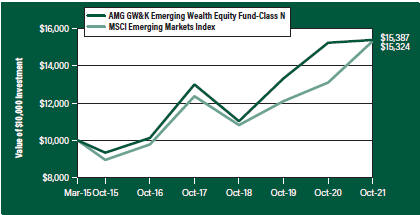
The table below shows the average annual total returns for the AMG GW&K Emerging Wealth Equity Fund and the MSCI Emerging Markets Index for the same time periods ended October 31, 2021.
| | | | | | | | | | | | | | | | |
| Average Annual Total Returns1 | | One
Year | | | Five
Years | | | Since
Inception | | | Inception
Date | |
|
AMG GW&K Emerging Wealth Equity Fund2, 3, 4, 5, 6, 7, 8, 9 | |
| | | | |
Class N | | | 0.98 | % | | | 8.72 | % | | | 6.73 | % | | | 03/19/15 | |
| | | | |
Class I | | | 1.27 | % | | | 9.03 | % | | | 7.01 | % | | | 03/19/15 | |
| | | | |
Class Z | | | 1.37 | % | | | 9.14 | % | | | 7.11 | % | | | 03/19/15 | |
| | | | |
MSCI Emerging Markets Index10 | | | 16.96 | % | | | 9.39 | % | | | 6.66 | % | | | 03/19/15 | † |
The performance data shown represents past performance. Past performance is not a guarantee of future results. Current performance may be lower or higher than the performance data quoted. The investment return and principal value of an investment will fluctuate so that an investor’s shares, when redeemed, may be worth more or less than their original cost.
Investors should carefully consider the Fund’s investment objectives, risks, charges and expenses before investing. For performance information through the most recent month end, current net asset values per share for the Fund and other information, please call 800.548.4539 or visit our website at amgfunds.com for a free prospectus. Read it carefully before investing or sending money.
Distributed by AMG Distributors, Inc., member FINRA/SIPC.
| † | Date reflects inception date of the Fund, not the index. |
| 1 | Total return equals income yield plus share price change and assumes reinvestment of all dividends and capital gain distributions. Returns are net of fees and may reflect offsets of Fund expenses as described in the prospectus. No adjustment has been made for taxes payable by shareholders on their reinvested dividends and |
|
capital gain distributions. Returns for periods greater than one year are annualized. The listed returns on the Fund are net of expenses and based on the published NAV as of October 31, 2021. All returns are in U.S. dollars ($). |
| |
2 Investments in international securities are subject to certain risks of overseas investing including currency fluctuations and changes in political and economic conditions, which could result in significant market fluctuations. These risks are magnified in emerging markets. |
| |
3 The Fund is subject to the risks associated with investments in emerging markets, such as erratic earnings patterns, economic and political instability, changing exchange controls, limitations on repatriation of foreign capital and changes in local governmental attitudes toward private investment, possibly leading to nationalization or confiscation of investor assets. |
| |
4 The Fund is subject to currency risk resulting from fluctuations in exchange rates that may affect the total loss or gain on a non-U.S. Dollar investment when converted back to U.S. Dollars. |
| |
5 The Fund may invest in derivatives such as options and futures; the complexity and rapidly changing structure of derivatives markets may increase the possibility of market losses. |
| |
6 The Fund is subject to risks associated with investments in mid-capitalization companies such as greater price volatility, lower trading volume, and less liquidity than the stocks of larger, more established companies. |
| |
7 The Fund is subject to risks associated with investments in small-capitalization companies, such as erratic earnings patterns, competitive conditions, limited earnings history and a reliance on one or a limited number of products. |
| |
8 Market prices of investments held by the Fund may fall rapidly or unpredictably due to a variety of economic or political factors, market conditions, disasters or public health issues, or in response to events that affect particular industries or companies. |
| |
9 Companies that are in similar industry sectors may be similarly affected by particular economic or market events; to the extent the Fund has substantial holdings within a particular sector, the risks associated with that sector increase. |
| |
10 The MSCI Emerging Markets Index is a free float-adjusted market capitalization index that is designed to measure equity market performance of emerging markets. Please go to msci.com for most current list of countries represented by the index. Unlike the Fund, the MSCI Emerging Markets Index is unmanaged, is not available for investment and does not incur expenses. |
| |
| |
20
|
AMG GW&K Emerging Wealth Equity Fund Portfolio Manager’s Comments (continued) |
| | | | | | | | |
| All MSCI data is provided “as is.” The products described herein are not sponsored or endorsed and have not been reviewed or passed on by MSCI. In no event shall MSCI, its affiliates or any MSCI data | | | | provider have any liability of any kind in connection with the MSCI data or the products described herein. Copying or redistributing the MSCI data is strictly prohibited. | | | | Not FIDC insured, not bank guaranteed. May lose value. |
21
|
AMG GW&K Emerging Wealth Equity Fund Fund Snapshots (unaudited) October 31, 2021 |
PORTFOLIO BREAKDOWN
| | |
| Sector | | %of
Net Assets |
| | |
Consumer Discretionary | | 37.8 |
| | |
Financials | | 20.1 |
| | |
Communication Services | | 13.2 |
| | |
Information Technology | | 13.1 |
| | |
Health Care | | 7.3 |
| | |
Consumer Staples | | 5.4 |
| | |
Materials | | 1.8 |
| | |
Short-Term Investments | | 0.2 |
| | |
Other Assets Less Liabilities | | 1.1 |
TOP TEN HOLDINGS
| | |
| Security Name | | %of Net Assets |
| | |
Tencent Holdings, Ltd. (China) | | 5.2 |
| | |
Infineon Technologies AG (Germany) | | 5.0 |
| | |
Alibaba Group Holding, Ltd., Sponsored ADR (China) | | 4.9 |
| | |
Trip.com Group, Ltd., ADR (China) | | 4.9 |
| | |
QUALCOMM, Inc. | | 4.6 |
| | |
HDFC Bank, Ltd., ADR (India) | | 4.5 |
| | |
Yum China Holdings, Inc. (China) | | 4.4 |
| | |
Kotak Mahindra (India) | | 4.2 |
| | |
Galaxy Entertainment Group, Ltd. (Hong Kong) | | 3.9 |
| | |
Baidu, Inc., Sponsored ADR (China) | | 3.6 |
| | | |
| | |
Top Ten as a Group | | 45.2 |
| | |
Because a fund’s strategy may result in multiple investments in particular sectors of the economy, its performance may depend on the performance of those sectors and may fluctuate more widely than investments diversified across more sectors. For additional information on these and other risk considerations, please see the Fund’s prospectus.
Any sectors, industries, or securities discussed should not be perceived as investment recommendations. Mention of a specific security should not be considered a recommendation to buy or solicitation to sell that security. Specific securities mentioned in this report may have been sold from the Fund’s portfolio of investments by the time you receive this report.
22
|
AMG GW&K Emerging Wealth Equity Fund Schedule of Portfolio Investments October 31, 2021 |
| | | | | | | | |
| | | Shares | | | Value | |
| | |
Common Stocks - 98.7% | | | | | | | | |
| | |
Communication Services - 13.2% | | | | | | | | |
| | |
Baidu, Inc., Sponsored ADR (China)* | | | 50,450 | | | | $8,185,008 | |
| | |
Kingsoft Corp., Ltd. (China) | | | 790,600 | | | | 3,373,526 | |
| | |
Kuaishou Technology (China)*,1 | | | 47,275 | | | | 618,424 | |
| | |
Tencent Holdings, Ltd. (China) | | | 192,240 | | | | 11,693,919 | |
| | |
Tencent Music Entertainment Group, ADR (China)* | | | 601,659 | | | | 4,729,040 | |
| | |
The Walt Disney Co. (United States)* | | | 7,068 | | | | 1,194,987 | |
| | |
Total Communication Services | | | | | | | 29,794,904 | |
| | |
Consumer Discretionary - 37.8% | | | | | | | | |
| | |
Alibaba Group Holding, Ltd., Sponsored ADR (China)* | | | 67,331 | | | | 11,105,575 | |
| | |
Eicher Motors, Ltd. (India) | | | 111,580 | | | | 3,713,804 | |
| | |
Galaxy Entertainment Group, Ltd. (Hong Kong)* | | | 1,650,000 | | | | 8,878,198 | |
| | |
Haidilao International Holding, Ltd. (China)1,2 | | | 925,000 | | | | 2,579,205 | |
| | |
Hermes International (France) | | | 2,044 | | | | 3,245,699 | |
| | |
Huazhu Group, Ltd., ADR (China)* | | | 153,359 | | | | 7,109,723 | |
| | |
JD Health International, Inc. (China)*,1 | | | 249,700 | | | | 2,191,979 | |
| | |
Jubilant Foodworks, Ltd. (India) | | | 55,388 | | | | 2,737,487 | |
| | |
LVMH Moet Hennessy Louis Vuitton SE (France) | | | 3,492 | | | | 2,738,153 | |
| | |
MakeMyTrip, Ltd. (India)* | | | 204,548 | | | | 6,478,035 | |
| | |
Meituan, Class B (China)*,1 | | | 65,700 | | | | 2,235,682 | |
| | |
Moncler SpA (Italy) | | | 36,733 | | | | 2,643,468 | |
| | |
NIKE, Inc., Class B (United States) | | | 10,889 | | | | 1,821,621 | |
| | |
Ozon Holdings PLC, ADR (Russia)* | | | 32,620 | | | | 1,467,900 | |
| | |
Pinduoduo, Inc., ADR (China)* | | | 12,100 | | | | 1,075,932 | |
| | |
Starbucks Corp. (United States) | | | 6,951 | | | | 737,293 | |
| | |
Titan Co., Ltd. (India) | | | 110,830 | | | | 3,536,291 | |
| | |
Trip.com Group, Ltd., ADR (China)* | | | 386,442 | | | | 11,036,783 | |
| | |
Yum China Holdings, Inc. (China) | | | 173,238 | | | | 9,888,425 | |
| | |
Total Consumer Discretionary | | | | | | | 85,221,253 | |
| | |
Consumer Staples - 5.4% | | | | | | | | |
| | |
The Estee Lauder Cos., Inc., Class A (United States) | | | 6,060 | | | | 1,965,440 | |
| | |
Foshan Haitian Flavouring & Food Co., Ltd., Class A (China) | | | 167,782 | | | | 3,072,295 | |
| | |
Wal-Mart de Mexico, S.A.B. de CV (Mexico) | | | 211,520 | | | | 736,950 | |
| | |
Wuliangye Yibin Co., Ltd., Class A (China) | | | 189,303 | | | | 6,396,816 | |
| | |
Total Consumer Staples | | | | | | | 12,171,501 | |
| | |
Financials - 20.1% | | | | | | | | |
| | |
AIA Group, Ltd. (Hong Kong) | | | 678,400 | | | | 7,602,836 | |
| | |
China International Capital Corp., Ltd., Class H (China)1 | | | 3,144,800 | | | | 7,785,799 | |
| | | | | | | | |
| | | Shares | | | Value | |
| | |
East Money Information Co., Ltd., Class A (China) | | | 483,020 | | | | $2,483,936 | |
| | |
Grupo Financiero Banorte, S.A.B de CV, Class O (Mexico) | | | 147,831 | | | | 934,463 | |
| | |
HDFC Bank, Ltd., ADR (India) | | | 142,333 | | | | 10,235,166 | |
| | |
Hong Kong Exchanges & Clearing, Ltd. (Hong Kong) | | | 71,350 | | | | 4,298,248 | |
| | |
Kotak Mahindra (India) | | | 350,886 | | | | 9,544,802 | |
| | |
LIC Housing Finance, Ltd. (India) | | | 472,800 | | | | 2,576,916 | |
| | |
Total Financials | | | | | | | 45,462,166 | |
| | |
Health Care - 7.3% | | | | | | | | |
| | |
China Resources Sanjiu Medical & Pharmaceutical Co., Ltd., Class A (China) | | | 1,748,012 | | | | 6,589,975 | |
| | |
CSPC Pharmaceutical Group, Ltd. (China) | | | 837,600 | | | | 874,036 | |
| | |
Jiangsu Hengrui Medicine Co., Ltd., Class A (China) | | | 189,860 | | | | 1,458,504 | |
| | |
Novo Nordisk A/S, Class B (Denmark) | | | 35,274 | | | | 3,867,967 | |
| | |
Wuxi Biologics Cayman, Inc. (China)*,1 | | | 241,700 | | | | 3,661,022 | |
| | |
Total Health Care | | | | | | | 16,451,504 | |
| | |
Information Technology - 13.1% | | | | | | | | |
| | |
Infineon Technologies AG (Germany) | | | 241,535 | | | | 11,311,412 | |
| | |
KLA Corp. (United States) | | | 3,550 | | | | 1,323,298 | |
| | |
Mastercard, Inc., Class A (United States) | | | 7,260 | | | | 2,435,875 | |
| | |
QUALCOMM, Inc. (United States) | | | 77,474 | | | | 10,307,141 | |
| | |
SK Hynix, Inc. (South Korea) | | | 24,400 | | | | 2,150,876 | |
| | |
Taiwan Semiconductor Manufacturing Co., Ltd. (Taiwan) | | | 57,000 | | | | 1,209,557 | |
| | |
Yeahka, Ltd. (China)* | | | 259,800 | | | | 784,673 | |
| | |
Total Information Technology | | | | | | | 29,522,832 | |
| | |
Materials - 1.8% | | | | | | | | |
| | |
Asian Paints, Ltd. (India) | | | 83,748 | | | | 3,470,796 | |
| | |
Chr Hansen Holding A/S (Denmark)2 | | | 7,948 | | | | 632,381 | |
| | |
Total Materials | | | | | | | 4,103,177 | |
| | |
Total Common Stocks
(Cost $192,579,167) | | | | | | | 222,727,337 | |
| | |
| | | Principal
Amount | | | | |
| | |
Short-Term Investments - 0.2% | | | | | | | | |
| |
Joint Repurchase Agreements - 0.2%3 | | | | | |
| | |
Daiwa Capital Markets America, dated 10/29/21, due 11/01/21, 0.050% total to be received $507,796 (collateralized by various U.S. Government Agency Obligations and U.S. Treasuries, 0.000% - 6.500%, 11/01/21 - 11/01/51, totaling $517,950) | | | $507,794 | | | | 507,794 | |
| | |
Total Short-Term Investments
(Cost $507,794) | | | | | | | 507,794 | |
The accompanying notes are an integral part of these financial statements.
23
|
AMG GW&K Emerging Wealth Equity Fund Schedule of Portfolio Investments (continued) |
| | | | | | | | |
| | | | | | Value | |
| | |
Total Investments - 98.9% | | | | | | | | |
(Cost $193,086,961) | | | | | | | $223,235,131 | |
| |
Other Assets, less Liabilities - 1.1% | | | | 2,474,452 | |
| | |
Net Assets - 100.0% | | | | | | | $225,709,583 | |
| * | Non-income producing security. |
| 1 | Security exempt from registration under Rule 144A of the Securities Act of 1933. This security may be resold in transactions exempt from registration, normally to qualified institutional buyers. At October 31, 2021, the value of these securities amounted to $19,072,111 or 8.4% of net assets. |
| 2 | Some of these securities, amounting to $1,589,618 or 0.7% of net assets, were out on loan to various borrowers and are collateralized by cash and various U.S. Treasury Obligations. See Note 4 of Notes to Financial Statements. |
| 3 | Cash collateral received for securities lending activity was invested in these joint repurchase agreements. |
ADR American Depositary Receipt
The following table summarizes the inputs used to value the Fund’s investments by the fair value hierarchy levels as of October 31, 2021:
| | | | | | | | | | | | | | | | |
| | | Level 1 | | | Level 21 | | | Level 3 | | | Total | |
| | | | |
Investments in Securities | | | | | | | | | | | | | | | | |
| | | | |
Common Stocks | | | | | | | | | | | | | | | | |
| | | | |
Consumer Discretionary | | | $50,721,287 | | | | $34,499,966 | | | | – | | | | $85,221,253 | |
| | | | |
Financials | | | 11,169,629 | | | | 34,292,537 | | | | – | | | | 45,462,166 | |
| | | | |
Communication Services | | | 14,109,035 | | | | 15,685,869 | | | | – | | | | 29,794,904 | |
| | | | |
Information Technology | | | 14,066,314 | | | | 15,456,518 | | | | – | | | | 29,522,832 | |
| | | | |
Health Care | | | – | | | | 16,451,504 | | | | – | | | | 16,451,504 | |
| | | | |
Consumer Staples | | | 2,702,390 | | | | 9,469,111 | | | | – | | | | 12,171,501 | |
| | | | |
Materials | | | 632,381 | | | | 3,470,796 | | | | – | | | | 4,103,177 | |
| | | | |
Short-Term Investments | | | | | | | | | | | | | | | | |
| | | | |
Joint Repurchase Agreements | | | – | | | | 507,794 | | | | – | | | | 507,794 | |
| | | | | | | | | | | | | | | | |
| | | | |
Total Investments in Securities | | | $93,401,036 | | | | $129,834,095 | | | | – | | | | $223,235,131 | |
| | | | | | | | | | | | | | | | |
| 1 | An external pricing service is used to reflect any impact on security value due to market movements between the time the Fund valued such foreign securities and the earlier closing of foreign markets. |
For the fiscal year ended October 31, 2021, there were no transfers in or out of Level 3.
The country allocation in the Schedule of Portfolio Investments at October 31, 2021, was as follows:
| | | | | |
| Country | | % of Long-Term
Investments |
| |
China | | | | 48.9 | |
| |
Denmark | | | | 2.0 | |
| |
France | | | | 2.7 | |
| |
Germany | | | | 5.1 | |
| |
Hong Kong | | | | 9.3 | |
| |
India | | | | 19.0 | |
| |
Italy | | | | 1.2 | |
| | |
| Country | | % of Long-Term
Investments |
| |
Mexico | | 0.7 |
| |
Russia | | 0.7 |
| |
South Korea | | 1.0 |
| |
Taiwan | | 0.5 |
| |
United States | | 8.9 |
| | |
| |
| | 100.0 |
| | |
The accompanying notes are an integral part of these financial statements.
24
|
AMG GW&K Small/Mid Cap Growth Fund Portfolio Manager’s Comments (unaudited) |
| | | | |
AMG GW&K Small/Mid Cap Growth Fund (the “Fund”) Class N shares outperformed its benchmark for the 12 months ended October 31, 2021, returning 46.66% vs. the Russell 2500® Growth Index return of 37.12%. The Fund’s prior benchmark, the Russell 2000® Growth Index, returned 38.45% over the same period. Effective March 19, 2021, the subadviser of Fund changed from LMCG Investments, LLC to GW&K Investment Management, LLC (“GW&K”). Also effective March 19, 2021, the Fund changed its name to AMG GW&K Small Cap Fund II and changed its principal investment strategies and principal risks. Furthermore, effective May 21, 2021, the Fund changed its name to AMG GW&K Small/Mid Cap Growth Fund and made changes to its principal investment strategies. U.S. equity markets enjoyed outsized gains over the trailing year as the economy recovered from the COVID pandemic fueled by massive monetary and fiscal stimulus, progress on the vaccine and therapeutics front, improving economic data, and strong corporate earnings growth. Markets saw volatility return in the third quarter of 2021 on concerns around the Delta variant, inflation, supply chain pressures, and peak growth, but then rebounded in October as corporate earnings results continued to impress and consumer demand remained robust. The domestic small/mid cap market experienced eye-popping returns, particularly in the first half of the fiscal year, with the Russell 2500® Index rising 49.4% as investors sought to gain exposure to the U.S. domestic reopening trade. As such, small/mid cap stocks outpaced large caps during the period (S&P 500 ® Index, returned 42.91%). Small/mid cap growth stocks were a bit lower as the Russell 2500® Growth Index returned 37.12%. Cyclicals and financials generally performed better than areas featuring more secular growers as the economy reopened, leading to the outperformance of value stocks for the year (Russell 2500® Value; up 58.1%). For the fiscal year period prior to the Fund’s transition to GW&K from November 1, 2020 to March 18, 2021, the Fund underperformed the legacy Russell 2000® Growth Index. Both stock selection and sector weightings negatively impacted relative | | performance over this period. An overweight and weak stock selection in the health care and technology sectors were the largest detractors. Underweight positioning and weak stock selection in industrials, financials, and consumer staples also detracted. Following the transition of the Fund to GW&K, relative performance improved significantly as the Fund strongly outperformed the Russell 2500® Growth Index through the remainder of the fiscal year. Stock selection drove the outperformance, with particular strength in information technology and health care. In information technology, the majority of the contribution can be attributed to our software holdings. While the benchmark return for this industry was a respectable 22.9%, our holdings returned 58.5% led by HubSpot, Inc., Paylocity Holding Corp., and Rapid7, Inc. Outside of Software, Gartner, Inc., EPAM Systems (EPAM Systems was sold during the period), and Brooks Automation, Inc. were also notably additive to the Strategy’s results. Within the health care sector, the largest contributor to relative performance came from biopharma, thanks entirely to stock selection. In particular, the big winners were Catalent, Inc., Biohaven Pharmaceutical Holding Co., Ltd., and Horizon Therapeutics PLC. All three stocks reported better-than-expected quarterly results, and subsequently saw increases in their forward sales and earnings estimates. On the other side of the ledger, the largest detractor to relative results was the financials sector, due to weakness in the Capital Markets industry. One stock, MarketAxess Holdings, Inc., accounted for most of the underperformance. The stock suffered late in the third quarter as the company’s share of bond trading volumes stepped down in August after increasing in July. Despite this short-term issue, we continue to admire the management team and prospects for the company moving forward. Consumer discretionary was also a challenging sector for us during the period. Grand Canyon Education, Inc., Krispy Kreme, Inc., and Burlington Stores, Inc. weighed most heavily on relative results. We continue to hold all three stocks at this time. Krispy Kreme, specifically, was a new purchase in the third quarter. We believe that the new management team has re-focused the company on its core, differentiated product and think | | the stock trades at an attractive valuation. Looking at relative performance through a factor lens, the allocation in our Strategy toward higher-quality stocks helped results by about 230 basis points based on an average of six factors, with earnings being the most prominent factor. While the past year has been quite strong for the market, the overall U.S. small/mid cap market, and the Russell 2500® Growth Index along with it, have not made much notional progress since March of 2021. The silver lining is that the composition of the benchmark is improving in both quality and valuation as the hard fall of meme and other low quality stocks has been met with continued earnings strength from many other components. Of course, that still leaves investors with a great many uncertainties to consider. This includes some waning fiscal support for the domestic economy, the partisan and even intra-party roadblocks in Washington, potential for U.S. Federal Reserve (Fed) tapering or a market tantrum from Fed speak or policy, supply chain shortages and challenges, and what appears to be an increasing acceptance of higher input prices; from commodities all the way up the value chain to labor. Will rising prices and interest rates result in a sudden change in the valuations investors are willing to pay for stocks? Could Delta or some other variant change the calculus on our recovery from the pandemic? And we haven’t even talked about China yet, which as the second largest economy in the world has domestic and foreign policy issues that could damage our best assumptions about future economic activity and corporate profits. Our conversations with small/mid cap companies reveal demand that is still robust and creative thinking and innovation that can help circumvent many of these fundamental challenges. The risk of larger macro changes are always present with many rivers to cross. If we take the long view and avoid meme shortcuts, our probability of investment success will increase meaningfully. The views expressed represent the opinions of GW&K Investment Management, LLC, as of October 31, 2021, and are not intended as a forecast or guarantee of future results and are subject to change without notice. |
25
|
AMG GW&K Small/Mid Cap Growth Fund Portfolio Manager’s Comments (continued) |
CUMULATIVE TOTAL RETURN PERFORMANCE
AMG GW&K Small/Mid Cap Growth Fund’s cumulative total return is based on the daily change in net asset value (NAV), and assumes that all dividends and distributions were reinvested. The graph compares a hypothetical $10,000 investment made in the AMG GW&K Small/Mid Cap Growth Fund’s Class N shares on October 31, 2011, to a $10,000 investment made in the Russell 2500® Growth Index and Russell 2000® Growth Index for the same time period. The graph and table do not reflect the deduction of taxes that a shareholder would pay on a Fund distribution or redemption of shares. The listed returns for the Fund are net of expenses and the returns for the indexes exclude expenses. Total returns would have been lower had certain expenses not been reduced.
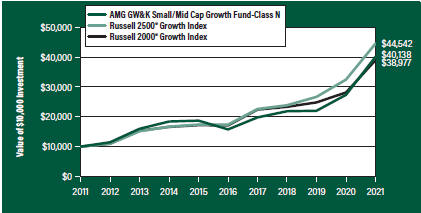
The table below shows the average annual total returns for the AMG GW&K Small/Mid Cap Growth Fund and the Russell 2500® Growth Index and Russell 2000® Growth Index for the same time periods ended October 31, 2021.
| | | | | | | | | | | | | | | | | | | | |
| Average Annual Total Returns1 | | One Year | | | Five
Years | | | Ten
Years | | | Since
Inception | | | Inception
Date | |
AMG GW&K Small/Mid Cap Growth Fund2, 3, 4, 5, 6, 7, 8, 9, 10, 11 | | | | | |
| | | | | |
Class N | | | 46.66 | % | | | 20.54 | % | | | 14.91 | % | | | 13.42 | % | | | 11/03/10 | |
| | | | | |
Class I | | | 46.94 | % | | | 20.77 | % | | | 15.16 | % | | | 12.13 | % | | | 06/01/11 | |
| | | | | |
Class Z | | | — | | | | — | | | | — | | | | 3.08 | % | | | 09/01/21 | |
| | | | | |
Russell 2500® Growth Index12 | | | 37.12 | % | | | 20.68 | % | | | 16.11 | % | | | 15.60 | % | | | 11/03/10 | † |
| | | | | |
Russell 2000® Growth Index13 | | | 38.45 | % | | | 17.90 | % | | | 14.57 | % | | | 14.00 | % | | | 11/03/10 | † |
The performance data shown represents past performance. Past performance is not a guarantee of future results. Current performance may be lower or higher than the performance data quoted. The investment return and principal value of an investment will fluctuate so that an investor’s shares, when redeemed, may be worth more or less than their original cost.
Investors should carefully consider the Fund’s investment objectives, risks, charges and expenses before investing. For performance information through the most recent month end, current net asset values per share for the Fund and other information, please call 800.548.4539 or visit our website at amgfunds.com for a free prospectus. Read it carefully before investing or sending money.
Distributed by AMG Distributors, Inc., member FINRA/SIPC.
| † | Date reflects the inception date of the Fund, not the index. |
| 1 | Total return equals income yield plus share price change and assumes reinvestment of all dividends and capital gain distributions. Returns are net of fees and may reflect offsets of Fund expenses as described in the |
| | |
| | | prospectus. No adjustment has been made for taxes payable by shareholders on their reinvested dividends and capital gain distributions. Returns for periods greater than one year are annualized. The listed returns on the Fund are net of expenses and based on the published NAV as of October 31, 2021. All returns are in U.S. dollars ($). |
| | |
| | | 2 As of March 19, 2021, the Fund’s subadvisor was changed to GW&K Investment Management, LLC. Prior to March 19, 2021, the Fund was known as the AMG Managers LMCG Small Cap Growth Fund and had different principal investment strategies and corresponding risks. Effective March 19, 2021, the Fund changed its name to AMG GW&K Small Cap Fund II. Effective May 21, 2021, the Fund changed its name to AMG GW&K Small/Mid Cap Growth Fund and made changes to its principal investment strategies. Performance shown for periods prior to March 19, 2021, reflects the performance and investment strategies of the Fund’s previous subadvisor, LMCG Investments, LLC. The Fund’s past performance would have been different if the Fund were managed by the current subadvisor and strategy, and the Fund’s prior performance record might be less pertinent for investors considering whether to purchase shares of the Fund. |
| | |
| | | 3 From time to time, the Fund’s advisor has waived its fees and/or absorbed Fund expenses, which has resulted in higher returns. |
| | |
| | | 4 The Fund is subject to risks associated with investments in small-capitalization companies, such as erratic earnings patterns, competitive conditions, limited earnings history and a reliance on one or a limited number of products. |
| | |
| | | 5 Active and frequent trading of a fund may result in higher transaction costs and increased tax liability. |
| | |
| | | 6 The Fund invests in growth stocks, which may be more sensitive to market movements because their prices tend to reflect future investor expectations rather than just current profits. Growth stocks may underperform value stocks during given periods. |
| | |
| | | 7 Investments in international securities are subject to certain risks of overseas investing including currency fluctuations and changes in political and economic conditions, which could result in significant market fluctuations. These risks are magnified in emerging markets. |
| | |
| | | 8 Investing in initial public offerings (IPOs) is risky and the prices of stocks purchased in IPOs tend to fluctuate more widely than stocks of companies that have been publicly traded for a longer period of time. Stocks purchased in IPOs generally do not have a trading history, and information about the companies may be available for very limited periods. |
| | |
| | | 9 The Fund is subject to risks associated with investments in mid-capitalization companies such |
26
|
AMG GW&K Small/Mid Cap Growth Fund Portfolio Manager’s Comments (continued) |
| | | | | | | | |
as greater price volatility, lower trading volume, and less liquidity than the stocks of larger, more established companies. 10 Companies that are in similar industry sectors may be similarly affected by particular economic or market events; to the extent the Fund has substantial holdings within a particular sector, the risks associated with that sector increase. 11 Market prices of investments held by the Fund may fall rapidly or unpredictably due to a variety of economic or political factors, market conditions, disasters or public health issues, or in response to | | | | events that affect particular industries or companies. 12 On March 19, 2021, the primary benchmark changed from the Russell 2000® Growth Index to the Russell 2500® Growth Index. The Russell 2500® Growth Index measures the performance of the small- to mid-cap growth segment of the U.S. equity universe. It includes those Russell 2500® companies with higher price-to-book ratios and higher forecasted growth values. Unlike the Fund, the Russell 2500® Growth Index is unmanaged, is not available for investment and does not incur expenses. | | | | 13 The Russell 2000® Growth Index measures the performance of the Russell 2000® companies with higher price-to-book ratios and higher forecasted growth values. Unlike the Fund, the Russell 2000® Growth Index is unmanaged, is not available for investment and does not incur expenses. The Russell Indices are a trademark of the London Stock Exchange Group companies. Not FDIC insured, nor bank guaranteed. May lose value. |
27
|
AMG GW&K Small/Mid Cap Growth Fund Fund Snapshots (unaudited) October 31, 2021 |
PORTFOLIO BREAKDOWN
| | | | | |
| Sector | | % of Net Assets |
| | |
Information Technology | | | | 31.5 | |
| | |
Health Care | | | | 26.2 | |
| | |
Industrials | | | | 14.7 | |
| | |
Consumer Discretionary | | | | 13.8 | |
| | |
Financials | | | | 4.6 | |
| | |
Materials | | | | 3.0 | |
| | |
Real Estate | | | | 2.5 | |
| | |
Energy | | | | 1.5 | |
| | |
Consumer Staples | | | | 1.2 | |
| | |
Short-Term Investments | | | | 1.1 | |
| | |
Other Assets Less Liabilities | | | | (0.1 | ) |
TOP TEN HOLDINGS
| | |
| Security Name | | % of Net Assets |
| | |
Gartner, Inc. | | 3.5 |
| | |
Paylocity Holding Corp. | | 3.1 |
| | |
HubSpot, Inc. | | 2.9 |
| | |
Catalent, Inc. | | 2.7 |
| | |
Brooks Automation, Inc. | | 2.3 |
| | |
Pool Corp. | | 2.2 |
| | |
SiteOne Landscape Supply, Inc. | | 2.1 |
| | |
Burlington Stores, Inc. | | 2.1 |
| | |
Rapid7, Inc. | | 2.0 |
| | |
Syneos Health, Inc. | | 2.0 |
| | | |
| | |
Top Ten as a Group | | 24.9 |
| | |
Because a fund’s strategy may result in multiple investments in particular sectors of the economy, its performance may depend on the performance of those sectors and may fluctuate more widely than investments diversified across more sectors. For additional information on these and other risk considerations, please see the Fund’s prospectus.
Any sectors, industries, or securities discussed should not be perceived as investment recommendations. Mention of a specific security should not be considered a recommendation to buy or solicitation to sell that security. Specific securities mentioned in this report may have been sold from the Fund’s portfolio of investments by the time you receive this report.
28
|
AMG GW&K Small/Mid Cap Growth Fund Schedule of Portfolio Investments October 31, 2021 |
| | | | | | | | |
| | | Shares | | | Value | |
| | |
Common Stocks - 99.0% | | | | | | | | |
| | |
Consumer Discretionary - 13.8% | | | | | | | | |
| | |
Bright Horizons Family Solutions, Inc.* | | | 2,133 | | | | $354,078 | |
| | |
Burlington Stores, Inc.* | | | 3,320 | | | | 917,283 | |
| | |
Churchill Downs, Inc. | | | 2,427 | | | | 558,210 | |
| | |
Five Below, Inc.* | | | 3,256 | | | | 642,409 | |
| | |
Grand Canyon Education, Inc.* | | | 4,956 | | | | 394,993 | |
| | |
Krispy Kreme Inc.1 | | | 23,575 | | | | 300,581 | |
| | |
Lithia Motors, Inc., Class A | | | 1,282 | | | | 409,240 | |
| | |
LKQ Corp.* | | | 10,484 | | | | 577,459 | |
| | |
Pool Corp. | | | 1,865 | | | | 960,774 | |
| | |
Texas Roadhouse, Inc. | | | 6,814 | | | | 605,151 | |
| | |
Vail Resorts, Inc. | | | 1,051 | | | | 362,290 | |
| | |
Total Consumer Discretionary | | | | | | | 6,082,468 | |
| | |
Consumer Staples - 1.2% | | | | | | | | |
| | |
Performance Food Group Co.* | | | 5,862 | | | | 265,138 | |
| | |
PriceSmart, Inc. | | | 3,385 | | | | 243,551 | |
| | |
Total Consumer Staples | | | | | | | 508,689 | |
| | |
Energy - 1.5% | | | | | | | | |
| | |
Matador Resources Co. | | | 16,050 | | | | 671,693 | |
| | |
Financials - 4.6% | | | | | | | | |
| | |
Evercore, Inc., Class A | | | 2,909 | | | | 441,703 | |
| | |
MarketAxess Holdings, Inc. | | | 1,566 | | | | 639,977 | |
| | |
Pinnacle Financial Partners, Inc. | | | 4,337 | | | | 418,824 | |
| | |
Signature Bank | | | 1,790 | | | | 533,098 | |
| | |
Total Financials | | | | | | | 2,033,602 | |
| | |
Health Care - 26.2% | | | | | | | | |
| | |
Acadia Healthcare Co., Inc.* | | | 9,391 | | | | 582,242 | |
| | |
Albireo Pharma, Inc.* | | | 10,439 | | | | 305,028 | |
| | |
Arena Pharmaceuticals, Inc.* | | | 5,512 | | | | 316,334 | |
| | |
Biohaven Pharmaceutical Holding Co., Ltd.* | | | 4,572 | | | | 650,687 | |
| | |
Bio-Rad Laboratories, Inc., Class A* | | | 769 | | | | 611,109 | |
| | |
Catalent, Inc.* | | | 8,723 | | | | 1,202,553 | |
| | |
Chemed Corp. | | | 672 | | | | 324,072 | |
| | |
CryoPort, Inc.*,1 | | | 7,298 | | | | 595,079 | |
| | |
Deciphera Pharmaceuticals, Inc.* | | | 8,973 | | | | 299,608 | |
| | |
Emergent BioSolutions, Inc.* | | | 4,758 | | | | 226,814 | |
| | |
Globus Medical, Inc., Class A* | | | 8,993 | | | | 693,990 | |
| | |
Halozyme Therapeutics, Inc.* | | | 8,059 | | | | 306,806 | |
| | |
HealthEquity, Inc.* | | | 7,273 | | | | 481,327 | |
| | |
Horizon Therapeutics PLC* | | | 5,754 | | | | 689,962 | |
| | |
ICU Medical, Inc.* | | | 917 | | | | 214,697 | |
| | |
Integra LifeSciences Holdings Corp.* | | | 6,959 | | | | 462,495 | |
| | | | | | | | |
| | | Shares | | | Value | |
| | |
LHC Group, Inc.* | | | 3,135 | | | | $421,940 | |
| | |
Medpace Holdings, Inc.* | | | 2,639 | | | | 597,865 | |
| | |
Neurocrine Biosciences, Inc.* | | | 3,757 | | | | 396,025 | |
| | |
Oyster Point Pharma, Inc.*,1 | | | 19,111 | | | | 225,128 | |
| | |
Phathom Pharmaceuticals, Inc.*,1 | | | 8,288 | | | | 195,017 | |
| | |
Syneos Health, Inc.* | | | 9,356 | | | | 873,289 | |
| | |
West Pharmaceutical Services, Inc. | | | 1,535 | | | | 659,866 | |
| | |
Zogenix, Inc.* | | | 15,392 | | | | 235,959 | |
| | |
Total Health Care | | | | | | | 11,567,892 | |
| | |
Industrials - 14.7% | | | | | | | | |
| | |
Booz Allen Hamilton Holding Corp. | | | 3,835 | | | | 333,108 | |
| | |
CACI International, Inc., Class A* | | | 1,488 | | | | 428,008 | |
| | |
Dycom Industries, Inc.* | | | 2,162 | | | | 171,706 | |
| | |
Gibraltar Industries, Inc.* | | | 3,954 | | | | 257,643 | |
| | |
Graco, Inc. | | | 6,325 | | | | 475,514 | |
| | |
IAA, Inc.* | | | 7,872 | | | | 469,565 | |
| | |
Ingersoll Rand, Inc.* | | | 10,057 | | | | 540,664 | |
| | |
JELD-WEN Holding, Inc.* | | | 5,127 | | | | 140,531 | |
| | |
Knight-Swift Transportation Holdings, Inc. | | | 6,089 | | | | 345,185 | |
| | |
RBC Bearings, Inc.* | | | 3,152 | | | | 737,347 | |
| | |
Ritchie Bros. Auctioneers, Inc. (Canada) | | | 11,608 | | | | 793,407 | |
| | |
SiteOne Landscape Supply, Inc.*,1 | | | 3,970 | | | | 932,791 | |
| | |
The Toro Co. | | | 4,834 | | | | 461,502 | |
| | |
Woodward, Inc. | | | 3,264 | | | | 368,669 | |
| | |
Total Industrials | | | | | | | 6,455,640 | |
| | |
Information Technology - 31.5% | | | | | | | | |
| | |
Brooks Automation, Inc. | | | 8,788 | | | | 1,023,363 | |
| | |
Cerence, Inc.*,1 | | | 8,044 | | | | 845,666 | |
| | |
Cognex Corp. | | | 8,262 | | | | 723,669 | |
| | |
The Descartes Systems Group, Inc. (Canada)* | | | 6,064 | | | | 495,853 | |
| | |
Entegris, Inc. | | | 5,815 | | | | 818,636 | |
| | |
Gartner, Inc.* | | | 4,610 | | | | 1,530,105 | |
| | |
Globant SA (Uruguay)* | | | 1,500 | | | | 478,785 | |
| | |
HubSpot, Inc.*,1 | | | 1,599 | | | | 1,295,558 | |
| | |
MACOM Technology Solutions Holdings, Inc.* | | | 7,182 | | | | 501,447 | |
| | |
Manhattan Associates, Inc.* | | | 4,361 | | | | 791,696 | |
| | |
Paycor HCM, Inc.*,1 | | | 15,213 | | | | 493,510 | |
| | |
Paylocity Holding Corp.* | | | 4,461 | | | | 1,361,229 | |
| | |
Rapid7, Inc.*,1 | | | 6,934 | | | | 892,752 | |
| | |
Rogers Corp.* | | | 1,896 | | | | 381,323 | |
| | |
Silicon Laboratories, Inc.* | | | 3,056 | | | | 576,850 | |
| | |
SS&C Technologies Holdings, Inc. | | | 4,370 | | | | 347,284 | |
| | |
Tyler Technologies, Inc.* | | | 908 | | | | 493,244 | |
The accompanying notes are an integral part of these financial statements.
29
|
AMG GW&K Small/Mid Cap Growth Fund Schedule of Portfolio Investments (continued) |
| | | | | | | | |
| | |
| | | Shares | | | Value | |
| | |
Information Technology - 31.5% | | | | | | | | |
(continued) | | | | | | | | |
| | |
Zebra Technologies Corp., Class A* | | | 1,599 | | | | $853,786 | |
| | |
Total Information Technology | | | | | | | 13,904,756 | |
| | |
Materials - 3.0% | | | | | | | | |
| | |
AptarGroup, Inc. | | | 3,097 | | | | 374,055 | |
| | |
Avient Corp. | | | 6,574 | | | | 354,207 | |
| | |
Eagle Materials, Inc. | | | 1,277 | | | | 189,456 | |
| | |
RPM International, Inc. | | | 4,780 | | | | 416,816 | |
| | |
Total Materials | | | | | | | 1,334,534 | |
| | |
Real Estate - 2.5% | | | | | | | | |
| | |
American Campus Communities, Inc., REIT | | | 4,796 | | | | 257,641 | |
| | |
CoreSite Realty Corp., REIT | | | 1,734 | | | | 247,025 | |
| | |
Sun Communities, Inc., REIT | | | 2,963 | | | | 580,689 | |
| | |
Total Real Estate | | | | | | | 1,085,355 | |
| | |
Total Common Stocks | | | | | | | | |
(Cost $36,482,263) | | | | | | | 43,644,629 | |
| | | | | | | | |
| | | Principal Amount | | | Value | |
| | |
Short-Term Investments - 1.1% | | | | | | | | |
| |
Joint Repurchase Agreements - 1.1%2 | | | | | |
| | |
Daiwa Capital Markets America, dated 10/29/21, due 11/01/21, 0.050% total to be received $485,592 (collateralized by various U.S. Government Agency Obligations and U.S. Treasuries, 0.000% - 6.500%, 11/01/21 -11/01/51, totaling $495,302) | | | $485,590 | | | | $485,590 | |
| | |
Total Short-Term Investments | | | | | | | | |
(Cost $485,590) | | | | | | | 485,590 | |
| | |
Total Investments - 100.1% | | | | | | | | |
(Cost $36,967,853) | | | | | | | 44,130,219 | |
| | |
Other Assets, less Liabilities - (0.1)% | | | | | | | (31,401 | ) |
| | |
Net Assets - 100.0% | | | | | | | $44,098,818 | |
| * | Non-income producing security. |
| 1 | Some of these securities, amounting to $4,624,938 or 10.5% of net assets, were out on loan to various borrowers and are collateralized by cash and various U.S. Treasury Obligations. See Note 4 of Notes to Financial Statements. |
| 2 | Cash collateral received for securities lending activity was invested in these joint repurchase agreements. |
REIT Real Estate Investment Trust
| | | | | | | | | | | | | | | | |
| | | Level 1 | | | Level 2 | | | Level 3 | | | Total | |
| | | | |
Investments in Securities | | | | | | | | | | | | | | | | |
| | | | |
Common Stocks† | | $ | 43,644,629 | | | | – | | | | – | | | $ | 43,644,629 | |
| | | | |
Short-Term Investments | | | | | | | | | | | | | | | | |
| | | | |
Joint Repurchase Agreements | | | – | | | $ | 485,590 | | | | – | | | | 485,590 | |
| | | | | | | | | | | | | | | | |
| | | | |
Total Investments in Securities | | $ | 43,644,629 | | | $ | 485,590 | | | | – | | | $ | 44,130,219 | |
| | | | | | | | | | | | | | | | |
| † | All common stocks held in the Fund are Level 1 securities. For a detailed breakout of common stocks by major industry classification, please refer to the Fund’s Schedule of Portfolio Investments. |
For the fiscal year ended October 31, 2021, there were no transfers in or out of Level 3.
The accompanying notes are an integral part of these financial statements.
30
|
Statement of Assets and Liabilities October 31, 2021 |
| | | | | | | | | | | | | | | | |
| | | AMG GW&K
Core Bond ESG Fund | | | AMG GW&K Emerging Markets Equity Fund | | | AMG GW&K Emerging Wealth Equity Fund | | | AMG GW&K Small/Mid Cap Growth Fund | |
| | | | |
Assets: | | | | | | | | | | | | | | | | |
| | | | |
Investments at value1 (including securities on loan valued at $0, $2,242,295, $1,589,618, and $4,624,938, respectively) | | | $187,223,760 | | | | $58,092,433 | | | | $223,235,131 | | | | $44,130,219 | |
| | | | |
Cash | | | 7,855,311 | | | | 2,094,705 | | | | 2,195,655 | | | | 369,165 | |
| | | | |
Foreign currency2 | | | – | | | | 503,550 | | | | 998,804 | | | | – | |
| | | | |
Receivable for investments sold | | | – | | | | – | | | | – | | | | 122,296 | |
| | | | |
Dividend and interest receivables | | | 1,160,434 | | | | 33,778 | | | | 91,512 | | | | 5,247 | |
| | | | |
Securities lending income receivable | | | – | | | | 210 | | | | 964 | | | | 3,004 | |
| | | | |
Receivable for Fund shares sold | | | 269,622 | | | | 29,291 | | | | 41,680 | | | | 1,399 | |
| | | | |
Receivable from affiliate | | | 19,060 | | | | 15,594 | | | | – | | | | 14,320 | |
| | | | |
Prepaid expenses and other assets | | | 12,566 | | | | 2,902 | | | | 10,963 | | | | 13,145 | |
| | | | |
Total assets | | | 196,540,753 | | | | 60,772,463 | | | | 226,574,709 | | | | 44,658,795 | |
| | | | |
Liabilities: | | | | | | | | | | | | | | | | |
| | | | |
Payable upon return of securities loaned | | | – | | | | 2,015,149 | | | | 507,794 | | | | 485,590 | |
| | | | |
Payable for investments purchased | | | – | | | | 10,683 | | | | – | | | | – | |
| | | | |
Payable for Fund shares repurchased | | | 196,959 | | | | – | | | | 15,821 | | | | 1,048 | |
| | | | |
Payable for foreign capital gains tax | | | – | | | | – | | | | 76,478 | | | | – | |
| | | | |
Accrued expenses: | | | | | | | | | | | | | | | | |
| | | | |
Investment advisory and management fees | | | 50,044 | | | | 27,572 | | | | 107,965 | | | | 22,469 | |
| | | | |
Administrative fees | | | 25,022 | | | | 7,520 | | | | 29,445 | | | | 5,436 | |
| | | | |
Distribution fees | | | 448 | | | | 92 | | | | 264 | | | | 5,320 | |
| | | | |
Shareholder service fees | | | 13,059 | | | | 2,440 | | | | 1,566 | | | | 273 | |
| | | | |
Other | | | 99,636 | | | | 75,590 | | | | 125,793 | | | | 39,841 | |
| | | | |
Total liabilities | | | 385,168 | | | | 2,139,046 | | | | 865,126 | | | | 559,977 | |
| | | | |
| | | | | | | | | | | | | | | | |
| | | | |
Net Assets | | | $196,155,585 | | | | $58,633,417 | | | | $225,709,583 | | | | $44,098,818 | |
| | | | |
1 Investments at cost | | | $182,901,480 | | | | $45,508,783 | | | | $193,086,961 | | | | $36,967,853 | |
| | | | |
2 Foreign currency at cost | | | – | | | | $509,084 | | | | $1,009,549 | | | | – | |
The accompanying notes are an integral part of these financial statements.
31
|
Statement of Assets and Liabilities (continued) |
| | | | | | | | | | | | | | | | |
| | | AMG GW&K
Core Bond
ESG Fund | | | AMG GW&K
Emerging Markets
Equity Fund | | | AMG GW&K
Emerging Wealth
Equity Fund | | | AMG GW&K
Small/Mid Cap
Growth Fund | |
| | | | |
Net Assets Represent: | | | | | | | | | | | | | | | | |
| | | | |
Paid-in capital | | | $187,344,468 | | | | $46,243,995 | | | | $196,202,624 | | | | $37,326,251 | |
| | | | |
Total distributable earnings | | | 8,811,117 | | | | 12,389,422 | | | | 29,506,959 | | | | 6,772,567 | |
| | | | |
Net Assets | | | $196,155,585 | | | | $58,633,417 | | | | $225,709,583 | | | | $44,098,818 | |
| | | | |
Class N: | | | | | | | | | | | | | | | | |
| | | | |
Net Assets | | | $2,124,979 | | | | $414,446 | | | | $967,435 | | | | $37,471,420 | |
| | | | |
Shares outstanding | | | 197,625 | | | | 40,245 | | | | 72,154 | | | | 2,120,110 | |
| | | | |
Net asset value, offering and redemption price per share | | | $10.75 | | | | $10.30 | | | | $13.41 | | | | $17.67 | |
| | | | |
Class I: | | | | | | | | | | | | | | | | |
| | | | |
Net Assets | | | $190,306,434 | | | | $24,570,809 | | | | $41,452,647 | | | | $6,611,932 | |
| | | | |
Shares outstanding | | | 17,691,563 | | | | 2,407,340 | | | | 3,060,018 | | | | 359,532 | |
| | | | |
Net asset value, offering and redemption price per share | | | $10.76 | | | | $10.21 | | | | $13.55 | | | | $18.39 | |
| | | | |
Class Z: | | | | | | | | | | | | | | | | |
| | | | |
Net Assets | | | $3,724,172 | | | | $33,648,162 | | | | $183,289,501 | | | | $15,466 | |
| | | | |
Shares outstanding | | | 346,421 | | | | 3,313,668 | | | | 13,552,956 | | | | 841 | |
| | | | |
Net asset value, offering and redemption price per share | | | $10.75 | | | | $10.15 | | | | $13.52 | | | | $18.39 | |
The accompanying notes are an integral part of these financial statements.
32
|
Statement of Operations For the fiscal year ended October 31, 2021 |
| | | | | | | | | | | | | | | | |
| | | AMG GW&K
Core Bond
ESG Fund | | | AMG GW&K
Emerging Markets
Equity Fund | | | AMG GW&K
Emerging Wealth
Equity Fund | | | AMG GW&K
Small/Mid Cap
Growth Fund | |
| | | | |
Investment Income: | | | | | | | | | | | | | | | | |
| | | | |
Dividend income | | | $97 | | | | $984,601 | | | | $1,764,081 | | | | $98,715 | |
| | | | |
Interest income | | | 3,984,290 | | | | – | | | | – | | | | – | |
| | | | |
Securities lending income | | | – | | | | 7,665 | | | | 34,047 | | | | 10,638 | |
| | | | |
Foreign withholding tax | | | – | | | | (118,669 | ) | | | (134,379 | ) | | | (1,385 | ) |
| | | | |
Total investment income | | | 3,984,387 | | | | 873,597 | | | | 1,663,749 | | | | 107,968 | |
| | | | |
Expenses: | | | | | | | | | | | | | | | | |
| | | | |
Investment advisory and management fees | | | 598,401 | | | | 326,599 | | | | 1,456,380 | | | | 337,346 | |
| | | | |
Administrative fees | | | 299,200 | | | | 89,073 | | | | 397,195 | | | | 63,507 | |
| | | | |
Distribution fees - Class N | | | 4,847 | | | | 1,231 | | | | 4,350 | | | | 63,201 | |
| | | | |
Shareholder servicing fees - Class N | | | 2,908 | | | | 738 | | | | 2,610 | | | | 15,385 | |
| | | | |
Shareholder servicing fees - Class I | | | 145,926 | | | | 21,441 | | | | 43,017 | | | | 4,523 | |
| | | | |
Professional fees | | | 55,841 | | | | 54,462 | | | | 65,293 | | | | 27,560 | |
| | | | |
Reports to shareholders | | | 29,232 | | | | 10,019 | | | | 24,699 | | | | 14,252 | |
| | | | |
Custodian fees | | | 29,014 | | | | 55,707 | | | | 124,386 | | | | 20,786 | |
| | | | |
Registration fees | | | 28,518 | | | | 20,604 | | | | 53,286 | | | | 27,049 | |
| | | | |
Transfer agent fees | | | 24,166 | | | | 3,456 | | | | 11,642 | | | | 10,117 | |
| | | | |
Trustee fees and expenses | | | 14,220 | | | | 4,170 | | | | 18,894 | | | | 3,063 | |
| | | | |
Interest expense | | | 33 | | | | – | | | | 408 | | | | 166 | |
| | | | |
Miscellaneous | | | 8,483 | | | | 3,501 | | | | 9,452 | | | | 3,409 | |
| | | | |
Repayment of prior reimbursements | | | – | | | | 7,118 | | | | – | | | | – | |
| | | | |
Total expenses before offsets | | | 1,240,789 | | | | 598,119 | | | | 2,211,612 | | | | 590,364 | |
| | | | |
Expense reimbursements | | | (129,634 | ) | | | (58,087 | ) | | | – | | | | (103,778 | ) |
| | | | |
Expense reductions | | | – | | | | – | | | | – | | | | (2,645 | ) |
| | | | |
Fee waivers | | | – | | | | (297 | ) | | | – | | | | – | |
| | | | |
Net expenses | | | 1,111,155 | | | | 539,735 | | | | 2,211,612 | | | | 483,941 | |
| | | | |
| | | | | | | | | | | | | | | | |
| | | | |
Net investment income (loss) | | | 2,873,232 | | | | 333,862 | | | | (547,863 | ) | | | (375,973 | ) |
| | | | |
Net Realized and Unrealized Gain (Loss): | | | | | | | | | | | | | | | | |
| | | | |
Net realized gain on investments | | | 4,909,231 | | | | 557,200 | | | | 2,895,248 | | | | 16,012,613 | |
| | | | |
Net realized gain (loss) on foreign currency transactions | | | – | | | | 7,230 | | | | (23,639 | ) | | | – | |
| | | | |
Net change in unrealized appreciation/depreciation on investments | | | (7,605,124 | ) | | | 2,367,756 | | | | (5,095,133 | ) | | | (137,250 | ) |
| | | | |
Net change in unrealized appreciation/depreciation on foreign currency translations | | | – | | | | (8,202 | ) | | | 68,588 | | | | – | |
| | | | |
Net realized and unrealized gain (loss) | | | (2,695,893 | ) | | | 2,923,984 | | | | (2,154,936 | ) | | | 15,875,363 | |
| | | | |
| | | | | | | | | | | | | | | | |
| | | | |
Net increase (decrease) in net assets resulting from operations | | | $177,339 | | | | $3,257,846 | | | | $(2,702,799 | ) | | | $15,499,390 | |
The accompanying notes are an integral part of these financial statements.
33
|
Statements of Changes in Net Assets For the fiscal years ended October 31, |
| | | | | | | | | | | | | | | | |
| | | AMG GW&K
Core Bond ESG Fund | | | AMG GW&K
Emerging Markets
Equity Fund | |
| | | | |
| | | 2021 | | | 2020 | | | 2021 | | | 2020 | |
| | | | |
Increase in Net Assets Resulting From Operations: | | | | | | | | | | | | | | | | |
| | | | |
Net investment income | | | $2,873,232 | | | | $4,276,093 | | | | $333,862 | | | | $243,007 | |
| | | | |
Net realized gain on investments | | | 4,909,231 | | | | 3,844,884 | | | | 564,430 | | | | 1,747,550 | |
| | | | |
Net change in unrealized appreciation/depreciation on investments | | | (7,605,124 | ) | | | 3,478,614 | | | | 2,359,554 | | | | 1,505,399 | |
| | | | |
Net increase in net assets resulting from operations | | | 177,339 | | | | 11,599,591 | | | | 3,257,846 | | | | 3,495,956 | |
| | | | |
Distributions to Shareholders: | | | | | | | | | | | | | | | | |
| | | | |
Class N | | | (21,649 | ) | | | (27,152 | ) | | | (17,233 | ) | | | (26,892 | ) |
| | | | |
Class I | | | (2,789,712 | ) | | | (4,226,935 | ) | | | (1,069,474 | ) | | | (1,090,353 | ) |
| | | | |
Class Z | | | (57,930 | ) | | | (77,096 | ) | | | (1,249,608 | ) | | | (1,569,541 | ) |
| | | | |
Total distributions to shareholders | | | (2,869,291 | ) | | | (4,331,183 | ) | | | (2,336,315 | ) | | | (2,686,786 | ) |
| | | | |
Capital Share Transactions:1 | | | | | | | | | | | | | | | | |
| | | | |
Net increase (decrease) from capital share transactions | | | (9,231,990 | ) | | | (16,453,440 | ) | | | 13,857,527 | | | | (13,302,131 | ) |
| | | | | | | | | | | | | | | | |
| | | | |
Total increase (decrease) in net assets | | | (11,923,942 | ) | | | (9,185,032 | ) | | | 14,779,058 | | | | (12,492,961 | ) |
| | | | |
Net Assets: | | | | | | | | | | | | | | | | |
| | | | |
Beginning of year | | | 208,079,527 | | | | 217,264,559 | | | | 43,854,359 | | | | 56,347,320 | |
| | | | |
End of year | | | $196,155,585 | | | | $208,079,527 | | | | $58,633,417 | | | | $43,854,359 | |
| | | | |
1 See Note 1(g) of the Notes to Financial Statements. | | | | | | | | | | | | | | | | |
The accompanying notes are an integral part of these financial statements.
34
|
Statements of Changes in Net Assets (continued) For the fiscal years ended October 31, |
| | | | | | | | | | | | | | | | |
| | | AMG GW&K
Emerging Wealth
Equity Fund | | | AMG GW&K
Small/Mid Cap
Growth Fund | |
| | | 2021 | | | 2020 | | | 2021 | | | 2020 | |
Increase (Decrease) in Net Assets Resulting From Operations: | | | | | | | | | | | | | | | | |
Net investment income (loss) | | | $(547,863 | ) | | | $55,701 | | | | $(375,973 | ) | | | $(314,735 | ) |
| | | | |
Net realized gain (loss) on investments | | | 2,871,609 | | | | (3,363,890 | ) | | | 16,012,613 | | | | 4,712,131 | |
| | | | |
Net change in unrealized appreciation/depreciation on investments | | | (5,026,545 | ) | | | 24,585,666 | | | | (137,250 | ) | | | 2,853,559 | |
| | | | |
Net increase (decrease) in net assets resulting from operations | | | (2,702,799 | ) | | | 21,277,477 | | | | 15,499,390 | | | | 7,250,955 | |
Distributions to Shareholders: | | | | | | | | | | | | | | | | |
From net investment income and/or realized gain on investments: | | | | | | | | | | | | | | | | |
| | | | |
Class N | | | – | | | | (55,712 | ) | | | (14,397,541 | ) | | | – | |
| | | | |
Class I | | | – | | | | (219,919 | ) | | | (3,078,320 | ) | | | – | |
| | | | |
Class Z | | | (35,421 | ) | | | (3,346,538 | ) | | | – | | | | – | |
From paid-in capital: | | | | | | | | | | | | | | | | |
| | | | |
Class N | | | – | | | | – | | | | (674,816 | ) | | | – | |
| | | | |
Class I | | | – | | | | – | | | | (144,282 | ) | | | – | |
| | | | |
Total distributions to shareholders | | | (35,421 | ) | | | (3,622,169 | ) | | | (18,294,959 | ) | | | – | |
Capital Share Transactions:1 | | | | | | | | | | | | | | | | |
| | | | |
Net increase (decrease) from capital share transactions | | | 18,163,731 | | | | 79,224,668 | | | | 11,502,921 | | | | (17,184,417 | ) |
| | | | | | | | | | | | | | | | |
| | | | |
Total increase (decrease) in net assets | | | 15,425,511 | | | | 96,879,976 | | | | 8,707,352 | | | | (9,933,462 | ) |
Net Assets: | | | | | | | | | | | | | | | | |
| | | | |
Beginning of year | | | 210,284,072 | | | | 113,404,096 | | | | 35,391,466 | | | | 45,324,928 | |
| | | | |
End of year | | | $225,709,583 | | | | $210,284,072 | | | | $44,098,818 | | | | $35,391,466 | |
| 1 | See Note 1(g) of the Notes to Financial Statements. |
The accompanying notes are an integral part of these financial statements.
35
|
AMG GW&K Core Bond ESG Fund Financial Highlights For a share outstanding throughout each fiscal year |
| | | | | | | | | | | | | | | | | | | | |
| | | For the fiscal years ended October 31, | |
| Class N | | 2021 | | | 2020 | | | 2019 | | | 2018 | | | 2017 | |
| | | | | |
Net Asset Value, Beginning of Year | | | $10.90 | | | | $10.53 | | | | $9.67 | | | | $10.14 | | | | $10.26 | |
| | | | | |
Income (loss) from Investment Operations: | | | | | | | | | | | | | | | | | | | | |
| | | | | |
Net investment income1,2 | | | 0.12 | | | | 0.18 | | | | 0.21 | | | | 0.18 | | | | 0.18 | |
| | | | | |
Net realized and unrealized gain (loss) on investments | | | (0.15 | ) | | | 0.37 | | | | 0.86 | | | | (0.46 | ) | | | (0.12 | ) |
| | | | | |
Total income (loss) from investment operations | | | (0.03 | ) | | | 0.55 | | | | 1.07 | | | | (0.28 | ) | | | 0.06 | |
| | | | | |
Less Distributions to Shareholders from: | | | | | | | | | | | | | | | | | | | | |
| | | | | |
Net investment income | | | (0.12 | ) | | | (0.18 | ) | | | (0.21 | ) | | | (0.19 | ) | | | (0.18 | ) |
| | | | | |
Net Asset Value, End of Year | | | $10.75 | | | | $10.90 | | | | $10.53 | | �� | | $9.67 | | | | $10.14 | |
| | | | | |
Total Return2,3 | | | (0.27 | )% | | | 5.31 | % | | | 11.20 | % | | | (2.79 | )% | | | 0.57 | % |
| | | | | |
Ratio of net expenses to average net assets | | | 0.88 | % | | | 0.88 | % | | | 0.88 | % | | | 0.88 | % | | | 0.88 | % |
| | | | | |
Ratio of gross expenses to average net assets4 | | | 0.94 | % | | | 0.96 | % | | | 0.95 | % | | | 0.93 | % | | | 0.93 | % |
| | | | | |
Ratio of net investment income to average net assets2 | | | 1.12 | % | | | 1.69 | % | | | 2.10 | % | | | 1.88 | % | | | 1.75 | % |
| | | | | |
Portfolio turnover | | | 62 | % | | | 56 | % | | | 48 | % | | | 17 | % | | | 18 | % |
| | | | | |
Net assets end of year (000’s) omitted | | | $2,125 | | | | $1,905 | | | | $1,255 | | | | $502 | | | | $146 | |
| | | | | | | | | | | | | | | | | | | | | |
36
|
AMG GW&K Core Bond ESG Fund Financial Highlights For a share outstanding throughout each fiscal year |
| | | | | | | | | | | | | | | | | | | | |
| | | For the fiscal years ended October 31, | |
| Class I | | 2021 | | | 2020 | | | 2019 | | | 2018 | | | 2017 | |
| | | | | |
Net Asset Value, Beginning of Year | | | $10.90 | | | | $10.54 | | | | $9.67 | | | | $10.15 | | | | $10.27 | |
| | | | | |
Income (loss) from Investment Operations: | | | | | | | | | | | | | | | | | | | | |
| | | | | |
Net investment income1,2 | | | 0.16 | | | | 0.22 | | | | 0.24 | | | | 0.22 | | | | 0.21 | |
| | | | | |
Net realized and unrealized gain (loss) on investments | | | (0.14 | ) | | | 0.36 | | | | 0.88 | | | | (0.48 | ) | | | (0.12 | ) |
| | | | | |
Total income (loss) from investment operations | | | 0.02 | | | | 0.58 | | | | 1.12 | | | | (0.26 | ) | | | 0.09 | |
| | | | | |
Less Distributions to Shareholders from: | | | | | | | | | | | | | | | | | | | | |
| | | | | |
Net investment income | | | (0.16 | ) | | | (0.22 | ) | | | (0.25 | ) | | | (0.22 | ) | | | (0.21 | ) |
| | | | | |
Net Asset Value, End of Year | | | $10.76 | | | | $10.90 | | | | $10.54 | | | | $9.67 | | | | $10.15 | |
| | | | | |
Total Return2,3 | | | 0.15 | % | | | 5.55 | % | | | 11.70 | % | | | (2.59 | )% | | | 0.91 | % |
| | | | | |
Ratio of net expenses to average net assets | | | 0.56 | % | | | 0.55 | % | | | 0.55 | % | | | 0.56 | % | | | 0.55 | % |
| | | | | |
Ratio of gross expenses to average net assets4 | | | 0.62 | % | | | 0.63 | % | | | 0.62 | % | | | 0.61 | % | | | 0.60 | % |
| | | | | |
Ratio of net investment income to average net assets2 | | | 1.44 | % | | | 2.01 | % | | | 2.42 | % | | | 2.20 | % | | | 2.08 | % |
| | | | | |
Portfolio turnover | | | 62 | % | | | 56 | % | | | 48 | % | | | 17 | % | | | 18 | % |
| | | | | |
Net assets end of year (000’s) omitted | | | $190,306 | | | | $202,363 | | | | $212,801 | | | | $264,795 | | | | $325,855 | |
| | | | | | | | | | | | | | | | | | | | | |
37
|
AMG GW&K Core Bond ESG Fund Financial Highlights For a share outstanding throughout each fiscal year |
| | | | | | | | | | | | | | | | | | | | |
| | | For the fiscal years ended October 31, | |
| Class Z | | 2021 | | | 2020 | | | 2019 | | | 2018 | | | 2017 | |
| | | | | |
Net Asset Value, Beginning of Year | | | $10.90 | | | | $10.53 | | | | $9.67 | | | | $10.14 | | | | $10.26 | |
| | | | | |
Income (loss) from Investment Operations: | | | | | | | | | | | | | | | | | | | | |
| | | | | |
Net investment income1,2 | | | 0.16 | | | | 0.22 | | | | 0.25 | | | | 0.23 | | | | 0.22 | |
| | | | | |
Net realized and unrealized gain (loss) on investments | | | (0.15 | ) | | | 0.38 | | | | 0.87 | | | | (0.47 | ) | | | (0.12 | ) |
| | | | | |
Total income (loss) from investment operations | | | 0.01 | | | | 0.60 | | | | 1.12 | | | | (0.24 | ) | | | 0.10 | |
| | | | | |
Less Distributions to Shareholders from: | | | | | | | | | | | | | | | | | | | | |
| | | | | |
Net investment income | | | (0.16 | ) | | | (0.23 | ) | | | (0.26 | ) | | | (0.23 | ) | | | (0.22 | ) |
| | | | | |
Net Asset Value, End of Year | | | $10.75 | | | | $10.90 | | | | $10.53 | | | | $9.67 | | | | $10.14 | |
| | | | | |
Total Return2,3 | | | 0.13 | % | | | 5.73 | % | | | 11.71 | % | | | (2.42 | )% | | | 0.98 | % |
| | | | | |
Ratio of net expenses to average net assets | | | 0.48 | % | | | 0.48 | % | | | 0.48 | % | | | 0.48 | % | | | 0.48 | % |
| | | | | |
Ratio of gross expenses to average net assets4 | | | 0.54 | % | | | 0.56 | % | | | 0.55 | % | | | 0.53 | % | | | 0.53 | % |
| | | | | |
Ratio of net investment income to average net assets2 | | | 1.52 | % | | | 2.09 | % | | | 2.50 | % | | | 2.28 | % | | | 2.15 | % |
| | | | | |
Portfolio turnover | | | 62 | % | | | 56 | % | | | 48 | % | | | 17 | % | | | 18 | % |
| | | | | |
Net assets end of year (000’s) omitted | | | $3,724 | | | | $3,812 | | | | $3,208 | | | | $5,005 | | | | $5,590 | |
| | | | | | | | | | | | | | | | | | | | | |
| 1 | Per share numbers have been calculated using average shares. |
| 2 | Total returns and net investment income would have been lower had certain expenses not been offset. |
| 3 | The total return is calculated using the published Net Asset Value as of fiscal year end. |
| 4 | Excludes the impact of expense reimbursement or fee waivers and expense reductions such as brokerage credits, but includes expense repayments and non-reimbursable expenses, if any, such as interest, taxes, and extraordinary expenses. (See Note 1(c) and 2 in the Notes to Financial Statements.) |
38
|
AMG GW&K Emerging Markets Equity Fund Financial Highlights For a share outstanding throughout each fiscal year |
| | | | | | | | | | | | | | | | | | | | |
| | | For the fiscal years ended October 31, | |
| | | | | |
| Class N | | 2021 | | | 2020 | | | 2019 | | | 2018 | | | 2017 | |
| | | | | |
Net Asset Value, Beginning of Year | | | $9.73 | | | | $9.52 | | | | $8.61 | | | | $10.11 | | | | $7.91 | |
| | | | | |
Income (loss) from Investment Operations: | | | | | | | | | | | | | | | | | | | | |
| | | | | |
Net investment income1,2 | | | 0.02 | | | | 0.01 | | | | 0.14 | | | | 0.11 | | | | 0.09 | |
| | | | | |
Net realized and unrealized gain (loss) on investments | | | 0.96 | | | | 0.70 | | | | 1.04 | | | | (1.54 | ) | | | 2.18 | |
| | | | | |
Total income (loss) from investment operations | | | 0.98 | | | | 0.71 | | | | 1.18 | | | | (1.43 | ) | | | 2.27 | |
| | | | | |
Less Distributions to Shareholders from: | | | | | | | | | | | | | | | | | | | | |
| | | | | |
Net investment income | | | (0.07 | ) | | | (0.06 | ) | | | (0.17 | ) | | | (0.07 | ) | | | (0.07 | ) |
| | | | | |
Net realized gain on investments | | | (0.34 | ) | | | (0.44 | ) | | | (0.10 | ) | | | – | | | | – | |
| | | | | |
Total distributions to shareholders | | | (0.41 | ) | | | (0.50 | ) | | | (0.27 | ) | | | (0.07 | ) | | | (0.07 | ) |
| | | | | |
Net Asset Value, End of Year | | | $10.30 | | | | $9.73 | | | | $9.52 | | | | $8.61 | | | | $10.11 | |
| | | | | |
Total Return2,3 | | | 9.85 | % | | | 7.55 | % | | | 13.94 | % | | | (14.24 | )% | | | 28.97 | % |
| | | | | |
Ratio of net expenses to average net assets | | | 1.27 | %4 | | | 1.34 | % | | | 1.30 | % | | | 1.27 | % | | | 1.31 | % |
| | | | | |
Ratio of gross expenses to average net assets5 | | | 1.37 | %4 | | | 1.52 | % | | | 1.30 | % | | | 1.27 | % | | | 1.31 | % |
| | | | | |
Ratio of net investment income to average net assets2 | | | 0.20 | % | | | 0.13 | % | | | 1.52 | % | | | 1.12 | % | | | 1.08 | % |
| | | | | |
Portfolio turnover | | | 36 | % | | | 40 | % | | | 123 | % | | | 24 | % | | | 29 | % |
| | | | | |
Net assets end of year (000’s) omitted | | | $414 | | | | $412 | | | | $520 | | | | $289 | | | | $350 | |
| | | | | | | | | | | | | | | | | | | | | |
39
|
AMG GW&K Emerging Markets Equity Fund Financial Highlights For a share outstanding throughout each fiscal year |
| | | | | | | | | | | | | | | | | | | | |
| | | For the fiscal years ended October 31, | |
| | | | | |
| Class I | | 2021 | | | 2020 | | | 2019 | | | 2018 | | | 2017 | |
| | | | | |
Net Asset Value, Beginning of Year | | | $9.69 | | | | $9.48 | | | | $8.60 | | | | $10.11 | | | | $7.90 | |
| | | | | |
Income (loss) from Investment Operations: | | | | | | | | | | | | | | | | | | | | |
| | | | | |
Net investment income1,2 | | | 0.06 | | | | 0.04 | | | | 0.17 | | | | 0.13 | | | | 0.12 | |
| | | | | |
Net realized and unrealized gain (loss) on investments | | | 0.95 | | | | 0.69 | | | | 1.04 | | | | (1.53 | ) | | | 2.18 | |
| | | | | |
Total income (loss) from investment operations | | | 1.01 | | | | 0.73 | | | | 1.21 | | | | (1.40 | ) | | | 2.30 | |
| | | | | |
Less Distributions to Shareholders from: | | | | | | | | | | | | | | | | | | | | |
| | | | | |
Net investment income | | | (0.15 | ) | | | (0.08 | ) | | | (0.23 | ) | | | (0.11 | ) | | | (0.09 | ) |
| | | | | |
Net realized gain on investments | | | (0.34 | ) | | | (0.44 | ) | | | (0.10 | ) | | | – | | | | – | |
| | | | | |
Total distributions to shareholders | | | (0.49 | ) | | | (0.52 | ) | | | (0.33 | ) | | | (0.11 | ) | | | (0.09 | ) |
| | | | | |
Net Asset Value, End of Year | | | $10.21 | | | | $9.69 | | | | $9.48 | | | | $8.60 | | | | $10.11 | |
| | | | | |
Total Return2,3 | | | 10.13 | % | | | 7.91 | % | | | 14.34 | % | | | (13.94 | )% | | | 29.34 | % |
| | | | | |
Ratio of net expenses to average net assets | | | 0.95 | %4 | | | 1.01 | % | | | 0.97 | % | | | 0.99 | % | | | 1.03 | % |
| | | | | |
Ratio of gross expenses to average net assets5 | | | 1.05 | %4 | | | 1.19 | % | | | 0.97 | % | | | 0.99 | % | | | 1.03 | % |
| | | | | |
Ratio of net investment income to average net assets2 | | | 0.52 | % | | | 0.47 | % | | | 1.85 | % | | | 1.40 | % | | | 1.36 | % |
| | | | | |
Portfolio turnover | | | 36 | % | | | 40 | % | | | 123 | % | | | 24 | % | | | 29 | % |
| | | | | |
Net assets end of year (000’s) omitted | | | $24,571 | | | | $19,251 | | | | $24,100 | | | | $11,210 | | | | $2,207 | |
| | | | | | | | | | | | | | | | | | | | | |
40
|
AMG GW&K Emerging Markets Equity Fund Financial Highlights For a share outstanding throughout each fiscal year |
| | | | | | | | | | | | | | | | | | | | |
| | | For the fiscal years ended October 31, | |
| | | | | |
| Class Z | | 2021 | | | 2020 | | | 2019 | | | 2018 | | | 2017 | |
| | | | | |
Net Asset Value, Beginning of Year | | | $9.64 | | | | $9.43 | | | | $8.56 | | | | $10.06 | | | | $7.86 | |
| | | | | |
Income (loss) from Investment Operations: | | | | | | | | | | | | | | | | | | | | |
| | | | | |
Net investment income1,2 | | | 0.07 | | | | 0.05 | | | | 0.18 | | | | 0.15 | | | | 0.13 | |
| | | | | |
Net realized and unrealized gain (loss) on investments | | | 0.93 | | | | 0.69 | | | | 1.02 | | | | (1.53 | ) | | | 2.16 | |
| | | | | |
Total income (loss) from investment operations | | | 1.00 | | | | 0.74 | | | | 1.20 | | | | (1.38 | ) | | | 2.29 | |
| | | | | |
Less Distributions to Shareholders from: | | | | | | | | | | | | | | | | | | | | |
| | | | | |
Net investment income | | | (0.15 | ) | | | (0.09 | ) | | | (0.23 | ) | | | (0.12 | ) | | | (0.09 | ) |
| | | | | |
Net realized gain on investments | | | (0.34 | ) | | | (0.44 | ) | | | (0.10 | ) | | | – | | | | – | |
| | | | | |
Total distributions to shareholders | | | (0.49 | ) | | | (0.53 | ) | | | (0.33 | ) | | | (0.12 | ) | | | (0.09 | ) |
| | | | | |
Net Asset Value, End of Year | | | $10.15 | | | | $9.64 | | | | $9.43 | | | | $8.56 | | | | $10.06 | |
| | | | | |
Total Return2,3 | | | 10.15 | % | | | 8.01 | % | | | 14.39 | % | | | (13.88 | )% | | | 29.62 | % |
| | | | | |
Ratio of net expenses to average net assets | | | 0.87 | %4 | | | 0.94 | % | | | 0.90 | % | | | 0.87 | %�� | | | 0.88 | % |
| | | | | |
Ratio of gross expenses to average net assets5 | | | 0.97 | %4 | | | 1.12 | % | | | 0.90 | % | | | 0.87 | % | | | 0.88 | % |
| | | | | |
Ratio of net investment income to average net assets2 | | | 0.60 | % | | | 0.53 | % | | | 1.92 | % | | | 1.52 | % | | | 1.51 | % |
| | | | | |
Portfolio turnover | | | 36 | % | | | 40 | % | | | 123 | % | | | 24 | % | | | 29 | % |
| | | | | |
Net assets end of year (000’s) omitted | | | $33,648 | | | | $24,191 | | | | $31,727 | | | | $133,688 | | | | $130,828 | |
| | | | | | | | | | | | | | | | | | | | | |
| 1 | Per share numbers have been calculated using average shares. |
| 2 | Total returns and net investment income would have been lower had certain expenses not been offset. |
| 3 | The total return is calculated using the published Net Asset Value as of fiscal year end. |
| 4 | Such ratio includes recapture of waived/reimbursed fees from prior periods amounting to 0.01% for the fiscal year ended October 31, 2021. |
| 5 | Excludes the impact of expense reimbursement or fee waivers and expense reductions such as brokerage credits, but includes expense repayments and non-reimbursable expenses, if any, such as interest, taxes, and extraordinary expenses. (See Note 1(c) and 2 in the Notes to Financial Statements.) |
41
|
AMG GW&K Emerging Wealth Equity Fund Financial Highlights For a share outstanding throughout each fiscal year |
| | | | | | | | | | | | | | | | | | | | |
| | | For the fiscal years ended October 31, | |
| | | | | |
| Class N | | 2021 | | | 2020 | | | 2019 | | | 2018 | | | 2017 | |
| | | | | |
Net Asset Value, Beginning of Year | | | $13.28 | | | | $11.93 | | | | $10.38 | | | | $12.94 | | | | $10.13 | |
| | | | | |
Income (loss) from Investment Operations: | | | | | | | | | | | | | | | | | | | | |
| | | | | |
Net investment income (loss)1,2 | | | (0.09 | ) | | | (0.04 | ) | | | 0.10 | | | | 0.06 | | | | 0.05 | |
| | | | | |
Net realized and unrealized gain (loss) on investments | | | 0.22 | | | | 1.72 | | | | 1.95 | | | | (1.88 | ) | | | 2.80 | |
| | | | | |
Total income (loss) from investment operations | | | 0.13 | | | | 1.68 | | | | 2.05 | | | | (1.82 | ) | | | 2.85 | |
| | | | | |
Less Distributions to Shareholders from: | | | | | | | | | | | | | | | | | | | | |
| | | | | |
Net investment income | | | – | | | | (0.06 | ) | | | (0.06 | ) | | | (0.05 | ) | | | (0.04 | ) |
| | | | | |
Net realized gain on investments | | | – | | | | (0.27 | ) | | | (0.44 | ) | | | (0.69 | ) | | | – | |
| | | | | |
Total distributions to shareholders | | | – | | | | (0.33 | ) | | | (0.50 | ) | | | (0.74 | ) | | | (0.04 | ) |
| | | | | |
Net Asset Value, End of Year | | | $13.41 | | | | $13.28 | | | | $11.93 | | | | $10.38 | | | | $12.94 | |
| | | | | |
Total Return2,3 | | | 0.98 | % | | | 14.37 | % | | | 20.82 | % | | | (15.16 | )% | | | 28.31 | % |
| | | | | |
Ratio of net expenses to average net assets | | | 1.22 | % | | | 1.26 | % | | | 1.37 | %4 | | | 1.45 | %4,5 | | | 1.45 | %4,5 |
| | | | | |
Ratio of gross expenses to average net assets6 | | | 1.22 | % | | | 1.26 | % | | | 1.37 | %4 | | | 1.45 | %4 | | | 1.45 | %4 |
| | | | | |
Ratio of net investment income (loss) to average net assets2 | | | (0.59 | )% | | | (0.35 | )% | | | 0.93 | % | | | 0.49 | % | | | 0.45 | % |
| | | | | |
Portfolio turnover | | | 57 | % | | | 37 | % | | | 40 | % | | | 37 | % | | | 68 | % |
| | | | | |
Net assets end of year (000’s) omitted | | | $967 | | | | $1,716 | | | | $2,007 | | | | $1,940 | | | | $10 | |
| | | | | | | | | | | | | | | | | | | | | |
42
|
AMG GW&K Emerging Wealth Equity Fund Financial Highlights For a share outstanding throughout each fiscal year |
| | | | | | | | | | | | | | | | | | | | |
| | | For the fiscal years ended October 31, | |
| | | | | |
| Class I | | 2021 | | | 2020 | | | 2019 | | | 2018 | | | 2017 | |
| | | | | |
Net Asset Value, Beginning of Year | | | $13.38 | | | | $12.03 | | | | $10.44 | | | | $12.96 | | | | $10.14 | |
| | | | | |
Income (loss) from Investment Operations: | | | | | | | | | | | | | | | | | | | | |
| | | | | |
Net investment income (loss)1,2 | | | (0.05 | ) | | | (0.01 | ) | | | 0.14 | | | | 0.09 | | | | 0.08 | |
| | | | | |
Net realized and unrealized gain (loss) on investments | | | 0.22 | | | | 1.73 | | | | 1.96 | | | | (1.88 | ) | | | 2.81 | |
| | | | | |
Total income (loss) from investment operations | | | 0.17 | | | | 1.72 | | | | 2.10 | | | | (1.79 | ) | | | 2.89 | |
| | | | | |
Less Distributions to Shareholders from: | | | | | | | | | | | | | | | | | | | | |
| | | | | |
Net investment income | | | – | | | | (0.10 | ) | | | (0.07 | ) | | | (0.04 | ) | | | (0.07 | ) |
| | | | | |
Net realized gain on investments | | | – | | | | (0.27 | ) | | | (0.44 | ) | | | (0.69 | ) | | | – | |
| | | | | |
Total distributions to shareholders | | | – | | | | (0.37 | ) | | | (0.51 | ) | | | (0.73 | ) | | | (0.07 | ) |
| | | | | |
Net Asset Value, End of Year | | | $13.55 | | | | $13.38 | | | | $12.03 | | | | $10.44 | | | | $12.96 | |
| | | | | |
Total Return2,3 | | | 1.27 | % | | | 14.63 | % | | | 21.15 | % | | | (14.89 | )% | | | 28.73 | % |
| | | | | |
Ratio of net expenses to average net assets | | | 0.93 | % | | | 0.97 | % | | | 1.08 | %4 | | | 1.19 | %4,5 | | | 1.12 | %4,5 |
| | | | | |
Ratio of gross expenses to average net assets6 | | | 0.93 | % | | | 0.97 | % | | | 1.08 | %4 | | | 1.19 | %4 | | | 1.16 | %4 |
| | | | | |
Ratio of net investment income (loss) to average net assets2 | | | (0.30 | )% | | | (0.06 | )% | | | 1.22 | % | | | 0.75 | % | | | 0.78 | % |
| | | | | |
Portfolio turnover | | | 57 | % | | | 37 | % | | | 40 | % | | | 37 | % | | | 68 | % |
| | | | | |
Net assets end of year (000’s) omitted | | | $41,453 | | | | $22,813 | | | | $6,328 | | | | $2,539 | | | | $1,646 | |
| | | | | | | | | | | | | | | | | | | | | |
43
|
AMG GW&K Emerging Wealth Equity Fund Financial Highlights For a share outstanding throughout each fiscal year |
| | | | | | | | | | | | | | | | | | | | |
| | | For the fiscal years ended October 31, | |
| | | | | |
| Class Z | | 2021 | | | 2020 | | | 2019 | | | 2018 | | | 2017 | |
| | | | | |
Net Asset Value, Beginning of Year | | | $13.34 | | | | $11.99 | | | | $10.41 | | | | $12.97 | | | | $10.15 | |
| | | | | |
Income (loss) from Investment Operations: | | | | | | | | | | | | | | | | | | | | |
| | | | | |
Net investment income (loss)1,2 | | | (0.03 | ) | | | 0.01 | | | | 0.15 | | | | 0.11 | | | | 0.10 | |
| | | | | |
Net realized and unrealized gain (loss) on investments | | | 0.21 | | | | 1.72 | | | | 1.96 | | | | (1.89 | ) | | | 2.80 | |
| | | | | |
Total income (loss) from investment operations | | | 0.18 | | | | 1.73 | | | | 2.11 | | | | (1.78 | ) | | | 2.90 | |
| | | | | |
Less Distributions to Shareholders from: | | | | | | | | | | | | | | | | | | | | |
| | | | | |
Net investment income | | | (0.00 | )7 | | | (0.11 | ) | | | (0.09 | ) | | | (0.09 | ) | | | (0.08 | ) |
| | | | | |
Net realized gain on investments | | | – | | | | (0.27 | ) | | | (0.44 | ) | | | (0.69 | ) | | | – | |
| | | | | |
Total distributions to shareholders | | | (0.00 | )7 | | | (0.38 | ) | | | (0.53 | ) | | | (0.78 | ) | | | (0.08 | ) |
| | | | | |
Net Asset Value, End of Year | | | $13.52 | | | | $13.34 | | | | $11.99 | | | | $10.41 | | | | $12.97 | |
| | | | | |
Total Return2,3 | | | 1.37 | % | | | 14.75 | % | | | 21.34 | % | | | (14.87 | )% | | | 28.86 | % |
| | | | | |
Ratio of net expenses to average net assets | | | 0.82 | % | | | 0.86 | % | | | 0.97 | %4 | | | 1.05 | %4,5 | | | 1.05 | %4,5 |
| | | | | |
Ratio of gross expenses to average net assets6 | | | 0.82 | % | | | 0.86 | % | | | 0.97 | %4 | | | 1.05 | %4 | | | 1.05 | %4 |
| | | | | |
Ratio of net investment income (loss) to average net assets2 | | | (0.19 | )% | | | 0.05 | % | | | 1.33 | % | | | 0.89 | % | | | 0.85 | % |
| | | | | |
Portfolio turnover | | | 57 | % | | | 37 | % | | | 40 | % | | | 37 | % | | | 68 | % |
| | | | | |
Net assets end of year (000’s) omitted | | | $183,290 | | | | $185,755 | | | | $105,069 | | | | $60,443 | | | | $59,500 | |
| | | | | | | | | | | | | | | | | | | | | |
| 1 | Per share numbers have been calculated using average shares. |
| 2 | Total returns and net investment income (loss) would have been lower had certain expenses not been offset. |
| 3 | The total return is calculated using the published Net Asset Value as of fiscal year end. |
| 4 | Such ratio includes recapture of waived/reimbursed fees from prior periods amounting to 0.02%, 0.07% and 0.04% for the fiscal years ended October 31, 2019, 2018 and 2017, respectively. |
| 5 | Includes reduction from broker recapture amounting to less than 0.01%. |
| 6 | Excludes the impact of expense reimbursement or fee waivers and expense reductions such as brokerage credits, but includes expense repayments and non-reimbursable expenses, if any, such as interest, taxes, and extraordinary expenses. (See Note 1(c) and 2 in the Notes to Financial Statements.) |
| 7 | Less than $(0.005) per share. |
44
|
AMG GW&K Small/Mid Cap Growth Fund Financial Highlights For a share outstanding throughout each fiscal year |
| | | | | | | | | | | | | | | | | | | | |
| | | For the fiscal years ended October 31, | |
| | | | | |
| Class N | | 2021 | | | 2020 | | | 2019 | | | 2018 | | | 2017 | |
| | | | | |
Net Asset Value, Beginning of Year | | | $21.14 | | | | $17.02 | | | | $16.90 | | | | $15.30 | | | | $12.19 | |
| | | | | |
Income (loss) from Investment Operations: | | | | | | | | | | | | | | | | | | | | |
| | | | | |
Net investment loss1,2 | | | (0.17 | ) | | | (0.17 | ) | | | (0.08 | ) | | | (0.12 | ) | | | (0.09 | )3 |
| | | | | |
Net realized and unrealized gain on investments | | | 7.74 | | | | 4.29 | | | | 0.20 | | | | 1.72 | | | | 3.20 | |
| | | | | |
Total income from investment operations | | | 7.57 | | | | 4.12 | | | | 0.12 | | | | 1.60 | | | | 3.11 | |
| | | | | |
Less Distributions to Shareholders from: | | | | | | | | | | | | | | | | | | | | |
| | | | | |
Net realized gain on investments | | | (10.55 | ) | | | – | | | | – | | | | – | | | | – | |
| | | | | |
Paid in capital | | | (0.49 | ) | | | – | | | | – | | | | – | | | | – | |
| | | | | |
Total distributions to shareholders | | | (11.04 | ) | | | – | | | | – | | | | – | | | | – | |
| | | | | |
Net Asset Value, End of Year | | | $17.67 | | | | $21.14 | | | | $17.02 | | | | $16.90 | | | | $15.30 | |
| | | | | |
Total Return2,4 | | | 46.66 | % | | | 24.27 | % | | | 0.71 | % | | | 10.46 | % | | | 25.51 | % |
| | | | | |
Ratio of net expenses to average net assets5 | | | 1.17 | % | | | 1.29 | %6 | | | 1.30 | % | | | 1.31 | % | | | 1.23 | % |
| | | | | |
Ratio of gross expenses to average net assets7 | | | 1.42 | % | | | 1.60 | % | | | 1.47 | % | | | 1.43 | % | | | 1.36 | % |
| | | | | |
Ratio of net investment loss to average net assets2 | | | (0.91 | )% | | | (0.92 | )% | | | (0.48 | )% | | | (0.73 | )% | | | (0.65 | )% |
| | | | | |
Portfolio turnover | | | 158 | % | | | 126 | % | | | 138 | % | | | 161 | % | | | 151 | % |
| | | | | |
Net assets end of year (000’s) omitted | | | $37,471 | | | | $28,908 | | | | $30,717 | | | | $37,232 | | | | $45,902 | |
| | | | | | | | | | | | | | | | | | | | | |
45
|
AMG GW&K Small/Mid Cap Growth Fund Financial Highlights For a share outstanding throughout each fiscal year |
| | | | | | | | | | | | | | | | | | | | |
| | | For the fiscal years ended October 31, | |
| | | | | |
| Class I | | 2021 | | | 2020 | | | 2019 | | | 2018 | | | 2017 | |
| | | | | |
Net Asset Value, Beginning of Year | | | $21.60 | | | | $17.35 | | | | $17.20 | | | | $15.54 | | | | $12.36 | |
| | | | | |
Income (loss) from Investment Operations: | | | | | | | | | | | | | | | | | | | | |
| | | | | |
Net investment loss1,2 | | | (0.15 | ) | | | (0.14 | ) | | | (0.05 | ) | | | (0.09 | ) | | | (0.07 | )3 |
| | | | | |
Net realized and unrealized gain on investments | | | 7.98 | | | | 4.39 | | | | 0.20 | | | | 1.75 | | | | 3.25 | |
| | | | | |
Total income from investment operations | | | 7.83 | | | | 4.25 | | | | 0.15 | | | | 1.66 | | | | 3.18 | |
| | | | | |
Less Distributions to Shareholders from: | | | | | | | | | | | | | | | | | | | | |
| | | | | |
Net realized gain on investments | | | (10.55 | ) | | | – | | | | – | | | | – | | | | – | |
| | | | | |
Paid in capital | | | (0.49 | ) | | | – | | | | – | | | | – | | | | – | |
| | | | | |
Total distributions to shareholders | | | (11.04 | ) | | | – | | | | – | | | | – | | | | – | |
| | | | | |
Net Asset Value, End of Year | | | $18.39 | | | | $21.60 | | | | $17.35 | | | | $17.20 | | | | $15.54 | |
| | | | | |
Total Return2,4 | | | 46.94 | % | | | 24.48 | % | | | 0.93 | % | | | 10.68 | % | | | 25.73 | % |
| | | | | |
Ratio of net expenses to average net assets5 | | | 1.02 | % | | | 1.10 | %6 | | | 1.10 | % | | | 1.10 | % | | | 1.05 | % |
| | | | | |
Ratio of gross expenses to average net assets7 | | | 1.27 | % | | | 1.41 | % | | | 1.27 | % | | | 1.22 | % | | | 1.18 | % |
| | | | | |
Ratio of net investment loss to average net assets2 | | | (0.76 | )% | | | (0.73 | )% | | | (0.28 | )% | | | (0.52 | )% | | | (0.47 | )% |
| | | | | |
Portfolio turnover | | | 158 | % | | | 126 | % | | | 138 | % | | | 161 | % | | | 151 | % |
| | | | | |
Net assets end of year (000’s) omitted | | | $6,612 | | | | $6,483 | | | | $14,608 | | | | $65,802 | | | | $79,652 | |
| | | | | | | | | | | | | | | | | | | | | |
46
|
AMG GW&K Small/Mid Cap Growth Fund Financial Highlights For a share outstanding throughout each fiscal period |
| | | | |
| |
| Class Z | | For the fiscal
period ended
October 31,20218 | |
| |
Net Asset Value, Beginning of Period | | | $17.84 | |
| |
Income (loss) from Investment Operations: | | | | |
| |
Net investment loss1,2 | | | (0.01 | ) |
| |
Net realized and unrealized gain on investments | | | 0.56 | |
| |
Total income from investment operations | | | 0.55 | |
| |
Net Asset Value, End of Period | | | $18.39 | |
| |
Total Return2,4 | | | 3.08 | %9 |
| |
Ratio of net expenses to average net assets10 | | | 0.82 | %11 |
| |
Ratio of gross expenses to average net assets7 | | | 1.13 | %11 |
| |
Ratio of net investment loss to average net assets2 | | | (0.49 | )%11 |
| |
Portfolio turnover | | | 158 | % |
| |
Net assets end of period (000’s) omitted | | | $15 | |
| | | | | |
| 1 | Per share numbers have been calculated using average shares. |
| 2 | Total returns and net investment loss would have been lower had certain expenses not been offset. |
| 3 | Includes non-recurring dividends. Without these dividends, net investment loss per share would have been $(0.11) and $(0.09) for Class N and Class I shares, respectively. |
| 4 | The total return is calculated using the published Net Asset Value as of fiscal year end. |
| 5 | Includes reduction from broker recapture amounting to less than 0.01%, 0.01%, less than 0.01%, 0.01% and 0.01% for the fiscal years ended 2021, 2020, 2019, 2018 and 2017, respectively. |
| 6 | Includes interest expense of 0.01%. |
| 7 | Excludes the impact of expense reimbursement or fee waivers and expense reductions such as brokerage credits, but includes expense repayments and non-reimbursable expenses, if any, such as interest, taxes, and extraordinary expenses. (See Note 1(c) and 2 in the Notes to Financial Statements.) |
| 8 | Commencement of operations was on August 31, 2021. |
| 10 | Includes reduction from broker recapture amounting to less than 0.01% for the fiscal period ended October 31, 2021. |
47
|
Notes to Financial Statements October 31, 2021 |
1. ORGANIZATION AND SUMMARY OF SIGNIFICANT ACCOUNTING POLICIES
AMG Funds, AMG Funds I and AMG Funds IV (the “Trusts”) are open-end management investment companies. AMG Funds and AMG Funds I are organized as Massachusetts business trusts, while AMG Funds IV is organized as a Delaware Statutory Trust. The Trusts are registered under the Investment Company Act of 1940, as amended (the “1940 Act”). Currently, the Trusts consist of a number of different funds, each having distinct investment management objectives, strategies, risks, and policies. Included in this report are AMG Funds I: AMG GW&K Core Bond ESG Fund (“Core Bond ESG”), AMG Funds: AMG GW&K Emerging Markets Equity Fund (“Emerging Markets Equity”) and AMG GW&K Emerging Wealth Equity Fund (“Emerging Wealth Equity”) and AMG Funds IV: AMG GW&K Small/Mid Cap Growth Fund (“Small/Mid Cap Growth”) (formerly AMG GW&K Small Cap Fund II, which was formerly AMG Managers LMCG Small Cap Growth Fund), each a “Fund” and collectively, the “Funds”.
Each Fund offers different classes of shares. Core Bond ESG, Emerging Markets Equity and Emerging Wealth Equity offer Class N, Class I and Class Z shares. Small/Mid Cap Growth offers Class N and Class I shares, and, effective August 31, 2021, commenced offering Class Z shares. Each class represents an interest in the same assets of the respective Fund. Although all share classes generally have identical voting rights, each share class votes separately when required by law. Different share classes may have different net asset values per share to the extent the share classes pay different distribution amounts and/or the expenses of such share classes differ. Each share class has its own expense structure. Please refer to a current prospectus for additional information on each share class.
On March 17-18, 2021, the Board of Trustees of AMG Funds IV (together with the Board of Trustees of AMG Funds and AMG Funds I, the “Board”) approved GW&K Investment Management, LLC (“GW&K”) as the subadviser to Small/Mid Cap Growth on an interim basis to replace LMCG Investments, LLC (“LMCG”), effective March 19, 2021, which was subsequently approved by the shareholders of Small/Mid Cap Growth on June 18, 2021. In conjunction with the subadviser change, Small/Mid Cap Growth seeks to achieve its investment objective by investing securities of small- and mid-capitalization companies. In conjunction with the changes in investment strategy for Small/Mid Cap Growth, Small/Mid Cap Growth sold substantially all open positions around the date of the subadviser change that increased Small/Mid Cap Growth’s portfolio turnover. Small/Mid Cap Growth also declared a special capital gain distribution on March 24, 2021.
Market disruptions associated with the COVID-19 pandemic have had a global impact, and uncertainty exists as to the long-term implications. Such disruptions can adversely affect assets of the Funds and thus Fund performance.
Certain instruments held by a Fund may pay an interest rate based on the London Interbank Offered Rate (“LIBOR”), which is the offered rate for short-term loans between certain major international banks. LIBOR is expected to be phased out by the end of 2021. While the effect of the phase out cannot yet be determined, it may result in, among other things, increased volatility or illiquidity in markets for instruments based on LIBOR and changes in the value of some LIBOR-based investments or the effectiveness of new hedges placed against existing LIBOR-based investments. These effects could occur prior to the end of 2021. There also remains uncertainty and risk regarding the willingness and ability of issuers to include enhanced provisions in new and existing contracts or instruments. All of the aforementioned may adversely affect a Fund’s performance or net asset value.
The Funds’ financial statements are prepared in accordance with accounting principles generally accepted in the United States of America (“U.S. GAAP”),
including accounting and reporting guidance pursuant to Accounting Standards Codification Topic 946 applicable to investment companies. U.S. GAAP requires management to make estimates and assumptions that affect the reported amounts of assets and liabilities and disclosure of contingent assets and liabilities at the date of the financial statements and the reported amounts of income and expenses during the reporting period. Actual results could differ from those estimates and such differences could be material. The following is a summary of significant accounting policies followed by the Funds in the preparation of their financial statements:
a. VALUATION OF INVESTMENTS
For the Funds, equity securities traded on a national securities exchange or reported on the NASDAQ national market system (“NMS”) are valued at the last quoted sales price on the primary exchange or, if applicable, the NASDAQ official closing price or the official closing price of the relevant exchange or, lacking any sales, at the last quoted bid price for Emerging Markets Equity, Emerging Wealth Equity and Small/Mid Cap Growth, or the mean between the last quoted bid and ask prices (the “mean price”) for Core Bond ESG. Equity securities held by the Funds that are traded in the over-the-counter market (other than NMS securities) are valued at the mean price. Foreign equity securities (securities principally traded in markets other than U.S. markets) held by the Funds are valued at the official closing price on the primary exchange or, for markets that either do not offer an official closing price or where the official closing price may not be representative of the overall market, the last quoted sale price. Effective October 1, 2021, equity securities lacking any sales in Core Bond ESG are valued at the last quoted bid price and equity securities traded in the over-the-counter market (other than NMS securities) in each Fund are valued at the bid price. As of October 1, 2021, there was no impact to the Funds due to the changes in valuation policy.
Fixed income securities purchased with a remaining maturity exceeding 60 days are valued at the evaluated mean price provided by an authorized pricing service or, if an evaluated price is not available, by reference to other securities which are considered comparable in credit rating, interest rate, due date and other features (generally referred to as “matrix pricing”) or other similar pricing methodologies. Effective October 1, 2021, fixed income securities purchased with a remaining maturity exceeding 60 days are valued at the evaluated bid price provided by an authorized pricing service. As of October 1, 2021, the impact of the change in valuation policy to Core Bond ESG was $182,653 of change in unrealized appreciation/deprecation, which equates to 0.01 Net Asset Value per share.
Fixed income securities purchased with a remaining maturity of 60 days or less are valued at amortized cost, provided that the amortized cost value is approximately the same as the fair value of the security valued without the use of amortized cost. Investments in other open-end registered investment companies are valued at their end of day net asset value per share.
The Funds’ portfolio investments are generally valued based on independent market quotations or prices or, if none, “evaluative” or other market based valuations provided by third party pricing services approved by the Board. Under certain circumstances, the value of certain Fund portfolio investments may be based on an evaluation of fair value, pursuant to procedures established by and under the general supervision of the Board. The Valuation Committee, which is comprised of the Independent Trustees of the Board, and the Pricing Committee, which is comprised of representatives from AMG Funds LLC (the “Investment Manager”) are the committees appointed by the Board to make fair value determinations. Each Fund may use the fair value of a portfolio investment to
48
|
Notes to Financial Statements (continued) |
calculate its net asset value (“NAV”) in the event that the market quotation, price or market based valuation for the portfolio investment is not readily available or otherwise not determinable pursuant to the Board’s valuation procedures, if the Investment Manager or the Pricing Committee believes the quotation, price or market based valuation to be unreliable, or in certain other circumstances. When determining the fair value of an investment, the Pricing Committee and, if required under the Trusts’ securities valuation procedures, the Valuation Committee, seeks to determine the price that the Fund might reasonably expect to receive from current sale of that portfolio investment in an arms-length transaction. Fair value determinations shall be based upon consideration of all available facts and information, including, but not limited to (i) attributes specific to the investment; (ii) fundamental and analytical data relating to the investment; and (iii) the value of other comparable securities or relevant financial instruments, including derivative securities, traded on other markets or among dealers.
The values assigned to fair value portfolio investments are based on available information and do not necessarily represent amounts that might ultimately be realized in the future, since such amounts depend on future developments inherent in long-term investments. Because of the inherent uncertainty of valuation, those estimated values may differ significantly from the values that would have been used had a ready market for the investments existed, and the differences could be material. The Board will be presented with a quarterly report showing as of the most recent quarter end, all outstanding securities fair valued by the Funds, including a comparison with the prior quarter end and the percentage of the Funds that the security represents at each quarter end.
With respect to foreign equity securities and certain foreign fixed income securities, the Board has adopted a policy that securities held in the Funds that can be fair valued by the applicable fair value pricing service are fair valued on each business day provided that each individual price exceeds a pre-established confidence level.
U.S. GAAP defines fair value as the price that a fund would receive to sell an asset or pay to transfer a liability in an orderly transaction between market participants at the measurement date. U.S. GAAP also establishes a framework for measuring fair value, and a three level hierarchy for fair value measurements based upon the transparency of inputs to the valuation of an asset or liability. Inputs may be observable or unobservable and refer broadly to the assumptions that market participants would use in pricing the asset or liability. Observable inputs reflect the assumptions market participants would use in pricing the asset or liability based on market data obtained from sources independent of the Funds. Unobservable inputs reflect the Funds’ own assumptions about the assumptions that market participants would use in pricing the asset or liability developed based on the best information available in the circumstances. Each investment is assigned a level based upon the observability of the inputs which are significant to the overall valuation.
The three-tier hierarchy of inputs is summarized below:
Level 1 – inputs are quoted prices in active markets for identical investments (e.g., equity securities, open-end investment companies)
Level 2 – other observable inputs (including, but not limited to: quoted prices for similar assets or liabilities in markets that are active, quoted prices for identical or similar assets or liabilities in markets that are not active, inputs other than quoted prices that are observable for the assets or liabilities (such as interest rates, yield curves, volatilities, prepayment speeds, loss severities, credit risks and default rates) or other market corroborated inputs) (e.g., debt securities, government
securities, foreign currency exchange contracts, swaps, foreign securities utilizing international fair value pricing, fair valued securities with observable inputs)
Level 3 – inputs are significant unobservable inputs (including the Fund’s own assumptions used to determine the fair value of investments) (e.g., fair valued securities with unobservable inputs)
Changes in inputs or methodologies used for valuing investments may result in a transfer in or out of levels within the fair value hierarchy. The inputs or methodologies used for valuing investments may not necessarily be an indication of the risk associated with investing in those investments.
b. SECURITY TRANSACTIONS
Security transactions are accounted for as of trade date. Realized gains and losses on securities sold are determined on the basis of identified cost.
c. INVESTMENT INCOME AND EXPENSES
Dividend income is recorded on the ex-dividend date. Dividends from foreign securities are recorded on the ex-dividend date, and if after the fact, as soon as the Funds become aware of the ex-dividend date, except for Korean securities where dividends are recorded on confirmation date. Interest income, which includes amortization of premium and accretion of discount on debt securities, is accrued as earned. Dividend and interest income on foreign securities is recorded gross of any withholding tax. Non-cash dividends included in dividend income, if any, are reported at the fair market value of the securities received. Other income and expenses are recorded on an accrual basis. Expenses that cannot be directly attributed to a Fund are apportioned among the funds in the Trusts and other trusts or funds within the AMG Funds Family of Funds (collectively the “AMG Funds Family”) based upon their relative average net assets or number of shareholders. Investment income, realized and unrealized capital gains and losses, the common expenses of each Fund, and certain fund level expense reductions, if any, are allocated on a pro-rata basis to each class based on the relative net assets of each class to the total net assets of each Fund.
Small/Mid Cap Growth had certain portfolio trades directed to various brokers under a brokerage recapture program. Credits received from the brokerage recapture program are earned and paid on a monthly basis, and are recorded as expense offsets, which serve to reduce the Fund’s overall expense ratio. For the fiscal year ended October 31, 2021, the impact on the expenses and expense ratios was $2,645 or less than 0.01%.
d. DIVIDENDS AND DISTRIBUTIONS
Fund distributions resulting from net investment income will normally be declared and paid monthly for Core Bond ESG and annually for Emerging Markets Equity, Emerging Wealth Equity and Small/Mid Cap Growth. Realized net capital gains distributions, if any, will normally be declared and paid at least annually in December. Distributions to shareholders are recorded on the ex-dividend date. Distributions are determined in accordance with federal income tax regulations, which may differ from net investment income and net realized capital gains for financial statement purposes (U.S. GAAP). Differences may be permanent or temporary. Permanent differences are reclassified among capital accounts in the financial statements to reflect their tax character. Permanent book and tax basis differences, if any, relating to shareholder distributions will result in reclassifications to paid-in capital. Temporary differences arise when certain items of income, expense and gain or loss are recognized in different periods for
49
|
Notes to Financial Statements (continued) |
financial statement and tax purposes; these differences will reverse at some time in the future. Permanent differences are primarily due to net operating losses. Temporary differences are primarily due to wash sale loss deferrals,
mark-to-market on passive foreign investment companies, and the deferral of qualified late year losses.
The tax character of distributions paid during the fiscal years ended October 31, 2021 and October 31, 2020 were as follows:
| | | | | | | | | | | | | | | | |
| | | Core Bond ESG | | | Emerging Markets Equity | |
| | | | |
| Distributions paid from: | | 2021 | | | 2020 | | | 2021 | | | 2020 | |
| | | | |
Ordinary income * | | | $2,869,291 | | | | $4,331,183 | | | | $711,110 | | | | $2,686,786 | |
| | | | |
Long-term capital gains | | | – | | | | – | | | | 1,625,205 | | | | – | |
| | | | | | | | | | | | | | | | |
| | | | |
| | | $2,869,291 | | | | $4,331,183 | | | | $2,336,315 | | | | $2,686,786 | |
| | | | | | | | | | | | | | | | |
| | |
| | | Emerging Wealth Equity | | | Small/Mid Cap Growth | |
| | | | |
| Distributions paid from: | | 2021 | | | 2020 | | | 2021 | | | 2020 | |
| | | | |
Ordinary income * | | | $35,159 | | | | $1,049,631 | | | | $9,053,185 | | | | – | |
| | | | |
Long-term capital gains | | | 262 | | | | 2,572,538 | | | | 8,422,676 | | | | – | |
| | | | |
Paid-in capital | | | – | | | | – | | | | 819,098 | | | | – | |
| | | | | | | | | | | | | | | | |
| | | | |
| | | $35,421 | | | | $3,622,169 | | | | $18,294,959 | | | | – | |
| | | | | | | | | | | | | | | | |
| * | For tax purposes, short-term capital gain distributions, if any, are considered ordinary income distributions. |
As of October 31, 2021, the components of distributable earnings (excluding unrealized appreciation/depreciation) on a tax basis consisted of:
| | | | | | | | | | | | | | | | |
| | | Core Bond ESG | | | Emerging Markets Equity | | | Emerging Wealth Equity | | | Small/Mid Cap Growth | |
| | | | |
Undistributed ordinary income | | | $478,093 | | | | $399,654 | | | | – | | | | – | |
Undistributed long-term capital gains | | | 4,019,861 | | | | 211,238 | | | | $2,341,935 | | | | – | |
Late-year loss deferral | | | – | | | | – | | | | 432,825 | | | | $312,728 | |
At October 31, 2021, the cost of investments and the aggregate gross unrealized appreciation and depreciation for federal income tax purposes were as follows:
| | | | | | | | | | | | | | | | |
| Fund | | Cost | | | Appreciation | | | Depreciation | | | Net Appreciation | |
| | | | |
Core Bond ESG | | | $182,910,597 | | | | $5,373,966 | | | | $(1,060,803 | ) | | | $4,313,163 | |
Emerging Markets Equity | | | 46,308,480 | | | | 14,591,299 | | | | (2,812,769 | ) | | | 11,778,530 | |
Emerging Wealth Equity | | | 195,604,187 | | | | 45,764,578 | | | | (18,166,729 | ) | | | 27,597,849 | |
Small/Mid Cap Growth | | | 37,043,331 | | | | 8,967,608 | | | | (1,880,720 | ) | | | 7,086,888 | |
e. FEDERAL TAXES
Each Fund currently qualifies as an investment company and intends to comply with the requirements under Subchapter M of the Internal Revenue Code of 1986, as amended, and to distribute substantially all of its taxable income and gains to its shareholders and to meet certain diversification and income requirements with respect to investment companies. Therefore, no provision for federal income or excise tax is included in the accompanying financial statements.
Additionally, based on each Fund’s understanding of the tax rules and rates related to income, gains and transactions for the foreign jurisdictions in which it invests, each Fund will provide for foreign taxes, and where appropriate, deferred foreign taxes.
Management has analyzed the Funds’ tax positions taken on federal income tax returns as of October 31, 2021, and for all open tax years (generally, the three prior taxable years), and has concluded that no provision for federal income tax is
required in the Funds’ financial statements. Additionally, Management is not aware of any tax position for which it is reasonably possible that the total amounts of unrecognized tax benefits will change materially in the next twelve months.
f. CAPITAL LOSS CARRYOVERS AND DEFERRALS
As of October 31, 2021, the Funds had no capital loss carryovers for federal income tax purposes. Should the Funds incur net capital losses for the fiscal year ended October 31, 2022, such amounts may be used to offset future realized capital gains indefinitely, and retain their character as short-term and/or long-term.
50
|
Notes to Financial Statements (continued) |
For the fiscal year ended October 31, 2021, the following Funds utilized capital loss carryovers in the amount of:
| | | | | | | | | | |
| | | Capital Loss Carryover Utilized |
| | |
| Fund | | Short-Term | | Long-Term |
| | |
Core Bond ESG | | | | $425,987 | | | | | – | |
| | |
Emerging Wealth Equity | | | | 911,098 | | | | | – | |
g. CAPITAL STOCK
The Trusts’ Declaration of Trust authorizes for each Fund the issuance of an unlimited number of shares of beneficial interest, without par value. Each Fund records sales and repurchases of its capital stock on the trade date.
For the fiscal years ended October 31, 2021 and October 31, 2020, the capital stock transactions by class for the Funds were as follows:
| | | | | | | | | | | | | | | | | | | | | | | | | | | | | | | | |
| | | | | | Core Bond ESG | | | | | | | | | Emerging Markets Equity | | | | |
| | | | |
| | | October 31, 2021 | | | October 31, 2020 | | | October 31, 2021 | | | October 31, 2020 | |
| | | | | | | | |
| | | Shares | | | Amount | | | Shares | | | Amount | | | Shares | | | Amount | | | Shares | | | Amount | |
| | | | | | | | |
Class N: | | | | | | | | | | | | | | | | | | | | | | | | | | | | | | | | |
| | | | | | | | |
Proceeds from sale of shares | | | 57,167 | | | | $617,603 | | | | 85,411 | | | | $920,846 | | | | 26,050 | | | | $301,090 | | | | 181,059 | | | | $1,744,337 | |
| | | | | | | | |
Reinvestment of distributions | | | 1,982 | | | | 21,505 | | | | 2,508 | | | | 26,975 | | | | 1,571 | | | | 17,233 | | | | 2,833 | | | | 26,891 | |
| | | | | | | | |
Cost of shares repurchased | | | (36,310 | ) | | | (394,283 | ) | | | (32,291 | ) | | | (348,057 | ) | | | (29,702 | ) | | | (340,566 | ) | | | (196,188 | ) | | | (1,558,530 | ) |
| | | | | | | | | | | | | | | | | | | | | | | | | | | | | | | | |
| | | | | | | | |
Net increase (decrease) | | | 22,839 | | | | $244,825 | | | | 55,628 | | | | $599,764 | | | | (2,081 | ) | | | $(22,243 | ) | | | (12,296 | ) | | | $212,698 | |
| | | | | | | | | | | | | | | | | | | | | | | | | | | | | | | | |
| | | | | | | | |
Class I: | | | | | | | | | | | | | | | | | | | | | | | | | | | | | | | | |
| | | | | | | | |
Proceeds from sale of shares | | | 1,732,406 | | | | $18,782,363 | | | | 1,374,556 | | | | $14,850,604 | | | | 635,502 | | | | $7,074,008 | | | | 1,230,745 | | | | $9,743,030 | |
| | | | | | | | |
Reinvestment of distributions | | | 244,961 | | | | 2,659,029 | | | | 374,177 | | | | 4,019,598 | | | | 35,661 | | | | 386,561 | | | | 52,112 | | | | 491,414 | |
| | | | | | | | |
Cost of shares repurchased | | | (2,843,986 | ) | | | (30,881,158 | ) | | | (3,385,772 | ) | | | (36,392,063 | ) | | | (251,494 | ) | | | (2,698,418 | ) | | | (1,837,609 | ) | | | (15,777,470 | ) |
| | | | | | | | | | | | | | | | | | | | | | | | | | | | | | | | |
| | | | | | | | |
Net increase (decrease) | | | (866,619 | ) | | | $(9,439,766 | ) | | | (1,637,039 | ) | | | $(17,521,861 | ) | | | 419,669 | | | | $4,762,151 | | | | (554,752 | ) | | | $(5,543,026 | ) |
| | | | | | | | | | | | | | | | | | | | | | | | | | | | | | | | |
| | | | | | | | |
Class Z: | | | | | | | | | | | | | | | | | | | | | | | | | | | | | | | | |
| | | | | | | | |
Proceeds from sale of shares | | | 58,501 | | | | $638,670 | | | | 82,098 | | | | $869,531 | | | | 762,904 | | | | $8,699,676 | | | | 231,629 | | | | $2,130,804 | |
| | | | | | | | |
Reinvestment of distributions | | | 5,343 | | | | 57,930 | | | | 7,172 | | | | 77,096 | | | | 115,827 | | | | 1,248,619 | | | | 128,421 | | | | 1,203,308 | |
| | | | | | | | |
Cost of shares repurchased | | | (67,164 | ) | | | (733,649 | ) | | | (44,147 | ) | | | (477,970 | ) | | | (75,374 | ) | | | (830,676 | ) | | | (1,213,641 | ) | | | (11,305,915 | ) |
| | | | | | | | | | | | | | | | | | | | | | | | | | | | | | | | |
| | | | | | | | |
Net increase (decrease) | | | (3,320 | ) | | | $(37,049 | ) | | | 45,123 | | | | $468,657 | | | | 803,357 | | | | $9,117,619 | | | | (853,591 | ) | | | $(7,971,803 | ) |
| | | | | | | | | | | | | | | | | | | | | | | | | | | | | | | | |
| | | | | | |
| | | | | | Emerging Wealth Equity | | | | | | | | | Small/Mid Cap Growth | | | | |
| | | | |
| | | October 31, 2021 | | | October 31, 2020 | | | October 31, 2021 | | | October 31, 2020 | |
| | | | | | | | |
| | | Shares | | | Amount | | | Shares | | | Amount | | | Shares | | | Amount | | | Shares | | | Amount | |
| | | | | | | | |
Class N: | | | | | | | | | | | | | | | | | | | | | | | | | | | | | | | | |
| | | | | | | | |
Proceeds from sale of shares | | | 8,974 | | | | $138,021 | | | | 24,646 | | | | $275,535 | | | | 91,217 | | | | $1,757,478 | | | | 36,920 | | | | $687,740 | |
| | | | | | | | |
Reinvestment of distributions | | | – | | | | – | | | | 4,548 | | | | 55,712 | | | | 972,672 | | | | 14,770,300 | | | | – | | | | – | |
| | | | | | | | |
Cost of shares repurchased | | | (66,077 | ) | | | (967,375 | ) | | | (68,095 | ) | | | (733,597 | ) | | | (311,010 | ) | | | (5,726,959 | ) | | | (473,941 | ) | | | (8,270,391 | ) |
| | | | | | | | | | | | | | | | | | | | | | | | | | | | | | | | |
| | | | | | | | |
Net increase (decrease) | | | (57,103 | ) | | | $(829,354 | ) | | | (38,901 | ) | | | $(402,350 | ) | | | 752,879 | | | | $10,800,819 | | | | (437,021 | ) | | | $(7,582,651 | ) |
| | | | | | | | | | | | | | | | | | | | | | | | | | | | | | | | |
51
|
Notes to Financial Statements (continued) |
| | | | | | | | | | | | | | | | | | | | | | | | | | | | | | | | |
| | | | | | |
| | | | | | Emerging Wealth Equity | | | | | | | | | Small/Mid Cap Growth | | | | |
| | | | |
| | | October 31, 2021 | | | October 31, 2020 | | | October 31, 2021 | | | October 31, 2020 | |
| | | | | | | | |
| | | Shares | | | Amount | | | Shares | | | Amount | | | Shares | | | Amount | | | Shares | | | Amount | |
| | | | | | | | |
Class I: | | | | | | | | | | | | | | | | | | | | | | | | | | | | | | | | |
| | | | | | | | |
Proceeds from sale of shares | | | 1,993,990 | | | | $30,549,706 | | | | 1,818,122 | | | | $21,632,228 | | | | 42,998 | | | | $900,118 | | | | 34,550 | | | | $621,155 | |
| | | | | | | | |
Reinvestment of distributions | | | – | | | | – | | | | 17,592 | | | | 216,555 | | | | 202,482 | | | | 3,199,629 | | | | – | | | | – | |
| | | | | | | | |
Cost of shares repurchased | | | (639,402 | ) | | | (9,207,782 | ) | | | (656,368 | ) | | | (7,085,572 | ) | | | (186,045 | ) | | | (3,412,645 | ) | | | (576,238 | ) | | | (10,222,921 | ) |
| | | | | | | | | | | | | | | | | | | | | | | | | | | | | | | | |
| | | | | | | | |
Net increase (decrease) | | | 1,354,588 | | | | $21,341,924 | | | | 1,179,346 | | | | $14,763,211 | | | | 59,435 | | | | $687,102 | | | | (541,688 | ) | | | $(9,601,766 | ) |
| | | | | | | | | | | | | | | | | | | | | | | | | | | | | | | | |
| | | | | | | | |
Class Z:1 | | | | | | | | | | | | | | | | | | | | | | | | | | | | | | | | |
| | | | | | | | |
Proceeds from sale of shares | | | 3,554,557 | | | | $54,731,525 | | | | 8,182,601 | | | | $98,216,854 | | | | 841 | | | | $15,000 | | | | – | | | | – | |
| | | | | | | | |
Reinvestment of distributions | | | 162 | | | | 2,470 | | | | 27,678 | | | | 339,331 | | | | – | | | | – | | | | – | | | | – | |
| | | | | | | | |
Cost of shares repurchased | | | (3,925,460 | ) | | | (57,082,834 | ) | | | (3,049,658 | ) | | | (33,692,378 | ) | | | – | | | | – | | | | – | | | | – | |
| | | | | | | | | | | | | | | | | | | | | | | | | | | | | | | | |
| | | | | | | | |
Net increase (decrease) | | | (370,741 | ) | | | $(2,348,839 | ) | | | 5,160,621 | | | | $64,863,807 | | | | 841 | | | | $15,000 | | | | – | | | | – | |
| | | | | | | | | | | | | | | | | | | | | | | | | | | | | | | | |
| 1 | Commencement of operations for Small/Mid Cap Growth was on August 31, 2021. |
At October 31, 2021, certain affiliated and unaffiliated shareholders of record individually or collectively held greater than 10% of the net assets of the Funds as follows: Emerging Markets Equity - one owns 39%. Transactions by this shareholder may have a material impact on the Fund.
h. REPURCHASE AGREEMENTS AND JOINT REPURCHASE AGREEMENTS
The Funds may enter into third-party repurchase agreements for temporary cash management purposes and third-party or bilateral joint repurchase agreements for reinvestment of cash collateral on securities lending transactions under the securities lending program offered by The Bank of New York Mellon (“BNYM”) (the “Program”) (collectively, “Repurchase Agreements”). The value of the underlying collateral, including accrued interest, must equal or exceed the value of the Repurchase Agreements during the term of the agreement. For joint repurchase agreements, the Funds participate on a pro rata basis with other clients of BNYM in its share of the underlying collateral under such joint repurchase agreements and in its share of proceeds from any repurchase or other disposition of the underlying collateral. The underlying collateral for all Repurchase Agreements is held in safekeeping by the Funds’ custodian or at the Federal Reserve Bank. If the seller defaults and the value of the collateral declines, or if bankruptcy proceedings commence with respect to the seller of the security, realization of the collateral by the Funds may be delayed or limited. Pursuant to the Program, the Funds are indemnified for such losses by BNYM on joint repurchase agreements.
At October 31, 2021, the market value of Repurchase Agreements outstanding for Emerging Markets Equity, Emerging Wealth Equity and Small/Mid Cap Growth were $2,015,149, $507,794 and $485,590, respectively.
i. FOREIGN CURRENCY TRANSLATION
The books and records of the Funds are maintained in U.S. dollars. The value of investments, assets and liabilities denominated in currencies other than U.S. dollars are translated into U.S. dollars based upon current foreign exchange rates. Purchases and sales of foreign investments, income and expenses are converted into U.S. dollars based on currency exchange rates prevailing on the respective dates of such transactions. Net realized and unrealized gain (loss) on foreign currency transactions represent: (1) foreign exchange gains and losses from the sale and holdings of foreign currencies; (2) gains and losses between trade date and settlement date on investment securities transactions and foreign currency
exchange contracts; and (3) gains and losses from the difference between amounts of interest and dividends recorded and the amounts actually received.
The Funds do not isolate the net realized and unrealized gain or loss resulting from changes in exchange rates from the fluctuations in market prices of securities held. Such fluctuations are included with the net realized and unrealized gain or loss on investments.
2. AGREEMENTS AND TRANSACTIONS WITH AFFILIATES
For each of the Funds, the Trusts have entered into an investment advisory agreement under which the Investment Manager, a subsidiary and the U.S. retail distribution arm of Affiliated Managers Group, Inc. (“AMG”), serves as investment manager to the Funds and is responsible for the Funds’ overall administration and operations. The Investment Manager selects one or more subadvisers for the Funds (subject to Board approval) and monitors each subadviser’s investment performance, security holdings and investment strategies. Each Fund’s investment portfolio is managed by GW&K, who serves pursuant to a subadvisory agreement with the Investment Manager. AMG indirectly owns a majority interest in GW&K. Prior to March 19, 2021, Small/Mid Cap Growth’s investment portfolio was managed by LMCG, who served pursuant to subadvisory agreements with the Investment Manager.
52
|
Notes to Financial Statements (continued) |
Investment management fees are paid directly by the Funds to the Investment Manager based on average daily net assets. For the fiscal year ended October 31, 2021, the Funds’ investment management fees were paid at the following annual rate of each Fund’s respective average daily net assets:
| | | | |
Core Bond ESG | | | 0.30 | % |
| |
Emerging Markets Equity | | | 0.55 | % |
Emerging Wealth Equity | | | 0.55 | % |
| |
Small/Mid Cap Growth1 | | | 0.62 | % |
| 1 | Prior to June 18, 2021, the investment management fees were 0.90%. |
The Investment Manager has contractually agreed, through at least March 1, 2022 for Core Bond ESG, Emerging Markets Equity, and Emerging Wealth Equity and March 1, 2023 for Small/Mid Cap Growth, to waive management fees and/or pay or reimburse fund expenses in order to limit total annual Fund operating expenses after fee waiver and expense reimbursements (exclusive of taxes, interest (including interest incurred in connection with bank and custody overdrafts and in connection with securities sold short), shareholder servicing fees, distribution and service (12b-1) fees, brokerage commissions and other transaction costs, dividends payable with respect to securities sold short, acquired fund fees and expenses and extraordinary expenses) of Core Bond ESG, Emerging Markets Equity, Emerging Wealth Equity and Small/Mid Cap Growth to 0.48%, 0.87%, 0.90% and 0.82%, respectively, of each Fund’s average daily net assets (this annual rate or such other annual rate that may be in effect from time to time, the “Expense Cap”), subject to later reimbursement by the Funds in certain circumstances. Prior to March 1, 2020, the total annual Fund operating expense limitation was 1.05% of Emerging Markets Equity’s average daily net assets. Prior to June 18 2021, the total annual Fund operating expense limitation was 1.03% of Small/Mid Cap Growth’s average daily net assets.
In general, for a period of up to 36 months after the date any amounts are paid, waived or reimbursed by the Investment Manager, the Investment Manager may recover such amounts from a Fund, provided that such repayment would not cause the Fund’s total annual operating expenses after fee waiver and expense reimbursements (exclusive of the items noted in the parenthetical above) to exceed either (i) the Expense Cap in effect at the time such amounts were paid, waived or reimbursed, or (ii) the Expense Cap in effect at the time of such repayment by the Fund.
The contractual expense limitation may only be terminated in the event the Investment Manager or a successor ceases to be the investment manager of a Fund or a successor fund, by mutual agreement between the Investment Manager and the Board, or in the event of a Fund’s liquidation unless the Fund is reorganized or is a party to a merger in which the surviving entity is successor to the accounting and performance information of a Fund.
At October 31, 2021, the Funds’ expiration of reimbursements subject to recoupment is as follows:
| | | | | | | | | | | | |
| Expiration | | | | | | | | | |
| Period | | Core Bond ESG | | | Emerging Markets Equity | | | Small/Mid Cap Growth | |
| | | |
Less than 1 year | | | $156,648 | | | | – | | | | $140,019 | |
| | | |
1-2 years | | | 159,696 | | | | $78,697 | | | | 111,190 | |
| | | |
2-3 years | | | 129,634 | | | | 58,087 | | | | 103,778 | |
| | | | | | | | | | | | |
| | | |
Total | | | $445,978 | | | | $136,784 | | | | $354,987 | |
| | | | | | | | | | | | |
The Investment Manager has contractually agreed, through March 1, 2021, to waive management fees and/or pay or reimburse Emerging Markets Equity’s expenses in an amount that is equal to the fees and expenses incurred indirectly by the Fund as a result of investment in shares of one or more acquired funds. The contractual expense limitation may only be terminated in the event the Investment Manager or a successor ceases to be the investment manager of the Fund or a successor fund, by mutual agreement among the Investment Manager, GW&K and the Board or in the event of the Fund’s liquidation unless the Fund is reorganized or is a party to a merger in which the surviving entity is successor to the accounting and performance information of the Fund. For the four months ended February 28, 2021, the Investment Manager waived $297 in fees.
The Trusts, on behalf of the Funds, have entered into an amended and restated Administration Agreement under which the Investment Manager serves as the Funds’ administrator (the “Administrator”) and is responsible for all non-portfolio management aspects of managing the Funds’ operations, including administration and shareholder services to each Fund. Each Fund pays a fee to the Administrator at the rate of 0.15% per annum of the Fund’s average daily net assets for this service.
The Funds are distributed by AMG Distributors, Inc. (the “Distributor”), a wholly-owned subsidiary of the Investment Manager. The Distributor serves as the distributor and underwriter for each Fund and is a registered broker-dealer and member of the Financial Industry Regulatory Authority, Inc. (“FINRA”). Shares of each Fund will be continuously offered and will be sold directly to prospective purchasers and through brokers, dealers or other financial intermediaries who have executed selling agreements with the Distributor. Generally the Distributor bears all or a portion of the expenses of providing services pursuant to the distribution agreement, including the payment of the expenses relating to the distribution of prospectuses for sales purposes and any advertising or sales literature.
The Trusts have adopted a distribution and service plan (the “Plan”) with respect to the Class N shares of each Fund, in accordance with the requirements of Rule 12b-1 under the 1940 Act and the requirements of the applicable rules of FINRA regarding asset-based sales charges. Pursuant to the Plan, each Fund may make payments to the Distributor for its expenditures in financing any activity primarily intended to result in the sale of each Fund’s Class N shares and for maintenance and personal service provided to existing shareholders of that class. The Plan authorized payments to the Distributor up to 0.25% annually of each Fund’s average daily net assets attributable to the Class N shares. For Small/Mid Cap Growth, the Plan is characterized as a reimbursement plan and is directly tied to expenses incurred by the Distributor; the payments the Distributor receives during any year may not exceed its actual expenses. The impact on the Class N annualized expense ratios for the fiscal year ended October 31, 2021, were 0.25%
53
|
Notes to Financial Statements (continued) |
for Core Bond ESG, Emerging Markets Equity, and Emerging Wealth Equity and 0.18% for Small/Mid Cap Growth.
For each of the Class N shares and Class I shares, the Board has approved reimbursement payments to the Investment Manager for shareholder servicing expenses (“shareholder servicing fees”) incurred. Shareholder servicing fees include payments to financial intermediaries, such as broker-dealers (including fund supermarket platforms), banks, and trust companies who provide shareholder recordkeeping, account servicing and other services. The Class N and Class I shares may reimburse the Investment Manager for the actual amount incurred up to a maximum annual rate of each Class’s average daily net assets as shown in the table below.
The impact on the annualized expense ratios for the fiscal year ended October 31, 2021, were as follows:
| | | | | | | | |
| Fund | | Maximum Annual
Amount
Approved | | | Actual Amount Incurred | |
| | |
Core Bond ESG | | | | | | | | |
Class N | | | 0.15% | | | | 0.15% | |
Class I | | | 0.10% | | | | 0.08% | |
Emerging Markets Equity | | | | | | | | |
Class N | | | 0.15% | | | | 0.15% | |
Class I | | | 0.15% | | | | 0.08% | |
Emerging Wealth Equity | | | | | | | | |
Class N | | | 0.15% | | | | 0.15% | |
Class I | | | 0.15% | | | | 0.11% | |
Small/Mid Cap Growth | | | | | | | | |
Class N* | | | – | | | | 0.04% | |
Class I* | | | 0.05% | | | | 0.06% | |
| * | Prior to June 18, 2021, the maximum annual amount approved was 0.15%. Effective, June 18, 2021, the shareholder servicing fees for Class N was eliminated. |
The Board provides supervision of the affairs of the Trusts and other trusts within the AMG Funds Family. The Trustees of the Trusts who are not affiliated with the Investment Manager receive an annual retainer and per meeting fees for regular, special and telephonic meetings, and they are reimbursed for out-of-pocket expenses incurred while carrying out their duties as Board members. The Chairman of the Board and the Audit Committee Chair receive additional annual retainers. Certain Trustees and Officers of the Funds are Officers and/or Directors of the Investment Manager, AMG and/or the Distributor.
The Securities and Exchange Commission (the “SEC”) granted an exemptive order that permits certain eligible funds in the AMG Funds Family to lend and borrow money for certain temporary purposes directly to and from other eligible funds in the AMG Funds Family. Participation in this interfund lending program is voluntary for both the borrowing and lending funds, and an interfund loan is only made if it benefits each participating fund. The Administrator manages the program according to procedures approved by the Board, and the Board monitors the operation of the program. An interfund loan must comply with certain conditions set out in the exemptive order, which are designed to assure fairness and protect all participating funds. The interest earned and interest paid on interfund loans are included on the Statement of Operations as interest income and interest expense,
respectively. Core Bond ESG, Emerging Markets Equity and Emerging Wealth Equity participated in the interfund lending program for the year ended October 31, 2021, while Small/Mid Cap Growth commenced participating in the interfund lending program on July 2, 2021. At October 31, 2021, the Funds had no interfund loans outstanding.
The following Funds utilized the interfund loan program during the fiscal year ended October 31, 2021 as follows:
| | | | | | | | | | | | | | | | |
| Fund | | Average
Lent | | | Number
of Days | | | Interest
Earned | | | Average
Interest Rate | |
| | | | |
Core Bond ESG | | | $1,335,266 | | | | 9 | | | | $308 | | | | 0.936% | |
| | | | |
| Fund | | Average
Borrowed | | | Number
of Days | | | Interest
Paid | | | Average
Interest Rate | |
| | | | |
Core Bond ESG | | | $1,344,381 | | | | 1 | | | | $33 | | | | 0.908% | |
| | | | |
Emerging Wealth Equity | | | 1,949,218 | | | | 8 | | | | 408 | | | | 0.955% | |
3. PURCHASES AND SALES OF SECURITIES
Purchases and sales of securities (excluding short-term securities and U.S. Government Obligations) for the fiscal year ended October 31, 2021, were as follows:
| | | | | | | | |
| | | Long Term Securities | |
| | |
| Fund | | Purchases | | | Sales | |
| | |
Core Bond ESG | | | $62,383,118 | | | | $86,118,731 | |
| | |
Emerging Markets Equity | | | 31,010,215 | | | | 20,056,587 | |
| | |
Emerging Wealth Equity | | | 167,557,733 | | | | 143,756,947 | |
| | |
Small/Mid Cap Growth | | | 65,349,566 | | | | 71,590,324 | |
Core Bond ESG purchases and sales of U.S. Government obligations during the fiscal year ended October 31, 2021 were $57,922,268 and $45,970,522, respectively.
4. PORTFOLIO SECURITIES LOANED
The Funds participate in the Program providing for the lending of securities to qualified borrowers. Securities lending income includes earnings of such temporary cash investments, plus or minus any rebate to a borrower. These earnings (after any rebate) are then divided between BNYM, as a fee for its services under the Program, and the Funds, according to agreed-upon rates. Collateral on all securities loaned is accepted in cash, U.S. Treasury Obligations or U.S. Government Agency Obligations. Collateral is maintained at a minimum level of 102% (105% in the case of certain foreign securities) of the market value, plus interest, if applicable, of investments on loan. It is the Funds’ policy to obtain additional collateral from or return excess collateral to the borrower by the end of the next business day, following the valuation date of the securities loaned. Therefore, the value of the collateral held may be temporarily less than the value of the securities on loan. Lending securities entails a risk of loss to the Funds if and to the extent that the market value of the securities loaned were to increase and the borrower did not increase the collateral accordingly, and the borrower fails to return the securities. Under the terms of the Program, the Funds are indemnified for such losses by BNYM. Cash collateral is held in separate omnibus accounts managed by BNYM, who is authorized to exclusively enter into joint repurchase agreements for that cash collateral, and securities collateral is held in separate
54
|
Notes to Financial Statements (continued) |
omnibus accounts managed by BNYM and cannot be sold or pledged. BNYM bears the risk of any deficiency in the amount of the cash collateral available for return to the borrower due to any loss on the collateral invested. Loans of securities are terminable at any time and the borrower, after notice, is required to return borrowed securities as soon as practical, which is normally within three business days.
The value of securities loaned on positions held, cash collateral and securities collateral received at October 31, 2021, were as follows:
| | | | | | | | | | | | | | | | |
| Fund | | Securities
Loaned | | | Cash
Collateral
Received | | | Securities
Collateral
Received | | | Total
Collateral
Received | |
| | | | |
Emerging Markets Equity | | | $2,242,295 | | | | $2,015,149 | | | | $360,842 | | | | $2,375,991 | |
| | | | |
Emerging Wealth Equity | | | 1,589,618 | | | | 507,794 | | | | 1,208,507 | | | | 1,716,301 | |
| | | | |
Small/Mid Cap Growth | | | 4,624,938 | | | | 485,590 | | | | 4,218,215 | | | | 4,703,805 | |
The following table summarizes the securities received as collateral for securities lending at October 31, 2021:
| | | | | | |
| Fund | | Collateral Type | | Coupon
Range | | Maturity Date Range |
| | | |
Emerging Markets Equity | | U.S. Treasury Obligations | | 0.000%-3.750% | | 11/30/21-02/15/51 |
| | | |
Emerging Wealth Equity | | U.S. Treasury Obligations | | 0.750%-3.625% | | 05/31/22-08/15/49 |
| | | |
Small/Mid Cap Growth | | U.S. Treasury Obligations | | 0.000%-6.875% | | 11/15/21-11/15/50 |
5. FOREIGN SECURITIES
Certain Funds invest in securities of foreign entities and in instruments denominated in foreign currencies which involve risks not typically associated with investments in domestic securities. Non-domestic securities carry special risks, such as exposure to currency fluctuations, less developed or less efficient trading markets, political instability, a lack of company information, differing auditing and legal standards, and, potentially, less liquidity. A Fund’s investments in emerging market countries are exposed to additional risks. A Fund’s performance will be influenced by political, social and economic factors affecting companies in emerging market countries. Emerging market countries generally have economic structures that are less diverse and mature, and political systems that are less stable, than those of developed countries. Realized gains in certain countries may be subject to foreign taxes at the Fund level and the Fund would pay such foreign taxes at the appropriate rate for each jurisdiction.
6. COMMITMENTS AND CONTINGENCIES
Under the Trusts’ organizational documents, its trustees and officers are indemnified against certain liabilities arising out of the performance of their duties
to the Trusts. In addition, in the normal course of business, the Funds may enter into contracts and agreements that contain a variety of representations and warranties, which provide general indemnifications. The maximum exposure to the Funds under these arrangements is unknown, as this would involve future claims that may be made against a Fund that have not yet occurred. However, based on experience, the Funds had no prior claims or losses and expect the risks of loss to be remote.
7. CREDIT AGREEMENT
Effective July 6, 2010, and amended and restated on July 22, 2020, AMG Funds IV entered into a Credit Agreement with BNYM (the “Credit Agreement”) which provides the funds in AMG Funds IV, including Small/Mid Cap Growth with a revolving line of credit of up to $50 million. The Credit Agreement expires in 365 days and can be renewed at the mutual agreement of AMG Funds IV and BNYM. The facility is shared by each fund of AMG Funds IV, and is available for temporary, emergency purposes including liquidity needs in meeting redemptions. The interest rate on outstanding Alternate Base Rate Loans is equal to the greater of the Prime Rate plus 1.25%, or 0.50% plus the Federal Funds Effective Rate plus 1.25%. The interest rate on outstanding Overnight Loans is equal to the greater of the Federal Funds Effective Rate plus 1.25%, or the One-Month LIBOR Rate plus 1.25%. AMG Funds IV pays a commitment fee on the unutilized commitment amount of 0.175% per annum, which is allocated to the funds in AMG Funds IV based on average daily net assets and included in miscellaneous expense on the Statement of Operations. Interest incurred on loans utilized is included in the Statement of Operations as interest expense. Upon the expiration of the Credit Agreement on July 21, 2021, Small/Mid Cap Growth did not participate in the Credit Agreement renewal.
The following Fund utilized the line of credit during the fiscal year ended October 31, 2021:
| | | | | | | | | | | | | | | | |
| Fund | | Weighted
Average
Borrowed | | | Number
of Days | | | Interest
Paid | | | Average
Interest Rate | |
| | | | |
Small/Mid Cap Growth | | | $1,471,403 | | | | 3 | | | | $166 | | | | 1.357 | % |
8. MASTER NETTING AGREEMENTS
The Funds may enter into master netting agreements with their counterparties for the securities lending program and Repurchase Agreements, which provide the right, in the event of default (including bankruptcy or insolvency) for the non-defaulting party to liquidate the collateral and calculate net exposure to the defaulting party or request additional collateral. For financial reporting purposes, the Funds do not offset financial assets and financial liabilities that are subject to master netting agreements in the Statement of Assets and Liabilities. For securities lending transactions, see Note 4.
55
|
Notes to Financial Statements (continued) |
The following table is a summary of the Funds’ open Repurchase Agreements that are subject to a master netting agreement as of October 31, 2021:
| | | | | | | | | | |
| | | | | Gross Amount Not Offset in the
Statement of Assets and Liabilities | | | | |
Fund | | Gross Amounts of
Assets Presented in
the Statement of
Assets and Liabilities | | Offset
Amount | | Net
Asset
Balance | | Collateral
Received | | Net
Amount |
| | | | | |
Emerging Markets Equity | | | | | | | | | | |
| | | | | |
Bank of America Securities, Inc. | | $1,000,000 | | – | | $1,000,000 | | $1,000,000 | | – |
| | | | | |
HSBC Securities USA, Inc. | | 15,149 | | – | | 15,149 | | 15,149 | | – |
| | | | | |
RBC Dominion Securities, Inc. | | 1,000,000 | | – | | 1,000,000 | | 1,000,000 | | – |
| | | | | | | | | | |
| | | | | |
Total | | $2,015,149 | | – | | $2,015,149 | | $2,015,149 | | – |
| | | | | | | | | | |
| | | | | |
Emerging Wealth Equity | | | | | | | | | | |
| | | | | |
Daiwa Capital Markets America | | $ 507,794 | | – | | $507,794 | | $507,794 | | – |
| | | | | |
Small/Mid Cap Growth | | | | | | | | | | |
| | | | | |
Daiwa Capital Markets America | | $ 485,590 | | – | | $485,590 | | $485,590 | | – |
9. SUBSEQUENT EVENTS
The Funds have determined that no material events or transactions occurred through the issuance date of the Funds’ financial statements which require an additional disclosure in or adjustment of the Funds’ financial statements.
56
|
Report of Independent Registered Public Accounting Firm |
TO THE BOARD OF TRUSTEES OF AMG FUNDS, AMG FUNDS I, AND AMG FUNDS IV AND SHAREHOLDERS OF AMG GW&K CORE BOND ESG FUND, AMG GW&K EMERGING MARKETS EQUITY FUND, AMG GW&K EMERGING WEALTH EQUITY FUND, AND AMG GW&K SMALL/MID CAP GROWTH FUND:
Opinion on the Financial Statements
We have audited the accompanying statements of assets and liabilities, including the schedules of portfolio investments, of AMG GW&K Core Bond ESG Fund (one of the funds constituting AMG Funds I), AMG GW&K Emerging Markets Equity Fund and AMG GW&K Emerging Wealth Equity Fund (two of the funds constituting AMG Funds), and AMG GW&K Small/Mid Cap Growth Fund (formerly AMG GW&K Small Cap Fund II, which was formerly AMG Managers LMCG Small Cap Growth Fund) (one of the funds constituting AMG Funds IV) (hereafter collectively referred to as the “Funds “) as of October 31, 2021, the related statements of operations for the year ended October 31, 2021, the statements of changes in net assets for each of the two years in the period ended October 31, 2021, including the related notes, and the financial highlights for each of the periods indicated therein (collectively referred to as the “financial statements”). In our opinion, the financial statements present fairly, in all material respects, the financial position of each of the Funds as of October 31, 2021, the results of each of their operations for the year then ended, the changes in each of their net assets for each of the two years in the period ended October 31, 2021 and the financial highlights for each of the periods indicated therein in conformity with accounting principles generally accepted in the United States of America.
Basis for Opinion
These financial statements are the responsibility of the Funds’ management. Our responsibility is to express an opinion on the Funds’ financial statements based on our audits. We are a public accounting firm registered with the Public Company Accounting Oversight Board (United States) (PCAOB) and are required to be independent with respect to the Funds in accordance with the U.S. federal securities laws and the applicable rules and regulations of the Securities and Exchange Commission and the PCAOB.
We conducted our audits of these financial statements in accordance with the standards of the PCAOB. Those standards require that we plan and perform the audit to obtain reasonable assurance about whether the financial statements are free of material misstatement, whether due to error or fraud.
Our audits included performing procedures to assess the risks of material misstatement of the financial statements, whether due to error or fraud, and performing procedures that respond to those risks. Such procedures included examining, on a test basis, evidence regarding the amounts and disclosures in the financial statements. Our audits also included evaluating the accounting principles used and significant estimates made by management, as well as evaluating the overall presentation of the financial statements. Our procedures included confirmation of securities owned as of October 31, 2021 by correspondence with the custodian, transfer agent and brokers; when replies were not received from brokers, we performed other auditing procedures. We believe that our audits provide a reasonable basis for our opinions.
PricewaterhouseCoopers LLP
Boston, Massachusetts
December 22, 2021
We have served as the auditor of one or more investment companies in AMG Funds Family since 1993.
57
|
Other Information (unaudited) |
TAX INFORMATION
AMG GW&K Core Bond ESG Fund, AMG GW&K Emerging Markets Equity Fund, AMG GW&K Emerging Wealth Equity Fund and AMG GW&K Small/Mid Cap Growth Fund each hereby designates the maximum amount allowable of their net taxable income as qualified dividends as provided in the Jobs and Growth Tax Relief Reconciliation Act of 2003. The 2020/2021 Form 1099-DIV you receive for each Fund will show the tax status of all distributions paid to you during the year.
In accordance with federal tax law, the following Funds elect to provide foreign taxes paid and the income sourced from foreign countries. Accordingly, each Fund hereby makes the following designations regarding its taxable period ended October 31, 2021:
AMG GW&K Emerging Markets Equity Fund
u The total amount of taxes paid and income sourced from foreign countries was $106,848 and $984,671, respectively.
AMG GW&K Emerging Wealth Equity Fund
u The total amount of taxes paid and income sourced from foreign countries was $767,841 and $1,367,271, respectively.
Pursuant to section 852 of the Internal Revenue Code, AMG GW&K Core Bond ESG Fund, AMG GW&K Emerging Markets Equity Fund, AMG GW&K Emerging Wealth Equity Fund and AMG GW&K Small/Mid Cap Growth Fund, each hereby designates as a capital gain distribution with respect to the taxable period ended October 31, 2021, $0, $1,625,205, $262 and $8,422,676, respectively, or, if subsequently determined to be different, the net capital gains of such period.
PROXY VOTE
A special meeting of the shareholders of AMG GW&K Small/Mid Cap Growth Fund (the “Fund”) was held on June 18, 2021, to vote on proposals to approve a new subadvisory agreement between AMG Funds LLC (the “Investment Manager”) and GW&K Investment Management, LLC (“GW&K”) with respect to the Fund. The proposals and results of the votes are summarized below.
| | | | | | | | | | | | | | | |
| | | | | Number of Eligible Shareholders | | |
| | | |
| Proposal 1 | | For | | Against | | Abstain |
| | | |
To approve a new subadvisory agreement between the Investment Manager and GW&K with respect to the Fund. | | 1,069,360 | | 77,401 | | 192,172 |
| | | |
% of Shares Present | | 79.866% | | 5.781% | | 14.353% |
| | | |
% of Outstanding Shares | | 40.246% | | 2.913% | | 7.232% |
| | | |
| | | | | Number of Eligible Shareholders | | |
| | | |
| Proposal 2 | | For | | Against | | Abstain |
| | | |
To approve the redesignation of the Fund’s fundamental investment objective as non-fundamental. | | 991,268 | | 163,495 | | 184,170 |
| | | |
% of Shares Present | | 74.034% | | 12.211% | | 13.755% |
| | | |
% of Outstanding Shares | | 37.307% | | 6.153% | | 6.931% |
| | | |
| | | | | Number of Eligible Shareholders | | |
| | | |
| Proposal 3a | | For | | Against | | Abstain |
| | | |
To approve the amendment of the Fund’s fundamental investment restriction with respect to borrowing and issuing senior securities. | | 1,033,279 | | 130,744 | | 174,910 |
| | | |
% of Shares Present | | 77.172% | | 9.765% | | 13.063% |
| | | |
% of Outstanding Shares | | 38.887% | | 4.921% | | 6.583% |
| | | |
| | | | | Number of Eligible Shareholders | | |
| | | |
| Proposal 3b | | For | | Against | | Abstain |
| | | |
To approve the amendment of the Funds fundamental investment restriction with respect to lending. | | 1,026,548 | | 137,533 | | 174,852 |
| | | |
% of Shares Present | | 76.669% | | 10.272% | | 13.059% |
| | | |
% of Outstanding Shares | | 38.634% | | 5.176% | | 6.581% |
58
|
Other Information (continued) |
| | | | | | | | | | | | | | | |
| | | |
| | | | | Number of Eligible Shareholders | | |
| | | |
| Proposal 4 | | For | | Against | | Abstain |
To approve a modified manager-of-managers structure for the Fund that would permit the Investment Manager to enter into and materially amend subadvisory agreements with unaffiliated and affiliated subadvisers without obtaining shareholder approval and would also permit the Fund to disclose fees paid to subadvisers on an aggregate, rather than individual, basis. | | 972,247 | | 176,963 | | 189,723 |
% of Shares Present | | 72.613% | | 13.217% | | 14.170% |
% of Outstanding Shares | | 36.591% | | 6.660% | | 7.140% |
| | | | |
| Fund Totals: | | Shares | |
Record Total | | | 2,657,099 | |
Shares Voted | | | 1,338,933 | |
Percent Present | | | 50.391% | |
59
|
AMG Funds Trustees and Officers |
| | | | | | | | |
The Trustees and Officers of the Trust, their business addresses, principal occupations for the past five years and ages are listed below. The Trustees provide broad supervision over the affairs of the Trust and the Funds. The Trustees are experienced executives who meet periodically throughout the year to oversee the Funds’ activities, review contractual arrangements with companies that provide services to the Funds, and | | | | review the Funds’ performance. Unless otherwise noted, the address of each Trustee or Officer is the address of the Trust: 680 Washington Blvd., Suite 500, Stamford, CT. 06901. There is no stated term of office for Trustees. Trustees serve until their resignation, retirement or removal in | | | | accordance with the Trust’s organizational documents and policies adopted by the Board from time to time. The Chairman of the Trustees, President, Treasurer and Secretary of the Trust are elected by the Trustees annually. Other officers hold office at the pleasure of the Trustees. |
Independent Trustees
The following Trustees are not “interested persons” of the Trust within the meaning of the 1940 Act:
| | |
Number of Funds Overseen in Fund Complex | | Name, Age, Principal Occupation(s) During Past 5 Years and Other Directorships Held by
Trustee |
| | |
• Trustee since 2012 - AMG Funds • Trustee since 2012 - AMG Funds I • Trustee since 2016 - AMG Funds IV • Oversees 42 Funds in Fund Complex | | Bruce B. Bingham, 72 Partner, Hamilton Partners (real estate development firm) (1987-Present); Director of The Yacktman Funds, Inc. (2 portfolios) (2000-2012). |
| | |
• Trustee since 2013 - AMG Funds • Trustee since 2013 - AMG Funds I • Trustee since 2013 - AMG Funds IV • Chairman of the Audit Committee since 2021 - AMG Funds, AMG Funds I • Chairman of the Audit Committee since 2020 - AMG Funds IV • Oversees 46 Funds in Fund Complex | | Kurt A. Keilhacker, 58 Managing Partner, TechFund Europe (2000-Present); Managing Partner, TechFund Capital (1997-Present); Managing Partner, Elementum Ventures (2013-Present); Director, MetricStory, Inc. (2017-Present); Trustee, Wheaton College (2018-Present); Trustee, Gordon College (2001-2016); Board Member, 6wind SA (2002-2019). |
| | |
• Trustee since 2000 - AMG Funds • Oversees 42 Funds in Fund Complex | | Steven J. Paggioli, 71 Independent Consultant (2002-Present); Trustee, Professionally Managed Portfolios (28 portfolios); Advisory Board Member, Sustainable Growth Advisors, LP; Independent Director, Muzinich BDC, Inc. (business development company) (2019-Present); Director, The Wadsworth Group; Independent Director, Chase Investment Counsel (2008–2019); Executive Vice President, Secretary and Director, Investment Company Administration, LLC and First Fund Distributors, INC. (1990-2001). |
| | |
• Trustee since 2013 • Oversees 42 Funds in Fund Complex | | Richard F. Powers III, 75 Adjunct Professor, U.S. Naval War College (2016-Present); Adjunct Professor, Boston College (2011-2015); Director, Ameriprise Financial Inc. (2005-2009); President and CEO of Van Kampen Investments Inc. (1998-2003); President, Morgan Stanley Client Group (2000-2002); Executive Vice President and Chief Marketing Officer of the Morgan Stanley Individual Investor Group (1984-1998). |
| | |
• Independent Chairman of the Board of Trustees since 2017; Chairman of the Governance Committee since 2017 • Trustee since 2000 • Oversees 46 Funds in Fund Complex | | Eric Rakowski, 63 Professor of Law, University of California at Berkeley School of Law (1990-Present); Tax Attorney at Davis Polk & Wardwell and clerked for Judge Harry T. Edwards of the U.S. Court of Appeals for the District of Columbia Circuit and for Justice William J. Brennan Jr. of the U.S. Supreme Court; Director of Harding, Loevner Funds, Inc. (10 portfolios); Trustee of Third Avenue Trust (3 portfolios) (2002-2019); Trustee of Third Avenue Variable Trust (1 portfolio) (2002-2019). |
| | |
• Trustee since 2013 • Oversees 46 Funds in Fund Complex | | Victoria L. Sassine, 56 Adjunct Professor, Babson College (2007–Present); Director, Board of Directors, PRG Group (2017-Present); CEO, Founder, Scale Smarter Partners, LLC (2018-Present); Adviser, EVOFEM Biosciences (2019-Present); Chairperson of the Board of Directors of Business Management Associates (2018 to 2019). |
60
|
AMG Funds Trustees and Officers (continued) |
| | |
Number of Funds Overseen in Fund Complex | | Name, Age, Principal Occupation(s) During Past 5 Years and Other Directorships Held by
Trustee |
| | |
• Trustee since 2000 - AMG Funds I • Trustee since 2004 - AMG Funds • Trustee since 2016 - AMG Funds IV • Oversees 42 Funds in Fund Complex | | Thomas R. Schneeweis, 74 Professor Emeritus, University of Massachusetts (2013-Present); President, TRS Associates (1982-Present); Board Member, Chartered Alternative Investment Association (“CAIA”) (2002-Present); Co-Founder and Director, Institute for Global Asset and Risk Management (Education) (2010-Present); Co-Owner, Quantitative Investment Technologies (2014-Present); Co-Owner, Yes Wealth Management (2018-Present); Director, CAIA Foundation (2010-2019); Partner, S Capital Wealth Advisors (2015-2018); Partner, S Capital Management, LLC (2007-2015); President, Alternative Investment Analytics, LLC, (formerly Schneeweis Partners, LLC) (2001-2013). |
Interested Trustees
Each Trustee in the following table is an “interested person” of the Trust within the meaning of the 1940 Act. Ms. Carsman is an interested person of the Trust within the meaning of the 1940 Act by virtue of her position with, and interest in securities of, AMG.
| | |
Number of Funds Overseen in Fund Complex | | Name, Age, Principal Occupation(s) During Past 5 Years and Other Directorships Held by
Trustee |
| | |
• Trustee since 2011 • Oversees 42 Funds in Fund Complex | | Christine C. Carsman, 69 Affiliated Managers Group, Inc. (2004-Present): Senior Policy Advisor (2019-Present), Executive Vice President, Deputy General Counsel and Chief Regulatory Counsel (2017-2018), Senior Vice President and Deputy General Counsel (2011-2016), Senior Vice President and Chief Regulatory Counsel (2007-2011), Vice President and Chief Regulatory Counsel (2004-2007); Chair of the Board of Directors, AMG Funds plc (2015-2018); Director, AMG Funds plc (2010-2018); Secretary and Chief Legal Officer, AMG Funds, AMG Funds I, AMG Funds II and AMG Funds III (2004-2011); Senior Counsel, Vice President and Director of Operational Risk Management and Compliance, Wellington Management Company, LLP (1995-2004); Director Emeritus of Harding, Loevner Funds, Inc. (0 Portfolios) (2021- Present); Director of Harding, Loevner Funds, Inc. (9 portfolios) (2017-2020). |
| | |
• Trustee since 2021 • Oversees 42 Funds in Fund Complex | | Garret W. Weston, 40 Affiliated Managers Group, Inc. (2008-Present): Managing Director, Co-Head of Affiliate Engagement (2021-Present), Senior Vice President, Affiliate Development (2016-2021), Vice President, Office of the CEO (2015-2016), Vice President, New Investments (2012-2015), Senior Associate, New Investments (2008-2012); Associate, Madison Dearborn Partners (2006-2008); Analyst, Merrill Lynch (2004-2006). |
| |
| Officers | | |
Position(s) Held with Fund and Length of Time Served | | Name, Age, Principal Occupation(s) During Past 5 Years |
| | |
• President since 2018 • Principal Executive Officer since 2018 • Chief Executive Officer since 2018 • Chief Operating Officer since 2007 | | Keitha L. Kinne, 63 Chief Operating Officer, AMG Funds LLC (2007-Present); Chief Investment Officer, AMG Funds LLC (2008-Present); President and Principal, AMG Distributors, Inc. (2018-Present); Chief Operating Officer, AMG Distributors, Inc. (2007-Present); President, Chief Executive Officer and Principal Executive Officer, AMG Funds, AMG Funds I, AMG Funds II, AMG Funds III and AMG Funds IV (2018-Present); Chief Operating Officer, AMG Funds, AMG Funds I, AMG Funds II, and AMG Funds III (2007-Present); Chief Operating Officer, AMG Funds IV (2016-Present); Chief Operating Officer and Chief Investment Officer, Aston Asset Management, LLC (2016); President and Principal Executive Officer, AMG Funds, AMG Funds I, AMG Funds II and AMG Funds III (2012-2014); Managing Partner, AMG Funds LLC (2007-2014); President and Principal, AMG Distributors, Inc. (2012-2014); Managing Director, Legg Mason & Co., LLC (2006-2007); Managing Director, Citigroup Asset Management (2004-2006). |
| | |
• Secretary since 2015 • Chief Legal Officer since 2015 | | Mark J. Duggan, 56 Managing Director and Senior Counsel, AMG Funds LLC (2021-Present); Senior Vice President and Senior Counsel, AMG Funds LLC (2015-2021); Secretary and Chief Legal Officer, AMG Funds, AMG Funds I, AMG Funds II, AMG Funds III and AMG Funds IV (2015-Present); Attorney, K&L Gates, LLP (2009-2015). |
| | |
• Chief Financial Officer since 2017 • Treasurer since 2017 • Principal Financial Officer since 2017 • Principal Accounting Officer since 2017 | | Thomas G. Disbrow, 55 Vice President, Mutual Fund Treasurer & CFO, AMG Funds, AMG Funds LLC (2017-Present); Chief Financial Officer, Principal Financial Officer, Treasurer and Principal Accounting Officer, AMG Funds, AMG Funds I, AMG Funds II, AMG Funds III and AMG Funds IV (2017-Present); Managing Director - Global Head of Traditional Funds Product Control, UBS Asset Management (Americas), Inc. (2015-2017); Managing Director - Head of North American Funds Treasury, UBS Asset Management (Americas), Inc. (2011-2015). |
61
|
AMG Funds Trustees and Officers (continued) |
| | |
Position(s) Held with Fund and Length of Time Served | | Name, Age, Principal Occupation(s) During Past 5 Years |
| | |
• Deputy Treasurer since 2017 | | John A. Starace, 51 Vice President, Mutual Fund Accounting, AMG Funds LLC (2021-Present); Director, Mutual Fund Accounting, AMG Funds LLC (2017-2021); Vice President, Deputy Treasurer of Mutual Funds Services, AMG Funds LLC (2014-2017); Deputy Treasurer, AMG Funds, AMG Funds I, AMG Funds II, AMG Funds III and AMG Funds IV (2017-Present); Vice President, Citi Hedge Fund Services (2010-2014); Audit Senior Manager (2005-2010) and Audit Manager (2001-2005), Deloitte & Touche LLP. |
| | |
• Chief Compliance Officer and Sarbanes-Oxley Code of Ethics Compliance Officer since 2019 | | Patrick J. Spellman, 47 Vice President, Chief Compliance Officer, AMG Funds LLC (2017-Present); Chief Compliance Officer, AMG Distributors, Inc., (2010-Present); Chief Compliance Officer and Sarbanes-Oxley Code of Ethics Compliance Officer, AMG Funds, AMG Funds I, AMG Funds II, AMG Funds III and AMG Funds IV (2019-Present); Senior Vice President, Chief Compliance Officer, AMG Funds LLC (2011-2017); Anti-Money Laundering Compliance Officer, AMG Funds, AMG Funds I, AMG Funds II, and AMG Funds III (2014-2019); Anti-Money Laundering Officer, AMG Funds IV (2016-2019); Compliance Manager, Legal and Compliance, Affiliated Managers Group, Inc. (2005-2011). |
| | |
• Assistant Secretary since 2016 | | Maureen A. Meredith, 36 Vice President, Senior Counsel, AMG Funds LLC (2021-Present); Vice President, Counsel, AMG Funds LLC (2019-2021); Director, Counsel, AMG Funds LLC (2017-2018); Vice President, Counsel, AMG Funds LLC (2015-2017); Assistant Secretary, AMG Funds, AMG Funds I, AMG Funds II, AMG Funds III and AMG Funds IV (2016-Present); Associate, Ropes & Gray LLP (2011-2015); Law Fellow, Massachusetts Appleseed Center for Law and Justice (2010-2011). |
| | |
• Anti-Money Laundering Compliance Officer since 2019 | | Hector D. Roman, 43 Director, Legal and Compliance, AMG Funds LLC (2020-Present); Anti-Money Laundering Compliance Officer, AMG Funds, AMG Funds I, AMG Funds II, AMG Funds III and AMG Funds IV (2019-Present); Manager, Legal and Compliance, AMG Funds LLC (2017-2019); Director of Compliance, Morgan Stanley Investment Management (2015-2017); Senior Advisory, PricewaterhouseCoopers LLP (2014-2015); Risk Manager, Barclays Investment Bank (2008-2014). |
62
|
Annual Renewal of Investment Management and Subadvisory Agreements |
| | | | | | | | |
AMG GW&K Emerging Markets Equity Fund, AMG GW&K Emerging Wealth Equity Fund, AMG GW&K Core Bond ESG Fund, and AMG GW&K Small/Mid Cap Growth Fund (formerly AMG GW&K Small Cap Fund II, which was formerly AMG Managers LMCG Small Cap Growth Fund): Approval of Investment Management and Subadvisory Agreements on June 24, 2021 At a meeting held via telephone and video conference on June 24, 2021,1 the Board of Trustees (the “Board” or the “Trustees”) of each of AMG Funds, AMG Funds I, and AMG Funds IV (each, a “Trust” and collectively, the “Trusts”), and separately a majority of the Trustees who are not “interested persons” of the Trusts (the “Independent Trustees”), approved (i) the Investment Management Agreement, as amended pursuant to letter agreements at any time prior to the date of the meeting, with AMG Funds LLC (the “Investment Manager”) and AMG Funds for each of AMG GW&K Emerging Markets Equity Fund and AMG GW&K Emerging Wealth Equity Fund, and separately each of Amendment No. 1 thereto dated July 1, 2015, and Amendment No. 2 thereto dated October 1, 2016; the Fund Management Agreement, as amended pursuant to letter agreements at any time prior to the date of the meeting, with the Investment Manager and AMG Funds I for AMG GW&K Core Bond ESG Fund, and separately each of Amendment No. 1 thereto dated July 1, 2015, and Amendment No. 2 thereto dated October 1, 2016; and the Investment Advisory Agreement, as amended pursuant to letter agreements at any time prior to the date of the meeting, with the Investment Manager and AMG Funds IV for AMG GW&K Small/Mid Cap Growth Fund (formerly AMG GW&K Small Cap Fund II, which was formerly AMG Managers LMCG Small Cap Growth Fund), and separately Amendment No. 1 thereto dated October 1, 2016 (collectively, the “Investment Management Agreements”); and (ii) the Subadvisory Agreements, as amended at any time prior to the date of the meeting (collectively, the “Subadvisory Agreements”), with the Subadviser for AMG GW&K Emerging Markets Equity Fund, AMG GW&K Emerging Wealth Equity Fund, and AMG GW&K Core Bond ESG Fund. 2 The Independent Trustees were separately represented by independent legal counsel in connection with their consideration of the approval of these agreements. In considering the Investment Management Agreements and the Subadvisory Agreements, the Trustees reviewed a variety of materials relating to AMG GW&K Emerging Markets Equity Fund, AMG GW&K Emerging Wealth Equity Fund, AMG GW&K Core Bond ESG Fund, and AMG GW&K Small/Mid Cap Growth Fund (each, a | | | | “Fund,” and collectively, the “Funds”), the Investment Manager and, with respect to AMG GW&K Emerging Markets Equity Fund, AMG GW&K Emerging Wealth Equity Fund, and AMG GW&K Core Bond ESG Fund, the Subadviser, including the nature, extent and quality of services, comparative performance, fee and expense information for an appropriate peer group of similar mutual funds for each Fund (each, a “Peer Group”), performance information for the relevant benchmark index for each Fund (each, a “Fund Benchmark”), other relevant matters, and other information provided to them on a periodic basis throughout the year. Prior to voting, the Independent Trustees: (a) reviewed the foregoing information with their independent legal counsel; (b) received materials from their independent legal counsel discussing the legal standards applicable to their consideration of the Investment Management Agreements and the Subadvisory Agreements; and (c) met with their independent legal counsel in private sessions at which no representatives of management were present. NATURE, EXTENT AND QUALITY OF SERVICES In considering the nature, extent and quality of the services provided by the Investment Manager, the Trustees reviewed information relating to the Investment Manager’s operations and personnel. Among other things, the Investment Manager provided financial information, information about its supervisory and professional staff and descriptions of its organizational and management structure. The Trustees also took into account information provided periodically throughout the previous year by the Investment Manager in Board meetings relating to the performance of its duties with respect to the Funds and the Trustees’ knowledge of the Investment Manager’s management and the quality of the performance of the Investment Manager’s duties under the Investment Management Agreements and Administration Agreement. In the course of their deliberations regarding the Investment Manager, the Trustees evaluated, among other things: (a) the extent and quality of the Investment Manager’s oversight of the operation and management of the Funds; (b) the quality of the Investment Manager’s oversight of the performance by the Subadviser of its portfolio management duties; (c) the Investment Manager’s ability to supervise the Funds’ other service providers; and (d) the Investment Manager’s compliance program. The Trustees also took into account that, in performing its functions under the Investment Management Agreements and supervising the Subadviser, the Investment Manager: performs periodic detailed analyses and | | | | reviews of the performance by the Subadviser of its obligations to each Fund, including without limitation, analysis and review of portfolio and other compliance matters and review of the Subadviser’s investment performance with respect to each Fund; prepares and presents periodic reports to the Board regarding the investment performance of the Subadviser and other information regarding the Subadviser, at such times and in such forms as the Board may reasonably request; reviews and considers any changes in the personnel of the Subadviser responsible for performing the Subadviser’s obligations and makes appropriate reports to the Board; reviews and considers any changes in the ownership or senior management of the Subadviser and makes appropriate reports to the Board; performs periodic in-person, telephonic or videoconference diligence meetings, including with respect to compliance matters, with representatives of the Subadviser; assists the Board and management of the Trusts in developing and reviewing information with respect to the initial approval of each Subadvisory Agreement and the Small/Mid Cap Growth Subadvisory Agreement and annual consideration of each Subadvisory Agreement and the Small/Mid Cap Growth Subadvisory Agreement thereafter; prepares recommendations with respect to the continued retention of the Subadviser or the replacement of the Subadviser, including at the request of the Board; identifies potential successors to, or replacements of, the Subadviser or potential additional subadvisers, including performing appropriate due diligence, and developing and presenting to the Board a recommendation as to any such successor, replacement, or additional subadviser, including at the request of the Board; designates and compensates from its own resources such personnel as the Investment Manager may consider necessary or appropriate to the performance of its services; and performs such other review and reporting functions as the Board shall reasonably request consistent with the Investment Management Agreements and applicable law. The Trustees noted the affiliation of the Subadviser with the Investment Manager, noting any potential conflicts of interest. The Trustees also took into account the financial condition of the Investment Manager with respect to its ability to provide the services required under the Investment Management Agreements and the Investment Manager’s undertaking to maintain contractual expense limitations for the Funds. The Trustees also considered the Investment Manager’s risk management processes. |
63
|
Annual Renewal of Investment Management and Subadvisory Agreements (continued) |
| | | | | | | | |
For AMG GW&K Emerging Markets Equity Fund, AMG GW&K Emerging Wealth Equity Fund and AMG GW&K Core Bond ESG Fund, the Trustees also reviewed information relating to the Subadviser’s operations and personnel and the investment philosophy, strategies and techniques used in managing each Fund. Among other things, the Trustees reviewed information on portfolio management and other professional staff, information regarding the Subadviser’s organizational and management structure and the Subadviser’s brokerage policies and practices. The Trustees considered specific information provided regarding the experience of the individuals at the Subadviser with portfolio management responsibility for each Fund, including the information set forth in the Fund’s prospectus and statement of additional information. In the course of their deliberations, the Trustees evaluated, among other things: (a) the services rendered by the Subadviser in the past; (b) the qualifications and experience of the Subadviser’s personnel; and (c) the Subadviser’s compliance program. The Trustees also took into account the financial condition of the Subadviser with respect to its ability to provide the services required under each Subadvisory Agreement. The Trustees also considered the Subadviser’s risk management processes. PERFORMANCE The Board considered each Fund’s net performance during relevant time periods as compared to the Fund’s Peer Group and Fund Benchmark, considered the gross performance of each of AMG GW&K Emerging Markets Equity Fund, AMG GW&K Emerging Wealth Equity Fund and AMG GW&K Core Bond ESG Fund as compared to the Subadviser’s relevant performance composite that utilizes the same investment strategy and approach, and noted that the Board reviews on a quarterly basis detailed information about both a Fund’s performance results and portfolio composition, as well as the Subadviser’s investment philosophy, strategies and techniques used in managing the Fund. The Board was mindful of the Investment Manager’s expertise, resources and attention to monitoring the Subadviser’s performance, investment style and risk-adjusted performance with respect to the Funds and its discussions with the management of the Funds’ subadvisers during the period regarding the factors that contributed to the performance of the Funds. With respect to AMG GW&K Emerging Markets Equity Fund, among other information relating to the Fund’s performance, the Trustees noted that the Fund’s | | | | performance for Class Z shares (which share class has one of the earliest inception dates and the largest amount of assets of all the share classes of the Fund) for the 1-year, 3-year, 5-year, and 10-year periods ended March 31, 2021 was above, above, above, and below, respectively, the median performance of the Peer Group and above, above, above, and below, respectively, the performance of the Fund Benchmark, the MSCI Emerging Markets Index. The Trustees took into account management’s discussion of the Fund’s performance, including the Fund’s recent outperformance of the Peer Group and the Fund Benchmark. The Trustees concluded that the Fund’s overall performance has been satisfactory. With respect to AMG GW&K Emerging Wealth Equity Fund, among other information relating to the Fund’s performance, the Trustees noted that the Fund’s performance for Class Z shares (which share class has the largest amount of assets of all the share classes of the Fund) for the 1-year, 3-year, and 5-year periods ended March 31, 2021 and for the period from the Fund’s inception on March 19, 2015 through March 31, 2021 was below, above, above, and above the median performance of the Peer Group and above the performance of the Fund Benchmark, the MSCI Emerging Markets Index. The Trustees took into account management’s discussion of the Fund’s performance, noting that the Class Z shares of the Fund ranked in the top quintile relative to its Peer Group for the 3-year and 5-year periods and the period from inception through March 31, 2021. The Trustees concluded that the Fund’s overall performance has been satisfactory. With respect to AMG GW&K Core Bond ESG Fund, among other information relating to the Fund’s performance, the Trustees noted that the Fund’s performance for Class I shares (which share class has the earliest inception date and the largest amount of assets of all the share classes of the Fund) for the 1-year, 3-year, 5-year and 10-year periods ended March 31, 2021 was above, above, below, and below, respectively, the median performance of the Peer Group and above, above, at, and below, respectively, the performance of the Fund Benchmark, the Bloomberg Barclays U.S. Aggregate Bond Index. The Trustees took into account management’s discussion of the Fund’s performance, including the reasons for the Fund’s more recent outperformance of the Peer Group and the Fund Benchmark. The Trustees also noted the change in the Fund’s Subadviser in February 2015 and that the performance record prior to that time reflects that of the prior Subadviser. The Trustees | | | | also took into account the fact that the Fund transitioned to include an ESG strategy in 2019. The Trustees concluded that the Fund’s overall performance has been satisfactory. With respect to AMG GW&K Small/Mid Cap Growth Fund, among other information relating to the Fund’s performance, the Trustees noted that the Fund’s performance for Class N shares (which share class has the earliest inception date and the largest amount of assets of all the share classes of the Fund) for the 1-year, 3-year, 5-year, and 10-year periods ended March 31, 2021 was above, below, below, and below, respectively, the median performance of the Peer Group and below the performance of the Fund Benchmark, the Russell 2500® Growth Index. The Trustees took into account management’s discussion of the Fund’s performance, including the reasons for the Fund’s underperformance. The Trustees noted that the Fund ranked in the top third relative to its Peer Group for the 1-year period. The Trustees also took into account the fact that the Fund’s subadviser changed effective March 19, 2021, that the Fund’s investment strategy changed effective March 19, 2021 and further on May 21, 2021, that the Fund Benchmark changed effective May 21, 2021, and that the performance information reflected that of the Fund’s prior subadviser and investment strategy. The Trustees concluded that the Fund’s performance is being addressed. ADVISORY AND SUBADVISORY FEES; FUND EXPENSES; PROFITABILITY; AND ECONOMIES OF SCALE In considering the reasonableness of the advisory fee payable to the Investment Manager, the Trustees reviewed information provided by the Investment Manager at the June 24, 2021 and prior meetings setting forth all revenues and other benefits, both direct and indirect (including any so-called “fallout benefits” such as reputational value derived from the Investment Manager serving as Investment Manager to a Fund), received by the Investment Manager and its affiliates attributable to managing each Fund and all the mutual funds in the AMG Funds Family of Funds; the cost of providing such services; the significant risks undertaken as Investment Manager and sponsor of the Funds, including investment, operational, enterprise, entrepreneurial, litigation, regulatory and compliance risks; and the resulting profitability to the Investment Manager and its affiliates from these relationships. The Trustees also considered the changes to the management, subadvisory, and shareholder servicing fee rates that |
64
|
Annual Renewal of Investment Management and Subadvisory Agreements (continued) |
| | | | | | | | |
were implemented during the past year for AMG GW&K Small/Mid Cap Growth Fund and the changes to the expense caps that were implemented during the past year for AMG GW&K Emerging Wealth Equity Fund and AMG GW&K Small/Mid Cap Growth Fund. The Trustees also considered the amount of the advisory fee retained by the Investment Manager after payment of the subadvisory fee with respect to each Fund. The Trustees also noted payments made or to be made from the Subadviser to the Investment Manager, and other payments made or to be made from the Investment Manager to the Subadviser. The Trustees also considered management’s discussion of the current asset levels of the Funds, and the impact on profitability of both the current asset levels and any future growth of assets of the Funds. In considering the cost of services to be provided by the Investment Manager under each Investment Management Agreement and the profitability to the Investment Manager of its relationship with each Fund, the Trustees noted the undertaking by the Investment Manager to maintain contractual expense limitations for the Funds. The Board also took into account management’s discussion of the advisory fee structure, and the services the Investment Manager provides in performing its functions under each Investment Management Agreement and supervising the Subadviser. Based on the foregoing, the Trustees concluded that the profitability to the Investment Manager is reasonable and that the Investment Manager is not realizing material benefits from economies of scale that would warrant adjustments to the advisory fee at this time. Also with respect to economies of scale, the Trustees noted that as each Fund’s assets increase over time, the Fund may realize other economies of scale to the extent the increase in assets is proportionally greater than the increase in certain other expenses. For each of AMG GW&K Emerging Markets Equity Fund, AMG GW&K Emerging Wealth Equity Fund, and AMG GW&K Core Bond ESG Fund, in considering the reasonableness of the subadvisory fees payable by the Investment Manager to the Subadviser, the Trustees reviewed information regarding the cost to the Subadviser of providing subadvisory services to each Fund and the resulting profitability from these relationships. The Trustees noted that, because the Subadviser is an affiliate of the Investment Manager, a portion of the Subadviser’s revenues or profits might be shared directly or indirectly with the Investment Manager. The Trustees also noted that the subadvisory fees are paid by the Investment Manager out of its advisory fee. The Board also took into account management’s discussion of the subadvisory fee structure, and the services the | | | | Subadviser provides in performing its functions under each Subadvisory Agreement. Based on the foregoing, the Trustees concluded that the profitability to the Subadviser is reasonable and that the Subadviser is not realizing material benefits from economies of scale that would warrant adjustments to the subadvisory fees at this time. Also with respect to economies of scale, the Trustees noted that as a Fund’s assets increase over time, the Fund may realize other economies of scale to the extent the increase in assets is proportionally greater than the increase in certain other expenses. With respect to AMG GW&K Emerging Markets Equity Fund, the Trustees noted that the management fees (which include both the advisory and administration fees) and total expenses (net of applicable expense waivers/reimbursements) of Class I shares (the class of shares which is the primary focus of the Fund’s distribution) of the Fund as of March 31, 2021 were both lower than the average for the Fund’s Peer Group. The Trustees took into account the fact that the Investment Manager has contractually agreed, through March 1, 2022, to limit the Fund’s net annual operating expenses (subject to certain excluded expenses) to 0.87%. The Trustees concluded that, in light of the nature, extent and quality of the services provided by the Investment Manager and the Subadviser (which is an affiliate of the Investment Manager), the foregoing expense limitation and the considerations noted above with respect to the Investment Manager and the Subadviser, the Fund’s advisory and subadvisory fees are reasonable. With respect to AMG GW&K Emerging Wealth Equity Fund, the Trustees noted that the management fees (which include both the advisory and administration fees) and total expenses (net of applicable expense waivers/reimbursements) of Class I shares (the class of shares which is the primary focus of the Fund’s distribution) of the Fund as of March 31, 2021 were both lower than the average for the Fund’s Peer Group. The Trustees took into account the fact that, effective March 1, 2021, the Investment Manager has contractually agreed, through March 1, 2022, to lower the Fund’s contractual expense limitation from 1.05% to 0.90% of the Fund’s net annual operating expenses (subject to certain excluded expenses). The Trustees concluded that, in light of the nature, extent and quality of the services provided by the Investment Manager and the Subadviser (which is an affiliate of the Investment Manager), the foregoing expense limitation and the considerations noted above with respect to the Investment Manager and the Subadviser, the Fund’s advisory and subadvisory fees are reasonable. | | | | With respect to AMG GW&K Core Bond ESG Fund, the Trustees noted that the management fees (which include both the advisory and administration fees) and total expenses (net of applicable expense waivers/reimbursements) of Class I shares of the Fund as of March 31, 2021 were both higher than the average for the Fund’s Peer Group. The Trustees took into account the fact that the Investment Manager has contractually agreed, through March 1, 2022, to limit the Fund’s net annual operating expenses (subject to certain excluded expenses) to 0.48%. The Trustees also took into account management’s discussion of the Fund’s expenses and competitiveness with comparably sized funds and select competitors. The Trustees concluded that, in light of the nature, extent and quality of the services provided by the Investment Manager and the Subadviser (which is an affiliate of the Investment Manager), the foregoing expense limitation and the considerations noted above with respect to the Investment Manager and the Subadviser, the Fund’s advisory and subadvisory fees are reasonable. With respect to AMG GW&K Small/Mid Cap Growth Fund, the Trustees noted that the management fees (which include both the advisory and administration fees) and total expenses (net of applicable expense waivers/reimbursements) of Class I shares (the class of shares which is the primary focus of the Fund’s distribution) of the Fund as of March 31, 2021 were both higher than the average for the Fund’s Peer Group. The Trustees took into account the fact that, effective June 18, 2021, the Investment Manager has contractually agreed, through March 1, 2023, to lower the Fund’s contractual expense limitation from 1.03% to 0.82% of the Fund’s net annual operating expenses (subject to certain excluded expenses). The Trustees also noted that, effective June 18, 2021, the Fund’s management fee rate was reduced. The Trustees also took into account management’s discussion of the Fund’s expenses, including fees and expenses relative to comparably sized funds and select competitors, and the Fund’s small size relative to its peer universe. The Trustees concluded that, in light of the nature, extent and quality of the services provided by the Investment Manager, the foregoing expense limitation and the considerations noted above with respect to the Investment Manager, the Fund’s advisory fees are reasonable. With respect to AMG GW&K Small/Mid Cap Growth Fund, the Trustees also considered information provided by the Investment Manager throughout the previous year related to the benefits of the strategic repositioning of the AMG Funds complex for greater alignment with Affiliated Managers Group, Inc. (“AMG”), in which each fund that was not previously |
65
|
Annual Renewal of Investment Management and Subadvisory Agreements (continued) |
| | | | | | | | |
subadvised by an affiliate of AMG (each affiliate of AMG, an “Affiliate” and collectively, “Affiliates”) was transitioned to an AMG Affiliate subadviser. The Trustees considered that the strategic repositioning was expected to create value for the Fund, the other funds in the AMG Funds complex and their shareholders through enhanced resources and competitive fee levels. The Trustees noted the expectations that the changes would result in bringing the full range of AMG’s resources to bear on the growth and success of the AMG Funds, streamlining the lineup of funds in the AMG Funds complex and reducing the number of subadvisers in the AMG Funds complex, significantly reducing strategy overlap and providing more differentiated investment solutions for the AMG Funds complex that are otherwise not available to U.S. retail investors. The Trustees further considered the expectation that the repositioning would bring AMG’s strong partnerships in support of the Fund and the AMG Funds complex as a whole and enable AMG Funds to bring the best capabilities of AMG’s Affiliates to the Fund and the rest of the AMG Funds complex. The Trustees noted that AMG’s relationship with its Affiliates will also allow the Fund to have greater insight into the Affiliates’ compliance and business platform than is generally possible with third party subadvisers, aiding the ongoing monitoring of subadvisers. * * * * | | | | After consideration of the foregoing, the Trustees also reached the following conclusions (in addition to the conclusions discussed above) regarding the Investment Management and Subadvisory Agreements: (a) the Investment Manager and the Subadviser have demonstrated that they possess the capability and resources to perform the duties required of them under each Investment Management Agreement and each Subadvisory Agreement and (b) the Investment Manager and Subadviser maintain appropriate compliance programs. Based on all of the above-mentioned factors and their related conclusions, with no single factor or conclusion being determinative and with each Trustee not necessarily attributing the same weight to each factor, the Trustees concluded that approval of each Investment Management Agreement and each Subadvisory Agreement would be in the best interests of the applicable Fund and its shareholders. Accordingly, on June 24, 2021, the Trustees, and separately a majority of the Independent Trustees, voted to approve the Investment Management Agreement for each Fund and the Subadvisory Agreement for each of AMG GW&K Emerging Markets Equity Fund, AMG GW&K Emerging Wealth Equity Fund, and AMG GW&K Core Bond ESG Fund. 1 The Trustees determined that the conditions surrounding COVID-19 constituted unforeseen or emergency circumstances and that reliance on the | | | | Securities and Exchange Commission’s (“SEC”) exemptive order, which provides relief from the in-person voting requirements of the Investment Company Act of 1940, as amended (the “1940 Act”), in certain circumstances (the “In-Person Relief”), was necessary or appropriate due to the circumstances related to current or potential effects of COVID-19. The Trustees unanimously wished to rely on the In-Person Relief with respect to the approval of those matters on the agenda for the June 24, 2021 meeting that would otherwise require in-person votes under the 1940 Act. See Investment Company Release No. 33897 (June 19, 2020). This exemptive order supersedes, in part, a similar, earlier exemptive order issued by the SEC (Investment Company Release No. 33824 (March 25, 2020)). 2 At a meeting held via telephone and videoconference on March 17-18, 2021, the Board of AMG Funds IV, and separately a majority of the Independent Trustees, approved the Subadvisory Agreement with respect to AMG GW&K Small/Mid Cap Growth Fund (the “Small/Mid Cap Growth Subadvisory Agreement”). The Small/Mid Cap Growth Subadvisory Agreement was subsequently approved by the Fund’s shareholders at a special meeting held on June 18, 2021, for an initial two-year period. References herein to the “Subadvisory Agreements” refer to the Subadvisory Agreements for AMG GW&K Emerging Markets Equity Fund, AMG GW&K Emerging Wealth Equity Fund, and AMG GW&K Core Bond ESG Fund, and do not include the Small/Mid Cap Growth Subadvisory Agreement. |
66
THIS PAGE INTENTIONALLY LEFT BLANK
THIS PAGE INTENTIONALLY LEFT BLANK
| | |
| | |
| | | | |
INVESTMENT MANAGER AND ADMINISTRATOR AMG Funds LLC 680 Washington Blvd., Suite 500 Stamford, CT 06901 800.548.4539 DISTRIBUTOR AMG Distributors, Inc. 680 Washington Blvd., Suite 500 Stamford, CT 06901 800.548.4539 SUBADVISER GW&K Investment Management, LLC 222 Berkeley St. Boston, MA 02116 | | CUSTODIAN The Bank of New York Mellon Mutual Funds Custody 6023 Airport Road Oriskany, NY 13424 LEGAL COUNSEL Ropes & Gray LLP Prudential Tower, 800 Boylston Street Boston, MA 02199-3600 TRANSFER AGENT BNY Mellon Investment Servicing (US) Inc. Attn: AMG Funds 4400 Computer Drive Westborough, MA 01581 800.548.4539 | | This report is prepared for the Funds’ shareholders. It is authorized for distribution to prospective investors only when preceded or accompanied by an effective prospectus. To receive a free copy of the prospectus or Statement of Additional Information, which includes additional information about Fund Trustees, please contact us by calling 800.548.4539. Distributed by AMG Distributors, Inc., member FINRA/SIPC. Current net asset values per share for each Fund are available on the Funds’ website at amgfunds.com. A description of the policies and procedures each Fund uses to vote its proxies is available: (i) without charge, upon request, by calling 800.548.4539, or (ii) on the Securities and Exchange Commission’s (SEC) website at sec.gov. For information regarding each Fund’s proxy voting record for the 12-month period ended June 30, call 800.548.4539 or visit the SEC website at sec.gov. The Funds file their complete schedule of portfolio holdings with the SEC for the first and third quarters of each fiscal year as an exhibit to their reports on Form N-PORT. The Funds’ portfolio holdings on Form N-PORT are available on the SEC’s website at sec.gov and the Funds’ website at amgfunds.com. To review a complete list of the Funds’ portfolio holdings, or to view the most recent semiannual report or annual report, please visit amgfunds.com. |
| | |
| | |
| | | | | | | | |
BALANCED FUNDS AMG GW&K Global Allocation GW&K Investment Management, LLC AMG FQ Global Risk-Balanced First Quadrant, L.P. EQUITY FUNDS AMG Beutel Goodman International Equity Beutel, Goodman & Company Ltd. AMG Boston Common Global Impact Boston Common Asset Management, LLC AMG Managers CenterSquare Real Estate CenterSquare Investment Management LLC AMG Frontier Small Cap Growth Frontier Capital Management Co., LLC AMG GW&K Small Cap Core AMG GW&K Small Cap Value AMG GW&K Small/Mid Cap AMG GW&K Small/Mid Cap Growth AMG GW&K Emerging Markets Equity AMG GW&K Emerging Wealth Equity AMG GW&K International Small Cap GW&K Investment Management, LLC AMG Montrusco Bolton Large Cap Growth Montrusco Bolton Investments, Inc. | | | | AMG Renaissance Large Cap Growth The Renaissance Group LLC AMG River Road Dividend All Cap Value AMG River Road Focused Absolute Value AMG River Road International Value Equity AMG River Road Large Cap Value Select AMG River Road Mid Cap Value AMG River Road Small-Mid Cap Value AMG River Road Small Cap Value River Road Asset Management, LLC AMG TimesSquare Emerging Markets Small Cap AMG TimesSquare Global Small Cap AMG TimesSquare International Small Cap AMG TimesSquare Mid Cap Growth AMG TimesSquare Small Cap Growth TimesSquare Capital Management, LLC AMG Veritas Asia Pacific AMG Veritas China AMG Veritas Global Focus AMG Veritas Global Real Return Veritas Asset Management LLP AMG Yacktman AMG Yacktman Focused AMG Yacktman Global AMG Yacktman Special Opportunities Yacktman Asset Management LP | | | | FIXED INCOME FUNDS AMG Beutel Goodman Core Plus Bond Beutel, Goodman & Company Ltd. AMG GW&K Core Bond ESG AMG GW&K Enhanced Core Bond ESG AMG GW&K ESG Bond AMG GW&K High Income AMG GW&K Municipal Bond AMG GW&K Municipal Enhanced Yield GW&K Investment Management, LLC |
| | | | |
amgfunds.com | | 103121 | | AR069 |
Registrant has adopted a Code of Ethics. See attached Exhibit (a)(1).
| Item 3. | AUDIT COMMITTEE FINANCIAL EXPERT |
Registrant’s Board of Trustees has determined that independent Trustee Mr. Steven J. Paggioli qualifies as an Audit Committee Financial Expert. Mr. Paggioli is “independent” as such term is defined in Form N-CSR.
| Item 4. | PRINCIPAL ACCOUNTANT FEES AND SERVICES |
(a) Audit Fees
The aggregate fees billed by the Funds’ independent registered public accounting firm, PricewaterhouseCoopers LLP (“PwC”), to the Funds for the Funds’ two most recent fiscal years for professional services rendered for audits of annual financial statements, or services that are normally provided in connection with statutory and regulatory filings or engagements (“Audit Fees”) were as follows:
| | | | | | | | |
Fund | | Fiscal 2021 | | | Fiscal 2020 | |
AMG GW&K Emerging Markets Equity Fund | | $ | 44,929 | | | $ | 49,266 | |
AMG GW&K Emerging Wealth Equity Fund | | $ | 43,297 | | | $ | 41,608 | |
(b) Audit-Related Fees
There were no fees billed by PwC to the Funds in their two recent fiscal years for services rendered for assurance and related services that are reasonably related to the performance of the audit or review of the Funds’ financial statements, but are not reported as Audit Fees (“Audit-Related Fees”).
For the Funds’ two most recent fiscal years, there were no Audit-Related Fees billed by PwC for engagements related directly to the operations and financial reporting of one or more Funds by a Fund Service Provider. A Fund Service Provider is (a) any investment adviser to a Fund (not including any Subadvisor whose role is primarily portfolio management and is subcontracted with or overseen by another investment adviser) or (b) any entity that provides ongoing services to a Fund and is controlling, controlled by or under common control with a Fund investment adviser described in (a).
(c) Tax Fees
The aggregate fees billed by PwC to the Funds for the two most recent fiscal years for professional services rendered for tax compliance, tax advice, and tax planning (“Tax Fees”) were as follows:
| | | | | | | | |
| | | Fiscal 2021 | | | Fiscal 2020 | |
AMG GW&K Emerging Markets Equity Fund | | $ | 6,050 | | | $ | 6,050 | |
AMG GW&K Emerging Wealth Equity Fund | | $ | 6,050 | | | $ | 6,050 | |
For the Funds’ two most recent fiscal years, Tax Fees billed by PwC for engagements by Fund Service Providers that related directly to the operations and financial reporting of the Funds were $0 for fiscal 2021 and $0 for fiscal 2020, respectively.
The services for which Tax Fees were charged comprise all services performed by professional staff in PwC’s tax division except those services related to the audit. Typically, this category would include fees for tax compliance, tax planning, and tax advice. Tax compliance, tax advice, and tax planning services include preparation of original and amended tax returns, claims for refund and tax payment-planning services, assistance with tax audits and appeals, tax advice related to mergers and acquisitions and requests for rulings or technical advice from taxing authorities.
(d) All Other Fees
There were no other fees billed by PwC to the Funds for all other non-audit services (“Other Fees”) during the Funds’ two most recent fiscal years. During the same period, there were no Other Fees billed by PwC for engagements by Fund Service Providers that related directly to the operations and financial reporting of the Funds.
(e) (1) According to policies adopted by the Audit Committee, services provided by PwC to the Funds must be pre-approved by the Audit Committee. On an annual basis, the Audit Committee reviews and pre-approves various types of services that PwC may perform for the Funds without specific approval of each engagement, subject to specified budget limitations. As contemplated by the Sarbanes-Oxley Act of 2002 and related SEC rules, the Audit Committee also pre-approves non-audit services provided by PwC to any Fund Service Provider for any engagement that relates directly to the operations and financial reporting of the Funds. Any engagement that is not already pre-approved or that will exceed a pre-approved budget must be submitted to the Audit Committee for pre-approval. The Chairman of the Audit Committee is authorized on behalf of the Board of Trustees and the Audit Committee to approve the engagement of PwC to perform non-audit services subject to certain conditions, including notification to the Audit Committee of such pre-approval not later than the next meeting of the Audit Committee following the date of such pre-approval.
(e)(2) None.
(f) Not applicable.
(g) The aggregate fees billed by PwC in 2021 and 2020 for non-audit services rendered to the Funds and Fund Service Providers were $53,683 and $61,600, respectively. For the fiscal year ended October 31, 2021, this amount reflects the amounts disclosed above in Item 4(b),(c),(d), plus $41,583 in fees billed to the Fund Service Providers for non-audit services that did not relate directly to the operations and financial reporting of the Funds. For the fiscal year ended October 31, 2020, this amount reflects the amounts disclosed above in Item 4(b),(c),(d), plus $49,500 in fees billed to the Fund Service Providers for non-audit services that did not relate directly to the operations and financial reporting of the Funds.
(h) The Trust’s Audit Committee has considered whether the provision of non-audit services by registrant’s independent registered public accounting firm to the registrant’s investment advisor, and any entity controlling, controlled, or under common control with the investment advisor that provided ongoing services to the registrant that were not pre-approved by the Committee (because such services did not relate directly to the operations and financial reporting of the registrant) was compatible with maintaining the independence of the independent registered public accounting firm.
| Item 5. | AUDIT COMMITTEE OF LISTED REGISTRANTS |
Not applicable.
| Item 6. | SCHEDULE OF INVESTMENTS |
The schedule of investments in securities of unaffiliated issuers as of the close of the reporting period is included as part of the shareholder report contained in Item 1 of this form.
| Item 7. | DISCLOSURE OF PROXY VOTING POLICIES AND PROCEDURES FOR CLOSED-END MANAGEMENT INVESTMENT COMPANIES |
Not applicable.
| Item 8. | PORTFOLIO MANAGERS OF CLOSED-END MANAGEMENT INVESTMENT COMPANIES |
Not applicable.
| Item 9. | PURCHASES OF EQUITY SECURITIES BY CLOSED-END MANAGEMENT INVESTMENT COMPANIES AND AFFILIATED PURCHASERS |
Not applicable.
| Item 10. | SUBMISSION OF MATTERS TO A VOTE OF SECURITY HOLDERS |
Not applicable.
| Item 11. | CONTROLS AND PROCEDURES |
(a) The Registrant’s principal executive and principal financial officers have concluded, based on their evaluation of the registrant’s disclosure controls and procedures as of a date within 90 days of the filing of this report, that the Registrant’s disclosure controls and procedures are reasonably designed to ensure that information required to be disclosed by the Registrant on Form N-CSR is recorded, processed, summarized and reported within the required time
periods and that information required to be disclosed by the registrant in the reports that it files or submits on Form N-CSR is accumulated and communicated to the Registrant’s management, including its principal executive and principal financial officers, as appropriate to allow timely decisions regarding required disclosure.
(b) There were no changes in the Registrant’s internal control over financial reporting during the period covered by this report that have materially affected, or are reasonably likely to materially affect, the internal control over financial reporting.
| Item 12. | DISCLOSURE OF SECURITIES LENDING ACTIVITIES FOR CLOSED-END MANAGEMENT INVESTMENT COMPANIES |
Not applicable.
SIGNATURES
Pursuant to the requirements of the Securities Exchange Act of 1934 and the Investment Company Act of 1940, the registrant has duly caused this report to be signed on its behalf by the undersigned, thereunto duly authorized.
| | |
| AMG FUNDS |
| |
| By: | | /s/ Keitha L. Kinne |
| | Keitha L. Kinne, Principal Executive Officer |
| |
| Date: | | January 6, 2022 |
Pursuant to the requirements of the Securities Exchange Act of 1934 and the Investment Company Act of 1940, this report has been signed below by the following persons on behalf of the registrant and in the capacities and on the dates indicated.
| | |
| By: | | /s/ Keitha L. Kinne |
| | Keitha L. Kinne, Principal Executive Officer |
| |
| Date: | | January 6, 2022 |
| |
| By: | | /s/ Thomas Disbrow |
| | Thomas Disbrow, Principal Financial Officer |
| |
| Date: | | January 6, 2022 |