UNITED STATES
SECURITIES AND EXCHANGE COMMISSION
Washington, D.C. 20549
FORM N-CSR
CERTIFIED SHAREHOLDER REPORT OF REGISTERED
MANAGEMENT INVESTMENT COMPANIES
Investment Company Act file number: 811-09521
AMG FUNDS
(Exact name of registrant as specified in charter)
680 Washington Boulevard, Suite 500, Stamford, Connecticut 06901
(Address of principal executive offices) (Zip code)
AMG Funds LLC
680 Washington Boulevard, Suite 500, Stamford, Connecticut 06901
(Name and address of agent for service)
Registrant’s telephone number, including area code: (203) 299-3500
Date of fiscal year end: DECEMBER 31
Date of reporting period: JANUARY 1, 2022 – DECEMBER 31, 2022
(Annual Shareholder Report)
| Item 1. | Reports to Shareholders |
| | |
 | | ANNUAL REPORT |
| | |
| | | AMG Funds December 31, 2022 |
| | |
| | |  |
| | |
| | | AMG GW&K Small Cap Core Fund |
| | |
| | | Class N: GWETX | Class I: GWEIX | Class Z: GWEZX |
| | |
| | | AMG GW&K Small Cap Value Fund |
| | |
| | | Class N: SKSEX | Class I: SKSIX | Class Z: SKSZX |
| | |
| | | AMG GW&K Small/Mid Cap Fund |
| | |
| | | Class N: GWGVX | Class I: GWGIX | Class Z: GWGZX |
| | |
| | | AMG GW&K Global Allocation Fund |
| | |
| | | Class N: MBEAX | Class I: MBESX | Class Z: MBEYX |
| | |
| | | |
| | |
| | | |
| | | | |
| amgfunds.com | | | | 123122 AR089 |
| | |
| | | AMG Funds Annual Report — December 31, 2022 |
| | | | | | |
| | | |
| | | | | | |
| | | TABLE OF CONTENTS | | PAGE | |
| | | |
| | | LETTER TO SHAREHOLDERS | | | 2 | |
| | | |
| | | ABOUT YOUR FUND’S EXPENSES | | | 3 | |
| | | |
| | | PORTFOLIO MANAGER’S COMMENTS, FUND SNAPSHOTS AND SCHEDULES OF PORTFOLIO INVESTMENTS | | | | |
| | | |
| | | AMG GW&K Small Cap Core Fund | | | 4 | |
| | | |
| | | AMG GW&K Small Cap Value Fund | | | 10 | |
| | | |
| | | AMG GW&K Small/Mid Cap Fund | | | 16 | |
| | | |
| | | AMG GW&K Global Allocation Fund | | | 22 | |
| | | |
| | | FINANCIAL STATEMENTS | | | | |
| | | |
| | | Statement of Assets and Liabilities | | | 33 | |
| | | |
| | | Balance sheets, net asset value (NAV) per share computations
and cumulative distributable earnings (loss) | | | | |
| | | |
| | | Statement of Operations | | | 35 | |
| | | |
| | | Detail of sources of income, expenses, and realized and
unrealized gains (losses) during the fiscal year | | | | |
| | | |
| | | Statements of Changes in Net Assets | | | 36 | |
| | | |
| | | Detail of changes in assets for the past two fiscal years | | | | |
| | | |
| | | Financial Highlights | | | 38 | |
| | | |
| | | Historical net asset values per share, distributions, total returns, income
and expense ratios, turnover ratios and net assets | | | | |
| | | |
| | | Notes to Financial Statements | | | 50 | |
| | | |
| | | Accounting and distribution policies, details of agreements and
transactions with Fund management and affiliates, and descriptions of
certain investment risks | | | | |
| | | |
| | | REPORT OF INDEPENDENT REGISTERED PUBLIC ACCOUNTING FIRM | | | 60 | |
| | | |
| | | OTHER INFORMATION | | | 61 | |
| | | |
| | | TRUSTEES AND OFFICERS | | | 62 | |
| | | | | | | |
|
Nothing contained herein is to be considered an offer, sale or solicitation of an offer to buy shares of any series of the AMG Funds Family of Funds. Such offering is made only by prospectus, which includes details as to offering price and other material information. | |
| | |
| | Letter to Shareholders |
Dear Shareholder:
We are pleased to provide this annual report for your investment with AMG Funds. Our foremost goal is to provide investment solutions that help our shareholders successfully achieve their long-term investment goals. We appreciate the privilege of providing you with investment tools.
The past year was a challenging period for investors, as uncertainties about high inflation, tighter financial conditions, and the Russian invasion of Ukraine led to significant volatility. Global equity and bond markets fell in tandem amid sharply higher interest rates and eroding investor confidence as worries of an impending recession lingered most of the year. A global commodity shock caused by the war in Ukraine only made matters worse. The S&P 500® Index slipped into a bear market with the Index falling more than (24)% from its peak earlier in the year. The abrupt shift in markets this year has reset expectations around future growth, as the U.S. Federal Reserve (the Fed) and other global central banks have taken aggressive policy action to bring down inflation. While the outlook is uncertain given recent negative returns across many asset classes, global stock and bond valuations are now far more attractive entering 2023 compared to a year ago.
There was very wide dispersion in S&P 500® Index sector performance. Energy significantly outperformed all other sectors with a gain of 65.72% as the price of oil surged during the period. The defensive-oriented sectors also outperformed, although utilities was the only other sector with a positive return, gaining 1.54%. Consumer staples and health care were slightly negative with returns of (0.62)% and (1.95)%, respectively. High-growth technology and mega cap internet-related companies underperformed during the period, and real estate was impacted by higher interest rates. Communications services fell the most with a (39.93)% return during the year, followed by declines of (37.03)% for consumer discretionary, (28.14)% for information technology and (26.13)% for real estate. Value stocks held up much better than growth stocks as the Russell 1000® Value Index returned (7.54)% compared to the (29.14)% return for the Russell 1000® Growth Index. Small cap stocks struggled as the Russell 2000® Index lost (20.44)%. Outside the U.S., foreign developed markets were negative with a (14.45)% return for the MSCI EAFE Index, however a very strong fourth quarter rally drove international equity returns ahead of their U.S. counterparts for the year.
The 10-year Treasury yield more than doubled during the year, surging to the highest levels since before the Great Financial Crisis. Rapidly rising rates from a very low base led to historic negative performance for bonds as the Bloomberg U.S. Aggregate Bond Index, a broad measure of U.S. bond market performance, lost (13.01)% over the period. Investment-grade corporate bonds underperformed, returning (15.76)% for the year. High yield bonds held up better with a (11.19)% return as measured by the return of the Bloomberg U.S. Corporate High Yield Bond
Index. Municipal bonds were also negative, but outperformed the broader market with a (8.53)% return for the Bloomberg Municipal Bond Index.
AMG Funds provides access to a distinctive array of actively managed return-oriented investment strategies. You can rest assured that under all market conditions our team is focused on delivering excellent investment management services for your benefit. For more information about AMG Funds’ wide range of products and resources, please visit www.amgfunds.com. We thank you for your investment and continued trust in AMG Funds.
Respectfully,

Keitha Kinne
President
AMG Funds
| | | | | | | | | | | | | | |
| | | | | Periods ended | |
| Average Annual Total Returns | | December 31, 2022* | |
| | | | |
| Stocks: | | | | 1 Year | | | 3 Years | | | 5 Years | |
| | | | |
Large Cap | | (S&P 500® Index) | | | (18.11 | )% | | | 7.66 | % | | | 9.42 | % |
| | | | |
Small Cap | | (Russell 2000® Index) | | | (20.44 | )% | | | 3.10 | % | | | 4.13 | % |
| | | | |
International | | (MSCI ACWI ex USA) | | | (16.00 | )% | | | 0.07 | % | | | 0.88 | % |
| | | | |
Bonds: | | | | | | | | | | | | | | |
| | | | |
Investment Grade | | (Bloomberg U.S. Aggregate Bond Index) | | | (13.01 | )% | | | (2.71 | )% | | | 0.02 | % |
| | | | |
High Yield | | (Bloomberg U.S. Corporate High Yield Bond Index) | | | (11.19 | )% | | | 0.05 | % | | | 2.31 | % |
| | | | |
Tax-exempt | | (Bloomberg Municipal Bond Index) | | | (8.53 | )% | | | (0.77 | )% | | | 1.25 | % |
| | | | |
Treasury Bills | | (ICE BofAML U.S. 6-Month Treasury Bill Index) | | | 1.34 | % | | | 0.82 | % | | | 1.39 | % |
*Source: FactSet. Past performance is no guarantee of future results.
2
| | |
| | | About Your Fund’s Expenses |
| | | |
| | | |
| | | | | | | | |
As a shareholder of a Fund, you may incur two types of costs: (1) transaction costs, which may include sales charges (loads) on purchase payments; redemption fees; and exchange fees; and (2) ongoing costs, including management fees; distribution (12b-1) fees; and other Fund expenses. This example is intended to help you understand your ongoing costs (in dollars) of investing in the Fund and to compare these costs with the ongoing costs of investing in other mutual funds. The example is based on $1,000 invested at the beginning of the period and held for the entire period as indicated below. ACTUAL EXPENSES The first line of the following table provides information about the actual account values and | | | | actual expenses. You may use the information in this line, together with the amount you invested, to estimate the expenses that you paid over the period. Simply divide your account value by $1,000 (for example, an $8,600 account value divided by $1,000 = 8.6), then multiply the result by the number in the first line under the heading entitled “Expenses Paid During the Period” to estimate the expenses you paid on your account during this period. HYPOTHETICAL EXAMPLE FOR COMPARISON PURPOSES The second line of the following table provides information about hypothetical account values and hypothetical expenses based on the Fund’s actual expense ratio and an assumed annual rate of return of 5% before expenses, which is not the Fund’s | | | | actual return. The hypothetical account values and expenses may not be used to estimate the actual ending account balance or expenses you paid for the period. You may use this information to compare the ongoing costs of investing in the Fund and other funds by comparing this 5% hypothetical example with the 5% hypothetical examples that appear in the shareholder reports of other funds. Please note that the expenses shown in the table are meant to highlight your ongoing costs only and do not reflect any transactional costs, such as sales charges (loads), redemption fees, or exchange fees. Therefore, the second line of the table is useful in comparing ongoing costs only, and will not help you determine the relative total costs of owning different funds. |
| | | | | | | | |
| | | | | | | | | | |
Six Months Ended December 31, 2022 | | Expense
Ratio for
the Period | | Beginning
Account
Value
07/01/22 | | Ending
Account
Value
12/31/22 | | | Expenses
Paid
During
the Period* |
AMG GW&K Small Cap Core Fund |
|
Based on Actual Fund Return |
Class N | | 1.30% | | $1,000 | | | $1,055 | | | $6.73 |
Class I | | 0.95% | | $1,000 | | | $1,057 | | | $4.93 |
Class Z | | 0.90% | | $1,000 | | | $1,057 | | | $4.67 |
|
Based on Hypothetical 5% Annual Return |
Class N | | 1.30% | | $1,000 | | | $1,019 | | | $6.61 |
Class I | | 0.95% | | $1,000 | | | $1,020 | | | $4.84 |
Class Z | | 0.90% | | $1,000 | | | $1,021 | | | $4.58 |
AMG GW&K Small Cap Value Fund |
|
Based on Actual Fund Return |
Class N | | 1.15% | | $1,000 | | | $1,035 | | | $5.90 |
Class I | | 0.95% | | $1,000 | | | $1,036 | | | $4.88 |
Class Z | | 0.90% | | $1,000 | | | $1,036 | | | $4.62 |
|
Based on Hypothetical 5% Annual Return |
Class N | | 1.15% | | $1,000 | | | $1,019 | | | $5.85 |
Class I | | 0.95% | | $1,000 | | | $1,020 | | | $4.84 |
Class Z | | 0.90% | | $1,000 | | | $1,021 | | | $4.58 |
AMG GW&K Small/Mid Cap Fund |
|
Based on Actual Fund Return |
Class N | | 1.07% | | $1,000 | | | $1,040 | | | $5.50 |
Class I | | 0.87% | | $1,000 | | | $1,041 | | | $4.48 |
Class Z | | 0.82% | | $1,000 | | | $1,042 | | | $4.22 |
|
Based on Hypothetical 5% Annual Return |
Class N | | 1.07% | | $1,000 | | | $1,020 | | | $5.45 |
Class I | | 0.87% | | $1,000 | | | $1,021 | | | $4.43 |
Class Z | | 0.82% | | $1,000 | | | $1,021 | | | $4.18 |
| | | | | | | | | | |
Six Months Ended December 31, 2022 | | Expense
Ratio for
the Period | | Beginning
Account
Value
07/01/22 | | Ending
Account
Value
12/31/22 | | | Expenses
Paid
During
the Period* |
AMG GW&K Global Allocation Fund |
|
Based on Actual Fund Return |
Class N | | 1.08% | | $1,000 | | | $1,005 | | | $5.46 |
Class I | | 0.89% | | $1,000 | | | $1,006 | | | $4.50 |
Class Z | | 0.83% | | $1,000 | | | $1,007 | | | $4.20 |
|
Based on Hypothetical 5% Annual Return |
Class N | | 1.08% | | $1,000 | | | $1,020 | | | $5.50 |
Class I | | 0.89% | | $1,000 | | | $1,021 | | | $4.53 |
Class Z | | 0.83% | | $1,000 | | | $1,021 | | | $4.23 |
| * | Expenses are equal to the Fund’s annualized expense ratio multiplied by the average account value over the period, multiplied by the number of days in the most recent fiscal half-year (184), then divided by 365. |
3
| | |
| | | AMG GW&K Small Cap Core Fund Portfolio Manager’s Comments (unaudited) |
| | | |
| | | |
| | | | |
THE YEAR IN REVIEW For the year ended December 31, 2022, AMG GW&K Small Cap Core Fund (the “Fund”) Class N shares returned (16.58)%, compared to the Fund’s benchmark, the Russell 2000® Index (the “Index”), which returned (20.44)%. It is starting to become an unwelcome tagline for this decade: 202x was a challenging year for investors to navigate. So far, each year in this nascent decade has been uncertain and confounding for investors. 2022 fit that mold as well, but this year the pain was felt in our wallets too as stocks and asset values of all kinds declined sharply. The Index dropped (20.44)% and finished just a bit above its June lows. The simple mathematical determinants of stock prices tell us they can fall because investors: 1) lower their accepted valuation levels, 2) lower their earnings expectations, or 3) lower both. For 2022, reason 1 was dominant for small cap stocks as rising inflation and interest rates led to a significant de-rating in valuations. However, late in the year analysts began to more actively mark down earnings estimates as well. There were myriad factors contributing to the uncertainty and subsequent estimate revisions. A list of prominent factors would likely include changing consumer spending preferences (services versus goods), lower end demand in housing and other related industries, uncertainty about the duration of the U.S. Federal Reserve’s (the Fed) tightening campaign, lingering supply-chain challenges (inflation and availability), a very uncertain reopening in China, and Russia’s war on Ukraine. To keep investors more off balance, small-cap stocks rallied in the final quarter of the year. Short-term oriented investors will ask whether expectations have fallen enough for stocks to have bottomed. We are skeptical that anyone can answer this correctly with high confidence, so it may not be the best question to ponder to maximize long-term returns. The Fund outperformed the Index during the year. Within the benchmark, style factors indicated a preference for higher-quality attributes in the selloff | | of 2022. Broadly speaking, the lower quality the stock the more poorly it performed over the course of the year. This was most evident in characteristics such as low return-on-equity (ROE), non-earners, high beta, and negative equity, which all meaningfully underperformed the Index. During 2022, the benchmark had only one sector in positive territory, but it was a noteworthy one with energy up an impressive 53.2%. Utilities and consumer staples were next best sectors given their relatively stable cash flows, finishing down single digits. Five sectors dropped more than 25% on the year, each having significantly more exposure to the weaker factors mentioned above. The strong relative outperformance of the Fund in 2022 came from a combination of allocation toward higher-quality companies and strong stock selection. On the factor side, averaging the allocation impact for the six quality factors we follow implies about 150 basis points of positive impact to relative performance. The impact was greater for earnings-specific factors. The strong stock selection came prominently from health care, with six other sectors also making positive contributions. Health care benefited from an underweight to Biotechnology, but also suffered from an overweight in Life Science Tools/Service. While the health care portion of the benchmark dropped 28.7%, eight of our holdings were up, of which ChemoCentryx Inc., LHC Group Inc., and Covetrus, Inc. were the beneficiaries of takeout bids. The remaining five are still in the Fund and each finished in the black based on improved long-term cash flow outlooks. Energy was the poorest relative performing sector. Our underweight position was responsible for 85% of the deficit. The materials sector was hurt by our lack of exposure to relatively strong industries such as metals & mining, as well as a (38.2)% decline in our largest position in the sector, Avient Corp, due to weak earnings results. Whether the June lows for the Index turn out to be THE lows or not will depend on the answers to several other important and complex questions. It | | appears that inflation has peaked, but will the stickiest elements (especially labor costs) recede quickly enough for the Fed to pause their interest rate increases and avoid further compression of end demand and corporate profits? Is there some part of our economic system that “breaks” due to the dramatic tightening actions of the Fed and other central banks? Will China’s new COVID policies result in a public health policy challenge that lasts months or much longer? Could more strains emerge that defy current vaccines? Finally, is there an acceptable end game for Russia’s war against Ukraine, or is there a further serious escalation? Instead of trying to correctly answer all these questions, a fool’s errand if there ever was one, we think it is best to focus on what opportunities exist today in the small cap market. Two years ago, investors were convinced energy stocks were a black hole while Amazon and Tesla would grow to the sky. Since then, small cap energy stocks are up 156% while Amazon and Tesla are off their highs for the year by (40)% or more. What do investors collectively think they know with high confidence today? Which stocks in the Index and in our Fund reflect excessive optimism? What segments of the market are investors too fearful to own? Fear today can often be the fuel for tomorrow’s returns. Sometimes, that tomorrow can be slower than we would like to arrive. We believe our best course is to continue to look for stocks priced at reasonable valuations relative to the strength of their long-term business outlook. And be patient. The 2020s still have seven more years to go. The views expressed represent the opinions of GW&K Investment Management, LLC as of December 31, 2022, and are not intended as a forecast or guarantee of future results, and are subject to change without notice. |
4
| | |
| | | AMG GW&K Small Cap Core Fund Portfolio Manager’s Comments (continued) |
CUMULATIVE TOTAL RETURN PERFORMANCE
AMG GW&K Small Cap Core Fund’s cumulative total return is based on the daily change in net asset value (NAV), and assumes that all dividends and distributions were reinvested. The graph compares a hypothetical $10,000 investment made in the AMG GW&K Small Cap Core Fund’s Class N shares on December 31, 2012, to a $10,000 investment made in the Russell 2000® Index for the same time period. The graph and table do not reflect the deduction of taxes that a shareholder would pay on a Fund distribution or redemption of shares. The listed returns for the Fund are net of expenses and the returns for the index exclude expenses. Total returns would have been lower had certain expenses not been reduced.

The table below shows the average annual total returns for the AMG GW&K Small Cap Core Fund and the Russell 2000® Index for the same time periods ended December 31, 2022.
| | | | | | | | | | | | | | | | | | | | |
| | | One | | | Five | | | Ten | | | Since | | | Inception | |
| Average Annual Total Returns1 | | Year | | | Years | | | Years | | | Inception | | | Date | |
AMG GW&K Small Cap Core Fund2, 3, 4, 5, 6 | |
| | | | | |
Class N | | | (16.58 | %) | | | 5.94 | % | | | 10.20% | | | | 8.08 | % | | | 12/10/96 | |
| | | | | |
Class I | | | (16.27 | %) | | | 6.30 | % | | | 10.62% | | | | 12.31 | % | | | 07/27/09 | |
| | | | | |
Class Z | | | (16.25 | %) | | | 6.35 | % | | | — | | | | 7.93 | % | | | 02/24/17 | |
| | | | | |
Russell 2000® Index7 | | | (20.44 | %) | | | 4.13 | % | | | 9.01% | | | | 7.68 | % | | | 12/10/96 | † |
The performance data shown represents past performance. Past performance is not a guarantee of future results. Current performance may be lower or higher than the performance data quoted. The investment return and principal value of an investment will fluctuate so that an investor’s shares, when redeemed, may be worth more or less than their original cost.
Investors should carefully consider the Fund’s investment objectives, risks, charges and expenses before investing. For performance information through the most recent month end, current net asset values per share for the Fund and other information, please call 800.548.4539 or visit our website at amgfunds.com for a free prospectus. Read it carefully before investing or sending money.
Distributed by AMG Distributors, Inc., member FINRA/SIPC.
| † | Date reflects the inception date of the Fund, not the index. |
| 1 | Total return equals income yield plus share price change and assumes reinvestment of all dividends and capital gain distributions. Returns are net of fees and may reflect offsets of Fund expenses as described in the prospectus. No adjustment has been made for taxes payable by shareholders on their reinvested dividends and |
|
capital gain distributions. Returns for periods greater than one year are annualized. The listed returns on the Fund are net of expenses and based on the published NAV as of December 31, 2022. All returns are in U.S. Dollars ($). 2 From time to time, the Fund’s investment manager has waived its fees and/or absorbed Fund expenses, which has resulted in higher returns. 3 Market prices of investments held by the Fund may fall rapidly or unpredictably due to a variety of economic or political factors, market conditions, disasters or public health issues, or in response to events that affect particular industries or companies. 4 The Fund invests in growth stocks, which may be more sensitive to market movements because their prices tend to reflect future investor expectations rather than just current profits. Growth stocks may underperform value stocks during given periods. 5 The Fund is subject to risks associated with investments in small-capitalization companies, such as erratic earnings patterns, competitive conditions, limited earnings history, and a reliance on one or a limited number of products. 6 The Fund invests in value stocks, which may perform differently from the market as a whole and may be undervalued by the market for a long period of time. 7 The Russell 2000® Index is composed of the 2,000 smallest stocks in the Russell 3000® Index and is widely regarded in the industry as the premier measure of small-cap stock performance. Unlike the Fund, the Russell 2000® Index is unmanaged, is not available for investment and does not incur expenses. The Russell Indices are trademarks of the London Stock Exchange Group companies. Not FDIC insured, nor bank guaranteed. May lose value. |
| |
| |
5
| | |
| | | AMG GW&K Small Cap Core Fund Fund Snapshots (unaudited) December 31, 2022 |
PORTFOLIO BREAKDOWN
| | | | | |
| Sector | | % of
Net Assets |
| | |
Health Care | | 19.6 |
| | |
Financials | | 17.4 |
| | |
Industrials | | 15.1 |
| | |
Consumer Discretionary | | 12.8 |
| | |
Information Technology | | 11.7 |
| | |
Materials | | 5.2 |
| | |
Real Estate | | 5.1 |
| | |
Energy | | 4.8 |
| | |
Consumer Staples | | 3.8 |
| | |
Utilities | | 2.7 |
| | |
Short-Term Investments | | 2.0 |
| | |
Other Assets, less Liabilities | | (0.2) |
TOP TEN HOLDINGS
| | |
| Security Name | | % of Net Assets |
| | |
Performance Food Group Co. | | 2.6 |
| | |
SPX Technologies, Inc. | | 2.2 |
| | |
Matador Resources Co. | | 2.2 |
| | |
Halozyme Therapeutics, Inc. | | 2.0 |
| | |
MACOM Technology Solutions Holdings, Inc. | | 2.0 |
| | |
Texas Roadhouse, Inc. | | 2.0 |
| | |
RBC Bearings, Inc. | | 1.9 |
| | |
Globus Medical, Inc., Class A | | 1.9 |
| | |
Seacoast Banking Corp. of Florida | | 1.7 |
| | |
Ameris Bancorp | | 1.7 |
| | | |
| | |
Top Ten as a Group | | 20.2 |
| | |
Because a fund’s strategy may result in multiple investments in particular sectors of the economy, its performance may depend on the performance of those sectors and may fluctuate more widely than investments diversified across more sectors. For additional information on these and other risk considerations, please see the Fund’s prospectus.
Any sectors, industries, or securities discussed should not be perceived as investment recommendations. Mention of a specific security should not be considered a recommendation to buy or solicitation to sell that security. Specific securities mentioned in this report may have been sold from the Fund’s portfolio of investments by the time you receive this report.
6
| | |
| | | AMG GW&K Small Cap Core Fund Schedule of Portfolio Investments December 31, 2022 |
| | | | | | | | |
| | |
Shares | | | Value | |
| |
Common Stocks - 98.2% | | | | | |
| |
Consumer Discretionary - 12.8% | | | | | |
| | |
Boot Barn Holdings, Inc.* | | | 82,568 | | | | $5,162,151 | |
| | |
Churchill Downs, Inc. | | | 46,372 | | | | 9,804,432 | |
| | |
Chuy’s Holdings, Inc.* | | | 141,824 | | | | 4,013,619 | |
| | |
Five Below, Inc.* | | | 32,250 | | | | 5,704,058 | |
| | |
Grand Canyon Education, Inc.* | | | 103,089 | | | | 10,892,384 | |
| | |
Helen of Troy, Ltd.* | | | 46,330 | | | | 5,138,460 | |
| | |
Lithia Motors, Inc., Class A1 | | | 34,160 | | | | 6,993,918 | |
| | |
Oxford Industries, Inc. | | | 87,680 | | | | 8,170,022 | |
| | |
Patrick Industries, Inc.1 | | | 76,735 | | | | 4,650,141 | |
| | |
Revolve Group, Inc.*,1 | | | 76,441 | | | | 1,701,577 | |
| | |
Skyline Champion Corp.* | | | 141,260 | | | | 7,276,303 | |
| | |
Texas Roadhouse, Inc. | | | 142,303 | | | | 12,942,458 | |
| | |
Wolverine World Wide, Inc. | | | 203,928 | | | | 2,228,933 | |
| | |
Total Consumer Discretionary | | | | | | | 84,678,456 | |
| | |
Consumer Staples - 3.8% | | | | | | | | |
| | |
Central Garden & Pet Co., Class A* | | | 222,609 | | | | 7,969,402 | |
| | |
Performance Food Group Co.* | | | 292,289 | | | | 17,066,755 | |
| | |
Total Consumer Staples | | | | | | | 25,036,157 | |
| | |
Energy - 4.8% | | | | | | | | |
| | |
ChampionX Corp. | | | 139,958 | | | | 4,057,382 | |
| | |
Magnolia Oil & Gas Corp., Class A1 | | | 431,517 | | | | 10,119,074 | |
| | |
Matador Resources Co.1 | | | 249,377 | | | | 14,274,340 | |
| | |
Patterson-UTI Energy, Inc. | | | 196,482 | | | | 3,308,757 | |
| | |
Total Energy | | | | | | | 31,759,553 | |
| | |
Financials - 17.4% | | | | | | | | |
| | |
Ameris Bancorp | | | 242,138 | | | | 11,414,385 | |
| | |
AMERISAFE, Inc. | | | 106,723 | | | | 5,546,394 | |
| | |
Cathay General Bancorp | | | 237,022 | | | | 9,668,127 | |
| | |
Cohen & Steers, Inc.1 | | | 136,806 | | | | 8,832,195 | |
| | |
Glacier Bancorp, Inc. | | | 151,804 | | | | 7,502,154 | |
| | |
Horace Mann Educators Corp. | | | 251,174 | | | | 9,386,372 | |
| | |
Houlihan Lokey, Inc. | | | 116,309 | | | | 10,137,493 | |
| | |
Independent Bank Corp. | | | 88,812 | | | | 7,498,397 | |
| | |
OceanFirst Financial Corp. | | | 360,300 | | | | 7,656,375 | |
| | |
Pacific Premier Bancorp, Inc. | | | 268,100 | | | | 8,461,236 | |
| | |
Seacoast Banking Corp. of Florida | | | 367,860 | | | | 11,473,554 | |
| | |
Stifel Financial Corp. | | | 157,726 | | | | 9,206,467 | |
| | |
Veritex Holdings, Inc. | | | 284,291 | | | | 7,982,891 | |
| | |
Total Financials | | | | | | | 114,766,040 | |
| | |
Health Care - 19.6% | | | | | | | | |
| | |
Arcutis Biotherapeutics, Inc.* | | | 251,328 | | | | 3,719,654 | |
| | | | | | | | |
| | |
Shares | | | Value | |
| | |
Artivion, Inc.* | | | 264,636 | | | | $3,207,388 | |
| | |
AtriCure, Inc.* | | | 179,231 | | | | 7,954,272 | |
| | |
Azenta, Inc. | | | 103,364 | | | | 6,017,852 | |
| | |
BioCryst Pharmaceuticals, Inc.*,1 | | | 291,366 | | | | 3,344,882 | |
| | |
Castle Biosciences, Inc.* | | | 93,190 | | | | 2,193,693 | |
| | |
CryoPort, Inc.* | | | 148,604 | | | | 2,578,279 | |
| | |
Globus Medical, Inc., Class A* | | | 171,470 | | | | 12,735,077 | |
| | |
Halozyme Therapeutics, Inc.*,1 | | | 234,021 | | | | 13,315,795 | |
| | |
HealthEquity, Inc.* | | | 150,700 | | | | 9,289,148 | |
| | |
ICU Medical, Inc.*,1 | | | 34,297 | | | | 5,401,092 | |
| | |
Insmed, Inc.* | | | 184,678 | | | | 3,689,866 | |
| | |
Integra LifeSciences Holdings Corp.* | | | 136,764 | | | | 7,668,357 | |
| | |
Intra-Cellular Therapies, Inc.* | | | 126,421 | | | | 6,690,199 | |
| | |
Medpace Holdings, Inc.* | | | 42,784 | | | | 9,087,749 | |
| | |
Phreesia, Inc.* | | | 334,214 | | | | 10,815,165 | |
| | |
Progyny, Inc.* | | | 170,591 | | | | 5,313,910 | |
| | |
Supernus Pharmaceuticals, Inc.*,1 | | | 264,556 | | | | 9,436,713 | |
| | |
Syneos Health, Inc.* | | | 64,793 | | | | 2,376,607 | |
| | |
Veracyte, Inc.* | | | 183,894 | | | | 4,363,805 | |
| | |
Total Health Care | | | | | | | 129,199,503 | |
| | |
Industrials - 15.1% | | | | | | | | |
| | |
Alamo Group, Inc. | | | 68,502 | | | | 9,699,883 | |
| | |
Allegiant Travel Co.*,1 | | | 44,496 | | | | 3,025,283 | |
| | |
Heartland Express, Inc. | | | 177,672 | | | | 2,725,488 | |
| | |
Helios Technologies, Inc. | | | 120,426 | | | | 6,555,991 | |
| | |
ICF International, Inc. | | | 92,202 | | | | 9,132,608 | |
| | |
ITT, Inc. | | | 89,625 | | | | 7,268,588 | |
| | |
Primoris Services Corp. | | | 326,956 | | | | 7,173,415 | |
| | |
RBC Bearings, Inc.*,1 | | | 60,880 | | | | 12,745,228 | |
| | |
Shoals Technologies Group, Inc.,
Class A* | | | 94,089 | | | | 2,321,176 | |
| | |
The Shyft Group, Inc. | | | 271,399 | | | | 6,746,979 | |
| | |
SPX Technologies, Inc.* | | | 223,437 | | | | 14,668,639 | |
| | |
Terex Corp. | | | 177,479 | | | | 7,581,903 | |
| | |
UFP Industries, Inc. | | | 128,453 | | | | 10,179,900 | |
| | |
Total Industrials | | | | | | | 99,825,081 | |
| | |
Information Technology - 11.7% | | | | | | | | |
| | |
The Descartes Systems Group, Inc. (Canada)* | | | 130,116 | | | | 9,062,580 | |
| | |
Endava PLC, ADR (United Kingdom)* | | | 48,128 | | | | 3,681,792 | |
| | |
Flywire Corp.* | | | 433,563 | | | | 10,609,287 | |
| | |
MACOM Technology Solutions Holdings, Inc.* | | | 210,121 | | | | 13,233,421 | |
| | |
Novanta, Inc.* | | | 71,938 | | | | 9,774,216 | |
| | |
Paycor HCM, Inc.* | | | 287,138 | | | | 7,026,267 | |
| | |
Rapid7, Inc.* | | | 105,031 | | | | 3,568,953 | |
The accompanying notes are an integral part of these financial statements.
7
| | |
| | | AMG GW&K Small Cap Core Fund Schedule of Portfolio Investments (continued) |
| | | | | | | | |
| | |
Shares | | | Value | |
| |
Information Technology - 11.7% (continued) | | | | | |
| | |
Silicon Laboratories, Inc.*,1 | | | 58,624 | | | | $7,953,518 | |
| | |
Thoughtworks Holding, Inc.*,1 | | | 600,086 | | | | 6,114,876 | |
| | |
Viavi Solutions, Inc.* | | | 632,438 | | | | 6,646,923 | |
| | |
Total Information Technology | | | | | | | 77,671,833 | |
| | |
Materials - 5.2% | | | | | | | | |
| | |
Avient Corp. | | | 305,162 | | | | 10,302,269 | |
| | |
Balchem Corp. | | | 65,410 | | | | 7,987,215 | |
| | |
Minerals Technologies, Inc. | | | 140,057 | | | | 8,504,261 | |
| | |
Silgan Holdings, Inc. | | | 141,653 | | | | 7,343,292 | |
| | |
Total Materials | | | | | | | 34,137,037 | |
| | |
Real Estate - 5.1% | | | | | | | | |
| | |
Agree Realty Corp., REIT | | | 115,823 | | | | 8,215,325 | |
| | |
National Health Investors, Inc., REIT | | | 98,117 | | | | 5,123,670 | |
| | |
Ryman Hospitality Properties, Inc., REIT | | | 111,710 | | | | 9,135,644 | |
| | |
STAG Industrial, Inc., REIT | | | 348,059 | | | | 11,245,786 | |
| | |
Total Real Estate | | | | | | | 33,720,425 | |
| | |
Utilities - 2.7% | | | | | | | | |
| | |
IDACORP, Inc. | | | 74,083 | | | | 7,989,852 | |
| | |
NorthWestern Corp. | | | 170,238 | | | | 10,101,923 | |
| | |
Total Utilities | | | | | | | 18,091,775 | |
| |
Total Common Stocks | | | | | |
(Cost $534,382,503) | | | | | | | 648,885,860 | |
| | |
| | | Principal
Amount | | | | |
| |
Short-Term Investments - 2.0% | | | | | |
| |
Joint Repurchase Agreements - 0.3%2 | | | | | |
| | |
Citigroup Global Markets, Inc., dated 12/30/22, due 01/03/23, 4.250% total to be received $248,899 (collateralized by various U.S. Treasuries, 0.000% - 4.500%, 04/11/23 - 10/31/29, totaling $253,758) | | | $248,782 | | | | 248,782 | |
| | | | | | | | |
| | | Principal Amount | | | Value | |
| | |
National Bank Financial, dated 12/30/22, due 01/03/23, 4.340% total to be received $1,000,482 (collateralized by various U.S. Treasuries, 0.000% - 4.435%, 01/03/23 - 09/09/49, totaling $1,020,000) | | | $1,000,000 | | | | $1,000,000 | |
| | |
RBC Dominion Securities, Inc., dated 12/30/22, due 01/03/23, 4.300% total to be received $1,000,478 (collateralized by various U.S. Government Agency Obligations, 2.000% - 6.000%, 09/01/24 - 10/20/52, totaling $1,020,000) | | | 1,000,000 | | | | 1,000,000 | |
| |
Total Joint Repurchase Agreements | | | | 2,248,782 | |
| | |
Repurchase Agreements - 1.7% | | | | | | | | |
| | |
Fixed Income Clearing Corp., dated 12/30/22 due 01/03/23, 4.150% total to be received $10,903,025 (collateralized by a U.S. Treasury, 0.125%, 01/15/32, totaling $11,116,004) | | | 10,898,000 | | | | 10,898,000 | |
| |
Total Short-Term Investments | | | | | |
(Cost $13,146,782) | | | | | | | 13,146,782 | |
| |
Total Investments - 100.2% | | | | | |
(Cost $547,529,285) | | | | | | | 662,032,642 | |
| |
Other Assets, less Liabilities - (0.2)% | | | | (1,492,527 | ) |
| |
Net Assets - 100.0% | | | | $660,540,115 | |
| * | Non-income producing security. |
| 1 | Some of these securities, amounting to $30,453,990 or 4.6% of net assets, were out on loan to various borrowers and are collateralized by cash and various U.S. Treasury Obligations. See Note 4 of Notes to Financial Statements. |
| 2 | Cash collateral received for securities lending activity was invested in these joint repurchase agreements. |
|
| ADR American Depositary Receipt |
| REIT Real Estate Investment Trust |
The accompanying notes are an integral part of these financial statements.
8
| | |
| | | AMG GW&K Small Cap Core Fund Schedule of Portfolio Investments (continued) |
The following table summarizes the inputs used to value the Fund’s investments by the fair value hierarchy levels as of December 31, 2022:
| | | | | | | | | | | | | | | | |
| | | Level 1 | | | Level 2 | | | Level 3 | | | Total | |
| | | | |
Investments in Securities | | | | | | | | | | | | | | | | |
| | | | |
Common Stocks† | | $ | 648,885,860 | | | | — | | | | — | | | $ | 648,885,860 | |
| | | | |
Short-Term Investments | | | | | | | | | | | | | | | | |
| | | | |
Joint Repurchase Agreements | | | — | | | $ | 2,248,782 | | | | — | | | | 2,248,782 | |
| | | | |
Repurchase Agreements | | | — | | | | 10,898,000 | | | | — | | | | 10,898,000 | |
| | | | | | | | | | | | | | | | |
| | | | |
Total Investments in Securities | | $ | 648,885,860 | | | $ | 13,146,782 | | | | — | | | $ | 662,032,642 | |
| | | | | | | | | | | | | | | | |
| † | All common stocks held in the Fund are Level 1 securities. For a detailed breakout of common stocks by major industry classification, please refer to the Fund’s Schedule of Portfolio Investments. |
For the fiscal year ended December 31, 2022, there were no transfers in or out of Level 3.
The accompanying notes are an integral part of these financial statements.
9
| | |
| | | AMG GW&K Small Cap Value Fund Portfolio Manager’s Comments (unaudited) |
| | | | | | | | |
For the fiscal year ended December 31, 2022, AMG GW&K Small Cap Value Fund (the “Fund”) Class N shares returned (15.33)%, compared to a (14.48)% return for the Russell 2000® Value Index (the “Index”), the Fund’s benchmark. It is starting to become an unwelcome tagline for this decade: 202x was a challenging year for investors to navigate. So far, each year in this nascent decade has been uncertain and confounding for investors. 2022 fit that mold as well, but this year the pain was felt in our wallets too as stocks and asset values of all kinds declined sharply. The Index dropped (20.48)% and finished just a bit above its June lows. The simple mathematical determinants of stock prices tell us they can fall because investors: 1) lower their accepted valuation levels, 2) lower their earnings expectations, or 3) lower both. For 2022, reason number 1 was dominant for small cap stocks as rising inflation and interest rates led to a significant de-rating in valuations. However, late in the year analysts began to more actively mark down earnings estimates as well. There were myriad factors contributing to the uncertainty and subsequent estimate revisions. A list of prominent factors would likely include changing consumer spending preferences (services versus goods), lower end demand in housing and other related industries, uncertainty about the duration of the U.S. Federal Reserve’s (the Fed) tightening campaign, lingering supply-chain challenges (inflation and availability), a very uncertain reopening in China, and Russia’s war on Ukraine. To keep investors more off balance, small-cap stocks rallied in the final quarter of the year. Short-term oriented investors will ask whether expectations have fallen enough for stocks to have bottomed. We are skeptical that anyone can answer this correctly with high confidence, so it may not be the best question to ponder to maximize long-term returns. The Fund underperformed the Index during the year. In 2022, the benchmark had only one sector in positive territory, but it was a noteworthy one with | | | | energy up an impressive 60.5%. Utilities and consumer staples were the next best sectors given their relatively stable cash flows, finishing down single digits. Not surprisingly, style factors indicated a preference for higher-quality attributes in the selloff of 2022. Broadly speaking, within the Index, the lower quality the stock, the more poorly it performed over the course of the year. This was most evident in characteristics such as low return-on-equity (ROE), non-earners, high beta, and negative equity, which all meaningfully underperformed the Index. Five sectors dropped more than 24% on the year, each having significantly more exposure to the weaker factors mentioned above. The Fund benefited in 2022 from a combination of allocation toward higher-quality stocks and stock selection. On the factor side, averaging the allocation impact for the six quality factors we follow implies about 130 basis points of positive impact. The impact was greater for earnings specific factors. The positive stock selection came primarily from industrials with financials, health care, real estate, and communication services also making positive contributions. Industrials benefited from an overweight in the professional services industry, with two names, CBIZ, Inc. and CACI International up double digits in a sector that was down 12.8%. CACI International was sold during the period. Strong stock selection in banking drove the relative outperformance in financials. In health care, the Fund benefited from an underweight position in Biotechnology and good stock selection across other industries. Energy was the poorest relative performing sector, with our underweight position to this strong performing area was a significant detractor from relative results. The consumer discretionary sector was also a significant headwind, due to our overweight exposure and weak stock selection in the specialty retail and the hotel restaurants and leisure industries. | | | | Whether the June lows for the Index turn out to be THE lows or not will depend on the answers to several other important and complex questions. It appears that inflation has peaked, but will the stickiest elements (especially labor costs) recede quickly enough for the Fed to pause their interest rate increases and avoid further compression of end demand and corporate profits? Is there some part of our economic system that “breaks” due to the dramatic tightening actions of the Fed and other central banks? Will China’s new COVID policies result in a public health policy challenge that lasts months or much longer? Could more strains emerge that defy current vaccines? Finally, is there an acceptable end game for Russia’s war against Ukraine, or is there a further serious escalation? Instead of trying to correctly answer all these questions, a fool’s errand if there ever was one, we think it is best to focus on what opportunities exist today in the small cap market. Two years ago, investors were convinced energy stocks were a black hole while Amazon and Tesla would grow to the sky. Since then, small cap energy stocks are up 156% while Amazon and Tesla are off their highs for the year by (40)% or more. What do investors collectively think they know with high confidence today? Which stocks in the Index and in our Fund reflect excessive optimism? What segments of the market are investors too fearful to own? Fear today can often be the fuel for tomorrow’s returns. Sometimes that tomorrow can be slower than we would like to arrive. We believe our best course is to continue to look for stocks priced at reasonable valuations relative to the strength of their long-term business outlook. And be patient. The 2020s still have seven more years to go. The views expressed represent the opinions of GW&K Investment Management, LLC as of December 31, 2022, and are not intended as a forecast or guarantee of future results, and are subject to change without notice. |
10
|
AMG GW&K Small Cap Value Fund Portfolio Manager’s Comments (continued) |
CUMULATIVE TOTAL RETURN PERFORMANCE
AMG GW&K Small Cap Value Fund’s cumulative total return is based on the daily change in net asset value (NAV), and assumes that all dividends and distributions were reinvested. The graph compares a hypothetical $10,000 investment made in the AMG GW&K Small Cap Value Fund’s Class N shares on December 31, 2012, to a $10,000 investment made in the Russell 2000® Value Index for the same time period. The graph and table do not reflect the deduction of taxes that a shareholder would pay on a Fund distribution or redemption of shares. The listed returns for the Fund are net of expenses and the returns for the index exclude expenses. Total returns would have been lower had certain expenses not been reduced.
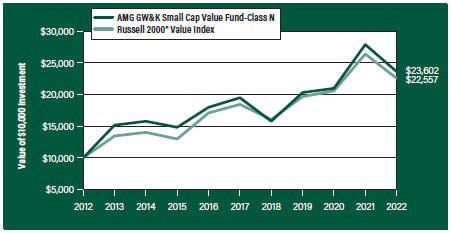
The table below shows the average annual total returns for the AMG GW&K Small Cap Value Fund and the Russell 2000® Value Index for the same time periods ended December 31, 2022.
| | | | | | | | | | | | | | | | | | | | |
| | | One | | | Five | | | Ten | | | Since | | | Inception | |
| Average Annual Total Returns1 | | Year | | | Years | | | Years | | | Inception | | | Date | |
| | |
AMG GW&K Small Cap Value Fund2, 3, 4, 5, 6, 7, 8 | | | | | | | | | |
| | | | | |
Class N | | | (15.33 | %) | | | 3.91 | % | | | 8.97% | | | | 10.94% | | | | 04/23/87 | |
| | | | | |
Class I | | | (15.19 | %) | | | 4.09 | % | | | — | | | | 4.81% | | | | 02/24/17 | |
| | | | | |
Class Z | | | (15.16 | %) | | | 4.16 | % | | | — | | | | 4.88% | | | | 02/24/17 | |
| | | | | |
Russell 2000® Value Index9 | | | (14.48 | %) | | | 4.13 | % | | | 8.48% | | | | — | | | | — | |
The performance data shown represents past performance. Past performance is not a guarantee of future results. Current performance may be lower or higher than the performance data quoted. The investment return and principal value of an investment will fluctuate so that an investor’s shares, when redeemed, may be worth more or less than their original cost.
Investors should carefully consider the Fund’s investment objectives, risks, charges and expenses before investing. For performance information through the most recent month end, current net asset values per share for the Fund and other information, please call 800.548.4539 or visit our website at amgfunds.com for a free prospectus. Read it carefully before investing or sending money.
Distributed by AMG Distributors, Inc., member FINRA/SIPC.
| 1 | Total return equals income yield plus share price change and assumes reinvestment of all dividends and capital gain distributions. Returns are net of fees and may reflect offsets of Fund expenses as described in the prospectus. No adjustment has been made for taxes payable by shareholders on their reinvested dividends and capital gain distributions. Returns for periods greater than one year are annualized. The listed returns on the Fund are net of expenses and based on the published NAV as of December 31, 2022. All returns are in U.S. Dollars ($). |
|
2 From time to time, the Fund’s investment manager has waived its fees and/or absorbed Fund expenses, which has resulted in higher returns. 3 As of December 4, 2020, the Fund’s subadvisor was changed to GW&K Investment Management, LLC. Prior to December 4, 2020, the Fund was known as the AMG Managers Skyline Special Equities Fund, and had different principal investment strategies and corresponding risks. Performance shown for periods prior to December 4, 2020 reflects the performance and investment strategies of the Fund’s previous subadvisor, Skyline Asset Management, L.P. The Fund’s past performance would have been different if the Fund were managed by the current subadvisor and strategy, and the Fund’s prior performance record might be less pertinent for investors considering whether to purchase shares of the Fund. 4 The Fund is subject to risks associated with investments in small-capitalization companies, such as erratic earnings patterns, competitive conditions, limited earnings history and a reliance on one or a limited number of products. 5 Companies that are in similar industry sectors may be similarly affected by particular economic or market events; to the extent the Fund has substantial holdings within a particular sector, the risks associated with that sector increase. 6 Market prices of investments held by the Fund may fall rapidly or unpredictably due to a variety of economic or political factors, market conditions, disasters or public health issues, or in response to events that affect particular industries or companies. 7 The Fund is subject to special risk considerations similar to those associated with the direct ownership of real estate. Real estate valuations may be subject to factors such as changing general and local economic, financial, competitive, and environmental conditions. 8 The Fund invests in value stocks, which may perform differently from the market as a whole and may be undervalued by the market for a long period of time. 9 The Russell 2000® Value Index is an unmanaged, market-value weighted, value-oriented index comprised of small stocks that have relatively low price-to-book ratios and lower forecasted growth values. Unlike the Fund, the Russell 2000® Value Index is unmanaged, is not available for investment and does not incur expenses. The Russell Indices are trademarks of the London Stock Exchange Group companies. Not FDIC insured, nor bank guaranteed. May lose value. |
11
| | |
| | | AMG GW&K Small Cap Value Fund Fund Snapshots (unaudited) December 31, 2022 |
PORTFOLIO BREAKDOWN
| | | | | |
| Sector | | % of Net Assets |
| | |
Financials | | | | 28.5 | |
| | |
Industrials | | | | 15.0 | |
| | |
Health Care | | | | 11.2 | |
| | |
Real Estate | | | | 10.3 | |
| | |
Consumer Discretionary | | | | 10.0 | |
| | |
Energy | | | | 5.5 | |
| | |
Information Technology | | | | 4.5 | |
| | |
Materials | | | | 4.4 | |
| | |
Utilities | | | | 3.8 | |
| | |
Communication Services | | | | 2.8 | |
| | |
Consumer Staples | | | | 2.6 | |
| | |
Short-Term Investments | | | | 4.4 | |
| | |
Other Assets, less Liabilities | | | | (3.0 | ) |
TOP TEN HOLDINGS
| | | | | |
| Security Name | | % of Net Assets |
| | |
Selective Insurance Group, Inc. | | | | 2.3 | |
| | |
Group 1 Automotive, Inc. | | | | 2.3 | |
| | |
Independence Realty Trust, Inc. | | | | 2.2 | |
| | |
Ameris Bancorp | | | | 2.0 | |
| | |
First Interstate BancSystem, Inc., Class A | | | | 2.0 | |
| | |
Tenet Healthcare Corp. | | | | 1.9 | |
| | |
CBIZ, Inc. | | | | 1.9 | |
| | |
Atlantic Union Bankshares Corp. | | | | 1.8 | |
| | |
ICF International, Inc. | | | | 1.8 | |
| | |
Piper Sandler Cos. | | | | 1.8 | |
| | | | | | |
| | |
Top Ten as a Group | | | | 20.0 | |
| | | | | |
Because a fund’s strategy may result in multiple investments in particular sectors of the economy, its performance may depend on the performance of those sectors and may fluctuate more widely than investments diversified across more sectors. For additional information on these and other risk considerations, please see the Fund’s prospectus.
Any sectors, industries, or securities discussed should not be perceived as investment recommendations. Mention of a specific security should not be considered a recommendation to buy or solicitation to sell that security. Specific securities mentioned in this report may have been sold from the Fund’s portfolio of investments by the time you receive this report.
12
| | |
| | | AMG GW&K Small Cap Value Fund Schedule of Portfolio Investments December 31, 2022 |
| | | | | | | | |
| | |
| | |
Shares | | | Value | |
| | |
Common Stocks - 98.6% | | | | | | | | |
| |
Communication Services - 2.8% | | | | | |
| | |
Gray Television, Inc. | | | 252,726 | | | | $2,828,004 | |
| | |
IMAX Corp. (Canada)* | | | 153,235 | | | | 2,246,425 | |
| | |
Ziff Davis, Inc.* | | | 24,200 | | | | 1,914,220 | |
| | |
Total Communication Services | | | | | | | 6,988,649 | |
| | |
Consumer Discretionary - 10.0% | | | | | | | | |
| | |
Academy Sports & Outdoors, Inc. | | | 66,425 | | | | 3,489,969 | |
| | |
Boot Barn Holdings, Inc.* | | | 67,612 | | | | 4,227,102 | |
| | |
First Watch Restaurant Group, Inc.* | | | 258,011 | | | | 3,490,889 | |
| | |
Group 1 Automotive, Inc. | | | 31,794 | | | | 5,734,684 | |
| | |
Helen of Troy, Ltd.* | | | 24,300 | | | | 2,695,113 | |
| | |
Leslie’s, Inc.* | | | 205,955 | | | | 2,514,711 | |
| | |
Topgolf Callaway Brands Corp.*,1 | | | 151,684 | | | | 2,995,759 | |
| | |
Total Consumer Discretionary | | | | | | | 25,148,227 | |
| | |
Consumer Staples - 2.6% | | | | | | | | |
| | |
Central Garden & Pet Co.* | | | 113,080 | | | | 4,234,846 | |
| | |
Hostess Brands, Inc.* | | | 108,600 | | | | 2,436,984 | |
| | |
Total Consumer Staples | | | | | | | 6,671,830 | |
| | |
Energy - 5.5% | | | | | | | | |
| | |
Earthstone Energy, Inc., Class A*,1 | | | 191,553 | | | | 2,725,799 | |
| | |
Magnolia Oil & Gas Corp., Class A | | | 116,685 | | | | 2,736,263 | |
| | |
Matador Resources Co.1 | | | 64,371 | | | | 3,684,596 | |
| | |
ProPetro Holding Corp.* | | | 249,914 | | | | 2,591,608 | |
| | |
Solaris Oilfield Infrastructure, Inc., Class A | | | 214,865 | | | | 2,133,610 | |
| | |
Total Energy | | | | | | | 13,871,876 | |
| | |
Financials - 28.5% | | | | | | | | |
| | |
Ameris Bancorp | | | 108,536 | | | | 5,116,387 | |
| | |
Atlantic Union Bankshares Corp. | | | 129,829 | | | | 4,562,191 | |
| | |
Cathay General Bancorp | | | 83,722 | | | | 3,415,020 | |
| | |
City Holding Co.1 | | | 37,149 | | | | 3,458,200 | |
| | |
Community Bank System, Inc. | | | 60,600 | | | | 3,814,770 | |
| | |
Enterprise Financial Services Corp. | | | 72,040 | | | | 3,527,078 | |
| | |
Federal Agricultural Mortgage Corp., Class C | | | 34,265 | | | | 3,862,008 | |
| | |
First Financial Bancorp | | | 135,954 | | | | 3,294,166 | |
| | |
First Interstate BancSystem, Inc., Class A | | | 127,615 | | | | 4,932,320 | |
| | |
International Bancshares Corp. | | | 83,563 | | | | 3,823,843 | |
| | |
OceanFirst Financial Corp. | | | 203,268 | | | | 4,319,445 | |
| | |
Pacific Premier Bancorp, Inc. | | | 137,124 | | | | 4,327,634 | |
| | |
Piper Sandler Cos. | | | 34,072 | | | | 4,435,834 | |
| | |
PJT Partners, Inc., Class A | | | 36,321 | | | | 2,676,495 | |
| | |
Selective Insurance Group, Inc.1 | | | 65,075 | | | | 5,766,296 | |
| | |
Stifel Financial Corp. | | | 61,835 | | | | 3,609,309 | |
| | | | | | | | |
| | |
| | |
Shares | | | Value | |
| | |
Walker & Dunlop, Inc. | | | 54,280 | | | | $4,259,894 | |
| | |
WesBanco, Inc. | | | 68,733 | | | | 2,541,746 | |
| | |
Total Financials | | | | | | | 71,742,636 | |
| | |
Health Care - 11.2% | | | | | | | | |
| | |
Albireo Pharma, Inc.* | | | 119,200 | | | | 2,575,912 | |
| | |
Arcutis Biotherapeutics, Inc.* | | | 169,827 | | | | 2,513,440 | |
| | |
BioCryst Pharmaceuticals, Inc.*,1 | | | 207,809 | | | | 2,385,647 | |
| | |
Integer Holdings Corp.*,1 | | | 51,449 | | | | 3,522,199 | |
| | |
Ligand Pharmaceuticals, Inc.* | | | 27,445 | | | | 1,833,326 | |
| | |
NeoGenomics, Inc.* | | | 309,348 | | | | 2,858,376 | |
| | |
OmniAb, Inc.* | | | 135,707 | | | | 488,545 | |
| | |
OmniAb, Inc.*,2,3 | | | 10,502 | | | | 0 | |
| | |
OmniAb, Inc.*,2,3 | | | 10,502 | | | | 0 | |
| | |
SeaSpine Holdings Corp.* | | | 383,738 | | | | 3,204,212 | |
| | |
Supernus Pharmaceuticals, Inc.* | | | 115,006 | | | | 4,102,264 | |
| | |
Tenet Healthcare Corp.* | | | 98,333 | | | | 4,797,667 | |
| | |
Total Health Care | | | | | | | 28,281,588 | |
| | |
Industrials - 15.0% | | | | | | | | |
| | |
Atkore, Inc.* | | | 30,306 | | | | 3,437,307 | |
| | |
CBIZ, Inc.* | | | 99,304 | | | | 4,652,392 | |
| | |
Columbus McKinnon Corp. | | | 102,102 | | | | 3,315,252 | |
| | |
Comfort Systems USA, Inc. | | | 31,053 | | | | 3,573,579 | |
| | |
Herc Holdings, Inc. | | | 21,360 | | | | 2,810,335 | |
| | |
Hillenbrand, Inc. | | | 67,241 | | | | 2,869,173 | |
| | |
ICF International, Inc. | | | 45,073 | | | | 4,464,481 | |
| | |
Primoris Services Corp. | | | 123,020 | | | | 2,699,059 | |
| | |
RBC Bearings, Inc.* | | | 14,615 | | | | 3,059,650 | |
| | |
Terex Corp. | | | 85,160 | | | | 3,638,035 | |
| | |
UFP Industries, Inc. | | | 41,387 | | | | 3,279,920 | |
| | |
Total Industrials | | | | | | | 37,799,183 | |
| | |
Information Technology - 4.5% | | | | | | | | |
| | |
American Software, Inc., Class A | | | 213,708 | | | | 3,137,233 | |
| | |
Power Integrations, Inc. | | | 46,305 | | | | 3,320,995 | |
| | |
Silicon Laboratories, Inc.*,1 | | | 18,157 | | | | 2,463,360 | |
| | |
Viavi Solutions, Inc.* | | | 221,560 | | | | 2,328,596 | |
| | |
Total Information Technology | | | | | | | 11,250,184 | |
| | |
Materials - 4.4% | | | | | | | | |
| | |
Minerals Technologies, Inc. | | | 43,121 | | | | 2,618,307 | |
| | |
Orion Engineered Carbons, S.A. (Luxembourg) | | | 208,251 | | | | 3,708,950 | |
| | |
Schnitzer Steel Industries, Inc., Class A | | | 67,510 | | | | 2,069,182 | |
| | |
Worthington Industries, Inc.1 | | | 54,218 | | | | 2,695,177 | |
| | |
Total Materials | | | | | | | 11,091,616 | |
The accompanying notes are an integral part of these financial statements.
13
| | |
| | | AMG GW&K Small Cap Value Fund Schedule of Portfolio Investments (continued) |
| | | | | | | | |
| | |
| | | Shares | | | Value | |
| | |
Real Estate - 10.3% | | | | | | | | |
| | |
Agree Realty Corp., REIT | | | 49,370 | | | | $3,501,814 | |
| | |
Four Corners Property Trust, Inc., REIT 1 | | | 151,003 | | | | 3,915,508 | |
| | |
Getty Realty Corp., REIT 1 | | | 124,607 | | | | 4,217,947 | |
| | |
Independence Realty Trust, Inc., REIT | | | 323,197 | | | | 5,449,101 | |
| | |
LXP Industrial Trust, REIT | | | 172,384 | | | | 1,727,288 | |
| | |
STAG Industrial, Inc., REIT | | | 94,640 | | | | 3,057,818 | |
| | |
Summit Hotel Properties, Inc., REIT | | | 222,335 | | | | 1,605,259 | |
| | |
Xenia Hotels & Resorts, Inc., REIT | | | 189,036 | | | | 2,491,494 | |
| | |
Total Real Estate | | | | | | | 25,966,229 | |
| | |
Utilities - 3.8% | | | | | | | | |
| | |
IDACORP, Inc. | | | 37,411 | | | | 4,034,776 | |
| | |
NorthWestern Corp. | | | 52,943 | | | | 3,141,638 | |
| | |
Southwest Gas Holdings, Inc. | | | 40,684 | | | | 2,517,526 | |
| | |
Total Utilities | | | | | | | 9,693,940 | |
| | |
Total Common Stocks
(Cost $224,336,717) | | | | | | | 248,505,958 | |
| | |
| | | Principal
Amount | | | | |
| |
Short-Term Investments - 4.4% | | | | | |
| |
Joint Repurchase Agreements - 3.4%4 | | | | | |
| | |
Cantor Fitzgerald Securities, Inc., dated 12/30/22, due 01/03/23, 4.300% total to be received $2,004,257 (collateralized by various U.S. Government Agency Obligations, 0.000% - 9.000%, 01/15/23 - 11/20/72, totaling $2,043,366) | | | $2,003,300 | | | | 2,003,300 | |
| | |
Citadel Securities LLC, dated 12/30/22, due 01/03/23, 4.410% total to be received $2,004,282 (collateralized by various U.S. Treasuries, 0.125% - 6.250%, 04/15/23 - 11/15/52, totaling $2,044,367) | | | 2,003,300 | | | | 2,003,300 | |
| | | | | | | | |
| | | Principal
Amount | | | Value | |
| | |
Citigroup Global Markets, Inc., dated 12/30/22, due 01/03/23, 4.250% total to be received $420,901 (collateralized by various U.S. Treasuries, 0.000% - 4.500%, 04/11/23 - 10/31/29, totaling $429,116) | | | $420,702 | | | | $420,702 | |
| | |
National Bank Financial, dated 12/30/22, due 01/03/23, 4.340% total to be received $2,004,241 (collateralized by various U.S. Treasuries, 0.000% - 4.435%, 01/03/23 - 09/09/49, totaling $2,043,341) | | | 2,003,275 | | | | 2,003,275 | |
| | |
RBC Dominion Securities, Inc., dated 12/30/22, due 01/03/23, 4.300% total to be received $2,004,232 (collateralized by various U.S. Government Agency Obligations, 2.000% - 6.000%, 09/01/24 - 10/20/52, totaling $2,043,341) | | | 2,003,275 | | | | 2,003,275 | |
| | |
Total Joint Repurchase Agreements | | | | | | | 8,433,852 | |
| | |
Repurchase Agreements - 1.0% | | | | | | | | |
| | |
Fixed Income Clearing Corp., dated 12/30/22 due 01/03/23, 4.150% total to be received $2,574,186 (collateralized by a U.S. Treasury, 0.125%, 01/15/32, totaling $2,624,509) | | | 2,573,000 | | | | 2,573,000 | |
| | |
Total Short-Term Investments
(Cost $11,006,852) | | | | | | | 11,006,852 | |
| | |
Total Investments - 103.0% | | | | | | | | |
(Cost $235,343,569) | | | | | | | 259,512,810 | |
| |
Other Assets, less Liabilities - (3.0)% | | | | (7,601,504 | ) |
Net Assets - 100.0% | | | | $251,911,306 | |
| * | Non-income producing security. |
| 1 | Some of these securities, amounting to $18,116,821 or 7.2% of net assets, were out on loan to various borrowers and are collateralized by cash and various U.S. Treasury Obligations. See Note 4 of Notes to Financial Statements. |
| 2 | Security’s value was determined by using significant unobservable inputs. |
| 3 | These securities are restricted and are not available for re-sale. Ligand Pharmaceuticals, Inc. (“Ligand”) completed a spin-off of OmniAb, Inc on November 2,2022. Ligand shareholders received OmniAb common stock and two new holdings of OmniAb earn-out shares. The market value of OmniAb common stock and earn-out shares were $327,055 and $0, respectively on the date of the spin-off, which equates to $2.41 and $0 per share, respectively. At December 31, 2022, the cost of OmniAb, Inc. common shares was $576,806 and market value was $488,545 which equates to less than 1% of net assets. For each holding of OmniAb earn-out shares the cost was $19,190 and the market value of each was $0 which has no impact on total net assets. The total value of restricted securities held is $0, which represents 0% of net assets. |
| 4 | Cash collateral received for securities lending activity was invested in these joint repurchase agreements. |
REIT Real Estate Investment Trust
The accompanying notes are an integral part of these financial statements.
14
| | |
| | | AMG GW&K Small Cap Value Fund Schedule of Portfolio Investments (continued) |
The following table summarizes the inputs used to value the Fund’s investments by the fair value hierarchy levels as of December 31, 2022:
| | | | | | | | | | | | | | | | |
| | | Level 1 | | | Level 2 | | | Level 3 | | | Total | |
| | | | |
Investments in Securities | | | | | | | | | | | | | | | | |
| | | | |
Common Stocks | | | | | | | | | | | | | | | | |
| | | | |
Financials | | | $71,742,636 | | | | — | | | | — | | | | $71,742,636 | |
| | | | |
Industrials | | | 37,799,183 | | | | — | | | | — | | | | 37,799,183 | |
| | | | |
Health Care | | | 28,281,588 | | | | — | | | | $0 | | | | 28,281,588 | |
| | | | |
Real Estate | | | 25,966,229 | | | | — | | | | — | | | | 25,966,229 | |
| | | | |
Consumer Discretionary | | | 25,148,227 | | | | — | | | | — | | | | 25,148,227 | |
| | | | |
Energy | | | 13,871,876 | | | | — | | | | — | | | | 13,871,876 | |
| | | | |
Information Technology | | | 11,250,184 | | | | — | | | | — | | | | 11,250,184 | |
| | | | |
Materials | | | 11,091,616 | | | | — | | | | — | | | | 11,091,616 | |
| | | | |
Utilities | | | 9,693,940 | | | | — | | | | — | | | | 9,693,940 | |
| | | | |
Communication Services | | | 6,988,649 | | | | — | | | | — | | | | 6,988,649 | |
| | | | |
Consumer Staples | | | 6,671,830 | | | | — | | | | — | | | | 6,671,830 | |
| | | | |
Short-Term Investments | | | | | | | | | | | | | | | | |
| | | | |
Joint Repurchase Agreements | | | — | | | | $8,433,852 | | | | — | | | | 8,433,852 | |
| | | | |
Repurchase Agreements | | | — | | | | 2,573,000 | | | | — | | | | 2,573,000 | |
| | | | | | | | | | | | | | | | |
| | | | |
Total Investments in Securities | | | $248,505,958 | | | | $11,006,852 | | | | $0 | | | | $259,512,810 | |
| | | | | | | | | | | | | | | | |
At December 31, 2022, the Level 3 common stocks were received as a result of a corporate action. The security’s value was determined by using significant unobservable inputs, which generated a change in unrealized depreciation of $38,380.
For the fiscal year ended December 31, 2022, there were no transfers in or out of Level 3. The Fund did not have any purchases and sales of Level 3 securities for the same period.
The accompanying notes are an integral part of these financial statements.
15
| | |
| | | AMG GW&K Small/Mid Cap Fund Portfolio Manager’s Comments (unaudited) |
| | | | | | | | |
THE YEAR IN REVIEW For the year ended December 31, 2022, AMG GW&K Small/Mid Cap Fund (the “Fund”) Class I shares returned (18.01)%, compared to the Fund’s benchmark, the Russell 2500® Index (the “Index”), which returned (18.37)%. It is starting to become an unwelcome tagline for this decade: 202x was a challenging year for investors to navigate. So far, each year in this nascent decade has been uncertain and confounding for investors. 2022 fit that mold as well, but this year the pain was felt in our wallets too as stocks and asset values of all kinds declined sharply. The Index dropped (18.37)% and finished just a bit above the lows it made in June and September. The simple mathematical determinants of stock prices tell us they can fall because investors: 1) lower their accepted valuation levels, 2) lower their earnings expectations, or 3) lower both. For 2022, reason number 1 was dominant for small/mid cap stocks as rising inflation and interest rates led to a significant de-rating in valuations. However, late in the year analysts began to more actively mark down earnings estimates as well. There were myriad factors contributing to the uncertainty and subsequent estimate revisions. A list of prominent factors would likely include changing consumer spending preferences (services versus goods), lower end demand in housing and other related industries, uncertainty about the duration of the U.S. Federal Reserve’s (the Fed) tightening campaign, lingering supply-chain challenges (inflation and availability), a very uncertain reopening in China, and Russia’s war on Ukraine. To keep investors more off balance, small- and mid-cap stocks rallied in the final quarter of the year. Short-term oriented investors will ask whether expectations have fallen enough for stocks to have bottomed. We are skeptical that anyone can answer this correctly with high confidence, so it may not be the best question to ponder to maximize long-term returns. The Fund modestly outperformed the Index during the year. Within the benchmark, style factors indicated a preference for higher-quality attributes in | | | | the selloff of 2022. Broadly speaking, the lower quality the stock the more poorly it performed over the course of the year. This was most evident in characteristics such as low return-on-equity (ROE), non-earners, high beta, and negative equity, which all meaningfully underperformed the Index. During 2022, the benchmark had only one sector in positive territory, but it was a noteworthy one with energy up an impressive 50.0%. Utilities and consumer staples were next best sectors given their relatively stable cash flows, finishing down single digits. Five sectors dropped more than 25% on the year, each having significantly more exposure to the weaker factors mentioned above. The relative outperformance of the Fund in 2022 came from a combination of allocation toward higher-quality companies and strong stock selection. On the factor side, averaging the allocation impact for the six quality factors we follow implies about 100 basis points of positive impact to relative performance. The impact was greater for earnings-specific factors. The good stock selection came prominently from health care, with three other sectors also making positive contributions. Health care benefited from an underweight to Biotechnology, but also suffered from an overweight in Life Science Tools & Service. While the health care portion of the benchmark dropped 28.2%, nine of our holdings were up on the year, of which Biohaven Pharmaceutical Holding Co. Ltd. and Horizon Therapeutics PLC were the beneficiaries of takeout bids. The remaining seven are still in the Fund and each finished in the black based on improved long-term cash flow outlooks. The Fund also had its share of weaker performers, led by information technology, financials, and energy. Within information technology, we had two holdings with weakening fundamentals—Cerence Inc. and Rapid7, Inc.—which were responsible for about half the relative loss. Cerence was sold during the period. The financials sector was hit mostly by two poorly performing Bank holdings—Signature Bank and Western Alliance Bancorp. The Fund continued to be underweight energy, which drove the majority of sector underperformance. | | | | Whether the September lows for the Index turn out to be THE lows or not will depend on the answers to several other important and complex questions. It appears that inflation has peaked, but will the stickiest elements (especially labor costs) recede quickly enough for the Fed to pause their interest rate increases and avoid further compression of end demand and corporate profits? Is there some part of our economic system that “breaks” due to the dramatic tightening actions of the Fed and other central banks? Will China’s new COVID policies result in a public health policy challenge that lasts months or much longer? Could more strains emerge that defy current vaccines? Finally, is there an acceptable end game for Russia’s war against Ukraine, or is there a further serious escalation? Instead of trying to correctly answer all these questions, a fool’s errand if there ever was one, we think it is best to focus on what opportunities exist today in the small and mid-cap market. Two years ago, investors were convinced energy stocks were a black hole while Amazon and Tesla would grow to the sky. Since then, small/mid cap energy stocks are up 172% while Amazon and Tesla are off their highs for the year by (40)% or more. What do investors collectively think they know with high confidence today? Which stocks in the Index and in our Fund reflect excessive optimism? What segments of the market are investors too fearful to own? Fear today can often be the fuel for tomorrow’s returns. Sometimes, that tomorrow can be slower than we would like to arrive. We believe our best course is to continue to look for stocks priced at reasonable valuations relative to the strength of their long-term business outlook. And be patient. The 2020s still have seven more years to go. The views expressed represent the opinions of GW&K Investment Management, LLC as of December 31, 2022, and are not intended as a forecast or guarantee of future results, and are subject to change without notice. |
16
|
AMG GW&K Small/Mid Cap Fund Portfolio Manager’s Comments (continued) |
CUMULATIVE TOTAL RETURN PERFORMANCE
AMG GW&K Small/Mid Cap Fund’s cumulative total return is based on the daily change in net asset value (NAV), and assumes that all dividends and distributions were reinvested. The graph compares a hypothetical $10,000 investment made in the AMG GW&K Small/Mid Cap Fund’s Class I shares on June 30, 2015, to a $10,000 investment made in the Russell 2500® Index for the same time period. The graph and table do not reflect the deduction of taxes that a shareholder would pay on a Fund distribution or redemption of shares. The listed returns for the Fund are net of expenses and the returns for the index exclude expenses. Total returns would have been lower had certain expenses not been reduced.

The table below shows the average annual total returns for the AMG GW&K Small/Mid Cap Fund and the Russell 2500® Index for the same time periods ended December 31, 2022.
| | | | | | | | | | |
| | | One | | Five | | Since | | Inception | |
| Average Annual Total Returns1 | | Year | | Years | | Inception | | Date | |
|
AMG GW&K Small/Mid Cap Fund2, 3, 4, 5, 6, 7, 8 | |
| | | | |
Class N | | (18.15%) | | 8.70% | | 9.01% | | | 02/24/17 | |
| | | | |
Class I | | (18.01%) | | 8.88% | | 7.59% | | | 06/30/15 | |
| | | | |
Class Z | | (17.94%) | | 8.98% | | 9.28% | | | 02/24/17 | |
| | | | |
Russell 2500® Index9 | | (18.37%) | | 5.89% | | 7.27% | | | 06/30/15 | † |
The performance data shown represents past performance. Past performance is not a guarantee of future results. Current performance may be lower or higher than the performance data quoted. The investment return and principal value of an investment will fluctuate so that an investor’s shares, when redeemed, may be worth more or less than their original cost.
Investors should carefully consider the Fund’s investment objectives, risks, charges and expenses before investing. For performance information through the most recent month end, current net asset values per share for the Fund and other information, please call 800.548.4539 or visit our website at amgfunds.com for a free prospectus. Read it carefully before investing or sending money.
Distributed by AMG Distributors, Inc., member FINRA/SIPC.
| † | Date reflects the inception date of the Fund, not the index |
| 1 | Total return equals income yield plus share price change and assumes reinvestment of all dividends and capital gain distributions. Returns are net of fees and may reflect offsets of Fund expenses as described in the prospectus. No adjustment has been made for taxes payable by shareholders on their reinvested dividends and |
|
capital gain distributions. Returns for periods greater than one year are annualized. The listed returns on the Fund are net of expenses and based on the published NAV as of December 31, 2022. All returns are in U.S. Dollars ($). 2 From time to time, the Fund’s investment manager has waived its fees and/or absorbed Fund expenses, which has resulted in higher returns. 3 The Fund is subject to risks associated with investments in small-capitalization companies, such as erratic earnings patterns, competitive conditions, limited earnings history, and a reliance on one or a limited number of products. 4 The Fund is subject to risks associated with investments in mid-capitalization companies such as greater price volatility, lower trading volume, and less liquidity than the stocks of larger, more established companies. 5 The Fund is subject to special risk considerations similar to those associated with the direct ownership of real estate. Real estate valuations may be subject to factors such as changing general and local economic, financial, competitive, and environmental conditions. 6 The Fund invests in growth stocks, which may be more sensitive to market movements because their prices tend to reflect future investor expectations rather than just current profits. Growth stocks may underperform value stocks during given periods. 7 The Fund invests in value stocks, which may perform differently from the market as a whole and may be undervalued by the market for a long period of time. 8 Market prices of investments held by the Fund may fall rapidly or unpredictably due to a variety of economic or political factors, market conditions, disasters or public health issues, or in response to events that affect particular industries or companies. 9 The Russell 2500® Index is composed of the 2,500 smallest stocks in the Russell 3000® Index and is widely regarded in the industry as the premier measure of small/mid cap stock performance. Unlike the Fund, the Russell 2500® Index is unmanaged, is not available for investment and does not incur expenses. The Russell Indices are trademarks of the London Stock Exchange Group companies. Not FDIC insured, nor bank guaranteed. May lose value. |
17
| | |
| | | AMG GW&K Small/Mid Cap Fund Fund Snapshots (unaudited) December 31, 2022 |
PORTFOLIO BREAKDOWN
| | | | | |
| Sector | | % of Net Assets |
| | |
Industrials | | | | 19.3 | |
| | |
Health Care | | | | 17.2 | |
| | |
Consumer Discretionary | | | | 13.7 | |
| | |
Information Technology | | | | 13.2 | |
| | |
Financials | | | | 11.6 | |
| | |
Real Estate | | | | 6.4 | |
| | |
Materials | | | | 6.1 | |
| | |
Consumer Staples | | | | 5.1 | |
| | |
Energy | | | | 4.1 | |
| | |
Utilities | | | | 2.3 | |
| | |
Short-Term Investments | | | | 2.2 | |
| | |
Other Assets, less Liabilities | | | | (1.2 | ) |
TOP TEN HOLDINGS
| | | | |
| Security Name | | % of Net Assets | |
| | |
Horizon Therapeutics Plc | | | 2.4 | |
| | |
BJ’s Wholesale Club Holdings, Inc. | | | 2.1 | |
| | |
Manhattan Associates, Inc. | | | 1.9 | |
| | |
Nordson Corp. | | | 1.8 | |
| | |
Ingersoll Rand, Inc. | | | 1.8 | |
| | |
Voya Financial, Inc. | | | 1.7 | |
| | |
RBC Bearings, Inc. | | | 1.7 | |
| | |
Booz Allen Hamilton Holding Corp. | | | 1.7 | |
| | |
Performance Food Group Co. | | | 1.6 | |
| | |
Element Solutions, Inc. | | | 1.6 | |
| | | | | |
| | |
Top Ten as a Group | | | 18.3 | |
| | | | |
Because a fund’s strategy may result in multiple investments in particular sectors of the economy, its performance may depend on the performance of those sectors and may fluctuate more widely than investments diversified across more sectors. For additional information on these and other risk considerations, please see the Fund’s prospectus.
Any sectors, industries, or securities discussed should not be perceived as investment recommendations. Mention of a specific security should not be considered a recommendation to buy or solicitation to sell that security. Specific securities mentioned in this report may have been sold from the Fund’s portfolio of investments by the time you receive this report.
18
| | |
| | | AMG GW&K Small/Mid Cap Fund Schedule of Portfolio Investments December 31, 2022 |
| | | | | | | | |
| | |
| | |
Shares | | | Value | |
| | |
Common Stocks - 99.0% | | | | | | | | |
| |
Consumer Discretionary - 13.7% | | | | | |
| | |
Bright Horizons Family Solutions, Inc.* | | | 45,269 | | | | $2,856,474 | |
| | |
Burlington Stores, Inc.* | | | 36,579 | | | | 7,416,758 | |
| | |
Carter’s, Inc.1 | | | 72,127 | | | | 5,381,395 | |
| | |
Cavco Industries, Inc.* | | | 32,730 | | | | 7,405,163 | |
| | |
Dorman Products, Inc.* | | | 71,359 | | | | 5,770,802 | |
| | |
Five Below, Inc.* | | | 50,431 | | | | 8,919,731 | |
| | |
Gentherm, Inc.* | | | 81,254 | | | | 5,305,074 | |
| | |
Grand Canyon Education, Inc.* | | | 38,915 | | | | 4,111,759 | |
| | |
Krispy Kreme Inc. | | | 179,515 | | | | 1,852,595 | |
| | |
Lithia Motors, Inc., Class A | | | 32,158 | | | | 6,584,029 | |
| | |
Polaris, Inc. | | | 73,981 | | | | 7,472,081 | |
| | |
Texas Roadhouse, Inc. | | | 96,061 | | | | 8,736,748 | |
| | |
Vail Resorts, Inc. | | | 22,278 | | | | 5,309,961 | |
| | |
Total Consumer Discretionary | | | | | | | 77,122,570 | |
| | |
Consumer Staples - 5.1% | | | | | | | | |
| | |
BJ’s Wholesale Club Holdings, Inc.* | | | 176,461 | | | | 11,674,659 | |
| | |
Lancaster Colony Corp. | | | 41,951 | | | | 8,276,932 | |
| | |
Performance Food Group Co.* | | | 153,727 | | | | 8,976,120 | |
| | |
Total Consumer Staples | | | | | | | 28,927,711 | |
| | |
Energy - 4.1% | | | | | | | | |
| | |
ChampionX Corp. | | | 121,726 | | | | 3,528,837 | |
| | |
Magnolia Oil & Gas Corp., Class A | | | 248,661 | | | | 5,831,100 | |
| | |
Ovintiv, Inc. | | | 108,670 | | | | 5,510,656 | |
| | |
ProPetro Holding Corp.* | | | 272,233 | | | | 2,823,056 | |
| | |
SM Energy Co. | | | 149,136 | | | | 5,194,407 | |
| | |
Total Energy | | | | | | | 22,888,056 | |
| | |
Financials - 11.6% | | | | | | | | |
| | |
Artisan Partners Asset Management, Inc., Class A | | | 65,869 | | | | 1,956,309 | |
| | |
Atlantic Union Bankshares Corp. | | | 178,251 | | | | 6,263,740 | |
| | |
Glacier Bancorp, Inc. | | | 95,590 | | | | 4,724,058 | |
| | |
Kinsale Capital Group, Inc. | | | 30,957 | | | | 8,095,875 | |
| | |
MarketAxess Holdings, Inc. | | | 17,880 | | | | 4,986,553 | |
| | |
Pinnacle Financial Partners, Inc. | | | 119,611 | | | | 8,779,447 | |
| | |
Piper Sandler Cos. | | | 56,761 | | | | 7,389,715 | |
| | |
Signature Bank | | | 45,230 | | | | 5,211,401 | |
| | |
Voya Financial, Inc.1 | | | 158,232 | | | | 9,729,686 | |
| | |
Western Alliance Bancorp. | | | 135,458 | | | | 8,067,878 | |
| | |
Total Financials | | | | | | | 65,204,662 | |
| | |
Health Care - 17.2% | | | | | | | | |
| | |
Acadia Healthcare Co., Inc.* | | | 88,572 | | | | 7,291,247 | |
| | |
Azenta, Inc. | | | 55,756 | | | | 3,246,114 | |
| | | | | | | | |
| | |
| | |
Shares | | | Value | |
| | |
Bio-Rad Laboratories, Inc., Class A* | | | 16,516 | | | | $6,944,813 | |
| | |
Catalent, Inc.* | | | 144,812 | | | | 6,517,988 | |
| | |
Globus Medical, Inc., Class A* | | | 111,701 | | | | 8,296,033 | |
| | |
Halozyme Therapeutics, Inc.* | | | 122,565 | | | | 6,973,949 | |
| | |
Hologic, Inc.* | | | 72,878 | | | | 5,452,003 | |
| | |
Horizon Therapeutics PLC.* | | | 117,816 | | | | 13,407,461 | |
| | |
Integer Holdings Corp.*,1 | | | 75,174 | | | | 5,146,412 | |
| | |
Intra-Cellular Therapies, Inc.* | | | 104,835 | | | | 5,547,868 | |
| | |
Jazz Pharmaceuticals PLC (Ireland)* | | | 49,042 | | | | 7,812,881 | |
| | |
Molina Healthcare, Inc.* | | | 19,972 | | | | 6,595,154 | |
| | |
Neurocrine Biosciences, Inc.* | | | 74,284 | | | | 8,872,481 | |
| | |
Syneos Health, Inc.* | | | 55,502 | | | | 2,035,813 | |
| | |
Vericel Corp.* | | | 120,002 | | | | 3,160,853 | |
| | |
Total Health Care | | | | | | | 97,301,070 | |
| | |
Industrials - 19.3% | | | | | | | | |
| | |
Atkore, Inc.* | | | 57,079 | | | | 6,473,900 | |
| | |
Booz Allen Hamilton Holding Corp. | | | 89,243 | | | | 9,327,678 | |
| | |
Columbus McKinnon Corp. | | | 139,363 | | | | 4,525,117 | |
| | |
Comfort Systems USA, Inc. | | | 65,293 | | | | 7,513,919 | |
| | |
Exponent, Inc. | | | 62,901 | | | | 6,232,860 | |
| | |
Federal Signal Corp. | | | 173,006 | | | | 8,039,589 | |
| | |
Gates Industrial Corp. PLC* | | | 502,820 | | | | 5,737,176 | |
| | |
Gibraltar Industries, Inc.* | | | 118,685 | | | | 5,445,268 | |
| | |
Hexcel Corp. | | | 107,305 | | | | 6,314,899 | |
| | |
Ingersoll Rand, Inc. | | | 191,457 | | | | 10,003,628 | |
| | |
Lincoln Electric Holdings, Inc. | | | 51,497 | | | | 7,440,802 | |
| | |
Nordson Corp. | | | 42,743 | | | | 10,160,866 | |
| | |
RBC Bearings, Inc.* | | | 44,952 | | | | 9,410,701 | |
| | |
Schneider National, Inc., Class B | | | 159,069 | | | | 3,722,215 | |
| | |
The Toro Co. | | | 74,972 | | | | 8,486,830 | |
| | |
Total Industrials | | | | | | | 108,835,448 | |
| |
Information Technology - 13.2% | | | | | |
| | |
Cognex Corp. | | | 173,369 | | | | 8,167,414 | |
| | |
CyberArk Software, Ltd. (Israel)* | | | 49,223 | | | | 6,381,762 | |
| | |
Entegris, Inc. | | | 90,824 | | | | 5,957,146 | |
| | |
Globant SA (Uruguay)* | | | 46,729 | | | | 7,857,949 | |
| | |
HubSpot, Inc.* | | | 25,075 | | | | 7,249,935 | |
| | |
Manhattan Associates, Inc.* | | | 88,040 | | | | 10,688,056 | |
| | |
Paylocity Holding Corp.* | | | 41,241 | | | | 8,011,477 | |
| | |
Power Integrations, Inc. | | | 56,542 | | | | 4,055,192 | |
| | |
Rapid7, Inc.* | | | 88,426 | | | | 3,004,715 | |
| | |
Silicon Laboratories, Inc.* | | | 48,787 | | | | 6,618,932 | |
The accompanying notes are an integral part of these financial statements.
19
| | |
| | | AMG GW&K Small/Mid Cap Fund Schedule of Portfolio Investments (continued) |
| | | | | | | | |
| | |
| | | Shares | | | Value | |
| | |
Information Technology - 13.2%
(continued) | | | | | | | | |
| | |
Zebra Technologies Corp., Class A* | | | 24,728 | | | | $6,340,506 | |
| | |
Total Information Technology | | | | | | | 74,333,084 | |
| | |
Materials - 6.1% | | | | | | | | |
| | |
AptarGroup, Inc. | | | 35,988 | | | | 3,957,960 | |
| | |
Eagle Materials, Inc. | | | 61,723 | | | | 8,199,900 | |
| | |
Element Solutions, Inc. | | | 492,968 | | | | 8,967,088 | |
| | |
Quaker Chemical Corp.1 | | | 34,374 | | | | 5,737,021 | |
| | |
RPM International, Inc. | | | 80,166 | | | | 7,812,177 | |
| | |
Total Materials | | | | | | | 34,674,146 | |
| | |
Real Estate - 6.4% | | | | | | | | |
| | |
Agree Realty Corp., REIT | | | 96,226 | | | | 6,825,310 | |
| | |
Easterly Government Properties, Inc., REIT 1 | | | 304,612 | | | | 4,346,813 | |
| | |
EastGroup Properties, Inc., REIT | | | 38,558 | | | | 5,708,898 | |
| | |
National Storage Affiliates Trust, REIT | | | 82,819 | | | | 2,991,422 | |
| | |
Physicians Realty Trust, REIT | | | 325,932 | | | | 4,716,236 | |
| | |
Summit Hotel Properties, Inc., REIT | | | 457,668 | | | | 3,304,363 | |
| | |
Sun Communities, Inc., REIT | | | 57,994 | | | | 8,293,142 | |
| | |
Total Real Estate | | | | | | | 36,186,184 | |
| | |
Utilities - 2.3% | | | | | | | | |
| | |
IDACORP, Inc. | | | 68,498 | | | | 7,387,509 | |
| | |
Portland General Electric Co.1 | | | 115,069 | | | | 5,638,381 | |
| | |
Total Utilities | | | | | | | 13,025,890 | |
| | |
Total Common Stocks
(Cost $533,089,996) | | | | | | | 558,498,821 | |
| | |
| | | Principal
Amount | | | | |
| |
Short-Term Investments - 2.2% | | | | | |
| |
Joint Repurchase Agreements - 1.7%2 | | | | | |
| | |
Cantor Fitzgerald Securities, Inc., dated 12/30/22,due 01/03/23, 4.300% total to be received $2,268,884 (collateralized by various U.S. Government Agency Obligations, 0.000% - 9.000%, 01/15/23 - 11/20/72, totaling $2,313,156) | | | $2,267,800 | | | | 2,267,800 | |
| | | | | | | | |
| | |
| | | Principal
Amount | | | Value | |
| | |
Citadel Securities LLC, dated 12/30/22, due 01/03/23, 4.410% total to be received $2,268,911 (collateralized by various U.S. Treasuries, 0.125% - 6.250%, 04/15/23 - 11/15/52, totaling $2,314,289) | | | $2,267,800 | | | | $2,267,800 | |
| | |
Citigroup Global Markets, Inc., dated 12/30/22,due 01/03/23, 4.250% total to be received $476,555 (collateralized by various U.S. Treasuries, 0.000% - 4.500%, 04/11/23 - 10/31/29, totaling $485,857) | | | 476,330 | | | | 476,330 | |
| | |
National Bank Financial, dated 12/30/22, due 01/03/23, 4.340% total to be received $2,268,900 (collateralized by various U.S. Treasuries, 0.000% - 4.435%, 01/03/23 - 09/09/49, totaling $2,313,162) | | | 2,267,806 | | | | 2,267,806 | |
| | |
RBC Dominion Securities, Inc., dated 12/30/22,due 01/03/23, 4.300% total to be received $2,268,890 (collateralized by various U.S. Government Agency Obligations, 2.000% - 6.000%, 09/01/24 - 10/20/52, totaling $2,313,162) | | | 2,267,806 | | | | 2,267,806 | |
| |
Total Joint Repurchase Agreements | | | | 9,547,542 | |
| |
Repurchase Agreements - 0.5% | | | | | |
| | |
Fixed Income Clearing Corp., dated 12/30/22 due 01/03/23, 4.150% total to be received $2,762,273 (collateralized by a U.S. Treasury, 0.125%, 01/15/32, totaling $2,816,240) | | | 2,761,000 | | | | 2,761,000 | |
| | |
Total Short-Term Investments
(Cost $12,308,542) | | | | | | | 12,308,542 | |
| | |
Total Investments - 101.2%
(Cost $545,398,538) | | | | | | | 570,807,363 | |
| |
Other Assets, less Liabilities - (1.2)% | | | | (6,653,243 | ) |
| | |
Net Assets - 100.0% | | | | | | $ | 564,154,120 | |
| * | Non-income producing security. |
| 1 | Some of these securities, amounting to $29,481,147 or 5.2% of net assets, were out on loan to various borrowers and are collateralized by cash and various U.S. Treasury Obligations. See Note 4 of Notes to Financial Statements. |
| 2 | Cash collateral received for securities lending activity was invested in these joint repurchase agreements. |
REIT Real Estate Investment Trust
The accompanying notes are an integral part of these financial statements.
20
| | |
| | | AMG GW&K Small/Mid Cap Fund Schedule of Portfolio Investments (continued) |
The following table summarizes the inputs used to value the Fund’s investments by the fair value hierarchy levels as of December 31, 2022:
| | | | | | | | | | | | | | | | |
| | | Level 1 | | | Level 2 | | | Level 3 | | | Total | |
| | | | |
Investments in Securities | | | | | | | | | | | | | | | | |
| | | | |
Common Stocks† | | $ | 558,498,821 | | | | — | | | | — | | | | $558,498,821 | |
| | | | |
Short-Term Investments | | | | | | | | | | | | | | | | |
| | | | |
Joint Repurchase Agreements | | | — | | | | $9,547,542 | | | | — | | | | 9,547,542 | |
| | | | |
Repurchase Agreements | | | — | | | | 2,761,000 | | | | — | | | | 2,761,000 | |
| | | | |
| | | | | | | | | | | | | | | | |
| | | | |
Total Investments in Securities | | $ | 558,498,821 | | | $ | 12,308,542 | | | | — | | | $ | 570,807,363 | |
| | | | | | | | | | | | | | | | |
| † | All common stocks held in the Fund are Level 1 securities. For a detailed breakout of common stocks by major industry classification, please refer to the Fund’s Schedule of Portfolio Investments. |
For the fiscal year ended December 31, 2022, there were no transfers in or out of Level 3.
The accompanying notes are an integral part of these financial statements.
21
| | |
| | | AMG GW&K Global Allocation Fund Portfolio Manager’s Comments (unaudited) |
| | | | | | | | |
THE YEAR IN REVIEW For the year ended December 31, 2022, AMG GW&K Global Allocation Fund (the “Fund”) Class N shares returned (20.04)%, compared to the (17.22)% return for its blended benchmark which consists of 60% the MSCI All Country World (ACWI) Index (“MSCI ACWI Index”) and 40% the Bloomberg Barclays Global Aggregate Bond Index. ASSET ALLOCATION The asset allocation framework for the Fund continues to favor equities over fixed income. At the end of the year, the equity/fixed income asset allocation stood at 65%/35%, where it has remained since early March 2022. For the full year, the 60% MSCI ACWI Index/40% Barclays Global Aggregate Index benchmark lost (17.22)% following the sharp weakness of equity and bond markets in the first three quarters of 2022. The current very modest tilt toward equities reflects our judgment that global equities should outperform global fixed income over the coming quarters, albeit with significant volatility along the way. The continued tilt toward equities is based on both quantitative and qualitative judgments. First, relative asset-class valuations continue to support a significant allocation to equities, despite the rise in most developed market government bond yields last year. Second, we expect the global economy to continue to expand for the next several years, although recession risks are significant for both the U.S. and Europe. Inflation continues to be a challenge for global central banks, with the U.S. Federal Reserve (the Fed) projecting that it will hike the upper range of the Fed funds rate to 5.25% by the end of this year compared to its current level of 4.5%. With the exception of the Bank of Japan and the People’s Bank of China, most other major central banks are also hiking rates to curb inflation. Rising rates provided headwinds to global equity and bond markets last year. Fortunately, those headwinds appear to be moderating as reflected in softer inflation reports and more resilient growth reports in recent months in both the U.S. and Europe. Notably, recession fears for Europe have started to ease in response to an 80% drop in natural gas prices since last August thanks to warm weather and aggressive efforts to diversify gas supplies away from Russia. China is also expected to post stronger growth this year thanks to policy support and a recent pivot away from extreme COVID suppression measures. In short, we remain cautiously optimistic that the global economy has sufficient momentum to continue to | | | | expand despite higher rates and that a positive tailwind of corporate earnings growth should still favor equities over fixed income. A key valuation metric for global equities is the Long-term Earnings Yield MSCI ACWI. That stood at 5.1% at the end of 2022, and is based on the inverse of the corresponding Shiller Price/Earning (PE) ratio of 19.6 times. By way of comparison, the Long-term Earnings Yield of MSCI ACWI has averaged 5.1% since 2005, corresponding to an average Shiller PE ratio of 19.8 times. Those figures suggest that equities fairly valued relative to their own history. For asset allocation purposes, however, a relevant comparison of the Long-term Earnings Yield is to the real yield of U.S. Treasuries. At the end of September, the yield on 10-Year US Treasury Inflation-Protected Securities (TIPS) stood at 1.6%. The gap between the Long-term Earnings Yield of 5.1 for global equities and 1.6% for TIPS securities suggests the potential for global equities to outperform bonds by about 3.5% per annum in inflation-adjusted terms over the next five-to-ten years. In short, investors continue to have reasonable incentive to favor equities over fixed income, notwithstanding the potential for greater volatility in equities. Key risks would be if the ongoing expansion that is evident in global economic data gives way to pronounced weakness or if major central banks significantly accelerate their rate hiking agendas beyond what is currently priced into markets. Those risks will be monitored carefully, but we currently view such risks to be sufficiently discounted by markets to justify a significant tilt toward equities. EQUITY It was a disappointing year for global equity markets as Russia invaded Ukraine amid a challenging inflationary backdrop and the long-awaited liftoff in U.S. interest rates. Markets finished off the lows, however, thanks to a fourth-quarter rally prompted by softer inflation readings in several countries, receding energy shortage fears in Europe, and the abrupt end to China’s zero-COVID policy. The MSCI ACWI Index declined (18.4)%, with all regions down on the year. Sector performance was broadly negative, aside from energy which rose sharply on surging crude oil and gas prices. The U.S. dollar gained 7.9%, as the Fed aggressively tightened monetary policy. The Fund’s equity sleeve underperformed the benchmark during the year. Stock selection in the health care and information technology (IT) sectors | | | | were main detractors, along with an overweight allocation to the underperforming consumer discretionary sector, though strong stock selection more than offset this allocation impact. Two U.S. holdings were the main culprits within health care. Avantor, Inc., a Biopharma and healthcare supplier, was plagued by some headwinds that are non-core to their fundamentals such as China lockdowns, foreign currency headwinds, and fading COVID tailwinds. IDEXX Laboratories, Inc., a leader in companion animal health diagnostics, experienced slowing growth against tough comparisons and its relatively high multiple contracted due to higher U.S. interest rates. Within technology two European holdings and one U.S. were the main detractors. Payment processing companies Adyen N.V. (Netherlands) and PayPal, Inc. (U.S.) were victims of the selloff in high multiple growth stocks, and in the case of Paypal disappointing earnings results also weighed on the stock. Paypal was sold during the period. Halma PLC (UK), a company focused on safety and environmental products, returned (45)% despite reporting solid results throughout the year. Consumer discretionary was by far the top contributing sector, due entirely to stock selection, mostly in China. Trip.com Group Ltd., Yum China Holding, Inc. and H World Group Ltd. all rallied towards the end of the year as the market began to price in the benefits these travel and restaurant-oriented companies will enjoy as China moves away from a zero-COVID policy and begins to reopen their economy. On a geographic level, Asia, most notably China, was the equity sleeve’s top regional contributor due entirely to stock selection, (key contributors noted above) while the overweight allocation was a very modest drag. India also contributed to results, due to a combination of allocation and security selection; the Indian market held up well with only an (8.0)% decline and the Fund’s holdings delivered a positive return of 3%. Western Europe and North America were the two biggest detractors. In addition to the detractors mentioned above Infineon Technologies AG (Germany) and Goosehead Insurance, Inc. (U.S.) were also weak. Goosehead was sold during the period. Semiconductor stocks in general were weak on concerns related to excess inventory from over ordering while higher rates impacted the homeowners and auto insurance business at Goosehead. |
22
| | |
| | | AMG GW&K Global Allocation Fund Portfolio Manager’s Comments (continued) |
| | | | | | | | |
“The only function of economic forecasting is to make astrology look respectable.” This quote is attributed to Ezra Solomon in a 1985 Readers’ Digest piece, as noted by Bloomberg in “What Will Happen in 2023: All the Latest Predictions for Next Year.” The same can obviously be said for market forecasting, so we will refrain from making any bold 2023 predictions. Strategists’ views vary, but many are calling for relatively better results in Asia thanks to China’s zero-COVID pivot and renewed focus on economic expansion, a mild economic and earnings recession in the U.S., and a demanding year for Europe, which is still facing energy security risks but should also benefit from policy changes in China. What we do know is that equities have proven resilient over the long-term, despite some notable bouts of macro weakness and market volatility. Regardless of how the numerous forecasts play out this year, our focus will remain on finding good companies that can adeptly manage various business cycles, particularly those that are the most challenging. FIXED INCOME For 2022, the fixed income sleeve finished ahead of its benchmark. Currency effect was the largest positive contributor to relative performance as the | | | | Fund’s holdings are primarily dollar-denominated during a period when the dollar depreciated. Our overweight to U.S. rates was the largest detractor for the year amid the sharp selloff in U.S. rates. Our overweight to U.S. markets and overweight to spread product also detracted. This was somewhat offset by our overweight to higher coupon mortgage-backed securities (MBS) within securitized as well as our allocation and selection within Government-Related. Security selection within corporates had minimal impact. The disconnect between the Fed’s projections and market pricing has widened following the most recent Summary of Economic Projections (SEP). The median estimate of Federal Open Market Committee (FOMC) participants for the overnight rate at the end of 2023 is 5.125%, up from 4.625% in September; the Fed funds futures market sees a terminal rate of nearly 5.00% in June of 2023 and then two cuts by year end. There has also been a small but not insignificant chorus of economists calling for the FOMC to raise its target inflation to 3% from 2%, prompting objections that this would undermine the Fed’s hard-earned credibility. These are just two sources of tension in the rates market, and their resolution could have significant implications for both the level and the shape of the yield curve. We | | | | don’t believe investors are being sufficiently compensated for these risks. Our fundamental view of credit is broadly constructive, and we believe balance sheets in general are sound and liquidity is sufficient. But we recognize the potential for macroeconomic forces to alter this landscape and we don’t believe all these risks are adequately reflected in valuations. Within the space, we see the best value at the front end, where higher quality credits in less rate-sensitive sectors offer attractive yields and compelling breakevens. We have also been able to identify names that we believe can improve their credit profiles independently of a challenging macro backdrop. In the mortgage sector, we believe the benefits of lower originations and potentially lower rate volatility are offset by event risks surrounding quantitative tightening and middling spread levels. The views expressed represent the opinions of GW&K Investment Management, LLC as of December 31, 2022, and are not intended as a forecast or guarantee of future results, and are subject to change without notice. |
23
|
AMG GW&K Global Allocation Fund Portfolio Manager’s Comments (continued) |
CUMULATIVE TOTAL RETURN PERFORMANCE
AMG GW&K Global Allocation Fund’s cumulative total return is based on the daily change in net asset value (NAV), and assumes that all dividends and distributions were reinvested. The graph compares a hypothetical $10,000 investment made in the AMG GW&K Global Allocation Fund’s Class N shares on December 31, 2012, to a $10,000 investment made in the 60% MSCI ACWI/40% Bloomberg Global Aggregate Bond Index for the same time period. The graph and table do not reflect the deduction of taxes that a shareholder would pay on a Fund distribution or redemption of shares. The listed returns for the Fund are net of expenses and the returns for the indexes exclude expenses. Total returns would have been lower had certain expenses not been reduced.
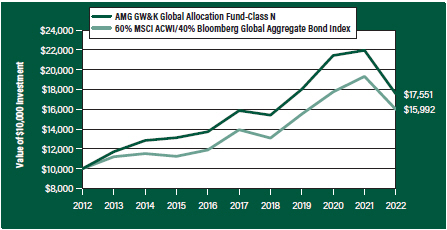
The table below shows the average annual total returns for the AMG GW&K Global Allocation Fund and the 60% MSCI ACWI/40% Bloomberg Global Aggregate Bond Index for the same time periods ended December 31, 2022.
| | | | | | |
| | | One | | Five | | Ten |
| Average Annual Total Returns1 | | Year | | Years | | Years |
|
AMG GW&K Global Allocation Fund2, 3, 4, 5, 6, 7, 8, 9, 10, 11, 12 |
| | | |
Class N | | (20.04%) | | 2.04% | | 5.79% |
| | | |
Class I | | (19.91%) | | 2.20% | | 5.97% |
| | | |
Class Z | | (19.85%) | | 2.30% | | 6.06% |
| | | |
60% MSCI ACWI/40% Bloomberg Global Aggregate Bond Index13, 14 | | (17.22%) | | 2.79% | | 4.81% |
| | | |
MSCI ACWI Index 13 | | (18.36%) | | 5.23% | | 7.98% |
| | | |
Bloomberg Global Aggregate Bond Index14 | | (16.25%) | | (1.66%) | | (0.44%) |
The performance data shown represents past performance. Past performance is not a guarantee of future results. Current performance may be lower or higher than the performance data quoted. The investment return and principal value of an investment will fluctuate so that an investor’s shares, when redeemed, may be worth more or less than their original cost.
Investors should carefully consider the Fund’s investment objectives, risks, charges and expenses before investing. For performance information through the most recent month end, current net asset values per share for the Fund and other information, please call 800.548.4539 or visit our website at amgfunds.com for a free prospectus. Read it carefully before investing or sending money.
Distributed by AMG Distributors, Inc., member FINRA/SIPC.
| 1 | Total return equals income yield plus share price change and assumes reinvestment of all dividends and capital gain distributions. Returns are net of fees and may reflect offsets of Fund expenses as described in the prospectus. No adjustment has been made for taxes payable by shareholders on their reinvested dividends and capital gain |
|
distributions. Returns for periods greater than one year are annualized. The listed returns on the Fund are net of expenses and based on the published NAV as of December 31, 2022. All returns are in U.S. Dollars ($). |
| |
2 From time to time, the Fund’s investment manager has waived its fees and/or absorbed Fund expenses, which has resulted in higher returns. |
| |
3 As of April 17, 2020, the Fund’s subadvisor was changed to GW&K Investment Management, LLC. Prior to April 17, 2020, the Fund was known as the AMG Chicago Equity Partners Balanced Fund, and had different principal investment strategies and corresponding risks. Performance shown for periods prior to April 17, 2020 reflects the performance and investment strategies of the Fund’s previous subadvisor, Chicago Equity Partners, LLC. The Fund’s past performance would have been different if the Fund were managed by the current subadvisor and strategy, and the Fund’s prior performance record might be less pertinent for investors considering whether to purchase shares of the Fund. |
| |
4 To the extent that the Fund invests in asset-backed or mortgage-backed securities, its exposure to prepayment and extension risks may be greater than investments in other fixed income securities. |
| |
5 The Fund is subject to the risks associated with investments in debt securities, such as default risk and fluctuations in the perception of the debtor’s ability to pay its creditors. Changing interest rates may adversely affect the value of an investment. An increase in interest rates typically causes the value of bonds and other fixed income securities to fall. |
| |
6 The Fund invests in value stocks, which may perform differently from the market as a whole and may be undervalued by the market for a long period of time. |
| |
7 Investments in international securities are subject to certain risks of overseas investing including currency fluctuations and changes in political and economic conditions, which could result in significant market fluctuations. These risks are magnified in emerging markets. |
| |
8 The Fund is subject to the risks associated with investments in emerging markets, such as erratic earnings patterns, economic and political instability, changing exchange controls, limitations on repatriation of foreign capital and changes in local governmental attitudes toward private investment, possibly leading to nationalization or confiscation of investor assets. |
| |
9 The Fund invests in growth stocks, which may be more sensitive to market movements because their prices tend to reflect future investor expectations rather than just current profits. Growth stocks may underperform value stocks during given periods. |
24
| | |
| | | AMG GW&K Global Allocation Fund Portfolio Manager’s Comments (continued) |
| | | | |
10 Market prices of investments held by the Fund may fall rapidly or unpredictably due to a variety of economic or political factors, market conditions, disasters or public health issues, or in response to events that affect particular industries or companies. 11 The Fund’s investments may not be allocated in the best performing asset classes. 12 The Fund is subject to currency risk resulting from fluctuations in exchange rates that may affect the total loss or gain on a non-U.S. Dollar investment when converted back to U.S. Dollars. 13 The MSCI All Country World Index (ACWI) is a free-float adjusted market capitalization weighted index that is designed to measure the equity market performance of developed and emerging markets. Please go to msci.com for most current list of countries represented by the Index. Unlike the Fund, the ACWI is unmanaged, is not available for investment and does not incur expenses. | | 14 The Bloomberg Global Aggregate Bond Index provides a broad-based measure of the global investment-grade fixed income markets. The three major components of this index are the U.S. Aggregate, the Pan-European Aggregate, and the Asian-Pacific Aggregate Indices. The Index also includes Eurodollar and Euro-Yen corporate bonds, Canadian government, agency and corporate securities, and USD investment grade 144A securities. Unlike the Fund, the Bloomberg Global Aggregate Bond Index is unmanaged, is not available for investment and does not incur expenses. All MSCI data is provided “as is”. The products described herein are not sponsored or endorsed and have not been reviewed or passed on by MSCI. In no event shall MSCI, its affiliates or any MSCI data provider have any liability of any kind in connection with the MSCI data or the products described herein. Copying or redistributing the MSCI data is strictly prohibited. All holdings and sector/region allocations are subject to review and adjustment in accordance | | with the Portfolio’s investment strategy and may vary in the future, and should not be considered recommendations to buy or sell any security. “Bloomberg®” and any Bloomberg index described herein are service marks of Bloomberg Finance L.P. and its affiliates, including Bloomberg Index Services Limited (“BISL”), the administrator of the index (collectively, “Bloomberg”) and have been licensed for use for certain purposes by AMG Funds LLC. Bloomberg is not affiliated with AMG Funds LLC, and Bloomberg does not approve, endorse, review, or recommend the fund described herein. Bloomberg does not guarantee the timeliness, accurateness, or completeness of any data or information relating to such fund. Not FDIC insured, nor bank guaranteed. May lose value. |
25
| | |
| | | AMG GW&K Global Allocation Fund Fund Snapshots (unaudited) December 31, 2022 |
PORTFOLIO BREAKDOWN
| | | | | |
| Sector | | % of
Net Assets |
| | |
Consumer Discretionary | | 15.1 |
| | |
Industrials | | 14.5 |
| | |
U.S. Government and Agency Obligations | | 13.3 |
| | |
Information Technology | | 13.2 |
| | |
Financials | | 10.4 |
| | |
Health Care | | 9.3 |
| | |
Foreign Government Obligations | | 8.1 |
| | |
Energy | | 4.4 |
| | |
Communication Services | | 3.6 |
| | |
Utilities | | 2.8 |
| | |
Real Estate | | 1.9 |
| | |
Municipal Bonds | | 0.9 |
| | |
Short-Term Investments | | 4.4 |
| | |
Other Assets, less Liabilities | | (1.9) |
TOP TEN HOLDINGS
| | |
| Security Name | | % of
Net Assets |
| | |
UnitedHealth Group, Inc. | | 3.7 |
| | |
The Charles Schwab Corp. | | 2.9 |
| | |
Hess Corp. | | 2.6 |
| | |
AIA Group, Ltd. (Hong Kong) | | 2.4 |
| | |
NextEra Energy, Inc. | | 2.3 |
| | |
Infineon Technologies AG (Germany) | | 2.3 |
| | |
HDFC Bank, Ltd., ADR (India) | | 2.2 |
| | |
H World Group Ltd., ADR (China) | | 2.2 |
| | |
STERIS PLC | | 2.2 |
| | |
Yum China Holdings, Inc. (China) | | 2.1 |
| | | |
| | |
Top Ten as a Group | | 24.9 |
| | |
| | | | | |
| Rating | | % of Market Value1 |
| | |
U.S. Government and Agency Obligations | | | | 39.2 | |
| | |
Aaa/AAA | | | | 13.6 | |
| | |
Aa/AA | | | | 14.5 | |
| | |
A | | | | 3.0 | |
| | |
Baa/BBB | | | | 19.6 | |
| | |
Ba/BB | | | | 9.1 | |
| | |
B | | | | 1.0 | |
| 1 | Includes market value of long-term fixed-income securities only. |
Credit quality ratings shown above reflect the highest rating assigned by either Standard & Poor’s (“S&P”), Moody’s Investors Service, Inc. (“Moody’s”) or Fitch. These rating agencies are independent, nationally recognized statistical rating organizations and are widely used. Investment grade ratings are credit ratings of BBB- or higher. Below investment grade ratings are credit ratings of BB+ or lower. Investments designated N/R are not rated by any of the rating agencies. Unrated investments do not necessarily indicate low credit quality. Credit quality ratings are subject to change.
Because a fund’s strategy may result in multiple investments in particular sectors of the economy, its performance may depend on the performance of those sectors and may fluctuate more widely than investments diversified across more sectors. For additional information on these and other risk considerations, please see the Fund’s prospectus.
Any sectors, industries, or securities discussed should not be perceived as investment recommendations. Mention of a specific security should not be considered a recommendation to buy or solicitation to sell that security. Specific securities mentioned in this report may have been sold from the Fund’s portfolio of investments by the time you receive this report.
26
| | |
| | | AMG GW&K Global Allocation Fund Schedule of Portfolio Investments December 31, 2022 |
| | | | | | | | |
| | |
| | | Shares | | | Value | |
| | |
Common Stocks - 63.6% | | | | | | | | |
| |
Communication Services - 3.6% | | | | | |
| | |
Alphabet, Inc., Class A* | | | 9,520 | | | | $839,950 | |
| | |
Tencent Holdings, Ltd. (China) | | | 14,600 | | | | 619,045 | |
| | |
Total Communication Services | | | | | | | 1,458,995 | |
| |
Consumer Discretionary - 15.1% | | | | | |
| | |
Alibaba Group Holding, Ltd. (China)* | | | 52,500 | | | | 576,078 | |
| | |
Amazon.com, Inc.* | | | 6,633 | | | | 557,172 | |
| | |
H World Group Ltd., ADR (China) | | | 21,035 | | | | 892,305 | |
| | |
JD.com, Inc., Class A (China) | | | 880 | | | | 24,567 | |
| | |
LVMH Moet Hennessy Louis Vuitton SE (France) | | | 919 | | | | 668,750 | |
| | |
MakeMyTrip, Ltd. (India)* | | | 30,251 | | | | 834,020 | |
| | |
Moncler SpA (Italy)1 | | | 12,596 | | | | 669,312 | |
| | |
Sands China, Ltd. (Macau)* | | | 85,600 | | | | 280,788 | |
| | |
Trip.com Group, Ltd. (China)* | | | 24,100 | | | | 831,199 | |
| | |
Yum China Holdings, Inc. (China) | | | 15,700 | | | | 876,686 | |
| | |
Total Consumer Discretionary | | | | | | | 6,210,877 | |
| |
Energy - 4.4% | | | | | |
| | |
Canadian Natural Resources, Ltd. (Canada)1 | | | 13,046 | | | | 724,467 | |
| | |
Hess Corp. | | | 7,620 | | | | 1,080,669 | |
| | |
Total Energy | | | | | | | 1,805,136 | |
| |
Financials - 7.5% | | | | | |
| | |
AIA Group, Ltd. (Hong Kong) | | | 88,500 | | | | 977,340 | |
| | |
The Charles Schwab Corp. | | | 14,103 | | | | 1,174,216 | |
| | |
HDFC Bank, Ltd., ADR (India) | | | 13,494 | | | | 923,125 | |
| | |
Total Financials | | | | | | | 3,074,681 | |
| |
Health Care - 9.3% | | | | | |
| | |
Avantor, Inc.* | | | 32,300 | | | | 681,207 | |
| | |
IDEXX Laboratories, Inc.* | | | 1,763 | | | | 719,233 | |
| | |
STERIS PLC | | | 4,807 | | | | 887,805 | |
| | |
UnitedHealth Group, Inc. | | | 2,881 | | | | 1,527,449 | |
| | |
Total Health Care | | | | | | | 3,815,694 | |
| |
Industrials - 6.2% | | | | | |
| | |
Casella Waste Systems, Inc., Class A* | | | 8,807 | | | | 698,483 | |
| | |
MISUMI Group, Inc. (Japan) | | | 30,650 | | | | 666,157 | |
| | |
TransDigm Group, Inc. | | | 964 | | | | 606,982 | |
| | |
Union Pacific Corp. | | | 2,800 | | | | 579,796 | |
| | |
Total Industrials | | | | | | | 2,551,418 | |
| |
Information Technology - 13.2% | | | | | |
| | |
Adyen, N.V. (Netherlands)*,2 | | | 518 | | | | 719,113 | |
| | |
Black Knight, Inc.* | | | 11,918 | | | | 735,937 | |
| | |
Halma PLC (United Kingdom) | | | 28,111 | | | | 669,462 | |
| | |
Infineon Technologies AG (Germany) | | | 30,707 | | | | 933,245 | |
| | | | | | | | |
| | |
| | | Shares | | | Value | |
| | |
Mastercard, Inc., Class A | | | 2,503 | | | | $870,368 | |
| | |
Microsoft Corp. | | | 3,361 | | | | 806,035 | |
| | |
Taiwan Semiconductor Manufacturing Co., Ltd. ADR, Sponsored ADR (Taiwan) | | | 9,221 | | | | 686,872 | |
| | |
Total Information Technology | | | | | | | 5,421,032 | |
| |
Real Estate - 1.9% | | | | | |
| | |
American Tower Corp., REIT | | | 3,725 | | | | 789,179 | |
| | |
Utilities - 2.4% | | | | | | | | |
| | |
NextEra Energy, Inc. | | | 11,509 | | | | 962,152 | |
| | |
Total Common Stocks
(Cost $20,256,428) | | | | | | | 26,089,164 | |
| | |
| | | Principal
Amount | | | | |
| |
Corporate Bonds and Notes - 11.6% | | | | | |
| |
Financials - 2.9% | | | | | |
| | |
AerCap Ireland Capital DAC/AerCap Global Aviation Trust (Ireland) 1.650%, 10/29/24 | | | $280,000 | | | | 258,272 | |
| | |
Aircastle, Ltd. (Bermuda)
5.250%, 08/11/252 | | | 91,000 | | | | 87,518 | |
| | |
American Tower Corp.
2.750%, 01/15/27 | | | 160,000 | | | | 145,042 | |
| | |
Bank of America Corp. | | | | | | | | |
MTN, (4.330% to 03/15/49 then 3 month LIBOR + 1.520%), 4.330%, 03/15/503,4 | | | 50,000 | | | | 41,009 | |
| | |
Citigroup, Inc. | | | | | | | | |
(3.875% to 02/18/26 then U.S. Treasury Yield Curve CMT 5 year + 3.417%), 3.875%, 02/18/263,4,5 | | | 85,000 | | | | 72,463 | |
| | |
First-Citizens Bank & Trust Co. | | | | | | | | |
6.125%, 03/09/28 | | | 78,000 | | | | 79,269 | |
| | |
Landwirtschaftliche Rentenbank, EMTN (Germany) | | | | | | | | |
1.750%, 01/14/27 | | | 175,000 | | | | 159,095 | |
| | |
MetLife, Inc. | | | | | | | | |
Series G, (3.850% to 09/15/25 then U.S. Treasury Yield Curve CMT 5 year + 3.576%), 3.850%, 09/15/251,3,4,5 | | | 163,000 | | | | 151,386 | |
| | |
SBA Communications Corp. | | | | | | | | |
3.875%, 02/15/27 | | | 52,000 | | | | 46,983 | |
| | |
Sprint Capital Corp. | | | | | | | | |
6.875%, 11/15/28 | | | 60,000 | | | | 62,276 | |
| | |
Truist Financial Corp. | | | | | | | | |
Series N, (4.800% to 09/01/24 then U.S. Treasury Yield Curve CMT 5 year + 3.003%), 4.800%, 09/01/243,4,5 | | | 106,000 | | | | 95,427 | |
| | |
Total Financials | | | | | | | 1,198,740 | |
| | |
Industrials - 8.3% | | | | | | | | |
| | |
AECOM | | | | | | | | |
5.125%, 03/15/27 | | | 56,000 | | | | 53,900 | |
The accompanying notes are an integral part of these financial statements.
27
| | |
| | | AMG GW&K Global Allocation Fund Schedule of Portfolio Investments (continued) |
| | | | | | | | |
| | | Principal
Amount | | | Value | |
| | |
Industrials - 8.3% (continued) | | | | | | | | |
| | |
Alcoa Nederland Holding, B.V. (Netherlands) | | | | | | | | |
4.125%, 03/31/292 | | | $200,000 | | | | $177,432 | |
| | |
Amazon.com, Inc. | | | | | | | | |
4.600%, 12/01/251 | | | 123,000 | | | | 122,697 | |
| | |
Anheuser-Busch InBev Worldwide, Inc. | | | | | | | | |
4.375%, 04/15/38 | | | 72,000 | | | | 64,362 | |
| | |
Ardagh Metal Packaging Finance USA LLC/Ardagh Metal Packaging Finance PLC | | | | | | | | |
3.250%, 09/01/281,2 | | | 185,000 | | | | 157,147 | |
| | |
AT&T, Inc. | | | | | | | | |
4.300%, 12/15/42 | | | 96,000 | | | | 78,758 | |
| | |
Ball Corp. | | | | | | | | |
4.875%, 03/15/26 | | | 71,000 | | | | 68,773 | |
| | |
The Boeing Co. | | | | | | | | |
5.805%, 05/01/50 | | | 32,000 | | | | 29,670 | |
| | |
Callon Petroleum Co. | | | | | | | | |
6.375%, 07/01/26 | | | 147,000 | | | | 137,011 | |
| | |
Centene Corp. | | | | | | | | |
2.500%, 03/01/31 | | | 51,000 | | | | 39,906 | |
3.375%, 02/15/301 | | | 39,000 | | | | 32,969 | |
| | |
Cisco Systems, Inc. | | | | | | | | |
5.500%, 01/15/40 | | | 58,000 | | | | 60,355 | |
| | |
Cogent Communications Group, Inc. | | | | | | | | |
3.500%, 05/01/262 | | | 68,000 | | | | 61,774 | |
| | |
Crown Americas LLC/Crown Americas Capital Corp. V | | | | | | | | |
4.250%, 09/30/261 | | | 54,000 | | | | 51,493 | |
| | |
Dell, Inc. | | | | | | | | |
7.100%, 04/15/28 | | | 65,000 | | | | 69,313 | |
| | |
Delta Air Lines, Inc. | | | | | | | | |
7.375%, 01/15/261 | | | 70,000 | | | | 71,522 | |
| | |
Embraer Netherlands Finance BV (Netherlands) | | | | | | | | |
5.050%, 06/15/25 | | | 135,000 | | | | 131,019 | |
| | |
HB Fuller Co. | | | | | | | | |
4.250%, 10/15/28 | | | 74,000 | | | | 65,490 | |
| | |
HCA, Inc. | | | | | | | | |
3.500%, 09/01/30 | | | 67,000 | | | | 57,786 | |
| | |
KB Home | | | | | | | | |
4.000%, 06/15/311 | | | 48,000 | | | | 38,585 | |
| | |
Kinder Morgan, Inc. | | | | | | | | |
4.300%, 06/01/25 | | | 146,000 | | | | 143,180 | |
| | |
Kraft Heinz Foods Co. | | | | | | | | |
4.375%, 06/01/46 | | | 71,000 | | | | 57,695 | |
| | |
Lamar Media Corp. | | | | | | | | |
3.750%, 02/15/28 | | | 64,000 | | | | 57,287 | |
| | |
MEG Energy Corp. (Canada) | | | | | | | | |
5.875%, 02/01/292 | | | 52,000 | | | | 49,037 | |
| | |
Microsoft Corp. | | | | | | | | |
2.525%, 06/01/50 | | | 55,000 | | | | 36,193 | |
| | | | | | | | |
| | | Principal
Amount | | | Value | |
| | |
Murphy Oil Corp. | | | | | | | | |
6.375%, 07/15/281 | | | $90,000 | | | | $86,629 | |
| | |
Murphy Oil USA, Inc. | | | | | | | | |
5.625%, 05/01/27 | | | 57,000 | | | | 55,348 | |
| | |
Nestle Holdings, Inc. | | | | | | | | |
1.000%, 09/15/272 | | | 275,000 | | | | 232,986 | |
| | |
Newell Brands, Inc. | | | | | | | | |
4.450%, 04/01/266 | | | 64,000 | | | | 60,211 | |
| | |
NuStar Logistics LP | | | | | | | | |
5.750%, 10/01/25 | | | 80,000 | | | | 76,907 | |
| | |
Oracle Corp. | | | | | | | | |
2.800%, 04/01/27 | | | 161,000 | | | | 146,509 | |
| | |
Pernod Ricard International Finance LLC | | | | | | | | |
1.250%, 04/01/282 | | | 250,000 | | | | 206,300 | |
| | |
Silgan Holdings, Inc. | | | | | | | | |
4.125%, 02/01/28 | | | 69,000 | | | | 63,836 | |
| | |
SK Hynix, Inc. (South Korea) | | | | | | | | |
2.375%, 01/19/312 | | | 200,000 | | | | 146,633 | |
| | |
Smith & Nephew PLC (United Kingdom) | | | | | | | | |
2.032%, 10/14/301 | | | 107,000 | | | | 83,634 | |
| | |
Teva Pharmaceutical Finance Netherlands III, B.V. (Netherlands) | | | | | | | | |
3.150%, 10/01/26 | | | 69,000 | | | | 60,340 | |
| | |
Travel + Leisure Co. | | | | | | | | |
5.650%, 04/01/246 | | | 56,000 | | | | 55,157 | |
| | |
United Rentals North America, Inc. | | | | | | | | |
3.875%, 02/15/31 | | | 56,000 | | | | 46,944 | |
| | |
Verizon Communications, Inc. | | | | | | | | |
3.875%, 02/08/291 | | | 54,000 | | | | 50,666 | |
| | |
Walmart, Inc. | | | | | | | | |
4.050%, 06/29/48 | | | 50,000 | | | | 44,373 | |
| | |
Western Digital Corp. | | | | | | | | |
4.750%, 02/15/26 | | | 48,000 | | | | 45,203 | |
| | |
Yum! Brands, Inc. | | | | | | | | |
3.625%, 03/15/31 | | | 43,000 | | | | 36,055 | |
| | |
Total Industrials | | | | | | | 3,411,085 | |
| | |
Utilities - 0.4% | | | | | | | | |
| | |
Dominion Energy, Inc. | | | | | | | | |
Series B, (4.650% to 12/15/24 then U.S. Treasury Yield Curve CMT 5 year + 2.993%), 4.650%, 12/15/243,4,5 | | | 131,000 | | | | 114,625 | |
| | |
Northern States Power Co. | | | | | | | | |
2.900%, 03/01/50 | | | 63,000 | | | | 43,090 | |
| | |
Total Utilities | | | | | | | 157,715 | |
| | |
Total Corporate Bonds and Notes
(Cost $5,417,510) | | | | | | | 4,767,540 | |
| | |
Municipal Bonds - 0.9% | | | | | | | | |
| | |
California State General Obligation, School Improvements Build America Bonds, 7.550%, 04/01/39 | | | 60,000 | | | | 75,098 | |
The accompanying notes are an integral part of these financial statements.
28
| | |
| | | AMG GW&K Global Allocation Fund Schedule of Portfolio Investments (continued) |
| | | | | | | | |
| | |
| | | Principal
Amount | | | Value | |
| |
Municipal Bonds - 0.9% (continued) | | | | | |
| | |
JobsOhio Beverage System | | | | | | | | |
Series B, 4.532%, 01/01/35 | | | $130,000 | | | | $125,402 | |
| | |
Los Angeles Unified School District, School Improvements | | | | | | | | |
5.750%, 07/01/34 | | | 85,000 | | | | 88,789 | |
| | |
New Jersey Transportation Trust Fund Authority | | | | | | | | |
Series C, 5.754%, 12/15/28 | | | 90,000 | | | | 90,672 | |
| | |
Total Municipal Bonds
(Cost $460,225) | | | | | | | 379,961 | |
| |
U.S. Government and Agency Obligations - 13.3% | | | | | |
| |
Fannie Mae - 4.5% | | | | | |
| | |
FNMA | | | | | | | | |
3.000%, 10/01/37 to 01/01/38 | | | 179,589 | | | | 166,640 | |
4.000%, 11/01/44 to 02/01/50 | | | 636,758 | | | | 608,622 | |
4.500%, 09/01/46 to 02/01/49 | | | 365,321 | | | | 360,970 | |
5.000%, 08/01/49 | | | 259,414 | | | | 261,108 | |
5.500%, 02/01/37 | | | 4,970 | | | | 5,074 | |
| | |
FNMA Pool | | | | | | | | |
3.500%, 05/01/52 | | | 479,755 | | | | 442,829 | |
| | |
Total Fannie Mae | | | | | | | 1,845,243 | |
| | |
Freddie Mac - 0.8% | | | | | | | | |
| | |
FHLMC Gold Pool | | | | | | | | |
3.000%, 02/01/38 | | | 74,068 | | | | 68,330 | |
| | |
FHLMC Pool | | | | | | | | |
4.500%, 07/01/44 | | | 253,776 | | | | 249,489 | |
| | |
Total Freddie Mac | | | | | | | 317,819 | |
| | |
U.S. Treasury Obligations - 8.0% | | | | | | | | |
| | |
U.S. Treasury Bonds | | | | | | | | |
2.250%, 05/15/41 to 02/15/52 | | | 881,000 | | | | 618,952 | |
3.000%, 11/15/44 to 02/15/49 | | | 431,000 | | | | 355,205 | |
4.375%, 02/15/38 | | | 527,000 | | | | 551,765 | |
4.500%, 08/15/39 | | | 492,000 | | | | 521,693 | |
| | |
U.S. Treasury Notes | | | | | | | | |
1.500%, 02/15/30 | | | 448,000 | | | | 381,780 | |
2.250%, 02/15/27 | | | 364,000 | | | | 338,733 | |
2.875%, 05/15/32 | | | 590,000 | | | | 543,722 | |
| | |
Total U.S. Treasury Obligations | | | | | | | 3,311,850 | |
| | |
Total U.S. Government and Agency Obligations
(Cost $5,875,460) | | | | | | | 5,474,912 | |
| |
Foreign Government Obligations - 8.1% | | | | | |
| | |
African Development Bank
(Côte d’Ivoire) Series GDIF | | | | | | | | |
0.875%, 03/23/261 | | | 135,000 | | | | 120,715 | |
| | |
Agence Francaise de Developpement (France) | | | | | | | | |
0.625%, 01/22/26 | | | 200,000 | | | | 177,890 | |
| | |
Asian Development Bank (Philippines) | | | | | | | | |
1.750%, 09/19/29 | | | 165,000 | | | | 142,006 | |
| | |
BNG Bank, N.V. (Netherlands) | | | | | | | | |
0.875%, 05/18/262 | | | 200,000 | | | | 177,581 | |
| | | | | | | | |
| | |
| | | Principal
Amount | | | Value | |
| | |
European Investment Bank (Luxembourg) | | | | | | | | |
0.625%, 10/21/271 | | | $122,000 | | | | $103,484 | |
| | |
Finland Government International Bond (Finland) | | | | | | | | |
0.875%, 05/20/302 | | | 200,000 | | | | 158,490 | |
| | |
Inter-American Development Bank | | | | | | | | |
4.375%, 01/24/44 | | | 310,000 | | | | 303,541 | |
| | |
International Bank for Reconstruction & Development | | | | | | | | |
Series GDIF | | | | | | | | |
3.125%, 11/20/25 | | | 275,000 | | | | 265,672 | |
| | |
International Finance Corp. | | | | | | | | |
2.125%, 04/07/26 | | | 160,000 | | | | 149,412 | |
| | |
Japan Finance Organization for Municipalities (Japan) | | | | | | | | |
1.000%, 05/21/252 | | | 300,000 | | | | 274,041 | |
| | |
Kingdom of Belgium Government International Bond (Belgium) | | | | | | | | |
1.000%, 05/28/30 | | | 200,000 | | | | 159,139 | |
| | |
Kommunalbanken A.S. (Norway) | | | | | | | | |
1.125%, 10/26/262 | | | 200,000 | | | | 177,125 | |
| | |
The Korea Development Bank (South Korea) | | | | | | | | |
0.500%, 10/27/23 | | | 299,000 | | | | 288,791 | |
1.375%, 04/25/27 | | | 200,000 | | | | 172,906 | |
| | |
Nederlandse Financierings-Maatschappij voor Ontwikkelingslanden, N.V. (Netherlands) | | | | | | | | |
0.875%, 06/15/26 | | | 300,000 | | | | 265,733 | |
| | |
Philippine Government International Bond (Philippines) | | | | | | | | |
1.648%, 06/10/31 | | | 200,000 | | | | 159,535 | |
| | |
Province of Ontario Canada (Canada) | | | | | | | | |
1.050%, 05/21/271 | | | 151,000 | | | | 130,918 | |
| | |
Province of Quebec Canada (Canada) | | | | | | | | |
1.350%, 05/28/30 | | | 123,000 | | | | 99,634 | |
| | |
Total Foreign Government Obligations
(Cost $3,847,388) | | | | | | | 3,326,613 | |
| |
Short-Term Investments - 4.4% | | | | | |
| |
Joint Repurchase Agreements - 3.4%7 | | | | | |
| | |
National Bank Financial, dated 12/30/22, due 01/03/23, 4.340% total to be received $1,000,482 (collateralized by various U.S. Treasuries, 0.000% - 4.435%, 01/03/23 - 09/09/49, totaling $1,020,000) | | | 1,000,000 | | | | 1,000,000 | |
| | |
Nomura Securities International, Inc., dated 12/30/22, due 01/03/23, 4.300% total to be received $405,232 (collateralized by various U.S. Government Agency Obligations, 1.973% - 9.000%, 02/01/23 - 07/01/60, totaling $413,139) | | | 405,038 | | | | 405,038 | |
| | |
Total Joint Repurchase Agreements | | | | | | | 1,405,038 | |
The accompanying notes are an integral part of these financial statements.
29
| | |
| | | AMG GW&K Global Allocation Fund Schedule of Portfolio Investments (continued) |
| | | | | | | | |
| | |
| | | Principal
Amount | | | Value | |
| |
Repurchase Agreements - 1.0% | | | | | |
| | |
Fixed Income Clearing Corp., dated 12/30/22 due 01/03/23, 4.150% total to be received $381,176 (collateralized by a U.S. Treasury, 0.125%, 01/15/32, totaling $388,645) | | | $381,000 | | | | $381,000 | |
| | |
Total Short-Term Investments
(Cost $1,786,038) | | | | | | | 1,786,038 | |
| | | | | | | | |
| | |
| | |
| | | Value | |
| | |
Total Investments - 101.9%
(Cost $37,643,049) | | | | | | $ | 41,824,228 | |
| |
Other Assets, less Liabilities - (1.9)% | | | | (775,084 | ) |
| | |
Net Assets - 100.0% | | | | | | $ | 41,049,144 | |
| * | Non-income producing security. |
| 1 | Some of these securities, amounting to $1,896,239 or 4.6% of net assets, were out on loan to various borrowers and are collateralized by cash and various U.S. Treasury Obligations. See Note 4 of Notes to Financial Statements. |
| 2 | Security exempt from registration under Rule 144A of the Securities Act of 1933. This security may be resold in transactions exempt from registration, normally to qualified institutional buyers. At December 31, 2022, the value of these securities amounted to $2,625,177 or 6.4% of net assets. |
| 3 | Fixed to variable rate investment. The rate shown reflects the fixed rate in effect at December 31, 2022. Rate will reset at a future date. |
| 4 | Variable rate security. The rate shown is based on the latest available information as of December 31, 2022. Certain variable rate securities are not based on a published reference rate and spread but are determined by the issuer or agent and are based on current market conditions. These securities do not indicate a reference rate and spread in their description above. |
| 5 | Perpetuity Bond. The date shown represents the next call date. |
| 6 | Step Bond: A debt instrument with either deferred interest payments or an interest rate that resets at specific times during its term. |
| 7 | Cash collateral received for securities lending activity was invested in these joint repurchase agreements. |
| | |
| ADR | | American Depositary Receipt |
| |
| CMT | | Constant Maturity Treasury |
| |
| EMTN | | European Medium Term Note |
| |
| FHLMC | | Freddie Mac |
| |
| FNMA | | Fannie Mae |
| |
| LIBOR | | London Interbank Offered Rate |
| |
| MTN | | Medium-Term Note |
| |
| REIT | | Real Estate Investment Trust |
The accompanying notes are an integral part of these financial statements.
30
| | |
| | | AMG GW&K Global Allocation Fund Schedule of Portfolio Investments (continued) |
The following table summarizes the inputs used to value the Fund’s investments by the fair value hierarchy levels as of December 31, 2022:
| | | | | | | | | | | | | | | | |
| | | Level 1 | | | Level 21 | | | Level 3 | | | Total | |
Investments in Securities | | | | | | | | | | | | | | | | |
| | | | |
Common Stocks | | | | | | | | | | | | | | | | |
| | | | |
Consumer Discretionary | | $ | 2,283,497 | | | $ | 3,927,380 | | | | — | | | $ | 6,210,877 | |
| | | | |
Information Technology | | | 3,099,212 | | | | 2,321,820 | | | | — | | | | 5,421,032 | |
| | | | |
Health Care | | | 3,815,694 | | | | — | | | | — | | | | 3,815,694 | |
| | | | |
Financials | | | 2,097,341 | | | | 977,340 | | | | — | | | | 3,074,681 | |
| | | | |
Industrials | | | 1,885,261 | | | | 666,157 | | | | — | | | | 2,551,418 | |
| | | | |
Energy | | | 1,805,136 | | | | — | | | | — | | | | 1,805,136 | |
| | | | |
Communication Services | | | 839,950 | | | | 619,045 | | | | — | | | | 1,458,995 | |
| | | | |
Utilities | | | 962,152 | | | | — | | | | — | | | | 962,152 | |
| | | | |
Real Estate | | | 789,179 | | | | — | | | | — | | | | 789,179 | |
Corporate Bonds and Notes† | | | — | | | | 4,767,540 | | | | — | | | | 4,767,540 | |
Municipal Bonds† | | | — | | | | 379,961 | | | | — | | | | 379,961 | |
U.S. Government and Agency Obligations† | | | — | | | | 5,474,912 | | | | — | | | | 5,474,912 | |
Foreign Government Obligations† | | | — | | | | 3,326,613 | | | | — | | | | 3,326,613 | |
Short-Term Investments | | | | | | | | | | | | | | | | |
| | | | |
Joint Repurchase Agreements | | | — | | | | 1,405,038 | | | | — | | | | 1,405,038 | |
| | | | |
Repurchase Agreements | | | — | | | | 381,000 | | | | — | | | | 381,000 | |
| | | | | | | | | | | | | | | | |
| | | | |
Total Investments in Securities | | $ | 17,577,422 | | | $ | 24,246,806 | | | | — | | | $ | 41,824,228 | |
| | | | | | | | | | | | | | | | |
| † | All corporate bonds and notes, municipal bonds, U.S. government and agency obligations, and foreign government obligations held in the Fund are Level 2 securities. For a detailed breakout of corporate bonds and notes, municipal bonds, U.S. government and agency obligations and foreign government obligations by major industry or agency classification, please refer to the Fund’s Schedule of Portfolio Investments. |
| 1 | An external pricing service is used to reflect any impact on security value due to market movements between the time the Fund valued such foreign securities and the earlier closing of foreign markets. |
For the fiscal year ended December 31, 2022, there were no transfers in or out of Level 3.
The accompanying notes are an integral part of these financial statements.
31
| | |
| | | AMG GW&K Global Allocation Fund Schedule of Portfolio Investments (continued) |
The country allocation in the Schedule of Portfolio Investments at December 31, 2022, was as follows:
| | |
| Country | | % of Long-Term
Investments |
| |
Belgium | | 0.4 |
| |
Bermuda | | 0.2 |
| |
Canada | | 2.5 |
| |
China | | 9.5 |
| |
Côte d’Ivoire | | 0.3 |
| |
Finland | | 0.4 |
| |
France | | 2.1 |
| |
Germany | | 2.7 |
| |
Hong Kong | | 2.4 |
| |
India | | 4.4 |
| |
Ireland | | 0.7 |
| |
Italy | | 1.7 |
| |
Japan | | 2.4 |
| |
Luxembourg | | 0.3 |
| |
Macau | | 0.7 |
| |
Netherlands | | 3.8 |
| |
Norway | | 0.4 |
| |
Philippines | | 0.8 |
| |
South Korea | | 1.5 |
| |
Taiwan | | 1.7 |
| |
United Kingdom | | 1.9 |
| |
United States | | 59.2 |
| | |
| |
| | | 100.0 |
| | |
The accompanying notes are an integral part of these financial statements.
32
| | |
| | | Statement of Assets and Liabilities December 31, 2022 |
| | | | | | | | | | | | | | | | | | | | |
| | | AMG
GW&K Small Cap
Core Fund | | AMG
GW&K Small Cap
Value Fund | | AMG
GW&K Small/Mid
Cap Fund | | AMG
GW&K Global
Allocation Fund |
| | | | |
Assets: | | | | | | | | | | | | | | | | | | | | |
| | | | |
Investments at value1 (including securities on loan valued at $30,453,990, $18,116,821, $29,481,147, and $1,896,239, respectively) | | | | $662,032,642 | | | | | $259,512,810 | | | | | $570,807,363 | | | | | $41,824,228 | |
| | | | |
Cash | | | | 961 | | | | | 158,555 | | | | | 822 | | | | | 560,926 | |
| | | | |
Foreign currency2 | | | | — | | | | | — | | | | | — | | | | | 1,137 | |
| | | | |
Receivable for investments sold | | | | 1,041,005 | | | | | — | | | | | 2,991,862 | | | | | — | |
| | | | |
Dividend and interest receivables | | | | 485,336 | | | | | 303,916 | | | | | 341,432 | | | | | 168,814 | |
| | | | |
Securities lending income receivable | | | | 1,793 | | | | | 1,503 | | | | | 2,896 | | | | | 311 | |
| | | | |
Receivable for Fund shares sold | | | | 231,184 | | | | | 718,134 | | | | | 636,432 | | | | | 396 | |
| | | | |
Receivable from affiliate | | | | 3,302 | | | | | 5,075 | | | | | 11,869 | | | | | 10,081 | |
| | | | |
Prepaid expenses and other assets | | | | 18,759 | | | | | 12,180 | | | | | 29,483 | | | | | 18,146 | |
| | | | |
Total assets | | | | 663,814,982 | | | | | 260,712,173 | | | | | 574,822,159 | | | | | 42,584,039 | |
| | | | |
Liabilities: | | | | | | | | | | | | | | | | | | | | |
| | | | |
Payable upon return of securities loaned | | | | 2,248,782 | | | | | 8,433,852 | | | | | 9,547,542 | | | | | 1,405,038 | |
| | | | |
Payable for Fund shares repurchased | | | | 405,537 | | | | | 55,818 | | | | | 620,970 | | | | | 27,635 | |
| | | | |
Accrued expenses: | | | | | | | | | | | | | | | | | | | | |
| | | | |
Investment advisory and management fees | | | | 401,608 | | | | | 153,241 | | | | | 303,527 | | | | | 21,941 | |
| | | | |
Administrative fees | | | | 86,059 | | | | | 32,837 | | | | | 73,434 | | | | | 5,485 | |
| | | | |
Distribution fees | | | | 1,854 | | | | | — | | | | | 11,222 | | | | | 5,188 | |
| | | | |
Shareholder service fees | | | | 19,953 | | | | | 38,776 | | | | | 10,869 | | | | | — | |
| | | | |
Other | | | | 111,074 | | | | | 86,343 | | | | | 100,475 | | | | | 69,608 | |
| | | | |
Total liabilities | | | | 3,274,867 | | | | | 8,800,867 | | | | | 10,668,039 | | | | | 1,534,895 | |
| | | | | | | | | | | | | | | | | | | | |
| | | | |
Net Assets | | | | $660,540,115 | | | | | $251,911,306 | | | | | $564,154,120 | | | | | $41,049,144 | |
| | | | |
1 Investments at cost | | | | $547,529,285 | | | | | $235,343,569 | | | | | $545,398,538 | | | | | $37,643,049 | |
| | | | |
2 Foreign currency at cost | | | | — | | | | | — | | | | | — | | | | | $1,044 | |
The accompanying notes are an integral part of these financial statements.
33
| | |
| | | Statement of Assets and Liabilities (continued) |
| | | | | | | | | | | | | | | | | | | | |
| | | AMG
GW&K Small Cap
Core Fund | | AMG
GW&K Small Cap
Value Fund | | AMG
GW&K Small/Mid
Cap Fund | | AMG
GW&K Global
Allocation Fund |
| | | | |
Net Assets Represent: | | | | | | | | | | | | | | | | | | | | |
| | | | |
Paid-in capital | | | | $546,247,805 | | | | | $226,581,215 | | | | | $544,114,477 | | | | | $36,512,353 | |
| | | | |
Total distributable earnings | | | | 114,292,310 | | | | | 25,330,091 | | | | | 20,039,643 | | | | | 4,536,791 | |
| | | | |
Net Assets | | | | $660,540,115 | | | | | $251,911,306 | | | | | $564,154,120 | | | | | $41,049,144 | |
| | | | |
Class N: | | | | | | | | | | | | | | | | | | | | |
| | | | |
Net Assets | | | | $8,532,923 | | | | | $162,010,756 | | | | | $51,332,648 | | | | | $23,430,255 | |
| | | | |
Shares outstanding | | | | 311,060 | | | | | 6,297,767 | | | | | 3,417,086 | | | | | 1,681,604 | |
| | | | |
Net asset value, offering and redemption price per share | | | | $27.43 | | | | | $25.73 | | | | | $15.02 | | | | | $13.93 | |
| | | | |
Class I: | | | | | | | | | | | | | | | | | | | | |
| | | | |
Net Assets | | | | $433,065,845 | | | | | $81,318,785 | | | | | $250,023,584 | | | | | $16,074,200 | |
| | | | |
Shares outstanding | | | | 15,335,387 | | | | | 3,165,246 | | | | | 16,585,463 | | | | | 1,136,656 | |
| | | | |
Net asset value, offering and redemption price per share | | | | $28.24 | | | | | $25.69 | | | | | $15.07 | | | | | $14.14 | |
| | | | |
Class Z: | | | | | | | | | | | | | | | | | | | | |
| | | | |
Net Assets | | | | $218,941,347 | | | | | $8,581,765 | | | | | $262,797,888 | | | | | $1,544,689 | |
| | | | |
Shares outstanding | | | | 7,747,166 | | | | | 335,369 | | | | | 17,404,458 | | | | | 109,324 | |
| | | | |
Net asset value, offering and redemption price per share | | | | $28.26 | | | | | $25.59 | | | | | $15.10 | | | | | $14.13 | |
The accompanying notes are an integral part of these financial statements.
34
| | |
| | | Statement of Operations For the fiscal year ended December 31, 2022 |
| | | | | | | | | | | | | | | | |
| | | AMG
GW&K Small Cap
Core Fund | | AMG
GW&K Small Cap
Value Fund | | AMG
GW&K Small/Mid
Cap Fund | | AMG
GW&K Global
Allocation Fund |
| | | | |
Investment Income: | | | | | | | | | | | | | | | | |
| | | | |
Dividend income | | | $7,120,891 | | | | $4,721,476 | | | | $6,189,733 | | | | $533,907 | |
| | | | |
Interest income | | | 254,871 | | | | 58,851 | | | | 168,748 | | | | 551,415 | |
| | | | |
Securities lending income | | | 47,800 | | | | 25,658 | | | | 37,239 | | | | 8,295 | |
| | | | |
Foreign withholding tax | | | (21,029 | ) | | | (3,581 | ) | | | (18,764 | ) | | | (33,992 | ) |
| | | | |
Total investment income | | | 7,402,533 | | | | 4,802,404 | | | | 6,376,956 | | | | 1,059,625 | |
| | | | |
Expenses: | | | | | | | | | | | | | | | | |
| | | | |
Investment advisory and management fees | | | 4,826,899 | | | | 2,091,338 | | | | 3,562,334 | | | | 438,869 | |
| | | | |
Administrative fees | | | 1,034,336 | | | | 448,144 | | | | 861,855 | | | | 109,717 | |
| | | | |
Distribution fees - Class N | | | 22,782 | | | | — | | | | 143,033 | | | | 71,624 | |
| | | | |
Shareholder servicing fees - Class N | | | 13,669 | | | | 453,622 | | | | — | | | | — | |
| | | | |
Shareholder servicing fees - Class I | | | 230,145 | | | | 47,390 | | | | 131,987 | | | | 38,535 | |
| | | | |
Custodian fees | | | 73,945 | | | | 53,904 | | | | 60,199 | | | | 35,522 | |
| | | | |
Professional fees | | | 64,313 | | | | 54,244 | | | | 66,530 | | | | 43,187 | |
| | | | |
Registration fees | | | 61,540 | | | | 50,094 | | | | 56,783 | | | | 48,600 | |
| | | | |
Trustee fees and expenses | | | 48,096 | | | | 20,474 | | | | 40,586 | | | | 4,805 | |
| | | | |
Reports to shareholders | | | 34,736 | | | | 23,929 | | | | 39,360 | | | | 15,057 | |
| | | | |
Transfer agent fees | | | 25,447 | | | | 27,182 | | | | 28,927 | | | | 5,585 | |
| | | | |
Interest expense | | | 3,657 | | | | 3,414 | | | | 227 | | | | 8,384 | |
| | | | |
Miscellaneous | | | 25,281 | | | | 12,916 | | | | 19,674 | | | | 7,360 | |
| | | | |
Repayment of prior reimbursements | | | 23,921 | | | | — | | | | 14,991 | | | | — | |
| | | | |
Total expenses before offsets | | | 6,488,767 | | | | 3,286,651 | | | | 5,026,486 | | | | 827,245 | |
| | | | |
Expense reimbursements | | | (12,500 | ) | | | (93,363 | ) | | | (39,766 | ) | | | (116,229 | ) |
| | | | |
Expense reductions | | | (54,366 | ) | | | (40,501 | ) | | | (23,627 | ) | | | — | |
| | | | |
Net expenses | | | 6,421,901 | | | | 3,152,787 | | | | 4,963,093 | | | | 711,016 | |
| | | | | | | | | | | | | | | | |
| | | | |
Net investment income | | | 980,632 | | | | 1,649,617 | | | | 1,413,863 | | | | 348,609 | |
| | | | |
Net Realized and Unrealized Loss: | | | | | | | | | | | | | | | | |
| | | | |
Net realized gain on investments | | | 8,194,929 | | | | 2,350,459 | | | | 11,157,155 | | | | 3,027,676 | |
| | | | |
Net realized loss on foreign currency transactions | | | — | | | | — | | | | — | | | | (139,806 | ) |
| | | | |
Net change in unrealized appreciation/depreciation on investments | | | (135,195,014 | ) | | | (58,011,614 | ) | | | (126,909,129 | ) | | | (28,079,775 | ) |
| | | | |
Net change in unrealized appreciation/depreciation on foreign currency translations | | | — | | | | — | | | | — | | | | (2,267 | ) |
| | | | |
Net realized and unrealized loss | | | (127,000,085 | ) | | | (55,661,155 | ) | | | (115,751,974 | ) | | | (25,194,172 | ) |
| | | | | | | | | | | | | | | | |
| | | | |
Net decrease in net assets resulting from operations | | | $(126,019,453 | ) | | | $(54,011,538 | ) | | | $(114,338,111 | ) | | | $(24,845,563 | ) |
The accompanying notes are an integral part of these financial statements.
35
| | |
| | | Statements of Changes in Net Assets For the fiscal years ended December 31, |
| | | | | | | | | | | | | | | | |
| | | AMG
GW&K Small Cap
Core Fund | | | AMG
GW&K Small Cap
Value Fund | |
| | | | |
| | | 2022 | | | 2021 | | | 2022 | | | 2021 |
| | | | |
Increase (Decrease) in Net Assets Resulting From Operations: | | | | | | | | | | | | | | | | |
| | | | |
Net investment income (loss) | | | $980,632 | | | | $(629,013 | ) | | | $1,649,617 | | | | $1,232,848 | |
| | | | |
Net realized gain on investments | | | 8,194,929 | | | | 49,419,834 | | | | 2,350,459 | | | | 38,956,174 | |
| | | | |
Net change in unrealized appreciation/depreciation on investments | | | (135,195,014 | ) | | | 79,668,547 | | | | (58,011,614 | ) | | | 60,248,817 | |
| | | | |
Net increase (decrease) in net assets resulting from operations | | | (126,019,453 | ) | | | 128,459,368 | | | | (54,011,538 | ) | | | 100,437,839 | |
| | | | |
Distributions to Shareholders: | | | | | | | | | | | | | | | | |
| | | | |
Class N | | | (64,594 | ) | | | (949,945 | ) | | | (2,695,354 | ) | | | (28,587,718 | ) |
| | | | |
Class I | | | (3,756,002 | ) | | | (46,514,091 | ) | | | (1,530,323 | ) | | | (12,015,888 | ) |
| | | | |
Class Z | | | (2,006,227 | ) | | | (15,991,224 | ) | | | (164,728 | ) | | | (1,267,238 | ) |
| | | | |
Total distributions to shareholders | | | (5,826,823 | ) | | | (63,455,260 | ) | | | (4,390,405 | ) | | | (41,870,844 | ) |
| | | | |
Capital Share Transactions:1 | | | | | | | | | | | | | | | | |
| | | | |
Net increase (decrease) from capital share transactions | | | 34,931,383 | | | | 87,562,396 | | | | (61,819,336 | ) | | | (23,573,512 | ) |
| | | | | | | | | | | | | | | | |
| | | | |
Total increase (decrease) in net assets | | | (96,914,893 | ) | | | 152,566,504 | | | | (120,221,279 | ) | | | 34,993,483 | |
| | | | |
Net Assets: | | | | | | | | | | | | | | | | |
| | | | |
Beginning of year | | | 757,455,008 | | | | 604,888,504 | | | | 372,132,585 | | | | 337,139,102 | |
| | | | |
End of year | | | $660,540,115 | | | | $757,455,008 | | | | $251,911,306 | | | | $372,132,585 | |
1 See Note 1(g) of the Notes to Financial Statements.
The accompanying notes are an integral part of these financial statements.
36
| | |
| | | Statements of Changes in Net Assets (continued) For the fiscal years ended December 31, |
| | | | | | | | | | | | | | | | |
| | | AMG
GW&K Small/Mid
Cap Fund | | | AMG
GW&K Global
Allocation Fund | |
| | | | |
| | | 2022 | | | 2021 | | | 2022 | | | 2021 |
| | | | |
Increase (Decrease) in Net Assets Resulting From Operations: | | | | | | | | | | | | | | | | |
| | | | |
Net investment income (loss) | | | $1,413,863 | | | | $(577,795 | ) | | | $348,609 | | | | $(157,875 | ) |
| | | | |
Net realized gain on investments | | | 11,157,155 | | | | 32,735,934 | | | | 2,887,870 | | | | 8,621,655 | |
| | | | |
Net change in unrealized appreciation/depreciation on investments | | | (126,909,129 | ) | | | 63,516,205 | | | | (28,082,042 | ) | | | (4,403,764 | ) |
| | | | |
Net increase (decrease) in net assets resulting from operations | | | (114,338,111 | ) | | | 95,674,344 | | | | (24,845,563 | ) | | | 4,060,016 | |
| | | | |
Distributions to Shareholders: | | | | | | | | | | | | | | | | |
| | | | |
Class N | | | (2,004,795 | ) | | | (3,691,812 | ) | | | (2,644,479 | ) | | | (999,921 | ) |
| | | | |
Class I | | | (10,257,877 | ) | | | (14,552,343 | ) | | | (1,798,913 | ) | | | (2,220,592 | ) |
| | | | |
Class Z | | | (10,783,979 | ) | | | (10,207,781 | ) | | | (201,039 | ) | | | (78,887 | ) |
| | | | |
Total distributions to shareholders | | | (23,046,651 | ) | | | (28,451,936 | ) | | | (4,644,431 | ) | | | (3,299,400 | ) |
| | | | |
Capital Share Transactions:1 | | | | | | | | | | | | | | | | |
| | | | |
Net increase (decrease) from capital share transactions | | | 138,227,537 | | | | 225,319,643 | | | | (56,032,680 | ) | | | (27,205,033 | ) |
| | | | | | | | | | | | | | | | |
| | | | |
Total increase (decrease) in net assets | | | 842,775 | | | | 292,542,051 | | | | (85,522,674 | ) | | | (26,444,417 | ) |
| | | | |
Net Assets: | | | | | | | | | | | | | | | | |
| | | | |
Beginning of year | | | 563,311,345 | | | | 270,769,294 | | | | 126,571,818 | | | | 153,016,235 | |
| | | | |
End of year | | | $564,154,120 | | | | $563,311,345 | | | | $41,049,144 | | | | $126,571,818 | |
1 See Note 1(g) of the Notes to Financial Statements.
The accompanying notes are an integral part of these financial statements.
37
| | |
| | | AMG GW&K Small Cap Core Fund Financial Highlights For a share outstanding throughout each fiscal year |
| | | | | | | | | | | | | | | | | | | | |
| | | For the fiscal years ended December 31, |
| | | | | |
| Class N | | 2022 | | 2021 | | 2020 | | 2019 | | 2018 |
| | | | | |
Net Asset Value, Beginning of Year | | | $33.13 | | | | $29.97 | | | | $26.09 | | | | $21.03 | | | | $28.04 | |
| | | | | |
Income (loss) from Investment Operations: | | | | | | | | | | | | | | | | | | | | |
| | | | | |
Net investment loss1,2 | | | (0.06 | ) | | | (0.15 | ) | | | (0.03 | ) | | | (0.04 | ) | | | (0.04 | ) |
| | | | | |
Net realized and unrealized gain (loss) on investments | | | (5.43 | ) | | | 6.34 | | | | 4.64 | | | | 6.47 | | | | (3.95 | ) |
| | | | | |
Total income (loss) from investment operations | | | (5.49 | ) | | | 6.19 | | | | 4.61 | | | | 6.43 | | | | (3.99 | ) |
| | | | | |
Less Distributions to Shareholders from: | | | | | | | | | | | | | | | | | | | | |
| | | | | |
Net realized gain on investments | | | (0.21 | ) | | | (3.03 | ) | | | (0.73 | ) | | | (1.37 | ) | | | (3.02 | ) |
| | | | | |
Net Asset Value, End of Year | | | $27.43 | | | | $33.13 | | | | $29.97 | | | | $26.09 | | | | $21.03 | |
| | | | | |
Total Return2,3 | | | (16.58 | )% | | | 21.01 | % | | | 17.73 | % | | | 30.66 | % | | | (14.08 | )% |
| | | | | |
Ratio of net expenses to average net assets4 | | | 1.29 | %5 | | | 1.30 | %5 | | | 1.29 | % | | | 1.29 | % | | | 1.28 | % |
| | | | | |
Ratio of gross expenses to average net assets6 | | | 1.30 | %5 | | | 1.30 | %5 | | | 1.30 | % | | | 1.31 | % | | | 1.28 | % |
| | | | | |
Ratio of net investment loss to average net assets2 | | | (0.22 | )% | | | (0.45 | )% | | | (0.14 | )% | | | (0.15 | )% | | | (0.13 | )% |
| | | | | |
Portfolio turnover | | | 25 | % | | | 33 | % | | | 37 | % | | | 20 | % | | | 25 | % |
| | | | | |
Net assets end of year (000’s) omitted | | | $8,533 | | | | $11,278 | | | | $8,667 | | | | $10,239 | | | | $12,655 | |
| | | | | |
| | | | | | | | | | | | | | | | | | | | | |
38
| | |
| | | AMG GW&K Small Cap Core Fund Financial Highlights For a share outstanding throughout each fiscal year |
| | | | | | | | | | | | | | | | | | | | |
| | | For the fiscal years ended December 31, |
| | | | | |
| Class I | | 2022 | | 2021 | | 2020 | | 2019 | | 2018 |
| | | | | |
Net Asset Value, Beginning of Year | | | $34.02 | | | | $30.61 | | | | $26.57 | | | | $21.37 | | | | $28.42 | |
| | | | | |
Income (loss) from Investment Operations: | | | | | | | | | | | | | | | | | | | | |
| | | | | |
Net investment income (loss)1,2 | | | 0.04 | | | | (0.03 | ) | | | 0.05 | | | | 0.05 | | | | 0.06 | |
| | | | | |
Net realized and unrealized gain (loss) on investments | | | (5.57 | ) | | | 6.47 | | | | 4.76 | | | | 6.58 | | | | (4.03 | ) |
| | | | | |
Total income (loss) from investment operations | | | (5.53 | ) | | | 6.44 | | | | 4.81 | | | | 6.63 | | | | (3.97 | ) |
| | | | | |
Less Distributions to Shareholders from: | | | | | | | | | | | | | | | | | | | | |
| | | | | |
Net investment income | | | (0.04 | ) | | | — | | | | (0.04 | ) | | | (0.06 | ) | | | (0.06 | ) |
| | | | | |
Net realized gain on investments | | | (0.21 | ) | | | (3.03 | ) | | | (0.73 | ) | | | (1.37 | ) | | | (3.02 | ) |
| | | | | |
Total distributions to shareholders | | | (0.25 | ) | | | (3.03 | ) | | | (0.77 | ) | | | (1.43 | ) | | | (3.08 | ) |
| | | | | |
Net Asset Value, End of Year | | | $28.24 | | | | $34.02 | | | | $30.61 | | | | $26.57 | | | | $21.37 | |
| | | | | |
Total Return2,3 | | | (16.27 | )% | | | 21.38 | % | | | 18.16 | % | | | 31.13 | % | | | (13.83 | )% |
| | | | | |
Ratio of net expenses to average net assets4 | | | 0.94 | %5 | | | 0.95 | %5 | | | 0.94 | % | | | 0.94 | % | | | 0.95 | % |
| | | | | |
Ratio of gross expenses to average net assets6 | | | 0.95 | %5 | | | 0.95 | %5 | | | 0.95 | % | | | 0.96 | % | | | 0.95 | % |
| | | | | |
Ratio of net investment income (loss) to average net assets2 | | | 0.13 | % | | | (0.10 | )% | | | 0.21 | % | | | 0.20 | % | | | 0.20 | % |
| | | | | |
Portfolio turnover | | | 25 | % | | | 33 | % | | | 37 | % | | | 20 | % | | | 25 | % |
| | | | | |
Net assets end of year (000’s) omitted | | | $433,066 | | | | $546,326 | | | | $470,373 | | | | $331,703 | | | | $311,252 | |
| | | | | |
| | | | | | | | | | | | | | | | | | | | | |
39
| | |
| | | AMG GW&K Small Cap Core Fund Financial Highlights For a share outstanding throughout each fiscal year |
| | | | | | | | | | | | | | | | | | | | |
| | | For the fiscal years ended December 31, |
| | | | | |
| Class Z | | 2022 | | 2021 | | 2020 | | 2019 | | 2018 |
| | | | | |
Net Asset Value, Beginning of Year | | | $34.05 | | | | $30.61 | | | | $26.57 | | | | $21.37 | | | | $28.42 | |
| | | | | |
Income (loss) from Investment Operations: | | | | | | | | | | | | | | | | | | | | |
| | | | | |
Net investment income (loss)1,2 | | | 0.05 | | | | (0.02 | ) | | | 0.07 | | | | 0.06 | | | | 0.07 | |
| | | | | |
Net realized and unrealized gain (loss) on investments | | | (5.58 | ) | | | 6.49 | | | | 4.75 | | | | 6.59 | | | | (4.03 | ) |
| | | | | |
Total income (loss) from investment operations | | | (5.53 | ) | | | 6.47 | | | | 4.82 | | | | 6.65 | | | | (3.96 | ) |
| | | | | |
Less Distributions to Shareholders from: | | | | | | | | | | | | | | | | | | | | |
| | | | | |
Net investment income | | | (0.05 | ) | | | — | | | | (0.05 | ) | | | (0.08 | ) | | | (0.07 | ) |
| | | | | |
Net realized gain on investments | | | (0.21 | ) | | | (3.03 | ) | | | (0.73 | ) | | | (1.37 | ) | | | (3.02 | ) |
| | | | | |
Total distributions to shareholders | | | (0.26 | ) | | | (3.03 | ) | | | (0.78 | ) | | | (1.45 | ) | | | (3.09 | ) |
| | | | | |
Net Asset Value, End of Year | | | $28.26 | | | | $34.05 | | | | $30.61 | | | | $26.57 | | | | $21.37 | |
| | | | | |
Total Return2,3 | | | (16.25 | )% | | | 21.48 | % | | | 18.21 | % | | | 31.13 | % | | | (13.73 | )% |
| | | | | |
Ratio of net expenses to average net assets4 | | | 0.89 | %5 | | | 0.90 | %5 | | | 0.89 | % | | | 0.89 | % | | | 0.90 | % |
| | | | | |
Ratio of gross expenses to average net assets6 | | | 0.90 | %5 | | | 0.90 | %5 | | | 0.90 | % | | | 0.91 | % | | | 0.90 | % |
| | | | | |
Ratio of net investment income (loss) to average net assets2 | | | 0.18 | % | | | (0.05 | )% | | | 0.26 | % | | | 0.25 | % | | | 0.25 | % |
| | | | | |
Portfolio turnover | | | 25 | % | | | 33 | % | | | 37 | % | | | 20 | % | | | 25 | % |
| | | | | |
Net assets end of year (000’s) omitted | | | $218,941 | | | | $199,851 | | | | $125,848 | | | | $110,020 | | | | $85,009 | |
| | | | | |
| | | | | | | | | | | | | | | | | | | | | |
| 1 | Per share numbers have been calculated using average shares. |
| 2 | Total returns and net investment income (loss) would have been lower had certain expenses not been offset. |
| 3 | The total return is calculated using the published Net Asset Value as of fiscal year end. |
| 4 | Includes reduction from broker recapture amounting to 0.01% for the fiscal year ended December 31, 2022, less than 0.01% for the fiscal year ended December 31, 2021, 0.01% for the fiscal years ended December 31, 2020 and 2019 and less than 0.01% for the fiscal year ended December 31, 2018. |
| 5 | Such ratio includes recapture of waived/reimbursed fees from prior periods amounting to less than 0.01% for the fiscal year ended December 31, 2022, and 0.01% for the fiscal year ended December 31, 2021. |
| 6 | Excludes the impact of expense reimbursement or fee waivers and expense reductions such as brokerage credits, but includes expense repayments and non-reimbursable expenses, if any, such as interest, taxes, and extraordinary expenses. (See Note 1(c) and 2 in the Notes to Financial Statements.) |
40
| | |
| | | AMG GW&K Small Cap Value Fund Financial Highlights For a share outstanding throughout each fiscal year |
| | | | | | | | | | | | | | | | | | | | |
| | | For the fiscal years ended December 31, |
| | | | | |
| Class N | | 2022 | | 2021 | | 2020 | | 2019 | | 2018 |
| | | | | |
Net Asset Value, Beginning of Year | | | $30.90 | | | | $26.71 | | | | $37.16 | | | | $30.93 | | | | $43.98 | |
| | | | | |
Income (loss) from Investment Operations: | | | | | | | | | | | | | | | | | | | | |
| | | | | |
Net investment income (loss)1,2 | | | 0.13 | | | | 0.09 | | | | 0.08 | | | | 0.07 | | | | (0.01 | ) |
| | | | | |
Net realized and unrealized gain (loss) on investments | | | (4.87 | ) | | | 8.41 | | | | 1.00 | | | | 8.79 | | | | (8.40 | ) |
| | | | | |
Total income (loss) from investment operations | | | (4.74 | ) | | | 8.50 | | | | 1.08 | | | | 8.86 | | | | (8.41 | ) |
| | | | | |
Less Distributions to Shareholders from: | | | | | | | | | | | | | | | | | | | | |
| | | | | |
Net investment income | | | (0.15 | ) | | | (0.08 | ) | | | (0.08 | ) | | | (0.09 | ) | | | — | |
| | | | | |
Net realized gain on investments | | | (0.28 | ) | | | (4.23 | ) | | | (11.45 | ) | | | (2.54 | ) | | | (4.64 | ) |
| | | | | |
Total distributions to shareholders | | | (0.43 | ) | | | (4.31 | ) | | | (11.53 | ) | | | (2.63 | ) | | | (4.64 | ) |
| | | | | |
Net Asset Value, End of Year | | | $25.73 | | | | $30.90 | | | | $26.71 | | | | $37.16 | | | | $30.93 | |
| | | | | |
Total Return2,3 | | | (15.33 | )% | | | 32.93 | % | | | 3.29 | % | | | 28.64 | % | | | (19.00 | )% |
| | | | | |
Ratio of net expenses to average net assets | | | 1.13 | %4 | | | 1.13 | %4 | | | 1.17 | % | | | 1.17 | % | | | 1.17 | % |
| | | | | |
Ratio of gross expenses to average net assets5 | | | 1.18 | % | | | 1.17 | % | | | 1.21 | % | | | 1.20 | % | | | 1.18 | % |
| | | | | |
Ratio of net investment income (loss) to average net assets2 | | | 0.47 | % | | | 0.28 | % | | | 0.28 | % | | | 0.19 | % | | | (0.03 | )% |
| | | | | |
Portfolio turnover | | | 19 | % | | | 41 | % | | | 115 | % | | | 20 | % | | | 24 | % |
| | | | | |
Net assets end of year (000’s) omitted | | | $162,011 | | | | $223,586 | | | | $243,655 | | | | $359,550 | | | | $425,540 | |
| | | | | |
| | | | | | | | | | | | | | | | | | | | | |
41
| | |
| | | AMG GW&K Small Cap Value Fund Financial Highlights For a share outstanding throughout each fiscal year |
| | | | | | | | | | | | | | | | | | | | |
| | | For the fiscal years ended December 31, |
| | | | | |
| Class I | | 2022 | | 2021 | | 2020 | | 2019 | | 2018 |
| | | | | |
Net Asset Value, Beginning of Year | | | $30.87 | | | | $26.79 | | | | $37.23 | | | | $31.05 | | | | $44.06 | |
| | | | | |
Income (loss) from Investment Operations: | | | | | | | | | | | | | | | | | | | | |
| | | | | |
Net investment income1,2 | | | 0.18 | | | | 0.15 | | | | 0.14 | | | | 0.13 | | | | 0.06 | |
| | | | | |
Net realized and unrealized gain (loss) on investments | | | (4.87 | ) | | | 8.42 | | | | 1.02 | | | | 8.83 | | | | (8.43 | ) |
| | | | | |
Total income (loss) from investment operations | | | (4.69 | ) | | | 8.57 | | | | 1.16 | | | | 8.96 | | | | (8.37 | ) |
| | | | | |
Less Distributions to Shareholders from: | | | | | | | | | | | | | | | | | | | | |
| | | | | |
Net investment income | | | (0.21 | ) | | | (0.26 | ) | | | (0.15 | ) | | | (0.24 | ) | | | — | |
| | | | | |
Net realized gain on investments | | | (0.28 | ) | | | (4.23 | ) | | | (11.45 | ) | | | (2.54 | ) | | | (4.64 | ) |
| | | | | |
Total distributions to shareholders | | | (0.49 | ) | | | (4.49 | ) | | | (11.60 | ) | | | (2.78 | ) | | | (4.64 | ) |
| | | | | |
Net Asset Value, End of Year | | | $25.69 | | | | $30.87 | | | | $26.79 | | | | $37.23 | | | | $31.05 | |
| | | | | |
Total Return2,3 | | | (15.19 | )% | | | 33.17 | % | | | 3.50 | % | | | 28.86 | % | | | (18.88 | )% |
| | | | | |
Ratio of net expenses to average net assets | | | 0.93 | %4 | | | 0.93 | %4 | | | 0.99 | % | | | 1.01 | % | | | 1.01 | % |
| | | | | |
Ratio of gross expenses to average net assets5 | | | 0.98 | % | | | 0.97 | % | | | 1.03 | % | | | 1.04 | % | | | 1.02 | % |
| | | | | |
Ratio of net investment income to average net assets2 | | | 0.67 | % | | | 0.48 | % | | | 0.46 | % | | | 0.35 | % | | | 0.13 | % |
| | | | | |
Portfolio turnover | | | 19 | % | | | 41 | % | | | 115 | % | | | 20 | % | | | 24 | % |
| | | | | |
Net assets end of year (000’s) omitted | | | $81,319 | | | | $115,837 | | | | $83,003 | | | | $122,323 | | | | $306,757 | |
| | | | | |
| | | | | | | | | | | | | | | | | | | | | |
42
| | |
| | | AMG GW&K Small Cap Value Fund Financial Highlights For a share outstanding throughout each fiscal year |
| | | | | | | | | | | | | | | | | | | | |
| | | For the fiscal years ended December 31, |
| | | | | |
| Class Z | | 2022 | | 2021 | | 2020 | | 2019 | | 2018 |
| | | | | |
Net Asset Value, Beginning of Year | | | $30.76 | | | | $26.72 | | | | $37.16 | | | | $31.10 | | | | $44.08 | |
| | | | | |
Income (loss) from Investment Operations: | | | | | | | | | | | | | | | | | | | | |
| | | | | |
Net investment income1,2 | | | 0.20 | | | | 0.16 | | | | 0.16 | | | | 0.16 | | | | 0.10 | |
| | | | | |
Net realized and unrealized gain (loss) on investments | | | (4.87 | ) | | | 8.41 | | | | 1.02 | | | | 8.84 | | | | (8.44 | ) |
| | | | | |
Total income (loss) from investment operations | | | (4.67 | ) | | | 8.57 | | | | 1.18 | | | | 9.00 | | | | (8.34 | ) |
| | | | | |
Less Distributions to Shareholders from: | | | | | | | | | | | | | | | | | | | | |
| | | | | |
Net investment income | | | (0.22 | ) | | | (0.30 | ) | | | (0.17 | ) | | | (0.40 | ) | | | — | |
| | | | | |
Net realized gain on investments | | | (0.28 | ) | | | (4.23 | ) | | | (11.45 | ) | | | (2.54 | ) | | | (4.64 | ) |
| | | | | |
Total distributions to shareholders | | | (0.50 | ) | | | (4.53 | ) | | | (11.62 | ) | | | (2.94 | ) | | | (4.64 | ) |
| | | | | |
Net Asset Value, End of Year | | | $25.59 | | | | $30.76 | | | | $26.72 | | | | $37.16 | | | | $31.10 | |
| | | | | |
Total Return2,3 | | | (15.16 | )% | | | 33.27 | % | | | 3.57 | % | | | 28.94 | % | | | (18.80 | )% |
| | | | | |
Ratio of net expenses to average net assets | | | 0.88 | %4 | | | 0.88 | %4 | | | 0.92 | % | | | 0.92 | % | | | 0.92 | % |
| | | | | |
Ratio of gross expenses to average net assets5 | | | 0.93 | % | | | 0.92 | % | | | 0.96 | % | | | 0.95 | % | | | 0.93 | % |
| | | | | |
Ratio of net investment income to average net assets2 | | | 0.72 | % | | | 0.53 | % | | | 0.53 | % | | | 0.44 | % | | | 0.22 | % |
| | | | | |
Portfolio turnover | | | 19 | % | | | 41 | % | | | 115 | % | | | 20 | % | | | 24 | % |
| | | | | |
Net assets end of year (000’s) omitted | | | $8,582 | | | | $32,710 | | | | $10,481 | | | | $11,815 | | | | $16,969 | |
| | | | | |
| | | | | | | | | | | | | | | | | | | | | |
| 1 | Per share numbers have been calculated using average shares. |
| 2 | Total returns and net investment income (loss) would have been lower had certain expenses not been offset. |
| 3 | The total return is calculated using the published Net Asset Value as of fiscal year end. |
| 4 | Includes reduction from broker recapture amounting to 0.01% for the fiscal year ended December 31, 2022 and 0.02% for the fiscal year ended December 31, 2021. |
| 5 | Excludes the impact of expense reimbursement or fee waivers and expense reductions such as brokerage credits, but includes expense repayments and non-reimbursable expenses, if any, such as interest, taxes, and extraordinary expenses. (See Note 1(c) and 2 in the Notes to Financial Statements.) |
43
| | |
| | | AMG GW&K Small/Mid Cap Fund Financial Highlights For a share outstanding throughout each fiscal year |
| | | | | | | | | | | | | | | | | | | | |
| | | For the fiscal years ended December 31, |
| | | | | |
| Class N | | 2022 | | 2021 | | 2020 | | 2019 | | 2018 |
| | | | | |
Net Asset Value, Beginning of Year | | | $19.08 | | | | $16.04 | | | | $13.03 | | | | $9.99 | | | | $11.15 | |
| | | | | |
Income (loss) from Investment Operations: | | | | | | | | | | | | | | | | | | | | |
| | | | | |
Net investment income (loss)1,2 | | | 0.01 | | | | (0.06 | ) | | | (0.01 | ) | | | 0.003 | | | | (0.01 | ) |
| | | | | |
Net realized and unrealized gain (loss) on investments | | | (3.47 | ) | | | 4.14 | | | | 3.02 | | | | 3.07 | | | | (0.91 | ) |
| | | | | |
Total income (loss) from investment operations | | | (3.46 | ) | | | 4.08 | | | | 3.01 | | | | 3.07 | | | | (0.92 | ) |
| | | | | |
Less Distributions to Shareholders from: | | | | | | | | | | | | | | | | | | | | |
| | | | | |
Net investment income | | | (0.00 | )4 | | | — | | | | — | | | | (0.01 | ) | | | — | |
| | | | | |
Net realized gain on investments | | | (0.60 | ) | | | (1.04 | ) | | | — | | | | (0.02 | ) | | | (0.24 | ) |
| | | | | |
Total distributions to shareholders | | | (0.60 | ) | | | (1.04 | ) | | | — | | | | (0.03 | ) | | | (0.24 | ) |
| | | | | |
Net Asset Value, End of Year | | | $15.02 | | | | $19.08 | | | | $16.04 | | | | $13.03 | | | | $9.99 | |
| | | | | |
Total Return2,5 | | | (18.15 | )% | | | 25.63 | % | | | 23.10 | % | | | 30.64 | % | | | (8.25 | )% |
| | | | | |
Ratio of net expenses to average net assets6 | | | 1.06 | %7 | | | 1.06 | %7 | | | 1.10 | % | | | 1.09 | % | | | 1.09 | % |
| | | | | |
Ratio of gross expenses to average net assets8 | | | 1.08 | %7 | | | 1.08 | %7 | | | 1.13 | % | | | 1.14 | % | | | 1.16 | % |
| | | | | |
Ratio of net investment income (loss) to average net assets2 | | | 0.04 | % | | | (0.32 | )% | | | (0.07 | )% | | | 0.02 | % | | | (0.09 | )% |
| | | | | |
Portfolio turnover | | | 25 | % | | | 19 | % | | | 29 | % | | | 18 | % | | | 53 | % |
| | | | | |
Net assets end of year (000’s) omitted | | | $51,333 | | | | $70,736 | | | | $224 | | | | $172 | | | | $89 | |
| | | | | |
| | | | | | | | | | | | | | | | | | | | | |
44
| | |
| | | AMG GW&K Small/Mid Cap Fund Financial Highlights For a share outstanding throughout each fiscal year |
| | | | | | | | | | | | | | | | | | | | |
| | | For the fiscal years ended December 31, |
| | | | | |
| Class I | | 2022 | | 2021 | | 2020 | | 2019 | | 2018 |
| | | | | |
Net Asset Value, Beginning of Year | | | $19.15 | | | | $16.06 | | | | $13.04 | | | | $9.99 | | | | $11.15 | |
| | | | | |
Income (loss) from Investment Operations: | | | | | | | | | | | | | | | | | | | | |
| | | | | |
Net investment income (loss)1,2 | | | 0.04 | | | | (0.02 | ) | | | 0.01 | | | | 0.02 | | | | 0.01 | |
| | | | | |
Net realized and unrealized gain (loss) on investments | | | (3.48 | ) | | | 4.15 | | | | 3.03 | | | | 3.07 | | | | (0.92 | ) |
| | | | | |
Total income (loss) from investment operations | | | (3.44 | ) | | | 4.13 | | | | 3.04 | | | | 3.09 | | | | (0.91 | ) |
| | | | | |
Less Distributions to Shareholders from: | | | | | | | | | | | | | | | | | | | | |
| | | | | |
Net investment income | | | (0.04 | ) | | | — | | | | (0.02 | ) | | | (0.02 | ) | | | (0.01 | ) |
| | | | | |
Net realized gain on investments | | | (0.60 | ) | | | (1.04 | ) | | | — | | | | (0.02 | ) | | | (0.24 | ) |
| | | | | |
Total distributions to shareholders | | | (0.64 | ) | | | (1.04 | ) | | | (0.02 | ) | | | (0.04 | ) | | | (0.25 | ) |
| | | | | |
Net Asset Value, End of Year | | | $15.07 | | | | $19.15 | | | | $16.06 | | | | $13.04 | | | | $9.99 | |
| | | | | |
Total Return2,5 | | | (18.01 | )% | | | 25.91 | % | | | 23.31 | % | | | 30.86 | % | | | (8.15 | )% |
| | | | | |
Ratio of net expenses to average net assets6 | | | 0.86 | %7 | | | 0.86 | %7 | | | 0.92 | % | | | 0.94 | % | | | 0.94 | % |
| | | | | |
Ratio of gross expenses to average net assets8 | | | 0.88 | %7 | | | 0.88 | %7 | | | 0.95 | % | | | 0.99 | % | | | 1.01 | % |
| | | | | |
Ratio of net investment income (loss) to average net assets2 | | | 0.24 | % | | | (0.12 | )% | | | 0.11 | % | | | 0.17 | % | | | 0.06 | % |
| | | | | |
Portfolio turnover | | | 25 | % | | | 19 | % | | | 29 | % | | | 18 | % | | | 53 | % |
| | | | | |
Net assets end of year (000’s) omitted | | | $250,024 | | | | $293,614 | | | | $165,840 | | | | $102,784 | | | | $54,376 | |
| | | | | |
| | | | | | | | | | | | | | | | | | | | | |
45
| | |
| | | AMG GW&K Small/Mid Cap Fund Financial Highlights For a share outstanding throughout each fiscal year |
| | | | | | | | | | | | | | | | | | | | |
| | | For the fiscal years ended December 31, |
| | | | | |
| Class Z | | 2022 | | 2021 | | 2020 | | 2019 | | 2018 |
| | | | | |
Net Asset Value, Beginning of Year | | | $19.18 | | | | $16.07 | | | | $13.05 | | | | $10.00 | | | | $11.15 | |
| | | | | |
Income (loss) from Investment Operations: | | | | | | | | | | | | | | | | | | | | |
| | | | | |
Net investment income (loss)1,2 | | | 0.05 | | | | (0.01 | ) | | | 0.02 | | | | 0.03 | | | | 0.02 | |
| | | | | |
Net realized and unrealized gain (loss) on investments | | | (3.48 | ) | | | 4.16 | | | | 3.03 | | | | 3.07 | | | | (0.91 | ) |
| | | | | |
Total income (loss) from investment operations | | | (3.43 | ) | | | 4.15 | | | | 3.05 | | | | 3.10 | | | | (0.89 | ) |
| | | | | |
Less Distributions to Shareholders from: | | | | | | | | | | | | | | | | | | | | |
| | | | | |
Net investment income | | | (0.05 | ) | | | — | | | | (0.03 | ) | | | (0.03 | ) | | | (0.02 | ) |
| | | | | |
Net realized gain on investments | | | (0.60 | ) | | | (1.04 | ) | | | — | | | | (0.02 | ) | | | (0.24 | ) |
| | | | | |
Total distributions to shareholders | | | (0.65 | ) | | | (1.04 | ) | | | (0.03 | ) | | | (0.05 | ) | | | (0.26 | ) |
| | | | | |
Net Asset Value, End of Year | | | $15.10 | | | | $19.18 | | | | $16.07 | | | | $13.05 | | | | $10.00 | |
| | | | | |
Total Return2,5 | | | (17.94 | )% | | | 26.02 | % | | | 23.37 | % | | | 30.94 | % | | | (7.98 | )% |
| | | | | |
Ratio of net expenses to average net assets6 | | | 0.81 | %7 | | | 0.81 | %7 | | | 0.83 | % | | | 0.84 | % | | | 0.84 | % |
| | | | | |
Ratio of gross expenses to average net assets8 | | | 0.83 | %7 | | | 0.83 | %7 | | | 0.86 | % | | | 0.89 | % | | | 0.91 | % |
| | | | | |
Ratio of net investment income (loss) to average net assets2 | | | 0.29 | % | | | (0.07 | )% | | | 0.19 | % | | | 0.27 | % | | | 0.16 | % |
| | | | | |
Portfolio turnover | | | 25 | % | | | 19 | % | | | 29 | % | | | 18 | % | | | 53 | % |
| | | | | |
Net assets end of year (000’s) omitted | | | $262,798 | | | | $198,961 | | | | $104,705 | | | | $95,884 | | | | $65,375 | |
| | | | | |
| | | | | | | | | | | | | | | | | | | | | |
| 1 | Per share numbers have been calculated using average shares. |
| 2 | Total returns and net investment income (loss) would have been lower had certain expenses not been offset. |
| 3 | Less than $0.005 per share. |
| 4 | Less than $(0.005) per share. |
| 5 | The total return is calculated using the published Net Asset Value as of fiscal year end. |
| 6 | Includes reduction from broker recapture amounting to less than 0.01% for the fiscal year ended December 31, 2022 and 0.01% for the fiscal years ended December 31, 2021, 2020, 2019 and 2018. |
| 7 | Such ratio includes recapture of waived/reimbursed fees from prior periods amounting to less than 0.01%. |
| 8 | Excludes the impact of expense reimbursement or fee waivers and expense reductions such as brokerage credits, but includes expense repayments and non-reimbursable expenses, if any, such as interest, taxes, and extraordinary expenses. (See Note 1(c) and 2 in the Notes to Financial Statements.) |
46
| | |
| | | AMG GW&K Global Allocation Fund Financial Highlights For a share outstanding throughout each fiscal year |
| | | | | | | | | | | | | | | | | | | | |
| | | For the fiscal years ended December 31, |
| | | | | |
| Class N | | 2022 | | 2021 | | 2020 | | 2019 | | 2018 |
| | | | | |
Net Asset Value, Beginning of Year | | | $19.50 | | | | $19.50 | | | | $17.04 | | | | $15.45 | | | | $17.03 | |
| | | | | |
Income (loss) from Investment Operations: | | | | | | | | | | | | | | | | | | | | |
| | | | | |
Net investment income (loss)1,2 | | | 0.06 | | | | (0.04 | ) | | | 0.10 | | | | 0.25 | | | | 0.18 | |
| | | | | |
Net realized and unrealized gain (loss) on investments | | | (3.94 | ) | | | 0.51 | | | | 2.93 | | | | 2.35 | | | | (0.67 | ) |
| | | | | |
Total income (loss) from investment operations | | | (3.88 | ) | | | 0.47 | | | | 3.03 | | | | 2.60 | | | | (0.49 | ) |
| | | | | |
Less Distributions to Shareholders from: | | | | | | | | | | | | | | | | | | | | |
| | | | | |
Net investment income | | | (0.02 | ) | | | (0.00 | )3 | | | (0.09 | ) | | | (0.27 | ) | | | (0.16 | ) |
| | | | | |
Net realized gain on investments | | | (1.67 | ) | | | (0.47 | ) | | | (0.48 | ) | | | (0.74 | ) | | | (0.93 | ) |
| | | | | |
Paid in capital | | | — | | | | — | | | | (0.00 | )3 | | | — | | | | — | |
| | | | | |
Total distributions to shareholders | | | (1.69 | ) | | | (0.47 | ) | | | (0.57 | ) | | | (1.01 | ) | | | (1.09 | ) |
| | | | | |
Net Asset Value, End of Year | | | $13.93 | | | | $19.50 | | | | $19.50 | | | | $17.04 | | | | $15.45 | |
| | | | | |
Total Return2,4 | | | (20.04 | )% | | | 2.44 | % | | | 18.92 | % | | | 16.96 | % | | | (2.89 | )% |
| | | | | |
Ratio of net expenses to average net assets | | | 1.07 | %5 | | | 1.06 | % | | | 1.07 | %6 | | | 1.08 | %6 | | | 1.08 | %6 |
| | | | | |
Ratio of gross expenses to average net assets7 | | | 1.23 | %5 | | | 1.10 | % | | | 1.19 | % | | | 1.16 | % | | | 1.15 | % |
| | | | | |
Ratio of net investment income (loss) to average net assets2 | | | 0.38 | % | | | (0.21 | )% | | | 0.60 | % | | | 1.51 | % | | | 1.02 | % |
| | | | | |
Portfolio turnover | | | 36 | % | | | 36 | % | | | 156 | % | | | 123 | % | | | 80 | % |
| | | | | |
Net assets end of year (000’s) omitted | | | $23,430 | | | | $41,939 | | | | $51,415 | | | | $69,774 | | | | $75,271 | |
| | | | | |
| | | | | | | | | | | | | | | | | | | | | |
47
| | |
| | | AMG GW&K Global Allocation Fund Financial Highlights For a share outstanding throughout each fiscal year |
| | | | | | | | | | | | | | | | | | | | |
| | | For the fiscal years ended December 31, |
| | | | | |
| Class I | | 2022 | | 2021 | | 2020 | | 2019 | | 2018 |
| | | | | |
Net Asset Value, Beginning of Year | | | $19.75 | | | | $19.71 | | | | $17.22 | | | | $15.60 | | | | $17.19 | |
| | | | | |
Income (loss) from Investment Operations: | | | | | | | | | | | | | | | | | | | | |
| | | | | |
Net investment income (loss)1,2 | | | 0.09 | | | | (0.01 | ) | | | 0.13 | | | | 0.28 | | | | 0.21 | |
| | | | | |
Net realized and unrealized gain (loss) on investments | | | (4.00 | ) | | | 0.53 | | | | 2.95 | | | | 2.38 | | | | (0.68 | ) |
| | | | | |
Total income (loss) from investment operations | | | (3.91 | ) | | | 0.52 | | | | 3.08 | | | | 2.66 | | | | (0.47 | ) |
| | | | | |
Less Distributions to Shareholders from: | | | | | | | | | | | | | | | | | | | | |
| | | | | |
Net investment income | | | (0.03 | ) | | | (0.01 | ) | | | (0.11 | ) | | | (0.30 | ) | | | (0.19 | ) |
| | | | | |
Net realized gain on investments | | | (1.67 | ) | | | (0.47 | ) | | | (0.48 | ) | | | (0.74 | ) | | | (0.93 | ) |
| | | | | |
Paid in capital | | | — | | | | — | | | | (0.00 | )3 | | | — | | | | — | |
| | | | | |
Total distributions to shareholders | | | (1.70 | ) | | | (0.48 | ) | | | (0.59 | ) | | | (1.04 | ) | | | (1.12 | ) |
| | | | | |
Net Asset Value, End of Year | | | $14.14 | | | | $19.75 | | | | $19.71 | | | | $17.22 | | | | $15.60 | |
| | | | | |
Total Return2,4 | | | (19.91 | )% | | | 2.60 | % | | | 19.08 | % | | | 17.17 | % | | | (2.77 | )% |
| | | | | |
Ratio of net expenses to average net assets | | | 0.91 | %5 | | | 0.91 | % | | | 0.92 | %6 | | | 0.93 | %6 | | | 0.92 | %6 |
| | | | | |
Ratio of gross expenses to average net assets7 | | | 1.07 | %5 | | | 0.95 | % | | | 1.04 | % | | | 1.01 | % | | | 0.99 | % |
| | | | | |
Ratio of net investment income (loss) to average net assets2 | | | 0.54 | % | | | (0.06 | )% | | | 0.75 | % | | | 1.66 | % | | | 1.18 | % |
| | | | | |
Portfolio turnover | | | 36 | % | | | 36 | % | | | 156 | % | | | 123 | % | | | 80 | % |
| | | | | |
Net assets end of year (000’s) omitted | | | $16,074 | | | | $81,515 | | | | $97,869 | | | | $173,575 | | | | $166,554 | |
| | | | | |
| | | | | | | | | | | | | | | | | | | | | |
48
| | |
| | | AMG GW&K Global Allocation Fund Financial Highlights For a share outstanding throughout each fiscal year |
| | | | | | | | | | | | | | | | | | | | |
| | | For the fiscal years ended December 31, |
| | | | | |
| Class Z | | 2022 | | 2021 | | 2020 | | 2019 | | 2018 |
| | | | | |
Net Asset Value, Beginning of Year | | | $19.76 | | | | $19.71 | | | | $17.21 | | | | $15.60 | | | | $17.19 | |
| | | | | |
Income (loss) from Investment Operations: | | | | | | | | | | | | | | | | | | | | |
| | | | | |
Net investment income1,2 | | | 0.10 | | | | 0.01 | | | | 0.14 | | | | 0.30 | | | | 0.22 | |
| | | | | |
Net realized and unrealized gain (loss) on investments | | | (3.99 | ) | | | 0.52 | | | | 2.97 | | | | 2.37 | | | | (0.67 | ) |
| | | | | |
Total income (loss) from investment operations | | | (3.89 | ) | | | 0.53 | | | | 3.11 | | | | 2.67 | | | | (0.45 | ) |
| | | | | |
Less Distributions to Shareholders from: | | | | | | | | | | | | | | | | | | | | |
| | | | | |
Net investment income | | | (0.07 | ) | | | (0.01 | ) | | | (0.13 | ) | | | (0.32 | ) | | | (0.21 | ) |
| | | | | |
Net realized gain on investments | | | (1.67 | ) | | | (0.47 | ) | | | (0.48 | ) | | | (0.74 | ) | | | (0.93 | ) |
| | | | | |
Paid in capital | | | — | | | | — | | | | (0.00 | )3 | | | — | | | | — | |
| | | | | |
Total distributions to shareholders | | | (1.74 | ) | | | (0.48 | ) | | | (0.61 | ) | | | (1.06 | ) | | | (1.14 | ) |
| | | | | |
Net Asset Value, End of Year | | | $14.13 | | | | $19.76 | | | | $19.71 | | | | $17.21 | | | | $15.60 | |
| | | | | |
Total Return2,4 | | | (19.85 | )% | | | 2.73 | % | | | 19.28 | % | | | 17.21 | % | | | (2.68 | )% |
| | | | | |
Ratio of net expenses to average net assets | | | 0.82 | %5 | | | 0.81 | % | | | 0.82 | %6 | | | 0.83 | %6 | | | 0.83 | %6 |
| | | | | |
Ratio of gross expenses to average net assets7 | | | 0.98 | %5 | | | 0.85 | % | | | 0.94 | % | | | 0.91 | % | | | 0.90 | % |
| | | | | |
Ratio of net investment income to average net assets2 | | | 0.63 | % | | | 0.04 | % | | | 0.85 | % | | | 1.76 | % | | | 1.27 | % |
| | | | | |
Portfolio turnover | | | 36 | % | | | 36 | % | | | 156 | % | | | 123 | % | | | 80 | % |
| | | | | |
Net assets end of year (000’s) omitted | | | $1,545 | | | | $3,118 | | | | $3,733 | | | | $8,358 | | | | $8,429 | |
| | | | | |
| | | | | | | | | | | | | | | | | | | | | |
| 1 | Per share numbers have been calculated using average shares. |
| 2 | Total returns and net investment income (loss) would have been lower had certain expenses not been offset. |
| 3 | Less than $(0.005) per share. |
| 4 | The total return is calculated using the published Net Asset Value as of fiscal year end. |
| 5 | Includes interest expense totaling 0.01% related to participation in the interfund lending program. |
| 6 | Includes reduction from broker recapture amounting to less than 0.01% for the fiscal year ended December 31, 2020, 0.01% for the fiscal years ended December 31, 2019 and 2018. |
| 7 | Excludes the impact of expense reimbursement or fee waivers and expense reductions such as brokerage credits, but includes expense repayments and non-reimbursable expenses, if any, such as interest, taxes, and extraordinary expenses. (See Note 1(c) and 2 in the Notes to Financial Statements.) |
49
| | |
| | | Notes to Financial Statements December 31, 2022 |
| | | |
| | | |
1. ORGANIZATION AND SUMMARY OF SIGNIFICANT ACCOUNTING POLICIES
AMG Funds and AMG Funds II (the “Trusts”) are open-end management investment companies, organized as Massachusetts business trusts, and registered under the Investment Company Act of 1940, as amended (the “1940 Act”). Currently, the Trusts consist of a number of different funds, each having distinct investment management objectives, strategies, risks, and policies. Included in this report are AMG Funds: AMG GW&K Small Cap Core Fund (“Small Cap Core”), AMG GW&K Small Cap Value (“Small Cap Value”) and GW&K Small/Mid Cap Fund (“Small/Mid Cap”) and AMG Funds II: AMG GW&K Global Allocation Fund (“Global Allocation”), each a “Fund” and collectively, the “Funds”.
Each Fund offers Class N shares, Class I shares and Class Z shares. Each class represents an interest in the same assets of the respective Fund. Although all share classes generally have identical voting rights, each share class votes separately when required by law. Different share classes may have different net asset values per share to the extent the share classes pay different distribution amounts and/or the expenses of such share classes differ. Each share class has its own expense structure. Please refer to a current prospectus for additional information on each share class.
Market prices of investments held by the Funds may fall rapidly or unpredictably due to a variety of economic or political factors, market conditions, disasters or public health issues, or in response to events that affect particular industries or companies.
The Funds’ financial statements are prepared in accordance with accounting principles generally accepted in the United States of America (“U.S. GAAP”), including accounting and reporting guidance pursuant to Accounting Standards Codification Topic 946 applicable to investment companies. U.S. GAAP requires management to make estimates and assumptions that affect the reported amounts of assets and liabilities and disclosure of contingent assets and liabilities at the date of the financial statements and the reported amounts of income and expenses during the reporting period. Actual results could differ from those estimates and such differences could be material. The following is a summary of significant accounting policies followed by the Funds in the preparation of their financial statements:
a. VALUATION OF INVESTMENTS
For the Funds, equity securities traded on a national securities exchange or reported on the NASDAQ national market system (“NMS”) are valued at the last quoted sales price on the primary exchange or, if applicable, the NASDAQ official closing price or the official closing price of the relevant exchange or, lacking any sales, at the last quoted bid price. Equity securities held by the Funds that are traded in the over-the-counter market (other than NMS securities) are valued at the bid price. Foreign equity securities (securities principally traded in markets other than U.S. markets) held by the Funds are valued at the official closing price on the primary exchange or, for markets that either do not offer an official closing price or where the official closing price may not be representative of the overall market, the last quoted sale price.
Fixed income securities purchased with a remaining maturity exceeding 60 days are valued at the evaluated bid price provided by an authorized pricing service or, if an evaluated price is not available, by reference to other securities which are considered comparable in credit rating, interest rate, due date and other features (generally referred to as “matrix pricing”) or other similar pricing methodologies.
Fixed income securities purchased with a remaining maturity of 60 days or less are valued at amortized cost, provided that the amortized cost value is approximately the same as the fair value of the security valued without the use of amortized cost. Investments in other open-end registered investment companies are valued at their end of day net asset value per share.
The Funds’ portfolio investments are generally valued based on independent market quotations or prices or, if none, “evaluative” or other market based valuations provided by third party pricing services approved by the Boards of Trustees of the Trusts (the “Boards”). Under certain circumstances, the value of certain Fund portfolio investments may be based on an evaluation of fair value, pursuant to procedures established by and under the general supervision of the Boards. The Valuation Committee, which is comprised of the Independent Trustees of the Boards, and the Pricing Committee, which is comprised of representatives from AMG Funds LLC (the “Investment Manager”) are the committees appointed by the Boards to make fair value determinations. Each Fund may use the fair value of a portfolio investment to calculate its net asset value (“NAV”) in the event that the market quotation, price or market based valuation for the portfolio investment is not readily available or otherwise not determinable pursuant to the Boards’ valuation procedures, if the Investment Manager or the Pricing Committee believes the quotation, price or market based valuation to be unreliable, or in certain other circumstances. When determining the fair value of an investment, the Pricing Committee and, if required under the Trusts’ securities valuation procedures, the Valuation Committee, seeks to determine the price that a Fund might reasonably expect to receive from current sale of that portfolio investment in an arms-length transaction. Fair value determinations shall be based upon consideration of all available facts and information, including, but not limited to (i) attributes specific to the investment; (ii) fundamental and analytical data relating to the investment; and (iii) the value of other comparable securities or relevant financial instruments, including derivative securities, traded on other markets or among dealers.
The values assigned to fair value portfolio investments are based on available information and do not necessarily represent amounts that might ultimately be realized in the future, since such amounts depend on future developments inherent in long-term investments. Because of the inherent uncertainty of valuation, those estimated values may differ significantly from the values that would have been used had a ready market for the investments existed, and the differences could be material. The Boards will be presented with a quarterly report showing as of the most recent quarter end, all outstanding securities fair valued by the Funds, including a comparison with the prior quarter end and the percentage of the Funds that the security represents at each quarter end.
With respect to foreign equity securities and certain foreign fixed income securities, the Boards have adopted a policy that securities held in the Funds that can be fair valued by the applicable fair value pricing service are fair valued on each business day provided that each individual price exceeds a pre-established confidence level.
Effective September 8, 2022, the Funds adopted the requirements of Rule 2a-5 under the 1940 Act (“Rule 2a-5”), which the Funds’ Board designated the Funds’ Investment Manager as the Funds’ Valuation Designee to perform the Funds’ fair value determinations. Such determinations are subject to Board oversight and certain reporting and other requirements intended to ensure that the Board receives the information it needs to oversee the Investment Manager’s fair value determinations. Other than the designation of the Investment Manager as the Valuation Designee, the Funds’ adoption of Rule 2-a5 did not impact how the Funds determine fair value or the carrying amount of investments held in the Funds.
50
| | |
| | | Notes to Financial Statements (continued) |
| | | |
| | | |
U.S. GAAP defines fair value as the price that a fund would receive to sell an asset or pay to transfer a liability in an orderly transaction between market participants at the measurement date. U.S. GAAP also establishes a framework for measuring fair value, and a three level hierarchy for fair value measurements based upon the transparency of inputs to the valuation of an asset or liability. Inputs may be observable or unobservable and refer broadly to the assumptions that market participants would use in pricing the asset or liability. Observable inputs reflect the assumptions market participants would use in pricing the asset or liability based on market data obtained from sources independent of the Funds.
Unobservable inputs reflect the Funds’ own assumptions about the assumptions that market participants would use in pricing the asset or liability developed based on the best information available in the circumstances. Each investment is assigned a level based upon the observability of the inputs which are significant to the overall valuation.
The three-tier hierarchy of inputs is summarized below:
Level 1 – inputs are quoted prices in active markets for identical investments (e.g., equity securities, open-end investment companies)
Level 2 – other observable inputs (including, but not limited to: quoted prices for similar assets or liabilities in markets that are active, quoted prices for identical or similar assets or liabilities in markets that are not active, inputs other than quoted prices that are observable for the assets or liabilities (such as interest rates, yield curves, volatilities, prepayment speeds, loss severities, credit risks and default rates) or other market corroborated inputs) (e.g., debt securities, government securities, foreign currency exchange contracts, foreign securities utilizing international fair value pricing, fair valued securities with observable inputs)
Level 3 – inputs are significant unobservable inputs (including the Fund’s own assumptions used to determine the fair value of investments) (e.g., fair valued securities with unobservable inputs)
Changes in inputs or methodologies used for valuing investments may result in a transfer in or out of levels within the fair value hierarchy. The inputs or methodologies used for valuing investments may not necessarily be an indication of the risk associated with investing in those investments.
b. SECURITY TRANSACTIONS
Security transactions are accounted for as of trade date. Realized gains and losses on securities sold are determined on the basis of identified cost.
c. INVESTMENT INCOME AND EXPENSES
Dividend income is recorded on the ex-dividend date. Dividends from foreign securities are recorded on the ex-dividend date, and if after the fact, as soon as the Funds become aware of the ex-dividend date. Interest income, which includes amortization of premium and accretion of discount on debt securities, is accrued as earned. Dividend and interest income on foreign securities is recorded gross of any withholding tax. Non-cash dividends included in dividend income, if any, are reported at the fair market value of the securities received. Upon notification from the issuer, distributions received from a real estate investment trust (REIT) may be redesignated as a reduction of cost of investments and/or realized gain. Other income and expenses are recorded on an accrual basis. Expenses that cannot be directly attributed to a Fund are apportioned among the funds in the Trusts and other trusts or funds within the AMG Funds Family of Funds (collectively the “AMG Funds Family”) based upon their relative average net assets or number of shareholders. Investment income, realized and unrealized capital gains and losses, the common expenses of each Fund, and certain fund level expense reductions, if any, are allocated on a pro-rata basis to each class based on the relative net assets of each class to the total net assets of each Fund.
Small Cap Core, Small Cap Value and Small/Mid Cap had certain portfolio trades directed to various brokers under a brokerage recapture program. Credits received from the brokerage recapture program are earned and paid on a monthly basis, and are recorded as expense offsets, which serve to reduce the Fund’s overall expense ratio. For the fiscal year ended December 31, 2022, the impact on the expenses and expense ratios were as follows: Small Cap Core $54,366 or 0.01%, Small Cap Value $40,501 or 0.01% and Small/Mid Cap $23,627 or less than 0.01%.
d. DIVIDENDS AND DISTRIBUTIONS
Fund distributions resulting from either net investment income or realized net capital gains, if any, will normally be declared and paid at least annually in December. Distributions to shareholders are recorded on the ex-dividend date. Distributions are determined in accordance with federal income tax regulations, which may differ from net investment income and net realized capital gains for financial statement purposes (U.S. GAAP). Differences may be permanent or temporary. Permanent differences are reclassified among capital accounts in the financial statements to reflect their tax character. Permanent book and tax basis differences, if any, relating to shareholder distributions will result in reclassifications to paid-in capital. Temporary differences arise when certain items of income, expense and gain or loss are recognized in different periods for financial statement and tax purposes; these differences will reverse at some time in the future. Permanent differences are primarily due to equalization utilized for Small/Mid Cap and Global Allocation. There were no permanent differences during the year for Small Cap Core or Small Cap Value. Temporary differences are primarily due to qualified late-year capital loss deferrals for Small/Mid Cap. In addition, temporary differences for each Fund are wash sale loss deferrals.
51
| | |
| | | Notes to Financial Statements (continued) |
| | | |
| | | |
The tax character of distributions paid during the fiscal years ended December 31, 2022 and December 31, 2021 were as follows:
| | | | | | | | | | | | | | | | |
| | |
| | | Small Cap Core | | | Small Cap Value | |
| | | | |
Distributions paid from: | | | 2022 | | | | 2021 | | | | 2022 | | | | 2021 | |
| | | | |
Ordinary income * | | | $983,753 | | | | $12,026,639 | | | | $2,858,422 | | | | $29,494,137 | |
| | | | |
Long-term capital gains | | | 4,843,070 | | | | 51,428,621 | | | | 1,531,983 | | | | 12,376,707 | |
| | | | | | | | | | | | | | | | |
| | | | |
| | | $5,826,823 | | | | $63,455,260 | | | | $4,390,405 | | | | $41,870,844 | |
| | | | | | | | | | | | | | | | |
| | | | | | | | | | | | | | | | |
| | |
| | | Small/Mid Cap | | | Global Allocation | |
| | | | |
Distributions paid from: | | | 2022 | | | | 2021 | | | | 2022 | | | | 2021 | |
| | | | |
Ordinary income * | | | $3,063,625 | | | | $2,786,628 | | | | $70,230 | | | | — | |
| | | | |
Long-term capital gains | | | 19,983,026 | | | | 25,665,308 | | | | 4,574,201 | | | | $3,299,400 | |
| | | | | | | | | | | | | | | | |
| | | | |
| | | $23,046,651 | | | | $28,451,936 | | | | $4,644,431 | | | | $3,299,400 | |
| | | | | | | | | | | | | | | | |
| * | For tax purposes, short-term capital gain distributions, if any, are considered ordinary income distributions. |
As of December 31, 2022, the components of distributable earnings (excluding unrealized appreciation/depreciation) on a tax basis consisted of:
| | | | | | | | | | | | | | | | |
| | | | |
| | | Small Cap Core | | | Small Cap Value | | | Small/Mid Cap | | | Global Allocation | |
| | | | |
Undistributed ordinary income | | | $56,600 | | | | — | | | | — | | | | $23,344 | |
| | | | |
Undistributed long-term capital gains | | | 3,646,467 | | | | $2,195,731 | | | | — | | | | 402,378 | |
| | | | |
Late-year capital loss deferral | | | — | | | | — | | | | $2,964,125 | | | | — | |
At December 31, 2022, the cost of investments and the aggregate gross unrealized appreciation and depreciation for federal income tax purposes were as follows:
| | | | | | | | | | | | | | | | |
| | | | |
| Fund | | Cost | | | Appreciation | | | Depreciation | | | Net Appreciation | |
| | | | |
Small Cap Core | | | $551,443,399 | | | | $148,476,219 | | | | $(37,886,976) | | | | $110,589,243 | |
| | | | |
Small Cap Value | | | 236,374,822 | | | | 37,883,126 | | | | (14,745,138 | ) | | | 23,137,988 | |
| | | | |
Small/Mid Cap | | | 547,803,596 | | | | 68,609,033 | | | | (45,605,266) | | | | 23,003,767 | |
| | | | |
Global Allocation | | | 37,711,760 | | | | 6,312,411 | | | | (2,201,342 | ) | | | 4,111,069 | |
e. FEDERAL TAXES
Each Fund currently qualifies as an investment company and intends to comply with the requirements under Subchapter M of the Internal Revenue Code of 1986, as amended, and to distribute substantially all of its taxable income and gains to its shareholders and to meet certain diversification and income requirements with respect to investment companies. Therefore, no provision for federal income or excise tax is included in the accompanying financial statements.
Additionally, based on each Fund’s understanding of the tax rules and rates related to income, gains and transactions for the foreign jurisdictions in which it invests, each Fund will provide for foreign taxes, and where appropriate, deferred foreign taxes.
Management has analyzed the Funds’ tax positions taken on federal income tax returns as of December 31, 2022, and for all open tax years (generally, the three
prior taxable years), and has concluded that no provision for federal income tax is required in the Funds’ financial statements. Additionally, Management is not aware of any tax position for which it is reasonably possible that the total amounts of unrecognized tax benefits will change materially in the next twelve months.
f. CAPITAL LOSS CARRYOVERS AND DEFERRALS
As of December 31, 2022, the Funds had no capital loss carryovers for federal income tax purposes. Should the Funds incur net capital losses for the fiscal year ended December 31, 2023, such amounts may be used to offset future realized capital gains indefinitely, and retain their character as short-term and/or long-term.
g. CAPITAL STOCK
The Trusts’ Declaration of Trust authorizes for each Fund the issuance of an unlimited number of shares of beneficial interest, without par value. Each Fund records sales and repurchases of its capital stock on the trade date.
52
| | |
| | | Notes to Financial Statements (continued) |
| | | |
| | | |
For the fiscal years ended December 31, 2022 and December 31, 2021, the capital stock transactions by class for the Funds were as follows:
| | | | | | | | | | | | | | | | | | | | | | | | | | | | | | | | |
| | | Small Cap Core | | | Small Cap Value | |
| | | | |
| | | December 31, 2022 | | | December 31, 2021 | | | December 31, 2022 | | | December 31, 2021 | |
| | | Shares | | | Amount | | | Shares | | | Amount | | | Shares | | | Amount | | | Shares | | | Amount | |
| | | | | | | | |
Class N: | | | | | | | | | | | | | | | | | | | | | | | | | | | | | | | | |
| | | | | | | | |
Shares sold | | | 37,881 | | | | $1,067,824 | | | | 84,169 | | | | $2,934,323 | | | | 328,009 | | | | $9,251,175 | | | | 646,059 | | | | $20,089,418 | |
| | | | | | | | |
Shares issued in reinvestment of distributions | | | 2,347 | | | | 64,594 | | | | 29,602 | | | | 949,062 | | | | 103,980 | | | | 2,676,448 | | | | 964,248 | | | | 28,375,377 | |
| | | | | | | | |
Proceeds from sale of shares issued in connection with merger1 | | | — | | | | — | | | | — | | | | — | | | | — | | | | — | | | | 186,108 | | | | 5,493,756 | |
| | | | | | | | |
Shares redeemed | | | (69,611 | ) | | | (2,001,608 | ) | | | (62,485 | ) | | | (2,150,775 | ) | | | (1,369,396 | ) | | | (38,000,949 | ) | | | (3,681,845 | ) | | | (115,582,183 | ) |
| | | | | | | | | | | | | | | | | | | | | | | | | | | | | | | | |
| | | | | | | | |
Net increase (decrease) | | | (29,383 | ) | | | $(869,190 | ) | | | 51,286 | | | | $1,732,610 | | | | (937,407 | ) | | | $(26,073,326 | ) | | | (1,885,430 | ) | | | $(61,623,632 | ) |
| | | | | | | | | | | | | | | | | | | | | | | | | | | | | | | | |
| | | | | | | | |
Class I: | | | | | | | | | | | | | | | | | | | | | | | | | | | | | | | | |
| | | | | | | | |
Shares sold | | | 4,099,105 | | | | $120,153,569 | | | | 2,645,735 | | | | $91,738,088 | | | | 175,101 | | | | $4,827,765 | | | | 341,959 | | | | $10,607,900 | |
| | | | | | | | |
Shares issued in reinvestment of distributions | | | 120,360 | | | | 3,408,606 | | | | 1,277,694 | | | | 42,061,693 | | | | 58,116 | | | | 1,494,168 | | | | 396,269 | | | | 11,704,153 | |
| | | | | | | | |
Proceeds from sale of shares issued in connection with merger1 | | | — | | | | — | | | | — | | | | — | | | | — | | | | — | | | | 1,824,176 | | | | 53,997,408 | |
| | | | | | | | |
Shares redeemed | | | (4,942,007 | ) | | | (145,337,666 | ) | | | (3,234,127 | ) | | | (111,529,391 | ) | | | (820,535 | ) | | | (22,214,607 | ) | | | (1,908,490 | ) | | | (57,882,036 | ) |
| | | | | | | | | | | | | | | | | | | | | | | | | | | | | | | | |
| | | | | | | | |
Net increase (decrease) | | | (722,542 | ) | | | $(21,775,491 | ) | | | 689,302 | | | | $22,270,390 | | | | (587,318 | ) | | | $(15,892,674 | ) | | | 653,914 | | | | $18,427,425 | |
| | | | | | | | | | | | | | | | | | | | | | | | | | | | | | | | |
| | | | | | | | |
Class Z: | | | | | | | | | | | | | | | | | | | | | | | | | | | | | | | | |
| | | | | | | | |
Shares sold | | | 3,687,440 | | | | $109,560,529 | | | | 3,719,320 | | | | $134,331,474 | | | | 234,844 | | | | $6,285,035 | | | | 139,820 | | | | $4,232,314 | |
| | | | | | | | |
Shares issued in reinvestment of distributions | | | 67,660 | | | | 1,917,493 | | | | 441,716 | | | | 14,554,549 | | | | 6,435 | | | | 164,728 | | | | 42,709 | | | | 1,267,237 | |
| | | | | | | | |
Proceeds from sale of shares issued in connection with merger1 | | | — | | | | — | | | | — | | | | — | | | | — | | | | — | | | | 914,333 | | | | 26,987,694 | |
| | | | | | | | |
Shares redeemed | | | (1,877,449 | ) | | | (53,901,958 | ) | | | (2,402,803 | ) | | | (85,326,627 | ) | | | (969,451 | ) | | | (26,303,099 | ) | | | (425,526 | ) | | | (12,864,550 | ) |
| | | | | | | | | | | | | | | | | | | | | | | | | | | | | | | | |
| | | | | | | | |
Net increase (decrease) | | | 1,877,651 | | | | $57,576,064 | | | | 1,758,233 | | | | $63,559,396 | | | | (728,172 | ) | | | $(19,853,336 | ) | | | 671,336 | | | | $19,622,695 | |
| | | | | | | | | | | | | | | | | | | | | | | | | | | | | | | | |
| | | | | | | | | | | | | | | | | | | | | | | | | | | | | | | | |
| | | Small/Mid Cap | | | Global Allocation | |
| | | | |
| | | December 31, 2022 | | | December 31, 2021 | | | December 31, 2022 | | | December 31, 2021 | |
| | | Shares | | | Amount | | | Shares | | | Amount | | | Shares | | | Amount | | | Shares | | | Amount | |
| | | | | | | | |
Class N: | | | | | | | | | | | | | | | | | | | | | | | | | | | | | | | | |
| | | | | | | | |
Shares sold | | | 79,691 | | | | $1,266,688 | | | | 77,253 | | | | $1,461,251 | | | | 185,281 | | | | $2,987,760 | | | | 294,575 | | | | $5,879,209 | |
| | | | | | | | |
Shares issued in reinvestment of distributions | | | 125,984 | | | | 1,906,132 | | | | 188,828 | | | | 3,512,206 | | | | 168,475 | | | | 2,382,240 | | | | 47,121 | | | | 910,836 | |
| | | | | | | | |
Proceeds from sale of shares issued in connection with merger1 | | | — | | | | — | | | | 3,848,331 | | | | 66,278,653 | | | | — | | | | — | | | | — | | | | — | |
| | | | | | | | |
Shares redeemed | | | (495,033 | ) | | | (7,984,813 | ) | | | (421,926 | ) | | | (7,905,351 | ) | | | (822,318 | ) | | | (13,591,753 | ) | | | (828,499 | ) | | | (16,567,833 | ) |
| | | | | | | | | | | | | | | | | | | | | | | | | | | | | | | | |
| | | | | | | | |
Net increase (decrease) | | | (289,358 | ) | | | $(4,811,993 | ) | | | 3,692,486 | | | | $63,346,759 | | | | (468,562 | ) | | | $(8,221,753 | ) | | | (486,803 | ) | | | $(9,777,788 | ) |
| | | | | | | | | | | | | | | | | | | | | | | | | | | | | | | | |
53
| | |
| | | Notes to Financial Statements (continued) |
| | | |
| | | |
| | | | | | | | | | | | | | | | | | | | | | | | | | | | | | | | |
| | | Small/Mid Cap | | | Global Allocation | |
| | | | |
| | | December 31, 2022 | | | December 31, 2021 | | | December 31, 2022 | | | December 31, 2021 | |
| | | Shares | | | Amount | | | Shares | | | Amount | | | Shares | | | Amount | | | Shares | | | Amount | |
| | | | | | | | |
Class I: | | | | | | | | | | | | | | | | | | | | | | | | | | | | | | | | |
| | | | | | | | |
Shares sold | | | 5,005,682 | | | | $81,783,320 | | | | 4,826,923 | | | | $88,859,351 | | | | 101,204 | | | | $1,688,772 | | | | 551,511 | | | | $11,042,654 | |
| | | | | | | | |
Shares issued in reinvestment of distributions | | | 638,185 | | | | 9,687,652 | | | | 738,929 | | | | 13,795,804 | | | | 111,655 | | | | 1,601,140 | | | | 31,565 | | | | 617,691 | |
| | | | | | | | |
Proceeds from sale of shares issued in connection with merger1 | | | — | | | | — | | | | 792,895 | | | | 13,678,626 | | | | — | | | | — | | | | — | | | | — | |
| | | | | | | | |
Shares redeemed | | | (4,388,574 | ) | | | (68,857,138 | ) | | | (1,355,973 | ) | | | (25,571,871 | ) | | | (3,204,309 | ) | | | (50,332,935 | ) | | | (1,420,191 | ) | | | (28,442,920 | ) |
| | | | | | | | | | | | | | | | | | | | | | | | | | | | | | | | |
| | | | | | | | |
Net increase (decrease) | | | 1,255,293 | | | | $22,613,834 | | | | 5,002,774 | | | | $90,761,910 | | | | (2,991,450 | ) | | | $(47,043,023 | ) | | | (837,115 | ) | | | $(16,782,575 | ) |
| | | | | | | | | | | | | | | | | | | | | | | | | | | | | | | | |
| | | | | | | | |
Class Z: | | | | | | | | | | | | | | | | | | | | | | | | | | | | | | | | |
| | | | | | | | |
Shares sold | | | 8,639,083 | | | | $147,447,070 | | | | 3,681,463 | | | | $68,683,820 | | | | 8,240 | | | | $131,446 | | | | 11,662 | | | | $233,192 | |
| | | | | | | | |
Shares issued in reinvestment of distributions | | | 666,057 | | | | 10,124,070 | | | | 516,351 | | | | 9,655,772 | | | | 13,576 | | | | 194,542 | | | | 3,937 | | | | 77,077 | |
| | | | | | | | |
Proceeds from sale of shares issued in connection with merger1 | | | — | | | | — | | | | 780,901 | | | | 13,486,545 | | | | — | | | | — | | | | — | | | | — | |
| | | | | | | | |
Shares redeemed | | | (2,272,861 | ) | | | (37,145,444 | ) | | | (1,120,356 | ) | | | (20,615,163 | ) | | | (70,316 | ) | | | (1,093,892 | ) | | | (47,183 | ) | | | (954,939 | ) |
| | | | | | | | | | | | | | | | | | | | | | | | | | | | | | | | |
| | | | | | | | |
Net increase (decrease) | | | 7,032,279 | | | | $120,425,696 | | | | 3,858,359 | | | | $71,210,974 | | | | (48,500 | ) | | | $(767,904 | ) | | | (31,584 | ) | | | $(644,670 | ) |
| | | | | | | | | | | | | | | | | | | | | | | | | | | | | | | | |
| 1 | See Note 8 of the Notes to Financial Statements. |
At December 31, 2022, certain unaffiliated shareholders of record, individually or collectively held greater than 5% of the net assets of the Funds as follows: Small/Mid Cap - one owns 10%. Transactions by this shareholder may have a material impact on the Fund.
h. REPURCHASE AGREEMENTS AND JOINT REPURCHASE AGREEMENTS
The Funds may enter into third-party and bilateral repurchase agreements for temporary cash management purposes and third-party or bilateral joint repurchase agreements for reinvestment of cash collateral on securities lending transactions under the securities lending program offered by The Bank of New York Mellon (“BNYM”) (the “Program”) (collectively, “Repurchase Agreements”). The value of the underlying collateral, including accrued interest, must equal or exceed the value of the Repurchase Agreements during the term of the agreement. For joint repurchase agreements, the Funds participate on a pro rata basis with other clients of BNYM in its share of the underlying collateral under such joint repurchase agreements and in its share of proceeds from any repurchase or other disposition of the underlying collateral. The underlying collateral for all Repurchase Agreements is held in safekeeping by the Funds’ custodian or at the Federal Reserve Bank. If the seller defaults and the value of the collateral declines, or if bankruptcy proceedings commence with respect to the seller of the security, realization of the collateral by the Funds may be delayed or limited. Pursuant to the Program, the Funds are indemnified for such losses by BNYM on joint repurchase agreements.
At December 31, 2022, the market value of Repurchase Agreements outstanding for Small Cap Core, Small Cap Value, Small/Mid Cap and Global Allocation were $13,146,782, $11,006,852, $12,308,542 and $1,786,038, respectively.
i. FOREIGN CURRENCY TRANSLATION
The books and records of the Funds are maintained in U.S. Dollars. The value of investments, assets and liabilities denominated in currencies other than
U.S. Dollars are translated into U.S. Dollars based upon current foreign exchange rates. Purchases and sales of foreign investments, income and expenses are converted into U.S. Dollars based on currency exchange rates prevailing on the respective dates of such transactions. Net realized and unrealized gain (loss) on foreign currency transactions represent: (1) foreign exchange gains and losses from the sale and holdings of foreign currencies; (2) gains and losses between trade date and settlement date on investment securities transactions and foreign currency exchange contracts; and (3) gains and losses from the difference between amounts of interest and dividends recorded and the amounts actually received.
The Funds do not isolate the net realized and unrealized gain or loss resulting from changes in exchange rates from the fluctuations in market prices of securities held. Such fluctuations are included with the net realized and unrealized gain or loss on investments.
j. SECURITIES TRANSACTED ON A WHEN ISSUED BASIS
Global Allocation may enter into To-Be-Announced (“TBA”) sale commitments to hedge their portfolio positions or to sell mortgage-backed securities they own under delayed delivery arrangements. Proceeds of TBA sale commitments are not received until the contractual settlement date. During the time a TBA sale commitment is outstanding, equivalent deliverable securities, with the same counterparty, or an offsetting TBA purchase commitment deliverable on or before the sale commitment date, are held as “cover” for the transaction. Unsettled TBA sale commitments are valued at the current market value of the underlying securities according to the procedures described under “Valuation of Investments,” in Footnote 1a above.
54
| | |
| | | Notes to Financial Statements (continued) |
| | | |
| | | |
Each TBA contract is marked-to-market daily and the change in market value is recorded by the Fund as an unrealized gain or loss. If the TBA sale commitment is closed through the acquisition of an offsetting purchase commitment with the same broker, the Fund realizes a gain or loss. If the Fund delivers securities under the commitment, the Fund realizes a gain or a loss from the sale of the securities based upon the unit price established at the date the commitment was entered into.
During the fiscal year ended December 31, 2022, Global Allocation did not invest in TBA commitment transactions.
k. DELAYED DELIVERY TRANSACTIONS AND WHEN-ISSUED SECURITIES
Global Allocation may enter into securities transactions on a delayed delivery or when issued basis. Payment and delivery may take place after the customary settlement period for that security. The price of the underlying securities and the date when the securities will be delivered and paid for are fixed at the time the transaction is negotiated. During the time a delayed delivery sell is outstanding, the contract is marked to market daily and equivalent deliverable securities are held for the transaction. The value of the securities purchased on a delayed delivery or when-issued basis are identified as such in each Fund’s Schedule of Portfolio Investments. With respect to purchase commitments, the Fund identifies securities as segregated in its records with a value at least equal to the amount of the commitment. Delayed delivery or when-issued securities that have been purchased from and sold to different brokers are reflected as an investment in securities and a forward sale commitment in the Fund’s Statement of Assets and Liabilities. For financial reporting purposes, the Fund does offset the receivable and payable for delayed delivery investments purchased and sold on TBA commitments. Losses may arise due to changes in the value of the underlying securities or if the counterparty does not perform under the contract, or if the issuer does not issue the securities due to political, economic, or other factors.
During the fiscal year ended December 31, 2022 Global Allocation did not enter into securities transactions on a delayed delivery or when issued basis.
2. AGREEMENTS AND TRANSACTIONS WITH AFFILIATES
For each of the Funds, the Trusts have entered into an investment advisory agreement under which the Investment Manager, a subsidiary and the U.S. retail distribution arm of Affiliated Managers Group, Inc. (“AMG”), serves as investment manager to the Funds and is responsible for the Funds’ overall administration and operations. The Investment Manager selects one or more subadvisers for the Funds (subject to Board approval) and monitors each subadviser’s investment performance, security holdings and investment strategies. Each Fund’s investment portfolio is managed by GW&K Investment Management, LLC, (“GW&K”) who serves pursuant to a subadvisory agreement with the Investment Manager. AMG indirectly owns a majority interest in GW&K.
Investment management fees are paid directly by the Funds to the Investment Manager based on average daily net assets. For the fiscal year ended December 31, 2022, the Funds’ investment management fees were paid at the following annual rates of each Fund’s respective average daily net assets:
| | |
| |
Small Cap Core | | 0.70% |
| |
Small Cap Value | | 0.70% |
| |
Small/Mid Cap | | 0.62% |
| |
Global Allocation | | 0.60% |
The fee paid to GW&K for its services as subadviser is paid out of the fee the Investment Manager receives from each Fund and does not increase the expenses of each Fund.
The Investment Manager has contractually agreed, through at least May 1, 2023, to waive management fees and/or pay or reimburse fund expenses in order to limit total annual Fund operating expenses after fee waiver and expense reimbursements (exclusive of taxes, interest (including interest incurred in connection with bank and custody overdrafts, and in connection with securities sold short), shareholder servicing fees, distribution and service (12b-1) fees, brokerage commissions and other transaction costs, dividends payable with respect to securities sold short, acquired fund fees and expenses and extraordinary expenses) of Small Cap Core, Small Cap Value, Small/Mid Cap and Global Allocation to the annual rate of 0.90%, 0.90%, 0.82% and 0.81%, respectively, of each Fund’s average daily net assets (this annual rate or such other annual rate that may be in effect from time to time, the “Expense Cap”), subject to later reimbursement by the Funds in certain circumstances.
In general, for a period of up to 36 months after the date any amounts are paid, waived or reimbursed by the Investment Manager, the Investment Manager may recover such amounts from a Fund, provided that such repayment would not cause the Fund’s total annual operating expenses after fee waiver and expense reimbursements (exclusive of the items noted in the parenthetical above) to exceed either (i) the Expense Cap in effect at the time such amounts were paid, waived or reimbursed, or (ii) the Expense Cap in effect at the time of such repayment by the Fund.
The contractual expense limitation may only be terminated in the event the Investment Manager or a successor ceases to be the investment manager of a Fund or a successor fund, by mutual agreement between the Investment Manager and the Board, or in the event of a Fund’s liquidation unless the Fund is reorganized or is a party to a merger in which the surviving entity is successor to the accounting and performance information of a Fund.
At December 31, 2022, the Funds’ expiration of reimbursements subject to recoupment is as follows:
| | | | | | | | | | | | | | | | |
Expiration Period | | Small Cap Core | | | Small Cap Value | | | Small/Mid Cap | | | Global Allocation | |
| | | | |
Less than 1 year | | | — | | | | $144,468 | | | | $48,533 | | | | $203,900 | |
| | | | |
1-2 years | | | $1,488 | | | | 52,722 | | | | 42,690 | | | | 63,131 | |
| | | | |
2-3 years | | | 12,500 | | | | 93,363 | | | | 39,766 | | | | 116,229 | |
| | | | | | | | | | | | | | | | |
| | | | |
Total | | | $13,988 | | | | $290,553 | | | | $130,989 | | | | $383,260 | |
| | | | | | | | | | | | | | | | |
The Trusts, on behalf of the Funds, have entered into an amended and restated Administration Agreement under which the Investment Manager serves as the Funds’ administrator (the “Administrator”) and is responsible for all non-portfolio
55
| | |
| | | Notes to Financial Statements (continued) |
| | | |
| | | |
management aspects of managing the Funds’ operations, including administration and shareholder services to each Fund. Each Fund pays a fee to the Administrator at the rate of 0.15% per annum of the Fund’s average daily net assets for this service.
The Funds are distributed by AMG Distributors, Inc. (the “Distributor”), a wholly-owned subsidiary of the Investment Manager. The Distributor serves as the distributor and underwriter for each Fund and is a registered broker-dealer and member of the Financial Industry Regulatory Authority, Inc. (“FINRA”). Shares of each Fund will be continuously offered and will be sold directly to prospective purchasers and through brokers, dealers or other financial intermediaries who have executed selling agreements with the Distributor. Generally the Distributor bears all or a portion of the expenses of providing services pursuant to the distribution agreement, including the payment of the expenses relating to the distribution of prospectuses for sales purposes and any advertising or sales literature.
The Trusts have adopted a distribution and service plan (the “Plan”) with respect to the Class N shares of each Fund, in accordance with the requirements of Rule 12b-1 under the 1940 Act and the requirements of the applicable rules of FINRA regarding asset-based sales charges. Pursuant to the Plan, each Fund, except Small Cap Value, may make payments to the Distributor for its expenditures in financing any activity primarily intended to result in the sale of each Fund’s Class N shares and for maintenance and personal service provided to existing shareholders of that class. The Plan authorized payments to the Distributor up to 0.25% annually of each Fund’s, except Small Cap Value, average daily net assets attributable to the Class N shares. The portion of payments made under the plan by Class N shares of each Fund, except Small Cap Value, for shareholder servicing may not exceed an annual rate of 0.25% of the average daily net asset value of each Fund’s shares of that class owned by clients of such broker, dealer or financial intermediary.
For each of Class N and Class I shares of Small Cap Core and Small Cap Value, and for Small/Mid Cap and Global Allocation’s Class I shares, the Boards have approved reimbursement payments to the Investment Manager for shareholder servicing expenses (“shareholder servicing fees”) incurred. Shareholder servicing fees include payments to financial intermediaries, such as broker-dealers (including fund supermarket platforms), banks, and trust companies who provide shareholder recordkeeping, account servicing and other services. The Class N and Class I shares may reimburse the Investment Manager for the actual amount incurred up to a maximum annual rate of each Class’s average daily net assets as shown in the table below.
The impact on the annualized expense ratios for the fiscal year ended December 31, 2022, were as follows:
| | | | | | |
| | | Maximum Annual | | | Actual |
| | | Amount | | | Amount |
| Fund | | Approved | | | Incurred |
| | |
Small Cap Core | | | | | | |
| | |
Class N | | | 0.15% | | | 0.15% |
| | |
Class I | | | 0.05% | | | 0.05% |
| | |
Small Cap Value | | | | | | |
| | |
Class N | | | 0.25% | | | 0.25% |
| | |
Class I | | | 0.05% | | | 0.05% |
| | | | | | |
| | | Maximum Annual | | | Actual |
| | | Amount | | | Amount |
| Fund | | Approved | | | Incurred |
| | |
Small/Mid Cap | | | | | | |
| | |
Class I | | | 0.05% | | | 0.05% |
| | |
Global Allocation | | | | | | |
| | |
Class I | | | 0.10% | | | 0.09% |
The Boards provide supervision of the affairs of the Trusts and other trusts within the AMG Funds Family. The Trustees of the Trusts who are not affiliated with the Investment Manager receive an annual retainer and per meeting fees for regular, special and telephonic meetings, and they are reimbursed for out-of-pocket expenses incurred while carrying out their duties as Board members. The Chairman of the Boards and the Audit Committee Chair receive additional annual retainers. Certain Trustees and Officers of the Funds are Officers and/or Directors of the Investment Manager, AMG and/or the Distributor.
The Securities and Exchange Commission (the “SEC”) granted an exemptive order that permits certain eligible funds in the AMG Funds Family to lend and borrow money for certain temporary purposes directly to and from other eligible funds in the AMG Funds Family. Participation in this interfund lending program is voluntary for both the borrowing and lending funds, and an interfund loan is only made if it benefits each participating fund. The Administrator manages the program according to procedures approved by the Boards, and the Boards monitor the operation of the program. An interfund loan must comply with certain conditions set out in the exemptive order, which are designed to assure fairness and protect all participating funds. The interest earned and interest paid on interfund loans are included on the Statement of Operations as interest income and interest expense, respectively. At December 31, 2022, the Funds had no interfund loans outstanding.
The following Funds utilized the interfund loan program during the fiscal year ended December 31, 2022 as follows:
| | | | | | | | | | | | | | | | |
| Fund | | Average
Lent | | | Number
of Days | | | Interest
Earned | | | Average
Interest Rate | |
| | | | |
Small Cap Core | | | $450,650 | | | | 7 | | | | $338 | | | | 3.915% | |
| | | | |
Small Cap Value | | | 135,766 | | | | 7 | | | | 103 | | | | 3.945% | |
| | | | |
Small/Mid Cap | | | 6,017,674 | | | | 6 | | | | 2,409 | | | | 2.435% | |
| | | | |
Global Allocation | | | 748,895 | | | | 2 | | | | 49 | | | | 1.193% | |
| | | | | | | | | | | | | | | | |
| Fund | | Average
Borrowed | | | Number
of Days | | | Interest
Paid | | | Average
Interest Rate | |
| | | | |
Small Cap Core | | | $7,134,943 | | | | 9 | | | | $3,657 | | | | 2.079% | |
| | | | |
Small Cap Value | | | 10,434,077 | | | | 4 | | | | 3,414 | | | | 2.986% | |
| | | | |
Small/Mid Cap | | | 1,913,909 | | | | 1 | | | | 227 | | | | 4.330% | |
| | | | |
Global Allocation | | | 3,631,093 | | | | 35 | | | | 8,384 | | | | 2.408% | |
3. PURCHASES AND SALES OF SECURITIES
Purchases and sales of securities (excluding short-term securities and U.S. Government Obligations) for the fiscal year ended December 31, 2022, were as follows:
56
| | |
| | | Notes to Financial Statements (continued) |
| | | |
| | | |
| | | | | | | | |
| | | Long Term Securities | |
| Fund | | Purchases | | | Sales | |
| | |
Small Cap Core | | | $196,313,818 | | | | $170,006,548 | |
| | |
Small Cap Value | | | 57,516,088 | | | | 121,468,791 | |
| | |
Small/Mid Cap | | | 274,970,475 | | | | 141,527,157 | |
| | |
Global Allocation | | | 16,802,563 | | | | 74,266,069 | |
Global Allocation purchases and sales of U.S. Government Obligations for the fiscal year ended December 31, 2022 were $8,939,543 and $13,133,566, respectively.
4. PORTFOLIO SECURITIES LOANED
The Funds participate in the Program providing for the lending of securities to qualified borrowers. Securities lending income includes earnings of such temporary cash investments, plus or minus any rebate to a borrower. These earnings (after any rebate) are then divided between BNYM, as a fee for its services under the Program, and the Funds, according to agreed-upon rates. Collateral on all securities loaned is accepted in cash, U.S. Treasury Obligations or U.S. Government Agency Obligations. Collateral is maintained at a minimum level of 102% (105% in the case of certain foreign securities) of the market value, plus interest, if applicable, of investments on loan. It is the Funds’ policy to obtain additional collateral from or return excess collateral to the borrower by the end of the next business day, following the valuation date of the securities loaned. Therefore, the value of the collateral held may be temporarily less than the value of the securities on loan. Lending securities entails a risk of loss to the Funds if and to the extent that the market value of the securities loaned were to increase and the borrower did not increase the collateral accordingly, and the borrower fails to return the securities. Under the terms of the Program, the Funds are indemnified for such losses by BNYM. Cash collateral is held in separate omnibus accounts managed by BNYM, who is authorized to exclusively enter into joint repurchase agreements for that cash collateral. Securities collateral is held in separate omnibus accounts managed by BNYM and cannot be sold or pledged. BNYM bears the risk of any deficiency in the amount of the cash collateral available for return to the borrower due to any loss on the collateral invested. Loans of securities are terminable at any time and the borrower, after notice, is required to return borrowed securities as soon as practical, which is normally within three business days.
The value of securities loaned on positions held, cash collateral and securities collateral received at December 31, 2022, were as follows:
| | | | | | | | | | | | | | | | |
| Fund | | Securities Loaned | | | Cash Collateral Received | | | Securities Collateral Received | | | Total Collateral Received | |
| | | | |
Small Cap Core | | | $30,453,990 | | | | $2,248,782 | | | | $28,924,432 | | | | $31,173,214 | |
| | | | | | | | | | | | | | | | |
| | | | | | Cash | | | Securities | | | Total | |
| | | Securities | | | Collateral | | | Collateral | | | Collateral | |
| Fund | | Loaned | | | Received | | | Received | | | Received | |
| | | | |
Small Cap Value | | | $18,116,821 | | | | $8,433,852 | | | | $10,111,784 | | | | 18,545,636 | |
| | | | |
Small/Mid Cap | | | 29,481,147 | | | | 9,547,542 | | | | 20,933,055 | | | | 30,480,597 | |
| | | | |
Global Allocation | | | 1,896,239 | | | | 1,405,038 | | | | 586,168 | | | | 1,991,206 | |
The following table summarizes the securities received as collateral for securities lending at December 31, 2022:
| | | | | | |
| Fund | | Collateral Type | | Coupon Range | | Maturity
Date Range |
| | | |
Small Cap Core | | U.S. Treasury Obligations | | 0.125%-4.750% | | 02/28/23-11/15/51 |
| | | |
Small Cap Value | | U.S. Treasury Obligations | | 0.125%-4.750% | | 02/28/23-11/15/51 |
| | | |
Small/Mid Cap | | U.S. Treasury Obligations | | 0.000%-4.750% | | 11/15/51-02/15/23 |
| | | |
Global Allocation | | U.S. Treasury Obligations | | 0.125%-4.750% | | 04/15/23-11/15/51 |
5. FOREIGN SECURITIES
Global Allocation invests in securities of foreign entities and in instruments denominated in foreign currencies which involve risks not typically associated with investments in domestic securities. Non-domestic securities carry special risks, such as exposure to currency fluctuations, less developed or less efficient trading markets, political instability, a lack of company information, differing auditing and legal standards, and, potentially, less liquidity. The Fund’s investments in emerging market countries are exposed to additional risks. The Fund’s performance will be influenced by political, social and economic factors affecting companies in emerging market countries. Emerging market countries generally have economic structures that are less diverse and mature, and political systems that are less stable, than those of developed countries. Realized gains in certain countries may be subject to foreign taxes at the Fund level and the Fund would pay such foreign taxes at the appropriate rate for each jurisdiction.
6. COMMITMENTS AND CONTINGENCIES
Under the Trusts’ organizational documents, its Trustees and Officers are indemnified against certain liabilities arising out of the performance of their duties to the Trusts. In addition, in the normal course of business, the Funds may enter into contracts and agreements that contain a variety of representations and warranties, which provide general indemnifications. The maximum exposure to the Funds under these arrangements is unknown, as this would involve future claims that may be made against a Fund that have not yet occurred. However, based on experience, the Funds had no prior claims or losses and expect the risks of loss to be remote.
57
| | |
| | | Notes to Financial Statements (continued) |
| | | |
| | | |
7. MASTER NETTING AGREEMENTS
The Funds may enter into master netting agreements with their counterparties for the Program and Repurchase Agreements, which provide the right, in the event of default (including bankruptcy or insolvency) for the non-defaulting party to liquidate the collateral and calculate net exposure to the defaulting party or request additional collateral. For financial reporting purposes, the Funds do not offset financial assets and financial liabilities that are subject to master netting agreements in the Statement of Assets and Liabilities. For securities lending transactions, see Note 4.
The following table is a summary of the Funds’ open Repurchase Agreements that are subject to a master netting agreement as of December 31, 2022:
| | | | | | | | | | | | | | | | | | | | | | | | | |
| | | | | Gross Amount Not Offset in the | | | | |
| | | | | Statement of Assets and Liabilities | | | | |
| Fund | | Gross Amounts of
Assets Presented in
the Statement of
Assets and Liabilities | | Offset Amount | | Net Asset Balance | | Collateral Received | | Net Amount |
| | | | | | | | | | | | | | | | | | | | | | | | | | |
| | | | | |
Small Cap Core | | | | | | | | | | | | | | | | | | | | | | | | | |
| | | | | |
Citigroup Global Markets, Inc. | | | | $248,782 | | | | | — | | | | | $248,782 | | | | | $248,782 | | | | | — | |
| | | | | |
National Bank Financial | | | | 1,000,000 | | | | | — | | | | | 1,000,000 | | | | | 1,000,000 | | | | | — | |
| | | | | |
RBC Dominion Securities, Inc. | | | | 1,000,000 | | | | | — | | | | | 1,000,000 | | | | | 1,000,000 | | | | | — | |
| | | | | |
Fixed Income Clearing Corp. | | | | 10,898,000 | | | | | — | | | | | 10,898,000 | | | | | 10,898,000 | | | | | — | |
| | | | | | | | | | | | | | | | | | | | | | | | | |
| | | | | |
Total | | | | $13,146,782 | | | | | — | | | | | $13,146,782 | | | | | $13,146,782 | | | | | — | |
| | | | | | | | | | | | | | | | | | | | | | | | | |
| | | | | | | | | | | | | | | | | | | | | | | | | | |
| | | | | |
Small Cap Value | | | | | | | | | | | | | | | | | | | | | | | | | |
| | | | | |
Cantor Fitzgerald Securities, Inc. | | | | $2,003,300 | | | | | — | | | | | $2,003,300 | | | | | $2,003,300 | | | | | — | |
| | | | | |
Citadel Securities LLC | | | | 2,003,300 | | | | | — | | | | | 2,003,300 | | | | | 2,003,300 | | | | | — | |
| | | | | |
Citigroup Global Markets, Inc. | | | | 420,702 | | | | | — | | | | | 420,702 | | | | | 420,702 | | | | | — | |
| | | | | |
National Bank Financial | | | | 2,003,275 | | | | | — | | | | | 2,003,275 | | | | | 2,003,275 | | | | | — | |
| | | | | |
RBC Dominion Securities, Inc. | | | | 2,003,275 | | | | | — | | | | | 2,003,275 | | | | | 2,003,275 | | | | | — | |
| | | | | |
Fixed Income Clearing Corp. | | | | 2,573,000 | | | | | — | | | | | 2,573,000 | | | | | 2,573,000 | | | | | — | |
| | | | | | | | | | | | | | | | | | | | | | | | | |
| | | | | | | | | | | | | | | | | | | | | | | | | | |
| | | | | |
Total | | | | $11,006,852 | | | | | — | | | | | $11,006,852 | | | | | $11,006,852 | | | | | — | |
| | | | | | | | | | | | | | | | | | | | | | | | | |
| | | | | | | | | | | | | | | | | | | | | | | | | | |
| | | | | |
Small/Mid Cap | | | | | | | | | | | | | | | | | | | | | | | | | |
| | | | | |
Cantor Fitzgerald Securities, Inc. | | | | $2,267,800 | | | | | — | | | | | $2,267,800 | | | | | $2,267,800 | | | | | — | |
| | | | | |
Citadel Securities LLC | | | | 2,267,800 | | | | | — | | | | | 2,267,800 | | | | | 2,267,800 | | | | | — | |
| | | | | |
Citigroup Global Markets, Inc. | | | | 476,330 | | | | | — | | | | | 476,330 | | | | | 476,330 | | | | | — | |
| | | | | |
National Bank Financial | | | | 2,267,806 | | | | | — | | | | | 2,267,806 | | | | | 2,267,806 | | | | | — | |
| | | | | |
RBC Dominion Securities, Inc. | | | | 2,267,806 | | | | | — | | | | | 2,267,806 | | | | | 2,267,806 | | | | | — | |
| | | | | |
Fixed Income Clearing Corp. | | | | 2,761,000 | | | | | — | | | | | 2,761,000 | | | | | 2,761,000 | | | | | — | |
| | | | | | | | | | | | | | | | | | | | | | | | | |
| | | | | | | | | | | | | | | | | | | | | | | | | | |
| | | | | |
Total | | | | $12,308,542 | | | | | — | | | | | $12,308,542 | | | | | $12,308,542 | | | | | — | |
| | | | | | | | | | | | | | | | | | | | | | | | | |
| | | | | | | | | | | | | | | | | | | | | | | | | | |
| | | | | |
Global Allocation | | | | | | | | | | | | | | | | | | | | | | | | | |
| | | | | |
National Bank Financial | | | | $1,000,000 | | | | | — | | | | | $1,000,000 | | | | | $1,000,000 | | | | | — | |
| | | | | |
Nomura Securities International, Inc. | | | | 405,038 | | | | | — | | | | | 405,038 | | | | | 405,038 | | | | | — | |
| | | | | |
Fixed Income Clearing Corp. | | | | 381,000 | | | | | — | | | | | 381,000 | | | | | 381,000 | | | | | — | |
| | | | | | | | | | | | | | | | | | | | | | | | | |
| | | | | |
Total | | | | $1,786,038 | | | | | — | | | | | $1,786,038 | | | | | $1,786,038 | | | | | — | |
| | | | | | | | | | | | | | | | | | | | | | | | | |
58
| | |
| | | Notes to Financial Statements (continued) |
| | | |
| | | |
8. FUND MERGER
On March 8, 2021, Small/Mid Cap acquired all the net assets of AMG GW&K Mid Cap Fund (“Mid Cap”), a series of AMG Funds IV, based on the respective valuations as of the close of business on March 5, 2021, pursuant to a Plan of Reorganization approved by the Board of Mid Cap on October 8, 2021.
The acquisition was accomplished by a tax-free exchange of 3,848,331 Class N shares of Small/Mid Cap at a net asset value of $17.22 per share for 2,667,192 Class N shares of Mid Cap; 792,895 Class I shares of Small/Mid Cap at a net asset value of $17.25 per share for 519,987 Class I shares of Mid Cap; and 780,901 Class Z shares of Small/Mid Cap at a net asset value of $17.27 per share for 474,356 Class Z shares of Mid Cap.
The net assets of Small/Mid Cap and Mid Cap immediately before the acquisition were $311,921,414 and $93,443,824, respectively, including unrealized appreciation of $16,703,006 for Mid Cap. Immediately after the acquisition, the combined net assets of Small/Mid Cap amounted to $405,365,238. For financial reporting purposes, assets received and shares issued by Small/Mid Cap were recorded at fair value; however, the cost basis of the investments received from Mid Cap was carried forward to align ongoing reporting of Small/Mid Cap’s realized and unrealized gains and losses with amounts distributable to shareholders for tax purposes.
On August 9, 2021, Small Cap Value acquired all the net assets of AMG GW&K Small Cap Value Fund II (“Small Cap Value II”), a series of AMG Funds IV, based on the respective valuations as of the close of business on August 6, 2021, pursuant to a Plan of Reorganization approved by the Board of Small Cap Value II on March 17-18, 2021.
The acquisition was accomplished by a tax-free exchange of 186,108 Class N shares of Small Cap Value at a net asset value of $29.52 per share for 399,433 Class N shares of Small Cap Value II; 1,824,176 Class I shares of Small Cap Value at a net asset value of $29.60 per share for 3,846,984 Class I shares of Small Cap Value II; and 914,333 Class Z shares of Small Cap Value at a net asset value of $29.52 per share for 1,924,341 Class Z shares of Small Cap Value II.
The net assets of Small Cap Value and Small Cap Value II immediately before the acquisition were $299,058,407 and $86,478,858, respectively, including unrealized appreciation of $7,179,547 for Small Cap Value II. Immediately after the acquisition, the combined net assets of Small Cap Value amounted to $385,537,265. For financial reporting purposes, assets received and shares issued by Small Cap Value were recorded at fair value; however, the cost basis of the investments received from Small Cap Value II was carried forward to align ongoing reporting of Small Cap Value’s realized and unrealized gains and losses with amounts distributable to shareholders for tax purposes.
Assuming these reorganizations had been completed on January 1, 2021, the Funds’ results of operations for the fiscal year ended December 31, 2021 would have been as follows:
| | | | | | | | |
| | | Small/Mid Cap | | | Small Cap Value | |
| | |
Net Investment Income | | | $(381,491 | ) | | | $1,325,967 | |
| | |
Realized and Unrealized Gain on Investments | | | 121,546,008 | | | | 140,200,795 | |
| | | | | | | | |
| | |
Net Increase to Net Assets from Operations | | | $121,164,517 | | | | $141,526,762 | |
| | | | | | | | |
Because the combined investment portfolios have been managed as single portfolios since the reorganizations were completed, it is not practical to separate the amounts of revenue and earnings to the Funds that have been included in their statements of operations for the fiscal year ended December 31, 2021.
9. SUBSEQUENT EVENTS
The Funds have determined that no material events or transactions occurred through the issuance date of the Funds’ financial statements which require an additional disclosure in or adjustment of the Funds’ financial statements.
59
|
Report of Independent Registered Public Accounting Firm |
To the Board of Trustees of AMG Funds and AMG Funds II and Shareholders of AMG GW&K Small Cap Core Fund, AMG GW&K Small Cap Value Fund, AMG GW&K Small/Mid Cap Fund, and AMG GW&K Global Allocation Fund
Opinions on the Financial Statements
We have audited the accompanying statements of assets and liabilities, including the schedules of portfolio investments, of AMG GW&K Small Cap Core Fund, AMG GW&K Small Cap Value Fund, AMG GW&K Small/Mid Cap Fund (three of the funds constituting AMG Funds), and AMG GW&K Global Allocation Fund (one of the funds constituting AMG Funds II) (hereafter collectively referred to as the “Funds”) as of December 31, 2022, the related statements of operations for the year ended December 31, 2022, the statements of changes in net assets for each of the two years in the period ended December 31, 2022, including the related notes, and the financial highlights for each of the five years in the period ended December 31, 2022 (collectively referred to as the “financial statements”). In our opinion, the financial statements present fairly, in all material respects, the financial position of each of the Funds as of December 31, 2022, the results of each of their operations for the year then ended, the changes in each of their net assets for each of the two years in the period ended December 31, 2022 and each of the financial highlights for each of the five years in the period ended December 31, 2022 in conformity with accounting principles generally accepted in the United States of America.
Basis for Opinions
These financial statements are the responsibility of the Funds’ management. Our responsibility is to express an opinion on the Funds’ financial statements based on our audits. We are a public accounting firm registered with the Public Company Accounting Oversight Board (United States) (PCAOB) and are required to be independent with respect to the Funds in accordance with the U.S. federal securities laws and the applicable rules and regulations of the Securities and Exchange Commission and the PCAOB.
We conducted our audits of these financial statements in accordance with the standards of the PCAOB. Those standards require that we plan and perform the audit to obtain reasonable assurance about whether the financial statements are free of material misstatement, whether due to error or fraud.
Our audits included performing procedures to assess the risks of material misstatement of the financial statements, whether due to error or fraud, and performing procedures that respond to those risks. Such procedures included examining, on a test basis, evidence regarding the amounts and disclosures in the financial statements. Our audits also included evaluating the accounting principles used and significant estimates made by management, as well as evaluating the overall presentation of the financial statements. Our procedures included confirmation of securities owned as of December 31, 2022 by correspondence with the custodian. We believe that our audits provide a reasonable basis for our opinions.
/s/ PricewaterhouseCoopers LLP
Boston, Massachusetts
February 24, 2023
We have served as the auditor of one or more investment companies in the AMG Funds Family since 1993.
60
| | |
| | | Other Information (unaudited) |
| | | |
| | | |
TAX INFORMATION
AMG GW&K Small Cap Core Fund, AMG GW&K Small Cap Value Fund, AMG GW&K Small/Mid Cap Fund and AMG GW&K Global Allocation Fund each hereby designates the maximum amount allowable of its net taxable income as qualified dividends as provided in the Jobs and Growth Tax Relief Reconciliation Act of 2003. The 2022 Form 1099-DIV you receive for each Fund will show the tax status of all distributions paid to you during the year.
Pursuant to section 852 of the Internal Revenue Code, AMG GW&K Small Cap Core Fund, AMG GW&K Small Cap Value Fund, AMG GW&K Small/Mid Cap Fund and AMG GW&K Global Allocation Fund each hereby designates $4,843,070, $1,531,983, $20,723,675 and $6,715,846, respectively, as a capital gain distribution with respect to the taxable year ended December 31, 2022, or if subsequently determined to be different, the net capital gains of such fiscal year.
61
| | |
| | | AMG Funds Trustees and Officers |
| | | |
| | | |
| | | | |
The Trustees and Officers of the Trust, their business addresses, principal occupations for the past five years and ages are listed below. The Trustees provide broad supervision over the affairs of the Trust and the Funds. The Trustees are experienced executives who meet periodically throughout the year to oversee the Funds’ activities, review contractual arrangements with companies that provide services to the Funds, and | | review the Funds’ performance. Unless otherwise noted, the address of each Trustee or Officer is the address of the Trust: 680 Washington Blvd., Suite 500, Stamford, CT. 06901. There is no stated term of office for Trustees. Trustees serve until their resignation, retirement or removal in | | accordance with the Trust’s organizational documents and policies adopted by the Board from time to time. The Chairman of the Trustees, President, Treasurer and Secretary of the Trust are elected by the Trustees annually. Other officers hold office at the pleasure of the Trustees. |
Independent Trustees
The following Trustees are not “interested persons” of the Trust within the meaning of the 1940 Act:
| | |
Number of Funds Overseen in Fund Complex | | Name, Age, Principal Occupation(s) During Past 5 Years and Other Directorships Held by Trustee |
| | |
• Trustee since 2012 - AMG Funds • Trustee since 2012 - AMG Funds II • Oversees 40 Funds in Fund Complex | | Bruce B. Bingham, 74 Partner, Hamilton Partners (real estate development firm) (1987-Present); Director of The Yacktman Funds, Inc. (2 portfolios) (2000-2012). |
| | |
• Chairman of the Audit Committee since 2021 • Trustee since 2013 - AMG Funds • Trustee since 2013 - AMG Funds II • Oversees 44 Funds in Fund Complex | | Kurt A. Keilhacker, 59 Managing Partner, TechFund Europe (2000-Present); Managing Partner, TechFund Capital (1997-Present); Managing Partner, Elementum Ventures (2013-Present); Director, MetricStory, Inc. (2017-Present); Trustee, Wheaton College (2018-Present); Trustee, Gordon College (2001-2016); Board Member, 6wind SA (2002-2019). |
| | |
• Trustee since 2004 - AMG Funds • Trustee since 2000 - AMG Funds II • Oversees 40 Funds in Fund Complex | | Steven J. Paggioli, 72 Independent Consultant (2002-Present); Trustee, Professionally Managed Portfolios (28 portfolios); Advisory Board Member, Sustainable Growth Advisors, LP; Independent Director, Muzinich BDC, Inc. (business development company) (2019-Present); Director, The Wadsworth Group; Independent Director, Chase Investment Counsel (2008–2019); Executive Vice President, Secretary and Director, Investment Company Administration, LLC and First Fund Distributors, INC. (1990-2001). |
| | |
• Independent Chairman of the Board of Trustees since 2017 • Chairman of the Governance Committee since 2017 • Trustee since 1999 - AMG Funds • Trustee since 2000 - AMG Funds II • Oversees 44 Funds in Fund Complex | | Eric Rakowski, 64 Professor of Law, University of California at Berkeley School of Law (1990-Present); Tax Attorney at Davis Polk & Wardwell and clerked for Judge Harry T. Edwards of the U.S. Court of Appeals for the District of Columbia Circuit and for Justice William J. Brennan Jr. of the U.S. Supreme Court; Trustee of Parnassus Funds (3 portfolios) (2021-Present); Trustee of Parnassus Income Funds (2 portfolios) (2021-Present); Director of Harding, Loevner Funds, Inc. (10 portfolios); Trustee of Third Avenue Trust (3 portfolios) (2002-2019); Trustee of Third Avenue Variable Trust (1 portfolio) (2002-2019). |
| | |
• Trustee since 2013 - AMG Funds • Trustee since 2013 - AMG Funds II • Oversees 44 Funds in Fund Complex | | Victoria L. Sassine, 57 Adjunct Professor, Babson College (2007–Present); Director, Board of Directors, PRG Group (2017-Present); CEO, Founder, Scale Smarter Partners, LLC (2018-Present); Adviser, EVOFEM Biosciences (2019-Present); Chairperson of the Board of Directors of Business Management Associates (2018-2019). |
| | |
• Trustee since 2000 - AMG Funds II • Trustee since 2004 - AMG Funds • Oversees 40 Funds in Fund Complex | | Thomas R. Schneeweis, 75* Professor Emeritus, University of Massachusetts (2013-Present); President, TRS Associates (1982-Present); Board Member, Chartered Alternative Investment Association (“CAIA”) (2002-Present); Co-Founder and Director, Institute for Global Asset and Risk Management (Education) (2010-Present); Co-Owner, Quantitative Investment Technologies (2014-Present); Co-Owner, Yes Wealth Management (2018-Present); Director, CAIA Foundation (2010-2019); Partner, S Capital Wealth Advisors (2015-2018); Partner, S Capital Management, LLC (2007-2015); President, Alternative Investment Analytics, LLC (formerly Schneeweis Partners, LLC) (2001-2013). |
62
| | |
| | | AMG Funds Trustees and Officers (continued) |
| | | |
| | | |
*Mr. Schneeweis retired from the Board of Trustees of AMG Funds and AMG Funds II as of December 31, 2022.
Interested Trustee
The Trustee in the following table is an “interested person” of the Trust within the meaning of the 1940 Act.
| | |
Number of Funds Overseen in
Fund Complex | | Name, Age, Principal Occupation(s) During Past 5 Years and Other Directorships Held by Trustee |
| | |
• Trustee since 2021 • Oversees 44 Funds in Fund Complex | | Garret W. Weston, 41 Affiliated Managers Group, Inc. (2008-Present): Managing Director, Co-Head of Affiliate Engagement (2021-Present), Senior Vice President, Affiliate Development (2016-2021), Vice President, Office of the CEO (2015-2016), Vice President, New Investments (2012-2015), Senior Associate, New Investments (2008-2012); Associate, Madison Dearborn Partners (2006-2008); Analyst, Merrill Lynch (2004-2006). |
Officers
| | |
Position(s) Held with Fund and Length of Time Served | | Name, Age, Principal Occupation(s) During Past 5 Years |
| | |
• President since 2018 • Principal Executive Officer
since 2018 • Chief Executive Officer
since 2018 • Chief Operating Officer
since 2007 | | Keitha L. Kinne, 64 Chief Operating Officer, AMG Funds LLC (2007-Present); Chief Investment Officer, AMG Funds LLC (2008-Present); President and Principal, AMG Distributors, Inc. (2018-Present); Chief Operating Officer, AMG Distributors, Inc. (2007-Present); President, Chief Executive Officer and Principal Executive Officer, AMG Funds, AMG Funds I, AMG Funds II, AMG Funds III and AMG Funds IV (2018-Present); Chief Operating Officer, AMG Funds, AMG Funds I, AMG Funds II, and AMG Funds III (2007-Present); Chief Operating Officer, AMG Funds IV (2016-Present); Chief Operating Officer and Chief Investment Officer, Aston Asset Management, LLC (2016); President and Principal Executive Officer, AMG Funds, AMG Funds I, AMG Funds II and AMG Funds III (2012-2014); Managing Partner, AMG Funds LLC (2007-2014); President and Principal, AMG Distributors, Inc. (2012-2014); Managing Director, Legg Mason & Co., LLC (2006-2007); Managing Director, Citigroup Asset Management (2004-2006). |
| | |
• Secretary since 2015 • Chief Legal Officer since 2015 | | Mark J. Duggan, 57 Managing Director and Senior Counsel, AMG Funds LLC (2021-Present); Senior Vice President and Senior Counsel, AMG Funds LLC (2015-2021); Secretary and Chief Legal Officer, AMG Funds, AMG Funds I, AMG Funds II, AMG Funds III and AMG Funds IV (2015-Present); Attorney, K&L Gates, LLP (2009-2015). |
| | |
• Chief Financial Officer
since 2017 • Treasurer since 2017 • Principal Financial Officer
since 2017 • Principal Accounting Officer
since 2017 | | Thomas G. Disbrow, 56 Vice President, Mutual Fund Treasurer & CFO, AMG Funds, AMG Funds LLC (2017-Present); Chief Financial Officer, Principal Financial Officer, Treasurer and Principal Accounting Officer, AMG Funds, AMG Funds I, AMG Funds II, AMG Funds III and AMG Funds IV (2017-Present); Managing Director - Global Head of Traditional Funds Product Control, UBS Asset Management (Americas), Inc. (2015-2017); Managing Director - Head of North American Funds Treasury, UBS Asset Management (Americas), Inc. (2011-2015). |
| | |
• Deputy Treasurer since 2017 | | John A. Starace, 52 Vice President, Mutual Fund Accounting, AMG Funds LLC (2021-Present); Director, Mutual Fund Accounting, AMG Funds LLC (2017-2021); Vice President, Deputy Treasurer of Mutual Funds Services, AMG Funds LLC (2014-2017); Deputy Treasurer, AMG Funds, AMG Funds I, AMG Funds II, AMG Funds III and AMG Funds IV (2017-Present); Vice President, Citi Hedge Fund Services (2010-2014); Audit Senior Manager (2005-2010) and Audit Manager (2001-2005), Deloitte & Touche LLP. |
| | |
• Chief Compliance Officer and Sarbanes-Oxley Code of Ethics Compliance Officer since 2019 • Anti-Money Laundering Compliance Officer since 2022 | | Patrick J. Spellman, 48 Vice President, Chief Compliance Officer, AMG Funds LLC (2017-Present); Chief Compliance Officer, AMG Distributors, Inc. (2010-Present); Chief Compliance Officer and Sarbanes-Oxley Code of Ethics Compliance Officer, AMG Funds, AMG Funds I, AMG Funds II, AMG Funds III and AMG Funds IV (2019-Present); Anti-Money Laundering Compliance Officer, AMG Funds, AMG Funds I, AMG Funds II, and AMG Funds III (2014-2019; 2022-Present); Anti-Money Laundering Compliance Officer, AMG Funds IV (2016-2019; 2022-Present); Senior Vice President, Chief Compliance Officer, AMG Funds LLC (2011-2017); Compliance Manager, Legal and Compliance, Affiliated Managers Group, Inc. (2005-2011). |
| | |
• Assistant Secretary since 2016 | | Maureen M. Kerrigan, 37 Vice President, Senior Counsel, AMG Funds LLC (2021-Present); Vice President, Counsel, AMG Funds LLC (2019-2021); Director, Counsel, AMG Funds LLC (2017-2018); Vice President, Counsel, AMG Funds LLC (2015-2017); Assistant Secretary, AMG Funds, AMG Funds I, AMG Funds II, AMG Funds III and AMG Funds IV (2016-Present); Associate, Ropes & Gray LLP (2011-2015); Law Fellow, Massachusetts Appleseed Center for Law and Justice (2010-2011). |
63
THIS PAGE INTENTIONALLY LEFT BLANK
|
|
|
| |
| | | | |
INVESTMENT MANAGER AND ADMINISTRATOR AMG Funds LLC 680 Washington Blvd., Suite 500 Stamford, CT 06901 800.548.4539 DISTRIBUTOR AMG Distributors, Inc. 680 Washington Blvd., Suite 500 Stamford, CT 06901 800.548.4539 SUBADVISER GW&K Investment Management, LLC 222 Berkeley St. Boston, MA 02116 CUSTODIAN The Bank of New York Mellon Mutual Funds Custody 6023 Airport Road Oriskany, NY 13424 | | LEGAL COUNSEL Ropes & Gray LLP Prudential Tower, 800 Boylston Street Boston, MA 02199-3600 TRANSFER AGENT BNY Mellon Investment Servicing (US) Inc. Attn: AMG Funds 4400 Computer Drive Westborough, MA 01581 800.548.4539 Effective March 9, 2023, the Transfer Agent’s mailing address will change to the following: BNY Mellon Investment Servicing (US) Inc. AMG Funds Attn: 534426 AIM 154-0520 500 Ross Street Pittsburgh, PA 15262 800.548.4539 | | This report is prepared for the Funds’ shareholders. It is authorized for distribution to prospective investors only when preceded or accompanied by an effective prospectus. To receive a free copy of the prospectus or Statement of Additional Information, which includes additional information about Fund Trustees, please contact us by calling 800.548.4539. Distributed by AMG Distributors, Inc., member FINRA/SIPC. Current net asset values per share for each Fund are available on the Funds’ website at amgfunds.com. A description of the policies and procedures each Fund uses to vote its proxies is available: (i) without charge, upon request, by calling 800.548.4539, or (ii) on the Securities and Exchange Commission’s (SEC) website at sec.gov. For information regarding each Fund’s proxy voting record for the 12-month period ended June 30, call 800.548.4539 or visit the SEC website at sec.gov. The Funds file their complete schedule of portfolio holdings with the SEC for the first and third quarters of each fiscal year as an exhibit to their reports on Form N-PORT. The Funds’ portfolio holdings on Form N-PORT are available on the SEC’s website at sec.gov and the Funds’ website at amgfunds.com. To review a complete list of the Funds’ portfolio holdings, or to view the most recent semiannual report or annual report, please visit amgfunds.com. |
| | |
|
| | | |
| | | |
| | | | | | |
BALANCED FUNDS AMG GW&K Global Allocation GW&K Investment Management, LLC EQUITY FUNDS AMG Beutel Goodman International Equity Beutel, Goodman & Company Ltd. AMG Boston Common Global Impact Boston Common Asset Management, LLC AMG Frontier Small Cap Growth Frontier Capital Management Co., LLC AMG GW&K Small Cap Core AMG GW&K Small Cap Value AMG GW&K Small/Mid Cap AMG GW&K Small/Mid Cap Growth AMG GW&K Emerging Markets Equity AMG GW&K Emerging Wealth Equity AMG GW&K International Small Cap GW&K Investment Management, LLC AMG Montrusco Bolton Large Cap Growth Montrusco Bolton Investments, Inc. AMG Renaissance Large Cap Growth The Renaissance Group LLC | | | | AMG River Road Dividend All Cap Value AMG River Road Focused Absolute Value AMG River Road International Value Equity AMG River Road Large Cap Value Select AMG River Road Mid Cap Value AMG River Road Small-Mid Cap Value AMG River Road Small Cap Value River Road Asset Management, LLC AMG TimesSquare Emerging Markets Small Cap AMG TimesSquare Global Small Cap AMG TimesSquare International Small Cap AMG TimesSquare Mid Cap Growth AMG TimesSquare Small Cap Growth TimesSquare Capital Management, LLC AMG Veritas Asia Pacific AMG Veritas China AMG Veritas Global Focus AMG Veritas Global Real Return Veritas Asset Management LLP AMG Yacktman AMG Yacktman Focused AMG Yacktman Global AMG Yacktman Special Opportunities Yacktman Asset Management LP | | FIXED INCOME FUNDS AMG Beutel Goodman Core Plus Bond Beutel, Goodman & Company Ltd. AMG GW&K Core Bond ESG AMG GW&K Enhanced Core Bond ESG AMG GW&K ESG Bond AMG GW&K High Income AMG GW&K Municipal Bond AMG GW&K Municipal Enhanced Yield GW&K Investment Management, LLC |
|
|
|
|
|
|
|
|
|
|
|
|
|
|
|
|
|
|
|
|
|
|
|
|
|
| | | | | | |
| amgfunds.com | | | | | | 123122 AR089 |
| | |
| | ANNUAL REPORT |
| | |
| | | AMG Funds December 31, 2022 |
| | |
| | | |
| | |
| | | AMG GW&K ESG Bond Fund |
| | |
| | | Class N: MGFIX | Class I: MGBIX |
| | |
| | | AMG GW&K Enhanced Core Bond ESG Fund |
| | |
| | | Class N: MFDAX | Class I: MFDSX | Class Z: MFDYX |
| | |
| | | AMG GW&K High Income Fund |
| | |
| | | Class N: MGGBX | Class I: GWHIX |
| | |
| | | AMG GW&K Municipal Bond Fund |
| | |
| | | Class N: GWMTX | Class I: GWMIX |
| | |
| | | AMG GW&K Municipal Enhanced Yield Fund |
| | |
| | | Class N: GWMNX | Class I: GWMEX | Class Z: GWMZX |
| | |
| | | |
| | |
| | | |
| | | | |
| amgfunds.com | | | | 123122 AR088 |
| | |
| | | AMG Funds Annual Report — December 31, 2022 |
| | | | | | |
| | | |
| | | | | | |
| | | TABLE OF CONTENTS | | PAGE | |
| | | |
| | | LETTER TO SHAREHOLDERS | | | 2 | |
| | | |
| | | ABOUT YOUR FUND’S EXPENSES | | | 3 | |
| | |
| | PORTFOLIO MANAGER’S COMMENTS, FUND SNAPSHOTS AND SCHEDULES OF PORTFOLIO INVESTMENTS | | | | |
| | | |
| | | AMG GW&K ESG Bond Fund | | | 4 | |
| | | |
| | | AMG GW&K Enhanced Core Bond ESG Fund | | | 14 | |
| | | |
| | | AMG GW&K High Income Fund | | | 23 | |
| | | |
| | | AMG GW&K Municipal Bond Fund | | | 31 | |
| | | |
| | | AMG GW&K Municipal Enhanced Yield Fund | | | 40 | |
| | | |
| | | FINANCIAL STATEMENTS | | | | |
| | | |
| | | Statement of Assets and Liabilities | | | 48 | |
| | | |
| | | Balance sheets, net asset value (NAV) per share computations
and cumulative distributable earnings (loss) | | | | |
| | | |
| | | Statement of Operations | | | 50 | |
| | | |
| | | Detail of sources of income, expenses, and realized and
unrealized gains (losses) during the fiscal year | | | | |
| | | |
| | | Statements of Changes in Net Assets | | | 51 | |
| | | |
| | | Detail of changes in assets for the past two fiscal years | | | | |
| | | |
| | | Financial Highlights | | | 53 | |
| | | |
| | | Historical net asset values per share, distributions, total returns, income
and expense ratios, turnover ratios and net assets | | | | |
| | | |
| | | Notes to Financial Statements | | | 65 | |
| | | |
| | | Accounting and distribution policies, details of agreements and
transactions with Fund management and affiliates, and descriptions of
certain investment risks | | | | |
| | | |
| | | REPORT OF INDEPENDENT REGISTERED PUBLIC ACCOUNTING FIRM | | | 74 | |
| | | |
| | | OTHER INFORMATION | | | 75 | |
| | | |
| | | TRUSTEES AND OFFICERS | | | 76 | |
| | | |
| | | | | | | |
| | | | | | | |
|
Nothing contained herein is to be considered an offer, sale or solicitation of an offer to buy shares of any series of the AMG Funds Family of Funds. Such offering is made only by prospectus, which includes details as to offering price and other material information. | |
| | |
| | Letter to Shareholders |
Dear Shareholder:
We are pleased to provide this annual report for your investment with AMG Funds. Our foremost goal is to provide investment solutions that help our shareholders successfully achieve their long-term investment goals. We appreciate the privilege of providing you with investment tools.
The past year was a challenging period for investors, as uncertainties about high inflation, tighter financial conditions, and the Russian invasion of Ukraine led to significant volatility. Global equity and bond markets fell in tandem amid sharply higher interest rates and eroding investor confidence as worries of an impending recession lingered most of the year. A global commodity shock caused by the war in Ukraine only made matters worse. The S&P 500® Index slipped into a bear market with the Index falling more than (24)% from its peak earlier in the year. The abrupt shift in markets this year has reset expectations around future growth, as the U.S. Federal Reserve (the Fed) and other global central banks have taken aggressive policy action to bring down inflation. While the outlook is uncertain given recent negative returns across many asset classes, global stock and bond valuations are now far more attractive entering 2023 compared to a year ago.
There was very wide dispersion in S&P 500® Index sector performance. Energy significantly outperformed all other sectors with a gain of 65.72% as the price of oil surged during the period. The defensive-oriented sectors also outperformed, although utilities was the only other sector with a positive return, gaining 1.54%. Consumer staples and health care were slightly negative with returns of (0.62)% and (1.95)%, respectively. High-growth technology and mega cap internet-related companies underperformed during the period, and real estate was impacted by higher interest rates. Communications services fell the most with a (39.93)% return during the year, followed by declines of (37.03)% for consumer discretionary, (28.14)% for information technology and (26.13)% for real estate. Value stocks held up much better than growth stocks as the Russell 1000® Value Index returned (7.54)% compared to the (29.14)% return for the Russell 1000® Growth Index. Small cap stocks struggled as the Russell 2000® Index lost (20.44)%. Outside the U.S., foreign developed markets were negative with a (14.45)% return for the MSCI EAFE Index, however a very strong fourth quarter rally drove international equity returns ahead of their U.S. counterparts for the year.
The 10-year Treasury yield more than doubled during the year, surging to the highest levels since before the Great Financial Crisis. Rapidly rising rates from a very low base led to historic negative performance for bonds as the Bloomberg U.S. Aggregate Bond Index, a broad measure of U.S. bond market performance, lost (13.01)% over the period. Investment-grade corporate bonds underperformed, returning (15.76)% for the year. High yield bonds held up better with a (11.19)% return as measured by the return of the Bloomberg U.S. Corporate High Yield Bond
Index. Municipal bonds were also negative, but outperformed the broader market with a (8.53)% return for the Bloomberg Municipal Bond Index.
AMG Funds provides access to a distinctive array of actively managed return-oriented investment strategies. You can rest assured that under all market conditions our team is focused on delivering excellent investment management services for your benefit. For more information about AMG Funds’ wide range of products and resources, please visit www.amgfunds.com. We thank you for your investment and continued trust in AMG Funds.
Respectfully,
Keitha Kinne
President
AMG Funds
| | | | | | | | | | | | | | |
| | | | | Periods ended | |
| Average Annual Total Returns | | December 31, 2022* | |
| | | | |
| Stocks: | | | | 1 Year | | | 3 Years | | | 5 Years | |
| | | | |
Large Cap | | (S&P 500® Index) | | | (18.11 | )% | | | 7.66 | % | | | 9.42 | % |
| | | | |
Small Cap | | (Russell 2000® Index) | | | (20.44 | )% | | | 3.10 | % | | | 4.13 | % |
| | | | |
International | | (MSCI ACWI ex USA) | | | (16.00 | )% | | | 0.07 | % | | | 0.88 | % |
| | | | |
Bonds: | | | | | | | | | | | | | | |
| | | | |
Investment Grade | | (Bloomberg U.S. Aggregate Bond Index) | | | (13.01 | )% | | | (2.71 | )% | | | 0.02 | % |
| | | | |
High Yield | | (Bloomberg U.S. Corporate High Yield Bond Index) | | | (11.19 | )% | | | 0.05 | % | | | 2.31 | % |
| | | | |
Tax-exempt | | (Bloomberg Municipal Bond Index) | | | (8.53 | )% | | | (0.77 | )% | | | 1.25 | % |
| | | | |
Treasury Bills | | (ICE BofAML U.S. 6-Month Treasury Bill Index) | | | 1.34 | % | | | 0.82 | % | | | 1.39 | % |
* Source: FactSet. Past performance is no guarantee of future results.
2
| | |
| | | About Your Fund’s Expenses |
| | | |
| | | |
| | | | | | | | |
As a shareholder of a Fund, you may incur two types of costs: (1) transaction costs, which may include sales charges (loads) on purchase payments; redemption fees; and exchange fees; and (2) ongoing costs, including management fees; distribution (12b-1) fees; and other Fund expenses. This example is intended to help you understand your ongoing costs (in dollars) of investing in the Fund and to compare these costs with the ongoing costs of investing in other mutual funds. The example is based on $1,000 invested at the beginning of the period and held for the entire period as indicated below. ACTUAL EXPENSES The first line of the following table provides information about the actual account values and | | | | actual expenses. You may use the information in this line, together with the amount you invested, to estimate the expenses that you paid over the period. Simply divide your account value by $1,000 (for example, an $8,600 account value divided by $1,000 = 8.6), then multiply the result by the number in the first line under the heading entitled “Expenses Paid During the Period” to estimate the expenses you paid on your account during this period. HYPOTHETICAL EXAMPLE FOR COMPARISON PURPOSES The second line of the following table provides information about hypothetical account values and hypothetical expenses based on the Fund’s actual expense ratio and an assumed annual rate of return of 5% before expenses, which is not the Fund’s | | | | actual return. The hypothetical account values and expenses may not be used to estimate the actual ending account balance or expenses you paid for the period. You may use this information to compare the ongoing costs of investing in the Fund and other funds by comparing this 5% hypothetical example with the 5% hypothetical examples that appear in the shareholder reports of other funds. Please note that the expenses shown in the table are meant to highlight your ongoing costs only and do not reflect any transactional costs, such as sales charges (loads), redemption fees, or exchange fees. Therefore, the second line of the table is useful in comparing ongoing costs only, and will not help you determine the relative total costs of owning different funds. |
| | | | | | | | |
| | | | | | | | | | |
| | | | |
Six Months Ended December 31, 2022 | | Expense
Ratio for
the Period | | Beginning
Account
Value
07/01/22 | | Ending
Account
Value
12/31/22 | | | Expenses
Paid
During
the Period* |
AMG GW&K ESG Bond Fund |
|
Based on Actual Fund Return |
Class N | | 0.68% | | $1,000 | | | $981 | | | $3.40 |
Class I | | 0.48% | | $1,000 | | | $982 | | | $2.40 |
|
Based on Hypothetical 5% Annual Return |
Class N | | 0.68% | | $1,000 | | | $1,022 | | | $3.47 |
Class I | | 0.48% | | $1,000 | | | $1,023 | | | $2.45 |
AMG GW&K Enhanced Core Bond ESG Fund |
|
Based on Actual Fund Return |
Class N | | 0.73% | | $1,000 | | | $971 | | | $3.63 |
Class I | | 0.56% | | $1,000 | | | $970 | | | $2.78 |
Class Z | | 0.48% | | $1,000 | | | $972 | | | $2.39 |
|
Based on Hypothetical 5% Annual Return |
Class N | | 0.73% | | $1,000 | | | $1,022 | | | $3.72 |
Class I | | 0.56% | | $1,000 | | | $1,022 | | | $2.85 |
Class Z | | 0.48% | | $1,000 | | | $1,023 | | | $2.45 |
AMG GW&K High Income Fund |
|
Based on Actual Fund Return |
Class N | | 0.87% | | $1,000 | | | $1,040 | | | $4.47 |
Class I | | 0.67% | | $1,000 | | | $1,041 | | | $3.45 |
|
Based on Hypothetical 5% Annual Return |
Class N | | 0.87% | | $1,000 | | | $1,021 | | | $4.43 |
Class I | | 0.67% | | $1,000 | | | $1,022 | | | $3.41 |
| | | | | | | | | | |
| | | | |
Six Months Ended December 31, 2022 | | Expense
Ratio for
the Period | | Beginning
Account
Value
07/01/22 | | Ending
Account
Value
12/31/22 | | | Expenses
Paid
During
the Period* |
AMG GW&K Municipal Bond Fund |
|
Based on Actual Fund Return |
Class N | | 0.73% | | $1,000 | | | $1,016 | | | $3.71 |
Class I | | 0.39% | | $1,000 | | | $1,019 | | | $1.98 |
|
Based on Hypothetical 5% Annual Return |
Class N | | 0.73% | | $1,000 | | | $1,022 | | | $3.72 |
Class I | | 0.39% | | $1,000 | | | $1,023 | | | $1.99 |
AMG GW&K Municipal Enhanced Yield Fund |
|
Based on Actual Fund Return |
Class N | | 0.99% | | $1,000 | | | $984 | | | $4.95 |
Class I | | 0.64% | | $1,000 | | | $985 | | | $3.20 |
Class Z | | 0.59% | | $1,000 | | | $985 | | | $2.95 |
|
Based on Hypothetical 5% Annual Return |
Class N | | 0.99% | | $1,000 | | | $1,020 | | | $5.04 |
Class I | | 0.64% | | $1,000 | | | $1,022 | | | $3.26 |
Class Z | | 0.59% | | $1,000 | | | $1,022 | | | $3.01 |
| * | Expenses are equal to the Fund’s annualized expense ratio multiplied by the average account value over the period, multiplied by the number of days in the most recent fiscal half-year (184), then divided by 365. |
3
| | |
| | | AMG GW&K ESG Bond Fund Portfolio Manager’s Comments (unaudited) |
| | | |
| | | |
| | | | | | | | |
THE YEAR IN REVIEW AMG GW&K ESG Bond Fund Class N (the “Fund”) shares returned (13.17)% for the year ended December 31, 2022, compared with the (13.01)% return for its current benchmark, the Bloomberg U.S. Aggregate Bond Index (the “Index”). MARKET OVERVIEW In the first quarter of 2022, fixed income markets experienced their worst quarter in more than four decades amid an extraordinary confluence of economic and geopolitical shocks. Core inflation jumped to 5.4%, its highest level since 1983, on a broad-based rise in consumer prices. The U.S. Federal Reserve (the Fed) responded in kind, intensifying its hawkish rhetoric and laying out an aggressive course of hikes to bring inflation back to target. And in addition to exacting a tragic human toll, Russia’s invasion of Ukraine exacerbated already strained supply chains and commodity markets, threatening acute and prolonged shortages of materials vital to the basic functioning of the global economy. But for all this uncertainty and turmoil, there was a notable divergence between the performance of rates and credit; the former extended a historically severe downdraft, while the latter continued to enjoy a remarkably benign trading environment. How this disconnect eventually would resolve itself was a central question before investors, though policy uncertainty and heightened tensions seemed unlikely to subside anytime soon. More volatility followed in the second quarter, as bonds traded in a wide range and struggled to commit to a consistent narrative. The central question revolved around how persistent inflation would be and what policy measures would be necessary to quell it. A natural deceleration would allow the Fed to pursue less aggressive policy and possibly achieve a soft landing; more recalcitrant price pressure would require the Fed to mount a harsher response and invite a potential recession. The implications of these two different paths were at odds, leading to a broad lack of conviction with no clear market direction. Similarly, puzzling was a consumer with a strong proclivity to spend but a deeply pessimistic outlook and a corporate sector earning solid profits but starting to announce layoffs. Additionally, China offered a potential bright spot as it emerged from recent shutdowns, but the Ukraine conflict lingered as a major threat to global energy and commodity markets. An imminent resolution to any of these tensions seemed unlikely, so disciplined risk management and careful analysis of relative value were of particular importance for the months ahead. | | | | Fixed income markets were under extraordinary pressure in the third quarter as investors continued to adapt to restrictive monetary policy after more than a decade of accommodation. Stubbornly rising prices, hawkish central banks, and various geopolitical forces combined to tighten financial conditions and raise the cost of borrowing around the world. Defying expectations that it had peaked, inflation remained elevated and manifested across a broader and more entrenched collection of goods and services. The Fed also confounded expectations, projecting a more cautious outlook and a more aggressive path of hikes than most economists had anticipated. International pressures escalated as well, as currency market dislocations, political leadership changes in Europe and Asia, and multiple energy crises collectively drove a heightened sense of uncertainty. The variety and momentum of these forces suggested no near-term end to volatility, especially against a backdrop of increasingly expensive capital. Bonds rebounded in the fourth quarter amid growing confidence that central banks have succeeded in slowing inflation and will soon be able to pursue less restrictive policy. This modest rally nevertheless ended up being too little, too late to help the bond market avoid its worst annual performance on record and an unprecedented second consecutive year of losses. Sentiment among both investors and consumers may have reached an inflection point, but data continue to justify some measure of caution: inflation is still stubbornly above the Fed’s target, the labor market shows few signs of loosening and corporations have yet to see a meaningful deterioration in earnings. Only the rate-sensitive housing market really stands out as a casualty of the Fed’s tightening campaign to this point. Whether the end of the cycle is imminent is likely to remain an open question, especially as investors await the realization of the “long and variable lag” that has yet to be fully reflected across so many segments of the economy. FUND REVIEW The Fund slightly underperformed the Index during the fiscal year. Yield curve positioning was a relative positive, given the Fund’s shorter relative duration in a period of rising rates. Our overweight allocation to corporates had a negative impact to performance amid the heightened spread volatility. Our preference for lower-rated securities within the investment grade corporate space also had a negative effect. On | | | | the positive side, being slightly underweight mortgage-backed securities (MBS) within Securitized and our bias to higher coupon mortgages were helpful to relative performance. Our out-of-benchmark allocation to high yield had little incremental impact on relative performance. ESG (Environmental, Social, and Governance) remained an important area of focus for the corporate bond market in what could be viewed as a transition year in 2022. A growing list of companies have moved beyond publishing sustainability reports to set emissions reduction and net zero targets over the past year. Investors shook off an overall difficult market environment, from geopolitical turmoil to interest rate volatility, to demonstrate continued strong interest in ESG. This was also a landmark year for global sustainability regulation, with regulators across Europe, North America, and Asia introducing new rules and proposals related to reporting for both corporations and investors. In the U.S., the Inflation Reduction Act is poised to provide policy support for many companies of interest to ESG investors. We continue to integrate ESG as a core part of our fundamental investment process, while monitoring regulatory and policy actions that could influence the ESG investing landscape in the coming years. OUTLOOK The disconnect between the Fed’s projections and market pricing has widened following the most recent Summary of Economic Projections (SEP). The median estimate of Federal Open Market Committee (FOMC) participants for the overnight rate at the end of 2023 is 5.125%, up from 4.625% in September; the Fed Funds futures market sees a terminal rate of nearly 5.0% in June of 2023, and then two cuts by year end. There has also been a small but not insignificant chorus of economists calling for the FOMC to raise its target inflation to 3.0% from 2.0%, prompting objections that this would undermine the Fed’s hard-earned credibility. These are just two sources of tension in the rates market, and their resolution could have significant implications for both the level and the shape of the yield curve. We don’t believe investors are being sufficiently compensated for these risks, so duration and curve positioning is positioned relatively neutral to the benchmark. Our fundamental view of credit is broadly constructive, and we believe balance sheets in general are sound and liquidity is sufficient. But we recognize the potential for macroeconomic forces to |
4
| | |
| | | AMG GW&K ESG Bond Fund Portfolio Manager’s Comments (continued) |
| | | |
| | | |
| | | | | | | | |
| alter this landscape and we don’t believe all these risks are adequately reflected in valuations. Consequently, our allocation to corporate credit is at the lower end of its historical range. Within the space, we see the best value at the front end, where higher quality credits in less rate-sensitive sectors offer attractive yields and compelling breakevens. | | | | We have also been able to identify names that we believe can improve their credit profiles independently of a challenging macro backdrop. Our exposure to mortgages is neutral, as we believe the benefits of lower originations and potentially lower rate volatility are offset by event risks surrounding quantitative tightening and middling spread levels. | | | | The views expressed represent the opinions of GW&K Investment Management, LLC as of December 31, 2022, and are not intended as a forecast or guarantee of future results, and are subject to change without notice. |
| | | | | | | | |
| | | | | | | | |
5
| | |
| | | AMG GW&K ESG Bond Fund Portfolio Manager’s Comments (continued) |
CUMULATIVE TOTAL RETURN PERFORMANCE
AMG GW&K ESG Bond Fund’s cumulative total return is based on the daily change in net asset value (NAV), and assumes that all dividends and distributions were reinvested. The graph compares a hypothetical $10,000 investment made in the AMG GW&K ESG Bond Fund’s Class N shares on December 31, 2012, to a $10,000 investment made in the Bloomberg U.S. Aggregate Bond Index for the same time period. The graph and table do not reflect the deduction of taxes that a shareholder would pay on a Fund distribution or redemption of shares. The listed returns for the Fund are net of expenses and the returns for the index exclude expenses. Total returns would have been lower had certain expenses not been reduced.
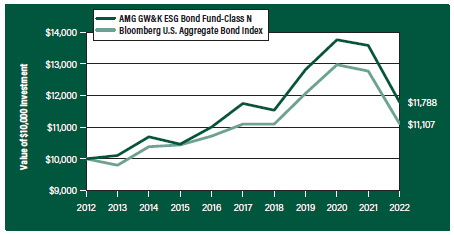
The table below shows the average annual total returns for the AMG GW&K ESG Bond Fund and the Bloomberg U.S. Aggregate Bond Index for the same time periods ended December 31, 2022.
| | | | | | | | | | | | | | | | | | | | |
| | | One | | | Five | | | Ten | | | Since | | | Inception | |
| Average Annual Total Returns1 | | Year | | | Years | | | Years | | | Inception | | | Date | |
AMG GW&K ESG Bond Fund2, 3, 4, 5, 6, 7, 8, 9, 10, 11, 12 | |
| | | | | |
Class N | | | (13.17%) | | | | 0.07% | | | | 1.66% | | | | 7.11% | | | | 06/01/84 | |
| | | | | |
Class I | | | (12.99%) | | | | 0.26% | | | | — | | | | 1.68% | | | | 04/01/13 | |
| | | | | |
Bloomberg U.S. Aggregate Bond Index13 | | | (13.01%) | | | | 0.02% | | | | 1.06% | | | | 6.40% | | | | 06/01/84 | † |
The performance data shown represents past performance. Past performance is not a guarantee of future results. Current performance may be lower or higher than the performance data quoted. The investment return and principal value of an investment will fluctuate so that an investor’s shares, when redeemed, may be worth more or less than their original cost.
Investors should carefully consider the Fund’s investment objectives, risks, charges and expenses before investing. For performance information through the most recent month end, current net asset values per share for the Fund and other information, please call 800.548.4539 or visit our website at amgfunds.com for a free prospectus. Read it carefully before investing or sending money.
Distributed by AMG Distributors, Inc., member FINRA/SIPC.
| † | Date reflects inception date of the Fund, not the index. |
| 1 | Total return equals income yield plus share price change and assumes reinvestment of all dividends and capital gain distributions. Returns are net of fees and may reflect offsets of Fund expenses as described in the prospectus. No adjustment has been made for taxes payable by shareholders on their reinvested dividends and capital gain distributions. Returns for periods greater than one year are annualized. The listed returns on the Fund are net of expenses and based on the published NAV as of December 31, 2022. All returns are in U.S. Dollars($). |
|
2 As of March 19, 2021, the Fund’s subadvisor was changed to GW&K Investment Management, LLC. Prior to March 19, 2021, the Fund was known as the AMG Managers Loomis Sayles Bond Fund and had different principal investment strategies and corresponding risks. Performance shown for periods prior to March 19, 2021, reflects the performance and investment strategies of the Fund’s previous subadvisor, Loomis, Sayles & Company, L.P. The Fund’s past performance would have been different if the Fund were managed by the current subadvisor and strategy, and the Fund’s prior performance record might be less pertinent for investors considering whether to purchase shares of the Fund. 3 From time to time, the Fund’s investment manager has waived fees and/or absorbed Fund expenses, which has resulted in higher returns. 4 The Fund is subject to the risks associated with investments in debt securities, such as default risk and fluctuations in the perception of the debtor’s ability to pay its creditors. Changing interest rates may adversely affect the value of an investment. An increase in interest rates typically causes the value of bonds and other fixed income securities to fall. 5 To the extent that the Fund invests in asset-backed or mortgage-backed securities, its exposure to prepayment and extension risks may be greater than investments in other fixed income securities. 6 High-yield bonds (also known as “junk bonds”) may be subject to greater levels of interest rate, credit, and liquidity risk than investments in higher rated securities. These securities are considered predominantly speculative with respect to the issuer’s continuing ability to make principal and interest payments. The issuers of the Fund’s holdings may be involved in bankruptcy proceedings, reorganizations, or financial restructurings, and are not as strong financially as higher-rated issuers. 7 Obligations of certain government agencies are not backed by the full faith and credit of the U.S. government. If one of these agencies defaulted on a loan, there is no guarantee that the U.S. government would provide financial support. Additionally, debt securities of the U.S. government may be affected by changing interest rates and subject to prepayment risk. 8 Market prices of investments held by the Fund may fall rapidly or unpredictably due to a variety of economic or political factors, market conditions, disasters or public health issues, or in response to events that affect particular industries or companies. 9 Investments in international securities are subject to certain risks of overseas investing including currency fluctuations and changes in political and economic conditions, which could result in |
6
| | |
| | | AMG GW&K ESG Bond Fund Portfolio Manager’s Comments (continued) |
| | | |
| | | |
| | | | | | | | |
significant market fluctuations. These risks are magnified in emerging markets. 10 Applying the Fund’s ESG investment criteria may result in the selection or exclusion of securities of certain issuers for reasons other than performance, and the Fund may underperform funds that do not utilize an ESG investment strategy. The application of his strategy may affect the Fund’s exposure to certain companies, sectors, regions, countries or types of investments, which could negatively impact the Fund’s performance depending on whether such investments are in or out of favor. Applying ESG criteria to investment decisions is qualitative and subjective by nature, and there is no guarantee that the criteria utilized by the subadviser or any judgment exercised by the | | | | subadviser will reflect the beliefs or values of any particular investor. 11 Because exchange-traded funds (ETFs) incur their own costs, investing in them could result in a higher cost to the investor. Additionally, the fund will be indirectly exposed to all the risks of securities held by the ETFs. 12 Factors unique to the municipal bond market may negatively affect the value in municipal bonds. 13 The Bloomberg U.S. Aggregate Bond Index an index of the U.S. investment-grade fixed-rate bond market, including both government and corporate bonds. Unlike the Fund, the Bloomberg U.S. Aggregate Bond Index is unmanaged, is not available for investment and does not incur expenses. | | | | “Bloomberg®” and any Bloomberg index described herein are service marks of Bloomberg Finance L.P. and its affiliates, including Bloomberg Index Services Limited (“BISL”), the administrator of the index (collectively, “Bloomberg”) and have been licensed for use for certain purposes by AMG Funds LLC. Bloomberg is not affiliated with AMG Funds LLC, and Bloomberg does not approve, endorse, review, or recommend the fund described herein. Bloomberg does not guarantee the timeliness, accurateness, or completeness of any data or information relating to such fund. Not FDIC insured, nor bank guaranteed. May lose value. |
7
| | |
| | | AMG GW&K ESG Bond Fund Fund Snapshots (unaudited) December 31, 2022 |
PORTFOLIO BREAKDOWN
| | | | |
| Category | | % of
Net Assets | |
| | |
Corporate Bonds and Notes | | | 51.4 | |
| | |
U.S. Government and Agency Obligations | | | 40.5 | |
| | |
Municipal Bonds | | | 5.9 | |
| | |
Foreign Government Obligations | | | 0.9 | |
| | |
Short-Term Investments | | | 2.1 | |
| | |
Other Assets, less Liabilities | | | (0.8) | |
| | |
| Rating | | % of Market Value1 |
| | |
U.S. Government and Agency Obligations | | 41.0 |
| | |
Aaa/AAA | | 2.2 |
| | |
Aa/AA | | 8.6 |
| | |
A | | 7.0 |
| | |
Baa/BBB | | 23.7 |
| | |
Ba/BB | | 16.4 |
| | |
B | | 1.1 |
| 1 | Includes market value of long-term fixed-income securities only. |
TOP TEN HOLDINGS
| | |
| Security Name | | % of
Net Assets |
| | |
U.S. Treasury Bonds, 2.250%, 05/15/41 | | 3.0 |
| | |
FHLMC, 3.000%, 04/01/51 | | 3.0 |
| | |
FNMA, 3.500%, 02/01/35 | | 2.2 |
| | |
FNMA, 3.500%, 08/01/49 | | 2.1 |
| | |
FNMA, 2.000%, 04/01/51 | | 2.1 |
| | |
U.S. Treasury Bonds, 1.875%, 02/15/51 | | 2.1 |
| | |
FNMA, 3.500%, 02/01/47 | | 2.0 |
| | |
U.S. Treasury Bonds, 3.125%, 05/15/48 | | 1.9 |
| | |
FHLMC, 3.500%, 02/01/50 | | 1.8 |
| | |
U.S. Treasury Bonds, 5.000%, 05/15/37 | | 1.8 |
| | | |
| | |
Top Ten as a Group | | 22.0 |
| | |
Credit quality ratings shown above reflect the highest rating assigned by either Standard & Poor’s (“S&P”), Moody’s Investors Service, Inc. (“Moody’s”) or Fitch. These rating agencies are independent, nationally recognized statistical rating organizations and are widely used. Investment grade ratings are credit ratings of BBB- or higher. Below investment grade ratings are credit ratings of BB+ or lower. Investments designated N/R are not rated by any of the rating agencies. Unrated investments do not necessarily indicate low credit quality. Credit quality ratings are subject to change.
Because a fund’s strategy may result in multiple investments in particular sectors of the economy, its performance may depend on the performance of those sectors and may fluctuate more widely than investments diversified across more sectors. For additional information on these and other risk considerations, please see the Fund’s prospectus.
Any sectors, industries, or securities discussed should not be perceived as investment recommendations. Mention of a specific security should not be considered a recommendation to buy or solicitation to sell that security. Specific securities mentioned in this report may have been sold from the Fund’s portfolio of investments by the time you receive this report.
8
| | |
| | | AMG GW&K ESG Bond Fund Schedule of Portfolio Investments December 31, 2022 |
| | | | | | | | |
| | |
| | | Principal
Amount | | | Value | |
Corporate Bonds and Notes - 51.4% | | | | | |
| | |
Financials - 12.2% | | | | | | | | |
| | |
AerCap Ireland Capital DAC/AerCap Global Aviation Trust (Ireland) 1.650%, 10/29/24 | | | $5,450,000 | | | | $5,027,082 | |
| | |
Aircastle, Ltd. (Bermuda)
5.250%, 08/11/251 | | | 2,282,000 | | | | 2,194,686 | |
| | |
American Express Co. | | | | | | | | |
(3.550% to 09/15/26 then U.S. Treasury Yield Curve CMT 5 year + 2.854%), 3.550%, 09/15/262,3,4 | | | 1,195,000 | | | | 981,693 | |
| | |
American Tower Corp.
4.400%, 02/15/265 | | | 1,900,000 | | | | 1,851,418 | |
| | |
Bank of America Corp. | | | | | | | | |
(3.559% to 04/23/26 then 3 month LIBOR + 1.060%), 3.559%, 04/23/272,4 | | | 2,850,000 | | | | 2,670,080 | |
| | |
MTN, (4.330% to 03/15/49 then 3 month LIBOR + 1.520%), 4.330%, 03/15/502,4 | | | 2,775,000 | | | | 2,276,024 | |
| | |
The Bank of New York Mellon Corp. | | | | | | | | |
Series G, (4.700% to 09/20/25 then U.S. Treasury Yield Curve CMT 5 year + 4.358%), 4.700%, 09/20/252,3,4 | | | 4,300,000 | | | | 4,128,559 | |
| | |
The Charles Schwab Corp. | | | | | | | | |
Series I, (4.000% to 06/01/26 then U.S. Treasury Yield Curve CMT 5 year + 3.168%), 4.000%, 06/01/262,3,4 | | | 4,400,000 | | | | 3,817,000 | |
| | |
Crown Castle, Inc.
4.000%, 03/01/27 | | | 2,300,000 | | | | 2,193,392 | |
| | |
First-Citizens Bank & Trust Co.
6.125%, 03/09/28 | | | 2,825,000 | | | | 2,870,967 | |
| | |
The Goldman Sachs Group, Inc.
6.750%, 10/01/37 | | | 1,850,000 | | | | 1,973,993 | |
| | |
JPMorgan Chase & Co. | | | | | | | | |
(1.470% to 09/22/26 then SOFR + 0.765%), 1.470%, 09/22/272,4 | | | 3,104,000 | | | | 2,687,328 | |
| | |
Morgan Stanley
3.950%, 04/23/27 | | | 2,200,000 | | | | 2,077,664 | |
(4.431% to 01/23/29 then 3 month LIBOR + 1.628%), 4.431%, 01/23/302,4 | | | 2,948,000 | | | | 2,743,714 | |
| | |
Owl Rock Capital Corp.
4.250%, 01/15/26 | | | 2,300,000 | | | | 2,111,443 | |
| | |
SBA Communications Corp.
3.875%, 02/15/27 | | | 3,700,000 | | | | 3,343,000 | |
| | |
SLM Corp.
3.125%, 11/02/26 | | | 3,365,000 | | | | 2,861,764 | |
4.200%, 10/29/25 | | | 838,000 | | | | 766,733 | |
| | |
Starwood Property Trust, Inc.
4.750%, 03/15/25 | | | 1,700,000 | | | | 1,622,224 | |
| | |
Truist Financial Corp. | | | | | | | | |
Series P, (4.950% to 12/01/25 then U.S. Treasury Yield Curve CMT 5 year + 4.605%), 4.950%, 09/01/252,3,4 | | | 3,400,000 | | | | 3,250,740 | |
| | | | | | | | |
| | |
| | | Principal
Amount | | | Value | |
| | |
VICI Properties LP/VICI Note Co., Inc.
3.500%, 02/15/251 | | | $1,900,000 | | | | $1,791,377 | |
| | |
Wells Fargo & Co., MTN | | | | | | | | |
(2.879% to 10/30/29 then 3 Month Term SOFR + 1.432%), 2.879%, 10/30/302,4 | | | 3,435,000 | | | | 2,917,705 | |
| | |
Weyerhaeuser Co.
6.875%, 12/15/33 | | | 2,600,000 | | | | 2,788,953 | |
| | |
Wynn Las Vegas LLC/Wynn Las Vegas Capital Corp.
5.500%, 03/01/251 | | | 1,250,000 | | | | 1,186,682 | |
| | |
Total Financials | | | | | | | 60,134,221 | |
| | |
Industrials - 37.2% | | | | | | | | |
| | |
Advocate Health & Hospitals Corp.
4.272%, 08/15/48 | | | 1,700,000 | | | | 1,443,252 | |
| | |
AECOM
5.125%, 03/15/27 | | | 1,650,000 | | | | 1,588,125 | |
| | |
Air Products and Chemicals, Inc.
2.700%, 05/15/40 | | | 2,450,000 | | | | 1,822,883 | |
| | |
Alcoa Nederland Holding, B.V. (Netherlands)
4.125%, 03/31/291 | | | 5,750,000 | | | | 5,101,162 | |
| | |
Amazon.com, Inc.
4.600%, 12/01/255 | | | 5,053,000 | | | | 5,040,560 | |
| | |
Anglo American Capital PLC (United Kingdom)
2.875%, 03/17/311,5 | | | 3,554,000 | | | | 2,901,876 | |
| | |
Anheuser-Busch InBev Worldwide, Inc.
4.375%, 04/15/38 | | | 2,200,000 | | | | 1,966,603 | |
| | |
Aramark Services, Inc.
5.000%, 02/01/281,5 | | | 3,220,000 | | | | 3,004,051 | |
| | |
Ardagh Metal Packaging Finance USA LLC/Ardagh Metal Packaging Finance PLC
3.250%, 09/01/281 | | | 3,500,000 | | | | 2,973,058 | |
| | |
Ashtead Capital, Inc.
1.500%, 08/12/261 | | | 3,536,000 | | | | 3,017,590 | |
| | |
AT&T, Inc.
4.300%, 02/15/30 | | | 2,200,000 | | | | 2,071,513 | |
| | |
Ball Corp.
2.875%, 08/15/30 | | | 3,875,000 | | | | 3,092,715 | |
| | |
Broadcom Corp./Broadcom Cayman Finance, Ltd.
3.875%, 01/15/27 | | | 3,019,000 | | | | 2,855,642 | |
| | |
CCO Holdings LLC/CCO Holdings Capital Corp.
5.500%, 05/01/261 | | | 2,000,000 | | | | 1,936,201 | |
| | |
Celanese US Holdings LLC
6.050%, 03/15/25 | | | 5,085,000 | | | | 5,065,216 | |
| | |
Centene Corp.
3.375%, 02/15/305 | | | 3,650,000 | | | | 3,085,601 | |
| | |
Cisco Systems, Inc.
5.500%, 01/15/40 | | | 1,650,000 | | | | 1,716,999 | |
| | |
Clearwater Paper Corp.
4.750%, 08/15/281 | | | 1,950,000 | | | | 1,713,418 | |
The accompanying notes are an integral part of these financial statements.
9
| | |
| | | AMG GW&K ESG Bond Fund Schedule of Portfolio Investments (continued) |
| | | | | | | | |
| | |
| | | Principal Amount | | | Value | |
| |
Industrials - 37.2% (continued) | | | | | |
| | |
The Coca-Cola Co.
2.500%, 06/01/40 | | | $2,400,000 | | | | $1,748,822 | |
| | |
Cogent Communications Group, Inc.
3.500%, 05/01/261 | | | 3,365,000 | | | | 3,056,909 | |
| | |
CommonSpirit Health
3.347%, 10/01/29 | | | 1,950,000 | | | | 1,696,984 | |
| | |
Crown Americas LLC/Crown Americas Capital Corp. V
4.250%, 09/30/265 | | | 3,350,000 | | | | 3,194,493 | |
| | |
Dell International LLC/EMC Corp.
8.100%, 07/15/36 | | | 972,000 | | | | 1,089,241 | |
| | |
Dell, Inc.
7.100%, 04/15/28 | | | 2,950,000 | | | | 3,145,746 | |
| | |
Delta Air Lines, Inc.
7.375%, 01/15/265 | | | 3,100,000 | | | | 3,167,394 | |
| | |
Discovery Communications LLC
3.950%, 03/20/285 | | | 2,047,000 | | | | 1,816,889 | |
| | |
FMG Resources August 2006 Pty, Ltd. (Australia)
4.500%, 09/15/271 | | | 3,000,000 | | | | 2,767,500 | |
| | |
The Ford Foundation
Series 2020, 2.415%, 06/01/50 | | | 2,725,000 | | | | 1,714,252 | |
| | |
Freeport-McMoRan, Inc.
4.625%, 08/01/305 | | | 2,961,000 | | | | 2,757,859 | |
| | |
The Goodyear Tire & Rubber Co.
4.875%, 03/15/275 | | | 500,000 | | | | 457,365 | |
| | |
Graphic Packaging International LLC
3.500%, 03/01/291 | | | 2,850,000 | | | | 2,428,279 | |
| | |
Hanesbrands, Inc.
4.875%, 05/15/261,5 | | | 3,250,000 | | | | 2,904,106 | |
| | |
Hasbro, Inc.
3.900%, 11/19/29 | | | 3,425,000 | | | | 3,043,744 | |
| | |
HB Fuller Co.
4.250%, 10/15/28 | | | 3,400,000 | | | | 3,009,000 | |
| | |
HCA, Inc.
3.500%, 09/01/30 | | | 3,050,000 | | | | 2,630,553 | |
| | |
Hilton Domestic Operating Co., Inc.
4.875%, 01/15/30 | | | 3,600,000 | | | | 3,262,356 | |
| | |
The Home Depot, Inc.
5.875%, 12/16/36 | | | 1,600,000 | | | | 1,711,065 | |
| | |
Howmet Aerospace, Inc.
6.875%, 05/01/25 | | | 2,000,000 | | | | 2,052,340 | |
| | |
KB Home
4.800%, 11/15/29 | | | 1,222,000 | | | | 1,062,639 | |
6.875%, 06/15/275 | | | 1,751,000 | | | | 1,761,418 | |
| | |
Lamar Media Corp.
4.875%, 01/15/295 | | | 3,250,000 | | | | 2,984,075 | |
| | |
Merck & Co., Inc.
1.900%, 12/10/28 | | | 7,010,000 | | | | 6,018,509 | |
| | |
Meritage Homes Corp.
6.000%, 06/01/25 | | | 485,000 | | | | 482,666 | |
| | | | | | | | |
| | |
| | | Principal Amount | | | Value | |
| | |
MGM Resorts International
5.750%, 06/15/25 | | | $1,175,000 | | | | $1,141,954 | |
| | |
Microsoft Corp.
2.525%, 06/01/50 | | | 2,450,000 | | | | 1,612,220 | |
| | |
MSCI, Inc.
3.250%, 08/15/331 | | | 2,015,000 | | | | 1,556,101 | |
| | |
Mueller Water Products, Inc.
4.000%, 06/15/291 | | | 3,000,000 | | | | 2,636,250 | |
| | |
Murphy Oil USA, Inc.
4.750%, 09/15/29 | | | 3,250,000 | | | | 2,973,848 | |
| | |
Newell Brands, Inc.
4.450%, 04/01/266 | | | 3,400,000 | | | | 3,198,704 | |
| | |
Novelis Corp.
3.250%, 11/15/261 | | | 3,175,000 | | | | 2,846,419 | |
| | |
Owens Corning
7.000%, 12/01/36 | | | 1,800,000 | | | | 1,904,913 | |
| | |
Parker-Hannifin Corp.
3.250%, 06/14/29 | | | 1,900,000 | | | | 1,696,696 | |
| | |
Penske Automotive Group, Inc.
3.500%, 09/01/255 | | | 2,000,000 | | | | 1,856,119 | |
| | |
Prime Security Services Borrower LLC/Prime Finance, Inc.
5.750%, 04/15/261 | | | 3,250,000 | | | | 3,128,125 | |
| | |
PulteGroup, Inc.
6.000%, 02/15/35 | | | 2,050,000 | | | | 1,960,131 | |
| | |
SK Hynix, Inc. (South Korea)
2.375%, 01/19/311 | | | 3,000,000 | | | | 2,199,494 | |
| | |
Sonoco Products Co.
2.850%, 02/01/32 | | | 3,682,000 | | | | 2,992,949 | |
| | |
Sysco Corp.
2.400%, 02/15/30 | | | 4,475,000 | | | | 3,719,568 | |
| | |
Teleflex, Inc.
4.250%, 06/01/281 | | | 3,350,000 | | | | 3,058,081 | |
| | |
Tenet Healthcare Corp.
4.875%, 01/01/261 | | | 3,350,000 | | | | 3,167,903 | |
| | |
Toll Brothers Finance Corp.
4.875%, 03/15/27 | | | 3,250,000 | | | | 3,103,212 | |
| | |
Travel + Leisure Co.
5.650%, 04/01/246 | | | 2,700,000 | | | | 2,659,368 | |
| | |
Twilio, Inc.
3.625%, 03/15/29 | | | 600,000 | | | | 487,440 | |
3.875%, 03/15/315 | | | 2,694,000 | | | | 2,137,298 | |
| | |
United Parcel Service, Inc.
6.200%, 01/15/38 | | | 1,500,000 | | | | 1,658,363 | |
| | |
United Rentals North America, Inc.
3.875%, 02/15/31 | | | 3,650,000 | | | | 3,059,759 | |
| | |
Verizon Communications, Inc.
3.875%, 02/08/295 | | | 3,460,000 | | | | 3,246,398 | |
| | |
VF Corp.
2.950%, 04/23/305 | | | 2,100,000 | | | | 1,744,175 | |
The accompanying notes are an integral part of these financial statements.
10
| | |
| | | AMG GW&K ESG Bond Fund Schedule of Portfolio Investments (continued) |
| | | | | | | | |
| | | Principal
Amount | | | Value | |
| | |
Industrials - 37.2% (continued) | | | | | | | | |
| | |
VMware, Inc.
3.900%, 08/21/27 | | | $3,400,000 | | | | $3,173,153 | |
| | |
Walgreens Boots Alliance, Inc.
4.800%, 11/18/44 | | | 2,520,000 | | | | 2,109,022 | |
| | |
Walmart, Inc.
4.050%, 06/29/48 | | | 1,850,000 | | | | 1,641,798 | |
| | |
WESCO Distribution, Inc.
7.125%, 06/15/251 | | | 1,600,000 | | | | 1,620,019 | |
| | |
Western Digital Corp.
4.750%, 02/15/26 | | | 1,916,000 | | | | 1,804,336 | |
| | |
Yum! Brands, Inc.
3.625%, 03/15/31 | | | 3,550,000 | | | | 2,976,675 | |
| | |
Total Industrials | | | | | | | 183,431,160 | |
| | |
Utilities - 2.0% | | | | | | | | |
| | |
Dominion Energy, Inc. | | | | | | | | |
Series B, (4.650% to 12/15/24 then U.S. Treasury Yield Curve CMT 5 year + 2.993%), 4.650%, 12/15/242,3,4 | | | 3,950,000 | | | | 3,456,250 | |
| | |
National Rural Utilities Cooperative Finance Corp.
1.350%, 03/15/31 | | | 4,750,000 | | | | 3,509,956 | |
| | |
Northern States Power Co.
2.900%, 03/01/50 | | | 3,800,000 | | | | 2,599,065 | |
| | |
Total Utilities | | | | | | | 9,565,271 | |
| | |
Total Corporate Bonds and Notes | | | | | | | | |
(Cost $288,413,877) | | | | | | | 253,130,652 | |
| | |
Municipal Bonds - 5.9% | | | | | | | | |
| | |
California Health Facilities Financing Authority
4.190%, 06/01/37 | | | 3,500,000 | | | | 3,126,553 | |
| | |
California State General Obligation, School Improvements Build America Bonds,
7.550%, 04/01/39 | | | 2,300,000 | | | | 2,878,754 | |
| | |
Commonwealth of Massachusetts Series B,
4.110%, 07/15/31 | | | 3,660,000 | | | | 3,533,621 | |
| | |
Dallas Fort Worth International Airport, Series A
4.507%, 11/01/51 | | | 1,000,000 | | | | 898,819 | |
| | |
JobsOhio Beverage System,
Series A
2.833%, 01/01/38 | | | 3,700,000 | | | | 2,890,756 | |
| | |
Los Angeles Unified School District, School Improvements
5.750%, 07/01/34 | | | 3,225,000 | | | | 3,368,776 | |
| | |
Massachusetts School Building Authority | | | | | | | | |
Series B, 1.753%, 08/15/30 | | | 4,500,000 | | | | 3,673,920 | |
| | |
New Jersey Economic Development Authority, Pension Funding, Series A (National Insured)
7.425%, 02/15/29 | | | 3,550,000 | | | | 3,821,584 | |
| | |
Port Authority of New York & New Jersey
6.040%, 12/01/29 | | | 2,000,000 | | | | 2,109,782 | |
| | | | | | | | |
| | | Principal
Amount | | | Value | |
| | |
University of California, Series BI
1.697%, 05/15/29 | | | $3,650,000 | | | | $2,996,395 | |
| | |
Total Municipal Bonds | | | | | | | | |
(Cost $34,814,883) | | | | | | | 29,298,960 | |
| |
U.S. Government and Agency Obligations - 40.5% | | | | | |
| | |
Fannie Mae - 17.2% | | | | | | | | |
| | |
FNMA 2.000%, 04/01/51 | | | 12,427,952 | | | | 10,147,515 | |
2.500%, 11/01/50 | | | 5,079,053 | | | | 4,326,132 | |
3.500%, 02/01/35 to 02/01/51 | | | 39,894,854 | | | | 37,465,019 | |
4.000%, 07/01/44 to 01/01/51 | | | 24,014,213 | | | | 22,930,759 | |
4.500%, 05/01/48 to 06/01/49 | | | 6,969,461 | | | | 6,872,502 | |
5.000%, 05/01/50 | | | 3,240,435 | | | | 3,248,364 | |
| | |
Total Fannie Mae | | | | | | | 84,990,291 | |
| | |
Freddie Mac - 8.4% | | | | | | | | |
| | |
FHLMC 2.000%, 03/01/36 | | | 8,784,509 | | | | 7,835,185 | |
3.000%, 04/01/51 | | | 16,670,090 | | | | 14,676,474 | |
3.500%, 02/01/50 | | | 9,647,506 | | | | 8,898,566 | |
4.500%, 10/01/48 to 12/01/48 | | | 10,081,490 | | | | 9,887,915 | |
| | |
Total Freddie Mac | | | | | | | 41,298,140 | |
| |
U.S. Treasury Obligations - 14.9% | | | | | |
| | |
U.S. Treasury Bonds 1.250%, 05/15/50 | | | 4,625,000 | | | | 2,489,009 | |
1.875%, 02/15/51 | | | 15,912,000 | | | | 10,112,822 | |
2.250%, 05/15/41 | | | 19,759,000 | | | | 14,853,982 | |
2.500%, 02/15/46 | | | 2,096,000 | | | | 1,568,234 | |
3.125%, 05/15/48 | | | 11,143,000 | | | | 9,364,908 | |
3.500%, 02/15/39 | | | 7,852,000 | | | | 7,375,052 | |
5.000%, 05/15/37 | | | 7,846,000 | | | | 8,762,388 | |
6.750%, 08/15/26 | | | 2,579,000 | | | | 2,800,431 | |
| | |
U.S. Treasury Notes 0.250%, 03/15/24 | | | 5,868,000 | | | | 5,562,910 | |
0.500%, 02/28/26 | | | 3,270,000 | | | | 2,913,749 | |
2.500%, 01/31/25 | | | 3,450,000 | | | | 3,319,008 | |
2.625%, 02/15/29 | | | 4,763,000 | | | | 4,402,054 | |
| | |
Total U.S. Treasury Obligations | | | | | | | 73,524,547 | |
| |
Total U.S. Government and Agency Obligations | | | | | |
(Cost $237,183,222) | | | | | | | 199,812,978 | |
| |
Foreign Government Obligation - 0.9% | | | | | |
| | |
The Korea Development Bank (South Korea) 0.500%, 10/27/23 | | | | | | | | |
(Cost $4,552,913) | | | 4,550,000 | | | | 4,394,653 | |
| | |
Short-Term Investments - 2.1% | | | | | | | | |
| |
Joint Repurchase Agreements - 1.5%7 | | | | | |
| | |
Bank of America Securities, Inc., dated 12/30/22, due 01/03/23, 4.300% total to be received $1,761,488 (collateralized by various U.S. Government Agency Obligations, 1.500% - 6.500%, 05/01/37 - 05/01/58, totaling $1,795,860) | | | 1,760,647 | | | | 1,760,647 | |
The accompanying notes are an integral part of these financial statements.
11
| | |
| | | AMG GW&K ESG Bond Fund Schedule of Portfolio Investments (continued) |
| | | | | | | | |
| | | Principal
Amount | | | Value | |
| |
Joint Repurchase Agreements - 1.5%7 | | | | | |
(continued) | | | | | | | | |
| | |
Citigroup Global Markets, Inc., dated 12/30/22, due 01/03/23, 4.250% total to be received $369,995 (collateralized by various U.S. Treasuries, 0.000% - 4.500%, 04/11/23 - 10/31/29, totaling $377,216) | | | $369,820 | | | | $369,820 | |
| | |
MUFG Securities America, Inc., dated 12/30/22, due 01/03/23, 4.300% total to be received $1,761,488 (collateralized by various U.S. Government Agency Obligations, 2.000% - 5.500%, 08/01/24 - 01/01/53, totaling $1,795,860) | | | 1,760,647 | | | | 1,760,647 | |
| | |
National Bank Financial, dated 12/30/22, due 01/03/23, 4.340% total to be received $1,761,496 (collateralized by various U.S. Treasuries, 0.000% - 4.435%, 01/03/23 - 09/09/49, totaling $1,795,860) | | | 1,760,647 | | | | 1,760,647 | |
| | |
RBC Dominion Securities, Inc., dated 12/30/22, due 01/03/23, 4.300% total to be received $1,761,488 (collateralized by various U.S. Government Agency Obligations, 2.000% - 6.000%, 09/01/24 - 10/20/52, totaling $1,795,860) | | | 1,760,647 | | | | 1,760,647 | |
| |
Total Joint Repurchase Agreements | | | | 7,412,408 | |
| | | | | | | | |
| | | Principal
Amount | | | Value | |
Repurchase Agreements - 0.6% | | | | | |
| | |
Fixed Income Clearing Corp., dated 12/30/22 due 01/03/23, 4.150% total to be received $3,071,416 (collateralized by a U.S. Treasury, 0.125%, 01/15/32, totaling $3,131,490) | | | $3,070,000 | | | | $3,070,000 | |
| |
Total Short-Term Investments | | | | | |
(Cost $10,482,408) | | | | 10,482,408 | |
| |
Total Investments - 100.8% | | | | | |
(Cost $575,447,303) | | | | 497,119,651 | |
| |
Other Assets, less Liabilities - (0.8)% | | | | (4,113,005 | ) |
| | |
Net Assets - 100.0% | | | | | | | $493,006,646 | |
| 1 | Security exempt from registration under Rule 144A of the Securities Act of 1933. This security may be resold in transactions exempt from registration, normally to qualified institutional buyers. At December 31, 2022, the value of these securities amounted to $57,189,287 or 11.6% of net assets. |
| 2 | Fixed to variable rate investment. The rate shown reflects the fixed rate in effect at December 31, 2022. Rate will reset at a future date. |
| 3 | Perpetuity Bond. The date shown represents the next call date. |
| 4 | Variable rate security. The rate shown is based on the latest available information as of December 31, 2022. Certain variable rate securities are not based on a published reference rate and spread but are determined by the issuer or agent and are based on current market conditions. These securities do not indicate a reference rate and spread in their description above. |
| 5 | Some of these securities, amounting to $25,458,950 or 5.2% of net assets, were out on loan to various borrowers and are collateralized by cash and various U.S. Treasury Obligations. See Note 4 of Notes to Financial Statements. |
| 6 | Step Bond: A debt instrument with either deferred interest payments or an interest rate that resets at specific times during its term. |
| 7 | Cash collateral received for securities lending activity was invested in these joint repurchase agreements. |
| | |
| CMT | | Constant Maturity Treasury |
| |
| FHLMC | | Freddie Mac |
| |
| FNMA | | Fannie Mae |
| |
| LIBOR | | London Interbank Offered Rate |
| |
| MTN | | Medium-Term Note |
| |
| National Insured | | National Public Finance Guarantee Corp. |
| |
| SOFR | | Secured Overnight Financing Rate |
The accompanying notes are an integral part of these financial statements.
12
| | |
| | | AMG GW&K ESG Bond Fund Schedule of Portfolio Investments (continued) |
The following table summarizes the inputs used to value the Fund’s investments by the fair value hierarchy levels as of December 31, 2022:
| | | | | | | | | | | | | | | | |
| | | Level 1 | | | Level 2 | | | Level 3 | | | Total | |
Investments in Securities | | | | | | | | | | | | | | | | |
| | | | |
Corporate Bonds and Notes† | | | — | | | $ | 253,130,652 | | | | — | | | $ | 253,130,652 | |
| | | | |
Municipal Bonds† | | | — | | | | 29,298,960 | | | | — | | | | 29,298,960 | |
| | | | |
U.S. Government and Agency Obligations† | | | — | | | | 199,812,978 | | | | — | | | | 199,812,978 | |
| | | | |
Foreign Government Obligation† | | | — | | | | 4,394,653 | | | | — | | | | 4,394,653 | |
| | | | |
Short-Term Investments | | | | | | | | | | | | | | | | |
| | | | |
Joint Repurchase Agreements | | | — | | | | 7,412,408 | | | | — | | | | 7,412,408 | |
| | | | |
Repurchase Agreements | | | — | | | | 3,070,000 | | | | — | | | | 3,070,000 | |
| | | | | | | | | | | | | | | | |
| | | | |
Total Investments in Securities | | | — | | | $ | 497,119,651 | | | | — | | | $ | 497,119,651 | |
| | | | | | | | | | | | | | | | |
| † | All corporate bonds and notes, municipal bonds, U.S. government and agency obligations and foreign government obligations held in the Fund are Level 2 securities. For a detailed breakout of corporate bonds and notes, municipal bonds, U.S. government and agency obligations and foreign government obligations by major industry or agency classification, please refer to the Fund’s Schedule of Portfolio Investments. |
The following table below is a reconciliation of investments in which significant unobservable inputs (Level 3) were used in determining fair value at December 31, 2022:
| | | | |
| | | Asset-Backed Securities | |
| |
Balance as of December 31, 2021 | | | $2,475,909 | |
| |
Accrued discounts (premiums) | | | 2,490 | |
| |
Realized gain (loss) | | | (207,677 | ) |
| |
Change in unrealized appreciation/depreciation | | | 4,633,827 | |
| |
Sales | | | (1,670,846 | ) |
| |
Paydown | | | (5,233,703 | ) |
| |
Transfers in to Level 3 | | | — | |
| |
Transfers out of Level 3 | | | — | |
| |
Balance as of December 31, 2022 | | | $0 | |
| |
| | | | |
| |
Net change in unrealized appreciation/depreciation on investments still held at December 31, 2022 | | | — | |
The accompanying notes are an integral part of these financial statements.
13
| | |
| | | AMG GW&K Enhanced Core Bond ESG Fund Portfolio Manager’s Comments (unaudited) |
| | | |
| | | |
| | | | | | | | |
THE YEAR IN REVIEW AMG GW&K Enhanced Core Bond ESG Fund (the “Fund”) Class N shares returned (14.17)% for the year ended December 31, 2022, compared to the return of (13.01)% for the Fund’s benchmark, the Bloomberg U.S. Aggregate Bond Index. MARKET OVERVIEW In the first quarter of 2022 fixed income markets experienced their worst quarter in more than four decades amid an extraordinary confluence of economic and geopolitical shocks. Core inflation jumped to 5.4%, its highest level since 1983, on a broad-based rise in consumer prices. The U.S. Federal Reserve (the Fed) responded in kind, intensifying their hawkish rhetoric and laying out an aggressive course of hikes to bring inflation back to target. And—in addition to exacting a tragic human toll—Russia’s invasion of Ukraine exacerbated already strained supply chains and commodity markets, threatening acute and prolonged shortages of materials vital to the basic functioning of the global economy. But for all this uncertainty and turmoil, there was a notable divergence between the performance of rates and credit; the former extended a historically severe downdraft, while the latter continued to enjoy a remarkably benign trading environment. How this disconnect eventually would resolve itself was a central question before investors, though policy uncertainty and heightened tensions seemed unlikely to subside anytime soon. More volatility followed in the second quarter, as bonds traded in a wide range and struggled to commit to a consistent narrative. The central question revolved around how persistent inflation would be and what policy measures would be necessary to quell it. A natural deceleration would allow the Fed to pursue less aggressive policy and possibly achieve a soft landing; more recalcitrant price pressure would require the Fed to mount a harsher response and invite a potential recession. The implications of these two different paths were at odds, leading to a broad lack of conviction with no clear market direction. Similarly, puzzling was a consumer with a strong proclivity to spend but a deeply pessimistic outlook and a corporate sector earning solid profits but starting to announce layoffs. Additionally, China offered a potential bright spot as it emerged from recent shutdowns, but the Ukraine conflict lingered as a major threat to global energy and commodity markets. An imminent resolution to any of these tensions seemed unlikely, so disciplined risk management and careful analysis of relative value were of particular importance for the months ahead. | | | | Fixed income markets were under extraordinary pressure in the third quarter as investors continued to adapt to restrictive monetary policy after more than a decade of accommodation. Stubbornly rising prices, hawkish central banks, and various geopolitical forces combined to tighten financial conditions and raise the cost of borrowing around the world. Defying expectations that it had peaked, inflation remained elevated and manifested across a broader and more entrenched collection of goods and services. The Fed also confounded expectations, projecting a more cautious outlook and a more aggressive path of hikes than most economists had anticipated. International pressures escalated as well, as currency market dislocations, political leadership changes in Europe and Asia, and multiple energy crises collectively drove a heightened sense of uncertainty. The variety and momentum of these forces suggested no near-term end to volatility, especially against a backdrop of increasingly expensive capital. Bonds rebounded in the fourth quarter amid growing confidence that central banks have succeeded in slowing inflation and will soon be able to pursue less restrictive policy. This modest rally nevertheless ended up being too little, too late to help the bond market avoid its worst annual performance on record and an unprecedented second consecutive year of losses. Sentiment among both investors and consumers may have reached an inflection point, but data continue to justify some measure of caution: inflation is still stubbornly above the Fed’s target, the labor market shows few signs of loosening, and corporations have yet to see a meaningful deterioration in earnings. Only the rate-sensitive housing market really stands out as a casualty of the Fed’s tightening campaign to this point. Whether the end of the cycle is imminent is likely to remain an open question, especially as investors await the realization of the “long and variable lag” that has yet to be fully reflected across so many segments of the economy. FUND REVIEW The Fund underperformed the Index during the fiscal year. Yield curve positioning was a relative positive, given the Fund’s shorter relative duration in a period of rising rates. Our overweight allocation to corporates had a negative impact on performance amid the heightened spread volatility. Our preference for lower-rated securities within the investment grade corporate space also had a negative effect. On | | | | the positive side, our bias to higher coupon mortgages was helpful to relative performance. Our out-of-benchmark allocation to high yield had an incrementally positive influence on overall corporate security selection. ESG (Environmental, Social, and Governance) remained an important area of focus for the corporate bond market in what could be viewed as a transition year in 2022. A growing list of companies have moved beyond publishing sustainability reports to set emissions reduction and net zero targets over the past year. Investors shook off an overall difficult market environment, from geopolitical turmoil to interest rate volatility, to demonstrate continued strong interest in ESG. This was also a landmark year for global sustainability regulation, with regulators across Europe, North America, and Asia introducing new rules and proposals related to reporting for both corporations and investors. In the U.S., the Inflation Reduction Act is poised to provide policy support for many companies of interest to ESG investors. We continue to integrate ESG as a core part of our fundamental investment process, while monitoring regulatory and policy actions that could influence the ESG investing landscape in the coming years. OUTLOOK The disconnect between the Fed’s projections and market pricing has widened following the most recent Summary of Economic Projections (SEP). The median estimate of Federal Open Market Committee (FOMC) participants for the overnight rate at the end of 2023 is 5.125%, up from 4.625% in September; the Fed Funds futures market sees a terminal rate of nearly 5% in June of 2023, and then two cuts by year end. There has also been a small but not insignificant chorus of economists calling for the FOMC to raise its target inflation to 3.0% from 2.0%, prompting objections that this would undermine the Fed’s hard-earned credibility. These are just two sources of tension in the rates market, and their resolution could have significant implications for both the level and the shape of the yield curve. We don’t believe investors are being sufficiently compensated for these risks, so duration and curve positioning is relatively neutral relative to its benchmark. Our fundamental view of credit is broadly constructive, and we believe balance sheets in general are sound and liquidity is sufficient. But we recognize the potential for macroeconomic forces to alter this landscape and we don’t believe all these |
14
| | |
| | | AMG GW&K Enhanced Core Bond ESG Fund Portfolio Manager’s Comments (continued) |
| | | |
| | | |
| | | | | | | | |
risks are adequately reflected in valuations. Consequently, our allocation to corporate credit is at the lower end of its historical range. Within the space, we see the best value at the front end, where higher quality credits in less rate-sensitive sectors offer attractive yields and compelling breakevens. We have also been able to identify names that we | | | | believe can improve their credit profiles independently of a challenging macro backdrop. Our exposure to mortgages is neutral, as we believe the benefits of lower originations and potentially lower rate volatility are offset by event risks surrounding quantitative tightening and middling spread levels. | | | | The views expressed represent the opinions of GW&K Investment Management, LLC as of December 31, 2022, and are not intended as a forecast or guarantee of future results, and are subject to change without notice. |
15
|
AMG GW&K Enhanced Core Bond ESG Fund Portfolio Manager’s Comments (continued) |
CUMULATIVE TOTAL RETURN PERFORMANCE
AMG GW&K Enhanced Core Bond ESG Fund’s cumulative total return is based on the daily change in net asset value (NAV), and assumes that all dividends and distributions were reinvested. The graph compares a hypothetical $10,000 investment made in the AMG GW&K Enhanced Core Bond ESG Fund’s Class N shares on December 31, 2012, to a $10,000 investment made in the Bloomberg U.S. Aggregate Bond Index for the same time period. The graph and table do not reflect the deduction of taxes that a shareholder would pay on a Fund distribution or redemption of shares. The listed returns for the Fund are net of expenses and the returns for the index exclude expenses. Total returns would have been lower had certain expenses not been reduced.
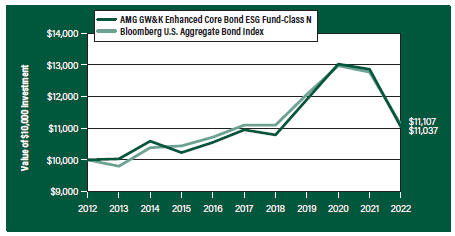
The table below shows the average annual total returns for the AMG GW&K Enhanced Core Bond ESG Fund and the Bloomberg U.S. Aggregate Bond Index for the same time periods ended December 31, 2022.
| | | | | | | | | | | | |
| | | One | | | | Five | | | | Ten | |
| Average Annual Total Returns1 | | Year | | | | Years | | | | Years | |
|
AMG GW&K Enhanced Core Bond ESG Fund2, 3, 4, 5, 6, 7, 8, 9 | |
| | | | | |
Class N | | (14.17%) | | | | 0.16% | | | | | 0.99% | |
| | | | | |
Class I | | (14.07%) | | | | 0.32% | | | | | 1.16% | |
| | | | | |
Class Z | | (14.00%) | | | | 0.41% | | | | | 1.24% | |
| | | | | |
Bloomberg U.S. Aggregate Bond Index10 | | (13.01%) | | | | 0.02% | | | | | 1.06% | |
The performance data shown represents past performance. Past performance is not a guarantee of future results. Current performance may be lower or higher than the performance data quoted. The investment return and principal value of an investment will fluctuate so that an investor’s shares, when redeemed, may be worth more or less than their original cost.
Investors should carefully consider the Fund’s investment objectives, risks, charges and expenses before investing. For performance information through the most recent month end, current net asset values per share for the Fund and other information, please call 800.548.4539 or visit our website at amgfunds.com for a free prospectus. Read it carefully before investing or sending money.
Distributed by AMG Distributors, Inc., member FINRA/SIPC.
| 1 | Total return equals income yield plus share price change and assumes reinvestment of all dividends and capital gain distributions. Returns are net of fees and may reflect offsets of Fund expenses as described in the prospectus. No adjustment has been made for taxes payable by shareholders on their reinvested dividends and capital gain distributions. Returns for periods greater than one year are annualized. The listed returns on the Fund are net of expenses and based on the published NAV as of December 31, 2022. All returns are in U.S. Dollars ($). |
|
2 From time to time, the Fund’s investment manager has waived its fees and/or absorbed Fund expenses, which has resulted in higher returns. 3 The Fund is subject to the risks associated with investments in debt securities, such as default risk and fluctuations in the perception of the debtor’s ability to pay its creditors. Changing interest rates may adversely affect the value of an investment. An increase in interest rates typically causes the value of bonds and other fixed income securities to fall. 4 To the extent that the Fund invests in asset-backed or mortgage-backed securities, its exposure to prepayment and extension risks may be greater than investments in other fixed income securities. 5 High-yield bonds (also known as “junk bonds”) may be subject to greater levels of interest rate, credit, and liquidity risk than investments in higher rated securities. These securities are considered predominantly speculative with respect to the issuer’s continuing ability to make principal and interest payments. The issuers of the Fund’s holdings may be involved in bankruptcy proceedings, reorganizations, or financial restructurings, and are not as strong financially as higher-rated issuers. 6 Investments in international securities are subject to certain risks of overseas investing including currency fluctuations and changes in political and economic conditions, which could result in significant market fluctuations. These risks are magnified in emerging markets. 7 Market prices of investments held by the Fund may fall rapidly or unpredictably due to a variety of economic or political factors, market conditions, disasters or public health issues, or in response to events that affect particular industries or companies. 8 Obligations of certain government agencies are not backed by the full faith and credit of the U.S. government. If one of these agencies defaulted on a loan, there is no guarantee that the U.S. government would provide financial support. Additionally, debt securities of the U.S. government may be affected by changing interest rates and subject to prepayment risk. 9 Applying the Fund’s ESG investment criteria may result in the selection or exclusion of securities of certain issuers for reasons other than performance, and the Fund may underperform funds that do not utilize an ESG investment strategy. The application of this strategy may affect the Fund’s exposure to certain companies, sectors, regions, countries or types of investments, which could negatively impact the Fund’s performance depending on whether such investments are in or out of favor. Applying ESG criteria to investment decisions is qualitative and subjective by nature, and there is no guarantee that the criteria utilized by the |
16
| | |
| | | AMG GW&K Enhanced Core Bond ESG Fund Portfolio Manager’s Comments (continued) |
| | | |
| | | |
| | | | | | | | |
Subadviser or any judgment exercised by the Subadviser will reflect the beliefs or values of any particular investor. 10 The Bloomberg U.S. Aggregate Bond Index is an index of the U.S. investment-grade fixed-rate bond market, including both government and corporate bonds. Unlike the Fund, the Bloomberg U.S. Aggregate Bond Index is unmanaged, is not available for investment and does not incur expenses. | | | | “Bloomberg®” and any Bloomberg index described herein are service marks of Bloomberg Finance L.P. and its affiliates, including Bloomberg Index Services Limited (“BISL”), the administrator of the index (collectively, “Bloomberg”) and have been licensed for use for certain purposes by AMG Funds LLC. Bloomberg is not affiliated with AMG Funds LLC, and Bloomberg does not approve, endorse, review, or recommend the fund described herein. Bloomberg | | | | does not guarantee the timeliness, accurateness, or completeness of any data or information relating to such fund. Not FDIC insured, nor bank guaranteed. May lose value. |
17
| | |
| | | AMG GW&K Enhanced Core Bond ESG Fund Fund Snapshots (unaudited) December 31, 2022 |
PORTFOLIO BREAKDOWN
| | | | |
| Category | | % of Net Assets | |
| | |
U.S. Government and Agency Obligations | | | 48.3 | |
| | |
Corporate Bonds and Notes | | | 42.5 | |
| | |
Municipal Bonds | | | 6.4 | |
| | |
Foreign Government Obligations | | | 0.8 | |
| | |
Short-Term Investments | | | 3.7 | |
| | |
Other Assets, less Liabilities | | | (1.7) | |
| | | | |
| Rating | | % of Market Value1 | |
| | |
U.S. Government and Agency Obligations | | | 49.2 | |
| | |
Aaa/AAA | | | 3.3 | |
| | |
Aa/AA | | | 7.0 | |
| | |
A | | | 8.1 | |
| | |
Baa/BBB | | | 22.6 | |
| | |
Ba/BB | | | 9.3 | |
| | |
B | | | 0.5 | |
| 1 | Includes market value of long-term fixed-income securities only. |
TOP TEN HOLDINGS
| | | | |
| Security Name | | % of Net Assets | |
| | |
U.S. Treasury Bonds, 3.500%, 02/15/39 | | | 3.5 | |
| | |
FNMA, 4.000%, 10/01/43 | | | 2.2 | |
| | |
U.S. Treasury Bonds, 1.875%, 02/15/51 | | | 2.0 | |
| | |
FNMA, 4.500%, 09/01/46 | | | 2.0 | |
| | |
U.S. Treasury Bonds, 2.250%, 05/15/41 | | | 2.0 | |
| | |
FNMA, 3.500%, 02/01/47 | | | 1.9 | |
| | |
FHLMC, 3.000%, 03/01/51 | | | 1.7 | |
| | |
U.S. Treasury Bonds, 3.125%, 05/15/48 | | | 1.7 | |
| | |
California State General Obligation, School Improvements, , 7.550%, 04/01/39 | | | 1.6 | |
| | |
FNMA, 3.500%, 07/01/50 | | | 1.6 | |
| | | | | |
| | |
Top Ten as a Group | | | 20.2 | |
| | | | |
| | | | |
Credit quality ratings shown above reflect the highest rating assigned by either Standard & Poor’s (“S&P”), Moody’s Investors Service, Inc. (“Moody’s”) or Fitch. These rating agencies are independent, nationally recognized statistical rating organizations and are widely used. Investment grade ratings are credit ratings of BBB- or higher. Below investment grade ratings are credit ratings of BB+ or lower. Investments designated N/R are not rated by any of the rating agencies. Unrated investments do not necessarily indicate low credit quality. Credit quality ratings are subject to change.
Because a fund’s strategy may result in multiple investments in particular sectors of the economy, its performance may depend on the performance of those sectors and may fluctuate more widely than investments diversified across more sectors. For additional information on these and other risk considerations, please see the Fund’s prospectus.
Any sectors, industries, or securities discussed should not be perceived as investment recommendations. Mention of a specific security should not be considered a recommendation to buy or solicitation to sell that security. Specific securities mentioned in this report may have been sold from the Fund’s portfolio of investments by the time you receive this report.
18
| | |
| | | AMG GW&K Enhanced Core Bond ESG Fund Schedule of Portfolio Investments December 31, 2022 |
| | | | | | | | |
| | |
| | | Principal Amount | | | Value | |
| | |
Corporate Bonds and Notes - 42.5% | | | | | | | | |
| | |
Financials - 12.0% | | | | | | | | |
| | |
AerCap Ireland Capital DAC/AerCap Global Aviation Trust (Ireland) 1.650%, 10/29/24 | | | $450,000 | | | | $415,080 | |
| | |
Air Lease Corp. | | | | | | | | |
2.875%, 01/15/26 | | | 248,000 | | | | 229,463 | |
| | |
American Express Co. | | | | | | | | |
(3.550% to 09/15/26 then U.S. Treasury Yield Curve CMT 5 year + 2.854%), 3.550%, 09/15/261,2,3 | | | 505,000 | | | | 414,858 | |
| | |
American Tower Corp. | | | | | | | | |
2.950%, 01/15/51 | | | 265,000 | | | | 164,065 | |
| | |
Bank of America Corp. | | | | | | | | |
MTN, (4.330% to 03/15/49 then 3 month LIBOR + 1.520%), 4.330%, 03/15/501,3 | | | 373,000 | | | | 305,931 | |
| | |
The Bank of New York Mellon Corp. | | | | | | | | |
Series G, (4.700% to 09/20/25 then U.S. Treasury Yield Curve CMT 5 year + 4.358%), 4.700%, 09/20/251,2,3 | | | 221,000 | | | | 212,189 | |
| | |
Boston Properties, LP | | | | | | | | |
3.400%, 06/21/29 | | | 473,000 | | | | 407,352 | |
| | |
Crown Castle, Inc. | | | | | | | | |
4.300%, 02/15/294 | | | 325,000 | | | | 306,910 | |
| | |
First-Citizens Bank & Trust Co. | | | | | | | | |
6.125%, 03/09/28 | | | 355,000 | | | | 360,776 | |
| | |
The Goldman Sachs Group, Inc. | | | | | | | | |
3.500%, 04/01/25 | | | 211,000 | | | | 202,907 | |
Series O, (5.300% to 11/10/26 then 3 month LIBOR + 3.834%), 5.300%, 11/10/261,2,3 | | | 243,000 | | | | 230,604 | |
| | |
JPMorgan Chase & Co. | | | | | | | | |
(1.470% to 09/22/26 then SOFR + 0.765%), 1.470%, 09/22/271,3 | | | 250,000 | | | | 216,441 | |
| | |
Morgan Stanley | | | | | | | | |
(4.431% to 01/23/29 then 3 month LIBOR + 1.628%), 4.431%, 01/23/301,3 | | | 435,000 | | | | 404,856 | |
| | |
SBA Communications Corp. | | | | | | | | |
3.875%, 02/15/27 | | | 205,000 | | | | 185,220 | |
| | |
SLM Corp. | | | | | | | | |
3.125%, 11/02/26 | | | 260,000 | | | | 221,117 | |
| | |
Starwood Property Trust, Inc. | | | | | | | | |
5.500%, 11/01/235 | | | 161,000 | | | | 159,598 | |
| | |
Wells Fargo & Co., MTN | | | | | | | | |
(2.879% to 10/30/29 then 3 month Term + 1.432%), 2.879%, 10/30/301,3 | | | 475,000 | | | | 403,467 | |
| | |
Total Financials | | | | | | | 4,840,834 | |
| | |
Industrials - 29.8% | | | | | | | | |
| | |
AECOM | | | | | | | | |
5.125%, 03/15/27 | | | 204,000 | | | | 196,350 | |
| | |
Alcoa Nederland Holding, B.V. (Netherlands) | | | | | | | | |
4.125%, 03/31/295 | | | 480,000 | | | | 425,836 | |
| | | | | | | | |
| | |
| | | Principal Amount | | | Value | |
Amazon.com, Inc. | | | | | | | | |
4.600%, 12/01/254 | | | $389,000 | | | | $388,042 | |
| | |
Anglo American Capital PLC (United Kingdom) | | | | | | | | |
2.875%, 03/17/315 | | | 277,000 | | | | 226,173 | |
| | |
Aramark Services, Inc. | | | | | | | | |
5.000%, 02/01/284,5 | | | 212,000 | | | | 197,782 | |
| | |
Ardagh Metal Packaging Finance USA LLC/Ardagh Metal Packaging Finance PLC | | | | | | | | |
3.250%, 09/01/284,5 | | | 400,000 | | | | 339,778 | |
| | |
Ashtead Capital, Inc. | | | | | | | | |
1.500%, 08/12/265 | | | 508,000 | | | | 433,523 | |
| | |
Ball Corp. | | | | | | | | |
2.875%, 08/15/304 | | | 203,000 | | | | 162,018 | |
| | |
Block Financial LLC | | | | | | | | |
3.875%, 08/15/30 | | | 142,000 | | | | 124,236 | |
| | |
Celanese US Holdings LLC | | | | | | | | |
6.050%, 03/15/25 | | | 411,000 | | | | 409,401 | |
| | |
Centene Corp. | | | | | | | | |
2.500%, 03/01/31 | | | 328,000 | | | | 256,651 | |
| | |
Charter Communications Operating LLC/Charter Communications Operating Capital | | | | | | | | |
4.908%, 07/23/25 | | | 427,000 | | | | 418,503 | |
| | |
Clearwater Paper Corp. | | | | | | | | |
4.750%, 08/15/285 | | | 242,000 | | | | 212,640 | |
| | |
The Coca-Cola Co. | | | | | | | | |
2.500%, 06/01/40 | | | 110,000 | | | | 80,154 | |
| | |
Cogent Communications Group, Inc. | | | | | | | | |
3.500%, 05/01/265 | | | 312,000 | | | | 283,434 | |
| | |
Comcast Corp. | | | | | | | | |
4.150%, 10/15/28 | | | 234,000 | | | | 224,394 | |
| | |
CommonSpirit Health | | | | | | | | |
3.347%, 10/01/29 | | | 458,000 | | | | 398,574 | |
| | |
Crown Americas LLC/Crown | | | | | | | | |
Americas Capital Corp. V | | | | | | | | |
4.250%, 09/30/264 | | | 275,000 | | | | 262,235 | |
| | |
Dell, Inc. | | | | | | | | |
7.100%, 04/15/284 | | | 379,000 | | | | 404,148 | |
| | |
Discovery Communications LLC | | | | | | | | |
3.950%, 03/20/28 | | | 483,000 | | | | 428,704 | |
| | |
Fiserv, Inc. | | | | | | | | |
4.200%, 10/01/28 | | | 423,000 | | | | 400,137 | |
| | |
The Ford Foundation | | | | | | | | |
Series 2020, 2.415%, 06/01/50 | | | 508,000 | | | | 319,574 | |
| | |
Freeport-McMoRan, Inc. | | | | | | | | |
4.625%, 08/01/304 | | | 176,000 | | | | 163,925 | |
| | |
HCA, Inc. | | | | | | | | |
3.500%, 09/01/30 | | | 207,000 | | | | 178,533 | |
| | |
Hilton Domestic Operating Co., Inc. | | | | | | | | |
4.875%, 01/15/30 | | | 220,000 | | | | 199,366 | |
The accompanying notes are an integral part of these financial statements.
19
| | |
| | | AMG GW&K Enhanced Core Bond ESG Fund Schedule of Portfolio Investments (continued) |
| | | |
| | | |
| | | | | | | | |
| | |
| | | Principal Amount | | | Value | |
| | |
Industrials - 29.8% (continued) | | | | | | | | |
| | |
Howmet Aerospace, Inc. | | | | | | | | |
5.900%, 02/01/27 | | | $161,000 | | | | $160,095 | |
| | |
KB Home | | | | | | | | |
4.800%, 11/15/29 | | | 231,000 | | | | 200,875 | |
| | |
Kraft Heinz Foods Co. | | | | | | | | |
4.250%, 03/01/31 | | | 366,000 | | | | 342,157 | |
| | |
Merck & Co., Inc. | | | | | | | | |
1.900%, 12/10/28 | | | 479,000 | | | | 411,250 | |
| | |
Microsoft Corp. | | | | | | | | |
2.525%, 06/01/50 | | | 486,000 | | | | 319,812 | |
| | |
MSCI, Inc. | | | | | | | | |
3.250%, 08/15/335 | | | 218,000 | | | | 168,352 | |
| | |
Murphy Oil USA, Inc. | | | | | | | | |
4.750%, 09/15/29 | | | 60,000 | | | | 54,902 | |
5.625%, 05/01/27 | | | 165,000 | | | | 160,217 | |
| | |
Newell Brands, Inc. | | | | | | | | |
4.450%, 04/01/266 | | | 221,000 | | | | 207,916 | |
| | |
Novelis Corp. | | | | | | | | |
3.250%, 11/15/265 | | | 210,000 | | | | 188,267 | |
| | |
Prime Security Services Borrower LLC/Prime Finance, Inc. | | | | | | | | |
5.750%, 04/15/265 | | | 189,000 | | | | 181,913 | |
| | |
PulteGroup, Inc. | | | | | | | | |
5.000%, 01/15/274 | | | 407,000 | | | | 402,322 | |
| | |
Sonoco Products Co. | | | | | | | | |
2.850%, 02/01/32 | | | 501,000 | | | | 407,243 | |
| | |
Sysco Corp. | | | | | | | | |
2.400%, 02/15/30 | | | 463,000 | | | | 384,840 | |
| | |
Tenet Healthcare Corp. | | | | | | | | |
4.875%, 01/01/265 | | | 185,000 | | | | 174,944 | |
| | |
Travel + Leisure Co. | | | | | | | | |
5.650%, 04/01/246 | | | 167,000 | | | | 164,487 | |
| | |
United Rentals North America, Inc. | | | | | | | | |
3.875%, 02/15/31 | | | 195,000 | | | | 163,467 | |
| | |
Verizon Communications, Inc. | | | | | | | | |
3.875%, 02/08/294 | | | 419,000 | | | | 393,133 | |
| | |
Walgreens Boots Alliance, Inc. | | | | | | | | |
4.800%, 11/18/44 | | | 325,000 | | | | 271,997 | |
| | |
WESCO Distribution, Inc. | | | | | | | | |
7.250%, 06/15/285 | | | 175,000 | | | | 177,270 | |
| | |
Total Industrials | | | | | | | 12,069,570 | |
| | |
Utilities - 0.7% | | | | | | | | |
| | |
National Rural Utilities Cooperative Finance Corp. | | | | | | | | |
1.350%, 03/15/31 | | | 377,000 | | | | 278,580 | |
| | |
Total Corporate Bonds and Notes | | | | | | | | |
(Cost $19,554,986) | | | | | | | 17,188,984 | |
| | | | | | | | |
| | |
| | | Principal Amount | | | Value | |
| | |
Municipal Bonds - 6.4% | | | | | | | | |
| | |
California Health Facilities Financing Authority
4.190%, 06/01/37 | | | $225,000 | | | | $200,993 | |
| | |
California State General Obligation, School Improvements Build America Bonds,
7.550%, 04/01/39 | | | 525,000 | | | | 657,107 | |
| | |
Commonwealth of Massachusetts Series B, 4.110%, 07/15/31 | | | 300,000 | | | | 289,641 | |
| | |
County of Miami-Dade FL Aviation Revenue, Series C
4.280%, 10/01/41 | | | 455,000 | | | | 401,833 | |
| | |
Los Angeles Unified School District, School Improvements
5.750%, 07/01/34 | | | 390,000 | | | | 407,387 | |
| | |
Massachusetts School Building Authority | | | | | | | | |
Series B, 1.753%, 08/15/30 | | | 448,000 | | | | 365,759 | |
| | |
University of California, University & College Improvements
Series BD,
3.349%, 07/01/29 | | | 300,000 | | | | 274,097 | |
| | |
Total Municipal Bonds | | | | | | | | |
(Cost $2,962,506) | | | | | | | 2,596,817 | |
| |
U.S. Government and Agency Obligations - 48.3% | | | | | |
| |
Fannie Mae - 26.6% | | | | | |
| | |
FNMA | | | | | | | | |
3.000%, 06/01/38 | | | 527,353 | | | | 494,509 | |
3.500%, 02/01/33 to 07/01/50 | | | 4,241,273 | | | | 3,969,806 | |
4.000%, 10/01/43 to 03/01/50 | | | 1,850,393 | | | | 1,771,372 | |
4.500%, 04/01/39 to 08/01/50 | | | 1,517,009 | | | | 1,495,390 | |
5.000%, 07/01/47 to 08/01/50 | | | 837,562 | | | | 850,127 | |
| | |
FNMA Pool | | | | | | | | |
3.000%, 06/01/33 to 05/01/50 | | | 880,831 | | | | 804,077 | |
3.500%, 01/01/36 | | | 177,615 | | | | 170,131 | |
4.000%, 05/01/47 to 06/01/49 | | | 739,997 | | | | 709,513 | |
4.500%, 01/01/44 to 05/01/48 | | | 506,713 | | | | 502,011 | |
| | |
Total Fannie Mae | | | | | | | 10,766,936 | |
| | |
Freddie Mac - 6.5% | | | | | | | | |
| | |
FHLMC | | | | | | | | |
3.000%, 03/01/50 to 03/01/51 | | | 1,309,573 | | | | 1,157,644 | |
4.000%, 07/01/48 to 09/01/50 | | | 382,919 | | | | 365,536 | |
4.500%, 10/01/41 | | | 478,743 | | | | 474,593 | |
| | |
FHLMC Gold Pool | | | | | | | | |
3.500%, 02/01/30 to 04/01/46 | | | 661,039 | | | | 627,804 | |
| | |
Total Freddie Mac | | | | | | | 2,625,577 | |
| | |
U.S. Treasury Obligations - 15.2% | | | | | | | | |
| | |
U.S. Treasury Bonds | | | | | | | | |
1.875%, 02/15/51 | | | 1,290,000 | | | | 819,855 | |
2.250%, 05/15/41 | | | 1,057,000 | | | | 794,608 | |
2.500%, 02/15/46 | | | 318,000 | | | | 237,929 | |
3.125%, 05/15/48 | | | 816,000 | | | | 685,791 | |
3.500%, 02/15/39 | | | 1,503,000 | | | | 1,411,704 | |
5.000%, 05/15/37 | | | 523,000 | | | | 584,085 | |
The accompanying notes are an integral part of these financial statements.
20
| | |
| | | AMG GW&K Enhanced Core Bond ESG Fund Schedule of Portfolio Investments (continued) |
| | | | | | | | |
| | |
| | | Principal Amount | | | Value | |
| |
U.S. Treasury Obligations - 15.2% | | | | | |
(continued) | | | | | | | | |
| | |
U.S. Treasury Bonds | | | | | | | | |
6.750%, 08/15/26 | | | $544,000 | | | | $590,708 | |
| | |
U.S. Treasury Notes | | | | | | | | |
1.625%, 02/15/26 | | | 573,000 | | | | 529,935 | |
1.875%, 02/15/32 | | | 297,000 | | | | 251,951 | |
2.125%, 09/30/24 | | | 236,000 | | | | 226,477 | |
| | |
Total U.S. Treasury Obligations | | | | | | | 6,133,043 | |
| |
Total U.S. Government and Agency Obligations | | | | | |
(Cost $22,257,041) | | | | | | | 19,525,556 | |
| |
Foreign Government Obligation - 0.8% | | | | | |
| | |
The Korea Development Bank (South Korea)
0.500%, 10/27/23
(Cost $345,761) | | | 346,000 | | | | 334,187 | |
| |
Short-Term Investments - 3.7% | | | | | |
| |
Joint Repurchase Agreements - 3.1%7 | | | | | |
| | |
Citigroup Global Markets, Inc., dated 12/30/22, due 01/03/23, 4.250% total to be received $242,930 (collateralized by various U.S. Treasuries, 0.000% - 4.500%, 04/11/23 - 10/31/29, totaling $247,671) | | | 242,815 | | | | 242,815 | |
| | | | | | | | |
| | |
| | | Principal Amount | | | Value | |
| | |
National Bank Financial, dated 12/30/22, due 01/03/23, 4.340% total to be received $1,000,482 (collateralized by various U.S. Treasuries, 0.000% - 4.435%, 01/03/23 - 09/09/49, totaling $1,020,000) | | | $1,000,000 | | | | $1,000,000 | |
| |
Total Joint Repurchase Agreements | | | | 1,242,815 | |
| |
Repurchase Agreements - 0.6% | | | | | |
| | |
Fixed Income Clearing Corp., dated 12/30/22 due 01/03/23, 4.150% total to be received $230,106 (collateralized by a U.S. Treasury, 0.125%, 01/15/32, totaling $234,600) | | | 230,000 | | | | 230,000 | |
| |
Total Short-Term Investments | | | | | |
(Cost $1,472,815) | | | | | | | 1,472,815 | |
| | |
Total Investments - 101.7% | | | | | | | | |
(Cost $46,593,109) | | | | | | | 41,118,359 | |
| |
Other Assets, less Liabilities - (1.7)% | | | | (671,486 | ) |
| |
Net Assets - 100.0% | | | | $40,446,873 | |
| 1 | Fixed to variable rate investment. The rate shown reflects the fixed rate in effect at December 31, 2022. Rate will reset at a future date. |
| 2 | Perpetuity Bond. The date shown represents the next call date. |
| 3 | Variable rate security. The rate shown is based on the latest available information as of December 31, 2022. Certain variable rate securities are not based on a published reference rate and spread but are determined by the issuer or agent and are based on current market conditions. These securities do not indicate a reference rate and spread in their description above. |
| 4 | Some of these securities, amounting to $2,393,361 or 5.9% of net assets, were out on loan to various borrowers and are collateralized by cash and various U.S. Treasury Obligations. See Note 4 of Notes to Financial Statements. |
| 5 | Security exempt from registration under Rule 144A of the Securities Act of 1933. This security may be resold in transactions exempt from registration, normally to qualified institutional buyers. At December 31, 2022, the value of these securities amounted to $3,169,510 or 7.8% of net assets. |
| 6 | Step Bond: A debt instrument with either deferred interest payments or an interest rate that resets at specific times during its term. |
| 7 | Cash collateral received for securities lending activity was invested in these joint repurchase agreements. |
| | |
| CMT | | Constant Maturity Treasury |
| |
| FHLMC | | Freddie Mac |
| |
| FNMA | | Fannie Mae |
| |
| LIBOR | | London Interbank Offered Rate |
| |
| MTN | | Medium-Term Note |
| |
| SOFR | | Secured Overnight Financing Rate |
The accompanying notes are an integral part of these financial statements.
21
| | |
| | | AMG GW&K Enhanced Core Bond ESG Fund Schedule of Portfolio Investments (continued) |
The following table summarizes the inputs used to value the Fund’s investments by the fair value hierarchy levels as of December 31, 2022:
| | | | | | | | | | | | | | | | |
| | | Level 1 | | | Level 2 | | | Level 3 | | | Total | |
| | | | |
Investments in Securities | | | | | | | | | | | | | | | | |
| | | | |
Corporate Bonds and Notes† | | | — | | | $ | 17,188,984 | | | | — | | | $ | 17,188,984 | |
| | | | |
Municipal Bonds† | | | — | | | | 2,596,817 | | | | — | | | | 2,596,817 | |
| | | | |
U.S. Government and Agency Obligations† | | | — | | | | 19,525,556 | | | | — | | | | 19,525,556 | |
| | | | |
Foreign Government Obligation† | | | — | | | | 334,187 | | | | — | | | | 334,187 | |
| | | | |
Short-Term Investments | | | | | | | | | | | | | | | | |
| | | | |
Joint Repurchase Agreements | | | — | | | | 1,242,815 | | | | — | | | | 1,242,815 | |
| | | | |
Repurchase Agreements | | | — | | | | 230,000 | | | | — | | | | 230,000 | |
| | | | | | | | | | | | | | | | |
| | | | |
Total Investments in Securities | | | — | | | $ | 41,118,359 | | | | — | | | $ | 41,118,359 | |
| | | | | | | | | | | | | | | | |
| † | All corporate bonds and notes, municipal bonds, U.S. government and agency obligations and foreign government obligation held in the Fund are Level 2 securities. For a detailed breakout of corporate bonds and notes, municipal bonds, U.S. government and agency obligations and foreign government obligation by major industry or agency classification, please refer to the Fund’s Schedule of Portfolio Investments. |
For the fiscal year ended December 31, 2022, there were no transfers in or out of Level 3.
The accompanying notes are an integral part of these financial statements.
22
| | |
| | | AMG GW&K High Income Fund Portfolio Manager’s Comments (unaudited) |
| | | |
| | | |
| | | | | | | | |
THE YEAR IN REVIEW AMG GW&K High Income Fund (the “Fund”) Class N shares returned (6.80)% during the year ended December 31, 2022, compared to the (5.30)% return for the Bloomberg U.S. High Yield 1–5 Year Ba Index (the “Index”). MARKET OVERVIEW In the first quarter of 2022, fixed income markets experienced their worst quarter in more than four decades amid an extraordinary confluence of economic and geopolitical shocks. Core inflation jumped to 5.4%, its highest level since 1983, on a broad-based rise in consumer prices. The U.S. Federal Reserve (the Fed) responded in kind, intensifying its hawkish rhetoric and laying out an aggressive course of hikes to bring inflation back to target. And—in addition to exacting a tragic human toll—Russia’s invasion of Ukraine exacerbated already strained supply chains and commodity markets, threatening acute and prolonged shortages of materials vital to the basic functioning of the global economy. But for all this uncertainty and turmoil, there was a notable divergence between the performance of rates and credit; the former extended a historically severe downdraft, while the latter continued to enjoy a remarkably benign trading environment. How this disconnect eventually would resolve itself was a central question before investors, though policy uncertainty and heightened tensions seemed unlikely to subside anytime soon. More volatility followed in the second quarter as bonds traded in a wide range and struggled to commit to a consistent narrative. The central question revolved around how persistent inflation would be and what policy measures would be necessary to quell it. A natural deceleration would allow the Fed to pursue less aggressive policy and possibly achieve a soft landing; more recalcitrant price pressure would require the Fed to mount a harsher response and invite a potential recession. The implications of these two different paths were at odds, leading to a broad lack of conviction with no clear market direction. Similarly, puzzling was a consumer with a strong proclivity to spend but a deeply pessimistic outlook and a corporate sector earning solid profits but starting to announce layoffs. | | | | Additionally, China offered a potential bright spot as it emerged from recent shutdowns, but the Ukraine conflict lingered as a major threat to global energy and commodity markets. An imminent resolution to any of these tensions seemed unlikely, so disciplined risk management and careful analysis of relative value were of particular importance for the months ahead. Fixed income markets were under extraordinary pressure in the third quarter as investors continued to adapt to restrictive monetary policy after more than a decade of accommodation. Stubbornly rising prices, hawkish central banks, and various geopolitical forces combined to tighten financial conditions and raise the cost of borrowing around the world. Defying expectations that it had peaked, inflation remained elevated and manifested across a broader and more entrenched collection of goods and services. The Fed also confounded expectations, projecting a more cautious outlook and a more aggressive path of hikes than most economists had anticipated. International pressures escalated as well, as currency market dislocations, political leadership changes in Europe and Asia, and multiple energy crises collectively drove a heightened sense of uncertainty. The variety and momentum of these forces suggested no near-term end to volatility, especially against a backdrop of increasingly expensive capital. Bonds rebounded in the fourth quarter amid growing confidence that central banks have succeeded in slowing inflation and will soon be able to pursue less restrictive policy. This modest rally nevertheless ended up being too little, too late to help the bond market avoid its worst annual performance on record and an unprecedented second consecutive year of losses. Sentiment among both investors and consumers may have reached an inflection point, but data continue to justify some measure of caution: inflation is still stubbornly above the Fed’s target, the labor market shows few signs of loosening, and corporations have yet to see a meaningful deterioration in earnings. Only the rate-sensitive housing market really stands out as a casualty of the Fed’s tightening campaign to this point. Whether the end of the cycle is imminent is likely to remain an open question, especially as | | | | investors await the realization of the “long and variable lag” that has yet to be fully reflected across so many segments of the economy. FUND REVIEW The Fund underperformed the Index during the fiscal year mainly because of its longer duration in the rising rate environment. Security selection was mixed overall but our out-of-benchmark allocation to preferreds had a notable negative effect. OUTLOOK The disconnect between the Fed’s projections and market pricing has widened following the most recent Summary of Economic Projections (SEP). The median estimate of Federal Open Market Committee (FOMC) participants for the overnight rate at the end of 2023 is 5.125%, up from 4.625% in September; the Federal Funds futures market sees a terminal rate of nearly 5.0% in June of 2023 and then two cuts by year end. There has also been a small but not insignificant chorus of economists calling for the FOMC to raise its target inflation to 3.0% from 2.0%, prompting objections that this would undermine the Fed’s hard-earned credibility. These are just two sources of tension in the rates market, and their resolution could have significant implications for both the level and the shape of the yield curve. We don’t believe investors are being sufficiently compensated for these risks. Our fundamental view of credit is broadly constructive, and we believe balance sheets in general are sound and liquidity is sufficient. But we recognize the potential for macroeconomic forces to alter this landscape and we don’t believe all these risks are adequately reflected in valuations. Within the space, we see value at the front end, where quality credits offer attractive yields and compelling breakevens. We have also been able to identify names that we believe can improve their credit profiles independently of a challenging macro backdrop. The views expressed represent the opinions of GW&K Investment Management, LLC as of December 31, 2022, and are not intended as a forecast or guarantee of future results, and are subject to change without notice. |
23
|
AMG GW&K High Income Fund Portfolio Manager’s Comments (continued) |
CUMULATIVE TOTAL RETURN PERFORMANCE
AMG GW&K High Income Fund’s cumulative total return is based on the daily change in net asset value (NAV), and assumes that all dividends and distributions were reinvested. The graph compares a hypothetical $10,000 investment made in the AMG GW&K High Income Fund’s Class N shares on December 31, 2012, to a $10,000 investment made in the Bloomberg U.S. High Yield 1-5 Year Ba Index for the same time period. The graph and table do not reflect the deduction of taxes that a shareholder would pay on a Fund distribution or redemption of shares. The listed returns for the Fund are net of expenses and the returns for the index exclude expenses. Total returns would have been lower had certain expenses not been reduced.
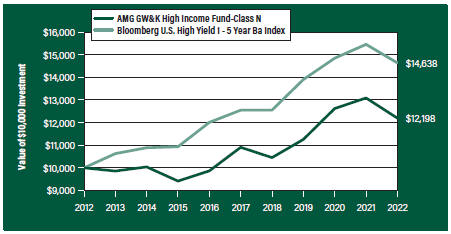
The table below shows the average annual total returns for the AMG GW&K High Income Fund and the Bloomberg U.S. High Yield 1-5 Year Ba Index for the same time periods ended December 31, 2022.
| | | | | | | | | | | | | | | | | | | | |
| | | One | | | Five | | | Ten | | | Since | | | Inception | |
| Average Annual Total Returns1 | | Year | | | Years | | | Years | | | Inception | | | Date | |
|
AMG GW&K High Income Fund2, 3, 4, 5, 6, 7 | |
| | | | | |
Class N | | | (6.80%) | | | | 2.26% | | | | 2.01% | | | | 4.54% | | | | 03/25/94 | |
| | | | | |
Class I | | | (6.63%) | | | | — | | | | — | | | | (1.79%) | | | | 03/15/21 | |
| | | | | |
Bloomberg U.S. High Yield 1-5 Year Ba Index8 | | | (5.30%) | | | | 3.13% | | | | 3.88% | | | | — | | | | 03/25/94 | † |
The performance data shown represents past performance. Past performance is not a guarantee of future results. Current performance may be lower or higher than the performance data quoted. The investment return and principal value of an investment will fluctuate so that an investor’s shares, when redeemed, may be worth more or less than their original cost.
Investors should carefully consider the Fund’s investment objectives, risks, charges and expenses before investing. For performance information through the most recent month end, current net asset values per share for the Fund and other information, please call 800.548.4539 or visit our website at amgfunds.com for a free prospectus. Read it carefully before investing or sending money.
Distributed by AMG Distributors, Inc., member FINRA/SIPC.
| † | Date reflects the inception date of the Fund, not the index. |
| 1 | Total return equals income yield plus share price change and assumes reinvestment of all dividends and capital gain distributions. Returns are net of fees and may reflect offsets of Fund expenses as described in the prospectus. No adjustment has been made for taxes payable by shareholders on their reinvested dividends and capital gain distributions. Returns for periods greater than one year are annualized. The listed returns on the Fund are net of expenses and based on the published NAV as of December 31, 2022. All returns are in U.S. Dollars($). |
|
2 From time to time the Fund’s investment manager has waived it’s fees and/or absorbed Fund expenses, which has resulted in higher returns. 3 As of December 4, 2020, the Fund’s subadvisor was changed to GW&K Investment Management, LLC. Prior to December 4, 2020, the Fund was known as the AMG Managers Global Income Opportunity Fund, and had different principal investment strategies and corresponding risks. Performance shown for periods prior to December 4, 2020 reflects the performance and investment strategies of the Fund’s previous subadvisor, Loomis, Sayles & Company, L.P. The Fund’s past performance would have been different if the Fund were managed by the current subadvisor and strategy, and the Fund’s prior performance record might be less pertinent for investors considering whether to purchase shares of the Fund. 4 The Fund is subject to the risks associated with investments in debt securities, such as default risk and fluctuations in the perception of the debtor’s ability to pay its creditors. Changing interest rates may adversely affect the value of an investment. An increase in interest rates typically causes the value of bonds and other fixed income securities to fall. 5 Market prices of investments held by the Fund may fall rapidly or unpredictably due to a variety of economic or political factors, market conditions, disasters or public health issues, or in response to events that affect particular industries or companies. 6 High-yield bonds (also known as “junk bonds”) may be subject to greater levels of interest rate, credit, and liquidity risk than investments in higher rated securities. These securities are considered predominantly speculative with respect to the issuer’s continuing ability to make principal and interest payments. The issuers of the Fund’s holdings may be involved in bankruptcy proceedings, reorganizations, or financial restructurings, and are not as strong financially as higher-rated issuers. 7 The issuer of the bonds may not be able to meet interest or principal payments when the bonds come due. 8 The Bloomberg U.S. High Yield 1-5 Year Ba Index, a subset of the Bloomberg High Yield Index, is an unmanaged index comprised of fixed rate, publicly issued, non-investment grade debt registered with the Securities and Exchange Commission (SEC) where the middle rating of Moody’s, S&P and Fitch is BB and maturities range from 1 to 5 years. Unlike the Fund, the Bloomberg U.S. High Yield 1-5 Year Ba Index is unmanaged, is not available for investment and does not incur expenses. |
24
| | |
| | | AMG GW&K High Income Fund Portfolio Manager’s Comments (continued) |
| | | |
| | | |
| | | | | | | | |
“Bloomberg®” and any Bloomberg index described herein are service marks of Bloomberg Finance L.P. and its affiliates, including Bloomberg Index Services Limited (“BISL”), the administrator of the index (collectively, “Bloomberg”) and have been licensed | | | | for use for certain purposes by AMG Funds LLC. Bloomberg is not affiliated with AMG Funds LLC, and Bloomberg does not approve, endorse, review, or recommend the fund described herein. Bloomberg does not guarantee the timeliness, accurateness, or | | | | completeness of any data or information relating to such fund. Not FDIC insured, nor bank guaranteed. May lose value |
25
| | |
| | | AMG GW&K High Income Fund Fund Snapshots (unaudited) December 31, 2022 |
PORTFOLIO BREAKDOWN
| | |
| Category | | % of
Net Assets |
| | |
Corporate Bonds and Notes | | 97.6 |
| | |
Short-Term Investments1 | | 8.7 |
| | |
Other Assets, less Liabilities1 | | (6.3) |
| 1 | Includes reinvestment of cash collateral into joint repurchase agreements on security lending transactions. |
| | |
| Rating | | % of Market Value1 |
| | |
Baa/BBB | | 28.3 |
| | |
Ba/BB | | 61.1 |
| | |
B | | 10.6 |
| 1 | Includes market value of long-term fixed-income securities only. |
TOP TEN HOLDINGS
| | |
Security Name | | % of
Net Assets |
| | |
Ford Motor Co., 4.346%, 12/08/26 | | 1.8 |
| | |
Matador Resources Co., 5.875%, 09/15/26 | | 1.6 |
| | |
SM Energy Co., 5.625%, 06/01/25 | | 1.6 |
| | |
Southwestern Energy Co., 8.375%, 09/15/28 | | 1.6 |
| | |
Aircastle, Ltd., 4.250%, 06/15/26 (Bermuda) | | 1.5 |
| | |
Ball Corp., 5.250%, 07/01/25 | | 1.5 |
| | |
NuStar Logistics LP, 5.625%, 04/28/27 | | 1.5 |
| | |
Western Midstream Operating LP, 4.650%, 07/01/26 | | 1.5 |
| | |
DCP Midstream Operating LP, 5.375%, 07/15/25 | | 1.4 |
| | |
Starwood Property Trust, Inc., 4.750%, 03/15/25 | | 1.4 |
| | | |
| | |
Top Ten as a Group | | 15.4 |
| | |
Credit quality ratings shown above reflect the highest rating assigned by either Standard & Poor’s (“S&P”), Moody’s Investors Service, Inc. (“Moody’s”) or Fitch. These rating agencies are independent, nationally recognized statistical rating organizations and are widely used. Investment grade ratings are credit ratings of BBB- or higher. Below investment grade ratings are credit ratings of BB+ or lower. Investments designated N/R are not rated by any of the rating agencies. Unrated investments do not necessarily indicate low credit quality. Credit quality ratings are subject to change.
Because a fund’s strategy may result in multiple investments in particular sectors of the economy, its performance may depend on the performance of those sectors and may fluctuate more widely than investments diversified across more sectors. For additional information on these and other risk considerations, please see the Fund’s prospectus.
Any sectors, industries, or securities discussed should not be perceived as investment recommendations. Mention of a specific security should not be considered a recommendation to buy or solicitation to sell that security. Specific securities mentioned in this report may have been sold from the Fund’s portfolio of investments by the time you receive this report.
26
| | |
| | | AMG GW&K High Income Fund Schedule of Portfolio Investments December 31, 2022 |
| | | | | | | | |
| | |
| | | Principal
Amount | | | Value | |
| | |
Corporate Bonds and Notes - 97.6% | | | | | | | | |
| |
Financials - 15.1% | | | | | |
| | |
Aircastle, Ltd. (Bermuda) | | | | | | | | |
4.250%, 06/15/26 | | $ | 278,000 | | | $ | 261,439 | |
| | |
Ally Financial, Inc.
Series B
(4.700% to 05/15/26 then U.S. Treasury Yield Curve CMT 5 year + 3.868%), 4.700%, 05/15/261,2,3,4 | | | 187,000 | | | | 125,056 | |
| | |
American Express Co.
(3.550% to 09/15/26 then U.S. Treasury Yield Curve CMT 5 year + 2.854%), 3.550%, 09/15/261,2,4 | | | 186,000 | | | | 152,799 | |
| | |
The Charles Schwab Corp.
Series I
(4.000% to 06/01/26 then U.S. Treasury Yield Curve CMT 5 year + 3.168%), 4.000%, 06/01/261,2,4 | | | 131,000 | | | | 113,643 | |
| | |
Citigroup, Inc.
(3.875% to 02/18/26 then U.S. Treasury Yield Curve CMT 5 year + 3.417%), 3.875%, 02/18/261,2,4 | | | 276,000 | | | | 235,290 | |
| | |
The Goldman Sachs Group, Inc.
Series U
(3.650% to 08/10/26 then U.S. Treasury Yield Curve CMT 5 year + 2.915%), 3.650%, 08/10/261,2,3,4 | | | 155,000 | | | | 125,163 | |
| | |
JPMorgan Chase & Co.
Series HH
(4.600% to 02/01/25 then SOFR + 3.125%), 4.600%, 02/01/251,2,4 | | | 99,000 | | | | 87,244 | |
| | |
MetLife, Inc.
Series G
(3.850% to 09/15/25 then U.S. Treasury Yield Curve CMT 5 year + 3.576%), 3.850%, 09/15/251,2,3,4 | | | 136,000 | | | | 126,310 | |
| | |
Morgan Stanley
Series M
(5.875% to 09/15/26 then 3 month LIBOR + 4.435%), 5.875%, 09/15/261,2,3,4 | | | 194,000 | | | | 189,631 | |
| | |
Navient Corp. | | | | | | | | |
6.125%, 03/25/24 | | | 180,000 | | | | 176,331 | |
| | |
SBA Communications Corp. | | | | | | | | |
3.875%, 02/15/27 | | | 225,000 | | | | 203,291 | |
| | |
SLM Corp. | | | | | | | | |
4.200%, 10/29/25 | | | 259,000 | | | | 236,974 | |
| | |
Starwood Property Trust, Inc. | | | | | | | | |
4.750%, 03/15/25 | | | 250,000 | | | | 238,562 | |
| | |
VICI Properties LP/VICI Note Co., Inc. | | | | | | | | |
3.500%, 02/15/255 | | | 27,000 | | | | 25,456 | |
4.250%, 12/01/265 | | | 165,000 | | | | 153,932 | |
| | | | | | | | |
| | |
| | | Principal
Amount | | | Value | |
| | |
Wynn Las Vegas LLC/Wynn Las Vegas Capital Corp. | | | | | | | | |
5.500%, 03/01/255 | | | $170,000 | | | | $161,389 | |
| | |
Total Financials | | | | | | | 2,612,510 | |
| | |
Industrials - 79.9% | | | | | | | | |
| | |
AECOM | | | | | | | | |
5.125%, 03/15/27 | | | 169,000 | | | | 162,663 | |
| | |
Alcoa Nederland Holding BV (Netherlands) | | | | | | | | |
6.125%, 05/15/285 | | | 200,000 | | | | 197,024 | |
| | |
American Airlines Inc/AAdvantage Loyalty IP, Ltd. | | | | | | | | |
5.500%, 04/20/265 | | | 211,000 | | | | 202,907 | |
| | |
American Axle & Manufacturing, Inc. | | | | | | | | |
6.250%, 03/15/26 | | | 206,000 | | | | 192,355 | |
| | |
Aramark Services, Inc. | | | | | | | | |
5.000%, 02/01/285 | | | 138,000 | | | | 128,745 | |
| | |
ATI, Inc. | | | | | | | | |
4.875%, 10/01/29 | | | 139,000 | | | | 122,838 | |
| | |
Avient Corp. | | | | | | | | |
5.750%, 05/15/255 | | | 135,000 | | | | 131,625 | |
| | |
Ball Corp. | | | | | | | | |
5.250%, 07/01/25 | | | 262,000 | | | | 258,580 | |
| | |
Bath & Body Works, Inc. | | | | | | | | |
6.694%, 01/15/27 | | | 123,000 | | | | 122,116 | |
| | |
Caesars Entertainment, Inc. | | | | | | | | |
6.250%, 07/01/255 | | | 170,000 | | | | 165,185 | |
| | |
Callon Petroleum Co. | | | | | | | | |
6.375%, 07/01/26 | | | 185,000 | | | | 172,428 | |
| | |
CCO Holdings LLC/CCO Holdings Capital Corp. | | | | | | | | |
5.500%, 05/01/265 | | | 179,000 | | | | 173,290 | |
| | |
CDW LLC/CDW Finance Corp. | | | | | | | | |
5.500%, 12/01/24 | | | 133,000 | | | | 132,992 | |
| | |
Centene Corp. | | | | | | | | |
4.250%, 12/15/27 | | | 231,000 | | | | 216,646 | |
| | |
Cheniere Energy Partners LP | | | | | | | | |
4.500%, 10/01/29 | | | 155,000 | | | | 139,379 | |
| | |
Chord Energy Corp. | | | | | | | | |
6.375%, 06/01/265 | | | 177,000 | | | | 172,386 | |
| | |
Clearwater Paper Corp. | | | | | | | | |
5.375%, 02/01/255 | | | 230,000 | | | | 223,478 | |
| | |
Cleveland-Cliffs, Inc. | | | | | | | | |
5.875%, 06/01/273 | | | 174,000 | | | | 166,226 | |
| | |
Cogent Communications Group, Inc. | | | | | | | | |
3.500%, 05/01/265 | | | 188,000 | | | | 170,787 | |
| | |
Crown Cork & Seal Co., Inc. | | | | | | | | |
7.375%, 12/15/26 | | | 185,000 | | | | 190,459 | |
| | |
Dana, Inc. | | | | | | | | |
5.625%, 06/15/28 | | | 123,000 | | | | 111,889 | |
| | |
DCP Midstream Operating LP | | | | | | | | |
5.375%, 07/15/25 | | | 249,000 | | | | 246,684 | |
The accompanying notes are an integral part of these financial statements.
27
| | |
| | | AMG GW&K High Income Fund Schedule of Portfolio Investments (continued) |
| | | | | | | | |
| | |
| | | Principal
Amount | | | Value | |
| | |
Industrials - 79.9% (continued) | | | | | | | | |
| | |
Delta Air Lines, Inc. | | | | | | | | |
7.375%, 01/15/263 | | | $225,000 | | | | $229,891 | |
| | |
Elanco Animal Health, Inc. | | | | | | | | |
6.400%, 08/28/28 | | | 126,000 | | | | 119,890 | |
| | |
Embraer Netherlands Finance BV (Netherlands) | | | | | | | | |
5.050%, 06/15/25 | | | 198,000 | | | | 192,161 | |
| | |
Encompass Health Corp. | | | | | | | | |
4.500%, 02/01/28 | | | 178,000 | | | | 161,695 | |
| | |
Energy Transfer LP | | | | | | | | |
5.250%, 04/15/29 | | | 180,000 | | | | 174,052 | |
| | |
EQT Corp. | | | | | | | | |
5.700%, 04/01/28 | | | 183,000 | | | | 182,017 | |
| | |
FMG Resources August 2006 Pty, Ltd. (Australia) | | | | | | | | |
4.500%, 09/15/275 | | | 94,000 | | | | 86,715 | |
| | |
Ford Motor Co. | | | | | | | | |
4.346%, 12/08/263 | | | 326,000 | | | | 309,159 | |
5.291%, 12/08/46 | | | 77,000 | | | | 58,675 | |
| | |
Fortress Transportation and Infrastructure Investors LLC | | | | | | | | |
6.500%, 10/01/255 | | | 179,000 | | | | 168,296 | |
| | |
General Motors Co. | | | | | | | | |
6.800%, 10/01/273 | | | 161,000 | | | | 167,115 | |
| | |
The Goodyear Tire & Rubber Co. | | | | | | | | |
4.875%, 03/15/273 | | | 258,000 | | | | 236,000 | |
| | |
Hanesbrands, Inc. | | | | | | | | |
4.875%, 05/15/265 | | | 157,000 | | | | 140,291 | |
| | |
HB Fuller Co. | | | | | | | | |
4.250%, 10/15/28 | | | 146,000 | | | | 129,210 | |
| | |
HCA, Inc. | | | | | | | | |
5.375%, 02/01/25 | | | 139,000 | | | | 138,832 | |
| | |
Hillenbrand, Inc. | | | | | | | | |
5.000%, 09/15/266 | | | 126,000 | | | | 121,628 | |
| | |
Howmet Aerospace, Inc. | | | | | | | | |
5.900%, 02/01/27 | | | 80,000 | | | | 79,550 | |
6.875%, 05/01/253 | | | 114,000 | | | | 116,983 | |
| | |
Hudbay Minerals, Inc. (Canada) | | | | | | | | |
4.500%, 04/01/265 | | | 97,000 | | | | 88,109 | |
| | |
KB Home | | | | | | | | |
4.000%, 06/15/31 | | | 85,000 | | | | 68,327 | |
| | |
Kraft Heinz Foods Co. | | | | | | | | |
4.375%, 06/01/46 | | | 76,000 | | | | 61,758 | |
| | |
Lamar Media Corp. | | | | | | | | |
4.875%, 01/15/293 | | | 175,000 | | | | 160,681 | |
| | |
Matador Resources Co. | | | | | | | | |
5.875%, 09/15/263 | | | 283,000 | | | | 272,093 | |
| | |
Mattel, Inc. | | | | | | | | |
3.375%, 04/01/265 | | | 218,000 | | | | 200,430 | |
| | |
MEG Energy Corp. (Canada) | | | | | | | | |
5.875%, 02/01/295 | | | 175,000 | | | | 165,029 | |
| | | | | | | | |
| | |
| | | Principal
Amount | | | Value | |
| | |
Meritage Homes Corp. | | | | | | | | |
6.000%, 06/01/25 | | | $148,000 | | | | $147,288 | |
| | |
Methanex Corp. (Canada) | | | | | | | | |
5.125%, 10/15/27 | | | 183,000 | | | | 169,733 | |
| | |
MGM Resorts International | | | | | | | | |
5.750%, 06/15/253 | | | 210,000 | | | | 204,094 | |
| | |
Mueller Water Products, Inc. | | | | | | | | |
4.000%, 06/15/295 | | | 183,000 | | | | 160,811 | |
| | |
Murphy Oil Corp. | | | | | | | | |
6.375%, 07/15/28 | | | 170,000 | | | | 163,633 | |
| | |
Murphy Oil USA, Inc. | | | | | | | | |
5.625%, 05/01/27 | | | 180,000 | | | | 174,782 | |
| | |
Newell Brands, Inc. | | | | | | | | |
4.450%, 04/01/266 | | | 181,000 | | | | 170,284 | |
| | |
Novelis Corp. | | | | | | | | |
3.250%, 11/15/265 | | | 189,000 | | | | 169,440 | |
| | |
NuStar Logistics LP | | | | | | | | |
5.625%, 04/28/27 | | | 276,000 | | | | 258,076 | |
| | |
Occidental Petroleum Corp. | | | | | | | | |
7.875%, 09/15/31 | | | 151,000 | | | | 166,704 | |
| | |
Olin Corp. | | | | | | | | |
5.125%, 09/15/27 | | | 204,000 | | | | 192,780 | |
| | |
Owens-Brockway Glass Container, Inc. | | | | | | | | |
6.375%, 08/15/255 | | | 198,000 | | | | 194,018 | |
| | |
Penn Entertainment, Inc. | | | | | | | | |
4.125%, 07/01/295 | | | 183,000 | | | | 144,571 | |
| | |
Penske Automotive Group, Inc. | | | | | | | | |
3.500%, 09/01/25 | | | 174,000 | | | | 161,482 | |
| | |
Permian Resources Operating LLC | | | | | | | | |
5.375%, 01/15/265 | | | 190,000 | | | | 172,954 | |
| | |
Prime Security Services Borrower LLC/Prime Finance, Inc. | | | | | | | | |
5.750%, 04/15/265 | | | 225,000 | | | | 216,562 | |
| | |
PTC, Inc. | | | | | | | | |
3.625%, 02/15/255 | | | 218,000 | | | | 207,630 | |
| | |
Sealed Air Corp. | | | | | | | | |
5.500%, 09/15/255 | | | 182,000 | | | | 179,386 | |
| | |
Silgan Holdings, Inc. | | | | | | | | |
4.125%, 02/01/28 | | | 137,000 | | | | 126,747 | |
| | |
Southwestern Energy Co. | | | | | | | | |
8.375%, 09/15/28 | | | 260,000 | | | | 268,045 | |
| | |
Sprint LLC | | | | | | | | |
7.125%, 06/15/24 | | | 213,000 | | | | 217,162 | |
| | |
Tenet Healthcare Corp. | | | | | | | | |
4.875%, 01/01/265 | | | 177,000 | | | | 167,379 | |
| | |
Teva Pharmaceutical Finance Netherlands III, B.V. (Netherlands) | | | | | | | | |
3.150%, 10/01/26 | | | 201,000 | | | | 175,775 | |
| | |
Toll Brothers Finance Corp. | | | | | | | | |
4.350%, 02/15/28 | | | 190,000 | | | | 172,627 | |
The accompanying notes are an integral part of these financial statements.
28
| | |
| | | AMG GW&K High Income Fund Schedule of Portfolio Investments (continued) |
| | | | | | | | |
| | |
| | | Principal
Amount | | | Value | |
| | |
Industrials - 79.9% (continued) | | | | | | | | |
| | |
TransDigm, Inc. | | | | | | | | |
6.250%, 03/15/265 | | | $172,000 | | | | $169,625 | |
| | |
Travel + Leisure Co. | | | | | | | | |
5.650%, 04/01/246 | | | 97,000 | | | | 95,540 | |
6.600%, 10/01/256 | | | 75,000 | | | | 73,691 | |
| | |
Trinity Industries, Inc. | | | | | | | | |
4.550%, 10/01/24 | | | 182,000 | | | | 176,602 | |
| | |
United Airlines Holdings, Inc. | | | | | | | | |
4.875%, 01/15/253 | | | 110,000 | | | | 105,050 | |
5.000%, 02/01/243 | | | 157,000 | | | | 154,253 | |
| | |
United Rentals North America, Inc. | | | | | | | | |
4.875%, 01/15/28 | | | 183,000 | | | | 173,420 | |
| | |
United States Steel Corp. | | | | | | | | |
6.875%, 03/01/293 | | | 133,000 | | | | 129,096 | |
| | |
Wabash National Corp. | | | | | | | | |
4.500%, 10/15/285 | | | 153,000 | | | | 130,293 | |
| | |
WESCO Distribution, Inc. | | | | | | | | |
7.250%, 06/15/285 | | | 118,000 | | | | 119,531 | |
| | |
Western Digital Corp. | | | | | | | | |
4.750%, 02/15/26 | | | 137,000 | | | | 129,016 | |
| | |
Western Midstream Operating LP | | | | | | | | |
4.650%, 07/01/26 | | | 269,000 | | | | 255,297 | |
| | |
Westlake Corp. | | | | | | | | |
0.875%, 08/15/24 | | | 73,000 | | | | 67,782 | |
| | |
Total Industrials | | | | | | | 13,790,428 | |
| | |
Utilities - 2.6% | | | | | | | | |
| | |
NRG Energy, Inc. | | | | | | | | |
5.250%, 06/15/295 | | | 195,000 | | | | 172,134 | |
| | |
SM Energy Co. | | | | | | | | |
5.625%, 06/01/25 | | | 283,000 | | | | 271,677 | |
| | |
Total Utilities | | | | | | | 443,811 | |
| | |
Total Corporate Bonds and Notes
(Cost $17,730,127) | | | | | | | 16,846,749 | |
| | | | | | | | |
| | |
| | | Principal
Amount | | | Value | |
| |
Short-Term Investments - 8.7% | | | | | |
| |
Joint Repurchase Agreements - 7.3%7 | | | | | |
| | |
Citigroup Global Markets, Inc., dated 12/30/22,due 01/03/23, 4.250% total to be received $253,367 (collateralized by various U.S. Treasuries, 0.000% - 4.500%, 04/11/23 - 10/31/29, totaling $258,312) | | | $253,247 | | | | $253,247 | |
| | |
National Bank Financial, dated 12/30/22, due 01/03/23, 4.340% total to be received $1,000,482 (collateralized by various U.S. Treasuries, 0.000% - 4.435%, 01/03/23 - 09/09/49, totaling $1,020,000) | | | 1,000,000 | | | | 1,000,000 | |
| |
Total Joint Repurchase Agreements | | | | 1,253,247 | |
| |
Repurchase Agreements - 1.4% | | | | | |
| | |
Fixed Income Clearing Corp., dated 12/30/22 due 01/03/23, 4.150% total to be received $248,114 (collateralized by a U.S. Treasury, 0.125%, 01/15/32, totaling $252,973) | | | 248,000 | | | | 248,000 | |
| |
Total Short-Term Investments | | | | | |
(Cost $1,501,247) | | | | | | | 1,501,247 | |
| |
Total Investments - 106.3% | | | | | |
(Cost $19,231,374) | | | | | | | 18,347,996 | |
| |
Other Assets, less Liabilities - (6.3)% | | | | (1,079,447 | ) |
| |
Net Assets - 100.0% | | | | $17,268,549 | |
| 1 | Fixed to variable rate investment. The rate shown reflects the fixed rate in effect at December 31, 2022. Rate will reset at a future date. |
| 2 | Perpetuity Bond. The date shown represents the next call date. |
| 3 | Some of these securities, amounting to $1,415,713 or 8.2% of net assets, were out on loan to various borrowers and are collateralized by cash and various U.S. Treasury Obligations. See Note 4 of Notes to Financial Statements. |
| 4 | Variable rate security. The rate shown is based on the latest available information as of December 31, 2022. Certain variable rate securities are not based on a published reference rate and spread but are determined by the issuer or agent and are based on current market conditions. These securities do not indicate a reference rate and spread in their description above. |
| 5 | Security exempt from registration under Rule 144A of the Securities Act of 1933. This security may be resold in transactions exempt from registration, normally to qualified institutional buyers. At December 31, 2022, the value of these securities amounted to $4,959,408 or 28.7% of net assets. |
| 6 | Step Bond: A debt instrument with either deferred interest payments or an interest rate that resets at specific times during its term. |
| 7 | Cash collateral received for securities lending activity was invested in these joint repurchase agreements. |
| | |
| CMT | | Constant Maturity Treasury |
| |
| LIBOR | | London Interbank Offered Rate |
| |
| SOFR | | Secured Overnight Financing Rate |
The accompanying notes are an integral part of these financial statements.
29
| | |
| | | AMG GW&K High Income Fund Schedule of Portfolio Investments (continued) |
The following table summarizes the inputs used to value the Fund’s investments by the fair value hierarchy levels as of December 31, 2022:
| | | | | | | | | | | | | | | | |
| | | Level 1 | | | Level 2 | | | Level 3 | | | Total | |
| | | | |
Investments in Securities | | | | | | | | | | | | | | | | |
| | | | |
Corporate Bonds and Notes† | | | — | | | | $16,846,749 | | | | — | | | | $16,846,749 | |
| | | | |
Short-Term Investments | | | | | | | | | | | | | | | | |
| | | | |
Joint Repurchase Agreements | | | — | | | | 1,253,247 | | | | — | | | | 1,253,247 | |
| | | | |
Repurchase Agreements | | | — | | | | 248,000 | | | | — | | | | 248,000 | |
| | | | | | | | | | | | | | | | |
| | | | |
Total Investments in Securities | | | — | | | $ | 18,347,996 | | | | — | | | $ | 18,347,996 | |
| | | | | | | | | | | | | | | | |
| † | All corporate bonds and notes held in the Fund are level 2 securities. For a detailed breakout of corporate bonds and notes by major industry classification, please refer to the Fund’s Schedule of Portfolio Investments. |
For the fiscal year ended December 31, 2022, there were no transfers in or out of Level 3.
The accompanying notes are an integral part of these financial statements.
30
| | |
| | | AMG GW&K Municipal Bond Fund Portfolio Manager’s Comments (unaudited) |
| | | | |
THE YEAR IN REVIEW For the year ended December 31, 2022, AMG GW&K Municipal Bond Fund (the “Fund”) Class N shares returned (7.80)%, compared to the (6.57)% return for its benchmark, the Bloomberg 10-Year Municipal Bond Index (the “Index”). In the first quarter of 2022, municipal bonds suffered their worst quarter of performance in 40 years, getting caught in a Treasury market rout that stemmed from the mounting determination of central banks to combat sustained inflationary pressure. Coming into 2022, the U.S. Federal Reserve (the Fed) had been projecting only three quarter-point rate hikes for the calendar year, an outlook that was also reflected in the futures market. But as the quarter progressed, labor markets began to overheat and core inflation surged to a four-decade high. Russia’s invasion of Ukraine sent energy and grain prices soaring amid a humanitarian crisis with no clear endgame. In response to these developments, the Fed rhetoric grew more hawkish and policy projections turned more aggressive. At the March Federal Open Market Committee (FOMC) meeting, after lifting rates for the first time since 2018, committee members raised their forecast to seven total hikes for 2022 and by quarter-end, the futures market was pricing in nine. Short Treasury yields surged, mirroring the faster pace of hikes, while those out longer increased less, reflecting the possible damage to growth. The combination of those two dynamics led to inversions at key segments of the curve, which raised questions as to whether monetary policy can successfully tame inflation without tipping the economy into recession. Going into the second quarter, municipal bonds posted more losses, adding to their worst start to any year on record. The selloff was driven by the Fed’s aggressive tightening campaign, as successive 40-year highs in the Consumer Price Index (CPI) put to rest any lingering convictions that inflation would prove “transitory.” Officials raised rates twice during the quarter, first by half a point in May and then by three-quarters of a point in June, the latter the largest such move since 1994. Interest rates responded by climbing to multi-year highs. Fed Chair Jerome Powell stepped up his hawkish rhetoric, emphasizing the tightness of the labor force and the mounting risks from continued supply chain disruptions, the war in Ukraine and China’s zero-COVID policy. The implication was clear: the long-term damage from entrenched inflation must be prioritized above all else, even at the risk of | | slowing economic growth. Investors got the message, becoming less concerned about a price spiral and more worried about the possibility of a recession. Inflation breakeven measures plunged over the final three weeks of June while futures markets pared bets on the peak Fed Funds rate and even priced in cuts by the middle of next year. Interest rates finished well below their mid-June cyclical highs, but were still up meaningfully for the quarter. Municipal bonds again posted heavy losses in the third quarter as hopes faded that the Fed would soon pull back on its aggressive tightening program. After an impressive rally in July, when it still seemed possible that a lowercase “R” recession might usher in an early-spring easing, bond yields soared over the following two months. The two major culprits were the labor market, which stayed extremely tight, and inflation, which remained broad-based and hovered near 40-year highs. Fed officials cited the data as evidence that more needed to be done, lest elevated inflation expectations become entrenched. The FOMC followed through by raising rates 150 basis points (“bps”) during the quarter, doubling the magnitude of hikes from the first half of the year. As importantly, committee members signaled more to come, forecasting a steeper policy path and higher terminal rate than traders had expected. Sentiment was also weighed down by geopolitical crosscurrents, including the ongoing war in Ukraine, COVID lockdowns in China, and a brief but dramatic crash in UK government debt, which necessitated an intervention from the Bank of England. In late September, the yield on the 10-year Treasury touched 4.00% for the first time since 2008, before declining slightly to end the quarter at 3.83%. As we ended the year, municipal bonds posted their strongest quarterly performance in over a decade, partially erasing what still amounted to the worst annual loss in 40 years. With a struggling Treasury market providing little direction, returns were instead powered by a combination of scant supply and building demand. New issue volume for the fourth quarter declined 40% on a year-over-year basis, creating a scarcity premium that was turbo-charged by the need for investors to reinvest seasonally high coupon and maturity redemptions. Although mutual funds continued to experience significant outflows, likely exacerbated by year-end tax-loss selling, the bid-side remained strong and picked up steam as the quarter progressed. In fact, after a modest selloff in October, tax-exempt yields staged a breathtaking turnaround, plummeting 70-90 bps through | | mid-December. Even with that rally, however, rates were still up 1.60% to 2.30% from January’s historically low starting point, leaving no escape from the sharply negative annual performance that materialized across the entire curve. Although municipal bonds outperformed Treasuries in the fourth quarter, they were still directionally influenced by the underlying forces driving the broader market. Early in the quarter, interest rates shot up due to still-elevated inflation, tight labor markets, and hawkish saber rattling from central banks. By October 28, 2022, the yield on the 10-year Treasury had risen 40 bps for the month to close at 4.24%, its highest level since 2008. From there, however, sentiment turned as the lagged effects of contractionary policy seemed to take hold. Key prints on inflation decelerated from their peaks, creating a sense that the worst may be over. A pullback in manufacturing and a softening in unit labor costs were also contributing factors. And while the Fed continued to talk tough on keeping policy restrictive, a downshift to a 50 bp hike in December after four consecutive 75 bp increases lent further credibility to the slowdown narrative. The futures market even started pricing in a couple of rate cuts for the back half of 2023. From its October high, the 10-year Treasury yield dropped 36 bps the rest of the way, ending December more than 50 bps below the yield on the two-year, the steepest inversion of that segment of the curve since the early 1980s. Amid this backdrop, the Fund underperformed the Index for the year. The Fund’s overall longer duration and overweight to longer maturities were the biggest negatives as interest rates rose. The Fund’s overweight to higher coupon structures, allocation to shorter maturities and overall security selection benefited performance. OUTLOOOK Don’t be fooled by all the hand-wringing over what a terrible year 2022 was for bonds. In fact, long-term investors should be grateful for what transpired. Make no mistake, ultra-low interest rates are a threat to savers, especially those artificially manufactured by well-intentioned governments. It was critical to break out of that destabilizing cycle and mark-to-market losses were a small price to pay to get there. We believe municipal bonds enter 2023 in much better shape. Yields that began the year at 1.00% are now far more attractive, in many instances topping 5.00% on a tax-equivalent basis. The technical backdrop should continue strong, with issuance remaining low due to a decline in |
31
| | |
| | | AMG GW&K Municipal Bond Fund Portfolio Manager’s Comments (continued) |
| | | | | | | | |
refunding opportunities. The outflow cycle that plagued 2022 will likely lose steam in the face of better yields and less tax-loss selling. States are better positioned to withstand the effects of a potential recession, having made prudent use of windfall tax collections to build record reserves. To be sure, challenges still exist. More economically | | | | sensitive sectors will need closer scrutiny and a historically flat yield curve alters the risk/return calculus. But these issues are considerably less difficult to navigate than central banks pinning rates near zero. And we look forward to taking advantage of the gift handed to us by the 2022 market. | | | | The views expressed represent the opinions of GW&K Investment Management, LLC as of December 31, 2022, and are not intended as a forecast or guarantee of future results, and are subject to change without notice. |
32
|
AMG GW&K Municipal Bond Fund Portfolio Manager’s Comments (continued) |
CUMULATIVE TOTAL RETURN PERFORMANCE
AMG GW&K Municipal Bond Fund’s cumulative total return is based on the daily change in net asset value (NAV), and assumes that all dividends and distributions were reinvested. The graph compares a hypothetical $10,000 investment made in the AMG GW&K Municipal Bond Fund’s Class N shares on December 31, 2012, to a $10,000 investment made in the Bloomberg 10-Year Municipal Bond Index for the same time period. The graph and table do not reflect the deduction of taxes that a shareholder would pay on a Fund distribution or redemption of shares. The listed returns for the Fund are net of expenses and the returns for the index exclude expenses. Total returns would have been lower had certain expenses not been reduced.
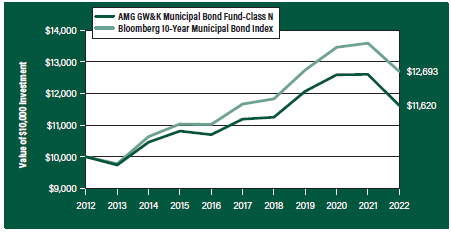
The table below shows the average annual total returns for the AMG GW&K Municipal Bond Fund and the Bloomberg 10-Year Municipal Bond Index for the same time periods ended December 31, 2022.
| | | | | | |
| | | One | | Five | | Ten |
| Average Annual Total Returns1 | | Year | | Years | | Years |
|
AMG GW&K Municipal Bond Fund2, 3, 4, 5, 6, 7 |
| | | |
Class N | | (7.80%) | | 0.76% | | 1.51% |
| | | |
Class I | | (7.45%) | | 1.09% | | 1.90% |
| | | |
Bloomberg 10-Year Municipal Bond Index8 | | (6.57%) | | 1.70% | | 2.41% |
The performance data shown represents past performance. Past performance is not a guarantee of future results. Current performance may be lower or higher than the performance data quoted. The investment return and principal value of an investment will fluctuate so that an investor’s shares, when redeemed, may be worth more or less than their original cost.
Investors should carefully consider the Fund’s investment objectives, risks, charges and expenses before investing. For performance information through the most recent month end, current net asset values per share for the Fund and other information, please call 800.548.4539 or visit our website at amgfunds.com for a free prospectus. Read it carefully before investing or sending money.
Distributed by AMG Distributors, Inc., member FINRA/SIPC.
| 1 | Total return equals income yield plus share price change and assumes reinvestment of all dividends and capital gain distributions. Returns are net of fees and may reflect offsets of Fund expenses as described in the prospectus. No adjustment has been made for taxes payable by shareholders on their reinvested dividends and capital gain distributions. Returns for periods greater than one year are annualized. The listed returns on the Fund are net of expenses and based on the published NAV as of December 31, 2022. All returns are in U.S. Dollars ($). |
| 2 | From time to time, the Fund’s investment manager has waived its fees and/or absorbed Fund expenses, which has resulted in higher returns. |
| 3 | The Fund is subject to the risks associated with investments in debt securities, such as default risk and |
|
fluctuations in the perception of the debtor’s ability to pay its creditors. Changing interest rates may adversely affect the value of an investment. An increase in interest rates typically causes the value of bonds and other fixed income securities to fall. 4 Factors unique to the municipal bond market may negatively affect the value of municipal bonds. 5 Investment income may be subject to certain state and local taxes, and depending on your tax status, the federal alternative minimum tax. Capital gains are not exempt from federal income tax. 6 Market prices of investments held by the Fund may fall rapidly or unpredictably due to a variety of economic or political factors, market conditions, disasters or public health issues, or in response to events that affect particular industries or companies. 7 Companies that are in similar industry sectors may be similarly affected by particular economic or market events; to the extent the Fund has substantial holdings within a particular sector, the risks associated with that sector increase. 8 The Bloomberg 10-Year Municipal Bond Index is the 10 Year (8-12) component of the Municipal Bond index. It is a rules-based, market-value-weighted index engineered for the tax-exempt bond market. The Index tracks general obligation bonds, revenue bonds, insured bonds, and prerefunded bonds rated Baa3/BBB- or higher by at least two of the ratings agencies: Moody’s, S&P, Fitch. Unlike the Fund, the Bloomberg 10-Year Municipal Bond Index is unmanaged, is not available for investment and does not incur expenses. “Bloomberg®” and any Bloomberg index described herein are service marks of Bloomberg Finance L.P. and its affiliates, including Bloomberg Index Services Limited (“BISL”), the administrator of the index (collectively, “Bloomberg”) and have been licensed for use for certain purposes by AMG Funds LLC. Bloomberg is not affiliated with AMG Funds LLC, and Bloomberg does not approve, endorse, review, or recommend the fund described herein. Bloomberg does not guarantee the timeliness, accurateness, or completeness of any data or information relating to such fund. Not FDIC insured, nor bank guaranteed. May lose value. |
33
| | |
| | | AMG GW&K Municipal Bond Fund Fund Snapshots (unaudited) December 31, 2022 |
PORTFOLIO BREAKDOWN
| | | | |
| Category | | % of
Net Assets | |
| | |
General Obligation | | | 41.4 | |
| | |
Transportation | | | 34.0 | |
| | |
Medical | | | 9.0 | |
| | |
Water | | | 6.2 | |
| | |
Education | | | 4.2 | |
| | |
Utilities | | | 2.1 | |
| | |
Power | | | 1.7 | |
| | |
Tobacco Settlement | | | 0.8 | |
| | |
Industrial Development | | | 0.7 | |
| | |
Short-term | | | 0.1 | |
| | |
Other Assets, less Liabilities | | | (0.2) | |
| | | | | |
| Rating | | % of Market Value1 |
| | |
Aaa/AAA | | | | 25.3 | |
| | |
Aa/AA | | | | 46.0 | |
| | |
A | | | | 22.2 | |
| | |
Baa/BBB | | | | 6.5 | |
| 1 | Includes market value of long-term fixed-income securities only. |
TOP TEN HOLDINGS
| | |
Security Name | | % of Net Assets |
| | |
Wisconsin State Revenue, Department of Transportation, Series 2, 5.000%, 07/01/29 | | 2.1 |
| | |
Iowa Finance Authority, State Revolving Fund Green Bond, 5.000%, 08/01/30 | | 1.5 |
| | |
Metropolitan Transportation Authority, Transit Revenue, Green Bond, Series B, 5.000%, 11/15/27 | | 1.4 |
| | |
New York State Urban Development Corp., 5.000%, 03/15/32 | | 1.3 |
| | |
State of California, General Obligation, 5.000%, 11/01/30 | | 1.3 |
| | |
State of Maryland, Department of Transportation, 5.000%, 09/01/29 | | 1.2 |
| | |
State of Maryland, Department of Transportation, 5.000%, 10/01/28 | | 1.2 |
| | |
State of New Jersey, Series A, 5.000%, 06/01/29 | | 1.2 |
| | |
New York City Transitional Finance Authority Building Aid Revenue, Series 1A, 5.000%, 07/15/32 | | 1.2 |
| | |
Michigan Finance Authority, Henry Ford Health System, 5.000%, 11/15/29 | | 1.1 |
| | | |
| | |
Top Ten as a Group | | 13.5 |
| | |
Credit quality ratings shown above reflect the highest rating assigned by either Standard & Poor’s (“S&P”), Moody’s Investors Service, Inc. (“Moody’s”) or Fitch. These rating agencies are independent, nationally recognized statistical rating organizations and are widely used. Investment grade ratings are credit ratings of BBB- or higher. Below investment grade ratings are credit ratings of BB+ or lower. Investments designated N/R are not rated by any of the rating agencies. Unrated investments do not necessarily indicate low credit quality. Credit quality ratings are subject to change.
Because a fund’s strategy may result in multiple investments in particular sectors of the economy, its performance may depend on the performance of those sectors and may fluctuate more widely than investments diversified across more sectors. For additional information on these and other risk considerations, please see the Fund’s prospectus.
Any sectors, industries, or securities discussed should not be perceived as investment recommendations. Mention of a specific security should not be considered a recommendation to buy or solicitation to sell that security. Specific securities mentioned in this report may have been sold from the Fund’s portfolio of investments by the time you receive this report.
34
| | |
| | | AMG GW&K Municipal Bond Fund Schedule of Portfolio Investments December 31, 2022 |
| | | | | | | | |
| | |
| | | Principal Amount | | | Value | |
| | |
Municipal Bonds - 100.1% | | | | | | | | |
| |
Alabama - 0.8% | | | | | |
| | |
Alabama Public School and College Authority, Series A | | | | | | | | |
5.000%, 11/01/34 | | | $7,500,000 | | | | $8,573,619 | |
| |
Arizona - 1.2% | | | | | |
| | |
Arizona Department of Transportation State Highway Fund Revenue | | | | | | | | |
5.000%, 07/01/28 | | | 5,040,000 | | | | 5,433,712 | |
| | |
Arizona Industrial Development Authority | | | | | | | | |
5.000%, 02/01/32 | | | 1,450,000 | | | | 1,677,374 | |
5.000%, 02/01/35 | | | 1,700,000 | | | | 1,928,284 | |
5.000%, 02/01/36 | | | 1,800,000 | | | | 2,010,638 | |
5.000%, 02/01/37 | | | 1,905,000 | | | | 2,100,342 | |
| | |
Total Arizona | | | | | | | 13,150,350 | |
| |
California - 11.6% | | | | | |
| | |
California Municipal Finance Authority, Community Medical Centers, Series A | | | | | | | | |
5.000%, 02/01/27 | | | 950,000 | | | | 1,007,489 | |
5.000%, 02/01/30 | | | 1,630,000 | | | | 1,720,520 | |
5.000%, 02/01/31 | | | 900,000 | | | | 949,687 | |
5.000%, 02/01/32 | | | 1,855,000 | | | | 1,953,142 | |
| | |
California State Public Works Board, Series A | | | | | | | | |
5.000%, 02/01/30 | | | 2,500,000 | | | | 2,893,407 | |
5.000%, 02/01/31 | | | 3,500,000 | | | | 4,101,895 | |
5.000%, 02/01/32 | | | 3,500,000 | | | | 4,155,800 | |
5.000%, 08/01/33 | | | 5,000,000 | | | | 5,863,122 | |
5.000%, 08/01/34 | | | 2,750,000 | | | | 3,194,881 | |
5.000%, 08/01/35 | | | 2,500,000 | | | | 2,868,944 | |
| | |
California State Public Works Board, Series C | | | | | | | | |
5.000%, 08/01/30 | | | 2,785,000 | | | | 3,250,783 | |
5.000%, 08/01/31 | | | 2,560,000 | | | | 3,020,342 | |
5.000%, 08/01/32 | | | 2,750,000 | | | | 3,235,555 | |
5.000%, 08/01/33 | | | 3,000,000 | | | | 3,517,873 | |
| | |
City of Los Angeles Department of Airports, Series C | | | | | | | | |
5.000%, 05/15/30 | | | 10,515,000 | | | | 11,590,975 | |
| | |
San Francisco City & County Airport Commission, San Francisco International Airport, Series A | | | | | | | | |
5.000%, 05/01/32 | | | 3,000,000 | | | | 3,270,007 | |
5.000%, 05/01/34 | | | 5,010,000 | | | | 5,318,966 | |
5.000%, 05/01/35 | | | 5,800,000 | | | | 6,119,436 | |
| | |
State of California | | | | | | | | |
5.000%, 09/01/29 | | | 4,075,000 | | | | 4,410,914 | |
5.000%, 11/01/29 | | | 5,000,000 | | | | 5,751,735 | |
5.000%, 11/01/30 | | | 11,575,000 | | | | 13,540,401 | |
5.000%, 09/01/31 | | | 8,000,000 | | | | 9,455,470 | |
5.000%, 04/01/32 | | | 5,000,000 | | | | 5,953,574 | |
| | |
University of California, Series BM | | | | | | | | |
5.000%, 05/15/31 1 | | | 2,000,000 | | | | 2,362,596 | |
5.000%, 05/15/32 1 | | | 5,000,000 | | | | 5,977,539 | |
| | | | | | | | |
| | |
| | | Principal Amount | | | Value | |
| | |
University of California, Series S | | | | | | | | |
5.000%, 05/15/36 | | | $3,000,000 | | | | $3,453,213 | |
5.000%, 05/15/37 | | | 3,000,000 | | | | 3,425,656 | |
5.000%, 05/15/38 | | | 3,000,000 | | | | 3,410,677 | |
| | |
Total California | | | | | | | 125,774,599 | |
| | |
Colorado - 0.4% | | | | | | | | |
| | |
Colorado Health Facilities Authority, Series A | | | | | | | | |
5.000%, 08/01/33 | | | 4,260,000 | | | | 4,514,562 | |
| | |
Connecticut - 4.7% | | | | | | | | |
| | |
Connecticut State Health & Educational Facilities Authority | | | | | | | | |
5.000%, 07/01/31 | | | 6,205,000 | | | | 6,812,342 | |
5.000%, 07/01/33 | | | 2,750,000 | | | | 2,980,361 | |
5.000%, 07/01/34 | | | 3,100,000 | | | | 3,350,647 | |
| | |
State of Connecticut Special Tax Revenue, Series A | | | | | | | | |
5.000%, 05/01/28 | | | 3,000,000 | | | | 3,345,715 | |
| | |
State of Connecticut Special Tax Revenue, Transportation Infrastructure, Series A | | | | | | | | |
5.000%, 01/01/30 | | | 10,180,000 | | | | 11,219,614 | |
| | |
State of Connecticut Special Tax Revenue, Series B | | | | | | | | |
5.000%, 10/01/35 | | | 7,500,000 | | | | 8,218,798 | |
| | |
State of Connecticut Special Tax Revenue, Series C | | | | | | | | |
5.000%, 01/01/28 | | | 1,000,000 | | | | 1,108,578 | |
5.000%, 01/01/29 | | | 1,000,000 | | | | 1,121,404 | |
5.000%, 01/01/30 | | | 1,000,000 | | | | 1,139,234 | |
5.000%, 01/01/31 | | | 1,000,000 | | | | 1,156,600 | |
5.000%, 01/01/32 | | | 1,000,000 | | | | 1,162,692 | |
| | |
State of Connecticut, Series A | | | | | | | | |
5.000%, 01/15/31 | | | 7,650,000 | | | | 8,659,339 | |
| | |
Total Connecticut | | | | | | | 50,275,324 | |
| | |
Delaware - 0.3% | | | | | | | | |
| | |
Delaware River & Bay Authority | | | | | | | | |
5.000%, 01/01/31 | | | 1,000,000 | | | | 1,162,820 | |
5.000%, 01/01/32 | | | 1,040,000 | | | | 1,223,585 | |
5.000%, 01/01/33 | | | 1,100,000 | | | | 1,282,892 | |
| | |
Total Delaware | | | | | | | 3,669,297 | |
| | |
District of Columbia - 3.4% | | | | | | | | |
| | |
District of Columbia, Series A | | | | | | | | |
5.000%, 06/01/30 | | | 6,020,000 | | | | 6,479,505 | |
| | |
District of Columbia, Series B | | | | | | | | |
5.000%, 06/01/31 | | | 10,080,000 | | | | 11,322,300 | |
| | |
District of Columbia, Series C | | | | | | | | |
5.000%, 12/01/33 | | | 5,000,000 | | | | 5,867,415 | |
5.000%, 12/01/34 | | | 6,000,000 | | | | 6,961,513 | |
| | |
Washington DC Convention & Sports Authority, Series A | | | | | | | | |
5.000%, 10/01/27 | | | 5,475,000 | | | | 6,026,340 | |
| | |
Total District of Columbia | | | | | | | 36,657,073 | |
The accompanying notes are an integral part of these financial statements.
35
| | |
| | | AMG GW&K Municipal Bond Fund Schedule of Portfolio Investments (continued) |
| | | | | | | | |
| | |
| | | Principal Amount | | | Value | |
| | |
Florida - 4.3% | | | | | | | | |
| | |
Central Florida Expressway Authority | | | | | | | | |
5.000%, 07/01/28 | | | $4,460,000 | | | | $4,967,235 | |
| | |
Escambia County Health Facilities Authority | | | | | | | | |
5.000%, 08/15/37 | | | 6,000,000 | | | | 6,165,401 | |
| | |
Florida Development Finance Corp. | | | | | | | | |
4.000%, 11/15/33 | | | 10,000,000 | | | | 10,123,488 | |
| | |
Florida’s Turnpike Enterprise, Department of Transportation, Series C | | | | | | | | |
5.000%, 07/01/28 | | | 7,075,000 | | | | 7,630,134 | |
| | |
Lee Memorial Health System, Series A1 | | | | | | | | |
5.000%, 04/01/34 | | | 5,645,000 | | | | 6,034,130 | |
| | |
Orange County Health Facilities Authority, Series A | | | | | | | | |
5.000%, 10/01/31 | | | 4,525,000 | | | | 4,759,415 | |
| | |
State of Florida, Series C | | | | | | | | |
5.000%, 06/01/31 | | | 5,375,000 | | | | 6,323,204 | |
| | |
Total Florida | | | | | | | 46,003,007 | |
| | |
Georgia - 1.7% | | | | | | | | |
| | |
Private Colleges & Universities Authority, Series A | | | | | | | | |
5.000%, 09/01/32 | | | 5,000,000 | | | | 5,979,124 | |
| | |
Private Colleges & Universities Authority, Series B | | | | | | | | |
5.000%, 09/01/30 | | | 10,365,000 | | | | 12,068,283 | |
| | |
Total Georgia | | | | | | | 18,047,407 | |
| | |
Illinois - 8.1% | | | | | | | | |
| | |
Chicago O’Hare International Airport, Series A | | | | | | | | |
5.000%, 01/01/35 | | | 5,010,000 | | | | 5,479,704 | |
| | |
Chicago O’Hare International Airport, Series B | | | | | | | | |
5.000%, 01/01/28 | | | 5,670,000 | | | | 5,891,816 | |
| | |
Chicago O’Hare International Airport, Senior Lien, Series A | | | | | | | | |
5.000%, 01/01/36 | | | 10,035,000 | | | | 10,500,574 | |
5.000%, 01/01/38 | | | 5,500,000 | | | | 5,698,790 | |
| | |
Illinois Finance Authority | | | | | | | | |
5.000%, 01/01/29 | | | 2,310,000 | | | | 2,610,849 | |
5.000%, 07/01/29 | | | 8,755,000 | | | | 9,952,332 | |
| | |
Illinois Finance Authority, Series A | | | | | | | | |
4.000%, 08/15/37 | | | 5,910,000 | | | | 5,699,355 | |
| | |
Illinois State Finance Authority Revenue, Clean Water Initiative Revenue | | | | | | | | |
5.000%, 07/01/27 | | | 11,000,000 | | | | 11,712,580 | |
| | |
Illinois State Toll Highway Authority, Series A | | | | | | | | |
5.000%, 12/01/31 | | | 9,735,000 | | | | 10,289,406 | |
| | |
Illinois State Toll Highway Authority, Senior Revenue Bonds, Series A | | | | | | | | |
5.000%, 01/01/30 | | | 10,110,000 | | | | 11,320,825 | |
| | |
State of Illinois, Series A | | | | | | | | |
5.250%, 03/01/37 | | | 8,500,000 | | | | 8,685,368 | |
| | |
Total Illinois | | | | | | | 87,841,599 | |
| | | | | | | | |
| | |
| | | Principal Amount | | | Value | |
| | |
Indiana - 2.2% | | | | | | | | |
| | |
Indiana Finance Authority, Series 1 | | | | | | | | |
5.000%, 10/01/28 | | | $1,000,000 | | | | $1,120,682 | |
5.000%, 10/01/29 | | | 3,555,000 | | | | 4,048,261 | |
| | |
Indiana Finance Authority, Series A | | | | | | | | |
5.000%, 02/01/32 | | | 5,000,000 | | | | 5,809,909 | |
| | |
Indiana Finance Authority, Series B | | | | | | | | |
5.000%, 02/01/34 | | | 5,815,000 | | | | 6,798,044 | |
| | |
Indiana Finance Authority, Series C | | | | | | | | |
5.000%, 06/01/29 | | | 4,800,000 | | | | 5,476,113 | |
| | |
Total Indiana | | | | | | | 23,253,009 | |
| | |
Iowa - 1.5% | | | | | | | | |
| | |
Iowa Finance Authority, State Revolving Fund Green Bond | | | | | | | | |
5.000%, 08/01/30 | | | 15,025,000 | | | | 16,484,229 | |
| | |
Kentucky - 0.5% | | | | | | | | |
| | |
Louisville/Jefferson County Metropolitan Government, Norton Healthcare Inc.,
Series A | | | | | | | | |
5.000%, 10/01/29 | | | 5,505,000 | | | | 5,777,778 | |
| | |
Maine - 0.8% | | | | | | | | |
| | |
Maine Turnpike Authority | | | | | | | | |
5.000%, 07/01/28 | | | 1,955,000 | | | | 2,181,564 | |
5.000%, 07/01/29 | | | 1,600,000 | | | | 1,810,671 | |
5.000%, 07/01/30 | | | 1,390,000 | | | | 1,597,740 | |
5.000%, 07/01/31 | | | 1,500,000 | | | | 1,747,975 | |
5.000%, 07/01/32 | | | 1,390,000 | | | | 1,638,519 | |
| | |
Total Maine | | | | | | | 8,976,469 | |
| | |
Maryland - 7.1% | | | | | | | | |
| | |
Maryland State Transportation Authority | | | | | | | | |
5.000%, 07/01/33 | | | 6,350,000 | | | | 7,291,035 | |
| | |
State of Maryland, Department of Transportation | | | | | | | | |
5.000%, 10/01/28 | | | 12,365,000 | | | | 13,413,762 | |
5.000%, 09/01/29 | | | 12,205,000 | | | | 13,475,583 | |
| | |
State of Maryland, Series C | | | | | | | | |
4.000%, 03/01/28 | | | 9,500,000 | | | | 10,136,426 | |
4.000%, 03/01/29 | | | 9,245,000 | | | | 9,972,956 | |
| | |
State of Maryland, Series D | | | | | | | | |
4.000%, 08/01/28 | | | 8,000,000 | | | | 8,575,709 | |
4.000%, 08/01/29 | | | 6,500,000 | | | | 7,042,308 | |
| | |
State of Maryland, State & Local Facilities Loan of 2019, 1st Series | | | | | | | | |
5.000%, 03/15/30 | | | 6,000,000 | | | | 6,828,295 | |
| | |
Total Maryland | | | | | | | 76,736,074 | |
| | |
Michigan - 2.2% | | | | | | | | |
| | |
Michigan Finance Authority, Henry Ford Health System | | | | | | | | |
5.000%, 11/15/29 | | | 11,450,000 | | | | 12,102,170 | |
| | |
Michigan State Building Authority Revenue, Series I | | | | | | | | |
5.000%, 04/15/27 | | | 5,700,000 | | | | 6,033,296 | |
The accompanying notes are an integral part of these financial statements.
36
| | |
| | | AMG GW&K Municipal Bond Fund Schedule of Portfolio Investments (continued) |
| | | | | | | | |
| | |
| | | Principal Amount | | | Value | |
| | |
Michigan - 2.2% (continued) | | | | | | | | |
| | |
Wayne County Airport Authority, Series A | | | | | | | | |
5.000%, 12/01/37 | | | $2,285,000 | | | | $2,504,730 | |
5.000%, 12/01/38 | | | 1,405,000 | | | | 1,528,144 | |
5.000%, 12/01/39 | | | 1,800,000 | | | | 1,948,293 | |
| | |
Total Michigan | | | | | | | 24,116,633 | |
| | |
New Jersey - 6.1% | | | | | | | | |
| | |
New Jersey Economic Development Authority, Series A | | | | | | | | |
5.250%, 11/01/40 | | | 7,000,000 | | | | 7,472,576 | |
| | |
New Jersey State Turnpike Authority Revenue, Series B | | | | | | | | |
5.000%, 01/01/28 | | | 4,010,000 | | | | 4,427,633 | |
| | |
New Jersey State Turnpike Authority Revenue, Series D | | | | | | | | |
5.000%, 01/01/28 | | | 6,000,000 | | | | 6,449,725 | |
| | |
New Jersey Transportation Trust Fund Authority, Series B | | | | | | | | |
5.000%, 06/15/30 | | | 6,255,000 | | | | 6,892,723 | |
5.000%, 06/15/31 | | | 7,615,000 | | | | 8,427,835 | |
5.000%, 06/15/32 | | | 5,750,000 | | | | 6,337,748 | |
5.000%, 06/15/33 | | | 6,000,000 | | | | 6,565,123 | |
| | |
New Jersey Transportation Trust Fund Authority, Series BB | | | | | | | | |
4.000%, 06/15/37 | | | 3,000,000 | | | | 2,847,361 | |
| | |
South Jersey Transportation Authority | | | | | | | | |
5.000%, 11/01/39 | | | 1,150,000 | | | | 1,169,028 | |
5.000%, 11/01/41 | | | 2,500,000 | | | | 2,528,542 | |
| | |
State of New Jersey,
Series A | | | | | | | | |
5.000%, 06/01/29 | | | 11,500,000 | | | | 12,996,644 | |
| | |
Total New Jersey | | | | | | | 66,114,938 | |
| | |
New Mexico - 1.3% | | | | | | | | |
| | |
New Mexico Finance Authority, Series A | | | | | | | | |
5.000%, 06/15/28 | | | 4,470,000 | | | | 4,984,108 | |
5.000%, 06/15/30 | | | 7,500,000 | | | | 8,625,814 | |
| | |
Total New Mexico | | | | | | | 13,609,922 | |
| | |
New York - 19.0% | | | | | | | | |
| | |
City of New York, Series B-1 | | | | | | | | |
5.000%, 08/01/32 | | | 3,000,000 | | | | 3,539,534 | |
| | |
City of New York, Series C | | | | | | | | |
5.000%, 08/01/33 | | | 1,500,000 | | | | 1,705,347 | |
5.000%, 08/01/34 | | | 3,250,000 | | | | 3,661,864 | |
| | |
City of New York, Series L-5 | | | | | | | | |
5.000%, 04/01/33 | | | 6,500,000 | | | | 7,468,024 | |
| | |
Long Island Power Authority | | | | | | | | |
5.000%, 09/01/35 | | | 5,030,000 | | | | 5,464,745 | |
| | |
Long Island Power Authority, Series A | | | | | | | | |
5.000%, 09/01/30 | | | 2,275,000 | | | | 2,623,262 | |
5.000%, 09/01/31 | | | 3,935,000 | | | | 4,594,517 | |
| | | | | | | | |
| | |
| | | Principal Amount | | | Value | |
| | |
Metropolitan Transportation Authority, Transit Revenue, Green Bond, Series B | | | | | | | | |
5.000%, 11/15/27 | | | $14,225,000 | | | | $14,936,243 | |
| | |
Metropolitan Transportation Authority, Transit Revenue, Series F | | | | | | | | |
5.000%, 11/15/28 | | | 4,760,000 | | | | 4,858,174 | |
| | |
New York City Transitional Finance Authority Building Aid Revenue, Series 1A | | | | | | | | |
5.000%, 07/15/32 | | | 10,835,000 | | | | 12,552,836 | |
| | |
New York City Transitional Finance Authority Building Aid Revenue, Series S-3 | | | | | | | | |
5.000%, 07/15/31 | | | 5,080,000 | | | | 5,659,719 | |
| | |
New York City Transitional Finance Authority Future Tax Secured Revenue | | | | | | | | |
5.000%, 11/01/31 | | | 2,500,000 | | | | 2,919,509 | |
5.000%, 11/01/32 | | | 4,000,000 | | | | 4,655,501 | |
| | |
New York City Transitional Finance Authority Future Tax Secured Revenue, Series 1 | | | | | | | | |
5.000%, 02/01/36 | | | 1,000,000 | | | | 1,127,805 | |
5.000%, 02/01/37 | | | 7,000,000 | | | | 7,732,156 | |
5.000%, 02/01/39 | | | 4,000,000 | | | | 4,392,443 | |
| | |
New York State Dormitory Authority, Series A | | | | | | | | |
5.000%, 03/15/31 | | | 7,670,000 | | | | 8,592,230 | |
5.000%, 03/15/32 | | | 8,000,000 | | | | 9,270,206 | |
5.000%, 03/15/33 | | | 3,200,000 | | | | 3,747,904 | |
| | |
New York State Dormitory Authority, Series E | | | | | | | | |
5.000%, 03/15/32 | | | 8,410,000 | | | | 8,875,596 | |
| | |
New York State Dormitory Authority, Series S | | | | | | | | |
4.000%, 05/01/39 | | | 2,000,000 | | | | 1,930,935 | |
| | |
New York State Urban Development Corp. | | | | | | | | |
5.000%, 03/15/32 | | | 12,000,000 | | | | 13,837,038 | |
| | |
New York Transportation Development Corp. | | | | | | | | |
4.000%, 10/31/41 | | | 1,250,000 | | | | 1,096,980 | |
4.000%, 10/31/46 | | | 1,500,000 | | | | 1,262,920 | |
5.000%, 12/01/30 | | | 1,000,000 | | | | 1,078,518 | |
5.000%, 12/01/31 | | | 1,100,000 | | | | 1,183,524 | |
5.000%, 12/01/32 | | | 1,450,000 | | | | 1,558,211 | |
5.000%, 12/01/33 | | | 1,000,000 | | | | 1,069,563 | |
| | |
New York Transportation Development Corp.,
Series P | | | | | | | | |
5.000%, 12/01/36 | | | 10,000,000 | | | | 10,341,972 | |
| | |
Port Authority of New York & New Jersey, Series 221 | | | | | | | | |
5.000%, 07/15/32 | | | 6,545,000 | | | | 7,117,845 | |
| | |
Triborough Bridge & Tunnel Authority | | | | | | | | |
5.000%, 05/15/30 | | | 10,000,000 | | | | 11,522,063 | |
5.000%, 05/15/31 | | | 10,000,000 | | | | 11,683,516 | |
5.000%, 05/15/32 | | | 5,000,000 | | | | 5,908,015 | |
| | |
Triborough Bridge & Tunnel Authority, Series 2 | | | | | | | | |
5.000%, 11/15/32 | | | 8,000,000 | | | | 9,453,366 | |
| | |
Utility Debt Securitization Authority, Series TE | | | | | | | | |
5.000%, 06/15/31 | | | 6,800,000 | | | | 7,763,986 | |
| | |
Total New York | | | | | | | 205,186,067 | |
The accompanying notes are an integral part of these financial statements.
37
| | |
| | | AMG GW&K Municipal Bond Fund Schedule of Portfolio Investments (continued) |
| | | | | | | | |
| | |
| | | Principal Amount | | | Value | |
| | |
North Carolina - 1.0% | | | | | | | | |
| | |
North Carolina State Limited Obligation, Series B | | | | | | | | |
5.000%, 05/01/28 | | | $10,000,000 | | | | $10,960,963 | |
| | |
Ohio - 0.9% | | | | | | | | |
| | |
Ohio State General Obligation, Series T | | | | | | | | |
5.000%, 05/01/30 | | | 5,000,000 | | | | 5,466,663 | |
| | |
State of Ohio, Series C | | | | | | | | |
5.000%, 09/01/30 | | | 3,910,000 | | | | 4,549,584 | |
| | |
Total Ohio | | | | | | | 10,016,247 | |
| | |
Oregon - 1.9% | | | | | | | | |
| | |
Oregon State Lottery, Series C | | | | | | | | |
5.000%, 04/01/27 | | | 10,000,000 | | | | 10,495,567 | |
| | |
Oregon State Lottery, Series D | | | | | | | | |
5.000%, 04/01/28 | | | 9,225,000 | | | | 9,682,161 | |
| | |
Total Oregon | | | | | | | 20,177,728 | |
| | |
Pennsylvania - 3.4% | | | | | | | | |
| | |
Allegheny County Airport Authority, Series A | | | | | | | | |
5.000%, 01/01/31 | | | 1,350,000 | | | | 1,467,595 | |
5.000%, 01/01/32 | | | 2,215,000 | | | | 2,393,738 | |
| | |
Allegheny County Hospital Development Authority, University Pittsburgh Medical Center | | | | | | | | |
5.000%, 07/15/31 | | | 5,530,000 | | | | 6,095,018 | |
| | |
Commonwealth Financing Authority, Pennsylvania Tobacco | | | | | | | | |
5.000%, 06/01/32 | | | 7,910,000 | | | | 8,577,054 | |
| | |
Hospitals & Higher Education Facilities Authority of Philadelphia | | | | | | | | |
4.000%, 07/01/38 | | | 2,500,000 | | | | 2,418,821 | |
4.000%, 07/01/39 | | | 2,000,000 | | | | 1,925,957 | |
| | |
Pennsylvania Economic Development Financing Authority | | | | | | | | |
5.250%, 06/30/35 | | | 3,000,000 | | | | 3,189,392 | |
5.750%, 06/30/48 | | | 5,000,000 | | | | 5,206,001 | |
| | |
Pennsylvania Turnpike Commission, Series A | | | | | | | | |
5.000%, 12/01/33 | | | 5,000,000 | | | | 5,792,940 | |
| | |
Total Pennsylvania | | | | | | | 37,066,516 | |
| | |
Texas - 6.8% | | | | | | | | |
| | |
City of Corpus Christi TX Utility System Revenue, Junior Lien | | | | | | | | |
5.000%, 07/15/29 | | | 3,125,000 | | | | 3,456,364 | |
| | |
City of Houston TX Airport System Revenue, Series A | | | | | | | | |
4.000%, 07/01/35 | | | 1,100,000 | | | | 1,064,938 | |
4.000%, 07/01/36 | | | 1,100,000 | | | | 1,052,830 | |
5.000%, 07/01/34 | | | 2,835,000 | | | | 3,056,614 | |
| | |
City of San Antonio TX Electric & Gas Systems Revenue, Series A | | | | | | | | |
5.000%, 02/01/37 | | | 3,010,000 | | | | 3,307,056 | |
5.000%, 02/01/38 | | | 2,985,000 | | | | 3,266,956 | |
| | |
Dallas Area Rapid Transit, Senior Lien | | | | | | | | |
5.250%, 12/01/28 | | | 8,865,000 | | | | 10,114,763 | |
| | | | | | | | |
| | |
| | | Principal Amount | | | Value | |
| | |
Dallas Fort Worth International Airport, Series A | | | | | | | | |
5.000%, 11/01/30 | | | $2,000,000 | | | | $2,307,434 | |
5.000%, 11/01/31 | | | 3,265,000 | | | | 3,751,104 | |
| | |
Lower Colorado River Authority, LCRA Transmission Services Corporation | | | | | | | | |
5.000%, 05/15/29 | | | 3,815,000 | | | | 3,908,514 | |
| | |
North Texas Municipal Water District Water System Revenue, Refunding and Improvement | | | | | | | | |
5.000%, 09/01/29 | | | 7,350,000 | | | | 7,925,795 | |
| | |
North Texas Tollway Authority, 2nd Tier, Series B | | | | | | | | |
5.000%, 01/01/31 | | | 2,000,000 | | | | 2,099,042 | |
5.000%, 01/01/32 | | | 3,010,000 | | | | 3,201,201 | |
| | |
North Texas Tollway Authority, Series A | | | | | | | | |
5.250%, 01/01/38 | | | 4,500,000 | | | | 5,000,636 | |
| | |
State of Texas, Series A | | | | | | | | |
5.000%, 10/01/29 | | | 5,000,000 | | | | 5,303,339 | |
| | |
Texas Private Activity Bond Surface Transportation Corp., Series A | | | | | | | | |
4.000%, 12/31/37 | | | 5,000,000 | | | | 4,605,433 | |
4.000%, 12/31/38 | | | 3,735,000 | | | | 3,404,415 | |
| | |
Texas Water Development Board | | | | | | | | |
5.000%, 08/01/38 | | | 5,860,000 | | | | 6,610,933 | |
| | |
Total Texas | | | | | | | 73,437,367 | |
| | |
Utah - 2.1% | | | | | | | | |
| | |
Intermountain Power Agency, Series A | | | | | | | | |
5.000%, 07/01/34 | | | 5,250,000 | | | | 6,023,794 | |
| | |
Salt Lake City Corp. Airport Revenue, Series A | | | | | | | | |
5.000%, 07/01/29 | | | 3,450,000 | | | | 3,667,536 | |
5.000%, 07/01/30 | | | 6,585,000 | | | | 6,997,951 | |
| | |
University of Utah/The, Series B | | | | | | | | |
5.000%, 08/01/37 | | | 5,000,000 | | | | 5,670,287 | |
| | |
Total Utah | | | | | | | 22,359,568 | |
| | |
Virginia - 0.5% | | | | | | | | |
| | |
Virginia Small Business Financing Authority | | | | | | | | |
4.000%, 01/01/37 | | | 3,000,000 | | | | 2,812,422 | |
4.000%, 01/01/38 | | | 3,000,000 | | | | 2,782,255 | |
| | |
Total Virginia | | | | | | | 5,594,677 | |
| | |
Washington - 2.5% | | | | | | | | |
| | |
Port of Seattle, Series C | | | | | | | | |
5.000%, 08/01/31 | | | 5,000,000 | | | | 5,492,102 | |
| | |
State of Washington School Improvements, Series C | | | | | | | | |
5.000%, 02/01/28 | | | 7,370,000 | | | | 7,864,426 | |
| | |
State of Washington, Series C | | | | | | | | |
5.000%, 07/01/28 | | | 10,280,000 | | | | 10,728,741 | |
| | |
Washington Health Care Facilities Authority, Series A | | | | | | | | |
5.000%, 08/01/38 | | | 3,270,000 | | | | 3,381,039 | |
| | |
Total Washington | | | | | | | 27,466,308 | |
The accompanying notes are an integral part of these financial statements.
38
| | |
| | | AMG GW&K Municipal Bond Fund Schedule of Portfolio Investments (continued) |
| | | | | | | | |
| | | Principal Amount | | | Value | |
| | |
West Virginia - 0.9% | | | | | | | | |
| | |
West Virginia Parkways Authority | | | | | | | | |
5.000%, 06/01/37 | | | $1,750,000 | | | | $1,951,686 | |
5.000%, 06/01/38 | | | 2,000,000 | | | | 2,215,442 | |
5.000%, 06/01/39 | | | 5,150,000 | | | | 5,670,468 | |
| | |
Total West Virginia | | | | | | | 9,837,596 | |
| | |
Wisconsin - 2.9% | | | | | | | | |
| | |
State of Wisconsin, Series 1 | | | | | | | | |
5.000%, 05/01/31 | | | 2,700,000 | | | | 3,121,279 | |
| | |
State of Wisconsin, Series A | | | | | | | | |
5.000%, 05/01/31 | | | 5,000,000 | | | | 5,258,596 | |
| | |
Wisconsin State Revenue, Department of Transportation, Series 2 | | | | | | | | |
5.000%, 07/01/29 | | | 20,405,000 | | | | 22,486,722 | |
| | |
Total Wisconsin | | | | | | | 30,866,597 | |
| | |
Total Municipal Bonds | | | | | | | | |
(Cost $1,142,894,341) | | | | | | | 1,082,545,523 | |
| | | | | | | | |
| | | Principal
Amount | | | Value | |
| |
Short-Term Investments - 0.1% | | | | | |
| |
Repurchase Agreements - 0.1% | | | | | |
| | |
Fixed Income Clearing Corp., dated 12/30/22 due 01/03/23, 4.150% total to be received $668,308 (collateralized by a U.S. Treasury, 0.125%, 01/15/32, totaling $681,377) | | | $668,000 | | | | $668,000 | |
| |
Total Short-Term Investments | | | | | |
(Cost $668,000) | | | | | | | 668,000 | |
| |
Total Investments - 100.2% | | | | | |
(Cost $1,143,562,341) | | | | | | | 1,083,213,523 | |
| |
Other Assets, less Liabilities - (0.2)% | | | | (1,951,011 | ) |
| |
Net Assets - 100.0% | | | | $1,081,262,512 | |
| 1 | All or part of a security is delayed delivery transaction. The market value for delayed delivery securities at December 31, 2022, amounted to $8,340,135, or 0.8% of net assets. |
The following table summarizes the inputs used to value the Fund’s investments by the fair value hierarchy levels as of December 31, 2022:
| | | | | | | | | | | | | | | | |
| | | Level 1 | | | Level 2 | | | Level 3 | | | Total | |
| | | | |
Investments in Securities | | | | | | | | | | | | | | | | |
| | | | |
Municipal Bonds† | | | — | | | $ | 1,082,545,523 | | | | — | | | $ | 1,082,545,523 | |
| | | | |
Short-Term Investments | | | | | | | | | | | | | | | | |
| | | | |
Repurchase Agreements | | | — | | | | 668,000 | | | | — | | | | 668,000 | |
| | | | | | | | | | | | | | | | |
| | | | |
Total Investments in Securities | | | — | | | $ | 1,083,213,523 | | | | — | | | $ | 1,083,213,523 | |
| | | | | | | | | | | | | | | | |
| † | All municipal bonds held in the Fund are Level 2 securities. For a detailed breakout of municipal bonds by major classification, please refer to the Fund’s Schedule of Portfolio Investments. |
For the fiscal year ended December 31, 2022, there were no transfers in or out of Level 3.
The accompanying notes are an integral part of these financial statements.
39
| | |
| | | AMG GW&K Municipal Enhanced Yield Fund Portfolio Manager’s Comments (unaudited) |
| | | | | | | | |
THE YEAR IN REVIEW For the year ended December 31, 2022, AMG GW&K Municipal Enhanced Yield Fund’s (the “Fund”) Class N shares returned (18.19)%, compared to the Bloomberg U.S. Municipal Bond BAA Index (the “Index”), which returned (11.63)%. In the first quarter of 2022, Municipal bonds suffered their worst quarter of performance in 40 years, getting caught in a Treasury market rout that stemmed from the mounting determination of central banks to combat sustained inflationary pressure. Coming into 2022, the U.S. Federal Reserve (the Fed) had been projecting only three quarter-point rate hikes for the calendar year, an outlook that was also reflected in the futures market. But as the quarter progressed, labor markets began to overheat and core inflation surged to a four-decade high. Russia’s invasion of Ukraine sent energy and grain prices soaring amid a humanitarian crisis with no clear endgame. In response to these developments, the Fed rhetoric grew more hawkish and policy projections turned more aggressive. At the March Federal Open Market Committee (FOMC) meeting, after lifting rates for the first time since 2018, committee members raised their forecast to seven total hikes for 2022 and by quarter-end, the futures market was pricing in nine. Short Treasury yields surged, mirroring the faster pace of hikes, while those out longer increased less, reflecting the possible damage to growth. The combination of those two dynamics led to inversions at key segments of the curve, which raised questions as to whether monetary policy can successfully tame inflation without tipping the economy into recession. Going into the second quarter, municipal bonds posted more losses, adding to their worst start to any year on record. The selloff was driven by the Fed’s aggressive tightening campaign, as successive 40-year highs in the Consumer Price Index (CPI) put to rest any lingering convictions that inflation would prove “transitory.” Officials raised rates twice during the quarter, first by half a point in May and then by three-quarters of a point in June, the latter the largest such move since 1994. Interest rates responded by climbing to multi-year highs. Fed Chair Jerome Powell stepped up his hawkish rhetoric, emphasizing the tightness of the labor force and the mounting risks from continued supply chain disruptions, the war in Ukraine and China’s zero-COVID policy. The implication was clear: the long-term damage from entrenched inflation must be prioritized above all else, even at the risk of | | | | slowing economic growth. Investors got the message, becoming less concerned about a price spiral and more worried about the possibility of a recession. Inflation breakeven measures plunged over the final three weeks of June while futures markets pared bets on the peak Fed Funds rate and even priced in cuts by the middle of next year. Interest rates finished well below their mid-June cyclical highs, but were still up meaningfully for the quarter. Municipal bonds again posted heavy losses in the third quarter as hopes faded that the Fed would soon pull back on its aggressive tightening program. After an impressive rally in July, when it still seemed possible that a lowercase “R” recession might usher in an early-summer easing, bond yields soared over the following two months. The two major culprits were the labor market, which stayed extremely tight, and inflation, which remained broad-based and hovered near 40-year highs. The Fed officials cited the data as evidence that more needed to be done, lest elevated inflation expectations become entrenched. The FOMC followed through by raising rates 150 basis points (bps) during the quarter, doubling the magnitude of hikes from the first half of the year. As importantly, committee members signaled more to come, forecasting a steeper policy path and higher terminal rate than traders had expected. Sentiment was also weighed down by geopolitical crosscurrents, including the ongoing war in Ukraine, COVID lockdowns in China and a brief but dramatic crash in UK government debt, which necessitated an intervention from the Bank of England. In late September the yield on the 10-year Treasury touched 4.00% for the first time since 2008, before declining slightly to end the quarter at 3.83%. As we ended the year, municipal bonds posted their strongest quarterly performance in over a decade, partially erasing what still amounted to the worst annual loss in 40 years. With a struggling Treasury market providing little direction, returns were instead powered by a combination of scant supply and building demand. New issue volume for the fourth quarter declined 40% on a year-over-year basis, creating a scarcity premium that was turbo-charged by the need for investors to reinvest seasonally high coupon and maturity redemptions. Although mutual funds continued to experience significant outflows, likely exacerbated by year-end tax-loss selling, the bid-side remained strong and picked up steam as the quarter progressed. In fact, after a modest selloff in October, tax-exempt yields staged a breathtaking turnaround, plummeting 70-90 bps through | | | | mid-December. Even with that rally, however, rates were still up 1.60% to 2.30% from January’s historically low starting point, leaving no escape from the sharply negative annual performance that materialized across the entire curve. Although municipal bonds outperformed Treasuries over the quarter, they were still directionally influenced by the underlying forces driving the broader market. Early in the quarter, interest rates shot up due to still-elevated inflation, tight labor markets, and hawkish saber rattling from central banks. By October 28, 2022, the yield on the 10-year Treasury had risen 40 bps for the month to close at 4.24%, its highest level since 2008. From there, however, sentiment turned as the lagged effects of contractionary policy seemed to take hold. Key prints on inflation decelerated from their peaks, creating a sense that the worst may be over. A pullback in manufacturing and a softening in unit labor costs were also contributing factors. And while the Fed continued to talk tough on keeping policy restrictive, a downshift to a 50 bp hike in December after four consecutive 75 bp increases lent further credibility to the slowdown narrative. The futures market even started pricing in a couple of rate cuts for the back half of 2023. From its October high, the 10-year Treasury yield dropped 36 bps the rest of the way, ending December more than 50 bps below the yield on the two-year, the steepest inversion of that segment of the curve since the early 1980s. Amid this backdrop, the Fund materially underperformed the Index for the full year. The Fund’s longer duration was the biggest negative as interest rates rose. Positively contributing to performance for the year was the Fund’s higher-quality bias and its overweight to higher coupon bonds. OUTLOOK Don’t be fooled by all the hand-wringing over what a terrible year 2022 was for bonds. In fact, long-term investors should be grateful for what transpired. Make no mistake, ultra-low interest rates are a threat to savers, especially those artificially manufactured by well-intentioned governments. It was critical to break out of that destabilizing cycle and mark-to-market losses were a small price to pay to get there. We believe municipal bonds enter 2023 in much better shape. Yields that began the year at 1% are now far more attractive, in many instances topping 5% on a tax-equivalent basis. The technical backdrop should continue strong, with issuance remaining low due to a decline in refunding |
40
| | |
| | | AMG GW&K Municipal Enhanced Yield Fund Portfolio Manager’s Comments (continued) |
| | | | | | | | |
| opportunities. The outflow cycle that plagued 2022 will likely lose steam in the face of better yields and less tax-loss selling. States are better positioned to withstand the effects of a potential recession, having made prudent use of windfall tax collections to build record reserves. To be sure, challenges still exist. More economically sensitive sectors will need closer | | | | scrutiny and a historically flat yield curve alters the risk/return calculus. But these issues are considerably less difficult to navigate than central banks pinning rates near zero. And we look forward to taking advantage of the gift handed to us by the 2022 market. | | | | The views expressed represent the opinions of GW&K Investment Management, LLC as of December 31, 2022, and are not intended as a forecast or guarantee of future results, and are subject to change without notice. |
41
|
AMG GW&K Municipal Enhanced Yield Fund Portfolio Manager’s Comments (continued) |
CUMULATIVE TOTAL RETURN PERFORMANCE
AMG GW&K Municipal Enhanced Yield Fund’s cumulative total return is based on the daily change in net asset value (NAV), and assumes that all dividends and distributions were reinvested. The graph compares a hypothetical $10,000 investment made in the AMG GW&K Municipal Enhanced Yield Fund’s Class N shares on December 31, 2012, to a $10,000 investment made in the Bloomberg U.S. Municipal Bond BAA Index for the same time period. The graph and table do not reflect the deduction of taxes that a shareholder would pay on a Fund distribution or redemption of shares. The listed returns for the Fund are net of expenses and the returns for the index exclude expenses. Total returns would have been lower had certain expenses not been reduced.
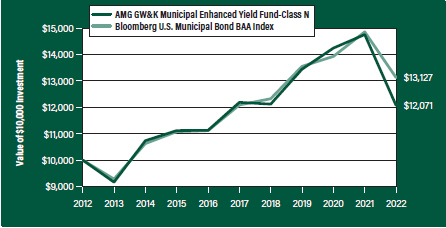
The table below shows the average annual total returns for the AMG GW&K Municipal Enhanced Yield Fund and the Bloomberg U.S. Municipal Bond BAA Index for the same time periods ended December 31, 2022.
| | | | | | | | | | | | | | | | | | | | |
| | | One | | | Five | | | Ten | | | Since | | | Inception | |
| Average Annual Total Returns1 | | Year | | | Years | | | Years | | | Inception | | | Date | |
|
AMG GW&K Municipal Enhanced Yield Fund2, 3, 4, 5, 6, 7, 8, 9, 10 | |
Class N | | | (18.19 | %) | | | (0.19 | %) | | | 1.90 | % | | | 4.35 | % | | | 07/27/09 | |
| | | | | |
Class I | | | (17.86 | %) | | | 0.19 | % | | | 2.33 | % | | | 3.53 | % | | | 12/30/05 | |
| | | | | |
Class Z | | | (17.82 | %) | | | 0.24 | % | | | — | | | | 1.57 | % | | | 02/24/17 | |
Bloomberg U.S. Municipal Bond BAA Index11 | | | (11.63 | %) | | | 1.66 | % | | | 2.76 | % | | | 4.51 | % | | | 07/27/09 | † |
The performance data shown represents past performance. Past performance is not a guarantee of future results. Current performance may be lower or higher than the performance data quoted. The investment return and principal value of an investment will fluctuate so that an investor’s shares, when redeemed, may be worth more or less than their original cost.
Investors should carefully consider the Fund’s investment objectives, risks, charges and expenses before investing. For performance information through the most recent month end, current net asset values per share for the Fund and other information, please call 800.548.4539 or visit our website at amgfunds.com for a free prospectus. Read it carefully before investing or sending money.
Distributed by AMG Distributors, Inc., member FINRA/SIPC.
| † | Date reflects the inception date of the Fund, not the index. |
| 1 | Total return equals income yield plus share price change and assumes reinvestment of all dividends and capital gain distributions. Returns are net of fees and may reflect offsets of Fund expenses as described in the prospectus. No adjustment has been made for taxes payable by shareholders on their reinvested dividends and |
|
capital gain distributions. Returns for periods greater than one year are annualized. The listed returns on the Fund are net of expenses and based on the published NAV as of December 31, 2022. All returns are in U.S. Dollars ($). 2 From time to time, the Fund’s investment manager has waived its fees and/or absorbed Fund expenses, which has resulted in higher returns. 3 The Fund is subject to the risks associated with investments in debt securities, such as default risk and fluctuations in the perception of the debtor’s ability to pay its creditors. Changing interest rates may adversely affect the value of an investment. An increase in interest rates typically causes the value of bonds and other fixed income securities to fall. 4 Companies that are in similar industry sectors may be similarly affected by particular economic or market events; to the extent the Fund has substantial holdings within a particular sector, the risks associated with that sector increase. 5 The Fund may invest in derivatives such as options and futures; the complexity and rapidly changing structure of derivatives markets may increase the possibility of market losses. 6 High-yield bonds (also known as “junk bonds”) may be subject to greater levels of interest rate, credit, and liquidity risk than investments in higher rated securities. These securities are considered predominantly speculative with respect to the issuer’s continuing ability to make principal and interest payments. The issuers of the Fund’s holdings may be involved in bankruptcy proceedings, reorganizations, or financial restructurings, and are not as strong financially as higher-rated issuers. 7 The use of leverage in a Fund’s strategy, such as futures and forward commitment transactions, can magnify relatively small market movements into relatively larger losses for the Fund. 8 Factors unique to the municipal bond market may negatively affect the value of municipal bonds. 9 Investment income may be subject to certain state and local taxes, and depending on your tax status, the federal alternative minimum tax. Capital gains are not exempt from federal income tax. 10 Market prices of investments held by the Fund may fall rapidly or unpredictably due to a variety of economic or political factors, market conditions, disasters or public health issues, or in response to events that affect particular industries or companies. |
42
| | |
| | | AMG GW&K Municipal Enhanced Yield Fund Portfolio Manager’s Comments (continued) |
| | | | | | | | |
11 The Bloomberg U.S. Municipal Bond BAA Index is a subset of the Bloomberg U.S. Municipal Bond Index with an index rating of Baa1, Baa2, or Baa3. The Bloomberg U.S. Municipal Bond Index is a rules-based, market-value-weighted index engineered for the long-term, tax-exempt bond market. Unlike the Fund, the Bloomberg U.S. Municipal Bond BAA Index is unmanaged, is not available for investment and does not incur expenses. | | | | “Bloomberg®” and any Bloomberg index described herein are service marks of Bloomberg Finance L.P. and its affiliates, including Bloomberg Index Services Limited (“BISL”), the administrator of the index (collectively, “Bloomberg”) and have been licensed for use for certain purposes by AMG Funds LLC. Bloomberg is not affiliated with AMG Funds LLC, and Bloomberg does not approve, endorse, review, or recommend the fund described herein. Bloomberg | | | | does not guarantee the timeliness, accurateness, or completeness of any data or information relating to such fund. Not FDIC insured, nor bank guaranteed. May lose value. |
43
| | |
| | | AMG GW&K Municipal Enhanced Yield Fund Fund Snapshots (unaudited) December 31, 2022 |
PORTFOLIO BREAKDOWN
| | | | | |
| Category | | % of
Net Assets |
| | |
Transportation | | | | 38.8 | |
| | |
Medical | | | | 22.6 | |
| | |
General Obligation | | | | 22.5 | |
| | |
Industrial Development | | | | 5.1 | |
| | |
Education | | | | 4.8 | |
| | |
Tobacco Settlement | | | | 4.2 | |
| | |
Short-Term Investments | | | | 0.4 | |
| | |
Other Assets, less Liabilities | | | | 1.6 | |
| | | | | |
| Rating | | % of Market Value1 |
| | |
Aaa/AAA | | | | 0.9 | |
| | |
Aa/AA | | | | 6.2 | |
| | |
A | | | | 44.8 | |
| | |
Baa/BBB | | | | 48.1 | |
| 1 | Includes market value of long-term fixed-income securities only. |
TOP TEN HOLDINGS
| | |
Security Name | | % of
Net Assets |
| | |
Texas Private Activity Bond Surface Transportation Corp., 5.000%, 06/30/58 | | 3.4 |
| | |
Chicago O’Hare International Airport, Senior Lien, Series A, 5.000%, 01/01/48 | | 2.6 |
| | |
Brevard County Health Facilities Authority, Series A, 5.000%, 04/01/47 | | 2.4 |
| | |
Pennsylvania Economic Development Financing Authority, 5.250%, 06/30/53 | | 2.3 |
| | |
New York Transportation Development Corp., Revenue, 4.000%, 04/30/53 | | 2.2 |
| | |
Central Plains Energy Project #3, Series A, 5.000%, 09/01/42 | | 2.1 |
| | |
Pennsylvania Turnpike Commission, Series A, 4.000%, 12/01/50 | | 2.1 |
| | |
Public Authority for Colorado Energy Natural Gas Purchase Revenue, 6.500%, 11/15/38 | | 2.0 |
| | |
Escambia County Health Facilities Authority, 4.000%, 08/15/50 | | 2.0 |
| | |
New York Transportation Development Corp., 5.000%, 12/01/40 | | 2.0 |
| | | |
| | |
Top Ten as a Group | | 23.1 |
| | |
Credit quality ratings shown above reflect the highest rating assigned by either Standard & Poor’s (“S&P”), Moody’s Investors Service, Inc. (“Moody’s”) or Fitch. These rating agencies are independent, nationally recognized statistical rating organizations and are widely used. Investment grade ratings are credit ratings of BBB- or higher. Below investment grade ratings are credit ratings of BB+ or lower. Investments designated N/R are not rated by any of the rating agencies. Unrated investments do not necessarily indicate low credit quality. Credit quality ratings are subject to change.
Because a fund’s strategy may result in multiple investments in particular sectors of the economy, its performance may depend on the performance of those sectors and may fluctuate more widely than investments diversified across more sectors. For additional information on these and other risk considerations, please see the Fund’s prospectus.
Any sectors, industries, or securities discussed should not be perceived as investment recommendations. Mention of a specific security should not be considered a recommendation to buy or solicitation to sell that security. Specific securities mentioned in this report may have been sold from the Fund’s portfolio of investments by the time you receive this report.
44
| | |
| | | AMG GW&K Municipal Enhanced Yield Fund Schedule of Portfolio Investments December 31, 2022 |
| | | | | | | | |
| | |
| | | Principal Amount | | | Value | |
| | |
Municipal Bonds - 98.0% | | | | | | | | |
| | |
California - 6.2% | | | | | | | | |
| | |
California Municipal Finance Authority | | | | | | | | |
5.000%, 05/15/43 | | | $3,000,000 | | | | $3,007,373 | |
5.000%, 05/15/48 | | | 4,600,000 | | | | 4,547,569 | |
| | |
California Municipal Finance Authority, Series A | | | | | | | | |
4.000%, 02/01/51 | | | 1,500,000 | | | | 1,344,180 | |
| | |
Riverside County Transportation Commission, Series B1 | | | | | | | | |
4.000%, 06/01/46 | | | 2,500,000 | | | | 2,313,403 | |
| | |
Riverside County Transportation Commission, Series C | �� | | | | | | | |
4.000%, 06/01/47 | | | 3,425,000 | | | | 3,146,980 | |
| | |
San Diego County Regional Airport Authority, Series B | | | | | | | | |
4.000%, 07/01/51 | | | 2,000,000 | | | | 1,728,578 | |
| |
Total California | | | | 16,088,083 | |
| | |
Colorado - 3.9% | | | | | | | | |
| | |
Colorado Health Facilities Authority, Series A | | | | | | | | |
5.000%, 08/01/44 | | | 5,000,000 | | | | 5,008,861 | |
| | |
Public Authority for Colorado Energy Natural Gas Purchase Revenue | | | | | | | | |
6.500%, 11/15/38 | | | 4,445,000 | | | | 5,207,013 | |
| |
Total Colorado | | | | 10,215,874 | |
| | |
Connecticut - 2.9% | | | | | | | | |
| | |
Connecticut State Health & Educational Facilities Authority | | | | | | | | |
4.000%, 07/01/39 | | | 3,000,000 | | | | 2,768,631 | |
4.000%, 07/01/40 | | | 3,400,000 | | | | 3,097,196 | |
4.000%, 07/01/42 | | | 1,750,000 | | | | 1,547,461 | |
| |
Total Connecticut | | | | 7,413,288 | |
| | |
Florida - 11.9% | | | | | | | | |
| | |
Brevard County Health Facilities Authority | | | | | | | | |
5.000%, 04/01/47 | | | 6,000,000 | | | | 6,181,279 | |
| | |
City of Tampa, Series B | | | | | | | | |
5.000%, 07/01/50 | | | 2,460,000 | | | | 2,482,795 | |
| | |
County of Miami-Dade Seaport Department, Series A | | | | | | | | |
4.000%, 10/01/45 | | | 4,750,000 | | | | 4,290,215 | |
| | |
Escambia County Health Facilities Authority | | | | | | | | |
4.000%, 08/15/50 | | | 6,050,000 | | | | 5,138,584 | |
| | |
Florida Development Finance Corp. | | | | | | | | |
4.000%, 02/01/52 | | | 3,000,000 | | | | 2,317,606 | |
5.000%, 02/01/52 | | | 2,000,000 | | | | 1,814,238 | |
| | |
Hillsborough County Industrial Development Authority | | | | | | | | |
4.000%, 08/01/50 | | | 5,000,000 | | | | 4,225,508 | |
| | |
Miami Beach Health Facilities Authority | | | | | | | | |
4.000%, 11/15/46 | | | 5,000,000 | | | | 4,321,604 | |
| |
Total Florida | | | | 30,771,829 | |
| | | | | | | | |
| | |
| | | Principal Amount | | | Value | |
| | |
Illinois - 10.3% | | | | | | | | |
| | |
Chicago O’Hare International Airport, Senior Lien, Series A | | | | | | | | |
5.000%, 01/01/48 | | | $6,750,000 | | | | $6,839,776 | |
| | |
Metropolitan Pier & Exposition Authority | | | | | | | | |
4.000%, 12/15/42 | | | 2,000,000 | | | | 1,740,270 | |
4.000%, 06/15/52 | | | 3,000,000 | | | | 2,428,314 | |
5.000%, 06/15/50 | | | 5,000,000 | | | | 4,870,522 | |
| | |
State of Illinois | | | | | | | | |
5.500%, 05/01/39 | | | 4,000,000 | | | | 4,128,331 | |
5.750%, 05/01/45 | | | 3,000,000 | | | | 3,115,852 | |
| | |
State of Illinois, Series A | | | | | | | | |
4.000%, 03/01/40 | | | 1,500,000 | | | | 1,303,398 | |
5.000%, 03/01/46 | | | 2,225,000 | | | | 2,162,415 | |
| |
Total Illinois | | | | 26,588,878 | |
| | |
Massachusetts - 1.6% | | | | | | | | |
| | |
Massachusetts Development Finance Agency | | | | | | | | |
4.000%, 07/01/51 | | | 5,180,000 | | | | 4,190,784 | |
| | |
Minnesota - 0.9% | | | | | | | | |
| | |
Duluth Economic Development Authority, Essentia Health Obligated Group, Series A | | | | | | | | |
5.000%, 02/15/48 | | | 2,550,000 | | | | 2,477,997 | |
| | |
Nebraska - 2.1% | | | | | | | | |
| | |
Central Plains Energy Project #3, Series A | | | | | | | | |
5.000%, 09/01/42 | | | 5,560,000 | | | | 5,579,807 | |
| | |
New Jersey - 12.2% | | | | | | | | |
| | |
New Jersey Economic Development Authority | | | | | | | | |
5.000%, 11/01/44 | | | 2,500,000 | | | | 2,547,965 | |
| | |
New Jersey Economic Development Authority, Series QQQ | | | | | | | | |
4.000%, 06/15/46 | | | 1,500,000 | | | | 1,300,037 | |
4.000%, 06/15/50 | | | 1,500,000 | | | | 1,261,590 | |
| | |
New Jersey Transportation Trust Fund Authority, Series AA | | | | | | | | |
4.000%, 06/15/45 | | | 2,000,000 | | | | 1,746,511 | |
4.000%, 06/15/50 | | | 2,000,000 | | | | 1,682,120 | |
5.000%, 06/15/45 | | | 1,000,000 | | | | 1,019,723 | |
5.000%, 06/15/50 | | | 1,500,000 | | | | 1,517,519 | |
| | |
New Jersey Transportation Trust Fund Authority, Series B | | | | | | | | |
5.250%, 06/15/46 | | | 2,000,000 | | | | 2,106,085 | |
5.500%, 06/15/50 | | | 1,000,000 | | | | 1,069,443 | |
| | |
New Jersey Transportation Trust Fund Authority, Series BB | | | | | | | | |
5.000%, 06/15/44 | | | 1,750,000 | | | | 1,779,880 | |
| | |
South Jersey Transportation Authority | | | | | | | | |
4.625%, 11/01/47 | | | 3,500,000 | | | | 3,298,105 | |
5.250%, 11/01/52 | | | 4,500,000 | | | | 4,567,224 | |
| | |
Tobacco Settlement Financing Corp. | | | | | | | | |
Series A | | | | | | | | |
5.000%, 06/01/46 | | | 2,500,000 | | | | 2,449,212 | |
5.250%, 06/01/46 | | | 3,285,000 | | | | 3,295,562 | |
The accompanying notes are an integral part of these financial statements.
45
| | |
| | | AMG GW&K Municipal Enhanced Yield Fund Schedule of Portfolio Investments (continued) |
| | | | | | | | |
| | |
| | | Principal Amount | | | Value | |
| |
New Jersey - 12.2% (continued) | | | | | |
| | |
Tobacco Settlement Financing Corp. | | | | | | | | |
Series B | | | | | | | | |
5.000%, 06/01/46 | | | $2,050,000 | | | | $1,957,389 | |
| |
Total New Jersey | | | | 31,598,365 | |
| | |
New York - 15.6% | | | | | | | | |
| | |
City of New York, Series B-1 | | | | | | | | |
5.250%, 10/01/47 | | | 2,000,000 | | | | 2,199,235 | |
| | |
Metropolitan Transportation Authority, Series C | | | | | | | | |
4.750%, 11/15/45 | | | 3,175,000 | | | | 2,968,898 | |
5.000%, 11/15/50 | | | 2,335,000 | | | | 2,243,298 | |
5.250%, 11/15/55 | | | 3,020,000 | | | | 3,019,797 | |
| | |
New York City Transitional Finance Authority Future Tax Secured Revenue, Series D-1 | | | | | | | | |
5.500%, 11/01/45 | | | 2,000,000 | | | | 2,250,411 | |
| | |
New York State Dormitory Authority | | | | | | | | |
5.000%, 05/01/52 | | | 3,000,000 | | | | 3,059,347 | |
| | |
New York State Dormitory Authority, Series A | | | | | | | | |
4.000%, 07/01/47 | | | 2,000,000 | | | | 1,736,163 | |
4.000%, 07/01/52 | | | 2,115,000 | | | | 1,791,547 | |
| | |
New York State Thruway Authority, Series B | | | | | | | | |
4.000%, 01/01/45 | | | 2,000,000 | | | | 1,858,731 | |
| | |
New York Transportation Development Corp. | | | | | | | | |
4.000%, 12/01/39 | | | 1,825,000 | | | | 1,714,401 | |
4.000%, 12/01/41 | | | 1,900,000 | | | | 1,740,849 | |
4.000%, 04/30/53 | | | 6,915,000 | | | | 5,615,382 | |
5.000%, 12/01/40 | | | 5,000,000 | | | | 5,071,748 | |
5.000%, 12/01/41 | | | 5,000,000 | | | | 5,045,825 | |
| |
Total New York | | | | 40,315,632 | |
| | |
Pennsylvania - 11.5% | | | | | | | | |
| | |
Allegheny County Airport Authority, Series A | | | | | | | | |
5.000%, 01/01/51 | | | 5,000,000 | | | | 5,050,008 | |
| | |
Geisinger Authority | | | | | | | | |
4.000%, 04/01/50 | | | 3,200,000 | | | | 2,869,903 | |
| | |
Montgomery County Higher Education and Health Authority, Series B | | | | | | | | |
5.000%, 05/01/52 | | | 4,750,000 | | | | 4,604,557 | |
| | |
Pennsylvania Economic Development Financing Authority | | | | | | | | |
5.000%, 12/31/57 | | | 1,250,000 | | | | 1,239,779 | |
5.250%, 06/30/53 | | | 6,000,000 | | | | 5,874,902 | |
| | |
Pennsylvania Turnpike Commission, Series A | | | | | | | | |
4.000%, 12/01/50 | | | 6,050,000 | | | | 5,401,398 | |
| | |
Philadelphia Authority for Industrial Development | | | | | | | | |
5.250%, 11/01/52 | | | 4,615,000 | | | | 4,829,516 | |
| |
Total Pennsylvania | | | | 29,870,063 | |
| | |
Rhode Island - 1.3% | | | | | | | | |
| | |
Tobacco Settlement Financing Corp. | | | | | | | | |
Series A | | | | | | | | |
5.000%, 06/01/40 | | | 3,285,000 | | | | 3,304,675 | |
| | | | | | | | |
| | |
| | | Principal Amount | | | Value | |
| | |
Texas - 10.3% | | | | | | | | |
| | |
Central Texas Regional Mobility Authority, Series B | | | | | | | | |
4.000%, 01/01/51 | | | $2,030,000 | | | | $1,790,598 | |
5.000%, 01/01/45 | | | 1,930,000 | | | | 1,990,915 | |
| | |
City of Houston Airport System Revenue, Series A | | | | | | | | |
4.000%, 07/01/48 | | | 1,500,000 | | | | 1,306,209 | |
| | |
Texas Private Activity Bond Surface Transportation Corp. | | | | | | | | |
5.000%, 06/30/58 | | | 9,320,000 | | | | 8,889,107 | |
| | |
Texas Private Activity Bond Surface Transportation Corp., Senior Lien-Blueridge Transport | | | | | | | | |
5.000%, 12/31/40 | | | 3,955,000 | | | | 3,960,894 | |
5.000%, 12/31/45 | | | 3,880,000 | | | | 3,828,155 | |
| | |
Texas Private Activity Bond Surface Transportation Corp., Series A | | | | | | | | |
4.000%, 12/31/39 | | | 5,500,000 | | | | 4,953,546 | |
| |
Total Texas | | | | 26,719,424 | |
| | |
Virginia - 5.7% | | | | | | | | |
| | |
Lynchburg Economic Development Authority | | | | | | | | |
4.000%, 01/01/55 | | | 1,500,000 | | | | 1,309,025 | |
| | |
Virginia Small Business Financing Authority | | | | | | | | |
4.000%, 01/01/39 | | | 3,000,000 | | | | 2,744,828 | |
4.000%, 01/01/40 | | | 3,000,000 | | | | 2,718,243 | |
5.000%, 12/31/47 | | | 2,555,000 | | | | 2,570,139 | |
| | |
Virginia Small Business Financing Authority, Transform 66 P3 Project | | | | | | | | |
5.000%, 12/31/49 | | | 2,500,000 | | | | 2,376,794 | |
5.000%, 12/31/52 | | | 3,170,000 | | | | 2,987,148 | |
| |
Total Virginia | | | | 14,706,177 | |
| | |
West Virginia - 1.6% | | | | | | | | |
| | |
West Virginia Hospital Finance Authority, Cabell Huntington Hospital Obligation | | | | | | | | |
5.000%, 01/01/43 | | | 4,000,000 | | | | 4,033,344 | |
| |
Total Municipal Bonds | | | | | |
(Cost $289,251,690) | | | | | | | 253,874,220 | |
| | |
Short-Term Investments - 0.4% | | | | | | | | |
| | |
Repurchase Agreements - 0.4% | | | | | | | | |
Fixed Income Clearing Corp., dated 12/30/22 due 01/03/23, 4.150% total to be received $926,427 (collateralized by a U.S. Treasury, 0.125%, 01/15/32, totaling $944,525) | | | 926,000 | | | | 926,000 | |
| |
Total Short-Term Investments | | | | | |
(Cost $926,000) | | | | 926,000 | |
| |
Total Investments - 98.4% | | | | | |
(Cost $290,177,690) | | | | 254,800,220 | |
| |
Other Assets, less Liabilities - 1.6% | | | | 4,193,826 | |
| | |
Net Assets - 100.0% | | | | | | | $258,994,046 | |
The accompanying notes are an integral part of these financial statements.
46
| | |
| | | AMG GW&K Municipal Enhanced Yield Fund Schedule of Portfolio Investments (continued) |
The following table summarizes the inputs used to value the Fund’s investments by the fair value hierarchy levels as of December 31, 2022:
| | | | | | | | | | | | |
| | | Level 1 | | | Level 2 | | Level 3 | | | Total |
| | | | |
Investments in Securities | | | | | | | | | | | | |
| | | | |
Municipal Bonds† | | | — | | | $253,874,220 | | | — | | | $253,874,220 |
| | | | |
Short-Term Investments | | | | | | | | | | | | |
| | | | |
Repurchase Agreements | | | — | | | 926,000 | | | — | | | 926,000 |
| | | | | | | | | | | | |
Total Investments in Securities | | | — | | | $254,800,220 | | | — | | | $254,800,220 |
| | | | | | | | | | | | |
| † | All municipal bonds held in the Fund are Level 2 securities. For a detailed breakout of municipal bonds by major classification, please refer to the Fund’s Schedule of Portfolio Investments. |
For the fiscal year ended December 31, 2022, there were no transfers in or out of Level 3.
The accompanying notes are an integral part of these financial statements.
47
| | |
| | | Statement of Assets and Liabilities December 31, 2022 |
| | | | | | | | | | | | | | | | | | | | | | | | | |
| | | AMG GW&K
ESG
Bond Fund | | AMG
GW&K Enhanced
Core Bond
ESG Fund | | AMG
GW&K High
Income Fund | | AMG
GW&K Municipal
Bond Fund | | AMG
GW&K Municipal
Enhanced
Yield Fund |
| | | | | |
Assets: | | | | | | | | | | | | | | | | | | | | | | | | | |
| | | | | |
Investments at value1 (including securities on loan valued at $25,458,950, $2,393,361, $1,415,713, $0, and $0, respectively) | | | | $497,119,651 | | | | | $41,118,359 | | | | | $18,347,996 | | | | | $1,083,213,523 | | | | | $254,800,220 | |
| | | | | |
Cash | | | | 651 | | | | | 331,228 | | | | | 890,771 | | | | | 548 | | | | | 599 | |
| | | | | |
Dividend and interest receivables | | | | 4,534,690 | | | | | 348,725 | | | | | 246,128 | | | | | 14,156,329 | | | | | 3,402,657 | |
| | | | | |
Securities lending income receivable | | | | 2,735 | | | | | 645 | | | | | 1,737 | | | | | — | | | | | — | |
| | | | | |
Receivable for Fund shares sold | | | | 24,758 | | | | | 4,267 | | | | | 1,404 | | | | | 2,553,483 | | | | | 2,793,369 | |
| | | | | |
Receivable from affiliate | | | | — | | | | | 13,761 | | | | | 9,005 | | | | | 67,793 | | | | | 20,258 | |
| | | | | |
Prepaid expenses and other assets | | | | 16,467 | | | | | 12,312 | | | | | 9,884 | | | | | 48,865 | | | | | 22,853 | |
| | | | | |
Total assets | | | | 501,698,952 | | | | | 41,829,297 | | | | | 19,506,925 | | | | | 1,100,040,541 | | | | | 261,039,956 | |
| | | | | |
Liabilities: | | | | | | | | | | | | | | | | | | | | | | | | | |
| | | | | |
Payable upon return of securities loaned | | | | 7,412,408 | | | | | 1,242,815 | | | | | 1,253,247 | | | | | — | | | | | — | |
| | | | | |
Payable for investments purchased | | | | — | | | | | — | | | | | 923,211 | | | | | — | | | | | 985,164 | |
| | | | | |
Payable for delayed delivery investments purchased | | | | — | | | | | — | | | | | — | | | | | 8,158,150 | | | | | — | |
| | | | | |
Payable for Fund shares repurchased | | | | 885,796 | | | | | 51,790 | | | | | 137 | | | | | 10,068,969 | | | | | 834,552 | |
| | | | | |
Accrued expenses: | | | | | | | | | | | | | | | | | | | | | | | | | |
| | | | | |
Investment advisory and management fees | | | | 109,998 | | | | | 10,581 | | | | | 3,768 | | | | | 195,849 | | | | | 101,123 | |
| | | | | |
Administrative fees | | | | 64,826 | | | | | 5,291 | | | | | 1,449 | | | | | 141,313 | | | | | 33,708 | |
| | | | | |
Distribution fees | | | | — | | | | | 2,293 | | | | | — | | | | | 2,700 | | | | | 632 | |
| | | | | |
Shareholder service fees | | | | 74,128 | | | | | 1,166 | | | | | 1,613 | | | | | 48,470 | | | | | 11,484 | |
| | | | | |
Other | | | | 145,150 | | | | | 68,488 | | | | | 54,951 | | | | | 162,578 | | | | | 79,247 | |
| | | | | |
Total liabilities | | | | 8,692,306 | | | | | 1,382,424 | | | | | 2,238,376 | | | | | 18,778,029 | | | | | 2,045,910 | |
| | | | | | | | | | | | | | | | | | | | | | | | | |
| | | | | |
Net Assets | | | | $493,006,646 | | | | | $40,446,873 | | | | | $17,268,549 | | | | | $1,081,262,512 | | | | | $258,994,046 | |
| | | | | |
1 Investments at cost | | | | $575,447,303 | | | | | $46,593,109 | | | | | $19,231,374 | | | | | $1,143,562,341 | | | | | $290,177,690 | |
The accompanying notes are an integral part of these financial statements.
48
| | |
| | | Statement of Assets and Liabilities (continued) |
| | | | | | | | | | | | | | | | | | | | |
| | | AMG GW&K
ESG
Bond Fund | | | AMG
GW&K Enhanced
Core Bond
ESG Fund | | AMG
GW&K High
Income Fund | | AMG
GW&K Municipal
Bond Fund | | AMG
GW&K Municipal
Enhanced
Yield Fund |
| | | | | |
Net Assets Represent: | | | | | | | | | | | | | | | | | | | | |
| | | | | |
Paid-in capital | | | $591,675,117 | | | | $51,134,647 | | | | $19,378,717 | | | | $1,151,923,012 | | | | $305,163,279 | |
| | | | | |
Total distributable loss | | | (98,668,471) | | | | (10,687,774) | | | | (2,110,168) | | | | (70,660,500) | | | | (46,169,233) | |
| | | | | |
Net Assets | | | $493,006,646 | | | | $40,446,873 | | | | $17,268,549 | | | | $1,081,262,512 | | | | $258,994,046 | |
| | | | | |
Class N: | | | | | | | | | | | | | | | | | | | | |
| | | | | |
Net Assets | | | $301,027,605 | | | | $10,680,376 | | | | $6,528,383 | | | | $12,972,392 | | | | $2,955,237 | |
| | | | | |
Shares outstanding | | | 14,256,971 | | | | 1,197,222 | | | | 324,636 | | | | 1,167,150 | | | | 345,097 | |
| | | | | |
Net asset value, offering and redemption price per share | | | $21.11 | | | | $8.92 | | | | $20.11 | | | | $11.11 | | | | $8.56 | |
| | | | | |
Class I: | | | | | | | | | | | | | | | | | | | | |
| | | | | |
Net Assets | | | $191,979,041 | | | | $19,889,744 | | | | $10,740,166 | | | | $1,068,290,120 | | | | $255,927,964 | |
| | | | | |
Shares outstanding | | | 9,091,124 | | | | 2,221,529 | | | | 534,326 | | | | 95,562,700 | | | | 30,828,135 | |
| | | | | |
Net asset value, offering and redemption price per share | | | $21.12 | | | | $8.95 | | | | $20.10 | | | | $11.18 | | | | $8.30 | |
| | | | | |
Class Z: | | | | | | | | | | | | | | | | | | | | |
| | | | | |
Net Assets | | | — | | | | $9,876,753 | | | | — | | | | — | | | | $110,845 | |
| | | | | |
Shares outstanding | | | — | | | | 1,103,437 | | | | — | | | | — | | | | 13,355 | |
| | | | | |
Net asset value, offering and redemption price per share | | | — | | | | $8.95 | | | | — | | | | — | | | | $8.30 | |
The accompanying notes are an integral part of these financial statements.
49
| | |
| | | Statement of Operations For the fiscal year ended December 31, 2022 |
| | | | | | | | | | | | | | | | | | | | |
| | | AMG GW&K
ESG
Bond Fund | | | AMG
GW&K Enhanced
Core Bond
ESG Fund | | AMG
GW&K High
Income Fund | | AMG
GW&K Municipal
Bond Fund | | AMG
GW&K Municipal
Enhanced
Yield Fund | |
| | | | | |
Investment Income: | | | | | | | | | | | | | | | | | | | | |
| | | | | |
Interest income | | | $15,673,594 | | | | $1,317,282 | | | | $732,593 | | | | $24,322,772 | | | | $9,942,590 | |
| | | | | |
Securities lending income | | | 91,026 | | | | 9,143 | | | | 21,484 | | | | — | | | | — | |
| | | | | |
Foreign withholding tax | | | (4,703 | ) | | | — | | | | — | | | | — | | | | — | |
| | | | | |
Total investment income | | | 15,759,917 | | | | 1,326,425 | | | | 754,077 | | | | 24,322,772 | | | | 9,942,590 | |
| | | | | |
Expenses: | | | | | | | | | | | | | | | | | | | | |
| | | | | |
Investment advisory and management fees | | | 1,363,391 | | | | 146,227 | | | | 72,096 | | | | 2,430,930 | | | | 1,325,322 | |
| | | | | |
Administrative fees | | | 889,168 | | | | 73,114 | | | | 27,729 | | | | 1,757,573 | | | | 441,774 | |
| | | | | |
Distribution fees - Class N | | | — | | | | 29,255 | | | | — | | | | 35,742 | | | | 10,133 | |
| | | | | |
Shareholder servicing fees - Class N | | | 865,479 | | | | — | | | | 17,627 | | | | 18,880 | | | | 6,080 | |
| | | | | |
Shareholder servicing fees - Class I | | | 123,293 | | | | 20,774 | | | | 5,718 | | | | 578,709 | | | | 145,173 | |
| | | | | |
Professional fees | | | 105,299 | | | | 61,295 | | | | 44,119 | | | | 97,306 | | | | 52,581 | |
| | | | | |
Registration fees | | | 60,338 | | | | 39,079 | | | | 27,739 | | | | 116,005 | | | | 46,918 | |
| | | | | |
Reports to shareholders | | | 58,040 | | | | 9,094 | | | | 3,334 | | | | 49,662 | | | | 12,357 | |
| | | | | |
Custodian fees | | | 50,336 | | | | 23,888 | | | | 17,097 | | | | 97,442 | | | | 40,199 | |
| | | | | |
Trustee fees and expenses | | | 41,125 | | | | 3,413 | | | | 1,341 | | | | 84,573 | | | | 20,683 | |
| | | | | |
Transfer agent fees | | | 29,706 | | | | 3,321 | | | | 1,253 | | | | 35,800 | | | | 9,340 | |
| | | | | |
Interest expense | | | — | | | | 1,340 | | | | 3,009 | | | | 352 | | | | 164 | |
| | | | | |
Miscellaneous | | | 24,388 | | | | 4,740 | | | | 2,410 | | | | 40,727 | | | | 13,587 | |
| | | | | |
Total expenses before offsets | | | 3,610,563 | | | | 415,540 | | | | 223,472 | | | | 5,343,701 | | | | 2,124,311 | |
| | | | | |
Expense reimbursements | | | (72,842 | ) | | | (130,195 | ) | | | (88,045 | ) | | | (726,185 | ) | | | (225,094 | ) |
| | | | | |
Net expenses | | | 3,537,721 | | | | 285,345 | | | | 135,427 | | | | 4,617,516 | | | | 1,899,217 | |
| | | | | |
| | | | | | | | | | | | | | | | | | | | |
| | | | | |
Net investment income | | | 12,222,196 | | | | 1,041,080 | | | | 618,650 | | | | 19,705,256 | | | | 8,043,373 | |
| | | | | |
Net Realized and Unrealized Loss: | | | | | | | | | | | | | | | | | | | | |
| | | | | |
Net realized loss on investments | | | (19,299,747 | ) | | | (2,654,300 | ) | | | (1,149,384 | ) | | | (10,312,359 | ) | | | (10,807,395 | ) |
| | | | | |
Net change in unrealized appreciation/depreciation on investments | | | (84,052,548 | ) | | | (5,951,857 | ) | | | (961,928 | ) | | | (113,439,737 | ) | | | (60,592,633 | ) |
| | | | | |
Net realized and unrealized loss | | | (103,352,295 | ) | | | (8,606,157 | ) | | | (2,111,312 | ) | | | (123,752,096 | ) | | | (71,400,028 | ) |
| | | | | |
| | | | | | | | | | | | | | | | | | | | |
| | | | | |
Net decrease in net assets resulting from operations | | | $(91,130,099 | ) | | | $(7,565,077 | ) | | | $(1,492,662 | ) | | | $(104,046,840 | ) | | | $(63,356,655 | ) |
The accompanying notes are an integral part of these financial statements.
50
| | |
| | | Statements of Changes in Net Assets For the fiscal years ended December 31, |
| | | | | | | | | | | | | | | | | | | | | | | | |
| | | AMG GW&K
ESG Bond Fund | | | AMG
GW&K Enhanced
Core Bond ESG Fund | | | AMG
GW&K High
Income Fund | |
| | | 2022 | | | 2021 | | | 2022 | | | 2021 | | | 2022 | | | 2021 | |
| | | | | | |
Increase (Decrease) in Net Assets Resulting From Operations: | | | | | | | | | | | | | | | | | | | | | | | | |
| | | | | | |
Net investment income | | | $12,222,196 | | | | $16,869,717 | | | | $1,041,080 | | | | $812,613 | | | | $618,650 | | | | $437,039 | |
| | | | | | |
Net realized gain (loss) on investments | | | (19,299,747 | ) | | | 81,364,988 | | | | (2,654,300 | ) | | | 874,010 | | | | (1,149,384 | ) | | | 151,347 | |
| | | | | | |
Net change in unrealized appreciation/depreciation on investments | | | (84,052,548 | ) | | | (112,045,135 | ) | | | (5,951,857 | ) | | | (2,321,289 | ) | | | (961,928 | ) | | | 89,236 | |
| | | | | | |
Net increase (decrease) in net assets resulting from operations | | | (91,130,099 | ) | | | (13,810,430 | ) | | | (7,565,077 | ) | | | (634,666 | ) | | | (1,492,662 | ) | | | 677,622 | |
| | | | | | |
Distributions to Shareholders: | | | | | | | | | | | | | | | | | | | | | | | | |
| | | | | | |
From net investment income and/or realized gain on investments: | | | | | | | | | | | | | | | | | | | | | | | | |
| | | | | | |
Class N | | | (7,736,535 | ) | | | (53,132,625 | ) | | | (235,849 | ) | | | (211,642 | ) | | | (277,251 | ) | | | (232,178 | ) |
| | | | | | |
Class I | | | (5,885,301 | ) | | | (51,380,355 | ) | | | (537,618 | ) | | | (426,487 | ) | | | (410,014 | ) | | | (312,124 | ) |
| | | | | | |
Class Z | | | — | | | | — | | | | (268,295 | ) | | | (186,240 | ) | | | — | | | | — | |
| | | | | | |
From paid-in capital: | | | | | | | | | | | | | | | | | | | | | | | | |
| | | | | | |
Class N | | | — | | | | — | | | | — | | | | (12,304 | ) | | | — | | | | — | |
| | | | | | |
Class I | | | — | | | | — | | | | — | | | | (24,795 | ) | | | — | | | | — | |
| | | | | | |
Class Z | | | — | | | | — | | | | — | | | | (10,828 | ) | | | — | | | | — | |
| | | | | | |
Total distributions to shareholders | | | (13,621,836 | ) | | | (104,512,980 | ) | | | (1,041,762 | ) | | | (872,296 | ) | | | (687,265 | ) | | | (544,302 | ) |
| | | | | | |
Capital Share Transactions:1 | | | | | | | | | | | | | | | | | | | | | | | | |
| | | | | | |
Net increase (decrease) from capital share transactions | | | (157,179,741 | ) | | | (228,559,947 | ) | | | (11,796,222 | ) | | | 7,211,314 | | | | (1,875,236 | ) | | | 10,888,534 | |
| | | | | | |
| | | | | | | | | | | | | | | | | | | | | | | | |
| | | | | | |
Total increase (decrease) in net assets | | | (261,931,676 | ) | | | (346,883,357 | ) | | | (20,403,061 | ) | | | 5,704,352 | | | | (4,055,163 | ) | | | 11,021,854 | |
| | | | | | |
Net Assets: | | | | | | | | | | | | | | | | | | | | | | | | |
| | | | | | |
Beginning of year | | | 754,938,322 | | | | 1,101,821,679 | | | | 60,849,934 | | | | 55,145,582 | | | | 21,323,712 | | | | 10,301,858 | |
| | | | | | |
End of year | | | $493,006,646 | | | | $754,938,322 | | | | $40,446,873 | | | | $60,849,934 | | | | $17,268,549 | | | | $21,323,712 | |
1 See Note 1(g) of the Notes to Financial Statements.
The accompanying notes are an integral part of these financial statements.
51
| | |
| | | Statements of Changes in Net Assets (continued) For the fiscal years ended December 31, |
| | | | | | | | | | | | | | | | |
| | | AMG
GW&K Municipal
Bond Fund | | | AMG
GW&K Municipal
Enhanced Yield Fund | |
| | | 2022 | | | 2021 | | | 2022 | | | 2021 | |
| | | | |
Increase (Decrease) in Net Assets Resulting From Operations: | | | | | | | | | | | | | | | | |
| | | | |
Net investment income | | | $19,705,256 | | | | $17,736,073 | | | | $8,043,373 | | | | $8,074,327 | |
| | | | |
Net realized gain (loss) on investments | | | (10,312,359 | ) | | | 11,510,796 | | | | (10,807,395 | ) | | | 5,033,099 | |
| | | | |
Net change in unrealized appreciation/depreciation on investments | | | (113,439,737 | ) | | | (24,090,355 | ) | | | (60,592,633 | ) | | | 727,146 | |
| | | | |
Net increase (decrease) in net assets resulting from operations | | | (104,046,840 | ) | | | 5,156,514 | | | | (63,356,655 | ) | | | 13,834,572 | |
| | | | |
Distributions to Shareholders: | | | | | | | | | | | | | | | | |
| | | | |
Class N | | | (212,610 | ) | | | (320,461 | ) | | | (79,222 | ) | | | (239,124 | ) |
| | | | |
Class I | | | (21,345,146 | ) | | | (27,948,470 | ) | | | (8,871,256 | ) | | | (12,853,713 | ) |
| | | | |
Class Z | | | — | | | | — | | | | (3,685 | ) | | | (4,817 | ) |
| | | | |
Total distributions to shareholders | | | (21,557,756 | ) | | | (28,268,931 | ) | | | (8,954,163 | ) | | | (13,097,654 | ) |
| | | | |
Capital Share Transactions:1 | | | | | | | | | | | | | | | | |
| | | | |
Net increase (decrease) from capital share transactions | | | (142,203,031 | ) | | | 66,362,378 | | | | (53,225,598 | ) | | | 55,209,790 | |
| | | | |
| | | | | | | | | | | | | | | | |
| | | | |
Total increase (decrease) in net assets | | | (267,807,627 | ) | | | 43,249,961 | | | | (125,536,416 | ) | | | 55,946,708 | |
| | | | |
Net Assets: | | | | | | | | | | | | | | | | |
| | | | |
Beginning of year | | | 1,349,070,139 | | | | 1,305,820,178 | | | | 384,530,462 | | | | 328,583,754 | |
| | | | |
End of year | | | $1,081,262,512 | | | | $1,349,070,139 | | | | $258,994,046 | | | | $384,530,462 | |
1 See Note 1(g) of the Notes to Financial Statements.
The accompanying notes are an integral part of these financial statements.
52
| | |
| | | AMG GW&K ESG Bond Fund Financial Highlights For a share outstanding throughout each fiscal year |
| | | | | | | | | | | | | | | | | | | | |
| | | For the fiscal years ended December 31, |
| | | | | |
| Class N | | 2022 | | 2021 | | 2020 | | 2019 | | 2018 |
| | | | | |
Net Asset Value, Beginning of Year | | | $24.88 | | | | $28.12 | | | | $27.14 | | | | $25.49 | | | | $26.97 | |
| | | | | |
Income (loss) from Investment Operations: | | | | | | | | | | | | | | | | | | | | |
| | | | | |
Net investment income1,2 | | | 0.44 | | | | 0.44 | | | | 0.90 | | | | 0.94 | | | | 0.84 | |
| | | | | |
Net realized and unrealized gain (loss) on investments | | | (3.70 | ) | | | (0.83 | ) | | | 1.03 | | | | 1.85 | | | | (1.33 | ) |
| | | | | |
Total income (loss) from investment operations | | | (3.26 | ) | | | (0.39 | ) | | | 1.93 | | | | 2.79 | | | | (0.49 | ) |
| | | | | |
Less Distributions to Shareholders from: | | | | | | | | | | | | | | | | | | | | |
| | | | | |
Net investment income | | | (0.47 | ) | | | (0.47 | ) | | | (0.88 | ) | | | (0.98 | ) | | | (0.80 | ) |
| | | | | |
Net realized gain on investments | | | (0.04 | ) | | | (2.38 | ) | | | (0.07 | ) | | | (0.16 | ) | | | (0.19 | ) |
| | | | | |
Total distributions to shareholders | | | (0.51 | ) | | | (2.85 | ) | | | (0.95 | ) | | | (1.14 | ) | | | (0.99 | ) |
| | | | | |
Net Asset Value, End of Year | | | $21.11 | | | | $24.88 | | | | $28.12 | | | | $27.14 | | | | $25.49 | |
| | | | | |
Total Return2,3 | | | (13.17 | )% | | | (1.29 | )% | | | 7.34 | % | | | 11.10 | % | | | (1.82 | )% |
| | | | | |
Ratio of net expenses to average net assets | | | 0.68 | % | | | 0.69 | %4 | | | 0.71 | % | | | 0.72 | %5 | | | 0.98 | %4 |
| | | | | |
Ratio of gross expenses to average net assets6 | | | 0.69 | % | | | 0.69 | %4 | | | 0.72 | % | | | 0.73 | %5 | | | 0.98 | %4 |
| | | | | |
Ratio of net investment income to average net assets2 | | | 1.98 | % | | | 1.71 | % | | | 3.31 | % | | | 3.53 | % | | | 3.19 | % |
| | | | | |
Portfolio turnover | | | 23 | % | | | 186 | % | | | 25 | % | | | 20 | % | | | 9 | % |
| | | | | |
Net assets end of year (000’s) omitted | | | $301,028 | | | | $427,818 | | | | $555,124 | | | | $618,381 | | | | $715,468 | |
| | |
53
| | |
| | | AMG GW&K ESG Bond Fund Financial Highlights For a share outstanding throughout each fiscal year |
| | | | | | | | | | | | | | | | | | | | |
| | | For the fiscal years ended December 31, |
| | | | | |
| Class I | | 2022 | | 2021 | | 2020 | | 2019 | | 2018 |
| | | | | |
Net Asset Value, Beginning of Year | | | $24.89 | | | | $28.13 | | | | $27.14 | | | | $25.49 | | | | $26.97 | |
| | | | | |
Income (loss) from Investment Operations: | | | | | | | | | | | | | | | | | | | | |
| | | | | |
Net investment income1,2 | | | 0.49 | | | | 0.50 | | | | 0.95 | | | | 0.99 | | | | 0.86 | |
| | | | | |
Net realized and unrealized gain (loss) on investments | | | (3.71 | ) | | | (0.83 | ) | | | 1.05 | | | | 1.85 | | | | (1.32 | ) |
| | | | | |
Total income (loss) from investment operations | | | (3.22 | ) | | | (0.33 | ) | | | 2.00 | | | | 2.84 | | | | (0.46 | ) |
| | | | | |
Less Distributions to Shareholders from: | | | | | | | | | | | | | | | | | | | | |
| | | | | |
Net investment income | | | (0.51 | ) | | | (0.53 | ) | | | (0.94 | ) | | | (1.03 | ) | | | (0.83 | ) |
| | | | | |
Net realized gain on investments | | | (0.04 | ) | | | (2.38 | ) | | | (0.07 | ) | | | (0.16 | ) | | | (0.19 | ) |
| | | | | |
Total distributions to shareholders | | | (0.55 | ) | | | (2.91 | ) | | | (1.01 | ) | | | (1.19 | ) | | | (1.02 | ) |
| | | | | |
Net Asset Value, End of Year | | | $21.12 | | | | $24.89 | | | | $28.13 | | | | $27.14 | | | | $25.49 | |
| | | | | |
Total Return2,3 | | | (12.99 | )% | | | (1.05 | )% | | | 7.57 | % | | | 11.32 | % | | | (1.72 | )% |
| | | | | |
Ratio of net expenses to average net assets | | | 0.48 | % | | | 0.49 | %4 | | | 0.50 | % | | | 0.52 | %5 | | | 0.88 | %4 |
| | | | | |
Ratio of gross expenses to average net assets6 | | | 0.49 | % | | | 0.49 | %4 | | | 0.51 | % | | | 0.53 | %5 | | | 0.88 | %4 |
| | | | | |
Ratio of net investment income to average net assets2 | | | 2.18 | % | | | 1.91 | % | | | 3.52 | % | | | 3.73 | % | | | 3.29 | % |
| | | | | |
Portfolio turnover | | | 23 | % | | | 186 | % | | | 25 | % | | | 20 | % | | | 9 | % |
| | | | | |
Net assets end of year (000’s) omitted | | | $191,979 | | | | $327,121 | | | | $546,698 | | | | $605,353 | | | | $1,094,820 | |
| | |
| 1 | Per share numbers have been calculated using average shares. |
| 2 | Total returns and net investment income would have been lower had certain expenses not been offset. |
| 3 | The total return is calculated using the published Net Asset Value as of fiscal year end. |
| 4 | Ratio includes recapture of reimbursed fees from prior years amounting to less than 0.01% and 0.04% for the fiscal year ended December 31, 2021 and December 31, 2018, respectively. |
| 5 | Includes 0.01% of extraordinary expense related to legal expense in support of an investment held in the portfolio. |
| 6 | Excludes the impact of expense reimbursement or fee waivers and expense reductions such as brokerage credits, but includes expense repayments and non-reimbursable expenses, if any, such as interest, taxes, and extraordinary expenses. (See Note 1(c) and 2 in the Notes to Financial Statements.) |
54
| | |
| | | AMG GW&K Enhanced Core Bond ESG Fund Financial Highlights For a share outstanding throughout each fiscal year |
| | | | | | | | | | | | | | | | | | | | |
| | | For the fiscal years ended December 31, |
| | | | | |
| Class N | | 2022 | | 2021 | | 2020 | | 2019 | | 2018 |
| | | | | |
Net Asset Value, Beginning of Year | | | $10.61 | | | | $10.90 | | | | $10.15 | | | | $9.43 | | | | $9.81 | |
| | | | | |
Income (loss) from Investment Operations: | | | | | | | | | | | | | | | | | | | | |
| | | | | |
Net investment income1,2 | | | 0.19 | | | | 0.14 | | | | 0.20 | | | | 0.24 | | | | 0.23 | |
| | | | | |
Net realized and unrealized gain (loss) on investments | | | (1.69 | ) | | | (0.28 | ) | | | 0.75 | | | | 0.73 | | | | (0.38 | ) |
| | | | | |
Total income (loss) from investment operations | | | (1.50 | ) | | | (0.14 | ) | | | 0.95 | | | | 0.97 | | | | (0.15 | ) |
| | | | | |
Less Distributions to Shareholders from: | | | | | | | | | | | | | | | | | | | | |
| | | | | |
Net investment income | | | (0.19 | ) | | | (0.14 | ) | | | (0.20 | ) | | | (0.25 | ) | | | (0.23 | ) |
| | | | | |
Paid in capital | | | — | | | | (0.01 | ) | | | — | | | | — | | | | — | |
| | | | | |
Total distributions to shareholders | | | (0.19 | ) | | | (0.15 | ) | | | (0.20 | ) | | | (0.25 | ) | | | (0.23 | ) |
| | | | | |
Net Asset Value, End of Year | | | $8.92 | | | | $10.61 | | | | $10.90 | | | | $10.15 | | | | $9.43 | |
| | | | | |
Total Return2,3 | | | (14.17 | )% | | | (1.26 | )% | | | 9.41 | % | | | 10.35 | % | | | (1.48 | )% |
| | | | | |
Ratio of net expenses to average net assets | | | 0.73 | % | | | 0.73 | % | | | 0.73 | % | | | 0.73 | % | | | 0.73 | % |
| | | | | |
Ratio of gross expenses to average net assets4 | | | 1.00 | % | | | 0.93 | % | | | 1.06 | % | | | 1.16 | % | | | 0.99 | % |
| | | | | |
Ratio of net investment income to average net assets2 | | | 1.99 | % | | | 1.32 | % | | | 1.86 | % | | | 2.43 | % | | | 2.45 | % |
| | | | | |
Portfolio turnover | | | 54 | % | | | 86 | % | | | 101 | % | | | 71 | % | | | 26 | % |
| | | | | |
Net assets end of year (000’s) omitted | | | $10,680 | | | | $13,736 | | | | $15,794 | | | | $14,779 | | | | $12,884 | |
| | |
55
| | |
| | | AMG GW&K Enhanced Core Bond ESG Fund Financial Highlights For a share outstanding throughout each fiscal year |
| | | | | | | | | | | | | | | | | | | | |
| | | For the fiscal years ended December 31, |
| | | | | |
| Class I | | 2022 | | 2021 | | 2020 | | 2019 | | 2018 |
| | | | | |
Net Asset Value, Beginning of Year | | | $10.65 | | | | $10.94 | | | | $10.19 | | | | $9.47 | | | | $9.85 | |
| | | | | |
Income (loss) from Investment Operations: | | | | | | | | | | | | | | | | | | | | |
| | | | | |
Net investment income1,2 | | | 0.21 | | | | 0.16 | | | | 0.22 | | | | 0.26 | | | | 0.25 | |
| | | | | |
Net realized and unrealized gain (loss) on investments | | | (1.70 | ) | | | (0.28 | ) | | | 0.75 | | | | 0.73 | | | | (0.38 | ) |
| | | | | |
Total income (loss) from investment operations | | | (1.49 | ) | | | (0.12 | ) | | | 0.97 | | | | 0.99 | | | | (0.13 | ) |
| | | | | |
Less Distributions to Shareholders from: | | | | | | | | | | | | | | | | | | | | |
| | | | | |
Net investment income | | | (0.21 | ) | | | (0.16 | ) | | | (0.22 | ) | | | (0.27 | ) | | | (0.25 | ) |
| | | | | |
Paid in capital | | | — | | | | (0.01 | ) | | | — | | | | — | | | | — | |
| | | | | |
Total distributions to shareholders | | | (0.21 | ) | | | (0.17 | ) | | | (0.22 | ) | | | (0.27 | ) | | | (0.25 | ) |
| | | | | |
Net Asset Value, End of Year | | | $8.95 | | | | $10.65 | | | | $10.94 | | | | $10.19 | | | | $9.47 | |
| | | | | |
Total Return2,3 | | | (14.07 | )% | | | (1.07 | )% | | | 9.57 | % | | | 10.51 | % | | | (1.27 | )% |
| | | | | |
Ratio of net expenses to average net assets | | | 0.56 | % | | | 0.56 | % | | | 0.55 | % | | | 0.55 | % | | | 0.54 | % |
| | | | | |
Ratio of gross expenses to average net assets4 | | | 0.83 | % | | | 0.76 | % | | | 0.88 | % | | | 0.98 | % | | | 0.80 | % |
| | | | | |
Ratio of net investment income to average net assets2 | | | 2.16 | % | | | 1.49 | % | | | 2.04 | % | | | 2.62 | % | | | 2.64 | % |
| | | | | |
Portfolio turnover | | | 54 | % | | | 86 | % | | | 101 | % | | | 71 | % | | | 26 | % |
| | | | | |
Net assets end of year (000’s) omitted | | | $19,890 | | | | $33,402 | | | | $27,800 | | | | $8,502 | | | | $5,967 | |
| | |
56
| | |
| | | AMG GW&K Enhanced Core Bond ESG Fund Financial Highlights For a share outstanding throughout each fiscal year |
| | | | | | | | | | | | | | | | | | | | |
| | | For the fiscal years ended December 31, |
| | | | | |
| Class Z | | 2022 | | 2021 | | 2020 | | 2019 | | 2018 |
| | | | | |
Net Asset Value, Beginning of Year | | | $10.65 | | | | $10.93 | | | | $10.18 | | �� | | $9.46 | | | | $9.84 | |
| | | | | |
Income (loss) from Investment Operations: | | | | | | | | | | | | | | | | | | | | |
| | | | | |
Net investment income1,2 | | | 0.21 | | | | 0.17 | | | | 0.22 | | | | 0.27 | | | | 0.26 | |
| | | | | |
Net realized and unrealized gain (loss) on investments | | | (1.69 | ) | | | (0.27 | ) | | | 0.75 | | | | 0.72 | | | | (0.38 | ) |
| | | | | |
Total income (loss) from investment operations | | | (1.48 | ) | | | (0.10 | ) | | | 0.97 | | | | 0.99 | | | | (0.12 | ) |
| | | | | |
Less Distributions to Shareholders from: | | | | | | | | | | | | | | | | | | | | |
| | | | | |
Net investment income | | | (0.22 | ) | | | (0.17 | ) | | | (0.22 | ) | | | (0.27 | ) | | | (0.26 | ) |
| | | | | |
Paid in capital | | | — | | | | (0.01 | ) | | | — | | | | — | | | | — | |
| | | | | |
Total distributions to shareholders | | | (0.22 | ) | | | (0.18 | ) | | | (0.22 | ) | | | (0.27 | ) | | | (0.26 | ) |
| | | | | |
Net Asset Value, End of Year | | | $8.95 | | | | $10.65 | | | | $10.93 | | | | $10.18 | | | | $9.46 | |
| | | | | |
Total Return2,3 | | | (14.00 | )% | | | (0.92 | )% | | | 9.65 | % | | | 10.59 | % | | | (1.23 | )% |
| | | | | |
Ratio of net expenses to average net assets | | | 0.48 | % | | | 0.48 | % | | | 0.48 | % | | | 0.48 | % | | | 0.48 | % |
| | | | | |
Ratio of gross expenses to average net assets4 | | | 0.75 | % | | | 0.68 | % | | | 0.81 | % | | | 0.91 | % | | | 0.74 | % |
| | | | | |
Ratio of net investment income to average net assets2 | | | 2.24 | % | | | 1.57 | % | | | 2.11 | % | | | 2.72 | % | | | 2.70 | % |
| | | | | |
Portfolio turnover | | | 54 | % | | | 86 | % | | | 101 | % | | | 71 | % | | | 26 | % |
| | | | | |
Net assets end of year (000’s) omitted | | | $9,877 | | | | $13,712 | | | | $11,552 | | | | $10,080 | | | | $15,254 | |
| | |
| 1 | Per share numbers have been calculated using average shares. |
| 2 | Total returns and net investment income would have been lower had certain expenses not been offset. |
| 3 | The total return is calculated using the published Net Asset Value as of fiscal year end. |
| 4 | Excludes the impact of expense reimbursement or fee waivers and expense reductions such as brokerage credits, but includes expense repayments and non-reimbursable expenses, if any, such as interest, taxes, and extraordinary expenses. (See Note 1(c) and 2 in the Notes to Financial Statements.) |
57
| | |
| | | AMG GW&K High Income Fund Financial Highlights For a share outstanding throughout each fiscal year |
| | | | | | | | | | | | | | | | | | | | |
| | | For the fiscal years ended December 31, |
| | | | | |
| Class N | | 2022 | | 2021 | | 2020 | | 2019 | | 2018 |
| | | | | |
Net Asset Value, Beginning of Year | | | $22.46 | | | | $22.23 | | | | $21.52 | | | | $20.04 | | | | $21.06 | |
| | | | | |
Income (loss) from Investment Operations: | | | | | | | | | | | | | | | | | | | | |
| | | | | |
Net investment income1,2 | | | 0.67 | | | | 0.53 | | | | 0.51 | | | | 0.57 | | | | 0.69 | |
| | | | | |
Net realized and unrealized gain (loss) on investments | | | (2.20 | ) | | | 0.28 | | | | 2.09 | | | | 0.98 | | | | (1.57 | ) |
| | | | | |
Total income (loss) from investment operations | | | (1.53 | ) | | | 0.81 | | | | 2.60 | | | | 1.55 | | | | (0.88 | ) |
| | | | | |
Less Distributions to Shareholders from: | | | | | | | | | | | | | | | | | | | | |
| | | | | |
Net investment income | | | (0.77 | ) | | | (0.53 | ) | | | (0.48 | ) | | | (0.07 | ) | | | (0.14 | ) |
| | | | | |
Net realized gain on investments | | | (0.05 | ) | | | (0.05 | ) | | | (1.41 | ) | | | — | | | | — | |
| | | | | |
Total distributions to shareholders | | | (0.82 | ) | | | (0.58 | ) | | | (1.89 | ) | | | (0.07 | ) | | | (0.14 | ) |
| | | | | |
Net Asset Value, End of Year | | | $20.11 | | | | $22.46 | | | | $22.23 | | | | $21.52 | | | | $20.04 | |
| | | | | |
Total Return2,3 | | | (6.80 | )% | | | 3.67 | % | | | 12.16 | % | | | 7.67 | % | | | (4.18 | )% |
| | | | | |
Ratio of net expenses to average net assets | | | 0.86 | %4 | | | 0.84 | % | | | 0.89 | % | | | 0.89 | % | | | 0.89 | % |
| | | | | |
Ratio of gross expenses to average net assets5 | | | 1.32 | % | | | 1.37 | % | | | 1.70 | % | | | 1.87 | % | | | 1.52 | % |
| | | | | |
Ratio of net investment income to average net assets2 | | | 3.22 | % | | | 2.36 | % | | | 2.28 | % | | | 2.70 | % | | | 3.34 | % |
| | | | | |
Portfolio turnover | | | 74 | % | | | 97 | % | | | 157 | % | | | 52 | % | | | 60 | % |
| | | | | |
Net assets end of year (000’s) omitted | | | $6,528 | | | | $8,157 | | | | $10,302 | | | | $9,638 | | | | $10,365 | |
| | |
58
| | |
| | | AMG GW&K High Income Fund Financial Highlights For a share outstanding throughout each fiscal period |
| | | | |
| | | For the fiscal year ended December 31, | | For the fiscal
period ended
December 31, |
| | |
| Class I | | 2022 | | 20216 |
| | |
Net Asset Value, Beginning of Period | | $22.45 | | $22.27 |
| | |
Income (loss) from Investment Operations: | | | | |
| | |
Net investment income1,2 | | 0.71 | | 0.46 |
| | |
Net realized and unrealized gain (loss) on investments | | (2.20) | | 0.35 |
| | |
Total income (loss) from investment operations | | (1.49) | | 0.81 |
| | |
Less Distributions to Shareholders from: | | | | |
| | |
Net investment income | | (0.81) | | (0.58) |
| | |
Net realized gain on investments | | (0.05) | | (0.05) |
| | |
Total distributions to shareholders | | (0.86) | | (0.63) |
| | |
Net Asset Value, End of Period | | $20.10 | | $22.45 |
| | |
Total Return2,3 | | (6.63)% | | 3.68%7 |
| | |
Ratio of net expenses to average net assets | | 0.66%4 | | 0.64%8 |
| | |
Ratio of gross expenses to average net assets5 | | 1.12% | | 1.17%8 |
| | |
Ratio of net investment income to average net assets2 | | 3.42% | | 2.56%8 |
| | |
Portfolio turnover | | 74% | | 97% |
| | |
Net assets end of period (000’s) omitted | | $10,740 | | $13,166 |
| |
| 1 | Per share numbers have been calculated using average shares. |
| 2 | Total returns and net investment income would have been lower had certain expenses not been offset. |
| 3 | The total return is calculated using the published Net Asset Value as of fiscal year end. |
| 4 | Includes interest expense totaling 0.02% related to participation in the interfund lending program. |
| 5 | Excludes the impact of expense reimbursement or fee waivers and expense reductions such as brokerage credits, but includes expense repayments and non-reimbursable expenses, if any, such as interest, taxes, and extraordinary expenses. (See Note 1(c) and 2 in the Notes to Financial Statements.) |
| 6 | Commencement of operations was on March 15, 2021. |
59
| | |
| | | AMG GW&K Municipal Bond Fund Financial Highlights For a share outstanding throughout each fiscal year |
| | | | | | | | | | | | | | | | | | | | |
| | | For the fiscal years ended December 31, |
| | | | | |
| Class N | | 2022 | | 2021 | | 2020 | | 2019 | | 2018 |
| | | | | |
Net Asset Value, Beginning of Year | | | $12.24 | | | | $12.45 | | | | $12.12 | | | | $11.48 | | | | $11.60 | |
| | | | | |
Income (loss) from Investment Operations: | | | | | | | | | | | | | | | | | | | | |
| | | | | |
Net investment income1,2 | | | 0.15 | | | | 0.13 | | | | 0.15 | | | | 0.19 | | | | 0.17 | |
| | | | | |
Net realized and unrealized gain (loss) on investments | | | (1.10 | ) | | | (0.11 | ) | | | 0.33 | | | | 0.64 | | | | (0.11 | ) |
| | | | | |
Total income (loss) from investment operations | | | (0.95 | ) | | | 0.02 | | | | 0.48 | | | | 0.83 | | | | 0.06 | |
| | | | | |
Less Distributions to Shareholders from: | | | | | | | | | | | | | | | | | | | | |
| | | | | |
Net investment income | | | (0.16 | ) | | | (0.13 | ) | | | (0.15 | ) | | | (0.19 | ) | | | (0.18 | ) |
| | | | | |
Net realized gain on investments | | | (0.02 | ) | | | (0.10 | ) | | | — | | | | — | | | | (0.00 | )3 |
| | | | | |
Total distributions to shareholders | | | (0.18 | ) | | | (0.23 | ) | | | (0.15 | ) | | | (0.19 | ) | | | (0.18 | ) |
| | | | | |
Net Asset Value, End of Year | | | $11.11 | | | | $12.24 | | | | $12.45 | | | | $12.12 | | | | $11.48 | |
| | | | | |
Total Return2,4 | | | (7.80 | )% | | | 0.10 | % | | | 4.31 | % | | | 7.29 | % | | | 0.54 | % |
| | | | | |
Ratio of net expenses to average net assets | | | 0.72 | % | | | 0.71 | % | | | 0.71 | % | | | 0.71 | % | | | 0.71 | % |
| | | | | |
Ratio of gross expenses to average net assets5 | | | 0.78 | % | | | 0.76 | % | | | 0.77 | % | | | 0.78 | % | | | 0.77 | % |
| | | | | |
Ratio of net investment income to average net assets2 | | | 1.35 | % | | | 1.01 | % | | | 1.25 | % | | | 1.59 | % | | | 1.53 | % |
| | | | | |
Portfolio turnover | | | 20 | % | | | 24 | % | | | 17 | % | | | 18 | % | | | 35 | % |
| | | | | |
Net assets end of year (000’s) omitted | | | $12,972 | | | | $17,112 | | | | $18,153 | | | | $18,711 | | | | $17,445 | |
| | |
60
| | |
| | | AMG GW&K Municipal Bond Fund Financial Highlights For a share outstanding throughout each fiscal year |
| | | | | | | | | | | | | | | | | | | | |
| | | For the fiscal years ended December 31, |
| | | | | |
| Class I | | 2022 | | 2021 | | 2020 | | 2019 | | 2018 |
| | | | | |
Net Asset Value, Beginning of Year | | | $12.31 | | | | $12.52 | | | | $12.18 | | | | $11.54 | | | | $11.66 | |
| | | | | |
Income (loss) from Investment Operations: | | | | | | | | | | | | | | | | | | | | |
| | | | | |
Net investment income1,2 | | | 0.19 | | | | 0.17 | | | | 0.19 | | | | 0.23 | | | | 0.21 | |
| | | | | |
Net realized and unrealized gain (loss) on investments | | | (1.11 | ) | | | (0.11 | ) | | | 0.34 | | | | 0.64 | | | | (0.12 | ) |
| | | | | |
Total income (loss) from investment operations | | | (0.92 | ) | | | 0.06 | | | | 0.53 | | | | 0.87 | | | | 0.09 | |
| | | | | |
Less Distributions to Shareholders from: | | | | | | | | | | | | | | | | | | | | |
| | | | | |
Net investment income | | | (0.19 | ) | | | (0.17 | ) | | | (0.19 | ) | | | (0.23 | ) | | | (0.21 | ) |
| | | | | |
Net realized gain on investments | | | (0.02 | ) | | | (0.10 | ) | | | — | | | | — | | | | (0.00 | )3 |
| | | | | |
Total distributions to shareholders | | | (0.21 | ) | | | (0.27 | ) | | | (0.19 | ) | | | (0.23 | ) | | | (0.21 | ) |
| | | | | |
Net Asset Value, End of Year | | | $11.18 | | | | $12.31 | | | | $12.52 | | | | $12.18 | | | | $11.54 | |
| | | | | |
Total Return2,4 | | | (7.45 | )% | | | 0.43 | % | | | 4.70 | % | | | 7.58 | % | | | 0.87 | % |
| | | | | |
Ratio of net expenses to average net assets | | | 0.39 | % | | | 0.39 | % | | | 0.39 | % | | | 0.39 | % | | | 0.39 | % |
| | | | | |
Ratio of gross expenses to average net assets5 | | | 0.45 | % | | | 0.44 | % | | | 0.45 | % | | | 0.46 | % | | | 0.45 | % |
| | | | | |
Ratio of net investment income to average net assets2 | | | 1.68 | % | | | 1.33 | % | | | 1.57 | % | | | 1.91 | % | | | 1.85 | % |
| | | | | |
Portfolio turnover | | | 20 | % | | | 24 | % | | | 17 | % | | | 18 | % | | | 35 | % |
| | | | | |
Net assets end of year (000’s) omitted | | | $1,068,290 | | | | $1,331,958 | | | | $1,287,667 | | | | $1,014,514 | | | | $940,553 | |
| | |
| 1 | Per share numbers have been calculated using average shares. |
| 2 | Total returns and net investment income would have been lower had certain expenses not been offset. |
| 3 | Less than $(0.005) per share. |
| 4 | The total return is calculated using the published Net Asset Value as of fiscal year end. |
| 5 | Excludes the impact of expense reimbursement or fee waivers and expense reductions such as brokerage credits, but includes expense repayments and non-reimbursable expenses, if any, such as interest, taxes, and extraordinary expenses. (See Note 1(c) and 2 in the Notes to Financial Statements.) |
61
| | |
| | | AMG GW&K Municipal Enhanced Yield Fund Financial Highlights For a share outstanding throughout each fiscal year |
| | | | | | | | | | | | | | | | | | | | |
| | | For the fiscal years ended December 31, |
| | | | | |
| Class N | | 2022 | | 2021 | | 2020 | | 2019 | | 2018 |
| | | | | |
Net Asset Value, Beginning of Year | | | $10.74 | | | | $10.69 | | | | $10.42 | | | | $9.69 | | | | $10.02 | |
| | | | | |
Income (loss) from Investment Operations: | | | | | | | | | | | | | | | | | | | | |
| | | | | |
Net investment income1,2 | | | 0.22 | | | | 0.20 | | | | 0.23 | | | | 0.26 | | | | 0.27 | |
| | | | | |
Net realized and unrealized gain (loss) on investments | | | (2.17 | ) | | | 0.18 | | | | 0.37 | | | | 0.78 | | | | (0.33 | ) |
| | | | | |
Total income (loss) from investment operations | | | (1.95 | ) | | | 0.38 | | | | 0.60 | | | | 1.04 | | | | (0.06 | ) |
| | | | | |
Less Distributions to Shareholders from: | | | | | | | | | | | | | | | | | | | | |
| | | | | |
Net investment income | | | (0.20 | ) | | | (0.19 | ) | | | (0.21 | ) | | | (0.25 | ) | | | (0.15 | ) |
| | | | | |
Net realized gain on investments | | | (0.03 | ) | | | (0.14 | ) | | | (0.12 | ) | | | (0.06 | ) | | | — | |
| | | | | |
Paid in capital | | | — | | | | — | | | | — | | | | — | | | | (0.12 | ) |
| | | | | |
Total distributions to shareholders | | | (0.23 | ) | | | (0.33 | ) | | | (0.33 | ) | | | (0.31 | ) | | | (0.27 | ) |
| | | | | |
Net Asset Value, End of Year | | | $8.56 | | | | $10.74 | | | | $10.69 | | | | $10.42 | | | | $9.69 | |
| | | | | |
Total Return2,3 | | | (18.19 | )% | | | 3.59 | % | | | 5.95 | % | | | 10.92 | % | | | (0.55 | )% |
| | | | | |
Ratio of net expenses to average net assets | | | 0.99 | % | | | 0.99 | % | | | 0.99 | % | | | 0.99 | % | | | 0.99 | % |
| | | | | |
Ratio of gross expenses to average net assets4 | | | 1.07 | % | | | 1.05 | % | | | 1.07 | % | | | 1.08 | % | | | 1.08 | % |
| | | | | |
Ratio of net investment income to average net assets2 | | | 2.39 | % | | | 1.85 | % | | | 2.17 | % | | | 2.56 | % | | | 2.79 | % |
| | | | | |
Portfolio turnover | | | 45 | % | | | 61 | % | | | 81 | % | | | 40 | % | | | 89 | % |
| | | | | |
Net assets end of year (000’s) omitted | | | $2,955 | | | | $14,923 | | | | $5,015 | | | | $5,722 | | | | $7,283 | |
| | |
62
| | |
| | | AMG GW&K Municipal Enhanced Yield Fund Financial Highlights For a share outstanding throughout each fiscal year |
| | | | | | | | | | | | | | | | | | | | |
| | | For the fiscal years ended December 31, |
| | | | | |
| Class I | | 2022 | | 2021 | | 2020 | | 2019 | | 2018 |
| | | | | |
Net Asset Value, Beginning of Year | | | $10.43 | | | | $10.40 | | | | $10.15 | | | | $9.45 | | | | $10.01 | |
| | | | | |
Income (loss) from Investment Operations: | | | | | | | | | | | | | | | | | | | | |
| | | | | |
Net investment income1,2 | | | 0.24 | | | | 0.23 | | | | 0.25 | | | | 0.29 | | | | 0.31 | |
| | | | | |
Net realized and unrealized gain (loss) on investments | | | (2.09 | ) | | | 0.17 | | | | 0.37 | | | | 0.76 | | | | (0.32 | ) |
| | | | | |
Total income (loss) from investment operations | | | (1.85 | ) | | | 0.40 | | | | 0.62 | | | | 1.05 | | | | (0.01 | ) |
| | | | | |
Less Distributions to Shareholders from: | | | | | | | | | | | | | | | | | | | | |
| | | | | |
Net investment income | | | (0.25 | ) | | | (0.23 | ) | | | (0.25 | ) | | | (0.29 | ) | | | (0.31 | ) |
| | | | | |
Net realized gain on investments | | | (0.03 | ) | | | (0.14 | ) | | | (0.12 | ) | | | (0.06 | ) | | | — | |
| | | | | |
Paid in capital | | | — | | | | — | | | | — | | | | — | | | | (0.24 | ) |
| | | | | |
Total distributions to shareholders | | | (0.28 | ) | | | (0.37 | ) | | | (0.37 | ) | | | (0.35 | ) | | | (0.55 | ) |
| | | | | |
Net Asset Value, End of Year | | | $8.30 | | | | $10.43 | | | | $10.40 | | | | $10.15 | | | | $9.45 | |
| | | | | |
Total Return2,3 | | | (17.86 | )% | | | 3.94 | % | | | 6.31 | % | | | 11.28 | % | | | (0.07 | )% |
| | | | | |
Ratio of net expenses to average net assets | | | 0.64 | % | | | 0.64 | % | | | 0.64 | % | | | 0.64 | % | | | 0.64 | % |
| | | | | |
Ratio of gross expenses to average net assets4 | | | 0.72 | % | | | 0.70 | % | | | 0.72 | % | | | 0.73 | % | | | 0.73 | % |
| | | | | |
Ratio of net investment income to average net assets2 | | | 2.74 | % | | | 2.20 | % | | | 2.52 | % | | | 2.91 | % | | | 3.14 | % |
| | | | | |
Portfolio turnover | | | 45 | % | | | 61 | % | | | 81 | % | | | 40 | % | | | 89 | % |
| | | | | |
Net assets end of year (000’s) omitted | | | $255,928 | | | | $369,473 | | | | $323,439 | | | | $273,228 | | | | $203,867 | |
| | |
63
| | |
| | | AMG GW&K Municipal Enhanced Yield Fund Financial Highlights For a share outstanding throughout each fiscal year |
| | | | | | | | | | | | | | | | | | | | |
| | | For the fiscal years ended December 31, |
| | | | | |
| Class Z | | 2022 | | 2021 | | 2020 | | 2019 | | 2018 |
| | | | | |
Net Asset Value, Beginning of Year | | | $10.43 | | | | $10.40 | | | | $10.15 | | | | $9.44 | | | | $10.01 | |
| | | | | |
Income (loss) from Investment Operations: | | | | | | | | | | | | | | | | | | | | |
| | | | | |
Net investment income1,2 | | | 0.25 | | | | 0.24 | | | | 0.26 | | | | 0.30 | | | | 0.31 | |
| | | | | |
Net realized and unrealized gain (loss) on investments | | | (2.10 | ) | | | 0.17 | | | | 0.37 | | | | 0.76 | | | | (0.32 | ) |
| | | | | |
Total income (loss) from investment operations | | | (1.85 | ) | | | 0.41 | | | | 0.63 | | | | 1.06 | | | | (0.01 | ) |
| | | | | |
Less Distributions to Shareholders from: | | | | | | | | | | | | | | | | | | | | |
| | | | | |
Net investment income | | | (0.25 | ) | | | (0.24 | ) | | | (0.26 | ) | | | (0.29 | ) | | | (0.32 | ) |
| | | | | |
Net realized gain on investments | | | (0.03 | ) | | | (0.14 | ) | | | (0.12 | ) | | | (0.06 | ) | | | — | |
| | | | | |
Paid in capital | | | — | | | | — | | | | — | | | | — | | | | (0.24 | ) |
| | | | | |
Total distributions to shareholders | | | (0.28 | ) | | | (0.38 | ) | | | (0.38 | ) | | | (0.35 | ) | | | (0.56 | ) |
| | | | | |
Net Asset Value, End of Year | | | $8.30 | | | | $10.43 | | | | $10.40 | | | | $10.15 | | | | $9.44 | |
| | | | | |
Total Return2,3 | | | (17.82 | )% | | | 3.99 | % | | | 6.37 | % | | | 11.45 | % | | | (0.09 | )% |
| | | | | |
Ratio of net expenses to average net assets | | | 0.59 | % | | | 0.59 | % | | | 0.59 | % | | | 0.59 | % | | | 0.59 | % |
| | | | | |
Ratio of gross expenses to average net assets4 | | | 0.67 | % | | | 0.65 | % | | | 0.67 | % | | | 0.68 | % | | | 0.68 | % |
| | | | | |
Ratio of net investment income to average net assets2 | | | 2.79 | % | | | 2.25 | % | | | 2.57 | % | | | 2.96 | % | | | 3.19 | % |
| | | | | |
Portfolio turnover | | | 45 | % | | | 61 | % | | | 81 | % | | | 40 | % | | | 89 | % |
| | | | | |
Net assets end of year (000’s) omitted | | | $111 | | | | $135 | | | | $130 | | | | $120 | | | | $108 | |
| | |
| 1 | Per share numbers have been calculated using average shares. |
| 2 | Total returns and net investment income would have been lower had certain expenses not been offset. |
| 3 | The total return is calculated using the published Net Asset Value as of fiscal year end. |
| 4 | Excludes the impact of expense reimbursement or fee waivers and expense reductions such as brokerage credits, but includes expense repayments and non-reimbursable expenses, if any, such as interest, taxes, and extraordinary expenses. (See Note 1(c) and 2 in the Notes to Financial Statements.) |
64
| | |
| | | Notes to Financial Statements December 31, 2022 |
1. ORGANIZATION AND SUMMARY OF SIGNIFICANT ACCOUNTING POLICIES
AMG Funds, AMG Funds II and AMG Funds III (the “Trusts”) are open-end management investment companies, organized as Massachusetts business trusts, and registered under the Investment Company Act of 1940, as amended (the “1940 Act”). Currently, the Trusts consist of a number of different funds, each having distinct investment management objectives, strategies, risks, and policies. Included in this report are AMG Funds: AMG GW&K Municipal Bond Fund (“Municipal Bond”), AMG GW&K Municipal Enhanced Yield Fund (“Municipal Enhanced”), AMG Funds II: AMG GW&K Enhanced Core Bond ESG Fund (“Enhanced Core Bond ESG”) and AMG Funds III: AMG GW&K ESG Bond Fund (“ESG Bond”) and AMG GW&K High Income Fund (“High Income”), each a “Fund” and collectively, the “Funds”.
Each Fund offers different classes of shares. All Funds offer Class N shares and Class I shares; and Enhanced Core Bond ESG and Municipal Enhanced offer Class Z shares. Each class represents an interest in the same assets of the respective Fund. Although all share classes generally have identical voting rights, each share class votes separately when required by law. Different share classes may have different net asset values per share to the extent the share classes pay different distribution amounts and/or the expenses of such share classes differ. Each share class has its own expense structure. Please refer to a current prospectus for additional information on each share class.
Market prices of investments held by the Funds may fall rapidly or unpredictably due to a variety of economic or political factors, market conditions, disasters or public health issues, or in response to events that affect particular industries or companies.
The Funds’ financial statements are prepared in accordance with accounting principles generally accepted in the United States of America (“U.S. GAAP”), including accounting and reporting guidance pursuant to Accounting Standards Codification Topic 946 applicable to investment companies. U.S. GAAP requires management to make estimates and assumptions that affect the reported amounts of assets and liabilities and disclosure of contingent assets and liabilities at the date of the financial statements and the reported amounts of income and expenses during the reporting period. Actual results could differ from those estimates and such differences could be material. The following is a summary of significant accounting policies followed by the Funds in the preparation of their financial statements:
a. VALUATION OF INVESTMENTS
Fixed income securities purchased with a remaining maturity exceeding 60 days are valued at the evaluated bid price provided by an authorized pricing service or, if an evaluated price is not available, by reference to other securities which are considered comparable in credit rating, interest rate, due date and other features (generally referred to as “matrix pricing”) or other similar pricing methodologies. Investments in certain mortgage-backed and stripped mortgage-backed securities, convertible securities, derivatives and other debt securities not traded on an organized securities market are valued on the basis of valuations provided by dealers or by a pricing service which uses information with respect to transactions in such securities and various relationships between such securities and yield to maturity in determining value.
Fixed income securities purchased with a remaining maturity of 60 days or less are valued at amortized cost, provided that the amortized cost value is
approximately the same as the fair value of the security valued without the use of amortized cost. Investments in other open-end registered investment companies are valued at their end of day net asset value per share.
The Funds’ portfolio investments are generally valued based on independent market quotations or prices or, if none, “evaluative” or other market based valuations provided by third party pricing services approved by the Boards of Trustees of the Trusts (the “Boards”). Under certain circumstances, the value of certain Fund portfolio investments may be based on an evaluation of fair value, pursuant to procedures established by and under the general supervision of the Boards. The Valuation Committee, which is comprised of the Independent Trustees of the Boards, and the Pricing Committee, which is comprised of representatives from AMG Funds LLC (the “Investment Manager”) are the committees appointed by the Boards to make fair value determinations. Each Fund may use the fair value of a portfolio investment to calculate its net asset value (“NAV”) in the event that the market quotation, price or market based valuation for the portfolio investment is not readily available or otherwise not determinable pursuant to the Boards’ valuation procedures, if the Investment Manager or the Pricing Committee believes the quotation, price or market based valuation to be unreliable, or in certain other circumstances. When determining the fair value of an investment, the Pricing Committee and, if required under the Trusts’ securities valuation procedures, the Valuation Committee, seeks to determine the price that a Fund might reasonably expect to receive from current sale of that portfolio investment in an arms-length transaction. Fair value determinations shall be based upon consideration of all available facts and information, including, but not limited to (i) attributes specific to the investment; (ii) fundamental and analytical data relating to the investment; and (iii) the value of other comparable securities or relevant financial instruments, including derivative securities, traded on other markets or among dealers.
The values assigned to fair value portfolio investments are based on available information and do not necessarily represent amounts that might ultimately be realized in the future, since such amounts depend on future developments inherent in long-term investments. Because of the inherent uncertainty of valuation, those estimated values may differ significantly from the values that would have been used had a ready market for the investments existed, and the differences could be material. The Boards will be presented with a quarterly report showing as of the most recent quarter end, all outstanding securities fair valued by the Funds, including a comparison with the prior quarter end and the percentage of the Funds that the security represents at each quarter end.
With respect to foreign equity securities and certain foreign fixed income securities, the Boards have adopted a policy that securities held in the Funds that can be fair valued by the applicable fair value pricing service are fair valued on each business day provided that each individual price exceeds a pre-established confidence level.
Effective September 8, 2022, the Funds adopted the requirements of Rule 2a-5 under the 1940 Act (“Rule 2a-5”), which the Funds’ Board designated the Funds’ Investment Manager as the Funds’ Valuation Designee to perform the Funds’ fair value determinations. Such determinations are subject to Board oversight and certain reporting and other requirements intended to ensure that the Board receives the information it needs to oversee the Investment Manager’s fair value determinations. Other than the designation of the Investment Manager as the Valuation Designee, the Funds’ adoption of Rule 2-a5 did not impact how the Funds determine fair value or the carrying amount of investments held in the Funds.
65
| | |
| | | Notes to Financial Statements (continued) |
| | | |
| | | |
U.S. GAAP defines fair value as the price that a fund would receive to sell an asset or pay to transfer a liability in an orderly transaction between market participants at the measurement date. U.S. GAAP also establishes a framework for measuring fair value, and a three level hierarchy for fair value measurements based upon the transparency of inputs to the valuation of an asset or liability. Inputs may be observable or unobservable and refer broadly to the assumptions that market participants would use in pricing the asset or liability. Observable inputs reflect the assumptions market participants would use in pricing the asset or liability based on market data obtained from sources independent of the Funds.
Unobservable inputs reflect the Funds’ own assumptions about the assumptions that market participants would use in pricing the asset or liability developed based on the best information available in the circumstances. Each investment is assigned a level based upon the observability of the inputs which are significant to the overall valuation.
The three-tier hierarchy of inputs is summarized below:
Level 1 – inputs are quoted prices in active markets for identical investments (e.g., equity securities, open-end investment companies)
Level 2 – other observable inputs (including, but not limited to: quoted prices for similar assets or liabilities in markets that are active, quoted prices for identical or similar assets or liabilities in markets that are not active, inputs other than quoted prices that are observable for the assets or liabilities (such as interest rates, yield curves, volatilities, prepayment speeds, loss severities, credit risks and default rates) or other market corroborated inputs) (e.g., debt securities, government securities, foreign currency exchange contracts, foreign securities utilizing international fair value pricing, fair valued securities with observable inputs)
Level 3 – inputs are significant unobservable inputs (including the Fund’s own assumptions used to determine the fair value of investments) (e.g., fair valued securities with unobservable inputs)
Changes in inputs or methodologies used for valuing investments may result in a transfer in or out of levels within the fair value hierarchy. The inputs or methodologies used for valuing investments may not necessarily be an indication of the risk associated with investing in those investments.
b. SECURITY TRANSACTIONS
Security transactions are accounted for as of trade date. Realized gains and losses on securities sold are determined on the basis of identified cost.
c. INVESTMENT INCOME AND EXPENSES
Interest income, which includes amortization of premium and accretion of discount on debt securities, is accrued as earned. Interest income on foreign securities is recorded gross of any withholding tax. Expenses that cannot be directly attributed to a Fund are apportioned among the funds in the Trusts and other trusts or funds within the AMG Funds Family of Funds (collectively the “AMG Funds Family”) based upon their relative average net assets or number of shareholders. Investment income, realized and unrealized capital gains and losses, the common expenses of each Fund, and certain fund level expense reductions, if any, are allocated on a pro-rata basis to each class based on the relative net assets of each class to the total net assets of each Fund.
d. DIVIDENDS AND DISTRIBUTIONS
Fund distributions resulting from net investment income, if any, will normally be declared and paid monthly by the Funds. Fund distributions resulting from realized net capital gains, if any, will normally be declared and paid at least annually in December. Distributions to shareholders are recorded on the ex-dividend date. Distributions are determined in accordance with federal income tax regulations, which may differ from net investment income and net realized capital gains for financial statement purposes (U.S. GAAP). Differences may be permanent or temporary. Permanent differences are reclassified among capital accounts in the financial statements to reflect their tax character. Permanent book and tax basis differences, if any, relating to shareholder distributions will result in reclassifications to paid-in capital. Temporary differences arise when certain items of income, expense and gain or loss are recognized in different periods for financial statement and tax purposes; these differences will reverse at some time in the future. There are no permanent differences during the year. Temporary differences are primarily due to; for ESG Bond, Enhanced Core Bond ESG, High Income and Municipal Enhanced Yield wash sale loss deferrals, for ESG Bond and High Income, premium amortization on callable bonds.
The tax character of distributions paid during the fiscal years ended December 31, 2022 and December 31, 2021 were as follows:
| | | | | | | | | | | | | | | | | | | | | | | | |
| | | |
| | | ESG Bond | | | Enhanced Core Bond ESG | | | High Income | |
| | | | | | |
Distributions paid from: | | | 2022 | | | | 2021 | | | | 2022 | | | | 2021 | | | | 2022 | | | | 2021 | |
| | | | | | |
Ordinary income * | | | $12,655,107 | | | | $200,763 | | | | $1,041,762 | | | | $824,369 | | | | $684,311 | | | | $543,755 | |
| | | | | | |
Tax-exempt income | | | — | | | | — | | | | — | | | | — | | | | — | | | | — | |
| | | | | | |
Long-term capital gains | | | 966,729 | | | | 104,312,217 | | | | — | | | | — | | | | 2,954 | | | | 547 | |
| | | | | | |
Paid-in capital | | | — | | | | — | | | | — | | | | 47,927 | | | | — | | | | — | |
| | | | | | | | | | | | | | | | | | | | | | | | |
| | | | | | |
| | | $13,621,836 | | | | $104,512,980 | | | | $1,041,762 | | | | $872,296 | | | | $687,265 | | | | $544,302 | |
| | | | | | | | | | | | | | | | | | | | | | | | |
66
| | |
| | | Notes to Financial Statements (continued) |
| | | |
| | | |
| | | | | | | | | | | | | | | | |
| | | Municipal Bond | | | Municipal Enhanced | |
| | | | |
Distributions paid from: | | | 2022 | | | | 2021 | | | | 2022 | | | | 2021 | |
| | | | |
Ordinary income * | | | $551,119 | | | | $808,177 | | | | $207,654 | | | | $1,453,156 | |
| | | | |
Tax-exempt income | | | 19,272,793 | | | | 17,729,864 | | | | 7,931,831 | | | | 8,070,665 | |
| | | | |
Long-term capital gains | | | 1,733,844 | | | | 9,730,890 | | | | 814,678 | | | | 3,573,833 | |
| | | | | | | | | | | | | | | | |
| | | | |
| | | $21,557,756 | | | | $28,268,931 | | | | $8,954,163 | | | | $13,097,654 | |
| | | | | | | | | | | | | | | | |
| * | For tax purposes, short-term capital gain distributions, if any, are considered ordinary income distributions. |
As of December 31, 2022, the components of distributable earnings (excluding unrealized appreciation/depreciation) on a tax basis consisted of:
| | | | | | | | | | | | | | | | | | | | |
| | | | | |
| | | ESG Bond | | | Enhanced Core Bond ESG | | | High Income | | | Municipal Bond | | | Municipal Enhanced | |
| | | | | |
Capital loss carryforward | | | $19,613,061 | | | | $4,956,739 | | | | $1,188,227 | | | | $10,312,359 | | | | $10,809,353 | |
| | | | | |
Undistributed ordinary income | | | 31,878 | | | | — | | | | 4,287 | | | | — | | | | — | |
| | | | | |
Undistributed tax-exempt income | | | — | | | | — | | | | — | | | | 677 | | | | 30,058 | |
At December 31, 2022, the cost of investments and the aggregate gross unrealized appreciation and depreciation for federal income tax purposes were as follows:
| | | | | | | | | | | | | | | | |
| | | | |
| Fund | | Cost | | | Appreciation | | | Depreciation | | | Net Depreciation | |
| | | | |
ESG Bond | | | $576,213,247 | | | | $926,487 | | | | $(80,013,775 | ) | | | $(79,087,288 | ) |
| | | | |
Enhanced Core Bond ESG | | | 46,849,394 | | | | 10,494 | | | | (5,741,529 | ) | | | (5,731,035 | ) |
| | | | |
High Income | | | 19,273,681 | | | | 35,883 | | | | (962,111 | ) | | | (926,228 | ) |
| | | | |
Municipal Bond | | | 1,143,562,341 | | | | 2,993,902 | | | | (63,342,720 | ) | | | (60,348,818 | ) |
| | | | |
Municipal Enhanced | | | 290,190,158 | | | | 829,496 | | | | (36,219,434 | ) | | | (35,389,938 | ) |
e. FEDERAL TAXES
Each Fund currently qualifies as an investment company and intends to comply with the requirements under Subchapter M of the Internal Revenue Code of 1986, as amended, and to distribute substantially all of its taxable income and gains to its shareholders and to meet certain diversification and income requirements with respect to investment companies. Therefore, no provision for federal income or excise tax is included in the accompanying financial statements.
Additionally, based on each Fund’s understanding of the tax rules and rates related to income, gains and transactions for the foreign jurisdictions in which it invests, each Fund will provide for foreign taxes, and where appropriate, deferred foreign taxes.
Management has analyzed the Funds’ tax positions taken on federal income tax returns as of December 31, 2022, and for all open tax years (generally, the three prior taxable years), and has concluded that no provision for federal income tax is required in the Funds’ financial statements. Additionally, Management is not aware of any tax position for which it is reasonably possible that the total amounts of unrecognized tax benefits will change materially in the next twelve months.
f. CAPITAL LOSS CARRYOVERS AND DEFERRALS
As of December 31, 2022, the Funds had capital loss carryovers for federal income tax purposes as shown in the following chart. These amounts may be used to offset future realized capital gains indefinitely, and retain their character as short-term and/or long-term.
| | | | | | | | | | | | |
| | | |
| Fund | | Short-Term | | | Long-Term | | | Total | |
| | | |
ESG Bond | | | $7,220,366 | | | | $12,392,695 | | | | $19,613,061 | |
| | | |
Enhanced Core Bond ESG | | | 2,475,319 | | | | 2,481,420 | | | | 4,956,739 | |
| | | |
High Income | | | 397,484 | | | | 790,743 | | | | 1,188,227 | |
| | | |
Municipal Bond | | | 2,786,859 | | | | 7,525,500 | | | | 10,312,359 | |
| | | |
Municipal Enhanced | | | 3,966,598 | | | | 6,842,755 | | | | 10,809,353 | |
For the fiscal year ended December 31, 2022, the Funds did not utilize capital loss carryovers.
67
| | |
| | | Notes to Financial Statements (continued) |
| | | |
| | | |
g. CAPITAL STOCK
The Trust’s Declaration of Trust authorizes for each Fund the issuance of an unlimited number of shares of beneficial interest, without par value. Each Fund records sales and repurchases of its capital stock on the trade date.
For the fiscal years ended December 31, 2022 and December 31, 2021, the capital stock transactions by class for the Funds were as follows:
| | | | | | | | | | | | | | | | | | | | | | | | | | | | | | | | |
| | | ESG Bond | | | Enhanced Core Bond ESG | |
| | | | |
| | | December 31, 2022 | | | December 31, 2021 | | | December 31, 2022 | | | December 31, 2021 | |
| | | Shares | | | Amount | | | Shares | | | Amount | | | Shares | | | Amount | | | Shares | | | Amount | |
| | | | | | | | |
Class N: | | | | | | | | | | | | | | | | | | | | | | | | | | | | | | | | |
| | | | | | | | |
Shares sold | | | 434,859 | | | | $9,802,580 | | | | 1,452,937 | | | | $38,053,195 | | | | 151,245 | | | | $1,447,268 | | | | 286,260 | | | | $3,068,578 | |
| | | | | | | | |
Shares issued in reinvestment of distributions | | | 345,800 | | | | 7,627,326 | | | | 2,051,404 | | | | 51,918,933 | | | | 20,650 | | | | 192,586 | | | | 17,561 | | | | 187,784 | |
| | | | | | | | |
Shares redeemed | | | (3,716,450) | | | | (83,888,821) | | | | (6,049,606) | | | | (156,764,465) | | | | (268,963) | | | | (2,557,723) | | | | (459,141) | | | | (4,905,575) | |
| | | | | | | | | | | | | | | | | | | | | | | | | | | | | | | | |
| | | | | | | | |
Net decrease | | | (2,935,791) | | | | $(66,458,915) | | | | (2,545,265) | | | | $(66,792,337) | | | | (97,068) | | | | $(917,869) | | | | (155,320) | | | | $(1,649,213) | |
| | | | | | | | | | | | | | | | | | | | | | | | | | | | | | | | |
| | | | | | | | |
Class I: | | | | | | | | | | | | | | | | | | | | | | | | | | | | | | | | |
| | | | | | | | |
Shares sold | | | 1,292,769 | | | | $29,148,121 | | | | 3,132,524 | | | | $82,409,399 | | | | 1,447,204 | | | | $13,969,790 | | | | 1,729,710 | | | | $18,560,256 | |
| | | | | | | | |
Shares issued in reinvestment of distributions | | | 256,042 | | | | 5,663,172 | | | | 1,959,229 | | | | 49,642,039 | | | | 55,346 | | | | 519,860 | | | | 40,944 | | | | 439,321 | |
| | | | | | | | |
Shares redeemed | | | (5,602,000) | | | | (125,532,119) | | | | (11,383,287) | | | | (293,819,048) | | | | (2,416,748) | | | | (23,744,821) | | | | (1,177,158) | | | | (12,618,347) | |
| | | | | | | | | | | | | | | | | | | | | | | | | | | | | | | | |
| | | | | | | | |
Net increase (decrease) | | | (4,053,189) | | | | $(90,720,826) | | | | (6,291,534) | | | | $(161,767,610) | | | | (914,198) | | | | $(9,255,171) | | | | 593,496 | | | | $6,381,230 | |
| | | | | | | | | | | | | | | | | | | | | | | | | | | | | | | | |
| | | | | | | | |
Class Z: | | | | | | | | | | | | | | | | | | | | | | | | | | | | | | | | |
| | | | | | | | |
Shares sold | | | — | | | | — | | | | — | | | | — | | | | 147,673 | | | | $1,476,721 | | | | 442,744 | | | | $4,753,770 | |
| | | | | | | | |
Shares issued in reinvestment of distributions | | | — | | | | — | | | | — | | | | — | | | | 27,916 | | | | 261,662 | | | | 17,832 | | | | 191,235 | |
| | | | | | | | |
Shares redeemed | | | — | | | | — | | | | — | | | | — | | | | (359,946) | | | | (3,361,565) | | | | (229,602) | | | | (2,465,708) | |
| | | | | | | | | | | | | | | | | | | | | | | | | | | | | | | | |
| | | | | | | | |
Net increase (decrease) | | | — | | | | — | | | | — | | | | — | | | | (184,357) | | | | $(1,623,182) | | | | 230,974 | | | | $2,479,297 | |
| | | | | | | | | | | | | | | | | | | | | | | | | | | | | | | | |
| | |
| | | High Income | | | Municipal Bond | |
| | | | |
| | | December 31, 2022 | | | December 31, 2021 | | | December 31, 2022 | | | December 31, 2021 | |
| | | Shares | | | Amount | | | Shares | | | Amount | | | Shares | | | Amount | | | Shares | | | Amount | |
| | | | | | | | |
Class N: | | | | | | | | | | | | | | | | | | | | | | | | | | | | | | | | |
| | | | | | | | |
Shares sold | | | 18,712 | | | | $389,945 | | | | 111,205 | | | | $2,494,229 | | | | 647,098 | | | | $7,349,629 | | | | 698,892 | | | | $8,650,727 | |
| | | | | | | | |
Shares issued in reinvestment of distributions | | | 13,040 | | | | 267,721 | | | | 9,973 | | | | 224,451 | | | | 16,904 | | | | 188,374 | | | | 23,744 | | | | 292,232 | |
| | | | | | | | |
Shares redeemed | | | (70,270) | | | | (1,469,556) | | | | (221,405) | | | | (4,977,229) | | | | (895,246) | | | | (10,012,745) | | | | (782,262) | | | | (9,674,017) | |
| | | | | | | | | | | | | | | | | | | | | | | | | | | | | | | | |
| | | | | | | | |
Net decrease | | | (38,518) | | | | $(811,890) | | | | (100,227) | | | | $(2,258,549) | | | | (231,244) | | | | $(2,474,742) | | | | (59,626) | | | | $(731,058) | |
| | | | | | | | | | | | | | | | | | | | | | | | | | | | | | | | |
| | | | | | | | |
Class I: | | | | | | | | | | | | | | | | | | | | | | | | | | | | | | | | |
| | | | | | | | |
Shares sold | | | 484,312 | | | | $9,834,594 | | | | 605,743 | | | | $13,584,553 | | | | 81,732,933 | | | | $917,700,640 | | | | 33,594,124 | | | | $418,621,329 | |
| | | | | | | | |
Shares issued in reinvestment of distributions | | | 19,941 | | | | 410,014 | | | | 13,885 | | | | 312,124 | | | | 1,484,035 | | | | 16,631,130 | | | | 1,809,529 | | | | 22,408,701 | |
| | | | | | | | |
Shares redeemed | | | (556,443) | | | | (11,307,954) | | | | (33,112) | | | | (749,594) | | | | (95,879,229) | | | | (1,074,060,059) | | | | (30,023,803) | | | | (373,936,594) | |
| | | | | | | | | | | | | | | | | | | | | | | | | | | | | | | | |
| | | | | | | | |
Net increase (decrease) | | | (52,190) | | | | $(1,063,346) | | | | 586,516 | | | | $13,147,083 | | | | (12,662,261) | | | | $(139,728,289) | | | | 5,379,850 | | | | $67,093,436 | |
| | | | | | | | | | | | | | | | | | | | | | | | | | | | | | | | |
68
| | |
| | | Notes to Financial Statements (continued) |
| | | |
| | | |
| | | | | | | | | | | | | | | | |
| | | Municipal Enhanced | |
| | |
| | | December 31, 2022 | | | December 31, 2021 | |
| | | | |
| | | Shares | | | Amount | | | Shares | | | Amount | |
| | | | |
Class N: | | | | | | | | | | | | | | | | |
| | | | |
Shares sold | | | 616,950 | | | | $5,797,292 | | | | 3,442,311 | | | | $37,047,081 | |
| | | | |
Shares issued in reinvestment of distributions | | | 5,976 | | | | 53,425 | | | | 15,958 | | | | 172,953 | |
| | | | |
Shares redeemed | | | (1,667,635) | | | | (16,584,715) | | | | (2,537,721) | | | | (27,497,613) | |
| | | | | | | | | | | | | | | | |
| | | | |
Net increase (decrease) | | | (1,044,709) | | | | $(10,733,998) | | | | 920,548 | | | | $9,722,421 | |
| | | | | | | | | | | | | | | | |
| | | | |
Class I: | | | | | | | | | | | | | | | | |
| | | | |
Shares sold | | | 12,933,675 | | | | $112,341,447 | | | | 10,001,279 | | | | $105,402,142 | |
| | | | |
Shares issued in reinvestment of distributions | | | 534,430 | | | | 4,664,114 | | | | 631,256 | | | | 6,610,515 | |
| | | | |
Shares redeemed | | | (18,061,842) | | | | (159,500,846) | | | | (6,312,309) | | | | (66,530,105) | |
| | | | | | | | | | | | | | | | |
| | | | |
Net increase (decrease) | | | (4,593,737) | | | | $(42,495,285) | | | | 4,320,226 | | | | $45,482,552 | |
| | | | | | | | | | | | | | | | |
| | | | |
Class Z: | | | | | | | | | | | | | | | | |
| | | | |
Shares issued in reinvestment of distributions | | | 423 | | | | $3,685 | | | | 461 | | | | $4,817 | |
| | | | | | | | | | | | | | | | |
| | | | |
Net increase | | | 423 | | | | $3,685 | | | | 461 | | | | $4,817 | |
| | | | | | | | | | | | | | | | |
h. REPURCHASE AGREEMENTS AND JOINT REPURCHASE AGREEMENTS
The Funds may enter into third-party and bilateral repurchase agreements for temporary cash management purposes and third-party or bilateral joint repurchase agreements for reinvestment of cash collateral on securities lending transactions under the securities lending program offered by The Bank of New York Mellon (“BNYM”) (the “Program”) (collectively, “Repurchase Agreements”). The value of the underlying collateral, including accrued interest, must equal or exceed the value of the Repurchase Agreements during the term of the agreement. For joint repurchase agreements, the Funds participate on a pro rata basis with other clients of BNYM in its share of the underlying collateral under such joint repurchase agreements and in its share of proceeds from any repurchase or other disposition of the underlying collateral. The underlying collateral for all Repurchase Agreements is held in safekeeping by the Funds’ custodian or at the Federal Reserve Bank. If the seller defaults and the value of the collateral declines, or if bankruptcy proceedings commence with respect to the seller of the security, realization of the collateral by the Funds may be delayed or limited. Pursuant to the Program, the Funds are indemnified for such losses by BNYM on joint repurchase agreements.
At December 31, 2022, the market value of Repurchase Agreements outstanding for ESG Bond, Enhanced Core Bond ESG, High Income, Municipal Bond Fund and Municipal Enhanced Yield were $10,482,408, $1,472,815, $1,501,247, $668,000 and $926,000, respectively.
i. SECURITIES TRANSACTED ON A WHEN ISSUED BASIS
The Funds may enter into To-Be-Announced (“TBA”) sale commitments to hedge their portfolio positions or to sell mortgage-backed securities they own under delayed delivery arrangements. Proceeds of TBA sale commitments are not received until the contractual settlement date. During the time a
TBA sale commitment is outstanding, equivalent deliverable securities, with the same counterparty, or an offsetting TBA purchase commitment deliverable on or before the sale commitment date, are held as “cover” for the transaction. Unsettled TBA sale commitments are valued at the current market value of the underlying securities according to the procedures described under “Valuation of Investments,” in Footnote 1a above.
Each TBA contract is marked-to-market daily and the change in market value is recorded by the Fund as an unrealized gain or loss. If the TBA sale commitment is closed through the acquisition of an offsetting purchase commitment with the same broker, the Fund realizes a gain or loss. If the Fund delivers securities under the commitment, the Fund realizes a gain or a loss from the sale of the securities based upon the unit price established at the date the commitment was entered into.
j. DELAYED DELIVERY TRANSACTIONS AND WHEN-ISSUED SECURITIES
The Funds may enter into securities transactions on a delayed delivery or when issued basis. Payment and delivery may take place after the customary settlement period for that security. The price of the underlying securities and the date when the securities will be delivered and paid for are fixed at the time the transaction is negotiated. During the time a delayed delivery sell is outstanding, the contract is marked to market daily and equivalent deliverable securities are held for the transaction. The value of the securities purchased on a delayed delivery or when-issued basis are identified as such in each Fund’s Schedule of Portfolio Investments. With respect to purchase commitments, the Fund’s identify securities as segregated in its records with a value at least equal to the amount of the commitment. Delayed delivery or when-issued securities that have been purchased from and sold to different brokers are reflected as an investment in securities and a forward sale commitment in the Fund’s Statement of Assets and Liabilities. For financial reporting purposes, the Fund does offset the receivable and payable for delayed delivery investments purchased and sold on TBA commitments. Losses may arise due to changes in the value of the underlying
69
| | |
| | | Notes to Financial Statements (continued) |
| | | |
| | | |
securities or if the counterparty does not perform under the contract, or if the issuer does not issue the securities due to political, economic, or other factors.
2. AGREEMENTS AND TRANSACTIONS WITH AFFILIATES
For each of the Funds, the Trusts have entered into an investment advisory agreement under which the Investment Manager, a subsidiary and the U.S. retail distribution arm of Affiliated Managers Group, Inc. (“AMG”), serves as investment manager to the Funds and is responsible for the Funds’ overall administration and operations. The Investment Manager selects one or more subadvisers for the Funds (subject to the Boards approval) and monitors each subadviser’s investment performance, security holdings and investment strategies. Each Fund’s investment portfolio is managed by GW&K who serves pursuant to a subadvisory agreement with the Investment Manager. AMG indirectly owns a majority interest in GW&K. Prior to March 19, 2021, ESG Bond’s investment portfolio was managed by Loomis, Sayles & Company, L.P.
Investment management fees are paid directly by the Funds to the Investment Manager based on average daily net assets. For the fiscal year ended December 31, 2022, the Funds’ investment management fees were paid at the following annual rates of each Fund’s respective average daily net assets:
| | |
| |
ESG Bond | | 0.23%1 |
| |
Enhanced Core Bond ESG | | 0.30% |
| |
High Income | | 0.39% |
| |
Municipal Bond | | |
| |
on first $25 million | | 0.35% |
| |
on next $25 million | | 0.30% |
| |
on next $50 million | | 0.25% |
| |
on balance over $100 million | | 0.20% |
| |
Municipal Enhanced | | 0.45% |
| 1 | Prior to June 12, 2021, the annual rate for the investment management fees for ESG Bond was 0.26% of the Fund’s average daily net assets. |
The fee paid to GW&K for its services as subadviser is paid out of the fee the Investment Manager receives from each Fund and does not increase the expenses of each Fund.
The Investment Manager has contractually agreed, through at least May 1, 2023, to waive management fees and/or pay or reimburse fund expenses in order to limit total annual Fund operating expenses after fee waiver and expense reimbursements (exclusive of taxes, interest (including interest incurred in connection with bank and custody overdrafts, and in connection with securities sold short), shareholder servicing fees, distribution and service (12b-1) fees, brokerage commissions and other transaction costs, dividends payable with respect to securities sold short, acquired fund fees and expenses and extraordinary expenses) of ESG Bond, Enhanced Core Bond ESG, High Income, Municipal Bond, and Municipal Enhanced to the annual rate of 0.43%, 0.48%. 0.59%, 0.34%, and 0.59%, respectively, of each Fund’s average daily net assets (this annual rate or such other annual rate that may be in effect from time to time, the “Expense Cap”), subject to later reimbursement by the Funds in certain circumstances. Prior to June 12, 2021, ESG Bond expense limitation was 0.46%.
In general, for a period of up to 36 months after the date any amounts are paid, waived or reimbursed by the Investment Manager, the Investment Manager may recover such amounts from a Fund, provided that such repayment would not cause the Fund’s total annual operating expenses after fee waiver and expense reimbursements (exclusive of the items noted in the parenthetical above) to exceed either (i) the Expense Cap in effect at the time such amounts were paid, waived or reimbursed, or (ii) the Expense Cap in effect at the time of such repayment by the Fund.
The contractual expense limitation may only be terminated in the event the Investment Manager or a successor ceases to be the investment manager of a Fund or a successor fund, by mutual agreement between the Investment Manager and the Boards, or in the event of a Fund’s liquidation unless the Fund is reorganized or is a party to a merger in which the surviving entity is successor to the accounting and performance information of a Fund.
At December 31, 2022, the Funds’ expiration of reimbursements subject to recoupment is as follows:
| | | | | | | | | | | | |
Expiration Period | | ESG Bond | | | Enhanced Core
Bond ESG | | | High Income | |
| | | |
Less than 1 year | | | $51,532 | | | | $135,792 | | | | $75,430 | |
| | | |
1-2 years | | | 19,644 | | | | 113,335 | | | | 94,499 | |
| | | |
2-3 years | | | 72,842 | | | | 130,195 | | | | 88,045 | |
| | | | | | | | | | | | |
| | | |
Total | | | $144,018 | | | | $379,322 | | | | $257,974 | |
| | | | | | | | | | | | |
| | | | | | | | |
Expiration Period | | Municipal Bond | | | Municipal Enhanced | |
| | |
Less than 1 year | | | $704,935 | | | | $242,883 | |
| | |
1-2 years | | | 706,015 | | | | 230,390 | |
| | |
2-3 years | | | 726,185 | | | | 225,094 | |
| | | | | | | | |
| | |
Total | | | $2,137,135 | | | | $698,367 | |
| | | | | | | | |
The Trusts, on behalf of the Funds, have entered into an amended and restated Administration Agreement under which the Investment Manager serves as the Funds’ administrator (the “Administrator”) and is responsible for all non-portfolio management aspects of managing the Funds’ operations, including administration and shareholder services to each Fund. Each Fund pays a fee to the Administrator at the rate of 0.15% per annum of the Fund’s average daily net assets for this service.
The Funds are distributed by AMG Distributors, Inc. (the “Distributor”), a wholly-owned subsidiary of the Investment Manager. The Distributor serves as the distributor and underwriter for each Fund and is a registered broker-dealer and member of the Financial Industry Regulatory Authority, Inc. (“FINRA”). Shares of each Fund will be continuously offered and will be sold directly to prospective purchasers and through brokers, dealers or other financial intermediaries who have executed selling agreements with the Distributor. Generally the Distributor bears all or a portion of the expenses of providing services pursuant to the distribution agreement, including the payment of the expenses relating to the distribution of prospectuses for sales purposes and any advertising or sales literature.
The Trusts have adopted a distribution and service plan (the “Plan”) with respect to the Class N shares, in accordance with the requirements of Rule 12b-1 under the
70
| | |
| | | Notes to Financial Statements (continued) |
| | | |
| | | |
1940 Act and the requirements of the applicable rules of FINRA regarding asset-based sales charges. Pursuant to the Plan, Enhanced Core Bond ESG, Municipal Bond and Municipal Enhanced may make payments to the Distributor for its expenditures in financing any activity primarily intended to result in the sale of each Fund’s Class N shares and for maintenance and personal service provided to existing shareholders of that class. The Plan authorized payments to the Distributor up to 0.25% annually of Enhanced Core Bond ESG, Municipal Bond and Municipal Enhanced average daily net assets attributable to the Class N shares. The portion of payments made under the plan by Class N shares of Enhanced Core Bond ESG, Municipal Bond and Municipal Enhanced for shareholder servicing may not exceed an annual rate of 0.25% of the average daily net asset value of each Fund’s shares of that class owned by clients of such broker, dealer or financial intermediary.
For each of Class N and Class I shares of ESG Bond, High Income, Municipal Bond, Municipal Enhanced, and for Enhanced Core Bond ESG’s Class I shares, the Boards have approved reimbursement payments to the Investment Manager for shareholder servicing expenses (“shareholder servicing fees”) incurred. Shareholder servicing fees include payments to financial intermediaries, such as broker-dealers (including fund supermarket platforms), banks, and trust companies who provide shareholder recordkeeping, account servicing and other services. The Class N and Class I shares may reimburse the Investment Manager for the actual amount incurred up to a maximum annual rate of each Class’s average daily net assets as shown in the table below.
The impact on the annualized expense ratios for the fiscal year ended December 31, 2022, were as follows:
| | | | | | | | |
| | | Maximum Annual | | | Actual | |
| | | Amount | | | Amount | |
| Fund | | Approved | | | Incurred | |
| | |
ESG Bond | | | | | | | | |
| | |
Class N | | | 0.25% | | | | 0.25% | |
| | |
Class I | | | 0.05% | | | | 0.05% | |
|
Enhanced Core Bond ESG | |
| | |
Class I | | | 0.10% | | | | 0.08% | |
|
High Income | |
| | |
Class N | | | 0.25% | | | | 0.25% | |
| | |
Class I | | | 0.05% | | | | 0.05% | |
|
Municipal Bond | |
| | |
Class N | | | 0.15% | | | | 0.13% | |
| | |
Class I | | | 0.05% | | | | 0.05% | |
|
Municipal Enhanced | |
| | |
Class N | | | 0.15% | | | | 0.15% | |
| | |
Class I | | | 0.05% | | | | 0.05% | |
The Boards provide supervision of the affairs of the Trusts and other trusts within the AMG Funds Family. The Trustees of the Trusts who are not affiliated with the Investment Manager receive an annual retainer and per meeting fees for regular, special and telephonic meetings, and they are reimbursed for out-of-pocket expenses incurred while carrying out their duties as Board members. The Chairman of the Boards and the Audit Committee Chair receive additional annual
retainers. Certain Trustees and Officers of the Funds are Officers and/or Directors of the Investment Manager, AMG and/or the Distributor.
The Securities and Exchange Commission (the “SEC”) granted an exemptive order that permits certain eligible funds in the AMG Funds Family to lend and borrow money for certain temporary purposes directly to and from other eligible funds in the AMG Funds Family. Participation in this interfund lending program is voluntary for both the borrowing and lending funds, and an interfund loan is only made if it benefits each participating fund. The Administrator manages the program according to procedures approved by the Boards, and the Boards monitor the operation of the program. An interfund loan must comply with certain conditions set out in the exemptive order, which are designed to assure fairness and protect all participating funds. The interest earned and interest paid on interfund loans are included on the Statement of Operations as interest income and interest expense, respectively. At December 31, 2022, the Funds had no interfund loans outstanding.
The following Funds utilized the interfund loan program during the fiscal year ended December 31, 2022 as follows:
| | | | | | | | | | | | | | | | |
| Fund | | Average
Lent | | | Number
of Days | | | Interest
Earned | | | Average Interest Rate | |
| | | | |
ESG Bond | | | $4,329,671 | | | | 4 | | | | $1,148 | | | | 2.419 | % |
| | | | |
Enhanced Core Bond ESG | | | 486,039 | | | | 14 | | | | 389 | | | | 2.089 | % |
| | | | |
High Income | | | 489,086 | | | | 7 | | | | 370 | | | | 3.945 | % |
| | | | |
Municipal Bond | | | 8,854,595 | | | | 18 | | | | 9,801 | | | | 2.245 | % |
| | | | |
Municipal Enhanced | | | 3,158,274 | | | | 12 | | | | 1,532 | | | | 1.475 | % |
| | | | |
| Fund | | Average
Borrowed | | | Number of Days | | | Interest
Paid | | | Average
Interest Rate | |
| | | | |
Enhanced Core Bond ESG | | | $3,368,341 | | | | 8 | | | | $1,340 | | | | 1.815 | % |
| | | | |
High Income | | | 4,673,444 | | | | 5 | | | | 3,009 | | | | 4.700 | % |
| | | | |
Municipal Bond | | | 2,734,196 | | | | 1 | | | | 352 | | | | 4.700 | % |
| | | | |
Municipal Enhanced | | | 1,149,132 | | | | 1 | | | | 164 | | | | 5.210 | % |
3. PURCHASES AND SALES OF SECURITIES
Purchases and sales of securities (excluding short-term securities and U.S. Government Obligations) for the fiscal year ended December 31, 2022, were as follows:
| | | | | | | | |
| | | Long Term Securities | |
| | |
| Fund | | Purchases | | | Sales | |
| | |
ESG Bond | | | $65,298,623 | | | | $153,695,147 | |
| | |
Enhanced Core Bond ESG | | | 12,514,020 | | | | 18,382,332 | |
| | |
High Income | | | 13,256,982 | | | | 14,699,126 | |
| | |
Municipal Bond | | | 233,624,424 | | | | 311,059,127 | |
| | |
Municipal Enhanced | | | 130,975,152 | | | | 184,265,445 | |
71
| | |
| | | Notes to Financial Statements (continued) |
| | | |
| | | |
Purchases and sales of U.S. Government Obligations for the fiscal year ended December 31, 2022 were as follows:
| | | | | | |
| | | U.S. Government Obligations |
| | |
| Fund | | Purchases | | | Sales |
| | |
ESG Bond | | | $65,991,278 | | | $120,991,689 |
| | |
Enhanced Core Bond ESG | | | 13,127,041 | | | 16,165,260 |
4. PORTFOLIO SECURITIES LOANED
The Funds participate in the Program providing for the lending of securities to qualified borrowers. Securities lending income includes earnings of such temporary cash investments, plus or minus any rebate to a borrower. These earnings (after any rebate) are then divided between BNYM, as a fee for its services under the Program, and the Funds, according to agreed-upon rates. Collateral on all securities loaned is accepted in cash, U.S. Treasury Obligations or U.S. Government Agency Obligations. Collateral is maintained at a minimum level of 102% (105% in the case of certain foreign securities) of the market value, plus interest, if applicable, of investments on loan. It is the Funds’ policy to obtain additional collateral from or return excess collateral to the borrower by the end of the next business day, following the valuation date of the securities loaned. Therefore, the value of the collateral held may be temporarily less than the value of the securities on loan. Lending securities entails a risk of loss to the Funds if and to the extent that the market value of the securities loaned were to increase and the borrower did not increase the collateral accordingly, and the borrower fails to return the securities. Under the terms of the Program, the Funds are indemnified for such losses by BNYM. Cash collateral is held in separate omnibus accounts managed by BNYM, who is authorized to exclusively enter into joint repurchase agreements for that cash collateral. Securities collateral is held in separate omnibus accounts managed by BNYM and cannot be sold or pledged. BNYM bears the risk of any deficiency in the amount of the cash collateral available for return to the borrower due to any loss on the collateral invested. Loans of securities are terminable at any time and the borrower, after notice, is required to return borrowed securities as soon as practical, which is normally within three business days.
The value of securities loaned on positions held, cash collateral and securities collateral received at December 31, 2022, were as follows:
| | | | | | | | | | | | | | | | |
| Fund | | Securities
Loaned | | | Cash
Collateral
Received | | | Securities
Collateral
Received | | | Total
Collateral
Received | |
| | | | |
ESG Bond | | | $25,458,950 | | | | $7,412,408 | | | | $19,038,641 | | | | $26,451,049 | |
| | | | |
Enhanced Core Bond ESG | | | 2,393,361 | | | | 1,242,815 | | | | 1,247,494 | | | | 2,490,309 | |
| | | | |
High Income | | | 1,415,713 | | | | 1,253,247 | | | | 226,879 | | | | 1,480,126 | |
The following table summarizes the securities received as collateral for securities lending at December 31, 2022:
| | | | | | |
| Fund | | Collateral Type | | Coupon
Range | | Maturity Date Range |
| | | |
ESG Bond | | U.S. Treasury Obligations | | 0.125%-4.750% | | 04/15/23-11/15/51 |
| | | |
Enhanced Core Bond ESG | | U.S. Treasury Obligations | | 0.125%-4.750% | | 01/31/24-11/15/51 |
| | | |
High Income | | U.S. Treasury Obligations | | 0.125%-3.875% | | 04/15/23-11/15/50 |
5. FOREIGN SECURITIES
Certain Funds invest in securities of foreign entities and in instruments denominated in foreign currencies which involve risks not typically associated with investments in domestic securities. Non-domestic securities carry special risks, such as exposure to currency fluctuations, less developed or less efficient trading markets, political instability, a lack of company information, differing auditing and legal standards, and, potentially, less liquidity. Realized gains in certain countries may be subject to foreign taxes at the Fund level and the Fund would pay such foreign taxes at the appropriate rate for each jurisdiction.
6. COMMITMENTS AND CONTINGENCIES
Under the Trusts’ organizational documents, its Trustees and Officers are indemnified against certain liabilities arising out of the performance of their duties to the Trusts. In addition, in the normal course of business, the Funds may enter into contracts and agreements that contain a variety of representations and warranties, which provide general indemnifications. The maximum exposure to the Funds under these arrangements is unknown, as this would involve future claims that may be made against a Fund that have not yet occurred. However, based on experience, the Funds had no prior claims or losses and expect the risks of loss to be remote.
7. RISKS ASSOCIATED WITH HIGH YIELD SECURITIES
Investing in high yield securities involves greater risks and considerations not typically associated with U.S. Government and other high quality/investment grade securities. High yield securities are generally below investment grade securities and do not have an established retail secondary market. Economic downturns may disrupt the high yield market and impair the issuer’s ability to repay principal and interest. Also, an increase in interest rates would likely have an adverse impact on the value of such obligations and could cause the securities to become less liquid.
8. MASTER NETTING AGREEMENTS
The Funds may enter into master netting agreements with their counterparties for the Program and Repurchase Agreements, which provide the right, in the event of default (including bankruptcy or insolvency) for the non-defaulting party to liquidate the collateral and calculate net exposure to the defaulting party or request additional collateral. For financial reporting purposes, the Funds do not offset financial assets and financial liabilities that are subject to master netting agreements in the Statement of Assets and Liabilities. For securities lending transactions, see Note 4.
72
| | |
| | | Notes to Financial Statements (continued) |
| | | |
| | | |
The following table is a summary of the Funds’ open Repurchase Agreements that are subject to a master netting agreement as of December 31, 2022:
| | | | | | | | | | | | | | | | | | | | | | | | | |
| | | | | Gross Amount Not Offset in the | | | | |
| | | | | Statement of Assets and Liabilities | | | | |
| Fund | | Gross Amounts of
Assets Presented in
the Statement of
Assets and Liabilities | | Offset Amount | | Net Asset Balance | | Collateral
Received | | Net
Amount |
| | | | | |
ESG Bond | | | | | | | | | | | | | | | | | | | | | | | | | |
| | | | | |
Bank of America Securities, Inc. | | | | $1,760,647 | | | | | — | | | | | $1,760,647 | | | | | $1,760,647 | | | | | — | |
| | | | | |
Citigroup Global Markets, Inc. | | | | 369,820 | | | | | — | | | | | 369,820 | | | | | 369,820 | | | | | — | |
| | | | | |
MUFG Securities America, Inc. | | | | 1,760,647 | | | | | — | | | | | 1,760,647 | | | | | 1,760,647 | | | | | — | |
| | | | | |
National Bank Financial | | | | 1,760,647 | | | | | — | | | | | 1,760,647 | | | | | 1,760,647 | | | | | — | |
| | | | | |
RBC Dominion Securities, Inc. | | | | 1,760,647 | | | | | — | | | | | 1,760,647 | | | | | 1,760,647 | | | | | — | |
| | | | | |
Fixed Income Clearing Corp. | | | | 3,070,000 | | | | | — | | | | | 3,070,000 | | | | | 3,070,000 | | | | | — | |
| | | | | |
| | | | | | | | | | | | | | | | | | | | | | | | | |
| | | | | |
Total | | | | $10,482,408 | | | | | — | | | | | $10,482,408 | | | | | $10,482,408 | | | | | — | |
| | | | | |
| | | | | | | | | | | | | | | | | | | | | | | | | |
| | | | | | | | | | | | | | | | | | | | | | | | | |
| | | | | |
Enhanced Core Bond ESG | | | | | | | | | | | | | | | | | | | | | | | | | |
| | | | | |
Citigroup Global Markets, Inc. | | | | $242,815 | | | | | — | | | | | $242,815 | | | | | $242,815 | | | | | — | |
| | | | | |
National Bank Financial | | | | 1,000,000 | | | | | — | | | | | 1,000,000 | | | | | 1,000,000 | | | | | — | |
| | | | | |
Fixed Income Clearing Corp. | | | | 230,000 | | | | | — | | | | | 230,000 | | | | | 230,000 | | | | | — | |
| | | | | |
| | | | | | | | | | | | | | | | | | | | | | | | | |
| | | | | |
Total | | | | $1,472,815 | | | | | — | | | | | $1,472,815 | | | | | $1,472,815 | | | | | — | |
| | | | | |
| | | | | | | | | | | | | | | | | | | | | | | | | |
| | | | | | | | | | | | | | | | | | | | | | | | | |
| | | | | |
High Income | | | | | | | | | | | | | | | | | | | | | | | | | |
| | | | | |
Citigroup Global Markets, Inc. | | | | $253,247 | | | | | — | | | | | $253,247 | | | | | $253,247 | | | | | — | |
| | | | | |
National Bank Financial | | | | 1,000,000 | | | | | — | | | | | 1,000,000 | | | | | 1,000,000 | | | | | — | |
| | | | | |
Fixed Income Clearing Corp. | | | | 248,000 | | | | | — | | | | | 248,000 | | | | | 248,000 | | | | | — | |
| | | | | |
| | | | | | | | | | | | | | | | | | | | | | | | | |
| | | | | |
Total | | | | $1,501,247 | | | | | — | | | | | $1,501,247 | | | | | $1,501,247 | | | | | — | |
| | | | | |
| | | | | | | | | | | | | | | | | | | | | | | | | |
| | | | | | | | | | | | | | | | | | | | | | | | | |
| | | | | |
Municipal Bond | | | | | | | | | | | | | | | | | | | | | | | | | |
| | | | | |
Fixed Income Clearing Corp. | | | | $ 668,000 | | | | | — | | | | | $668,000 | | | | | $668,000 | | | | | — | |
| | | | | |
Municipal Enhanced | | | | | | | | | | | | | | | | | | | | | | | | | |
| | | | | |
Fixed Income Clearing Corp. | | | | $ 926,000 | | | | | — | | | | | $926,000 | | | | | $926,000 | | | | | — | |
9. SUBSEQUENT EVENTS
The Funds have determined that no material events or transactions occurred through the issuance date of the Funds’ financial statements which require an additional disclosure in or adjustment of the Funds’ financial statements.
73
| | |
| | | Report of Independent Registered Public Accounting Firm |
| | | |
| | | |
To the Board of Trustees of AMG Funds, AMG Funds II, and AMG Funds III and Shareholders of AMG GW&K Municipal Bond Fund, AMG GW&K Municipal Enhanced Yield Fund, AMG GW&K Enhanced Core Bond ESG Fund, AMG GW&K ESG Bond Fund, and AMG GW&K High Income Fund
Opinions on the Financial Statements
We have audited the accompanying statements of assets and liabilities, including the schedules of portfolio investments, of AMG GW&K Municipal Bond Fund, AMG GW&K Municipal Enhanced Yield Fund (two of the funds constituting AMG Funds), AMG GW&K Enhanced Core Bond ESG Fund (one of the funds constituting AMG Funds II), AMG GW&K ESG Bond Fund, and AMG GW&K High Income Fund (two of the funds constituting AMG Funds III) (hereafter collectively referred to as the “Funds”) as of December 31, 2022, the related statements of operations for the year ended December 31, 2022, the statements of changes in net assets for each of the two years in the period ended December 31, 2022, including the related notes, and the financial highlights for each of the periods indicated therein (collectively referred to as the “financial statements”). In our opinion, the financial statements present fairly, in all material respects, the financial position of each of the Funds as of December 31, 2022, the results of each of their operations for the year then ended, the changes in each of their net assets for each of the two years in the period ended December 31, 2022 and each of the financial highlights for each of the periods indicated therein in conformity with accounting principles generally accepted in the United States of America.
Basis for Opinions
These financial statements are the responsibility of the Funds’ management. Our responsibility is to express an opinion on the Funds’ financial statements based on our audits. We are a public accounting firm registered with the Public Company Accounting Oversight Board (United States) (PCAOB) and are required to be independent with respect to the Funds in accordance with the U.S. federal securities laws and the applicable rules and regulations of the Securities and Exchange Commission and the PCAOB.
We conducted our audits of these financial statements in accordance with the standards of the PCAOB. Those standards require that we plan and perform the audit to obtain reasonable assurance about whether the financial statements are free of material misstatement, whether due to error or fraud.
Our audits included performing procedures to assess the risks of material misstatement of the financial statements, whether due to error or fraud, and performing procedures that respond to those risks. Such procedures included examining, on a test basis, evidence regarding the amounts and disclosures in the financial statements. Our audits also included evaluating the accounting principles used and significant estimates made by management, as well as evaluating the overall presentation of the financial statements. Our procedures included confirmation of securities owned as of December 31, 2022 by correspondence with the custodian and brokers; when replies were not received from brokers, we performed other auditing procedures. We believe that our audits provide a reasonable basis for our opinions.
/s/ PricewaterhouseCoopers LLP
Boston, Massachusetts
February 24, 2023
We have served as the auditor of one or more investment companies in the AMG Funds Family since 1993.
74
| | |
| | | Other Information (unaudited) |
| | | |
| | | |
TAX INFORMATION
AMG GW&K ESG Bond Fund, AMG GW&K Enhanced Core Bond ESG Fund, AMG GW&K High Income Fund, AMG GW&K Municipal Bond Fund, and AMG GW&K Municipal Enhanced Yield Fund each hereby designates the maximum amount allowable of its net taxable income as qualified dividends as provided in the Jobs and Growth Tax Relief Reconciliation Act of 2003. The 2022 Form 1099-DIV you receive for each Fund will show the tax status of all distributions paid to you during the year.
Pursuant to section 852 of the Internal Revenue Code, AMG GW&K ESG Bond Fund, AMG GW&K Enhanced Core Bond ESG Fund, AMG GW&K High Income Fund, AMG GW&K Municipal Bond Fund, and AMG GW&K Municipal Enhanced Yield Fund each hereby designates $966,729, $0, $2,954, $1,733,844, and $814,678, respectively, as a capital gain distribution with respect to the taxable year ended December 31, 2022, or if subsequently determined to be different, the net capital gains of such fiscal year.
75
| | |
| | | AMG Funds Trustees and Officers |
| | | |
| | | |
| | | | | | |
| The Trustees and Officers of the Trust, their business addresses, principal occupations for the past five years and ages are listed below. The Trustees provide broad supervision over the affairs of the Trust and the Funds. The Trustees are experienced executives who meet periodically throughout the year to oversee the Funds’ activities, review contractual arrangements with companies that provide services to the Funds, and | | | | review the Funds’ performance. Unless otherwise noted, the address of each Trustee or Officer is the address of the Trust: 680 Washington Blvd., Suite 500, Stamford, CT. 06901. There is no stated term of office for Trustees. Trustees serve until their resignation, retirement or removal in | | accordance with the Trust’s organizational documents and policies adopted by the Board from time to time. The Chairman of the Trustees, President, Treasurer and Secretary of the Trust are elected by the Trustees annually. Other officers hold office at the pleasure of the Trustees. |
Independent Trustees
The following Trustees are not “interested persons” of the Trust within the meaning of the 1940 Act:
| | |
Number of Funds Overseen in Fund Complex | | Name, Age, Principal Occupation(s) During Past 5 Years and Other Directorships Held by Trustee |
| | |
• Trustee since 2012- AMG Funds • Trustee since 2012- AMG Funds II • Trustee since 2012- AMG Funds III • Oversees 40 Funds in Fund Complex | | Bruce B. Bingham, 74 Partner, Hamilton Partners (real estate development firm) (1987-Present); Director of The Yacktman Funds, Inc. (2 portfolios) (2000-2012). |
| | |
• Chairman of the Audit Committee since 2021 • Trustee since 2013- AMG Funds • Trustee since 2013- AMG Funds II • Trustee since 2013- AMG Funds III • Oversees 44 Funds in Fund Complex | | Kurt A. Keilhacker, 59 Managing Partner, TechFund Europe (2000-Present); Managing Partner, TechFund Capital (1997-Present); Managing Partner, Elementum Ventures (2013-Present); Director, MetricStory, Inc. (2017-Present); Trustee, Wheaton College (2018-Present); Trustee, Gordon College (2001-2016); Board Member, 6wind SA (2002-2019). |
| | |
• Trustee since 2004- AMG Funds • Trustee since 2000- AMG Funds II • Trustee since 1993- AMG Funds III • Oversees 40 Funds in Fund Complex | | Steven J. Paggioli, 72 Independent Consultant (2002-Present); Trustee, Professionally Managed Portfolios (28 portfolios); Advisory Board Member, Sustainable Growth Advisors, LP; Independent Director, Muzinich BDC, Inc. (business development company) (2019-Present); Director, The Wadsworth Group; Independent Director, Chase Investment Counsel (2008–2019); Executive Vice President, Secretary and Director, Investment Company Administration, LLC and First Fund Distributors, INC. (1990-2001). |
| | |
• Independent Chairman of the Board of Trustees since 2017 • Chairman of the Governance Committee since 2017 • Trustee since 1999- AMG Funds • Trustee since 2000- AMG Funds II • Trustee since 1999- AMG Funds III • Oversees 44 Funds in Fund Complex | | Eric Rakowski, 64 Professor of Law, University of California at Berkeley School of Law (1990-Present); Tax Attorney at Davis Polk & Wardwell and clerked for Judge Harry T. Edwards of the U.S. Court of Appeals for the District of Columbia Circuit and for Justice William J. Brennan Jr. of the U.S. Supreme Court; Trustee of Parnassus Funds (3 portfolios) (2021-Present); Trustee of Parnassus Income Funds (2 portfolios) (2021-Present); Director of Harding, Loevner Funds, Inc. (10 portfolios); Trustee of Third Avenue Trust (3 portfolios) (2002-2019); Trustee of Third Avenue Variable Trust (1 portfolio) (2002-2019). |
| | |
• Trustee since 2013- AMG Funds • Trustee since 2013- AMG Funds II • Trustee since 2013- AMG Funds III • Oversees 44 Funds in Fund Complex | | Victoria L. Sassine, 57 Adjunct Professor, Babson College (2007–Present); Director, Board of Directors, PRG Group (2017-Present); CEO, Founder, Scale Smarter Partners, LLC (2018-Present); Adviser, EVOFEM Biosciences (2019-Present); Chairperson of the Board of Directors, Business Management Associates (2018-2019). |
76
| | |
| | | AMG Funds Trustees and Officers (continued) |
| | | |
| | | |
| | |
Number of Funds Overseen in Fund Complex | | Name, Age, Principal Occupation(s) During Past 5 Years and Other Directorships Held by Trustee |
| | |
• Trustee since 2000-AMG Funds II • Trustee since 2004-AMG Funds • Trustee since 1987-AMG Funds III • Oversees 40 Funds in Fund | | Thomas R. Schneeweis, 75* Professor Emeritus, University of Massachusetts (2013-Present); President, TRS Associates (1982-Present); Board Member, Chartered Alternative Investment Association (“CAIA”) (2002-Present); Co-Founder and Director, Institute for Global Asset and Risk Management (Education) (2010-Present); Co-Owner, Quantitative Investment Technologies (2014-Present); Co-Owner, Yes Wealth Management (2018-Present); Director, CAIA Foundation (2010-2019); Partner, S Capital Wealth Advisors (2015-2018); Partner, S Capital Management, LLC (2007-2015); President, Alternative Investment Analytics, LLC (formerly Schneeweis Partners, LLC) (2001-2013). Complex |
*Mr. Schneeweis retired from the Board of Trustees of AMG Funds, AMG Funds II and AMG Funds III as of December 31, 2022.
Interested Trustee
The Trustee in the following table is an “interested person” of the Trust within the meaning of the 1940 Act.
| | |
Number of Funds Overseen in Fund
Complex | | Name, Age, Principal Occupation(s) During Past 5 Years and Other Directorships Held by Trustee |
| | |
• Trustee since 2021 • Oversees 44 Funds in Fund Complex | | Garret W. Weston, 41 Affiliated Managers Group, Inc. (2008-Present): Managing Director, Co-Head of Affiliate Engagement (2021-Present), Senior Vice President, Affiliate Development (2016-2021), Vice President, Office of the CEO (2015-2016), Vice President, New Investments (2012-2015), Senior Associate, New Investments (2008-2012); Associate, Madison Dearborn Partners (2006-2008); Analyst, Merrill Lynch (2004-2006). |
Officers
| | |
Position(s) Held with Fund and Length of Time Served | | Name, Age, Principal Occupation(s) During Past 5 Years |
| | |
• President since 2018 • Principal Executive Officer since 2018 • Chief Executive Officer since 2018 • Chief Operating Officer since 2007 | | Keitha L. Kinne, 64 Chief Operating Officer, AMG Funds LLC (2007-Present); Chief Investment Officer, AMG Funds LLC (2008-Present); President and Principal, AMG Distributors, Inc. (2018-Present); Chief Operating Officer, AMG Distributors, Inc. (2007-Present); President, Chief Executive Officer and Principal Executive Officer, AMG Funds, AMG Funds I, AMG Funds II, AMG Funds III and AMG Funds IV (2018-Present); Chief Operating Officer, AMG Funds, AMG Funds I, AMG Funds II, and AMG Funds III (2007-Present); Chief Operating Officer, AMG Funds IV (2016-Present); Chief Operating Officer and Chief Investment Officer, Aston Asset Management, LLC (2016); President and Principal Executive Officer, AMG Funds, AMG Funds I, AMG Funds II and AMG Funds III (2012-2014); Managing Partner, AMG Funds LLC (2007-2014); President and Principal, AMG Distributors, Inc. (2012-2014); Managing Director, Legg Mason & Co., LLC (2006-2007); Managing Director, Citigroup Asset Management (2004-2006). |
| | |
• Secretary since 2015 • Chief Legal Officer since 2015 | | Mark J. Duggan, 57 Managing Director and Senior Counsel, AMG Funds LLC (2021-Present); Senior Vice President and Senior Counsel, AMG Funds LLC (2015-2021); Secretary and Chief Legal Officer, AMG Funds, AMG Funds I, AMG Funds II, AMG Funds III and AMG Funds IV (2015-Present); Attorney, K&L Gates, LLP (2009-2015). |
| | |
• Chief Financial Officer since 2017 • Treasurer since 2017 • Principal Financial Officer since 2017 • Principal Accounting Officer since 2017 | | Thomas G. Disbrow, 56 Vice President, Mutual Fund Treasurer & CFO, AMG Funds, AMG Funds LLC (2017-Present); Chief Financial Officer, Principal Financial Officer, Treasurer and Principal Accounting Officer, AMG Funds, AMG Funds I, AMG Funds II, AMG Funds III and AMG Funds IV (2017-Present); Managing Director - Global Head of Traditional Funds Product Control, UBS Asset Management (Americas), Inc. (2015-2017); Managing Director - Head of North American Funds Treasury, UBS Asset Management (Americas), Inc. (2011-2015). |
| | |
• Deputy Treasurer since 2017 | | John A. Starace, 52 Vice President, Mutual Fund Accounting, AMG Funds LLC (2021-Present); Director, Mutual Fund Accounting, AMG Funds LLC (2017-2021); Vice President, Deputy Treasurer of Mutual Funds Services, AMG Funds LLC (2014-2017); Deputy Treasurer, AMG Funds, AMG Funds I, AMG Funds II, AMG Funds III and AMG Funds IV (2017-Present); Vice President, Citi Hedge Fund Services (2010-2014); Audit Senior Manager (2005-2010) and Audit Manager (2001-2005), Deloitte & Touche LLP. |
| | |
• Chief Compliance Officer and Sarbanes-Oxley Code of Ethics Compliance Officer since 2019 • Anti-Money Laundering Compliance Officer since 2022 | | Patrick J. Spellman, 48 Vice President, Chief Compliance Officer, AMG Funds LLC (2017-Present); Chief Compliance Officer, AMG Distributors, Inc. (2010-Present); Chief Compliance Officer and Sarbanes-Oxley Code of Ethics Compliance Officer, AMG Funds, AMG Funds I, AMG Funds II, AMG Funds III and AMG Funds IV (2019-Present); Anti-Money Laundering Compliance Officer, AMG Funds, AMG Funds I, AMG Funds II, and AMG Funds III (2014-2019; 2022-Present); Anti-Money Laundering Compliance Officer, AMG Funds IV (2016-2019; 2022-Present); Senior Vice President, Chief Compliance Officer, AMG Funds LLC (2011-2017); Compliance Manager, Legal and Compliance, Affiliated Managers Group, Inc. (2005-2011). |
77
| | |
| | | AMG Funds Trustees and Officers (continued) |
| | | |
| | | |
| | |
| Position(s) Held with Fund and Length of Time Served | | Name, Age, Principal Occupation(s) During Past 5 Years |
| | |
• Assistant Secretary since 2016 | | Maureen M. Kerrigan, 37 Vice President, Senior Counsel, AMG Funds LLC (2021-Present); Vice President, Counsel, AMG Funds LLC (2019-2021); Director, Counsel, AMG Funds LLC (2017-2018); Vice President, Counsel, AMG Funds LLC (2015-2017); Assistant Secretary, AMG Funds, AMG Funds I, AMG Funds II, AMG Funds III and AMG Funds IV (2016-Present); Associate, Ropes & Gray LLP (2011-2015); Law Fellow, Massachusetts Appleseed Center for Law and Justice (2010-2011). |
78
|
|
| | | | | | | | |
INVESTMENT MANAGER AND ADMINISTRATOR AMG Funds LLC 680 Washington Blvd., Suite 500 Stamford, CT 06901 800.548.4539 DISTRIBUTOR AMG Distributors, Inc. 680 Washington Blvd., Suite 500 Stamford, CT 06901 800.548.4539 SUBADVISER GW&K Investment Management, LLC 222 Berkeley St. Boston, MA 02116 CUSTODIAN The Bank of New York Mellon Mutual Funds Custody 6023 Airport Road Oriskany, NY 13424 | | | | LEGAL COUNSEL Ropes & Gray LLP Prudential Tower, 800 Boylston Street Boston, MA 02199-3600 TRANSFER AGENT BNY Mellon Investment Servicing (US) Inc. Attn: AMG Funds 4400 Computer Drive Westborough, MA 01581 800.548.4539 Effective March 9, 2023, the Transfer Agent’s mailing address will change to the following: BNY Mellon Investment Servicing (US) Inc. AMG Funds Attn: 534426 AIM 154-0520 500 Ross Street Pittsburgh, PA 15262 800.548.4539 | | | | This report is prepared for the Funds’ shareholders. It is authorized for distribution to prospective investors only when preceded or accompanied by an effective prospectus. To receive a free copy of the prospectus or Statement of Additional Information, which includes additional information about Fund Trustees, please contact us by calling 800.548.4539. Distributed by AMG Distributors, Inc., member FINRA/SIPC. Current net asset values per share for each Fund are available on the Funds’ website at amgfunds.com. A description of the policies and procedures each Fund uses to vote its proxies is available: (i) without charge, upon request, by calling 800.548.4539, or (ii) on the Securities and Exchange Commission’s (SEC) website at sec.gov. For information regarding each Fund’s proxy voting record for the 12-month period ended June 30, call 800.548.4539 or visit the SEC website at sec.gov. The Funds file their complete schedule of portfolio holdings with the SEC for the first and third quarters of each fiscal year as an exhibit to their reports on Form N-PORT. The Funds’ portfolio holdings on Form N-PORT are available on the SEC’s website at sec.gov and the Funds’ website at amgfunds.com. To review a complete list of the Funds’ portfolio holdings, or to view the most recent semiannual report or annual report, please visit amgfunds.com. |
| | | | | | | | | |
| | | | | | | | |
BALANCED FUNDS AMG GW&K Global Allocation GW&K Investment Management, LLC EQUITY FUNDS AMG Beutel Goodman International Equity Beutel, Goodman & Company Ltd. AMG Boston Common Global Impact Boston Common Asset Management, LLC AMG Frontier Small Cap Growth Frontier Capital Management Co., LLC AMG GW&K Small Cap Core AMG GW&K Small Cap Value AMG GW&K Small/Mid Cap AMG GW&K Small/Mid Cap Growth AMG GW&K Emerging Markets Equity AMG GW&K Emerging Wealth Equity AMG GW&K International Small Cap GW&K Investment Management, LLC AMG Montrusco Bolton Large Cap Growth Montrusco Bolton Investments, Inc. AMG Renaissance Large Cap Growth The Renaissance Group LLC | | | | AMG River Road Dividend All Cap Value AMG River Road Focused Absolute Value AMG River Road International Value Equity AMG River Road Large Cap Value Select AMG River Road Mid Cap Value AMG River Road Small-Mid Cap Value AMG River Road Small Cap Value River Road Asset Management, LLC AMG TimesSquare Emerging Markets Small Cap AMG TimesSquare Global Small Cap AMG TimesSquare International Small Cap AMG TimesSquare Mid Cap Growth AMG TimesSquare Small Cap Growth TimesSquare Capital Management, LLC AMG Veritas Asia Pacific AMG Veritas China AMG Veritas Global Focus AMG Veritas Global Real Return Veritas Asset Management LLP AMG Yacktman AMG Yacktman Focused AMG Yacktman Global AMG Yacktman Special Opportunities Yacktman Asset Management LP | | | | FIXED INCOME FUNDS AMG Beutel Goodman Core Plus Bond Beutel, Goodman & Company Ltd. AMG GW&K Core Bond ESG AMG GW&K Enhanced Core Bond ESG AMG GW&K ESG Bond AMG GW&K High Income AMG GW&K Municipal Bond AMG GW&K Municipal Enhanced Yield GW&K Investment Management, LLC |
| | | | | | | | | |
| | | | | | | | | |
| | | | | | | | | |
| | | | | | | | | |
| | | | | | | | | |
| | | | | | | | | |
| | | | | | | | | |
| | | | | | | | | |
| | | | | | | | | |
| | | | |
| amgfunds.com | | | | 123122 AR088 |
| | |
| | ANNUAL REPORT |
| | |
| | | AMG Funds December 31, 2022 |
| | |
| | | 
|
| | |
| | | AMG Renaissance Large Cap Growth Fund |
| | |
| | | Class N: MRLTX | Class I: MRLSX | Class Z: MRLIX |
| | |
| | | |
| | |
| | | |
| | | | |
| amgfunds.com | | | | 123122 AR024 |
| | |
| | | AMG Funds Annual Report — December 31, 2022 |
| | | | | | |
| | | |
| | | | | | |
| | | TABLE OF CONTENTS | | PAGE | |
| | | |
| | | LETTER TO SHAREHOLDERS | | | 2 | |
| | | |
| | | ABOUT YOUR FUND’S EXPENSES | | | 3 | |
| | | |
| | | PORTFOLIO MANAGER’S COMMENTS, FUND SNAPSHOTS AND SCHEDULE OF PORTFOLIO INVESTMENTS | | | 4 | |
| | | |
| | | FINANCIAL STATEMENTS | | | | |
| | | |
| | | Statement of Assets and Liabilities | | | 9 | |
| | | |
| | | Balance sheet, net asset value (NAV) per share computations
and cumulative distributable earnings (loss) | | | | |
| | | |
| | | Statement of Operations | | | 11 | |
| | | |
| | | Detail of sources of income, expenses, and realized and
unrealized gains (losses) during the fiscal year | | | | |
| | | |
| | | Statements of Changes in Net Assets | | | 12 | |
| | | |
| | | Detail of changes in assets for the past two fiscal years | | | | |
| | | |
| | | Financial Highlights | | | 13 | |
| | | |
| | | Historical net asset values per share, distributions, total returns, income
and expense ratios, turnover ratios and net assets | | | | |
| | | |
| | | Notes to Financial Statements | | | 16 | |
| | | |
| | | Accounting and distribution policies, details of agreements and
transactions with Fund management and affiliates, and descriptions of
certain investment risks | | | | |
| | | |
| | | REPORT OF INDEPENDENT REGISTERED PUBLIC ACCOUNTING FIRM | | | 21 | |
| | | |
| | | OTHER INFORMATION | | | 22 | |
| | | |
| | | TRUSTEES AND OFFICERS | | | 23 | |
Nothing contained herein is to be considered an offer, sale or solicitation of an offer to buy shares of any series of the AMG Funds Family of Funds. Such offering is made only by prospectus, which includes details as to offering price and other material information.
| | |
| | Letter to Shareholders |
Dear Shareholder:
We are pleased to provide this annual report for your investment with AMG Funds. Our foremost goal is to provide investment solutions that help our shareholders successfully achieve their long-term investment goals. We appreciate the privilege of providing you with investment tools.
The past year was a challenging period for investors, as uncertainties about high inflation, tighter financial conditions, and the Russian invasion of Ukraine led to significant volatility. Global equity and bond markets fell in tandem amid sharply higher interest rates and eroding investor confidence as worries of an impending recession lingered most of the year. A global commodity shock caused by the war in Ukraine only made matters worse. The S&P 500® Index slipped into a bear market with the Index falling more than (24)% from its peak earlier in the year. The abrupt shift in markets this year has reset expectations around future growth, as the U.S. Federal Reserve (the Fed) and other global central banks have taken aggressive policy action to bring down inflation. While the outlook is uncertain given recent negative returns across many asset classes, global stock and bond valuations are now far more attractive entering 2023 compared to a year ago.
There was very wide dispersion in S&P 500® Index sector performance. Energy significantly outperformed all other sectors with a gain of 65.72% as the price of oil surged during the period. The defensive-oriented sectors also outperformed, although utilities was the only other sector with a positive return, gaining 1.54%. Consumer staples and health care were slightly negative with returns of (0.62)% and (1.95)%, respectively. High-growth technology and mega cap internet-related companies underperformed during the period, and real estate was impacted by higher interest rates. Communications services fell the most with a (39.93)% return during the year, followed by declines of (37.03)% for consumer discretionary, (28.14)% for information technology and (26.13)% for real estate. Value stocks held up much better than growth stocks as the Russell 1000® Value Index returned (7.54)% compared to the (29.14)% return for the Russell 1000® Growth Index. Small cap stocks struggled as the Russell 2000® Index lost (20.44)%. Outside the U.S., foreign developed markets were negative with a (14.45)% return for the MSCI EAFE Index, however a very strong fourth quarter rally drove international equity returns ahead of their U.S. counterparts for the year.
The 10-year Treasury yield more than doubled during the year, surging to the highest levels since before the Great Financial Crisis. Rapidly rising rates from a very low base led to historic negative performance for bonds as the Bloomberg U.S. Aggregate Bond Index, a broad measure of U.S. bond market performance, lost (13.01)% over the period. Investment-grade corporate bonds underperformed, returning (15.76)% for the year. High yield bonds held up better with a (11.19)% return as measured by the return of the Bloomberg U.S. Corporate High Yield Bond
Index. Municipal bonds were also negative, but outperformed the broader market with a (8.53)% return for the Bloomberg Municipal Bond Index.
AMG Funds provides access to a distinctive array of actively managed return-oriented investment strategies. You can rest assured that under all market conditions our team is focused on delivering excellent investment management services for your benefit. For more information about AMG Funds’ wide range of products and resources, please visit www.amgfunds.com. We thank you for your investment and continued trust in AMG Funds.
Respectfully,
Keitha Kinne
President
AMG Funds
| | | | | | | | | | | | | | |
| | | | | Periods ended | |
| Average Annual Total Returns | | December 31, 2022* | |
| | | | |
| Stocks: | | | | 1 Year | | | 3 Years | | | 5 Years | |
| | | | |
Large Cap | | (S&P 500® Index) | | | (18.11 | )% | | | 7.66 | % | | | 9.42 | % |
| | | | |
Small Cap | | (Russell 2000® Index) | | | (20.44 | )% | | | 3.10 | % | | | 4.13 | % |
| | | | |
International | | (MSCI ACWI ex USA) | | | (16.00 | )% | | | 0.07 | % | | | 0.88 | % |
| | | | |
Bonds: | | | | | | | | | | | | | | |
| | | | |
Investment Grade | | (Bloomberg U.S. Aggregate Bond Index) | | | (13.01 | )% | | | (2.71 | )% | | | 0.02 | % |
| | | | |
High Yield | | (Bloomberg U.S. Corporate High Yield Bond Index) | | | (11.19 | )% | | | 0.05 | % | | | 2.31 | % |
| | | | |
Tax-exempt | | (Bloomberg Municipal Bond Index) | | | (8.53 | )% | | | (0.77 | )% | | | 1.25 | % |
| | | | |
Treasury Bills | | (ICE BofAML U.S. 6-Month Treasury Bill Index) | | | 1.34 | % | | | 0.82 | % | | | 1.39 | % |
*Source: FactSet. Past performance is no guarantee of future results.
2
| | |
| | | About Your Fund’s Expenses |
| | | |
| | | |
| | | | | | | | |
As a shareholder of a Fund, you may incur two types of costs: (1) transaction costs, which may include sales charges (loads) on purchase payments; redemption fees; and exchange fees; and (2) ongoing costs, including management fees; distribution (12b-1) fees; and other Fund expenses. This example is intended to help you understand your ongoing costs (in dollars) of investing in the Fund and to compare these costs with the ongoing costs of investing in other mutual funds. The example is based on $1,000 invested at the beginning of the period and held for the entire period as indicated below. ACTUAL EXPENSES The first line of the following table provides information about the actual account values and | | | | actual expenses. You may use the information in this line, together with the amount you invested, to estimate the expenses that you paid over the period. Simply divide your account value by $1,000 (for example, an $8,600 account value divided by $1,000 = 8.6), then multiply the result by the number in the first line under the heading entitled “Expenses Paid During the Period” to estimate the expenses you paid on your account during this period. HYPOTHETICAL EXAMPLE FOR COMPARISON PURPOSES The second line of the following table provides information about hypothetical account values and hypothetical expenses based on the Fund’s actual expense ratio and an assumed annual rate of return of 5% before expenses, which is not the Fund’s | | | | actual return. The hypothetical account values and expenses may not be used to estimate the actual ending account balance or expenses you paid for the period. You may use this information to compare the ongoing costs of investing in the Fund and other funds by comparing this 5% hypothetical example with the 5% hypothetical examples that appear in the shareholder reports of other funds. Please note that the expenses shown in the table are meant to highlight your ongoing costs only and do not reflect any transactional costs, such as sales charges (loads), redemption fees, or exchange fees. Therefore, the second line of the table is useful in comparing ongoing costs only, and will not help you determine the relative total costs of owning different funds. |
| | | | | | | | |
| | | | | | | | | | |
Six Months Ended
December 31, 2022 | | Expense
Ratio for
the Period | | Beginning
Account
Value
07/01/22 | | Ending
Account
Value
12/31/22 | | | Expenses
Paid
During
the Period* |
AMG Renaissance Large Cap Growth Fund |
|
Based on Actual Fund Return |
Class N | | 1.00% | | $1,000 | | | $1,064 | | | $5.20 |
Class I | | 0.71% | | $1,000 | | | $1,065 | | | $3.70 |
Class Z | | 0.66% | | $1,000 | | | $1,065 | | | $3.44 |
|
Based on Hypothetical 5% Annual Return |
Class N | | 1.00% | | $1,000 | | | $1,020 | | | $5.09 |
Class I | | 0.71% | | $1,000 | | | $1,022 | | | $3.62 |
Class Z | | 0.66% | | $1,000 | | | $1,022 | | | $3.36 |
| * | Expenses are equal to the Fund’s annualized expense ratio multiplied by the average account value over the period, multiplied by the number of days in the most recent fiscal half-year (184), then divided by 365. |
3
| | |
| | | AMG Renaissance Large Cap Growth Fund Portfolio Manager’s Comments (unaudited) |
| | | |
| | | |
| | | | | | | | |
AMG Renaissance Large Cap Growth Fund (the “Fund”) Class N shares returned (17.05)% for the year ending December 31, 2022, faring better than the Fund’s benchmark, the Russell 1000® Growth Index, which returned (29.14)%. MARKET OVERVIEW The stock market declines were catalyzed by the start of a U.S. Federal Reserve (the Fed) tightening cycle. For the year, the consumer staples, energy, and utilities sectors were among the stronger performers in the Russell 1000® Growth Index, while the communication services, consumer discretionary and information technology sectors lagged. Interestingly, corporate earnings did not contribute to the stock market decline, as S&P 500® earnings for the year (incorporating consensus estimates for the fourth quarter) are likely to be around $221/share, almost exactly what analysts predicted for 2022 a year ago and about 6% higher than earnings in 2021 (Source: The Wall Street Journal, 12/25/2022). Nevertheless, the price/earnings ratio (P/E) of the S&P 500® declined meaningfully over the course of the year, dropping 23% to 17.5x, and accounting for all of the decline in the index for 2022. Currently, consensus forecasts for S&P 500® earnings for 2023 have trended downward over the past several quarters. Surging interest rates, rising labor costs, and slowing economic growth have contributed to a forecasted decline in corporate profit margins from historically high levels seen in recent years. At year end, 2023 forecasted earnings growth was in the low single digits, but the downward trend suggests that further cuts in estimates are likely to be seen over the coming months. Increases in interest rates (and inflation) were among the bigger surprises of 2022, and P/Es declined over the year as interest rates rose. The Fed | | | | Fund rate rose from 0.08% at the start of the year to 4.33% at the end of the year, contributing to a historically bad year for bonds. Bonds reacted negatively to the Fed’s rate increases as well as with rising inflation measures. Encouragingly, however, many inflation measures have shown a slowdown in the rate of inflation in recent months. Inflation remains the focus and the Fed is unlikely to shift from its higher interest rate policy until inflation shows signs of abating. On that front, recent data points are somewhat encouraging. While recent trailing inflation (as measured by the Consumer Price Index) is still elevated at 7.1%, it is below its high point in June at 9.0%. Over the past five months, the average monthly change in inflation has been only 0.2%, which equals an annualized rate of only 2.55%. Rising interest rates have also resulted in an increasingly negative consensus outlook for economic growth for 2023. Predictions for an imminent recession have reached the highest levels ever recorded, although predictions for the severity and duration of a possible recession vary widely. As baseball legend Yogi Berra is reputed to have said, “It’s tough to make predictions, especially about the future.” Making accurate predictions about the economy and financial markets certainly qualifies as challenging. However, a sustained level of higher interest rates is likely to continue to create a more complex environment for stocks than we have seen in past years. PERFORMANCE REVIEW For 2022, our stock selection in the information technology and the consumer discretionary sectors, along with our overweight in the health care sector, | | | | made the most positive contributions to relative returns for the year. Notable performers over the period include EOG Resources (+57%), Vertex Pharmaceuticals (+32%) and Arch Capital Group (+30%). On the negative side, our stock selection in the consumer staples sector and our underweight in the materials and consumer staples sectors detracted the most from our relative returns for the year. Notable underperformers include Meta Platforms (-64%), Alphabet (-39%), and Amazon.com (-50%). OUTLOOK Living through periods of falling markets is always difficult, but we have successfully navigated a number of such periods in Renaissance’s 40+ year history of investment management. We are encouraged that market sentiment appears to be shifting from high momentum “growth at any price” stocks to higher-quality stocks that are selling at reasonable valuations. A focus on identifying reasonably priced growth stocks is the hallmark of our investment discipline, and we continue to find good long-term investment opportunities as we enter 2023. Market volatility is likely to continue in the months ahead, but we believe that our disciplined and patient investment approach is likely to continue to result in good long-term returns. The views expressed represent the opinions of Renaissance Investment Management as of December 31, 2022, and are not intended as a forecast or guarantee of future results, and are subject to change without notice. |
4
|
AMG Renaissance Large Cap Growth Fund Portfolio Manager’s Comments (continued) |
CUMULATIVE TOTAL RETURN PERFORMANCE
AMG Renaissance Large Cap Growth Fund’s cumulative total return is based on the daily change in net asset value (NAV), and assumes that all dividends and distributions were reinvested. This graph compares a hypothetical $10,000 investment made in the AMG Renaissance Large Cap Growth Fund’s Class N shares on December 31, 2012, to a $10,000 investment made in the Russell 1000® Growth Index for the same time period. The graph and table do not reflect the deduction of taxes that a shareholder would pay on a Fund distribution or redemption of shares. The listed returns for the Fund are net of expenses and the returns for the index exclude expenses. Total returns would have been lower had certain expenses not been reduced.
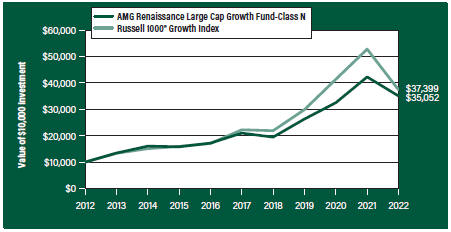
The table below shows the average annual total returns for the AMG Renaissance Large Cap Growth Fund and the Russell 1000® Growth Index for the same time periods ended December 31, 2022.
| | | | | | | | | | | | |
| | | One | | | Five | | | Ten | |
| Average Annual Total Returns1 | | Year | | | Years | | | Years | |
AMG Renaissance Large Cap Growth Fund2, 3, 4, 5, 6 | |
| | | |
Class N | | | (17.05 | %) | | | 10.81 | % | | | 13.36 | % |
| | | |
Class I | | | (16.87 | %) | | | 11.07 | % | | | 13.70 | % |
| | | |
Class Z | | | (16.83 | %) | | | 11.17 | % | | | 13.82 | % |
| | | |
Russell 1000® Growth Index7 | | | (29.14 | %) | | | 10.96 | % | | | 14.10 | % |
The performance data shown represents past performance. Past performance is not a guarantee of future results. Current performance may be lower or higher than the performance data quoted. The investment return and principal value of an investment will fluctuate so that an investor’s shares, when redeemed, may be worth more or less than their original cost.
Investors should carefully consider the Fund’s investment objectives, risks, charges and expenses before investing. For performance information through the most recent month end, current net asset values per share for the Fund and other information, please call 800.548.4539 or visit our website at amgfunds.com for a free prospectus. Read it carefully before investing or sending money.
Distributed by AMG Distributors, Inc., member FINRA/SIPC.
| 1 | Total return equals income yield plus share price change and assumes reinvestment of all dividends and capital gain distributions. Returns are net of fees and may reflect offsets of Fund expenses as described in the prospectus. No adjustment has been made for taxes payable by shareholders on their reinvested dividends and capital gain distributions. Returns for periods greater than one year are annualized. The listed returns on the Fund are net of expenses and based on the published NAV as of December 31, 2022. All returns are in U.S. Dollars ($). |
|
2 From time to time, the Fund’s investment manager has waived its fees and/or absorbed Fund expenses, which has resulted in higher returns. 3 The Fund invests in growth stocks, which may be more sensitive to market movements because their prices tend to reflect future investor expectations rather than just current profits. Growth stocks may underperform value stocks during given periods. 4 Companies that are in similar industry sectors may be similarly affected by particular economic or market events; to the extent the Fund has substantial holdings within a particular sector, the risks associated with that sector increase. 5 The Fund invests in large-capitalization companies that may underperform other stock funds (such as funds that focus on small-and medium-capitalization companies) when stocks of large-capitalization companies are out of favor. 6 Market prices of investments held by the Fund may fall rapidly or unpredictably due to a variety of economic or political factors, market conditions, disasters or public health issues, or in response to events that affect particular industries or companies. 7 The Russell 1000® Growth Index is a market capitalization weighted index that measures the performance of those Russell 1000® companies with higher price-to-book ratios and higher forecasted growth values. Unlike the Fund, the Russell 1000® Growth Index is unmanaged, is not available for investment and does not incur expenses. The Russell 1000® Growth Index is a trademark of the London Stock Exchange Group companies. Not FDIC insured, nor bank guaranteed. May lose value. |
|
|
|
|
|
|
|
|
|
|
|
|
|
|
|
|
|
|
|
| |
| |
| |
| |
| |
| |
| |
| |
| |
| |
| |
| |
| |
| |
| |
| |
| |
| |
| |
| |
| |
| |
| |
| |
| |
5
| | |
| | | AMG Renaissance Large Cap Growth Fund Fund Snapshots (unaudited) December 31, 2022 |
PORTFOLIO BREAKDOWN
| | | | | |
| Sector | | % of
Net Assets |
| | |
Information Technology | | 38.6 |
| | |
Health Care | | 21.5 |
| | |
Industrials | | 10.5 |
| | |
Consumer Discretionary | | 10.3 |
| | |
Communication Services | | 5.4 |
| | |
Consumer Staples | | 5.3 |
| | |
Financials | | 3.4 |
| | |
Real Estate | | 1.8 |
| | |
Energy | | 1.8 |
| | |
Short-Term Investments | | 4.8 |
| | |
Other Assets, less Liabilities | | (3.4) |
TOP TEN HOLDINGS
| | |
| Security Name | | % of
Net Assets |
| | |
Apple, Inc. | | 2.8 |
| | |
Microsoft Corp. | | 2.4 |
| | |
Mastercard, Inc., Class A | | 1.9 |
| | |
Alphabet, Inc., Class A | | 1.9 |
| | |
Horizon Therapeutics PLC. | | 1.9 |
| | |
Roper Technologies, Inc. | | 1.9 |
| | |
Motorola Solutions, Inc. | | 1.9 |
| | |
Visa, Inc., Class A | | 1.8 |
| | |
PTC, Inc. | | 1.8 |
| | |
Dollar General Corp. | | 1.8 |
| | | |
| | |
Top Ten as a Group | | 20.1 |
| | |
Because a fund’s strategy may result in multiple investments in particular sectors of the economy, its performance may depend on the performance of those sectors and may fluctuate more widely than investments diversified across more sectors. For additional information on these and other risk considerations, please see the Fund’s prospectus.
Any sectors, industries, or securities discussed should not be perceived as investment recommendations. Mention of a specific security should not be considered a recommendation to buy or solicitation to sell that security. Specific securities mentioned in this report may have been sold from the Fund’s portfolio of investments by the time you receive this report.
6
| | |
| | | AMG Renaissance Large Cap Growth Fund Schedule of Portfolio Investments December 31, 2022 |
| | | | | | | | |
| | | Shares | | | Value | |
| | |
Common Stocks - 98.6% | | | | | | | | |
| | |
Communication Services - 5.4% | | | | | | | | |
| | |
Alphabet, Inc., Class A* | | | 22,240 | | | $ | 1,962,235 | |
| | |
Electronic Arts, Inc. | | | 15,166 | | | | 1,852,982 | |
| | |
Meta Platforms, Inc., Class A* | | | 14,185 | | | | 1,707,023 | |
| | |
Total Communication Services | | | | | | | 5,522,240 | |
| | |
Consumer Discretionary - 10.3% | | | | | | | | |
| | |
Amazon.com, Inc.* | | | 20,067 | | | | 1,685,628 | |
| | |
Dollar General Corp. | | | 7,700 | | | | 1,896,125 | |
| | |
The Home Depot, Inc. | | | 5,579 | | | | 1,762,183 | |
| | |
Lowe’s Cos., Inc. | | | 8,656 | | | | 1,724,621 | |
| | |
O’Reilly Automotive, Inc.* | | | 2,155 | | | | 1,818,885 | |
| | |
Ulta Beauty, Inc.* | | | 3,824 | | | | 1,793,724 | |
| | |
Total Consumer Discretionary | | | | | | | 10,681,166 | |
| | |
Consumer Staples - 5.3% | | | | | | | | |
| | |
Altria Group, Inc. | | | 40,397 | | | | 1,846,547 | |
| | |
BJ’s Wholesale Club Holdings, Inc.* | | | 27,936 | | | | 1,848,246 | |
| | |
The Procter & Gamble Co. | | | 11,852 | | | | 1,796,289 | |
| | |
Total Consumer Staples | | | | | | | 5,491,082 | |
| | |
Energy - 1.8% | | | | | | | | |
| | |
EOG Resources, Inc. | | | 14,035 | | | | 1,817,813 | |
| | |
Financials - 3.4% | | | | | | | | |
| | |
Arch Capital Group, Ltd. (Bermuda)* | | | 29,109 | | | | 1,827,463 | |
| | |
Raymond James Financial, Inc. | | | 15,388 | | | | 1,644,208 | |
| | |
Total Financials | | | | | | | 3,471,671 | |
| | |
Health Care - 21.5% | | | | | | | | |
| | |
Abbott Laboratories | | | 16,786 | | | | 1,842,935 | |
| | |
AmerisourceBergen Corp. | | | 11,184 | | | | 1,853,301 | |
| | |
Chemed Corp. | | | 3,706 | | | | 1,891,654 | |
| | |
Danaher Corp. | | | 6,989 | | | | 1,855,020 | |
| | |
HCA Healthcare, Inc. | | | 7,871 | | | | 1,888,725 | |
| | |
Horizon Therapeutics PLC.* | | | 17,143 | | | | 1,950,873 | |
| | |
Humana, Inc. | | | 3,591 | | | | 1,839,274 | |
| | |
Johnson & Johnson | | | 10,025 | | | | 1,770,916 | |
| | |
McKesson Corp. | | | 4,828 | | | | 1,811,079 | |
| | |
Thermo Fisher Scientific, Inc. | | | 3,358 | | | | 1,849,217 | |
| | |
UnitedHealth Group, Inc. | | | 3,377 | | | | 1,790,418 | |
| | |
Vertex Pharmaceuticals, Inc.* | | | 6,452 | | | | 1,863,209 | |
| | |
Total Health Care | | | | | | | 22,206,621 | |
| | |
Industrials - 10.5% | | | | | | | | |
| | |
Cintas Corp. | | | 4,168 | | | | 1,882,352 | |
| | |
Illinois Tool Works, Inc. | | | 8,056 | | | | 1,774,737 | |
| | |
Lockheed Martin Corp. | | | 3,686 | | | | 1,793,202 | |
| | |
| | | | | | | | |
| | | | | | | | |
| | | Shares | | | Value | |
| | |
Union Pacific Corp. | | | 8,282 | | | $ | 1,714,954 | |
| | |
Waste Management, Inc. | | | 11,754 | | | | 1,843,967 | |
| | |
WW Grainger, Inc. | | | 3,316 | | | | 1,844,525 | |
| | |
Total Industrials | | | | | | | 10,853,737 | |
| |
Information Technology - 38.6% | | | | | |
| | |
Accenture PLC, Class A (Ireland) | | | 6,951 | | | | 1,854,805 | |
| | |
Adobe, Inc.* | | | 5,093 | | | | 1,713,947 | |
| | |
Akamai Technologies, Inc.* | | | 20,470 | | | | 1,725,621 | |
| | |
Amphenol Corp., Class A | | | 23,643 | | | | 1,800,178 | |
| | |
Apple, Inc. | | | 22,032 | | | | 2,862,618 | |
| | |
Broadcom, Inc. | | | 3,246 | | | | 1,814,936 | |
| | |
Cadence Design Systems, Inc.* | | | 11,516 | | | | 1,849,930 | |
| | |
CDW Corp. | | | 9,904 | | | | 1,768,656 | |
| | |
Fiserv, Inc.* | | | 18,325 | | | | 1,852,108 | |
| | |
Fortinet, Inc.* | | | 33,294 | | | | 1,627,744 | |
| | |
Genpact, Ltd. | | | 37,908 | | | | 1,755,898 | |
| | |
KLA Corp. | | | 4,899 | | | | 1,847,070 | |
| | |
Mastercard, Inc., Class A | | | 5,753 | | | | 2,000,491 | |
| | |
Microsoft Corp. | | | 10,141 | | | | 2,432,015 | |
| | |
Motorola Solutions, Inc. | | | 7,464 | | | | 1,923,547 | |
| | |
PayPal Holdings, Inc.* | | | 24,545 | | | | 1,748,095 | |
| | |
PTC, Inc.* | | | 15,843 | | | | 1,901,794 | |
| | |
Roper Technologies, Inc. | | | 4,501 | | | | 1,944,837 | |
| | |
ServiceNow, Inc.* | | | 4,290 | | | | 1,665,678 | |
| | |
Texas Instruments, Inc. | | | 11,239 | | | | 1,856,908 | |
| | |
Visa, Inc., Class A1 | | | 9,163 | | | | 1,903,705 | |
| | |
Total Information Technology | | | | | | | 39,850,581 | |
| | |
Real Estate - 1.8% | | | | | | | | |
| | |
CBRE Group, Inc., Class A* | | | 24,325 | | | | 1,872,052 | |
| | |
Total Common Stocks
(Cost $74,714,150) | | | | | | | 101,766,963 | |
| | |
Short-Term Investments - 4.8% | | | | | | | | |
| |
Other Investment Companies - 4.8% | | | | | |
| | |
Dreyfus Government Cash Management Fund, Institutional Shares, 4.19%2 | | | 1,991,150 | | | | 1,991,150 | |
| | |
Dreyfus Institutional Preferred Government Money Market Fund, Institutional Shares, 4.27%2 | | | 2,986,724 | | | | 2,986,724 | |
| | |
Total Short-Term Investments
(Cost $4,977,874) | | | | | | | 4,977,874 | |
| | |
Total Investments - 103.4%
(Cost $79,692,024) | | | | | | | 106,744,837 | |
| | |
Other Assets, less Liabilities - (3.4)% | | | | | | | (3,509,051 | ) |
| | |
Net Assets - 100.0% | | | | | | $ | 103,235,786 | |
| | |
| | | | | | | | |
The accompanying notes are an integral part of these financial statements.
7
| | |
| | | AMG Renaissance Large Cap Growth Fund Schedule of Portfolio Investments (continued) |
| * | Non-income producing security. |
| 1 | Some of this security, amounting to $1,884,591 or 1.8% of net assets, was out on loan to various borrowers and is collateralized by various U.S. Treasury Obligations. See Note 4 of Notes to Financial Statements. |
| 2 | Yield shown represents the December 31, 2022, seven day average yield, which refers to the sum of the previous seven days’ dividends paid, expressed as an annual percentage. |
The following table summarizes the inputs used to value the Fund’s investments by the fair value hierarchy levels as of December 31, 2022:
| | | | | | | | | | | | | | | | |
| | | Level 1 | | | Level 2 | | | Level 3 | | | Total | |
Investments in Securities | | | | | | | | | | | | | | | | |
| | | | |
Common Stocks† | | $ | 101,766,963 | | | | — | | | | — | | | | $101,766,963 | |
| | | | |
Short-Term Investments | | | | | | | | | | | | | | | | |
| | | | |
Other Investment Companies | | | 4,977,874 | | | | — | | | | — | | | | 4,977,874 | |
| | | | | | | | | | | | | | | | |
| | | | |
Total Investments in Securities | | $ | 106,744,837 | | | | — | | | | — | | | | $106,744,837 | |
| | | | | | | | | | | | | | | | |
| † | All common stocks held in the Fund are Level 1 securities. For a detailed breakout of common stocks by major industry classification, please refer to the Fund’s Schedule of Portfolio Investments. |
For the fiscal year ended December 31, 2022, there were no transfers in or out of Level 3.
The accompanying notes are an integral part of these financial statements.
8
| | |
| | | Statement of Assets and Liabilities December 31, 2022 |
| | | | | |
| | | AMG Renaissance
Large Cap
Growth Fund |
| |
Assets: | | | | | |
| |
Investments at value1 (including securities on loan valued at $1,884,591) | | | | $106,744,837 | |
| |
Dividend and interest receivables | | | | 81,171 | |
| |
Securities lending income receivable | | | | 82 | |
| |
Receivable for Fund shares sold | | | | 426 | |
| |
Receivable from affiliate | | | | 15,728 | |
| |
Prepaid expenses and other assets | | | | 10,596 | |
| |
Total assets | | | | 106,852,840 | |
| |
Liabilities: | | | | | |
| |
Payable for investments purchased | | | | 3,415,252 | |
| |
Payable for Fund shares repurchased | | | | 70,328 | |
| |
Accrued expenses: | | | | | |
| |
Investment advisory and management fees | | | | 44,251 | |
| |
Administrative fees | | | | 13,014 | |
| |
Distribution fees | | | | 12,269 | |
| |
Shareholder service fees | | | | 1,894 | |
| |
Other | | | | 60,046 | |
| |
Total liabilities | | | | 3,617,054 | |
| | | | | |
| |
Net Assets | | | | $103,235,786 | |
| |
1 Investments at cost | | | | $79,692,024 | |
The accompanying notes are an integral part of these financial statements.
9
| | |
| | | Statement of Assets and Liabilities (continued) |
| | | | | |
| | | AMG Renaissance
Large Cap
Growth Fund |
| |
Net Assets Represent: | | | | | |
| |
Paid-in capital | | | | $74,707,841 | |
| |
Total distributable earnings | | | | 28,527,945 | |
| |
Net Assets | | | | $103,235,786 | |
| |
Class N: | | | | | |
| |
Net Assets | | | | $56,263,950 | |
| |
Shares outstanding | | | | 3,940,610 | |
| |
Net asset value, offering and redemption price per share | | | | $14.28 | |
| |
Class I: | | | | | |
| |
Net Assets | | | | $25,585,355 | |
| |
Shares outstanding | | | | 1,769,826 | |
| |
Net asset value, offering and redemption price per share | | | | $14.46 | |
| |
Class Z: | | | | | |
| |
Net Assets | | | | $21,386,481 | |
| |
Shares outstanding | | | | 1,507,687 | |
| |
Net asset value, offering and redemption price per share | | | | $14.18 | |
The accompanying notes are an integral part of these financial statements.
10
| | |
| | | Statement of Operations For the fiscal year ended December 31, 2022 |
| | | | | |
| | | AMG Renaissance
Large Cap
Growth Fund |
| |
Investment Income: | | | | | |
| |
Dividend income | | | | $1,166,333 | |
| |
Securities lending income | | | | 1,707 | |
| |
Total investment income | | | | 1,168,040 | |
| |
Expenses: | | | | | |
| |
Investment advisory and management fees | | | | 496,548 | |
| |
Administrative fees | | | | 144,837 | |
| |
Distribution fees - Class N | | | | 155,620 | |
| |
Shareholder servicing fees - Class N | | | | 54,208 | |
| |
Shareholder servicing fees - Class I | | | | 10,961 | |
| |
Professional fees | | | | 36,794 | |
| |
Registration fees | | | | 36,531 | |
| |
Custodian fees | | | | 21,931 | |
| |
Reports to shareholders | | | | 18,505 | |
| |
Transfer agent fees | | | | 15,061 | |
| |
Trustee fees and expenses | | | | 6,878 | |
| |
Miscellaneous | | | | 5,690 | |
| |
Total expenses before offsets | | | | 1,003,564 | |
| |
Expense reimbursements | | | | (145,481 | ) |
| |
Expense reductions | | | | (2,803 | ) |
| |
Net expenses | | | | 855,280 | |
| | | | | |
| |
Net investment income | | | | 312,760 | |
| |
Net Realized and Unrealized Loss: | | | | | |
| |
Net realized gain on investments | | | | 5,552,868 | |
| |
Net change in unrealized appreciation/depreciation on investments | | | | (24,391,584 | ) |
| |
Net realized and unrealized loss | | | | (18,838,716 | ) |
| | | | | |
| |
Net decrease in net assets resulting from operations | | | | $(18,525,956 | ) |
The accompanying notes are an integral part of these financial statements.
11
| | |
| | | Statements of Changes in Net Assets For the fiscal years ended December 31, |
| | | | | | | | | | |
| | | AMG Renaissance
Large Cap
Growth Fund |
| | |
| | | 2022 | | 2021 |
| | |
Increase (Decrease) in Net Assets Resulting From Operations: | | | | | | | | | | |
| | |
Net investment income | | | | $312,760 | | | | | $93,306 | |
| | |
Net realized gain on investments | | | | 5,552,868 | | | | | 10,257,941 | |
| | |
Net change in unrealized appreciation/depreciation on investments | | | | (24,391,584 | ) | | | | 16,697,774 | |
| | |
Net increase (decrease) in net assets resulting from operations | | | | (18,525,956 | ) | | | | 27,049,021 | |
| | |
Distributions to Shareholders: | | | | | | | | | | |
| | |
Class N | | | | (3,750,988 | ) | | | | (5,932,775 | ) |
| | |
Class I | | | | (1,502,447 | ) | | | | (939,739 | ) |
| | |
Class Z | | | | (1,496,106 | ) | | | | (1,617,440 | ) |
| | |
Total distributions to shareholders | | | | (6,749,541 | ) | | | | (8,489,954 | ) |
| | |
Capital Share Transactions:1 | | | | | | | | | | |
| | |
Net increase from capital share transactions | | | | 15,701,143 | | | | | 81,815 | |
| | | | | | | | | | |
| | |
Total increase (decrease) in net assets | | | | (9,574,354 | ) | | | | 18,640,882 | |
| | |
Net Assets: | | | | | | | | | | |
| | |
Beginning of year | | | | 112,810,140 | | | | | 94,169,258 | |
| | |
End of year | | | | $103,235,786 | | | | | $112,810,140 | |
1 See Note 1(g) of the Notes to Financial Statements.
The accompanying notes are an integral part of these financial statements.
12
| | |
| | | AMG Renaissance Large Cap Growth Fund Financial Highlights For a share outstanding throughout each fiscal year |
| | | | | | | | | | | | | | | | | | | | | | | | | |
| | | For the fiscal years ended December 31, |
| | | | | |
| Class N | | 2022 | | 2021 | | 2020 | | 2019 | | 2018 |
| | | | | |
Net Asset Value, Beginning of Year | | | | $18.41 | | | | | $15.31 | | | | | $13.01 | | | | | $10.48 | | | | | $14.03 | |
| | | | | |
Income (loss) from Investment Operations: | | | | | | | | | | | | | | | | | | | | | | | | | |
| | | | | |
Net investment income1,2 | | | | 0.03 | | | | | 0.00 | 3,4 | | | | 0.01 | | | | | 0.06 | | | | | 0.06 | |
| | | | | |
Net realized and unrealized gain (loss) on investments | | | | (3.16 | ) | | | | 4.57 | | | | | 3.04 | | | | | 3.61 | | | | | (1.09 | ) |
| | | | | |
Total income (loss) from investment operations | | | | (3.13 | ) | | | | 4.57 | | | | | 3.05 | | | | | 3.67 | | | | | (1.03 | ) |
| | | | | |
Less Distributions to Shareholders from: | | | | | | | | | | | | | | | | | | | | | | | | | |
| | | | | |
Net investment income | | | | (0.02 | ) | | | | (0.00 | )3 | | | | (0.02 | ) | | | | (0.08 | ) | | | | (0.07 | ) |
| | | | | |
Net realized gain on investments | | | | (0.98 | ) | | | | (1.47 | ) | | | | (0.73 | ) | | | | (1.06 | ) | | | | (2.45 | ) |
| | | | | |
Total distributions to shareholders | | | | (1.00 | ) | | | | (1.47 | ) | | | | (0.75 | ) | | | | (1.14 | ) | | | | (2.52 | ) |
| | | | | |
Net Asset Value, End of Year | | | | $14.28 | | | | | $18.41 | | | | | $15.31 | | | | | $13.01 | | | | | $10.48 | |
| | | | | |
Total Return2,5 | | | | (17.05 | )% | | | | 30.02 | % | | | | 23.54 | % | | | | 35.16 | % | | | | (7.23 | )% |
| | | | | |
Ratio of net expenses to average net assets6 | | | | 1.00 | % | | | | 1.00 | % | | | | 1.00 | % | | | | 1.00 | %7 | | | | 1.00 | % |
| | | | | |
Ratio of gross expenses to average net assets8 | | | | 1.15 | % | | | | 1.13 | % | | | | 1.19 | % | | | | 1.17 | % | | | | 1.12 | % |
| | | | | |
Ratio of net investment income to average net assets2 | | | | 0.22 | % | | | | 0.00 | %9 | | | | 0.10 | % | | | | 0.48 | % | | | | 0.45 | % |
| | | | | |
Portfolio turnover | | | | 28 | % | | | | 18 | % | | | | 28 | % | | | | 40 | % | | | | 38 | % |
| | | | | |
Net assets end of year (000’s) omitted | | | | $56,264 | | | | | $79,490 | | | | | $67,688 | | | | | $63,900 | | | | | $54,595 | |
13
| | |
| | | AMG Renaissance Large Cap Growth Fund Financial Highlights For a share outstanding throughout each fiscal year |
| | | | | | | | | | | | | | | | | | | | | | | | | |
| | | For the fiscal years ended December 31, |
| | | | | |
| Class I | | 2022 | | 2021 | | 2020 | | 2019 | | 2018 |
| | | | | |
Net Asset Value, Beginning of Year | | | | $18.63 | | | | | $15.48 | | | | | $13.14 | | | | | $10.58 | | | | | $14.17 | |
| | | | | |
Income (loss) from Investment Operations: | | | | | | | | | | | | | | | | | | | | | | | | | |
| | | | | |
Net investment income1,2 | | | | 0.07 | | | | | 0.04 | 4 | | | | 0.05 | | | | | 0.09 | | | | | 0.10 | |
| | | | | |
Net realized and unrealized gain (loss) on investments | | | | (3.19 | ) | | | | 4.62 | | | | | 3.07 | | | | | 3.64 | | | | | (1.11 | ) |
| | | | | |
Total income (loss) from investment operations | | | | (3.12 | ) | | | | 4.66 | | | | | 3.12 | | | | | 3.73 | | | | | (1.01 | ) |
| | | | | |
Less Distributions to Shareholders from: | | | | | | | | | | | | | | | | | | | | | | | | | |
| | | | | |
Net investment income | | | | (0.07 | ) | | | | (0.04 | ) | | | | (0.05 | ) | | | | (0.11 | ) | | | | (0.13 | ) |
| | | | | |
Net realized gain on investments | | | | (0.98 | ) | | | | (1.47 | ) | | | | (0.73 | ) | | | | (1.06 | ) | | | | (2.45 | ) |
| | | | | |
Total distributions to shareholders | | | | (1.05 | ) | | | | (1.51 | ) | | | | (0.78 | ) | | | | (1.17 | ) | | | | (2.58 | ) |
| | | | | |
Net Asset Value, End of Year | | | | $14.46 | | | | | $18.63 | | | | | $15.48 | | | | | $13.14 | | | | | $10.58 | |
| | | | | |
Total Return2,5 | | | | (16.87 | )% | | | | 30.30 | % | | | | 23.90 | % | | | | 35.42 | % | | | | (7.00 | )% |
| | | | | |
Ratio of net expenses to average net assets6 | | | | 0.73 | % | | | | 0.75 | % | | | | 0.75 | % | | | | 0.75 | %7 | | | | 0.74 | % |
| | | | | |
Ratio of gross expenses to average net assets8 | | | | 0.88 | % | | | | 0.88 | % | | | | 0.94 | % | | | | 0.92 | % | | | | 0.86 | % |
| | | | | |
Ratio of net investment income to average net assets2 | | | | 0.48 | % | | | | 0.25 | % | | | | 0.35 | % | | | | 0.73 | % | | | | 0.71 | % |
| | | | | |
Portfolio turnover | | | | 28 | % | | | | 18 | % | | | | 28 | % | | | | 40 | % | | | | 38 | % |
| | | | | |
Net assets end of year (000’s) omitted | | | | $25,585 | | | | | $12,599 | | | | | $9,414 | | | | | $8,410 | | | | | $11,247 | |
14
| | |
| | | AMG Renaissance Large Cap Growth Fund Financial Highlights For a share outstanding throughout each fiscal year |
| | | | | | | | | | | | | | | | | | | | | | | | | |
| | | For the fiscal years ended December 31, |
| | | | | |
| Class Z | | 2022 | | 2021 | | 2020 | | 2019 | | 2018 |
| | | | | |
Net Asset Value, Beginning of Year | | | | $18.31 | | | | | $15.22 | | | | | $12.94 | | | | | $10.43 | | | | | $14.00 | |
| | | | | |
Income (loss) from Investment Operations: | | | | | | | | | | | | | | | | | | | | | | | | | |
| | | | | |
Net investment income1,2 | | | | 0.09 | | | | | 0.06 | 4 | | | | 0.06 | | | | | 0.10 | | | | | 0.11 | |
| | | | | |
Net realized and unrealized gain (loss) on investments | | | | (3.16 | ) | | | | 4.56 | | | | | 3.01 | | | | | 3.60 | | | | | (1.09 | ) |
| | | | | |
Total income (loss) from investment operations | | | | (3.07 | ) | | | | 4.62 | | | | | 3.07 | | | | | 3.70 | | | | | (0.98 | ) |
| | | | | |
Less Distributions to Shareholders from: | | | | | | | | | | | | | | | | | | | | | | | | | |
| | | | | |
Net investment income | | | | (0.08 | ) | | | | (0.06 | ) | | | | (0.06 | ) | | | | (0.13 | ) | | | | (0.14 | ) |
| | | | | |
Net realized gain on investments | | | | (0.98 | ) | | | | (1.47 | ) | | | | (0.73 | ) | | | | (1.06 | ) | | | | (2.45 | ) |
| | | | | |
Total distributions to shareholders | | | | (1.06 | ) | | | | (1.53 | ) | | | | (0.79 | ) | | | | (1.19 | ) | | | | (2.59 | ) |
| | | | | |
Net Asset Value, End of Year | | | | $14.18 | | | | | $18.31 | | | | | $15.22 | | | | | $12.94 | | | | | $10.43 | |
| | | | | |
Total Return2,5 | | | | (16.83 | )% | | | | 30.54 | % | | | | 23.90 | % | | | | 35.58 | % | | | | (6.88 | )% |
| | | | | |
Ratio of net expenses to average net assets6 | | | | 0.66 | % | | | | 0.66 | % | | | | 0.66 | % | | | | 0.66 | %7 | | | | 0.66 | % |
| | | | | |
Ratio of gross expenses to average net assets8 | | | | 0.81 | % | | | | 0.79 | % | | | | 0.85 | % | | | | 0.83 | % | | | | 0.78 | % |
| | | | | |
Ratio of net investment income to average net assets2 | | | | 0.55 | % | | | | 0.34 | % | | | | 0.44 | % | | | | 0.82 | % | | | | 0.79 | % |
| | | | | |
Portfolio turnover | | | | 28 | % | | | | 18 | % | | | | 28 | % | | | | 40 | % | | | | 38 | % |
| | | | | |
Net assets end of year (000’s) omitted | | | | $21,386 | | | | | $20,721 | | | | | $17,068 | | | | | $20,372 | | | | | $39,149 | |
| 1 | Per share numbers have been calculated using average shares. |
| 2 | Total returns and net investment income would have been lower had certain expenses not been offset. |
| 3 | Less than $0.005 or $(0.005) per share. |
| 4 | Includes non-recurring dividends. Without these dividends, net investment gain (loss) per share would have been $(0.02), $0.02, and $0.04 for Class N, Class I and Class Z, respectively. |
| 5 | The total return is calculated using the published Net Asset Value as of fiscal year end. |
| 6 | Includes reduction from broker recapture amounting to less than 0.01% for the fiscal years ended December 31, 2022, 2021 and 2020, and 0.01% for the fiscal years ended 2019 and 2018, respectively. |
| 7 | Includes interest expense of 0.01% of average net assets. |
| 8 | Excludes the impact of expense reimbursement or fee waivers and expense reductions such as brokerage credits, but includes expense repayments and non-reimbursable expenses, if any, such as interest, taxes, and extraordinary expenses. (See Note 1(c) and 2 in the Notes to Financial Statements.) |
15
| | |
| | | Notes to Financial Statements December 31, 2022 |
| | | |
| | | |
1. ORGANIZATION AND SUMMARY OF SIGNIFICANT ACCOUNTING POLICIES
AMG Funds (the “Trust”) is an open-end management investment company, organized as a Massachusetts business trust, and registered under the Investment Company Act of 1940, as amended (the “1940 Act”). Currently, the Trust consists of a number of different funds, each having distinct investment management objectives, strategies, risks, and policies. Included in this report is AMG Renaissance Large Cap Growth Fund (the “Fund”).
The Fund offers Class N, Class I, and Class Z shares. Each class represents an interest in the same assets of the Fund. Although all share classes generally have identical voting rights, each share class votes separately when required by law. Different share classes may have different net asset values per share to the extent the share classes pay different distribution amounts and/or the expenses of such share classes differ. Each share class has its own expense structure. Please refer to a current prospectus for additional information on each share class.
Stocks in the information technology sector comprise a significant portion of the Fund’s portfolio at December 31, 2022. The information technology sector may be affected by technological obsolescence, short product cycles, falling prices and profits, competitive pressures and general market conditions.
Market prices of investments held by the Fund may fall rapidly or unpredictably due to a variety of economic or political factors, market conditions, disasters or public health issues, or in response to events that affect particular industries or companies.
The Fund’s financial statements are prepared in accordance with accounting principles generally accepted in the United States of America (“U.S. GAAP”), including accounting and reporting guidance pursuant to Accounting Standards Codification Topic 946 applicable to investment companies. U.S. GAAP requires management to make estimates and assumptions that affect the reported amounts of assets and liabilities and disclosure of contingent assets and liabilities at the date of the financial statements and the reported amounts of income and expenses during the reporting period. Actual results could differ from those estimates and such differences could be material. The following is a summary of significant accounting policies followed by the Fund in the preparation of its financial statements:
a. VALUATION OF INVESTMENTS
Equity securities traded on a national securities exchange or reported on the NASDAQ national market system (“NMS”) are valued at the last quoted sales price on the primary exchange or, if applicable, the NASDAQ official closing price or the official closing price of the relevant exchange or, lacking any sales, at the last quoted bid price. Equity securities held by the Fund that are traded in the over-the-counter market (other than NMS securities) are valued at the bid price. Foreign equity securities (securities principally traded in markets other than U.S. markets) held by the Fund are valued at the official closing price on the primary exchange or, for markets that either do not offer an official closing price or where the official closing price may not be representative of the overall market, the last quoted sale price.
Fixed income securities purchased with a remaining maturity of 60 days or less are valued at amortized cost, provided that the amortized cost value is approximately the same as the fair value of the security valued without the use of amortized cost. Investments in other open-end registered investment companies are valued at their end of day net asset value per share.
The Fund’s portfolio investments are generally valued based on independent market quotations or prices or, if none, “evaluative” or other market based valuations provided by third party pricing services approved by the Board of Trustees of the Trust (the “Board”). Under certain circumstances, the value of certain Fund portfolio investments may be based on an evaluation of fair value, pursuant to procedures established by and under the general supervision of the Board. The Valuation Committee, which is comprised of the Independent Trustees of the Board, and the Pricing Committee, which is comprised of representatives from AMG Funds LLC (the “Investment Manager”) are the committees appointed by the Board to make fair value determinations. The Fund may use the fair value of a portfolio investment to calculate its net asset value (“NAV”) in the event that the market quotation, price or market based valuation for the portfolio investment is not readily available or otherwise not determinable pursuant to the Board’s valuation procedures, if the Investment Manager or the Pricing Committee believes the quotation, price or market based valuation to be unreliable, or in certain other circumstances. When determining the fair value of an investment, the Pricing Committee and, if required under the Trust’s securities valuation procedures, the Valuation Committee, seeks to determine the price that the Fund might reasonably expect to receive from current sale of that portfolio investment in an arms-length transaction. Fair value determinations shall be based upon consideration of all available facts and information, including, but not limited to (i) attributes specific to the investment; (ii) fundamental and analytical data relating to the investment; and (iii) the value of other comparable securities or relevant financial instruments, including derivative securities, traded on other markets or among dealers.
The values assigned to fair value portfolio investments are based on available information and do not necessarily represent amounts that might ultimately be realized in the future, since such amounts depend on future developments inherent in long-term investments. Because of the inherent uncertainty of valuation, those estimated values may differ significantly from the values that would have been used had a ready market for the investments existed, and the differences could be material. The Board will be presented with a quarterly report showing as of the most recent quarter end, all outstanding securities fair valued by the Fund, including a comparison with the prior quarter end and the percentage of the Fund that the security represents at each quarter end.
With respect to foreign equity securities and certain foreign fixed income securities, the Board has adopted a policy that securities held in the Fund that can be fair valued by the applicable fair value pricing service are fair valued on each business day provided that each individual price exceeds a pre-established confidence level.
Effective September 8, 2022, the Fund adopted the requirements of Rule 2a-5 under the 1940 Act (“Rule 2a-5”), which the Fund’s Board designated the Fund’s Investment Manager as the Fund’s Valuation Designee to perform the Fund’s fair value determinations. Such determinations are subject to Board oversight and certain reporting and other requirements intended to ensure that the Board receives the information it needs to oversee the Investment Manager’s fair value determinations. Other than the designation of the Investment Manager as the Valuation Designee, the Fund’s adoption of Rule 2-a5 did not impact how the Fund determines fair value or the carrying amount of investments held in the Fund.
U.S. GAAP defines fair value as the price that a fund would receive to sell an asset or pay to transfer a liability in an orderly transaction between market participants at the measurement date. U.S. GAAP also establishes a framework for measuring fair value, and a three level hierarchy for fair value measurements based upon the transparency of inputs to the valuation of an asset or liability. Inputs may be
16
| | |
| | | Notes to Financial Statements (continued) |
| | | |
| | | |
observable or unobservable and refer broadly to the assumptions that market participants would use in pricing the asset or liability. Observable inputs reflect the assumptions market participants would use in pricing the asset or liability based on market data obtained from sources independent of the Fund. Unobservable inputs reflect the Fund’s own assumptions about the assumptions that market participants would use in pricing the asset or liability developed based on the best information available in the circumstances. Each investment is assigned a level based upon the observability of the inputs which are significant to the overall valuation.
The three-tier hierarchy of inputs is summarized below:
Level 1 – inputs are quoted prices in active markets for identical investments (e.g., equity securities, open-end investment companies)
Level 2 – other observable inputs (including, but not limited to: quoted prices for similar assets or liabilities in markets that are active, quoted prices for identical or similar assets or liabilities in markets that are not active, inputs other than quoted prices that are observable for the assets or liabilities (such as interest rates, yield curves, volatilities, prepayment speeds, loss severities, credit risks and default rates) or other market corroborated inputs) (e.g., debt securities, government securities, foreign currency exchange contracts, foreign securities utilizing international fair value pricing, fair valued securities with observable inputs)
Level 3 – inputs are significant unobservable inputs (including the Fund’s own assumptions used to determine the fair value of investments) (e.g., fair valued securities with unobservable inputs)
Changes in inputs or methodologies used for valuing investments may result in a transfer in or out of levels within the fair value hierarchy. The inputs or methodologies used for valuing investments may not necessarily be an indication of the risk associated with investing in those investments.
b. SECURITY TRANSACTIONS
Security transactions are accounted for as of trade date. Realized gains and losses on securities sold are determined on the basis of identified cost.
c. INVESTMENT INCOME AND EXPENSES
Dividend income is recorded on the ex-dividend date. Interest income, which includes amortization of premium and accretion of discount on debt securities, is accrued as earned. Dividend and interest income on foreign securities is recorded gross of any withholding tax. Non-cash dividends included in dividend income, if any, are reported at the fair market value of the securities received. Other income and expenses are recorded on an accrual basis. Expenses that cannot be directly attributed to the Fund are apportioned among the funds in the Trust and other trusts or funds within the AMG Funds Family of Funds (collectively the “AMG Funds Family”) based upon their relative average net assets or number of shareholders. Investment income, realized and unrealized capital gains and losses, the common expenses of the Fund, and certain fund level expense reductions, if any, are allocated on a pro-rata basis to each class based on the relative net assets of each class to the total net assets of the Fund.
The Fund had certain portfolio trades directed to various brokers under a brokerage recapture program. Credits received from the brokerage recapture program are earned and paid on a monthly basis, and are recorded as expense offsets, which serve to reduce the Fund’s overall expense ratio. For the fiscal year
ended December 31, 2022, the impact on the expenses and expense ratios was $2,803 or less than 0.01%.
d. DIVIDENDS AND DISTRIBUTIONS
Fund distributions resulting from either net investment income or realized net capital gains, if any, will normally be declared and paid at least annually in December. Distributions to shareholders are recorded on the ex-dividend date. Distributions are determined in accordance with federal income tax regulations, which may differ from net investment income and net realized capital gains for financial statement purposes (U.S. GAAP). Differences may be permanent or temporary. Permanent differences are reclassified among capital accounts in the financial statements to reflect their tax character. Permanent book and tax basis differences, if any, relating to shareholder distributions will result in reclassifications to paid-in capital. Temporary differences arise when certain items of income, expense and gain or loss are recognized in different periods for financial statement and tax purposes; these differences will reverse at some time in the future. Permanent differences are primarily due to tax equalization utilized. Temporary differences are primarily due to wash sale loss deferrals.
The tax character of distributions paid during the fiscal years ended December 31, 2022 and December 31, 2021 were as follows:
| | | | | | | | |
| Distributions paid from: | | 2022 | | | 2021 | |
| | |
Ordinary income * | | | $301,910 | | | | $650,288 | |
| | |
Long-term capital gains | | | 6,447,631 | | | | 7,839,666 | |
| | | | | | | | |
| | |
| | | $6,749,541 | | | | $8,489,954 | |
| | | | | | | | |
| * | For tax purposes, short-term capital gain distributions, if any, are considered ordinary income distributions. |
As of December 31, 2022, the components of distributable earnings (excluding unrealized appreciation/depreciation) on a tax basis consisted of:
| | | | |
| |
Undistributed ordinary income | | | $7,235 | |
| |
Undistributed long-term capital gains | | | 1,475,871 | |
At December 31, 2022, the cost of investments and the aggregate gross unrealized appreciation and depreciation for federal income tax purposes were as follows:
| | | | | | | | | | | | |
| Cost | | Appreciation | | | Depreciation | | | Net Appreciation | |
| | | |
$79,699,998 | | | $29,534,622 | | | | $(2,489,783 | ) | | | $27,044,839 | |
e. FEDERAL TAXES
The Fund currently qualifies as an investment company and intends to comply with the requirements under Subchapter M of the Internal Revenue Code of 1986, as amended, and to distribute substantially all of its taxable income and gains to its shareholders and to meet certain diversification and income requirements with respect to investment companies. Therefore, no provision for federal income or excise tax is included in the accompanying financial statements.
Additionally, based on the Fund’s understanding of the tax rules and rates related to income, gains and transactions for the foreign jurisdictions in which it invests, the Fund will provide for foreign taxes, and where appropriate, deferred foreign taxes.
17
| | |
| | | Notes to Financial Statements (continued) |
| | | |
| | | |
Management has analyzed the Fund’s tax positions taken on federal income tax returns as of December 31, 2022, and for all open tax years (generally, the three prior taxable years), and has concluded that no provision for federal income tax is required in the Fund’s financial statements. Additionally, Management is not aware of any tax position for which it is reasonably possible that the total amounts of unrecognized tax benefits will change materially in the next twelve months.
f. CAPITAL LOSS CARRYOVERS AND DEFERRALS
As of December 31, 2022, the Fund had no capital loss carryovers for federal income tax purposes. Should the Fund incur net capital losses for the fiscal year ended December 31, 2023, such amounts may be used to offset future realized capital gains indefinitely, and retain their character as short-term and/or long-term.
g. CAPITAL STOCK
The Trust’s Declaration of Trust authorizes for the Fund the issuance of an unlimited number of shares of beneficial interest, without par value. The Fund records sales and repurchases of its capital stock on the trade date.
For the fiscal years ended December 31, 2022 and December 31, 2021, the capital stock transactions by class for the Fund were as follows:
| | | | | | | | | | | | | | | | |
| | |
| | | December 31, 2022 | | | December 31, 2021 | |
| | | | | | | | | | | | | | | | |
| | | | |
| | | Shares | | | Amount | | | Shares | | | Amount | |
| | | | |
Class N: | | | | | | | | | | | | | | | | |
| | | | |
Shares sold | | | 76,753 | | | | $1,159,718 | | | | 109,927 | | | | $1,898,528 | |
| | | | |
Shares issued in reinvestment of distributions | | | 226,359 | | | | 3,255,046 | | | | 285,234 | | | | 5,162,738 | |
| | | | |
Shares redeemed | | | (680,358 | ) | | | (10,668,386 | ) | | | (498,953 | ) | | | (8,443,388 | ) |
| | | | | | | | | | | | | | | | |
| | | | |
Net decrease | | | (377,246 | ) | | | $(6,253,622 | ) | | | (103,792 | ) | | | $(1,382,122 | ) |
| | | | | | | | | | | | | | | | |
| | | | |
Class I: | | | | | | | | | | | | | | | | |
| | | | |
Shares sold | | | 1,270,962 | | | | $19,392,826 | | | | 119,211 | | | | $1,986,733 | |
| | | | |
Shares issued in reinvestment of distributions | | | 101,750 | | | | 1,480,470 | | | | 51,218 | | | | 937,805 | |
| | | | |
Shares redeemed | | | (279,075 | ) | | | (4,314,115 | ) | | | (102,506 | ) | | | (1,728,236 | ) |
| | | | | | | | | | | | | | | | |
| | | | |
Net increase | | | 1,093,637 | | | | $16,559,181 | | | | 67,923 | | | | $1,196,302 | |
| | | | | | | | | | | | | | | | |
| | | | |
Class Z: | | | | | | | | | | | | | | | | |
| | | | |
Shares sold | | | 446,235 | | | | $6,599,400 | | | | 70,562 | | | | $1,224,341 | |
| | | | |
Shares issued in reinvestment of distributions | | | 100,082 | | | | 1,429,170 | | | | 85,595 | | | | 1,539,857 | |
| | | | |
Shares redeemed | | | (170,599 | ) | | | (2,632,986 | ) | | | (145,277 | ) | | | (2,496,563 | ) |
| | | | | | | | | | | | | | | | |
| | | | |
Net increase | | | 375,718 | | | | $5,395,584 | | | | 10,880 | | | | $267,635 | |
| | | | | | | | | | | | | | | | |
h. REPURCHASE AGREEMENTS AND JOINT REPURCHASE AGREEMENTS
The Fund may enter into third-party and bilateral repurchase agreements for temporary cash management purposes and third-party or bilateral joint repurchase agreements for reinvestment of cash collateral on securities lending transactions under the securities lending program offered by The Bank of New York Mellon (“BNYM”) (the “Program”) (collectively, “Repurchase Agreements”). The value of the underlying collateral, including accrued interest, must equal or exceed the value of the Repurchase Agreements during the term of the agreement. For joint repurchase agreements, the Fund participates on a pro rata basis with other clients of BNYM in its share of the underlying collateral under such joint repurchase agreements and in its share of proceeds from any repurchase or other disposition of the underlying collateral. The underlying collateral for all Repurchase Agreements is held in safekeeping by the Fund’s custodian or at the Federal Reserve Bank. If the seller defaults and the value of the collateral declines, or if bankruptcy proceedings commence with respect to the seller of the security,
realization of the collateral by the Fund may be delayed or limited. Pursuant to the Program, the Fund is indemnified for such losses by BNYM on joint repurchase agreements.
At December 31, 2022, the Fund had no Repurchase Agreements outstanding.
2. AGREEMENTS AND TRANSACTIONS WITH AFFILIATES
The Trust has entered into an investment advisory agreement under which the Investment Manager, a subsidiary and the U.S. retail distribution arm of Affiliated Managers Group, Inc. (“AMG”), serves as investment manager to the Fund and is responsible for the Fund’s overall administration and operations. The Investment Manager selects one or more subadvisers for the Fund (subject to Board approval) and monitors each subadviser’s investment performance, security holdings and investment strategies. The Fund’s investment portfolio is managed by The Renaissance Group LLC (“Renaissance”) who serves pursuant to a subadvisory
18
| | |
| | | Notes to Financial Statements (continued) |
| | | |
| | | |
agreement with the Investment Manager. AMG indirectly owns a majority interest in Renaissance.
Investment management fees are paid directly by the Fund to the Investment Manager based on average daily net assets. For the fiscal year ended December 31, 2022, the Fund paid an investment management fee at the following annual rates of the Fund’s average daily net assets:
| | | | |
| |
on the first $50 million | | | 0.55 | % |
| |
on the next $25 million | | | 0.50 | % |
| |
on the next $25 million | | | 0.45 | % |
| |
on balance over $100 million | | | 0.40 | % |
The fee paid to Renaissance for its services as subadviser is paid out of the fee the Investment Manager receives from each Fund and does not increase the expenses of the Fund.
The Investment Manager has contractually agreed, through at least May 1, 2023, to waive management fees and/or pay or reimburse fund expenses in order to limit total annual Fund operating expenses after fee waiver and expense reimbursements (exclusive of taxes, interest (including interest incurred in connection with bank and custody overdrafts, and in connection with securities sold short), shareholder servicing fees, distribution and service (12b-1) fees, brokerage commissions and other transaction costs, dividends payable with respect to securities sold short, acquired fund fees and expenses and extraordinary expenses) of 0.66% of the Fund’s average daily net assets (this annual rate or such other annual rate that may be in effect from time to time, the “Expense Cap”), subject to later reimbursement by the Fund in certain circumstances.
In general, for a period of up to 36 months after the date any amounts are paid, waived or reimbursed by the Investment Manager, the Investment Manager may recover such amounts from the Fund, provided that such repayment would not cause the Fund’s total annual operating expenses after fee waiver and expense reimbursements (exclusive of the items noted in the parenthetical above) to exceed either (i) the Expense Cap in effect at the time such amounts were paid, waived or reimbursed, or (ii) the Expense Cap in effect at the time of such repayment by the Fund.
The contractual expense limitation may only be terminated in the event the Investment Manager or a successor ceases to be the investment manager of the Fund or a successor fund, by mutual agreement between the Investment Manager and the Board, or in the event of the Fund’s liquidation unless the Fund is reorganized or is a party to a merger in which the surviving entity is successor to the accounting and performance information of the Fund.
At December 31, 2022, the Fund’s expiration of reimbursements subject to recoupment is as follows:
| | | | |
Expiration Period | | | |
| |
Less than 1 year | | | $164,987 | |
| |
1-2 years | | | 131,129 | |
| |
2-3 years | | | 145,481 | |
| | | | |
| |
Total | | | $441,597 | |
| | | | |
The Trust, on behalf of the Fund, has entered into an amended and restated Administration Agreement under which the Investment Manager serves as the Fund’s administrator (the “Administrator”) and is responsible for all non-portfolio management aspects of managing the Fund’s operations, including administration and shareholder services to the Fund. The Fund pays a fee to the Administrator at the rate of 0.15% per annum of the Fund’s average daily net assets for this service.
The Fund is distributed by AMG Distributors, Inc. (the “Distributor”), a wholly-owned subsidiary of the Investment Manager. The Distributor serves as the distributor and underwriter for the Fund and is a registered broker-dealer and member of the Financial Industry Regulatory Authority, Inc. (“FINRA”). Shares of the Fund will be continuously offered and will be sold directly to prospective purchasers and through brokers, dealers or other financial intermediaries who have executed selling agreements with the Distributor. Generally the Distributor bears all or a portion of the expenses of providing services pursuant to the distribution agreement, including the payment of the expenses relating to the distribution of prospectuses for sales purposes and any advertising or sales literature.
The Trust has adopted a distribution and service plan (the “Plan”) with respect to the Class N shares, in accordance with the requirements of Rule 12b-1 under the 1940 Act and the requirements of the applicable rules of FINRA regarding asset-based sales charges. Pursuant to the Plan, the Fund may make payments to the Distributor for its expenditures in financing any activity primarily intended to result in the sale of the Fund’s Class N shares and for maintenance and personal service provided to existing shareholders of that class. The Plan authorized payments to the Distributor up to 0.25% annually of the Fund’s average daily net assets attributable to the Class N shares.
For each of the Class N and Class I shares, the Board has approved reimbursement payments to the Investment Manager for shareholder servicing expenses (“shareholder servicing fees”) incurred. Shareholder servicing fees include payments to financial intermediaries, such as broker-dealers (including fund supermarket platforms), banks, and trust companies who provide shareholder recordkeeping, account servicing and other services. The Class N and Class I shares may reimburse the Investment Manager for the actual amount incurred up to a maximum annual rate of each Class’s average daily net assets as shown in the table below. Effective December 31, 2022, the Investment Manager has agreed, through at least December 31, 2023, to waive a portion of shareholder servicing fees paid by Class I, as necessary, to ensure the fees are limited to 0.07% for the Class.
19
| | |
| | | Notes to Financial Statements (continued) |
| | | |
| | | |
The impact on the annualized expense ratios for the fiscal year ended December 31, 2022, were as follows:
| | | | | | | | | | | | |
| | | Maximum Annual Amount Approved | | | Actual Amount Incurred | | | | |
| | | |
Class N | | | 0.15% | | | | 0.09% | | | | | |
| | | |
Class I | | | 0.15% | | | | 0.07% | | | | | |
The Board provides supervision of the affairs of the Trust and other trusts within the AMG Funds Family. The Trustees of the Trust who are not affiliated with the Investment Manager receive an annual retainer and per meeting fees for regular, special and telephonic meetings, and they are reimbursed for out-of-pocket expenses incurred while carrying out their duties as Board members. The Chairman of the Board and the Audit Committee Chair receive additional annual retainers. Certain Trustees and Officers of the Fund are Officers and/or Directors of the Investment Manager, AMG and/or the Distributor.
The Securities and Exchange Commission (the “SEC”) granted an exemptive order that permits certain eligible funds in the AMG Funds Family to lend and borrow money for certain temporary purposes directly to and from other eligible funds in the AMG Funds Family. Participation in this interfund lending program is voluntary for both the borrowing and lending funds, and an interfund loan is only made if it benefits each participating fund. The Administrator manages the program according to procedures approved by the Board, and the Board monitors the operation of the program. An interfund loan must comply with certain conditions set out in the exemptive order, which are designed to assure fairness and protect all participating funds. The interest earned and interest paid on interfund loans are included on the Statement of Operations as interest income and interest expense, respectively. At December 31, 2022, the Fund had no interfund loans outstanding.
The Fund did not utilize the interfund loan program during the fiscal year ended December 31, 2022.
3. PURCHASES AND SALES OF SECURITIES
Purchases and sales of securities (excluding short-term securities and U.S. Government Obligations) for the fiscal year ended December 31, 2022, were $36,711,664 and $27,265,770, respectively.
The Fund had no purchases or sales of U.S. Government Obligations during the fiscal year ended December 31, 2022.
4. PORTFOLIO SECURITIES LOANED
The Fund participates in the Program providing for the lending of securities to qualified borrowers. Securities lending income includes earnings of such temporary cash investments, plus or minus any rebate to a borrower. These earnings (after any rebate) are then divided between BNYM, as a fee for its services under the Program, and the Fund, according to agreed-upon rates. Collateral on all securities loaned is accepted in cash, U.S. Treasury Obligations or U.S. Government Agency Obligations. Collateral is maintained at a minimum level of 102% (105% in the case of certain foreign securities) of the market value, plus interest, if applicable, of investments on loan. It is the Fund’s policy to obtain additional collateral from or return excess collateral to the borrower by the end of the next business day, following the valuation date of the securities loaned. Therefore, the value of the collateral held may be temporarily less than the value of
the securities on loan. Lending securities entails a risk of loss to the Fund if and to the extent that the market value of the securities loaned were to increase and the borrower did not increase the collateral accordingly, and the borrower fails to return the securities. Under the terms of the Program, the Fund is indemnified for such losses by BNYM. Cash collateral is held in separate omnibus accounts managed by BNYM, who is authorized to exclusively enter into joint repurchase agreements for that cash collateral. Securities collateral is held in separate omnibus accounts managed by BNYM and cannot be sold or pledged. BNYM bears the risk of any deficiency in the amount of the cash collateral available for return to the borrower due to any loss on the collateral invested. Loans of securities are terminable at any time and the borrower, after notice, is required to return borrowed securities as soon as practical, which is normally within three business days.
The value of securities loaned on positions held, cash collateral and securities collateral received at December 31, 2022, were as follows:
| | | | | | | | | | | | | | | | |
Securities
Loaned | | Cash
Collateral
Received | | | Securities
Collateral
Received | | | Total
Collateral
Received | | | | |
| | | | |
$1,884,591 | | | — | | | | $1,925,776 | | | | $1,925,776 | | | | | |
The following table summarizes the securities received as collateral for securities lending at December 31, 2022:
| | | | | | |
| | | |
Collateral Type | | Coupon Range | | Maturity
Date Range | | |
| | | |
U.S. Treasury Obligations | | 0.000%-7.500% | | 01/15/23-05/15/52 | | |
5. COMMITMENTS AND CONTINGENCIES
Under the Trust’s organizational documents, its Trustees and Officers are indemnified against certain liabilities arising out of the performance of their duties to the Trust. In addition, in the normal course of business, the Fund may enter into contracts and agreements that contain a variety of representations and warranties, which provide general indemnifications. The maximum exposure to the Fund under these arrangements is unknown, as this would involve future claims that may be made against the Fund that have not yet occurred. However, based on experience, the Fund had no prior claims or losses and expects the risks of loss to be remote.
6. MASTER NETTING AGREEMENTS
The Fund may enter into master netting agreements with its counterparties for the Program and Repurchase Agreements, which provide the right, in the event of default (including bankruptcy or insolvency) for the non-defaulting party to liquidate the collateral and calculate net exposure to the defaulting party or request additional collateral. For financial reporting purposes, the Fund does not offset financial assets and financial liabilities that are subject to master netting agreements in the Statement of Assets and Liabilities. For securities lending transactions, see Note 4. At December 31, 2022, the Fund had no repurchase agreements outstanding.
7. SUBSEQUENT EVENTS
The Fund has determined that no material events or transactions occurred through the issuance date of the Fund’s financial statements which require an additional disclosure in or adjustment of the Fund’s financial statements.
20
| | |
| | | Report of Independent Registered Public Accounting Firm |
| | | |
| | | |
To the Board of Trustees of AMG Funds and Shareholders of AMG Renaissance Large Cap Growth Fund
Opinion on the Financial Statements
We have audited the accompanying statement of assets and liabilities, including the schedule of portfolio investments, of AMG Renaissance Large Cap Growth Fund (one of the funds constituting AMG Funds, referred to hereafter as the “Fund”) as of December 31, 2022, the related statement of operations for the year ended December 31, 2022, the statements of changes in net assets for each of the two years in the period ended December 31, 2022, including the related notes, and the financial highlights for each of the five years in the period ended December 31, 2022 (collectively referred to as the “financial statements”). In our opinion, the financial statements present fairly, in all material respects, the financial position of the Fund as of December 31, 2022, the results of its operations for the year then ended, the changes in its net assets for each of the two years in the period ended December 31, 2022 and the financial highlights for each of the five years in the period ended December 31, 2022 in conformity with accounting principles generally accepted in the United States of America.
Basis for Opinion
These financial statements are the responsibility of the Fund’s management. Our responsibility is to express an opinion on the Fund’s financial statements based on our audits. We are a public accounting firm registered with the Public Company Accounting Oversight Board (United States) (PCAOB) and are required to be independent with respect to the Fund in accordance with the U.S. federal securities laws and the applicable rules and regulations of the Securities and Exchange Commission and the PCAOB.
We conducted our audits of these financial statements in accordance with the standards of the PCAOB. Those standards require that we plan and perform the audit to obtain reasonable assurance about whether the financial statements are free of material misstatement, whether due to error or fraud.
Our audits included performing procedures to assess the risks of material misstatement of the financial statements, whether due to error or fraud, and performing procedures that respond to those risks. Such procedures included examining, on a test basis, evidence regarding the amounts and disclosures in the financial statements. Our audits also included evaluating the accounting principles used and significant estimates made by management, as well as evaluating the overall presentation of the financial statements. Our procedures included confirmation of securities owned as of December 31, 2022 by correspondence with the custodian and brokers; when replies were not received from brokers, we performed other auditing procedures. We believe that our audits provide a reasonable basis for our opinion.
/s/ PricewaterhouseCoopers LLP
Boston, Massachusetts
February 24, 2023
We have served as the auditor of one or more investment companies in the AMG Funds Family since 1993.
21
| | |
| | | Other Information (unaudited) |
| | | |
| | | |
TAX INFORMATION
AMG Renaissance Large Cap Growth Fund hereby designates the maximum amount allowable of its net taxable income as qualified dividends as provided in the Jobs and Growth Tax Relief Reconciliation Act of 2003. The 2022 Form 1099-DIV you receive for the Fund will show the tax status of all distributions paid to you during the year.
Pursuant to section 852 of the Internal Revenue Code, AMG Renaissance Large Cap Growth Fund hereby designates $6,631,823 as a capital gain distribution with respect to the taxable fiscal year ended December 31, 2022, or if subsequently determined to be different, the net capital gains of such year.
22
| | |
| | | AMG Funds Trustees and Officers |
| | | |
| | | |
| | | | | | | | |
| The Trustees and Officers of the Trust, their business addresses, principal occupations for the past five years and ages are listed below. The Trustees provide broad supervision over the affairs of the Trust and the Funds. The Trustees are experienced executives who meet periodically throughout the year to oversee the Funds’ activities, review contractual arrangements with companies that provide services to the Funds, and | | | | review the Funds’ performance. Unless otherwise noted, the address of each Trustee or Officer is the address of the Trust: 680 Washington Blvd., Suite 500, Stamford, CT. 06901. There is no stated term of office for Trustees. Trustees serve until their resignation, retirement or removal in | | | | accordance with the Trust’s organizational documents and policies adopted by the Board from time to time. The Chairman of the Trustees, President, Treasurer and Secretary of the Trust are elected by the Trustees annually. Other officers hold office at the pleasure of the Trustees. |
| | | | | | | | | |
Independent Trustees
The following Trustees are not “interested persons” of the Trust within the meaning of the 1940 Act:
| | |
Number of Funds Overseen in Fund Complex | | Name, Age, Principal Occupation(s) During Past 5 Years and Other Directorships Held by Trustee |
| | |
• Trustee since 2012 • Oversees 40 Funds in Fund Complex | | Bruce B. Bingham, 74 Partner, Hamilton Partners (real estate development firm) (1987-Present); Director of The Yacktman Funds, Inc. (2 portfolios) (2000-2012). |
| | |
• Trustee since 2013 • Oversees 44 Funds in Fund Complex • Chairman of the Audit Committee since 2021 | | Kurt A. Keilhacker, 59 Managing Partner, TechFund Europe (2000-Present); Managing Partner, TechFund Capital (1997-Present); Managing Partner, Elementum Ventures (2013-Present); Director, MetricStory, Inc. (2017-Present); Trustee, Wheaton College (2018-Present); Trustee, Gordon College (2001-2016); Board Member, 6wind SA (2002-2019). |
| | |
• Trustee since 2004 • Oversees 40 Funds in Fund Complex | | Steven J. Paggioli, 72 Independent Consultant (2002-Present); Trustee, Professionally Managed Portfolios (28 portfolios); Advisory Board Member, Sustainable Growth Advisors, LP; Independent Director, Muzinich BDC, Inc. (business development company) (2019-Present); Director, The Wadsworth Group; Independent Director, Chase Investment Counsel (2008–2019); Executive Vice President, Secretary and Director, Investment Company Administration, LLC and First Fund Distributors, INC. (1990-2001). |
| | |
• Independent Chairman of the Board of Trustees since 2017 • Chairman of the Governance Committee since 2017 • Trustee since 1999 • Oversees 44 Funds in Fund Complex | | Eric Rakowski, 64 Professor of Law, University of California at Berkeley School of Law (1990-Present); Tax Attorney at Davis Polk & Wardwell and clerked for Judge Harry T. Edwards of the U.S. Court of Appeals for the District of Columbia Circuit and for Justice William J. Brennan Jr. of the U.S. Supreme Court; Trustee of Parnassus Funds (3 portfolios) (2021-Present); Trustee of Parnassus Income Funds (2 portfolios) (2021-Present); Director of Harding, Loevner Funds, Inc. (10 portfolios); Trustee of Third Avenue Trust (3 portfolios) (2002-2019); Trustee of Third Avenue Variable Trust (1 portfolio) (2002-2019). |
| | |
• Trustee since 2013 • Oversees 44 Funds in Fund Complex | | Victoria L. Sassine, 57 Adjunct Professor, Babson College (2007–Present); Director, Board of Directors, PRG Group (2017-Present); CEO, Founder, Scale Smarter Partners, LLC (2018-Present); Adviser, EVOFEM Biosciences (2019-Present); Chairperson of the Board of Directors, Business Management Associates (2018-2019). |
| | |
• Trustee since 2004 • Oversees 40 Funds in Fund Complex | | Thomas R. Schneeweis, 75* Professor Emeritus, University of Massachusetts (2013-Present); President, TRS Associates (1982-Present); Board Member, Chartered Alternative Investment Association (“CAIA”) (2002-Present); Co-Founder and Director, Institute for Global Asset and Risk Management (Education) (2010-Present); Co-Owner, Quantitative Investment Technologies (2014-Present); Co-Owner, Yes Wealth Management (2018-Present); Director, CAIA Foundation (2010-2019); Partner, S Capital Wealth Advisors (2015-2018); Partner, S Capital Management, LLC (2007-2015); President, Alternative Investment Analytics, LLC (formerly Schneeweis Partners, LLC) (2001-2013). |
*Mr. Schneeweis retired from the Board of Trustees of AMG Funds as of December 31, 2022.
Interested Trustee
The Trustee in the following table is an “interested person” of the Trust within the meaning of the 1940 Act.
| | |
Number of Funds Overseen in Fund Complex | | Name, Age, Principal Occupation(s) During Past 5 Years and Other Directorships Held by Trustee |
23
| | |
| | | AMG Funds Trustees and Officers (continued) |
| | | |
| | | |
| | |
| | |
• Trustee since 2021 • Oversees 44 Funds in Fund Complex | | Garret W. Weston, 41 Affiliated Managers Group, Inc. (2008-Present): Managing Director, Co-Head of Affiliate Engagement (2021-Present), Senior Vice President, Affiliate Development (2016-2021), Vice President, Office of the CEO (2015-2016), Vice President, New Investments (2012-2015), Senior Associate, |
Officers
| | |
Position(s) Held with Fund and Length of Time Served | | Name, Age, Principal Occupation(s) During Past 5 Years |
| | |
• President since 2018 • Principal Executive Officer since 2018 • Chief Executive Officer since 2018 • Chief Operating Officer since 2007 | | Keitha L. Kinne, 64 Chief Operating Officer, AMG Funds LLC (2007-Present); Chief Investment Officer, AMG Funds LLC (2008-Present); President and Principal, AMG Distributors, Inc. (2018-Present); Chief Operating Officer, AMG Distributors, Inc. (2007-Present); President, Chief Executive Officer and Principal Executive Officer, AMG Funds, AMG Funds I, AMG Funds II, AMG Funds III and AMG Funds IV (2018-Present); Chief Operating Officer, AMG Funds, AMG Funds I, AMG Funds II, and AMG Funds III (2007-Present); Chief Operating Officer, AMG Funds IV (2016-Present); Chief Operating Officer and Chief Investment Officer, Aston Asset Management, LLC (2016); President and Principal Executive Officer, AMG Funds, AMG Funds I, AMG Funds II and AMG Funds III (2012-2014); Managing Partner, AMG Funds LLC (2007-2014); President and Principal, AMG Distributors, Inc. (2012-2014); Managing Director, Legg Mason & Co., LLC (2006-2007); Managing Director, Citigroup Asset Management (2004-2006). |
| | |
• Secretary since 2015 • Chief Legal Officer since 2015 | | Mark J. Duggan, 57 Managing Director and Senior Counsel, AMG Funds LLC (2021-Present); Senior Vice President and Senior Counsel, AMG Funds LLC (2015-2021); Secretary and Chief Legal Officer, AMG Funds, AMG Funds I, AMG Funds II, AMG Funds III and AMG Funds IV (2015-Present); Attorney, K&L Gates, LLP (2009-2015). |
| | |
• Chief Financial Officer since 2017 • Treasurer since 2017 • Principal Financial Officer since 2017 • Principal Accounting Officer since 2017 | | Thomas G. Disbrow, 56 Vice President, Mutual Fund Treasurer & CFO, AMG Funds, AMG Funds LLC (2017-Present); Chief Financial Officer, Principal Financial Officer, Treasurer and Principal Accounting Officer, AMG Funds, AMG Funds I, AMG Funds II, AMG Funds III and AMG Funds IV (2017-Present); Managing Director - Global Head of Traditional Funds Product Control, UBS Asset Management (Americas), Inc. (2015-2017); Managing Director - Head of North American Funds Treasury, UBS Asset Management (Americas), Inc. (2011-2015). |
| | |
• Deputy Treasurer since 2017 | | John A. Starace, 52 Vice President, Mutual Fund Accounting, AMG Funds LLC (2021-Present); Director, Mutual Fund Accounting, AMG Funds LLC (2017-2021); Vice President, Deputy Treasurer of Mutual Funds Services, AMG Funds LLC (2014-2017); Deputy Treasurer, AMG Funds, AMG Funds I, AMG Funds II, AMG Funds III and AMG Funds IV (2017-Present); Vice President, Citi Hedge Fund Services (2010-2014); Audit Senior Manager (2005-2010) and Audit Manager (2001-2005), Deloitte & Touche LLP. |
| | |
• Chief Compliance Officer and Sarbanes-Oxley Code of Ethics Compliance Officer since 2019 • Anti-Money Laundering Compliance Officer since 2022 | | Patrick J. Spellman, 48 Vice President, Chief Compliance Officer, AMG Funds LLC (2017-Present); Chief Compliance Officer, AMG Distributors, Inc. (2010-Present); Chief Compliance Officer and Sarbanes-Oxley Code of Ethics Compliance Officer, AMG Funds, AMG Funds I, AMG Funds II, AMG Funds III and AMG Funds IV (2019-Present); Anti-Money Laundering Compliance Officer, AMG Funds, AMG Funds I, AMG Funds II, and AMG Funds III (2014-2019; 2022-Present); Anti-Money Laundering Compliance Officer, AMG Funds IV (2016-2019; 2022-Present); Senior Vice President, Chief Compliance Officer, AMG Funds LLC (2011-2017); Compliance Manager, Legal and Compliance, Affiliated Managers Group, Inc. (2005-2011). |
| | |
• Assistant Secretary since 2016 | | Maureen M. Kerrigan, 37 Vice President, Senior Counsel, AMG Funds LLC (2021-Present); Vice President, Counsel, AMG Funds LLC (2019-2021); Director, Counsel, AMG Funds LLC (2017-2018); Vice President, Counsel, AMG Funds LLC (2015-2017); Assistant Secretary, AMG Funds, AMG Funds I, AMG Funds II, AMG Funds III and AMG Funds IV (2016-Present); Associate, Ropes & Gray LLP (2011-2015); Law Fellow, Massachusetts Appleseed Center for Law and Justice (2010-2011). |
24
| | |
| | |
| | | |
| | | |
| | | | | | | | | | | | |
INVESTMENT MANAGER AND ADMINISTRATOR AMG Funds LLC 680 Washington Blvd., Suite 500 Stamford, CT 06901 800.548.4539 DISTRIBUTOR AMG Distributors, Inc. 680 Washington Blvd., Suite 500 Stamford, CT 06901 800.548.4539 SUBADVISER The Renaissance Group LLC 625 Eden Park Drive, Suite 1200 Cincinnati, OH 45202 CUSTODIAN The Bank of New York Mellon Mutual Funds Custody 6023 Airport Road Oriskany, NY 13424 | | | | | | LEGAL COUNSEL Ropes & Gray LLP Prudential Tower, 800 Boylston Street Boston, MA 02199-3600 TRANSFER AGENT BNY Mellon Investment Servicing (US) Inc. Attn: AMG Funds 4400 Computer Drive Westborough, MA 01581 800.548.4539 Effective March 9, 2023, the Transfer Agent’s mailing address will change to the following: BNY Mellon Investment Servicing (US) Inc. AMG Funds Attn: 534426 AIM 154-0520 500 Ross Street Pittsburgh, PA 15262 800.548.4539 | | | | | | This report is prepared for the Fund’s shareholders. It is authorized for distribution to prospective investors only when preceded or accompanied by an effective prospectus. To receive a free copy of the prospectus or Statement of Additional Information, which includes additional information about Fund Trustees, please contact us by calling 800.548.4539. Distributed by AMG Distributors, Inc., member FINRA/SIPC. Current net asset values per share for the Fund are available on the Fund’s website at amgfunds.com. A description of the policies and procedures the Fund uses to vote its proxies is available: (i) without charge, upon request, by calling 800.548.4539, or (ii) on the Securities and Exchange Commission’s (SEC) website at sec.gov. For information regarding the Fund’s proxy voting record for the 12-month period ended June 30, call 800.548.4539 or visit the SEC website at sec.gov. The Fund files its complete schedule of portfolio holdings with the SEC for the first and third quarters of each fiscal year as an exhibit to their reports on Form N-PORT. The Fund’s portfolio holdings on Form N-PORT are available on the SEC’s website at sec.gov and the Fund’s website at amgfunds.com. To review a complete list of the Fund’s portfolio holdings, or to view the most recent semiannual report or annual report, please visit amgfunds.com. |
| | |
| | |
| | | |
| | | |
| | | | | | | | | | | | |
BALANCED FUNDS AMG GW&K Global Allocation GW&K Investment Management, LLC EQUITY FUNDS AMG Beutel Goodman International Equity Beutel, Goodman & Company Ltd. AMG Boston Common Global Impact Boston Common Asset Management, LLC AMG Frontier Small Cap Growth Frontier Capital Management Co., LLC AMG GW&K Small Cap Core AMG GW&K Small Cap Value AMG GW&K Small/Mid Cap AMG GW&K Small/Mid Cap Growth AMG GW&K Emerging Markets Equity AMG GW&K Emerging Wealth Equity AMG GW&K International Small Cap GW&K Investment Management, LLC AMG Montrusco Bolton Large Cap Growth Montrusco Bolton Investments, Inc. AMG Renaissance Large Cap Growth The Renaissance Group LLC | | | | | | AMG River Road Dividend All Cap Value AMG River Road Focused Absolute Value AMG River Road International Value Equity AMG River Road Large Cap Value Select AMG River Road Mid Cap Value AMG River Road Small-Mid Cap Value AMG River Road Small Cap Value River Road Asset Management, LLC AMG TimesSquare Emerging Markets Small Cap AMG TimesSquare Global Small Cap AMG TimesSquare International Small Cap AMG TimesSquare Mid Cap Growth AMG TimesSquare Small Cap Growth TimesSquare Capital Management, LLC AMG Veritas Asia Pacific AMG Veritas China AMG Veritas Global Focus AMG Veritas Global Real Return Veritas Asset Management LLP AMG Yacktman AMG Yacktman Focused AMG Yacktman Global AMG Yacktman Special Opportunities Yacktman Asset Management LP | | | | | | FIXED INCOME FUNDS AMG Beutel Goodman Core Plus Bond Beutel, Goodman & Company Ltd. AMG GW&K Core Bond ESG AMG GW&K Enhanced Core Bond ESG AMG GW&K ESG Bond AMG GW&K High Income AMG GW&K Municipal Bond AMG GW&K Municipal Enhanced Yield GW&K Investment Management, LLC |
| | | | |
| amgfunds.com | | | | 123122 AR024 |
| | |
| | ANNUAL REPORT |
| | |
| | | AMG Funds December 31, 2022 |
| | |
| | |  |
| | |
| | | AMG TimesSquare Small Cap Growth Fund |
| | |
| | | Class N: TSCPX | Class I: TSQIX | Class Z: TSCIX |
| | |
| | | AMG TimesSquare Mid Cap Growth Fund |
| | |
| | | Class N: TMDPX | Class I: TQMIX | Class Z: TMDIX |
| | |
| | | AMG TimesSquare International Small Cap Fund |
| | |
| | | Class N: TCMPX | Class I: TQTIX | Class Z: TCMIX |
| | |
| | | AMG TimesSquare Emerging Markets Small Cap Fund |
| | |
| | | Class N: TQENX | Class I: TQEIX | Class Z: TQEZX |
| | |
| | | AMG TimesSquare Global Small Cap Fund |
| | |
| | | Class N: TSYNX | Class I: TSYIX | Class Z: TSYZX |
| | | | |
| amgfunds.com | | | | 123122 AR012 |
| | |
| | | AMG Funds Annual Report — December 31, 2022 |
| | | | | | |
| | | | | | |
| | | TABLE OF CONTENTS | | PAGE | |
| | | |
| | | LETTER TO SHAREHOLDERS | | | 2 | |
| | | |
| | | ABOUT YOUR FUND’S EXPENSES | | | 3 | |
| | | |
| | | PORTFOLIO MANAGER’S COMMENTS, FUND SNAPSHOTS AND SCHEDULES OF PORTFOLIO INVESTMENTS | | | | |
| | | |
| | | AMG TimesSquare Small Cap Growth Fund | | | 4 | |
| | | |
| | | AMG TimesSquare Mid Cap Growth Fund | | | 11 | |
| | | |
| | | AMG TimesSquare International Small Cap Fund | | | 19 | |
| | | |
| | | AMG TimesSquare Emerging Markets Small Cap Fund | | | 27 | |
| | | |
| | | AMG TimesSquare Global Small Cap Fund | | | 35 | |
| | | |
| | | FINANCIAL STATEMENTS | | | | |
| | | |
| | | Statement of Assets and Liabilities | | | 43 | |
| | | |
| | | Balance sheets, net asset value (NAV) per share computations
and cumulative distributable earnings (loss) | | | | |
| | | |
| | | Statement of Operations | | | 45 | |
| | | |
| | | Detail of sources of income, expenses, and realized and
unrealized gains (losses) during the fiscal year | | | | |
| | | |
| | | Statements of Changes in Net Assets | | | 46 | |
| | | |
| | | Detail of changes in assets for the past two fiscal years | | | | |
| | | |
| | | Financial Highlights | | | 48 | |
| | | |
| | | Historical net asset values per share, distributions, total returns, income
and expense ratios, turnover ratios and net assets | | | | |
| | | |
| | | Notes to Financial Statements | | | 63 | |
| | | |
| | | Accounting and distribution policies, details of agreements and
transactions with Fund management and affiliates, and descriptions of
certain investment risks | | | | |
| | | |
| | | REPORT OF INDEPENDENT REGISTERED PUBLIC ACCOUNTING FIRM | | | 72 | |
| | | |
| | | OTHER INFORMATION | | | 73 | |
| | | |
| | | TRUSTEES AND OFFICERS | | | 74 | |
| | | | | | |
Nothing contained herein is to be considered an offer, sale or solicitation of an offer to buy shares of any series of the AMG Funds Family of Funds. Such offering is made only by prospectus, which includes details as to offering price and other material information.
| | |
| | Letter to Shareholders |
Dear Shareholder:
We are pleased to provide this annual report for your investment with AMG Funds. Our foremost goal is to provide investment solutions that help our shareholders successfully achieve their long-term investment goals. We appreciate the privilege of providing you with investment tools.
The past year was a challenging period for investors, as uncertainties about high inflation, tighter financial conditions, and the Russian invasion of Ukraine led to significant volatility. Global equity and bond markets fell in tandem amid sharply higher interest rates and eroding investor confidence as worries of an impending recession lingered most of the year. A global commodity shock caused by the war in Ukraine only made matters worse. The S&P 500® Index slipped into a bear market with the Index falling more than (24)% from its peak earlier in the year. The abrupt shift in markets this year has reset expectations around future growth, as the U.S. Federal Reserve (the Fed) and other global central banks have taken aggressive policy action to bring down inflation. While the outlook is uncertain given recent negative returns across many asset classes, global stock and bond valuations are now far more attractive entering 2023 compared to a year ago.
There was very wide dispersion in S&P 500® Index sector performance. Energy significantly outperformed all other sectors with a gain of 65.72% as the price of oil surged during the period. The defensive-oriented sectors also outperformed, although utilities was the only other sector with a positive return, gaining 1.54%. Consumer staples and health care were slightly negative with returns of (0.62)% and (1.95)%, respectively. High-growth technology and mega cap internet-related companies underperformed during the period, and real estate was impacted by higher interest rates. Communications services fell the most with a (39.93)% return during the year, followed by declines of (37.03)% for consumer discretionary, (28.14)% for information technology and (26.13)% for real estate. Value stocks held up much better than growth stocks as the Russell 1000® Value Index returned (7.54)% compared to the (29.14)% return for the Russell 1000® Growth Index. Small cap stocks struggled as the Russell 2000® Index lost (20.44)%. Outside the U.S., foreign developed markets were negative with a (14.45)% return for the MSCI EAFE Index, however a very strong fourth quarter rally drove international equity returns ahead of their U.S. counterparts for the year.
The 10-year Treasury yield more than doubled during the year, surging to the highest levels since before the Great Financial Crisis. Rapidly rising rates from a very low base led to historic negative performance for bonds as the Bloomberg U.S. Aggregate Bond Index, a broad measure of U.S. bond market performance, lost (13.01)% over the period. Investment-grade corporate bonds underperformed, returning (15.76)% for the year. High yield bonds held up better with a (11.19)% return as measured by the return of the Bloomberg U.S. Corporate High Yield Bond
Index. Municipal bonds were also negative, but outperformed the broader market with a (8.53)% return for the Bloomberg Municipal Bond Index.
AMG Funds provides access to a distinctive array of actively managed return-oriented investment strategies. You can rest assured that under all market conditions our team is focused on delivering excellent investment management services for your benefit. For more information about AMG Funds’ wide range of products and resources, please visit www.amgfunds.com. We thank you for your investment and continued trust in AMG Funds.
Respectfully,
Keitha Kinne
President
AMG Funds
| | | | | | | | | | | | | | | | |
| | | | | | | Periods ended | |
| Average Annual Total Returns | | | | December 31, 2022* | |
| | | | | |
| Stocks: | | | | | | 1 Year | | | 3 Years | | | 5 Years | |
| | | | | |
Large Cap | | (S&P 500® Index) | | | | | (18.11 | )% | | | 7.66 | % | | | 9.42 | % |
| | | | | |
Small Cap | | (Russell 2000® Index) | | | | | (20.44 | )% | | | 3.10 | % | | | 4.13 | % |
| | | | | |
International | | (MSCI ACWI ex USA) | | | | | (16.00 | )% | | | 0.07 | % | | | 0.88 | % |
| | | | | |
Bonds: | | | | | | | | | | | | | | | | |
| | | | | |
Investment Grade | | (Bloomberg U.S. Aggregate Bond Index) | | | | | (13.01 | )% | | | (2.71 | )% | | | 0.02 | % |
| | | | | |
High Yield | | (Bloomberg U.S. Corporate High Yield Bond Index) | | | | | (11.19 | )% | | | 0.05 | % | | | 2.31 | % |
| | | | | |
Tax-exempt | | (Bloomberg Municipal Bond Index) | | | | | (8.53 | )% | | | (0.77 | )% | | | 1.25 | % |
| | | | | |
Treasury Bills | | (ICE BofAML U.S. 6-Month Treasury Bill Index) | | | | | 1.34 | % | | | 0.82 | % | | | 1.39 | % |
*Source: FactSet. Past performance is no guarantee of future results.
2
| | |
| | | About Your Fund’s Expenses |
| | | |
| | | |
| | | | | | | | |
As a shareholder of a Fund, you may incur two types of costs: (1) transaction costs, which may include sales charges (loads) on purchase payments; redemption fees; and exchange fees; and (2) ongoing costs, including management fees; distribution (12b-1) fees; and other Fund expenses. This example is intended to help you understand your ongoing costs (in dollars) of investing in the Fund and to compare these costs with the ongoing costs of investing in other mutual funds. The example is based on $1,000 invested at the beginning of the period and held for the entire period as indicated below. ACTUAL EXPENSES The first line of the following table provides information about the actual account values and | | | | actual expenses. You may use the information in this line, together with the amount you invested, to estimate the expenses that you paid over the period. Simply divide your account value by $1,000 (for example, an $8,600 account value divided by $1,000 = 8.6), then multiply the result by the number in the first line under the heading entitled “Expenses Paid During the Period” to estimate the expenses you paid on your account during this period. HYPOTHETICAL EXAMPLE FOR COMPARISON PURPOSES The second line of the following table provides information about hypothetical account values and hypothetical expenses based on the Fund’s actual expense ratio and an assumed annual rate of return of 5% before expenses, which is not the Fund’s | | | | actual return. The hypothetical account values and expenses may not be used to estimate the actual ending account balance or expenses you paid for the period. You may use this information to compare the ongoing costs of investing in the Fund and other funds by comparing this 5% hypothetical example with the 5% hypothetical examples that appear in the shareholder reports of other funds. Please note that the expenses shown in the table are meant to highlight your ongoing costs only and do not reflect any transactional costs, such as sales charges (loads), redemption fees, or exchange fees. Therefore, the second line of the table is useful in comparing ongoing costs only, and will not help you determine the relative total costs of owning different funds. |
| | | | | | | | | | |
Six Months Ended December 31, 2022 | | Expense
Ratio for
the Period | | Beginning
Account
Value
07/01/22 | | Ending
Account
Value
12/31/22 | | | Expenses
Paid
During
the Period* |
AMG TimesSquare Small Cap Growth Fund |
|
Based on Actual Fund Return |
Class N | | 1.19% | | $1,000 | | | $1,087 | | | $6.26 |
Class I | | 1.07% | | $1,000 | | | $1,087 | | | $5.63 |
Class Z | | 0.99% | | $1,000 | | | $1,088 | | | $5.21 |
|
Based on Hypothetical 5% Annual Return |
Class N | | 1.19% | | $1,000 | | | $1,019 | | | $6.06 |
Class I | | 1.07% | | $1,000 | | | $1,020 | | | $5.45 |
Class Z | | 0.99% | | $1,000 | | | $1,020 | | | $5.04 |
AMG TimesSquare Mid Cap Growth Fund |
|
Based on Actual Fund Return |
Class N | | 1.18% | | $1,000 | | | $1,039 | | | $6.06 |
Class I | | 1.03% | | $1,000 | | | $1,040 | | | $5.30 |
Class Z | | 0.98% | | $1,000 | | | $1,040 | | | $5.04 |
|
Based on Hypothetical 5% Annual Return |
Class N | | 1.18% | | $1,000 | | | $1,019 | | | $6.01 |
Class I | | 1.03% | | $1,000 | | | $1,020 | | | $5.24 |
Class Z | | 0.98% | | $1,000 | | | $1,020 | | | $4.99 |
AMG TimesSquare International Small Cap Fund |
|
Based on Actual Fund Return |
Class N | | 1.27% | | $1,000 | | | $1,031 | | | $6.50 |
Class I | | 1.12% | | $1,000 | | | $1,031 | | | $5.73 |
Class Z | | 1.02% | | $1,000 | | | $1,032 | | | $5.22 |
|
Based on Hypothetical 5% Annual Return |
Class N | | 1.27% | | $1,000 | | | $1,019 | | | $6.46 |
Class I | | 1.12% | | $1,000 | | | $1,020 | | | $5.70 |
Class Z | | 1.02% | | $1,000 | | | $1,020 | | | $5.19 |
| | | | | | | | | | |
Six Months Ended December 31, 2022 | | Expense
Ratio for
the Period | | Beginning
Account
Value
07/01/22 | | Ending
Account
Value
12/31/22 | | | Expenses
Paid
During
the Period* |
AMG TimesSquare Emerging Markets Small Cap Fund |
|
Based on Actual Fund Return |
Class N | | 1.68% | | $1,000 | | | $1,026 | | | $8.58 |
Class I | | 1.28% | | $1,000 | | | $1,027 | | | $6.54 |
Class Z | | 1.28% | | $1,000 | | | $1,029 | | | $6.54 |
|
Based on Hypothetical 5% Annual Return |
Class N | | 1.68% | | $1,000 | | | $1,017 | | | $8.54 |
Class I | | 1.28% | | $1,000 | | | $1,019 | | | $6.51 |
Class Z | | 1.28% | | $1,000 | | | $1,019 | | | $6.51 |
| | | | | | | | | | |
AMG TimesSquare Global Small Cap Fund |
|
Based on Actual Fund Return |
Class N | | 1.25% | | $1,000 | | | $1,065 | | | $6.51 |
Class I | | 1.00% | | $1,000 | | | $1,066 | | | $5.21 |
Class Z | | 1.00% | | $1,000 | | | $1,066 | | | $5.21 |
|
Based on Hypothetical 5% Annual Return |
Class N | | 1.25% | | $1,000 | | | $1,019 | | | $6.36 |
Class I | | 1.00% | | $1,000 | | | $1,020 | | | $5.09 |
Class Z | | 1.00% | | $1,000 | | | $1,020 | | | $5.09 |
| * | Expenses are equal to the Fund’s annualized expense ratio multiplied by the average account value over the period, multiplied by the number of days in the most recent fiscal half-year (184), then divided by 365. |
3
| | |
| | | AMG TimesSquare Small Cap Growth Fund Portfolio Manager’s Comments (unaudited) |
| | | |
| | | |
| | | | | | | | |
The Year In Review For the year ended December 31, 2022, AMG TimesSquare Small Cap Growth Fund (the “Fund”) Class N shares returned (26.41)%, while the benchmark, the Russell 2000® Growth Index, returned (26.36)%. In 2022, global equity markets retreated sharply after three consecutive years of double-digit gains. For example, the MSCI World Index declined by (18)% after average calendar year gains of 22% from 2019 to 2021. Though there were many economic challenges for the markets last year, weakness among global equities did not arise from poor company fundamentals—realized and projected earnings per share for the average MSCI World stock were either stable or increased in 2022 while their price/earnings (P/E) ratios contracted. Weighing on the markets during the year was a combination of higher inflation rates, climbing commodity prices, tighter monetary policies, and slowing measures of business activities that moved into the range of economic contraction. Focusing on the U.S., the year began with highs and lows that moved to opposite ends of their respective spectrums. In January economic activities were well into the range of expansion, but by year-end they fell into contraction levels. Consumer expectations eroded, in part matching the progressive climb of inflation, though the latter began to recede in the fourth quarter. Perhaps the most notable and steady ascent in 2022 was driven by the U.S. Federal Reserve’s (the Fed) pace of rate increases—seven raises lifted the Federal funds rate from a zero-interest rate policy to a range of 4.25% to 4.50% in December. Over the year, among small-to-mid cap growth stocks, there was a pronounced preference for quality and valuation as stocks with higher returns on equity or lower price/earnings ratios outperformed. Higher risk stocks or those that lacked earnings were punished. Amid this environment, the Fund performed relatively in line with the Russell 2000® Growth Index for the full year. There was relative weakness in the energy and financials sectors that was mostly offset by strength from our positions in the health care, consumer discretionary, industrials, and information technology sectors. The strongest sector in the benchmark during 2022 was energy. Because we believe many of these companies lack unique competitive aspects, we tend to underweight this sector and that was detrimental to relative returns this year. Offsetting that effect | | | | somewhat was the 33% return for Matador Resources Co., an oil and natural gas exploration and production company with acreage in major Texas fields and the neighboring states. In January, we began buying shares in Matador and subsequently its revenues and earnings regularly exceeded expectations following better-than-expected well production that was accompanied by lower levels of capital expenditures. There were notable challenges in the financial sector this year, primarily from the banking industry. That included Silvergate Capital Corp., which provides financial infrastructure solutions and services to the digital currency industry. The midyear troubles of high-profile cryptocurrencies and their exchanges reverberated throughout that ecosystem and all service providers, such as Silvergate. While we initially believed Silvergate’s financial position was stable and its valuation was attractive, the market punished its shares late in the year and sentiment was unrelentingly negative. Lacking the conviction to rebuild the position, we sold our remaining shares, which were down (89)% while we owned them this year. The health care sector provided a performance booster throughout 2022. One example was Silk Road Medical, Inc., which develops innovative treatments for carotid artery diseases, particularly transcarotid artery revascularization (“TCAR”). Midyear, Silk’s shares lifted after its management was optimistic about the recently increased reimbursement coverage for TCAR and its potential for greater use. We added to our position and later in the fall, Silk increased its guidance for sales of TCAR and highlighted new opportunities for growth. That included greater levels of surgeon training and possible label expansion of TCAR use for additional needs. The result was a 24% climb for Silk’s shares this year. Detracting from that was Tandem Diabetes Care, Inc. and its (72)% decline for the year until we exited our position at the start of December. Earlier in the year, Tandem’s earnings fell below expectations as the company spent aggressively on new product development of insulin pumps for diabetes patients. Then in the summer, Tandem’s management noted that consumer concerns over inflation and recession weighed on device sales. To tackle that issue, Tandem announced a new long-term payment plan that lowers the device’s initial costs, though the market seemed to also be concerned about competing devices. At the time we thought the recent sales weakness would abate and that future product enhancements and upgrades would reaccelerate sales. When that failed to materialize in | | | | the fall, and Tandem’s results again fell shy of expectations, we lost confidence in its management and began selling our shares. Far better was the 15% gain from Shockwave Medical, Inc., the developer of intravascular devices for calcified cardiovascular diseases. Quarter after quarter, the company bested expectations for revenues and earnings, as well as regularly increasing its forward guidance. Shockwave successfully navigated staffing issues at hospitals early in the year, and we added to our position during the overall market weakness in the late spring. In the fall, when it announced increased sales of its C2 coronary catheter system following a resumption of medical procedures, we trimmed our position on its strength. When Shockwave’s price retreated toward the end of the year, likely on profit taking, we began increasing our holdings. The consumer discretionary sector was also beneficial this year. At the head of the class with a 40% gain was PowerSchool Holdings, Inc., a cloud-based platform and collaboration software provider for K-12 educational settings. We added to the position midyear on share price weakness. That decision was rewarded as its shares rallied on improving results, with sales growth across all its end markets. Customer retention was over 100% during the recent renewal period (meaning on a net basis customers renewed for a higher dollar level of services) and PowerSchool signed new contracts with a major city’s school system and an online education provider. Countering that was the (49)% drain from the shares of Leslie’s, Inc., which provides direct-to-consumer pool care products and services. Toward the end of the year its price weakened on the market perception that higher interest rates would be detrimental to any housing or housing-adjust companies, such as pools. Subsequently, Leslie’s reported higher revenues and earnings than expected, though initial guidance for the new fiscal year was weaker than expected. During Leslie’s first investor day since becoming a public company in 2020, it appeared that management was deliberately setting an overly conservative tone for 2023, especially because over 80% of its sales were tied to pool maintenance—and thus more stable—compared with new installations. Returning to the positives in the sector finds Visteon Corp., which designs and manufactures automotive electronics, primarily for driver information and display clusters. During the weakness among automotive and related businesses in the first half of the year, we added to our position because Visteon maintained its profitability and found alternative sources for components in short supply. Beginning |
4
| | |
| | | AMG TimesSquare Small Cap Growth Fund Portfolio Manager’s Comments (continued) |
| | | |
| | | |
| | | | | | | | |
in the second half of the year, Visteon’s revenues and earnings far surpassed expectations. Even though automotive production levels were flat, Visteon launched several new products and gained additional wins from various automotive manufacturers. That development lifted its stock, and we trimmed the position, which gained 18% for the overall year. Another bulwark for performance was the industrials sector. We actively traded our position in EMCOR Group, Inc., which had a 16% return for the year. Earlier in the year, EMCOR’s margins weakened as it dealt with supply chain issues across the range of construction and operational services for mechanical and electrical systems it provides to a broad range of commercial, industrial, utility, and institutional customers. We added to our holdings during this period of relative weakness. Then EMCOR’s price recovered in the summer and climbed sharply in the fall as the company held the line on its margins, saw its backlog grow sequentially, increased its forward guidance twice, and authorized an additional $500 million share repurchase plan. During those gains, we trimmed our position. Not as strong was the (56)% showing for The AZEK Co., Inc., a manufacturer of wood-alternative decking, railing, trim, and molding. At the start of the year, despite reporting inline results, AZEK’s shares were punished as profit margin guidance was lower than expected due to the inclusion of its StruXure acquisition, a manufacturer of aluminum pergolas and cabanas. In that environment, businesses that possessed any blemishes were punished. Later, AZEK continued delivering very strong revenues, with both its residential and commercial businesses posting impressive growth rates. Despite those positives, the stock traded down on housing market fears and commodity price inflationary pressures. We believe that AZEK’s weakness and valuations reached a floor in the fall, and that it should return to | | | | a stronger growth trajectory, so we added to our position. Gaining 23% since initiating the position in June was ITT, Inc., which manufactures engineered components and customized technological solutions for the energy, transportation, and industrial markets. Initially its industrial operations recovered from the past weakness ITT faced. Then toward the end of the year, ITT’s revenues and earnings were better than expected with consistent growth across all three of its business units. Lastly there was the information technology sector, which saw several acquisition targets among our holdings. One example was SailPoint Technologies Holdings, Inc., which develops identity governance systems for enterprise-wide use across various platforms and environments. The company began the year reporting strong quarterly results in which annualized recurring revenues and revenue growth exceeded projections due to strong demand for its products. Then in April, a private equity firm announced plans to acquire SailPoint and we sold our position, which had gained 35% while we owned it this year. Similarly, the international merchant acquirer and payment software provider EVO Payments, Inc. reported steadily improving results during the first half of the year. Subsequently, in August a larger firm in its industry announced plans to acquire EVO and we sold our shares, which had appreciated by 32% until then. Slipping by (67)% was Synaptics, Inc., a developer of human interface technologies for a variety of devices. In our view, the market seemed incorrectly focused on supply chain constraints early in the year and later dwelled on the company’s exposure to smartphones or PCs. We believe that Synaptics’ growth focus on its Internet of Things (IoT) components should more than offset the challenges of other areas, and we added to our position. We also expect growth to resume for Integral Ad Science Holdings Corp. and its digital advertising verification services. The (60)% | | | | weakness in its shares seemed tied to concerns that a recessionary environment may delay starting recent deals or otherwise elongate the sales cycle. However, Integral tools have been adopted by social media platforms, such as TikTok and Meta. We expect a return to its prior growth path with healthy margins, so we added to our holdings. Finally, there was a 17% contribution from ExlService Holdings, Inc., a business process outsourcing and analytics company. We added to our holdings at the start of the year and later ExlService reported revenues and earnings that exceeded expectations, boosted by strong performance in the analytics segment and digital transformation engagements. ExlService attracted a number of new customers throughout the year, and as its shares climbed, we pared back our position. Looking forward into 2023, many investors remain fixated on the macroeconomic environment. Which central bank will blink first by pausing—or even reversing—its quantitative tightening? Will those actions effectively reduce global inflation? How shallow or deep will 2023’s widely anticipated recession be? As bottom-up investors, our attention zeroes in on a company’s fundamentals and capital structure. While the contraction of P/E multiples weighed on nearly all stocks last year, many continued to increase their earnings and have stronger balance sheets than they did before the last recession. Stocks with that combination have a larger place in our strategy because we believe they will be well-positioned no matter what 2023 holds. The views expressed represent the opinions of TimesSquare Capital Management, LLC as of December 31, 2022, and are not intended as a forecast or guarantee of future results, and are subject to change without notice. |
5
|
AMG TimesSquare Small Cap Growth Fund Portfolio Manager’s Comments (continued) |
CUMULATIVE TOTAL RETURN PERFORMANCE
AMG TimesSquare Small Cap Growth Fund’s cumulative total return is based on the daily change in net asset value (NAV), and assumes that all dividends and distributions were reinvested. This graph compares a hypothetical $10,000 investment made in the AMG TimesSquare Small Cap Growth Fund’s Class N shares on December 31, 2012 to a $10,000 investment made in the Russell 2000® Growth Index for the same time period. The graph and table do not reflect the deduction of taxes that a shareholder would pay on a Fund distribution or redemption of shares. The listed returns for the Fund are net of expenses and the returns for the index exclude expenses. Total returns would have been lower had certain expenses not been reduced.
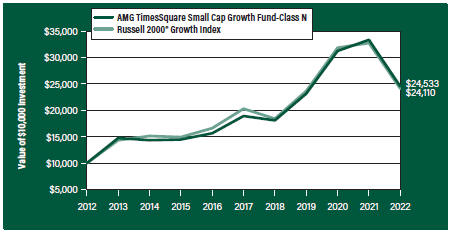
The table below shows the average annual total returns for the AMG TimesSquare Small Cap Growth Fund and the Russell 2000® Growth Index for the same time periods ended December 31, 2022.
| | | | | | | | | | | | | | | | | | | | |
| Average Annual Total Returns1 | | One
Year | | | Five
Years | | | Ten
Years | | | Since
Inception | | | Inception
Date | |
AMG TimesSquare Small Cap Growth Fund2, 3, 4, 5, 6 | |
| | | | | |
Class N | | | (26.41 | %) | | | 5.34 | % | | | 9.39% | | | | 8.14% | | | | 01/21/00 | |
| | | | | |
Class I | | | (26.34 | %) | | | 5.47 | % | | | — | | | | 7.37% | | | | 02/24/17 | |
| | | | | |
Class Z | | | (26.29 | %) | | | 5.55 | % | | | 9.61% | | | | 8.31% | | | | 01/21/00 | |
| | | | | |
Russell 2000® Growth Index7 | | | (26.36 | %) | | | 3.51 | % | | | 9.20% | | | | 4.57% | | | | 01/21/00 | † |
The performance data shown represents past performance. Past performance is not a guarantee of future results. Current performance may be lower or higher than the performance data quoted. The investment return and principal value of an investment will fluctuate so that an investor’s shares, when redeemed, may be worth more or less than their original cost.
Investors should carefully consider the Fund’s investment objectives, risks, charges and expenses before investing. For performance information through the most recent month end, current net asset values per share for the Fund and other information, please call 800.548.4539 or visit our website at amgfunds.com for a free prospectus. Read it carefully before investing or sending money.
Distributed by AMG Distributors, Inc., member FINRA/SIPC.
| † | Date reflects inception date of the Fund, not the index. |
| 1 | Total return equals income yield plus share price change and assumes reinvestment of all dividends and capital gain distributions. Returns are net of fees and may reflect offsets of Fund expenses as described in the prospectus. No adjustment has been made for taxes payable by shareholders on their reinvested dividends and |
|
capital gain distributions. Returns for periods greater than one year are annualized. The listed returns on the Fund are net of expenses and based on the published NAV as of December 31, 2022. All returns are in U.S. Dollars ($). 2 From time to time, the Fund’s investment manager has waived its fees and/or absorbed Fund expenses, which has resulted in higher returns. 3 The Fund is subject to risks associated with investments in small-capitalization companies, such as erratic earnings patterns, competitive conditions, limited earnings history and a reliance on one or a limited number of products. 4 The Fund invests in growth stocks, which may be more sensitive to market movements because their prices tend to reflect future investor expectations rather than just current profits. Growth stocks may underperform value stocks during given periods. 5 Companies that are in similar industry sectors may be similarly affected by particular economic or market events; to the extent the Fund has substantial holdings within a particular sector, the risks associated with that sector increase. 6 Market prices of investments held by the Fund may fall rapidly or unpredictably due to a variety of economic or political factors, market conditions, disasters or public health issues, or in response to events that affect particular industries or companies. 7 The Russell 2000® Growth Index measures the performance of the Russell 2000® companies with higher price-to-book ratios and higher forecasted growth values. Unlike the Fund, the Russell 2000® Growth Index is unmanaged, is not available for investment and does not incur expenses. The Russell 2000® Growth Index is a trademark of the London Stock Exchange Group companies. Not FDIC insured, nor bank guaranteed. May lose value. |
|
6
| | |
| | | AMG TimesSquare Small Cap Growth Fund Fund Snapshots (unaudited) December 31, 2022 |
PORTFOLIO BREAKDOWN
| | |
| Sector | | % of
Net Assets |
| | |
Industrials | | 23.6 |
| | |
Information Technology | | 23.0 |
| | |
Health Care | | 18.6 |
| | |
Consumer Discretionary | | 11.9 |
| | |
Financials | | 6.6 |
| | |
Energy | | 5.6 |
| | |
Consumer Staples | | 3.5 |
| | |
Real Estate | | 2.3 |
| | |
Communication Services | | 0.9 |
| | |
Short-Term Investments | | 5.7 |
| | |
Other Assets, less Liabilities | | (1.7) |
TOP TEN HOLDINGS
| | |
| Security Name | | % of
Net Assets |
| | |
Casella Waste Systems, Inc., Class A | | 2.5 |
| | |
Esab Corp. | | 2.4 |
| | |
WNS Holdings, Ltd., ADR (India) | | 2.3 |
| | |
HealthEquity, Inc. | | 2.2 |
| | |
ExlService Holdings, Inc. | | 2.1 |
| | |
PowerSchool Holdings, Inc., Class A | | 2.1 |
| | |
Matador Resources Co. | | 2.1 |
| | |
Driven Brands Holdings, Inc. | | 2.0 |
| | |
Paycor HCM, Inc. | | 2.0 |
| | |
Hamilton Lane, Inc., Class A | | 2.0 |
| | | |
| | |
Top Ten as a Group | | 21.7 |
| | |
Because a fund’s strategy may result in multiple investments in particular sectors of the economy, its performance may depend on the performance of those sectors and may fluctuate more widely than investments diversified across more sectors. For additional information on these and other risk considerations, please see the Fund’s prospectus.
Any sectors, industries, or securities discussed should not be perceived as investment recommendations. Mention of a specific security should not be considered a recommendation to buy or solicitation to sell that security. Specific securities mentioned in this report may have been sold from the Fund’s portfolio of investments by the time you receive this report.
7
| | |
| | | AMG TimesSquare Small Cap Growth Fund Schedule of Portfolio Investments December 31, 2022 |
| | | | | | | | |
| | | Shares | | | Value | |
| | |
Common Stocks - 96.0% | | | | | | | | |
| |
Communication Services - 0.9% | | | | | |
| | |
Integral Ad Science Holding Corp.* | | | 238,900 | | | | $2,099,931 | |
| |
Consumer Discretionary - 11.9% | | | | | |
| | |
Boot Barn Holdings, Inc.* | | | 41,100 | | | | 2,569,572 | |
| | |
Global-e Online, Ltd. (Israel)* | | | 72,200 | | | | 1,490,208 | |
| | |
Hilton Grand Vacations, Inc.* | | | 90,800 | | | | 3,499,432 | |
| | |
Leslie’s, Inc.* | | | 198,800 | | | | 2,427,348 | |
| | |
Malibu Boats, Inc., Class A* | | | 24,400 | | | | 1,300,520 | |
| | |
MYT Netherlands Parent, B.V. (Germany)* | | | 109,900 | | | | 979,209 | |
| | |
National Vision Holdings, Inc.*,1 | | | 109,900 | | | | 4,259,724 | |
| | |
Planet Fitness, Inc., Class A* | | | 46,800 | | | | 3,687,840 | |
| | |
Topgolf Callaway Brands Corp.*,1 | | | 145,300 | | | | 2,869,675 | |
| | |
Visteon Corp.* | | | 16,200 | | | | 2,119,446 | |
| | |
Wingstop, Inc.1 | | | 15,300 | | | | 2,105,586 | |
| | |
Total Consumer Discretionary | | | | | | | 27,308,560 | |
| |
Consumer Staples - 3.5% | | | | | |
| | |
BJ’s Wholesale Club Holdings, Inc.* | | | 60,600 | | | | 4,009,296 | |
| | |
The Simply Good Foods Co.* | | | 105,200 | | | | 4,000,756 | |
| | |
Total Consumer Staples | | | | | | | 8,010,052 | |
| |
Energy - 5.6% | | | | | |
| | |
Cactus, Inc., Class A | | | 69,800 | | | | 3,508,148 | |
| | |
Magnolia Oil & Gas Corp., Class A | | | 100,000 | | | | 2,345,000 | |
| | |
Matador Resources Co. | | | 84,100 | | | | 4,813,884 | |
| | |
SM Energy Co. | | | 59,300 | | | | 2,065,419 | |
| | |
Total Energy | | | | | | | 12,732,451 | |
| |
Financials - 6.6% | | | | | |
| | |
Focus Financial Partners, Inc., Class A* | | | 66,900 | | | | 2,493,363 | |
| | |
Hamilton Lane, Inc., Class A | | | 71,000 | | | | 4,535,480 | |
| | |
MVB Financial Corp. | | | 80,300 | | | | 1,768,206 | |
| | |
ProAssurance Corp. | | | 140,000 | | | | 2,445,800 | |
| | |
Victory Capital Holdings, Inc., Class A | | | 141,500 | | | | 3,796,445 | |
| | |
Total Financials | | | | | | | 15,039,294 | |
| |
Health Care - 18.6% | | | | | |
| | |
Addus HomeCare Corp.* | | | 20,300 | | | | 2,019,647 | |
| | |
Arcellx, Inc.*,1 | | | 21,100 | | | | 653,678 | |
| | |
Ascendis Pharma A/S, ADR (Denmark)*,1 | | | 32,500 | | | | 3,969,225 | |
| | |
AtriCure, Inc.* | | | 78,400 | | | | 3,479,392 | |
| | |
Azenta, Inc. | | | 24,900 | | | | 1,449,678 | |
| | |
Certara, Inc.* | | | 42,100 | | | | 676,547 | |
| | |
HealthEquity, Inc.* | | | 80,000 | | | | 4,931,200 | |
| | |
Heska Corp.* | | | 22,500 | | | | 1,398,600 | |
| | |
Inspire Medical Systems, Inc.* | | | 11,900 | | | | 2,997,372 | |
| | |
| | | | | | | | |
| | | | | | | | |
| | | Shares | | | Value | |
| | |
Intra-Cellular Therapies, Inc.* | | | 57,400 | | | | $3,037,608 | |
| | |
IVERIC bio, Inc.* | | | 78,400 | | | | 1,678,544 | |
| | |
Phreesia, Inc.* | | | 73,600 | | | | 2,381,696 | |
| | |
PTC Therapeutics, Inc.* | | | 49,700 | | | | 1,897,049 | |
| | |
Shockwave Medical, Inc.* | | | 9,800 | | | | 2,014,978 | |
| | |
Silk Road Medical, Inc.* | | | 71,200 | | | | 3,762,920 | |
| | |
Tarsus Pharmaceuticals, Inc.* | | | 141,550 | | | | 2,075,123 | |
| | |
Treace Medical Concepts, Inc.* | | | 95,600 | | | | 2,197,844 | |
| | |
Xenon Pharmaceuticals, Inc. (Canada)* | | | 45,100 | | | | 1,778,293 | |
| | |
Total Health Care | | | | | | | 42,399,394 | |
| |
Industrials - 23.6% | | | | | |
| | |
ACV Auctions, Inc., Class A*,1 | | | 155,800 | | | | 1,279,118 | |
| | |
ASGN, Inc.* | | | 25,300 | | | | 2,061,444 | |
| | |
The AZEK Co., Inc.* | | | 160,600 | | | | 3,263,392 | |
| | |
Casella Waste Systems, Inc., Class A* | | | 71,000 | | | | 5,631,010 | |
| | |
Columbus McKinnon Corp. | | | 44,500 | | | | 1,444,915 | |
| | |
Driven Brands Holdings, Inc.*,1 | | | 170,000 | | | | 4,642,700 | |
| | |
EMCOR Group, Inc. | | | 28,100 | | | | 4,161,891 | |
| | |
Esab Corp. | | | 118,000 | | | | 5,536,560 | |
| | |
Exponent, Inc. | | | 28,700 | | | | 2,843,883 | |
| | |
Hexcel Corp. | | | 62,100 | | | | 3,654,585 | |
| | |
ITT, Inc. | | | 46,500 | | | | 3,771,150 | |
| | |
RBC Bearings, Inc.* | | | 10,000 | | | | 2,093,500 | |
| | |
Regal Rexnord Corp. | | | 17,700 | | | | 2,123,646 | |
| | |
Saia, Inc.* | | | 11,400 | | | | 2,390,352 | |
| | |
Sun Country Airlines Holdings, Inc.*,1 | | | 79,300 | | | | 1,257,698 | |
| | |
Tetra Tech, Inc. | | | 16,200 | | | | 2,352,078 | |
| | |
WillScot Mobile Mini Holdings Corp.* | | | 45,900 | | | | 2,073,303 | |
| | |
Zurn Elkay Water Solutions Corp. | | | 156,800 | | | | 3,316,320 | |
| | |
Total Industrials | | | | | | | 53,897,545 | |
| |
Information Technology - 23.0% | | | | | |
| | |
Allegro MicroSystems, Inc.* | | | 105,200 | | | | 3,158,104 | |
| | |
CyberArk Software, Ltd. (Israel)* | | | 9,000 | | | | 1,166,850 | |
| | |
ExlService Holdings, Inc.* | | | 29,000 | | | | 4,913,470 | |
| | |
Flywire Corp.* | | | 80,700 | | | | 1,974,729 | |
| | |
JFrog, Ltd. (Israel)* | | | 107,100 | | | | 2,284,443 | |
| | |
MACOM Technology Solutions Holdings, Inc.* | | | 45,900 | | | | 2,890,782 | |
| | |
New Relic, Inc.* | | | 48,700 | | | | 2,749,115 | |
| | |
nLight, Inc.* | | | 156,400 | | | | 1,585,896 | |
| | |
Onto Innovation, Inc.* | | | 44,900 | | | | 3,057,241 | |
| | |
Paycor HCM, Inc.* | | | 186,400 | | | | 4,561,208 | |
| | |
PowerSchool Holdings, Inc., Class A* | | | 210,000 | | | | 4,846,800 | |
| | |
Q2 Holdings, Inc.* | | | 47,800 | | | | 1,284,386 | |
| | |
| | | | | | | | |
The accompanying notes are an integral part of these financial statements.
8
| | |
| | | AMG TimesSquare Small Cap Growth Fund Schedule of Portfolio Investments (continued) |
| | | | | | | | |
| | | Shares | | | Value | |
| | |
Information Technology - 23.0%
(continued) | | | | | | | | |
| | |
Smartsheet, Inc., Class A* | | | 60,200 | | | | $2,369,472 | |
| | |
Sprout Social, Inc., Class A*,1 | | | 39,200 | | | | 2,213,232 | |
| | |
Synaptics, Inc.* | | | 28,700 | | | | 2,731,092 | |
| | |
Vertex, Inc., Class A* | | | 172,000 | | | | 2,495,720 | |
| | |
WNS Holdings, Ltd., ADR (India)* | | | 66,000 | | | | 5,279,340 | |
| | |
Workiva, Inc.* | | | 36,800 | | | | 3,090,096 | |
| | |
Total Information Technology | | | | | | | 52,651,976 | |
| | |
Real Estate - 2.3% | | | | | | | | |
| | |
Kennedy-Wilson Holdings, Inc. | | | 146,200 | | | | 2,299,726 | |
| | |
National Storage Affiliates Trust, REIT | | | 81,300 | | | | 2,936,556 | |
| | |
Total Real Estate | | | | | | | 5,236,282 | |
| | |
Total Common Stocks
(Cost $209,867,412) | | | | | | | 219,375,485 | |
| | |
| | | Principal
Amount | | | | |
| |
Short-Term Investments - 5.7% | | | | | |
| |
Joint Repurchase Agreements - 1.5%2 | | | | | |
| | |
Citigroup Global Markets, Inc., dated 12/30/22,due 01/03/23, 4.250% total to be received $360,691 (collateralized by various U.S. Treasuries, 0.000% - 4.500%, 04/11/23 - 10/31/29, totaling $367,731) | | | $360,521 | | | | 360,521 | |
| | |
MUFG Securities America, Inc., dated 12/30/22,due 01/03/23, 4.300% total to be received $1,000,478 (collateralized by various U.S. Government Agency Obligations, 2.000% - 5.500%, 08/01/24 - 01/01/53, totaling $1,020,000) | | | 1,000,000 | | | | 1,000,000 | |
| | |
| | | | | | | | |
| | | | | | | | |
| | |
| | | Principal
Amount | | | Value | |
| | |
National Bank Financial, dated 12/30/22, due 01/03/23, 4.340% total to be received $1,000,482 (collateralized by various U.S. Treasuries, 0.000% - 4.435%, 01/03/23 - 09/09/49, totaling $1,020,000) | | | $1,000,000 | | | | $1,000,000 | |
| | |
RBC Dominion Securities, Inc., dated 12/30/22,due 01/03/23, 4.300% total to be received $1,000,478 (collateralized by various U.S. Government Agency Obligations, 2.000% - 6.000%, 09/01/24 - 10/20/52, totaling $1,020,000) | | | 1,000,000 | | | | 1,000,000 | |
| |
Total Joint Repurchase Agreements | | | | 3,360,521 | |
| | |
| | | Shares | | | | |
Other Investment Companies - 4.2% | | | | | |
| | |
Dreyfus Government Cash Management Fund, Institutional Shares, 4.19%3 | | | 3,889,998 | | | | 3,889,998 | |
| | |
Dreyfus Institutional Preferred Government Money Market Fund, Institutional Shares, 4.27%3 | | | 5,834,996 | | | | 5,834,996 | |
| | |
Total Other Investment Companies | | | | | | | 9,724,994 | |
| |
Total Short-Term Investments | | | | | |
(Cost $13,085,515) | | | | | | | 13,085,515 | |
| |
Total Investments - 101.7% | | | | | |
(Cost $222,952,927) | | | | | | | 232,461,000 | |
| |
Other Assets, less Liabilities - (1.7)% | | | | (3,812,432 | ) |
| |
Net Assets - 100.0% | | | | $228,648,568 | |
| |
| | | | | |
| * | Non-income producing security. |
| 1 | Some of these securities, amounting to $9,786,629 or 4.3% of net assets, were out on loan to various borrowers and are collateralized by cash and various U.S. Treasury Obligations. See Note 4 of Notes to Financial Statements. |
| 2 | Cash collateral received for securities lending activity was invested in these joint repurchase agreements. |
| 3 | Yield shown represents the December 31, 2022, seven day average yield, which refers to the sum of the previous seven days’ dividends paid, expressed as an annual percentage. |
ADR American Depositary Receipt
REIT Real Estate Investment Trust
The accompanying notes are an integral part of these financial statements.
9
| | |
| | | AMG TimesSquare Small Cap Growth Fund Schedule of Portfolio Investments (continued) |
The following table summarizes the inputs used to value the Fund’s investments by the fair value hierarchy levels as of December 31, 2022:
| | | | | | | | | | | | | | | | |
| | | Level 1 | | | Level 2 | | | Level 3 | | | Total | |
Investments in Securities | | | | | | | | | | | | | | | | |
| | | | |
Common Stocks† | | $ | 219,375,485 | | | | — | | | | — | | | $ | 219,375,485 | |
| | | | |
Short-Term Investments | | | | | | | | | | | | | | | | |
| | | | |
Joint Repurchase Agreements | | | — | | | $ | 3,360,521 | | | | — | | | | 3,360,521 | |
| | | | |
Other Investment Companies | | | 9,724,994 | | | | — | | | | — | | | | 9,724,994 | |
| | | | | | | | | | | | | | | | |
| | | | |
Total Investments in Securities | | $ | 229,100,479 | | | $ | 3,360,521 | | | | — | | | $ | 232,461,000 | |
| | | | | | | | | | | | | | | | |
| † | All common stocks held in the Fund are Level 1 securities. For a detailed breakout of common stocks by major industry classification, please refer to the Fund’s Schedule of Portfolio Investments. |
For the fiscal year ended December 31, 2022, there were no transfers in or out of Level 3.
The accompanying notes are an integral part of these financial statements.
10
| | |
| | | AMG TimesSquare Mid Cap Growth Fund Portfolio Manager’s Comments (unaudited) |
| | | |
| | | |
| | | | | | | | | | | | |
The Year In Review For the year ended December 31, 2022, AMG TimesSquare Mid Cap Growth Fund (the “Fund”) Class N shares returned (22.39%), while its benchmark, the Russell Midcap® Growth Index, returned (26.72)%. In 2022, global equity markets retreated sharply after three consecutive years of double-digit gains. For example, the MSCI World Index declined by (18)% after average calendar year gains of 22% from 2019 to 2021. Though there were many economic challenges for the markets last year, weakness among global equities did not arise from poor company fundamentals—realized and projected earnings per share for the average MSCI World stock were either stable or increased in 2022 while their price/earnings (P/E) ratios contracted. Weighing on the markets during the year was a combination of higher inflation rates, climbing commodity prices, tighter monetary policies, and slowing measures of business activities that moved into the range of economic contraction. Focusing on the U.S., the year began with highs and lows that moved to opposite ends of their respective spectrums. In January, economic activities were well into the range of expansion, but by year-end they fell into contraction levels. Consumer expectations eroded, in part matching the progressive climb of inflation, though the latter began to recede in the fourth quarter. Perhaps the most notable and steady ascent in 2022 was driven by the U.S. Federal Reserve’s (the Fed) pace of rate increases—seven raises lifted the Federal funds rate from a zero-interest rate policy to a range of 4.25% to 4.50% in December. Over the year, among small-to-mid cap growth stocks, there was a pronounced preference for quality and valuation as stocks with higher returns on equity or lower price/earnings ratios outperformed. Higher risk stocks or those that lacked earnings were punished. Amid this environment, the Fund outperformed the Russell Midcap® Growth Index for the full year through strong stock selection. The Fund experienced broad-based strength across industrials, communication services, consumer discretionary, materials, and health care. This was partially offset by relative weakness in the consumer staples and energy, and information technology sectors. Within the industrials sector, Cintas Corp. supplies uniforms and facilities services. Their latest fiscal quarter results outpaced Street projections. Its | | | | | | uniform rental segment experienced strong volume growth, while first aid and safety services also had increased organic revenues. The only blemish was a sequential decline in demand for personal protective equipment. Its shares edged forward by 3%. Booz Allen Hamilton Holding Corp. provides management and technology consulting services to U.S. government departments and agencies. The company reported revenues and earnings that were better than expected. All segments experienced revenue growth as well as an increase in backlogs. That in turn led to a high ratio of bookings to billings and a 26% rise in the stock price. We trimmed on this strength. Over the course of the year, we sold out of names with reduced growth prospects. TransUnion, a credit bureau offering risk and information services, tumbled (46)%. This position was liquidated during the third quarter due to the combination of weaker results with reduced guidance. Higher interest rates have diminished volumes of mortgage and refinancing. Generac Holdings, Inc. designs and manufactures power equipment and energy storage systems. We decided to exit the position during the fourth quarter with signs of continued softness in their home standby generator business. Its shares retreated (66)% while it was held. Of note, both TransUnion and Generac had been strong contributors in 2021. A new addition to the sector this year was Rockwell Automation, Inc., a provider of industrial automation and digital transformation solutions. Its shares had pulled back significantly and that gave us an attractive entry point for this high-quality business with secular growth prospects stemming from increased plant automation. Semiconductor shortages have lengthened lead times, but recently we have seen signs of improvement. Rockwell ascended 32% since it was purchased. In communication services, Zynga, Inc., a video game developer for mobile devices, agreed to be acquired by Take Two Interactive early in 2022. Its shares climbed 28% while held during the year. A more disappointing finish came from IAC, Inc. and its (66)% return. They are a media and internet services provider operating through four business segments. Angi is a leader in digital home services, Dotdash Meredith is the largest digital and print publisher in the U.S., IAC’s Search includes Ask. com as a broad collection of reference websites, and Emerging & Other is comprised of investments in early-stage companies. Macroeconomic headwinds impacted its digital and search businesses, while Angi revenue decelerated. | | | | | | Within consumer discretionary, O’Reilly Automotive, Inc. is a specialty retailer of after-market automotive parts and accessories. Their results were weak early in the year, then rebounded in the second half. We had added to the position in the middle of the year on price weakness. In the latest quarter, revenues and earnings surpassed sell-side estimates on higher same store comparisons. Their do-it-for-me professional mechanic business generated double-digit growth while do-it-yourself increased sales by a modest amount. The company managed to generate a 20% gain in its shares for the year. We decided to make changes to the Fund’s specialty retail positioning. Burlington Stores, Inc. operates as a discount retailer of branded apparel. We decided to liquidate the position during the third quarter as this company is more exposed to lower-income consumers that are under more inflationary pressure. Its shares lost (48)% for the time it was held. We replaced this position with Ross Stores, Inc., an off-price retailer of apparel and home accessories. We prefer Ross over Burlington due to the former’s product mix, exposure to a broader income range of customers, and better geographical exposure. Ross Stores received a 50% mark-up to its stock price since it was purchased. Another addition to the Fund was Tractor Supply Co., a retailer of farm and ranch products. We view this company as a best-in-class operator with consistent multi-year growth. There has been a population shift to more rural areas. Tractor Supply’s Neighbor’s Club customer loyalty program now boasts 28 million members, with many upgrading to higher level tiers. This stock was up 3% after being bought in the fourth quarter. The sector had other challenges related to the housing market and adjacent businesses due to high interest/mortgage rates. Pool Corp. is a wholesale distributor of swimming pool supplies, equipment, and related leisure products. For the third quarter, Pool experienced steady growth in maintenance, repair, and renovation. That offset weaker new pool construction Nevertheless, Pool’s shares dipped by (46)% for the year and we added to the position. Importantly, 80% of this company’s revenues come from maintenance. Floor & Decor Holdings, Inc. operates as a multi-channel specialty retailer of hard surface flooring and related accessories. Its management team reduced their full-year sales outlook and trimmed the top end of earnings guidance to account for anticipated macro-related demand challenges. We trimmed the position, which was down (47)%. |
11
| | |
| | | AMG TimesSquare Mid Cap Growth Fund Portfolio Manager’s Comments (continued) |
| | | |
| | | |
| | | | | | | | | | | | |
The Fund’s two positions in the materials sector moved in opposite directions. FMC Corp. is an agricultural sciences company offering solutions in areas such as crop protection, plant health, professional pest, and turf management. They consistently beat Street estimates throughout 2022 and we trimmed on the strength of the stock’s 16% rise. Management continues to view the outlook as favorable, underpinned by strong demand. Inflationary pressures appear to be easing and are supportive of margin expansion. Martin Marietta Materials, Inc., a supplier of aggregates to the construction industry, dropped (23)% on mixed results. Its management expressed concerns about 2023 aggregates volumes and we decided to reduce the position. In financials, Signature Bank is a commercial bank operating predominantly in the New York metropolitan area. Its shares plummeted (64)% on mixed results that included loan growth, though with a lower-than-expected net interest margin caused by a higher level of interest-bearing deposits. The stock was also impacted by souring sentiment on the cryptocurrency market. While the bank has no direct exposure, some of its deposit balances are for institutional investors trading crypto. In December, the company announced plans to cap the level of cryptocurrency deposits. Credit to the sector came from RenaissanceRe Holdings, Ltd., which staged a recovery in 2022. They are a provider of reinsurance and insurance services. Key attributes for this company are its very capable management team and their conservative accounting, which over-reserves for potential losses. The hurricane season of July through early November can be a bit frenetic based on the amount of storm activity. For this year, RenaissanceRe exceeded expectations on higher net investment income and catastrophe losses were in line with their preannouncement. Recent hurricane activity has resulted in a firmer pricing environment for property catastrophe reinsurance. Gross premiums written were well above Street projections. The stock rose 10% and we trimmed the position. Health care was home to the Fund’s top and bottom performers. Pharmaceutical distributor AmerisourceBergen Corp. jumped 26%. Early in the year, they along with fellow drug distributors Cardinal Health and McKesson reached an agreement with states across the country to settle claims related to the opioid crisis. Its results were steady throughout the year. Management has acknowledged macroeconomic headwinds while emphasizing its international business has remained | | | | | | resilient and U.S. growth was strong. We trimmed the AmerisourceBergen position. Catalent Inc. is an outsourced contract manufacturing organization serving the biopharmaceutical and consumer health industries. Recent results came in below both the sell-side and our estimates. Management pointed to weaker macroeconomic conditions impacting consumer and company spending. Forward guidance also factors in lower COVID-related revenues. We decided to exit the position, with the stock tumbling (64)% for the time it was held during the year. Partially countering that was a boost from Encompass Health Corp. and its 33% improvement. This company is a market leader in inpatient rehabilitation after spinning off their home health and hospice business during the year. Encompass continues to meet volume demands and is well positioned for further growth. The industry is working through a period of nursing shortages and higher labor costs. In the latter part of 2022, they broadened their reach through the acquisition of three inpatient rehabilitation facilities. The shares of Encompass leapt forward 16% for the year and we opportunistically added to the position. Third quarter additions of IDEXX Laboratories, Inc and Legend Biotech Corp made solid contributions to the sector with returns of 11% and 45%, respectively. IDEXX develops, manufactures, and distributes products and services for veterinary, livestock, poultry, and dairy markets. Management narrowed short-term guidance as they continue to experience solid, yet somewhat moderated growth due to capacity constraints in U.S. markets and some macro-related volatility in its international business. Legend is a clinical-stage biopharmaceutical company engaged in the discovery and development of novel therapies for oncology and other indications. The company’s lead product is a CAR-T treatment for multiple myeloma and is currently in joint development/commercialization with Janssen Biotech. Chimeric antigen receptor T cells are genetically engineered for use in immunotherapy. A challenge to health care came from one of the Fund’s strongest performers in 2021. Charles River Laboratories International, Inc. an early-stage contract research organization aiding the biopharmaceutical industry in the discovery and development of drugs, devices, and therapies. The combination of soft results and lowered guidance caused us to reassess the position and we decided to sell out of the stock during the third quarter, despite its (41)% decline. Management cited challenges coming from adverse foreign currency translations and a cancelled COVID contract. | | | | | | Within consumer staples, Olaplex Holdings, Inc. is a technology-driven beauty company focused on developing patent-protected hair care products that are sold to hair salons, retailers, and directly to consumers. The combination of a large miss to third quarter estimates and guidance well below Street projections caused its shares to sell off by (84)%. They expect professional channel sales to be lower for some time as salons work through existing inventory levels. We exited the position during the fourth quarter on this development. Better was Casey’s General Stores Inc. with its 13% gain. This stock was added to the Fund in the second quarter. Casey’s operates over 2,000 gas stations and convenience stores across the Midwestern U.S. Results were higher than expected and driven by better same-store sales. In the energy sector, Cheniere Energy, Inc. is an energy infrastructure company that operates liquefied natural gas (LNG) terminals in Louisiana and Texas. The company is well positioned to benefit from tight conditions in the global LNG market. Solid results led to a 49% surge in its stock price. We bolstered the sector weight by adding Pioneer Natural Resources Co., an exploration and production company with operations in Texas. They reported a slight beat to production estimates with other metrics within their guidance range. The company continued with its aggressive capital return program inclusive of a sizable quarterly dividend and share repurchases. Management announced a shift to its drilling plans by focusing on acreage with higher expected returns. Pioneer rose 24% since its purchase. Sentiment became decidedly more negative in information technology as the year progressed. While cyber remains a key topic in news headlines and a prominent category for IT budgets, management teams have witnessed a challenging macroeconomic environment that is altering customer behaviors such as increased deal scrutiny and elongated sales cycles. Such was the case with CrowdStrike Holdings, Inc., a provider of cybersecurity products and services to stop network breaches. Its stock sold off by (48)% on mixed results and lower forward guidance. Semiconductors also came under end market pressures. Marvell Technology, Inc. is a leading provider of high-speed communications semiconductors for data storage, networking, and connectivity. In the middle of the year, Marvell’s shares seemed to retreat with the rest of the semiconductor industry on fears of cyclical weakness and the impact from China’s lockdowns. They later reported in line results, though with |
12
| | |
| | | AMG TimesSquare Mid Cap Growth Fund Portfolio Manager’s Comments (continued) |
| | | |
| | | |
| | | | | | | | |
reduced guidance. Management noted cancellations and pushouts of orders, mostly in their storage business. Chinese enterprise customers are also going through an inventory correction, while others are holding up well. We believe that Marvell should benefit from its secular growth opportunities, such as cloud-based data centers and 5G base stations. Outpacing the index average of (33)% was research and advisory company Gartner, Inc. and its 0% return, which consistently beat consensus estimates. This was driven by solid results in Research and Consulting, while its Conferences business | | | | experienced a highly successful return to in-person events. These had been cancelled during the pandemic. Looking forward into 2023, many investors remain fixated on the macroeconomic environment. Which central bank will blink first by pausing—or even reversing—its quantitative tightening? Will those actions effectively reduce global inflation? How shallow or deep will 2023’s widely anticipated recession be? As bottom-up investors, our attention zeroes in on a company’s fundamentals and capital structure. While the contraction of P/E multiples | | | | weighed on nearly all stocks last year, many continued to increase their earnings and have stronger balance sheets than they did before the last recession. Stocks with that combination have a larger place in our strategy because we believe they will be well-positioned no matter what 2023 holds. The views expressed represent the opinions of TimesSquare Capital Management, LLC as of December 31, 2022, and are not intended as a forecast or guarantee of future results, and are subject to change without notice. |
13
|
AMG TimesSquare Mid Cap Growth Fund Portfolio Manager’s Comments (continued) |
CUMULATIVE TOTAL RETURN PERFORMANCE
AMG TimesSquare Mid Cap Growth Fund’s cumulative total return is based on the daily change in net asset value (NAV), and assumes that all dividends and distributions were reinvested. This graph compares a hypothetical $10,000 investment made in the AMG TimesSquare Mid Cap Growth Fund’s Class N shares on December 31, 2012 to a $10,000 investment made in the Russell Midcap® Growth Index for the same time period. The graph and table do not reflect the deduction of taxes that a shareholder would pay on a Fund distribution or redemption of shares. The listed returns for the Fund are net of expenses and the returns for the index exclude expenses. Total returns would have been lower had certain expenses not been reduced.
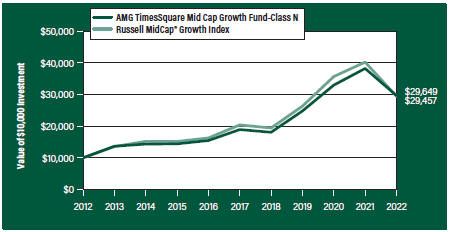
The table below shows the average annual total returns for the AMG TimesSquare Mid Cap Growth Fund and the Russell Midcap® Growth Index for the same time periods ended December 31, 2022.
| | | | | | | | | | | | | | | | | | | | |
| | | One | | | Five | | | Ten | | | Since | | | Inception | |
| Average Annual Total Returns1 | | Year | | | Years | | | Years | | | Inception | | | Date | |
|
AMG TimesSquare Mid Cap Growth Fund2, 3, 4, 5, 6 | |
| | | | | |
Class N | | | (22.39 | %) | | | 9.40 | % | | | 11.48 | % | | | 9.73 | % | | | 03/04/05 | |
| | | | | |
Class I | | | (22.23 | %) | | | 9.56 | % | | | | — | | | 10.77 | % | | | 02/24/17 | |
| | | | | |
Class Z | | | (22.18 | %) | | | 9.62 | % | | | 11.71 | % | | | 9.94 | % | | | 03/04/05 | |
| | | | | |
Russell Midcap® Growth Index7 | | | (26.72 | %) | | | 7.64 | % | | | 11.41 | % | | | 9.09 | % | | | 03/04/05 | † |
The performance data shown represents past performance. Past performance is not a guarantee of future results. Current performance may be lower or higher than the performance data quoted. The investment return and principal value of an investment will fluctuate so that an investor’s shares, when redeemed, may be worth more or less than their original cost.
Investors should carefully consider the Fund’s investment objectives, risks, charges and expenses before investing. For performance information through the most recent month end, current net asset values per share for the Fund and other information, please call 800.548.4539 or visit our website at amgfunds.com for a free prospectus. Read it carefully before investing or sending money.
Distributed by AMG Distributors, Inc., member FINRA/SIPC.
| † | Date reflects inception date of the Fund, not the index. |
| 1 | Total return equals income yield plus share price change and assumes reinvestment of all dividends and capital gain distributions. Returns are net of fees and may reflect offsets of Fund expenses as described in the prospectus. No adjustment has been made for taxes payable by shareholders on their reinvested dividends and |
|
capital gain distributions. Returns for periods greater than one year are annualized. The listed returns on the Fund are net of expenses and based on the published NAV as of December 31, 2022. All returns are in U.S. Dollars ($). 2 From time to time, the Fund’s investment manager has waived its fees and/or absorbed Fund expenses, which has resulted in higher returns. 3 The Fund is subject to risks associated with investments in mid-capitalization companies such as greater price volatility, lower trading volume, and less liquidity than the stocks of larger, more established companies. 4 The Fund invests in growth stocks, which may be more sensitive to market movements because their prices tend to reflect future investor expectations rather than just current profits. Growth stocks may underperform value stocks during given periods. 5 Companies that are in similar industry sectors may be similarly affected by particular economic or market events; to the extent the Fund has substantial holdings within a particular sector, the risks associated with that sector increase. 6 Market prices of investments held by the Fund may fall rapidly or unpredictably due to a variety of economic or political factors, market conditions, disasters or public health issues, or in response to events that affect particular industries or companies. 7 The Russell Midcap® Growth Index measures the performance of those Russell Midcap® companies with higher price/book ratios and higher forecasted growth values. The stocks are also members of the Russell 1000® Growth Index. Unlike the Fund, the Russell Midcap® Growth Index is unmanaged, is not available for investment and does not incur expenses. The Russell Midcap® Growth Index is a trademark of the London Stock Exchange Group companies. Not FDIC insured, nor bank guaranteed. May lose value. |
| |
| |
| |
| |
| |
| |
| |
| |
| |
| |
| |
| |
| |
| |
14
| | |
| | | AMG TimesSquare Mid Cap Growth Fund Fund Snapshots (unaudited) December 31, 2022 |
PORTFOLIO BREAKDOWN
| | |
Sector | | % of
Net Assets |
| | |
Information Technology | | 28.9 |
| | |
Industrials | | 19.6 |
| | |
Health Care | | 15.0 |
| | |
Consumer Discretionary | | 14.5 |
| | |
Financials | | 8.4 |
| | |
Energy | | 3.9 |
| | |
Materials | | 2.7 |
| | |
Consumer Staples | | 2.1 |
| | |
Real Estate | | 2.1 |
| | |
Communication Services | | 2.1 |
| | |
Short-Term Investments | | 3.8 |
| | |
Other Assets, less Liabilities | | (3.1) |
TOP TEN HOLDINGS
| | |
Security Name | | % of
Net Assets |
| | |
Gartner, Inc. | | 3.4 |
| | |
O’Reilly Automotive, Inc. | | 3.1 |
| | |
Waste Connections, Inc. | | 3.1 |
| | |
Cintas Corp. | | 2.6 |
| | |
AmerisourceBergen Corp. | | 2.5 |
| | |
RenaissanceRe Holdings, Ltd. (Bermuda) | | 2.3 |
| | |
Synopsys, Inc. | | 2.3 |
| | |
Palo Alto Networks, Inc. | | 2.2 |
| | |
SBA Communications Corp., Class A | | 2.1 |
| | |
Amphenol Corp., Class A | | 1.9 |
| | | |
| | |
Top Ten as a Group | | 25.5 |
| | |
Because a fund’s strategy may result in multiple investments in particular sectors of the economy, its performance may depend on the performance of those sectors and may fluctuate more widely than investments diversified across more sectors. For additional information on these and other risk considerations, please see the Fund’s prospectus.
Any sectors, industries, or securities discussed should not be perceived as investment recommendations. Mention of a specific security should not be considered a recommendation to buy or solicitation to sell that security. Specific securities mentioned in this report may have been sold from the Fund’s portfolio of investments by the time you receive this report.
15
| | |
| | | AMG TimesSquare Mid Cap Growth Fund Schedule of Portfolio Investments December 31, 2022 |
| | | | | | | | |
| | | Shares | | | Value | |
| | |
Common Stocks - 99.3% | | | | | | | | |
| | |
Communication Services - 2.1% | | | | | | | | |
| | |
IAC, Inc.* | | | 120,200 | | | | $5,336,880 | |
| | |
Pinterest, Inc., Class A* | | | 470,600 | | | | 11,426,168 | |
| | |
Take-Two Interactive Software, Inc.* | | | 64,200 | | | | 6,685,146 | |
| | |
Total Communication Services | | | | | | | 23,448,194 | |
| | |
Consumer Discretionary - 14.5% | | | | | | | | |
| | |
Aptiv PLC (Ireland)* | | | 186,600 | | | | 17,378,058 | |
| | |
Brunswick Corp. | | | 275,000 | | | | 19,822,000 | |
| | |
Floor & Decor Holdings, Inc., Class A*,1 | | | 129,100 | | | | 8,989,233 | |
| | |
Lululemon Athletica, Inc. (Canada)* | | | 45,300 | | | | 14,513,214 | |
| | |
Marriott Vacations Worldwide Corp. | | | 106,800 | | | | 14,374,212 | |
| | |
O’Reilly Automotive, Inc.* | | | 41,000 | | | | 34,605,230 | |
| | |
Pool Corp. | | | 60,650 | | | | 18,336,314 | |
| | |
Ross Stores, Inc. | | | 163,800 | | | | 19,012,266 | |
| | |
Tractor Supply Co. | | | 69,475 | | | | 15,629,791 | |
| | |
Total Consumer Discretionary | | | | | | | 162,660,318 | |
| | |
Consumer Staples - 2.1% | | | | | | | | |
| | |
BJ’s Wholesale Club Holdings, Inc.* | | | 161,000 | | | | 10,651,760 | |
| | |
Casey’s General Stores, Inc. | | | 55,500 | | | | 12,451,425 | |
| | |
Total Consumer Staples | | | | | | | 23,103,185 | |
| | |
Energy - 3.9% | | | | | | | | |
| | |
Antero Resources Corp.* | | | 329,600 | | | | 10,214,304 | |
| | |
Cheniere Energy, Inc. | | | 133,700 | | | | 20,049,652 | |
| | |
Pioneer Natural Resources Co. | | | 60,800 | | | | 13,886,112 | |
| | |
Total Energy | | | | | | | 44,150,068 | |
| | |
Financials - 8.4% | | | | | | | | |
| | |
Brown & Brown, Inc. | | | 190,700 | | | | 10,864,179 | |
| | |
Interactive Brokers Group, Inc., Class A | | | 261,200 | | | | 18,897,820 | |
| | |
Markel Corp.* | | | 5,100 | | | | 6,719,199 | |
| | |
Nasdaq, Inc. | | | 186,600 | | | | 11,447,910 | |
| | |
RenaissanceRe Holdings, Ltd. (Bermuda)1 | | | 141,000 | | | | 25,976,430 | |
| | |
Signature Bank | | | 80,600 | | | | 9,286,732 | |
| | |
TPG, Inc. | | | 403,800 | | | | 11,237,754 | |
| | |
Total Financials | | | | | | | 94,430,024 | |
| | |
Health Care - 15.0% | | | | | | | | |
| | |
AmerisourceBergen Corp. | | | 169,800 | | | | 28,137,558 | |
| | |
Argenx SE, ADR (Netherlands)* | | | 32,200 | | | | 12,198,326 | |
| | |
Ascendis Pharma A/S, ADR (Denmark)*,1 | | | 102,700 | | | | 12,542,751 | |
| | |
Chemed Corp. | | | 33,700 | | | | 17,201,491 | |
| | |
Encompass Health Corp. | | | 248,800 | | | | 14,880,728 | |
| | |
Envista Holdings Corp.* | | | 291,300 | | | | 9,808,071 | |
| | |
ICON PLC (Ireland)* | | | 64,500 | | | | 12,529,125 | |
| | |
| | | | | | | | |
| | | | | | | | |
| | | Shares | | | Value | |
| | |
IDEXX Laboratories, Inc.* | | | 43,700 | | | | $17,827,852 | |
| | |
Legend Biotech Corp., ADR * | | | 217,700 | | | | 10,867,584 | |
| | |
Royalty Pharma PLC, Class A | | | 422,900 | | | | 16,713,008 | |
| | |
Veeva Systems, Inc., Class A* | | | 93,300 | | | | 15,056,754 | |
| | |
Total Health Care | | | | | | | 167,763,248 | |
| | |
Industrials - 19.6% | | | | | | | | |
| | |
AMETEK, Inc. | | | 122,300 | | | | 17,087,756 | |
| | |
AO Smith Corp. | | | 273,400 | | | | 15,649,416 | |
| | |
Booz Allen Hamilton Holding Corp. | | | 130,600 | | | | 13,650,312 | |
| | |
Carlisle Cos., Inc. | | | 42,000 | | | | 9,897,300 | |
| | |
Cintas Corp. | | | 65,900 | | | | 29,761,758 | |
| | |
Copart, Inc.* | | | 268,500 | | | | 16,348,965 | |
| | |
CoStar Group, Inc.* | | | 230,100 | | | | 17,782,128 | |
| | |
Equifax, Inc. | | | 55,000 | | | | 10,689,800 | |
| | |
Hubbell, Inc. | | | 43,100 | | | | 10,114,708 | |
| | |
Nordson Corp. | | | 59,600 | | | | 14,168,112 | |
| | |
Rockwell Automation, Inc. | | | 42,000 | | | | 10,817,940 | |
| | |
Verisk Analytics, Inc., Class A | | | 112,000 | | | | 19,759,040 | |
| | |
Waste Connections, Inc. | | | 259,100 | | | | 34,346,296 | |
| | |
Total Industrials | | | | | | | 220,073,531 | |
| | |
Information Technology - 28.9% | | | | | | | | |
| | |
Amphenol Corp., Class A | | | 284,000 | | | | 21,623,760 | |
| | |
Aspen Technology, Inc.* | | | 53,900 | | | | 11,071,060 | |
| | |
Bentley Systems, Inc., Class B | | | 362,800 | | | | 13,409,088 | |
| | |
Crowdstrike Holdings, Inc., Class A* | | | 142,100 | | | | 14,961,709 | |
| | |
CyberArk Software, Ltd. (Israel)* | | | 84,300 | | | | 10,929,495 | |
| | |
Elastic, N.V.* | | | 149,300 | | | | 7,688,950 | |
| | |
Enphase Energy, Inc.* | | | 17,300 | | | | 4,583,808 | |
| | |
Entegris, Inc. | | | 146,200 | | | | 9,589,258 | |
| | |
Gartner, Inc.* | | | 113,500 | | | | 38,151,890 | |
| | |
HubSpot, Inc.* | | | 29,100 | | | | 8,413,683 | |
| | |
Keysight Technologies, Inc.* | | | 102,100 | | | | 17,466,247 | |
| | |
Marvell Technology, Inc. | | | 373,100 | | | | 13,819,624 | |
| | |
Microchip Technology, Inc. | | | 279,900 | | | | 19,662,975 | |
| | |
Monolithic Power Systems, Inc. | | | 38,400 | | | | 13,578,624 | |
| | |
Nice, Ltd., Sponsored ADR (Israel)*,1 | | | 81,900 | | | | 15,749,370 | |
| | |
Palo Alto Networks, Inc.* | | | 179,200 | | | | 25,005,568 | |
| | |
Paylocity Holding Corp.* | | | 77,300 | | | | 15,016,298 | |
| | |
Samsara, Inc., Class A*,1 | | | 451,900 | | | | 5,617,117 | |
| | |
Smartsheet, Inc., Class A* | | | 203,200 | | | | 7,997,952 | |
| | |
Synopsys, Inc.* | | | 79,800 | | | | 25,479,342 | |
| | |
Tyler Technologies, Inc.* | | | 44,600 | | | | 14,379,486 | |
| | |
| | | | | | | | |
The accompanying notes are an integral part of these financial statements.
16
| | |
| | | AMG TimesSquare Mid Cap Growth Fund Schedule of Portfolio Investments (continued) |
| | | | | | | | |
| | | Shares | | | Value | |
| |
Information Technology - 28.9% | | | | | |
(continued) | | | | | | | | |
| | |
WEX, Inc.* | | | 64,300 | | | | $10,522,695 | |
| | |
Total Information Technology | | | | | | | 324,717,999 | |
| | |
Materials - 2.7% | | | | | | | | |
| | |
FMC Corp. | | | 107,700 | | | | 13,440,960 | |
| | |
Martin Marietta Materials, Inc. | | | 49,800 | | | | 16,830,906 | |
| | |
Total Materials | | | | | | | 30,271,866 | |
| | |
Real Estate - 2.1% | | | | | | | | |
| | |
SBA Communications Corp., Class A, REIT | | | 83,500 | | | | 23,405,885 | |
| | |
Total Common Stocks | | | | | | | | |
| | |
(Cost $862,613,165) | | | | | | | 1,114,024,318 | |
| | |
| | | Principal
Amount | | | | |
| | |
Short-Term Investments - 3.8% | | | | | | | | |
| |
Joint Repurchase Agreements - 1.9%2 | | | | | |
| | |
Cantor Fitzgerald Securities, Inc., dated 12/30/22, due 01/03/23, 4.300% total to be received $5,164,366 (collateralized by various U.S. Government Agency Obligations, 0.000% - 9.000%, 01/15/23 - 11/20/72, totaling $5,265,138) | | | $5,161,900 | | | | 5,161,900 | |
| | |
Citadel Securities LLC, dated 12/30/22, due 01/03/23, 4.410% total to be received $5,164,429 (collateralized by various U.S. Treasuries, 0.125% - 6.250%, 04/15/23 - 11/15/52, totaling $5,267,718) | | | 5,161,900 | | | | 5,161,900 | |
| | |
Citigroup Global Markets, Inc., dated 12/30/22, due 01/03/23, 4.250% total to be received $1,630,075 (collateralized by various U.S. Treasuries, 0.000% - 4.500%, 04/11/23 - 10/31/29, totaling $1,661,892) | | | 1,629,306 | | | | 1,629,306 | |
| | |
| | | | | | | | |
| | | | | | | | |
| | | Principal
Amount | | | Value | |
| | |
National Bank Financial, dated 12/30/22, due 01/03/23, 4.340% total to be received $5,164,429 (collateralized by various U.S. Treasuries, 0.000% - 4.435%, 01/03/23 - 09/09/49, totaling $5,265,179) | | | $5,161,940 | | | | $5,161,940 | |
| | |
State of Wisconsin Investment Board, dated 12/30/22, due 01/03/23, 4.340% total to be received $4,619,107 (collateralized by various U.S. Treasuries, 0.125% - 3.875%, 01/15/24 - 02/15/51, totaling $4,709,241) | | | 4,616,881 | | | | 4,616,881 | |
| | |
Total Joint Repurchase Agreements | | | | | | | 21,731,927 | |
| | |
| | | Shares | | | | | |
| |
Other Investment Companies - 1.9% | | | | | |
| | |
Dreyfus Government Cash Management Fund, Institutional Shares, 4.19%3 | | | 8,559,224 | | | | 8,559,224 | |
| | |
Dreyfus Institutional Preferred Government Money Market Fund, Institutional Shares, 4.27%3 | | | 12,838,836 | | | | 12,838,836 | |
| | |
Total Other Investment Companies | | | | | | | 21,398,060 | |
| |
Total Short-Term Investments | | | | | |
(Cost $43,129,987) | | | | | | | 43,129,987 | |
| | |
Total Investments - 103.1% | | | | | | | | |
(Cost $905,743,152) | | | | | | | 1,157,154,305 | |
| |
Other Assets, less Liabilities - (3.1)% | | | | (34,818,395 | ) |
| | |
Net Assets - 100.0% | | | | | | | $1,122,335,910 | |
| | |
| | | | | | | | |
| * | Non-income producing security. |
| 1 | Some of these securities, amounting to $26,774,296 or 2.4% of net assets, were out on loan to various borrowers and are collateralized by cash and various U.S. Treasury Obligations. See Note 4 of Notes to Financial Statements. |
| 2 | Cash collateral received for securities lending activity was invested in these joint repurchase agreements. |
| 3 | Yield shown represents the December 31, 2022, seven day average yield, which refers to the sum of the previous seven days’ dividends paid, expressed as an annual percentage. |
ADR American Depositary Receipt
REIT Real Estate Investment Trust
The accompanying notes are an integral part of these financial statements.
17
| | |
| | | AMG TimesSquare Mid Cap Growth Fund Schedule of Portfolio Investments (continued) |
The following table summarizes the inputs used to value the Fund’s investments by the fair value hierarchy levels as of December 31, 2022:
| | | | | | | | | | | | | | | | |
| | | Level 1 | | | Level 2 | | | Level 3 | | | Total | |
| | | | |
Investments in Securities | | | | | | | | | | | | | | | | |
| | | | |
Common Stocks† | | $ | 1,114,024,318 | | | | — | | | | — | | | $ | 1,114,024,318 | |
| | | | |
Short-Term Investments | | | | | | | | | | | | | | | | |
| | | | |
Joint Repurchase Agreements | | | — | | | $ | 21,731,927 | | | | — | | | | 21,731,927 | |
| | | | |
Other Investment Companies | | | 21,398,060 | | | | — | | | | — | | | | 21,398,060 | |
| | | | | | | | | | | | | | | | |
| | | | |
Total Investments in Securities | | $ | 1,135,422,378 | | | $ | 21,731,927 | | | | — | | | $ | 1,157,154,305 | |
| | | | | | | | | | | | | | | | |
| † | All common stocks held in the Fund are Level 1 securities. For a detailed breakout of common stocks by major industry classification, please refer to the Fund’s Schedule of Portfolio Investments. |
For the fiscal year ended December 31, 2022, there were no transfers in or out of Level 3.
The accompanying notes are an integral part of these financial statements.
18
| | |
| | | AMG TimesSquare International Small Cap Fund Portfolio Manager’s Comments (unaudited) |
| | | | | | | | |
Year In Review For the year ended December 31, 2022, AMG TimesSquare International Small Cap Fund (the “Fund”) Class N shares returned (27.97)%, while its benchmark, the MSCI EAFE Small Cap Index returned (21.39)%. In 2022, global equity markets retreated sharply after three consecutive years of double-digit gains. For example, the MSCI World Index declined by (18)% after average calendar year gains of 22% from 2019 to 2021. Weighing on the markets during the year was a combination of higher inflation rates, climbing commodity prices, tighter monetary policies, and slowing measures of business activities that moved into the range of economic contraction. Within the non-U.S. universe, there were better returns for larger stocks than smaller capitalizations and Value outperformed Growth. Among the small cap stocks, value sectors such as energy and materials were propelled by the gains in underlying commodity prices. Longer duration sectors such as communication services and health care pulled back on the risk of rising interest rates. Amid this environment, the Fund underperformed the MSCI EAFE Small Cap Index benchmark for calendar year 2022. We experienced relative weakness in almost all regions with the exception of the Middle East. We benefited from stock selection in information technology and from our underweight in the real estate sector. We also experienced relative weakness in the industrials and communication sectors. Regional Performance: Europe Early in the year, Europe bore the brunt of the contagion effect from the war in the Ukraine. Our selection and relative overweight to Europe detracted from performance. Though we continued to focus on profitable companies with stable cash flows and strong balance sheets, we adjusted our footprint, on the margin, to reflect the new reality in Europe. Our holdings in the communication sectors faced multiple compressions and fragile sentiment in a rising rate environment. Case in point was Sweden based Viaplay, the region’s leading entertainment provider. Early in the year when streaming peer Netflix reported weak quarterly results, Viaplay’s share price declined in sympathy. Later in the year, the company fell short of our expectations that earnings would inflect positively in the third quarter—instead pricing power in Norway and | | | | overall advertising revenues were weaker than expected. We exited the position with shares declining by (64)% for the period that it was held. Retreating from its position as a top 2021 contributor with its (72)% correction was U.K.-based Future PLC. They are a specialty content publisher transitioning from print-to-digital-platform. The group benefited from ongoing momentum in digital advertising. However, its share price dropped when the company’s CEO shared her intention to step down by the end of 2023. We trimmed our exposure to Future throughout the year in light of the rising rate environment but decided to exit the name in the fourth quarter as the outlook for the company turned increasingly opaque. Broader recessionary concerns also weighed on our consumer-related holdings. U.K. listed Grafton Group PLC is a multi-channel distributor of construction products. Concerns on weakening end demand and the challenging macroeconomic backdrop hurt the overall building materials sector along with Grafton’s share price, which dropped by (49)%. Online automotive platform Auto Trader Group PLC experienced a similar move. Fundamentally, nothing changed with Auto Trader’s business model through 2022; in fact, they gained market share and recent rail strikes have increased car buying interest among Brits. That said, its share price declined by (37)%. We saw better relative performance for our consumer staple names such as Viscofan, S.A., the global leader in artificial sausage skins, where shares returned 9% in 2022. In light of the market turbulence, our holdings related to the capital markets also experienced share price contraction. St. James’s Place PLC is a wealth management business in the U.K. Despite experiencing a (40)% share price decline, they reported better-than-expected net new business. More defensive and better in the financial sector was Topdanmark AS, Denmark’s second largest non-life insurance company. In March 2022 Nordea announced that it would buy Topdanmark’s life and pension business which boosted sentiment. Its premium-driven business remained resilient and the company continues to execute well, with improving combined ratio and profit forecasts. Topdanmark’s shares only declined (1)%, better than the financial sector’s (10)% drop. Another relatively more defensive holding that benefited from high recurring revenues was multinational market research and consulting firm Ipsos SA, which finished up 36% during the year. Sales growth continued to trend well; and the | | | | company also benefited from its diverse client base and a strong currency effect. They revised up their 2022 sales guidance and were confident in achieving their 2023-25 strategic plan. Turning to areas of opportunities, we added holdings that would benefit from the structural shortages in the energy and defense markets. Within the energy sector, France-based Gaztransport & Technigaz S.A. (GTT) develops membrane containment systems for liquefied natural gas (LNG) vessels. Shares climbed 16% on continued high visibility and new project wins. Another beneficiary of Europe’s structural energy transition was fellow countryman Technip Energies. Technip N.V. is one of only a handful of companies that can build LNG plants. Shares rose 35%, in unison with the company’s increasing backlog. Finally, there were also stock specific challenges this year. For example, U.K.-based RWS Holdings PLC, a language and intellectual-property (IP) support services provider, dropped by (48)%. Shares in RWS Holdings PLC slumped after the company said it expected 2022 results to be at the lower end of expectations. Despite short-term growth headwinds from the Russia/Ukraine crisis and slower IP filing activity, the company’s growth outlook remains solid on significant investments to expand into the fast-growing artificial intelligence data annotation market. Amidst the multiple market dislocations, industrial buyers were opportunistically seeking price inefficiencies in quality assets. This was the case for UK based HomeServe PLC, which offers a range of home emergencies via subscription-based membership services. A top detractor in 2021, the tide turned as Canada-based Brookfield Asset Management offered to purchase HomeServe in a £4 billion transaction and shares appreciated 21% for the year. Regional Performance: Japan Japan was our weakest region due to stock selection. A large yen depreciation triggered concerns on the Japanese consumer’s purchasing ability. In the real estate sector, home renovation management company Katitas Co., Ltd. faced profit taking and retreated (43)% after delivering strong share price performance in 2021. The market remained apprehensive on home builders exposed to higher input costs, end demand, and rising rates. We opted for better risk reward elsewhere and sold the name in fourth quarter. |
19
| | |
| | | AMG TimesSquare International Small Cap Fund Portfolio Manager’s Comments (continued) |
| | | | | | | | |
Concerns on a weaker consumer also impacted leading conveyor belt sushi restaurant Food and Life Cos., Ltd. Though they navigated the shift to delivery during COVID well, subsequent disappointing execution on advertising and operational matters in combination with downward earnings guidance revisions raised concerns on the quality of management. As such, we exited the name in the third quarter with a (51)% loss for the period it was held. Our semiconductor material holdings also faced headwinds and concerns that the semis cycle had peaked. Toyo Gosei Co., Ltd. manufacturers photosensitive materials, organic chemicals and solvents. The stock was sold during the period. When management guided for lower growth as orders pulled forward ahead of impending price hike, its shares reacted with a sharp (34)% retreat. Despite some selection challenges, we remain excited on other opportunities in Japan. With elevated commodity prices on the horizon, our environmental and recycling names fared relatively better. The top contributor from the country with its 56% share price rise was Organo Corp., a provider of water recycling services. In October, the company raised guidance above expectations, mainly from customers in the overseas electronics industry. It made solid progress passing through higher raw material costs to its customers and the yen depreciation was also beneficial. In addition, an advisory panel to Prime Minister Kishida approved a plan to extend the useful lives of nuclear reactors and to build new units; and Organo is an important key player in that value chain. Another contributor and new to the Fund was Fujikura Ltd., one of the three major electric cable players in Japan. Fujikura stands out for its high-quality optical fiber business where it has captured more than 20% global share and is the only | | | | Japanese entity that supplies British Telecom in the U.K. Its forte is within telecom systems which accounts for 50-60% of operating profit. Shares jumped 27% since it was added to the Fund in fourth quarter. Regional Performance: Asia Pacific ex Japan, Middle East, and Americas Leading the gains in Asia Pacific ex Japan was Australasia’s largest insurance broker network, Steadfast Group Ltd. Premium rates continued to rise and operating conditions remain supportive. Shares were resilient and retreated (2)%, better than the region’s (16)% correction. The rising premium rate cycle, acquisitions, and technology efficiencies provide tailwinds for the company. Detracting from performance with a (35)% decline was Downer EDI Ltd., a leading infrastructure services provider in Australia and New Zealand. The company reported accounting irregularities in its utility business that involved historical misreporting; an investigation is underway. Compounding the concerns was the company’s announcement in December that guidance was unlikely to be met (after reiterating guidance in November). Over in the Americas, AG Growth International, Inc. (AGI) is a Canadian manufacturer of agricultural equipment. The company’s strategy places it in the center of the global food infrastructure buildout, which has become increasingly critical given the growing global population, increased grain demand, shifting geopolitical uncertainties and supply chain disruptions. The company continues to fire on all cylinders. AGI’s sales pipeline remains “robust” with strong customer interest emerging from all segments and regions. Organic growth continues to be driven by new businesses, margins benefit from operational improvements, and leverage continues to fall. Net-net, AGI’s shares climbed 28%. | | | | Regional Performance: Emerging Markets In the Emerging Markets, Latam fared better while North Asia fell short. South Korea’s K Car Co., Ltd. is a platform service for used cars. The impact of tight used car supply lingered over its share price. In September, one of its facilities was flooded along with 200 vehicles due to a typhoon. Although the damage is expected to be recovered through insurance, we decided to exit the position. Its share price fell (70)% for the period it was owned. After a steep selloff in 2021, Brazil saw strong inflows to start the year. Benefiting from those tailwinds with a 49% rise was TOTVS, S.A. the largest SaaS software provider in Brazil. The company continued to show impressive operating trends, pricing power, and strong operating leverage. A number of earnings beats also demonstrated the resilience of demand for the company’s products. The stock was sold during the period. Conclusion Looking forward into 2023, many investors remain fixated on the macroeconomic environment. As bottom-up investors, our attention zeroes in on a company’s fundamentals and capital structure. While the contraction of price/earning (P/E) multiples weighed on nearly all stocks last year, many continued to increase their earnings and have stronger balance sheets than they did before the last recession. Stocks with that combination have a larger place in our strategy because we believe they will be well-positioned no matter what 2023 holds. The views expressed represent the opinions of TimesSquare Capital Management, LLC as of December 31, 2022, and are not intended as a forecast or guarantee of future results, and are subject to change without notice. |
20
| | |
| | | AMG TimesSquare International Small Cap Fund Portfolio Manager’s Comments (continued) |
CUMULATIVE TOTAL RETURN PERFORMANCE
AMG TimesSquare International Small Cap Fund’s cumulative total return is based on the daily change in net asset value (NAV), and assumes that all dividends and distributions were reinvested. This graph compares a hypothetical $10,000 investment made in the AMG TimesSquare International Small Cap Fund’s Class N shares on January 2, 2013 (inception date), to a $10,000 investment made in the MSCI EAFE Small Cap Index for the same time period. The graph and table do not reflect the deduction of taxes that a shareholder would pay on a Fund distribution or redemption of shares. The listed returns for the Fund are net of expenses and the returns for the index exclude expenses. Total returns would have been lower had certain expenses not been reduced.
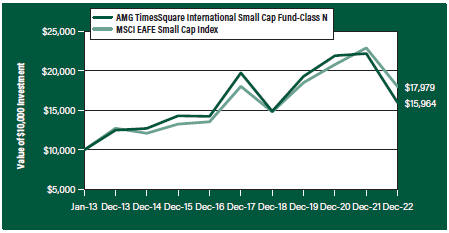
The table below shows the average annual total returns for the AMG TimesSquare International Small Cap Fund and the MSCI EAFE Small Cap Index for the same time periods ended December 31, 2022.
| | | | | | | | | | | | | | | | |
| | | One | | | Five | | | Since | | | Inception | |
| Average Annual Total Returns1 | | Year | | | Years | | | Inception | | | Date | |
AMG TimesSquare International Small Cap Fund2, 3, 4, 5, 6, 7, 8, 9, 10 | |
| | | | |
Class N | | | (27.97 | %) | | | (4.13 | %) | | | 4.79 | % | | | 01/02/13 | |
| | | | |
Class I | | | (27.84 | %) | | | (3.99 | %) | | | 1.11 | % | | | 02/24/17 | |
| | | | |
Class Z | | | (27.78 | %) | | | (3.89 | %) | | | 5.02 | % | | | 01/02/13 | |
| | | | |
MSCI EAFE Small Cap Index11 | | | (21.39 | %) | | | (0.05 | %) | | | 6.04 | % | | | 01/02/13 | † |
The performance data shown represents past performance. Past performance is not a guarantee of future results. Current performance may be lower or higher than the performance data quoted. The investment return and principal value of an investment will fluctuate so that an investor’s shares, when redeemed, may be worth more or less than their original cost.
Investors should carefully consider the Fund’s investment objectives, risks, charges and expenses before investing. For performance information through the most recent month end, current net asset values per share for the Fund and other information, please call 800.548.4539 or visit our website at amgfunds.com for a free prospectus. Read it carefully before investing or sending money.
Distributed by AMG Distributors, Inc., member FINRA/SIPC.
| † | Date reflects inception date of the Fund, not the index. |
| 1 | Total return equals income yield plus share price change and assumes reinvestment of all dividends and capital gain distributions. Returns are net of fees and may reflect offsets of Fund expenses as described in the prospectus. No adjustment has been made for taxes payable by shareholders on their reinvested dividends and |
|
capital gain distributions. Returns for periods greater than one year are annualized. The listed returns on the Fund are net of expenses and based on the published NAV as of December 31, 2022. All returns are in U.S. Dollars ($). 2 From time to time, the Fund’s investment manager has waived its fees and/or absorbed Fund expenses, which has resulted in higher returns. 3 Investments in international securities are subject to certain risks of overseas investing including currency fluctuations and changes in political and economic conditions, which could result in significant market fluctuations. These risks are magnified in emerging markets. 4 The Fund is subject to the risks associated with investments in emerging markets, such as erratic earnings patterns, economic and political instability, changing exchange controls, limitations on repatriation of foreign capital and changes in local governmental attitudes toward private investment, possibly leading to nationalization or confiscation of investor assets. 5 The Fund is subject to risks associated with investments in small-capitalization companies, such as erratic earnings patterns, competitive conditions, limited earnings history and a reliance on one or a limited number of products. 6 Companies that are in similar industry sectors may be similarly affected by particular economic or market events; to the extent the Fund has substantial holdings within a particular sector, the risks associated with that sector increase. 7 The Fund is subject to currency risk resulting from fluctuations in exchange rates that may affect the total loss or gain on a non-U.S. Dollar investment when converted back to U.S. Dollars. 8 The Fund may invest in derivatives such as options and futures; the complexity and rapidly changing structure of derivatives markets may increase the possibility of market losses. 9 The Fund invests in growth stocks, which may be more sensitive to market movements because their prices tend to reflect future investor expectations rather than just current profits. Growth stocks may underperform value stocks during given periods. 10 Market prices of investments held by the Fund may fall rapidly or unpredictably due to a variety of economic or political factors, market conditions, disasters or public health issues, or in response to events that affect particular industries or companies. 11 The MSCI EAFE Small Cap Index covers all investable small-cap securities with a market capitalization below that of the companies in the MSCI Standard Indices of developed markets, excluding the U.S. and Canada. Please go to |
21
| | |
| | | AMG TimesSquare International Small Cap Fund Portfolio Manager’s Comments (continued) |
| | | | | | | | |
msci.com for most current list of countries represented by the index. Unlike the Fund, the MSCI EAFE Small Cap Index is unmanaged, is not available for investment and does not incur expenses. | | | | All MSCI data is provided ‘as is.’ The products described herein are not sponsored or endorsed and have not been reviewed or passed on by MSCI. In no event shall MSCI, its affiliates or any MSCI data provider have any liability of any kind in connection with the MSCI data or the products described herein. | | | | Copying or redistributing the MSCI data is strictly prohibited. Not FDIC insured, nor bank guaranteed. May lose value. |
22
| | |
| | | AMG TimesSquare International Small Cap Fund Fund Snapshots (unaudited) December 31, 2022 |
PORTFOLIO BREAKDOWN
| | | | | |
Sector | | % of
Net Assets |
| | |
Industrials | | 33.4 |
| | |
Financials | | 12.0 |
| | |
Information Technology | | 10.7 |
| | |
Consumer Staples | | 7.4 |
| | |
Consumer Discretionary | | 7.1 |
| | |
Health Care | | 6.7 |
| | |
Energy | | 6.3 |
| | |
Communication Services | | 6.1 |
| | |
Materials | | 5.3 |
| | |
Utilities | | 1.6 |
| | |
Short-Term Investments | | 0.6 |
| | |
Other Assets, less Liabilities | | 2.8 |
TOP TEN HOLDINGS
| | |
Security Name | | % of
Net Assets |
| | |
Steadfast Group, Ltd. (Australia) | | 3.2 |
| | |
Saab AB, Class B (Sweden) | | 3.0 |
| | |
Topdanmark AS (Denmark) | | 3.0 |
| | |
Tate & Lyle PLC (United Kingdom) | | 2.3 |
| | |
Zenkoku Hosho Co., Ltd. (Japan) | | 2.3 |
| | |
Rotork PLC (United Kingdom) | | 2.2 |
| | |
Keywords Studios PLC (Ireland) | | 2.1 |
| | |
Spirent Communications PLC (United Kingdom) | | 2.0 |
| | |
Viscofan, S.A. (Spain) | | 1.9 |
| | |
IPH, Ltd. (Australia) | | 1.9 |
| | | |
| | |
Top Ten as a Group | | 23.9 |
| | |
Because a fund’s strategy may result in multiple investments in particular sectors of the economy, its performance may depend on the performance of those sectors and may fluctuate more widely than investments diversified across more sectors. For additional information on these and other risk considerations, please see the Fund’s prospectus.
Any sectors, industries, or securities discussed should not be perceived as investment recommendations. Mention of a specific security should not be considered a recommendation to buy or solicitation to sell that security. Specific securities mentioned in this report may have been sold from the Fund’s portfolio of investments by the time you receive this report.
23
| | |
| | | AMG TimesSquare International Small Cap Fund Schedule of Portfolio Investments December 31, 2022 |
| | | | | | | | |
| | | Shares | | | Value | |
| |
Common Stocks - 96.6% | | | | | |
| |
Communication Services - 6.1% | | | | | |
| | |
Auto Trader Group PLC (United Kingdom)1 | | | 833,940 | | | | $5,193,240 | |
| | |
carsales.com, Ltd. (Australia) | | | 245,000 | | | | 3,447,774 | |
| | |
Internet Initiative Japan, Inc. (Japan) | | | 436,000 | | | | 8,077,162 | |
| | |
IPSOS (France) | | | 96,720 | | | | 6,057,454 | |
| | |
Kadokawa Corp. (Japan) | | | 222,100 | | | | 4,057,387 | |
| | |
Total Communication Services | | | | | | | 26,833,017 | |
| |
Consumer Discretionary - 7.1% | | | | | |
| | |
Afya, Ltd., Class A (Brazil)* | | | 124,000 | | | | 1,936,880 | |
| | |
Arcos Dorados Holdings, Inc., Class A (Uruguay) | | | 582,200 | | | | 4,867,192 | |
| | |
CIE Automotive, S.A. (Spain)2 | | | 180,078 | | | | 4,632,920 | |
| | |
Dalata Hotel Group PLC (Ireland)* | | | 1,285,821 | | | | 4,454,883 | |
| | |
Games Workshop Group PLC (United Kingdom) | | | 78,600 | | | | 8,113,376 | |
| | |
Shoei Co., Ltd. (Japan) | | | 89,500 | | | | 3,459,376 | |
| | |
Spin Master Corp. (Canada)1 | | | 150,200 | | | | 3,696,207 | |
| | |
Total Consumer Discretionary | | | | | | | 31,160,834 | |
| |
Consumer Staples - 7.4% | | | | | |
| | |
Kobe Bussan Co., Ltd. (Japan) | | | 284,198 | | | | 8,190,930 | |
| | |
Sugi Holdings Co., Ltd. (Japan) | | | 119,697 | | | | 5,323,423 | |
| | |
Tate & Lyle PLC (United Kingdom) | | | 1,194,214 | | | | 10,231,103 | |
| | |
Viscofan, S.A. (Spain) | | | 131,700 | | | | 8,482,549 | |
| | |
Total Consumer Staples | | | | | | | 32,228,005 | |
| |
Energy - 6.3% | | | | | |
| | |
Gaztransport Et Technigaz, S.A. (France) | | | 77,200 | | | | 8,250,480 | |
| | |
Pason Systems, Inc. (Canada) | | | 429,900 | | | | 5,061,009 | |
| | |
Technip Energies, N.V. (France) | | | 506,200 | | | | 7,958,261 | |
| | |
TGS ASA (Norway) | | | 453,000 | | | | 6,125,657 | |
| | |
Total Energy | | | | | | | 27,395,407 | |
| |
Financials - 12.0% | | | | | |
| | |
FinecoBank Banca Fineco S.P.A. (Italy) | | | 166,213 | | | | 2,760,153 | |
| | |
Nordnet AB publ (Sweden) | | | 238,087 | | | | 3,447,709 | |
| | |
Patria Investments, Ltd., Class A (Cayman Islands) | | | 325,600 | | | | 4,535,608 | |
| | |
St James’s Place PLC (United Kingdom) | | | 358,841 | | | | 4,727,144 | |
| | |
Steadfast Group, Ltd. (Australia) | | | 3,746,483 | | | | 13,914,458 | |
| | |
Topdanmark AS (Denmark) | | | 246,511 | | | | 12,972,550 | |
| | |
Zenkoku Hosho Co., Ltd. (Japan) | | | 263,709 | | | | 10,103,485 | |
| | |
Total Financials | | | | | | | 52,461,107 | |
| |
Health Care - 6.7% | | | | | |
| | |
ALK-Abello A/S (Denmark)* | | | 219,100 | | | | 3,056,239 | |
| | |
Amplifon S.P.A. (Italy)2 | | | 72,395 | | | | 2,161,699 | |
| | |
As One Corp. (Japan) | | | 149,300 | | | | 6,522,535 | |
| | |
| | | | | | | | |
| | | | | | | | |
| | | Shares | | | Value | |
| | |
BML, Inc. (Japan) | | | 166,300 | | | | $4,218,737 | |
| | |
Nakanishi, Inc. (Japan) | | | 330,700 | | | | 6,405,378 | |
| | |
Siegfried Holding AG (Switzerland) | | | 10,700 | | | | 7,107,487 | |
| | |
Total Health Care | | | | | | | 29,472,075 | |
| |
Industrials - 33.4% | | | | | |
| | |
AG Growth International, Inc. (Canada) | | | 126,100 | | | | 4,037,249 | |
| | |
ALS, Ltd. (Australia) | | | 86,200 | | | | 714,677 | |
| | |
APM Human Services International, Ltd. (Australia) | | | 3,447,000 | | | | 5,599,241 | |
| | |
Arcadis, N.V. (Netherlands) | | | 200,700 | | | | 7,901,704 | |
| | |
BayCurrent Consulting, Inc. (Japan) | | | 189,600 | | | | 5,902,248 | |
| | |
Befesa, S.A. (Luxembourg)1 | | | 111,761 | | | | 5,391,251 | |
| | |
Bodycote PLC (United Kingdom) | | | 742,939 | | | | 5,106,131 | |
| | |
Cleanaway Waste Management, Ltd. (Australia) | | | 2,809,700 | | | | 5,006,416 | |
| | |
Daiseki Co., Ltd. (Japan) | | | 188,120 | | | | 6,456,883 | |
| | |
Diploma PLC (United Kingdom) | | | 199,800 | | | | 6,716,810 | |
| | |
Downer EDI, Ltd. (Australia) | | | 1,102,300 | | | | 2,770,188 | |
| | |
Fuji Corp. (Japan) | | | 184,200 | | | | 2,683,778 | |
| | |
Fujikura, Ltd. (Japan) | | | 497,200 | | | | 3,737,466 | |
| | |
HomeServe PLC (United Kingdom)* | | | 80,300 | | | | 1,162,032 | |
| | |
Howden Joinery Group PLC (United Kingdom) | | | 428,063 | | | | 2,890,444 | |
| | |
Interpump Group S.P.A. (Italy)2 | | | 98,057 | | | | 4,426,990 | |
| | |
IPH, Ltd. (Australia) | | | 1,432,540 | | | | 8,419,725 | |
| | |
Loomis AB (Sweden) | | | 187,800 | | | | 5,147,612 | |
| | |
Meitec Corp. (Japan) | | | 369,900 | | | | 6,710,005 | |
| | |
Nexans, S.A. (France) | | | 72,700 | | | | 6,580,027 | |
| | |
Organo Corp. (Japan) | | | 323,000 | | | | 7,169,182 | |
| | |
Rotork PLC (United Kingdom) | | | 2,601,900 | | | | 9,669,215 | |
| | |
RS Group PLC (United Kingdom) | | | 368,551 | | | | 3,968,245 | |
| | |
RWS Holdings PLC (United Kingdom) | | | 562,400 | | | | 2,553,755 | |
| | |
Saab AB, Class B (Sweden) | | | 337,800 | | | | 13,311,876 | |
| | |
SMS Co., Ltd. (Japan) | | | 128,200 | | | | 3,242,792 | |
| | |
THK Co., Ltd. (Japan) | | | 230,700 | | | | 4,362,113 | |
| | |
Valmet Oyj (Finland)2 | | | 176,200 | | | | 4,756,465 | |
| | |
Total Industrials | | | | | | | 146,394,520 | |
| |
Information Technology - 10.7% | | | | | |
| | |
Accton Technology Corp. (Taiwan) | | | 681,800 | | | | 5,177,454 | |
| | |
CyberArk Software, Ltd. (Israel)* | | | 26,200 | | | | 3,396,830 | |
| | |
Fortnox AB (Sweden) | | | 743,900 | | | | 3,377,966 | |
| | |
Indra Sistemas, S.A. (Spain)2 | | | 225,200 | | | | 2,567,056 | |
| | |
Keywords Studios PLC (Ireland) | | | 284,471 | | | | 9,335,317 | |
| | |
Nova, Ltd. (Israel)* | | | 25,600 | | | | 2,091,008 | |
| | |
Sopra Steria Group SACA (France) | | | 41,693 | | | | 6,312,454 | |
| | |
| | | | | | | | |
The accompanying notes are an integral part of these financial statements.
24
| | |
| | | AMG TimesSquare International Small Cap Fund Schedule of Portfolio Investments (continued) |
| | | |
| | | |
| | | | | | | | |
| | | Shares | | | Value | |
| |
Information Technology - 10.7%
(continued) | | | | | |
| | |
Spirent Communications PLC (United Kingdom) | | | 2,769,700 | | | | $8,799,467 | |
| | |
Systena Corp. (Japan) | | | 1,900,600 | | | | 5,894,980 | |
| | |
Total Information Technology | | | | | | | 46,952,532 | |
| | |
Materials - 5.3% | | | | | | | | |
| | |
Asahi Holdings, Inc. (Japan) | | | 391,100 | | | | 5,713,276 | |
| | |
Fuso Chemical Co., Ltd. (Japan) | | | 163,600 | | | | 4,195,592 | |
| | |
Huhtamaki Oyj (Finland) | | | 235,800 | | | | 8,077,797 | |
| | |
Verallia, S.A. (France)1 | | | 152,800 | | | | 5,178,347 | |
| | |
Total Materials | | | | | | | 23,165,012 | |
| | |
Utilities - 1.6% | | | | | | | | |
| | |
Nippon Gas Co., Ltd. (Japan) | | | 453,400 | | | | 7,095,386 | |
| |
Total Common Stocks | | | | | |
(Cost $416,363,260) | | | | | | | 423,157,895 | |
| | |
| | | Principal
Amount | | | | |
| |
Short-Term Investments - 0.6% | | | | | |
| |
Joint Repurchase Agreements - 0.6%3 | | | | | |
| | |
Deutsche Bank Securities, Inc., dated 12/30/22, due 01/03/23, 4.290% total to be received $755,708 (collateralized by various U.S. Government Agency Obligations, 1.500% - 7.500%, 02/01/24 - 01/01/57, totaling $770,455) | | $ | 755,348 | | | | 755,348 | |
| | |
| | | | | | | | |
| | | | | | | | |
| | | Principal
Amount | | | Value | |
| | |
National Bank Financial, dated 12/30/22, due 01/03/23, 4.340% total to be received $1,000,482 (collateralized by various U.S. Treasuries, 0.000% - 4.435%, 01/03/23 - 09/09/49, totaling $1,020,000) | | $ | 1,000,000 | | | | $1,000,000 | |
| | |
RBC Dominion Securities, Inc., dated 12/30/22,due 01/03/23, 4.300% total to be received $1,000,478 (collateralized by various U.S. Government Agency Obligations, 2.000% - 6.000%, 09/01/24 - 10/20/52, totaling $1,020,000) | | | 1,000,000 | | | | 1,000,000 | |
| |
Total Short-Term Investments | | | | | |
(Cost $2,755,348) | | | | | | | 2,755,348 | |
| |
Total Investments - 97.2% | | | | | |
(Cost $419,118,608) | | | | | | | 425,913,243 | |
| |
Other Assets, less Liabilities - 2.8% | | | | 12,267,164 | |
| |
Net Assets - 100.0% | | | $ | 438,180,407 | |
| |
| | | | | |
| * | Non-income producing security. |
| 1 | Security exempt from registration under Rule 144A of the Securities Act of 1933. This security may be resold in transactions exempt from registration, normally to qualified institutional buyers. At December 31, 2022, the value of these securities amounted to $19,459,045 or 4.4% of net assets. |
| 2 | Some of these securities, amounting to $8,922,218 or 2.0% of net assets, were out on loan to various borrowers and are collateralized by cash and various U.S. Treasury Obligations. See Note 4 of Notes to Financial Statements. |
| 3 | Cash collateral received for securities lending activity was invested in these joint repurchase agreements. |
The accompanying notes are an integral part of these financial statements.
25
| | |
| | | AMG TimesSquare International Small Cap Fund Schedule of Portfolio Investments (continued) |
| | | |
| | | |
The following table summarizes the inputs used to value the Fund’s investments by the fair value hierarchy levels as of December 31, 2022:
| | | | | | | | | | |
| | | Level 1 | | Level 21 | | Level 3 | | | Total |
Investments in Securities | | | | | | | | | | |
| | | | |
Common Stocks | | | | | | | | | | |
| | | | |
Industrials | | $12,859,167 | | $133,535,353 | | | — | | | $146,394,520 |
| | | | |
Financials | | 4,535,608 | | 47,925,499 | | | — | | | 52,461,107 |
| | | | |
Information Technology | | 5,487,838 | | 41,464,694 | | | — | | | 46,952,532 |
| | | | |
Consumer Staples | | — | | 32,228,005 | | | — | | | 32,228,005 |
| | | | |
Consumer Discretionary | | 10,500,279 | | 20,660,555 | | | — | | | 31,160,834 |
| | | | |
Health Care | | — | | 29,472,075 | | | — | | | 29,472,075 |
| | | | |
Energy | | 5,061,009 | | 22,334,398 | | | — | | | 27,395,407 |
| | | | |
Communication Services | | — | | 26,833,017 | | | — | | | 26,833,017 |
| | | | |
Materials | | — | | 23,165,012 | | | — | | | 23,165,012 |
| | | | |
Utilities | | — | | 7,095,386 | | | — | | | 7,095,386 |
| | | | |
Short-Term Investments | | | | | | | | | | |
| | | | |
Joint Repurchase Agreements | | — | | 2,755,348 | | | — | | | 2,755,348 |
| | | | | | | | | | |
| | | | |
Total Investment in Securities | | $38,443,901 | | $387,469,342 | | | — | | | $425,913,243 |
| | | | | | | | | | |
| 1 | An external pricing service is used to reflect any impact on security value due to market movements between the time the Fund valued such foreign securities and the earlier closing of foreign markets. |
For the fiscal year ended December 31, 2022, there were no transfers in or out of Level 3.
The country allocation in the Schedule of Portfolio Investments at December 31, 2022, was as follows:
| | |
| Country | | % of Long-Term Investments |
| |
Australia | | 9.4 |
| |
Brazil | | 0.5 |
| |
Canada | | 3.0 |
| |
Cayman Islands | | 1.1 |
| |
Denmark | | 3.8 |
| |
Finland | | 3.0 |
| |
France | | 9.5 |
| |
Ireland | | 3.3 |
| |
Israel | | 1.3 |
| |
Italy | | 2.2 |
| |
Japan | | 28.2 |
| | |
| Country | | % of Long-Term Investments |
| |
Luxembourg | | 1.3 |
| |
Netherlands | | 1.9 |
| |
Norway | | 1.4 |
| |
Spain | | 3.7 |
| |
Sweden | | 6.0 |
| |
Switzerland | | 1.7 |
| |
Taiwan | | 1.2 |
| |
United Kingdom | | 16.3 |
| |
Uruguay | | 1.2 |
| | |
| |
| | 100.0 |
| | |
The accompanying notes are an integral part of these financial statements.
26
|
AMG TimesSquare Emerging Markets Small Cap Fund Portfolio Manager’s Comments (unaudited) |
| | | | | | | | |
Year in Review For the year ended December 31, 2022, AMG TimesSquare Emerging Markets Small Cap Fund (the “Fund”) Class I shares returned (19.16)%, while its benchmark, the MSCI Emerging Markets Small Cap Index, returned (18.02)%. In 2022, global equity markets retreated sharply after three consecutive years of double-digit gains. For example, the MSCI World Index declined by (18)% after average calendar year gains of 22% from 2019 to 2021. Though there were many economic challenges for the markets last year, weakness among global equities did not arise from poor company fundamentals—realized and projected earnings per share for the average MSCI World stock were either stable or increased in 2022 while their price/earnings (P/E) ratios contracted. Weighing on the markets during the year was a combination of higher inflation rates, climbing commodity prices, tighter monetary policies, and slowing measures of business activities that moved into the range of economic contraction. In the fourth quarter equities rose from troughs earlier in 2022. That initial rebound was strongest for non-U.S. developed markets, followed by emerging markets, and then the U.S. As inflation rates remained above the goals for most major central banks, many of them raised interest. In contrast, the People’s Bank of China (PBoC) kept key lending rates stable after lowering them in August to provide support to the Chinese economy. In December, China’s long-awaited shift away from its zero-COVID policy also provided positive news to the market. Meanwhile In Brazil, after twelve consecutive rate increases, the Central Bank of Brazil left interest rates unchanged in its latest policy meeting, signaling the end of its tightening cycle. Toward the end of the year, President Lula returned with a large spending plan which fostered increased fiscal uncertainty. Within the emerging markets universe, smaller companies outperformed their larger cap peers, while Value significantly outpaced Growth. Among emerging markets small cap stocks, negative performance was seen across most regions and sectors: EMEA outshined other regions and energy was the lone positive sector for the year. Amid this environment, the Fund underperformed the MSCI Emerging Markets Small Cap Index for the year. Relative strength in Asia offset relative weakness in other regions. | | | | Regional Performance: Asia Strength in Greater China and Indonesia more than offset weakness in Thailand and India. Gaining 23% for the year, Shanghai Kindly Medical Instruments Co., Ltd. engages in the research, development, and selling of cardiovascular interventional devices throughout China and international markets. Concerns related to Chinese health care stocks surrounding policy risk and pricing pressure initially weighed on the sector and led Shanghai Kindly down sharply. However, the stock rebounded later in the year with its robust year-over-year growth despite the COVID lockdown in Shanghai, and we trimmed our position. Across the strait, Taiwan housed some of the largest contributors and detractors. On the negative side, eCloudvalley Digital Technology Co., Ltd. is the largest Amazon Web Services (AWS) Managed Service provider in Greater China. The company continues to drive expansion through cloud growth, AWS growth, and the addition of new markets and competencies. In 2021, the company’s strong storage distribution business was boosted by the appetite for crypto in mainland China. As that demand waned, eCloudvalley’s revenue normalized, and its shares sold off (71)%. Shares of Green World Fintech Service Co., Ltd. dropped (73)%. They are Taiwan’s largest third-party payment operator and provide online payment processing services. The company enjoyed an online retail boom driven by the pandemic, but there are lingering concerns over the potential for slower online sales as COVID-19 becomes less of a health issue. This weighed on its share price. We added to both positions on price weakness as we believe 2023 will demonstrate the secular growth characteristics of both companies. Better performance came from two pharmaceutical companies. Gaining 109%, Lotus Pharmaceutical Co., Ltd. is a generic pharmaceutical company that focuses on specialty and difficult-to-formulate generic products. With many of its products gaining approvals around the world, Lotus reported impressive results throughout the year. The launch of Lenalidomide (generic of Revlimid®) for treatment of multiple myeloma in the U.S. was also successful. Bora Pharmaceuticals Co., Ltd. is a contract development and manufacturing organization (CDMO). The company announced a number of acquisitions with the most significant one being TWi Pharmaceutical in September. They also continue to maintain a robust and growing pipeline and reported impressive results, which served to lift its stock by 83%. We pared our exposures in both Lotus and Bora. | | | | Moving over to Korea, the de-rating of the Korean market during the year had an outsized impact to some of our holdings in that market. South Korea’s K Car is a platform service for used cars. The impact of tight used car supply resulting in higher vehicle acquisition costs and lower margins lingered over its share price. In September one of its facilities was flooded along with 200 vehicles due to a typhoon, though the damage is expected to be recovered through insurance. Koh Young Technology, Inc. is a world leader in 3D measurement and inspection technology. The company reported solid results throughout the year, supported by strong sales growth backed by automotive and industrial clients. However, markets have been concerned about the health of semiconductor and automotive end markets. We exited both positions with their share prices down (70)% and (60)% respectively while they were held during the year. More positive was our position in Hanwha Aerospace Co., Ltd., which was initiated in the fourth quarter. Gaining 46% while held in the Fund, this leading Korean aerospace and defense firm announced new defense orders from Poland and sees growing interest in other parts of the world. Meanwhile, South Korea President Yoon Suk Yeol vowed to actively support defense exports, which should be beneficial to the industry. Gaining 9%, Jeisys Medical, Inc. manufactures and develops products used by plastic surgeons, dermatologists, and physicians. Despite challenging macro environments, the company reported slight beats to estimates thanks to resilient demand in the U.S. and its positive global expansion outlook. India was an area of weakness. One of the largest retail and institutional equities brokerage firms in the country, ICICI Securities, Ltd. fell (41)%. Lingering concerns over lower retail equity volumes and lower investment banking revenues due to weakness in the Indian equity markets drove its share price lower. Delivering better news was Aegis Logistics, Ltd., a supply chain management company for oil, gas, and chemical industries. The completion of its new Kandla LPG (liquefied petroleum gas) terminal cleared the path for its joint venture deal with Vopak and adds clarity on future growth opportunities. Shares of Aegis gained 44% for the year. Our holdings in Southeast Asia delivered mixed performance. In the Philippines, the largest highspeed broadband operator in the country, Converge ICT Solutions, Inc. had lower-than-expected subscriber additions and an elevated churn rate, so its shares tumbled (50)%. Due to its rapid expansion in the last few years, |
27
|
AMG TimesSquare Emerging Markets Small Cap Fund Portfolio Manager’s Comments (continued) |
| | | | | | | | |
Converge ICT experienced tremendous growth. We expect the revenue growth and subscriber additions to normalize to a sustainable level with lower capital expenditures. In neighboring Indonesia, AKR Corporindo Tbk PT engages in the general trading and distribution of chemical and petroleum products. During the quarter, they reported strong 6-month results with impressive net profit growth. AKR is well-positioned to benefit from the increasing demand for basic chemicals and petroleum products as well as Indonesia’s increasing inbound foreign direct investment flows. The Fund sold the position at a gain as the company’s share price was up 31%. Regional Performance: The Americas Holdings in Latin America underperformed the benchmark’s regional return. Earlier in the year, with the monetary tightening cycle coming to an end, our Brazilian holdings took some of the top spots of the Fund. We then trimmed our Brazil exposure ahead of the presidential election. Under newly elected President Lula, Brazil raised its spending cap, sparking volatility in the Brazil equities amid fears that the higher spending will lead to a prolonged high interest rate environment. Grupo SBF is the operator of Brazil’s top sporting goods chain Centauro. They reported disappointing third quarter numbers as the company moves through an Enterprise Resource Planning (ERP) system migration in its Fisia unit. Margin compression also | | | | dragged on their results. We sold the name in the fourth quarter which lost (51)% while they were held in the Fund during the year. In Argentina, online travel agency Despegar.com Corp. saw better-than-expected growth of gross bookings from both domestic and international travel. However, the stock was down (51)% due to increasing concerns about slowing economic growth and impact to diminishing discretionary spending from the high inflationary environment. We added to the position on signs of strong travel demand within and outbound from Latin America. Outperforming the benchmark was Mexico’s real estate property developer Corp. Inmobiliaria Vesta SAB de CV and its 23% return. Vesta had a positive investor day and confirmed its 2024 guideline. Management sees increasing demand for manufacturing and logistics warehouses driven by near-shoring and eCommerce. Regional Performance: EMEA EMEA was the largest regional detractor within the Fund. South Africa’s Telkom, S.A. SOC, Ltd. is the largest integrated communications service provider in Africa. Despite the intrinsic value of its data infrastructure assets, with no near-term catalyst for privatization by the government and ongoing operational challenges combined with the prospect | | | | of increased rolling blackouts across the country, we closed out the position which lost (37)% while it was held this year. Conclusion Looking forward into 2023, many investors remain fixated on the macroeconomic environment. Which central bank will blink first by pausing—or even reversing—its quantitative tightening? Will those actions effectively reduce global inflation? How shallow or deep will 2023’s widely anticipated recession be? As bottom-up investors, our attention zeroes in on a company’s fundamentals and capital structure. While the contraction of P/E multiples weighed on nearly all stocks last year, many continued to increase their earnings and have stronger balance sheets than they did before the last recession. Stocks with that combination have a larger place in our strategy because we believe they will be well-positioned no matter what 2023 holds. As always, we are available for any questions you might have as we endeavor to protect the assets you have entrusted with us. The views expressed represent the opinions of TimesSquare Capital Management, LLC as of December 31, 2022, and are not intended as a forecast or guarantee of future results, and are subject to change without notice. |
28
|
AMG TimesSquare Emerging Markets Small Cap Fund Portfolio Manager’s Comments (continued) |
CUMULATIVE TOTAL RETURN PERFORMANCE
AMG TimesSquare Emerging Markets Small Cap Fund’s cumulative total return is based on the daily change in net asset value (NAV), and assumes that all dividends and distributions were reinvested. This graph compares a hypothetical $10,000 investment made in the AMG TimesSquare Emerging Markets Small Cap Fund’s Class I shares on December 14, 2016 (inception date), to a $10,000 investment made in the MSCI Emerging Markets Small Cap Index for the same time period. The graph and table do not reflect the deduction of taxes that a shareholder would pay on a Fund distribution or redemption of shares. The listed returns for the Fund are net of expenses and the returns for the index exclude expenses. Total returns would have been lower had certain expenses not been reduced.
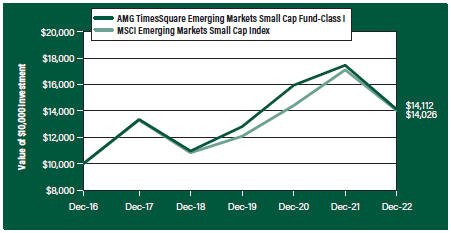
The table below shows the average annual total returns for the AMG TimesSquare Emerging Markets Small Cap Fund and the MSCI Emerging Markets Small Cap Index for the same time periods ended December 31, 2022.
| | | | | | | | | | | | | | | | |
| | | One | | | Five | | | Since | | | Inception | |
| Average Annual Total Returns1 | | Year | | | Years | | | Inception | | | Date | |
| |
AMG TimesSquare Emerging Markets Small Cap Fund2, 3, 4, 5, 6, 7, 8, 9, 10 | | | | | |
| | | | |
Class N | | | (19.43 | %) | | | 0.72 | % | | | 4.05 | % | | | 02/24/17 | |
| | | | |
Class I | | | (19.16 | %) | | | 1.11 | % | | | 5.86 | % | | | 12/14/16 | |
| | | | |
Class Z | | | (19.09 | %) | | | 1.12 | % | | | 5.87 | % | | | 12/14/16 | |
| | | | |
MSCI Emerging Markets Small Cap Index11 | | | (18.02 | %) | | | 1.06 | % | | | 5.75 | % | | | 12/14/16 | † |
The performance data shown represents past performance. Past performance is not a guarantee of future results. Current performance may be lower or higher than the performance data quoted. The investment return and principal value of an investment will fluctuate so that an investor’s shares, when redeemed, may be worth more or less than their original cost.
Investors should carefully consider the Fund’s investment objectives, risks, charges and expenses before investing. For performance information through the most recent month end, current net asset values per share for the Fund and other information, please call 800.548.4539 or visit our website at amgfunds.com for a free prospectus. Read it carefully before investing or sending money.
Distributed by AMG Distributors, Inc., member FINRA/SIPC.
| † | Date reflects the inception date of the Fund, not the index. |
| 1 | Total return equals income yield plus share price change and assumes reinvestment of all dividends and capital gain distributions. Returns are net of fees and may reflect offsets of Fund expenses as described in the prospectus. No adjustment has been made for taxes payable by shareholders on their reinvested dividends and |
|
capital gain distributions. Returns for periods greater than one year are annualized. The listed returns on the Fund are net of expenses and based on the published NAV as of December 31, 2022. All returns are in U.S. Dollars ($). 2 From time to time, the Fund’s investment manager has waived its fees and/or absorbed Fund expenses, which has resulted in higher returns. 3 Investments in international securities are subject to certain risks of overseas investing including currency fluctuations and changes in political and economic conditions, which could result in significant market fluctuations. These risks are magnified in emerging markets. 4 The Fund is subject to the risks associated with investments in emerging markets, such as erratic earnings patterns, economic and political instability, changing exchange controls, limitations on repatriation of foreign capital and changes in local governmental attitudes toward private investment, possibly leading to nationalization or confiscation of investor assets. 5 The Fund is subject to risks associated with investments in small-capitalization companies, such as erratic earnings patterns, competitive conditions, limited earnings history and a reliance on one or a limited number of products. 6 The Fund is subject to currency risk resulting from fluctuations in exchange rates that may affect the total loss or gain on a non-U.S. Dollar investment when converted back to U.S. Dollars. 7 The Fund may invest in derivatives such as options and futures; the complexity and rapidly changing structure of derivatives markets may increase the possibility of market losses. 8 Companies that are in similar industry sectors may be similarly affected by particular economic or market events; to the extent the Fund has substantial holdings within a particular sector, the risks associated with that sector increase. |
9 The Fund invests in growth stocks, which may be more sensitive to market movements because their prices tend to reflect future investor expectations rather than just current profits. Growth stocks may underperform value stocks during given periods. 10 Market prices of investments held by the Fund may fall rapidly or unpredictably due to a variety of economic or political factors, market conditions, disasters or public health issues, or in response to events that affect particular industries or companies. 11 MSCI Emerging Markets Small Cap Index includes small cap representation across 24 Emerging Markets countries. The small cap segment tends to capture more local economic and sector characteristics relative to larger Emerging Markets |
29
|
AMG TimesSquare Emerging Markets Small Cap Fund Portfolio Manager’s Comments (continued) |
| | | | |
| capitalization segments. Please go to msci.com for most current list of countries represented by the index. Unlike the Fund, the MSCI Emerging Markets Small Cap Index is unmanaged, is not available for investment and does not incur expenses. | | All MSCI data is provided ‘as is.’ The products described herein are not sponsored or endorsed and have not been reviewed or passed on by MSCI. In no event shall MSCI, its affiliates or any MSCI data provider have any liability of any kind in connection with the MSCI data or the products described herein. | | Copying or redistributing the MSCI data is strictly prohibited. Not FDIC insured, nor bank guaranteed. May lose value. |
30
| | |
| | | AMG TimesSquare Emerging Markets Small Cap Fund Fund Snapshots (unaudited) December 31, 2022 |
PORTFOLIO BREAKDOWN
| | | | | |
Sector | | % of Net Assets |
| | |
Information Technology | | 27.9 |
| | |
Consumer Discretionary | | 16.8 |
| | |
Communication Services | | 12.8 |
| | |
Financials | | 10.6 |
| | |
Health Care | | 10.6 |
| | |
Industrials | | 9.4 |
| | |
Materials | | 5.4 |
| | |
Real Estate | | 4.0 |
| | |
Energy | | 2.2 |
| | |
Consumer Staples | | 1.1 |
| | |
Short-Term Investments | | 0.3 |
| | |
Other Assets, less Liabilities | | (1.1) |
TOP TEN HOLDINGS
| | |
| Security Name | | % of Net Assets |
| | |
Jeisys Medical, Inc. (South Korea) | | 2.1 |
| | |
Tam Jai International Co., Ltd. (Hong Kong) | | 2.1 |
| | |
Metrodata Electronics Tbk PT (Indonesia) | | 2.1 |
| | |
Alchip Technologies, Ltd. (Taiwan) | | 2.0 |
| | |
KINX, Inc. (South Korea) | | 2.0 |
| | |
Chinasoft International, Ltd. (China) | | 2.0 |
| | |
Arabian Contracting Services Co. (Saudi Arabia) | | 1.9 |
| | |
Patria Investments, Ltd., Class A (Cayman Islands) | | 1.9 |
| | |
Converge ICT Solutions, Inc. (Philippines) | | 1.8 |
| | |
Green World FinTech Service Co., Ltd. (Taiwan) | | 1.7 |
| | | |
| | |
Top Ten as a Group | | 19.6 |
| | |
Because a fund’s strategy may result in multiple investments in particular sectors of the economy, its performance may depend on the performance of those sectors and may fluctuate more widely than investments diversified across more sectors. For additional information on these and other risk considerations, please see the Fund’s prospectus.
Any sectors, industries, or securities discussed should not be perceived as investment recommendations. Mention of a specific security should not be considered a recommendation to buy or solicitation to sell that security. Specific securities mentioned in this report may have been sold from the Fund’s portfolio of investments by the time you receive this report.
31
| | |
| | | AMG TimesSquare Emerging Markets Small Cap Fund Schedule of Portfolio Investments December 31, 2022 |
| | | | | | | | |
| | | Shares | | | Value | |
| | |
Common Stocks - 99.8% | | | | | | | | |
| |
Communication Services - 12.8% | | | | | |
| | |
AL Yah Satellite Communications Co.-PJSC-Yah Sat (United Arab Emirates) | | | 61,400 | | | | $41,791 | |
| | |
Arabian Contracting Services Co. (Saudi Arabia) | | | 3,100 | | | | 87,914 | |
| | |
Converge ICT Solutions, Inc. (Philippines)* | | | 291,100 | | | | 83,187 | |
| | |
KINX, Inc. (South Korea) | | | 2,200 | | | | 94,994 | |
| | |
Megacable Holdings SAB de CV (Mexico) | | | 24,900 | | | | 66,280 | |
| | |
The One Enterprise Public Co., Ltd. (Thailand) | | | 264,600 | | | | 60,738 | |
| | |
Plan B Media PCL, Class F (Thailand) | | | 213,600 | | | | 46,836 | |
| | |
Railtel Corp. of India, Ltd. (India) | | | 51,300 | | | | 78,494 | |
| | |
TIME dotCom Bhd (Malaysia) | | | 38,900 | | | | 43,270 | |
| | |
Total Communication Services | | | | | | | 603,504 | |
| |
Consumer Discretionary - 16.8% | | | | | |
| | |
AEON Motor Co., Ltd. (Taiwan) | | | 40,200 | | | | 51,128 | |
| | |
Afya, Ltd., Class A (Brazil)* | | | 3,400 | | | | 53,108 | |
| | |
Apollo Tyres, Ltd. (India) | | | 15,500 | | | | 60,611 | |
| | |
Arcos Dorados Holdings, Inc., Class A (Uruguay) | | | 7,600 | | | | 63,536 | |
| | |
Despegar.com Corp. (Argentina)* | | | 9,500 | | | | 48,735 | |
| | |
JUMBO SA (Greece) | | | 3,100 | | | | 53,168 | |
| | |
Kalyan Jewellers India, Ltd. (India)* | | | 37,200 | | | | 56,839 | |
| | |
Minor International PCL (Thailand)* | | | 57,200 | | | | 53,674 | |
| | |
momo.com, Inc. (Taiwan) | | | 2,232 | | | | 46,448 | |
| | |
MR DIY Group M Bhd (Malaysia)1 | | | 99,100 | | | | 44,990 | |
| | |
OPAP, S.A. (Greece) | | | 4,000 | | | | 56,591 | |
| | |
Raymond, Ltd. (India) | | | 2,600 | | | | 46,142 | |
| | |
Tam Jai International Co., Ltd. (Hong Kong) | | | 292,900 | | | | 98,440 | |
| | |
Varroc Engineering, Ltd. (India)*,1 | | | 16,600 | | | | 59,300 | |
| | |
Total Consumer Discretionary | | | | | | | 792,710 | |
| |
Consumer Staples - 1.1% | | | | | |
| | |
Laobaixing Pharmacy Chain JSC, Class A (China) | | | 8,700 | | | | 50,646 | |
| |
Energy - 2.2% | | | | | |
| | |
Aegis Logistics, Ltd. (India) | | | 8,900 | | | | 37,317 | |
| | |
AKR Corporindo Tbk PT (Indonesia) | | | 732,600 | | | | 65,896 | |
| | |
Total Energy | | | | | | | 103,213 | |
| |
Financials - 10.6% | | | | | |
| | |
Bangkok Commercial Asset Management PCL (Thailand) | | | 149,600 | | | | 68,230 | |
| | |
BSE, Ltd. (India) | | | 6,800 | | | | 44,713 | |
| | |
Central Depository Services India, Ltd. (India) | | | 3,600 | | | | 48,403 | |
| | |
ICICI Securities, Ltd. (India)1 | | | 12,000 | | | | 72,066 | |
| | |
Nippon Life India Asset Management, Ltd. (India)1 | | | 22,500 | | | | 67,658 | |
| | |
Patria Investments, Ltd., Class A (Cayman Islands) | | | 6,300 | | | | 87,759 | |
| | |
| | | | | | | | |
| | | | | | | | |
| | | Shares | | | Value | |
| | |
PB Fintech, Ltd. (India)* | | | 10,600 | | | | $57,342 | |
| | |
Transaction Capital, Ltd. (South Africa) | | | 27,900 | | | | 54,351 | |
| | |
Total Financials | | | | | | | 500,522 | |
| |
Health Care - 10.6% | | | | | |
| | |
Blau Farmaceutica, S.A. (Brazil) | | | 8,800 | | | | 43,869 | |
| | |
Bora Pharmaceuticals Co., Ltd. (Taiwan) | | | 3,300 | | | | 44,484 | |
| | |
Hypera, S.A. (Brazil) | | | 4,500 | | | | 38,525 | |
| | |
Jeisys Medical, Inc. (South Korea)* | | | 14,800 | | | | 100,227 | |
| | |
Lotus Pharmaceutical Co., Ltd. (Taiwan)* | | | 6,000 | | | | 47,875 | |
| | |
Rainbow Children’s Medicare, Ltd. (India) | | | 5,900 | | | | 52,655 | |
| | |
Shanghai Kindly Medical Instruments Co., Ltd., Class H (China) | | | 11,400 | | | | 41,851 | |
| | |
T&L Co., Ltd. (South Korea) | | | 2,500 | | | | 71,503 | |
| | |
Universal Vision Biotechnology Co., Ltd. (Taiwan) | | | 5,936 | | | | 57,619 | |
| | |
Total Health Care | | | | | | | 498,608 | |
| |
Industrials - 8.4% | | | | | |
| | |
Allcargo Logistics, Ltd. (India) | | | 11,800 | | | | 57,474 | |
| | |
Container Corp. Of India, Ltd. (India) | | | 5,600 | | | | 49,930 | |
| | |
Cowintech Co., Ltd. (South Korea) | | | 4,036 | | | | 73,518 | |
| | |
GMM Pfaudler, Ltd. (India) | | | 2,400 | | | | 45,377 | |
| | |
Hanwha Aerospace Co., Ltd. (South Korea) | | | 800 | | | | 46,588 | |
| | |
Maharah Human Resources Co. (Saudi Arabia) | | | 3,700 | | | | 51,128 | |
| | |
SFA Engineering Corp. (South Korea) | | | 2,400 | | | | 69,137 | |
| | |
Total Industrials | | | | | | | 393,152 | |
| |
Information Technology - 27.9% | | | | | |
| | |
Accton Technology Corp. (Taiwan) | | | 6,000 | | | | 45,563 | |
| | |
Alchip Technologies, Ltd. (Taiwan) | | | 3,800 | | | | 96,521 | |
| | |
Brogent Technologies, Inc. (Taiwan)* | | | 17,400 | | | | 72,723 | |
| | |
Chinasoft International, Ltd. (China) | | | 109,500 | | | | 94,795 | |
| | |
Chindata Group Holdings, Ltd., ADR (China)* | | | 5,000 | | | | 39,850 | |
| | |
Computer Age Management Services, Ltd. (India) | | | 2,000 | | | | 53,571 | |
| | |
Cyient, Ltd. (India) | | | 8,300 | | | | 81,215 | |
| | |
eCloudvalley Digital Technology Co., Ltd. (Taiwan) | | | 20,151 | | | | 53,808 | |
| | |
eMemory Technology, Inc. (Taiwan) | | | 1,000 | | | | 43,184 | |
| | |
Green World FinTech Service Co., Ltd.
(Taiwan) | | | 6,587 | | | | 82,794 | |
| | |
Intellian Technologies, Inc. (South Korea) | | | 1,500 | | | | 80,894 | |
| | |
LiveChat Software, S.A. (Poland) | | | 1,800 | | | | 44,065 | |
| | |
Locaweb Servicos de Internet, S.A. (Brazil)*,1 | | | 44,200 | | | | 58,769 | |
| | |
Metrodata Electronics Tbk PT (Indonesia) | | | 2,622,900 | | | | 97,722 | |
| | |
My EG Services Bhd (Malaysia) | | | 267,200 | | | | 52,781 | |
| | |
Park Systems Corp. (South Korea)* | | | 600 | | | | 54,367 | |
| | |
Sinbon Electronics Co., Ltd. (Taiwan) | | | 4,200 | | | | 37,519 | |
| | |
TOTVS, S.A. (Brazil) | | | 11,759 | | | | 61,515 | |
| | |
| | | | | | | | |
The accompanying notes are an integral part of these financial statements.
32
| | |
| | | AMG TimesSquare Emerging Markets Small Cap Fund Schedule of Portfolio Investments (continued) |
| | | | | | | | |
| | | Shares | | | Value | |
| | |
Information Technology - 27.9% (continued) | | | | | | | | |
| | |
Venustech Group, Inc., Class A (China) | | | 12,800 | | | | $47,943 | |
| | |
WinWay Technology Co., Ltd. (Taiwan) | | | 4,000 | | | | 54,211 | |
| | |
Yeahka, Ltd. (China)* | | | 22,100 | | | | 59,024 | |
| | |
Total Information Technology | | | | | | | 1,312,834 | |
| |
Materials - 5.4% | | | | | |
| | |
Dongsung Finetec Co., Ltd. (South Korea) | | | 8,800 | | | | 75,661 | |
| | |
EPL, Ltd. (India) | | | 29,500 | | | | 60,809 | |
| | |
Samator Indo Gas Tbk PT (Indonesia) | | | 364,800 | | | | 45,466 | |
| | |
SKC Co., Ltd. (South Korea) | | | 1,000 | | | | 70,568 | |
| | |
Total Materials | | | | | | | 252,504 | |
| |
Real Estate - 4.0% | | | | | |
| | |
A-Living Smart City Services Co., Ltd. (China)1 | | | 57,100 | | | | 68,427 | |
| | |
Corp. Inmobiliaria Vesta SAB de CV (Mexico) | | | 24,500 | | | | 58,061 | |
| | |
Multiplan Empreendimentos Imobiliarios, S.A. (Brazil) | | | 14,500 | | | | 60,145 | |
| | |
Total Real Estate | | | | | | | 186,633 | |
| | |
Total Common Stocks
(Cost $4,874,333) | | | | | | | 4,694,326 | |
| | | | | | | | |
| | | Shares | | | Value | |
| |
Participation Notes - 1.0% | | | | | |
| |
Industrials - 1.0% | | | | | |
| | |
Masan Group Corp., 01/27/23 (JPMorgan) (Vietnam) | | | 11,840 | | | $ | 46,685 | |
| | |
Total Participation Notes
(Cost $26,911) | | | | | | | 46,685 | |
| |
Short-Term Investments - 0.3% | | | | | |
| |
Other Investment Companies - 0.3% | | | | | |
| | |
Dreyfus Government Cash Management Fund, Institutional Shares, 4.19%2 | | | 5,765 | | | | 5,765 | |
| | |
Dreyfus Institutional Preferred Government Money Market Fund, Institutional Shares, 4.27%2 | | | 8,648 | | | | 8,648 | |
| | |
Total Short-Term Investments
(Cost $14,413) | | | | | | | 14,413 | |
| | |
Total Investments - 101.1%
(Cost $4,915,657) | | | | | | | 4,755,424 | |
| |
Other Assets, less Liabilities - (1.1)% | | | | (50,406 | ) |
| | |
Net Assets - 100.0% | | | | | | $ | 4,705,018 | |
| * | Non-income producing security. |
| 1 | Security exempt from registration under Rule 144A of the Securities Act of 1933. This security may be resold in transactions exempt from registration, normally to qualified institutional buyers. At December 31, 2022, the value of these securities amounted to $371,210 or 7.9% of net assets. |
| 2 | Yield shown represents the December 31, 2022, seven day average yield, which refers to the sum of the previous seven days’ dividends paid, expressed as an annual percentage. |
ADR American Depositary Receipt
The accompanying notes are an integral part of these financial statements.
33
| | |
| | | AMG TimesSquare Emerging Markets Small Cap Fund Schedule of Portfolio Investments (continued) |
| | | |
| | | |
The following table summarizes the inputs used to value the Fund’s investments by the fair value hierarchy levels as of December 31, 2022:
| | | | | | | | | | | | | | | | |
| | | Level 1 | | | Level 21 | | | Level 3 | | | Total | |
Investments in Securities | | | | | | | | | | | | | | | | |
| | | | |
Common Stocks | | | | | | | | | | | | | | | | |
| | | | |
Information Technology | | $ | 257,856 | | | $ | 1,054,978 | | | | — | | | $ | 1,312,834 | |
| | | | |
Consumer Discretionary | | | 219,053 | | | | 573,657 | | | | — | | | | 792,710 | |
| | | | |
Communication Services | | | 66,280 | | | | 537,224 | | | | — | | | | 603,504 | |
| | | | |
Financials | | | 142,110 | | | | 358,412 | | | | — | | | | 500,522 | |
| | | | |
Health Care | | | 82,394 | | | | 416,214 | | | | — | | | | 498,608 | |
| | | | |
Industrials | | | — | | | | 393,152 | | | | — | | | | 393,152 | |
| | | | |
Materials | | | — | | | | 252,504 | | | | — | | | | 252,504 | |
| | | | |
Real Estate | | | 118,206 | | | | 68,427 | | | | — | | | | 186,633 | |
| | | | |
Energy | | | — | | | | 103,213 | | | | — | | | | 103,213 | |
| | | | |
Consumer Staples | | | — | | | | 50,646 | | | | — | | | | 50,646 | |
| | | | |
Participation Notes† | | | — | | | | 46,685 | | | | — | | | | 46,685 | |
| | | | |
Short-Term Investments | | | | | | | | | | | | | | | | |
| | | | |
Other Investment Companies | | | 14,413 | | | | — | | | | — | | | | 14,413 | |
| | | | | | | | | | | | | | | | |
| | | | |
Total Investment in Securities | | $ | 900,312 | | | $ | 3,855,112 | | | | — | | | $ | 4,755,424 | |
| | | | | | | | | | | | | | | | |
| † | All participation notes held in the Fund are Level 2 securities. For a detailed breakout of participation notes by major industry classification, please refer to the Fund’s Schedule of Portfolio Investments. |
| 1 | An external pricing service is used to reflect any impact on security value due to market movements between the time the Fund valued such foreign securities and the earlier closing of foreign markets. |
For the fiscal year ended December 31, 2022, there were no transfers in or out of Level 3.
The country allocation in the Schedule of Portfolio Investments at December 31, 2022, was as follows:
| | |
| Country | | % of Long-Term Investments |
| |
Argentina | | 1.0 |
| |
Brazil | | 6.7 |
| |
Cayman Islands | | 1.9 |
| |
China | | 8.5 |
| |
Greece | | 2.3 |
| |
Hong Kong | | 2.1 |
| |
India | | 21.7 |
| |
Indonesia | | 4.4 |
| |
Malaysia | | 3.0 |
| |
Mexico | | 2.6 |
| |
Philippines | | 1.8 |
| | |
| Country | | % of Long-Term Investments |
| |
Poland | | 0.9 |
| |
Saudi Arabia | | 2.9 |
| |
South Africa | | 1.1 |
| |
South Korea | | 15.6 |
| |
Taiwan | | 15.5 |
| |
Thailand | | 4.8 |
| |
United Arab Emirates | | 0.9 |
| |
Uruguay | | 1.3 |
| |
Vietnam | | 1.0 |
| | |
| |
| | 100.0 |
| | |
The accompanying notes are an integral part of these financial statements.
34
|
AMG TimesSquare Global Small Cap Fund Portfolio Manager’s Comments (unaudited) |
| | | | | | | | |
Year in Review For the year ended December 31, 2022, AMG TimesSquare Global Small Cap Fund (the “Fund”) Class N shares returned (24.00)%, while its benchmark, the MSCI World Small Cap Index, returned (18.75)%. In 2022, global equity markets retreated sharply after three consecutive years of double-digit gains. For example, the MSCI World Index declined by (18)% after average calendar year gains of 22% from 2019 to 2021. Weighing on the markets during the year was a combination of higher inflation rates, climbing commodity prices, tighter monetary policies, and slowing measures of business activities that moved into the range of economic contraction. Though down for the year, in the fourth quarter equities rose from troughs earlier in 2022. That initial rebound was strongest for non-U.S. developed markets, followed by emerging markets, and then the U.S. Across all geographies, Value stocks remained favored above Growth stocks. For the year, energy remained the lone positive—and significantly so. As inflation rates remained above the goals for most major central banks, many of them raised interest rates during the year. In contrast, the People’s Bank of China (PBoC) kept key lending rates stable after lowering them in August to provide support to the Chinese economy. In December, China’s long-awaited shift away from its zero-COVID policy also provided positive news to the market. Amid this environment, the Fund underperformed the MSCI World Small Cap Index for the year. Relative weakness was seen across the regions. Among sectors, consumer staples and real estate contributed while stock selections in industrials and the Fund’s underweight position in energy detracted. Regional Performance: Americas The Americas region housed some of the Fund’s largest contributors. Within the industrials sector, EMCOR Group, Inc. provides construction and operational services for mechanical and electrical systems to a broad range of commercial, industrial, utility, and institutional customers. EMCOR’s revenues and earnings bested expectations, as did the increased guidance for the rest of 2022. Notable growth was generated from its service groups for construction and building services, along with a higher backlog of activities. With its price climbing 17%, we trimmed our position. In the fourth quarter, we initiated a position in Esab Corp., a leading global welding company. Despite a challenging economic environment for its end | | | | markets, Esab reported revenues and earnings that exceeded expectations thanks to growth in volumes and pricing. That growth continued unabated, despite the exclusion of its divested operations in Russia, and lifted its shares by 28% since it was added to the Fund. Offsetting some of the strength was The AZEK Co., Inc, a manufacturer of wood-alternative residential and commercial building products. Despite reporting strong results with both its residential and commercial businesses posting impressive growth rates, the stock traded down on housing market fears and commodity price inflationary pressures. Later in the year, fiscal year guidance was reduced as management saw future demand moderating. AZEK’s share price tumbled (56)% for the full year. Macro headwinds weighed on consumer discretionary names such as Floor & décor Holdings, Inc. Management reduced their full-year sales outlook and trimmed the top end of earnings guidance to account for anticipated macro-related demand challenges. We exited the position, which was down (46)% while it was held in the Fund this year. Meanwhile, more defensive consumer staples names fared better. Case in point is food products distributor Performance Food Group Co., which operates through two segments: Foodservice and Vistar. Foodservice delivers food-related products to restaurants. Vistar serves vending, theater, retail, and other channels. Recent revenues and earnings exceeded expectations, which led Performance Food’s management to increase its guidance for the balance of its fiscal year. The company’s staffing situation improved—less need for costlier temporary employees—and it gained market share among independent restaurants. Shares jumped 27% as a result. Performance within health care was mixed. Encompass Health Corp. is a market leader in in-patient rehabilitation after spinning off its home health and hospice business. Though many hospitals reported lower levels of inpatient admissions, Encompass reported better-than-expected revenues that were bolstered by its in-patient rehabilitation facilities. While increased labor costs did pinch earnings, Encompass continues to meet its volume demands and is well-positioned for further growth. That sent its shares 16% higher in the year. On the negative side, declining (42)% was Charles River Laboratories International, Inc. a leading provider of outsourced services for drug discovery and preclinical research. The company experienced slowing growth from a recently acquired contract development and manufacturing operation (CDMO) | | | | though the long-term prospects were positive for its core Research Model and Services (RMS) and Discovery and Safety Assessment (DSA) businesses. The stock was sold during the period. Share price of reinsurance provider RenaissanceRe Holdings zig-zagged during the year but ultimately ended up with a 10% gain. Earlier in the year, RenaissanceRe’s fiscal quarterly earnings were lower than anticipated, caused by higher losses tied to the Ukraine war and storm claims from Europe and Australia. The concerns associated with the hurricane season also added to the uncertainty. Despite the headwinds, RenaissanceRe’s level of gross premiums written was higher than anticipated, though more importantly the company expects that underwriting income, investment income, and fee income all are poised to increase materially in 2023. With the outlook of semicaps remaining weak, we exited our position in MKS Instruments, a manufacturer of subsystems for the semiconductor capital equipment industry. Shares of MKS Instruments slid (59)% while they were held in the Fund during the year. During the year, game developer for mobile devices Zynga, Inc. was acquired by Take-Two Software. That scored a 28% gain for Zynga’s shares while they were in the portfolio this year. Regional Performance: Europe The Fund’s holdings in Europe underperformed the benchmark’s regional return. The Fund’s largest detractor was leading forklift manufacturer in Germany, KION Group. Due to the long-term nature of some of its projects, the company has not been able to pass on higher material, labor, and logistics costs. As a result, the company issued a profit warning and shares tumbled (73)%. Our holdings in the communication sectors faced multiple compressions and fragile sentiment in a rising rate environment. Case in point was Sweden based Viaplay, the region’s leading entertainment provider. Early in the year when streaming peer Netflix reported weak quarterly results, Viaplay’s share price declined in sympathy. Later in the year, the company fell short of our expectations that earnings would inflect in third quarter—instead pricing power in Norway and overall advertising revenues were weaker than expected. We exited the position, with shares declining by (64)% for the period that it was held. Retreating from its position as a top 2021 contributor with its (72)% correction was U.K.-based Future PLC. They are a specialty |
35
|
AMG TimesSquare Global Small Cap Fund Portfolio Manager’s Comments (continued) |
| | | | | | | | |
content publisher transitioning from print-to-digital-platform. The group benefited from ongoing momentum in digital advertising. However, its share price dropped when the company’s CEO shared her intention to step down by the end of 2023. We trimmed our exposures to Future throughout the year in light of the rising rate environment but decided to exit the name in the fourth quarter as the outlook for both company turned increasingly opaque. Broader recessionary concerns also weighed on our consumer-related holdings in Europe. U.K. listed Grafton, is a multi-channel distributor of construction products. The stock was sold during the period. Concerns on weakening end demand and the challenging macroeconomic backdrop hurt the overall building materials sector along with Grafton’s share price, which dropped by (51)%. Amidst the multiple market dislocations, industrial buyers were opportunistically seeking price inefficiencies in quality assets. This was the case for UK based HomeServe, which offers a range of home emergencies coverage via subscription-based membership services. A top detractor in 2021, the tide turned as Canada-based Brookfield Asset Management offered to purchase HomeServe in a £4bn transaction. Its shares appreciated 21% and we exited our position. Regional Performance: Japan Japan was another area of weakness though there were some bright spots. Zenkoku Hosho Co., Ltd was added to the Fund in the third quarter. The company provides credit guarantee services for mortgages. | | | | Zenkoku Hosho recently attracted a new activist investor calling for a minimum of a 70% dividend payout plus share buybacks as measures to improve its return on equity (ROE) and stock price. Management is getting friendlier on shareholder returns via dividend payout increases. Meanwhile, they are making some very attractive acquisitions and we expect more in the coming months. During the fourth quarter we initiated a position in MatsukiyoCocokara (“MKCF”) on its price weakness. MKCF is one of Japan’s largest drug store chains, with a larger presence in central urban locations than its peers. They reported strong quarterly results thanks to higher-than-expected cost synergies post their Cocokara Fine merger. With its superior locations in areas with heavy tourist traffic, we believe MKCF stands to benefit from higher inbound tourism to Japan. Shares of Zenkoku and MKCF returned 18% and 35%, respectively, since they were added to the Fund. Regional Performance: Asia Pacific Ex Japan and Middle East The Fund’s Asia Pacific ex Japan and Middle East holdings underperformed the benchmark’s regional performance. The broad weakness in the information technology sector weighed on our holdings. Nice, Ltd. is a cloud-based contact center software and compliance systems provider. The company reported solid results throughout the year. Though its cloud-based revenues were as expected, Nice benefited from increased sales of its products for financial crimes and compliance. Shares of Nice traded down (37)% for the year. | | | | Regional Performance: Emerging Markets Within the Emerging Markets, our largest detractor was South Korea’s K Car Co., Ltd. The company provides a platform service for used cars. The impact of tight used car supply lingered over its share price. In September, one of its facilities was flooded along with 200 vehicles due to a typhoon. Although the damage is expected to be recovered through insurance, we decided to exit the position. Its share price fell (70)% for the period it was owned. Conclusion Looking forward into 2023, many investors remain fixated on the macroeconomic environment. Which central bank will blink first by pausing—or even reversing—its quantitative tightening? Will those actions effectively reduce global inflation? How shallow or deep will 2023’s widely anticipated recession be? As bottom-up investors, our attention zeroes in on a company’s fundamentals and capital structure. While the contraction of P/E multiples weighed on nearly all stocks last year, many continued to increase their earnings and have stronger balance sheets than they did before the last recession. Stocks with that combination have a larger place in our strategy because we believe they will be well-positioned no matter what 2023 holds. The views expressed represent the opinions of TimesSquare Capital Management, LLC as of December 31, 2022, and are not intended as a forecast or guarantee of future results, and are subject to change without notice. |
36
|
AMG TimesSquare Global Small Cap Fund Portfolio Manager’s Comments (continued) |
CUMULATIVE TOTAL RETURN PERFORMANCE
AMG TimesSquare Global Small Cap Fund’s cumulative total return is based on the daily change in net asset value (NAV), and assumes that all dividends and distributions were reinvested. This graph compares a hypothetical $10,000 investment made in the AMG TimesSquare Global Small Cap Fund’s Class N shares on May 30, 2018 (inception date), to a $10,000 investment made in the MSCI World Small Cap Index for the same time period. The graph and table do not reflect the deduction of taxes that a shareholder would pay on a Fund distribution or redemption of shares. The listed returns for the Fund are net of expenses and the returns for the index exclude expenses. Total returns would have been lower had certain expenses not been reduced.
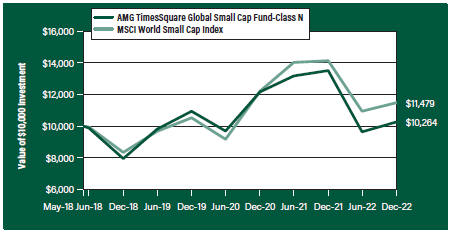
The table below shows the average annual total returns for the AMG TimesSquare Global Small Cap Fund and the MSCI World Small Cap Index for the same time periods ended December 31, 2022.
| | | | | | |
| | | One | | Since | | Inception |
| Average Annual Total Returns1 | | Year | | Inception | | Date |
|
AMG TimesSquare Global Small Cap Fund2, 3, 4, 5, 6, 7, 8, 9, 10 |
| | | |
Class N | | (24.00%) | | 0.57% | | 05/30/18 |
| | | |
Class I | | (23.76%) | | 0.82% | | 05/30/18 |
| | | |
Class Z | | (23.83%) | | 0.82% | | 05/30/18 |
| | | |
MSCI World Small Cap Index11 | | (18.75%) | | 3.05% | | 05/30/18† |
The performance data shown represents past performance. Past performance is not a guarantee of future results. Current performance may be lower or higher than the performance data quoted. The investment return and principal value of an investment will fluctuate so that an investor’s shares, when redeemed, may be worth more or less than their original cost.
Investors should carefully consider the Fund’s investment objectives, risks, charges and expenses before investing. For performance information through the most recent month end, current net asset values per share for the Fund and other information, please call 800.548.4539 or visit our website at amgfunds.com for a free prospectus. Read it carefully before investing or sending money.
Distributed by AMG Distributors, Inc., member FINRA/SIPC.
| † | Date reflects inception date of the Fund, not the index. |
| 1 | Total return equals income yield plus share price change and assumes reinvestment of all dividends and capital gain distributions. Returns are net of fees and may reflect offsets of Fund expenses as described in the prospectus. No adjustment has been made for taxes payable by shareholders on their reinvested dividends and |
|
capital gain distributions. Returns for periods greater than one year are annualized. The listed returns on the Fund are net of expenses and based on the published NAV as of December 31, 2022. All returns are in U.S. Dollars ($). 2 From time to time, the Fund’s investment manager has waived its fees and/or absorbed Fund expenses, which has resulted in higher returns. 3 Investments in international securities are subject to certain risks of overseas investing including currency fluctuations and changes in political and economic conditions, which could result in significant market fluctuations. These risks are magnified in emerging markets. 4 The Fund is subject to the risks associated with investments in emerging markets, such as erratic earnings patterns, economic and political instability, changing exchange controls, limitations on repatriation of foreign capital and changes in local governmental attitudes toward private investment, possibly leading to nationalization or confiscation of investor assets. 5 The Fund is subject to risks associated with investments in small-capitalization companies, such as erratic earnings patterns, competitive conditions, limited earnings history and a reliance on one or a limited number of products. 6 The Fund is subject to currency risk resulting from fluctuations in exchange rates that may affect the total loss or gain on a non-U.S. Dollar investment when converted back to U.S. Dollars. |
7 The Fund may invest in derivatives such as options and futures; the complexity and rapidly changing structure of derivatives markets may increase the possibility of market losses. 8 The Fund invests in growth stocks, which may be more sensitive to market movements because their prices tend to reflect future investor expectations rather than just current profits. Growth stocks may underperform value stocks during given periods. 9 Market prices of investments held by the Fund may fall rapidly or unpredictably due to a variety of economic or political factors, market conditions, disasters or public health issues, or in response to events that affect particular industries or companies. 10 Companies that are in similar industry sectors may be similarly affected by particular economic or market events; to the extent the Fund has substantial holdings within a particular sector, the risks associated with that sector increase. 11 The MSCI World Small Cap Index captures small cap representation across 23 Developed Markets countries. With over 4,000 constituents, the index covers approximately 14% of the free float-adjusted market capitalization in each country. Please go to |
37
|
AMG TimesSquare Global Small Cap Fund Portfolio Manager’s Comments (continued) |
| | | | |
| msci.com for most current list of countries represented by the Index. Unlike the Fund, the MSCI World Small Cap Index is unmanaged, is not available for investment and does not incur expenses. | | All MSCI data is provided ‘as is.’ The products described herein are not sponsored or endorsed and have not been reviewed or passed on by MSCI. In no event shall MSCI, its affiliates or any MSCI data provider have any liability of any kind in connection with the MSCI data or the products described herein. | | Copying or redistributing the MSCI data is strictly prohibited. Not FDIC insured, nor bank guaranteed. May lose value. |
38
| | |
| | | AMG TimesSquare Global Small Cap Fund Fund Snapshots (unaudited) December 31, 2022 |
PORTFOLIO BREAKDOWN
| | | | | |
| Sector | | % of Net Assets |
| | |
Industrials | | 27.6 |
| | |
Financials | | 17.6 |
| | |
Information Technology | | 15.4 |
| | |
Consumer Discretionary | | 14.7 |
| | |
Consumer Staples | | 9.5 |
| | |
Health Care | | 6.9 |
| | |
Materials | | 3.1 |
| | |
Energy | | 2.8 |
| | |
Communication Services | | 2.7 |
| | |
Utilities | | 0.8 |
| | |
Short-Term Investments | | 1.0 |
| | |
Other Assets, less Liabilities | | (2.1) |
TOP TEN HOLDINGS
| | |
| Security Name | | % of Net Assets |
| | |
Kobe Bussan Co., Ltd. (Japan) | | 2.9 |
| | |
Esab Corp. (United States) | | 2.8 |
| | |
Steadfast Group, Ltd. (Australia) | | 2.7 |
| | |
Nexans, S.A. (France) | | 2.7 |
| | |
Zenkoku Hosho Co., Ltd. (Japan) | | 2.5 |
| | |
CyberArk Software, Ltd. (Israel) | | 2.3 |
| | |
Nice, Ltd., Sponsored ADR (Israel) | | 2.3 |
| | |
RenaissanceRe Holdings, Ltd. (Bermuda) | | 2.2 |
| | |
PJT Partners, Inc., Class A (United States) | | 2.2 |
| | |
WNS Holdings, Ltd., ADR (India) | | 2.1 |
| | | |
| | |
Top Ten as a Group | | 24.7 |
| | |
Because a fund’s strategy may result in multiple investments in particular sectors of the economy, its performance may depend on the performance of those sectors and may fluctuate more widely than investments diversified across more sectors. For additional information on these and other risk considerations, please see the Fund’s prospectus.
Any sectors, industries, or securities discussed should not be perceived as investment recommendations. Mention of a specific security should not be considered a recommendation to buy or solicitation to sell that security. Specific securities mentioned in this report may have been sold from the Fund’s portfolio of investments by the time you receive this report.
39
| | |
| | | AMG TimesSquare Global Small Cap Fund Schedule of Portfolio Investments December 31, 2022 |
| | | | | | | | |
| | | Shares | | | Value | |
| |
Common Stocks - 101.1% | | | | | |
| |
Communication Services - 2.7% | | | | | |
| | |
Auto Trader Group PLC (United Kingdom)1 | | | 2,100 | | | | $13,078 | |
| | |
Internet Initiative Japan, Inc. (Japan) | | | 1,800 | | | | 33,346 | |
| | |
Total Communication Services | | | | | | | 46,424 | |
| |
Consumer Discretionary - 14.7% | | | | | |
| | |
Arcos Dorados Holdings, Inc., Class A (Uruguay) | | | 1,700 | | | | 14,212 | |
| | |
Brunswick Corp. (United States) | | | 400 | | | | 28,832 | |
| | |
CIE Automotive, S.A. (Spain) | | | 800 | | | | 20,582 | |
| | |
Dalata Hotel Group PLC (Ireland)* | | | 3,700 | | | | 12,819 | |
| | |
Games Workshop Group PLC (United Kingdom) | | | 200 | | | | 20,645 | |
| | |
Hilton Grand Vacations, Inc. (United States)* | | | 800 | | | | 30,832 | |
| | |
momo.com, Inc. (Taiwan) | | | 708 | | | | 14,733 | |
| | |
National Vision Holdings, Inc. (United States)*,2 | | | 700 | | | | 27,132 | |
| | |
Planet Fitness, Inc., Class A (United States)* | | | 400 | | | | 31,520 | |
| | |
Spin Master Corp. (Canada)1 | | | 500 | | | | 12,304 | |
| | |
Topgolf Callaway Brands Corp. (United States)* | | | 1,200 | | | | 23,700 | |
| | |
Visteon Corp. (United States)* | | | 100 | | | | 13,083 | |
| | |
Total Consumer Discretionary | | | | | | | 250,394 | |
| |
Consumer Staples - 9.5% | | | | | |
| | |
Kobe Bussan Co., Ltd. (Japan) | | | 1,700 | | | | 48,996 | |
| | |
MatsukiyoCocokara & Co. (Japan) | | | 500 | | | | 25,132 | |
| | |
Performance Food Group Co. (United States)* | | | 600 | | | | 35,034 | |
| | |
Tate & Lyle PLC (United Kingdom) | | | 2,400 | | | | 20,561 | |
| | |
Viscofan, S.A. (Spain) | | | 500 | | | | 32,204 | |
| | |
Total Consumer Staples | | | | | | | 161,927 | |
| | |
Energy - 2.8% | | | | | | | | |
| | |
Gaztransport Et Technigaz, S.A. (France) | | | 200 | | | | 21,374 | |
| | |
Pason Systems, Inc. (Canada) | | | 1,000 | | | | 11,773 | |
| | |
TGS ASA (Norway) | | | 1,100 | | | | 14,875 | |
| | |
Total Energy | | | | | | | 48,022 | |
| |
Financials - 17.6% | | | | | |
| | |
FinecoBank Banca Fineco S.P.A. (Italy) | | | 1,700 | | | | 28,231 | |
| | |
Focus Financial Partners, Inc.,
Class A (United States)* | | | 700 | | | | 26,089 | |
| | |
Nordnet AB publ (Sweden) | | | 1,300 | | | | 18,825 | |
| | |
Patria Investments, Ltd.,
Class A (Cayman Islands) | | | 1,100 | | | | 15,323 | |
| | |
PJT Partners, Inc., Class A (United States) | | | 500 | | | | 36,845 | |
| | |
RenaissanceRe Holdings, Ltd. (Bermuda) | | | 200 | | | | 36,846 | |
| | |
St James’s Place PLC (United Kingdom) | | | 1,300 | | | | 17,125 | |
| | |
Steadfast Group, Ltd. (Australia) | | | 12,400 | | | | 46,054 | |
| | |
Topdanmark AS (Denmark) | | | 600 | | | | 31,575 | |
| | | | | | | | |
| | | | | | | | |
| | | Shares | | | Value | |
| | |
Zenkoku Hosho Co., Ltd. (Japan) | | | 1,100 | | | | $42,144 | |
| | |
Total Financials | | | | | | | 299,057 | |
| | |
Health Care - 6.9% | | | | | | | | |
| | |
ALK-Abello A/S (Denmark)* | | | 600 | | | | 8,369 | |
| | |
Amplifon S.P.A. (Italy) | | | 300 | | | | 8,958 | |
| | |
As One Corp. (Japan) | | | 200 | | | | 8,737 | |
| | |
Ascendis Pharma A/S, ADR (Denmark)* | | | 150 | | | | 18,320 | |
| | |
Chemed Corp. (United States) | | | 50 | | | | 25,522 | |
| | |
Encompass Health Corp. (United States) | | | 500 | | | | 29,905 | |
| | |
Siegfried Holding AG (Switzerland) | | | 25 | | | | 16,606 | |
| | |
Total Health Care | | | | | | | 116,417 | |
| | |
Industrials - 27.6% | | | | | | | | |
| | |
AG Growth International, Inc. (Canada) | | | 400 | | | | 12,807 | |
| | |
Arcadis, N.V. (Netherlands) | | | 400 | | | | 15,748 | |
| | |
The AZEK Co., Inc. (United States)* | | | 900 | | | | 18,288 | |
| | |
Casella Waste Systems, Inc.,
Class A (United States)* | | | 425 | | | | 33,707 | |
| | |
Diploma PLC (United Kingdom) | | | 500 | | | | 16,810 | |
| | |
EMCOR Group, Inc. (United States) | | | 150 | | | | 22,216 | |
| | |
Esab Corp. (United States) | | | 1,000 | | | | 46,920 | |
| | |
Exponent, Inc. (United States) | | | 300 | | | | 29,727 | |
| | |
Fuji Corp. (Japan) | | | 900 | | | | 13,113 | |
| | |
Hexcel Corp. (United States) | | | 350 | | | | 20,598 | |
| | |
Interpump Group S.P.A. (Italy) | | | 200 | | | | 9,029 | |
| | |
IPH, Ltd. (Australia) | | | 6,000 | | | | 35,265 | |
| | |
KION Group AG (Germany) | | | 366 | | | | 10,424 | |
| | |
Nexans, S.A. (France) | | | 500 | | | | 45,255 | |
| | |
Regal Rexnord Corp. (United States) | | | 150 | | | | 17,997 | |
| | |
Rotork PLC (United Kingdom) | | | 5,800 | | | | 21,554 | |
| | |
RS Group PLC (United Kingdom) | | | 900 | | | | 9,690 | |
| | |
Saab AB, Class B (Sweden) | | | 900 | | | | 35,467 | |
| | |
Valmet Oyj (Finland)2 | | | 600 | | | | 16,197 | |
| | |
WillScot Mobile Mini Holdings
Corp. (United States)* | | | 400 | | | | 18,068 | |
| | |
Zurn Elkay Water Solutions Corp. (United States) | | | 1,000 | | | | 21,150 | |
| | |
Total Industrials | | | | | | | 470,030 | |
| | |
Information Technology - 15.4% | | | | | | | | |
| | |
Accton Technology Corp. (Taiwan) | | | 1,800 | | | | 13,669 | |
| | |
CyberArk Software, Ltd. (Israel)* | | | 300 | | | | 38,895 | |
| | |
Fortnox AB (Sweden) | | | 2,000 | | | | 9,082 | |
| | |
Jack Henry & Associates, Inc. (United States) | | | 150 | | | | 26,334 | |
| | |
Keywords Studios PLC (Ireland) | | | 600 | | | | 19,690 | |
| | |
MACOM Technology Solutions Holdings,
Inc. (United States)* | | | 400 | | | | 25,192 | |
| | | | | | | | |
The accompanying notes are an integral part of these financial statements.
40
| | |
| | | AMG TimesSquare Global Small Cap Fund Schedule of Portfolio Investments (continued) |
| | | |
| | | |
| | | | | | | | |
| | |
| | | Shares | | | Value | |
| | |
Information Technology - 15.4%
(continued) | | | | | | | | |
| | |
Nice, Ltd., Sponsored ADR (Israel)*,2 | | | 200 | | | | $38,460 | |
| | |
Simplex Holdings, Inc. (Japan)* | | | 1,200 | | | | 18,962 | |
| | |
Spirent Communications PLC (United Kingdom) | | | 7,000 | | | | 22,239 | |
| | |
TOTVS, S.A. (Brazil) | | | 2,583 | | | | 13,512 | |
| | |
WNS Holdings, Ltd., ADR (India)* | | | 450 | | | | 35,995 | |
| | |
Total Information Technology | | | | | | | 262,030 | |
| | |
Materials - 3.1% | | | | | | | | |
| | |
Asahi Holdings, Inc. (Japan) | | | 800 | | | | 11,686 | |
| | |
Huhtamaki Oyj (Finland) | | | 700 | | | | 23,980 | |
| | |
Verallia, S.A. (France)1 | | | 500 | | | | 16,945 | |
| | |
Total Materials | | | | | | | 52,611 | |
| | |
Utilities - 0.8% | | | | | | | | |
| | |
Nippon Gas Co., Ltd. (Japan) | | | 900 | | | | 14,084 | |
| |
Total Common Stocks
(Cost $1,665,861) | | | | 1,720,996 | |
| | | | | |
| | | | | | | | |
| | |
| | | Shares | | | Value | |
| |
Short-Term Investments - 1.0% | | | | | |
| |
Other Investment Companies - 1.0% | | | | | |
| | |
Dreyfus Government Cash Management Fund, Institutional Shares, 4.19%3 | | | 6,801 | | | | $6,801 | |
| | |
Dreyfus Institutional Preferred Government Money Market Fund, Institutional Shares, 4.27%3 | | | 10,202 | | | | 10,202 | |
| |
Total Short-Term Investments
(Cost $17,003) | | | | 17,003 | |
| |
Total Investments - 102.1%
(Cost $1,682,864) | | | | 1,737,999 | |
| |
Other Assets, less Liabilities - (2.1)% | | | | (35,050 | ) |
| |
Net Assets - 100.0% | | | $ | 1,702,949 | |
| | | | | |
| * | Non-income producing security. |
| 1 | Security exempt from registration under Rule 144A of the Securities Act of 1933. This security may be resold in transactions exempt from registration, normally to qualified institutional buyers. At December 31, 2022, the value of these securities amounted to $42,327 or 2.5% of net assets. |
| 2 | Some of these securities, amounting to $77,084 or 4.5% of net assets, were out on loan to various borrowers and are collateralized by various U.S. Treasury Obligations. See Note 4 of Notes to Financial Statements. |
| 3 | Yield shown represents the December 31, 2022, seven day average yield, which refers to the sum of the previous seven days’ dividends paid, expressed as an annual percentage. |
ADR American Depositary Receipt
The accompanying notes are an integral part of these financial statements.
41
| | |
| | | AMG TimesSquare Global Small Cap Fund Schedule of Portfolio Investments (continued) |
| | | |
| | | |
The following table summarizes the inputs used to value the Fund’s investments by the fair value hierarchy levels as of December 31, 2022:
| | | | | | | | | | | | | | | | |
| | | Level 1 | | | Level 21 | | | Level 3 | | | Total | |
Investments in Securities | | | | | | | | | | | | | | | | |
| | | | |
Common Stocks | | | | | | | | | | | | | | | | |
| | | | |
Industrials | | $ | 241,478 | | | $ | 228,552 | | | | — | | | $ | 470,030 | |
| | | | |
Financials | | | 115,103 | | | | 183,954 | | | | — | | | | 299,057 | |
| | | | |
Information Technology | | | 178,388 | | | | 83,642 | | | | — | | | | 262,030 | |
| | | | |
Consumer Discretionary | | | 181,615 | | | | 68,779 | | | | — | | | | 250,394 | |
| | | | |
Consumer Staples | | | 35,034 | | | | 126,893 | | | | — | | | | 161,927 | |
| | | | |
Health Care | | | 73,747 | | | | 42,670 | | | | — | | | | 116,417 | |
| | | | |
Materials | | | — | | | | 52,611 | | | | — | | | | 52,611 | |
| | | | |
Energy | | | 11,773 | | | | 36,249 | | | | — | | | | 48,022 | |
| | | | |
Communication Services | | | — | | | | 46,424 | | | | — | | | | 46,424 | |
| | | | |
Utilities | | | — | | | | 14,084 | | | | — | | | | 14,084 | |
| | | | |
Short-Term Investments | | | | | | | | | | | | | | | | |
| | | | |
Other Investment Companies | | | 17,003 | | | | — | | | | — | | | | 17,003 | |
| | | | | | | | | | | | | | | | |
| | | | |
Total Investment in Securities | | $ | 854,141 | | | $ | 883,858 | | | | — | | | $ | 1,737,999 | |
| | | | | | | | | | | | | | | | |
| 1 | An external pricing service is used to reflect any impact on security value due to market movements between the time the Fund valued such foreign securities and the earlier closing of foreign markets. |
For the fiscal year ended December 31, 2022, there were no transfers in or out of Level 3.
The country allocation in the Schedule of Portfolio Investments at December 31, 2022, was as follows:
| | |
Country | | % of Long-Term
Investments |
| |
Australia | | 4.7 |
| |
Bermuda | | 2.1 |
| |
Brazil | | 0.8 |
| |
Canada | | 2.1 |
| |
Cayman Islands | | 0.9 |
| |
Denmark | | 3.4 |
| |
Finland | | 2.3 |
| |
France | | 4.9 |
| |
Germany | | 0.6 |
| |
India | | 2.1 |
| |
Ireland | | 1.9 |
| |
Israel | | 4.5 |
| |
Italy | | 2.7 |
| | |
Country | | % of Long-Term
Investments |
| |
Japan | | 12.6 |
| |
Netherlands | | 0.9 |
| |
Norway | | 0.9 |
| |
Spain | | 3.1 |
| |
Sweden | | 3.7 |
| |
Switzerland | | 1.0 |
| |
Taiwan | | 1.6 |
| |
United Kingdom | | 8.2 |
| |
United States | | 34.2 |
| |
Uruguay | | 0.8 |
| | |
| |
| | 100.0 |
| | |
The accompanying notes are an integral part of these financial statements.
42
| | |
| | | Statement of Assets and Liabilities December 31, 2022 |
| | | | | | | | | | | | | | | | | | | | |
| | | AMG
TimesSquare
Small Cap
Growth Fund | | | AMG
TimesSquare
Mid Cap
Growth Fund | | | AMG
TimesSquare
International Small
Cap Fund | | | AMG
TimesSquare
Emerging
Markets Small
Cap Fund | | | AMG
TimesSquare
Global Small
Cap Fund | |
| | | | | |
Assets: | | | | | | | | | | | | | | | | | | | | |
| | | | | |
Investments at value1 (including securities on loan valued at $9,786,629, $26,774,296, $8,922,218, $0,and $77,084, respectively) | | | $232,461,000 | | | | $1,157,154,305 | | | | $425,913,243 | | | | $4,755,424 | | | | $1,737,999 | |
| | | | | |
Foreign currency2 | | | — | | | | — | | | | 15,526,680 | | | | 33,046 | | | | 8,107 | |
| | | | | |
Receivable for investments sold | | | 1,202,713 | | | | 3,001,944 | | | | 198,252 | | | | — | | | | — | |
| | | | | |
Dividend and interest receivables | | | 111,006 | | | | 418,033 | | | | 1,505,613 | | | | 7,318 | | | | 2,476 | |
| | | | | |
Securities lending income receivable | | | 1,663 | | | | 1,946 | | | | 872 | | | | — | | | | 5 | |
| | | | | |
Receivable for Fund shares sold | | | 99,266 | | | | 551,051 | | | | 134,090 | | | | — | | | | — | |
| | | | | |
Receivable from affiliate | | | 2,162 | | | | — | | | | — | | | | 14,139 | | | | 8,443 | |
| | | | | |
Prepaid expenses and other assets | | | 11,655 | | | | 12,267 | | | | 21,895 | | | | 495 | | | | 163 | |
| | | | | |
Total assets | | | 233,889,465 | | | | 1,161,139,546 | | | | 443,300,645 | | | | 4,810,422 | | | | 1,757,193 | |
| | | | | |
Liabilities: | | | | | | | | | | | | | | | | | | | | |
| | | | | |
Payable upon return of securities loaned | | | 3,360,521 | | | | 21,731,927 | | | | 2,755,348 | | | | — | | | | — | |
| | | | | |
Payable for investments purchased | | | 1,550,440 | | | | — | | | | 570,068 | | | | 9,949 | | | | — | |
| | | | | |
Payable for Fund shares repurchased | | | 37,288 | | | | 15,837,345 | | | | 646,389 | | | | — | | | | — | |
| | | | | |
Payable for foreign capital gains tax | | | — | | | | — | | | | — | | | | 8,323 | | | | — | |
| | | | | |
Due to custodian | | | — | | | | — | | | | 490,752 | | | | — | | | | — | |
| | | | | |
Accrued expenses: | | | | | | | | | | | | | | | | | | | | |
| | | | | |
Investment advisory and management fees | | | 167,199 | | | | 797,991 | | | | 288,463 | | | | 3,811 | | | | 1,020 | |
| | | | | |
Administrative fees | | | 31,747 | | | | 151,517 | | | | 57,692 | | | | 602 | | | | 219 | |
| | | | | |
Distribution fees | | | — | | | | — | | | | — | | | | 14 | | | | 11 | |
| | | | | |
Shareholder service fees | | | 9,907 | | | | 79,798 | | | | 25,363 | | | | 8 | | | | — | |
| | | | | |
Other | | | 83,795 | | | | 205,058 | | | | 286,163 | | | | 82,697 | | | | 52,994 | |
| | | | | |
Total liabilities | | | 5,240,897 | | | | 38,803,636 | | | | 5,120,238 | | | | 105,404 | | | | 54,244 | |
| | | | | | | | | | | | | | | | | | | | |
| | | | | |
Net Assets | | | $228,648,568 | | | | $1,122,335,910 | | | | $438,180,407 | | | | $4,705,018 | | | | $1,702,949 | |
| | | | | |
1 Investments at cost | | | $222,952,927 | | | | $905,743,152 | | | | $419,118,608 | | | | $4,915,657 | | | | $1,682,864 | |
| | | | | |
2 Foreign currency at cost | | | — | | | | — | | | | $15,541,856 | | | | $32,882 | | | | $8,080 | |
The accompanying notes are an integral part of these financial statements.
43
| | |
| | | Statement of Assets and Liabilities (continued) |
| | | | | | | | | | | | | | | | | | | | |
| | | AMG
TimesSquare
Small Cap
Growth Fund | | | AMG
TimesSquare
Mid Cap
Growth Fund | | | AMG
TimesSquare
International Small
Cap Fund | | | AMG
TimesSquare
Emerging
Markets Small
Cap Fund | | | AMG
TimesSquare
Global Small
Cap Fund | |
| | | | | |
Net Assets Represent: | | | | | | | | | | | | | | | | | | | | |
| | | | | |
Paid-in capital | | | $235,705,252 | | | | $903,665,650 | | | | $653,951,335 | | | | $6,102,832 | | | | $1,910,238 | |
| | | | | |
Total distributable earnings (loss) | | | (7,056,684 | ) | | | 218,670,260 | | | | (215,770,928 | ) | | | (1,397,814 | ) | | | (207,289 | ) |
| | | | | |
Net Assets | | | $228,648,568 | | | | $1,122,335,910 | | | | $438,180,407 | | | | $4,705,018 | | | | $1,702,949 | |
| | | | | |
Class N: | | | | | | | | | | | | | | | | | | | | |
| | | | | |
Net Assets | | | $38,225,439 | | | | $368,938,192 | | | | $10,977,138 | | | | $65,111 | | | | $52,785 | |
| | | | | |
Shares outstanding | | | 3,943,747 | | | | 28,642,663 | | | | 831,160 | | | | 7,854 | | | | 5,556 | |
| | | | | |
Net asset value, offering and redemption price per share | | | $9.69 | | | | $12.88 | | | | $13.21 | | | | $8.29 | | | | $9.50 | |
| | | | | |
Class I: | | | | | | | | | | | | | | | | | | | | |
| | | | | |
Net Assets | | | $9,185,111 | | | | $339,100,065 | | | | $260,896,167 | | | | $341,581 | | | | $31,151 | |
| | | | | |
Shares outstanding | | | 887,932 | | | | 24,688,795 | | | | 19,721,214 | | | | 40,887 | | | | 3,265 | |
| | | | | |
Net asset value, offering and redemption price per share | | | $10.34 | | | | $13.73 | | | | $13.23 | | | | $8.35 | | | | $9.54 | |
| | | | | |
Class Z: | | | | | | | | | | | | | | | | | | | | |
| | | | | |
Net Assets | | | $181,238,018 | | | | $414,297,653 | | | | $166,307,102 | | | | $4,298,326 | | | | $1,619,013 | |
| | | | | |
Shares outstanding | | | 17,422,429 | | | | 30,006,537 | | | | 12,570,013 | | | | 514,821 | | | | 169,661 | |
| | | | | |
Net asset value, offering and redemption price per share | | | $10.40 | | | | $13.81 | | | | $13.23 | | | | $8.35 | | | | $9.54 | |
The accompanying notes are an integral part of these financial statements.
44
| | |
| | | Statement of Operations For the fiscal year ended December 31, 2022 |
| | | | | | | | | | | | | | | | | | | | |
| | | AMG
TimesSquare
Small Cap
Growth Fund | | AMG
TimesSquare
Mid Cap
Growth Fund | | AMG
TimesSquare
International Small
Cap Fund | | AMG
TimesSquare
Emerging
Markets Small
Cap Fund | | AMG
TimesSquare
Global Small
Cap Fund |
| | | | | |
Investment Income: | | | | | | | | | | | | | | | | | | | | |
| | | | | |
Dividend income | | | $964,959 | | | | $10,090,554 | | | | $19,194,515 | 1 | | | $130,223 | | | | $31,568 | |
| | | | | |
Interest income | | | 3,632 | | | | 682 | | | | 3,416 | | | | — | | | | — | |
| | | | | |
Securities lending income | | | 106,081 | | | | 124,879 | | | | 66,984 | | | | 1,073 | | | | 156 | |
| | | | | |
Foreign withholding tax | | | — | | | | (45,099 | ) | | | (1,889,371 | ) | | | (16,626 | ) | | | (3,082 | ) |
| | | | | |
Total investment income | | | 1,074,672 | | | | 10,171,016 | | | | 17,375,544 | | | | 114,670 | | | | 28,642 | |
| | | | | |
Expenses: | | | | | | | | | | | | | | | | | | | | |
| | | | | |
Investment advisory and management fees | | | 2,251,473 | | | | 11,041,119 | | | | 5,041,919 | | | | 53,922 | | | | 14,325 | |
| | | | | |
Administrative fees | | | 427,495 | | | | 2,096,415 | | | | 1,008,384 | | | | 8,514 | | | | 3,070 | |
| | | | | |
Distribution fees - Class N | | | — | | | | — | | | | — | | | | 76 | | | | 136 | |
| | | | | |
Shareholder servicing fees - Class N | | | 133,586 | | | | 823,726 | | | | 35,851 | | | | 46 | | | | — | |
| | | | | |
Shareholder servicing fees - Class I | | | 7,695 | | | | 183,426 | | | | 369,807 | | | | 9 | | | | — | |
| | | | | |
Professional fees | | | 44,616 | | | | 102,111 | | | | 75,501 | | | | 72,414 | | | | 39,661 | |
| | | | | |
Custodian fees | | | 43,548 | | | | 133,751 | | | | 289,972 | | | | 73,900 | | | | 36,857 | |
| | | | | |
Registration fees | | | 39,114 | | | | 72,480 | | | | 100,301 | | | | 2,005 | | | | 1,663 | |
| | | | | |
Trustee fees and expenses | | | 19,090 | | | | 96,794 | | | | 44,909 | | | | 391 | | | | 140 | |
| | | | | |
Reports to shareholders | | | 12,183 | | | | 85,447 | | | | 94,068 | | | | 1,873 | | | | 1,949 | |
| | | | | |
Transfer agent fees | | | 9,104 | | | | 48,305 | | | | 37,614 | | | | 758 | | | | 455 | |
| | | | | |
Interest expense | | | 503 | | | | 7,074 | | | | 14,634 | | | | 885 | | | | 37 | |
| | | | | |
Miscellaneous | | | 13,934 | | | | 51,064 | | | | 31,626 | | | | 2,727 | | | | 2,570 | |
| | | | | |
Total expenses before offsets | | | 3,002,341 | | | | 14,741,712 | | | | 7,144,586 | | | | 217,520 | | | | 100,863 | |
| | | | | |
Expense reimbursements | | | (39,090 | ) | | | — | | | | — | | | | (144,775 | ) | | | (80,223 | ) |
| | | | | |
Expense reductions | | | (56,647 | ) | | | (128,649 | ) | | | — | | | | — | | | | — | |
| | | | | |
Net expenses | | | 2,906,604 | | | | 14,613,063 | | | | 7,144,586 | | | | 72,745 | | | | 20,640 | |
| | | | | | | | | | | | | | | | | | | | |
| | | | | |
Net investment income (loss) | | | (1,831,932 | ) | | | (4,442,047 | ) | | | 10,230,958 | | | | 41,925 | | | | 8,002 | |
| | | | | |
Net Realized and Unrealized Loss: | | | | | | | | | | | | | | | | | | | | |
| | | | | |
Net realized loss on investments | | | (14,588,698 | ) | | | (14,032,359 | ) | | | (155,670,177 | ) | | | (1,033,661 | ) | | | (225,803 | ) |
| | | | | |
Net realized loss on foreign currency transactions | | | — | | | | — | | | | (268,372 | ) | | | (16,012 | ) | | | (3,320 | ) |
| | | | | |
Net change in unrealized appreciation/depreciation on investments | | | (86,795,211 | ) | | | (375,856,383 | ) | | | (147,537,679 | ) | | | (419,120 | ) | | | (452,216 | ) |
| | | | | |
Net change in unrealized appreciation/depreciation on foreign currency translations | | | — | | | | — | | | | (185,178 | ) | | | 12,303 | | | | 139 | |
| | | | | |
Net realized and unrealized loss | | | (101,383,909 | ) | | | (389,888,742 | ) | | | (303,661,406 | ) | | | (1,456,490 | ) | | | (681,200 | ) |
| | | | | | | | | | | | | | | | | | | | |
| | | | | |
Net decrease in net assets resulting from operations | | | $(103,215,841 | ) | | | $(394,330,789 | ) | | | $(293,430,448 | ) | | | $(1,414,565 | ) | | | $(673,198 | ) |
1 Includes non-recurring dividends of $1,994,401.
The accompanying notes are an integral part of these financial statements.
45
| | |
| | | Statements of Changes in Net Assets For the fiscal years ended December 31, |
| | | | | | | | | | | | | | | | | | | | | | | | |
| | | AMG
TimesSquare
Small Cap
Growth Fund | | | AMG
TimesSquare
Mid Cap
Growth Fund | | | AMG
TimesSquare
International Small
Cap Fund | |
| | | | | | |
| | | 2022 | | | 2021 | | | 2022 | | | 2021 | | | 2022 | | | 2021 | |
| | | | | | |
Increase (Decrease) in Net Assets Resulting From Operations: | | | | | | | | | | | | | | | | | | | | | | | | |
| | | | | | |
Net investment income (loss) | | | $(1,831,932 | ) | | | $(3,671,518 | ) | | | $(4,442,047 | ) | | | $(6,297,739 | ) | | | $10,230,958 | | | | $7,055,207 | |
| | | | | | |
Net realized gain (loss) on investments | | | (14,588,698 | ) | | | 79,059,615 | | | | (14,032,359 | ) | | | 497,360,722 | | | | (155,938,549 | ) | | | 137,617,802 | |
| | | | | | |
Net change in unrealized appreciation/depreciation on investments | | | (86,795,211 | ) | | | (46,101,944 | ) | | | (375,856,383 | ) | | | (202,912,685 | ) | | | (147,722,857 | ) | | | (128,853,294 | ) |
| | | | | | |
Net increase (decrease) in net assets resulting from operations | | | (103,215,841 | ) | | | 29,286,153 | | | | (394,330,789 | ) | | | 288,150,298 | | | | (293,430,448 | ) | | | 15,819,715 | |
| | | | | | |
Distributions to Shareholders: | | | | | | | | | | | | | | | | | | | | | | | | |
| | | | | | |
Class N | | | (4,006,378 | ) | | | (16,889,951 | ) | | | (14,196,340 | ) | | | (129,769,564 | ) | | | (92,131 | ) | | | (202,193 | ) |
| | | | | | |
Class I | | | (580,982 | ) | | | (2,245,753 | ) | | | (12,340,247 | ) | | | (99,774,515 | ) | | | (2,705,146 | ) | | | (7,082,703 | ) |
| | | | | | |
Class Z | | | (11,346,058 | ) | | | (58,061,717 | ) | | | (15,739,439 | ) | | | (188,751,022 | ) | | | (1,955,638 | ) | | | (4,959,152 | ) |
| | | | | | |
Total distributions to shareholders | | | (15,933,418 | ) | | | (77,197,421 | ) | | | (42,276,026 | ) | | | (418,295,101 | ) | | | (4,752,915 | ) | | | (12,244,048 | ) |
| | | | | | |
Capital Share Transactions:1 | | | | | | | | | | | | | | | | | | | | | | | | |
| | | | | | |
Net increase (decrease) from capital share transactions | | | (64,127,267 | ) | | | 14,500,368 | | | | (218,353,331 | ) | | | (129,788,867 | ) | | | (295,725,740 | ) | | | (44,353,251 | ) |
| | | | | | | | | | | | | | | | | | | | | | | | |
| | | | | | |
Total decrease in net assets | | | (183,276,526 | ) | | | (33,410,900 | ) | | | (654,960,146 | ) | | | (259,933,670 | ) | | | (593,909,103 | ) | | | (40,777,584 | ) |
| | | | | | |
Net Assets: | | | | | | | | | | | | | | | | | | | | | | | | |
| | | | | | |
Beginning of year | | | 411,925,094 | | | | 445,335,994 | | | | 1,777,296,056 | | | | 2,037,229,726 | | | | 1,032,089,510 | | | | 1,072,867,094 | |
| | | | | | |
End of year | | | $228,648,568 | | | | $411,925,094 | | | | $1,122,335,910 | | | | $1,777,296,056 | | | | $438,180,407 | | | | $1,032,089,510 | |
1 See Note 1(g) of the Notes to Financial Statements.
The accompanying notes are an integral part of these financial statements.
46
| | |
| | | Statements of Changes in Net Assets (continued) For the fiscal years ended December 31, |
| | | | | | | | | | | | | | | | |
| | | AMG
TimesSquare
Emerging
Markets Small Cap Fund | | | AMG
TimesSquare
Global Small
Cap Fund | |
| | | | |
| | | 2022 | | | 2021 | | | 2022 | | | 2021 | |
| | | | |
Increase (Decrease) in Net Assets Resulting From Operations: | | | | | | | | | | | | | | | | |
| | | | |
Net investment income | | | $41,925 | | | | $17,190 | | | | $8,002 | | | | $6,177 | |
| | | | |
Net realized gain (loss) on investments | | | (1,049,673 | ) | | | 1,917,681 | | | | (229,123 | ) | | | 305,915 | |
| | | | |
Net change in unrealized appreciation/depreciation on investments | | | (406,817 | ) | | | (1,251,657 | ) | | | (452,077 | ) | | | (55,587 | ) |
| | | | |
Net increase (decrease) in net assets resulting from operations | | | (1,414,565 | ) | | | 683,214 | | | | (673,198 | ) | | | 256,505 | |
| | | | |
Distributions to Shareholders: | | | | | | | | | | | | | | | | |
| | | | |
Class N | | | (1,423 | ) | | | (14,953 | ) | | | — | | | | (4,448 | ) |
| | | | |
Class I | | | (7,395 | ) | | | (127,065 | ) | | | (65 | ) | | | (2,692 | ) |
| | | | |
Class Z | | | (93,111 | ) | | | (2,197,218 | ) | | | (3,369 | ) | | | (169,825 | ) |
| | | | |
Total distributions to shareholders | | | (101,929 | ) | | | (2,339,236 | ) | | | (3,434 | ) | | | (176,965 | ) |
| | | | |
Capital Share Transactions:1 | | | | | | | | | | | | | | | | |
| | | | |
Net increase (decrease) from capital share transactions | | | (1,734,530 | ) | | | 2,407,027 | | | | (308,863 | ) | | | 323,693 | |
| | | | | | | | | | | | | | | | |
| | | | |
Total increase (decrease) in net assets | | | (3,251,024 | ) | | | 751,005 | | | | (985,495 | ) | | | 403,233 | |
| | | | |
Net Assets: | | | | | | | | | | | | | | | | |
| | | | |
Beginning of year | | | 7,956,042 | | | | 7,205,037 | | | | 2,688,444 | | | | 2,285,211 | |
| | | | |
End of year | | | $4,705,018 | | | | $7,956,042 | | | | $1,702,949 | | | | $2,688,444 | |
1 See Note 1(g) of the Notes to Financial Statements.
The accompanying notes are an integral part of these financial statements.
47
| | |
| | | AMG TimesSquare Small Cap Growth Fund Financial Highlights For a share outstanding throughout each fiscal year |
| | | | | | | | | | | | | | | | | | | | |
| | | For the fiscal years ended December 31, |
| | | | | |
| Class N | | 2022 | | 2021 | | 2020 | | 2019 | | 2018 |
| | | | | |
Net Asset Value, Beginning of Year | | | $14.09 | | | | $16.45 | | | | $13.96 | | | | $12.21 | | | | $16.90 | |
| | | | | |
Income (loss) from Investment Operations: | | | | | | | | | | | | | | | | | | | | |
| | | | | |
Net investment loss1,2 | | | (0.09 | ) | | | (0.17 | ) | | | (0.11 | )3 | | | (0.09 | ) | | | (0.10 | ) |
| | | | | |
Net realized and unrealized gain (loss) on investments | | | (3.62 | ) | | | 1.18 | | | | 4.92 | | | | 3.47 | | | | (0.70 | ) |
| | | | | | | | | | | | | | | | | | | | |
| | | | | |
Total income (loss) from investment operations | | | (3.71 | ) | | | 1.01 | | | | 4.81 | | | | 3.38 | | | | (0.80 | ) |
| | | | | |
Less Distributions to Shareholders from: | | | | | | | | | | | | | | | | | | | | |
| | | | | |
Net realized gain on investments | | | (0.69 | ) | | | (3.37 | ) | | | (2.32 | ) | | | (1.63 | ) | | | (3.89 | ) |
| | | | | |
Net Asset Value, End of Year | | | $9.69 | | | | $14.09 | | | | $16.45 | | | | $13.96 | | | | $12.21 | |
| | | | | | | | | | | | | | | | | | | | |
| | | | | |
Total Return2,4 | | | (26.41 | )% | | | 6.72 | % | | | 34.96 | % | | | 27.98 | % | | | (4.38 | )% |
| | | | | |
Ratio of net expenses to average net assets5 | | | 1.17 | % | | | 1.17 | %6 | | | 1.16 | % | | | 1.17 | % | | | 1.09 | % |
| | | | | |
Ratio of gross expenses to average net assets7 | | | 1.20 | % | | | 1.19 | %6 | | | 1.20 | % | | | 1.19 | % | | | 1.10 | % |
| | | | | |
Ratio of net investment loss to average net assets2 | | | (0.79 | )% | | | (0.97 | )% | | | (0.79 | )% | | | (0.63 | )% | | | (0.55 | )% |
| | | | | |
Portfolio turnover | | | 50 | % | | | 65 | % | | | 71 | % | | | 62 | % | | | 63 | % |
| | | | | |
Net assets end of year (000’s) omitted | | | $38,225 | | | | $86,941 | | | | $112,740 | | | | $105,862 | | | | $99,996 | |
| | | | | | | | | | | | | | | | | | | | | |
| | | | | | | | | | | | | | | | | | | | | |
48
| | |
| | | AMG TimesSquare Small Cap Growth Fund Financial Highlights For a share outstanding throughout each fiscal year |
| | | | | | | | | | | | | | | | | | | | |
| | | For the fiscal years ended December 31, |
| | | | | |
| Class I | | 2022 | | 2021 | | 2020 | | 2019 | | 2018 |
| | | | | |
Net Asset Value, Beginning of Year | | | $14.96 | | | | $17.25 | | | | $14.53 | | | | $12.64 | | | | $17.32 | |
| | | | | |
Income (loss) from Investment Operations: | | | | | | | | | | | | | | | | | | | | |
| | | | | |
Net investment loss1,2 | | | (0.08 | ) | | | (0.15 | ) | | | (0.10 | )3 | | | (0.07 | ) | | | (0.09 | ) |
| | | | | |
Net realized and unrealized gain (loss) on investments | | | (3.85 | ) | | | 1.23 | | | | 5.14 | | | | 3.59 | | | | (0.70 | ) |
| | | | | | | | | | | | | | | | | | | | |
| | | | | |
Total income (loss) from investment operations | | | (3.93 | ) | | | 1.08 | | | | 5.04 | | | | 3.52 | | | | (0.79 | ) |
| | | | | |
Less Distributions to Shareholders from: | | | | | | | | | | | | | | | | | | | | |
| | | | | |
Net realized gain on investments | | | (0.69 | ) | | | (3.37 | ) | | | (2.32 | ) | | | (1.63 | ) | | | (3.89 | ) |
| | | | | |
Net Asset Value, End of Year | | | $10.34 | | | | $14.96 | | | | $17.25 | | | | $14.53 | | | | $12.64 | |
| | | | | | | | | | | | | | | | | | | | |
| | | | | |
Total Return2,4 | | | (26.34 | )% | | | 6.81 | % | | | 35.19 | % | | | 28.13 | % | | | (4.21 | )% |
| | | | | |
Ratio of net expenses to average net assets5 | | | 1.05 | % | | | 1.05 | %6 | | | 1.03 | % | | | 1.01 | % | | | 1.00 | % |
| | | | | |
Ratio of gross expenses to average net assets7 | | | 1.08 | % | | | 1.07 | %6 | | | 1.07 | % | | | 1.03 | % | | | 1.01 | % |
| | | | | |
Ratio of net investment loss to average net assets2 | | | (0.67 | )% | | | (0.85 | )% | | | (0.66 | )% | | | (0.47 | )% | | | (0.46 | )% |
| | | | | |
Portfolio turnover | | | 50 | % | | | 65 | % | | | 71 | % | | | 62 | % | | | 63 | % |
| | | | | |
Net assets end of year (000’s) omitted | | | $9,185 | | | | $12,380 | | | | $12,062 | | | | $11,333 | | | | $174,914 | |
| | | | | | | | | | | | | | | | | | | | | |
| | | | | | | | | | | | | | | | | | | | | |
49
| | |
| | | AMG TimesSquare Small Cap Growth Fund Financial Highlights For a share outstanding throughout each fiscal year |
| | | | | | | | | | | | | | | | | | | | |
| | | For the fiscal years ended December 31, |
| | | | | |
| Class Z | | 2022 | | 2021 | | 2020 | | 2019 | | 2018 |
| | | | | |
Net Asset Value, Beginning of Year | | | $15.03 | | | | $17.30 | | | | $14.55 | | | | $12.65 | | | | $17.33 | |
| | | | | |
Income (loss) from Investment Operations: | | | | | | | | | | | | | | | | | | | | |
| | | | | |
Net investment loss1,2 | | | (0.07 | ) | | | (0.14 | ) | | | (0.09 | )3 | | | (0.07 | ) | | | (0.08 | ) |
| | | | | |
Net realized and unrealized gain (loss) on investments | | | (3.87 | ) | | | 1.24 | | | | 5.16 | | | | 3.60 | | | | (0.71 | ) |
| | | | | | | | | | | | | | | | | | | | |
| | | | | |
Total income (loss) from investment operations | | | (3.94 | ) | | | 1.10 | | | | 5.07 | | | | 3.53 | | | | (0.79 | ) |
| | | | | |
Less Distributions to Shareholders from: | | | | | | | | | | | | | | | | | | | | |
| | | | | |
Net realized gain on investments | | | (0.69 | ) | | | (3.37 | ) | | | (2.32 | ) | | | (1.63 | ) | | | (3.89 | ) |
| | | | | |
Net Asset Value, End of Year | | | $10.40 | | | | $15.03 | | | | $17.30 | | | | $14.55 | | | | $12.65 | |
| | | | | | | | | | | | | | | | | | | | |
| | | | | |
Total Return2,4 | | | (26.29 | )% | | | 6.91 | % | | | 35.35 | % | | | 28.19 | % | | | (4.21 | )% |
| | | | | |
Ratio of net expenses to average net assets5 | | | 0.97 | % | | | 0.97 | %6 | | | 0.96 | % | | | 0.97 | % | | | 0.96 | % |
| | | | | |
Ratio of gross expenses to average net assets7 | | | 1.00 | % | | | 0.99 | %6 | | | 1.00 | % | | | 0.99 | % | | | 0.97 | % |
| | | | | |
Ratio of net investment loss to average net assets2 | | | (0.59 | )% | | | (0.77 | )% | | | (0.59 | )% | | | (0.43 | )% | | | (0.42 | )% |
| | | | | |
Portfolio turnover | | | 50 | % | | | 65 | % | | | 71 | % | | | 62 | % | | | 63 | % |
| | | | | |
Net assets end of year (000’s) omitted | | | $181,238 | | | | $312,604 | | | | $320,535 | | | | $367,787 | | | | $601,789 | |
| | | | | | | | | | | | | | | | | | | | | |
| | | | | | | | | | | | | | | | | | | | | |
| 1 | Per share numbers have been calculated using average shares. |
| 2 | Total returns and net investment loss would have been lower had certain expenses not been offset. |
| 3 | Includes non-recurring dividends. Without these dividends, net investment loss per share would have been $(0.12), $(0.10), and $(0.09) for Class N, Class I and Class Z, respectively. |
| 4 | The total return is calculated using the published Net Asset Value as of fiscal year end. |
| 5 | Includes reduction from broker recapture amounting to 0.02% for the fiscal years ended December 31, 2022 and 2021, 0.03% for the fiscal year ended December 31, 2020, 0.02% for the fiscal year ended 2019 and 0.01% for the fiscal year ended 2018. |
| 6 | Such ratio includes recapture of waived/reimbursed fees from prior periods amounting to 0.01%. |
| 7 | Excludes the impact of expense reimbursement or fee waivers and expense reductions such as brokerage credits, but includes expense repayments and non-reimbursable expenses, if any, such as interest, taxes, and extraordinary expenses. (See Note 1(c) and 2 in the Notes to Financial Statements.) |
50
| | |
| | | AMG TimesSquare Mid Cap Growth Fund Financial Highlights For a share outstanding throughout each fiscal year |
| | | | | | | | | | | | | | | | | | | | |
| | | For the fiscal years ended December 31, |
| | | | | |
| Class N | | 2022 | | 2021 | | 2020 | | 2019 | | 2018 |
| | | | | |
Net Asset Value, Beginning of Year | | | $17.24 | | | | $19.66 | | | | $17.69 | | | | $15.00 | | | | $18.40 | |
| | | | | |
Income (loss) from Investment Operations: | | | | | | | | | | | | | | | | | | | | |
| | | | | |
Net investment loss1,2 | | | (0.06 | ) | | | (0.10 | )3 | | | (0.09 | )4 | | | (0.07 | ) | | | (0.08 | ) |
| | | | | |
Net realized and unrealized gain (loss) on investments | | | (3.79 | ) | | | 3.11 | | | | 5.84 | | | | 5.62 | | | | (0.78 | ) |
| | | | | | | | | | | | | | | | | | | | |
| | | | | |
Total income (loss) from investment operations | | | (3.85 | ) | | | 3.01 | | | | 5.75 | | | | 5.55 | | | | (0.86 | ) |
| | | | | |
Less Distributions to Shareholders from: | | | | | | | | | | | | | | | | | | | | |
| | | | | |
Net realized gain on investments | | | (0.51 | ) | | | (5.43 | ) | | | (3.78 | ) | | | (2.86 | ) | | | (2.54 | ) |
| | | | | |
Net Asset Value, End of Year | | | $12.88 | | | | $17.24 | | | | $19.66 | | | | $17.69 | | | | $15.00 | |
| | | | | | | | | | | | | | | | | | | | |
| | | | | |
Total Return2,5 | | | (22.39 | )% | | | 15.92 | % | | | 33.03 | % | | | 37.15 | % | | | (4.55 | )% |
| | | | | |
Ratio of net expenses to average net assets6 | | | 1.17 | % | | | 1.17 | % | | | 1.17 | % | | | 1.17 | % | | | 1.17 | % |
| | | | | |
Ratio of gross expenses to average net assets7 | | | 1.18 | % | | | 1.18 | % | | | 1.18 | % | | | 1.18 | % | | | 1.18 | % |
| | | | | |
Ratio of net investment loss to average net assets2 | | | (0.45 | )% | | | (0.46 | )% | | | (0.48 | )% | | | (0.38 | )% | | | (0.39 | )% |
| | | | | |
Portfolio turnover | | | 44 | % | | | 53 | % | | | 74 | % | | | 65 | % | | | 59 | % |
| | | | | |
Net assets end of year (000’s) omitted | | | $368,938 | | | | $535,289 | | | | $613,501 | | | | $518,267 | | | | $375,505 | |
| | | | | | | | | | | | | | | | | | | | | |
| | | | | | | | | | | | | | | | | | | | | |
51
| | |
| | | AMG TimesSquare Mid Cap Growth Fund Financial Highlights For a share outstanding throughout each fiscal year |
| | | | | | | | | | | | | | | | | | | | |
| | | For the fiscal years ended December 31, |
| | | | | |
| Class I | | 2022 | | 2021 | | 2020 | | 2019 | | 2018 |
| | | | | |
Net Asset Value, Beginning of Year | | | $18.31 | | | | $20.58 | | | | $18.35 | | | | $15.46 | | | | $18.86 | |
| | | | | |
Income (loss) from Investment Operations: | | | | | | | | | | | | | | | | | | | | |
| | | | | |
Net investment loss1,2 | | | (0.04 | ) | | | (0.07 | )3 | | | (0.07 | )4 | | | (0.05 | ) | | | (0.05 | ) |
| | | | | |
Net realized and unrealized gain (loss) on investments | | | (4.03 | ) | | | 3.25 | | | | 6.08 | | | | 5.80 | | | | (0.81 | ) |
| | | | | | | | | | | | | | | | | | | | |
| | | | | |
Total income (loss) from investment operations | | | (4.07 | ) | | | 3.18 | | | | 6.01 | | | | 5.75 | | | | (0.86 | ) |
| | | | | |
Less Distributions to Shareholders from: | | | | | | | | | | | | | | | | | | | | |
| | | | | |
Net investment income | | | — | | | | (0.02 | ) | | | — | | | | — | | | | — | |
| | | | | |
Net realized gain on investments | | | (0.51 | ) | | | (5.43 | ) | | | (3.78 | ) | | | (2.86 | ) | | | (2.54 | ) |
| | | | | | | | | | | | | | | | | | | | |
| | | | | |
Total distributions to shareholders | | | (0.51 | ) | | | (5.45 | ) | | | (3.78 | ) | | | (2.86 | ) | | | (2.54 | ) |
| | | | | |
Net Asset Value, End of Year | | | $13.73 | | | | $18.31 | | | | $20.58 | | | | $18.35 | | | | $15.46 | |
| | | | | | | | | | | | | | | | | | | | |
| | | | | |
Total Return2,5 | | | (22.23 | )% | | | 16.04 | % | | | 33.27 | % | | | 37.33 | % | | | (4.45 | )% |
| | | | | |
Ratio of net expenses to average net assets6 | | | 1.02 | % | | | 1.02 | % | | | 1.04 | % | | | 1.07 | % | | | 1.02 | % |
| | | | | |
Ratio of gross expenses to average net assets7 | | | 1.03 | % | | | 1.03 | % | | | 1.05 | % | | | 1.08 | % | | | 1.03 | % |
| | | | | |
Ratio of net investment loss to average net assets2 | | | (0.30 | )% | | | (0.31 | )% | | | (0.35 | )% | | | (0.28 | )% | | | (0.24 | )% |
| | | | | |
Portfolio turnover | | | 44 | % | | | 53 | % | | | 74 | % | | | 65 | % | | | 59 | % |
| | | | | |
Net assets end of year (000’s) omitted | | | $339,100 | | | | $431,797 | | | | $526,800 | | | | $472,524 | | | | $353,282 | |
| | | | | | | | | | | | | | | | | | | | | |
| | | | | | | | | | | | | | | | | | | | | |
52
| | |
| | | AMG TimesSquare Mid Cap Growth Fund Financial Highlights For a share outstanding throughout each fiscal year |
| | | | | | | | | | | | | | | | | | | | |
| | | For the fiscal years ended December 31, |
| | | | | |
| Class Z | | 2022 | | 2021 | | 2020 | | 2019 | | 2018 |
| | | | | |
Net Asset Value, Beginning of Year | | | $18.39 | | | | $20.65 | | | | $18.39 | | | | $15.48 | | | | $18.87 | |
| | | | | |
Income (loss) from Investment Operations: | | | | | | | | | | | | | | | | | | | | |
| | | | | |
Net investment loss1,2 | | | (0.04 | ) | | | (0.06 | )3 | | | (0.05 | )4 | | | (0.03 | ) | | | (0.04 | ) |
| | | | | |
Net realized and unrealized gain (loss) on investments | | | (4.03 | ) | | | 3.27 | | | | 6.09 | | | | 5.80 | | | | (0.81 | ) |
| | | | | | | | | | | | | | | | | | | | |
| | | | | |
Total income (loss) from investment operations | | | (4.07 | ) | | | 3.21 | | | | 6.04 | | | | 5.77 | | | | (0.85 | ) |
| | | | | |
Less Distributions to Shareholders from: | | | | | | | | | | | | | | | | | | | | |
| | | | | |
Net investment income | | | — | | | | (0.04 | ) | | | — | | | | — | | | | — | |
| | | | | |
Net realized gain on investments | | | (0.51 | ) | | | (5.43 | ) | | | (3.78 | ) | | | (2.86 | ) | | | (2.54 | ) |
| | | | | | | | | | | | | | | | | | | | |
| | | | | |
Total distributions to shareholders | | | (0.51 | ) | | | (5.47 | ) | | | (3.78 | ) | | | (2.86 | ) | | | (2.54 | ) |
| | | | | |
Net Asset Value, End of Year | | | $13.81 | | | | $18.39 | | | | $20.65 | | | | $18.39 | | | | $15.48 | |
| | | | | | | | | | | | | | | | | | | | |
| | | | | |
Total Return2,5 | | | (22.18 | )% | | | 16.10 | % | | | 33.36 | % | | | 37.41 | % | | | (4.39 | )% |
| | | | | |
Ratio of net expenses to average net assets6 | | | 0.97 | % | | | 0.97 | % | | | 0.97 | % | | | 0.97 | % | | | 0.97 | % |
| | | | | |
Ratio of gross expenses to average net assets7 | | | 0.98 | % | | | 0.98 | % | | | 0.98 | % | | | 0.98 | % | | | 0.98 | % |
| | | | | |
Ratio of net investment loss to average net assets2 | | | (0.25 | )% | | | (0.26 | )% | | | (0.28 | )% | | | (0.18 | )% | | | (0.19 | )% |
| | | | | |
Portfolio turnover | | | 44 | % | | | 53 | % | | | 74 | % | | | 65 | % | | | 59 | % |
| | | | | |
Net assets end of year (000’s) omitted | | | $414,298 | | | | $810,210 | | | | $896,929 | | | | $894,390 | | | | $948,380 | |
| | | | | | | | | | | | | | | | | | | | | |
| | | | | | | | | | | | | | | | | | | | | |
| 1 | Per share numbers have been calculated using average shares. |
| 2 | Total returns and net investment loss would have been lower had certain expenses not been offset. |
| 3 | Includes non-recurring dividends. Without these dividends, net investment loss per share would have been $(0.16), $(0.13) and $(0.12) for Class N, Class I and Class Z, respectively. |
| 4 | Includes non-recurring dividends. Without these dividends, net investment loss per share would have been $(0.11), $(0.08) and $(0.07) for Class N, Class I and Class Z, respectively. |
| 5 | The total return is calculated using the published Net Asset Value as of fiscal year end. |
| 6 | Includes reduction from broker recapture amounting to 0.01% for each fiscal year ended 2022, 2021, 2020, 2019 and 2018. |
| 7 | Excludes the impact of expense reimbursement or fee waivers and expense reductions such as brokerage credits, but includes expense repayments and non-reimbursable expenses, if any, such as interest, taxes, and extraordinary expenses. (See Note 1(c) and 2 in the Notes to Financial Statements.) |
53
| | |
| | | AMG TimesSquare International Small Cap Fund Financial Highlights For a share outstanding throughout each fiscal year |
| | | | | | | | | | | | | | | | | | | | |
| | | For the fiscal years ended December 31, |
| | | | | |
| Class N | | 2022 | | 2021 | | 2020 | | 2019 | | 2018 |
| | | | | | | | | | | | | | | | | | | | |
| | | | | |
Net Asset Value, Beginning of Year | | | $18.49 | | | | $18.44 | | | | $16.24 | | | | $12.72 | | | | $16.99 | |
| | | | | |
Income (loss) from Investment Operations: | | | | | | | | | | | | | | | | | | | | |
| | | | | |
Net investment income1,2 | | | 0.19 | 3 | | | 0.09 | | | | 0.02 | | | | 0.21 | 4 | | | 0.18 | |
| | | | | |
Net realized and unrealized gain (loss) on investments | | | (5.36 | ) | | | 0.14 | | | | 2.18 | | | | 3.55 | | | | (4.35 | ) |
| | | | | | | | | | | | | | | | | | | | |
| | | | | |
Total income (loss) from investment operations | | | (5.17 | ) | | | 0.23 | | | | 2.20 | | | | 3.76 | | | | (4.17 | ) |
| | | | | |
Less Distributions to Shareholders from: | | | | | | | | | | | | | | | | | | | | |
| | | | | | | | | | | | | | | | | | | | |
| | | | | |
Net investment income | | | (0.11 | ) | | | (0.18 | ) | | | — | | | | (0.24 | ) | | | (0.10 | ) |
| | | | | |
Net Asset Value, End of Year | | | $13.21 | | | | $18.49 | | | | $18.44 | | | | $16.24 | | | | $12.72 | |
| | | | | | | | | | | | | | | | | | | | |
| | | | | |
Total Return2,5 | | | (27.97 | )% | | | 1.25 | % | | | 13.55 | % | | | 29.56 | % | | | (24.54 | )% |
| | | | | |
Ratio of net expenses to average net assets | | | 1.25 | % | | | 1.22 | % | | | 1.23 | % | | | 1.23 | % | | | 1.23 | % |
| | | | | |
Ratio of gross expenses to average net assets6 | | | 1.25 | % | | | 1.22 | % | | | 1.23 | % | | | 1.23 | % | | | 1.23 | % |
| | | | | |
Ratio of net investment income to average net assets2 | | | 1.33 | % | | | 0.47 | % | | | 0.17 | % | | | 1.43 | % | | | 1.07 | % |
| | | | | |
Portfolio turnover | | | 71 | % | | | 73 | % | | | 57 | % | | | 40 | % | | | 46 | % |
| | | | | |
Net assets end of year (000’s) omitted | | | $10,977 | | | | $21,202 | | | | $45,389 | | | | $70,532 | | | | $88,913 | |
| | | | | | | | | | | | | | | | | | | | | |
| | | | | | | | | | | | | | | | | | | | | |
54
| | |
| | | AMG TimesSquare International Small Cap Fund Financial Highlights For a share outstanding throughout each fiscal year |
| | | | | | | | | | | | | | | | | | | | |
| | | For the fiscal years ended December 31, |
| | | | | |
| Class I | | 2022 | | 2021 | | 2020 | | 2019 | | 2018 |
| | | | | | | | | | | | | | | | | | | | |
| | | | | |
Net Asset Value, Beginning of Year | | | $18.52 | | | | $18.49 | | | | $16.26 | | | | $12.74 | | | | $17.08 | |
| | | | | |
Income (loss) from Investment Operations: | | | | | | | | | | | | | | | | | | | | |
| | | | | |
Net investment income1,2 | | | 0.21 | 3 | | | 0.12 | | | | 0.05 | | | | 0.24 | 4 | | | 0.20 | |
| | | | | |
Net realized and unrealized gain (loss) on investments | | | (5.37 | ) | | | 0.13 | | | | 2.19 | | | | 3.55 | | | | (4.37 | ) |
| | | | | | | | | | | | | | | | | | | | |
| | | | | |
Total income (loss) from investment operations | | | (5.16 | ) | | | 0.25 | | | | 2.24 | | | | 3.79 | | | | (4.17 | ) |
| | | | | |
Less Distributions to Shareholders from: | | | | | | | | | | | | | | | | | | | | |
| | | | | | | | | | | | | | | | | | | | |
| | | | | |
Net investment income | | | (0.13 | ) | | | (0.22 | ) | | | (0.01 | ) | | | (0.27 | ) | | | (0.17 | ) |
| | | | | |
Net Asset Value, End of Year | | | $13.23 | | | | $18.52 | | | | $18.49 | | | | $16.26 | | | | $12.74 | |
| | | | | | | | | | | | | | | | | | | | |
| | | | | |
Total Return2,5 | | | (27.84 | )% | | | 1.36 | % | | | 13.75 | % | | | 29.78 | % | | | (24.42 | )% |
| | | | | |
Ratio of net expenses to average net assets | | | 1.10 | % | | | 1.07 | % | | | 1.08 | % | | | 1.06 | % | | | 1.06 | % |
| | | | | |
Ratio of gross expenses to average net assets6 | | | 1.10 | % | | | 1.07 | % | | | 1.08 | % | | | 1.06 | % | | | 1.06 | % |
| | | | | |
Ratio of net investment income to average net assets2 | | | 1.48 | % | | | 0.62 | % | | | 0.32 | % | | | 1.60 | % | | | 1.24 | % |
| | | | | |
Portfolio turnover | | | 71 | % | | | 73 | % | | | 57 | % | | | 40 | % | | | 46 | % |
| | | | | |
Net assets end of year (000’s) omitted | | | $260,896 | | | | $614,652 | | | | $629,502 | | | | $658,599 | | | | $538,749 | |
| | | | | | | | | | | | | | | | | | | | | |
| | | | | | | | | | | | | | | | | | | | | |
55
| | |
| | | AMG TimesSquare International Small Cap Fund Financial Highlights For a share outstanding throughout each fiscal year |
| | | | | | | | | | | | | | | | | | | | |
| | | For the fiscal years ended December 31, |
| | | | | |
| Class Z | | 2022 | | 2021 | | 2020 | | 2019 | | 2018 |
| | | | | | | | | | | | | | | | | | | | |
| | | | | |
Net Asset Value, Beginning of Year | | | $18.53 | | | | $18.50 | | | | $16.26 | | | | $12.75 | | | | $17.08 | |
| | | | | |
Income (loss) from Investment Operations: | | | | | | | | | | | | | | | | | | | | |
| | | | | |
Net investment income1,2 | | | 0.22 | 3 | | | 0.14 | | | | 0.06 | | | | 0.25 | 4 | | | 0.21 | |
| | | | | |
Net realized and unrealized gain (loss) on investments | | | (5.37 | ) | | | 0.12 | | | | 2.20 | | | | 3.55 | | | | (4.36 | ) |
| | | | | | | | | | | | | | | | | | | | |
| | | | | |
Total income (loss) from investment operations | | | (5.15 | ) | | | 0.26 | | | | 2.26 | | | | 3.80 | | | | (4.15 | ) |
| | | | | |
Less Distributions to Shareholders from: | | | | | | | | | | | | | | | | | | | | |
| | | | | | | | | | | | | | | | | | | | |
| | | | | |
Net investment income | | | (0.15 | ) | | | (0.23 | ) | | | (0.02 | ) | | | (0.29 | ) | | | (0.18 | ) |
| | | | | |
Net Asset Value, End of Year | | | $13.23 | | | | $18.53 | | | | $18.50 | | | | $16.26 | | | | $12.75 | |
| | | | | | | | | | | | | | | | | | | | |
| | | | | |
Total Return2,5 | | | (27.78 | )% | | | 1.47 | % | | | 13.90 | % | | | 29.77 | % | | | (24.29 | )% |
| | | | | |
Ratio of net expenses to average net assets | | | 1.00 | % | | | 0.97 | % | | | 0.98 | % | | | 0.98 | % | | | 0.98 | % |
| | | | | |
Ratio of gross expenses to average net assets6 | | | 1.00 | % | | | 0.97 | % | | | 0.98 | % | | | 0.98 | % | | | 0.98 | % |
| | | | | |
Ratio of net investment income to average net assets2 | | | 1.58 | % | | | 0.72 | % | | | 0.42 | % | | | 1.68 | % | | | 1.32 | % |
| | | | | |
Portfolio turnover | | | 71 | % | | | 73 | % | | | 57 | % | | | 40 | % | | | 46 | % |
| | | | | |
Net assets end of year (000’s) omitted | | | $166,307 | | | | $396,236 | | | | $397,976 | | | | $401,528 | | | | $372,085 | |
| | | | | | | | | | | | | | | | | | | | | |
| | | | | | | | | | | | | | | | | | | | | |
| 1 | Per share numbers have been calculated using average shares. |
| 2 | Total returns and net investment income would have been lower had certain expenses not been offset. |
| 3 | Includes non-recurring dividends. Without these dividends, net investment income per share would have been $0.15, $0.17 and $0.18 for Class N, Class I and Class Z, respectively. |
| 4 | Includes non-recurring dividends. Without these dividends, net investment income per share would have been $0.16, $0.18 and $0.20 for Class N, Class I and Class Z, respectively. |
| 5 | The total return is calculated using the published Net Asset Value as of fiscal year end. |
| 6 | Excludes the impact of expense reimbursement or fee waivers and expense reductions such as brokerage credits, but includes expense repayments and non-reimbursable expenses, if any, such as interest, taxes, and extraordinary expenses. (See Note 1(c) and 2 in the Notes to Financial Statements.) |
56
| | |
| | | AMG TimesSquare Emerging Markets Small Cap Fund Financial Highlights For a share outstanding throughout each fiscal year |
| | | | | | | | | | | | | | | | | | | | |
| | | For the fiscal years ended December 31, |
| | | | | |
| Class N | | 2022 | | 2021 | | 2020 | | 2019 | | 2018 |
| | | | | | | | | | | | | | | | | | | | |
| | | | | |
Net Asset Value, Beginning of Year | | | $10.52 | | | | $13.66 | | | | $11.03 | | | | $9.49 | | | | $12.32 | |
| | | | | |
Income (loss) from Investment Operations: | | | | | | | | | | | | | | | | | | | | |
| | | | | |
Net investment income (loss)1,2 | | | 0.03 | | | | (0.03 | ) | | | 0.13 | 3 | | | 0.03 | | | | 0.08 | |
| | | | | |
Net realized and unrealized gain (loss) on investments | | | (2.08 | ) | | | 1.22 | | | | 2.50 | | | | 1.53 | | | | (2.34 | ) |
| | | | | | | | | | | | | | | | | | | | |
| | | | | |
Total income (loss) from investment operations | | | (2.05 | ) | | | 1.19 | | | | 2.63 | | | | 1.56 | | | | (2.26 | ) |
| | | | | |
Less Distributions to Shareholders from: | | | | | | | | | | | | | | | | | | | | |
| | | | | |
Net investment income | | | — | | | | (0.07 | ) | | | (0.00 | )4 | | | (0.02 | ) | | | (0.01 | ) |
| | | | | |
Net realized gain on investments | | | (0.18 | ) | | | (4.26 | ) | | | — | | | | — | | | | (0.56 | ) |
| | | | | |
Paid in capital | | | — | | | | — | | | | — | | | | (0.00 | )4 | | | — | |
| | | | | | | | | | | | | | | | | | | | |
| | | | | |
Total distributions to shareholders | | | (0.18 | ) | | | (4.33 | ) | | | (0.00 | )4 | | | (0.02 | ) | | | (0.57 | ) |
| | | | | |
Net Asset Value, End of Year | | | $8.29 | | | | $10.52 | | | | $13.66 | | | | $11.03 | | | | $9.49 | |
| | | | | | | | | | | | | | | | | | | | |
| | | | | |
Total Return2,5 | | | (19.43 | )% | | | 9.10 | % | | | 23.86 | % | | | 16.49 | % | | | (18.30 | )% |
| | | | | |
Ratio of net expenses to average net assets | | | 1.68 | %6 | | | 1.68 | %7 | | | 1.65 | % | | | 1.67 | %8 | | | 1.67 | % |
| | | | | |
Ratio of gross expenses to average net assets9 | | | 4.23 | %6 | | | 3.03 | %7 | | | 3.66 | % | | | 4.29 | % | | | 3.87 | % |
| | | | | |
Ratio of net investment income (loss) to average net assets2 | | | 0.34 | % | | | (0.19 | )% | | | 1.22 | % | | | 0.31 | % | | | 0.68 | % |
| | | | | |
Portfolio turnover | | | 104 | % | | | 139 | % | | | 129 | % | | | 103 | % | | | 84 | % |
| | | | | |
Net assets end of year (000’s) omitted | | | $65 | | | | $49 | | | | $43 | | | | $39 | | | | $31 | |
| | | | | | | | | | | | | | | | | | | | | |
| | | | | | | | | | | | | | | | | | | | | |
57
| | |
| | | AMG TimesSquare Emerging Markets Small Cap Fund Financial Highlights For a share outstanding throughout each fiscal year |
| | | | | | | | | | | | | | | | | | | | |
| | | For the fiscal years ended December 31, |
| | | | | |
| Class I | | 2022 | | 2021 | | 2020 | | 2019 | | 2018 |
| | | | | | | | | | | | | | | | | | | | |
| | | | | |
Net Asset Value, Beginning of Year | | | $10.56 | | | | $13.70 | | | | $11.05 | | | | $9.51 | | | | $12.35 | |
| | | | | |
Income (loss) from Investment Operations: | | | | | | | | | | | | | | | | | | | | |
| | | | | |
Net investment income1,2 | | | 0.07 | | | | 0.03 | | | | 0.18 | 3 | | | 0.07 | | | | 0.11 | |
| | | | | |
Net realized and unrealized gain (loss) on investments | | | (2.10 | ) | | | 1.23 | | | | 2.51 | | | | 1.53 | | | | (2.33 | ) |
| | | | | | | | | | | | | | | | | | | | |
| | | | | |
Total income (loss) from investment operations | | | (2.03 | ) | | | 1.26 | | | | 2.69 | | | | 1.60 | | | | (2.22 | ) |
| | | | | |
Less Distributions to Shareholders from: | | | | | | | | | | | | | | | | | | | | |
| | | | | |
Net investment income | | | — | | | | (0.14 | ) | | | (0.04 | ) | | | (0.05 | ) | | | (0.06 | ) |
| | | | | |
Net realized gain on investments | | | (0.18 | ) | | | (4.26 | ) | | | — | | | | — | | | | (0.56 | ) |
| | | | | |
Paid in capital | | | — | | | | — | | | | — | | | | (0.01 | ) | | | — | |
| | | | | | | | | | | | | | | | | | | | |
| | | | | |
Total distributions to shareholders | | | (0.18 | ) | | | (4.40 | ) | | | (0.04 | ) | | | (0.06 | ) | | | (0.62 | ) |
| | | | | |
Net Asset Value, End of Year | | | $8.35 | | | | $10.56 | | | | $13.70 | | | | $11.05 | | | | $9.51 | |
| | | | | | | | | | | | | | | | | | | | |
| | | | | |
Total Return2,5 | | | (19.16 | )% | | | 9.50 | % | | | 24.49 | % | | | 16.83 | % | | | (17.90 | )% |
| | | | | |
Ratio of net expenses to average net assets | | | 1.28 | %6 | | | 1.28 | %7 | | | 1.25 | % | | | 1.27 | %8 | | | 1.27 | % |
| | | | | |
Ratio of gross expenses to average net assets9 | | | 3.83 | %6 | | | 2.63 | %7 | | | 3.26 | % | | | 3.89 | % | | | 3.47 | % |
| | | | | |
Ratio of net investment income to average net assets2 | | | 0.74 | % | | | 0.21 | % | | | 1.62 | % | | | 0.71 | % | | | 1.08 | % |
| | | | | |
Portfolio turnover | | | 104 | % | | | 139 | % | | | 129 | % | | | 103 | % | | | 84 | % |
| | | | | |
Net assets end of year (000’s) omitted | | | $342 | | | | $434 | | | | $396 | | | | $310 | | | | $273 | |
| | | | | | | | | | | | | | | | | | | | | |
| | | | | | | | | | | | | | | | | | | | | |
58
| | |
| | | AMG TimesSquare Emerging Markets Small Cap Fund Financial Highlights For a share outstanding throughout each fiscal year |
| | | | | | | | | | | | | | | | | | | | |
| | | For the fiscal years ended December 31, |
| | | | | |
| Class Z | | 2022 | | 2021 | | 2020 | | 2019 | | 2018 |
| | | | | | | | | | | | | | | | | | | | |
| | | | | |
Net Asset Value, Beginning of Year | | | $10.55 | | | | $13.70 | | | | $11.05 | | | | $9.51 | | | | $12.35 | |
| | | | | |
Income (loss) from Investment Operations: | | | | | | | | | | | | | | | | | | | | |
| | | | | |
Net investment income1,2 | | | 0.07 | | | | 0.03 | | | | 0.18 | 3 | | | 0.07 | | | | 0.12 | |
| | | | | |
Net realized and unrealized gain (loss) on investments | | | (2.09 | ) | | | 1.22 | | | | 2.51 | | | | 1.53 | | | | (2.34 | ) |
| | | | | | | | | | | | | | | | | | | | |
| | | | | |
Total income (loss) from investment operations | | | (2.02 | ) | | | 1.25 | | | | 2.69 | | | | 1.60 | | | | (2.22 | ) |
| | | | | |
Less Distributions to Shareholders from: | | | | | | | | | | | | | | | | | | | | |
| | | | | |
Net investment income | | | — | | | | (0.14 | ) | | | (0.04 | ) | | | (0.05 | ) | | | (0.06 | ) |
| | | | | |
Net realized gain on investments | | | (0.18 | ) | | | (4.26 | ) | | | — | | | | — | | | | (0.56 | ) |
| | | | | |
Paid in capital | | | — | | | | — | | | | — | | | | (0.01 | ) | | | — | |
| | | | | | | | | | | | | | | | | | | | |
| | | | | |
Total distributions to shareholders | | | (0.18 | ) | | | (4.40 | ) | | | (0.04 | ) | | | (0.06 | ) | | | (0.62 | ) |
| | | | | |
Net Asset Value, End of Year | | | $8.35 | | | | $10.55 | | | | $13.70 | | | | $11.05 | | | | $9.51 | |
| | | | | | | | | | | | | | | | | | | | |
| | | | | |
Total Return2,5 | | | (19.09 | )% | | | 9.51 | % | | | 24.40 | % | | | 16.83 | % | | | (17.90 | )% |
| | | | | |
Ratio of net expenses to average net assets | | | 1.28 | %6 | | | 1.28 | %7 | | | 1.25 | % | | | 1.27 | %8 | | | 1.27 | % |
| | | | | |
Ratio of gross expenses to average net assets9 | | | 3.83 | %6 | | | 2.63 | %7 | | | 3.26 | % | | | 3.89 | % | | | 3.47 | % |
| | | | | |
Ratio of net investment income to average net assets2 | | | 0.74 | % | | | 0.21 | % | | | 1.62 | % | | | 0.71 | % | | | 1.08 | % |
| | | | | |
Portfolio turnover | | | 104 | % | | | 139 | % | | | 129 | % | | | 103 | % | | | 84 | % |
| | | | | |
Net assets end of year (000’s) omitted | | | $4,298 | | | | $7,473 | | | | $6,766 | | | | $5,473 | | | | $5,513 | |
| | | | | | | | | | | | | | | | | | | | | |
| | | | | | | | | | | | | | | | | | | | | |
| 1 | Per share numbers have been calculated using average shares. |
| 2 | Total returns and net investment income (loss) would have been lower had certain expenses not been offset. |
| 3 | Includes non-recurring dividends. Without these dividends, net investment income per share would have been $0.11, $0.16 and $0.16 for Class N, Class I and Class Z, respectively. |
| 4 | Less than $(0.005) per share. |
| 5 | The total return is calculated using the published Net Asset Value as of fiscal year end. |
| 6 | Includes interest expense totaling 0.03% related to participation in the interfund lending program and bank overdrafts. |
| 7 | Includes expense totaling 0.03% relating to excise tax expense. |
| 8 | Includes interest expense totaling 0.02% relating to participation in the interfund lending and bank overdrafts. |
| 9 | Excludes the impact of expense reimbursement or fee waivers and expense reductions such as brokerage credits, but includes expense repayments and non-reimbursable expenses, if any, such as interest, taxes, and extraordinary expenses. (See Note 1(c) and 2 in the Notes to Financial Statements.) |
59
| | |
| | | AMG TimesSquare Global Small Cap Fund Financial Highlights For a share outstanding throughout each fiscal period |
| | | | | | | | | | | | | | | | | | | | |
| | | For the fiscal years ended December 31, | | For the fiscal
period ended
December 31, |
| | | | | |
Class N | | | 2022 | | | | 2021 | | | | 2020 | | | | 2019 | | | | 2018 | 1 |
| | | | | | | | | | | | | | | | | | | | |
| | | | | |
Net Asset Value, Beginning of Period | | | $12.50 | | | | $12.05 | | | | $10.84 | | | | $7.95 | | | | $10.00 | |
| | | | | |
Income (loss) from Investment Operations: | | | | | | | | | | | | | | | | | | | | |
| | | | | |
Net investment income (loss)2,3 | | | 0.01 | | | | 0.00 | 4,5 | | | (0.02 | ) | | | 0.04 | | | | 0.00 | 5 |
| | | | | |
Net realized and unrealized gain (loss) on investments | | | (3.01 | ) | | | 1.31 | | | | 1.23 | | | | 2.95 | | | | (2.05 | ) |
| | | | | | | | | | | | | | | | | | | | |
| | | | | |
Total income (loss) from investment operations | | | (3.00 | ) | | | 1.31 | | | | 1.21 | | | | 2.99 | | | | (2.05 | ) |
| | | | | |
Less Distributions to Shareholders from: | | | | | | | | | | | | | | | | | | | | |
| | | | | |
Net investment income | | | — | | | | — | | | | — | | | | (0.10 | ) | | | — | |
| | | | | |
Net realized gain on investments | | | — | | | | (0.86 | ) | | | — | | | | — | | | | — | |
| | | | | | | | | | | | | | | | | | | | |
| | | | | |
Total distributions to shareholders | | | — | | | | (0.86 | ) | | | — | | | | (0.10 | ) | | | — | |
| | | | | |
Net Asset Value, End of Period | | | $9.50 | | | | $12.50 | | | | $12.05 | | | | $10.84 | | | | $7.95 | |
| | | | | | | | | | | | | | | | | | | | |
| | | | | |
Total Return3,6 | | | (24.00 | )% | | | 11.08 | % | | | 11.16 | % | | | 37.60 | % | | | (20.50 | )%7 |
| | | | | |
Ratio of net expenses to average net assets | | | 1.25 | % | | | 1.25 | % | | | 1.25 | % | | | 1.27 | %8 | | | 1.25 | %9 |
| | | | | |
Ratio of gross expenses to average net assets10 | | | 5.17 | % | | | 4.28 | % | | | 6.48 | % | | | 7.45 | % | | | 11.67 | %9,11 |
| | | | | |
Ratio of net investment income (loss) to average net assets3 | | | 0.15 | % | | | 0.00 | %12 | | | (0.18 | )% | | | 0.42 | % | | | 0.07 | %9 |
| | | | | |
Portfolio turnover | | | 51 | % | | | 59 | % | | | 42 | % | | | 80 | % | | | 22 | %7 |
| | | | | |
Net assets end of period (000’s) omitted | | | $53 | | | | $69 | | | | $63 | | | | $44 | | | | $24 | |
| | | | | | | | | | | | | | | | | | | | | |
| | | | | | | | | | | | | | | | | | | | | |
60
| | |
| | | AMG TimesSquare Global Small Cap Fund Financial Highlights For a share outstanding throughout each fiscal period |
| | | | | | | | | | | | | | | | | | | | | | |
| | | For the fiscal years ended December 31, | | | | For the fiscal
period ended
December 31, |
| | | | | | |
Class I | | | 2022 | | | | 2021 | | | | 2020 | | | | 2019 | | | | | | 2018 | 1 |
| | | | | | | | | | | | | | | | | | | | | | |
| | | | | | |
Net Asset Value, Beginning of Period | | | $12.54 | | | | $12.09 | | | | $10.85 | | | | $7.96 | | | | | | $10.00 | |
| | | | | | |
Income (loss) from Investment Operations: | | | | | | | | | | | | | | | | | | | | | | |
| | | | | | |
Net investment income2,3 | | | 0.04 | | | | 0.03 | 4 | | | 0.01 | | | | 0.06 | | | | | | 0.02 | |
| | | | | | |
Net realized and unrealized gain (loss) on investments | | | (3.02 | ) | | | 1.31 | | | | 1.23 | | | | 2.96 | | | | | | (2.06 | ) |
| | | | | | | | | | | | | | | | | | | | | | |
| | | | | | |
Total income (loss) from investment operations | | | (2.98 | ) | | | 1.34 | | | | 1.24 | | | | 3.02 | | | | | | (2.04 | ) |
| | | | | | |
Less Distributions to Shareholders from: | | | | | | | | | | | | | | | | | | | | | | |
| | | | | | |
Net investment income | | | (0.02 | ) | | | (0.03 | ) | | | — | | | | (0.13 | ) | | | | | — | |
| | | | | | |
Net realized gain on investments | | | — | | | | (0.86 | ) | | | — | | | | — | | | | | | — | |
| | | | | | | | | | | | | | | | | | | | | | |
| | | | | | |
Total distributions to shareholders | | | (0.02 | ) | | | (0.89 | ) | | | — | | | | (0.13 | ) | | | | | — | |
| | | | | | |
Net Asset Value, End of Period | | | $9.54 | | | | $12.54 | | | | $12.09 | | | | $10.85 | | | | | | $7.96 | |
| | | | | | | | | | | | | | | | | | | | | | |
| | | | | | |
Total Return3,6 | | | (23.76 | )% | | | 11.29 | % | | | 11.43 | % | | | 37.96 | % | | | | | (20.40 | )%7 |
| | | | | | |
Ratio of net expenses to average net assets | | | 1.00 | % | | | 1.00 | % | | | 1.00 | % | | | 1.02 | %8 | | | | | 1.00 | %9 |
| | | | | | |
Ratio of gross expenses to average net assets10 | | | 4.92 | % | | | 4.03 | % | | | 6.23 | % | | | 7.20 | % | | | | | 11.42 | %9,11 |
| | | | | | |
Ratio of net investment income to average net assets3 | | | 0.40 | % | | | 0.25 | % | | | 0.07 | % | | | 0.67 | % | | | | | 0.32 | %9 |
| | | | | | |
Portfolio turnover | | | 51 | % | | | 59 | % | | | 42 | % | | | 80 | % | | | | | 22 | %7 |
| | | | | | |
Net assets end of period (000’s) omitted | | | $31 | | | | $41 | | | | $37 | | | | $33 | | | | | | $24 | |
| | | | | | | | | | | | | | | | | | | | | | | |
| | | | | | | | | | | | | | | | | | | | | | | |
61
| | |
| | | AMG TimesSquare Global Small Cap Fund Financial Highlights For a share outstanding throughout each fiscal period |
| | | | | | | | | | | | | | | | | | | | |
| | | For the fiscal years ended December 31, | | For the fiscal
period ended
December 31, |
| | | | | |
Class Z | | | 2022 | | | | 2021 | | | | 2020 | | | | 2019 | | | | 2018 | 1 |
| | | | | | | | | | | | | | | | | | | | |
| | | | | |
Net Asset Value, Beginning of Period | | | $12.55 | | | | $12.09 | | | | $10.86 | | | | $7.96 | | | | $10.00 | |
| | | | | |
Income (loss) from Investment Operations: | | | | | | | | | | | | | | | | | | | | |
| | | | | |
Net investment income2,3 | | | 0.04 | | | | 0.03 | 4 | | | 0.01 | | | | 0.06 | | | | 0.02 | |
| | | | | |
Net realized and unrealized gain (loss) on investments | | | (3.03 | ) | | | 1.32 | | | | 1.22 | | | | 2.97 | | | | (2.06 | ) |
| | | | | | | | | | | | | | | | | | | | |
| | | | | |
Total income (loss) from investment operations | | | (2.99 | ) | | | 1.35 | | | | 1.23 | | | | 3.03 | | | | (2.04 | ) |
| | | | | |
Less Distributions to Shareholders from: | | | | | | | | | | | | | | | | | | | | |
| | | | | |
Net investment income | | | (0.02 | ) | | | (0.03 | ) | | | — | | | | (0.13 | ) | | | — | |
| | | | | |
Net realized gain on investments | | | — | | | | (0.86 | ) | | | — | | | | — | | | | — | |
| | | | | | | | | | | | | | | | | | | | |
| | | | | |
Total distributions to shareholders | | | (0.02 | ) | | | (0.89 | ) | | | — | | | | (0.13 | ) | | | — | |
| | | | | |
Net Asset Value, End of Period | | | $9.54 | | | | $12.55 | | | | $12.09 | | | | $10.86 | | | | $7.96 | |
| | | | | | | | | | | | | | | | | | | | |
| | | | | |
Total Return3,6 | | | (23.83 | )% | | | 11.38 | % | | | 11.33 | % | | | 38.09 | % | | | (20.40 | )%7 |
| | | | | |
Ratio of net expenses to average net assets | | | 1.00 | % | | | 1.00 | % | | | 1.00 | % | | | 1.02 | %8 | | | 1.00 | %9 |
| | | | | |
Ratio of gross expenses to average net assets10 | | | 4.92 | % | | | 4.03 | % | | | 6.23 | % | | | 7.20 | % | | | 11.42 | %9,11 |
| | | | | |
Ratio of net investment income to average net assets3 | | | 0.40 | % | | | 0.25 | % | | | 0.07 | % | | | 0.67 | % | | | 0.32 | %9 |
| | | | | |
Portfolio turnover | | | 51 | % | | | 59 | % | | | 42 | % | | | 80 | % | | | 22 | %7 |
| | | | | |
Net assets end of period (000’s) omitted | | | $1,619 | | | | $2,578 | | | | $2,186 | | | | $2,032 | | | | $1,443 | |
| | | | | | | | | | | | | | | | | | | | | |
| | | | | | | | | | | | | | | | | | | | | |
| 1 | Commencement of operations was on May 31, 2018. |
| 2 | Per share numbers have been calculated using average shares. |
| 3 | Total returns and net investment income (loss) would have been lower had certain expenses not been offset. |
| 4 | Includes non-recurring dividends. Without these dividends, net investment income/(loss) per share would have been $(0.02), $0.01 and $0.01 for Class N, Class I and Class Z, respectively. |
| 5 | Less than $0.005 per share. |
| 6 | The total return is calculated using the published Net Asset Value as of period end. |
| 8 | Includes interest expense on interfund lending and excise tax expense totaling 0.02%. |
| 10 | Excludes the impact of expense reimbursement or fee waivers and expense reductions such as brokerage credits, but includes expense repayments and non-reimbursable expenses, if any, such as interest, taxes, and extraordinary expenses. (See Note 1(c) and 2 in the Notes to Financial Statements.) |
| 11 | Ratio does not reflect the annualization of audit, excise tax and organization expenses. |
62
| | |
| | | Notes to Financial Statements December 31, 2022 |
| | | |
| | | |
1. ORGANIZATION AND SUMMARY OF SIGNIFICANT ACCOUNTING POLICIES
AMG Funds (the “Trust”) is an open-end management investment company, organized as a Massachusetts business trust, and registered under the Investment Company Act of 1940, as amended (the “1940 Act”). Currently, the Trust consists of a number of different funds, each having distinct investment management objectives, strategies, risks, and policies. Included in this report are AMG TimesSquare Small Cap Growth Fund (“Small Cap”), AMG TimesSquare Mid Cap Growth Fund (“Mid Cap”), AMG TimesSquare International Small Cap Fund (“International Small Cap”), AMG TimesSquare Emerging Markets Small Cap Fund (“Emerging Markets Small Cap”) and AMG TimesSquare Global Small Cap Fund (“Global Small Cap”), each a “Fund” and collectively, the “Funds”.
Each Fund offers Class N, Class I and Class Z shares. Each class represents an interest in the same assets of the respective Fund. Although all share classes generally have identical voting rights, each share class votes separately when required by law. Different share classes may have different net asset values per share to the extent the share classes pay different distribution amounts and/or the expenses of such share classes differ. Each share class has its own expense structure. Please refer to a current prospectus for additional information on each share class.
Market prices of investments held by the Funds may fall rapidly or unpredictably due to a variety of economic or political factors, market conditions, disasters or public health issues, or in response to events that affect particular industries or companies.
The Funds’ financial statements are prepared in accordance with accounting principles generally accepted in the United States of America (“U.S. GAAP”), including accounting and reporting guidance pursuant to Accounting Standards Codification Topic 946 applicable to investment companies. U.S. GAAP requires management to make estimates and assumptions that affect the reported amounts of assets and liabilities and disclosure of contingent assets and liabilities at the date of the financial statements and the reported amounts of income and expenses during the reporting period. Actual results could differ from those estimates and such differences could be material. The following is a summary of significant accounting policies followed by the Funds in the preparation of their financial statements:
a. VALUATION OF INVESTMENTS
For the Funds, equity securities traded on a national securities exchange or reported on the NASDAQ national market system (“NMS”) are valued at the last quoted sales price on the primary exchange or, if applicable, the NASDAQ official closing price or the official closing price of the relevant exchange or, lacking any sales, at the last quoted bid price. Equity securities held by the Funds that are traded in the over-the-counter market (other than NMS securities) are valued at the bid price. Foreign equity securities (securities principally traded in markets other than U.S. markets) held by the Funds are valued at the official closing price on the primary exchange or, for markets that either do not offer an official closing price or where the official closing price may not be representative of the overall market, the last quoted sale price.
Fixed income securities purchased with a remaining maturity of 60 days or less are valued at amortized cost, provided that the amortized cost value is approximately the same as the fair value of the security valued without the use of
amortized cost. Investments in other open-end registered investment companies are valued at their end of day net asset value per share.
The Funds’ portfolio investments are generally valued based on independent market quotations or prices or, if none, “evaluative” or other market based valuations provided by third party pricing services approved by the Board of Trustees of the Trust (the “Board”). Under certain circumstances, the value of certain Fund portfolio investments may be based on an evaluation of fair value, pursuant to procedures established by and under the general supervision of the Board. The Valuation Committee, which is comprised of the Independent Trustees of the Board, and the Pricing Committee, which is comprised of representatives from AMG Funds LLC (the “Investment Manager”) are the committees appointed by the Board to make fair value determinations. Each Fund may use the fair value of a portfolio investment to calculate its net asset value (“NAV”) in the event that the market quotation, price or market based valuation for the portfolio investment is not readily available or otherwise not determinable pursuant to the Board’s valuation procedures, if the Investment Manager or the Pricing Committee believes the quotation, price or market based valuation to be unreliable, or in certain other circumstances. When determining the fair value of an investment, the Pricing Committee and, if required under the Trust’s securities valuation procedures, the Valuation Committee, seeks to determine the price that a Fund might reasonably expect to receive from current sale of that portfolio investment in an arms-length transaction. Fair value determinations shall be based upon consideration of all available facts and information, including, but not limited to (i) attributes specific to the investment; (ii) fundamental and analytical data relating to the investment; and (iii) the value of other comparable securities or relevant financial instruments, including derivative securities, traded on other markets or among dealers.
The values assigned to fair value portfolio investments are based on available information and do not necessarily represent amounts that might ultimately be realized in the future, since such amounts depend on future developments inherent in long-term investments. Because of the inherent uncertainty of valuation, those estimated values may differ significantly from the values that would have been used had a ready market for the investments existed, and the differences could be material. The Board will be presented with a quarterly report showing as of the most recent quarter end, all outstanding securities fair valued by the Funds, including a comparison with the prior quarter end and the percentage of the Funds that the security represents at each quarter end.
With respect to foreign equity securities and certain foreign fixed income securities, the Board has adopted a policy that securities held in the Funds that can be fair valued by the applicable fair value pricing service are fair valued on each business day provided that each individual price exceeds a pre-established confidence level.
Effective September 8, 2022, the Funds adopted the requirements of Rule 2a-5 under the 1940 Act (“Rule 2a-5”), which the Funds’ Board designated the Funds’ Investment Manager as the Funds’ Valuation Designee to perform the Funds’ fair value determinations. Such determinations are subject to Board oversight and certain reporting and other requirements intended to ensure that the Board receives the information it needs to oversee the Investment Manager’s fair value determinations. Other than the designation of the Investment Manager as the Valuation Designee, the Funds’ adoption of Rule 2-a5 did not impact how the Funds determine fair value or the carrying amount of investments held in the Funds.
U.S. GAAP defines fair value as the price that a fund would receive to sell an asset or pay to transfer a liability in an orderly transaction between market participants
63
| | |
| | | Notes to Financial Statements (continued) |
| | | |
| | | |
at the measurement date. U.S. GAAP also establishes a framework for measuring fair value, and a three level hierarchy for fair value measurements based upon the transparency of inputs to the valuation of an asset or liability. Inputs may be observable or unobservable and refer broadly to the assumptions that market participants would use in pricing the asset or liability. Observable inputs reflect the assumptions market participants would use in pricing the asset or liability based on market data obtained from sources independent of the Funds. Unobservable inputs reflect the Funds’ own assumptions about the assumptions that market participants would use in pricing the asset or liability developed based on the best information available in the circumstances. Each investment is assigned a level based upon the observability of the inputs which are significant to the overall valuation.
The three-tier hierarchy of inputs is summarized below:
Level 1 - inputs are quoted prices in active markets for identical investments (e.g., equity securities, open-end investment companies)
Level 2 - other observable inputs (including, but not limited to: quoted prices for similar assets or liabilities in markets that are active, quoted prices for identical or similar assets or liabilities in markets that are not active, inputs other than quoted prices that are observable for the assets or liabilities (such as interest rates, yield curves, volatilities, prepayment speeds, loss severities, credit risks and default rates) or other market corroborated inputs) (e.g., debt securities, government securities, foreign currency exchange contracts, foreign securities utilizing international fair value pricing, fair valued securities with observable inputs)
Level 3 - inputs are significant unobservable inputs (including the Fund’s own assumptions used to determine the fair value of investments) (e.g., fair valued securities with unobservable inputs)
Changes in inputs or methodologies used for valuing investments may result in a transfer in or out of levels within the fair value hierarchy. The inputs or methodologies used for valuing investments may not necessarily be an indication of the risk associated with investing in those investments.
b. SECURITY TRANSACTIONS
Security transactions are accounted for as of trade date. Realized gains and losses on securities sold are determined on the basis of identified cost.
c. INVESTMENT INCOME AND EXPENSES
Dividend income is recorded on the ex-dividend date. Dividends from foreign securities are recorded on the ex-dividend date, and if after the fact, as soon as the Funds become aware of the ex- dividend date, except for Korean securities where dividends are recorded on confirmation date. Interest income, which includes
amortization of premium and accretion of discount on debt securities, is accrued as earned. Dividend and interest income on foreign securities is recorded gross of any withholding tax. Non-cash dividends included in dividend income, if any, are reported at the fair market value of the securities received. Upon notification from the issuer, distributions received from a real estate investment trust (REIT) may be redesignated as a reduction of cost of investments and/or realized gain. Other income and expenses are recorded on an accrual basis. Expenses that cannot be directly attributed to a Fund are apportioned among the funds in the Trust and other trusts or funds within the AMG Funds Family of Funds (collectively the “AMG Funds Family”) based upon their relative average net assets or number of shareholders. Investment income, realized and unrealized capital gains and losses, the common expenses of each Fund, and certain fund level expense reductions, if any, are allocated on a pro-rata basis to each class based on the relative net assets of each class to the total net assets of each Fund.
Small Cap and Mid Cap had certain portfolio trades directed to various brokers under a brokerage recapture program. Credits received from the brokerage recapture program are earned and paid on a monthly basis, and are recorded as expense offsets, which serve to reduce the Funds’ overall expense ratio. For the fiscal year ended December 31, 2022, the impact on the expenses and expense ratios, if any, were as follows: Small Cap - $56,647 or 0.02% and Mid Cap - $128,649 or 0.01%.
d. DIVIDENDS AND DISTRIBUTIONS
Fund distributions resulting from either net investment income or realized net capital gains, if any, will normally be declared and paid at least annually in December. Distributions to shareholders are recorded on the ex-dividend date. Distributions are determined in accordance with federal income tax regulations, which may differ from net investment income and net realized capital gains for financial statement purposes (U.S. GAAP). Differences may be permanent or temporary. Permanent differences are reclassified among capital accounts in the financial statements to reflect their tax character. Permanent book and tax basis differences, if any, relating to shareholder distributions will result in reclassifications to paid-in capital. Temporary differences arise when certain items of income, expense and gain or loss are recognized in different periods for financial statement and tax purposes; these differences will reverse at some time in the future. Permanent differences are primarily due to net operating losses for Small Cap Growth and Mid Cap Growth. There were no permanent differences during the year for International Small Cap, Emerging Markets Small Cap, or Global Small Cap. Temporary differences are primarily due to qualified late-year ordinary loss deferrals and mark-to-market on passive foreign investment companies for Mid Cap Growth; and mark-to-market on passive foreign investment companies for International Small Cap, Emerging Markets Small Cap and Global Small Cap. In addition, temporary differences for each Fund are wash sale loss deferrals.
64
| | |
| | | Notes to Financial Statements (continued) |
| | | |
| | | |
The tax character of distributions paid during the fiscal years ended December 31, 2022 and December 31, 2021 were as follows:
| | | | | | | | | | | | | | | | | | | | | | | | |
| | | |
| | | Small Cap | | | Mid Cap | | | International Small Cap | |
| | | | | | |
Distributions paid from: | | | 2022 | | | | 2021 | | | | 2022 | | | | 2021 | | | | 2022 | | | | 2021 | |
| | | | | | |
Ordinary income * | | | — | | | | $2,223,579 | | | | — | | | | $41,720,839 | | | | $4,752,915 | | | | $12,244,048 | |
| | | | | | |
Long-term capital gains | | | $15,933,418 | | | | 74,973,842 | | | | $42,276,026 | | | | 376,574,262 | | | | — | | | | — | |
| | | | | | | | | | | | | | | | | | | | | | | | |
| | | | | | |
| | | $15,933,418 | | | | $77,197,421 | | | | $42,276,026 | | | | $418,295,101 | | | | $4,752,915 | | | | $12,244,048 | |
| | | | | | | | | | | | | | | | | | | | | | | | |
| | | | | | |
| | | | | | | | | | | | | | | | | | | | | | | | |
| | | | |
| | | | | | | | | Emerging Markets Small Cap | | | Global Small Cap | |
| | | | | | |
Distributions paid from: | | | | | | | | | | | 2022 | | | | 2021 | | | | 2022 | | | | 2021 | |
| | | | | | |
Ordinary income * | | | | | | | | | | | $40 | | | | $1,417,218 | | | | $3,434 | | | | $5,747 | |
| | | | | | |
Long-term capital gains | | | | | | | | | | | 101,889 | | | | 922,018 | | | | — | | | | 171,218 | |
| | | | | | | | | | | | | | | | | | | | | | | | |
| | | | | | |
| | | | | | | | | | | $101,929 | | | | $2,339,236 | | | | $3,434 | | | | $176,965 | |
| | | | | | | | | | | | | | | | | | | | | | | | |
| * | For tax purposes, short-term capital gain distributions, if any, are considered ordinary income distributions. |
As of December 31, 2022, the components of distributable earnings (excluding unrealized appreciation/depreciation) on a tax basis consisted of:
| | | | | | | | | | | | | | | | | | | | |
| | | | | |
| | | Small Cap | | | Mid Cap | | | International Small Cap | | | Emerging Markets Small Cap | | | Global Small Cap | |
| | | | | |
Capital loss carryforward | | | $14,054,444 | | | | $15,972,195 | | | | $208,788,323 | | | | $1,115,959 | | | | $251,674 | |
| | | | | |
Undistributed ordinary income | | | — | | | | — | | | | 1,209,508 | | | | 29,818 | | | | 5,517 | |
| | | | | |
Late-year ordinary loss deferral | | | — | | | | 1,162,286 | | | | — | | | | — | | | | — | |
At December 31, 2022, the cost of investments and the aggregate gross unrealized appreciation and depreciation for federal income tax purposes were as follows:
| | | | | | | | | | | | | | | | |
| | | | |
| Fund | | Cost | | | Appreciation | | | Depreciation | | | Net Appreciation (Depreciation) | |
| | | | |
Small Cap | | | $225,463,240 | | | | $38,375,758 | | | | $(31,377,998 | ) | | | $6,997,760 | |
| | | | |
Mid Cap | | | 921,349,564 | | | | 306,071,305 | | | | (70,266,564 | ) | | | 235,804,741 | |
| | | | |
International Small Cap | | | 433,971,434 | | | | 47,619,398 | | | | (55,811,511 | ) | | | (8,192,113 | ) |
| | | | |
Emerging Markets Small Cap | | | 5,058,914 | | | | 335,147 | | | | (646,820 | ) | | | (311,673 | ) |
| | | | |
Global Small Cap | | | 1,699,091 | | | | 204,612 | | | | (165,744 | ) | | | 38,868 | |
e. FEDERAL TAXES
Each Fund currently qualifies as an investment company and intends to comply with the requirements under Subchapter M of the Internal Revenue Code of 1986, as amended, and to distribute substantially all of its taxable income and gains to its shareholders and to meet certain diversification and income requirements with respect to investment companies. Therefore, no provision for federal income or excise tax is included in the accompanying financial statements.
Additionally, based on each Fund’s understanding of the tax rules and rates related to income, gains and transactions for the foreign jurisdictions in which it invests, each Fund will provide for foreign taxes, and where appropriate, deferred foreign taxes.
Management has analyzed the Funds’ tax positions taken on federal income tax returns as of December 31, 2022, and for all open tax years (generally, the three prior taxable years), and has concluded that no provision for federal income tax is required in the Funds’ financial statements. Additionally, Management is not aware of any tax position for which it is reasonably possible that the total amounts of unrecognized tax benefits will change materially in the next twelve months.
f. CAPITAL LOSS CARRYOVERS AND DEFERRALS
As of December 31, 2022, the following Funds had capital loss carryovers for federal income tax purposes as shown in the following chart. These amounts may be used to offset future realized capital gains indefinitely, and retain their character as short-term and/or long-term.
| | | | | | | | | | | | |
| | | |
| Fund | | Short-Term | | | Long-Term | | | Total | |
| | | |
Small Cap | | | $14,054,444 | | | | — | | | | $14,054,444 | |
| | | |
Mid Cap | | | 15,972,195 | | | | — | | | | 15,972,195 | |
| | | |
International Small Cap | | | 146,354,207 | | | | $62,434,116 | | | | 208,788,323 | |
| | | |
Emerging Markets Small Cap | | | 910,717 | | | | 205,242 | | | | 1,115,959 | |
| | | |
Global Small Cap | | | 251,674 | | | | — | | | | 251,674 | |
For the fiscal year ended December 31, 2022, the Funds did not utilize capital loss carryovers.
65
| | |
| | | Notes to Financial Statements (continued) |
| | | |
| | | |
g. CAPITAL STOCK
The Trust’s Declaration of Trust authorizes for each Fund the issuance of an unlimited number of shares of beneficial interest, without par value. Each Fund records sales and repurchases of its capital stock on the trade date. For the fiscal year ended December 31, 2021, Mid Cap transferred securities and cash to certain shareholders in connection with redemptions in-kind transactions in the amount of $96,239,592. For the purposes of U.S. GAAP, the transactions were treated as sales of securities and the resulting gain or loss was recognized based on the market value of the securities on the date of the transfer. For tax purposes, no gains or losses were recognized.
For the fiscal years ended December 31, 2022 and December 31, 2021, the capital stock transactions by class for the Funds were as follows:
| | | | | | | | | | | | | | | | | | | | | | | | | | | | | | | | |
| | | Small Cap | | | Mid Cap | |
| | | | |
| | | December 31, 2022 | | | December 31, 2021 | | | December 31, 2022 | | | December 31, 2021 | |
| | | | | | | | |
| | | Shares | | | Amount | | | Shares | | | Amount | | | Shares | | | Amount | | | Shares | | | Amount | |
| | | | | | | | |
Class N: | | | | | | | | | | | | | | | | | | | | | | | | | | | | | | | | |
| | | | | | | | |
Shares sold | | | 896,662 | | | | $9,946,104 | | | | 930,439 | | | | $15,571,628 | | | | 2,655,998 | | | | $37,873,019 | | | | 3,047,700 | | | | $63,868,231 | |
| | | | | | | | |
Shares issued in reinvestment of distributions | | | 406,723 | | | | 4,006,213 | | | | 1,230,987 | | | | 16,889,145 | | | | 1,081,027 | | | | 14,183,075 | | | | 7,682,488 | | | | 129,603,580 | |
| | | | | | | | |
Shares redeemed | | | (3,529,240) | | | | (35,526,177) | | | | (2,843,265) | | | | (48,167,312) | | | | (6,145,647) | | | | (87,467,481) | | | | (10,883,148) | | | | (223,239,974) | |
| | | | | | | | | | | | | | | | | | | | | | | | | | | | | | | | |
| | | | | | | | |
Net decrease | | | (2,225,855) | | | | $(21,573,860) | | | | (681,839) | | | | $(15,706,539) | | | | (2,408,622) | | | | $(35,411,387) | | | | (152,960) | | | | $(29,768,163) | |
| | | | | | | | | | | | | | | | | | | | | | | | | | | | | | | | |
| | | | | | | | |
Class I: | | | | | | | | | | | | | | | | | | | | | | | | | | | | | | | | |
| | | | | | | | |
Shares sold | | | 111,079 | | | | $1,237,865 | | | | 79,467 | | | | $1,373,565 | | | | 6,003,888 | | | | $91,051,092 | | | | 4,176,242 | | | | $93,109,355 | |
| | | | | | | | |
Shares issued in reinvestment of distributions | | | 55,279 | | | | 580,981 | | | | 154,084 | | | | 2,245,001 | | | | 876,938 | | | | 12,268,364 | | | | 5,558,491 | | | | 99,608,163 | |
| | | | | | | | |
Shares redeemed | | | (105,953) | | | | (1,199,131) | | | | (105,412) | | | | (1,906,387) | | | | (5,771,917) | | | | (85,383,863) | | | | (11,757,412) | | | | (263,905,674) | |
| | | | | | | | | | | | | | | | | | | | | | | | | | | | | | | | |
| | | | | | | | |
Net increase (decrease) | | | 60,405 | | | | $619,715 | | | | 128,139 | | | | $1,712,179 | | | | 1,108,909 | | | | $17,935,593 | | | | (2,022,679) | | | | $(71,188,156) | |
| | | | | | | | | | | | | | | | | | | | | | | | | | | | | | | | |
| | | | | | | | |
Class Z: | | | | | | | | | | | | | | | | | | | | | | | | | | | | | | | | |
| | | | | | | | |
Shares sold | | | 1,221,999 | | | | $14,450,187 | | | | 1,427,078 | | | | $24,765,445 | | | | 5,137,985 | | | | $78,962,853 | | | | 4,442,505 | | | | $95,320,322 | |
| | | | | | | | |
Shares issued in reinvestment of distributions | | | 1,010,145 | | | | 10,677,230 | | | | 3,693,532 | | | | 54,036,383 | | | | 1,089,566 | | | | 15,319,295 | | | | 10,284,038 | | | | 185,112,679 | |
| | | | | | | | |
Shares redeemed | | | (5,614,082) | | | | (68,300,539) | | | | (2,849,416) | | | | (50,307,100) | | | | (20,266,422) | | | | (295,159,685) | | | | (14,118,081) | | | | (309,265,549)1 | |
| | | | | | | | | | | | | | | | | | | | | | | | | | | | | | | | |
| | | | | | | | |
Net increase (decrease) | | | (3,381,938) | | | | $(43,173,122) | | | | 2,271,194 | | | | $28,494,728 | | | | (14,038,871) | | | | $(200,877,537) | | | | 608,462 | | | | $(28,832,548) | |
| | | | | | | | | | | | | | | | | | | | | | | | | | | | | | | | |
|
| 1 Includes redemption in-kind in the amount of $96,239,592. | |
| | | International Small Cap | | | Emerging Markets Small Cap | |
| | | | |
| | | December 31, 2022 | | | December 31, 2021 | | | December 31, 2022 | | | December 31, 2021 | |
| | | | | | | | |
| | | Shares | | | Amount | | | Shares | | | Amount | | | Shares | | | Amount | | | Shares | | | Amount | |
| | | | | | | | |
Class N: | | | | | | | | | | | | | | | | | | | | | | | | | | | | | | | | |
| | | | | | | | |
Shares sold | | | 143,240 | | | | $2,009,589 | | | | 134,982 | | | | $2,573,892 | | | | 5,117 | | | | $43,509 | | | | 4,935 | | | | $78,379 | |
| | | | | | | | |
Shares issued in reinvestment of distributions | | | 6,983 | | | | 92,109 | | | | 11,270 | | | | 202,193 | | | | 165 | | | | 1,353 | | | | 1,336 | | | | 13,885 | |
| | | | | | | | |
Shares redeemed | | | (465,959) | | | | (6,397,061) | | | | (1,460,668) | | | | (27,664,145) | | | | (2,100) | | | | (20,778) | | | | (4,734) | | | | (71,083) | |
| | | | | | | | | | | | | | | | | | | | | | | | | | | | | | | | |
| | | | | | | | |
Net increase (decrease) | | | (315,736) | | | | $(4,295,363) | | | | (1,314,416) | | | | $(24,888,060) | | | | 3,182 | | | | $24,084 | | | | 1,537 | | | | $21,181 | |
| | | | | | | | | | | | | | | | | | | | | | | | | | | | | | | | |
| | | | | | | | |
Class I: | | | | | | | | | | | | | | | | | | | | | | | | | | | | | | | | |
| | | | | | | | |
Shares sold | | | 8,648,988 | | | | $125,632,972 | | | | 10,853,232 | | | | $208,442,162 | | | | — | | | | — | | | | 3,903 | | | | $62,945 | |
| | | | | | | | |
Shares issued in reinvestment of distributions | | | 198,865 | | | | 2,627,008 | | | | 382,596 | | | | 6,879,080 | | | | 893 | | | | $7,395 | | | | 12,182 | | | | 127,065 | |
| | | | | | | | |
Shares redeemed | | | (22,311,931) | | | | (318,198,623) | | | | (12,100,730) | | | | (230,937,471) | | | | (1,083) | | | | (10,580) | | | | (3,903) | | | | (61,007) | |
| | | | | | | | | | | | | | | | | | | | | | | | | | | | | | | | |
| | | | | | | | |
Net increase (decrease) | | | (13,464,078) | | | | $(189,938,643) | | | | (864,902) | | | | $(15,616,229) | | | | (190) | | | | $(3,185) | | | | 12,182 | | | | $129,003 | |
| | | | | | | | | | | | | | | | | | | | | | | | | | | | | | | | |
66
| | |
| | | Notes to Financial Statements (continued) |
| | | |
| | | |
| | | | | | | | | | | | | | | | | | | | | | | | | | | | | | | | |
| | | International Small Cap | | | Emerging Markets Small Cap | |
| | | | |
| | | December 31, 2022 | | | December 31, 2021 | | | December 31, 2022 | | | December 31, 2021 | |
| | | | | | | | |
| | | Shares | | | Amount | | | Shares | | | Amount | | | Shares | | | Amount | | | Shares | | | Amount | |
| | | | | | | | |
Class Z: | | | | | | | | | | | | | | | | | | | | | | | | | | | | | | | | |
| | | | | | | | |
Shares sold | | | 4,355,478 | | | | $66,368,453 | | | | 2,778,649 | | | | $52,217,687 | | | | 527 | | | | $5,001 | | | | 8,876 | | | | $130,100 | |
| | | | | | | | |
Shares issued in reinvestment of distributions | | | 147,401 | | | | 1,947,166 | | | | 266,202 | | | | 4,786,311 | | | | 11,245 | | | | 93,111 | | | | 208,460 | | | | 2,172,152 | |
| | | | | | | | |
Shares redeemed | | | (13,315,597) | | | | (169,807,353) | | | | (3,176,564) | | | | (60,852,960) | | | | (205,101) | | | | (1,853,541) | | | | (3,176) | | | | (45,409) | |
| | | | | | | | | | | | | | | | | | | | | | | | | | | | | | | | |
| | | | | | | | |
Net increase (decrease) | | | (8,812,718) | | | | $(101,491,734) | | | | (131,713) | | | | $(3,848,962) | | | | (193,329) | | | | $(1,755,429) | | | | 214,160 | | | | $2,256,843 | |
| | | | | | | | | | | | | | | | | | | | | | | | | | | | | | | | |
| | |
| | | Global Small Cap | | | | |
| | | | |
| | | December 31, 2022 | | | December 31, 2021 | | | | | | | |
| | | | | | | | |
| | | Shares | | | Amount | | | Shares | | | Amount | | | | | | | | | | | | | |
| | | | | | | | |
Class N: | | | | | | | | | | | | | | | | | | | | | | | | | | | | | | | | |
| | | | | | | | |
Shares issued in reinvestment of distributions | | | — | | | | — | | | | 367 | | | | $4,448 | | | | | | | | | | | | | | | | | |
| | | | | | | | |
Class I: | | | | | | | | | | | | | | | | | | | | | | | | | | | | | | | | |
| | | | | | | | |
Shares issued in reinvestment of distributions | | | 7 | | | | $65 | | | | 221 | | | | $2,692 | | | | | | | | | | | | | | | | | |
| | | | | | | | |
Class Z: | | | | | | | | | | | | | | | | | | | | | | | | | | | | | | | | |
| | | | | | | | |
Shares sold | | | 4,549 | | | | $50,000 | | | | 16,217 | | | | $212,500 | | | | | | | | | | | | | | | | | |
| | | | | | | | |
Shares issued in reinvestment of distributions | | | 354 | | | | 3,369 | | | | 13,966 | | | | 169,825 | | | | | | | | | | | | | | | | | |
| | | | | | | | |
Shares redeemed | | | (40,733) | | | | (362,297) | | | | (5,491) | | | | (65,772) | | | | | | | | | | | | | | | | | |
| | | | | | | | | | | | | | | | | | | | | | | | | | | | | | | | |
| | | | | | | | |
Net increase (decrease) | | | (35,830) | | | | $(308,928) | | | | 24,692 | | | | $316,553 | | | | | | | | | | | | | | | | | |
| | | | | | | | | | | | | | | | | | | | | | | | | | | | | | | | |
At December 31, 2022, certain shareholders of record individually or collectively held greater than 5% of the net assets of the Funds as follows: Emerging Markets Small Cap - three own 81%; Global Small Cap - three own 83%. Transactions by these shareholders may have a material impact on the Funds.
h. REPURCHASE AGREEMENTS AND JOINT REPURCHASE AGREEMENTS
The Funds may enter into third-party and bilateral repurchase agreements for temporary cash management purposes and third-party or bilateral joint repurchase agreements for reinvestment of cash collateral on securities lending transactions under the securities lending program offered by The Bank of New York Mellon (“BNYM”) (the “Program”) (collectively, “Repurchase Agreements”). The value of the underlying collateral, including accrued interest, must equal or exceed the value of the Repurchase Agreements during the term of the agreement. For joint repurchase agreements, the Funds participate on a pro rata basis with other clients of BNYM in its share of the underlying collateral under such joint repurchase agreements and in its share of proceeds from any repurchase or other disposition of the underlying collateral. The underlying collateral for all Repurchase Agreements is held in safekeeping by the Funds’ custodian or at the Federal Reserve Bank. If the seller defaults and the value of the collateral declines, or if bankruptcy proceedings commence with respect to the seller of the security, realization of the collateral by the Funds may be delayed or limited. Pursuant to the Program, the Funds are indemnified for such losses by BNYM on joint repurchase agreements.
At December 31, 2022, the market value of Repurchase Agreements outstanding for Small Cap, Mid Cap, International Small Cap were $3,360,521, $21,731,927 and $2,755,348, respectively.
i. FOREIGN CURRENCY TRANSLATION
The books and records of the Funds are maintained in U.S. Dollars. The value of investments, assets and liabilities denominated in currencies other than U.S. Dollars are translated into U.S. Dollars based upon current foreign exchange rates. Purchases and sales of foreign investments, income and expenses are converted into U.S. Dollars based on currency exchange rates prevailing on the respective dates of such transactions. Net realized and unrealized gain (loss) on foreign currency transactions represent: (1) foreign exchange gains and losses from the sale and holdings of foreign currencies; (2) gains and losses between trade date and settlement date on investment securities transactions and foreign currency exchange contracts; and (3) gains and losses from the difference between amounts of interest and dividends recorded and the amounts actually received.
The Funds do not isolate the net realized and unrealized gain or loss resulting from changes in exchange rates from the fluctuations in market prices of securities held. Such fluctuations are included with the net realized and unrealized gain or loss on investments.
2. AGREEMENTS AND TRANSACTIONS WITH AFFILIATES
For each of the Funds, the Trust has entered into an investment advisory agreement under which the Investment Manager, a subsidiary and the U.S. retail distribution arm of Affiliated Managers Group, Inc. (“AMG”), serves as investment
67
| | |
| | | Notes to Financial Statements (continued) |
| | | |
| | | |
manager to the Funds and is responsible for the Funds’ overall administration and operations. The Investment Manager selects one or more subadvisers for the Funds (subject to Board approval) and monitors each subadviser’s investment performance, security holdings and investment strategies. Each Fund’s investment portfolio is managed by TimesSquare Capital Management, LLC (“TimesSquare”) who serves pursuant to a subadvisory agreement with the Investment Manager. AMG indirectly owns a majority interest in TimesSquare.
Investment management fees are paid directly by the Funds to the Investment Manager based on average daily net assets. For the fiscal year ended December 31, 2022, the Funds’ investment management fees were paid at the following annual rates of each Fund’s respective average daily net assets:
| | |
| |
Small Cap | | 0.79% |
| |
Mid Cap | | 0.79% |
| |
International Small Cap | | 0.75% |
| |
Emerging Markets Small Cap | | 0.95% |
| |
Global Small Cap | | 0.70% |
The fee paid to TimesSquare for its services as subadviser is paid out of the fee the Investment Manager receives from each Fund and does not increase the expenses of each Fund.
The Investment Manager has contractually agreed, through at least May 1, 2023, to waive management fees and/or pay or reimburse fund expenses in order to limit total annual Fund operating expenses after fee waiver and expense reimbursements (exclusive of taxes, interest (including interest incurred in connection with bank and custody overdrafts, and in connection with securities sold short), shareholder servicing fees, distribution and service (12b-1) fees, brokerage commissions and other transaction costs, dividends payable with respect to securities sold short, acquired fund fees and expenses and extraordinary expenses) of Small Cap, Mid Cap, International Small Cap, Emerging Markets Small Cap and Global Small Cap to the annual rate of 0.99%, 1.13%, 1.05%, 1.25% and 1.00%, respectively, of each Fund’s average daily net assets (this annual rate or such other annual rate that may be in effect from time to time, the “Expense Cap”), subject to later reimbursement by the Funds in certain circumstances.
In general, for a period of up to 36 months after the date any amounts are paid, waived or reimbursed by the Investment Manager, the Investment Manager may recover such amounts from a Fund, provided that such repayment would not cause the Fund’s total annual operating expenses after fee waiver and expense reimbursements (exclusive of the items noted in the parenthetical above) to exceed either (i) the Expense Cap in effect at the time such amounts were paid, waived or reimbursed, or (ii) the Expense Cap in effect at the time of such repayment by the Fund.
The contractual expense limitation may only be terminated in the event the Investment Manager or a successor ceases to be the investment manager of a Fund or a successor fund, by mutual agreement between the Investment Manager and the Board, or in the event of a Fund’s liquidation unless the Fund is reorganized or is a party to a merger in which the surviving entity is successor to the accounting and performance information of a Fund.
At December 31, 2022, the Funds’ expiration of reimbursements subject to recoupment is as follows:
| | | | | | | | | | | | |
Expiration Period | | Small Cap | | | Emerging Markets Small Cap | | | Global Small Cap | |
| | | |
Less than 1 year | | | $36,850 | | | | $111,885 | | | | $99,133 | |
| | | |
1-2 years | | | 4,404 | | | | 108,894 | | | | 76,549 | |
| | | |
2-3 years | | | 39,090 | | | | 144,775 | | | | 80,223 | |
| | | | | | | | | | | | |
| | | |
Total | | | $80,344 | | | | $365,554 | | | | $255,905 | |
| | | | | | | | | | | | |
The Trust, on behalf of the Funds, has entered into an amended and restated Administration Agreement under which the Investment Manager serves as the Funds’ administrator (the “Administrator”) and is responsible for all non-portfolio management aspects of managing the Funds’ operations, including administration and shareholder services to each Fund. Each Fund pays a fee to the Administrator at the rate of 0.15% per annum of the Fund’s average daily net assets for this service.
The Funds are distributed by AMG Distributors, Inc. (the “Distributor”), a wholly-owned subsidiary of the Investment Manager. The Distributor serves as the distributor and underwriter for each Fund and is a registered broker-dealer and member of the Financial Industry Regulatory Authority, Inc. (“FINRA”). Shares of each Fund will be continuously offered and will be sold directly to prospective purchasers and through brokers, dealers or other financial intermediaries who have executed selling agreements with the Distributor. Generally the Distributor bears all or a portion of the expenses of providing services pursuant to the distribution agreement, including the payment of the expenses relating to the distribution of prospectuses for sales purposes and any advertising or sales literature.
The Trust has adopted a distribution and service plan (the “Plan”) with respect to the Class N shares of Emerging Markets Small Cap and Global Small Cap, in accordance with the requirements of Rule 12b-1 under the 1940 Act and the requirements of the applicable rules of FINRA regarding asset-based sales charges. Pursuant to the Plan, Emerging Markets Small Cap and Global Small Cap may make payments to the Distributor for its expenditures in financing any activity primarily intended to result in the sale of Emerging Markets Small Cap and Global Small Cap’s Class N shares and for maintenance and personal service provided to existing shareholders of that class. The Plan authorized payments to the Distributor up to 0.25% annually of Emerging Markets Small Cap’s and Global Small Cap’s average daily net assets attributable to the Class N shares.
For each of the Class N and Class I shares, the Board has approved reimbursement payments to the Investment Manager for shareholder servicing expenses (“shareholder servicing fees”) incurred. Shareholder servicing fees include payments to financial intermediaries, such as broker-dealers (including fund supermarket platforms), banks, and trust companies who provide shareholder recordkeeping, account servicing and other services. The Class N and Class I shares may reimburse the Investment Manager for the actual amount incurred up to a maximum annual rate of each Class’s average daily net assets as shown in the table below.
68
| | |
| | | Notes to Financial Statements (continued) |
| | | |
| | | |
The impact on the annualized expense ratios for the fiscal year ended December 31, 2022, were as follows:
| | | | | | |
| | | Maximum Annual | | | Actual |
| | | Amount | | | Amount |
| Fund | | Approved | | | Incurred |
| | |
Small Cap | | | | | | |
| | |
Class N | | | 0.20% | | | 0.20% |
| | |
Class I | | | 0.10% | | | 0.08% |
| | |
Mid Cap | | | | | | |
| | |
Class N | | | 0.20% | | | 0.20% |
| | |
Class I | | | 0.05% | | | 0.05% |
| | |
International Small Cap | | | | | | |
| | |
Class N | | | 0.25% | | | 0.25% |
| | |
Class I | | | 0.10% | | | 0.10% |
| | |
Emerging Markets Small Cap | | | | | | |
| | |
Class N | | | 0.15% | | | 0.15% |
| | |
Class I | | | 0.15% | | | 0.00%* |
| | |
Global Small Cap | | | | | | |
| | |
Class N | | | 0.15% | | | — |
| | |
Class I | | | 0.15% | | | — |
The Board provides supervision of the affairs of the Trust and other trusts within the AMG Funds Family. The Trustees of the Trust who are not affiliated with the Investment Manager receive an annual retainer and per meeting fees for regular, special and telephonic meetings, and they are reimbursed for out-of-pocket expenses incurred while carrying out their duties as Board members. The Chairman of the Board and the Audit Committee Chair receive additional annual retainers. Certain Trustees and Officers of the Funds are Officers and/or Directors of the Investment Manager, AMG and/or the Distributor.
The Securities and Exchange Commission (the “SEC”) granted an exemptive order that permits certain eligible funds in the AMG Funds Family to lend and borrow money for certain temporary purposes directly to and from other eligible funds in the AMG Funds Family. Participation in this interfund lending program is voluntary for both the borrowing and lending funds, and an interfund loan is only made if it benefits each participating fund. The Administrator manages the program according to procedures approved by the Board, and the Board monitors the operation of the program. An interfund loan must comply with certain conditions set out in the exemptive order, which are designed to assure fairness and protect all participating funds. The interest earned and interest paid on interfund loans are included on the Statement of Operations as interest income and interest expense, respectively. At December 31, 2022, the Funds had no interfund loans outstanding.
The following Funds utilized the interfund loan program during the fiscal year ended December 31, 2022 as follows:
| | | | | | | | | | | | | | | | |
Fund | | Average Lent | | | Number of Days | | | Interest Earned | | | Average Interest Rate | |
| | | | |
Small Cap | | | $2,166,108 | | | | 14 | | | | $3,632 | | | | 4.372 | % |
| | | | |
Mid Cap | | | 822,737 | | | | 11 | | | | 682 | | | | 2.751 | % |
| | | | | | | | | | | | | | | | |
Fund | | Average Lent | | | Number of Days | | | Interest Earned | | | Average Interest Rate | |
| | | | |
International Small Cap | | | 2,766,867 | | | | 16 | | | | $3,416 | | | | 2.816 | % |
| | | | | | | | | | | | | | | | |
Fund | | Average Borrowed | | | Number of Days | | | Interest Paid | | | Average Interest Rate | |
| | | | |
Small Cap | | | $1,234,589 | | | | 3 | | | | $503 | | | | 4.960 | % |
| | | | |
Mid Cap | | | 54,880,832 | | | | 1 | | | | 7,074 | | | | 4.705 | % |
| | | | |
International Small Cap | | | 15,386,782 | | | | 15 | | | | 14,634 | | | | 2.314 | % |
| | | | |
Emerging Markets Small Cap | | | 189,856 | | | | 64 | | | | 885 | | | | 2.657 | % |
| | | | |
Global Small Cap | | | 170,137 | | | | 2 | | | | 37 | | | | 3.940 | % |
3. PURCHASES AND SALES OF SECURITIES
Purchases and sales of securities (excluding short-term securities and U.S. Government Obligations) for the fiscal year ended December 31, 2022, were as follows:
| | | | | | | | |
| | | Long Term Securities | |
| | |
| Fund | | Purchases | | | Sales | |
| | |
Small Cap | | | $139,852,058 | | | | $218,167,060 | |
| | |
Mid Cap | | | 601,848,428 | | | | 838,732,248 | |
| | |
International Small Cap | | | 466,462,171 | | | | 745,037,716 | |
| | |
Emerging Markets Small Cap | | | 6,011,504 | | | | 7,820,732 | |
| | |
Global Small Cap | | | 1,018,821 | | | | 1,281,962 | |
The Funds had no purchases or sales of U.S. Government Obligations during the fiscal year ended December 31, 2022.
4. PORTFOLIO SECURITIES LOANED
The Funds participate in the Program providing for the lending of securities to qualified borrowers. Securities lending income includes earnings of such temporary cash investments, plus or minus any rebate to a borrower. These earnings (after any rebate) are then divided between BNYM, as a fee for its services under the Program, and the Funds, according to agreed-upon rates. Collateral on all securities loaned is accepted in cash, U.S. Treasury Obligations or U.S. Government Agency Obligations. Collateral is maintained at a minimum level of 102% (105% in the case of certain foreign securities) of the market value, plus interest, if applicable, of investments on loan. It is the Funds’ policy to obtain additional collateral from or return excess collateral to the borrower by the end of the next business day, following the valuation date of the securities loaned. Therefore, the value of the collateral held may be temporarily less than the value of the securities on loan. Lending securities entails a risk of loss to the Funds if and to the extent that the market value of the securities loaned were to increase and the borrower did not increase the collateral accordingly, and the borrower fails to return the securities. Under the terms of the Program, the Funds are indemnified for such losses by BNYM. Cash collateral is held in separate omnibus accounts managed by BNYM, who is authorized to exclusively enter into joint repurchase agreements for that cash collateral. Securities collateral is held in separate omnibus accounts managed by BNYM and cannot be sold or pledged. BNYM bears the risk of any deficiency in the amount of the cash collateral available for return to the borrower due to any loss on the collateral invested. Loans of securities are
69
| | |
| | | Notes to Financial Statements (continued) |
| | | |
| | | |
terminable at any time and the borrower, after notice, is required to return borrowed securities as soon as practical, which is normally within three business days.
The value of securities loaned on positions held, cash collateral and securities collateral received at December 31, 2022, were as follows:
| | | | | | | | | | | | | | | | |
Fund | | Securities Loaned | | | Cash Collateral Received | | | Securities Collateral Received | | | Total Collateral Received | |
| | | | |
Small Cap | | | $9,786,629 | | | | $3,360,521 | | | | $6,591,151 | | | | $9,951,672 | |
| | | | |
Mid Cap | | | 26,774,296 | | | | 21,731,927 | | | | 5,763,576 | | | | 27,495,503 | |
| | | | |
International Small Cap | | | 8,922,218 | | | | 2,755,348 | | | | 6,671,350 | | | | 9,426,698 | |
| | | | |
Global Small Cap | | | 77,084 | | | | — | | | | 79,746 | | | | 79,746 | |
The following table summarizes the securities received as collateral for securities lending at December 31, 2022:
| | | | | | |
Fund | | Collateral Type | | Coupon Range | | Maturity Date Range |
| | | |
Small Cap | | U.S. Treasury Obligations | | 0.000%-4.750% | | 02/09/23-08/15/52 |
| | | |
Mid Cap | | U.S. Treasury Obligations | | 0.125%-4.750% | | 02/28/23-11/15/51 |
| | | |
International
Small Cap | | U.S. Treasury Obligations | | 0.000%-4.500% | | 01/26/23-02/15/51 |
| | | |
Global Small Cap | | U.S. Treasury Obligations | | 0.000%-4.375% | | 01/26/23-08/15/51 |
5. FOREIGN SECURITIES
Certain Funds invest in securities of foreign entities and in instruments denominated in foreign currencies which involve risks not typically associated with investments in domestic securities. Non-domestic securities carry special risks, such as exposure to currency fluctuations, less developed or less efficient trading markets, political instability, a lack of company information, differing auditing and legal standards, and, potentially, less liquidity. A Fund’s investments in emerging market countries are exposed to additional risks. A Fund’s performance will be influenced by political, social and economic factors affecting companies in emerging market countries. Emerging market countries generally have economic structures that are less diverse and mature, and political systems that are less stable, than those of developed countries. Realized gains in certain countries may be subject to foreign taxes at the Fund level and the Fund would pay such foreign taxes at the appropriate rate for each jurisdiction.
6. COMMITMENTS AND CONTINGENCIES
Under the Trust’s organizational documents, its Trustees and Officers are indemnified against certain liabilities arising out of the performance of their duties to the Trust. In addition, in the normal course of business, the Funds may enter into contracts and agreements that contain a variety of representations and warranties, which provide general indemnifications. The maximum exposure to the Funds under these arrangements is unknown, as this would involve future claims that may be made against a Fund that have not yet occurred. However, based on experience, the Funds had no prior claims or losses and expect the risks of loss to be remote.
7. MASTER NETTING AGREEMENTS
The Funds may enter into master netting agreements with their counterparties for the Program and Repurchase Agreements, which provide the right, in the event of default (including bankruptcy or insolvency) for the non-defaulting party to liquidate the collateral and calculate net exposure to the defaulting party or request additional collateral. For financial reporting purposes, the Funds do not offset financial assets and financial liabilities that are subject to master netting agreements in the Statement of Assets and Liabilities. For securities lending transactions, see Note 4.
The following table is a summary of the Funds’ open Repurchase Agreements that are subject to a master netting agreement as of December 31, 2022:
| | | | | | | | | | | | | | | | | | | | | | | | | |
| | | | | Gross Amount Not Offset in the | | | | |
| | | | | Statement of Assets and Liabilities | | | | |
Fund | | Gross Amounts of Assets Presented in the Statement of Assets and Liabilities | | Offset Amount | | Net Asset Balance | | Collateral Received | | Net Amount |
| | | | | |
Small Cap | | | | | | | | | | | | | | | | | | | | | | | | | |
| | | | | |
Citigroup Global Markets, Inc. | | | | $360,521 | | | | | — | | | | | $360,521 | | | | | $360,521 | | | | | — | |
| | | | | |
MUFG Securities America, Inc. | | | | 1,000,000 | | | | | — | | | | | 1,000,000 | | | | | 1,000,000 | | | | | — | |
| | | | | |
National Bank Financial | | | | 1,000,000 | | | | | — | | | | | 1,000,000 | | | | | 1,000,000 | | | | | — | |
| | | | | |
RBC Dominion Securities, Inc. | | | | 1,000,000 | | | | | — | | | | | 1,000,000 | | | | | 1,000,000 | | | | | — | |
| | | | | | | | | | | | | | | | | | | | | | | | | |
| | | | | |
Total | | | | $3,360,521 | | | | | — | | | | | $3,360,521 | | | | | $3,360,521 | | | | | — | |
| | | | | | | | | | | | | | | | | | | | | | | | | |
70
| | |
| | | Notes to Financial Statements (continued) |
| | | |
| | | |
| | | | | | | | | | | | | | | | | | | | |
| | | | | Gross Amount Not Offset in the | | | | |
| | | | | Statement of Assets and Liabilities | | | | |
| Fund | | Gross Amounts of
Assets Presented in
the Statement of
Assets and Liabilities | | Offset Amount | | Net Asset Balance | | Collateral Received | | Net Amount |
| | | | | |
Mid Cap | | | | | | | | | | | | | | | | | | | | |
| | | | | |
Cantor Fitzgerald Securities, Inc. | | | $5,161,900 | | | | — | | | | $5,161,900 | | | | $5,161,900 | | | | — | |
| | | | | |
Citadel Securities LLC | | | 5,161,900 | | | | — | | | | 5,161,900 | | | | 5,161,900 | | | | — | |
| | | | | |
Citigroup Global Markets, Inc. | | | 1,629,306 | | | | — | | | | 1,629,306 | | | | 1,629,306 | | | | — | |
| | | | | |
National Bank Financial | | | 5,161,940 | | | | — | | | | 5,161,940 | | | | 5,161,940 | | | | — | |
| | | | | |
State of Wisconsin Investment Board | | | 4,616,881 | | | | — | | | | 4,616,881 | | | | 4,616,881 | | | | — | |
| | | | | | | | | | | | | | | | | | | | |
| | | | | |
Total | | | $21,731,927 | | | | — | | | | $21,731,927 | | | | $21,731,927 | | | | — | |
| | | | | | | | | | | | | | | | | | | | |
| | | | | |
International Small Cap | | | | | | | | | | | | | | | | | | | | |
| | | | | |
Deutsche Bank Securities, Inc. | | | $755,348 | | | | — | | | | $755,348 | | | | $755,348 | | | | — | |
| | | | | |
National Bank Financial | | | 1,000,000 | | | | — | | | | 1,000,000 | | | | 1,000,000 | | | | — | |
| | | | | |
RBC Dominion Securities, Inc. | | | 1,000,000 | | | | — | | | | 1,000,000 | | | | 1,000,000 | | | | — | |
| | | | | | | | | | | | | | | | | | | | |
| | | | | |
Total | | | $2,755,348 | | | | — | | | | $2,755,348 | | | | $2,755,348 | | | | — | |
| | | | | | | | | | | | | | | | | | | | |
8. SUBSEQUENT EVENTS
The Funds have determined that no material events or transactions occurred through the issuance date of the Funds’ financial statements which require an additional disclosure in or adjustment of the Funds’ financial statements.
71
|
Report of Independent Registered Public Accounting Firm |
To the Board of Trustees of AMG Funds and Shareholders of AMG TimesSquare Small Cap Growth Fund, AMG TimesSquare Mid Cap Growth Fund, AMG TimesSquare International Small Cap Fund, AMG TimesSquare Emerging Markets Small Cap Fund, and AMG TimesSquare Global Small Cap Fund
Opinions on the Financial Statements
We have audited the accompanying statements of assets and liabilities, including the schedules of portfolio investments, of AMG TimesSquare Small Cap Growth Fund, AMG TimesSquare Mid Cap Growth Fund, AMG TimesSquare International Small Cap Fund, AMG TimesSquare Emerging Markets Small Cap Fund, and AMG TimesSquare Global Small Cap Fund (five of the funds constituting AMG Funds, hereafter collectively referred to as the “Funds”) as of December 31, 2022, the related statements of operations for the year ended December 31, 2022, the statements of changes in net assets for each of the two years in the period ended December 31, 2022, including the related notes, and the financial highlights for each of the periods indicated therein (collectively referred to as the “financial statements”). In our opinion, the financial statements present fairly, in all material respects, the financial position of each of the Funds as of December 31, 2022, the results of each of their operations for the year then ended, the changes in each of their net assets for each of the two years in the period ended December 31, 2022 and each of the financial highlights for each of the periods indicated therein in conformity with accounting principles generally accepted in the United States of America.
Basis for Opinions
These financial statements are the responsibility of the Funds’ management. Our responsibility is to express an opinion on the Funds’ financial statements based on our audits. We are a public accounting firm registered with the Public Company Accounting Oversight Board (United States) (PCAOB) and are required to be independent with respect to the Funds in accordance with the U.S. federal securities laws and the applicable rules and regulations of the Securities and Exchange Commission and the PCAOB.
We conducted our audits of these financial statements in accordance with the standards of the PCAOB. Those standards require that we plan and perform the audit to obtain reasonable assurance about whether the financial statements are free of material misstatement, whether due to error or fraud.
Our audits included performing procedures to assess the risks of material misstatement of the financial statements, whether due to error or fraud, and performing procedures that respond to those risks. Such procedures included examining, on a test basis, evidence regarding the amounts and disclosures in the financial statements. Our audits also included evaluating the accounting principles used and significant estimates made by management, as well as evaluating the overall presentation of the financial statements. Our procedures included confirmation of securities owned as of December 31, 2022 by correspondence with the custodian and brokers; when replies were not received from brokers, we performed other auditing procedures. We believe that our audits provide a reasonable basis for our opinions.
/s/ PricewaterhouseCoopers LLP
Boston, Massachusetts
February 24, 2023
We have served as the auditor of one or more investment companies in the AMG Funds Family since 1993.
72
| | |
| | | Other Information (unaudited) |
| | | |
| | | |
TAX INFORMATION
AMG TimesSquare Small Cap Growth Fund, AMG TimesSquare Mid Cap Growth Fund, AMG TimesSquare International Small Cap Fund, AMG TimesSquare Emerging Markets Small Cap Fund and AMG TimesSquare Global Small Cap Fund each hereby designates the maximum amount allowable of its net taxable income as qualified dividends as provided in the Jobs and Growth Tax Relief Reconciliation Act of 2003. The 2022 Form 1099-DIV you receive for each Fund will show the tax status of all distributions paid to you during the year.
In accordance with federal tax law, the following Funds elect to provide foreign taxes paid and the income sourced from foreign countries. Accordingly, each Fund hereby makes the following designations regarding its taxable period ended December 31, 2022:
AMG TimesSquare International Small Cap Fund
u The total amount of taxes paid and income sourced from foreign countries was $1,254,715 and $19,026,713, respectively.
AMG TimesSquare Emerging Markets Small Cap Fund
u The total amount of taxes paid and income sourced from foreign countries was $16,860 and $130,035, respectively.
AMG TimesSquare Global Small Cap Fund
u The total amount of taxes paid and income sourced from foreign countries was $2,204 and $27,060, respectively.
Pursuant to section 852 of the Internal Revenue Code, AMG TimesSquare Small Cap Growth Fund, AMG TimesSquare Mid Cap Growth Fund, AMG TimesSquare International Small Cap Fund, AMG TimesSquare Emerging Markets Small Cap Fund and AMG TimesSquare Global Small Cap Fund each hereby designates $15,933,418, $42,276,026, $0, $101,889 and $0, respectively, as a capital gain distribution with respect to the taxable period ended December 31, 2022, or, if subsequently determined to be different, the net capital gains of such period.
73
| | |
| | | AMG Funds Trustees and Officers |
| | | |
| | | |
| | | | | | |
The Trustees and Officers of the Trust, their business addresses, principal occupations for the past five years and ages are listed below. The Trustees provide broad supervision over the affairs of the Trust and the Funds. The Trustees are experienced executives who meet periodically throughout the year to oversee the Funds’ activities, review contractual arrangements with companies that provide services to the Funds, and | | | | review the Funds’ performance. Unless otherwise noted, the address of each Trustee or Officer is the address of the Trust: 680 Washington Blvd., Suite 500, Stamford, CT. 06901. There is no stated term of office for Trustees. Trustees serve until their resignation, retirement or removal in | | accordance with the Trust’s organizational documents and policies adopted by the Board from time to time. The Chairman of the Trustees, President, Treasurer and Secretary of the Trust are elected by the Trustees annually. Other officers hold office at the pleasure of the Trustees. |
Independent Trustees
The following Trustees are not “interested persons” of the Trust within the meaning of the 1940 Act:
| | |
Number of Funds Overseen in Fund Complex | | Name, Age, Principal Occupation(s) During Past 5 Years and Other Directorships Held by Trustee |
| | |
• Trustee since 2012 • Oversees 40 Funds in Fund Complex | | Bruce B. Bingham, 74 Partner, Hamilton Partners (real estate development firm) (1987-Present); Director of The Yacktman Funds, Inc. (2 portfolios) (2000-2012). |
| | |
• Trustee since 2013 • Oversees 44 Funds in Fund Complex • Chairman of the Audit Committee since 2021 | | Kurt A. Keilhacker, 59 Managing Partner, TechFund Europe (2000-Present); Managing Partner, TechFund Capital (1997-Present); Managing Partner, Elementum Ventures (2013-Present); Director, MetricStory, Inc. (2017-Present); Trustee, Wheaton College (2018-Present); Trustee, Gordon College (2001-2016); Board Member, 6wind SA (2002-2019). |
| | |
• Trustee since 2004 • Oversees 40 Funds in Fund Complex | | Steven J. Paggioli, 72 Independent Consultant (2002-Present); Trustee, Professionally Managed Portfolios (28 portfolios); Advisory Board Member, Sustainable Growth Advisors, LP; Independent Director, Muzinich BDC, Inc. (business development company) (2019-Present); Director, The Wadsworth Group; Independent Director, Chase Investment Counsel (2008–2019); Executive Vice President, Secretary and Director, Investment Company Administration, LLC and First Fund Distributors, INC. (1990-2001). |
| | |
• Independent Chairman of the Board of Trustees since 2017 • Chairman of the Governance Committee since 2017 • Trustee since 1999 • Oversees 44 Funds in Fund Complex | | Eric Rakowski, 64 Professor of Law, University of California at Berkeley School of Law (1990-Present); Tax Attorney at Davis Polk & Wardwell and clerked for Judge Harry T. Edwards of the U.S. Court of Appeals for the District of Columbia Circuit and for Justice William J. Brennan Jr. of the U.S. Supreme Court; Trustee of Parnassus Funds (3 portfolios) (2021-Present); Trustee of Parnassus Income Funds (2 portfolios) (2021-Present); Director of Harding, Loevner Funds, Inc. (10 portfolios); Trustee of Third Avenue Trust (3 portfolios) (2002-2019); Trustee of Third Avenue Variable Trust (1 portfolio) (2002-2019). |
| | |
• Trustee since 2013 • Oversees 44 Funds in Fund Complex | | Victoria L. Sassine, 57 Adjunct Professor, Babson College (2007–Present); Director, Board of Directors, PRG Group (2017-Present); CEO, Founder, Scale Smarter Partners, LLC (2018-Present); Adviser, EVOFEM Biosciences (2019-Present); Chairperson of the Board of Directors, Business Management Associates (2018-2019). |
| | |
• Trustee since 2004 • Oversees 40 Funds in Fund Complex | | Thomas R. Schneeweis, 75* Professor Emeritus, University of Massachusetts (2013-Present); President, TRS Associates (1982-Present); Board Member, Chartered Alternative Investment Association (“CAIA”) (2002-Present); Co-Founder and Director, Institute for Global Asset and Risk Management (Education) (2010-Present); Co-Owner, Quantitative Investment Technologies (2014-Present); Co-Owner, Yes Wealth Management (2018-Present); Director, CAIA Foundation (2010-2019); Partner, S Capital Wealth Advisors (2015-2018); Partner, S Capital Management, LLC (2007-2015); President, Alternative Investment Analytics, LLC (formerly Schneeweis Partners, LLC) (2001-2013). |
*Mr. Schneeweis retired from the Board of Trustees of AMG Funds as of December 31, 2022.
Interested Trustee
The Trustee in the following table is an “interested person” of the Trust within the meaning of the 1940 Act.
| | |
Number of Funds Overseen in Fund Complex | | Name, Age, Principal Occupation(s) During Past 5 Years and Other Directorships Held by Trustee |
74
| | |
| | AMG Funds Trustees and Officers (continued) |
| | | |
| | | |
| | |
| | |
• Trustee since 2021 • Oversees 44 Funds in Fund Complex | | Garret W. Weston, 41 Affiliated Managers Group, Inc. (2008-Present): Managing Director, Co-Head of Affiliate Engagement (2021-Present), Senior Vice President, Affiliate Development (2016-2021), Vice President, Office of the CEO (2015-2016), Vice President, New Investments (2012-2015), Senior Associate, New Investments (2008-2012); Associate, Madison Dearborn Partners (2006-2008); Analyst, Merrill Lynch (2004-2006). |
Officers
| | |
Position(s) Held with Fund and Length of Time Served | | Name, Age, Principal Occupation(s) During Past 5 Years |
| | |
• President since 2018 • Principal Executive Officer since 2018 • Chief Executive Officer since 2018 • Chief Operating Officer since 2007 | | Keitha L. Kinne, 64 Chief Operating Officer, AMG Funds LLC (2007-Present); Chief Investment Officer, AMG Funds LLC (2008-Present); President and Principal, AMG Distributors, Inc. (2018-Present); Chief Operating Officer, AMG Distributors, Inc. (2007-Present); President, Chief Executive Officer and Principal Executive Officer, AMG Funds, AMG Funds I, AMG Funds II, AMG Funds III and AMG Funds IV (2018-Present); Chief Operating Officer, AMG Funds, AMG Funds I, AMG Funds II, and AMG Funds III (2007-Present); Chief Operating Officer, AMG Funds IV (2016-Present); Chief Operating Officer and Chief Investment Officer, Aston Asset Management, LLC (2016); President and Principal Executive Officer, AMG Funds, AMG Funds I, AMG Funds II and AMG Funds III (2012-2014); Managing Partner, AMG Funds LLC (2007-2014); President and Principal, AMG Distributors, Inc. (2012-2014); Managing Director, Legg Mason & Co., LLC (2006-2007); Managing Director, Citigroup Asset Management (2004-2006). |
| | |
• Secretary since 2015 • Chief Legal Officer since 2015 | | Mark J. Duggan, 57 Managing Director and Senior Counsel, AMG Funds LLC (2021-Present); Senior Vice President and Senior Counsel, AMG Funds LLC (2015-2021); Secretary and Chief Legal Officer, AMG Funds, AMG Funds I, AMG Funds II, AMG Funds III and AMG Funds IV (2015-Present); Attorney, K&L Gates, LLP (2009-2015). |
| | |
• Chief Financial Officer since 2017 • Treasurer since 2017 • Principal Financial Officer since 2017 • Principal Accounting Officer since 2017 | | Thomas G. Disbrow, 56 Vice President, Mutual Fund Treasurer & CFO, AMG Funds, AMG Funds LLC (2017-Present); Chief Financial Officer, Principal Financial Officer, Treasurer and Principal Accounting Officer, AMG Funds, AMG Funds I, AMG Funds II, AMG Funds III and AMG Funds IV (2017-Present); Managing Director - Global Head of Traditional Funds Product Control, UBS Asset Management (Americas), Inc. (2015-2017); Managing Director - Head of North American Funds Treasury, UBS Asset Management (Americas), Inc. (2011-2015). |
| | |
• Deputy Treasurer since 2017 | | John A. Starace, 52 Vice President, Mutual Fund Accounting, AMG Funds LLC (2021-Present); Director, Mutual Fund Accounting, AMG Funds LLC (2017-2021); Vice President, Deputy Treasurer of Mutual Funds Services, AMG Funds LLC (2014-2017); Deputy Treasurer, AMG Funds, AMG Funds I, AMG Funds II, AMG Funds III and AMG Funds IV (2017-Present); Vice President, Citi Hedge Fund Services (2010-2014); Audit Senior Manager (2005-2010) and Audit Manager (2001-2005), Deloitte & Touche LLP. |
| | |
• Chief Compliance Officer and Sarbanes-Oxley Code of Ethics Compliance Officer since 2019 • Anti-Money Laundering Compliance Officer since 2022 | | Patrick J. Spellman, 48 Vice President, Chief Compliance Officer, AMG Funds LLC (2017-Present); Chief Compliance Officer, AMG Distributors, Inc. (2010-Present); Chief Compliance Officer and Sarbanes-Oxley Code of Ethics Compliance Officer, AMG Funds, AMG Funds I, AMG Funds II, AMG Funds III and AMG Funds IV (2019-Present); Anti-Money Laundering Compliance Officer, AMG Funds, AMG Funds I, AMG Funds II, and AMG Funds III (2014-2019; 2022-Present); Anti-Money Laundering Compliance Officer, AMG Funds IV (2016-2019; 2022-Present); Senior Vice President, Chief Compliance Officer, AMG Funds LLC (2011-2017); Compliance Manager, Legal and Compliance, Affiliated Managers Group, Inc. (2005-2011). |
| | |
• Assistant Secretary since 2016 | | Maureen M. Kerrigan, 37 Vice President, Senior Counsel, AMG Funds LLC (2021-Present); Vice President, Counsel, AMG Funds LLC (2019-2021); Director, Counsel, AMG Funds LLC (2017-2018); Vice President, Counsel, AMG Funds LLC (2015-2017); Assistant Secretary, AMG Funds, AMG Funds I, AMG Funds II, AMG Funds III and AMG Funds IV (2016-Present); Associate, Ropes & Gray LLP (2011-2015); Law Fellow, Massachusetts Appleseed Center for Law and Justice (2010-2011). |
75
THIS PAGE INTENTIONALLY LEFT BLANK
|
|
|
|
|
|
| | | | |
INVESTMENT MANAGER AND ADMINISTRATOR AMG Funds LLC 680 Washington Blvd., Suite 500 Stamford, CT 06901 800.548.4539 DISTRIBUTOR AMG Distributors, Inc. 680 Washington Blvd., Suite 500 Stamford, CT 06901 800.548.4539 SUBADVISER TimesSquare Capital Management, LLC 7 Times Square 42nd Floor New York, NY 10036 CUSTODIAN The Bank of New York Mellon Mutual Funds Custody 6023 Airport Road Oriskany, NY 13424 | | LEGAL COUNSEL Ropes & Gray LLP Prudential Tower, 800 Boylston Street Boston, MA 02199-3600 TRANSFER AGENT BNY Mellon Investment Servicing (US) Inc. Attn: AMG Funds 4400 Computer Drive Westborough, MA 01581 800.548.4539 Effective March 9, 2023, the Transfer Agent’s mailing address will change to the following: BNY Mellon Investment Servicing (US) Inc. AMG Funds Attn: 534426 AIM 154-0520 500 Ross Street Pittsburgh, PA 15262 800.548.4539 | | This report is prepared for the Funds’ shareholders. It is authorized for distribution to prospective investors only when preceded or accompanied by an effective prospectus. To receive a free copy of the prospectus or Statement of Additional Information, which includes additional information about Fund Trustees, please contact us by calling 800.548.4539. Distributed by AMG Distributors, Inc., member FINRA/SIPC. Current net asset values per share for each Fund are available on the Funds’ website at amgfunds.com. A description of the policies and procedures each Fund uses to vote its proxies is available: (i) without charge, upon request, by calling 800.548.4539, or (ii) on the Securities and Exchange Commission’s (SEC) website at sec.gov. For information regarding the Funds’ proxy voting record for the 12-month period ended June 30, call 800.548.4539 or visit the SEC website at sec.gov. The Funds file their complete schedule of portfolio holdings with the SEC for the first and third quarters of each fiscal year as an exhibit to their reports on Form N-PORT. The Funds’ portfolio holdings on Form N-PORT are available on the SEC’s website at sec.gov and the Funds’ website at amgfunds.com. To review a complete list of the Funds’ portfolio holdings, or to view the most recent semiannual report or annual report, please visit amgfunds.com. |
|
|
|
|
|
|
| | | | | | |
BALANCED FUNDS AMG GW&K Global Allocation GW&K Investment Management, LLC EQUITY FUNDS AMG Beutel Goodman International Equity Beutel, Goodman & Company Ltd. AMG Boston Common Global Impact Boston Common Asset Management, LLC AMG Frontier Small Cap Growth Frontier Capital Management Co., LLC AMG GW&K Small Cap Core AMG GW&K Small Cap Value AMG GW&K Small/Mid Cap AMG GW&K Small/Mid Cap Growth AMG GW&K Emerging Markets Equity AMG GW&K Emerging Wealth Equity AMG GW&K International Small Cap GW&K Investment Management, LLC AMG Montrusco Bolton Large Cap Growth Montrusco Bolton Investments, Inc. AMG Renaissance Large Cap Growth The Renaissance Group LLC | | | | AMG River Road Dividend All Cap Value AMG River Road Focused Absolute Value AMG River Road International Value Equity AMG River Road Large Cap Value Select AMG River Road Mid Cap Value AMG River Road Small-Mid Cap Value AMG River Road Small Cap Value River Road Asset Management, LLC AMG TimesSquare Emerging Markets Small Cap AMG TimesSquare Global Small Cap AMG TimesSquare International Small Cap AMG TimesSquare Mid Cap Growth AMG TimesSquare Small Cap Growth TimesSquare Capital Management, LLC AMG Veritas Asia Pacific AMG Veritas China AMG Veritas Global Focus AMG Veritas Global Real Return Veritas Asset Management LLP AMG Yacktman AMG Yacktman Focused AMG Yacktman Global AMG Yacktman Special Opportunities Yacktman Asset Management LP | | FIXED INCOME FUNDS AMG Beutel Goodman Core Plus Bond Beutel, Goodman & Company Ltd. AMG GW&K Core Bond ESG AMG GW&K Enhanced Core Bond ESG AMG GW&K ESG Bond AMG GW&K High Income AMG GW&K Municipal Bond AMG GW&K Municipal Enhanced Yield GW&K Investment Management, LLC |
|
|
|
|
|
|
|
|
|
|
|
|
|
|
|
|
|
|
|
|
|
|
|
|
|
| | | | | | |
| amgfunds.com | | | | | | 123122 AR012 |
| | |
| | ANNUAL REPORT |
| | |
| | | AMG Funds December 31, 2022 |
| | |
| | | 
|
| | |
| | | AMG Yacktman Fund |
| | |
| | | Class I: YACKX |
| | |
| | | AMG Yacktman Focused Fund |
| | |
| | | Class N: YAFFX | Class I: YAFIX |
| | |
| | | AMG Yacktman Global Fund |
| | |
| | | Class N: YFSNX | Class I: YFSIX |
| | |
| | | AMG Yacktman Special Opportunities Fund |
| | |
| | | Class I: YASSX | Class Z: YASLX |
| | |
| | | |
| | |
| | | |
| | | | |
| amgfunds.com | | | | 123122 AR071 |
| | |
| | | AMG Funds Annual Report — December 31, 2022 |
| | | | | | |
| | |
| | | | | | | |
| | | TABLE OF CONTENTS | | PAGE | |
| | | | |
| | | |
| | | LETTER TO SHAREHOLDERS | | | 2 | |
| | | |
| | | ABOUT YOUR FUND’S EXPENSES | | | 3 | |
| | | |
| | | PORTFOLIO MANAGER’S COMMENTS, FUND SNAPSHOTS AND SCHEDULES OF PORTFOLIO INVESTMENTS | | | | |
| | | |
| | | AMG Yacktman Fund | | | 4 | |
| | | |
| | | AMG Yacktman Focused Fund | | | 13 | |
| | | |
| | | AMG Yacktman Global Fund | | | 23 | |
| | | |
| | | AMG Yacktman Special Opportunities Fund | | | 32 | |
| | | |
| | | FINANCIAL STATEMENTS | | | | |
| | | |
| | | Statement of Assets and Liabilities | | | 41 | |
| | | |
| | | Balance sheets, net asset value (NAV) per share computations
and cumulative distributable earnings (loss) | | | | |
| | | |
| | | Statement of Operations | | | 43 | |
| | | |
| | | Detail of sources of income, expenses, and realized and
unrealized gains (losses) during the fiscal year | | | | |
| | | |
| | | Statements of Changes in Net Assets | | | 44 | |
| | | |
| | | Detail of changes in assets for the past two fiscal years | | | | |
| | | |
| | | Financial Highlights | | | 46 | |
| | | |
| | | Historical net asset values per share, distributions, total returns, income
and expense ratios, turnover ratios and net assets | | | | |
| | | |
| | | Notes to Financial Statements | | | 53 | |
| | | |
| | | Accounting and distribution policies, details of agreements and
transactions with Fund management and affiliates, and descriptions of
certain investment risks | | | | |
| | | |
| | | REPORT OF INDEPENDENT REGISTERED PUBLIC ACCOUNTING FIRM | | | 61 | |
| | | |
| | | OTHER INFORMATION | | | 62 | |
| | | |
| | | TRUSTEES AND OFFICERS | | | 63 | |
| | | | | | | |
|
Nothing contained herein is to be considered an offer, sale or solicitation of an offer to buy shares of any series of the AMG Funds Family of Funds. Such offering is made only by prospectus, which includes details as to offering price and other material information. | |
| | |
| | Letter to Shareholders |
Dear Shareholder:
We are pleased to provide this annual report for your investment with AMG Funds. Our foremost goal is to provide investment solutions that help our shareholders successfully achieve their long-term investment goals. We appreciate the privilege of providing you with investment tools.
The past year was a challenging period for investors, as uncertainties about high inflation, tighter financial conditions, and the Russian invasion of Ukraine led to significant volatility. Global equity and bond markets fell in tandem amid sharply higher interest rates and eroding investor confidence as worries of an impending recession lingered most of the year. A global commodity shock caused by the war in Ukraine only made matters worse. The S&P 500® Index slipped into a bear market with the Index falling more than (24)% from its peak earlier in the year. The abrupt shift in markets this year has reset expectations around future growth, as the U.S. Federal Reserve (the Fed) and other global central banks have taken aggressive policy action to bring down inflation. While the outlook is uncertain given recent negative returns across many asset classes, global stock and bond valuations are now far more attractive entering 2023 compared to a year ago.
There was very wide dispersion in S&P 500® Index sector performance. Energy significantly outperformed all other sectors with a gain of 65.72% as the price of oil surged during the period. The defensive-oriented sectors also outperformed, although utilities was the only other sector with a positive return, gaining 1.54%. Consumer staples and health care were slightly negative with returns of (0.62)% and (1.95)%, respectively. High-growth technology and mega cap internet-related companies underperformed during the period, and real estate was impacted by higher interest rates. Communications services fell the most with a (39.93)% return during the year, followed by declines of (37.03)% for consumer discretionary, (28.14)% for information technology and (26.13)% for real estate. Value stocks held up much better than growth stocks as the Russell 1000® Value Index returned (7.54)% compared to the (29.14)% return for the Russell 1000® Growth Index. Small cap stocks struggled as the Russell 2000® Index lost (20.44)%. Outside the U.S., foreign developed markets were negative with a (14.45)% return for the MSCI EAFE Index, however a very strong fourth quarter rally drove international equity returns ahead of their U.S. counterparts for the year.
The 10-year Treasury yield more than doubled during the year, surging to the highest levels since before the Great Financial Crisis. Rapidly rising rates from a very low base led to historic negative performance for bonds as the Bloomberg U.S. Aggregate Bond Index, a broad measure of U.S. bond market performance, lost (13.01)% over the period. Investment-grade corporate bonds underperformed, returning (15.76)% for the year. High yield bonds held up better with a (11.19)% return as measured by the return of the Bloomberg U.S. Corporate High Yield Bond
Index. Municipal bonds were also negative, but outperformed the broader market with a (8.53)% return for the Bloomberg Municipal Bond Index.
AMG Funds provides access to a distinctive array of actively managed return-oriented investment strategies. You can rest assured that under all market conditions our team is focused on delivering excellent investment management services for your benefit. For more information about AMG Funds’ wide range of products and resources, please visit www.amgfunds.com. We thank you for your investment and continued trust in AMG Funds.
Respectfully,
Keitha Kinne
President
AMG Funds
| | | | | | | | | | | | | | |
| | | | | Periods ended | |
| Average Annual Total Returns | | December 31, 2022* | |
| | | | |
| Stocks: | | | | 1 Year | | | 3 Years | | | 5 Years | |
| | | | |
Large Cap | | (S&P 500® Index) | | | (18.11 | )% | | | 7.66 | % | | | 9.42 | % |
| | | | |
Small Cap | | (Russell 2000® Index) | | | (20.44 | )% | | | 3.10 | % | | | 4.13 | % |
| | | | |
International | | (MSCI ACWI ex USA) | | | (16.00 | )% | | | 0.07 | % | | | 0.88 | % |
| | | | |
Bonds: | | | | | | | | | | | | | | |
| | | | |
Investment Grade | | (Bloomberg U.S. Aggregate Bond Index) | | | (13.01 | )% | | | (2.71 | )% | | | 0.02 | % |
| | | | |
High Yield | | (Bloomberg U.S. Corporate High Yield Bond Index) | | | (11.19 | )% | | | 0.05 | % | | | 2.31 | % |
| | | | |
Tax-exempt | | (Bloomberg Municipal Bond Index) | | | (8.53 | )% | | | (0.77 | )% | | | 1.25 | % |
| | | | |
Treasury Bills | | (ICE BofAML U.S. 6-Month Treasury Bill Index) | | | 1.34 | % | | | 0.82 | % | | | 1.39 | % |
*Source: FactSet. Past performance is no guarantee of future results.
2
| | |
| | | About Your Fund’s Expenses |
| | | |
| | | |
| | | | | | | | |
As a shareholder of a Fund, you may incur two types of costs: (1) transaction costs, which may include sales charges (loads) on purchase payments; redemption fees; and exchange fees; and (2) ongoing costs, including management fees; distribution (12b-1) fees; and other Fund expenses. This example is intended to help you understand your ongoing costs (in dollars) of investing in the Fund and to compare these costs with the ongoing costs of investing in other mutual funds. The example is based on $1,000 invested at the beginning of the period and held for the entire period as indicated below. ACTUAL EXPENSES The first line of the following table provides information about the actual account values and | | | | actual expenses. You may use the information in this line, together with the amount you invested, to estimate the expenses that you paid over the period. Simply divide your account value by $1,000 (for example, an $8,600 account value divided by $1,000 = 8.6), then multiply the result by the number in the first line under the heading entitled “Expenses Paid During the Period” to estimate the expenses you paid on your account during this period. HYPOTHETICAL EXAMPLE FOR COMPARISON PURPOSES The second line of the following table provides information about hypothetical account values and hypothetical expenses based on the Fund’s actual expense ratio and an assumed annual rate of return of 5% before expenses, which is not the Fund’s | | | | actual return. The hypothetical account values and expenses may not be used to estimate the actual ending account balance or expenses you paid for the period. You may use this information to compare the ongoing costs of investing in the Fund and other funds by comparing this 5% hypothetical example with the 5% hypothetical examples that appear in the shareholder reports of other funds. Please note that the expenses shown in the table are meant to highlight your ongoing costs only and do not reflect any transactional costs, such as sales charges (loads), redemption fees, or exchange fees. Therefore, the second line of the table is useful in comparing ongoing costs only, and will not help you determine the relative total costs of owning different funds. |
| | | | | | | | |
| | | | | | | | | | |
Six Months Ended
December 31, 2022 | | Expense Ratio for the Period | | Beginning Account Value 07/01/22 | | Ending Account Value 12/31/22 | | | Expenses Paid During the Period* |
AMG Yacktman Fund |
|
Based on Actual Fund Return |
Class I | | 0.70% | | $1,000 | | | $1,061 | | | $3.64 |
|
Based on Hypothetical 5% Annual Return |
Class I | | 0.70% | | $1,000 | | | $1,022 | | | $3.57 |
AMG Yacktman Focused Fund |
|
Based on Actual Fund Return |
Class N | | 1.25% | | $1,000 | | | $1,063 | | | $6.50 |
Class I | | 1.06% | | $1,000 | | | $1,065 | | | $5.52 |
|
Based on Hypothetical 5% Annual Return |
Class N | | 1.25% | | $1,000 | | | $1,019 | | | $6.36 |
Class I | | 1.06% | | $1,000 | | | $1,020 | | | $5.40 |
AMG Yacktman Global Fund |
|
Based on Actual Fund Return |
Class N | | 1.15% | | $1,000 | | | $1,069 | | | $6.00 |
Class I | | 0.93% | | $1,000 | | | $1,070 | | | $4.85 |
|
Based on Hypothetical 5% Annual Return |
Class N | | 1.15% | | $1,000 | | | $1,019 | | | $5.85 |
Class I | | 0.93% | | $1,000 | | | $1,021 | | | $4.74 |
| | | | | | | | | | |
Six Months Ended
December 31, 2022 | | Expense Ratio for the Period | | Beginning
Account
Value
07/01/22 | | Ending
Account
Value
12/31/22 | | | Expenses
Paid
During
the Period* |
AMG Yacktman Special Opportunities Fund |
|
Based on Actual Fund Return |
Class I | | 1.80%† | | $1,000 | | | $1,027 | | | $9.20 |
Class Z | | 1.68%† | | $1,000 | | | $1,028 | | | $8.59 |
|
Based on Hypothetical 5% Annual Return |
Class I | | 1.80%† | | $1,000 | | | $1,016 | | | $9.15 |
Class Z | | 1.68%† | | $1,000 | | | $1,017 | | | $8.54 |
| * | Expenses are equal to the Fund’s annualized expense ratio multiplied by the average account value over the period, multiplied by the number of days in the most recent fiscal half-year (184), then divided by 365. |
| † | Includes a performance fee adjustment amounting to 0.05% of average daily net assets which is not annualized. (See Note 2 of Notes to Financial Statements.) |
3
| | |
| | | AMG Yacktman Fund Portfolio Manager’s Comments (unaudited) |
| | | |
| | | |
| | | | | | | | |
For the 12 months ending December 31, 2022, AMG Yacktman Fund (the “Fund”) Class I shares returned (7.37)%, slightly outperforming the (7.54)% return of the Russell 1000® Value Index (and far better than the (18.11)% return of the S&P 500® Index. 2022 may have been a turning point for investing fundamentals like valuation, leverage ratios, and cash flow to matter more once again following many years of speculative frenzy. Given the huge influence of government stimulus in the last few years, it is difficult to predict normalized earnings for many businesses. In light of this dynamic, we think there can be significant economic and business headwinds that may continue to create a more difficult environment for stocks than in many years prior—maybe even back to the turmoil leading up to the market bottom in the 2008-2009 financial crisis. We have taken advantage of the volatility by adding significantly to our energy weighting on a mid-year pullback. The Fund has by far the highest exposure to energy stocks since its inception. We think the risk/reward in the energy sector has changed dramatically for the better in recent years as cash flows have been directed away from increasing production at all costs and have moved toward dividends, share repurchases and debt reduction. Underinvestment in new supply has continued since the initial downturn in 2015. Adding to this deficit are a number of other factors including the conclusion of emergency releases from the Strategic Petroleum Reserve, limited spare capacity at OPEC+ and productivity declines in U.S. shale basins. On the demand side, China re-opening from COVID-19 lockdowns is a major tailwind. Overall, we think fundamentals could be far stronger than many expect for energy companies in the next several years. In 2022, Yacktman Asset Management LP (“Yacktman”) celebrated its 30th anniversary as a boutique asset manager. We remain focused on delivering strong, risk-adjusted returns over full market cycles. In a world of passive indexing, benchmark hugging, and speculative short-term trading, we think our focus on risk management is a real differentiator. Our Fund’s portfolio has investments in companies that have strong balance sheets (including net cash at several of our top holdings) in a world where many companies leveraged up to repurchase high-priced shares. We have seen several of our portfolio companies utilize this balance sheet strength to substantially increase share repurchase plans or to begin new programs in recent quarters in contrast to companies like JP | | | | Morgan and CarMax, which had to suspend long-running programs despite lower stock prices. Stepping up when others are stepping aside could prove to be of great value in the next few years. We continue to utilize flexibility in our mandate to own some non-U.S. domiciled companies—in many cases, their business and currency exposure are very similar to U.S.-domiciled peers but they trade at steep discounts to U.S. peers. For example, by our calculations, Bolloré SE trades at a discount to just its publicly traded position in Universal Music Group (UMG), an exceptional company which has the #1 position in music content ownership. Although UMG is traded on the Amsterdam stock exchange, its operational headquarters is in the U.S., built years ago as part of Lew Wasserman’s famed Music Corporation of America (MCA) empire. In late 2022, Bolloré completed the sale of its African logistics business, which transformed the balance sheet into a net cash position alongside the UMG stake and other businesses and investments. We think 2023 could be the year for a big re-rating if management continues to simplify. Contributors and Detractors We report the contributors and detractors to give more detail about what contributed to last year’s results, but we remind investors that price movements can be somewhat random during shorter periods of time. Contributors last year included energy and defense stocks. The energy and utilities sectors were the only S&P 500® sectors that were up last year, and defense shares rose due to the war between Russia and Ukraine and generally increased geopolitical tensions. The technology sector, after years of leading performance, declined dramatically, which led many of our tech holdings to underperform in 2022 alongside the sector. Contributors • Canadian Natural Resources, Ltd. – benefited from strong energy prices and free cash flow • Weatherford International PLC – oil services firm that is seeing solid growth and margin expansion post emergence from restructuring • Northrup Grumman Corp – strength in defense sector Detractors • Samsung Electronics Co., Ltd – weakness in memory semiconductor market and technology shares being out of favor; optimism for a recovery in | | | | the memory market later this year, extremely low valuation, and potential for the Korean market to be reclassified from emerging market to developed could help propel the stock in 2023 • Alphabet Inc. – concerns about potential competition from artificial intelligence, a softer advertising market, and general weakness in the technology sector contributed to declines • Cognizant Technology Solutions Corp – IT consulting business that experienced weak growth; recently named new CEO who we think can reinvigorate the company Other securities to note U-Haul Holdings Co. (formerly AMERCO) took steps to simplify its structure, in part due to management’s frustration with the gap between the stock’s market price and management’s perception of value. We think its do-it-yourself moving business—an incredible brand built over multiple decades—is worth most of today’s stock price. In addition, investors get significant upside from the underappreciated self-storage holdings, which today consist of more than 75 million square feet of owned and operated space. Late in the year, the Shoen family, U-Haul’s controlling shareholders, purchased more than $75 million in shares. Associated British Foods PLC (ABF) lagged during the year, with the stock falling to levels that we felt were dramatically disconnected from its underlying value. ABF is a conglomerate which has businesses ranging from ingredient production of baker’s yeast and sugar to food brands like Ovaltine outside of the U.S., Twinings Tea in the U.K., and fast fashion apparel with its Primark retail chain. The company has a net cash balance sheet and owns significant real estate to support its retail operations. Firm update We are excited to welcome Molly Pieroni to Yacktman as President, Partner and a member of the investment team. She brings a strong background in the investment field and as a strategic consultant. We believe she will be a key contributor to driving the business forward over the coming years. Conclusion 2022 was a year of great turbulence in the financial markets but one of positive momentum for many of the Fund’s holdings. We think last year served as a |
4
| | |
| | | AMG Yacktman Fund Portfolio Manager’s Comments (continued) |
| | | |
| | | |
| | | | | | | | |
| good reminder of why it is important to have exposure to a manager like Yacktman, where a truly active investment approach and a keen understanding of risk management are foundational to an experienced team that has been through multiple cycles. While many have moved to indexing | | | | or benchmark hugging investment approaches, we remain independent thinkers focused on the long term and finding bargains that we believe offer strong, risk-adjusted returns over time. As always, we will be patient, objective and diligent in managing the Fund. | | | | The views expressed represent the opinions of Yacktman Asset Management LP as of December 31, 2022, and are not intended as a forecast or guarantee of future results, and are subject to change without notice. |
5
|
AMG Yacktman Fund Portfolio Manager’s Comments (continued) |
| |
| |
CUMULATIVE TOTAL RETURN PERFORMANCE
AMG Yacktman Fund’s cumulative total return is based on the daily change in net asset value (NAV), and assumes that all dividends and distributions were reinvested. The graph compares a hypothetical $10,000 investment made in the AMG Yacktman Fund’s Class I shares on December 31, 2012 to a $10,000 investment made in the Russell 1000® Value Index and the S&P 500® Index for the same time period. The graph and table do not reflect the deduction of taxes that a shareholder would pay on a Fund distribution or redemption of shares. The listed returns for the Fund are net of expenses and the returns for the index exclude expenses. Total returns would have been lower had certain expenses not been reduced.
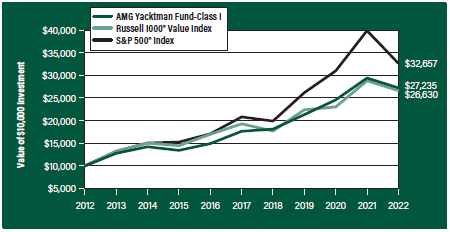
The table below shows the average annual total returns for the AMG Yacktman Fund, the Russell 1000® Value Index and the S&P 500® Index for the same time periods ended December 31, 2022.
| | | | | | | | | | | | |
| | | One | | | Five | | | Ten | |
| Average Annual Total Returns1 | | Year | | | Years | | | Years | |
AMG Yacktman Fund2, 3, 4, 5, 6, 7, 8, 9, 10, 11, 12 | |
| | | |
Class I | | | (7.37 | %) | | | 9.07 | % | | | 10.54 | % |
| | | |
Russell 1000® Value Index13, 15 | | | (7.54 | %) | | | 6.67 | % | | | 10.29 | % |
| | | |
S&P 500® Index14, 15 | | | (18.11 | %) | | | 9.42 | % | | | 12.56 | % |
The performance data shown represents past performance. Past performance is not a guarantee of future results. Current performance may be lower or higher than the performance data quoted. The investment return and principal value of an investment will fluctuate so that an investor’s shares, when redeemed, may be worth more or less than their original cost.
Investors should carefully consider the Fund’s investment objectives, risks, charges and expenses before investing. For performance information through the most recent month end, current net asset values per share for the Fund and other information, please call 800.548.4539 or visit our website at amgfunds.com for a free prospectus. Read it carefully before investing or sending money.
Distributed by AMG Distributors, Inc., member FINRA/SIPC.
| 1 | Total return equals income yield plus share price change and assumes reinvestment of all dividends and capital gain distributions. Returns are net of fees and may reflect offsets of Fund expenses as described in the prospectus. No adjustment has been made for taxes payable by shareholders on their reinvested dividends and capital gain distributions. Returns for periods greater than one year are annualized. The listed returns on the Fund are net of expenses and based on the published NAV as of December 31, 2022. All returns are in U.S. Dollars ($). |
| 2 | From time to time the Fund’s investment manager has waived its fees and/or absorbed Fund expenses, which has resulted in higher returns. |
| 3 | The Fund is subject to the risks associated with investments in debt securities, such as default risk and fluctuations in the perception of the debtor’s ability to pay its creditors. Changing interest rates may adversely affect the value of an investment. An increase in interest rates typically causes the value of bonds and other fixed income securities to fall. |
| 4 | The Fund is subject to risks associated with investments in mid-capitalization companies such as greater price volatility, lower trading volume, and less liquidity than the stocks of larger, more established companies. |
| 5 | The Fund is subject to risks associated with investments in small-capitalization companies, such as erratic earnings patterns, competitive conditions, limited earnings history and a reliance on one or a limited number of products. |
| 6 | The Fund invests in value stocks, which may perform differently from the market as a whole and may be undervalued by the market for a long period of time. |
| 7 | High-yield bonds (also known as “junk bonds”) may be subject to greater levels of interest rate, credit, and liquidity risk than investments in higher rated securities. These securities are considered predominantly speculative with respect to the issuer’s continuing ability to make principal and interest payments. The issuers of the Fund’s holdings may be involved in bankruptcy proceedings, reorganizations, or financial restructurings, and are not as strong financially as higher-rated issuers. |
| 8 | Investments in international securities are subject to certain risks of overseas investing including currency fluctuations and changes in political and economic conditions, which could result in significant market fluctuations. These risks are magnified in emerging markets. |
| 9 | The Fund is subject to the risks associated with investments in emerging markets, such as erratic earnings patterns, economic and political instability, changing exchange controls, limitations on repatriation of foreign capital and changes in local governmental attitudes toward private investment, possibly leading to nationalization or confiscation of investor assets. |
| 10 | Companies that are in similar industry sectors may be similarly affected by particular economic or market events; to the extent the Fund has substantial holdings within a particular sector, the risks associated with that sector increase. |
| 11 | Market prices of investments held by the Fund may fall rapidly or unpredictably due to a variety of |
6
| | |
| | | AMG Yacktman Fund Portfolio Manager’s Comments (continued) |
| | | |
| | | |
| | | | | | | | |
economic or political factors, market conditions, disasters or public health issues, or in response to events that affect particular industries or companies. 12 The Fund is subject to currency risk resulting from fluctuations in exchange rates that may affect the total loss or gain on a non-U.S. Dollar investment when converted back to U.S. Dollars. 13 The Russell 1000® Value Index is a market capitalization weighted index that measures the performance of those Russell 1000® companies with lower price-to-book ratios and lower forecasted | | | | growth values. Unlike the Fund, the Russell 1000® Value Index is unmanaged, is not available for investment and does not incur expenses. 14 The S&P 500® Index is a capitalization-weighted index of 500 stocks. The S&P 500® Index is designed to measure performance of the broad domestic economy through changes in the aggregate market value of 500 stocks representing all major industries. Unlike the Fund, the S&P 500® Index is unmanaged, is not available for investment and does not incur expenses. 15 The Russell 1000® Value and the S&P 500® Index are | | | | provided for illustrative purposes only. We have included the results of such indices to give you a perspective of the historical performance of the U.S. equity market. The Russell 1000® Value Index is a trademark of the London Stock Exchange Group companies. The S&P 500® Index is proprietary data of Standard & Poor’s, a division of McGraw-Hill Companies, Inc. Not FDIC insured, nor bank guaranteed. May lose value. |
7
| | |
| | | AMG Yacktman Fund Fund Snapshots (unaudited) December 31, 2022 |
PORTFOLIO BREAKDOWN
| | |
Sector | | % of
Net Assets |
| | |
Communication Services | | 15.3 |
| | |
Consumer Staples | | 15.3 |
| | |
Energy | | 14.6 |
| | |
Information Technology | | 12.0 |
| | |
Financials | | 10.6 |
| | |
Industrials | | 9.9 |
| | |
Consumer Discretionary | | 5.2 |
| | |
Health Care | | 4.7 |
| | |
Materials | | 1.6 |
| | |
Short-Term Investments | | 10.6 |
| | |
Other Assets, less Liabilities | | 0.2 |
TOP TEN HOLDINGS
| | |
Security Name | | % of
Net Assets |
| | |
Bolloré SE (France) | | 6.8 |
| | |
Canadian Natural Resources, Ltd. (Canada) | | 5.8 |
| | |
Samsung Electronics Co., Ltd., 2.630% (South Korea) | | 5.6 |
| | |
PepsiCo, Inc. | | 3.3 |
| | |
The Procter & Gamble Co. | | 2.8 |
| | |
Microsoft Corp. | | 2.7 |
| | |
The Charles Schwab Corp. | | 2.5 |
| | |
Alphabet, Inc., Class C | | 2.5 |
| | |
Johnson & Johnson | | 2.2 |
| | |
Brenntag SE (Germany) | | 2.2 |
| | | |
| | |
Top Ten as a Group | | 36.4 |
| | |
Because a fund’s strategy may result in multiple investments in particular sectors of the economy, its performance may depend on the performance of those sectors and may fluctuate more widely than investments diversified across more sectors. For additional information on these and other risk considerations, please see the Fund’s prospectus.
Any sectors, industries, or securities discussed should not be perceived as investment recommendations. Mention of a specific security should not be considered a recommendation to buy or solicitation to sell that security. Specific securities mentioned in this report may have been sold from the Fund’s portfolio of investments by the time you receive this report.
8
| | |
| | | AMG Yacktman Fund Fund Snapshots (continued) For the six months ended December 31, 2022 |
NEW EQUITY POSITIONS
| | | | |
| New Purchases | | Current
Shares Held |
| |
ConocoPhillips | | | 890,000 | |
| |
Devon Energy Corp. | | | 1,450,000 | |
| |
Diamondback Energy, Inc. | | | 685,000 | |
| |
EOG Resources, Inc. | | | 780,000 | |
| |
Pioneer Natural Resources Co. | | | 370,000 | |
| |
U-Haul Holding Co., Non-Voting Shares1 | | | 2,970,000 | |
CORPORATE BONDS & NOTES SALES
| | | | | | | | |
| Sales | | Net Principal
Sold | | | Current Principal
Held | |
| | |
Weatherford International, Ltd. (Bermuda), 11.000%, 12/01/24 | | | $11,698,000 | | | | $8,367,000 | |
EQUITY PURCHASES & SALES
| | | | | | | | |
| Purchases | | Net Shares
Purchased | | Current Shares
Held |
| | |
Alphabet, Inc., Class C | | | 2,109,000 | | | | 2,220,000 | |
| | |
The Charles Schwab Corp. | | | 550,000 | | | | 2,375,000 | |
| | |
GrafTech International, Ltd. | | | 2,499,379 | | | | 5,000,000 | |
| | |
U-Haul Holding Co. | | | — | | | | 330,000 | |
| | |
Warner Bros Discovery, Inc. | | | 1,500,000 | | | | 4,400,000 | |
| | | | | | | | |
| Sales | | Net Shares
Sold | | Current Shares
Held |
| | |
Beiersdorf AG, ADR (Germany) | | | 4,000,000 | | | | — | |
| | |
Canadian Natural Resources, Ltd. (Canada) | | | 790,000 | | | | 8,310,000 | |
| | |
The Coca-Cola Co. | | | 1,615,000 | | | | 1,385,000 | |
| | |
FirstCash Holdings, Inc. | | | 460,000 | | | | — | |
| | |
MSC Industrial Direct Co., Inc., Class A | | | 530,000 | | | | — | |
| | |
PepsiCo, Inc. | | | 450,000 | | | | 1,450,000 | |
| | |
Sysco Corp. | | | 1,180,000 | | | | 920,000 | |
| | |
Weatherford International PLC | | | 550,000 | | | | 3,350,000 | |
| | |
Wells Fargo & Co. | | | 940,000 | | | | 2,110,000 | |
1 Purchases and sales due to a corporate action.
9
| | |
| | | AMG Yacktman Fund Schedule of Portfolio Investments December 31, 2022 |
| | | | | | | | |
| | | Shares | | | Value | |
| | |
Common Stocks - 82.2% | | | | | | | | |
| |
Communication Services - 15.3% | | | | | |
| | |
Alphabet, Inc., Class C* | | | 2,220,000 | | | | $196,980,600 | |
| | |
Bolloré SE (France) | | | 97,075,700 | | | | 542,498,137 | |
| | |
Comcast Corp., Class A | | | 1,100,000 | | | | 38,467,000 | |
| | |
Fox Corp., Class A | | | 2,400,000 | | | | 72,888,000 | |
| | |
Fox Corp., Class B | | | 3,100,000 | | | | 88,195,000 | |
| | |
News Corp., Class A | | | 8,900,000 | | | | 161,980,000 | |
| | |
The Walt Disney Co.* | | | 900,000 | | | | 78,192,000 | |
| | |
Warner Bros Discovery, Inc.*,1 | | | 4,400,000 | | | | 41,712,000 | |
| | |
Total Communication Services | | | | | | | 1,220,912,737 | |
| |
Consumer Discretionary - 4.5% | | | | | |
| | |
Booking Holdings, Inc.* | | | 85,000 | | | | 171,298,800 | |
| | |
Continental AG (Germany) | | | 600,000 | | | | 35,768,743 | |
| | |
eBay, Inc. | | | 1,250,000 | | | | 51,837,500 | |
| | |
Hyundai Mobis Co., Ltd. (South Korea) | | | 550,000 | | | | 87,240,092 | |
| | |
Rinnai Corp. (Japan) | | | 180,000 | | | | 13,394,865 | |
| | |
Total Consumer Discretionary | | | | | | | 359,540,000 | |
| |
Consumer Staples - 15.3% | | | | | |
| | |
Associated British Foods PLC (United Kingdom) | | | 7,700,000 | | | | 145,982,526 | |
| | |
The Coca-Cola Co. | | | 1,385,000 | | | | 88,099,850 | |
| | |
Colgate-Palmolive Co. | | | 1,100,000 | | | | 86,669,000 | |
| | |
Hengan International Group Co., Ltd. (China) | | | 6,935,400 | | | | 36,770,611 | |
| | |
Ingredion, Inc. | | | 1,150,000 | | | | 112,619,500 | |
| | |
KT&G Corp. (South Korea) | | | 1,452,810 | | | | 105,005,522 | |
| | |
PepsiCo, Inc. | | | 1,450,000 | | | | 261,957,000 | |
| | |
The Procter & Gamble Co. | | | 1,450,000 | | | | 219,762,000 | |
| | |
Sysco Corp. | | | 920,000 | | | | 70,334,000 | |
| | |
Tyson Foods, Inc., Class A | | | 1,460,000 | | | | 90,885,000 | |
| | |
Total Consumer Staples | | | | | | | 1,218,085,009 | |
| |
Energy - 13.9% | | | | | |
| | |
Canadian Natural Resources, Ltd. (Canada) | | | 8,310,000 | | | | 461,454,300 | |
| | |
ConocoPhillips | | | 890,000 | | | | 105,020,000 | |
| | |
Devon Energy Corp. | | | 1,450,000 | | | | 89,189,500 | |
| | |
Diamondback Energy, Inc. | | | 685,000 | | | | 93,694,300 | |
| | |
EOG Resources, Inc. | | | 780,000 | | | | 101,025,600 | |
| | |
Pioneer Natural Resources Co. | | | 370,000 | | | | 84,504,300 | |
| | |
Weatherford International PLC* | | | 3,350,000 | | | | 170,582,000 | |
| | |
Total Energy | | | | | | | 1,105,470,000 | |
| |
Financials - 10.6% | | | | | |
| | |
The Bank of New York Mellon Corp. | | | 2,300,000 | | | | 104,696,000 | |
| | |
Berkshire Hathaway, Inc., Class B* | | | 340,000 | | | | 105,026,000 | |
| | |
The Charles Schwab Corp. | | | 2,375,000 | | | | 197,742,500 | |
| | |
| | | | | | | | |
| | | | | | | | |
| | | Shares | | | Value | |
| | |
First Hawaiian, Inc.1 | | | 1,530,000 | | | | $39,841,200 | |
| | |
The Goldman Sachs Group, Inc. | | | 130,000 | | | | 44,639,400 | |
| | |
State Street Corp. | | | 1,900,000 | | | | 147,383,000 | |
| | |
U.S. Bancorp | | | 2,800,000 | | | | 122,108,000 | |
| | |
Wells Fargo & Co. | | | 2,110,000 | | | | 87,121,900 | |
| | |
Total Financials | | | | | | | 848,558,000 | |
| |
Health Care - 4.7% | | | | | |
| | |
Elevance Health, Inc. | | | 300,000 | | | | 153,891,000 | |
| | |
Embecta Corp.1 | | | 1,600,000 | | | | 40,464,000 | |
| | |
Johnson & Johnson | | | 1,000,000 | | | | 176,650,000 | |
| | |
Total Health Care | | | | | | | 371,005,000 | |
| |
Industrials - 9.8% | | | | | |
| | |
Armstrong World Industries, Inc. | | | 735,000 | | | | 50,413,650 | |
| | |
Brenntag SE (Germany) | | | 2,700,000 | | | | 172,192,169 | |
| | |
GrafTech International, Ltd. | | | 5,000,000 | | | | 23,800,000 | |
| | |
L3Harris Technologies, Inc. | | | 355,000 | | | | 73,914,550 | |
| | |
Lockheed Martin Corp. | | | 195,000 | | | | 94,865,550 | |
| | |
Northrop Grumman Corp. | | | 225,000 | | | | 122,762,250 | |
| | |
Samsung C&T Corp. (South Korea) | | | 700,000 | | | | 63,063,891 | |
| | |
U-Haul Holding Co.1 | | | 330,000 | | | | 19,862,700 | |
| | |
U-Haul Holding Co., Non-Voting Shares | | | 2,970,000 | | | | 163,290,600 | |
| | |
Total Industrials | | | | | | | 784,165,360 | |
| |
Information Technology - 6.5% | | | | | |
| | |
Cisco Systems, Inc. | | | 800,000 | | | | 38,112,000 | |
| | |
Cognizant Technology Solutions Corp., Class A | | | 2,800,000 | | | | 160,132,000 | |
| | |
Corning, Inc. | | | 1,100,000 | | | | 35,134,000 | |
| | |
Microsoft Corp. | | | 900,000 | | | | 215,838,000 | |
| | |
Oracle Corp. | | | 700,000 | | | | 57,218,000 | |
| | |
Samsung Electronics Co., Ltd. (South Korea) | | | 200,000 | | | | 8,778,649 | |
| | |
Total Information Technology | | | | | | | 515,212,649 | |
| |
Materials - 1.6% | | | | | |
| | |
Reliance Steel & Aluminum Co. | | | 650,000 | | | | 131,586,000 | |
| |
Total Common Stocks | | | | | |
(Cost $4,566,323,286) | | | | | | | 6,554,534,755 | |
| | |
| | | Principal Amount | | | | |
| |
Corporate Bonds and Notes - 0.8% | | | | | |
| | |
Energy - 0.7% | | | | | | | | |
| | |
W&T Offshore, Inc. 9.750%, 11/01/232 | | | $51,359,000 | | | | 50,449,600 | |
| | |
| | | | | | | | |
The accompanying notes are an integral part of these financial statements.
10
| | |
| | | AMG Yacktman Fund Schedule of Portfolio Investments (continued) |
| | | | | | | | |
| | | Principal Amount | | | Value | |
| |
Industrials - 0.1% | | | | | |
| | |
Weatherford International, Ltd. (Bermuda) 11.000%, 12/01/242 | | | $8,367,000 | | | | $8,534,709 | |
| |
Total Corporate Bonds and Notes | | | | | |
(Cost $56,572,378) | | | | | | | 58,984,309 | |
| | |
| | | Shares | | | | |
| |
Preferred Stocks - 6.2% | | | | | |
| |
Consumer Discretionary - 0.7% | | | | | |
| | |
Hyundai Motor Co., 6.340% (South Korea) | | | 400,000 | | | | 23,410,627 | |
| | |
Hyundai Motor Co., 6.400% (South Korea) | | | 523,882 | | | | 30,680,189 | |
| | |
Total Consumer Discretionary | | | | | | | 54,090,816 | |
| |
Information Technology - 5.5% | | | | | |
| | |
Samsung Electronics Co., Ltd., 2.630% (South Korea) | | | 11,050,000 | | | | 442,810,600 | |
| |
Total Preferred Stocks | | | | | |
(Cost $304,566,646) | | | | | | | 496,901,416 | |
| | |
| | | Principal
Amount | | | | |
| |
Short-Term Investments - 10.6% | | | | | |
| |
Joint Repurchase Agreements - 0.1%3 | | | | | |
| | |
Bank of America Securities, Inc., dated 12/30/22, due 01/03/23, 4.300% total to be received $1,307,965 (collateralized by various U.S. Government Agency Obligations, 1.500% - 6.500%, 05/01/37 - 05/01/58, totaling $1,333,487) | | | $1,307,340 | | | | 1,307,340 | |
| | |
Citigroup Global Markets, Inc., dated 12/30/22, due 01/03/23, 4.250% total to be received $274,727 (collateralized by various U.S. Treasuries, 0.000% - 4.500%, 04/11/23 - 10/31/29, totaling $280,089) | | | 274,597 | | | | 274,597 | |
| | |
| | | | | | | | |
| | | | | | | | |
| | | Principal Amount | | | Value | |
| | |
MUFG Securities America, Inc., dated 12/30/22, due 01/03/23, 4.300% total to be received $1,307,965 (collateralized by various U.S. Government Agency Obligations, 2.000% - 5.500%, 08/01/24 - 01/01/53, totaling $1,333,487) | | | $1,307,340 | | | | $1,307,340 | |
| | |
National Bank Financial, dated 12/30/22, due 01/03/23, 4.340% total to be received $1,307,970 (collateralized by various U.S. Treasuries, 0.000% - 4.435%, 01/03/23 - 09/09/49, totaling $1,333,487) | | | 1,307,340 | | | | 1,307,340 | |
| | |
RBC Dominion Securities, Inc., dated 12/30/22, due 01/03/23, 4.300% total to be received $1,307,965 (collateralized by various U.S. Government Agency Obligations, 2.000% - 6.000%, 09/01/24 - 10/20/52, totaling $1,333,487) | | | 1,307,340 | | | | 1,307,340 | |
| |
Total Joint Repurchase Agreements | | | | 5,503,957 | |
| | |
| | | Shares | | | | |
| |
Other Investment Companies - 10.5% | | | | | |
| | |
Dreyfus Institutional Preferred Government Money Market Fund, Institutional Shares, 4.27%4 | | | 114,333,331 | | | | 114,333,331 | |
| | |
JPMorgan U.S. Government Money Market Fund, IM Shares, 4.20%4 | | | 723,498,852 | | | | 723,498,852 | |
| |
Total Other Investment Companies | | | | 837,832,183 | |
| |
Total Short-Term Investments | | | | | |
(Cost $843,336,140) | | | | | | | 843,336,140 | |
| |
Total Investments - 99.8% | | | | | |
(Cost $5,770,798,450) | | | | | | | 7,953,756,620 | |
| |
Other Assets, less Liabilities - 0.2% | | | | 19,284,038 | |
| |
Net Assets - 100.0% | | | | $7,973,040,658 | |
| |
| | | | | |
| * | Non-income producing security. |
| 1 | Some of these securities, amounting to $46,523,866 or 0.6% of net assets, were out on loan to various borrowers and are collateralized by cash and various U.S. Treasury Obligations. See Note 4 of Notes to Financial Statements. |
| 2 | Security exempt from registration under Rule 144A of the Securities Act of 1933. This security may be resold in transactions exempt from registration, normally to qualified institutional buyers. At December 31, 2022, the value of these securities amounted to $58,984,309 or 0.8% of net assets. |
| 3 | Cash collateral received for securities lending activity was invested in these joint repurchase agreements. |
| 4 | Yield shown represents the December 31, 2022, seven day average yield, which refers to the sum of the previous seven days’ dividends paid, expressed as an annual percentage. |
The accompanying notes are an integral part of these financial statements.
11
| | |
| | | AMG Yacktman Fund Schedule of Portfolio Investments (continued) |
The following table summarizes the inputs used to value the Fund’s investments by the fair value hierarchy levels as of December 31, 2022:
| | | | | | | | | | | | | | | | |
| | | Level 1 | | | Level 21 | | | Level 3 | | | Total | |
Investments in Securities | | | | | | | | | | | | | | | | |
| | | | |
Common Stocks | | | | | | | | | | | | | | | | |
| | | | |
Communication Services | | | $678,414,600 | | | | $542,498,137 | | | | — | | | | $1,220,912,737 | |
| | | | |
Consumer Staples | | | 930,326,350 | | | | 287,758,659 | | | | — | | | | 1,218,085,009 | |
| | | | |
Energy | | | 1,105,470,000 | | | | — | | | | — | | | | 1,105,470,000 | |
| | | | |
Financials | | | 848,558,000 | | | | — | | | | — | | | | 848,558,000 | |
| | | | |
Industrials | | | 548,909,300 | | | | 235,256,060 | | | | — | | | | 784,165,360 | |
| | | | |
Information Technology | | | 506,434,000 | | | | 8,778,649 | | | | — | | | | 515,212,649 | |
| | | | |
Health Care | | | 371,005,000 | | | | — | | | | — | | | | 371,005,000 | |
| | | | |
Consumer Discretionary | | | 223,136,300 | | | | 136,403,700 | | | | — | | | | 359,540,000 | |
| | | | |
Materials | | | 131,586,000 | | | | — | | | | — | | | | 131,586,000 | |
| | | | |
Corporate Bonds and Notes† | | | — | | | | 58,984,309 | | | | — | | | | 58,984,309 | |
| | | | |
Preferred Stocks† | | | — | | | | 496,901,416 | | | | — | | | | 496,901,416 | |
| | | | |
Short-Term Investments | | | | | | | | | | | | | | | | |
| | | | |
Joint Repurchase Agreements | | | — | | | | 5,503,957 | | | | — | | | | 5,503,957 | |
| | | | |
Other Investment Companies | | | 837,832,183 | | | | — | | | | — | | | | 837,832,183 | |
| | | | | | | | | | | | | | | | |
| | | | |
Total Investments in Securities | | | $6,181,671,733 | | | | $1,772,084,887 | | | | — | | | | $7,953,756,620 | |
| | | | | | | | | | | | | | | | |
| † | All corporate bonds and notes and preferred stocks held in the Fund are level 2 securities. For a detailed breakout of corporate bonds and notes and preferred stocks by major industry classification, please refer to the Fund’s Schedule of Portfolio Investments. |
| 1 | An external pricing service is used to reflect any impact on security value due to market movements between the time the Fund valued such foreign securities and the earlier closing of foreign markets. |
For the fiscal year ended December 31, 2022, there were no transfers in or out of Level 3.
The country allocation in the Schedule of Portfolio Investments at December 31, 2022, was as follows:
| | |
| Country | | % of Long-Term
Investments |
| |
Bermuda | | 0.1 |
| |
Canada | | 6.5 |
| |
China | | 0.5 |
| |
France | | 7.6 |
| |
Germany | | 2.9 |
| |
Japan | | 0.2 |
| |
South Korea | | 10.7 |
| |
United Kingdom | | 2.1 |
| |
United States | | 69.4 |
| |
| | |
| |
| | | 100.0 |
| | |
The accompanying notes are an integral part of these financial statements.
12
| | |
| | | AMG Yacktman Focused Fund Portfolio Manager’s Comments (unaudited) |
| | | |
| | | |
| | | | | | | | |
For the 12 months ending December 31, 2022, AMG Yacktman Focused Fund (the “Fund”) Class N shares returned (8.06)%, slightly underperforming the (7.54)% return of the Russell 1000® Value Index decline and far better than the (18.11)% return of the S&P 500® Index. 2022 may have been a turning point for investing fundamentals like valuation, leverage ratios, and cash flow to matter more once again following many years of speculative frenzy. Given the huge influence of government stimulus in the last few years, it is difficult to predict normalized earnings for many businesses. In light of this dynamic, we think there can be significant economic and business headwinds that may continue to create a more difficult environment for stocks than in many years prior—maybe even back to the turmoil leading up to the market bottom in the 2008-2009 financial crisis. We have taken advantage of the volatility by adding significantly to our energy weighting on a mid-year pullback. The Fund has by far the highest exposure to energy stocks since its inception. We think the risk/reward in the energy sector has changed dramatically for the better in recent years as cash flows have been directed away from increasing production at all costs and have moved toward dividends, share repurchases and debt reduction. Underinvestment in new supply has continued since the initial downturn in 2015. Adding to this deficit are a number of other factors including the conclusion of emergency releases from the Strategic Petroleum Reserve, limited spare capacity at OPEC+ and productivity declines in U.S. shale basins. On the demand side, China re-opening from COVID-19 lockdowns is a major tailwind. Overall, we think fundamentals could be far stronger than many expect for energy companies in the next several years. In 2022, Yacktman Asset Management LP (“Yacktman”) celebrated its 30th anniversary as a boutique asset manager. We remain focused on delivering strong, risk-adjusted returns over full market cycles. In a world of passive indexing, benchmark hugging, and speculative short-term trading, we think our focus on risk management is a real differentiator. Our Fund’s portfolio has investments in companies that have strong balance sheets (including net cash at several of our top holdings) in a world where many companies leveraged up to repurchase high-priced shares. We have seen several of our portfolio companies utilize this balance sheet strength to substantially increase share repurchase plans or to begin new programs in | | | | recent quarters in contrast to companies like JP Morgan and CarMax which had to suspend long-running programs despite lower stock prices. Stepping up when others are stepping aside could prove to be of great value in the next few years. We continue to utilize flexibility in our mandate to own some non-U.S. domiciled companies—in many cases, their business and currency exposure are very similar to U.S.-domiciled peers but they trade at steep discounts to U.S. peers. For example, by our calculations, Bolloré SE trades at a discount to just its publicly traded position in Universal Music Group (UMG), an exceptional company which has the #1 position in music content ownership. Although UMG is traded on the Amsterdam stock exchange, its operational headquarters is in the U.S., built years ago as part of Lew Wasserman’s famed Music Corporation of America (MCA) empire. In late 2022, Bolloré completed the sale of its African logistics business, which transformed the balance sheet into a net cash position alongside the UMG stake and other businesses and investments. We think 2023 could be the year for a big re-rating if management continues to simplify. Contributors and Detractors We report the contributors and detractors to give more detail about what contributed to last year’s results, but we remind investors that price movements can be somewhat random during shorter periods of time. Contributors last year included energy and defense stocks. The energy and utilities sectors were the only S&P 500® sectors that were up last year, and defense shares rose due to Russia’s invasion of Ukraine and generally increased geopolitical tensions. The technology sector, after years of leading performance, declined dramatically, which led many of our tech holdings to underperform in 2022 alongside the sector. Contributors • Canadian Natural Resources, Ltd. – benefited from strong energy prices and free cash flow • Weatherford International PLC – oil services firm that is seeing solid growth and margin expansion post emergence from restructuring • Northrup Grumman Corp – strength in defense sector Detractors • Samsung Electronics Co., Ltd – weakness in memory semiconductor market and technology shares being out of favor optimism for a recovery in | | | | the memory market later this year, extremely low valuation, and potential for the Korean market to be reclassified from emerging market to developed could help propel the stock in 2023 • Microsoft Corporation – weakness in technology sector and slowing earnings growth caused the stock to decline after many years of exceptionally strong returns • Alphabet Inc. – concerns about potential competition from artificial intelligence, a softer advertising market, and general weakness in the technology sector contributed to declines Other securities to note U-Haul Holdings Co. (formerly AMERCO) took steps to simplify its structure, in part due to management’s frustration with the gap between the stock’s market price and management’s perception of value. We think its do-it-yourself moving business—an incredible brand built over multiple decades—is worth most of today’s stock price. In addition, investors get significant upside from the underappreciated self-storage holdings, which today consist of more than 75 million square feet of owned and operated space. Late in the year, the Shoen family, U-Haul’s controlling shareholders, purchased more than $75 million in shares. Associated British Foods PLC (ABF) lagged during the year, with the stock falling to levels that we felt were dramatically disconnected from its underlying value. ABF is a conglomerate with businesses ranging from ingredient production of baker’s yeast and sugar to food brands like Ovaltine outside of the U.S., Twinings Tea in the U.K., and fast fashion apparel with its Primark retail chain. The company has a net cash balance sheet and owns significant real estate to support its retail operations. Firm update We are excited to welcome Molly Pieroni to Yacktman as President, Partner and a member of the investment team. She brings a strong background in the investment field and as a strategic consultant. We believe she will be a key contributor to driving the business forward over the coming years. Conclusion 2022 was a year of great turbulence in the financial markets but one of positive momentum for many of the Fund’s holdings. We think last year served as a |
13
| | |
| | | AMG Yacktman Focused Fund Portfolio Manager’s Comments (continued) |
| | | |
| | | |
| | | | | | | | |
| good reminder of why it is important to have exposure to a manager like Yacktman, where a truly active investment approach and a keen understanding of risk management are foundational to an experienced team that has been through multiple cycles. While many have moved to indexing | | | | or benchmark hugging investment approaches, we remain independent thinkers focused on the long term and finding bargains that we believe offer strong, risk-adjusted returns over time. As always, we will be patient, objective, and diligent in managing the Fund. | | | | The views expressed represent the opinions of Yacktman Asset Management LP as of December 31, 2022, and are not intended as a forecast or guarantee of future results, and are subject to change without notice. |
14
| | |
| | | AMG Yacktman Focused Fund Portfolio Manager’s Comments (continued) |
| | | |
| | |
CUMULATIVE TOTAL RETURN PERFORMANCE
AMG Yacktman Focused Fund’s cumulative total return is based on the daily change in net asset value (NAV), and assumes that all dividends and distributions were reinvested. The graph compares a hypothetical $10,000 investment made in the AMG Yacktman Focused Fund’s Class N shares on December 31, 2012 to a $10,000 investment made in the Russell 1000® Value Index and the S&P 500® Index for the same time period. The graph and table do not reflect the deduction of taxes that a shareholder would pay on a Fund distribution or redemption of shares. The listed returns for the Fund are net of expenses and the returns for the index exclude expenses. Total returns would have been lower had certain expenses not been reduced.
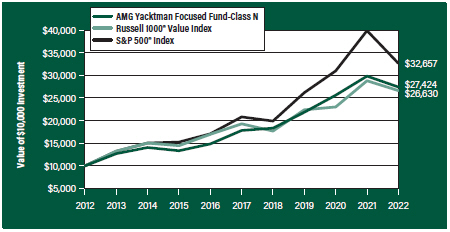
The table below shows the average annual total returns for the AMG Yacktman Focused Fund, the Russell 1000® Value Index and the S&P 500® Index for the same time periods ended December 31, 2022.
| | | | | | |
| | | One | | Five | | Ten |
| Average Annual Total Returns1 | | Year | | Years | | Years |
|
AMG Yacktman Focused Fund2, 3, 4, 5, 6, 7, 8, 9, 10, 11, 12, 13, 14, 15 |
| | | |
Class N | | (8.06%) | | 9.00% | | 10.61% |
| | | |
Class I | | (7.85%) | | 9.21% | | 10.82% |
| | | |
Russell 1000® Value Index16, 18 | | (7.54%) | | 6.67% | | 10.29% |
| | | |
S&P 500® Index17, 18 | | (18.11%) | | 9.42% | | 12.56% |
The performance data shown represents past performance. Past performance is not a guarantee of future results. Current performance may be lower or higher than the performance data quoted. The investment return and principal value of an investment will fluctuate so that an investor’s shares, when redeemed, may be worth more or less than their original cost.
Investors should carefully consider the Fund’s investment objectives, risks, charges and expenses before investing. For performance information through the most recent month end, current net asset values per share for the Fund and other information, please call 800.548.4539 or visit our website at amgfunds.com for a free prospectus. Read it carefully before investing or sending money.
Distributed by AMG Distributors, Inc., member FINRA/SIPC.
| 1 | Total return equals income yield plus share price change and assumes reinvestment of all dividends and capital gain distributions. Returns are net of fees and may reflect offsets of Fund expenses as described in the prospectus. No adjustment has been made for taxes payable by shareholders on their reinvested dividends and capital gain distributions. Returns for periods greater than one year are annualized. The listed returns on the Fund are net of expenses and based on the published NAV as of December 31, 2022. All returns are in U.S. Dollars ($). |
| | |
| | | 2 From time to time the Fund’s investment manager has waived its fees and/or absorbed Fund expenses, which has resulted in higher returns. 3 The Fund may suffer significant losses on assets that it sells short. Unlike the possible loss on a security that is purchased, there is no limit on the amount of loss on an appreciating security that is sold short. 4 The Fund is subject to the risks associated with investments in debt securities, such as default risk and fluctuations in the perception of the debtor’s ability to pay its creditors. Changing interest rates may adversely affect the value of an investment. An increase in interest rates typically causes the value of bonds and other fixed income securities to fall. 5 The Fund may invest in derivatives such as options and futures; the complexity and rapidly changing structure of derivatives markets may increase the possibility of market losses. 6 The Fund is subject to risks associated with investments in mid-capitalization companies such as greater price volatility, lower trading volume, and less liquidity than the stocks of larger, more established companies. 7 The Fund is subject to risks associated with investments in small-capitalization companies, such as erratic earnings patterns, competitive conditions, limited earnings history and a reliance on one or a limited number of products. 8 The Fund invests in value stocks, which may perform differently from the market as a whole and may be undervalued by the market for a long period of time. 9 A greater percentage of the Fund’s holdings may be focused in a smaller number of securities which may place the Fund at greater risk than a more diversified fund. 10 High-yield bonds (also known as “junk bonds”) may be subject to greater levels of interest rate, credit, and liquidity risk than investments in higher rated securities. These securities are considered predominantly speculative with respect to the issuer’s continuing ability to make principal and interest payments. The issuers of the Fund’s holdings may be involved in bankruptcy proceedings, reorganizations, or financial restructurings, and are not as strong financially as higher-rated issuers. |
| | | 11 Investments in international securities are subject to certain risks of overseas investing including currency fluctuations and changes in political and economic conditions, which could result in significant market fluctuations. These risks are magnified in emerging markets. 12 Companies that are in similar industry sectors may be similarly affected by particular economic or |
15
| | |
| | | AMG Yacktman Focused Fund Portfolio Manager’s Comments (continued) |
| | | |
| | | |
| | | | | | | | |
market events; to the extent the Fund has substantial holdings within a particular sector, the risks associated with that sector increase. 13 Market prices of investments held by the Fund may fall rapidly or unpredictably due to a variety of economic or political factors, market conditions, disasters or public health issues, or in response to events that affect particular industries or companies. 14 The Fund is subject to the risks associated with investments in emerging markets, such as erratic earnings patterns, economic and political instability, changing exchange controls, limitations on repatriation of foreign capital and changes in local governmental attitudes toward private investment, possibly leading to nationalization or confiscation of investor assets. | | | | 15 The Fund is subject to currency risk resulting from fluctuations in exchange rates that may affect the total loss or gain on a non-U.S. Dollar investment when converted back to U.S. Dollars. 16 The Russell 1000® Value Index is a market capitalization weighted index that measures the performance of those Russell 1000® companies with lower price-to-book ratios and lower forecasted growth values. Unlike the Fund, the Russell 1000® Value Index is unmanaged, is not available for investment and does not incur expenses. 17 The S&P 500® Index is a capitalization-weighted index of 500 stocks. The S&P 500® Index is designed to measure performance of the broad domestic economy through changes in the aggregate market value of 500 stocks representing all major industries. Unlike the Fund, the S&P 500® | | | | Index is unmanaged, is not available for investment and does not incur expenses. 18 The Russell 1000® Value and the S&P 500® Index are provided for illustrative purposes only. We have included the results of such indices to give you a perspective of the historical performance of the U.S. equity market. The Russell 1000® Value Index is a trademark of the London Stock Exchange Group companies. The S&P 500® Index is proprietary data of Standard & Poor’s, a division of McGraw-Hill Companies, Inc. Not FDIC insured, nor bank guaranteed. May lose value. |
16
| | |
| | | AMG Yacktman Focused Fund Fund Snapshots (unaudited) December 31, 2022 |
PORTFOLIO BREAKDOWN
| | | | | |
| Sector | | % of
Net Assets |
| | |
Communication Services | | | | 16.2 | |
| | |
Consumer Staples | | | | 15.9 | |
| | |
Information Technology | | | | 15.8 | |
| | |
Energy | | | | 15.2 | |
| | |
Industrials | | | | 11.9 | |
| | |
Consumer Discretionary | | | | 6.5 | |
| | |
Financials | | | | 6.4 | |
| | |
Materials | | | | 2.2 | |
| | |
Health Care | | | | 2.1 | |
| | |
Short-Term Investments | | | | 7.1 | |
| | |
Other Assets, less Liabilities1 | | | | 0.7 | |
| 1 | Includes collateral and net unrealized appreciation on options contracts. |
TOP TEN HOLDINGS
| | | | |
| Security Name | | % of
Net Assets | |
| | |
Samsung Electronics Co., Ltd., 2.630% (South Korea) | | | 9.4 | |
| | |
Bolloré SE (France) | | | 8.1 | |
| | |
Canadian Natural Resources, Ltd. (Canada) | | | 6.6 | |
| | |
Microsoft Corp. | | | 3.7 | |
| | |
KT&G Corp. (South Korea) | | | 3.4 | |
| | |
PepsiCo, Inc. | | | 2.8 | |
| | |
The Procter & Gamble Co. | | | 2.6 | |
| | |
Alphabet, Inc., Class C | | | 2.4 | |
| | |
Fox Corp., Class B | | | 2.4 | |
| | |
Associated British Foods PLC (United Kingdom) | | | 2.4 | |
| | | | | |
| | |
Top Ten as a Group | | | 43.8 | |
| | | | |
Because a fund’s strategy may result in multiple investments in particular sectors of the economy, its performance may depend on the performance of those sectors and may fluctuate more widely than investments diversified across more sectors. For additional information on these and other risk considerations, please see the Fund’s prospectus.
Any sectors, industries, or securities discussed should not be perceived as investment recommendations. Mention of a specific security should not be considered a recommendation to buy or solicitation to sell that security. Specific securities mentioned in this report may have been sold from the Fund’s portfolio of investments by the time you receive this report.
17
| | |
| | | AMG Yacktman Focused Fund Fund Snapshots (continued) For the six months ended December 31, 2022 |
| | | | | |
NEW EQUITY POSITIONS |
| |
| New Purchases | | Current
Shares Held |
| |
ConocoPhillips | | 400,000 |
| |
Devon Energy Corp. | | 650,000 |
| |
Diamondback Energy, Inc. | | 305,000 |
| |
EOG Resources, Inc. | | 345,000 |
| |
LG Household & Health Care Co., Ltd., 3.960% (South Korea) | | 118,000 |
| |
Pioneer Natural Resources Co. | | 165,000 |
| |
U-Haul Holding Co., Non-Voting Shares1 | | 1,431,000 |
CORPORATE BONDS & NOTES PURCHASES & SALES
| | |
| New Purchases | | Current
Principal Held |
| |
GrafTech Finance, Inc. 4.625%, 12/15/28 | | $2,400,000 |
WRITTEN OPTION POSITIONS CLOSED & WRITTEN
| | | | |
| Written Option | | Net Contracts
Closed | | Current Contracts
Written |
| | |
eBay, Inc. (Put) | | 8,348 | | 1,152 |
EQUITY PURCHASES & SALES
| | | | | | | | | | |
| Purchases | | Net Shares
Purchased | | Current Shares
Held |
| | |
Alphabet, Inc., Class C2 | | | | 950,000 | | | | | 970,000 | |
| | |
Hyundai Motor Co., 6.340% (South Korea) | | | | 38,620 | | | | | 438,620 | |
| | |
Hyundai Motor Co., 6.400% (South Korea) | | | | 161,380 | | | | | 661,380 | |
| | |
Samsung Electronics Co., Ltd., 2.630% (South Korea) | | | | 1,000,000 | | | | | 8,250,000 | |
| | |
U-Haul Holding Co. | | | | – | | | | | 159,000 | |
| | |
Warner Bros Discovery, Inc. | | | | 585,000 | | | | | 1,900,000 | |
| | | | | | | | | | |
| Sales | | Net Shares
Sold | | Current Shares
Held |
| | |
Ambev S.A. | | | | 5,000,000 | | | | | – | |
| | |
Associated British Foods PLC (United Kingdom) | | | | 1,350,130 | | | | | 4,449,870 | |
| | |
Bolloré SE (France) | | | | 554,977 | | | | | 51,191,551 | |
| | |
Booking Holdings, Inc. | | | | 3,000 | | | | | 32,000 | |
| | |
Canadian Natural Resources, Ltd. (Canada) | | | | 360,000 | | | | | 4,190,000 | |
| | |
The Coca-Cola Co. | | | | 730,000 | | | | | 470,000 | |
| | |
Cognizant Technology Solutions Corp., Class A | | | | 185,800 | | | | | 1,300,000 | |
| | |
Continental AG | | | | 250,000 | | | | | – | |
| | |
First Hawaiian, Inc. | | | | 250,000 | | | | | – | |
| | |
Hengan International Group Co., Ltd. | | | | 5,872,300 | | | | | – | |
| | |
Johnson & Johnson | | | | 10,000 | | | | | 420,000 | |
| | |
KT&G Corp. (South Korea) | | | | 140,000 | | | | | 1,660,000 | |
| | |
Microsoft Corp. | | | | 20,000 | | | | | 550,000 | |
| | |
Mitsuboshi Belting, Ltd. | | | | 91,535 | | | | | – | |
| | |
MSC Industrial Direct Co., Inc., Class A | | | | 220,000 | | | | | – | |
| | |
PepsiCo, Inc. | | | | 650,000 | | | | | 550,000 | |
| | |
The Procter & Gamble Co. | | | | 20,000 | | | | | 610,000 | |
| | |
Rinnai Corp. | | | | 110,000 | | | | | – | |
| | |
Samsung C&T Corp. (South Korea) | | | | 40,000 | | | | | 460,000 | |
| | |
Societe BIC, S.A. | | | | 300,000 | | | | | – | |
| | |
Sysco Corp. | | | | 900,000 | | | | | – | |
| | |
Weatherford International PLC | | | | 250,000 | | | | | 1,450,000 | |
| | |
Wells Fargo & Co. | | | | 500,000 | | | | | – | |
| | 1 | Purchases and sales due to a corporate action. |
| | 2 | Net share increase was due to a stock split, which offset the sale of securities during the period. |
18
| | |
| | | AMG Yacktman Focused Fund Schedule of Portfolio Investments December 31, 2022 |
| | | | | | | | |
| | | Shares | | | Value | |
| | |
Common Stocks - 77.9% | | | | | | | | |
| |
Communication Services - 16.2% | | | | | |
| | |
Alphabet, Inc., Class C* | | | 970,000 | | | | $86,068,100 | |
| | |
Bolloré SE (France) | | | 51,191,551 | | | | 286,079,019 | |
| | |
Fox Corp., Class B | | | 3,000,000 | | | | 85,350,000 | |
| | |
News Corp., Class A | | | 3,685,000 | | | | 67,067,000 | |
| | |
News Corp., Class B1 | | | 200,000 | | | | 3,688,000 | |
| | |
The Walt Disney Co.* | | | 300,000 | | | | 26,064,000 | |
| | |
Warner Bros Discovery, Inc.* | | | 1,900,000 | | | | 18,012,000 | |
| | |
Total Communication Services | | | | | | | 572,328,119 | |
| |
Consumer Discretionary - 4.7% | | | | | |
| | |
Booking Holdings, Inc.* | | | 32,000 | | | | 64,488,960 | |
| | |
eBay, Inc. | | | 834,800 | | | | 34,619,156 | |
| | |
Hyundai Home Shopping Network | | | | | | | | |
| | |
Corp. (South Korea)2 | | | 600,000 | | | | 25,657,438 | |
| | |
Hyundai Mobis Co., Ltd. (South Korea) | | | 260,000 | | | | 41,240,771 | |
| | |
Total Consumer Discretionary | | | | | | | 166,006,325 | |
| |
Consumer Staples - 14.8% | | | | | |
| | |
Associated British Foods PLC (United Kingdom) | | | 4,449,870 | | | | 84,364,060 | |
| | |
The Coca-Cola Co. | | | 470,000 | | | | 29,896,700 | |
| | |
Ingredion, Inc. | | | 540,000 | | | | 52,882,200 | |
| | |
KT&G Corp. (South Korea) | | | 1,660,000 | | | | 119,980,704 | |
| | |
PepsiCo, Inc. | | | 550,000 | | | | 99,363,000 | |
| | |
The Procter & Gamble Co. | | | 610,000 | | | | 92,451,600 | |
| | |
Tyson Foods, Inc., Class A | | | 700,000 | | | | 43,575,000 | |
| | |
Total Consumer Staples | | | | | | | 522,513,264 | |
| |
Energy - 14.6% | | | | | |
| | |
Canadian Natural Resources, Ltd. (Canada) | | | 4,190,000 | | | | 232,670,700 | |
| | |
ConocoPhillips | | | 400,000 | | | | 47,200,000 | |
| | |
Devon Energy Corp. | | | 650,000 | | | | 39,981,500 | |
| | |
Diamondback Energy, Inc. | | | 305,000 | | | | 41,717,900 | |
| | |
EOG Resources, Inc. | | | 345,000 | | | | 44,684,400 | |
| | |
Pioneer Natural Resources Co. | | | 165,000 | | | | 37,684,350 | |
| | |
Weatherford International PLC* | | | 1,450,000 | | | | 73,834,000 | |
| | |
Total Energy | | | | | | | 517,772,850 | |
| |
Financials - 6.4% | | | | | |
| | |
The Bank of New York Mellon Corp. | | | 650,000 | | | | 29,588,000 | |
| | |
Berkshire Hathaway, Inc., Class B* | | | 100,000 | | | | 30,890,000 | |
| | |
The Charles Schwab Corp. | | | 855,000 | | | | 71,187,300 | |
| | |
State Street Corp. | | | 800,000 | | | | 62,056,000 | |
| | |
U.S. Bancorp | | | 750,000 | | | | 32,707,500 | |
| | |
Total Financials | | | | | | | 226,428,800 | |
| | | | | | | | |
| | | Shares | | | Value | |
| |
Health Care - 2.1% | | | | | |
Johnson & Johnson | | | 420,000 | | | | $74,193,000 | |
| |
Industrials - 10.5% | | | | | |
| | |
Brenntag SE (Germany) | | | 1,250,000 | | | | 79,718,596 | |
| | |
L3Harris Technologies, Inc. | | | 170,000 | | | | 35,395,700 | |
| | |
Lockheed Martin Corp. | | | 95,000 | | | | 46,216,550 | |
| | |
Northrop Grumman Corp. | | | 110,000 | | | | 60,017,100 | |
| | |
Samsung C&T Corp. (South Korea) | | | 460,000 | | | | 41,441,986 | |
| | |
U-Haul Holding Co.1 | | | 159,000 | | | | 9,570,210 | |
| | |
U-Haul Holding Co., Non-Voting Shares | | | 1,431,000 | | | | 78,676,380 | |
| | |
Yuasa Trading Co., Ltd. (Japan) | | | 800,000 | | | | 21,961,118 | |
| | |
Total Industrials | | | | | | | 372,997,640 | |
| |
Information Technology - 6.4% | | | | | |
| | |
Cognizant Technology Solutions Corp., Class A | | | 1,300,000 | | | | 74,347,000 | |
| | |
Microsoft Corp. | | | 550,000 | | | | 131,901,000 | |
| | |
Oracle Corp. | | | 250,000 | | | | 20,435,000 | |
| | |
Total Information Technology | | | | | | | 226,683,000 | |
| |
Materials - 2.2% | | | | | |
| | |
Nihon Parkerizing Co., Ltd. (Japan) | | | 1,868,100 | | | | 13,243,315 | |
| | |
Reliance Steel & Aluminum Co. | | | 310,000 | | | | 62,756,400 | |
| | |
Total Materials | | | | | | | 75,999,715 | |
| |
Total Common Stocks | | | | | |
(Cost $2,088,772,262) | | | | | | | 2,754,922,713 | |
| | |
| | | Principal
Amount | | | | |
Corporate Bonds and Notes - 2.0% | | | | | |
| |
Energy - 0.6% | | | | | |
| | |
W&T Offshore, Inc. | | | | | | | | |
9.750%, 11/01/233 | | | $22,824,000 | | | | 22,419,862 | |
| |
Industrials - 1.4% | | | | | |
| | |
GrafTech Finance, Inc. | | | | | | | | |
4.625%, 12/15/283 | | | 2,400,000 | | | | 1,970,934 | |
| | |
Microsoft Corp. | | | | | | | | |
2.000%, 08/08/23 | | | 11,500,000 | | | | 11,317,829 | |
2.375%, 05/01/23 | | | 19,000,000 | | | | 18,864,264 | |
| | |
PepsiCo, Inc. | | | | | | | | |
0.750%, 05/01/23 | | | 14,623,000 | | | | 14,433,718 | |
| | |
Weatherford International, Ltd. (Bermuda) | | | | | | | | |
11.000%, 12/01/243 | | | 3,762,000 | | | | 3,837,406 | |
| | |
Total Industrials | | | | | | | 50,424,151 | |
| |
Total Corporate Bonds and Notes | | | | | |
(Cost $72,378,869) | | | | | | | 72,844,013 | |
The accompanying notes are an integral part of these financial statements.
19
| | |
| | | AMG Yacktman Focused Fund Schedule of Portfolio Investments (continued) |
| | | | | | | | |
| | | Shares | | | Value | |
| | |
Preferred Stocks - 12.3% | | | | | | | | |
| |
Consumer Discretionary - 1.8% | | | | | |
| | |
Hyundai Motor Co., 6.340% (South Korea) | | | 438,620 | | | | $25,670,923 | |
| | |
Hyundai Motor Co., 6.400% (South Korea) | | | 661,380 | | | | 38,732,508 | |
| |
Total Consumer Discretionary | | | | 64,403,431 | |
| |
Consumer Staples - 1.1% | | | | | |
| | |
Amorepacific Corp., 2.080% (South Korea) | | | 250,000 | | | | 9,588,447 | |
| | |
LG Household & Health Care Co., Ltd., 3.960% (South Korea) | | | 118,000 | | | | 29,568,028 | |
| |
Total Consumer Staples | | | | 39,156,475 | |
| |
Information Technology - 9.4% | | | | | |
| | |
Samsung Electronics Co., Ltd., 2.630% (South Korea) | | | 8,250,000 | | | | 330,605,199 | |
| |
Total Preferred Stocks | | | | | |
(Cost $322,001,629) | | | | | | | 434,165,105 | |
| | |
| | | Principal
Amount | | | | |
| |
Short-Term Investments - 7.1% | | | | | |
| |
Joint Repurchase Agreements - 0.2%4 | | | | | |
| | |
Bank of America Securities, Inc., dated 12/30/22, due 01/03/23, 4.300% total to be received $1,872,574 (collateralized by various U.S. Government Agency Obligations, 1.500% - 6.500%, 05/01/37 - 05/01/58, totaling $1,909,114) | | | $1,871,680 | | | | 1,871,680 | |
| | |
Citigroup Global Markets, Inc., dated 12/30/22, due 01/03/23, 4.250% total to be received $393,432 (collateralized by various U.S. Treasuries, 0.000% - 4.500%, 04/11/23 - 10/31/29, totaling $401,111) | | | 393,246 | | | | 393,246 | |
| | |
Deutsche Bank Securities, Inc., dated 12/30/22, due 01/03/23, 4.290% total to be received $1,872,572 (collateralized by various U.S. Government Agency Obligations, 1.500% - 7.500%, 02/01/24 - 01/01/57, totaling $1,909,114) | | | 1,871,680 | | | | 1,871,680 | |
| | | | | | | | |
| | | Principal
Amount | | | Value | |
| | |
National Bank Financial, dated 12/30/22, due 01/03/23, 4.340% total to be received $1,872,583 (collateralized by various U.S. Treasuries, 0.000% - 4.435%, 01/03/23 - 09/09/49, totaling $1,909,114) | | | $1,871,680 | | | | $1,871,680 | |
| | |
RBC Dominion Securities, Inc., dated 12/30/22, due 01/03/23, 4.300% total to be received $1,872,574 (collateralized by various U.S. Government Agency Obligations, 2.000% - 6.000%, 09/01/24 - 10/20/52, totaling $1,909,114) | | | 1,871,680 | | | | 1,871,680 | |
| |
Total Joint Repurchase Agreements | | | | 7,879,966 | |
| | |
| | | Shares | | | | |
| |
Other Investment Companies - 6.9% | | | | | |
| | |
Dreyfus Institutional Preferred Government Money Market Fund, Institutional Shares, 4.27%5 | | | 105,675,046 | | | | 105,675,046 | |
| | |
JPMorgan U.S. Government Money Market Fund, IM Shares, 4.20%5 | | | 137,763,333 | | | | 137,763,333 | |
| |
Total Other Investment Companies | | | | 243,438,379 | |
| |
Total Short-Term Investments | | | | | |
(Cost $251,318,345) | | | | | | | 251,318,345 | |
| |
Total Investments - 99.3% | | | | | |
(Cost $2,734,471,105) | | | | | | | 3,513,250,176 | |
| |
Derivatives - (0.0)%6 | | | | (685,440 | ) |
| |
Other Assets, less Liabilities - 0.7% | | | | 23,836,784 | |
| |
Net Assets - 100.0% | | | | $3,536,401,520 | |
| * | Non-income producing security. |
| 1 | Some of these securities, amounting to $11,289,472 or 0.3% of net assets, were out on loan to various borrowers and are collateralized by cash and various U.S. Treasury Obligations. See Note 4 of Notes to Financial Statements. |
| 2 | Affiliated issuer. See summary of affiliated investment transaction for details. |
| 3 | Security exempt from registration under Rule 144A of the Securities Act of 1933. This security may be resold in transactions exempt from registration, normally to qualified institutional buyers. At December 31, 2022, the value of these securities amounted to $28,228,202 or 0.8% of net assets. |
| 4 | Cash collateral received for securities lending activity was invested in these joint repurchase agreements. |
| 5 | Yield shown represents the December 31, 2022, seven day average yield, which refers to the sum of the previous seven days’ dividends paid, expressed as an annual percentage. |
| 6 | Includes Exchange Traded Written Options Contracts. Please refer to the Open Exchange Traded Written Options Contracts tables for the details. |
The accompanying notes are an integral part of these financial statements.
20
| | |
| | | AMG Yacktman Focused Fund Schedule of Portfolio Investments (continued) |
The following schedule shows the value of affiliated investments at December 31, 2022.
| | | | | | | | | | | | | | |
Affiliated Issuers | | Number
of shares | | Purchases | | Sales | | Net realized
gain (loss) for
the period | | Net change in
appreciation
(depreciation) | | Amount of
Dividends or
Interest | | Value |
| | | | | | | |
Hyundai Home Shopping Network Corp. | | 600,000 | | $1,940,086 | | – | | – | | $(6,280,273) | | $1,227,212 | | $25,657,438 |
Open Exchange Traded Written Options
| | | | | | | | | | | | | | |
| Description | | Strike Price | | Expiration Date | | Number of
Contracts | | | Notional
Amount | | Premium | | Value |
| | | | | | |
eBay, Inc. (Put) | | 47.50 | | 01/20/23 | | | 1,152 | | | $5,472,000 | | $607,711 | | $(685,440) |
The following table summarizes the inputs used to value the Fund’s investments by the fair value hierarchy levels as of December 31, 2022:
| | | | | | | | | | | | | | | | |
| | | Level 1 | | | Level 21 | | Level 3 | | | Total |
| | | | |
Investments in Securities | | | | | | | | | | | | | | | | |
| | | | |
Common Stocks | | | | | | | | | | | | | | | | |
| | | | |
Communication Services | | | $286,249,100 | | | | $286,079,019 | | | | — | | | | $572,328,119 | |
| | | | |
Consumer Staples | | | 318,168,500 | | | | 204,344,764 | | | | — | | | | 522,513,264 | |
| | | | |
Energy | | | 517,772,850 | | | | — | | | | — | | | | 517,772,850 | |
| | | | |
Industrials | | | 229,875,940 | | | | 143,121,700 | | | | — | | | | 372,997,640 | |
| | | | |
Information Technology | | | 226,683,000 | | | | — | | | | — | | | | 226,683,000 | |
| | | | |
Financials | | | 226,428,800 | | | | — | | | | — | | | | 226,428,800 | |
| | | | |
Consumer Discretionary | | | 99,108,116 | | | | 66,898,209 | | | | — | | | | 166,006,325 | |
| | | | |
Materials | | | 62,756,400 | | | | 13,243,315 | | | | — | | | | 75,999,715 | |
| | | | |
Health Care | | | 74,193,000 | | | | — | | | | — | | | | 74,193,000 | |
| | | | |
Corporate Bonds and Notes† | | | — | | | | 72,844,013 | | | | — | | | | 72,844,013 | |
| | | | |
Preferred Stocks† | | | — | | | | 434,165,105 | | | | — | | | | 434,165,105 | |
| | | | |
Short-Term Investments | | | | | | | | | | | | | | | | |
| | | | |
Joint Repurchase Agreements | | | — | | | | 7,879,966 | | | | — | | | | 7,879,966 | |
| | | | |
Other Investment Companies | | | 243,438,379 | | | | — | | | | — | | | | 243,438,379 | |
| | | | | | | | | | | | | | | | |
| | | | |
Total Investments in Securities | | | $2,284,674,085 | | | | $1,228,576,091 | | | | — | | | | $3,513,250,176 | |
| | | | | | | | | | | | | | | | |
| | | | |
Financial Derivative Instruments – Liabilities | | | | | | | | | | | | | | | | |
| | | | |
Equity Written Options | | | — | | | | $(685,440 | ) | | | — | | | | $(685,440 | ) |
| | | | | | | | | | | | | | | | |
| | | | |
Total Financial Derivative Instruments | | | — | | | | $(685,440 | ) | | | — | | | | $(685,440 | ) |
| | | | | | | | | | | | | | | | |
| | † | All corporate bonds and notes and preferred stocks held in the Fund are level 2 securities. For a detailed breakout of corporate bonds and notes and preferred stocks by major industry classification, please refer to the Fund’s Schedule of Portfolio Investments. |
| | 1 | An external pricing service is used to reflect any impact on security value due to market movements between the time the Fund valued such foreign securities and the earlier closing of foreign markets. |
For the fiscal year ended December 31, 2022, there were no transfers in or out of Level 3.
The accompanying notes are an integral part of these financial statements.
21
| | |
| | | AMG Yacktman Focused Fund Schedule of Portfolio Investments (continued) |
The following schedule shows the value of derivative instruments at December 31, 2022:
| | | | | | | | | | |
| | | Asset Derivatives | | Liability Derivatives | |
| | | | |
Derivatives not accounted
for as hedging instruments | | Statement of Assets and
Liabilities Location | | Fair Value | | Statement of Assets and Liabilities Location | | Fair Value | |
Equity contracts | | — | | — | | Written options | | | $685,440 | |
For the fiscal year ended December 31, 2022, the effect of derivative instruments on the Statement of Operations for the Fund and the amount of realized gain/loss and unrealized appreciation/depreciation on derivatives recognized in income was as follows:
| | | | | | | | | | |
| | | Realized Gain/(Loss) | | Change in Unrealized Appreciation/Depreciation | |
| | | | |
Derivatives not accounted for as hedging instruments | | Statement of Operations Location | | Realized Gain/(Loss) | | Statement of Operations Location | | Change in Unrealized Appreciation/ Depreciation | |
Equity contracts | | — | | — | | Net change in unrealized appreciation/
depreciation on written options | | | $(77,729) | |
The country allocation in the Schedule of Portfolio Investments at December 31, 2022, was as follows:
| | |
| Country | | % of Long-Term
Investments |
| |
Bermuda | | 0.1 |
| |
Canada | | 7.1 |
| |
France | | 8.8 |
| |
Germany | | 2.4 |
| |
Japan | | 1.1 |
| |
South Korea | | 20.3 |
| |
United Kingdom | | 2.6 |
| |
United States | | 57.6 |
| | |
| |
| | | 100.0 |
| | |
The accompanying notes are an integral part of these financial statements.
22
| | |
| | | AMG Yacktman Global Fund Portfolio Manager’s Comments (unaudited) |
| | | | | | | | |
For the 12 months ending December 31, 2022, AMG Yacktman Global Fund (the “Fund”) Class N shares returned (9.31)%, outperforming the (18.14)% return of the MSCI World Index. 2022 may have been a turning point for investing fundamentals like valuation, leverage ratios, and cash flow to matter more once again following many years of speculative frenzy. Given the huge influence of government stimulus in the last few years, it is difficult to predict normalized earnings for many businesses. In light of this dynamic, we think there can be significant economic and business headwinds that may continue to create a more difficult environment for stocks than in many years prior—maybe even back to the turmoil leading up to the market bottom in the 2008-2009 financial crisis. We have taken advantage of the volatility by adding significantly to our energy weighting on a mid-year pullback. The Fund has by far the highest exposure to energy stocks since its inception. We think the risk/reward in the energy sector has changed dramatically for the better in recent years as cash flows have been directed away from increasing production at all costs and have moved toward dividends, share repurchases, and debt reduction. Underinvestment in new supply has continued since the initial downturn in 2015. Adding to this deficit are a number of other factors including the conclusion of emergency releases from the Strategic Petroleum Reserve, limited spare capacity at OPEC+ and productivity declines in U.S. shale basins. On the demand side, China re-opening from COVID-19 lockdowns is a major tailwind. Overall, we think fundamentals could be far stronger than many expect for energy companies in the next several years. In 2022, Yacktman Asset Management LP (“Yacktman”) celebrated its 30th anniversary as a boutique asset manager. We remain focused on delivering strong, risk-adjusted returns over full market cycles. In a world of passive indexing, benchmark hugging, and speculative short-term trading, we think our focus on risk management is a real differentiator. Our Fund’s portfolio has investments in companies that have strong balance sheets (including net cash at several of our top holdings) in a world where many companies leveraged up to repurchase high-priced shares. We have seen several of our portfolio companies utilize this balance sheet strength to substantially increase share repurchase plans or begin new programs in recent quarters, in contrast to companies like JP Morgan and CarMax which had to suspend | | | | long-running programs despite lower stock prices. Stepping up when others are stepping aside could prove to be of great value in the next few years. We continue to utilize flexibility in our mandate to own some non-U.S. domiciled companies—in many cases, their business and currency exposure are very similar to U.S.-domiciled peers but they trade at steep discounts to U.S. peers. For example, by our calculations, Bolloré SE trades at a discount to just its publicly traded position in Universal Music Group (UMG), an exceptional company which has the #1 position in music content ownership. Although UMG is traded on the Amsterdam stock exchange, its operational headquarters is in the U.S., built years ago as part of Lew Wasserman’s famed Music Corporation of America (MCA) empire. In late 2022, Bolloré completed the sale of its African logistics business, which transformed the balance sheet into a net cash position alongside the UMG stake and other businesses and investments. We think 2023 could be the year for a big re-rating if management continues to simplify. Contributors and Detractors We report the contributors and detractors to give more detail about what contributed to last year’s results, but we remind investors that price movements can be somewhat random during shorter periods of time. Contributors last year included energy and defense stocks. The energy and utilities sectors were the only S&P 500® sectors that were up last year, and defense shares rose due to the war between Russia and Ukraine and generally increased geopolitical tensions. The technology sector, after years of leading performance, declined dramatically, which led many of our tech holdings to underperform in 2022 alongside the sector. Contributors • Canadian Natural Resources, Ltd. – benefited from strong energy prices and free cash flow • Total Energy Services Inc. – strength in oilfield services • KT&G Corp. – very inexpensive Korean ginseng and tobacco company that is the target of an activist campaign to unlock value Detractors • Samsung Electronics Co., Ltd. – weakness in memory semiconductor market and technology shares being out of favor; optimism for a recovery in | | | | the memory market later this year, extremely low valuation, and potential for the Korean market to be reclassified from emerging market to developed could help propel the stock in 2023 • HI-LEX Corp – very inexpensive stock experiencing short-term business weakness • Alphabet, Inc. – concerns about potential competition from artificial intelligence, a softer advertising market and general weakness in the technology sector contributed to declines Other securities to note U-Haul Holdings Co. (formerly AMERCO) took steps to simplify its structure, in part due to management’s frustration with the gap between the stock’s market price and management’s perception of value. We think its do-it-yourself moving business—an incredible brand built over multiple decades—is worth most of today’s stock price. In addition, investors get significant upside from the underappreciated self-storage holdings, which today consist of more than 75 million square feet of owned and operated space. Late in the year, the Shoen family, U-Haul’s controlling shareholders, purchased more than $75 million in shares. Associated British Foods PLC (ABF) lagged during the year, with the stock falling to levels that we felt were dramatically disconnected from its underlying value. ABF is a conglomerate that has businesses ranging from ingredient production of baker’s yeast and sugar to food brands like Ovaltine outside of the U.S., Twinings Tea in the U.K., and fast fashion apparel with its Primark retail chain. The company has a net cash balance sheet and owns significant real estate to support its retail operations. Firm update We are excited to welcome Molly Pieroni to Yacktman as President, Partner and a member of the investment team. She brings a strong background in the investment field and as a strategic consultant. We believe she will be a key contributor to driving the business forward over the coming years. Conclusion 2022 was a year of great turbulence in the financial markets but one of positive momentum for many of the Fund’s holdings. We think last year served as a good reminder why it is important to have exposure to a manager like Yacktman, where a truly active investment approach and a keen understanding of risk management are foundational to an experienced team that has been through multiple cycles. While |
23
| | |
| | | AMG Yacktman Global Fund Portfolio Manager’s Comments (continued) |
| | | | | | | | |
| many have moved to indexing or benchmark hugging investment approaches, we remain independent thinkers focused on the long term and finding bargains that we believe offer strong, risk-adjusted returns over time. As always, we will be patient, objective and diligent in managing the Fund. | | | | The views expressed represent the opinions of Yacktman Asset Management LP as of December 31, 2022, and are not intended as a forecast or guarantee of future results, and are subject to change without notice. | | | | |
24
| | |
| | | AMG Yacktman Global Fund Portfolio Manager’s Comments (continued) |
CUMULATIVE TOTAL RETURN PERFORMANCE
AMG Yacktman Global Fund’s cumulative total return is based on the daily change in net asset value (NAV), and assumes that all dividends and distributions were reinvested. The graph compares a hypothetical $10,000 investment made in the AMG Yacktman Global Fund’s Class N shares on January 30, 2017 (inception date), to a $10,000 investment made in the MSCI World Index for the same time period. The graph and table do not reflect the deduction of taxes that a shareholder would pay on a Fund distribution or redemption of shares. The listed returns for the Fund are net of expenses and the returns for the index exclude expenses. Total returns would have been lower had certain expenses not been reduced.
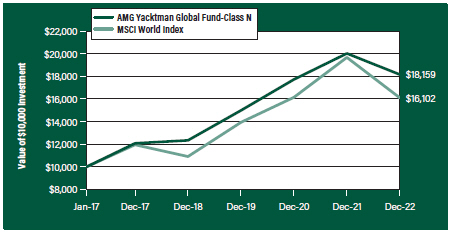
The table below shows the average annual total returns for the AMG Yacktman Global Fund and the MSCI World Index for the same time periods ended December 31, 2022.
| | | | | | | | | | | | | | | | | | | | |
| | | One | | Five | | Since | | Inception |
| Average Annual Total Returns1 | | Year | | Years | | Inception | | Date |
|
AMG Yacktman Global Fund2, 3, 4, 5, 6, 7, 8, 9, 10, 11, 12, 13, 14, 15 | |
| | | | |
Class N | | | | (9.31 | %) | | | | 8.50 | % | | | | 10.61 | % | | | | 01/30/17 | |
| | | | |
Class I | | | | (9.06 | %) | | | | 8.59 | % | | | | 10.69 | % | | | | 01/30/17 | |
| | | | |
MSCI World Index16 | | | | (18.14 | %) | | | | 6.14 | % | | | | 8.38 | % | | | | 01/30/17 | † |
The performance data shown represents past performance. Past performance is not a guarantee of future results. Current performance may be lower or higher than the performance data quoted. The investment return and principal value of an investment will fluctuate so that an investor’s shares, when redeemed, may be worth more or less than their original cost.
Investors should carefully consider the Fund’s investment objectives, risks, charges and expenses before investing. For performance information through the most recent month end, current net asset values per share for the Fund and other information, please call 800.548.4539 or visit our website at amgfunds.com for a free prospectus. Read it carefully before investing or sending money.
Distributed by AMG Distributors, Inc., member FINRA/SIPC.
| † | Date reflects the inception date of the Fund, not the index. |
| 1 | Total return equals income yield plus share price change and assumes reinvestment of all dividends and capital gain distributions. Returns are net of fees and may reflect offsets of Fund expenses as described in the prospectus. No adjustment has been made for taxes payable by shareholders on their reinvested dividends and capital gain distributions. Returns for periods greater than one year are annualized. The listed returns on the Fund are net of expenses and based on the published NAV as of December 31, 2022. All returns are in U.S. Dollars ($). |
|
2 From time to time the Fund’s investment manager has waived its fees and/or absorbed Fund expenses, which has resulted in higher returns. |
| |
3 The Fund may suffer significant losses on assets that it sells short. Unlike the possible loss on a security that is purchased, there is no limit on the amount of loss on an appreciating security that is sold short. |
| |
4 The Fund is subject to the risks associated with investments in debt securities, such as default risk and fluctuations in the perception of the debtor’s ability to pay its creditors. Changing interest rates may adversely affect the value of an investment. An increase in interest rates typically causes the value of bonds and other fixed income securities to fall. |
| |
5 The Fund invests in value stocks, which may perform differently from the market as a whole and may be undervalued by the market for a long period of time. |
| |
6 The Fund may invest in derivatives such as options and futures; the complexity and rapidly changing structure of derivatives markets may increase the possibility of market losses. |
| |
7 A greater percentage of the Fund’s holdings may be focused in a smaller number of securities which may place the Fund at greater risk than a more diversified fund. |
| |
8 High-yield bonds (also known as “junk bonds”) may be subject to greater levels of interest rate, credit, and liquidity risk than investments in higher rated securities. These securities are considered predominantly speculative with respect to the issuer’s continuing ability to make principal and interest payments. The issuers of the Fund’s holdings may be involved in bankruptcy proceedings, reorganizations, or financial restructurings, and are not as strong financially as higher-rated issuers. |
| |
9 Investments in international securities are subject to certain risks of overseas investing including currency fluctuations and changes in political and economic conditions, which could result in significant market fluctuations. These risks are magnified in emerging markets. |
| |
10 The Fund is subject to risks associated with investments in mid-capitalization companies such as greater price volatility, lower trading volume, and less liquidity than the stocks of larger, more established companies. |
| |
11 Companies that are in similar industry sectors may be similarly affected by particular economic or market events; to the extent the Fund has substantial holdings within a particular sector, the risks associated with that sector increase. |
| |
12 The Fund is subject to risks associated with investments in small-capitalization companies, |
25
| | |
| | | AMG Yacktman Global Fund Portfolio Manager’s Comments (continued) |
| | | | |
such as erratic earnings patterns, competitive conditions, limited earnings history and a reliance on one or a limited number of products. 13 Market prices of investments held by the Fund may fall rapidly or unpredictably due to a variety of economic or political factors, market conditions, disasters or public health issues, or in response to events that affect particular industries or companies. 14 The Fund is subject to the risks associated with investments in emerging markets, such as erratic earnings patterns, economic and political instability, changing exchange controls, limitations on repatriation of foreign capital and changes in local governmental attitudes toward private | | investment, possibly leading to nationalization or confiscation of investor assets. 15 The Fund is subject to currency risk resulting from fluctuations in exchange rates that may affect the total loss or gain on a non-U.S. Dollar investment when converted back to U.S. Dollars. 16 The MSCI World Index is a free float-adjusted market capitalization weighted index that is designed to measure the equity market performance of developed markets. Please go to msci.com for most current list of countries represented by the index. Unlike the Fund, the MSCI World Index is unmanaged, is not available for investment and does not incur expenses. | | All MSCI data is provided “as is”. The products described herein are not sponsored or endorsed and have not been reviewed or passed on by MSCI. In no event shall MSCI, its affiliates or any MSCI data provider have any liability of any kind in connection with the MSCI data or the products described herein. Copying or redistributing the MSCI data is strictly prohibited. Not FDIC insured, nor bank guaranteed. May lose value. |
26
| | |
| | | AMG Yacktman Global Fund Fund Snapshots (unaudited) December 31, 2022 |
PORTFOLIO BREAKDOWN
| | | | |
| Sector | | % of
Net Assets | |
| | |
Industrials | | | 21.8 | |
| | |
Communication Services | | | 17.2 | |
| | |
Information Technology | | | 13.4 | |
| | |
Consumer Discretionary | | | 13.2 | |
| | |
Energy | | | 12.1 | |
| | |
Consumer Staples | | | 9.9 | |
| | |
Materials | | | 3.3 | |
| | |
Financials | | | 2.7 | |
| | |
Health Care | | | 1.1 | |
| | |
Short-Term Investments | | | 4.4 | |
| | |
Other Assets, less Liabilities | | | 0.9 | |
TOP TEN HOLDINGS
| | | | |
| Security Name | | % of
Net Assets | |
| | |
Bolloré SE (France) | | | 10.2 | |
| | |
Samsung Electronics Co., Ltd., 2.630% (South Korea) | | | 8.2 | |
| | |
Canadian Natural Resources, Ltd. (Canada) | | | 6.3 | |
| | |
Samsung C&T Corp. (South Korea) | | | 5.1 | |
| | |
KT&G Corp. (South Korea) | | | 4.8 | |
| | |
Cie de L’Odet SE (France) | | | 4.4 | |
| | |
Total Energy Services, Inc. (Canada) | | | 4.0 | |
| | |
HI-LEX Corp. (Japan) | | | 3.8 | |
| | |
Ocean Wilsons Holdings, Ltd. (Bermuda) | | | 3.0 | |
| | |
Fox Corp., Class B | | | 2.5 | |
| | | | | |
| | |
Top Ten as a Group | | | 52.3 | |
| | | | |
Because a fund’s strategy may result in multiple investments in particular sectors of the economy, its performance may depend on the performance of those sectors and may fluctuate more widely than investments diversified across more sectors. For additional information on these and other risk considerations, please see the Fund’s prospectus.
Any sectors, industries, or securities discussed should not be perceived as investment recommendations. Mention of a specific security should not be considered a recommendation to buy or solicitation to sell that security. Specific securities mentioned in this report may have been sold from the Fund’s portfolio of investments by the time you receive this report.
27
| | |
| | | AMG Yacktman Global Fund Fund Snapshots (continued) For the six months ended December 31, 2022 |
| | | | | | | | |
NEW EQUITY POSITIONS | |
| | |
| New Purchases | | | | Current
Shares Held |
| |
Amplify Energy Corp. | | | | 115,000 | |
| |
U-Haul Holding Co., Non-Voting Shares1 | | | | 54,000 | |
EQUITY PURCHASES & SALES | |
| Purchases | | Net Shares
Purchased | | Current Shares
Held |
| | |
Alphabet, Inc., Class C1 | | | 19,000 | | | | 20,000 | |
| | |
U-Haul Holding Co. | | | — | | | | 6,000 | |
| | |
| Sales | | Net Shares
Sold | | Current Shares
Held |
| | |
The Bank of New York Mellon Corp. | | | 10,000 | | | | — | |
| | |
Bolloré SE (France) | | | 110,000 | | | | 2,750,000 | |
| | |
INFOvine Co., Ltd. (South Korea) | | | 20,000 | | | | 20,000 | |
| | |
Ingredion, Inc. | | | 8,500 | | | | — | |
| | |
Johnson & Johnson | | | 2,000 | | | | 8,000 | |
| | |
KT&G Corp. (South Korea) | | | 20,000 | | | | 100,000 | |
| | |
Mitsuboshi Belting, Ltd. | | | 2,965 | | | | — | |
| | |
MSC Industrial Direct Co., Inc., Class A | | | 7,000 | | | | — | |
| | |
Oracle Corp. | | | 6,000 | | | | — | |
| | |
PepsiCo, Inc. | | | 4,000 | | | | 9,000 | |
| | |
The Procter & Gamble Co. | | | 3,000 | | | | 11,000 | |
| | |
State Street Corp. | | | 5,000 | | | | 20,000 | |
| | |
Sysco Corp. | | | 10,000 | | | | — | |
| | |
U.S. Bancorp | | | 13,000 | | | | — | |
| 1 | Purchases and sales due to a corporate action. |
28
| | |
| | | AMG Yacktman Global Fund Schedule of Portfolio Investments December 31, 2022 |
| | | | | | | | |
| | |
| | | Shares | | | Value | |
| | |
Common Stocks - 82.7% | | | | | | | | |
| |
Communication Services - 17.2% | | | | | |
| | |
Alphabet, Inc., Class C* | | | 20,000 | | | | $1,774,600 | |
| | |
Bolloré SE (France) | | | 2,750,000 | | | | 15,368,107 | |
| | |
Fox Corp., Class B | | | 130,000 | | | | 3,698,500 | |
| | |
News Corp., Class A | | | 130,000 | | | | 2,366,000 | |
| | |
Reading International, Inc., Class A* | | | 320,000 | | | | 886,400 | |
| | |
Tohokushinsha Film Corp. (Japan) | | | 200,000 | | | | 1,018,358 | |
| | |
The Walt Disney Co.* | | | 10,000 | | | | 868,800 | |
| | |
Total Communication Services | | | | | | | 25,980,765 | |
| |
Consumer Discretionary - 11.1% | | | | | |
| | |
Booking Holdings, Inc.* | | | 1,000 | | | | 2,015,280 | |
| | |
Car Mate Manufacturing Co., Ltd. (Japan) | | | 52,500 | | | | 338,426 | |
| | |
Continental AG (Germany) | | | 10,000 | | | | 596,145 | |
| | |
Daewon San Up Co., Ltd. (South Korea) | | | 96,817 | | | | 407,264 | |
| | |
Dong Ah Tire & Rubber Co., Ltd. (South Korea) | | | 100,000 | | | | 897,815 | |
| | |
HI-LEX Corp. (Japan) | | | 700,000 | | | | 5,737,851 | |
| | |
Hyundai Home Shopping Network Corp. (South Korea) | | | 70,000 | | | | 2,993,368 | |
| | |
Hyundai Mobis Co., Ltd. (South Korea) | | | 20,000 | | | | 3,172,367 | |
| | |
Rinnai Corp. (Japan) | | | 8,000 | | | | 595,327 | |
| | |
Total Consumer Discretionary | | | | | | | 16,753,843 | |
| |
Consumer Staples - 8.9% | | | | | |
| | |
Associated British Foods PLC (United Kingdom) | | | 125,000 | | | | 2,369,846 | |
| | |
Hengan International Group Co., Ltd. (China) | | | 37,000 | | | | 196,169 | |
| | |
KT&G Corp. (South Korea) | | | 100,000 | | | | 7,227,753 | |
| | |
Naked Wines PLC (United Kingdom)* | | | 256,424 | | | | 388,536 | |
| | |
PepsiCo, Inc. | | | 9,000 | | | | 1,625,940 | |
| | |
The Procter & Gamble Co. | | | 11,000 | | | | 1,667,160 | |
| | |
Total Consumer Staples | | | | | | | 13,475,404 | |
| |
Energy - 11.6% | | | | | |
| | |
Amplify Energy Corp.* | | | 115,000 | | | | 1,010,850 | |
| | |
Canadian Natural Resources, Ltd. (Canada) | | | 170,000 | | | | 9,440,100 | |
| | |
Total Energy Services, Inc. (Canada) | | | 950,000 | | | | 6,040,990 | |
| | |
Weatherford International PLC* | | | 20,000 | | | | 1,018,400 | |
| | |
Total Energy | | | | | | | 17,510,340 | |
| |
Financials - 2.7% | | | | | |
| | |
The Charles Schwab Corp. | | | 30,000 | | | | 2,497,800 | |
| | |
State Street Corp. | | | 20,000 | | | | 1,551,400 | |
| | |
Total Financials | | | | | | | 4,049,200 | |
| |
Health Care - 1.1% | | | | | |
| | |
Johnson & Johnson | | | 8,000 | | | | 1,413,200 | |
| | | | | | | | |
| | |
| | | Shares | | | Value | |
| | |
Kissei Pharmaceutical Co., Ltd. (Japan) | | | 9,400 | | | | $183,665 | |
| | |
Total Health Care | | | | | | | 1,596,865 | |
| |
Industrials - 21.7% | | | | | |
| | |
Brenntag SE (Germany) | | | 40,000 | | | | 2,550,995 | |
| | |
CB Industrial Product Holding Bhd (Malaysia) | | | 10,500,000 | | | | 2,622,020 | |
| | |
Cie de L’Odet SE (France) | | | 4,500 | | | | 6,682,265 | |
| | |
Komelon Corp. (South Korea) | | | 80,000 | | | | 630,814 | |
| | |
Ocean Wilsons Holdings, Ltd. (Bermuda) | | | 400,000 | | | | 4,497,294 | |
| | |
Parker Corp. (Japan) | | | 150,000 | | | | 600,534 | |
| | |
Rix Corp. (Japan) | | | 60,000 | | | | 971,709 | |
| | |
Sam Yung Trading Co., Ltd. (South Korea) | | | 60,000 | | | | 592,244 | |
| | |
Samsung C&T Corp. (South Korea) | | | 86,000 | | | | 7,747,850 | |
| | |
U-Haul Holding Co. | | | 6,000 | | | | 361,140 | |
| | |
U-Haul Holding Co., Non-Voting Shares | | | 54,000 | | | | 2,968,920 | |
| | |
Yuasa Trading Co., Ltd. (Japan) | | | 90,000 | | | | 2,470,626 | |
| | |
Total Industrials | | | | | | | 32,696,411 | |
| |
Information Technology - 5.1% | | | | | |
| | |
CAC Holdings Corp. (Japan) | | | 240,000 | | | | 2,606,675 | |
| | |
Cognizant Technology Solutions Corp., Class A | | | 25,000 | | | | 1,429,750 | |
| | |
Hochiki Corp. (Japan) | | | 160,000 | | | | 1,697,395 | |
| | |
INFOvine Co., Ltd. (South Korea) | | | 20,000 | | | | 339,675 | |
| | |
Microsoft Corp. | | | 7,000 | | | | 1,678,740 | |
| | |
Total Information Technology | | | | | | | 7,752,235 | |
| |
Materials - 3.3% | | | | | |
| | |
KISCO Holdings Co., Ltd. (South Korea)* | | | 70,000 | | | | 869,720 | |
| | |
Kohsoku Corp. (Japan) | | | 90,000 | | | | 1,179,675 | |
| | |
Nihon Parkerizing Co., Ltd. (Japan) | | | 250,000 | | | | 1,772,297 | |
| | |
The Pack Corp. (Japan) | | | 60,000 | | | | 1,095,341 | |
| | |
Total Materials | | | | | | | 4,917,033 | |
| | |
Total Common Stocks
(Cost $112,764,434) | | | | | | | 124,732,096 | |
| | |
| | | Principal Amount | | | | |
| |
Corporate Bonds and Notes - 0.6% | | | | | |
| |
Energy - 0.5% | | | | | |
| | |
W&T Offshore, Inc. | | | | | | | | |
9.750%, 11/01/231 | | | $806,000 | | | | 791,728 | |
| |
Industrials - 0.1% | | | | | |
| | |
Weatherford International, Ltd. (Bermuda) | | | | | | | | |
11.000%, 12/01/241 | | | 86,000 | | | | 87,724 | |
| | |
Total Corporate Bonds and Notes
(Cost $864,928) | | | | | | | 879,452 | |
The accompanying notes are an integral part of these financial statements.
29
| | |
| | | AMG Yacktman Global Fund Schedule of Portfolio Investments (continued) |
| | | | | | | | |
| | |
| | | Shares | | | Value | |
| | |
Preferred Stocks - 11.4% | | | | | | | | |
| |
Consumer Discretionary - 2.1% | | | | | |
| | |
Hyundai Motor Co., 6.400% (South Korea) | | | 55,000 | | | | $3,220,974 | |
| |
Consumer Staples - 1.0% | | | | | |
| | |
Amorepacific Corp., 2.080% (South Korea) | | | 25,000 | | | | 958,845 | |
| | |
LG Household & Health Care Co., Ltd., 3.960% (South Korea) | | | 2,100 | | | | 526,211 | |
| | |
Total Consumer Staples | | | | | | | 1,485,056 | |
| |
Information Technology - 8.3% | | | | | |
| | |
Samsung Electronics Co., Ltd., 2.630% (South Korea) | | | 310,000 | | | | 12,422,740 | |
| | |
Total Preferred Stocks
(Cost $20,461,922) | | | | | | | 17,128,770 | |
| | | | | | | | |
| | |
| | | Shares | | | Value | |
| | |
Short-Term Investments - 4.4% | | | | | | | | |
| |
Other Investment Companies - 4.4% | | | | | |
| | |
Dreyfus Government Cash Management Fund, Institutional Shares, 4.19%2 | | | 2,670,304 | | | | $2,670,304 | |
| | |
Dreyfus Institutional Preferred Government Money Market Fund, Institutional Shares, 4.27%2 | | | 4,005,455 | | | | 4,005,455 | |
| | |
Total Short-Term Investments
(Cost $6,675,759) | | | | | | | 6,675,759 | |
| | |
Total Investments - 99.1%
(Cost $140,767,043) | | | | | | | 149,416,077 | |
| |
Other Assets, less Liabilities - 0.9% | | | | 1,428,793 | |
| | |
Net Assets - 100.0% | | | | | | | $150,844,870 | |
| * | Non-income producing security. |
| 1 | Security exempt from registration under Rule 144A of the Securities Act of 1933. This security may be resold in transactions exempt from registration, normally to qualified institutional buyers. At December 31, 2022, the value of these securities amounted to $879,452 or 0.6% of net assets. |
| 2 | Yield shown represents the December 31, 2022, seven day average yield, which refers to the sum of the previous seven days’ dividends paid, expressed as an annual percentage. |
The following table summarizes the inputs used to value the Fund’s investments by the fair value hierarchy levels as of December 31, 2022:
| | | | | | | | | | | | | | | | |
| | | Level 1 | | | Level 21 | | | Level 3 | | | Total | |
Investments in Securities | | | | | | | | | | | | | | | | |
| | | | |
Common Stocks | | | | | | | | | | | | | | | | |
| | | | |
Industrials | | | $10,449,374 | | | | $22,247,037 | | | | — | | | | $32,696,411 | |
| | | | |
Communication Services | | | 9,594,300 | | | | 16,386,465 | | | | — | | | | 25,980,765 | |
| | | | |
Energy | | | 17,510,340 | | | | — | | | | — | | | | 17,510,340 | |
| | | | |
Consumer Discretionary | | | 2,353,706 | | | | 14,400,137 | | | | — | | | | 16,753,843 | |
| | | | |
Consumer Staples | | | 3,293,100 | | | | 10,182,304 | | | | — | | | | 13,475,404 | |
| | | | |
Information Technology | | | 3,108,490 | | | | 4,643,745 | | | | — | | | | 7,752,235 | |
| | | | |
Materials | | | — | | | | 4,917,033 | | | | — | | | | 4,917,033 | |
| | | | |
Financials | | | 4,049,200 | | | | — | | | | — | | | | 4,049,200 | |
| | | | |
Health Care | | | 1,413,200 | | | | 183,665 | | | | — | | | | 1,596,865 | |
| | | | |
Corporate Bonds and Notes† | | | — | | | | 879,452 | | | | — | | | | 879,452 | |
| | | | |
Preferred Stocks† | | | — | | | | 17,128,770 | | | | — | | | | 17,128,770 | |
| | | | |
Short-Term Investments | | | | | | | | | | | | | | | | |
| | | | |
Other Investment Companies | | | 6,675,759 | | | | — | | | | — | | | | 6,675,759 | |
| | | | | | | | | | | | | | | | |
Total Investments in Securities | | | $58,447,469 | | | | $90,968,608 | | | | — | | | | $149,416,077 | |
| | | | | | | | | | | | | | | | |
| | † | All corporate bonds and notes and preferred stocks held in the Fund are level 2 securities. For a detailed breakout of corporate bonds and notes and preferred stocks by major industry classification, please refer to the Fund’s Schedule of Portfolio Investments. |
| | 1 | An external pricing service is used to reflect any impact on security value due to market movements between the time the Fund valued such foreign securities and the earlier closing of foreign markets. |
For the fiscal year ended December 31, 2022, there were no transfers in or out of Level 3.
The accompanying notes are an integral part of these financial statements.
30
| | |
| | | AMG Yacktman Global Fund Schedule of Portfolio Investments (continued) |
The country allocation in the Schedule of Portfolio Investments at December 31, 2022, was as follows:
| | |
| Country | | % of Long-Term Investments |
| |
Bermuda | | 3.2 |
| |
Canada | | 10.9 |
| |
China | | 0.1 |
| |
France | | 15.5 |
| |
Germany | | 2.2 |
| |
Japan | | 14.2 |
| |
Malaysia | | 1.8 |
| |
South Korea | | 29.4 |
| |
United Kingdom | | 1.9 |
| |
United States | | 20.8 |
| | |
| |
| | | 100.0 |
| | |
The accompanying notes are an integral part of these financial statements.
31
| | |
| | | AMG Yacktman Special Opportunities Fund Portfolio Manager's Comments (unaudited) |
| | | | | | | | |
For the twelve months ending December 31, 2022, AMG Yacktman Special Opportunities Fund (the “Fund”) Class Z shares returned (13.57)%, ahead of the (18.44)% decline in the MSCI ACWI All Cap Index. Markets staged a relatively sharp rally from October lows, but ended with a whimper, bucking the usual seasonal uplift into year-end. Pull up a price chart for the market in 2022 and the volatility is plain to see, with sharp rallies and steep pullbacks. The overall trend though, was down. The sharp selloff in bonds due to rising interest rates combined with falling stock prices meant there were few places to hide. It was one of the worst years for the traditional 60/40 equity to bond portfolio in the past century. Add persistently high inflation, and real returns were even worse. While equity markets have fallen, a pullback from high prices does not automatically mean the risk/reward has improved. Many of the risks mentioned in our previous letters do not appear to be “fixed”. Valuations on expected corporate profits remain elevated and will likely face downside pressures as margins squeeze lower. Bargain securities are still rare in our core universe (we avoid the money-losing, speculative corners of the market which have crashed the hardest to date). Our view remains that it is a market for caution, not greed. Rather than getting too caught up in the macro forecasting game, our plan for 2023 remains the same: we will invest on a bottom-up basis in individual securities offering solid risk-adjusted returns. Portfolio Review The Fund ended the year with a 50.4% weighting in the top ten holdings as a percentage of net assets. We believe this concentration is a key differentiator relative to our peers and the market. One notable change in the Fund’s top ten holdings was Trecora Resources (“Trecora”), which was exited after being acquired earlier in the year. Somewhat unusually, Trecora was the only M&A transaction in 2022 following a handful of deals in 2021. Buyouts like these have provided more meaningful performance contributions in prior years. The other factor that has weighed on results is the strength of the U.S. Dollar (“USD”). The Fund is overweight in small-cap international stocks by a considerable margin relative to the benchmark index. As foreign currencies weaken, the translated value of those small-cap international holdings into USD falls. Any reversion here may be a significant tailwind to Fund performance. It was also an above-average year for trading activity, as we responded to fund flows in a challenging and volatile trading environment. While | | | | slightly elevated this year, the Fund’s average annual turnover over the years has been around 30%, which strikes us as a good balance between long-held investments (we still own several securities that were in the Fund at inception eight and a half years ago) and new positions. We exited several marginal positions and ended the year with 47 holdings in the Fund. Our cash position is 7.4%, providing plenty of capital to deploy into new ideas. We anticipate volatile markets will produce opportunities to invest this capital at good returns in the coming year. Value Investing in Down Markets We recently re-read an essay from Paul Graham, the venture capitalist and co-founder of Y Combinator. Written in 2005 and entitled What You'll Wish You'd Known, Graham writes with advice to high school students. One section of the piece discusses the importance of optionality in figuring out long-term goals. He writes, “Flying a glider is a good metaphor here. Because a glider doesn't have an engine, you can't fly into the wind without losing a lot of altitude. If you let yourself get far downwind of good places to land, your options narrow uncomfortably. As a rule, you want to stay upwind.” Staying upwind seems like an apt metaphor for value investing as well. A cheap purchase price provides a lot of “landing spots” that can result in a satisfactory rate of return, even in the face of underwhelming business performance, disappointing management execution, or poorly timed economic downturns. It is foundational to our investment process that paying a sensible price in relation to business value provides a margin of safety against unknowns and mistakes. On the opposite end, many growth investors, especially in the past few years, purchased businesses at sky-high multiples without any margin of error. Those companies at those prices HAD to be wildly, even historically, successful to justify the valuation. They were downwind, committed to a course with no ability to adjust. Many crashed and burned in 2022 without a proven business model or path to profitability. They simply ran out of options. The largest gains (albeit usually temporary) often occur during roaring bull markets when everything seems to be flying up at once. Everyone appears to be winning. In bull markets, “buying a piece of a business based on expected cash flow” becomes “buying on the hope of selling a stock at an even more inflated price.” That worked for a while—even a long while in recent years. This mood permeated | | | | much of the last decade or more (with a sharp, but only brief, interruption from COVID), culminating in a blow-off in speculative behavior in 2021. As we enter 2023, investor mood has changed. As sharp as 2022’s -18% market decline has been, even more turmoil was under the surface, with many speculative story stocks down multiples more than that. Even mega-cap stocks with “real” business models saw sharp corrections from previously high valuations despite generally good results. Why do we focus on value investing? One reason is that the future is uncertain. That’s uncomfortable, and that discomfort is even more acute during drawdowns. Who knew that a global pandemic would temporarily shut down the world? Who believed that oil prices could go negative? What shock will it be next? Our goal is to invest in companies that can withstand the inevitable surprises and still earn a satisfactory outcome. Valuation is a huge part of that calculus. We believe the Fund’s portfolio–full of above-average businesses with conservative balance sheets at below-average valuations–has a lot of options. Staying upwind does not generate the same excitement as racing ahead, but boring is good if it leads to a safe landing. Contributors/Detractors The three largest contributors were Total Energy Services, Inc., (“Total Energy”), Trecora, and Amplify Energy Corp. (“Amplify”). All three share the characteristic of being “real economy” businesses across the energy and chemicals sectors. We discussed Trecora in our first half letter following its buyout by private equity in early 2022. We continue to be impressed with Total Energy’s management, as they have navigated through one of the most challenging periods in oilfield services, buying shares personally the entire way. We expect pricing power to finally show up in Total Energy’s results in 2023. Amplify is an upstream oil & gas holding. Unfortunately, the company suffered from a well-publicized oil spill off the coast of California at its Beta field in late 2021. The shares sold off in a panic immediately following the news, although it turned out to be much less dire than initially feared. While the cause of the oil spill is being litigated, Amplify’s insurers are covering most of the cleanup cost and the Beta field will likely restart in early 2023, after repairs are finished. With the spill overhang cleaned up, Beta back online, and old commodity hedges rolling off, Amplify’s earning potential should finally shine through. |
32
| | |
| | | AMG Yacktman Special Opportunities Fund Portfolio Manager’s Comments (continued) |
| | | | | | | | |
The three largest detractors were Naked Wines PLC, Italian Wine Brands S.P.A. (“IWB”), and Brickability Group PLC. In our past letters we have discussed the missteps made by Naked Wines—underperforming marketing spend, inflated cost base, inappropriate debt structure, and excess inventory. We invested with the belief that Naked Wines had a profitable underlying business underneath even if the pandemic tailwinds were temporary. While still early, management has fixed the leverage issues, reduced costs, and pivoted to profitability. Inventory is still elevated but management has committed to reducing it meaningfully over the next 18 months, unlocking significant cash to help re-focus on growth if marketing paybacks are there. Either way, we expect the market will look favorably on the change in strategy toward profitability and shareholder return, once management demonstrates it can execute the new plan. While sharing a product category with Naked Wines, IWB is a different business model. IWB’s largest business unit is a wholesaler of branded Italian wine to retail stores like grocery chains. As a European business, IWB faced extreme inflation and product shortages across many areas of its supply chain. The lag in passing through those costs has impacted margins, but we expect a reversion back to the normal profit structure in 2023. | | | | While our other two detractors saw some deterioration in financials or growth potential, Brickability’s share price did not suffer from poor earnings (which have been excellent across the board, with fiscal year 2022 another record year), but rather macro sentiment. As a brick merchant and building products distributor, over half of Brickability’s sales go into new home construction. Given the hike in interest rates, that end market will likely slow in 2023. Yet Brickability is executing extremely well across both operations and M&A, with an opportunity to gain further market share from weaker competitors. With essentially no debt and capable management, we expect them to navigate through a more difficult period. Conclusion We recently read The Prize: The Epic Quest for Oil, Money, and Power by Daniel Yergin, a comprehensive history of the energy business going back to the discovery of oil in 1859 by “Colonel” Edwin Drake in Titusville, PA. As we reflected on 2022, one exchange in the book stood out. It relays a conversation with Marcus Samuel, the founder of Shell (which merged with Royal Dutch to create the global energy major). Samuel is extremely important in the early history of the oil markets, but in this quote, he was being criticized by one of his business | | | | partners on his management style: “There seems only one idea: sink capital, create a great bluster, and trust to providence. Such a happy-go-lucky frame of mind in business I have never seen before … business like this cannot be conducted by an occasional glance in one’s spare time, or by some brilliant coup from time to time. It is steady, treadmill work. … Unless some very radical change is made, the bubble will burst.” The past decade or more has been full of bluster. It appears a bubble has burst in a meaningful portion of the more speculative risk assets, although it may be too early to tell if that will bleed further into the broader market and economy. If so, the next years will be harder than the ones before, and many investors are unprepared for a market offering much poorer returns. We believe value investing’s steady, incremental progress will matter once again. Our objective remains to produce attractive risk-adjusted returns over a full market cycle. We appreciate the AMG Yacktman Special Opportunities Fund shareholders who entrust us with their capital to pursue this goal. The views expressed represent the opinions of Yacktman Asset Management LP as of December 31, 2022, and are not intended as a forecast or guarantee of future results, and are subject to change without notice. |
33
|
AMG Yacktman Special Opportunities Fund Portfolio Manager’s Comments (continued) |
CUMULATIVE TOTAL RETURN PERFORMANCE
AMG Yacktman Special Opportunities Fund’s cumulative total return is based on the daily change in net asset value (NAV), and assumes that all dividends and distributions were reinvested. The graph compares a hypothetical $10,000 investment made in the AMG Yacktman Special Opportunities Fund’s Class Z shares on June 30, 2014 (inception date), to a $10,000 investment made in the MSCI ACWI All Cap Index for the same time period. The graph and table do not reflect the deduction of taxes that a shareholder would pay on a Fund distribution or redemption of shares. The listed returns for the Fund are net of expenses and the returns for the index exclude expenses. Total returns would have been lower had certain expenses not been reduced.
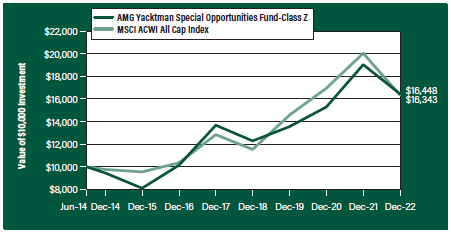
The table below shows the average annual total returns for the AMG Yacktman Special Opportunities Fund and the MSCI ACWI All Cap Index for the same time periods ended December 31, 2022.
| | | | | | | | | | | | | | | | | | | | |
| Average Annual Total Returns1 | | One
Year | | Five
Years | | Since
Inception | | Inception
Date |
|
AMG Yacktman Special Opportunities Fund2, 3, 4, 5, 6, 7, 8, 9, 10, 11, 12, 13, 14, 15, 16, 17, 18 | |
| | | | |
Class I | | | | (13.59 | %) | | | | 3.66 | % | | | | 7.68 | % | | | | 06/30/15 | |
| | | | |
Class Z | | | | (13.57 | %) | | | | 3.75 | % | | | | 6.03 | % | | | | 06/30/14 | |
| | | | |
MSCI ACWI All Cap Index19 | | | | (18.44 | %) | | | | 4.93 | % | | | | 5.94 | % | | | | 06/30/14 | † |
The performance data shown represents past performance. Past performance is not a guarantee of future results. Current performance may be lower or higher than the performance data quoted. The investment return and principal value of an investment will fluctuate so that an investor’s shares, when redeemed, may be worth more or less than their original cost.
Investors should carefully consider the Fund’s investment objectives, risks, charges and expenses before investing. For performance information through the most recent month end, current net asset values per share for the Fund and other information, please call 800.548.4539 or visit our website at amgfunds.com for a free prospectus. Read it carefully before investing or sending money.
Distributed by AMG Distributors, Inc., member FINRA/SIPC.
| † | Date reflects the inception date of the Fund, not the index. |
| 1 | Total return equals income yield plus share price change and assumes reinvestment of all dividends and capital gain distributions. Returns are net of fees and may reflect offsets of Fund expenses as described in the prospectus. No adjustment has been made for taxes payable by shareholders on their reinvested dividends and capital gain distributions. Returns for periods greater than one year are annualized. The listed returns on the Fund are net of expenses and based on the published NAV as of December 31, 2022. All returns are in U.S. Dollars ($). |
|
2 From time to time, the Fund’s investment manager has waived its fees and/or absorbed Fund expenses, which has resulted in higher returns. |
| |
3 The Fund’s investment management fees are subject to a performance adjustment, which could increase or reduce the investment management fees paid by the Fund. The prospect of a positive or negative performance adjustment may create an incentive for the Fund’s portfolio manager to take greater risks with the Fund’s portfolio. In addition, because performance adjustments are based upon past performance, a shareholder may pay a higher or lower management fee for performance that occurred prior to the shareholder’s investment in the Fund. The performance adjustment could increase the Investment Manager’s fee (and, in turn, the Subadviser’s fee) even if the Fund’s shares lose value during the performance period provided that the Fund outperformed its benchmark index, and could decrease the Investment Manager’s fee (and, in turn, the Subadviser’s fee) even if the Fund’s shares increase in value during the performance period provided that the Fund underperformed its benchmark index. |
| |
4 The Fund is subject to currency risk resulting from fluctuations in exchange rates that may affect the total loss or gain on a non-U.S. Dollar investment when converted back to U.S. Dollars. |
| |
5 The Fund is subject to the risks associated with investments in debt securities, such as default risk and fluctuations in the perception of the debtor’s ability to pay its creditors. Changing interest rates may adversely affect the value of an investment. An increase in interest rates typically causes the value of bonds and other fixed income securities to fall. |
| |
6 The Fund may invest in derivatives such as options and futures; the complexity and rapidly changing structure of derivatives markets may increase the possibility of market losses. |
| |
7 Investments in international securities are subject to certain risks of overseas investing including currency fluctuations and changes in political and economic conditions, which could result in significant market fluctuations. These risks are magnified in emerging markets. |
| |
8 The Fund is subject to the risks associated with investments in emerging markets, such as erratic earnings patterns, economic and political instability, changing exchange controls, limitations on repatriation of foreign capital and changes in local governmental attitudes toward private investment, possibly leading to nationalization or confiscation of investor assets. |
| |
9 A greater percentage of the Fund’s holdings may be focused in a smaller number of securities which may place the Fund at greater risk than a more diversified fund. |
34
| | |
| | | AMG Yacktman Special Opportunities Fund Portfolio Manager’s Comments (continued) |
| | | | |
10 High-yield bonds (also known as “junk bonds”) may be subject to greater levels of interest rate, credit, and liquidity risk than investments in higher rated securities. These securities are considered predominantly speculative with respect to the issuer’s continuing ability to make principal and interest payments. The issuers of the Fund’s holdings may be involved in bankruptcy proceedings, reorganizations, or financial restructurings, and are not as strong financially as higher-rated issuers. 11 The Fund invests in large-capitalization companies that may underperform other stock funds (such as funds that focus on small- and medium-capitalization companies) when stocks of large-capitalization companies are out of favor. 12 The Fund is subject to the special risks associated with investments in micro-cap companies, such as relatively short earnings history, competitive conditions, less publicly available corporate information, and reliance on a limited number of products. 13 The Fund is subject to risks associated with investments in mid-capitalization companies such as greater price volatility, lower trading volume, and less liquidity than the stocks of larger, more established companies. | | 14 Companies that are in similar industry sectors may be similarly affected by particular economic or market events; to the extent the Fund has substantial holdings within a particular sector, the risks associated with that sector increase. 15 The Fund may suffer significant losses on assets that it sells short. Unlike the possible loss on a security that is purchased, there is no limit on the amount of loss on an appreciating security that is sold short. 16 The Fund is subject to risks associated with investments in small-capitalization companies, such as erratic earnings patterns, competitive conditions, limited earnings history and a reliance on one or a limited number of products. 17 Market prices of investments held by the Fund may fall rapidly or unpredictably due to a variety of economic or political factors, market conditions, disasters or public health issues, or in response to events that affect particular industries or companies. 18 The Fund invests in value stocks, which may perform differently from the market as a whole and may be undervalued by the market for a long period of time. | | 19 The MSCI ACWI All Cap Index captures large, mid, small and micro cap representation across certain Developed Markets (DM) countries and large, mid and small cap representation across certain Emerging Markets (EM) countries. The index is comprehensive, covering a significant percentage of the global equity investment opportunity set. Please go to msci.com for most current list of countries represented by the index. Unlike the Fund, the MSCI ACWI All Cap Index is unmanaged, is not available for investment and does not incur expenses. All MSCI data is provided “as is”. The products described herein are not sponsored or endorsed and have not been reviewed or passed on by MSCI. In no event shall MSCI, its affiliates or any MSCI data provider have any liability of any kind in connection with the MSCI data or the products described herein. Copying or redistributing the MSCI data is strictly prohibited. Not FDIC Insured, nor bank guaranteed. May lose value. |
35
| | |
| | | AMG Yacktman Special Opportunities Fund Fund Snapshots (unaudited) December 31, 2022 |
PORTFOLIO BREAKDOWN
| | | | | |
| Sector | | % of
Net Assets |
| | |
Energy | | 21.8 |
| | |
Industrials | | 19.1 |
| | |
Consumer Discretionary | | 16.1 |
| | |
Consumer Staples | | 11.6 |
| | |
Materials | | 10.9 |
| | |
Financials | | 9.1 |
| | |
Information Technology | | 2.3 |
| | |
Health Care | | 0.6 |
| | |
Communication Services | | 0.6 |
| | |
Utilities | | 0.4 |
| | |
Short-Term Investments | | 7.8 |
| | |
Other Assets, less Liabilities | | (0.3) |
TOP TEN HOLDINGS
| | | | | | | | |
| Security Name | | | | | % of
Net Assets | |
| | | |
Omni Bridgeway, Ltd. (Australia) | | | | | | | 9.1 | |
| | | |
Total Energy Services, Inc. (Canada) | | | | | | | 8.8 | |
| | | |
U-Haul Holding Co., Non-Voting Shares (United States) | | | | | | | 5.0 | |
| | | |
Texhong Textile Group, Ltd. (Hong Kong) | | | | | | | 4.6 | |
| | | |
Brickability Group PLC (United Kingdom) | | | | | | | 4.6 | |
| | | |
Italian Wine Brands S.P.A (Italy) | | | | | | | 4.2 | |
| | | |
Legacy Housing Corp. (United States) | | | | | | | 4.2 | |
| | | |
B&S Group, S.A.R.L. (Luxembourg) | | | | | | | 3.6 | |
| | | |
Delfi, Ltd. (Singapore) | | | | | | | 3.2 | |
| | | |
America’s Car-Mart, Inc. (United States) | | | | | | | 3.1 | |
| | | |
Top Ten as a Group | | | | | | | 50.4 | |
| | | | | | | | |
Because a fund’s strategy may result in multiple investments in particular sectors of the economy, its performance may depend on the performance of those sectors and may fluctuate more widely than investments diversified across more sectors. For additional information on these and other risk considerations, please see the Fund’s prospectus.
Any sectors, industries, or securities discussed should not be perceived as investment recommendations. Mention of a specific security should not be considered a recommendation to buy or solicitation to sell that security. Specific securities mentioned in this report may have been sold from the Fund’s portfolio of investments by the time you receive this report.
36
| | |
| | | AMG Yacktman Special Opportunities Fund Fund Snapshots (continued) For the six months ended December 31, 2022 |
| | | | |
NEW EQUITY POSITIONS | |
| |
| New Purchases | | Current Shares Held | |
| |
Arrow Exploration Corp. (Canada) | | | 6,000,000 | |
| |
Fila S.P.A. (Italy) | | | 66,000 | |
| |
Noram Drilling A.S. (Norway) | | | 180,000 | |
| |
U-Haul Holding Co., Non-Voting Shares1 | | | 75,600 | |
EQUITY PURCHASES & SALES
| | | | | | | | |
| Purchases | | Net Shares
Purchased | | | Current Shares Held | |
| | |
America’s Car-Mart, Inc. | | | 20,500 | | | | 36,000 | |
| | |
Amerigo Resources, Ltd. (Canada) | | | 543,100 | | | | 1,500,000 | |
| | |
Brickability Group PLC (United Kingdom) | | | 215,000 | | | | 4,800,000 | |
| | |
Cie de L’Odet SE (France) | | | 257 | | | | 1,223 | |
| | |
Delfi, Ltd. (Singapore) | | | 502,600 | | | | 4,702,600 | |
| | |
Hargreaves Services PLC (United Kingdom) | | | 100,000 | | | | 410,000 | |
| | |
Hemisphere Energy Corp. (Canada) | | | 343,400 | | | | 1,000,000 | |
| | |
Horizon Oil, Ltd. (Australia) | | | 4,500,000 | | | | 22,500,000 | |
| | |
KISCO Holdings Co., Ltd. (South Korea) | | | 11,000 | | | | 101,000 | |
| | |
Macfarlane Group PLC (United Kingdom) | | | 675,000 | | | | 1,200,000 | |
| | |
NeoPharm Co., Ltd. (South Korea) | | | 6,640 | | | | 66,615 | |
| | |
Okamoto Industries, Inc. (Japan) | | | 3,500 | | | | 37,500 | |
| | |
Sinko Industries, Ltd. (Japan) | | | 12,000 | | | | 62,000 | |
| | |
Texhong Textile Group, Ltd. (Hong Kong) | | | 798,500 | | | | 4,850,000 | |
| | | | | | | | |
| Sales | | Net Shares
Sold | | | Current Shares
Held | |
| | |
B&S Group, S.A.R.L. (Luxembourg) | | | 80,000 | | | | 575,000 | |
| | |
Bixolon Co., Ltd. (South Korea) | | | 75,000 | | | | 120,000 | |
| | |
Boustead Singapore, Ltd. (Singapore) | | | 980,800 | | | | 1,350,000 | |
| | |
CB Industrial Product Holding Bhd (Malaysia) | | | 3,800,000 | | | | 2,580,800 | |
| | |
Cosco Capital, Inc. (Philippines) | | | 4,750,000 | | | | 4,500,000 | |
| | |
Dong Ah Tire & Rubber Co., Ltd. (South Korea) | | | 12,000 | | | | 62,500 | |
| | |
Evolution Petroleum Corp. | | | 70,000 | | | | 100,000 | |
| | |
GrafTech International, Ltd. | | | 55,000 | | | | — | |
| | |
Ifis Japan, Ltd. (Japan) | | | 10,000 | | | | 71,000 | |
| | |
Italian Wine Brands S.P.A (Italy) | | | 42,000 | | | | 120,000 | |
| | |
Komelon Corp. (South Korea) | | | 16,000 | | | | 55,000 | |
| | |
Legacy Housing Corp. | | | 100,000 | | | | 185,000 | |
| | |
Maezawa Industries, Inc. (Japan) | | | 27,400 | | | | 175,000 | |
| | |
Master Drilling Group, Ltd. (South Africa) | | | 150,000 | | | | 700,000 | |
| | |
Ocean Wilsons Holdings, Ltd. (Bermuda) | | | 59,000 | | | | 115,000 | |
| | |
Omni Bridgeway, Ltd. (Australia) | | | 1,225,000 | | | | 3,100,000 | |
| | |
Pardee Resources Co., Inc. | | | 2,172 | | | | 3,928 | |
| | |
Pumtech Korea Co., Ltd. (South Korea) | | | 2,600 | | | | 36,400 | |
| | |
Reading International, Inc., Class A | | | 131,200 | | | | 179,800 | |
| | |
Sam Yung Trading Co., Ltd. (South Korea) | | | 92,801 | | | | 97,259 | |
| | |
Sekisui Jushi Corp. (Japan) | | | 8,500 | | | | 100,000 | |
| | |
SK Kaken Co., Ltd. (Japan) | | | 300 | | | | 1,500 | |
| | |
Total Energy Services, Inc. (Canada) | | | 512,000 | | | | 1,153,600 | |
| | |
U-Haul Holding Co. | | | 300 | | | | 8,400 | |
| | |
Webstep A.S. | | | 100,407 | | | | — | |
| | |
WIN-Partners Co., Ltd. (Japan) | | | 38,500 | | | | 64,000 | |
| 1 | Purchases and sales due to a corporate action. |
37
| | |
| | | AMG Yacktman Special Opportunities Fund Schedule of Portfolio Investments December 31, 2022 |
| | | |
| | | |
| | | | | | | | |
| | | Shares | | | Value | |
| | |
Common Stocks - 91.4% | | | | | | | | |
| |
Communication Services - 0.6% | | | | | |
| | |
Reading International, Inc., Class A (United States)* | | | 179,800 | | | | $498,046 | |
| | |
Consumer Discretionary - 16.1% | | | | | | | | |
| | |
America’s Car-Mart, Inc. (United States)*,1 | | | 36,000 | | | | 2,601,360 | |
| | |
B&S Group, S.A.R.L. (Luxembourg)2 | | | 575,000 | | | | 2,975,985 | |
| | |
Dong Ah Tire & Rubber Co., Ltd. (South Korea) | | | 62,500 | | | | 561,135 | |
| | |
Legacy Housing Corp. (United States)* | | | 185,000 | | | | 3,507,600 | |
| | |
Texhong Textile Group, Ltd. (Hong Kong) | | | 4,850,000 | | | | 3,869,224 | |
| | |
Total Consumer Discretionary | | | | | | | 13,515,304 | |
| |
Consumer Staples - 11.6% | | | | | |
| | |
Cosco Capital, Inc. (Philippines) | | | 4,500,000 | | | | 377,103 | |
| | |
Delfi, Ltd. (Singapore) | | | 4,702,600 | | | | 2,718,474 | |
| | |
Italian Wine Brands S.P.A (Italy) | | | 120,000 | | | | 3,519,109 | |
| | |
Naked Wines PLC (United Kingdom)* | | | 1,350,000 | | | | 2,045,531 | |
| | |
NeoPharm Co., Ltd. (South Korea) | | | 66,615 | | | | 1,010,283 | |
| | |
Total Consumer Staples | | | | | | | 9,670,500 | |
| | |
Energy - 21.8% | | | | | | | | |
| | |
Amplify Energy Corp. (United States)* | | | 220,000 | | | | 1,933,800 | |
| | |
Arrow Exploration Corp. (Canada)* | | | 6,000,000 | | | | 1,269,397 | |
| | |
Evolution Petroleum Corp. (United States) | | | 100,000 | | | | 755,000 | |
| | |
Hargreaves Services PLC (United Kingdom) | | | 410,000 | | | | 1,957,895 | |
| | |
Hemisphere Energy Corp. (Canada) | | | 1,000,000 | | | | 967,504 | |
| | |
Horizon Oil, Ltd. (Australia) | | | 22,500,000 | | | | 2,004,354 | |
| | |
Noram Drilling A.S. (Norway) | | | 180,000 | | | | 1,043,409 | |
| | |
Pardee Resources Co., Inc. (United States) | | | 3,928 | | | | 1,021,280 | |
| | |
Total Energy Services, Inc. (Canada) | | | 1,153,600 | | | | 7,335,669 | |
| | |
Total Energy | | | | | | | 18,288,308 | |
| | |
Financials - 9.1% | | | | | | | | |
| | |
Omni Bridgeway, Ltd. (Australia)* | | | 3,100,000 | | | | 7,629,473 | |
| | |
Health Care - 0.6% | | | | | | | | |
| | |
WIN-Partners Co., Ltd. (Japan) | | | 64,000 | | | | 518,331 | |
| | |
Industrials - 19.1% | | | | | | | | |
| | |
Boustead Singapore, Ltd. (Singapore) | | | 1,350,000 | | | | 811,277 | |
| | |
CB Industrial Product Holding Bhd (Malaysia) | | | 2,580,800 | | | | 644,468 | |
| | |
Cie de L’Odet SE (France) | | | 1,223 | | | | 1,816,091 | |
| | |
Fila S.P.A. (Italy) | | | 66,000 | | | | 492,347 | |
| | |
Komelon Corp. (South Korea) | | | 55,000 | | | | 433,685 | |
| | |
Macfarlane Group PLC (United Kingdom) | | | 1,200,000 | | | | 1,501,581 | |
| | |
Maezawa Industries, Inc. (Japan) | | | 175,000 | | | | 814,422 | |
| | |
Mitani Corp. (Japan) | | | 43,500 | | | | 429,230 | |
| | |
Ocean Wilsons Holdings, Ltd. (Bermuda)1 | | | 115,000 | | | | 1,292,972 | |
| | | | | | | | |
| | | Shares | | | Value | |
| | |
Sam Yung Trading Co., Ltd. (South Korea) | | | 97,259 | | | | $960,017 | |
| | |
Sekisui Jushi Corp. (Japan) | | | 100,000 | | | | 1,415,565 | |
| | |
Sinko Industries, Ltd. (Japan) | | | 62,000 | | | | 676,656 | |
| | |
U-Haul Holding Co. (United States) | | | 8,400 | | | | 505,596 | |
| | |
U-Haul Holding Co., Non-Voting Shares (United States) | | | 75,600 | | | | 4,156,488 | |
| | |
Total Industrials | | | | | | | 15,950,395 | |
| | |
Information Technology - 1.2% | | | | | | | | |
| | |
Bixolon Co., Ltd. (South Korea) | | | 120,000 | | | | 665,929 | |
| | |
Ifis Japan, Ltd. (Japan) | | | 71,000 | | | | 329,061 | |
| | |
Total Information Technology | | | | | | | 994,990 | |
| | |
Materials - 10.9% | | | | | | | | |
| | |
Amerigo Resources, Ltd. (Canada) | | | 1,500,000 | | | | 1,462,334 | |
| | |
Brickability Group PLC (United Kingdom) | | | 4,800,000 | | | | 3,829,953 | |
| | |
KISCO Holdings Co., Ltd. (South Korea)* | | | 101,000 | | | | 1,254,882 | |
| | |
Master Drilling Group, Ltd. (South Africa) | | | 700,000 | | | | 596,542 | |
| | |
Okamoto Industries, Inc. (Japan) | | | 37,500 | | | | 1,051,312 | |
| | |
Pumtech Korea Co., Ltd. (South Korea)* | | | 36,400 | | | | 473,103 | |
| | |
SK Kaken Co., Ltd. (Japan) | | | 1,500 | | | | 474,322 | |
| | |
Total Materials | | | | | | | 9,142,448 | |
| | |
Utilities - 0.4% | | | | | | | | |
| | |
Maxim Power Corp. (Canada)* | | | 140,000 | | | | 351,551 | |
| | |
Total Common Stocks
(Cost $69,664,532) | | | | | | | 76,559,346 | |
| | |
Preferred Stock - 1.1% | | | | | | | | |
| | |
Information Technology - 1.1% | | | | | | | | |
| | |
Samsung Electronics Co., Ltd., 2.630% (South Korea) | | | 24,000 | | | | 961,761 | |
| | |
Total Preferred Stock
(Cost $398,488) | | | | | | | 961,761 | |
| | |
| | | Principal
Amount | | | | |
Short-Term Investments - 7.8% | | | | | | | | |
| |
Joint Repurchase Agreements - 0.4%3 | | | | | |
| | |
Citigroup Global Markets, Inc., dated 12/30/22, due 01/03/23, 4.250% total to be received $366,435 (collateralized by various U.S. Treasuries, 0.000% - 4.500%, 04/11/23 - 10/31/29, totaling $373,587) | | | $366,262 | | | | 366,262 | |
| | |
| | | Shares | | | | |
| |
Other Investment Companies - 7.4% | | | | | |
| | |
Dreyfus Government Cash Management Fund, Institutional Shares, 4.19%4 | | | 2,484,752 | | | | 2,484,752 | |
The accompanying notes are an integral part of these financial statements.
38
| | |
| | | AMG Yacktman Special Opportunities Fund Schedule of Portfolio Investments (continued) |
| | | | | | | | |
| | | Shares | | | Value | |
| | |
Dreyfus Institutional Preferred Government Money Market Fund, Institutional Shares, 4.27%4 | | | 3,727,129 | | | | $3,727,129 | |
| | |
Total Other Investment Companies | | | | | | | 6,211,881 | |
| | |
Total Short-Term Investments
(Cost $6,578,143) | | | | | | | 6,578,143 | |
| | | | | | |
| | | | | Value | |
| |
Total Investments - 100.3%
(Cost $76,641,163) | | | $84,099,250 | |
| |
Other Assets, less Liabilities - (0.3)% | | | (293,215 | ) |
| |
Net Assets - 100.0% | | | $83,806,035 | |
| * | Non-income producing security. |
| 1 | Some of these securities, amounting to $1,895,633 or 2.3% of net assets, were out on loan to various borrowers and are collateralized by cash and various U.S. Treasury Obligations. See Note 4 of Notes to Financial Statements. |
| 2 | Security exempt from registration under Rule 144A of the Securities Act of 1933. This security may be resold in transactions exempt from registration, normally to qualified institutional buyers. At December 31, 2022, the value of this security amounted to $2,975,985 or 3.6% of net assets. |
| 3 | Cash collateral received for securities lending activity was invested in these joint repurchase agreements. |
| 4 | Yield shown represents the December 31, 2022, seven day average yield, which refers to the sum of the previous seven days’ dividends paid, expressed as an annual percentage. |
The following table summarizes the inputs used to value the Fund’s investments by the fair value hierarchy levels as of December 31, 2022:
| | | | | | | | | | | | | | | | |
| | | Level 1 | | | Level 21 | | | Level 3 | | | Total | |
Investments in Securities | | | | | | | | | | | | | | | | |
| | | | |
Common Stocks | | | | | | | | | | | | | | | | |
| | | | |
Energy | | $ | 15,240,545 | | | $ | 3,047,763 | | | | — | | | $ | 18,288,308 | |
| | | | |
Industrials | | | 6,599,524 | | | | 9,350,871 | | | | — | | | | 15,950,395 | |
| | | | |
Consumer Discretionary | | | 9,084,945 | | | | 4,430,359 | | | | — | | | | 13,515,304 | |
| | | | |
Consumer Staples | | | 377,103 | | | | 9,293,397 | | | | — | | | | 9,670,500 | |
| | | | |
Materials | | | 5,888,829 | | | | 3,253,619 | | | | — | | | | 9,142,448 | |
| | | | |
Financials | | | — | | | | 7,629,473 | | | | — | | | | 7,629,473 | |
| | | | |
Information Technology | | | — | | | | 994,990 | | | | — | | | | 994,990 | |
| | | | |
Health Care | | | — | | | | 518,331 | | | | — | | | | 518,331 | |
| | | | |
Communication Services | | | 498,046 | | | | — | | | | — | | | | 498,046 | |
| | | | |
Utilities | | | 351,551 | | | | — | | | | — | | | | 351,551 | |
| | | | |
Preferred Stock† | | | — | | | | 961,761 | | | | — | | | | 961,761 | |
| | | | |
Short-Term Investments | | | | | | | | | | | | | | | | |
| | | | |
Joint Repurchase Agreements | | | — | | | | 366,262 | | | | — | | | | 366,262 | |
| | | | |
Other Investment Companies | | | 6,211,881 | | | | — | | | | — | | | | 6,211,881 | |
| | | | | | | | | | | | | | | | |
Total Investments in Securities | | $ | 44,252,424 | | | $ | 39,846,826 | | | | — | | | $ | 84,099,250 | |
| | | | | | | | | | | | | | | | |
| † | All preferred stocks held in the Fund are Level 2 securities. For a detailed breakout of preferred stocks by major industry classification, please refer to Schedule of Portfolio Investments. |
| 1 | An external pricing service is used to reflect any impact on security value due to market movements between the time the Fund valued such foreign securities and the earlier closing of foreign markets. |
For the fiscal year ended December 31, 2022, there were no transfers in or out of Level 3.
The accompanying notes are an integral part of these financial statements.
39
| | |
| | | AMG Yacktman Special Opportunities Fund Schedule of Portfolio Investments (continued) |
The country allocation in the Schedule of Portfolio Investments at December 31, 2022, was as follows:
| | |
| Country | | % of Long-Term Investments |
| |
Australia | | 12.4 |
| |
Bermuda | | 1.7 |
| |
Canada | | 14.7 |
| |
France | | 2.3 |
| |
Hong Kong | | 5.0 |
| |
Italy | | 5.2 |
| |
Japan | | 7.4 |
| |
Luxembourg | | 3.8 |
| |
Malaysia | | 0.8 |
| |
Norway | | 1.3 |
| |
Philippines | | 0.5 |
| |
Singapore | | 4.6 |
| |
South Africa | | 0.8 |
| |
South Korea | | 8.2 |
| |
United Kingdom | | 12.0 |
| |
United States | | 19.3 |
| | |
| |
| | 100.0 |
| | |
The accompanying notes are an integral part of these financial statements.
40
| | |
| | | Statement of Assets and Liabilities December 31, 2022 |
| | | | | | | | | | | | | | | | |
| | | AMG Yacktman
Fund | | | AMG Yacktman
Focused Fund | | | AMG Yacktman
Global Fund | | AMG Yacktman
Special
Opportunities Fund |
| | | | |
Assets: | | | | | | | | | | | | | | | | |
| | | | |
Investments at value1 (including securities on loan valued at $46,523,866, $11,289,472, $0, and $1,895,633, respectively) | | | $7,953,756,620 | | | | $3,487,592,738 | | | | $149,416,077 | | | | $84,099,250 | |
| | | | |
Affiliated Investments at value2 | | | — | | | | 25,657,438 | | | | — | | | | — | |
| | | | |
Foreign currency3 | | | — | | | | 439,233 | | | | — | | | | — | |
| | | | |
Receivable for investments sold | | | 250,631 | | | | 10,646,979 | | | | — | | | | — | |
| | | | |
Segregated cash at broker | | | — | | | | 5,472,000 | | | | — | | | | — | |
| | | | |
Dividend and interest receivables | | | 33,610,176 | | | | 23,307,480 | | | | 1,610,281 | | | | 285,629 | |
| | | | |
Securities lending income receivable | | | 8,154 | | | | 9,596 | | | | 511 | | | | 1,347 | |
| | | | |
Receivable for Fund shares sold | | | 3,976,697 | | | | 2,738,408 | | | | 41,546 | | | | 55,681 | |
| | | | |
Receivable from affiliate | | | — | | | | — | | | | 6,071 | | | | 8,980 | |
| | | | |
Prepaid expenses and other assets | | | 40,410 | | | | 33,514 | | | | 8,206 | | | | 6,184 | |
| | | | |
Total assets | | | 7,991,642,688 | | | | 3,555,897,386 | | | | 151,082,692 | | | | 84,457,071 | |
| | | | |
Liabilities: | | | | | | | | | | | | | | | | |
| | | | |
Payable upon return of securities loaned | | | 5,503,957 | | | | 7,879,966 | | | | — | | | | 366,262 | |
| | | | |
Payable for investments purchased | | | — | | | | 978,757 | | | | — | | | | 61,742 | |
| | | | |
Payable for Fund shares repurchased | | | 7,517,546 | | | | 5,941,166 | | | | 47,107 | | | | 14,130 | |
| | | | |
Written options4 | | | — | | | | 685,440 | | | | — | | | | — | |
| | | | |
Due to custodian | | | 5,265 | | | | — | | | | — | | | | — | |
| | | | |
Accrued expenses: | | | | | | | | | | | | | | | | |
| | | | |
Investment advisory and management fees | | | 2,962,287 | | | | 2,684,014 | | | | 90,671 | | | | 117,108 | |
| | | | |
Administrative fees | | | 1,035,210 | | | | 459,453 | | | | 19,156 | | | | 10,560 | |
| | | | |
Shareholder service fees | | | 485,634 | | | | 251,531 | | | | 315 | | | | 3,928 | |
| | | | |
Other | | | 1,092,131 | | | | 615,539 | | | | 80,573 | | | | 77,306 | |
| | | | |
Total liabilities | | | 18,602,030 | | | | 19,495,866 | | | | 237,822 | | | | 651,036 | |
| | | | | | | | | | | | | | | | |
| | | | |
Net Assets | | | $7,973,040,658 | | | | $3,536,401,520 | | | | $150,844,870 | | | | $83,806,035 | |
| | | | |
1 Investments at cost | | | $5,770,798,450 | | | | $2,680,956,218 | | | | $140,767,043 | | | | $76,641,163 | |
| | | | |
2 Affiliated Investments at cost | | | — | | | | $53,514,887 | | | | — | | | | — | |
| | | | |
3 Foreign currency at cost | | | — | | | | $439,233 | | | | — | | | | — | |
| | | | |
4 Premiums received | | | — | | | | $607,711 | | | | — | | | | — | |
The accompanying notes are an integral part of these financial statements.
41
| | |
| | | Statement of Assets and Liabilities (continued) |
| | | | | | | | | | | | | | | | |
| | | AMG Yacktman
Fund | | AMG Yacktman
Focused Fund | | AMG Yacktman
Global Fund | | AMG Yacktman
Special
Opportunities Fund |
| | | | |
Net Assets Represent: | | | | | | | | | | | | | | | | |
| | | | |
Paid-in capital | | | $5,758,869,921 | | | | $2,757,037,355 | | | | $141,668,240 | | | | $76,741,674 | |
| | | | |
Total distributable earnings | | | 2,214,170,737 | | | | 779,364,165 | | | | 9,176,630 | | | | 7,064,361 | |
| | | | |
Net Assets | | | $7,973,040,658 | | | | $3,536,401,520 | | | | $150,844,870 | | | | $83,806,035 | |
| | | | |
Class N: | | | | | | | | | | | | | | | | |
| | | | |
Net Assets | | | — | | | | $1,730,316,409 | | | | $1,353,609 | | | | — | |
| | | | |
Shares outstanding | | | — | | | | 95,523,984 | | | | 95,225 | | | | — | |
| | | | |
Net asset value, offering and redemption price per share | | | — | | | | $18.11 | | | | $14.21 | | | | — | |
| | | | |
Class I: | | | | | | | | | | | | | | | | |
| | | | |
Net Assets | | | $7,973,040,658 | | | | $1,806,085,111 | | | | $149,491,261 | | | | $47,024,129 | |
| | | | |
Shares outstanding | | | 377,327,176 | | | | 100,115,814 | | | | 10,493,601 | | | | 4,170,926 | |
| | | | |
Net asset value, offering and redemption price per share | | | $21.13 | | | | $18.04 | | | | $14.25 | | | | $11.27 | |
| | | | |
Class Z: | | | | | | | | | | | | | | | | |
| | | | |
Net Assets | | | — | | | | — | | | | — | | | | $36,781,906 | |
| | | | |
Shares outstanding | | | — | | | | — | | | | — | | | | 3,252,754 | |
| | | | |
Net asset value, offering and redemption price per share | | | — | | | | — | | | | — | | | | $11.31 | |
The accompanying notes are an integral part of these financial statements.
42
| | |
| | | Statement of Operations For the fiscal year ended December 31, 2022 |
| | | | | | | | | | | | | | | | |
| | | AMG Yacktman
Fund | | AMG Yacktman
Focused Fund | | AMG Yacktman
Global Fund | | AMG Yacktman
Special
Opportunities Fund |
| | | | |
Investment Income: | | | | | | | | | | | | | | | | |
| | | | |
Dividend income | | | $196,933,343 | | | | $96,570,611 | | | | $4,502,692 | | | | $2,769,674 | |
| | | | |
Interest income | | | 9,280,280 | | | | 4,424,114 | | | | 122,152 | | | | 23,172 | |
| | | | |
Dividends from affiliated securities | | | — | | | | 1,227,212 | | | | — | | | | — | |
| | | | |
Securities lending income | | | 70,247 | | | | 29,730 | | | | 1,535 | | | | 11,601 | |
| | | | |
Foreign withholding tax | | | (14,600,353 | ) | | | (9,309,044 | ) | | | (597,653 | ) | | | (171,030 | ) |
| | | | |
Total investment income | | | 191,683,517 | | | | 92,942,623 | | | | 4,028,726 | | | | 2,633,417 | |
| | | | |
Expenses: | | | | | | | | | | | | | | | | |
| | | | |
Investment advisory and management fees | | | 36,646,370 | | | | 33,833,815 | | | | 1,102,207 | | | | 1,580,558 | |
| | | | |
Administrative fees | | | 12,820,132 | | | | 5,833,417 | | | | 232,861 | | | | 148,758 | |
| | | | |
Shareholder servicing fees - Class N | | | — | | | | 3,446,880 | | | | 2,195 | | | | — | |
| | | | |
Shareholder servicing fees - Class I | | | 7,321,547 | | | | — | | | | — | | | | 42,625 | |
| | | | |
Custodian fees | | | 990,665 | | | | 558,240 | | | | 61,098 | | | | 58,841 | |
| | | | |
Trustee fees and expenses | | | 606,155 | | | | 274,676 | | | | 10,966 | | | | 6,856 | |
| | | | |
Professional fees | | | 448,920 | | | | 230,367 | | | | 49,137 | | | | 39,473 | |
| | | | |
Transfer agent fees | | | 408,612 | | | | 213,164 | | | | 8,668 | | | | 3,672 | |
| | | | |
Reports to shareholders | | | 356,343 | | | | 173,658 | | | | 3,836 | | | | 8,457 | |
| | | | |
Registration fees | | | 143,226 | | | | 129,510 | | | | 23,253 | | | | 21,963 | |
| | | | |
Interest expense | | | — | | | | — | | | | — | | | | 166 | |
| | | | |
Miscellaneous | | | 283,300 | | | | 135,800 | | | | 6,758 | | | | 5,893 | |
| | | | |
Repayment of prior reimbursements | | | — | | | | 46,637 | | | | — | | | | 8,646 | |
| | | | |
Total expenses before offsets | | | 60,025,270 | | | | 44,876,164 | | | | 1,500,979 | | | | 1,925,908 | |
| | | | |
Expense reimbursements | | | — | | | | (10,296 | ) | | | (54,795 | ) | | | (34,769 | ) |
| | | | |
Fee waivers | | | (334,444 | ) | | | (127,121 | ) | | | — | | | | — | |
| | | | |
Net expenses | | | 59,690,826 | | | | 44,738,747 | | | | 1,446,184 | | | | 1,891,139 | |
| | | | | | | | | | | | | | | | |
| | | | |
Net investment income | | | 131,992,691 | | | | 48,203,876 | | | | 2,582,542 | | | | 742,278 | |
| | | | |
Net Realized and Unrealized Loss: | | | | | | | | | | | | | | | | |
| | | | |
Net realized gain on investments | | | 360,231,374 | | | | 171,120,170 | | | | 5,213,176 | | | | 430,742 | |
| | | | |
Net realized loss on foreign currency transactions | | | (803,238 | ) | | | (750,183 | ) | | | (51,731 | ) | | | (94,488 | ) |
| | | | |
Net change in unrealized appreciation/depreciation on investments | | | (1,194,585,385 | ) | | | (567,173,632 | ) | | | (23,923,941 | ) | | | (16,505,792 | ) |
| | | | |
Net change in unrealized appreciation/depreciation on affiliated investments | | | — | | | | (6,280,273 | ) | | | — | | | | — | |
| | | | |
Net change in unrealized appreciation/depreciation on written options | | | — | | | | (77,729 | ) | | | — | | | | — | |
| | | | |
Net change in unrealized appreciation/depreciation on foreign currency translations | | | (294,974 | ) | | | (114,133 | ) | | | 7,511 | | | | 282 | |
| | | | |
Net realized and unrealized loss | | | (835,452,223 | ) | | | (403,275,780 | ) | | | (18,754,985 | ) | | | (16,169,256 | ) |
| | | | | | | | | | | | | | | | |
| | | | |
Net decrease in net assets resulting from operations | | | $(703,459,532) | | | | $(355,071,904) | | | | $(16,172,443) | | | | $(15,426,978) | |
The accompanying notes are an integral part of these financial statements.
43
| | |
| | | Statements of Changes in Net Assets For the fiscal years ended December 31, |
| | | | | | | | | | | | | | | | |
| | | AMG Yacktman
Fund | | | AMG Yacktman
Focused Fund | |
| | | | |
| | | 2022 | | | 2021 | | | 2022 | | | 2021 | |
| | | | |
Increase (Decrease) in Net Assets Resulting From Operations: | | | | | | | | | | | | | | | | |
| | | | |
Net investment income | | | $131,992,691 | | | | $96,876,644 | | | | $48,203,876 | | | | $33,310,116 | |
| | | | |
Net realized gain on investments | | | 359,428,136 | | | | 300,920,992 | | | | 170,369,987 | | | | 182,246,817 | |
| | | | |
Net change in unrealized appreciation/depreciation on investments | | | (1,194,880,359 | ) | | | 1,143,172,456 | | | | (573,645,767 | ) | | | 410,786,303 | |
| | | | | | | | | | | | | | | | |
| | | | |
Net increase (decrease) in net assets resulting from operations | | | (703,459,532 | ) | | | 1,540,970,092 | | | | (355,071,904 | ) | | | 626,343,236 | |
| | | | |
Distributions to Shareholders: | | | | | | | | | | | | | | | | |
| | | | |
Class N | | | — | | | | — | | | | (124,361,503 | ) | | | (97,900,715 | ) |
| | | | |
Class I | | | (557,461,732 | ) | | | (341,720,709 | ) | | | (134,536,532 | ) | | | (109,158,676 | ) |
| | | | |
Total distributions to shareholders | | | (557,461,732 | ) | | | (341,720,709 | ) | | | (258,898,035 | ) | | | (207,059,391 | ) |
| | | | |
Capital Share Transactions:1 | | | | | | | | | | | | | | | | |
| | | | |
Net increase (decrease) from capital share transactions | | | (241,661,122 | ) | | | 640,234,734 | | | | (317,483,501 | ) | | | 409,334,123 | |
| | | | | | | | | | | | | | | | |
| | | | |
Total increase (decrease) in net assets | | | (1,502,582,386 | ) | | | 1,839,484,117 | | | | (931,453,440 | ) | | | 828,617,968 | |
| | | | |
Net Assets: | | | | | | | | | | | | | | | | |
| | | | |
Beginning of year | | | 9,475,623,044 | | | | 7,636,138,927 | | | | 4,467,854,960 | | | | 3,639,236,992 | |
| | | | | | | | | | | | | | | | |
| | | | |
End of year | | | $7,973,040,658 | | | | $9,475,623,044 | | | | $3,536,401,520 | | | | $4,467,854,960 | |
1 See Note 1(g) of the Notes to Financial Statements.
The accompanying notes are an integral part of these financial statements.
44
| | |
| | | Statements of Changes in Net Assets (continued) For the fiscal years ended December 31, |
| | | | | | | | | | | | | | | | |
| | | AMG Yacktman
Global Fund | | | AMG Yacktman
Special
Opportunities Fund | |
| | | | |
| | | 2022 | | | 2021 | | | 2022 | | | 2021 | |
| | | | |
Increase (Decrease) in Net Assets Resulting From Operations: | | | | | | | | | | | | | | | | |
| | | | |
Net investment income (loss) | | | $2,582,542 | | | | $2,033,206 | | | | $742,278 | | | | $(15,569 | ) |
| | | | |
Net realized gain on investments | | | 5,161,445 | | | | 8,852,173 | | | | 336,254 | | | | 4,330,398 | |
| | | | |
Net change in unrealized appreciation/depreciation on investments | | | (23,916,430 | ) | | | 6,824,993 | | | | (16,505,510 | ) | | | 15,896,200 | |
| | | | | | | | | | | | | | | | |
| | | | |
Net increase (decrease) in net assets resulting from operations | | | (16,172,443 | ) | | | 17,710,372 | | | | (15,426,978 | ) | | | 20,211,029 | |
| | | | |
Distributions to Shareholders: | | | | | | | | | | | | | | | | |
| | | | |
Class N | | | (51,267 | ) | | | (53,059 | ) | | | — | | | | — | |
| | | | |
Class I | | | (6,262,235 | ) | | | (12,752,955 | ) | | | (398,986 | ) | | | (1,238,880 | ) |
| | | | |
Class Z | | | — | | | | — | | | | (342,692 | ) | | | (2,928,032 | ) |
| | | | |
Total distributions to shareholders | | | (6,313,502 | ) | | | (12,806,014 | ) | | | (741,678 | ) | | | (4,166,912 | ) |
| | | | |
Capital Share Transactions:1 | | | | | | | | | | | | | | | | |
| | | | |
Net increase (decrease) from capital share transactions | | | 2,240,388 | | | | 32,996,714 | | | | (12,133,984 | ) | | | 17,275,902 | |
| | | | | | | | | | | | | | | | |
| | | | |
Total increase (decrease) in net assets | | | (20,245,557 | ) | | | 37,901,072 | | | | (28,302,640 | ) | | | 33,320,019 | |
| | | | |
Net Assets: | | | | | | | | | | | | | | | | |
| | | | |
Beginning of year | | | 171,090,427 | | | | 133,189,355 | | | | 112,108,675 | | | | 78,788,656 | |
| | | | | | | | | | | | | | | | |
| | | | |
End of year | | | $150,844,870 | | | | $171,090,427 | | | | $83,806,035 | | | | $112,108,675 | |
1 See Note 1(g) of the Notes to Financial Statements.
The accompanying notes are an integral part of these financial statements.
45
| | |
| | | AMG Yacktman Fund Financial Highlights For a share outstanding throughout each fiscal year |
| | | | | | | | | | | | | | | | | | | | |
| | | For the fiscal years ended December 31, | |
| | | | | |
| Class I | | 2022 | | | 2021 | | | 2020 | | | 2019 | | | 2018 |
| | | | | |
Net Asset Value, Beginning of Year | | | $24.50 | | | | $21.26 | | | | $20.48 | | | | $19.05 | | | | $22.85 | |
| | | | | |
Income (loss) from Investment Operations: | | | | | | | | | | | | | | | | | | | | |
| | | | | |
Net investment income1,2 | | | 0.35 | | | | 0.26 | 3 | | | 0.27 | | | | 0.35 | | | | 0.40 | |
| | | | | |
Net realized and unrealized gain (loss) on investments | | | (2.17 | ) | | | 3.89 | | | | 2.81 | | | | 2.99 | | | | 0.20 | |
| | | | | | | | | | | | | | | | | | | | |
| | | | | |
Total income (loss) from investment operations | | | (1.82 | ) | | | 4.15 | | | | 3.08 | | | | 3.34 | | | | 0.60 | |
| | | | | |
Less Distributions to Shareholders from: | | | | | | | | | | | | | | | | | | | | |
| | | | | |
Net investment income | | | (0.33 | ) | | | (0.27 | ) | | | (0.28 | ) | | | (0.37 | ) | | | (0.44 | ) |
| | | | | |
Net realized gain on investments | | | (1.22 | ) | | | (0.64 | ) | | | (2.02 | ) | | | (1.54 | ) | | | (3.96 | ) |
| | | | | | | | | | | | | | | | | | | | |
| | | | | |
Total distributions to shareholders | | | (1.55 | ) | | | (0.91 | ) | | | (2.30 | ) | | | (1.91 | ) | | | (4.40 | ) |
| | | | | |
Net Asset Value, End of Year | | | $21.13 | | | | $24.50 | | | | $21.26 | | | | $20.48 | | | | $19.05 | |
| | | | | | | | | | | | | | | | | | | | |
| | | | | |
Total Return2,4 | | | (7.37 | )% | | | 19.63 | % | | | 15.28 | % | | | 17.66 | % | | | 2.69 | % |
| | | | | |
Ratio of net expenses to average net assets | | | 0.70 | % | | | 0.70 | % | | | 0.70 | % | | | 0.70 | % | | | 0.70 | % |
| | | | | |
Ratio of gross expenses to average net assets5 | | | 0.70 | % | | | 0.70 | % | | | 0.71 | % | | | 0.71 | % | | | 0.71 | % |
| | | | | |
Ratio of net investment income to average net assets2 | | | 1.54 | % | | | 1.09 | % | | | 1.38 | % | | | 1.70 | % | | | 1.70 | % |
| | | | | |
Portfolio turnover | | | 11 | % | | | 15 | % | | | 27 | % | | | 35 | % | | | 12 | % |
| | | | | |
Net assets end of year (000’s) omitted | | | $7,973,041 | | | | $9,475,623 | | | | $7,636,139 | | | | $8,242,523 | | | | $7,110,981 | |
| | | | | | | | | | | | | | | | | | | | | |
| 1 | Per share numbers have been calculated using average shares. |
| 2 | Total returns and net investment income would have been lower had certain expenses not been offset. |
| 3 | Includes non-recurring dividends. Without these dividends, net investment income per share would have been $0.21. |
| 4 | The total return is calculated using the published Net Asset Value as of fiscal year end. |
| 5 | Excludes the impact of expense reimbursement or fee waivers and expense reductions such as brokerage credits, but includes expense repayments and non-reimbursable expenses, if any, such as interest, taxes, and extraordinary expenses. (See Note 1(c) and 2 in the Notes to Financial Statements.) |
46
| | |
| | | AMG Yacktman Focused Fund Financial Highlights For a share outstanding throughout each fiscal year |
| | | | | | | | | | | | | | | | | | | | |
| | | For the fiscal years ended December 31, | |
| | | | | |
| Class N | | 2022 | | | 2021 | | | 2020 | | | 2019 | | | 2018 |
| | | | | |
Net Asset Value, Beginning of Year | | | $21.21 | | | | $19.09 | | | | $18.25 | | | | $17.78 | | | | $21.13 | |
| | | | | |
Income (loss) from Investment Operations: | | | | | | | | | | | | | | | | | | | | |
| | | | | |
Net investment income1,2 | | | 0.22 | | | | 0.14 | 3 | | | 0.15 | | | | 0.23 | | | | 0.28 | |
| | | | | |
Net realized and unrealized gain (loss) on investments | | | (1.94 | ) | | | 2.98 | | | | 2.95 | | | | 3.13 | | | | 0.31 | |
| | | | | | | | | | | | | | | | | | | | |
| | | | | |
Total income (loss) from investment operations | | | (1.72 | ) | | | 3.12 | | | | 3.10 | | | | 3.36 | | | | 0.59 | |
| | | | | |
Less Distributions to Shareholders from: | | | | | | | | | | | | | | | | | | | | |
| | | | | |
Net investment income | | | (0.21 | ) | | | (0.16 | ) | | | (0.15 | ) | | | (0.25 | ) | | | (0.31 | ) |
| | | | | |
Net realized gain on investments | | | (1.17 | ) | | | (0.84 | ) | | | (2.11 | ) | | | (2.64 | ) | | | (3.63 | ) |
| | | | | | | | | | | | | | | | | | | | |
| | | | | |
Total distributions to shareholders | | | (1.38 | ) | | | (1.00 | ) | | | (2.26 | ) | | | (2.89 | ) | | | (3.94 | ) |
| | | | | |
Net Asset Value, End of Year | | | $18.11 | | | | $21.21 | | | | $19.09 | | | | $18.25 | | | | $17.78 | |
| | | | | | | | | | | | | | | | | | | | |
| | | | | |
Total Return2,4 | | | (8.06 | )% | | | 16.45 | % | | | 17.26 | % | | | 19.13 | % | | | 2.88 | % |
| | | | | |
Ratio of net expenses to average net assets | | | 1.25 | %5 | | | 1.25 | %5 | | | 1.24 | % | | | 1.24 | % | | | 1.23 | % |
| | | | | |
Ratio of gross expenses to average net assets6 | | | 1.25 | %5 | | | 1.25 | %5 | | | 1.26 | % | | | 1.26 | % | | | 1.24 | % |
| | | | | |
Ratio of net investment income to average net assets2 | | | 1.14 | % | | | 0.68 | % | | | 0.85 | % | | | 1.20 | % | | | 1.30 | % |
| | | | | |
Portfolio turnover | | | 13 | % | | | 19 | % | | | 33 | % | | | 31 | % | | | 16 | % |
| | | | | |
Net assets end of year (000’s) omitted | | | $1,730,316 | | | | $2,158,777 | | | | $1,943,998 | | | | $2,078,758 | | | | $2,166,407 | |
| | | | | | | | | | | | | | | | | | | | | |
47
| | |
| | | AMG Yacktman Focused Fund Financial Highlights For a share outstanding throughout each fiscal year |
| | | | | | | | | | | | | | | | | | | | |
| | | For the fiscal years ended December 31, | |
| | | | | |
| Class I | | 2022 | | | 2021 | | | 2020 | | | 2019 | | | 2018 |
| | | | | | | | | | | | | | | | | | | | |
| | | | | |
Net Asset Value, Beginning of Year | | | $21.13 | | | | $19.03 | | | | $18.19 | | | | $17.74 | | | | $21.09 | |
| | | | | |
Income (loss) from Investment Operations: | | | | | | | | | | | | | | | | | | | | |
| | | | | |
Net investment income1,2 | | | 0.26 | | | | 0.18 | 3 | | | 0.18 | | | | 0.27 | | | | 0.32 | |
| | | | | |
Net realized and unrealized gain (loss) on investments | | | (1.93 | ) | | | 2.96 | | | | 2.96 | | | | 3.11 | | | | 0.32 | |
| | | | | | | | | | | | | | | | | | | | |
| | | | | |
Total income (loss) from investment operations | | | (1.67 | ) | | | 3.14 | | | | 3.14 | | | | 3.38 | | | | 0.64 | |
| | | | | |
Less Distributions to Shareholders from: | | | | | | | | | | | | | | | | | | | | |
| | | | | |
Net investment income | | | (0.25 | ) | | | (0.20 | ) | | | (0.19 | ) | | | (0.29 | ) | | | (0.36 | ) |
| | | | | |
Net realized gain on investments | | | (1.17 | ) | | | (0.84 | ) | | | (2.11 | ) | | | (2.64 | ) | | | (3.63 | ) |
| | | | | | | | | | | | | | | | | | | | |
| | | | | |
Total distributions to shareholders | | | (1.42 | ) | | | (1.04 | ) | | | (2.30 | ) | | | (2.93 | ) | | | (3.99 | ) |
| | | | | |
Net Asset Value, End of Year | | | $18.04 | | | | $21.13 | | | | $19.03 | | | | $18.19 | | | | $17.74 | |
| | | | | | | | | | | | | | | | | | | | |
| | | | | |
Total Return2,4 | | | (7.85 | )% | | | 16.62 | % | | | 17.52 | % | | | 19.30 | % | | | 3.11 | % |
| | | | | |
Ratio of net expenses to average net assets | | | 1.06 | % | | | 1.06 | % | | | 1.06 | % | | | 1.06 | % | | | 1.05 | % |
| | | | | |
Ratio of gross expenses to average net assets6 | | | 1.06 | % | | | 1.06 | % | | | 1.07 | % | | | 1.07 | % | | | 1.06 | % |
| | | | | |
Ratio of net investment income to average net assets2 | | | 1.33 | % | | | 0.87 | % | | | 1.04 | % | | | 1.39 | % | | | 1.48 | % |
| | | | | |
Portfolio turnover | | | 13 | % | | | 19 | % | | | 33 | % | | | 31 | % | | | 16 | % |
| | | | | |
Net assets end of year (000’s) omitted | | | $1,806,085 | | | | $2,309,078 | | | | $1,695,239 | | | | $1,554,975 | | | | $1,292,079 | |
| | | | | | | | | | | | | | | | | | | | | |
| 1 | Per share numbers have been calculated using average shares. |
| 2 | Total returns and net investment income would have been lower had certain expenses not been offset. |
| 3 | Includes non-recurring dividends. Without these dividends, net investment income per share would have been $0.09 and $0.13 for Class N and Class I, respectively. |
| 4 | The total return is calculated using the published Net Asset Value as of fiscal year end. |
| 5 | Such ratio includes recapture of waived/reimbursed fees from prior periods amounting to less than 0.01% and 0.01% for the fiscal years ended 2022 and 2021, respectively. |
| 6 | Excludes the impact of expense reimbursement or fee waivers and expense reductions such as brokerage credits, but includes expense repayments and non-reimbursable expenses, if any, such as interest, taxes, and extraordinary expenses. (See Note 1(c) and 2 in the Notes to Financial Statements.) |
48
| | |
| | | AMG Yacktman Global Fund Financial Highlights For a share outstanding throughout each fiscal year |
| | | | | | | | | | | | | | | | | | | | |
| | | For the fiscal years ended December 31, |
| | | | | |
| Class N | | 2022 | | 2021 | | 2020 | | 2019 | | 2018 |
| | | | | | | | | | | | | | | | | | | | |
| | | | | |
Net Asset Value, Beginning of Year | | | $16.36 | | | | $15.69 | | | | $13.90 | | | | $11.94 | | | | $11.77 | |
| | | | | |
Income (loss) from Investment Operations: | | | | | | | | | | | | | | | | | | | | |
| | | | | |
Net investment income1,2 | | | 0.21 | | | | 0.19 | 3 | | | 0.18 | | | | 0.17 | | | | 0.26 | |
| | | | | |
Net realized and unrealized gain (loss) on investments | | | (1.74 | ) | | | 1.80 | | | | 2.35 | | | | 2.37 | | | | 0.00 | 4 |
| | | | | | | | | | | | | | | | | | | | |
| | | | | |
Total income (loss) from investment operations | | | (1.53 | ) | | | 1.99 | | | | 2.53 | | | | 2.54 | | | | 0.26 | |
| | | | | |
Less Distributions to Shareholders from: | | | | | | | | | | | | | | | | | | | | |
| | | | | |
Net investment income | | | — | | | | (0.55 | ) | | | (0.23 | ) | | | (0.25 | ) | | | (0.07 | ) |
| | | | | |
Net realized gain on investments | | | (0.62 | ) | | | (0.77 | ) | | | (0.51 | ) | | | (0.33 | ) | | | (0.02 | ) |
| | | | | | | | | | | | | | | | | | | | |
| | | | | |
Total distributions to shareholders | | | (0.62 | ) | | | (1.32 | ) | | | (0.74 | ) | | | (0.58 | ) | | | (0.09 | ) |
| | | | | |
Net Asset Value, End of Year | | | $14.21 | | | | $16.36 | | | | $15.69 | | | | $13.90 | | | | $11.94 | |
| | | | | | | | | | | | | | | | | | | | |
| | | | | |
Total Return2,5 | | | (9.31 | )% | | | 12.96 | % | | | 18.32 | % | | | 21.40 | % | | | 2.17 | % |
| | | | | |
Ratio of net expenses to average net assets | | | 1.13 | % | | | 1.16 | %6 | | | 1.19 | % | | | 1.12 | % | | | 1.08 | % |
| | | | | |
Ratio of gross expenses to average net assets7 | | | 1.17 | % | | | 1.18 | %6 | | | 1.25 | % | | | 1.22 | % | | | 1.82 | % |
| | | | | |
Ratio of net investment income to average net assets2 | | | 1.47 | % | | | 1.12 | % | | | 1.40 | % | | | 1.28 | % | | | 2.14 | % |
| | | | | |
Portfolio turnover | | | 11 | % | | | 17 | % | | | 27 | % | | | 23 | % | | | 2 | % |
| | | | | |
Net assets end of year (000’s) omitted | | | $1,354 | | | | $775 | | | | $431 | | | | $183 | | | | $76 | |
| | | | | | | | | | | | | | | | | | | | | |
49
| | |
| | | AMG Yacktman Global Fund Financial Highlights For a share outstanding throughout each fiscal year |
| | | | | | | | | | | | | | | | | | | | |
| | | For the fiscal years ended December 31, |
| | | | | |
| Class I | | 2022 | | 2021 | | 2020 | | 2019 | | 2018 |
| | | | | | | | | | | | | | | | | | | | |
| | | | | |
Net Asset Value, Beginning of Year | | | $16.36 | | | | $15.69 | | | | $13.89 | | | | $11.94 | | | | $11.77 | |
| | | | | |
Income (loss) from Investment Operations: | | | | | | | | | | | | | | | | | | | | |
| | | | | |
Net investment income1,2 | | | 0.25 | | | | 0.22 | 3 | | | 0.20 | | | | 0.17 | | | | 0.26 | |
| | | | | |
Net realized and unrealized gain (loss) on investments | | | (1.74 | ) | | | 1.79 | | | | 2.35 | | | | 2.36 | | | | 0.00 | 4 |
| | | | | | | | | | | | | | | | | | | | |
| | | | | |
Total income (loss) from investment operations | | | (1.49 | ) | | | 2.01 | | | | 2.55 | | | | 2.53 | | | | 0.26 | |
| | | | | |
Less Distributions to Shareholders from: | | | | | | | | | | | | | | | | | | | | |
| | | | | |
Net investment income | | | — | | | | (0.57 | ) | | | (0.24 | ) | | | (0.25 | ) | | | (0.07 | ) |
| | | | | |
Net realized gain on investments | | | (0.62 | ) | | | (0.77 | ) | | | (0.51 | ) | | | (0.33 | ) | | | (0.02 | ) |
| | | | | | | | | | | | | | | | | | | | |
| | | | | |
Total distributions to shareholders | | | (0.62 | ) | | | (1.34 | ) | | | (0.75 | ) | | | (0.58 | ) | | | (0.09 | ) |
| | | | | |
Net Asset Value, End of Year | | | $14.25 | | | | $16.36 | | | | $15.69 | | | | $13.89 | | | | $11.94 | |
| | | | | | | | | | | | | | | | | | | | |
| | | | | |
Total Return2,5 | | | (9.06 | )% | | | 13.08 | % | | | 18.47 | % | | | 21.32 | % | | | 2.17 | % |
| | | | | |
Ratio of net expenses to average net assets | | | 0.93 | % | | | 1.00 | %6 | | | 1.08 | % | | | 1.08 | % | | | 1.08 | % |
| | | | | |
Ratio of gross expenses to average net assets7 | | | 0.97 | % | | | 1.02 | %6 | | | 1.15 | % | | | 1.19 | % | | | 1.82 | % |
| | | | | |
Ratio of net investment income to average net assets2 | | | 1.67 | % | | | 1.28 | % | | | 1.51 | % | | | 1.31 | % | | | 2.14 | % |
| | | | | |
Portfolio turnover | | | 11 | % | | | 17 | % | | | 27 | % | | | 23 | % | | | 2 | % |
| | | | | |
Net assets end of year (000’s) omitted | | | $149,491 | | | | $170,316 | | | | $132,758 | | | | $96,041 | | | | $59,936 | |
| | | | | | | | | | | | | | | | | | | | | |
| 1 | Per share numbers have been calculated using average shares. |
| 2 | Total returns and net investment income would have been lower had certain expenses not been offset. |
| 3 | Includes non-recurring dividends. Without these dividends, net investment income per share would have been $0.15 and $0.17 for Class N and Class I, respectively. |
| 4 | Less than $0.005 per share. |
| 5 | The total return is calculated using the published Net Asset Value as of fiscal year end. |
| 6 | Such ratio includes recapture of waived/reimbursed fees from prior periods amounting to less than 0.01%. |
| 7 | Excludes the impact of expense reimbursement or fee waivers and expense reductions such as brokerage credits, but includes expense repayments and non-reimbursable expenses, if any, such as interest, taxes, and extraordinary expenses. (See Note 1(c) and 2 in the Notes to Financial Statements.) |
50
| | |
| | | AMG Yacktman Special Opportunities Fund Financial Highlights For a share outstanding throughout each fiscal year |
| | | | | | | | | | | | | | | | | | | | |
| | | For the fiscal years ended December 31, |
| | | | | |
| Class I | | 2022 | | 2021 | | 2020 | | 2019 | | 2018 |
| | | | | | | | | | | | | | | | | | | | |
| | | | | |
Net Asset Value, Beginning of Year | | | $13.16 | | | | $11.02 | | | | $10.04 | | | | $9.82 | | | | $12.03 | |
| | | | | |
Income (loss) from Investment Operations: | | | | | | | | | | | | | | | | | | | | |
| | | | | |
Net investment income (loss)1,2 | | | 0.08 | | | | (0.01 | ) | | | 0.20 | 3 | | | 0.24 | | | | 0.16 | |
| | | | | |
Net realized and unrealized gain (loss) on investments | | | (1.87 | ) | | | 2.65 | | | | 1.06 | | | | 0.73 | | | | (1.41 | ) |
| | | | | | | | | | | | | | | | | | | | |
| | | | | |
Total income (loss) from investment operations | | | (1.79 | ) | | | 2.64 | | | | 1.26 | | | | 0.97 | | | | (1.25 | ) |
| | | | | |
Less Distributions to Shareholders from: | | | | | | | | | | | | | | | | | | | | |
| | | | | |
Net investment income | | | — | | | | (0.15 | ) | | | (0.23 | ) | | | (0.21 | ) | | | (0.11 | ) |
| | | | | |
Net realized gain on investments | | | (0.10 | ) | | | (0.35 | ) | | | (0.05 | ) | | | (0.54 | ) | | | (0.85 | ) |
| | | | | | | | | | | | | | | | | | | | |
| | | | | |
Total distributions to shareholders | | | (0.10 | ) | | | (0.50 | ) | | | (0.28 | ) | | | (0.75 | ) | | | (0.96 | ) |
| | | | | |
Net Asset Value, End of Year | | | $11.27 | | | | $13.16 | | | | $11.02 | | | | $10.04 | | | | $9.82 | |
| | | | | | | | | | | | | | | | | | | | |
| | | | | |
Total Return2,4 | | | (13.59 | )% | | | 24.30 | % | | | 12.66 | % | | | 10.20 | % | | | (10.26 | )% |
| | | | | |
Ratio of net expenses to average net assets5 | | | 1.96 | %6 | | | 2.29 | %6 | | | 1.14 | % | | | 1.29 | % | | | 1.84 | % |
| | | | | |
Ratio of gross expenses to average net assets5,7 | | | 2.00 | %6 | | | 2.29 | %6 | | | 1.23 | % | | | 1.47 | % | | | 2.03 | % |
| | | | | |
Ratio of net investment income (loss) to average net assets2,5 | | | 0.69 | % | | | (0.09 | )% | | | 2.27 | % | | | 2.32 | % | | | 1.38 | % |
| | | | | |
Portfolio turnover | | | 40 | % | | | 21 | % | | | 37 | % | | | 24 | % | | | 30 | % |
| | | | | |
Net assets end of year (000’s) omitted | | | $47,024 | | | | $33,912 | | | | $13,881 | | | | $11,701 | | | | $7,678 | |
| | | | | | | | | | | | | | | | | | | | | |
51
| | |
| | | AMG Yacktman Special Opportunities Fund Financial Highlights For a share outstanding throughout each fiscal year |
| | | | | | | | | | | | | | | | | | | | |
| | | For the fiscal years ended December 31, |
| | | | | |
| Class Z | | 2022 | | 2021 | | 2020 | | 2019 | | 2018 |
| | | | | | | | | | | | | | | | | | | | |
| | | | | |
Net Asset Value, Beginning of Year | | | $13.20 | | | | $11.04 | | | | $10.06 | | | | $9.84 | | | | $12.05 | |
| | | | | |
Income (loss) from Investment Operations: | | | | | | | | | | | | | | | | | | | | |
| | | | | |
Net investment income1,2 | | | 0.10 | | | | 0.00 | 8 | | | 0.21 | 3 | | | 0.25 | | | | 0.17 | |
| | | | | |
Net realized and unrealized gain (loss) on investments | | | (1.88 | ) | | | 2.67 | | | | 1.06 | | | | 0.72 | | | | (1.40 | ) |
| | | | | | | | | | | | | | | | | | | | |
| | | | | |
Total income (loss) from investment operations | | | (1.78 | ) | | | 2.67 | | | | 1.27 | | | | 0.97 | | | | (1.23 | ) |
| | | | | |
Less Distributions to Shareholders from: | | | | | | | | | | | | | | | | | | | | |
| | | | | |
Net investment income | | | (0.01 | ) | | | (0.16 | ) | | | (0.24 | ) | | | (0.21 | ) | | | (0.13 | ) |
| | | | | |
Net realized gain on investments | | | (0.10 | ) | | | (0.35 | ) | | | (0.05 | ) | | | (0.54 | ) | | | (0.85 | ) |
| | | | | | | | | | | | | | | | | | | | |
| | | | | |
Total distributions to shareholders | | | (0.11 | ) | | | (0.51 | ) | | | (0.29 | ) | | | (0.75 | ) | | | (0.98 | ) |
| | | | | |
Net Asset Value, End of Year | | | $11.31 | | | | $13.20 | | | | $11.04 | | | | $10.06 | | | | $9.84 | |
| | | | | | | | | | | | | | | | | | | | |
| | | | | |
Total Return2,4 | | | (13.57 | )% | | | 24.42 | % | | | 12.83 | % | | | 10.27 | % | | | (10.14 | )% |
| | | | | |
Ratio of net expenses to average net assets5 | | | 1.86 | %6 | | | 2.19 | %6 | | | 1.04 | % | | | 1.19 | % | | | 1.74 | % |
| | | | | |
Ratio of gross expenses to average net assets5,7 | | | 1.90 | %6 | | | 2.19 | %6 | | | 1.13 | % | | | 1.37 | % | | | 1.93 | % |
| | | | | |
Ratio of net investment income to average net assets2,5 | | | 0.79 | % | | | 0.01 | % | | | 2.37 | % | | | 2.42 | % | | | 1.48 | % |
| | | | | |
Portfolio turnover | | | 40 | % | | | 21 | % | | | 37 | % | | | 24 | % | | | 30 | % |
| | | | | |
Net assets end of year (000’s) omitted | | | $36,782 | | | | $78,197 | | | | $64,908 | | | | $47,981 | | | | $29,153 | |
| | | | | | | | | | | | | | | | | | | | | |
| 1 | Per share numbers have been calculated using average shares. |
| 2 | Total returns and net investment income (loss) would have been lower had certain expenses not been offset. |
| 3 | Includes non-recurring dividends. Without these dividends, net investment income per share would have been $0.17 and $0.18 for Class I and Class Z, respectively. |
| 4 | The total return is calculated using the published Net Asset Value as of fiscal year end. |
| 5 | Includes a performance adjustment amounting to 0.22%, 0.55%, (0.60)%, (0.45)% and 0.10% for the fiscal years ended 2022, 2021, 2020, 2019 and 2018, respectively. (See Note 2 in the Notes to Financial Statements) |
| 6 | Such ratio includes recapture of waived/reimbursed fees from prior periods amounting to 0.01%. |
| 7 | Excludes the impact of expense reimbursement or fee waivers and expense reductions such as brokerage credits, but includes expense repayments and non-reimbursable expenses, if any, such as interest, taxes, and extraordinary expenses. (See Note 1(c) and 2 in the Notes to Financial Statements.) |
| 8 | Less than $0.005 per share. |
52
| | |
| | | Notes to Financial Statements December 31, 2022 |
| | | |
| | | |
1. ORGANIZATION AND SUMMARY OF SIGNIFICANT ACCOUNTING POLICIES
AMG Funds (the “Trust”) is an open-end management investment company, organized as a Massachusetts business trust, and registered under the Investment Company Act of 1940, as amended (the “1940 Act”). Currently, the Trust consists of a number of different funds, each having distinct investment management objectives, strategies, risks, and policies. Included in this report are AMG Yacktman Fund (“Yacktman Fund”), AMG Yacktman Focused Fund (“Yacktman Focused”), AMG Yacktman Global Fund (“Yacktman Global”) and AMG Yacktman Special Opportunities Fund (“Yacktman Special Opportunities”), each a “Fund” and collectively, the “Funds”.
Each Fund offers different classes of shares. Yacktman Fund and Yacktman Special Opportunities have established Class N, Class I and Class Z shares. Currently, Yacktman Fund offers only Class I shares and Yacktman Special Opportunities offers only Class I shares and Class Z shares. Yacktman Focused and Yacktman Global established and offer Class N and Class I shares. Each class represents an interest in the same assets of the respective Fund. Although all share classes generally have identical voting rights, each share class votes separately when required by law. Different share classes may have different net asset values per share to the extent the share classes pay different distribution amounts and/or the expenses of such share classes differ. Each share class has its own expense structure. Please refer to a current prospectus for additional information on each share class.
Yacktman Focused, Yacktman Global and Yacktman Special Opportunities are non-diversified. A greater percentage of the Funds’ holdings may be focused in a smaller number of securities which may place the Funds at greater risk than a more diversified fund.
Market prices of investments held by the Funds may fall rapidly or unpredictably due to a variety of economic or political factors, market conditions, disasters or public health issues, or in response to events that affect particular industries or companies.
The Funds’ financial statements are prepared in accordance with accounting principles generally accepted in the United States of America (“U.S. GAAP”), including accounting and reporting guidance pursuant to Accounting Standards Codification Topic 946 applicable to investment companies. U.S. GAAP requires management to make estimates and assumptions that affect the reported amounts of assets and liabilities and disclosure of contingent assets and liabilities at the date of the financial statements and the reported amounts of income and expenses during the reporting period. Actual results could differ from those estimates and such differences could be material. The following is a summary of significant accounting policies followed by the Funds in the preparation of their financial statements:
a. VALUATION OF INVESTMENTS
For the Funds, equity securities, including options, traded on a national securities exchange or reported on the NASDAQ national market system (“NMS”) are valued at the last quoted sales price on the primary exchange or, if applicable, the NASDAQ official closing price or the official closing price of the relevant exchange or, lacking any sales, at the last quoted bid price. Equity securities held by the Funds that are traded in the over-the-counter market (other than NMS securities) are valued at the bid price. Foreign equity securities (securities principally traded in markets other than U.S. markets) held by the Funds are valued at the official
closing price on the primary exchange or, for markets that either do not offer an official closing price or where the official closing price may not be representative of the overall market, the last quoted sale price.
Fixed income securities purchased with a remaining maturity exceeding 60 days are valued at the evaluated bid price provided by an authorized pricing service or, if an evaluated price is not available, by reference to other securities which are considered comparable in credit rating, interest rate, due date and other features (generally referred to as “matrix pricing”) or other similar pricing methodologies.
Fixed income securities purchased with a remaining maturity of 60 days or less are valued at amortized cost, provided that the amortized cost value is approximately the same as the fair value of the security valued without the use of amortized cost. Investments in other open-end registered investment companies are valued at their end of day net asset value per share.
The Funds’ portfolio investments are generally valued based on independent market quotations or prices or, if none, “evaluative” or other market based valuations provided by third party pricing services approved by the Board of Trustees of the Trust (the “Board”). Under certain circumstances, the value of certain Fund portfolio investments may be based on an evaluation of fair value, pursuant to procedures established by and under the general supervision of the Board. The Valuation Committee, which is comprised of the Independent Trustees of the Board, and the Pricing Committee, which is comprised of representatives from AMG Funds LLC (the “Investment Manager”) are the committees appointed by the Board to make fair value determinations. Each Fund may use the fair value of a portfolio investment to calculate its net asset value (“NAV”) in the event that the market quotation, price or market based valuation for the portfolio investment is not readily available or otherwise not determinable pursuant to the Board’s valuation procedures, if the Investment Manager or the Pricing Committee believes the quotation, price or market based valuation to be unreliable, or in certain other circumstances. When determining the fair value of an investment, the Pricing Committee and, if required under the Trust’s securities valuation procedures, the Valuation Committee, seeks to determine the price that a Fund might reasonably expect to receive from current sale of that portfolio investment in an arms-length transaction. Fair value determinations shall be based upon consideration of all available facts and information, including, but not limited to (i) attributes specific to the investment; (ii) fundamental and analytical data relating to the investment; and (iii) the value of other comparable securities or relevant financial instruments, including derivative securities, traded on other markets or among dealers.
The values assigned to fair value portfolio investments are based on available information and do not necessarily represent amounts that might ultimately be realized in the future, since such amounts depend on future developments inherent in long-term investments. Because of the inherent uncertainty of valuation, those estimated values may differ significantly from the values that would have been used had a ready market for the investments existed, and the differences could be material. The Board will be presented with a quarterly report showing as of the most recent quarter end, all outstanding securities fair valued by the Funds, including a comparison with the prior quarter end and the percentage of the Funds that the security represents at each quarter end.
With respect to foreign equity securities and certain foreign fixed income securities, the Board has adopted a policy that securities held in the Funds that can be fair valued by the applicable fair value pricing service are fair valued on each business day provided that each individual price exceeds a pre-established confidence level.
53
| | |
| | | Notes to Financial Statements (continued) |
| | | |
| | | |
Effective September 8, 2022, the Funds adopted the requirements of Rule 2a-5 under the 1940 Act (“Rule 2a-5”), which the Funds’ Board designated the Funds’ Investment Manager as the Funds’ Valuation Designee to perform the Funds’ fair value determinations. Such determinations are subject to Board oversight and certain reporting and other requirements intended to ensure that the Board receives the information it needs to oversee the Investment Manager’s fair value determinations. Other than the designation of the Investment Manager as the Valuation Designee, the Funds’ adoption of Rule 2-a5 did not impact how the Funds determine fair value or the carrying amount of investments held in the Funds.
U.S. GAAP defines fair value as the price that a fund would receive to sell an asset or pay to transfer a liability in an orderly transaction between market participants at the measurement date. U.S. GAAP also establishes a framework for measuring fair value, and a three level hierarchy for fair value measurements based upon the transparency of inputs to the valuation of an asset or liability. Inputs may be observable or unobservable and refer broadly to the assumptions that market participants would use in pricing the asset or liability. Observable inputs reflect the assumptions market participants would use in pricing the asset or liability based on market data obtained from sources independent of the Funds.
Unobservable inputs reflect the Funds’ own assumptions about the assumptions that market participants would use in pricing the asset or liability developed based on the best information available in the circumstances. Each investment is assigned a level based upon the observability of the inputs which are significant to the overall valuation.
The three-tier hierarchy of inputs is summarized below:
Level 1 – inputs are quoted prices in active markets for identical investments (e.g., equity securities, open-end investment companies)
Level 2 – other observable inputs (including, but not limited to: quoted prices for similar assets or liabilities in markets that are active, quoted prices for identical or similar assets or liabilities in markets that are not active, inputs other than quoted prices that are observable for the assets or liabilities (such as interest rates, yield curves, volatilities, prepayment speeds, loss severities, credit risks and default rates) or other market corroborated inputs) (e.g., debt securities, government securities, foreign currency exchange contracts, foreign securities utilizing international fair value pricing, fair valued securities with observable inputs)
Level 3 – inputs are significant unobservable inputs (including the Fund’s own assumptions used to determine the fair value of investments) (e.g., fair valued securities with unobservable inputs)
Changes in inputs or methodologies used for valuing investments may result in a transfer in or out of levels within the fair value hierarchy. The inputs or methodologies used for valuing investments may not necessarily be an indication of the risk associated with investing in those investments.
b. SECURITY TRANSACTIONS
Security transactions are accounted for as of trade date. Realized gains and losses on securities sold are determined on the basis of identified cost.
c. INVESTMENT INCOME AND EXPENSES
Dividend income is recorded on the ex-dividend date. Dividends from foreign securities are recorded on the ex-dividend date, and if after the fact, as soon as the Funds become aware of the ex-dividend date, except for Korean securities where dividends are recorded on confirmation date. Interest income, which includes amortization of premium and accretion of discount on debt securities, is accrued as earned. Dividend and interest income on foreign securities is recorded gross of any withholding tax. Non-cash dividends included in dividend income, if any, are reported at the fair market value of the securities received. Expenses that cannot be directly attributed to a Fund are apportioned among the funds in the Trust and other trusts or funds within the AMG Funds Family of Funds (collectively the “AMG Funds Family”) based upon their relative average net assets or number of shareholders. Investment income, realized and unrealized capital gains and losses, the common expenses of each Fund, and certain fund level expense reductions, if any, are allocated on a pro-rata basis to each class based on the relative net assets of each class to the total net assets of each Fund.
d. DIVIDENDS AND DISTRIBUTIONS
Fund distributions resulting from either net investment income or realized net capital gains, if any, will normally be declared and paid at least annually in December. Distributions to shareholders are recorded on the ex-dividend date. Distributions are determined in accordance with federal income tax regulations, which may differ from net investment income and net realized capital gains for financial statement purposes (U.S. GAAP). Differences may be permanent or temporary. Permanent differences are reclassified among capital accounts in the financial statements to reflect their tax character. Permanent book and tax basis differences, if any, relating to shareholder distributions will result in reclassifications to paid-in capital. Temporary differences arise when certain items of income, expense and gain or loss are recognized in different periods for financial statement and tax purposes; these differences will reverse at some time in the future. Permanent differences are primarily due to tax equalization utilized for Yacktman Fund, Yacktman Focused, and Yacktman Special Opportunities, and write-off of net operating losses for Yacktman Global. Temporary differences are primarily due to write-off of outstanding defaulted securities interest for Yacktman Fund, Yacktman Focused and Yacktman Global, and premium amortization on callable bonds for Yacktman Focused. In addition, temporary differences for each Fund are wash sale loss deferrals, and mark-to-market on passive foreign investment companies.
54
| | |
| | | Notes to Financial Statements (continued) |
| | | |
| | | |
The tax character of distributions paid during the fiscal years ended December 31, 2022 and December 31, 2021 were as follows:
| | | | | | | | | | | | | | | | |
| | |
| | | Yacktman Fund | | | Yacktman Focused | |
| | | | |
Distributions paid from: | | | 2022 | | | | 2021 | | | | 2022 | | | | 2021 | |
| | | | |
Ordinary income * | | | $118,514,921 | | | | $151,346,324 | | | | $43,003,314 | | | | $62,421,779 | |
| | | | |
Long-term capital gains | | | 438,946,811 | | | | 190,374,385 | | | | 215,894,721 | | | | 144,637,612 | |
| | | | | | | | | | | | | | | | |
| | | | |
| | | $557,461,732 | | | | $341,720,709 | | | | $258,898,035 | | | | $207,059,391 | |
| | | | | | | | | | | | | | | | |
| | | | |
| | | | | | | | | | | | | | | | |
| | |
| | | Yacktman Global | | | Yacktman Special Opportunities | |
| | | | |
Distributions paid from: | | | 2022 | | | | 2021 | | | | 2022 | | | | 2021 | |
| | | | |
Ordinary income * | | | $179,704 | | | | $6,426,529 | | | | $22,911 | | | | $1,382,618 | |
| | | | |
Long-term capital gains | | | 6,133,798 | | | | 6,379,485 | | | | 718,767 | | | | 2,784,294 | |
| | | | | | | | | | | | | | | | |
| | | | |
| | | $6,313,502 | | | | $12,806,014 | | | | $741,678 | | | | $4,166,912 | |
| | | | | | | | | | | | | | | | |
| * | For tax purposes, short-term capital gain distributions, if any, are considered ordinary income distributions. |
As of December 31, 2022, the components of distributable earnings (excluding unrealized appreciation/depreciation) on a tax basis consisted of:
| | | | | | | | | | | | | | | | |
| | | | |
| | | Yacktman Fund | | | Yacktman Focused | | | Yacktman Global | | | Yacktman Special Opportunities | |
| | | | |
Undistributed ordinary income | | | $3,088,100 | | | | $381,156 | | | | — | | | | $159,614 | |
| | | | |
Undistributed long-term capital gains | | | 29,051,446 | | | | 429,621 | | | | $927,876 | | | | 402,891 | |
At December 31, 2022, the cost of investments and the aggregate gross unrealized appreciation and depreciation for federal income tax purposes were as follows:
| | | | | | | | | | | | | | | | |
| | | | |
| Fund | | Cost | | | Appreciation | | | Depreciation | | | Net Appreciation | |
| | | | |
Yacktman Fund | | | $5,771,422,321 | | | | $2,470,708,442 | | | | $(288,677,251 | ) | | | $2,182,031,191 | |
| | | | |
Yacktman Focused | | | 2,734,538,158 | | | | 923,720,161 | | | | (145,166,773 | ) | | | 778,553,388 | |
| | | | |
Yacktman Global | | | 141,170,717 | | | | 22,565,219 | | | | (14,316,464 | ) | | | 8,248,755 | |
| | | | |
Yacktman Special Opportunities | | | 77,597,592 | | | | 16,426,659 | | | | (9,924,803 | ) | | | 6,501,856 | |
e. FEDERAL TAXES
Each Fund currently qualifies as an investment company and intends to comply with the requirements under Subchapter M of the Internal Revenue Code of 1986, as amended, and to distribute substantially all of its taxable income and gains to its shareholders and to meet certain diversification and income requirements with respect to investment companies. Therefore, no provision for federal income or excise tax is included in the accompanying financial statements.
Additionally, based on each Fund’s understanding of the tax rules and rates related to income, gains and transactions for the foreign jurisdictions in which it invests, each Fund will provide for foreign taxes, and where appropriate, deferred foreign taxes.
Management has analyzed the Funds’ tax positions taken on federal income tax returns as of December 31, 2022, and for all open tax years (generally, the three prior taxable years), and has concluded that no provision for federal income tax is required in the Funds’ financial statements. Additionally, Management is not aware of any tax position for which it is reasonably possible that the total amounts of unrecognized tax benefits will change materially in the next twelve months.
f. CAPITAL LOSS CARRYOVERS AND DEFERRALS
As of December 31, 2022, the Funds had no capital loss carryovers for federal income tax purposes. Should the Funds incur net capital losses for the fiscal year ended December 31, 2023, such amounts may be used to offset future realized capital gains indefinitely, and retain their character as short-term and/or long-term.
55
| | |
| | | Notes to Financial Statements (continued) |
| | | |
| | | |
g. CAPITAL STOCK
The Trust’s Declaration of Trust authorizes for each Fund the issuance of an unlimited number of shares of beneficial interest, without par value. Each Fund records sales and repurchases of its capital stock on the trade date.
For the fiscal years ended December 31, 2022 and December 31, 2021, the capital stock transactions by class for the Funds were as follows:
| | | | | | | | | | | | | | | | | | | | | | | | | | | | | | | | |
| | | Yacktman Fund | | | Yacktman Focused | |
| | | | |
| | | December 31, 2022 | | | December 31, 2021 | | | December 31, 2022 | | | December 31, 2021 | |
| | | | | | | | |
| | | Shares | | | Amount | | | Shares | | | Amount | | | Shares | | | Amount | | | Shares | | | Amount | |
| | | | | | | | |
Class N: | | | | | | | | | | | | | | | | | | | | | | | | | | | | | | | | |
| | | | | | | | |
Shares sold | | | — | | | | — | | | | — | | | | — | | | | 5,851,238 | | | | $115,544,774 | | | | 12,333,437 | | | | $256,707,747 | |
| | | | | | | | |
Shares issued in reinvestment of distributions | | | — | | | | — | | | | — | | | | — | | | | 6,834,816 | | | | 122,548,252 | | | | 4,655,934 | | | | 96,331,267 | |
| | | | | | | | |
Shares redeemed | | | — | | | | — | | | | — | | | | — | | | | (18,963,976) | | | | (369,705,319) | | | | (17,004,392) | | | | (357,061,246) | |
| | | | | | | | | | | | | | | | | | | | | | | | | | | | | | | | |
| | | | | | | | |
Net decrease | | | — | | | | — | | | | — | | | | — | | | | (6,277,922) | | | | $(131,612,293) | | | | (15,021) | | | | $(4,022,232) | |
| | | | | | | | | | | | | | | | | | | | | | | | | | | | | | | | |
| | | | | | | | |
Class I: | | | | | | | | | | | | | | | | | | | | | | | | | | | | | | | | |
| | | | | | | | |
Shares sold | | | 45,550,372 | | | | $1,044,334,856 | | | | 72,181,278 | | | | $1,697,348,269 | | | | 19,648,527 | | | | $385,717,991 | | | | 38,413,804 | | | | $795,771,915 | |
| | | | | | | | |
Shares issued in reinvestment of distributions | | | 24,225,869 | | | | 507,774,202 | | | | 12,951,322 | | | | 309,536,595 | | | | 6,836,097 | | | | 122,024,342 | | | | 4,812,345 | | | | 99,182,433 | |
| | | | | | | | |
Shares redeemed | | | (79,153,813) | | | | (1,793,770,180) | | | | (57,592,354) | | | | (1,366,650,130) | | | | (35,653,583) | | | | (693,613,541) | | | | (23,041,575) | | | | (481,597,993) | |
| | | | | | | | | | | | | | | | | | | | | | | | | | | | | | | | |
| | | | | | | | |
Net increase (decrease) | | | (9,377,572) | | | | $(241,661,122) | | | | 27,540,246 | | | | $640,234,734 | | | | (9,168,959) | | | | $(185,871,208) | | | | 20,184,574 | | | | $413,356,355 | |
| | | | | | | | | | | | | | | | | | | | | | | | | | | | | | | | |
| | |
| | | Yacktman Global | | | Yacktman Special Opportunities | |
| | | | |
| | | December 31, 2022 | | | December 31, 2021 | | | December 31, 2022 | | | December 31, 2021 | |
| | | | | | | | |
| | | Shares | | | Amount | | | Shares | | | Amount | | | Shares | | | Amount | | | Shares | | | Amount | |
| | | | | | | | |
Class N: | | | | | | | | | | | | | | | | | | | | | | | | | | | | | | | | |
| | | | | | | | |
Shares sold | | | 74,515 | | | | $1,120,463 | | | | 20,664 | | | | $355,714 | | | | — | | | | — | | | | — | | | | — | |
| | | | | | | | |
Shares issued in reinvestment of distributions | | | 3,664 | | | | 51,082 | | | | 3,350 | | | | 53,059 | | | | — | | | | — | | | | — | | | | — | |
| | | | | | | | |
Shares redeemed | | | (30,314) | | | | (433,176) | | | | (4,132) | | | | (70,442) | | | | — | | | | — | | | | — | | | | — | |
| | | | | | | | | | | | | | | | | | | | | | | | | | | | | | | | |
| | | | | | | | |
Net increase | | | 47,865 | | | | $738,369 | | | | 19,882 | | | | $338,331 | | | | — | | | | — | | | | — | | | | — | |
| | | | | | | | | | | | | | | | | | | | | | | | | | | | | | | | |
| | | | | | | | |
Class I: | | | | | | | | | | | | | | | | | | | | | | | | | | | | | | | | |
| | | | | | | | |
Shares sold | | | 1,323,636 | | | | $19,495,639 | | | | 2,356,876 | | | | $40,663,325 | | | | 3,377,460 | | | | $40,334,837 | | | | 1,433,118 | | | | $18,442,723 | |
| | | | | | | | |
Shares issued in reinvestment of distributions | | | 275,730 | | | | 3,851,950 | | | | 518,086 | | | | 8,206,477 | | | | 35,664 | | | | 398,371 | | | | 96,992 | | | | 1,234,713 | |
| | | | | | | | |
Shares redeemed | | | (1,513,839) | | | | (21,845,570) | | | | (928,902) | | | | (16,211,419) | | | | (1,818,251) | | | | (21,433,664) | | | | (214,076) | | | | (2,794,549) | |
| | | | | | | | | | | | | | | | | | | | | | | | | | | | | | | | |
| | | | | | | | |
Net increase | | | 85,527 | | | | $1,502,019 | | | | 1,946,060 | | | | $32,658,383 | | | | 1,594,873 | | | | $19,299,544 | | | | 1,316,034 | | | | $16,882,887 | |
| | | | | | | | | | | | | | | | | | | | | | | | | | | | | | | | |
| | | | | | | | |
Class Z: | | | | | | | | | | | | | | | | | | | | | | | | | | | | | | | | |
| | | | | | | | |
Shares sold | | | — | | | | — | | | | — | | | | — | | | | 101,193 | | | | $1,143,070 | | | | 37,324 | | | | $488,315 | |
| | | | | | | | |
Shares issued in reinvestment of distributions | | | — | | | | — | | | | — | | | | — | | | | 17,985 | | | | 201,613 | | | | 176,361 | | | | 2,252,128 | |
| | | | | | | | |
Shares redeemed | | | — | | | | — | | | | — | | | | — | | | | (2,790,318) | | | | (32,778,211) | | | | (167,817) | | | | (2,347,428) | |
| | | | | | | | | | | | | | | | | | | | | | | | | | | | | | | | |
| | | | | | | | |
Net increase (decrease) | | | — | | | | — | | | | — | | | | — | | | | (2,671,140) | | | | $(31,433,528) | | | | 45,868 | | | | $393,015 | |
| | | | | | | | | | | | | | | | | | | | | | | | | | | | | | | | |
At December 31, 2022, certain unaffiliated shareholders of record individually or collectively held greater than 5% of the net assets of the Funds as follows: Yacktman Special Opportunities - one owns 9%. Transactions by this shareholder may have a material impact on their respective Fund.
56
| | |
| | | Notes to Financial Statements (continued) |
| | | |
| | | |
h. REPURCHASE AGREEMENTS AND JOINT REPURCHASE AGREEMENTS
The Funds may enter into third-party and bilateral repurchase agreements for temporary cash management purposes and third-party or bilateral joint repurchase agreements for reinvestment of cash collateral on securities lending transactions under the securities lending program offered by The Bank of New York Mellon (“BNYM”) (the “Program”) (collectively, “Repurchase Agreements”). The value of the underlying collateral, including accrued interest, must equal or exceed the value of the Repurchase Agreements during the term of the agreement. For joint repurchase agreements, the Funds participate on a pro rata basis with other clients of BNYM in its share of the underlying collateral under such joint repurchase agreements and in its share of proceeds from any repurchase or other disposition of the underlying collateral. The underlying collateral for all Repurchase Agreements is held in safekeeping by the Funds’ custodian or at the Federal Reserve Bank. If the seller defaults and the value of the collateral declines, or if bankruptcy proceedings commence with respect to the seller of the security, realization of the collateral by the Funds may be delayed or limited. Pursuant to the Program, the Funds are indemnified for such losses by BNYM on joint repurchase agreements.
At December 31, 2022, the market value of Repurchase Agreements outstanding for Yacktman Fund, Yacktman Focused Fund and Yacktman Special Opportunities were $5,503,957, $7,879,966 and $366,262, respectively.
i. FOREIGN CURRENCY TRANSLATION
The books and records of the Funds are maintained in U.S. Dollars. The value of investments, assets and liabilities denominated in currencies other than U.S. Dollars are translated into U.S. Dollars based upon current foreign exchange rates. Purchases and sales of foreign investments, income and expenses are converted into U.S. Dollars based on currency exchange rates prevailing on the respective dates of such transactions. Net realized and unrealized gain (loss) on foreign currency transactions represent: (1) foreign exchange gains and losses from the sale and holdings of foreign currencies; (2) gains and losses between trade date and settlement date on investment securities transactions and foreign currency exchange contracts; and (3) gains and losses from the difference between amounts of interest and dividends recorded and the amounts actually received.
The Funds do not isolate the net realized and unrealized gain or loss resulting from changes in exchange rates from the fluctuations in market prices of securities held. Such fluctuations are included with the net realized and unrealized gain or loss on investments.
2. AGREEMENTS AND TRANSACTIONS WITH AFFILIATES
For each of the Funds, the Trust has entered into an investment advisory agreement under which the Investment Manager, a subsidiary and the U.S. retail distribution arm of Affiliated Managers Group, Inc. (“AMG”), serves as investment manager to the Funds and is responsible for the Funds’ overall administration and operations. The Investment Manager selects one or more subadvisers for the Funds (subject to Board approval) and monitors each subadviser’s investment performance, security holdings and investment strategies. Each Fund’s investment portfolio is managed by Yacktman Asset Management LP (“Yacktman”) who serves pursuant to a subadvisory agreement with the Investment Manager. AMG indirectly owns a majority interest in Yacktman.
Investment management fees are paid directly by the Funds to the Investment Manager based on average daily net assets. For the fiscal year ended December 31, 2022, the Funds’ investment management fees were paid at the following annual rates of each Fund’s respective average daily net assets:
| | |
| |
Yacktman Fund | | |
| |
on first $500 million | | 0.52% |
| |
next $500 million | | 0.47% |
| |
over $1 billion | | 0.42% |
| |
Yacktman Focused | | 0.87% |
| |
Yacktman Global | | 0.71% |
| |
Yacktman Special Opportunities | | 1.37% |
The fee paid to Yacktman for its services as subadviser is paid out of the fee the Investment Manager receives from each Fund and does not increase the expenses of each Fund.
Yacktman Special Opportunities has a performance-based fee structure that consists of an investment management fee and a performance adjustment (“Performance Adjustment”). The monthly investment management fee is increased or reduced by the Performance Adjustment, based on the Fund’s performance relative to the MSCI ACWI All Cap Index over the then preceding twelve months. The Performance Adjustment for the Fund may not exceed plus or minus 0.75%. For the fiscal year ended December 31, 2022, the Performance Adjustment increased the management fee by a net amount of $221,902, resulting in an effective management fee rate of 1.59%.
The Investment Manager has contractually agreed, through at least May 1, 2023, to waive management fees and/or pay or reimburse fund expenses in order to limit total annual fund operating expenses after fee waiver and expense reimbursements (exclusive of taxes, interest (including interest incurred in connection with bank and custody overdrafts, and in connection with securities sold short), brokerage commissions and other transaction costs, dividends payable with respect to securities sold short, acquired fund fees and expenses, and extraordinary expenses, as well as shareholder servicing fees and distribution and service (12b-1) fees with respect to Yacktman Global and Yacktman Special Opportunities and investment management fees and administrative fees with respect to Yacktman Special Opportunities) of Yacktman Focused Class N shares, Yacktman Global and Yacktman Special Opportunities to the annual rate of 1.25%, 0.93% and 0.12%, respectively, of each Fund’s or share class’s average daily net assets (this annual rate or such other annual rate that may be in effect for the applicable Fund or share class from time to time, the “Expense Cap”), subject to later reimbursement by the applicable Fund or share class in certain circumstances. Prior to July 1, 2021, the expense limitation was 1.08% for Yacktman Global.
In general, for a period of up to 36 months after the date any amounts are paid, waived or reimbursed by the Investment Manager, the Investment Manager may recover such amounts from a Fund, provided that such repayment would not cause the Fund’s total annual operating expenses after fee waiver and expense reimbursements (exclusive of the items noted in the parenthetical above) to exceed either (i) the Expense Cap in effect at the time such amounts were paid, waived or reimbursed, or (ii) the Expense Cap in effect at the time of such repayment by the Fund.
57
| | |
| | | Notes to Financial Statements (continued) |
| | | |
| | | |
The contractual expense limitation may only be terminated in the event the Investment Manager or a successor ceases to be the investment manager of a Fund or a successor fund, by mutual agreement between the Investment Manager and the Board, or in the event of a Fund’s liquidation (unless the Fund is reorganized or is a party to a merger in which the surviving entity is successor to the accounting and performance information of a Fund).
At December 31, 2022, the Funds’ expiration of reimbursements subject to recoupment is as follows:
| | | | | | | | | | | | |
Expiration Period | | Yacktman Focused | | | Yacktman Global | | | Yacktman Special Opportunities | |
| | | |
Less than 1 year | | | — | | | | $69,647 | | | | $56,243 | |
| | | |
1-2 years | | | $10,884 | | | | 33,935 | | | | 4,331 | |
| | | |
2-3 years | | | 10,296 | | | | 54,795 | | | | 34,769 | |
| | | | | | | | | | | | |
| | | |
Total | | | $21,180 | | | | $158,377 | | | | $95,343 | |
| | | | | | | | | | | | |
The Investment Manager has agreed to waive a portion of its management fee in consideration of a shareholder servicing rebate that it has received from JPMorgan Distribution Services, Inc., with respect to direct investments in the JPMorgan U.S. Government Money Market Fund, IM Shares by Yacktman Fund and Yacktman Focused. For the fiscal year ended December 31, 2022, the investment management fees for Yacktman Fund and Yacktman Focused were reduced by $334,444 and $127,121, respectively, or less than 0.01% of average daily net assets.
The Trust, on behalf of the Funds, has entered into an amended and restated Administration Agreement under which the Investment Manager serves as the Funds’ administrator (the “Administrator”) and is responsible for all non-portfolio management aspects of managing the Funds’ operations, including administration and shareholder services to each Fund. Each Fund pays a fee to the Administrator at the rate of 0.15% per annum of the Fund’s average daily net assets for this service.
The Funds are distributed by AMG Distributors, Inc. (the “Distributor”), a wholly-owned subsidiary of the Investment Manager. The Distributor serves as the distributor and underwriter for each Fund and is a registered broker-dealer and member of the Financial Industry Regulatory Authority, Inc. (“FINRA”). Shares of each Fund will be continuously offered and will be sold directly to prospective purchasers and through brokers, dealers or other financial intermediaries who have executed selling agreements with the Distributor. Generally the Distributor bears all or a portion of the expenses of providing services pursuant to the distribution agreement, including the payment of the expenses relating to the distribution of prospectuses for sales purposes and any advertising or sales literature.
For Class N of Yacktman Focused and Yacktman Global and for Class I of Yacktman Fund and Yacktman Special Opportunities, the Board has approved reimbursement payments to the Investment Manager for shareholder servicing expenses (“shareholder servicing fees”) incurred. Shareholder servicing fees include payments to financial intermediaries, such as broker-dealers (including fund supermarket platforms), banks, and trust companies who provide shareholder recordkeeping, account servicing and other services. The Class N shares of Yacktman Focused and Yacktman Global and Class I shares of Yacktman Fund and Yacktman Special Opportunities may reimburse the Investment Manager for the actual amount incurred up to a maximum annual rate of each Class’s average daily net assets as shown in the table below.
The impact on the annualized expense ratios for the fiscal year ended December 31, 2022, were as follows:
| | | | | | | | | | | | |
| Fund | | Maximum Annual
Amount
Approved | | | Actual
Amount
Incurred | | | | |
| | | |
Yacktman Fund | | | | | | | | | | | | |
| | | |
Class I | | | 0.20% | | | | 0.09% | | | | | |
| | | |
Yacktman Focused | | | | | | | | | | | | |
| | | |
Class N | | | 0.20% | | | | 0.18% | | | | | |
| | | |
Yacktman Global | | | | | | | | | | | | |
| | | |
Class N | | | 0.20% | | | | 0.20% | | | | | |
| | | |
Yacktman Special Opportunities | | | | | | | | | | | | |
| | | |
Class I | | | 0.10% | | | | 0.10% | | | | | |
The Board provides supervision of the affairs of the Trust and other trusts within the AMG Funds Family. The Trustees of the Trust who are not affiliated with the Investment Manager receive an annual retainer and per meeting fees for regular, special and telephonic meetings, and they are reimbursed for out-of-pocket expenses incurred while carrying out their duties as Board members. The Chairman of the Board and the Audit Committee Chair receive additional annual retainers. Certain Trustees and Officers of the Funds are Officers and/or Directors of the Investment Manager, AMG and/or the Distributor.
The Securities and Exchange Commission (the “SEC”) granted an exemptive order that permits certain eligible funds in the AMG Funds Family to lend and borrow money for certain temporary purposes directly to and from other eligible funds in the AMG Funds Family. Participation in this interfund lending program is voluntary for both the borrowing and lending funds, and an interfund loan is only made if it benefits each participating fund. The Administrator manages the program according to procedures approved by the Board, and the Board monitors the operation of the program. An interfund loan must comply with certain conditions set out in the exemptive order, which are designed to assure fairness and protect all participating funds. The interest earned and interest paid on interfund loans are included on the Statement of Operations as interest income and interest expense, respectively. At December 31, 2022, the Funds had no interfund loans outstanding.
The following Funds utilized the interfund loan program during the fiscal year ended December 31, 2022 as follows:
| | | | | | | | | | | | | | | | | | | | |
Fund | | Average Lent | | | Number of Days | | | Interest Earned | | | Average Interest Rate | | | | |
| | | | | |
Yacktman Fund | | $ | 13,656,807 | | | | 23 | | | $ | 22,582 | | | | 2.624% | | | | | |
| | | | | |
Yacktman Focused | | | 8,128,100 | | | | 13 | | | | 7,157 | | | | 2.472% | | | | | |
| | | | | |
Yacktman Global | | | 502,173 | | | | 14 | | | | 557 | | | | 2.889% | | | | | |
| | | | | |
Yacktman Special Opportunities | | | 1,686,746 | | | | 15 | | | | 1,649 | | | | 2.379% | | | | | |
| | | | | |
Fund | | Average Borrowed | | | Number of Days | | | Interest Paid | | | Average Interest Rate | | | | |
| | | | | |
Yacktman Special Opportunities | | $ | 1,029,158 | | | | 5 | | | $ | 166 | | | | 1.175% | | | | | |
58
| | |
| | | Notes to Financial Statements (continued) |
| | | |
| | | |
3. PURCHASES AND SALES OF SECURITIES
Purchases and sales of securities (excluding short-term securities and U.S. Government Obligations) for the fiscal year ended December 31, 2022, were as follows:
| | | | | | | | |
| | | Long Term Securities | |
| | |
| Fund | | Purchases | | | Sales | |
| | |
Yacktman Fund | | | $774,125,593 | | | | $860,481,801 | |
| | |
Yacktman Focused | | | 442,615,157 | | | | 662,287,850 | |
| | |
Yacktman Global | | | 16,165,510 | | | | 21,607,829 | |
| | |
Yacktman Special Opportunities | | | 36,622,787 | | | | 50,790,266 | |
The Funds had no purchases or sales of U.S. Government Obligations during the fiscal year ended December 31, 2022.
4. PORTFOLIO SECURITIES LOANED
The Funds participate in the Program providing for the lending of securities to qualified borrowers. Securities lending income includes earnings of such temporary cash investments, plus or minus any rebate to a borrower. These earnings (after any rebate) are then divided between BNYM, as a fee for its services under the Program, and the Funds, according to agreed-upon rates. Collateral on all securities loaned is accepted in cash, U.S. Treasury Obligations or U.S. Government Agency Obligations. Collateral is maintained at a minimum level of 102% (105% in the case of certain foreign securities) of the market value, plus interest, if applicable, of investments on loan. It is the Funds’ policy to obtain additional collateral from or return excess collateral to the borrower by the end of the next business day, following the valuation date of the securities loaned. Therefore, the value of the collateral held may be temporarily less than the value of the securities on loan. Lending securities entails a risk of loss to the Funds if and to the extent that the market value of the securities loaned were to increase and the borrower did not increase the collateral accordingly, and the borrower fails to return the securities. Under the terms of the Program, the Funds are indemnified for such losses by BNYM. Cash collateral is held in separate omnibus accounts managed by BNYM, who is authorized to exclusively enter into joint repurchase agreements for that cash collateral. Securities collateral is held in separate omnibus accounts managed by BNYM and cannot be sold or pledged. BNYM bears the risk of any deficiency in the amount of the cash collateral available for return to the borrower due to any loss on the collateral invested. Loans of securities are terminable at any time and the borrower, after notice, is required to return borrowed securities as soon as practical, which is normally within three business days.
The value of securities loaned on positions held, cash collateral and securities collateral received at December 31, 2022, were as follows:
| | | | | | | | | | | | | | | | |
| Fund | | Securities
Loaned | | | Cash
Collateral
Received | | | Securities
Collateral
Received | | | Total Collateral
Received | |
| | | | |
Yacktman Fund | | | $46,523,866 | | | | $5,503,957 | | | | $42,371,141 | | | | $47,875,098 | |
| | | | |
Yacktman Focused | | | 11,289,472 | | | | 7,879,966 | | | | 3,733,872 | | | | 11,613,838 | |
| | | | |
Yacktman Special Opportunities | | | 1,895,633 | | | | 366,262 | | | | 1,580,020 | | | | 1,946,282 | |
The following table summarizes the securities received as collateral for securities lending at December 31, 2022:
| | | | | | |
| Fund | | Collateral Type | | Coupon Range | | Maturity Date Range |
| | | |
Yacktman Fund | | U.S. Treasury Obligations | | 0.000%-4.750% | | 02/07/23-11/15/51 |
| | | |
Yacktman Focused | | U.S. Treasury Obligations | | 0.125%-4.750% | | 01/31/24-11/15/51 |
| | | |
Yacktman Special Opportunities | | U.S. Treasury Obligations | | 0.125%-4.750% | | 01/31/24-11/15/51 |
5. FOREIGN SECURITIES
The Funds invest in securities of foreign entities and in instruments denominated in foreign currencies which involve risks not typically associated with investments in domestic securities. Non-domestic securities carry special risks, such as exposure to currency fluctuations, less developed or less efficient trading markets, political instability, a lack of company information, differing auditing and legal standards, and, potentially, less liquidity. A Fund’s investments in emerging market countries are exposed to additional risks. A Fund’s performance will be influenced by political, social and economic factors affecting companies in emerging market countries. Emerging market countries generally have economic structures that are less diverse and mature, and political systems that are less stable, than those of developed countries. Realized gains in certain countries may be subject to foreign taxes at the Fund level and the Fund would pay such foreign taxes at the appropriate rate for each jurisdiction.
6. COMMITMENTS AND CONTINGENCIES
Under the Trust’s organizational documents, its Trustees and Officers are indemnified against certain liabilities arising out of the performance of their duties to the Trust. In addition, in the normal course of business, the Funds may enter into contracts and agreements that contain a variety of representations and warranties, which provide general indemnifications. The maximum exposure to the Funds under these arrangements is unknown, as this would involve future claims that may be made against a Fund that have not yet occurred. However, based on experience, the Funds had no prior claims or losses and expect the risks of loss to be remote.
7. DERIVATIVE INSTRUMENTS
The following disclosures contain information on how and why certain Funds use derivative instruments, the credit risk and how derivative instruments affect the Fund’s financial position, and results of operations. The location and fair value amounts of these instruments on the Statement of Assets and Liabilities, and the realized gains and losses and changes in unrealized appreciation and depreciation on the Statement of Operations, each categorized by type of derivative contract, are included in a table at the end of the applicable Fund’s Schedule of Portfolio Investments.
For the fiscal year ended December 31, 2022, the average monthly balances of derivative financial instruments outstanding were as follows:
| | | | |
| | | Yacktman Focused | |
Options | | | | |
Average value of option contracts written | | | $3,305,380 | |
59
| | |
| | | Notes to Financial Statements (continued) |
| | | |
| | | |
8. OPTIONS
The Funds may purchase and write call options and put options on a variety of underlying securities and instruments, including, but not limited to, specific securities, securities indices, futures contracts and foreign currencies. A call option gives the purchaser the right to buy, and obligates the writer to sell, the underlying security or instrument at the agreed-upon price during the option period. A put option gives the purchaser the right to sell, and obligates the writer to buy, the underlying security or instrument at the agreed-upon price during the option period. Options purchased are recorded as an asset, while options written (sold) are recorded as liabilities. When a Fund writes options it bears the risk of an unfavorable change in the market value of the instrument underlying the written
option. When an option expires, the premium (original option value) is realized as a gain if the option was written or as a loss if the option was purchased. When the exercise of an option results in a cash settlement, the difference between the premium and the settlement proceeds is recognized as realized gain or loss. When securities are acquired or delivered upon exercise of an option, the acquisition cost or sale proceeds are adjusted by the amount of the premium. When an option is closed, the difference between the premium and the cost to close the position is realized as a gain or loss. At December 31, 2022, Yacktman Focused had cash collateral on deposit of $5,472,000, as shown on the Statement of Assets and Liabilities as Segregated cash at broker.
9. MASTER NETTING AGREEMENTS
The Funds may enter into master netting agreements with their counterparties for the Program, Repurchase Agreements and derivatives, which provide the right, in the event of default (including bankruptcy or insolvency) for the non-defaulting party to liquidate the collateral and calculate net exposure to the defaulting party or request additional collateral. For financial reporting purposes, the Funds do not offset financial assets and financial liabilities that are subject to master netting agreements in the Statement of Assets and Liabilities. For securities lending transactions, see Note 4 and for option transactions, see Note 8.
The following table is a summary of the Funds’ open Repurchase Agreements that are subject to a master netting agreement as of December 31, 2022:
| | | | | | | | | | | | | | | | | | | | |
| | | | | Gross Amount Not Offset in the
Statement of Assets and Liabilities | | | | |
| Fund | | Gross Amounts of
Assets Presented in
the Statement of
Assets and Liabilities | | Offset Amount | | Net Asset Balance | | Collateral Received | | Net Amount |
| | | | | |
Yacktman Fund | | | | | | | | | | | | | | | | | | | | |
| | | | | |
Bank of America Securities, Inc. | | | $1,307,340 | | | | — | | | | $1,307,340 | | | | $1,307,340 | | | | — | |
| | | | | |
Citigroup Global Markets, Inc. | | | 274,597 | | | | — | | | | 274,597 | | | | 274,597 | | | | — | |
| | | | | |
MUFG Securities America, Inc. | | | 1,307,340 | | | | — | | | | 1,307,340 | | | | 1,307,340 | | | | — | |
| | | | | |
National Bank Financial | | | 1,307,340 | | | | — | | | | 1,307,340 | | | | 1,307,340 | | | | — | |
| | | | | |
RBC Dominion Securities, Inc. | | | 1,307,340 | | | | — | | | | 1,307,340 | | | | 1,307,340 | | | | — | |
| | | | | | | | | | | | | | | | | | | | |
| | | | | |
Total | | | $5,503,957 | | | | — | | | | $5,503,957 | | | | $5,503,957 | | | | — | |
| | | | | | | | | | | | | | | | | | | | |
| | | | | |
Yacktman Focused | | | | | | | | | | | | | | | | | | | | |
| | | | | |
Bank of America Securities, Inc. | | | $1,871,680 | | | | — | | | | $1,871,680 | | | | $1,871,680 | | | | — | |
| | | | | |
Citigroup Global Markets, Inc. | | | 393,246 | | | | — | | | | 393,246 | | | | 393,246 | | | | — | |
| | | | | |
Deutsche Bank Securities, Inc. | | | 1,871,680 | | | | — | | | | 1,871,680 | | | | 1,871,680 | | | | — | |
| | | | | |
National Bank Financial | | | 1,871,680 | | | | — | | | | 1,871,680 | | | | 1,871,680 | | | | — | |
| | | | | |
RBC Dominion Securities, Inc. | | | 1,871,680 | | | | — | | | | 1,871,680 | | | | 1,871,680 | | | | — | |
| | | | | | | | | | | | | | | | | | | | |
| | | | | |
Total | | | $7,879,966 | | | | — | | | | $7,879,966 | | | | $7,879,966 | | | | — | |
| | | | | | | | | | | | | | | | | | | | |
| | | | |
Yacktman Special Opportunities | | | | | | | | | | | | | | | | | |
| | | | | |
Citigroup Global Markets, Inc. | | | $366,262 | | | | — | | | | $366,262 | | | | $366,262 | | | | — | |
10. SUBSEQUENT EVENTS
The Funds have determined that no material events or transactions occurred through the issuance date of the Funds’ financial statements which require an additional disclosure in or adjustment of the Funds’ financial statements.
60
|
Report of Independent Registered Public Accounting Firm |
To the Board of Trustees of AMG Funds and Shareholders of AMG Yacktman Fund, AMG Yacktman Focused Fund, AMG Yacktman Global Fund, and AMG Yacktman Special Opportunities Fund
Opinions on the Financial Statements
We have audited the accompanying statements of assets and liabilities, including the schedules of portfolio investments, of AMG Yacktman Fund, AMG Yacktman Focused Fund, AMG Yacktman Global Fund, and AMG Yacktman Special Opportunities Fund (four of the funds constituting AMG Funds, hereafter collectively referred to as the “Funds”) as of December 31, 2022, the related statements of operations for the year ended December 31, 2022, the statements of changes in net assets for each of the two years in the period ended December 31, 2022, including the related notes, and the financial highlights for each of the five years in the period ended December 31, 2022 (collectively referred to as the “financial statements”). In our opinion, the financial statements present fairly, in all material respects, the financial position of each of the Funds as of December 31, 2022, the results of each of their operations for the year then ended, the changes in each of their net assets for each of the two years in the period ended December 31, 2022 and each of the financial highlights for each of the five years in the period ended December 31, 2022 in conformity with accounting principles generally accepted in the United States of America.
Basis for Opinions
These financial statements are the responsibility of the Funds’ management. Our responsibility is to express an opinion on the Funds’ financial statements based on our audits. We are a public accounting firm registered with the Public Company Accounting Oversight Board (United States) (PCAOB) and are required to be independent with respect to the Funds in accordance with the U.S. federal securities laws and the applicable rules and regulations of the Securities and Exchange Commission and the PCAOB.
We conducted our audits of these financial statements in accordance with the standards of the PCAOB. Those standards require that we plan and perform the audit to obtain reasonable assurance about whether the financial statements are free of material misstatement, whether due to error or fraud.
Our audits included performing procedures to assess the risks of material misstatement of the financial statements, whether due to error or fraud, and performing procedures that respond to those risks. Such procedures included examining, on a test basis, evidence regarding the amounts and disclosures in the financial statements. Our audits also included evaluating the accounting principles used and significant estimates made by management, as well as evaluating the overall presentation of the financial statements. Our procedures included confirmation of securities owned as of December 31, 2022 by correspondence with the custodian, transfer agent and brokers; when replies were not received from brokers, we performed other auditing procedures. We believe that our audits provide a reasonable basis for our opinions.
/s/ PricewaterhouseCoopers LLP
Boston, Massachusetts
February 24, 2023
We have served as the auditor of one or more investment companies in the AMG Funds Family since 1993.
61
| | |
| | | Other Information (unaudited) |
| | | |
| | | |
TAX INFORMATION
AMG Yacktman Fund, AMG Yacktman Focused Fund, AMG Yacktman Global Fund and AMG Yacktman Special Opportunities Fund each hereby designates the maximum amount allowable of its net taxable income as qualified dividends as provided in the Jobs and Growth Tax Relief Reconciliation Act of 2003. The 2022 Form 1099-DIV you receive for each Fund will show the tax status of all distributions paid to you during the calendar year.
In accordance with federal tax law, the following Funds elected to provide foreign taxes paid and the income sourced from foreign countries. Accordingly, each Fund hereby makes the following designations regarding its period ended December 31, 2022:
AMG Yacktman Global Fund
u The total amount of taxes paid and income sourced from foreign countries was $553,432 and $3,930,109, respectively.
AMG Yacktman Special Opportunities Fund
u The total amount of taxes paid and income sourced from foreign countries was $167,640 and $2,463,645, respectively.
Pursuant to section 852 of the Internal Revenue Code, AMG Yacktman Fund, AMG Yacktman Focused Fund, AMG Yacktman Global Fund and AMG Yacktman Special Opportunities Fund each hereby designates $458,044,814, $228,562,676, $6,133,798 and $835,108, respectively, as a capital gain distribution with respect to the taxable year ended December 31, 2022, or if subsequently determined to be different, the net capital gains of such year.
62
| | |
| | | AMG Funds Trustees and Officers |
| | | |
| | | |
| | | | |
The Trustees and Officers of the Trust, their business addresses, principal occupations for the past five years and ages are listed below. The Trustees provide broad supervision over the affairs of the Trust and the Funds. The Trustees are experienced executives who meet periodically throughout the year to oversee the Funds’ activities, review contractual arrangements with companies that provide services to the Funds, and | | review the Funds’ performance. Unless otherwise noted, the address of each Trustee or Officer is the address of the Trust: 680 Washington Blvd., Suite 500, Stamford, CT. 06901. There is no stated term of office for Trustees. Trustees serve until their resignation, retirement or removal in | | accordance with the Trust’s organizational documents and policies adopted by the Board from time to time. The Chairman of the Trustees, President, Treasurer and Secretary of the Trust are elected by the Trustees annually. Other officers hold office at the pleasure of the Trustees. |
Independent Trustees
The following Trustees are not “interested persons” of the Trust within the meaning of the 1940 Act:
| | |
| | |
Number of Funds Overseen in Fund Complex | | Name, Age, Principal Occupation(s) During Past 5 Years and Other Directorships Held by Trustee |
| | |
• Trustee since 2012 • Oversees 40 Funds in Fund Complex | | Bruce B. Bingham, 74 Partner, Hamilton Partners (real estate development firm) (1987-Present); Director of The Yacktman Funds, Inc. (2 portfolios) (2000-2012). |
| | |
• Trustee since 2013 • Oversees 44 Funds in Fund Complex • Chairman of the Audit Committee since 2021 | | Kurt A. Keilhacker, 59 Managing Partner, TechFund Europe (2000-Present); Managing Partner, TechFund Capital (1997-Present); Managing Partner, Elementum Ventures (2013-Present); Director, MetricStory, Inc. (2017-Present); Trustee, Wheaton College (2018-Present); Trustee, Gordon College (2001-2016); Board Member, 6wind SA (2002-2019). |
| | |
• Trustee since 2004 • Oversees 40 Funds in Fund Complex | | Steven J. Paggioli, 72 Independent Consultant (2002-Present); Trustee, Professionally Managed Portfolios (28 portfolios); Advisory Board Member, Sustainable Growth Advisors, LP; Independent Director, Muzinich BDC, Inc. (business development company) (2019-Present); Director, The Wadsworth Group; Independent Director, Chase Investment Counsel (2008–2019); Executive Vice President, Secretary and Director, Investment Company Administration, LLC and First Fund Distributors, INC. (1990-2001). |
| | |
• Independent Chairman of the Board of Trustees since 2017 • Chairman of the Governance Committee since 2017 • Trustee since 1999 • Oversees 44 Funds in Fund Complex | | Eric Rakowski, 64 Professor of Law, University of California at Berkeley School of Law (1990-Present); Tax Attorney at Davis Polk & Wardwell and clerked for Judge Harry T. Edwards of the U.S. Court of Appeals for the District of Columbia Circuit and for Justice William J. Brennan Jr. of the U.S. Supreme Court; Trustee of Parnassus Funds (3 portfolios) (2021-Present); Trustee of Parnassus Income Funds (2 portfolios) (2021-Present); Director of Harding, Loevner Funds, Inc. (10 portfolios); Trustee of Third Avenue Trust (3 portfolios) (2002-2019); Trustee of Third Avenue Variable Trust (1 portfolio) (2002-2019). |
| | |
• Trustee since 2013 • Oversees 44 Funds in Fund Complex | | Victoria L. Sassine, 57 Adjunct Professor, Babson College (2007–Present); Director, Board of Directors, PRG Group (2017-Present); CEO, Founder, Scale Smarter Partners, LLC (2018-Present); Adviser, EVOFEM Biosciences (2019-Present); Chairperson of the Board of Directors, Business Management Associates (2018-2019). |
| | |
• Trustee since 2004 • Oversees 40 Funds in Fund Complex | | Thomas R. Schneeweis, 75* Professor Emeritus, University of Massachusetts (2013-Present); President, TRS Associates (1982-Present); Board Member, Chartered Alternative Investment Association (“CAIA”) (2002-Present); Co-Founder and Director, Institute for Global Asset and Risk Management (Education) (2010-Present); Co-Owner, Quantitative Investment Technologies (2014-Present); Co-Owner, Yes Wealth Management (2018-Present); Director, CAIA Foundation (2010-2019); Partner, S Capital Wealth Advisors (2015-2018); Partner, S Capital Management, LLC (2007-2015); President, Alternative Investment Analytics, LLC (formerly Schneeweis Partners, LLC) (2001-2013). |
*Mr. Schneeweis retired from the Board of Trustees of AMG Funds as of December 31, 2022.
Interested Trustee
The Trustee in the following table is an “interested person” of the Trust within the meaning of the 1940 Act.
| | |
Number of Funds Overseen in
Fund Complex | | Name, Age, Principal Occupation(s) During Past 5 Years and Other Directorships Held by Trustee |
63
| | |
| | | AMG Funds Trustees and Officers (continued) |
| | | |
| | | |
| | |
| | |
• Trustee since 2021 • Oversees 44 Funds in Fund Complex | | Garret W. Weston, 41 Affiliated Managers Group, Inc. (2008-Present): Managing Director, Co-Head of Affiliate Engagement (2021-Present), Senior Vice President, Affiliate Development (2016-2021), Vice President, Office of the CEO (2015-2016), Vice President, New Investments (2012-2015), Senior Associate, New Investments (2008-2012); Associate, Madison Dearborn Partners (2006-2008); Analyst, Merrill Lynch (2004-2006). |
Officers
| | |
| | |
Position(s) Held with Fund and Length of Time Served | | Name, Age, Principal Occupation(s) During Past 5 Years |
| | |
• President since 2018 • Principal Executive Officer since 2018 • Chief Executive Officer since 2018 • Chief Operating Officer since 2007 | | Keitha L. Kinne, 64 Chief Operating Officer, AMG Funds LLC (2007-Present); Chief Investment Officer, AMG Funds LLC (2008-Present); President and Principal, AMG Distributors, Inc. (2018-Present); Chief Operating Officer, AMG Distributors, Inc. (2007-Present); President, Chief Executive Officer and Principal Executive Officer, AMG Funds, AMG Funds I, AMG Funds II, AMG Funds III and AMG Funds IV (2018-Present); Chief Operating Officer, AMG Funds, AMG Funds I, AMG Funds II, and AMG Funds III (2007-Present); Chief Operating Officer, AMG Funds IV (2016-Present); Chief Operating Officer and Chief Investment Officer, Aston Asset Management, LLC (2016); President and Principal Executive Officer, AMG Funds, AMG Funds I, AMG Funds II and AMG Funds III (2012-2014); Managing Partner, AMG Funds LLC (2007-2014); President and Principal, AMG Distributors, Inc. (2012-2014); Managing Director, Legg Mason & Co., LLC (2006-2007); Managing Director, Citigroup Asset Management (2004-2006). |
| | |
• Secretary since 2015 • Chief Legal Officer since 2015 | | Mark J. Duggan, 57 Managing Director and Senior Counsel, AMG Funds LLC (2021-Present); Senior Vice President and Senior Counsel, AMG Funds LLC (2015-2021); Secretary and Chief Legal Officer, AMG Funds, AMG Funds I, AMG Funds II, AMG Funds III and AMG Funds IV (2015-Present); Attorney, K&L Gates, LLP (2009-2015). |
| | |
• Chief Financial Officer since 2017 • Treasurer since 2017 • Principal Financial Officer since 2017 • Principal Accounting Officer since 2017 | | Thomas G. Disbrow, 56 Vice President, Mutual Fund Treasurer & CFO, AMG Funds, AMG Funds LLC (2017-Present); Chief Financial Officer, Principal Financial Officer, Treasurer and Principal Accounting Officer, AMG Funds, AMG Funds I, AMG Funds II, AMG Funds III and AMG Funds IV (2017-Present); Managing Director - Global Head of Traditional Funds Product Control, UBS Asset Management (Americas), Inc. (2015-2017); Managing Director - Head of North American Funds Treasury, UBS Asset Management (Americas), Inc. (2011-2015). |
| | |
• Deputy Treasurer since 2017 | | John A. Starace, 52 Vice President, Mutual Fund Accounting, AMG Funds LLC (2021-Present); Director, Mutual Fund Accounting, AMG Funds LLC (2017-2021); Vice President, Deputy Treasurer of Mutual Funds Services, AMG Funds LLC (2014-2017); Deputy Treasurer, AMG Funds, AMG Funds I, AMG Funds II, AMG Funds III and AMG Funds IV (2017-Present); Vice President, Citi Hedge Fund Services (2010-2014); Audit Senior Manager (2005-2010) and Audit Manager (2001-2005), Deloitte & Touche LLP. |
| | |
• Chief Compliance Officer and Sarbanes-Oxley Code of Ethics Compliance Officer since 2019 • Anti-Money Laundering Compliance Officer since 2022 | | Patrick J. Spellman, 48 Vice President, Chief Compliance Officer, AMG Funds LLC (2017-Present); Chief Compliance Officer, AMG Distributors, Inc. (2010-Present); Chief Compliance Officer and Sarbanes-Oxley Code of Ethics Compliance Officer, AMG Funds, AMG Funds I, AMG Funds II, AMG Funds III and AMG Funds IV (2019-Present); Anti-Money Laundering Compliance Officer, AMG Funds, AMG Funds I, AMG Funds II, and AMG Funds III (2014-2019; 2022-Present); Anti-Money Laundering Compliance Officer, AMG Funds IV (2016-2019; 2022-Present); Senior Vice President, Chief Compliance Officer, AMG Funds LLC (2011-2017); Compliance Manager, Legal and Compliance, Affiliated Managers Group, Inc. (2005-2011). |
| | |
• Assistant Secretary since 2016 | | Maureen M. Kerrigan, 37 Vice President, Senior Counsel, AMG Funds LLC (2021-Present); Vice President, Counsel, AMG Funds LLC (2019-2021); Director, Counsel, AMG Funds LLC (2017-2018); Vice President, Counsel, AMG Funds LLC (2015-2017); Assistant Secretary, AMG Funds, AMG Funds I, AMG Funds II, AMG Funds III and AMG Funds IV (2016-Present); Associate, Ropes & Gray LLP (2011-2015); Law Fellow, Massachusetts Appleseed Center for Law and Justice (2010-2011). |
64
| | |
| | |
| | | |
| | | |
| | | | |
INVESTMENT MANAGER AND ADMINISTRATOR AMG Funds LLC 680 Washington Blvd., Suite 500 Stamford, CT 06901 800.548.4539 DISTRIBUTOR AMG Distributors, Inc. 680 Washington Blvd., Suite 500 Stamford, CT 06901 800.548.4539 SUBADVISER Yacktman Asset Management LP 6300 Bridgepoint Parkway Building One, Suite 500 Austin, TX 78730 CUSTODIAN The Bank of New York Mellon Mutual Funds Custody 6023 Airport Road Oriskany, NY 13424 | | LEGAL COUNSEL Ropes &Gray LLP Prudential Tower, 800 Boylston Street Boston, MA 02199-3600 TRANSFER AGENT BNY Mellon Investment Servicing (US) Inc. Attn: AMG Funds 4400 Computer Drive Westborough, MA 01581 800.548.4539 Effective March 9, 2023, the Transfer Agent’s mailing address will change to the following: BNY Mellon Investment Servicing (US) Inc. AMG Funds Attn: 534426 AIM 154-0520 500 Ross Street Pittsburgh, PA 15262 800.548.4539 | | This report is prepared for the Funds’ shareholders. It is authorized for distribution to prospective investors only when preceded or accompanied by an effective prospectus. To receive a free copy of the prospectus or Statement of Additional Information, which includes additional information about Fund Trustees, please contact us by calling 800.548.4539. Distributed by AMG Distributors, Inc., member FINRA/SIPC. Current net asset values per share for each Fund are available on the Funds’ website at amgfunds.com. A description of the policies and procedures each Fund uses to vote its proxies is available: (i) without charge, upon request, by calling 800.548.4539, or (ii) on the Securities and Exchange Commission’s (SEC) website at sec.gov. For information regarding the Funds’ proxy voting record for the 12-month period ended June 30, call 800.548.4539 or visit the SEC website at sec.gov. The Funds file their complete schedule of portfolio holdings with the SEC for the first and third quarters of each fiscal year as an exhibit to their reports on Form N-PORT. The Funds’ portfolio holdings on Form N-PORT are available on the SEC’s website at sec.gov and the Funds’ website at amgfunds.com. To review a complete list of the Funds’ portfolio holdings, or to view the most recent semiannual report or annual report, please visit amgfunds.com. |
| | |
| | |
| | | |
| | | |
| | | | | | | | |
BALANCED FUNDS AMG GW&K Global Allocation GW&K Investment Management, LLC EQUITY FUNDS AMG Beutel Goodman International Equity Beutel, Goodman & Company Ltd. AMG Boston Common Global Impact Boston Common Asset Management, LLC AMG Frontier Small Cap Growth Frontier Capital Management Co., LLC AMG GW&K Small Cap Core AMG GW&K Small Cap Value AMG GW&K Small/Mid Cap AMG GW&K Small/Mid Cap Growth AMG GW&K Emerging Markets Equity AMG GW&K Emerging Wealth Equity AMG GW&K International Small Cap GW&K Investment Management, LLC AMG Montrusco Bolton Large Cap Growth Montrusco Bolton Investments, Inc. AMG Renaissance Large Cap Growth The Renaissance Group LLC | | | | AMG River Road Dividend All Cap Value AMG River Road Focused Absolute Value AMG River Road International Value Equity AMG River Road Large Cap Value Select AMG River Road Mid Cap Value AMG River Road Small-Mid Cap Value AMG River Road Small Cap Value River Road Asset Management, LLC AMG TimesSquare Emerging Markets Small Cap AMG TimesSquare Global Small Cap AMG TimesSquare International Small Cap AMG TimesSquare Mid Cap Growth AMG TimesSquare Small Cap Growth TimesSquare Capital Management, LLC AMG Veritas Asia Pacific AMG Veritas China AMG Veritas Global Focus AMG Veritas Global Real Return Veritas Asset Management LLP AMG Yacktman AMG Yacktman Focused AMG Yacktman Global AMG Yacktman Special Opportunities Yacktman Asset Management LP | | FIXED INCOME FUNDS AMG Beutel Goodman Core Plus Bond Beutel, Goodman & Company Ltd. AMG GW&K Core Bond ESG AMG GW&K Enhanced Core Bond ESG AMG GW&K ESG Bond AMG GW&K High Income AMG GW&K Municipal Bond AMG GW&K Municipal Enhanced Yield GW&K Investment Management, LLC | | |
| | | | | | |
amgfunds.com | | | | | | 123122 AR071 |
Registrant has adopted a Code of Ethics. See attached Exhibit (a)(1).
| Item 3. | AUDIT COMMITTEE FINANCIAL EXPERT |
Registrant’s Board of Trustees has determined that independent Trustee Mr. Steven J. Paggioli qualifies as an Audit Committee Financial Expert. Mr. Paggioli is “independent” as such term is defined in Form N-CSR.
| Item 4. | PRINCIPAL ACCOUNTANT FEES AND SERVICES |
The aggregate fees billed by the Funds’ independent registered public accounting firm, PricewaterhouseCoopers LLP (“PwC”), to the Funds for the Funds’ two most recent fiscal years for professional services rendered for audits of annual financial statements, or services that are normally provided in connection with statutory and regulatory filings or engagements (“Audit Fees”) were as follows:
| | | | | | | | |
Fund - AMG Funds | | Fiscal
2022 | | | Fiscal
2021 | |
AMG GW&K Municipal Enhanced Yield Fund | | $ | 35,157 | | | $ | 36,695 | |
AMG GW&K Small Cap Core Fund | | $ | 31,658 | | | $ | 28,816 | |
AMG GW&K Municipal Bond Fund | | $ | 47,394 | | | $ | 46,980 | |
AMG GW&K Small/Mid Cap Fund | | $ | 37,773 | | | $ | 41,244 | |
AMG GW&K Small Cap Value Fund | | $ | 36,207 | | | $ | 29,718 | |
AMG TimesSquare Mid Cap Growth Fund | | $ | 42,304 | | | $ | 37,177 | |
AMG TimesSquare Small Cap Growth Fund | | $ | 27,443 | | | $ | 43,466 | |
AMG TimesSquare International Small Cap Fund | | $ | 42,491 | | | $ | 44,692 | |
AMG TimesSquare Emerging Markets Small Cap Fund | | $ | 64,146 | | | $ | 39,973 | |
AMG TimesSquare Global Small Cap Fund | | $ | 31,536 | | | $ | 32,668 | |
AMG Renaissance Large Cap Growth Fund | | $ | 26,314 | | | $ | 25,570 | |
AMG Yacktman Focused Fund | | $ | 68,352 | | | $ | 56,452 | |
AMG Yacktman Fund | | $ | 110,277 | | | $ | 80,934 | |
AMG Yacktman Special Opportunities Fund | | $ | 28,845 | | | $ | 29,280 | |
AMG Yacktman Global Fund | | $ | 35,068 | | | $ | 24,572 | |
There were no fees billed by PwC to the Funds in their two most recent fiscal years for services rendered for assurance and related services that are reasonably related to the performance of the audit or review of the Funds’ financial statements, but are not reported as Audit Fees (“Audit-Related Fees”).
For the Funds’ two most recent fiscal years, there were no Audit-Related Fees billed by PwC for engagements related directly to the operations and financial reporting of one or more Funds by a Fund Service Provider. A Fund Service Provider is (a) any investment adviser to the Fund (not including any Subadvisor whose role is primarily portfolio management and is subcontracted with or overseen by another investment adviser) or (b) any entity that provides ongoing services to the Fund and is controlling, controlled by or under common control with a Fund investment adviser described in (a).
The aggregate fees billed by PwC to the Funds for the two most recent fiscal years for professional services rendered for tax compliance, tax advice, and tax planning (“Tax Fees”) were as follows:
| | | | | | | | |
Fund - AMG Funds | | Fiscal
2022 | | | Fiscal
2021 | |
AMG GW&K Municipal Enhanced Yield Fund | | $ | 6,760 | | | $ | 6,250 | |
AMG GW&K Small Cap Core Fund | | $ | 6,760 | | | $ | 6,250 | |
AMG GW&K Municipal Bond Fund | | $ | 6,760 | | | $ | 6,250 | |
AMG GW&K Small/Mid Cap Fund | | $ | 6,760 | | | $ | 6,250 | |
AMG GW&K Small Cap Value Fund | | $ | 6,760 | | | $ | 6,250 | |
AMG TimesSquare Mid Cap Growth Fund | | $ | 6,760 | | | $ | 6,250 | |
AMG TimesSquare Small Cap Growth Fund | | $ | 6,760 | | | $ | 6,250 | |
AMG TimesSquare International Small Cap Fund | | $ | 8,050 | | | $ | 7,450 | |
AMG TimesSquare Emerging Markets Small Cap Fund | | $ | 8,050 | | | $ | 7,450 | |
AMG TimesSquare Global Small Cap Fund | | $ | 8,050 | | | $ | 7,450 | |
AMG Renaissance Large Cap Growth Fund | | $ | 6,760 | | | $ | 6,250 | |
AMG Yacktman Focused Fund | | $ | 6,760 | | | $ | 6,250 | |
AMG Yacktman Fund | | $ | 6,760 | | | $ | 6,250 | |
AMG Yacktman Special Opportunities Fund | | $ | 6,760 | | | $ | 6,250 | |
AMG Yacktman Global Fund | | $ | 8,050 | | | $ | 6,250 | |
For the Funds’ two most recent fiscal years, Tax Fees billed by PwC for engagements by Fund Service Providers that related directly to the operations and financial reporting of the Funds were $0 for fiscal 2022 and $0 for fiscal 2021, respectively.
The services for which Tax Fees were charged comprise all services performed by professional staff in PwC’s tax division except those services related to the audit. Typically, this category would include fees for tax compliance, tax planning, and tax advice. Tax compliance, tax advice, and tax planning services include preparation of original and amended tax returns, claims for refund and tax payment-planning services, assistance with tax audits and appeals, tax advice related to mergers and acquisitions and requests for rulings or technical advice from taxing authorities.
There were no other fees billed by PwC to the Funds for all other non-audit services (“Other Fees”) during the Funds’ two most recent fiscal years. During the same period, there were no Other Fees billed by PwC for engagements by Fund Service Providers that related directly to the operations and financial reporting of the Funds.
(e)(1)According to policies adopted by the Audit Committee, services provided by PwC to the Funds must be pre-approved by the Audit Committee. On an annual basis, the Audit Committee reviews and pre-approves various types of services that PwC may perform for the Funds without specific approval of each engagement, subject to specified budget limitations. As contemplated by the Sarbanes-Oxley Act of 2002 and related SEC rules, the Audit Committee also pre-approves non-audit services provided by PwC to any Fund Service Provider for any engagement that relates directly to the operations and financial reporting of the Funds. Any engagement that is not already pre-approved or that will exceed a pre-approved budget must be submitted to the Audit Committee for pre-approval. The Chairman of the Audit Committee is authorized on behalf of the Board of Trustees and the Audit Committee to approve the engagement of PwC to perform non-audit services subject to certain conditions, including notification to the Audit Committee of such pre-approval not later than the next meeting of the Audit Committee following the date of such pre-approval.
(e)(2) None.
(f) Not applicable.
(g) The aggregate fees billed by PwC in 2022 and 2021 for non-audit services rendered to the Funds and Fund Service Providers were $142,560 and $143,850, respectively. For the fiscal year ended December 31, 2022, this amount reflects the amounts disclosed above in Item 4(b),(c),(d), plus $36,000 in fees billed to the Fund Service Providers for non-audit services that did not relate directly to the operations and financial reporting of the Funds. For the fiscal year ended December 31, 2021, this amount reflects the amounts disclosed above in Item 4(b),(c),(d), plus $46,500 in additional fees billed to the Fund Service Providers for non-audit services that did not relate directly to the operations and financial reporting of the Funds.
(h) The Trust’s Audit Committee has considered whether the provision of non-audit services by registrant’s independent registered public accounting firm to the registrant’s investment adviser, and any entity controlling, controlled by, or under common control with the investment adviser that provided ongoing services to the registrant that were not pre-approved by the Committee (because such services did not relate directly to the operations and financial reporting of the registrant) was compatible with maintaining the independence of the independent registered public accounting firm.
| Item 5. | AUDIT COMMITTEE OF LISTED REGISTRANTS |
Not applicable.
| Item 6. | SCHEDULE OF INVESTMENTS |
The schedule of investments in securities of unaffiliated issuers as of the close of the reporting period is included as part of the report to shareholders filed under Item 1 of this form.
| Item 7. | DISCLOSURE OF PROXY VOTING POLICIES AND PROCEDURES FOR CLOSED-END MANAGEMENT INVESTMENT COMPANIES |
Not applicable.
| Item 8. | PORTFOLIO MANAGERS OF CLOSED-END MANAGEMENT INVESTMENT COMPANIES |
Not applicable.
| Item 9. | PURCHASES OF EQUITY SECURITIES BY CLOSED-END MANAGEMENT INVESTMENT COMPANIES AND AFFILIATED PURCHASERS |
Not applicable.
| Item 10. | SUBMISSION OF MATTERS TO A VOTE OF SECURITY HOLDERS |
Not applicable.
| Item 11. | CONTROLS AND PROCEDURES |
(a) The Registrant’s principal executive and principal financial officers have concluded, based on their evaluation of the registrant’s disclosure controls and procedures as of a date within 90 days of the filing of this report, that the Registrant’s disclosure controls and procedures are reasonably designed to ensure that information required to be disclosed by the Registrant on Form N-CSR is recorded, processed, summarized and reported within the required time periods and that information required to be disclosed by the registrant in the reports that it files or submits on Form N-CSR is accumulated and communicated to the Registrant’s management, including its principal executive and principal financial officers, as appropriate to allow timely decisions regarding required disclosure.
(b) There were no changes in the Registrant’s internal control over financial reporting during the period covered by this report that have materially affected, or are reasonably likely to materially affect, the internal control over financial reporting.
| Item 12. | DISCLOSURE OF SECURITIES LENDING ACTIVITIES FOR CLOSED-END MANAGEMENT INVESTMENT COMPANIES |
Not applicable.
(a)(1) Any Code of Ethics or amendments hereto. Filed herewith.
(a)(2) Certifications pursuant to Rule 30a-2(a) under the Investment Company Act of 1940 - Filed herewith.
(a)(3) Not applicable.
SIGNATURES
Pursuant to the requirements of the Securities Exchange Act of 1934 and the Investment Company Act of 1940, the registrant has duly caused this report to be signed on its behalf by the undersigned, thereunto duly authorized.
AMG FUNDS
| | |
| By: | | /s/ Keitha L. Kinne |
| | Keitha L. Kinne, Principal Executive Officer |
|
| Date: March 6, 2023 |
Pursuant to the requirements of the Securities Exchange Act of 1934 and the Investment Company Act of 1940, this report has been signed below by the following persons on behalf of the registrant and in the capacities and on the dates indicated.
| | |
| By: | | /s/ Keitha L. Kinne |
| | Keitha L. Kinne, Principal Executive Officer |
|
| Date: March 6, 2023 |
| |
| By: | | /s/ Thomas Disbrow |
| | Thomas Disbrow, Principal Financial Officer |
|
| Date: March 6, 2023 |