UNITED STATES
SECURITIES AND EXCHANGE COMMISSION
Washington, D.C. 20549
FORM N-CSR
CERTIFIED SHAREHOLDER REPORT OF
REGISTERED MANAGEMENT INVESTMENT COMPANIES
Investment Company Act file number: 811-09521
AMG Funds
(Exact name of registrant as specified in charter)
680 Washington Boulevard, Suite 500, Stamford, Connecticut 06901
(Address of principal executive offices) (Zip code)
AMG Funds LLC
680 Washington Boulevard, Suite 500, Stamford, Connecticut 06901
(Name and address of agent for service)
Registrant’s telephone number, including area code: (203) 299-3500
Date of fiscal year end: October 31
Date of reporting period: November 1, 2021 – October 31, 2022
(Annual Shareholder Report)
| Item 1. | Reports to Shareholders |
| | |
 | | ANNUAL REPORT |
| | |
| | | AMG Funds October 31, 2022 |
| | |
| | | 
|
| | |
| | | AMG GW&K Core Bond ESG Fund |
| | |
| | | Class N: MBGVX | Class I: MBDFX | Class Z: MBDLX |
| | |
| | | AMG GW&K Emerging Markets Equity Fund |
| | |
| | | Class N: TLEVX | Class I: TLESX | Class Z: TLEIX |
| | |
| | | AMG GW&K Emerging Wealth Equity Fund |
| | |
| | | Class N: TYWVX | Class I: TYWSX | Class Z: TYWIX |
| | |
| | | AMG GW&K Small/Mid Cap Growth Fund |
| | |
| | | Class N: ACWDX | Class I: ACWIX | Class Z: ACWZX |
| | |
| | | |
| | |
| | | |
| | | | |
| amgfunds.com | | | | 103122 AR069 |
| | |
| | | AMG Funds Annual Report — October 31, 2022 |
| | | | | | |
| | | |
| | | | | | |
| | | TABLE OF CONTENTS | | PAGE | |
| | | | |
| | | LETTER TO SHAREHOLDERS | | | 2 | |
| | | |
| | | ABOUT YOUR FUND’S EXPENSES | | | 3 | |
| | | |
| | | PORTFOLIO MANAGER’S COMMENTS, FUND SNAPSHOTS AND SCHEDULES OF PORTFOLIO INVESTMENTS | | | | |
| | | |
| | | AMG GW&K Core Bond ESG Fund | | | 4 | |
| | | |
| | | AMG GW&K Emerging Markets Equity Fund | | | 12 | |
| | | |
| | | AMG GW&K Emerging Wealth Equity Fund | | | 19 | |
| | | |
| | | AMG GW&K Small/Mid Cap Growth Fund | | | 26 | |
| | | |
| | | FINANCIAL STATEMENTS | | | | |
| | | |
| | | Statement of Assets and Liabilities | | | 32 | |
| | | |
| | | Balance sheets, net asset value (NAV) per share computations
and cumulative distributable earnings (loss) | | | | |
| | | |
| | | Statement of Operations | | | 34 | |
| | | |
| | | Detail of sources of income, expenses, and realized and
unrealized gains (losses) during the fiscal year | | | | |
| | | |
| | | Statements of Changes in Net Assets | | | 35 | |
| | | |
| | | Detail of changes in assets for the past two fiscal years | | | | |
| | | |
| | | Financial Highlights | | | 37 | |
| | | |
| | | Historical net asset values per share, distributions, total returns, income
and expense ratios, turnover ratios and net assets | | | | |
| | | |
| | | Notes to Financial Statements | | | 49 | |
| | | |
| | | Accounting and distribution policies, details of agreements and
transactions with Fund management and affiliates, and descriptions of
certain investment risks | | | | |
| | | |
| | | REPORT OF INDEPENDENT REGISTERED PUBLIC ACCOUNTING FIRM | | | 58 | |
| | | |
| | | OTHER INFORMATION | | | 59 | |
| | | |
| | | TRUSTEES AND OFFICERS | | | 60 | |
| | | |
| | | ANNUAL RENEWAL OF INVESTMENT MANAGEMENT AND SUBADVISORY AGREEMENTS | | | 63 | |
| | | | | | | |
|
Nothing contained herein is to be considered an offer, sale or solicitation of an offer to buy shares of any series of the AMG Funds Family of Funds. Such offering is made only by prospectus, which includes details as to offering price and other material information. | |
| | |
| | Letter to Shareholders |
Dear Shareholder:
The fiscal year ended October 31, 2022, was a volatile period for risk assets, as uncertainties mounted about high inflation, tighter financial conditions, and the Russian invasion of Ukraine. Global equity and bond markets fell in tandem amid sharply higher interest rates and eroding investor confidence as worries of an impending recession loomed over markets. A global commodity shock caused by the war in Ukraine only made matters worse. The S&P 500® Index slipped into a bear market with the Index falling more than (24)% from its peak earlier in the year. The abrupt shift in markets this year has reset expectations around future growth, as stubbornly high inflation has necessitated that the U.S. Federal Reserve (the Fed) and other global central banks take more aggressive policy action in an effort to bring down inflation. While the outlook is uncertain given the recent negative returns across many asset classes, one silver lining is that global stock and bond valuations are now more attractive than they were at the start of the year.
There was very wide dispersion in sector performance. Energy significantly outperformed all other sectors with a gain of 64.97% as the price of oil surged during the period. Defensive-oriented sectors also outperformed with a 4.86% return from consumer staples and 2.85% gain in utilities. High growth technology and mega cap internet-related companies underperformed during the period, and real estate was impacted by higher interest rates. Communications services fell the most with a (40.67)% return during the fiscal year, followed by declines of (28.53)% for consumer discretionary, (20.64)% for real estate, and (20.23)% for information technology. Value stocks held up much better than growth stocks as the Russell 1000® Value Index returned (7.00)% compared to the (24.60)% return for the Russell 1000® Growth Index. Small cap stocks struggled as the Russell 2000® Index lost (18.54)%. Outside the U.S., foreign developed markets lagged their U.S. counterparts as the U.S. dollar surged and the MSCI EAFE Index fell (23.00)%. Emerging Markets underperformed with a (31.03)% return for the MSCI Emerging Markets Index.
The 10-year Treasury yield more than doubled during the period, surging to the highest levels since before the Great Financial Crisis. Rapidly rising rates from a very low base led to historically bad performance for bonds as the Bloomberg U.S. Aggregate Bond Index, a broad measure of U.S. bond market performance, lost (15.68)% over the period. Investment-grade corporate bonds underperformed as the Bloomberg U.S. Corporate Bond Index returned (19.57)% for the year. High yield bonds held up better with a (11.76)% return as measured by the return of the Bloomberg U.S. Corporate High Yield Bond Index. Municipal bonds suffered steep losses but outperformed the broader market with a (11.98)% return for the Bloomberg Municipal Bond Index. Non-U.S. bonds delivered weak performance and were also impacted by the stronger dollar as the Bloomberg Global Aggregate ex U.S. fell (24.60)%.
AMG Funds appreciates the privilege of providing investment tools to you and your clients. Our foremost goal is to provide investment solutions that help our shareholders successfully reach their long-term investment goals. AMG Funds provides access to a distinctive array of actively managed return-oriented investment strategies. We thank you for your continued confidence and investment in AMG Funds. You can rest assured that under all market conditions our team is focused on delivering excellent investment management services for your benefit.
Respectfully,

Keitha Kinne
President
AMG Funds
| | | | | | | | | | | | | | |
| | | | | Periods ended | |
| Average Annual Total Returns | | October 31, 2022* | |
| | | | |
| Stocks: | | | | 1 Year | | | 3 Years | | | 5 Years | |
| | | | |
Large Cap | | (S&P 500® Index) | | | (14.61 | )% | | | 10.22 | % | | | 10.44 | % |
| | | | |
Small Cap | | (Russell 2000® Index) | | | (18.54 | )% | | | 7.05 | % | | | 5.56 | % |
| | | | |
International | | (MSCI ACWI ex USA) | | | (24.73 | )% | | | (1.68 | )% | | | (0.60 | )% |
| | | | |
Bonds: | | | | | | | | | | | | | | |
| | | | |
Investment Grade | | (Bloomberg U.S. Aggregate Bond Index) | | | (15.68 | )% | | | (3.77 | )% | | | (0.54 | )% |
| | | | |
High Yield | | (Bloomberg U.S. Corporate High Yield Bond Index) | | | (11.76 | )% | | | 0.31 | % | | | 2.01 | % |
| | | | |
Tax-exempt | | (Bloomberg Municipal Bond Index) | | | (11.98 | )% | | | (2.18 | )% | | | 0.37 | % |
| | | | |
Treasury Bills | | (ICE BofAML U.S. 6-Month Treasury Bill Index) | | | 0.55 | % | | | 0.65 | % | | | 1.27 | % |
*Source: FactSet. Past performance is no guarantee of future results.
2
| | |
| | | About Your Fund’s Expenses |
| | | |
| | | |
| | | | | | | | |
As a shareholder of a Fund, you may incur two types of costs: (1) transaction costs, which may include sales charges (loads) on purchase payments; redemption fees; and exchange fees; and (2) ongoing costs, including management fees; distribution (12b-1) fees; and other Fund expenses. This example is intended to help you understand your ongoing costs (in dollars) of investing in the Fund and to compare these costs with the ongoing costs of investing in other mutual funds. The example is based on $1,000 invested at the beginning of the period and held for the entire period as indicated below. ACTUAL EXPENSES The first line of the following table provides information about the actual account values and | | | | actual expenses. You may use the information in this line, together with the amount you invested, to estimate the expenses that you paid over the period. Simply divide your account value by $1,000 (for example, an $8,600 account value divided by $1,000 = 8.6), then multiply the result by the number in the first line under the heading entitled “Expenses Paid During the Period” to estimate the expenses you paid on your account during this period. HYPOTHETICAL EXAMPLE FOR COMPARISON PURPOSES The second line of the following table provides information about hypothetical account values and hypothetical expenses based on the Fund’s actual expense ratio and an assumed annual rate of return of 5% before expenses, which is not the Fund’s | | | | actual return. The hypothetical account values and expenses may not be used to estimate the actual ending account balance or expenses you paid for the period. You may use this information to compare the ongoing costs of investing in the Fund and other funds by comparing this 5% hypothetical example with the 5% hypothetical examples that appear in the shareholder reports of other funds. Please note that the expenses shown in the table are meant to highlight your ongoing costs only and do not reflect any transactional costs, such as sales charges (loads), redemption fees, or exchange fees. Therefore, the second line of the table is useful in comparing ongoing costs only, and will not help you determine the relative total costs of owning different funds. |
| | | | | | | | |
| | | | | | | | | | |
Six Months Ended October 31, 2022 | | Expense Ratio for the Period | | Beginning Account Value 05/01/22 | | Ending Account Value 10/31/22 | | | Expenses Paid During the Period* |
AMG GW&K Core Bond ESG Fund |
|
Based on Actual Fund Return |
Class N | | 0.88% | | $1,000 | | | $922 | | | $4.26 |
Class I | | 0.54% | | $1,000 | | | $923 | | | $2.62 |
Class Z | | 0.48% | | $1,000 | | | $924 | | | $2.33 |
|
Based on Hypothetical 5% Annual Return |
Class N | | 0.88% | | $1,000 | | | $1,021 | | | $4.48 |
Class I | | 0.54% | | $1,000 | | | $1,022 | | | $2.75 |
Class Z | | 0.48% | | $1,000 | | | $1,023 | | | $2.45 |
AMG GW&K Emerging Markets Equity Fund** |
|
Based on Actual Fund Return |
Class N | | 1.32% | | $1,000 | | | $830 | | | $6.09 |
Class I | | 1.03% | | $1,000 | | | $832 | | | $4.76 |
Class Z | | 0.92% | | $1,000 | | | $831 | | | $4.25 |
|
Based on Hypothetical 5% Annual Return |
Class N | | 1.32% | | $1,000 | | | $1,019 | | | $6.72 |
Class I | | 1.03% | | $1,000 | | | $1,020 | | | $5.24 |
Class Z | | 0.92% | | $1,000 | | | $1,021 | | | $4.69 |
AMG GW&K Emerging Wealth Equity Fund |
|
Based on Actual Fund Return |
Class N | | 1.42% | | $1,000 | | | $838 | | | $6.58 |
Class I | | 1.12% | | $1,000 | | | $839 | | | $5.19 |
Class Z | | 1.02% | | $1,000 | | | $838 | | | $4.73 |
|
Based on Hypothetical 5% Annual Return |
Class N | | 1.42% | | $1,000 | | | $1,018 | | | $7.22 |
Class I | | 1.12% | | $1,000 | | | $1,020 | | | $5.70 |
Class Z | | 1.02% | | $1,000 | | | $1,020 | | | $5.19 |
| | | | | | | | | | |
Six Months Ended October 31, 2022 | | Expense
Ratio for
the Period | | Beginning
Account
Value
05/01/22 | | Ending
Account
Value
10/31/22 | | | Expenses
Paid
During
the Period* |
AMG GW&K Small/Mid Cap Growth Fund |
|
Based on Actual Fund Return |
Class N | | 1.02% | | $1,000 | | | $968 | | | $5.06 |
Class I | | 0.87% | | $1,000 | | | $968 | | | $4.32 |
Class Z | | 0.82% | | $1,000 | | | $968 | | | $4.07 |
|
Based on Hypothetical 5% Annual Return |
Class N | | 1.02% | | $1,000 | | | $1,020 | | | $5.19 |
Class I | | 0.87% | | $1,000 | | | $1,021 | | | $4.43 |
Class Z | | 0.82% | | $1,000 | | | $1,021 | | | $4.18 |
| * | Expenses are equal to the Fund’s annualized expense ratio multiplied by the average account value over the period, multiplied by the number of days in the most recent fiscal half-year (184), then divided by 365. |
| ** | Includes interest expense related to participation in the interfund lending program. If excluded, your annualized expense ratios would be 1.27%, 0.98% and 0.87% for Class N, Class I and Class Z, respectively, and your actual and hypothetical expenses paid during the period would be $5.86, $4.53 and $4.02, and $6.46, $4.99 and $4.43 for Class N, Class I and Class Z, respectively. |
3
| | |
| | | AMG GW&K Core Bond ESG Fund Portfolio Manager’s Comments (unaudited) |
| | | |
| | | |
| | | | | | | | |
THE YEAR IN REVIEW For the 12 months ended October 31, 2022, AMG GW&K Core Bond ESG Fund’s (the “Fund”) Class I shares returned (16.99)%, compared to the return of (15.68)% for the Bloomberg U.S. Aggregate Bond Index (the “Index”). MARKET OVERVIEW Fixed income markets were effectively flat in late 2021, despite major narrative shifts with respect to inflation, monetary policy, and COVID-19. Signs of easing supply-chain pressures and continued labor market normalization were not enough to quell concerns about rising inflation, which printed at its highest level in almost 40 years. The U.S. Federal Reserve (the “Fed”) executed a “hawkish pivot” in acknowledging more persistent inflationary forces and signaled its intention to respond accordingly. The extremely contagious Omicron variant rapidly established itself as the dominant strain around the globe, forcing a reappraisal of reopening timelines and reviving the specter of lockdowns and healthcare rationing. Ironically, the combined effect of these various forces essentially netted to zero; solid economic data and a broadly constructive outlook from the Fed were met with the prospect of tightening financial conditions and growth fears posed by Omicron. But trading overall was orderly, and after the prior two years investors seemed well practiced at looking past near-term volatility toward the next stage of a return to normalcy. For the first quarter of 2022, fixed income markets experienced their worst period in more than four decades amid an extraordinary confluence of economic and geopolitical shocks. Core inflation jumped to 5.4%, its highest level since 1983, on a broad-based rise in consumer prices. The Fed responded in kind, intensifying its hawkish rhetoric and laying out an aggressive course of hikes to bring inflation back to target. In addition to exacting a tragic human toll, Russia’s invasion of Ukraine exacerbated already strained supply chains and commodity markets, threatening acute and prolonged shortages of materials vital to the basic functioning of the global economy. But for all this uncertainty and turmoil, there was a notable divergence between the performance of rates and credit; the former extended a historically severe downdraft, while the latter continued to enjoy a remarkably benign trading environment. How this disconnect was to be resolved was the central question before investors, though policy uncertainty and heightened tensions were deemed unlikely to subside anytime soon. | | | | In the second quarter of 2022, fixed income markets experienced another extremely volatile period, trading in a wide range and struggling to commit to a consistent narrative. The central question remained how persistent inflation would be and what policy measures would be necessary to quell it. A natural deceleration would allow the Fed to pursue less aggressive policy and possibly achieve a soft landing; more recalcitrant price pressure would require the Fed to mount a harsher response and invite a potential recession. The implications of these two different paths were starkly at odds, leading to a broad lack of conviction with no clear market direction. Similarly puzzling was a consumer with a strong proclivity to spend but a deeply pessimistic outlook and a corporate sector earning solid profits but starting to announce layoffs. Additionally, China offered a potential bright spot as it emerged from recent shutdowns, but the Ukraine conflict lingered as a major threat to global energy and commodity markets. An imminent resolution to any of these tensions seemed unlikely, so disciplined risk management and careful analysis of relative value were of particular importance for the months ahead. Fixed income markets were under extraordinary pressure in the third quarter of 2022, as investors continued to adapt to restrictive monetary policy after more than a decade of accommodation. Stubbornly rising prices, hawkish central banks, and various geopolitical forces combined to tighten financial conditions and raise the cost of borrowing around the world. Defying expectations that it had peaked, inflation remained elevated and manifested across a broader and more entrenched collection of goods and services. The Federal also confounded expectations by projecting a more cautious outlook and a more aggressive path of hikes than most economists had anticipated. International pressures escalated as well, as currency market dislocations, political leadership changes in Europe and Asia, and multiple energy crises collectively drove a heightened sense of uncertainty. The variety and momentum of these forces suggested no near-term end to volatility, especially against a backdrop of increasingly expensive capital. Fixed income markets were once again under pressure to end the fiscal year in October. Inflation continued to rise as the Fed reiterated its commitment to subduing it. The housing sector deteriorated further, and consumer sentiment | | | | remained dour, while the labor market showed few signs of weakening. Minutes from the September meeting made clear that the Fed will raise rates aggressively and keep them high until it sees evidence that inflation is coming down. Yields across the curve were higher on the month, briefly touching new cyclical peaks before retreating. The front end sold off in response to increased Fed hawkishness, while long rates reflected rising confidence that the end of the hiking cycle is near. FUND REVIEW The Fund underperformed its benchmark as an above-benchmark allocation to spread sectors was one of the main detractors from returns. Specifically, an overweight to investment grade corporate bonds was the largest negative, but also hurting performance were overweights to both taxable municipals and agency mortgage-backed securities (“MBS”). On the other hand, an out of benchmark allocation to fixed-to-floating preferreds aided returns. The Fund’s notable underweight was to the Treasury sector contributed to relative return. Security selection also lagged, with the largest affect coming from investment grade corporates. Consumer cyclicals was a notable detractor while communications contributed positively. Security selection in MBS was also a negative. The Fund’s duration positioning was its top contributor. Rates rose during the period and the Fund’s shorter duration compared to the benchmark proved favorable. Due to the Fund’s generally neutral yield curve positioning, the affect here was minimal. Environmental, social and governance practices (“ESG”) remained an important area of focus for the corporate bond market in what could be viewed as a transition year in 2022. A growing list of companies have moved beyond publishing sustainability reports to set emissions reduction and net zero targets over the past year. Investors shook off an overall difficult market environment, from geopolitical turmoil to interest rate volatility, to demonstrate continued strong interest in ESG. This was also a landmark year for global sustainability regulation, with regulators across Europe, North America, and Asia introducing new rules and proposals related to reporting for both corporations and investors. In the U.S., the Inflation Reduction Act is poised to provide policy support for many companies of interest to ESG investors. We continue to integrate ESG as a core part of our |
4
| | |
| | | AMG GW&K Core Bond ESG Fund Portfolio Manager’s Comments (continued) |
| | | |
| | | |
| | | | | | | | |
fundamental investment process, while monitoring regulatory and policy actions that could influence the ESG investing landscape in the coming years. We conducted the following trades based on ESG factors over the period: • We purchased Merck & Co., a high-quality investment grade sustainable bond • We bought Sonoco Products Co., a recent green bond new issue • We added a California State Health Facilities bond OUTLOOK Expectations of a Fed “pivot” have been relegated to the closing months of 2023, suggesting investors have become more comfortable with | | | | higher-for-longer monetary policy. Additionally, investors seem to have registered acceptance of the “pain” that Chairman Powell has warned might be necessary to quell inflation. Rate volatility has consequently risen to levels last seen at the outset of the pandemic and, prior to that, the global financial crisis. With such an uncertain fundamental backdrop and a wide dispersion of possible paths for both the level and shape of the yield curve, we have maintained essentially neutral duration and curve positioning. While our outlook for corporate credit is constructive from a bottom-up perspective–given years of prudent balance sheet management and robust profitability–we recognize the rising risks that macroeconomic factors pose to the sector. As such, our exposure is at the lower end of its historical | | | | range. Within corporates, we continue to prefer higher quality names with less exposure to cyclical industries. We remain opportunistic with respect to idiosyncratic stories and have been active in credits that we expect to improve their leverage profiles or which have sold off unduly. Our outlook for mortgages has informed a neutral exposure, given potential event risk surrounding quantitative tightening and elevated rate volatility, even as recent underperformance has brought spreads to the wider end of their recent range. The views expressed represent the opinions of GW&K Investment Management, LLC as of October 31, 2022, and are not intended as a forecast or guarantee of future results, and are subject to change without notice. |
5
| | |
| | | AMG GW&K Core Bond ESG Fund Portfolio Manager’s Comments (continued) |
CUMULATIVE TOTAL RETURN PERFORMANCE
AMG GW&K Core Bond ESG Fund’s cumulative total return is based on the daily change in net asset value (NAV), and assumes that all dividends and distributions were reinvested. This graph compares a hypothetical $10,000 investment made in the AMG GW&K Core Bond ESG Fund’s Class I shares on October 31, 2012, to a $10,000 investment made in the Bloomberg U.S. Aggregate Bond Index for the same time period. The graph and table do not reflect the deduction of taxes that a shareholder would pay on a Fund distribution or redemption of shares. The listed returns for the Fund are net of expenses and the returns for the index excludes expenses. Total returns would have been lower had certain expenses not been reduced.
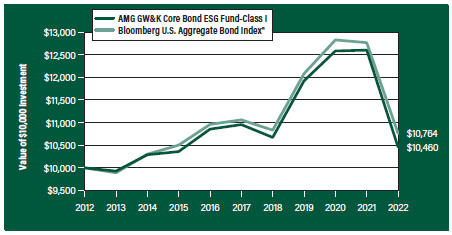
The table below shows the average annual total returns for the AMG GW&K Core Bond ESG Fund and the Bloomberg U.S. Aggregate Bond Index for the same time periods ended October 31, 2022.
| | | | | | | | | | | | | | | | | | | | |
| | | One | | | Five | | | Ten | | | Since | | | Inception | |
| Average Annual Total Returns1 | | Year | | | Years | | | Years | | | Inception | | | Date | |
AMG GW&K Core Bond ESG Fund2, 3, 4, 5, 6, 7, 8, 9 | |
| | | | | |
Class N | | | (17.18 | %) | | | (1.22 | %) | | | — | | | | (0.27 | %) | | | 05/08/15 | |
| | | | | |
Class I | | | (16.99 | %) | | | (0.92 | %) | | | 0.45% | | | | 4.78 | % | | | 04/30/93 | |
| | | | | |
Class Z | | | (16.85 | %) | | | (0.82 | %) | | | — | | | | 0.14 | % | | | 05/08/15 | |
| | | | | |
Bloomberg U.S. Aggregate Bond Index10 | | | (15.68 | %) | | | (0.54 | %) | | | 0.74% | | | | 4.35 | % | | | 04/30/93 | † |
The performance data shown represents past performance. Past performance is not a guarantee of future results. Current performance may be lower or higher than the performance data quoted. The investment return and principal value of an investment will fluctuate so that an investor’s shares, when redeemed, may be worth more or less than their original cost.
Investors should carefully consider the Fund’s investment objectives, risks, charges and expenses before investing. For performance information through the most recent month end, current net asset values per share for the Fund and other information, please call 800.548.4539 or visit our website at amgfunds.com for a free prospectus. Read it carefully before investing or sending money.
Distributed by AMG Distributors, Inc., member FINRA/SIPC.
| † | Date reflects inception date of the Fund, not the index. |
| 1 | Total return equals income yield plus share price change and assumes reinvestment of all dividends and capital gain distributions. Returns are net of fees and may reflect offsets of Fund expenses as described in the prospectus. No adjustment has been made for taxes payable by shareholders on their reinvested dividends and |
|
capital gain distributions. Returns for periods greater than one year are annualized. The listed returns on the Fund are net of expenses and based on the published NAV as of October 31, 2022. All returns are in U.S. Dollars($). 2 From time to time, the Fund’s adviser has waived its fees and/or absorbed Fund expenses, which has resulted in higher returns. 3 To the extent that the Fund invests in asset-backed or mortgage-backed securities, its exposure to prepayment and extension risks may be greater than investments in other fixed income securities. 4 Active and frequent trading of a fund may result in higher transaction costs and increased tax liability. 5 The Fund is subject to the risks associated with investments in debt securities, such as default risk and fluctuations in the perception of the debtor’s ability to pay its creditors. Changing interest rates may adversely affect the value of an investment. An increase in interest rates typically causes the value of bonds and other fixed income securities to fall. 6 The Fund may invest in derivatives such as options and futures; the complexity and rapidly changing structure of derivatives markets may increase the possibility of market losses. 7 Many bonds have call provisions which allow the debtors to pay them back before maturity. This is especially true with mortgage securities, which can be paid back anytime. Typically debtors prepay their debt when it is to their advantage (when interest rates drop making a new loan at current rates more attractive), and thus likely to the disadvantage of bondholders, who may have to reinvest prepayment proceeds in securities with lower yields. Prepayment risk will vary depending on the provisions of the security and current interest rates relative to the interest rate of the debt. 8 Market prices of investments held by the Fund may fall rapidly or unpredictably due to a variety of economic or political factors, market conditions, disasters or public health issues, or in response to events that affect particular industries or companies. 9 Applying the Fund’s ESG investment criteria may result in the selection or exclusion of securities of certain issuers for reasons other than performance, and the Fund may underperform funds that do not utilize an ESG investment strategy. The application of this strategy may affect the Fund’s exposure to certain companies, sectors, regions, countries or types of investments, which could negatively impact the Fund’s performance depending on whether such investments are in or out of favor. Applying ESG criteria to investment decisions is qualitative and subjective by nature, and there is no guarantee that the criteria utilized by the Subadviser or any judgment exercised by the |
6
| | |
| | | AMG GW&K Core Bond ESG Fund Portfolio Manager’s Comments (continued) |
| | | |
| | | |
| | | | | | | | |
Subadviser will reflect the beliefs or values of any particular investor. 10 The Bloomberg U.S. Aggregate Bond Index is an index of the U.S. investment-grade fixed-rate bond market, including both government and corporate bonds. Unlike the Fund, the Bloomberg U.S. Aggregate Bond Index is unmanaged, is not available for investment and does not incur expenses. | | | | “Bloomberg®” and any Bloomberg index described herein are service marks of Bloomberg Finance L.P. and its affiliates, including Bloomberg Index Services Limited (“BISL”), the administrator of the index (collectively, “Bloomberg”) and have been licensed for use for certain purposes by AMG Funds LLC. Bloomberg is not affiliated with AMG Funds LLC, and Bloomberg does not approve, endorse, review, or recommend the fund described herein. Bloomberg | | | | does not guarantee the timeliness, accurateness, or completeness of any data or information relating to such fund. Not FDIC insured, nor bank guaranteed. May lose value. |
7
| | |
| | | AMG GW&K Core Bond ESG Fund Fund Snapshots (unaudited) October 31, 2022 |
PORTFOLIO BREAKDOWN
| | |
| Category | | % of Net Assets |
| | |
U.S. Government and Agency Obligations | | 51.9 |
| | |
Corporate Bonds and Notes | | 36.0 |
| | |
Municipal Bonds | | 7.5 |
| | |
Foreign Government Obligations | | 0.9 |
| | |
Short-Term Investments | | 2.7 |
| | |
Other Assets, Less Liabilities | | 1.0 |
| | |
| Rating | | % of Market Value1 |
| | |
U.S. Government and Agency Obligations | | 53.8 |
| | |
Aaa/AAA | | 3.9 |
| | |
Aa/AA | | 9.4 |
| | |
A | | 10.4 |
| | |
Baa/BBB | | 22.5 |
| 1 | Includes market value of long-term fixed-income securities only. |
TOP TEN HOLDINGS
| | |
| Security Name | | % of Net Assets |
| | |
U.S. Treasury Notes, 2.000%, 06/30/24 | | 4.2 |
| | |
U.S. Treasury Bonds, 2.250%, 05/15/41 | | 3.7 |
| | |
FHLMC, 3.500%, 10/01/45 | | 2.5 |
| | |
Verizon Communications, Inc., 3.875%, 02/08/29 | | 2.2 |
| | |
U.S. Treasury Bonds, 6.250%, 08/15/23 | | 2.1 |
| | |
FNMA, 3.500%, 02/01/47 | | 2.1 |
| | |
U.S. Treasury Notes, 2.375%, 05/15/27 | | 2.0 |
| | |
California State General Obligation, School Improvements, 7.550%, 04/01/39 | | 2.0 |
| | |
FHLMC, 3.000%, 11/01/49 | | 2.0 |
| | |
U.S. Treasury Bonds, 3.500% , 02/15/39 | | 1.9 |
| | | |
| | |
Top Ten as a Group | | 24.7 |
| | |
Credit quality ratings shown above reflect the highest rating assigned by either Standard & Poor’s (“S&P”) or Moody’s Investors Service, Inc. (“Moody’s”). These rating agencies are independent, nationally recognized statistical rating organizations and are widely used. Investment grade ratings are credit ratings of BBB- or higher. Below investment grade ratings are credit ratings of BB+ or lower. Investments designated N/R are not rated by any of the rating agencies. Unrated investments do not necessarily indicate low credit quality. Credit quality ratings are subject to change.
Because a fund’s strategy may result in multiple investments in particular sectors of the economy, its performance may depend on the performance of those sectors and may fluctuate more widely than investments diversified across more sectors. For additional information on these and other risk considerations, please see the Fund’s prospectus.
Any sectors, industries, or securities discussed should not be perceived as investment recommendations. Mention of a specific security should not be considered a recommendation to buy or solicitation to sell that security. Specific securities mentioned in this report may have been sold from the Fund’s portfolio of investments by the time you receive this report.
8
| | |
| | | AMG GW&K Core Bond ESG Fund Schedule of Portfolio Investments October 31, 2022 |
| | | | | | | | |
| | |
| | | Principal Amount | | | Value | |
| |
Corporate Bonds and Notes - 36.0% | | | | | |
| |
Financials - 12.7% | | | | | |
| | |
AerCap Ireland Capital DAC/AerCap Global Aviation Trust (Ireland) 1.650%, 10/29/24 | | | $1,650,000 | | | | $1,497,600 | |
| | |
American Express Co. | | | | | | | | |
(3.550% to 09/15/26 then U.S. Treasury Yield Curve CMT 5 year + 2.854%), 3.550%, 09/15/261,2,3 | | | 973,000 | | | | 750,426 | |
| | |
American Tower Corp.
3.600%, 01/15/28 | | | 1,680,000 | | | | 1,488,749 | |
| | |
Bank of America Corp. | | | | | | | | |
MTN, (4.330% to 03/15/49 then 3 month LIBOR + 1.520%), 4.330%, 03/15/501,3 | | | 1,600,000 | | | | 1,244,374 | |
| | |
The Bank of New York Mellon Corp. | | | | | | | | |
MTN, 2.450%, 08/17/26 | | | 937,000 | | | | 849,517 | |
Series G, (4.700% to 09/20/25 then U.S. Treasury Yield Curve CMT 5 year + 4.358%), 4.700%, 09/20/251,2,3 | | | 460,000 | | | | 440,450 | |
| | |
Boston Properties, LP | | | | | | | | |
3.400%, 06/21/29 | | | 1,841,000 | | | | 1,522,076 | |
| | |
Citigroup, Inc. | | | | | | | | |
(3.980% to 03/20/29 then 3 month LIBOR + 1.338%), 3.980%, 03/20/301,3 | | | 1,677,000 | | | | 1,477,577 | |
| | |
Crown Castle, Inc. | | | | | | | | |
4.000%, 03/01/27 | | | 1,800,000 | | | | 1,665,268 | |
| | |
The Goldman Sachs Group, Inc. | | | | | | | | |
3.500%, 11/16/26 | | | 2,676,000 | | | | 2,453,984 | |
| | |
JPMorgan Chase & Co. | | | | | | | | |
(1.470% to 09/22/26 then SOFR + 0.765%), 1.470%, 09/22/271,3 | | | 871,000 | | | | 731,742 | |
| | |
MetLife, Inc. | | | | | | | | |
Series G, (3.850% to 09/15/25 then U.S. Treasury Yield Curve CMT 5 year + 3.576%), 3.850%, 09/15/251,2,3 | | | 1,409,000 | | | | 1,238,143 | |
| | |
Morgan Stanley | | | | | | | | |
(4.431% to 01/23/29 then 3 month LIBOR + 1.628%), 4.431%, 01/23/301,3 | | | 1,624,000 | | | | 1,481,905 | |
| | |
Wells Fargo & Co. | | | | | | | | |
MTN, (5.013% to 04/04/50 then SOFR + 4.502%), 5.013%, 04/04/511,3 | | | 1,411,000 | | | | 1,195,980 | |
| | |
Total Financials | | | | | | | 18,037,791 | |
| | |
Industrials - 21.2% | | | | | | | | |
| | |
Alcoa Nederland Holding, B.V. (Netherlands) | | | | | | | | |
4.125%, 03/31/294 | | | 1,275,000 | | | | 1,079,705 | |
| | |
Anglo American Capital PLC (United Kingdom)
2.875%, 03/17/314 | | | 919,000 | | | | 706,376 | |
| | |
Ashtead Capital, Inc.
1.500%, 08/12/264 | | | 1,786,000 | | | | 1,481,645 | |
AT&T, Inc.
4.300%, 12/15/42 | | | 1,710,000 | | | | 1,317,214 | |
| | | | | | | | |
| | |
| | | Principal Amount | | | Value | |
| | |
Block Financial LLC
3.875%, 08/15/30 | | | $1,667,000 | | | | $1,400,118 | |
| | |
Broadcom Corp./Broadcom Cayman Finance, Ltd.
3.875%, 01/15/27 | | | 1,808,000 | | | | 1,661,501 | |
| | |
Charter Communications Operating LLC/Charter Communications Operating Capital
2.250%, 01/15/29 | | | 2,000,000 | | | | 1,578,274 | |
| | |
CommonSpirit Health
3.347%, 10/01/29 | | | 1,737,000 | | | | 1,457,627 | |
| | |
Dell International LLC/EMC Corp. 6.200%, 07/15/30 | | | 1,512,000 | | | | 1,481,158 | |
| | |
Discovery Communications LLC 3.950%, 03/20/28 | | | 1,766,000 | | | | 1,532,843 | |
| | |
The Ford Foundation
Series 2020, 2.415%, 06/01/50 | | | 2,207,000 | | | | 1,274,092 | |
| | |
HCA, Inc. | | | | | | | | |
4.125%, 06/15/29 | | | 842,000 | | | | 742,988 | |
4.500%, 02/15/27 | | | 874,000 | | | | 818,257 | |
| | |
Merck & Co., Inc. | | | | | | | | |
1.900%, 12/10/28 | | | 1,897,000 | | | | 1,589,602 | |
| | |
Microsoft Corp.
2.525%, 06/01/50 | | | 2,165,000 | | | | 1,358,165 | |
| | |
Parker-Hannifin Corp.
3.250%, 06/14/29 | | | 1,623,000 | | | | 1,407,678 | |
| | |
PulteGroup, Inc.
5.000%, 01/15/27 | | | 761,000 | | | | 730,861 | |
| | |
Smith & Nephew PLC (United Kingdom)
2.032%, 10/14/30 | | | 1,010,000 | | | | 741,981 | |
| | |
Sonoco Products Co.
2.850%, 02/01/325 | | | 1,852,000 | | | | 1,443,393 | |
| | |
Sysco Corp.
2.400%, 02/15/30 | | | 2,284,000 | | | | 1,847,932 | |
| | |
Verizon Communications, Inc.
3.875%, 02/08/29 | | | 3,403,000 | | | | 3,093,150 | |
| | |
Walgreens Boots Alliance, Inc.
4.800%, 11/18/44 | | | 1,593,000 | | | | 1,249,355 | |
| | |
Total Industrials | | | | | | | 29,993,915 | |
| | |
Utilities - 2.1% | | | | | | | | |
| | |
Dominion Energy, Inc. | | | | | | | | |
Series B, (4.650% to 12/15/24 then U.S. Treasury Yield Curve CMT 5 year + 2.993%), 4.650%, 12/15/241,2,3 | | | 978,000 | | | | 846,476 | |
| | |
National Rural Utilities Cooperative Finance Corp.
1.350%, 03/15/31 | | | 2,024,000 | | | | 1,454,910 | |
| | |
Northern States Power Co.
2.900%, 03/01/50 | | | 1,000,000 | | | | 635,228 | |
| | |
Total Utilities | | | | | | | 2,936,614 | |
| | |
Total Corporate Bonds and Notes
(Cost $62,975,896) | | | | | | | 50,968,320 | |
The accompanying notes are an integral part of these financial statements.
9
| | |
| | | AMG GW&K Core Bond ESG Fund Schedule of Portfolio Investments (continued) |
| | | | | | | | |
| | | Principal
Amount | | | Value | |
| |
Municipal Bonds - 7.5% | | | | | |
| | |
California Health Facilities Financing Authority
4.190%, 06/01/37 | | | $775,000 | | | | $653,272 | |
| | |
California State General Obligation, School Improvements Build America Bonds, 7.550%, 04/01/39 | | | 2,410,000 | | | | 2,885,290 | |
| | |
Commonwealth of Massachusetts Series B, 4.110%, 07/15/31 | | | 1,040,000 | | | | 992,202 | |
| | |
JobsOhio Beverage System
Series B, 4.532%, 01/01/35 | | | 1,705,000 | | | | 1,571,841 | |
| | |
Los Angeles Unified School District, School Improvements
5.750%, 07/01/34 | | | 1,775,000 | | | | 1,801,304 | |
| | |
Massachusetts School Building Authority
Series B, 1.753%, 08/15/30 | | | 2,017,000 | | | | 1,637,975 | |
| | |
University of California, University & College Improvements
Series BD, 3.349%, 07/01/29 | | | 1,310,000 | | | | 1,169,005 | |
| |
Total Municipal Bonds | | | | | |
(Cost $12,564,216) | | | | | | | 10,710,889 | |
| |
| U.S. Government and Agency Obligations - 51.9% | | | | | |
| | |
Fannie Mae - 22.9% | | | | | | | | |
| | |
FNMA | | | | | | | | |
2.000%, 02/01/36 to 10/01/50 | | | 2,017,188 | | | | 1,682,847 | |
3.000%, 06/01/38 | | | 1,180,482 | | | | 1,079,662 | |
3.500%, 03/01/30 to 07/01/50 | | | 12,394,645 | | | | 11,286,818 | |
4.000%, 03/01/44 to 01/01/51 | | | 8,422,706 | | | | 7,812,991 | |
4.500%, 04/01/39 to 08/01/52 | | | 8,777,950 | | | | 8,470,612 | |
5.000%, 07/01/47 to 02/01/49 | | | 2,085,049 | | | | 2,068,894 | |
| | |
Total Fannie Mae | | | | | | | 32,401,824 | |
| | |
Freddie Mac - 10.4% | | | | | | | | |
| | |
FHLMC | | | | | | | | |
2.500%, 10/01/34 to 08/01/50 | | | 4,160,413 | | | | 3,658,775 | |
3.000%, 11/01/49 to 03/01/50 | | | 4,101,498 | | | | 3,547,704 | |
3.500%, 10/01/45 | | | 3,856,151 | | | | 3,473,611 | |
4.000%, 07/01/48 to 09/01/50 | | | 1,289,177 | | | | 1,190,472 | |
4.500%, 05/01/48 | | | 301,073 | | | | 291,367 | |
5.000%, 07/01/44 | | | 1,323,752 | | | | 1,325,131 | |
| | |
FHLMC Gold Pool | | | | | | | | |
3.500%, 07/01/32 to 05/01/44 | | | 1,316,512 | | | | 1,230,880 | |
| | |
Total Freddie Mac | | | | | | | 14,717,940 | |
| | | | | | | | |
| | | Principal
Amount | | | Value | |
| |
U.S. Treasury Obligations - 18.6% | | | | | |
| | |
U.S. Treasury Bonds | | | | | | | | |
1.875%, 02/15/51 | | | $3,958,000 | | | | $2,423,193 | |
2.250%, 05/15/41 | | | 7,180,000 | | | | 5,177,173 | |
3.125%, 05/15/48 | | | 1,998,000 | | | | 1,620,799 | |
3.500%, 02/15/39 | | | 3,044,000 | | | | 2,763,619 | |
5.000%, 05/15/37 | | | 978,000 | | | | 1,062,620 | |
6.250%, 08/15/23 | | | 2,968,000 | | | | 3,003,941 | |
6.750%, 08/15/26 | | | 1,339,000 | | | | 1,448,683 | |
| | |
U.S. Treasury Notes | | | | | | | | |
2.000%, 06/30/24 | | | 6,268,000 | | | | 6,006,262 | |
2.375%, 05/15/27 | | | 3,141,000 | | | | 2,892,296 | |
| | |
Total U.S. Treasury Obligations | | | | | | | 26,398,586 | |
| |
Total U.S. Government and Agency Obligations | | | | | |
(Cost $85,331,985) | | | | | | | 73,518,350 | |
| |
Foreign Government Obligation - 0.9% | | | | | |
The Korea Development Bank (South Korea)
0.500%, 10/27/23
(Cost $1,383,846) | | | 1,385,000 | | | | 1,328,254 | |
| |
Short-Term Investments - 2.7% | | | | | |
| |
Joint Repurchase Agreements - 0.1%6 | | | | | |
| | |
HSBC Securities USA, Inc., dated 10/31/22, due 11/01/22, 3.010% total to be received $157,617 (collateralized by various U.S. Treasuries, 0.000% - 7.625%, 01/15/23 - 08/15/52, totaling $160,756) | | | 157,604 | | | | 157,604 | |
| |
Repurchase Agreements - 2.6% | | | | | |
| | |
Fixed Income Clearing Corp., dated 10/31/22, due 11/01/22, 2.900% total to be received $3,645,294 (collateralized by a U.S. Treasury, 1.625%, 05/15/31, totaling $3,717,974) | | | 3,645,000 | | | | 3,645,000 | |
| |
Total Short-Term Investments | | | | | |
(Cost $3,802,604) | | | | | | | 3,802,604 | |
| |
Total Investments - 99.0% | | | | | |
(Cost $166,058,547) | | | | | | | 140,328,417 | |
| |
Other Assets, less Liabilities - 1.0% | | | | 1,388,160 | |
| |
Net Assets - 100.0% | | | | $141,716,577 | |
| 1 | Fixed to variable rate investment. The rate shown reflects the fixed rate in effect at October 31, 2022. Rate will reset at a future date. |
| 2 | Perpetuity Bond. The date shown represents the next call date. |
| 3 | Variable rate security. The rate shown is based on the latest available information as of October 31, 2022. Certain variable rate securities are not based on a published reference rate and spread but are determined by the issuer or agent and are based on current market conditions. These securities do not indicate a reference rate and spread in their description above. |
| 4 | Security exempt from registration under Rule 144A of the Securities Act of 1933. This security may be resold in transactions exempt from registration, normally to qualified institutional buyers. At October 31, 2022, the value of these securities amounted to $3,267,726 or 2.3% of net assets. |
| 5 | Some of this security, amounting to $151,198 or 0.1% of net assets, was out on loan to various borrowers and is collateralized by cash. See Note 4 of Notes to Financial Statements. |
| 6 | Cash collateral received for securities lending activity was invested in the joint repurchase agreement. |
The accompanying notes are an integral part of these financial statements.
10
| | |
| | | AMG GW&K Core Bond ESG Fund Schedule of Portfolio Investments (continued) |
| | | | | | |
| CMT | | Constant Maturity Treasury | | LIBOR | | London Interbank Offered Rate |
| | | |
| FHLMC | | Freddie Mac | | MTN | | Medium-Term Note |
| | | |
| FNMA | | Fannie Mae | | SOFR | | Secured Overnight Financing Rate |
The following table summarizes the inputs used to value the Fund’s investments by the fair value hierarchy levels as of October 31, 2022:
| | | | | | | | | | | | | | | | |
| | | Level 1 | | | Level 2 | | | Level 3 | | | Total | |
Investments in Securities | | | | | | | | | | | | | | | | |
| | | | |
Corporate Bonds and Notes† | | | — | | | $ | 50,968,320 | | | | — | | | $ | 50,968,320 | |
| | | | |
Municipal Bonds† | | | — | | | | 10,710,889 | | | | — | | | | 10,710,889 | |
| | | | |
U.S. Government and Agency Obligations† | | | — | | | | 73,518,350 | | | | — | | | | 73,518,350 | |
| | | | |
Foreign Government Obligation† | | | — | | | | 1,328,254 | | | | — | | | | 1,328,254 | |
| | | | |
Short-Term Investments | | | | | | | | | | | | | | | | |
| | | | |
Joint Repurchase Agreements | | | — | | | | 157,604 | | | | — | | | | 157,604 | |
| | | | |
Repurchase Agreements | | | — | | | | 3,645,000 | | | | — | | | | 3,645,000 | |
| | | | | | | | | | | | | | | | |
| | | | |
Total Investments in Securities | | | — | | | $ | 140,328,417 | | | | — | | | $ | 140,328,417 | |
| | | | | | | | | | | | | | | | |
| † | All corporate bonds and notes, municipal bonds, U.S. government and agency obligations, and foreign government obligations held in the Fund are Level 2 securities. For a detailed breakout of corporate bonds and notes, municipal bonds, U.S. government and agency obligations, and foreign government obligations by major industry or agency classification, please refer to the Fund’s Schedule of Portfolio Investments. |
For the fiscal year ended October 31, 2022, there were no transfers in or out of Level 3.
The accompanying notes are an integral part of these financial statements.
11
| | |
| | | AMG GW&K Emerging Markets Equity Fund Portfolio Manager’s Comments (unaudited) |
| | | |
| | | |
| | | | | | | | |
MARKET OVERVIEW Emerging markets fell sharply during the fiscal year ended October 31, 2022 amid Russia’s invasion of Ukraine, numerous headwinds in China, and a challenging inflation backdrop that saw several countries aggressively tighten monetary policy. Brent Crude oil initially traded above the $100/barrel level for the first time in seven years on U.S. sanctions targeting Russia’s energy industry. Other commodity prices were mixed; grains were well supported, but metals dropped on recession concerns. The MSCI Emerging Markets (“EM”) Index declined (31.0)%, while the MSCI EM ex China Index declined (21.9)%. This compares to an (18.5)% loss for the MSCI World Index of developed markets. Performance was mixed geographically, with commodity rich Latin America a standout performer, gaining 16.1% led by Brazil. The region is expected to benefit from the conflict driven surge in energy and agricultural commodity prices. EMEA oil producers in the Persian Gulf posted respectable gains—but Russia’s elimination from the MSCI EM Index weighed on the region’s aggregate performance. Eastern European countries with proximity to the conflict and trade ties to Russia also capped gains in the EMEA region. North Asia was particularly weak due to external demand worries and ongoing market pressure in China. South Korea and Taiwan both fell sharply on the backup in U.S. interest rates and slowing demand in the IT hardware and semiconductor industries. Foreign investors shed Chinese equities en masse due to the country’s growth-stifling zero-COVID policy, ongoing real estate industry turmoil, and President Xi’s consolidation of power at the National Party Congress. The MSCI China Index declined (47.9)%, bringing its Index weight down to 27% from 35% at the beginning of the period. Indonesia bucked the negative trend in Asia, rising modestly on positive earnings momentum. Sector performance was broadly negative, with utilities down modestly compared to the broader group. Financials also outperformed on a relative basis as investors looked to banks as proxies for several commodity producing countries including South Africa, UAE, and Brazil. | | | | Consumer discretionary, communication services, health care declined on China concerns, while slowing orders weighed on information technology. FUND REVIEW For the fiscal year ended October 31, 2022, AMG GW&K Emerging Markets Equity Fund (the “Fund”) Class N shares returned (32.5)%, underperforming the (31.0)% return for the MSCI EM Index. Stock selection within financials was the main source of the performance shortfall. For example, the portfolio had less exposure to banks in commodity-rich countries, such as South Africa and the Middle East oil markets, which were up sharply on investment inflows. In addition, though we exited the position immediately after the invasion, Sberbank Russia also weighed on the sector return, as did OTP Bank, a Hungarian bank with operations in Russia and Ukraine. OTB was subsequently sold later in the year. There was also weakness in Taiwan Semiconductor Manufacturing due to slowing orders and challenging comparable earnings from the prior year. Although, the Fund outperformed in China, regulatory changes hit internet giant Tencent Holdings and Prosus, a holding company with a stake in Tencent. Finally, sector allocation was negative, mainly due to a higher weight in consumer discretionary and no exposure to utilities. Encouragingly, stock selection was positive in several sectors and markets, with health care China, and Mexico key contributors. China Resources Sanjiu Medical & Pharmaceutical, a branded OTC drug and traditional Chinese medicine (TCM) specialist, gained on solid earnings due to market share gains and cost optimization. In Mexico, Grupo Financiero Banorte reported good earnings backed by both net interest and fee income growth, and airport operator Grupo Aeroportuario del Pacífico reported strong revenue growth compared to pre-pandemic periods driven by increased volumes and pricing. OUTLOOK Emerging markets are now at levels not seen since early in the pandemic or, looking further back, 2015. Although there are several pressing issues circulating in world capital markets that won’t | | | | immediately be resolved, emerging market valuations are clearly compelling, even when factoring in lower near-term growth. The 40% decline since their February 2021 peak brings the 2023 and 2024 estimated PE ratios to 10.5x and 9.3x, respectively. To be sure, the global backdrop remains turbulent, as developed market central banks continue to hike interest rates and China remains entangled in multiple layers of economic and political uncertainty. Still, this presents a unique opportunity for us to invest in quality businesses that are benefiting from the ongoing economic development of emerging markets but are often fully priced. In addition, history shows that MSCI EM Index has troughed ahead of the S&P 500® Index in four of the 10 prior bear markets and on the same date as the S&P 500® Index on three occasions. Given that China is more likely to be stimulating their economy when other major nations are still curbing growth, we suspect that MSCI EM Index will trough ahead of developed markets in this cycle. With respect to the Fund’s structure, trading and market activity during the fiscal year resulted in increased exposures to the industrials, health care, and consumer staples, while our weights in consumer discretionary, energy, and communication services decreased. At the close of the period, the Fund had overweight positions in the consumer discretionary, information technology, financials, consumer staples, health care, and communication services sectors and underweight positions in the materials, utilities, energy, real estate, and industrials sectors relative to the benchmark. Geographically, the portfolio finished the fiscal year with 75% in Asia, 14% in the EMEA region, and 8% in Latin America. The views expressed represent the opinions of GW&K Investment Management, LLC as of October 31, 2022, and are not intended as a forecast or guarantee of future results, and are subject to change without notice. |
12
| | |
| | | AMG GW&K Emerging Markets Equity Fund Portfolio Manager’s Comments (continued) |
| | | |
| | | |
CUMULATIVE TOTAL RETURN PERFORMANCE
AMG GW&K Emerging Markets Equity Fund’s cumulative total return is based on the daily change in net asset value (NAV), and assumes that all dividends and distributions were reinvested. This graph compares a hypothetical $10,000 investment made in the AMG GW&K Emerging Markets Equity Fund’s Class N shares on October 31, 2012, to a $10,000 investment made in the MSCI Emerging Markets Index for the same time period. The graph and table do not reflect the deduction of taxes that a shareholder would pay on a Fund distribution or redemption of shares. The listed returns for the Fund are net of expenses and the returns for the index excludes expenses. Total returns would have been lower had certain expenses not been reduced.
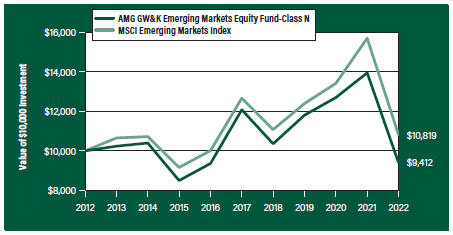
The table below shows the average annual total returns for the AMG GW&K Emerging Markets Equity Fund and the MSCI Emerging Markets Index for the same time periods ended October 31, 2022.
| | | | | | | | |
| | | One | | Five | | Ten | |
| Average Annual Total Returns1 | | Year | | Years | | Years | |
|
AMG GW&K Emerging Markets Equity Fund2, 3, 4, 5, 6, 7, 8, 9, 10, 11, 12 | |
| | | |
Class N | | (32.50%) | | (4.87%) | | | (0.61%) | |
| | | |
Class I | | (32.28%) | | (4.56%) | | | (0.26%) | |
| | | |
Class Z | | (32.20%) | | (4.49%) | | | (0.17%) | |
| | | |
MSCI Emerging Markets Index13 | | (31.03%) | | (3.09%) | | | 0.79% | |
The performance data shown represents past performance. Past performance is not a guarantee of future results. Current performance may be lower or higher than the performance data quoted. The investment return and principal value of an investment will fluctuate so that an investor’s shares, when redeemed, may be worth more or less than their original cost.
Investors should carefully consider the Fund’s investment objectives, risks, charges and expenses before investing. For performance information through the most recent month end, current net asset values per share for the Fund and other information, please call 800.548.4539 or visit our website at amgfunds.com for a free prospectus. Read it carefully before investing or sending money.
Distributed by AMG Distributors, Inc., member FINRA/SIPC.
| 1 | Total return equals income yield plus share price change and assumes reinvestment of all dividends and capital gain distributions. Returns are net of fees and may reflect offsets of Fund expenses as described in the prospectus. No adjustment has been made for taxes payable by shareholders on their reinvested dividends and capital gain distributions. Returns for periods greater than one year are annualized. The listed returns on the Fund are net of expenses and based on the published NAV as of October 31, 2022. All returns are in U.S. Dollars ($). |
|
2 From time to time, the Fund’s adviser has waived its fees and/or absorbed Fund expenses, which has resulted in higher returns. 3 The Fund is subject to currency risk resulting from fluctuations in exchange rates that may affect the total loss or gain on a non-U.S. Dollar investment when converted back to U.S. Dollars. 4 Investments in international securities are subject to certain risks of overseas investing including currency fluctuations and changes in political and economic conditions, which could result in significant market fluctuations. These risks are magnified in emerging markets. 5 The Fund is subject to the risks associated with investments in emerging markets, such as erratic earnings patterns, economic and political instability, changing exchange controls, limitations on repatriation of foreign capital and changes in local governmental attitudes toward private investment, possibly leading to nationalization or confiscation of investor assets. 6 Market prices of investments held by the Fund may fall rapidly or unpredictably due to a variety of economic or political factors, market conditions, disasters or public health issues, or in response to events that affect particular industries or companies. 7 The Fund may invest in derivatives such as options and futures; the complexity and rapidly changing structure of derivatives markets may increase the possibility of market losses. 8 The Fund invests in growth stocks, which may be more sensitive to market movements because their prices tend to reflect future investor expectations rather than just current profits. Growth stocks may underperform value stocks during given periods. 9 Investing in initial public offerings (IPOs) is risky and the prices of stocks purchased in IPOs tend to fluctuate more widely than stocks of companies that have been publicly traded for a longer period of time. Stocks purchased in IPOs generally do not have a trading history, and information about the companies may be available for very limited periods. 10 The Fund is subject to risks associated with investments in mid-capitalization companies such as greater price volatility, lower trading volume, and less liquidity than the stocks of larger, more established companies. 11 Companies that are in similar industry sectors may be similarly affected by particular economic or market events; to the extent the Fund has substantial holdings within a particular sector, the risks associated with that sector increase. |
13
| | |
| | | AMG GW&K Emerging Markets Equity Fund Portfolio Manager’s Comments (continued) |
| | | |
| | | |
| | | | | | | | |
12 The Fund is subject to risks associated with investments in small-capitalization companies, such as erratic earnings patterns, competitive conditions, limited earnings history and a reliance on one or a limited number of products. 13 The MSCI Emerging Markets Index is a free float-adjusted market capitalization index that is designed to measure equity market performance of emerging markets. Please go to msci.com for most current list of countries represented by the index. Unlike the Fund, the MSCI Emerging Markets Index is unmanaged, is not available for investment and does not incur expenses. | | | | All MSCI data is provided “as is.” The products described herein are not sponsored or endorsed and have not been reviewed or passed on by MSCI. In no event shall MSCI, its affiliates or any MSCI data provider have any liability of any kind in connection with the MSCI data or the products described herein. Copying or redistributing the MSCI data is strictly prohibited. Not FDIC insured, nor bank guaranteed. May lose value. | | | | |
14
| | |
| | | AMG GW&K Emerging Markets Equity Fund Fund Snapshots (unaudited) October 31, 2022 |
PORTFOLIO BREAKDOWN
| | | | | |
| Sector | | % of Net Assets |
| | |
Financials | | | | 27.5 | |
| | |
Information Technology | | | | 22.7 | |
| | |
Consumer Discretionary | | | | 18.3 | |
| | |
Communication Services | | | | 8.6 | |
| | |
Consumer Staples | | | | 8.1 | |
| | |
Industrials | | | | 5.6 | |
| | |
Health Care | | | | 4.9 | |
| | |
Energy | | | | 3.7 | |
| | |
Short-Term Investments | | | | 2.9 | |
| | |
Other Assets, Less Liabilities | | | | (2.3 | ) |
TOP TEN HOLDINGS
| | | | | |
| Security Name | | % of
Net Assets |
| | |
Taiwan Semiconductor Manufacturing Co., Ltd. (Taiwan) | | | | 7.4 | |
| | |
Samsung Electronics Co., Ltd. (South Korea) | | | | 5.7 | |
| | |
HDFC Bank, Ltd. (India) | | | | 4.7 | |
| | |
Housing Development Finance Corp., Ltd. (India) | | | | 4.3 | |
| | |
Reliance Industries, Ltd. (India) | | | | 3.7 | |
| | |
Bank Mandiri Persero Tbk PT (Indonesia) | | | | 2.9 | |
| | |
Alibaba Group Holding, Ltd. (China) | | | | 2.8 | |
| | |
Grupo Financiero Banorte, S.A.B de CV, Class O (Mexico) | | | | 2.7 | |
| | |
Yum China Holdings, Inc. (China) | | | | 2.4 | |
| | |
Grupo Aeroportuario del Pacifico, S.A.B de CV, Class B (Mexico) | | | | 2.2 | |
| | | | | | |
| | |
Top Ten as a Group | | | | 38.8 | |
| | | | | |
Because a fund’s strategy may result in multiple investments in particular sectors of the economy, its performance may depend on the performance of those sectors and may fluctuate more widely than investments diversified across more sectors. For additional information on these and other risk considerations, please see the Fund’s prospectus.
Any sectors, industries, or securities discussed should not be perceived as investment recommendations. Mention of a specific security should not be considered a recommendation to buy or solicitation to sell that security. Specific securities mentioned in this report may have been sold from the Fund’s portfolio of investments by the time you receive this report.
15
| | |
| | | AMG GW&K Emerging Markets Equity Fund Schedule of Portfolio Investments October 31, 2022 |
| | | | | | | | |
| | |
| | | Shares | | | Value | |
| | |
Common Stocks - 99.4% | | | | | | | | |
| |
Communication Services - 8.6% | | | | | |
| | |
Baidu, Inc., Class A (China)* | | | 29,816 | | | | $285,846 | |
| | |
Kingsoft Corp., Ltd. (China) | | | 71,200 | | | | 215,604 | |
| | |
Kuaishou Technology (China)*,1 | | | 26,000 | | | | 107,376 | |
| | |
MultiChoice Group (South Africa) | | | 32,058 | | | | 209,482 | |
| | |
NetEase, Inc. (China) | | | 12,425 | | | | 137,859 | |
| | |
Tencent Holdings, Ltd. (China) | | | 13,506 | | | | 354,894 | |
| | |
Tencent Music Entertainment Group, ADR (China)* | | | 19,872 | | | | 71,738 | |
| | |
Total Communication Services | | | | | | | 1,382,799 | |
| | |
Consumer Discretionary - 18.3% | | | | | | | | |
| | |
Alibaba Group Holding, Ltd. (China)* | | | 58,428 | | | | 454,272 | |
| | |
Feng TAY Enterprise Co., Ltd. (Taiwan) | | | 39,355 | | | | 195,448 | |
| | |
H World Group Ltd., ADR (China) | | | 5,750 | | | | 155,710 | |
| | |
Haidilao International Holding, Ltd. (China)*,1 | | | 49,000 | | | | 72,757 | |
| | |
JD.com, Inc., Class A (China) | | | 7,652 | | | | 139,347 | |
| | |
Li Ning Co., Ltd. (China) | | | 46,000 | | | | 237,954 | |
| | |
MakeMyTrip, Ltd. (India)* | | | 10,648 | | | | 296,334 | |
| | |
Midea Group Co., Ltd., Class A (China) | | | 33,385 | | | | 183,914 | |
| | |
Pepco Group, N.V. (United Kingdom)*,1,2 | | | 10,017 | | | | 70,378 | |
| | |
Prosus, N.V. (Netherlands) | | | 4,562 | | | | 197,269 | |
| | |
Sands China, Ltd. (Macau)* | | | 97,950 | | | | 171,239 | |
| | |
Shenzhou International Group Holdings, Ltd. (China) | | | 4,160 | | | | 28,883 | |
| | |
Trip.com Group, Ltd., ADR (China)* | | | 15,677 | | | | 354,770 | |
| | |
Yum China Holdings, Inc. (China) | | | 9,467 | | | | 391,460 | |
| | |
Total Consumer Discretionary | | | | | | | 2,949,735 | |
| | |
Consumer Staples - 8.1% | | | | | | | | |
| | |
Angel Yeast Co., Ltd., Class A (China) | | | 13,600 | | | | 67,634 | |
| | |
Bid Corp., Ltd. (South Africa) | | | 15,193 | | | | 244,461 | |
| | |
CP All PCL (Thailand) | | | 52,668 | | | | 83,074 | |
| | |
Dino Polska, S.A. (Poland)*,1 | | | 3,001 | | | | 195,882 | |
| | |
Fomento Economico Mexicano, S.A.B de CV (Mexico)2 | | | 27,996 | | | | 200,845 | |
| | |
Orion Corp. (South Korea) | | | 2,785 | | | | 198,186 | |
| | |
Vietnam Dairy Products JSC (Vietnam) | | | 23,700 | | | | 74,808 | |
| | |
Wal-Mart de Mexico, S.A.B. de CV (Mexico) | | | 60,873 | | | | 235,160 | |
| | |
Total Consumer Staples | | | | | | | 1,300,050 | |
| | |
Energy - 3.7% | | | | | | | | |
| | |
Reliance Industries, Ltd. (India) | | | 19,188 | | | | 592,080 | |
| | |
Financials - 27.5% | | | | | | | | |
| | |
AIA Group, Ltd. (Hong Kong) | | | 42,768 | | | | 323,959 | |
| | |
B3, S.A. - Brasil Bolsa Balcao (Brazil) | | | 32,300 | | | | 93,795 | |
| | | | | | | | |
| | |
| | | Shares | | | Value | |
| | |
Banco Bradesco, S.A., ADR (Brazil)2 | | | 66,983 | | | | $253,866 | |
| | |
Bank Mandiri Persero Tbk PT (Indonesia) | | | 685,216 | | | | 462,900 | |
| | |
Bank Rakyat Indonesia Persero Tbk PT (Indonesia) | | | 834,336 | | | | 248,910 | |
| | |
BDO Unibank, Inc. (Philippines) | | | 144,490 | | | | 319,379 | |
| | |
China International Capital Corp., Ltd., Class H (China)1 | | | 184,800 | | | | 256,820 | |
| | |
East Money Information Co., Ltd., Class A (China) | | | 45,600 | | | | 97,753 | |
| | |
Grupo Financiero Banorte, S.A.B de CV, Class O (Mexico) | | | 53,742 | | | | 437,493 | |
| | |
HDFC Bank, Ltd. (India) | | | 41,340 | | | | 750,257 | |
| | |
HDFC Life Insurance Co., Ltd. (India)1 | | | 18,500 | | | | 120,900 | |
| | |
Housing Development Finance Corp., Ltd. (India) | | | 22,969 | | | | 686,745 | |
| | |
Ping An Insurance Group Co. of China, Ltd., Class H (China) | | | 29,000 | | | | 116,098 | |
| | |
XP, Inc., Class A (Brazil)*,2 | | | 14,106 | | | | 258,563 | |
| | |
Total Financials | | | | | | | 4,427,438 | |
| | |
Health Care - 4.9% | | | | | | | | |
| | |
China Resources Sanjiu Medical & Pharmaceutical Co., Ltd., Class A (China) | | | 25,800 | | | | 192,970 | |
| | |
CSPC Pharmaceutical Group, Ltd. (China) | | | 103,408 | | | | 106,217 | |
| | |
Fleury, S.A. (Brazil) | | | 57,322 | | | | 205,851 | |
| | |
Jinxin Fertility Group, Ltd. (China)1 | | | 39,500 | | | | 19,471 | |
| | |
Lepu Medical Technology Beijing Co., Ltd., Class A (China) | | | 23,800 | | | | 82,516 | |
| | |
Odontoprev, S.A. (Brazil) | | | 85,461 | | | | 136,327 | |
| | |
Syngene International, Ltd. (India)1 | | | 6,010 | | | | 45,857 | |
| | |
Total Health Care | | | | | | | 789,209 | |
| | |
Industrials - 5.6% | | | | | | | | |
| | |
Contemporary Amperex Technology Co., Ltd., Class A (China) | | | 4,100 | | | | 210,411 | |
| | |
Copa Holdings, S.A., Class A (Panama)* | | | 2,550 | | | | 191,837 | |
| | |
Grupo Aeroportuario del Pacifico, S.A.B de CV, Class B (Mexico) | | | 22,955 | | | | 356,044 | |
| | |
International Container Terminal Services, Inc. (Philippines) | | | 32,100 | | | | 96,225 | |
| | |
Shenzhen Inovance Technology Co., Ltd., Class A (China) | | | 5,900 | | | | 54,055 | |
| | |
Total Industrials | | | | | | | 908,572 | |
| | |
Information Technology - 22.7% | | | | | | | | |
| | |
Advantech Co., Ltd. (Taiwan) | | | 10,727 | | | | 97,183 | |
| | |
Delta Electronics, Inc. (Taiwan) | | | 28,100 | | | | 223,587 | |
| | |
FPT Corp. (Vietnam) | | | 20,000 | | | | 60,857 | |
| | |
Globant SA (Uruguay)* | | | 800 | | | | 150,944 | |
| | |
Infosys, Ltd., Sponsored ADR (India) | | | 5,676 | | | | 106,311 | |
| | |
MediaTek, Inc. (Taiwan) | | | 12,000 | | | | 218,738 | |
The accompanying notes are an integral part of these financial statements.
16
| | |
| | | AMG GW&K Emerging Markets Equity Fund Schedule of Portfolio Investments (continued) |
| | | | | | | | |
| | |
| | | Shares | | | Value | |
| | |
Information Technology - 22.7%
(continued) | | | | | | | | |
| | |
Pagseguro Digital, Ltd., Class A (Brazil)* | | | 3,838 | | | | $52,504 | |
| | |
Samsung Electronics Co., Ltd. (South Korea) | | | 22,067 | | | | 918,425 | |
| | |
Silergy Corp. (China) | | | 4,000 | | | | 46,127 | |
| | |
SK Hynix, Inc. (South Korea) | | | 5,884 | | | | 340,634 | |
| | |
Taiwan Semiconductor Manufacturing Co., Ltd. (Taiwan) | | | 99,632 | | | | 1,197,797 | |
| | |
Tata Consultancy Services, Ltd. (India) | | | 2,184 | | | | 84,285 | |
| | |
TOTVS, S.A. (Brazil) | | | 25,300 | | | | 163,540 | |
| | |
Total Information Technology | | | | | | | 3,660,932 | |
| | |
Total Common Stocks
(Cost $15,063,802) | | | | | | | 16,010,815 | |
| |
Rights - 0.0%# | | | | | |
| | |
Health Care - 0.0%# | | | | | | | | |
| | |
Fleury, S.A., Expiration 11/25/22 (Brazil)* (Cost $0) | | | 12,746 | | | | 3,208 | |
| * | Non-income producing security. |
| 1 | Security exempt from registration under Rule 144A of the Securities Act of 1933. This security may be resold in transactions exempt from registration, normally to qualified institutional buyers. At October 31, 2022, the value of these securities amounted to $889,441 or 5.5% of net assets. |
| | | | | | | | |
| | |
| | | Principal
Amount | | | Value | |
| |
Short-Term Investments - 2.9% | | | | | |
| |
Joint Repurchase Agreements - 2.4%3 | | | | | |
| | |
National Bank Financial, dated 10/31/22, due 11/01/22, 3.090% total to be received $383,247 (collateralized by various U.S. Treasuries, 0.000% - 4.078%, 11/01/22 - 09/09/49, totaling $390,878) | | | $383,214 | | | | $383,214 | |
| |
Repurchase Agreements - 0.5% | | | | | |
| | |
Fixed Income Clearing Corp., dated 10/31/22, due 11/01/22, 2.900% total to be received $85,007 (collateralized by a U.S. Treasury, 1.625%, 05/15/31, totaling $86,772) | | | 85,000 | | | | 85,000 | |
| | |
Total Short-Term Investments
(Cost $468,214) | | | | | | | 468,214 | |
| | |
Total Investments - 102.3%
(Cost $15,532,016) | | | | | | | 16,482,237 | |
| |
Other Assets, less Liabilities - (2.3)% | | | | (372,047 | ) |
| | |
Net Assets - 100.0% | | | | | | $ | 16,110,190 | |
| 2 | Some of these securities, amounting to $637,837 or 4.0% of net assets, were out on loan to various borrowers and are collateralized by cash and various U.S. Treasury Obligations. See Note 4 of Notes to Financial Statements. |
| 3 | Cash collateral received for securities lending activity was invested in the joint repurchase agreement. |
ADR American Depositary Receipt
The accompanying notes are an integral part of these financial statements.
17
| | |
| | | AMG GW&K Emerging Markets Equity Fund Schedule of Portfolio Investments (continued) |
The following table summarizes the inputs used to value the Fund’s investments by the fair value hierarchy levels as of October 31, 2022:
| | | | | | | | | | | | | | | | |
| | | Level 1 | | | Level 21 | | | Level 3 | | | Total | |
Investments in Securities | | | | | | | | | | | | | | | | |
| | | | |
Common Stocks | | | | | | | | | | | | | | | | |
| | | | |
Financials | | | $1,043,717 | | | | $3,383,721 | | | | — | | | | $4,427,438 | |
| | | | |
Information Technology | | | 473,299 | | | | 3,187,633 | | | | — | | | | 3,660,932 | |
| | | | |
Consumer Discretionary | | | 1,198,274 | | | | 1,751,461 | | | | — | | | | 2,949,735 | |
| | | | |
Communication Services | | | 281,220 | | | | 1,101,579 | | | | — | | | | 1,382,799 | |
| | | | |
Consumer Staples | | | 680,466 | | | | 619,584 | | | | — | | | | 1,300,050 | |
| | | | |
Industrials | | | 547,881 | | | | 360,691 | | | | — | | | | 908,572 | |
| | | | |
Health Care | | | 342,178 | | | | 447,031 | | | | — | | | | 789,209 | |
| | | | |
Energy | | | — | | | | 592,080 | | | | — | | | | 592,080 | |
| | | | |
Rights | | | | | | | | | | | | | | | | |
| | | | |
Health Care | | | 3,208 | | | | — | | | | — | | | | 3,208 | |
| | | | |
Short-Term Investments | | | | | | | | | | | | | | | | |
| | | | |
Joint Repurchase Agreements | | | — | | | | 383,214 | | | | — | | | | 383,214 | |
| | | | |
Repurchase Agreements | | | — | | | | 85,000 | | | | — | | | | 85,000 | |
| | | | | | | | | | | | | | | | |
Total Investments in Securities | | $ | 4,570,243 | | | $ | 11,911,994 | | | | — | | | $ | 16,482,237 | |
| | | | | | | | | | | | | | | | |
| 1 | An external pricing service is used to reflect any impact on security value due to market movements between the time the Fund valued such foreign securities and the earlier closing of foreign markets. |
For the fiscal year ended October 31, 2022, there were no transfers in or out of Level 3.
The country allocation in the Schedule of Portfolio Investments at October 31, 2022, was as follows:
| | |
| Country | | % of Long-Term
Investments |
| |
Brazil | | 7.3 |
| |
China | | 27.7 |
| |
Hong Kong | | 2.0 |
| |
India | | 16.8 |
| |
Indonesia | | 4.5 |
| |
Macau | | 1.1 |
| |
Mexico | | 7.7 |
| |
Netherlands | | 1.2 |
| |
Panama | | 1.2 |
| |
Philippines | | 2.6 |
| | |
| Country | | % of Long-Term
Investments |
| |
Poland | | 1.2 |
| |
South Africa | | 2.8 |
| |
South Korea | | 9.1 |
| |
Taiwan | | 12.1 |
| |
Thailand | | 0.5 |
| |
United Kingdom | | 0.4 |
| |
Uruguay | | 0.9 |
| |
Vietnam | | 0.9 |
| |
| | |
| |
| | | 100.0 |
| | |
The accompanying notes are an integral part of these financial statements.
18
| | |
| | | AMG GW&K Emerging Wealth Equity Fund Portfolio Manager’s Comments (unaudited) |
| | | |
| | | |
| | | | | | | | |
MARKET OVERVIEW Emerging markets fell sharply during the fiscal year ended October 31, 2022, amid Russia’s invasion of Ukraine, numerous headwinds in China, and a challenging inflation backdrop that saw several countries aggressively tighten monetary policy. Brent Crude oil initially traded above the $100/barrel level for the first time in seven years on U.S. sanctions targeting Russia’s energy industry. Other commodity prices were mixed; grains were well supported, but metals dropped on recession concerns. The MSCI Emerging Markets (“EM”) Index declined (31.0)%, while the MSCI EM ex China Index declined (21.9)%. This compares to an (18.5)% loss for the MSCI World Index of developed markets. Performance was mixed geographically, with commodity rich Latin America a standout performer, gaining 16.1% led by Brazil. The region is expected to benefit from the conflict-driven surge in energy and agricultural commodity prices. EMEA oil producers in the Persian Gulf posted respectable gains—but Russia’s elimination from the MSCI EM Index weighed on the region’s aggregate performance. Eastern European countries with proximity to the conflict and trade ties to Russia also capped gains in the EMEA region. North Asia was particularly weak due to external demand worries and ongoing market pressure in China. South Korea and Taiwan both fell sharply on the backup in U.S. interest rates and slowing demand in the IT hardware and semiconductor industries. Foreign investors shed Chinese equities en masse due to the country’s growth stifling Covid-zero policy, ongoing real estate industry turmoil, and President Xi’s consolidation of power at the National Party Congress. The MSCI China Index declined (47.9)%, bringing its index weight down to 27% from 35% at the beginning of the period. Indonesia bucked the negative trend in Asia, rising modestly on positive earnings momentum. Sector performance was broadly negative, with utilities down modestly compared to the broader group. Financials also outperformed on a relative basis as investors looked to banks as proxies for several commodity producing countries including South Africa, UAE, and Brazil. Consumer | | | | discretionary, communication services, and health care declined on China concerns, while slowing orders weighed on information technology. FUND REVIEW For the fiscal year ended October 31, 2022, AMG GW&K Emerging Wealth Equity Fund (the “Fund”) Class N shares returned (33.9)%, underperforming the MSCI EM Index, which returned (31.0)%. This was primarily due to our strategic focus on the benefits of wealth creation in emerging markets, which generally leads to higher portfolio exposure in consumer related industries and China. Both market segments underperformed materially over the past 12 months, causing sector and country allocation to negatively impact the Fund’s relative performance. Encouragingly, stock selection in China, which averaged 54% of the Fund, and consumer discretionary, which averaged 32%, was positive. The Fund’s top performing company was China Resources Sanjiu Medical & Pharmaceutical, a branded OTC drug and traditional Chinese medicine (TCM) specialist that delivered solid earnings due to market share gains and cost optimization. Although markets proved challenging this year, there were a few companies that bucked the downward trend including India’s Eicher Motors, which reported better-than-expected margins due to improving volumes and mix benefits, and Titan Company, which benefited from resilient jewelry demand in India. Wal-Mart de Mexico, also rebounded late in the period on the company’s continued market share gains. Still, it was difficult to avoid the market turmoil and several of the portfolio’s holdings sold off as market sentiment turned more bearish. Southeast Asian internet platform, Sea Ltd. dropped sharply on mounting competition amid heavy selling of global growth stocks. Chinese ecommerce and internet platform giants Alibaba Group Holdings and Tencent Holdings were hard hit by regulatory uncertainty and slowing consumption. Power semiconductor producer, Infineon Technologies declined on near-term margin concerns as the company ramps up higher generation fabrication plants. | | | | OUTLOOK Emerging markets are now at levels not seen since early in the pandemic or, looking further back, 2015. Although there are several pressing issues circulating in world capital markets that won’t immediately be resolved, emerging market valuations are clearly compelling, even when factoring in lower near-term growth. The (40)% decline since their February 2021 peak brings the 2023 and 2024 estimated PE ratios to 10.5x and 9.3x, respectively. To be sure, the global backdrop remains turbulent, as developed market central banks continue to hike interest rates and China remains entangled in multiple layers of economic and political uncertainty. Still, this presents a unique opportunity for us to invest in quality businesses that are benefiting from the ongoing economic development of emerging markets but are often fully priced. In addition, history shows that MSCI EM Index has troughed ahead of the S&P 500® Index in four of the 10 prior bear markets and on the same date as the S&P® 500 Index on three occasions. Given that China is more likely to be stimulating their economy when other major nations are still curbing growth, we suspect that MSCI EM Index will trough ahead of developed market in this cycle. With respect to the Fund’s structure, trading and market activity during the fiscal year resulted in increased exposure to financials, consumer staples, and industrials, while consumer discretionary, health care, and communication services declined. At the close of the period, the Fund had overweight positions in the consumer discretionary, health care, and financials sectors and underweight positions in the information technology, materials, energy, and industrials sectors relative to the benchmark. Geographically, the portfolio finished the fiscal year with exposures of 78.9% in Asia, 16.0% in Developed Markets, and 3.2% in Latin America. The views expressed represent the opinions of GW&K Investment Management, LLC as of October 31, 2022, and are not intended as a forecast or guarantee of future results, and are subject to change without notice. |
19
| | |
| | | AMG GW&K Emerging Wealth Equity Fund Portfolio Manager’s Comments (continued) |
| | | |
| | | |
CUMULATIVE TOTAL RETURN PERFORMANCE
AMG GW&K Emerging Wealth Equity Fund’s cumulative total return is based on the daily change in net asset value (NAV), and assumes that all dividends and distributions were reinvested. This graph compares a hypothetical $10,000 investment made in the AMG GW&K Emerging Wealth Equity Fund’s Class N shares on March 19, 2015 (inception date), to a $10,000 investment made in the MSCI Emerging Markets Index for the same time period. The graph and table do not reflect the deduction of taxes that a shareholder would pay on a Fund distribution or redemption of shares. The listed returns for the Fund are net of expenses and the returns for the index excludes expenses. Total returns would have been lower had certain expenses not been reduced.
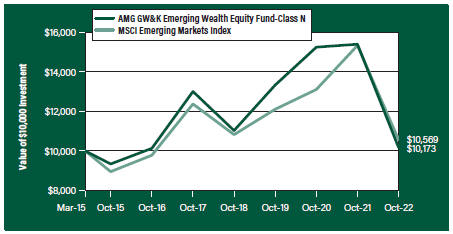
The table below shows the average annual total returns for the AMG GW&K Emerging Wealth Equity Fund and the MSCI Emerging Markets Index for the same time periods ended October 31, 2022.
| | | | | | | | |
| | | One | | Five | | Since | | Inception |
| Average Annual Total Returns1 | | Year | | Years | | Inception | | Date |
|
AMG GW&K Emerging Wealth Equity Fund2, 3, 4, 5, 6, 7, 8, 9 |
| | | | |
Class N | | (33.89%) | | (4.78%) | | 0.23% | | 03/19/15 |
| | | | |
Class I | | (33.68%) | | (4.51%) | | 0.49% | | 03/19/15 |
| | | | |
Class Z | | (33.61%) | | (4.42%) | | 0.60% | | 03/19/15 |
| | | | |
MSCI Emerging Markets Index10 | | (31.03%) | | (3.09%) | | 0.73% | | 03/19/15† |
The performance data shown represents past performance. Past performance is not a guarantee of future results. Current performance may be lower or higher than the performance data quoted. The investment return and principal value of an investment will fluctuate so that an investor’s shares, when redeemed, may be worth more or less than their original cost.
Investors should carefully consider the Fund’s investment objectives, risks, charges and expenses before investing. For performance information through the most recent month end, current net asset values per share for the Fund and other information, please call 800.548.4539 or visit our website at amgfunds.com for a free prospectus. Read it carefully before investing or sending money.
Distributed by AMG Distributors, Inc., member FINRA/SIPC.
| † | Date reflects inception date of the Fund, not the index. |
| 1 | Total return equals income yield plus share price change and assumes reinvestment of all dividends and capital gain distributions. Returns are net of fees and may reflect offsets of Fund expenses as described in the prospectus. No adjustment has been made for taxes payable by shareholders on their reinvested dividends and |
|
capital gain distributions. Returns for periods greater than one year are annualized. The listed returns on the Fund are net of expenses and based on the published NAV as of October 31, 2022. All returns are in U.S. Dollars ($). 2 Investments in international securities are subject to certain risks of overseas investing including currency fluctuations and changes in political and economic conditions, which could result in significant market fluctuations. These risks are magnified in emerging markets. 3 The Fund is subject to the risks associated with investments in emerging markets, such as erratic earnings patterns, economic and political instability, changing exchange controls, limitations on repatriation of foreign capital and changes in local governmental attitudes toward private investment, possibly leading to nationalization or confiscation of investor assets. 4 The Fund is subject to currency risk resulting from fluctuations in exchange rates that may affect the total loss or gain on a non-U.S. Dollar investment when converted back to U.S. Dollars. 5 The Fund may invest in derivatives such as options and futures; the complexity and rapidly changing structure of derivatives markets may increase the possibility of market losses. 6 The Fund is subject to risks associated with investments in mid-capitalization companies such as greater price volatility, lower trading volume, and less liquidity than the stocks of larger, more established companies. 7 The Fund is subject to risks associated with investments in small-capitalization companies, such as erratic earnings patterns, competitive conditions, limited earnings history and a reliance on one or a limited number of products. 8 Market prices of investments held by the Fund may fall rapidly or unpredictably due to a variety of economic or political factors, market conditions, disasters or public health issues, or in response to events that affect particular industries or companies. 9 Companies that are in similar industry sectors may be similarly affected by particular economic or market events; to the extent the Fund has substantial holdings within a particular sector, the risks associated with that sector increase. 10 The MSCI Emerging Markets Index is a free float-adjusted market capitalization index that is designed to measure equity market performance of emerging markets. Please go to msci.com for most current list of countries represented by the index. Unlike the Fund, the MSCI Emerging Markets Index is unmanaged, is not available for investment and does not incur expenses. |
20
| | |
| | | AMG GW&K Emerging Wealth Equity Fund Portfolio Manager’s Comments (continued) |
| | | |
| | | |
| | | | | | | | |
| All MSCI data is provided “as is.” The products described herein are not sponsored or endorsed and have not been reviewed or passed on by MSCI. In no event shall MSCI, its affiliates or any MSCI data | | | | provider have any liability of any kind in connection with the MSCI data or the products described herein. Copying or redistributing the MSCI data is strictly prohibited. | | | | Not FIDC insured, nor bank guaranteed. May lose value. |
21
| | |
| | | AMG GW&K Emerging Wealth Equity Fund Fund Snapshots (unaudited) October 31, 2022 |
PORTFOLIO BREAKDOWN
| | | | | |
| Sector | | % of Net Assets |
| | |
Consumer Discretionary | | | | 32.0 | |
| | |
Financials | | | | 24.8 | |
| | |
Information Technology | | | | 15.1 | |
| | |
Consumer Staples | | | | 7.1 | |
| | |
Communication Services | | | | 7.0 | |
| | |
Health Care | | | | 6.0 | |
| | |
Industrials | | | | 3.6 | |
| | |
Materials | | | | 3.0 | |
| | |
Short-Term Investments | | | | 1.7 | |
| | |
Other Assets, Less Liabilities | | | | (0.3 | ) |
TOP TEN HOLDINGS
| | | | | |
| Security Name | | % of
Net Assets |
| | |
HDFC Bank, Ltd., ADR (India) | | | | 5.6 | |
| | |
Kotak Mahindra Bank, Ltd. (India) | | | | 5.4 | |
| | |
Trip.com Group, Ltd., ADR (China) | | | | 5.1 | |
| | |
Yum China Holdings, Inc. (China) | | | | 4.7 | |
| | |
QUALCOMM, Inc. | | | | 4.4 | |
| | |
Taiwan Semiconductor Manufacturing Co., Ltd. (Taiwan) | | | | 4.3 | |
| | |
Sands China, Ltd. (Macau) | | | | 4.2 | |
| | |
Infineon Technologies AG (Germany) | | | | 3.9 | |
| | |
AIA Group, Ltd. (Hong Kong) | | | | 3.7 | |
| | |
Alibaba Group Holding, Ltd. (China) | | | | 3.3 | |
| | | | | | |
| | |
Top Ten as a Group | | | | 44.6 | |
| | | | | |
Because a fund’s strategy may result in multiple investments in particular sectors of the economy, its performance may depend on the performance of those sectors and may fluctuate more widely than investments diversified across more sectors. For additional information on these and other risk considerations, please see the Fund’s prospectus.
Any sectors, industries, or securities discussed should not be perceived as investment recommendations. Mention of a specific security should not be considered a recommendation to buy or solicitation to sell that security. Specific securities mentioned in this report may have been sold from the Fund’s portfolio of investments by the time you receive this report.
22
| | |
| | | AMG GW&K Emerging Wealth Equity Fund Schedule of Portfolio Investments October 31, 2022 |
| | | | | | | | |
| | |
| | | Shares | | | Value | |
| | |
Common Stocks - 98.6% | | | | | | | | |
| |
Communication Services - 7.0% | | | | | |
| | |
Baidu, Inc., Class A (China)* | | | 167,100 | | | | $1,601,988 | |
| | |
Kingsoft Corp., Ltd. (China) | | | 199,500 | | | | 604,115 | |
| | |
Sea, Ltd., ADR (Singapore)* | | | 7,000 | | | | 347,760 | |
| | |
Tencent Holdings, Ltd. (China) | | | 89,340 | | | | 2,347,569 | |
| | |
The Walt Disney Co. (United States)* | | | 1,778 | | | | 189,428 | |
| | |
Total Communication Services | | | | | | | 5,090,860 | |
| |
Consumer Discretionary - 32.0% | | | | | |
| | |
Alibaba Group Holding, Ltd. (China)* | | | 308,948 | | | | 2,402,042 | |
| | |
Eicher Motors, Ltd. (India) | | | 21,710 | | | | 1,011,544 | |
| | |
H World Group Ltd., ADR (China) | | | 86,759 | | | | 2,349,434 | |
| | |
Haidilao International Holding, Ltd. (China)*,1 | | | 681,000 | | | | 1,011,171 | |
| | |
Hermes International (France) | | | 389 | | | | 503,516 | |
| | |
JD.com, Inc., Class A (China) | | | 14,650 | | | | 266,784 | |
| | |
Jubilant Foodworks, Ltd. (India) | | | 109,610 | | | | 808,585 | |
| | |
Li Ning Co., Ltd. (China) | | | 159,500 | | | | 825,081 | |
| | |
LVMH Moet Hennessy Louis Vuitton SE (France) | | | 736 | | | | 464,412 | |
| | |
MakeMyTrip, Ltd. (India)* | | | 53,109 | | | | 1,478,024 | |
| | |
Moncler SpA (Italy)2 | | | 13,003 | | | | 561,005 | |
| | |
Sands China, Ltd. (Macau)* | | | 1,724,090 | | | | 3,014,096 | |
| | |
Titan Co., Ltd. (India) | | | 38,010 | | | | 1,268,320 | |
| | |
Trip.com Group, Ltd., ADR (China)* | | | 163,242 | | | | 3,694,166 | |
| | |
Yum China Holdings, Inc. (China) | | | 82,478 | | | | 3,410,465 | |
| | |
Total Consumer Discretionary | | | | | | | 23,068,645 | |
| | |
Consumer Staples - 7.1% | | | | | | | | |
| | |
Angel Yeast Co., Ltd., Class A (China) | | | 38,850 | | | | 193,204 | |
| | |
The Estee Lauder Cos., Inc., Class A (United States) | | | 1,465 | | | | 293,718 | |
| | |
Foshan Haitian Flavouring & Food Co., Ltd., Class A (China) | | | 96,810 | | | | 793,447 | |
| | |
Wal-Mart de Mexico, S.A.B. de CV (Mexico) | | | 381,820 | | | | 1,475,016 | |
| | |
Wuliangye Yibin Co., Ltd., Class A (China) | | | 128,203 | | | | 2,349,797 | |
| | |
Total Consumer Staples | | | | | | | 5,105,182 | |
| | |
Financials - 24.8% | | | | | | | | |
| | |
AIA Group, Ltd. (Hong Kong) | | | 354,530 | | | | 2,685,492 | |
| | |
Bank Central Asia Tbk PT (Indonesia) | | | 1,031,400 | | | | 583,027 | |
| | |
China International Capital Corp., Ltd., Class H (China)1 | | | 1,724,900 | | | | 2,397,128 | |
| | |
East Money Information Co., Ltd., Class A (China) | | | 463,174 | | | | 992,903 | |
| | |
HDFC Bank, Ltd., ADR (India) | | | 64,673 | | | | 4,029,775 | |
| | |
HDFC Life Insurance Co., Ltd. (India)1 | | | 350,320 | | | | 2,289,393 | |
| | |
Hong Kong Exchanges & Clearing, Ltd. (Hong Kong) | | | 37,650 | | | | 999,367 | |
| | | | | | | | |
| | |
| | | Shares | | | Value | |
| | |
Kotak Mahindra Bank, Ltd. (India) | | | 169,126 | | | | $3,894,145 | |
| | |
Total Financials | | | | | | | 17,871,230 | |
| | |
Health Care - 6.0% | | | | | | | | |
| | |
China Resources Sanjiu Medical & Pharmaceutical Co., Ltd., Class A (China) | | | 122,812 | | | | 918,568 | |
| | |
CSPC Pharmaceutical Group, Ltd. (China) | | | 1,437,600 | | | | 1,476,648 | |
| | |
Novo Nordisk A/S, Class B (Denmark) | | | 17,714 | | | | 1,926,066 | |
| | |
Total Health Care | | | | | | | 4,321,282 | |
| | |
Industrials - 3.6% | | | | | | | | |
| | |
Contemporary Amperex Technology Co., Ltd., Class A (China) | | | 26,100 | | | | 1,339,445 | |
| | |
Copa Holdings, S.A., Class A (Panama)* | | | 6,245 | | | | 469,811 | |
| | |
Shenzhen Inovance Technology Co., Ltd., Class A (China) | | | 84,300 | | | | 772,345 | |
| | |
Total Industrials | | | | | | | 2,581,601 | |
| |
Information Technology - 15.1% | | | | | |
| | |
Beijing Kingsoft Office Software, Inc., Class A (China) | | | 7,000 | | | | 279,616 | |
| | |
Dlocal, Ltd. (Uruguay)*,2 | | | 16,460 | | | | 367,058 | |
| | |
Infineon Technologies AG (Germany) | | | 114,945 | | | | 2,789,196 | |
| | |
Mastercard, Inc., Class A (United States) | | | 3,420 | | | | 1,122,375 | |
| | |
QUALCOMM, Inc. (United States) | | | 27,274 | | | | 3,209,059 | |
| | |
Taiwan Semiconductor Manufacturing Co., Ltd. (Taiwan) | | | 257,500 | | | | 3,095,719 | |
| | |
Total Information Technology | | | | | | | 10,863,023 | |
| | |
Materials - 3.0% | | | | | | | | |
| | |
Asian Paints, Ltd. (India) | | | 23,578 | | | | 887,548 | |
| | |
Chr Hansen Holding A/S (Denmark)2 | | | 10,833 | | | | 601,677 | |
| | |
Skshu Paint Co., Ltd., Class A (China)* | | | 59,250 | | | | 707,433 | |
| | |
Total Materials | | | | | | | 2,196,658 | |
| | |
Total Common Stocks
(Cost $78,787,366) | | | | | | | 71,098,481 | |
| | |
| | | Principal Amount | | | | |
| |
Short-Term Investments - 1.7% | | | | | |
| |
Joint Repurchase Agreements - 1.7%3 | | | | | |
| | |
Citigroup Global Markets, Inc., dated 10/31/22, due 11/01/22, 3.000% total to be received $256,679 (collateralized by various U.S. Treasuries, 0.125% - 4.375%, 11/15/31 - 02/15/52, totaling $261,945) | | | $256,658 | | | | 256,658 | |
The accompanying notes are an integral part of these financial statements.
23
| | |
| | | AMG GW&K Emerging Wealth Equity Fund Schedule of Portfolio Investments (continued) |
| | | | | | | | |
| | |
| | | Principal
Amount | | | Value | |
| |
Joint Repurchase Agreements - 1.7%3
(continued) | | | | | |
| | |
RBC Dominion Securities, Inc., dated 10/31/22, due 11/01/22, 3.050% total to be received $1,000,085 (collateralized by various U.S. Government Agency Obligations and U.S. Treasuries, 0.500% - 5.000%, 02/28/26 - 10/20/52, totaling $1,020,000) | | $ | 1,000,000 | | | | $1,000,000 | |
| | |
Total Short-Term Investments
(Cost $1,256,658) | | | | | | | 1,256,658 | |
| | | | | | | | |
| | |
| | | | | | Value | |
| | |
Total Investments - 100.3%
(Cost $80,044,024) | | | | | | $ | 72,355,139 | |
| |
Other Assets, less Liabilities - (0.3)% | | | | (231,474 | ) |
| | |
Net Assets - 100.0% | | | | | | $ | 72,123,665 | |
| * | Non-income producing security. |
| 1 | Security exempt from registration under Rule 144A of the Securities Act of 1933. This security may be resold in transactions exempt from registration, normally to qualified institutional buyers. At October 31, 2022, the value of these securities amounted to $5,697,692 or 7.9% of net assets. |
| 2 | Some of these securities, amounting to $1,183,977 or 1.6% of net assets, were out on loan to various borrowers and are collateralized by cash. See Note 4 of Notes to Financial Statements. |
| 3 | Cash collateral received for securities lending activity was invested in these joint repurchase agreements. |
ADR American Depositary Receipt
The following table summarizes the inputs used to value the Fund’s investments by the fair value hierarchy levels as of October 31, 2022:
| | | | | | | | | | | | | | | | |
| | | Level 1 | | | Level 21 | | | Level 3 | | | Total | |
Investments in Securities | | | | | | | | | | | | | | | | |
| | | | |
Common Stocks | | | | | | | | | | | | | | | | |
| | | | |
Consumer Discretionary | | $ | 10,932,089 | | | $ | 12,136,556 | | | | — | | | $ | 23,068,645 | |
| | | | |
Financials | | | 4,029,775 | | | | 13,841,455 | | | | — | | | | 17,871,230 | |
| | | | |
Information Technology | | | 4,698,492 | | | | 6,164,531 | | | | — | | | | 10,863,023 | |
| | | | |
Consumer Staples | | | 1,768,734 | | | | 3,336,448 | | | | — | | | | 5,105,182 | |
| | | | |
Communication Services | | | 537,188 | | | | 4,553,672 | | | | — | | | | 5,090,860 | |
| | | | |
Health Care | | | — | | | | 4,321,282 | | | | — | | | | 4,321,282 | |
| | | | |
Industrials | | | 469,811 | | | | 2,111,790 | | | | — | | | | 2,581,601 | |
| | | | |
Materials | | | — | | | | 2,196,658 | | | | — | | | | 2,196,658 | |
| | | | |
Short-Term Investments | | | | | | | | | | | | | | | | |
| | | | |
Joint Repurchase Agreements | | | — | | | | 1,256,658 | | | | — | | | | 1,256,658 | |
| | | | | | | | | | | | | | | | |
| | | | |
Total Investments in Securities | | $ | 22,436,089 | | | $ | 49,919,050 | | | | — | | | $ | 72,355,139 | |
| | | | | | | | | | | | | | | | |
| 1 | An external pricing service is used to reflect any impact on security value due to market movements between the time the Fund valued such foreign securities and the earlier closing of foreign markets. |
For the fiscal year ended October 31, 2022, there were no transfers in or out of Level 3.
The accompanying notes are an integral part of these financial statements.
24
| | |
| | | AMG GW&K Emerging Wealth Equity Fund Schedule of Portfolio Investments (continued) |
The country allocation in the Schedule of Portfolio Investments at October 31, 2022, was as follows:
| | |
| Country | | % of Long-Term
Investments |
| |
China | | 43.2 |
| |
Denmark | | 3.6 |
| |
France | | 1.4 |
| |
Germany | | 3.9 |
| |
Hong Kong | | 5.2 |
| |
India | | 22.0 |
| |
Indonesia | | 0.8 |
| |
Italy | | 0.8 |
| |
Macau | | 4.2 |
| |
Mexico | | 2.1 |
| |
Panama | | 0.7 |
| |
Singapore | | 0.5 |
| |
Taiwan | | 4.3 |
| |
United States | | 6.8 |
| |
Uruguay | | 0.5 |
| |
| | |
| |
| | | 100.0 |
| | |
The accompanying notes are an integral part of these financial statements.
25
| | |
| | | AMG GW&K Small/Mid Cap Growth Fund Portfolio Manager’s Comments (unaudited) |
| | | |
| | | |
| | | | |
AMG GW&K Small/Mid Cap Growth Fund (the “Fund”) Class N shares outperformed its benchmark for the 12 months ended October 31, 2022, returning (23.88)% vs. the Russell 2500® Growth Index (the “Index”) return of (27.38)%. MARKET OVERVIEW For the year ended October 31, 2022, U.S. equity markets faced several macro challenges that produced difficult performance returns. Well-known issues including surging inflation, rapidly increasing interest rates, the Russia/Ukraine war, elevated commodity prices and COVID-restrained growth in China compressed valuation multiples and challenged corporate profits. While October witnessed a strong rally, double-digit declines were posted by the major averages over the full year. Domestic small/mid cap equities slightly underperformed larger cap stocks, reflected by the Russell 2500® Index moving (17.58)% lower, compared to the (14.61)% decline in the S&P 500® Index. Cyclical and defensive stocks helped small/mid value stocks produce better relative returns while valuation compression, most noticeably in health care and information technology, caused small/mid growth stocks to give back a large portion of prior appreciation. FUND REVIEW The Fund fell sharply during the year but still outperformed its benchmark. Stock selection was the primary driver of the outperformance. Health care was the largest contributor with a broad number of holdings playing a role. Better than expected patient volumes and revenue/day metrics pushed Acadia Healthcare 31.1% higher while its peer group fell | | (22.5)%. HealthEquity, a provider of health savings account platforms, continued to increase its market share and benefited from higher interest rates. In biopharma, a focus on companies with promising new products and late-stage commercial pipelines enabled Halozyme Therapeutics and Neurocrine Biosciences to post positive returns and attracted takeover bids for Biohaven Pharmaceuticals and Arena Pharmaceuticals. Industrials saw multiple areas of performance support. The successful integration of an acquisition moved RBC Bearings into a high single-digit gain. Billings and pipelines that were above expectations lifted consulting firms Booz Allen Hamilton Holdings and CACI International. A timely purchase of IDEX resulted in respectable contribution. Although slightly lower over the year, Ritchie Bros. Auctioneers, Ingersoll Rand, and Graco added to relative returns. Shifting to consumer discretionary, Grand Canyon Education reported an inflection in new online student starts in the September quarter and raised guidance for the balance of 2022. Texas Roadhouse beat consensus earnings expectations and posted impressive comparable restaurant sales of 8.2%. Fund sectors lagging the Index included information technology and financials. Two stocks accounted for the information technology underperformance. Cerence reported disappointing earnings and turnover in the executive suite and was sold. HubSpot’s results over the past year were quite respectable, but investors fretted over the company’s meaningful exposure to overseas markets and small and medium sized businesses. In financials, most of the underperformance was explained by MarketAxess Holdings. The stock was weak due to investor concerns about market share, and the | | uptick in interest rates pressured high multiple equities like MarketAxess. Looking at relative performance through a factor lens, the Fund’s allocation toward higher quality stocks helped results by about 130 basis points based on an average of seven factors, with earnings being the most prominent factor. OUTLOOK Looking forward, we anticipate the U.S. Federal Reserve’s (the Fed) commitment to higher interest rates and their impact on U.S. economic growth and corporate profits are likely to keep market volatility in an elevated status. Our current base case is that a deeper and/or more prolonged U.S. recession can still be avoided. In our view, the steep decline in the Index would indicate that investors are certainly not ignoring the potential for lower corporate earnings power or the effects of higher interest rates. On a positive note, compression in P/E multiples for small/mid cap growth stocks has created more attractive valuations in this complex climate. Our strategy is to invest and hold companies with strengths in competitive position, financials, and management where the stocks appear reasonably priced relative to risks. This approach has served us well in the past and we will stick with it during these challenging times. The views expressed represent the opinions of GW&K Investment Management, LLC, as of October 31, 2022, and are not intended as a forecast or guarantee of future results and are subject to change without notice. |
26
| | |
| | | AMG GW&K Small/Mid Cap Growth Fund Portfolio Manager’s Comments (continued) |
| | | |
| | | |
CUMULATIVE TOTAL RETURN PERFORMANCE
AMG GW&K Small/Mid Cap Growth Fund’s cumulative total return is based on the daily change in net asset value (NAV), and assumes that all dividends and distributions were reinvested. The graph compares a hypothetical $10,000 investment made in the AMG GW&K Small/Mid Cap Growth Fund’s Class N shares on October 31, 2012, to a $10,000 investment made in the Russell 2500® Growth Index for the same time period. The graph and table do not reflect the deduction of taxes that a shareholder would pay on a Fund distribution or redemption of shares. The listed returns for the Fund are net of expenses and the returns for the index excludes expenses. Total returns would have been lower had certain expenses not been reduced.
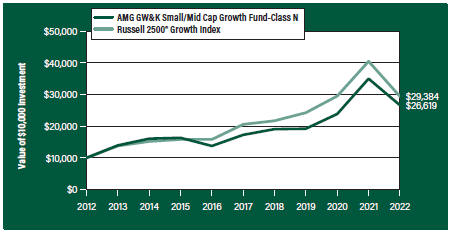
The table below shows the average annual total returns for the AMG GW&K Small/Mid Cap Growth Fund and the Russell 2500® Growth Index for the same time periods ended October 31, 2022.
| | | | | | | | | | | | | | | | | | |
| | | One | | Five | | | Ten | | | Since | | | Inception | |
| Average Annual Total Returns1 | | Year | | Years | | | Years | | | Inception | | | Date | |
|
AMG GW&K Small/Mid Cap Growth Fund2, 3, 4, 5, 6, 7, 8, 9, 10, 11 | |
| | | | | |
Class N | | (23.88%) | | | 9.06% | | | | 10.29% | | | | 9.71% | | | | 11/03/10 | |
| | | | | |
Class I | | (23.82%) | | | 9.25% | | | | 10.52% | | | | 8.40% | | | | 06/01/11 | |
| | | | | |
Class Z | | (23.76%) | | | — | | | | — | | | | (18.65%) | | | | 08/31/21 | |
| | | | | |
Russell 2500® Growth Index12 | | (27.38%) | | | 7.41% | | | | 11.38% | | | | 11.20% | | | | 11/03/10† | |
The performance data shown represents past performance. Past performance is not a guarantee of future results. Current performance may be lower or higher than the performance data quoted. The investment return and principal value of an investment will fluctuate so that an investor’s shares, when redeemed, may be worth more or less than their original cost.
Investors should carefully consider the Fund’s investment objectives, risks, charges and expenses before investing. For performance information through the most recent month end, current net asset values per share for the Fund and other information, please call 800.548.4539 or visit our website at amgfunds.com for a free prospectus. Read it carefully before investing or sending money.
Distributed by AMG Distributors, Inc., member FINRA/SIPC.
| † | Date reflects the inception date of the Fund, not the index. |
| 1 | Total return equals income yield plus share price change and assumes reinvestment of all dividends and capital gain distributions. Returns are net of fees and may reflect offsets of Fund expenses as described in the prospectus. No adjustment has been made for taxes payable by shareholders on their reinvested dividends and |
|
capital gain distributions. Returns for periods greater than one year are annualized. The listed returns on the Fund are net of expenses and based on the published NAV as of October 31, 2022. All returns are in U.S. Dollars ($). 2 As of March 19, 2021, the Fund’s subadviser was changed to GW&K Investment Management, LLC. Prior to March 19, 2021, the Fund was known as the AMG Managers LMCG Small Cap Growth Fund and had different principal investment strategies and corresponding risks. Effective March 19, 2021, the Fund changed its name to AMG GW&K Small Cap Fund II. Effective May 21, 2021, the Fund changed its name to AMG GW&K Small/Mid Cap Growth Fund and made changes to its principal investment strategies. Performance shown for periods prior to March 19, 2021, reflects the performance and investment strategies of the Fund’s previous subadviser, LMCG Investments, LLC. The Fund’s past performance would have been different if the Fund were managed by the current subadviser and strategy, and the Fund’s prior performance record might be less pertinent for investors considering whether to purchase shares of the Fund. 3 From time to time, the Fund’s adviser has waived its fees and/or absorbed Fund expenses, which has resulted in higher returns. 4 The Fund is subject to risks associated with investments in small-capitalization companies, such as erratic earnings patterns, competitive conditions, limited earnings history and a reliance on one or a limited number of products. 5 Active and frequent trading of a fund may result in higher transaction costs and increased tax liability. 6 The Fund invests in growth stocks, which may be more sensitive to market movements because their prices tend to reflect future investor expectations rather than just current profits. Growth stocks may underperform value stocks during given periods. 7 Investments in international securities are subject to certain risks of overseas investing including currency fluctuations and changes in political and economic conditions, which could result in significant market fluctuations. These risks are magnified in emerging markets. 8 Investing in initial public offerings (IPOs) is risky and the prices of stocks purchased in IPOs tend to fluctuate more widely than stocks of companies that have been publicly traded for a longer period of time. Stocks purchased in IPOs generally do not have a trading history, and information about the companies may be available for very limited periods. 9 The Fund is subject to risks associated with investments in mid-capitalization companies such as greater price volatility, lower trading volume, and |
27
| | |
| | | AMG GW&K Small/Mid Cap Growth Fund Portfolio Manager’s Comments (continued) |
| | | |
| | | |
| | | | |
less liquidity than the stocks of larger, more established companies. 10 Companies that are in similar industry sectors may be similarly affected by particular economic or market events; to the extent the Fund has substantial holdings within a particular sector, the risks associated with that sector increase. 11 Market prices of investments held by the Fund may fall rapidly or unpredictably due to a variety of | | economic or political factors, market conditions, disasters or public health issues, or in response to events that affect particular industries or companies. 12 The Russell 2500® Growth Index measures the performance of the small- to mid-cap growth segment of the U.S. equity universe. It includes those Russell 2500® companies with higher price-to-book ratios and higher forecasted growth values. Unlike the Fund, the Russell 2500® Growth | | Index is unmanaged, is not available for investment and does not incur expenses. The Russell Indices are a trademark of the London Stock Exchange Group companies. Not FDIC insured, nor bank guaranteed. May lose value. |
28
| | |
| | | AMG GW&K Small/Mid Cap Growth Fund Fund Snapshots (unaudited) October 31, 2022 |
| | | |
| | | |
PORTFOLIO BREAKDOWN
| | |
| Sector | | % of
Net Assets |
| | |
| Health Care | | 22.9 |
| | |
| Information Technology | | 22.1 |
| | |
| Industrials | | 18.7 |
| | |
| Consumer Discretionary | | 15.6 |
| | |
| Energy | | 6.1 |
| | |
| Financials | | 5.6 |
| | |
| Materials | | 3.4 |
| | |
| Consumer Staples | | 1.6 |
| | |
| Real Estate | | 1.2 |
| | |
| Short-Term Investments | | 3.7 |
| | |
| Other Assets, Less Liabilities | | (0.9) |
TOP TEN HOLDINGS
| | | | |
| Security Name | | % of
Net Assets | |
| | |
Paylocity Holding Corp. | | | 2.7 | |
| | |
RBC Bearings, Inc. | | | 2.4 | |
| | |
HubSpot, Inc. | | | 2.3 | |
| | |
Ritchie Bros. Auctioneers, Inc. (Canada) | | | 2.3 | |
| | |
Matador Resources Co. | | | 2.2 | |
| | |
Manhattan Associates, Inc. | | | 2.2 | |
| | |
Atkore, Inc. | | | 2.0 | |
| | |
Texas Roadhouse, Inc. | | | 2.0 | |
| | |
Five Below, Inc. | | | 1.9 | |
| | |
Globant SA (Uruguay) | | | 1.9 | |
| | | | |
| | |
Top Ten as a Group | | | 21.9 | |
| | | | |
Because a fund’s strategy may result in multiple investments in particular sectors of the economy, its performance may depend on the performance of those sectors and may fluctuate more widely than investments diversified across more sectors. For additional information on these and other risk considerations, please see the Fund’s prospectus.
Any sectors, industries, or securities discussed should not be perceived as investment recommendations. Mention of a specific security should not be considered a recommendation to buy or solicitation to sell that security. Specific securities mentioned in this report may have been sold from the Fund’s portfolio of investments by the time you receive this report.
29
| | |
| | | AMG GW&K Small/Mid Cap Growth Fund Schedule of Portfolio Investments October 31, 2022 |
| | | |
| | | |
| | | | | | | | |
| | | Shares | | | Value | |
| | |
Common Stocks - 97.2% | | | | | | | | |
| |
Consumer Discretionary - 15.6% | | | | | |
| | |
Bright Horizons Family Solutions, Inc.* | | | 2,006 | | | | $131,032 | |
| | |
Burlington Stores, Inc.*,1 | | | 3,129 | | | | 447,322 | |
| | |
Churchill Downs, Inc. | | | 2,280 | | | | 474,035 | |
| | |
Five Below, Inc.* | | | 4,153 | | | | 607,792 | |
| | |
Grand Canyon Education, Inc.* | | | 4,669 | | | | 469,841 | |
| | |
Holley, Inc.*,1 | | | 30,100 | | | | 119,798 | |
| | |
Krispy Kreme Inc. | | | 21,435 | | | | 307,592 | |
| | |
Lithia Motors, Inc., Class A | | | 1,194 | | | | 236,591 | |
| | |
LKQ Corp. | | | 9,899 | | | | 550,780 | |
| | |
Pool Corp. | | | 1,290 | | | | 392,457 | |
| | |
Revolve Group, Inc.*,1 | | | 13,855 | | | | 332,520 | |
| | |
Texas Roadhouse, Inc. | | | 6,403 | | | | 633,577 | |
| | |
Vail Resorts, Inc. | | | 989 | | | | 216,720 | |
| | |
Total Consumer Discretionary | | | | | | | 4,920,057 | |
| | |
Consumer Staples - 1.6% | | | | | | | | |
| | |
Performance Food Group Co.* | | | 5,475 | | | | 284,919 | |
| | |
PriceSmart, Inc. | | | 3,156 | | | | 201,889 | |
| | |
Total Consumer Staples | | | | | | | 486,808 | |
| | |
Energy - 6.1% | | | | | | | | |
| | |
ChampionX Corp. | | | 16,700 | | | | 477,954 | |
| | |
Matador Resources Co. | | | 10,650 | | | | 707,692 | |
| | |
Ovintiv, Inc. | | | 6,850 | | | | 346,953 | |
| | |
SM Energy Co. | | | 8,750 | | | | 393,575 | |
| | |
Total Energy | | | | | | | 1,926,174 | |
| | |
Financials - 5.6% | | | | | | | | |
| | |
Evercore, Inc., Class A | | | 2,748 | | | | 288,815 | |
| | |
Houlihan Lokey, Inc. | | | 4,950 | | | | 442,134 | |
| | |
MarketAxess Holdings, Inc. | | | 1,471 | | | | 358,983 | |
| | |
Pinnacle Financial Partners, Inc. | | | 5,045 | | | | 418,685 | |
| | |
Signature Bank | | | 1,680 | | | | 266,330 | |
| | |
Total Financials | | | | | | | 1,774,947 | |
| | |
Health Care - 22.9% | | | | | | | | |
| | |
ABIOMED, Inc.* | | | 1,175 | | | | 296,194 | |
| | |
Acadia Healthcare Co., Inc.* | | | 6,122 | | | | 497,719 | |
| | |
Albireo Pharma, Inc.*,1 | | | 13,484 | | | | 276,692 | |
| | |
Azenta, Inc. | | | 6,982 | | | | 310,001 | |
| | |
Bio-Rad Laboratories, Inc., Class A* | | | 607 | | | | 213,488 | |
| | |
Catalent, Inc.* | | | 5,391 | | | | 354,350 | |
| | |
Chemed Corp. | | | 636 | | | | 296,929 | |
| | |
CryoPort, Inc.* | | | 6,983 | | | | 193,848 | |
| | |
Globus Medical, Inc., Class A* | | | 8,530 | | | | 571,510 | |
| | | | | | | | |
| | | Shares | | | Value | |
| | |
Halozyme Therapeutics, Inc.* | | | 11,599 | | | | $554,548 | |
| | |
HealthEquity, Inc.* | | | 6,857 | | | | 534,229 | |
| | |
Horizon Therapeutics Plc* | | | 4,358 | | | | 271,590 | |
| | |
ICU Medical, Inc.* | | | 863 | | | | 128,078 | |
| | |
Integra LifeSciences Holdings Corp.* | | | 6,534 | | | | 328,333 | |
| | |
Intra-Cellular Therapies, Inc.* | | | 5,993 | | | | 273,700 | |
| | |
Medpace Holdings, Inc.* | | | 2,493 | | | | 553,396 | |
| | |
Neurocrine Biosciences, Inc.* | | | 4,316 | | | | 496,858 | |
| | |
Oyster Point Pharma, Inc.*,1 | | | 18,021 | | | | 141,285 | |
| | |
Phathom Pharmaceuticals, Inc.* | | | 20,238 | | | | 214,523 | |
| | |
Syneos Health, Inc.* | | | 7,160 | | | | 360,721 | |
| | |
West Pharmaceutical Services, Inc. | | | 1,599 | | | | 367,930 | |
| | |
Total Health Care | | | | | | | 7,235,922 | |
| | |
Industrials - 18.7% | | | | | | | | |
| | |
Atkore, Inc.* | | | 6,733 | | | | 641,655 | |
| | |
Booz Allen Hamilton Holding Corp. | | | 3,600 | | | | 391,860 | |
| | |
CACI International, Inc., Class A* | | | 1,418 | | | | 431,114 | |
| | |
Dycom Industries, Inc.* | | | 2,035 | | | | 240,496 | |
| | |
Gibraltar Industries, Inc.* | | | 1,893 | | | | 96,694 | |
| | |
Graco, Inc. | | | 5,932 | | | | 412,749 | |
| | |
IDEX Corp. | | | 1,800 | | | | 400,158 | |
| | |
Ingersoll Rand, Inc. | | | 9,482 | | | | 478,841 | |
| | |
Knight-Swift Transportation Holdings, Inc. | | | 5,822 | | | | 279,631 | |
| | |
RBC Bearings, Inc.* | | | 3,000 | | | | 760,590 | |
| | |
Ritchie Bros. Auctioneers, Inc. (Canada) | | | 10,983 | | | | 717,519 | |
| | |
SiteOne Landscape Supply, Inc.* | | | 4,734 | | | | 548,529 | |
| | |
The Toro Co. | | | 4,560 | | | | 480,761 | |
| | |
Total Industrials | | | | | | | 5,880,597 | |
| | |
Information Technology - 22.1% | | | | | | | | |
| | |
Cognex Corp. | | | 12,121 | | | | 560,354 | |
| | |
CyberArk Software, Ltd. (Israel)* | | | 2,060 | | | | 323,235 | |
| | |
The Descartes Systems Group, Inc. (Canada)* | | | 5,712 | | | | 394,528 | |
| | |
Entegris, Inc. | | | 5,504 | | | | 436,687 | |
| | |
Globant SA (Uruguay)* | | | 3,163 | | | | 596,795 | |
| | |
HubSpot, Inc.* | | | 2,484 | | | | 736,655 | |
| | |
MACOM Technology Solutions Holdings, Inc.* | | | 5,365 | | | | 310,472 | |
| | |
Manhattan Associates, Inc.* | | | 5,722 | | | | 696,196 | |
| | |
Paycor HCM, Inc.* | | | 13,735 | | | | 418,505 | |
| | |
Paylocity Holding Corp.* | | | 3,675 | | | | 851,828 | |
| | |
Power Integrations, Inc. | | | 4,215 | | | | 281,183 | |
| | |
Rapid7, Inc.* | | | 4,883 | | | | 221,053 | |
| | |
Silicon Laboratories, Inc.* | | | 2,132 | | | | 245,009 | |
| | |
SS&C Technologies Holdings, Inc. | | | 4,090 | | | | 210,308 | |
The accompanying notes are an integral part of these financial statements.
30
| | |
| | | AMG GW&K Small/Mid Cap Growth Fund Schedule of Portfolio Investments (continued) |
| | | |
| | | |
| | | | | | | | |
| | | Shares | | | Value | |
| | |
Information Technology - 22.1% | | | | | | | | |
(continued) | | | | | | | | |
| | |
Tyler Technologies, Inc.* | | | 851 | | | | $275,154 | |
| | |
Zebra Technologies Corp., Class A* | | | 1,494 | | | | 423,131 | |
| | |
Total Information Technology | | | | | | | 6,981,093 | |
| | |
Materials - 3.4% | | | | | | | | |
| | |
AptarGroup, Inc. | | | 2,909 | | | | 288,427 | |
| | |
Avient Corp. | | | 6,182 | | | | 213,217 | |
| | |
Eagle Materials, Inc. | | | 1,199 | | | | 146,650 | |
| | |
RPM International, Inc. | | | 4,507 | | | | 426,227 | |
| | |
Total Materials | | | | | | | 1,074,521 | |
| | |
Real Estate - 1.2% | | | | | | | | |
| | |
Sun Communities, Inc., REIT | | | 2,776 | | | | 374,344 | |
| | |
Total Common Stocks
(Cost $34,265,445) | | | | | | | 30,654,463 | |
| | |
| | | Principal
Amount | | | | |
Short-Term Investments - 3.7% | | | | | | | | |
| |
Joint Repurchase Agreements - 1.6%2 | | | | | |
| | |
Citigroup Global Markets, Inc., dated 10/31/22, due 11/01/22, 3.000% total to be received $510,000 (collateralized by various U.S. Treasuries, 0.125% - 4.375%, 11/15/31 - 02/15/52, totaling $520,462) | | | $509,958 | | | | 509,958 | |
| | | | | | | | |
| | | Principal
Amount | | | Value | |
| |
Repurchase Agreements - 2.1% | | | | | |
| | |
Fixed Income Clearing Corp., dated 10/31/22, due 11/01/22, 2.900% total to be received $670,054 (collateralized by a U.S. Treasury, 1.625%, 05/15/31, totaling $683,465) | | | $670,000 | | | | $670,000 | |
| | |
Total Short-Term Investments
(Cost $1,179,958) | | | | | | | 1,179,958 | |
| | |
Total Investments - 100.9%
(Cost $35,445,403) | | | | | | | 31,834,421 | |
| | |
Other Assets, less Liabilities - (0.9)% | | | | | | | (289,265 | ) |
| | |
Net Assets - 100.0% | | | | | | | $31,545,156 | |
| * | Non-income producing security. |
| 1 | Some of these securities, amounting to $1,104,767 or 3.5% of net assets, were out on loan to various borrowers and are collateralized by cash and various U.S. Treasury Obligations. See Note 4 of Notes to Financial Statements. |
| 2 | Cash collateral received for securities lending activity was invested in these joint repurchase agreements. |
REIT Real Estate Investment Trust
| | | | | | | | | | | | | | | | |
| | | Level 1 | | | Level 2 | | | Level 3 | | | Total | |
Investments in Securities | | | | | | | | | | | | | | | | |
| | | | |
Common Stocks† | | $ | 30,654,463 | | | | — | | | | — | | | $ | 30,654,463 | |
Short-Term Investments | | | | | | | | | | | | | | | | |
| | | | |
Joint Repurchase Agreements | | | — | | | $ | 509,958 | | | | — | | | | 509,958 | |
| | | | |
Repurchase Agreements | | | — | | | | 670,000 | | | | — | | | | 670,000 | |
| | | | | | | | | | | | | | | | |
| | | | |
Total Investments in Securities | | $ | 30,654,463 | | | $ | 1,179,958 | | | | — | | | $ | 31,834,421 | |
| | | | | | | | | | | | | | | | |
| † | All common stocks held in the Fund are Level 1 securities. For a detailed breakout of common stocks by major industry classification, please refer to the Fund’s Schedule of Portfolio Investments. |
For the fiscal year ended October 31, 2022, there were no transfers in or out of Level 3.
The accompanying notes are an integral part of these financial statements.
31
| | |
| | | Statement of Assets and Liabilities October 31, 2022 |
| | | |
| | | |
| | | | | | | | | | | | | | | | | | | | |
| | | AMG GW&K
Core Bond
ESG Fund | | AMG GW&K
Emerging Markets
Equity Fund | | AMG GW&K
Emerging Wealth
Equity Fund | | AMG GW&K
Small/Mid Cap
Growth Fund |
| | | | |
Assets: | | | | | | | | | | | | | | | | | | | | |
| | | | |
Investments at value1 (including securities on loan valued at $151,198, $637,837, $1,183,977, and $1,104,767, respectively) | | | | $140,328,417 | | | | | $16,482,237 | | | | | $72,355,139 | | | | | $31,834,421 | |
| | | | |
Cash | | | | 594,678 | | | | | 4,683 | | | | | — | | | | | 266,970 | |
| | | | |
Foreign currency2 | | | | — | | | | | 44,625 | | | | | 896,319 | | | | | — | |
| | | | |
Receivable for investments sold | | | | — | | | | | 116,197 | | | | | 807,033 | | | | | — | |
| | | | |
Dividend and interest receivables | | | | 1,093,081 | | | | | 8,828 | | | | | 86,527 | | | | | 7,104 | |
| | | | |
Securities lending income receivable | | | | — | | | | | 380 | | | | | 174 | | | | | 289 | |
| | | | |
Receivable for Fund shares sold | | | | 1,328 | | | | | 171 | | | | | 2,525 | | | | | 907 | |
| | | | |
Receivable from affiliate | | | | 163 | | | | | 18,891 | | | | | 11,356 | | | | | 9,896 | |
| | | | |
Prepaid expenses and other assets | | | | 13,788 | | | | | 3,423 | | | | | 8,528 | | | | | 7,852 | |
| | | | |
Total assets | | | | 142,031,455 | | | | | 16,679,435 | | | | | 74,167,601 | | | | | 32,127,439 | |
| | | | |
Liabilities: | | | | | | | | | | | | | | | | | | | | |
| | | | |
Payable upon return of securities loaned | | | | 157,604 | | | | | 383,214 | | | | | 1,256,658 | | | | | 509,958 | |
| | | | |
Payable for investments purchased | | | | — | | | | | 39,275 | | | | | — | | | | | — | |
| | | | |
Payable for Fund shares repurchased | | | | 13,017 | | | | | 52,417 | | | | | 325,886 | | | | | 105 | |
| | | | |
Payable for foreign capital gains tax | | | | — | | | | | — | | | | | 24,233 | | | | | — | |
| | | | |
Due to custodian | | | | — | | | | | — | | | | | 252,217 | | | | | — | |
| | | | |
Accrued expenses: | | | | | | | | | | | | | | | | | | | | |
| | | | |
Investment advisory and management fees | | | | 36,550 | | | | | 7,968 | | | | | 37,457 | | | | | 15,862 | |
| | | | |
Administrative fees | | | | 18,275 | | | | | 2,173 | | | | | 10,216 | | | | | 3,838 | |
| | | | |
Distribution fees | | | | 364 | | | | | 43 | | | | | 75 | | | | | 6,046 | |
| | | | |
Shareholder service fees | | | | — | | | | | 1,747 | | | | | 947 | | | | | 268 | |
| | | | |
Other | | | | 89,068 | | | | | 82,408 | | | | | 136,247 | | | | | 46,206 | |
| | | | |
Total liabilities | | | | 314,878 | | | | | 569,245 | | | | | 2,043,936 | | | | | 582,283 | |
| | | | | | | | | | | | | | | | | | | | |
| | | | |
Net Assets | | | | $141,716,577 | | | | | $16,110,190 | | | | | $72,123,665 | | | | | $31,545,156 | |
| | | | |
1 Investments at cost | | | | $166,058,547 | | | | | $15,532,016 | | | | | $80,044,024 | | | | | $35,445,403 | |
| | | | |
2 Foreign currency at cost | | | | — | | | | | $45,913 | | | | | $941,300 | | | | | — | |
The accompanying notes are an integral part of these financial statements.
32
| | |
| | | Statement of Assets and Liabilities (continued) |
| | | |
| | | |
| | | | | | | | | | | | | | | | | | | | |
| | | AMG GW&K
Core Bond
ESG Fund | | AMG GW&K
Emerging Markets
Equity Fund | | AMG GW&K
Emerging Wealth
Equity Fund | | AMG GW&K
Small/Mid Cap
Growth Fund |
| | | | |
Net Assets Represent: | | | | | | | | | | | | | | | | | | | | |
| | | | |
Paid-in capital | | | | $171,061,413 | | | | | $20,590,248 | | | | | $107,268,377 | | | | | $34,738,637 | |
| | | | |
Total distributable loss | | | | (29,344,836 | ) | | | | (4,480,058 | ) | | | | (35,144,712 | ) | | | | (3,193,481 | ) |
| | | | |
Net Assets | | | | $141,716,577 | | | | | $16,110,190 | | | | | $72,123,665 | | | | | $31,545,156 | |
| | | | |
Class N: | | | | | | | | | | | | | | | | | | | | |
| | | | |
Net Assets | | | | $1,715,755 | | | | | $180,081 | | | | | $329,551 | | | | | $24,993,735 | |
| | | | |
Shares outstanding | | | | 200,490 | | | | | 26,074 | | | | | 37,613 | | | | | 1,858,483 | |
| | | | |
Net asset value, offering and redemption price per share | | | | $8.56 | | | | | $6.91 | | | | | $8.76 | | | | | $13.45 | |
| | | | |
Class I: | | | | | | | | | | | | | | | | | | | | |
| | | | |
Net Assets | | | | $137,805,654 | | | | | $8,519,686 | | | | | $39,367,094 | | | | | $6,539,630 | |
| | | | |
Shares outstanding | | | | 16,094,762 | | | | | 1,246,241 | | | | | 4,433,508 | | | | | 466,712 | |
| | | | |
Net asset value, offering and redemption price per share | | | | $8.56 | | | | | $6.84 | | | | | $8.88 | | | | | $14.01 | |
| | | | |
Class Z: | | | | | | | | | | | | | | | | | | | | |
| | | | |
Net Assets | | | | $2,195,168 | | | | | $7,410,423 | | | | | $32,427,020 | | | | | $11,791 | |
| | | | |
Shares outstanding | | | | 256,574 | | | | | 1,089,990 | | | | | 3,654,553 | | | | | 841 | |
| | | | |
Net asset value, offering and redemption price per share | | | | $8.56 | | | | | $6.80 | | | | | $8.87 | | | | | $14.02 | |
The accompanying notes are an integral part of these financial statements.
33
| | |
| | | Statement of Operations For the fiscal year ended October 31, 2022 |
| | | |
| | | |
| | | | | | | | | | | | | | | | | | | | |
| | | AMG GW&K
Core Bond
ESG Fund | | AMG GW&K
Emerging Markets
Equity Fund | | AMG GW&K
Emerging Wealth
Equity Fund | | AMG GW&K
Small/Mid Cap
Growth Fund |
| | | | |
Investment Income: | | | | | | | | | | | | | | | | | | | | |
| | | | |
Dividend income | | | | — | | | | | $909,142 | | | | | $1,427,820 | | | | | $145,683 | |
| | | | |
Interest income | | | | $3,989,503 | | | | | 173 | | | | | 282 | | | | | 133 | |
| | | | |
Securities lending income | | | | 30 | | | | | 4,195 | | | | | 6,659 | | | | | 11,425 | |
| | | | |
Foreign withholding tax | | | | — | | | | | (120,540 | ) | | | | (90,387 | ) | | | | (2,854 | ) |
| | | | |
Total investment income | | | | 3,989,533 | | | | | 792,970 | | | | | 1,344,374 | | | | | 154,387 | |
| | | | |
Expenses: | | | | | | | | | | | | | | | | | | | | |
| | | | |
Investment advisory and management fees | | | | 505,313 | | | | | 247,455 | | | | | 847,647 | | | | | 217,378 | |
| | | | |
Administrative fees | | | | 252,657 | | | | | 67,488 | | | | | 231,176 | | | | | 52,592 | |
| | | | |
Distribution fees - Class N | | | | 4,705 | | | | | 770 | | | | | 1,518 | | | | | 53,569 | |
| | | | |
Shareholder servicing fees - Class N | | | | 2,823 | | | | | 462 | | | | | 911 | | | | | — | |
| | | | |
Shareholder servicing fees - Class I | | | | 114,934 | | | | | 18,550 | | | | | 53,198 | | | | | 3,164 | |
| | | | |
Professional fees | | | | 66,075 | | | | | 55,833 | | | | | 76,985 | | | | | 32,967 | |
| | | | |
Registration fees | | | | 29,382 | | | | | 10,797 | | | | | 36,153 | | | | | 26,523 | |
| | | | |
Custodian fees | | | | 26,347 | | | | | 69,061 | | | | | 155,861 | | | | | 20,104 | |
| | | | |
Transfer agent fees | | | | 19,501 | | | | | 3,238 | | | | | 8,341 | | | | | 8,065 | |
| | | | |
Reports to shareholders | | | | 11,612 | | | | | 7,981 | | | | | 23,440 | | | | | 12,441 | |
| | | | |
Trustee fees and expenses | | | | 11,592 | | | | | 3,157 | | | | | 10,807 | | | | | 2,370 | |
| | | | |
Interest expense | | | | — | | | | | 8,120 | | | | | 1,041 | | | | | — | |
| | | | |
Miscellaneous | | | | 8,016 | | | | | 4,111 | | | | | 8,104 | | | | | 4,200 | |
| | | | |
Total expenses before offsets | | | | 1,052,957 | | | | | 497,023 | | | | | 1,455,182 | | | | | 433,373 | |
| | | | |
Expense reimbursements | | | | (121,994 | ) | | | | (77,630 | ) | | | | (11,356 | ) | | | | (89,139 | ) |
| | | | |
Expense reductions | | | | — | | | | | — | | | | | — | | | | | (2,196 | ) |
| | | | |
Net expenses | | | | 930,963 | | | | | 419,393 | | | | | 1,443,826 | | | | | 342,038 | |
| | | | | | | | | | | | | | | | | | | | |
| | | | |
Net investment income (loss) | | | | 3,058,570 | | | | | 373,577 | | | | | (99,452 | ) | | | | (187,651 | ) |
| | | | |
Net Realized and Unrealized Loss: | | | | | | | | | | | | | | | | | | | | |
| | | | |
Net realized gain (loss) on investments | | | | (3,645,263 | ) | | | | (4,918,955 | ) | | | | (25,349,394 | ) | | | | 687,666 | 1 |
| | | | | |
Net realized loss on foreign currency transactions | | | | — | | | | | (60,876 | ) | | | | (86,225 | ) | | | | — | |
| | | | |
Net change in unrealized appreciation/depreciation on investments | | | | (30,052,410 | ) | | | | (11,633,429 | ) | | | | (37,837,055 | ) | | | | (10,773,348 | ) |
| | | | |
Net change in unrealized appreciation/depreciation on foreign currency translations | | | | — | | | | | 4,031 | | | | | (48,355 | ) | | | | — | |
| | | | |
Net realized and unrealized loss | | | | (33,697,673 | ) | | | | (16,609,229 | ) | | | | (63,321,029 | ) | | | | (10,085,682 | ) |
| | | | | | | | | | | | | | | | | | | | |
| | | | |
Net decrease in net assets resulting from operations | | | | $(30,639,103) | | | | | $(16,235,652) | | | | | $(63,420,481) | | | | | $(10,273,333) | |
1 Includes a non-recurring securities litigation gain of $316,570.
The accompanying notes are an integral part of these financial statements.
34
| | |
| | | Statements of Changes in Net Assets For the fiscal years ended October 31, |
| | | |
| | | |
| | | | | | | | | | | | | | | | |
| | | AMG GW&K
Core Bond ESG Fund | | AMG GW&K
Emerging Markets
Equity Fund |
| | | | |
| | | 2022 | | 2021 | | 2022 | | 2021 |
| | | | |
Increase (Decrease) in Net Assets Resulting From Operations: | | | | | | | | | | | | | | | | |
| | | | |
Net investment income | | | $3,058,570 | | | | $2,873,232 | | | | $373,577 | | | | $333,862 | |
| | | | |
Net realized gain (loss) on investments | | | (3,645,263 | ) | | | 4,909,231 | | | | (4,979,831 | ) | | | 564,430 | |
| | | | |
Net change in unrealized appreciation/depreciation on investments | | | (30,052,410 | ) | | | (7,605,124 | ) | | | (11,629,398 | ) | | | 2,359,554 | |
| | | | | | | | | | | | | | | | |
| | | | |
Net increase (decrease) in net assets resulting from operations | | | (30,639,103 | ) | | | 177,339 | | | | (16,235,652 | ) | | | 3,257,846 | |
| | | | |
Distributions to Shareholders: | | | | | | | | | | | | | | | | |
| | | | |
Class N | | | (76,235 | ) | | | (21,649 | ) | | | (2,402 | ) | | | (17,233 | ) |
| | | | |
Class I | | | (7,327,695 | ) | | | (2,789,712 | ) | | | (249,212 | ) | | | (1,069,474 | ) |
| | | | |
Class Z | | | (112,920 | ) | | | (57,930 | ) | | | (382,214 | ) | | | (1,249,608 | ) |
| | | | |
Total distributions to shareholders | | | (7,516,850 | ) | | | (2,869,291 | ) | | | (633,828 | ) | | | (2,336,315 | ) |
| | | | |
Capital Share Transactions:1 | | | | | | | | | | | | | | | | |
| | | | |
Net increase (decrease) from capital share transactions | | | (16,283,055 | ) | | | (9,231,990 | ) | | | (25,653,747 | ) | | | 13,857,527 | |
| | | | | | | | | | | | | | | | |
| | | | |
Total increase (decrease) in net assets | | | (54,439,008 | ) | | | (11,923,942 | ) | | | (42,523,227 | ) | | | 14,779,058 | |
| | | | |
Net Assets: | | | | | | | | | | | | | | | | |
| | | | |
Beginning of year | | | 196,155,585 | | | | 208,079,527 | | | | 58,633,417 | | | | 43,854,359 | |
| | | | | | | | | | | | | | | | |
| | | | |
End of year | | | $141,716,577 | | | | $196,155,585 | | | | $16,110,190 | | | | $58,633,417 | |
1 See Note 1(g) of the Notes to Financial Statements.
The accompanying notes are an integral part of these financial statements.
35
| | |
| | | Statements of Changes in Net Assets (continued) For the fiscal years ended October 31, |
| | | |
| | | |
| | | | | | | | | | | | | | | | |
| | | AMG GW&K
Emerging Wealth
Equity Fund | | | AMG GW&K
Small/Mid Cap
Growth Fund | |
| | | | |
| | | 2022 | | | 2021 | | | 2022 | | | 2021 | |
| | | | |
Increase (Decrease) in Net Assets Resulting From Operations: | | | | | | | | | | | | | | | | |
| | | | |
Net investment loss | | | $(99,452 | ) | | | $(547,863 | ) | | | $(187,651 | ) | | | $(375,973 | ) |
| | | | |
Net realized gain (loss) on investments | | | (25,435,619 | ) | | | 2,871,609 | | | | 687,666 | | | | 16,012,613 | |
| | | | |
Net change in unrealized appreciation/depreciation on investments | | | (37,885,410 | ) | | | (5,026,545 | ) | | | (10,773,348 | ) | | | (137,250 | ) |
| | | | | | | | | | | | | | | | |
| | | | |
Net increase (decrease) in net assets resulting from operations | | | (63,420,481 | ) | | | (2,702,799 | ) | | | (10,273,333 | ) | | | 15,499,390 | |
| | | | |
Distributions to Shareholders: | | | | | | | | | | | | | | | | |
| | | | |
From net investment income and/or realized gain on investments: | | | | | | | | | | | | | | | | |
| | | | |
Class N | | | (10,519 | ) | | | — | | | | — | | | | (14,397,541 | ) |
| | | | |
Class I | | | (417,335 | ) | | | — | | | | — | | | | (3,078,320 | ) |
| | | | |
Class Z | | | (1,915,232 | ) | | | (35,421 | ) | | | — | | | | — | |
| | | | |
From paid-in capital: | | | | | | | | | | | | | | | | |
| | | | |
Class N | | | — | | | | — | | | | — | | | | (674,816 | ) |
| | | | |
Class I | | | — | | | | — | | | | — | | | | (144,282 | ) |
| | | | |
Total distributions to shareholders | | | (2,343,086 | ) | | | (35,421 | ) | | | — | | | | (18,294,959 | ) |
| | | | |
Capital Share Transactions:1 | | | | | | | | | | | | | | | | |
| | | | |
Net increase (decrease) from capital share transactions | | | (87,822,351 | ) | | | 18,163,731 | | | | (2,280,329 | ) | | | 11,502,921 | |
| | | | | | | | | | | | | | | | |
| | | | |
Total increase (decrease) in net assets | | | (153,585,918 | ) | | | 15,425,511 | | | | (12,553,662 | ) | | | 8,707,352 | |
| | | | |
Net Assets: | | | | | | | | | | | | | | | | |
| | | | |
Beginning of year | | | 225,709,583 | | | | 210,284,072 | | | | 44,098,818 | | | | 35,391,466 | |
| | | | | | | | | | | | | | | | |
| | | | |
End of year | | | $72,123,665 | | | | $225,709,583 | | | | $31,545,156 | | | | $44,098,818 | |
1 See Note 1(g) of the Notes to Financial Statements.
The accompanying notes are an integral part of these financial statements.
36
| | |
| | | AMG GW&K Core Bond ESG Fund Financial Highlights For a share outstanding throughout each fiscal year |
| | | |
| | | |
| | | | | | | | | | | | | | | | | | | | |
| | | For the fiscal years ended October 31, |
| | | | | |
| Class N | | 2022 | | 2021 | | 2020 | | 2019 | | 2018 |
| | | | | |
Net Asset Value, Beginning of Year | | | $10.75 | | | | $10.90 | | | | $10.53 | | | | $9.67 | | | | $10.14 | |
| | | | | |
Income (loss) from Investment Operations: | | | | | | | | | | | | | | | | | | | | |
| | | | | |
Net investment income1,2 | | | 0.14 | | | | 0.12 | | | | 0.18 | | | | 0.21 | | | | 0.18 | |
| | | | | |
Net realized and unrealized gain (loss) on investments | | | (1.93 | ) | | | (0.15 | ) | | | 0.37 | | | | 0.86 | | | | (0.46 | ) |
| | | | | | | | | | | | | | | | | | | | |
| | | | | |
Total income (loss) from investment operations | | | (1.79 | ) | | | (0.03 | ) | | | 0.55 | | | | 1.07 | | | | (0.28 | ) |
| | | | | |
Less Distributions to Shareholders from: | | | | | | | | | | | | | | | | | | | | |
| | | | | |
Net investment income | | | (0.15 | ) | | | (0.12 | ) | | | (0.18 | ) | | | (0.21 | ) | | | (0.19 | ) |
| | | | | |
Net realized gain on investments | | | (0.25 | ) | | | — | | | | — | | | | — | | | | — | |
| | | | | | | | | | | | | | | | | | | | |
| | | | | |
Total distributions to shareholders | | | (0.40 | ) | | | (0.12 | ) | | | (0.18 | ) | | | (0.21 | ) | | | (0.19 | ) |
| | | | | |
Net Asset Value, End of Year | | | $8.56 | | | | $10.75 | | | | $10.90 | | | | $10.53 | | | | $9.67 | |
| | | | | | | | | | | | | | | | | | | | |
| | | | | |
Total Return2,3 | | | (17.18 | )% | | | (0.27 | )% | | | 5.31 | % | | | 11.20 | % | | | (2.79 | )% |
| | | | | |
Ratio of net expenses to average net assets | | | 0.88 | % | | | 0.88 | % | | | 0.88 | % | | | 0.88 | % | | | 0.88 | % |
| | | | | |
Ratio of gross expenses to average net assets4 | | | 0.95 | % | | | 0.94 | % | | | 0.96 | % | | | 0.95 | % | | | 0.93 | % |
| | | | | |
Ratio of net investment income to average net assets2 | | | 1.49 | % | | | 1.12 | % | | | 1.69 | % | | | 2.10 | % | | | 1.88 | % |
| | | | | |
Portfolio turnover | | | 34 | % | | | 62 | % | | | 56 | % | | | 48 | % | | | 17 | % |
| | | | | |
Net assets end of year (000’s) omitted | | | $1,716 | | | | $2,125 | | | | $1,905 | | | | $1,255 | | | | $502 | |
| | | | | |
| | | | | | | | | | | | | | | | | | | | | |
37
| | |
| | | AMG GW&K Core Bond ESG Fund Financial Highlights For a share outstanding throughout each fiscal year |
| | | |
| | | |
| | | | | | | | | | | | | | | | | | | | |
| | | For the fiscal years ended October 31, |
| | | | | |
| Class I | | 2022 | | 2021 | | 2020 | | 2019 | | 2018 |
| | | | | |
Net Asset Value, Beginning of Year | | | $10.76 | | | | $10.90 | | | | $10.54 | | | | $9.67 | | | | $10.15 | |
| | | | | |
Income (loss) from Investment Operations: | | | | | | | | | | | | | | | | | | | | |
| | | | | |
Net investment income1,2 | | | 0.18 | | | | 0.16 | | | | 0.22 | | | | 0.24 | | | | 0.22 | |
| | | | | |
Net realized and unrealized gain (loss) on investments | | | (1.95 | ) | | | (0.14 | ) | | | 0.36 | | | | 0.88 | | | | (0.48 | ) |
| | | | | | | | | | | | | | | | | | | | |
| | | | | |
Total income (loss) from investment operations | | | (1.77 | ) | | | 0.02 | | | | 0.58 | | | | 1.12 | | | | (0.26 | ) |
| | | | | |
Less Distributions to Shareholders from: | | | | | | | | | | | | | | | | | | | | |
| | | | | |
Net investment income | | | (0.18 | ) | | | (0.16 | ) | | | (0.22 | ) | | | (0.25 | ) | | | (0.22 | ) |
| | | | | |
Net realized gain on investments | | | (0.25 | ) | | | — | | | | — | | | | — | | | | — | |
| | | | | | | | | | | | | | | | | | | | |
| | | | | |
Total distributions to shareholders | | | (0.43 | ) | | | (0.16 | ) | | | (0.22 | ) | | | (0.25 | ) | | | (0.22 | ) |
| | | | | |
Net Asset Value, End of Year | | | $8.56 | | | | $10.76 | | | | $10.90 | | | | $10.54 | | | | $9.67 | |
| | | | | | | | | | | | | | | | | | | | |
| | | | | |
Total Return2,3 | | | (16.99 | )% | | | 0.15 | % | | | 5.55 | % | | | 11.70 | % | | | (2.59 | )% |
| | | | | |
Ratio of net expenses to average net assets | | | 0.55 | % | | | 0.56 | % | | | 0.55 | % | | | 0.55 | % | | | 0.56 | % |
| | | | | |
Ratio of gross expenses to average net assets4 | | | 0.62 | % | | | 0.62 | % | | | 0.63 | % | | | 0.62 | % | | | 0.61 | % |
| | | | | |
Ratio of net investment income to average net assets2 | | | 1.82 | % | | | 1.44 | % | | | 2.01 | % | | | 2.42 | % | | | 2.20 | % |
| | | | | |
Portfolio turnover | | | 34 | % | | | 62 | % | | | 56 | % | | | 48 | % | | | 17 | % |
| | | | | |
Net assets end of year (000’s) omitted | | | $137,806 | | | | $190,306 | | | | $202,363 | | | | $212,801 | | | | $264,795 | |
| | | | | |
| | | | | | | | | | | | | | | | | | | | | |
38
| | |
| | | AMG GW&K Core Bond ESG Fund Financial Highlights For a share outstanding throughout each fiscal year |
| | | |
| | | |
| | | | | | | | | | | | | | | | | | | | |
| | | For the fiscal years ended October 31, |
| | | | | |
| Class Z | | 2022 | | 2021 | | 2020 | | 2019 | | 2018 |
| | | | | |
Net Asset Value, Beginning of Year | | | $10.75 | | | | $10.90 | | | | $10.53 | | | | $9.67 | | | | $10.14 | |
| | | | | |
Income (loss) from Investment Operations: | | | | | | | | | | | | | | | | | | | | |
| | | | | |
Net investment income1,2 | | | 0.18 | | | | 0.16 | | | | 0.22 | | | | 0.25 | | | | 0.23 | |
| | | | | |
Net realized and unrealized gain (loss) on investments | | | (1.94 | ) | | | (0.15 | ) | | | 0.38 | | | | 0.87 | | | | (0.47 | ) |
| | | | | | | | | | | | | | | | | | | | |
| | | | | |
Total income (loss) from investment operations | | | (1.76 | ) | | | 0.01 | | | | 0.60 | | | | 1.12 | | | | (0.24 | ) |
| | | | | |
Less Distributions to Shareholders from: | | | | | | | | | | | | | | | | | | | | |
| | | | | |
Net investment income | | | (0.18 | ) | | | (0.16 | ) | | | (0.23 | ) | | | (0.26 | ) | | | (0.23 | ) |
| | | | | |
Net realized gain on investments | | | (0.25 | ) | | | — | | | | — | | | | — | | | | — | |
| | | | | | | | | | | | | | | | | | | | |
| | | | | |
Total distributions to shareholders | | | (0.43 | ) | | | (0.16 | ) | | | (0.23 | ) | | | (0.26 | ) | | | (0.23 | ) |
| | | | | |
Net Asset Value, End of Year | | | $8.56 | | | | $10.75 | | | | $10.90 | | | | $10.53 | | | | $9.67 | |
| | | | | | | | | | | | | | | | | | | | |
| | | | | |
Total Return2,3 | | | (16.85 | )% | | | 0.13 | % | | | 5.73 | % | | | 11.71 | % | | | (2.42 | )% |
| | | | | |
Ratio of net expenses to average net assets | | | 0.48 | % | | | 0.48 | % | | | 0.48 | % | | | 0.48 | % | | | 0.48 | % |
| | | | | |
Ratio of gross expenses to average net assets4 | | | 0.55 | % | | | 0.54 | % | | | 0.56 | % | | | 0.55 | % | | | 0.53 | % |
| | | | | |
Ratio of net investment income to average net assets2 | | | 1.89 | % | | | 1.52 | % | | | 2.09 | % | | | 2.50 | % | | | 2.28 | % |
| | | | | |
Portfolio turnover | | | 34 | % | | | 62 | % | | | 56 | % | | | 48 | % | | | 17 | % |
| | | | | |
Net assets end of year (000’s) omitted | | | $2,195 | | | | $3,724 | | | | $3,812 | | | | $3,208 | | | | $5,005 | |
| | | | | |
| | | | | | | | | | | | | | | | | | | | | |
| 1 | Per share numbers have been calculated using average shares. |
| 2 | Total returns and net investment income would have been lower had certain expenses not been offset. |
| 3 | The total return is calculated using the published Net Asset Value as of fiscal year end. |
| 4 | Excludes the impact of expense reimbursement or fee waivers and expense reductions such as brokerage credits, but includes expense repayments and non-reimbursable expenses, if any, such as interest, taxes, and extraordinary expenses. (See Note 1(c) and 2 in the Notes to Financial Statements.) |
39
| | |
| | | AMG GW&K Emerging Markets Equity Fund Financial Highlights For a share outstanding throughout each fiscal year |
| | | |
| | | |
| | | | | | | | | | | | | | | | | | | | |
| | | For the fiscal years ended October 31, |
| | | | | |
| Class N | | 2022 | | 2021 | | 2020 | | 2019 | | 2018 |
| | | | | |
Net Asset Value, Beginning of Year | | | $10.30 | | | | $9.73 | | | | $9.52 | | | | $8.61 | | | | $10.11 | |
| | | | | |
Income (loss) from Investment Operations: | | | | | | | | | | | | | | | | | | | | |
| | | | | |
Net investment income1,2 | | | 0.04 | | | | 0.02 | | | | 0.01 | | | | 0.14 | | | | 0.11 | |
| | | | | |
Net realized and unrealized gain (loss) on investments | | | (3.37 | ) | | | 0.96 | | | | 0.70 | | | | 1.04 | | | | (1.54 | ) |
| | | | | | | | | | | | | | | | | | | | |
| | | | | |
Total income (loss) from investment operations | | | (3.33 | ) | | | 0.98 | | | | 0.71 | | | | 1.18 | | | | (1.43 | ) |
| | | | | |
Less Distributions to Shareholders from: | | | | | | | | | | | | | | | | | | | | |
| | | | | |
Net investment income | | | (0.02 | ) | | | (0.07 | ) | | | (0.06 | ) | | | (0.17 | ) | | | (0.07 | ) |
| | | | | |
Net realized gain on investments | | | (0.04 | ) | | | (0.34 | ) | | | (0.44 | ) | | | (0.10 | ) | | | — | |
| | | | | | | | | | | | | | | | | | | | |
| | | | | |
Total distributions to shareholders | | | (0.06 | ) | | | (0.41 | ) | | | (0.50 | ) | | | (0.27 | ) | | | (0.07 | ) |
| | | | | |
Net Asset Value, End of Year | | | $6.91 | | | | $10.30 | | | | $9.73 | | | | $9.52 | | | | $8.61 | |
| | | | | | | | | | | | | | | | | | | | |
| | | | | |
Total Return2,3 | | | (32.50 | )% | | | 9.85 | % | | | 7.55 | % | | | 13.94 | % | | | (14.24 | )% |
| | | | | |
Ratio of net expenses to average net assets | | | 1.29 | %4 | | | 1.27 | %5 | | | 1.34 | % | | | 1.30 | % | | | 1.27 | % |
| | | | | |
Ratio of gross expenses to average net assets6 | | | 1.46 | % | | | 1.37 | %5 | | | 1.52 | % | | | 1.30 | % | | | 1.27 | % |
| | | | | |
Ratio of net investment income to average net assets2 | | | 0.47 | % | | | 0.20 | % | | | 0.13 | % | | | 1.52 | % | | | 1.12 | % |
| | | | | |
Portfolio turnover | | | 46 | % | | | 36 | % | | | 40 | % | | | 123 | % | | | 24 | % |
| | | | | |
Net assets end of year (000’s) omitted | | | $180 | | | | $414 | | | | $412 | | | | $520 | | | | $289 | |
| | | | | |
| | | | | | | | | | | | | | | | | | | | | |
40
| | |
| | | AMG GW&K Emerging Markets Equity Fund Financial Highlights For a share outstanding throughout each fiscal year |
| | | |
| | | |
| | | | | | | | | | | | | | | | | | | | |
| | | For the fiscal years ended October 31, |
| | | | | |
| Class I | | 2022 | | 2021 | | 2020 | | 2019 | | 2018 |
| | | | | |
Net Asset Value, Beginning of Year | | | $10.21 | | | | $9.69 | | | | $9.48 | | | | $8.60 | | | | $10.11 | |
| | | | | |
Income (loss) from Investment Operations: | | | | | | | | | | | | | | | | | | | | |
| | | | | |
Net investment income1,2 | | | 0.07 | | | | 0.06 | | | | 0.04 | | | | 0.17 | | | | 0.13 | |
| | | | | |
Net realized and unrealized gain (loss) on investments | | | (3.33 | ) | | | 0.95 | | | | 0.69 | | | | 1.04 | | | | (1.53 | ) |
| | | | | | | | | | | | | | | | | | | | |
| | | | | |
Total income (loss) from investment operations | | | (3.26 | ) | | | 1.01 | | | | 0.73 | | | | 1.21 | | | | (1.40 | ) |
| | | | | |
Less Distributions to Shareholders from: | | | | | | | | | | | | | | | | | | | | |
| | | | | |
Net investment income | | | (0.07 | ) | | | (0.15 | ) | | | (0.08 | ) | | | (0.23 | ) | | | (0.11 | ) |
| | | | | |
Net realized gain on investments | | | (0.04 | ) | | | (0.34 | ) | | | (0.44 | ) | | | (0.10 | ) | | | — | |
| | | | | | | | | | | | | | | | | | | | |
| | | | | |
Total distributions to shareholders | | | (0.11 | ) | | | (0.49 | ) | | | (0.52 | ) | | | (0.33 | ) | | | (0.11 | ) |
| | | | | |
Net Asset Value, End of Year | | | $6.84 | | | | $10.21 | | | | $9.69 | | | | $9.48 | | | | $8.60 | |
| | | | | | | | | | | | | | | | | | | | |
| | | | | |
Total Return2,3 | | | (32.28 | )% | | | 10.13 | % | | | 7.91 | % | | | 14.34 | % | | | (13.94 | )% |
| | | | | |
Ratio of net expenses to average net assets | | | 0.99 | %4 | | | 0.95 | %5 | | | 1.01 | % | | | 0.97 | % | | | 0.99 | % |
| | | | | |
Ratio of gross expenses to average net assets6 | | | 1.16 | % | | | 1.05 | %5 | | | 1.19 | % | | | 0.97 | % | | | 0.99 | % |
| | | | | |
Ratio of net investment income to average net assets2 | | | 0.77 | % | | | 0.52 | % | | | 0.47 | % | | | 1.85 | % | | | 1.40 | % |
| | | | | |
Portfolio turnover | | | 46 | % | | | 36 | % | | | 40 | % | | | 123 | % | | | 24 | % |
| | | | | |
Net assets end of year (000’s) omitted | | | $8,520 | | | | $24,571 | | | | $19,251 | | | | $24,100 | | | | $11,210 | |
| | | | | |
| | | | | | | | | | | | | | | | | | | | | |
41
| | |
| | | AMG GW&K Emerging Markets Equity Fund Financial Highlights For a share outstanding throughout each fiscal year |
| | | |
| | | |
| | | | | | | | | | | | | | | | | | | | |
| | | For the fiscal years ended October 31, |
| | | | | |
| Class Z | | 2022 | | 2021 | | 2020 | | 2019 | | 2018 |
| | | | | |
Net Asset Value, Beginning of Year | | | $10.15 | | | | $9.64 | | | | $9.43 | | | | $8.56 | | | | $10.06 | |
| | | | | |
Income (loss) from Investment Operations: | | | | | | | | | | | | | | | | | | | | |
| | | | | |
Net investment income1,2 | | | 0.08 | | | | 0.07 | | | | 0.05 | | | | 0.18 | | | | 0.15 | |
| | | | | |
Net realized and unrealized gain (loss) on investments | | | (3.31 | ) | | | 0.93 | | | | 0.69 | | | | 1.02 | | | | (1.53 | ) |
| | | | | | | | | | | | | | | | | | | | |
| | | | | |
Total income (loss) from investment operations | | | (3.23 | ) | | | 1.00 | | | | 0.74 | | | | 1.20 | | | | (1.38 | ) |
| | | | | |
Less Distributions to Shareholders from: | | | | | | | | | | | | | | | | | | | | |
| | | | | |
Net investment income | | | (0.08 | ) | | | (0.15 | ) | | | (0.09 | ) | | | (0.23 | ) | | | (0.12 | ) |
| | | | | |
Net realized gain on investments | | | (0.04 | ) | | | (0.34 | ) | | | (0.44 | ) | | | (0.10 | ) | | | — | |
| | | | | | | | | | | | | | | | | | | | |
| | | | | |
Total distributions to shareholders | | | (0.12 | ) | | | (0.49 | ) | | | (0.53 | ) | | | (0.33 | ) | | | (0.12 | ) |
| | | | | |
Net Asset Value, End of Year | | | $6.80 | | | | $10.15 | | | | $9.64 | | | | $9.43 | | | | $8.56 | |
| | | | | | | | | | | | | | | | | | | | |
| | | | | |
Total Return2,3 | | | (32.20 | )% | | | 10.15 | % | | | 8.01 | % | | | 14.39 | % | | | (13.88 | )% |
| | | | | |
Ratio of net expenses to average net assets | | | 0.89 | %4 | | | 0.87 | %5 | | | 0.94 | % | | | 0.90 | % | | | 0.87 | % |
| | | | | |
Ratio of gross expenses to average net assets6 | | | 1.06 | % | | | 0.97 | %5 | | | 1.12 | % | | | 0.90 | % | | | 0.87 | % |
| | | | | |
Ratio of net investment income to average net assets2 | | | 0.87 | % | | | 0.60 | % | | | 0.53 | % | | | 1.92 | % | | | 1.52 | % |
| | | | | |
Portfolio turnover | | | 46 | % | | | 36 | % | | | 40 | % | | | 123 | % | | | 24 | % |
| | | | | |
Net assets end of year (000’s) omitted | | | $7,410 | | | | $33,648 | | | | $24,191 | | | | $31,727 | | | | $133,688 | |
| | | | | |
| | | | | | | | | | | | | | | | | | | | | |
| 1 | Per share numbers have been calculated using average shares. |
| 2 | Total returns and net investment income would have been lower had certain expenses not been offset. |
| 3 | The total return is calculated using the published Net Asset Value as of fiscal year end. |
| 4 | Includes interest expense of 0.02% related to participation in the interfund lending program. |
| 5 | Such ratio includes recapture of waived/reimbursed fees from prior periods amounting to 0.01% for the fiscal year ended October 31, 2021. |
| 6 | Excludes the impact of expense reimbursement or fee waivers and expense reductions such as brokerage credits, but includes expense repayments and non-reimbursable expenses, if any, such as interest, taxes, and extraordinary expenses. (See Note 1(c) and 2 in the Notes to Financial Statements.) |
42
| | |
| | | AMG GW&K Emerging Wealth Equity Fund Financial Highlights For a share outstanding throughout each fiscal year |
| | | |
| | | |
| | | | | | | | | | | | | | | | | | | | |
| | | For the fiscal years ended October 31, |
| | | | | |
| Class N | | 2022 | | 2021 | | 2020 | | 2019 | | 2018 |
| | | | | |
Net Asset Value, Beginning of Year | | | $13.41 | | | | $13.28 | | | | $11.93 | | | | $10.38 | | | | $12.94 | |
| | | | | |
Income (loss) from Investment Operations: | | | | | | | | | | | | | | | | | | | | |
| | | | | |
Net investment income (loss)1,2 | | | (0.05 | ) | | | (0.09 | ) | | | (0.04 | ) | | | 0.10 | | | | 0.06 | |
| | | | | |
Net realized and unrealized gain (loss) on investments | | | (4.45 | ) | | | 0.22 | | | | 1.72 | | | | 1.95 | | | | (1.88 | ) |
| | | | | | | | | | | | | | | | | | | | |
| | | | | |
Total income (loss) from investment operations | | | (4.50 | ) | | | 0.13 | | | | 1.68 | | | | 2.05 | | | | (1.82 | ) |
| | | | | |
Less Distributions to Shareholders from: | | | | | | | | | | | | | | | | | | | | |
| | | | | |
Net investment income | | | — | | | | — | | | | (0.06 | ) | | | (0.06 | ) | | | (0.05 | ) |
| | | | | |
Net realized gain on investments | | | (0.15 | ) | | | — | | | | (0.27 | ) | | | (0.44 | ) | | | (0.69 | ) |
| | | | | | | | | | | | | | | | | | | | |
| | | | | |
Total distributions to shareholders | | | (0.15 | ) | | | — | | | | (0.33 | ) | | | (0.50 | ) | | | (0.74 | ) |
| | | | | |
Net Asset Value, End of Year | | | $8.76 | | | | $13.41 | | | | $13.28 | | | | $11.93 | | | | $10.38 | |
| | | | | | | | | | | | | | | | | | | | |
| | | | | |
Total Return2,3 | | | (33.89 | )% | | | 0.98 | % | | | 14.37 | % | | | 20.82 | % | | | (15.16 | )% |
| | | | | |
Ratio of net expenses to average net assets | | | 1.30 | %4 | | | 1.22 | % | | | 1.26 | % | | | 1.37 | %5 | | | 1.45 | %5,6 |
| | | | | |
Ratio of gross expenses to average net assets7 | | | 1.31 | % | | | 1.22 | % | | | 1.26 | % | | | 1.37 | %5 | | | 1.45 | %5 |
| | | | | |
Ratio of net investment income (loss) to average net assets2 | | | (0.43 | )% | | | (0.59 | )% | | | (0.35 | )% | | | 0.93 | % | | | 0.49 | % |
| | | | | |
Portfolio turnover | | | 63 | % | | | 57 | % | | | 37 | % | | | 40 | % | | | 37 | % |
| | | | | |
Net assets end of year (000’s) omitted | | | $330 | | | | $967 | | | | $1,716 | | | | $2,007 | | | | $1,940 | |
| | | | | |
| | | | | | | | | | | | | | | | | | | | | |
43
| | |
| | | AMG GW&K Emerging Wealth Equity Fund Financial Highlights For a share outstanding throughout each fiscal year |
| | | |
| | | |
| | | | | | | | | | | | | | | | | | | | |
| | | For the fiscal years ended October 31, |
| | | | | |
| Class I | | 2022 | | 2021 | | 2020 | | 2019 | | 2018 |
| | | | | |
Net Asset Value, Beginning of Year | | | $13.55 | | | | $13.38 | | | | $12.03 | | | | $10.44 | | | | $12.96 | |
| | | | | |
Income (loss) from Investment Operations: | | | | | | | | | | | | | | | | | | | | |
| | | | | |
Net investment income (loss)1,2 | | | (0.01 | ) | | | (0.05 | ) | | | (0.01 | ) | | | 0.14 | | | | 0.09 | |
| | | | | |
Net realized and unrealized gain (loss) on investments | | | (4.51 | ) | | | 0.22 | | | | 1.73 | | | | 1.96 | | | | (1.88 | ) |
| | | | | | | | | | | | | | | | | | | | |
| | | | | |
Total income (loss) from investment operations | | | (4.52 | ) | | | 0.17 | | | | 1.72 | | | | 2.10 | | | | (1.79 | ) |
| | | | | |
Less Distributions to Shareholders from: | | | | | | | | | | | | | | | | | | | | |
| | | | | |
Net investment income | | | — | | | | — | | | | (0.10 | ) | | | (0.07 | ) | | | (0.04 | ) |
| | | | | |
Net realized gain on investments | | | (0.15 | ) | | | — | | | | (0.27 | ) | | | (0.44 | ) | | | (0.69 | ) |
| | | | | | | | | | | | | | | | | | | | |
| | | | | |
Total distributions to shareholders | | | (0.15 | ) | | | — | | | | (0.37 | ) | | | (0.51 | ) | | | (0.73 | ) |
| | | | | |
Net Asset Value, End of Year | | | $8.88 | | | | $13.55 | | | | $13.38 | | | | $12.03 | | | | $10.44 | |
| | | | | | | | | | | | | | | | | | | | |
| | | | | |
Total Return2,3 | | | (33.68 | )% | | | 1.27 | % | | | 14.63 | % | | | 21.15 | % | | | (14.89 | )% |
| | | | | |
Ratio of net expenses to average net assets | | | 1.00 | %4 | | | 0.93 | % | | | 0.97 | % | | | 1.08 | %5 | | | 1.19 | %5,6 |
| | | | | |
Ratio of gross expenses to average net assets7 | | | 1.01 | % | | | 0.93 | % | | | 0.97 | % | | | 1.08 | %5 | | | 1.19 | %5 |
| | | | | |
Ratio of net investment income (loss) to average net assets2 | | | (0.13 | )% | | | (0.30 | )% | | | (0.06 | )% | | | 1.22 | % | | | 0.75 | % |
| | | | | |
Portfolio turnover | | | 63 | % | | | 57 | % | | | 37 | % | | | 40 | % | | | 37 | % |
| | | | | |
Net assets end of year (000’s) omitted | | | $39,367 | | | | $41,453 | | | | $22,813 | | | | $6,328 | | | | $2,539 | |
| | | | | |
| | | | | | | | | | | | | | | | | | | | | |
44
| | |
| | | AMG GW&K Emerging Wealth Equity Fund Financial Highlights For a share outstanding throughout each fiscal year |
| | | |
| | | |
| | | | | | | | | | | | | | | | | | | | |
| | | For the fiscal years ended October 31, |
| | | | | |
| Class Z | | 2022 | | 2021 | | 2020 | | 2019 | | 2018 |
| | | | | |
Net Asset Value, Beginning of Year | | | $13.52 | | | | $13.34 | | | | $11.99 | | | | $10.41 | | | | $12.97 | |
| | | | | |
Income (loss) from Investment Operations: | | | | | | | | | | | | | | | | | | | | |
| | | | | |
Net investment income (loss)1,2 | | | (0.00 | )8 | | | (0.03 | ) | | | 0.01 | | | | 0.15 | | | | 0.11 | |
| | | | | |
Net realized and unrealized gain (loss) on investments | | | (4.50 | ) | | | 0.21 | | | | 1.72 | | | | 1.96 | | | | (1.89 | ) |
| | | | | | | | | | | | | | | | | | | | |
| | | | | |
Total income (loss) from investment operations | | | (4.50 | ) | | | 0.18 | | | | 1.73 | | | | 2.11 | | | | (1.78 | ) |
| | | | | |
Less Distributions to Shareholders from: | | | | | | | | | | | | | | | | | | | | |
| | | | | |
Net investment income | | | — | | | | (0.00 | )8 | | | (0.11 | ) | | | (0.09 | ) | | | (0.09 | ) |
| | | | | |
Net realized gain on investments | | | (0.15 | ) | | | — | | | | (0.27 | ) | | | (0.44 | ) | | | (0.69 | ) |
| | | | | | | | | | | | | | | | | | | | |
| | | | | |
Total distributions to shareholders | | | (0.15 | ) | | | (0.00 | )8 | | | (0.38 | ) | | | (0.53 | ) | | | (0.78 | ) |
| | | | | |
Net Asset Value, End of Year | | | $8.87 | | | | $13.52 | | | | $13.34 | | | | $11.99 | | | | $10.41 | |
| | | | | | | | | | | | | | | | | | | | |
| | | | | |
Total Return2,3 | | | (33.61 | )% | | | 1.37 | % | | | 14.75 | % | | | 21.34 | % | | | (14.87 | )% |
| | | | | |
Ratio of net expenses to average net assets | | | 0.90 | %4 | | | 0.82 | % | | | 0.86 | % | | | 0.97 | %5 | | | 1.05 | %5,6 |
| | | | | |
Ratio of gross expenses to average net assets7 | | | 0.91 | % | | | 0.82 | % | | | 0.86 | % | | | 0.97 | %5 | | | 1.05 | %5 |
| | | | | |
Ratio of net investment income (loss) to average net assets2 | | | (0.03 | )% | | | (0.19 | )% | | | 0.05 | % | | | 1.33 | % | | | 0.89 | % |
| | | | | |
Portfolio turnover | | | 63 | % | | | 57 | % | | | 37 | % | | | 40 | % | | | 37 | % |
| | | | | |
Net assets end of year (000’s) omitted | | | $32,427 | | | | $183,290 | | | | $185,755 | | | | $105,069 | | | | $60,443 | |
| | | | | |
| | | | | | | | | | | | | | | | | | | | | |
| 1 | Per share numbers have been calculated using average shares. |
| 2 | Total returns and net investment income (loss) would have been lower had certain expenses not been offset. |
| 3 | The total return is calculated using the published Net Asset Value as of fiscal year end. |
| 4 | Includes interest expense of less than 0.01% related to participation in the interfund lending program. |
| 5 | Such ratio includes recapture of waived/reimbursed fees from prior periods amounting to 0.02% and 0.07% for the fiscal years ended October 31, 2019 and 2018, respectively. |
| 6 | Includes reduction from broker recapture amounting to less than 0.01%. |
| 7 | Excludes the impact of expense reimbursement or fee waivers and expense reductions such as brokerage credits, but includes expense repayments and non-reimbursable expenses, if any, such as interest, taxes, and extraordinary expenses. (See Note 1(c) and 2 in the Notes to Financial Statements.) |
| 8 | Less than $(0.005) per share. |
45
| | |
| | | AMG GW&K Small/Mid Cap Growth Fund Financial Highlights For a share outstanding throughout each fiscal year |
| | | |
| | | |
| | | | | | | | | | | | | | | | | | | | |
| | | For the fiscal years ended October 31, |
| | | | | |
| Class N | | 2022 | | 2021 | | 2020 | | 2019 | | 2018 |
| | | | | |
Net Asset Value, Beginning of Year | | | $17.67 | | | | $21.14 | | | | $17.02 | | | | $16.90 | | | | $15.30 | |
| | | | | |
Income (loss) from Investment Operations: | | | | | | | | | | | | | | | | | | | | |
| | | | | |
Net investment loss1,2 | | | (0.08 | ) | | | (0.17 | ) | | | (0.17 | ) | | | (0.08 | ) | | | (0.12 | ) |
| | | | | |
Net realized and unrealized gain (loss) on investments | | | (4.14 | ) | | | 7.74 | | | | 4.29 | | | | 0.20 | | | | 1.72 | |
| | | | | | | | | | | | | | | | | | | | |
| | | | | |
Total income (loss) from investment operations | | | (4.22 | ) | | | 7.57 | | | | 4.12 | | | | 0.12 | | | | 1.60 | |
| | | | | |
Less Distributions to Shareholders from: | | | | | | | | | | | | | | | | | | | | |
| | | | | |
Net realized gain on investments | | | — | | | | (10.55 | ) | | | — | | | | — | | | | — | |
| | | | | |
Paid in capital | | | — | | | | (0.49 | ) | | | — | | | | — | | | | — | |
| | | | | | | | | | | | | | | | | | | | |
| | | | | |
Total distributions to shareholders | | | — | | | | (11.04 | ) | | | — | | | | — | | | | — | |
| | | | | |
Net Asset Value, End of Year | | | $13.45 | | | | $17.67 | | | | $21.14 | | | | $17.02 | | | | $16.90 | |
| | | | | | | | | | | | | | | | | | | | |
| | | | | |
Total Return2,3 | | | (23.88 | )%4 | | | 46.66 | % | | | 24.27 | % | | | 0.71 | % | | | 10.46 | % |
| | | | | |
Ratio of net expenses to average net assets5 | | | 1.00 | % | | | 1.17 | % | | | 1.29 | %6 | | | 1.30 | % | | | 1.31 | % |
| | | | | |
Ratio of gross expenses to average net assets7 | | | 1.25 | % | | | 1.42 | % | | | 1.60 | % | | | 1.47 | % | | | 1.43 | % |
| | | | | |
Ratio of net investment loss to average net assets2 | | | (0.56 | )% | | | (0.91 | )% | | | (0.92 | )% | | | (0.48 | )% | | | (0.73 | )% |
| | | | | |
Portfolio turnover | | | 23 | % | | | 158 | % | | | 126 | % | | | 138 | % | | | 161 | % |
| | | | | |
Net assets end of year (000’s) omitted | | | $24,994 | | | | $37,471 | | | | $28,908 | | | | $30,717 | | | | $37,232 | |
| | | | | |
| | | | | | | | | | | | | | | | | | | | | |
46
| | |
| | | AMG GW&K Small/Mid Cap Growth Fund Financial Highlights For a share outstanding throughout each fiscal year |
| | | |
| | | |
| | | | | | | | | | | | | | | | | | | | |
| | | For the fiscal years ended October 31, |
| | | | | |
| Class I | | 2022 | | 2021 | | 2020 | | 2019 | | 2018 |
| | | | | |
Net Asset Value, Beginning of Year | | | $18.39 | | | | $21.60 | | | | $17.35 | | | | $17.20 | | | | $15.54 | |
| | | | | |
Income (loss) from Investment Operations: | | | | | | | | | | | | | | | | | | | | |
| | | | | |
Net investment loss1,2 | | | (0.06 | ) | | | (0.15 | ) | | | (0.14 | ) | | | (0.05 | ) | | | (0.09 | ) |
| | | | | |
Net realized and unrealized gain (loss) on investments | | | (4.32 | ) | | | 7.98 | | | | 4.39 | | | | 0.20 | | | | 1.75 | |
| | | | | | | | | | | | | | | | | | | | |
| | | | | |
Total income (loss) from investment operations | | | (4.38 | ) | | | 7.83 | | | | 4.25 | | | | 0.15 | | | | 1.66 | |
| | | | | |
Less Distributions to Shareholders from: | | | | | | | | | | | | | | | | | | | | |
| | | | | |
Net realized gain on investments | | | — | | | | (10.55 | ) | | | — | | | | — | | | | — | |
| | | | | |
Paid in capital | | | — | | | | (0.49 | ) | | | — | | | | — | | | | — | |
| | | | | | | | | | | | | | | | | | | | |
| | | | | |
Total distributions to shareholders | | | — | | | | (11.04 | ) | | | — | | | | — | | | | — | |
| | | | | |
Net Asset Value, End of Year | | | $14.01 | | | | $18.39 | | | | $21.60 | | | | $17.35 | | | | $17.20 | |
| | | | | | | | | | | | | | | | | | | | |
| | | | | |
Total Return2,3 | | | (23.82 | )%4 | | | 46.94 | % | | | 24.48 | % | | | 0.93 | % | | | 10.68 | % |
| | | | | |
Ratio of net expenses to average net assets5 | | | 0.86 | % | | | 1.02 | % | | | 1.10 | %6 | | | 1.10 | % | | | 1.10 | % |
| | | | | |
Ratio of gross expenses to average net assets7 | | | 1.11 | % | | | 1.27 | % | | | 1.41 | % | | | 1.27 | % | | | 1.22 | % |
| | | | | |
Ratio of net investment loss to average net assets2 | | | (0.42 | )% | | | (0.76 | )% | | | (0.73 | )% | | | (0.28 | )% | | | (0.52 | )% |
| | | | | |
Portfolio turnover | | | 23 | % | | | 158 | % | | | 126 | % | | | 138 | % | | | 161 | % |
| | | | | |
Net assets end of year (000’s) omitted | | | $6,540 | | | | $6,612 | | | | $6,483 | | | | $14,608 | | | | $65,802 | |
| | | | | |
| | | | | | | | | | | | | | | | | | | | | |
47
| | |
| | | AMG GW&K Small/Mid Cap Growth Fund Financial Highlights For a share outstanding throughout each fiscal period |
| | | |
| | | |
| | | | | | | | |
| | | For the fiscal
year ended
October 31, | | For the fiscal
period ended
October 31, |
| | |
| Class Z | | 2022 | | 20218 |
| | |
Net Asset Value, Beginning of Period | | | $18.39 | | | | $17.84 | |
| | |
Income (loss) from Investment Operations: | | | | | | | | |
| | |
Net investment loss1,2 | | | (0.06 | ) | | | (0.01 | ) |
| | |
Net realized and unrealized gain (loss) on investments | | | (4.31 | ) | | | 0.56 | |
| | | | | | | | |
| | |
Total income (loss) from investment operations | | | (4.37 | ) | | | 0.55 | |
| | |
Net Asset Value, End of Period | | | $14.02 | | | | $18.39 | |
| | | | | | | | |
| | |
Total Return2,3 | | | (23.76 | )%4 | | | 3.08 | %9 |
| | |
Ratio of net expenses to average net assets10 | | | 0.81 | % | | | 0.82 | %11 |
| | |
Ratio of gross expenses to average net assets7 | | | 1.06 | % | | | 1.13 | %11 |
| | |
Ratio of net investment loss to average net assets2 | | | (0.37 | )% | | | (0.49 | )%11 |
| | |
Portfolio turnover | | | 23 | % | | | 158 | % |
| | |
Net assets end of period (000’s) omitted | | | $12 | | | | $15 | |
| | | | | | | | | |
| 1 | Per share numbers have been calculated using average shares. |
| 2 | Total returns and net investment loss would have been lower had certain expenses not been offset. |
| 3 | The total return is calculated using the published Net Asset Value as of fiscal year end. |
| 4 | Includes a non-recurring securities litigation gain. Had the Fund not received the payment total return would have been (24.68%), (24.53%) and (24.53%) for Class N, Class I and Class Z respectively. |
| 5 | Includes reduction from broker recapture amounting to 0.01%, less than 0.01%, 0.01%, less than 0.01% and 0.01% for the fiscal years ended 2022, 2021, 2020, 2019 and 2018, respectively. |
| 6 | Includes interest expense of 0.01%. |
| 7 | Excludes the impact of expense reimbursement or fee waivers and expense reductions such as brokerage credits, but includes expense repayments and non-reimbursable expenses, if any, such as interest, taxes, and extraordinary expenses. (See Note 1(c) and 2 in the Notes to Financial Statements.) |
| 8 | Commencement of operations was on August 31, 2021. |
| 10 | Includes reduction from broker recapture amounting to 0.01% for the fiscal year ended 2022 and less than 0.01% for the fiscal period ended October 31, 2021. |
48
| | |
| | | Notes to Financial Statements October 31, 2022 |
| | | |
| | | |
1. ORGANIZATION AND SUMMARY OF SIGNIFICANT ACCOUNTING POLICIES
AMG Funds, AMG Funds I and AMG Funds IV (the “Trusts”) are open-end management investment companies. AMG Funds and AMG Funds I are organized as Massachusetts business trusts, while AMG Funds IV is organized as a Delaware Statutory Trust. The Trusts are registered under the Investment Company Act of 1940, as amended (the “1940 Act”). Currently, the Trusts consist of a number of different funds, each having distinct investment management objectives, strategies, risks, and policies. Included in this report are AMG Funds I: AMG GW&K Core Bond ESG Fund (“Core Bond ESG”), AMG Funds: AMG GW&K Emerging Markets Equity Fund (“Emerging Markets Equity”) and AMG GW&K Emerging Wealth Equity Fund (“Emerging Wealth Equity”) and AMG Funds IV: AMG GW&K Small/Mid Cap Growth Fund (“Small/Mid Cap Growth”), each a “Fund” and collectively, the “Funds”.
Each Fund offers Class N, Class I and Class Z shares. Each class represents an interest in the same assets of the respective Fund. Although all share classes generally have identical voting rights, each share class votes separately when required by law. Different share classes may have different net asset values per share to the extent the share classes pay different distribution amounts and/or the expenses of such share classes differ. Each share class has its own expense structure. Please refer to a current prospectus for additional information on each share class.
Market disruptions associated with the COVID-19 pandemic have had a global impact, and uncertainty exists as to the long-term implications. Such disruptions can adversely affect assets of the Funds and thus Fund performance.
The Funds’ financial statements are prepared in accordance with accounting principles generally accepted in the United States of America (“U.S. GAAP”), including accounting and reporting guidance pursuant to Accounting Standards Codification Topic 946 applicable to investment companies. U.S. GAAP requires management to make estimates and assumptions that affect the reported amounts of assets and liabilities and disclosure of contingent assets and liabilities at the date of the financial statements and the reported amounts of income and expenses during the reporting period. Actual results could differ from those estimates and such differences could be material. The following is a summary of significant accounting policies followed by the Funds in the preparation of their financial statements:
a. VALUATION OF INVESTMENTS
For the Funds, equity securities traded on a national securities exchange or reported on the NASDAQ national market system (“NMS”) are valued at the last quoted sales price on the primary exchange or, if applicable, the NASDAQ official closing price or the official closing price of the relevant exchange or, lacking any sales, at the last quoted bid price. Equity securities held by the Funds that are traded in the over-the-counter market (other than NMS securities) are valued at the bid price. Foreign equity securities (securities principally traded in markets other than U.S. markets) held by the Funds are valued at the official closing price on the primary exchange or, for markets that either do not offer an official closing price or where the official closing price may not be representative of the overall market, the last quoted sale price.
Fixed income securities purchased with a remaining maturity exceeding 60 days are valued at the evaluated bid price provided by an authorized pricing service or, if an evaluated price is not available, by reference to other securities which are
considered comparable in credit rating, interest rate, due date and other features (generally referred to as “matrix pricing”) or other similar pricing methodologies.
Fixed income securities purchased with a remaining maturity of 60 days or less are valued at amortized cost, provided that the amortized cost value is approximately the same as the fair value of the security valued without the use of amortized cost. Investments in other open-end registered investment companies are valued at their end of day net asset value per share.
The Funds’ portfolio investments are generally valued based on independent market quotations or prices or, if none, “evaluative” or other market based valuations provided by third party pricing services approved by the Board of Trustees of the Trust (the “Board”). Under certain circumstances, the value of certain Fund portfolio investments may be based on an evaluation of fair value, pursuant to procedures established by and under the general supervision of the Board. The Valuation Committee, which is comprised of the Independent Trustees of the Board, and the Pricing Committee, which is comprised of representatives from AMG Funds LLC (the “Investment Manager”) are the committees appointed by the Board to make fair value determinations. Each Fund may use the fair value of a portfolio investment to calculate its net asset value (“NAV”) in the event that the market quotation, price or market based valuation for the portfolio investment is not readily available or otherwise not determinable pursuant to the Board’s valuation procedures, if the Investment Manager or the Pricing Committee believes the quotation, price or market based valuation to be unreliable, or in certain other circumstances. When determining the fair value of an investment, the Pricing Committee and, if required under the Trusts’ securities valuation procedures, the Valuation Committee, seeks to determine the price that a Fund might reasonably expect to receive from current sale of that portfolio investment in an arms-length transaction. Fair value determinations shall be based upon consideration of all available facts and information, including, but not limited to (i) attributes specific to the investment; (ii) fundamental and analytical data relating to the investment; and (iii) the value of other comparable securities or relevant financial instruments, including derivative securities, traded on other markets or among dealers.
The values assigned to fair value portfolio investments are based on available information and do not necessarily represent amounts that might ultimately be realized in the future, since such amounts depend on future developments inherent in long-term investments. Because of the inherent uncertainty of valuation, those estimated values may differ significantly from the values that would have been used had a ready market for the investments existed, and the differences could be material. The Board will be presented with a quarterly report showing as of the most recent quarter end, all outstanding securities fair valued by the Funds, including a comparison with the prior quarter end and the percentage of the Funds that the security represents at each quarter end.
With respect to foreign equity securities and certain foreign fixed income securities, the Board has adopted a policy that securities held in the Funds that can be fair valued by the applicable fair value pricing service are fair valued on each business day provided that each individual price exceeds a pre-established confidence level.
Effective September 8, 2022, the Funds adopted the requirements of Rule 2a-5 under the 1940 Act (“Rule 2a-5”), which the Funds’ Board designated the Funds’ Investment Manager as the Funds’ Valuation Designee to perform the Funds’ fair value determinations. Such determinations are subject to Board oversight and certain reporting and other requirements intended to ensure that the Board receives the information it needs to oversee the Investment Manager’s fair value determinations. Other than the designation of the Investment Manager as the
49
| | |
| | | Notes to Financial Statements (continued) |
| | | |
| | | |
Valuation Designee, the Funds’ adoption of Rule 2-a5 did not impact how the Funds determine fair value or the carrying amount of investments held in the Funds.
U.S. GAAP defines fair value as the price that a fund would receive to sell an asset or pay to transfer a liability in an orderly transaction between market participants at the measurement date. U.S. GAAP also establishes a framework for measuring fair value, and a three level hierarchy for fair value measurements based upon the transparency of inputs to the valuation of an asset or liability. Inputs may be observable or unobservable and refer broadly to the assumptions that market participants would use in pricing the asset or liability. Observable inputs reflect the assumptions market participants would use in pricing the asset or liability based on market data obtained from sources independent of the Funds. Unobservable inputs reflect the Funds’ own assumptions about the assumptions that market participants would use in pricing the asset or liability developed based on the best information available in the circumstances. Each investment is assigned a level based upon the observability of the inputs which are significant to the overall valuation.
The three-tier hierarchy of inputs is summarized below:
Level 1 – inputs are quoted prices in active markets for identical investments (e.g., equity securities, open-end investment companies)
Level 2 – other observable inputs (including, but not limited to: quoted prices for similar assets or liabilities in markets that are active, quoted prices for identical or similar assets or liabilities in markets that are not active, inputs other than quoted prices that are observable for the assets or liabilities (such as interest rates, yield curves, volatilities, prepayment speeds, loss severities, credit risks and default rates) or other market corroborated inputs) (e.g., debt securities, government securities, foreign currency exchange contracts, foreign securities utilizing international fair value pricing, fair valued securities with observable inputs)
Level 3 – inputs are significant unobservable inputs (including the Fund’s own assumptions used to determine the fair value of investments) (e.g., fair valued securities with unobservable inputs)
Changes in inputs or methodologies used for valuing investments may result in a transfer in or out of levels within the fair value hierarchy. The inputs or methodologies used for valuing investments may not necessarily be an indication of the risk associated with investing in those investments.
b. SECURITY TRANSACTIONS
Security transactions are accounted for as of trade date. Realized gains and losses on securities sold are determined on the basis of identified cost.
c. INVESTMENT INCOME AND EXPENSES
Dividend income is recorded on the ex-dividend date. Dividends from foreign securities are recorded on the ex-dividend date, and if after the fact, as soon as the
Funds become aware of the ex-dividend date, except for Korean securities where dividends are recorded on confirmation date. Interest income, which includes amortization of premium and accretion of discount on debt securities, is accrued as earned. Dividend and interest income on foreign securities is recorded gross of any withholding tax. Non-cash dividends included in dividend income, if any, are reported at the fair market value of the securities received. Upon notification from the issuer, distributions received from a real estate investment trust (“REIT”) may be redesignated as a reduction of cost of investments and/or realized gain. Other income and expenses are recorded on an accrual basis. Expenses that cannot be directly attributed to a Fund are apportioned among the funds in the Trusts and other trusts or funds within the AMG Funds Family of Funds (collectively the “AMG Funds Family”) based upon their relative average net assets or number of shareholders. Investment income, realized and unrealized capital gains and losses, the common expenses of each Fund, and certain fund level expense reductions, if any, are allocated on a pro-rata basis to each class based on the relative net assets of each class to the total net assets of each Fund.
Small/Mid Cap Growth had certain portfolio trades directed to various brokers under a brokerage recapture program. Credits received from the brokerage recapture program are earned and paid on a monthly basis, and are recorded as expense offsets, which serve to reduce the Fund’s overall expense ratio. For the fiscal year ended October 31, 2022, the impact on the expenses and expense ratios was $2,196 or 0.01%.
d. DIVIDENDS AND DISTRIBUTIONS
Fund distributions resulting from net investment income will normally be declared and paid monthly for Core Bond ESG and annually for Emerging Markets Equity, Emerging Wealth Equity and Small/Mid Cap Growth. Realized net capital gains distributions, if any, will normally be declared and paid at least annually in December. Distributions to shareholders are recorded on the ex-dividend date. Distributions are determined in accordance with federal income tax regulations, which may differ from net investment income and net realized capital gains for financial statement purposes (U.S. GAAP). Differences may be permanent or temporary. Permanent differences are reclassified among capital accounts in the financial statements to reflect their tax character. Permanent book and tax basis differences, if any, relating to shareholder distributions will result in reclassifications to paid-in capital. Temporary differences arise when certain items of income, expense and gain or loss are recognized in different periods for financial statement and tax purposes; these differences will reverse at some time in the future. Permanent differences are primarily due to net operating losses. Temporary differences are primarily due to wash sale loss deferrals, the deferral of qualified late year ordinary losses and mark to market on passive foreign investment companies.
50
| | |
| | | Notes to Financial Statements (continued) |
| | | |
| | | |
The tax character of distributions paid during the fiscal years ended October 31, 2022 and October 31, 2021 were as follows:
| | | | | | | | | | | | | | | | |
| | |
| | | Core Bond ESG | | | Emerging Markets Equity | |
| | | | |
Distributions paid from: | | | 2022 | | | | 2021 | | | | 2022 | | | | 2021 | |
| | | | |
Ordinary income * | | | $3,496,989 | | | | $2,869,291 | | | | $422,590 | | | | $711,110 | |
| | | | |
Long-term capital gains | | | 4,019,861 | | | | — | | | | 211,238 | | | | 1,625,205 | |
| | | | | | | | | | | | | | | | |
| | | | |
| | | $7,516,850 | | | | $2,869,291 | | | | $633,828 | | | | $2,336,315 | |
| | | | | | | | | | | | | | | | |
| | |
| | | Emerging Wealth Equity | | | Small/Mid Cap Growth | |
| | | | |
Distributions paid from: | | | 2022 | | | | 2021 | | | | 2022 | | | | 2021 | |
| | | | |
Ordinary income * | | | — | | | | $35,159 | | | | — | | | | $9,053,185 | |
| | | | |
Long-term capital gains | | | $2,343,086 | | | | 262 | | | | — | | | | 8,422,676 | |
| | | | |
Paid-in capital | | | — | | | | — | | | | — | | | | 819,098 | |
| | | | | | | | | | | | | | | | |
| | | | |
| | | $2,343,086 | | | | $35,421 | | | | — | | | | $18,294,959 | |
| | | | | | | | | | | | | | | | |
| * | For tax purposes, short-term capital gain distributions, if any, are considered ordinary income distributions. |
As of October 31, 2022, the components of distributable earnings (excluding unrealized appreciation/depreciation) on a tax basis consisted of:
| | | | | | | | | | | | | | | | |
| | | | |
| | | Core Bond ESG | | | Emerging Markets Equity | | | Emerging Wealth Equity | | | Small/Mid Cap Growth | |
| | | | |
Capital loss carryforward | | | $3,488,405 | | | | $5,533,255 | | | | $25,084,682 | | | | — | |
| | | | |
Undistributed ordinary income | | | 39,674 | | | | 844,855 | | | | — | | | | — | |
| | | | |
Undistributed long-term capital gains | | | — | | | | — | | | | — | | | | $623,573 | |
| | | | |
Late-year ordinary loss deferral | | | — | | | | — | | | | — | | | | 142,167 | |
At October 31, 2022, the cost of investments and the aggregate gross unrealized appreciation and depreciation for federal income tax purposes were as follows:
| | | | | | | | | | | | | | | | |
| | | | |
| Fund | | Cost | | | Appreciation | | | Depreciation | | | Net Appreciation
(Depreciation) | |
| | | | |
Core Bond ESG | | | $166,224,522 | | | | — | | | | $(25,896,105 | ) | | | $(25,896,105 | ) |
| | | | |
Emerging Markets Equity | | | 16,272,503 | | | | $3,341,319 | | | | (3,132,977 | ) | | | 208,342 | |
| | | | |
Emerging Wealth Equity | | | 82,333,719 | | | | 11,491,326 | | | | (21,551,356 | ) | | | (10,060,030 | ) |
| | | | |
Small/Mid Cap Growth | | | 35,508,113 | | | | 2,632,339 | | | | (6,306,031 | ) | | | (3,673,692 | ) |
e. FEDERAL TAXES
Each Fund currently qualifies as an investment company and intends to comply with the requirements under Subchapter M of the Internal Revenue Code of 1986, as amended, and to distribute substantially all of its taxable income and gains to its shareholders and to meet certain diversification and income requirements with respect to investment companies. Therefore, no provision for federal income or excise tax is included in the accompanying financial statements.
Additionally, based on each Fund’s understanding of the tax rules and rates related to income, gains and transactions for the foreign jurisdictions in which it invests, each Fund will provide for foreign taxes, and where appropriate, deferred foreign taxes.
Management has analyzed the Funds’ tax positions taken on federal income tax returns as of October 31, 2022, and for all open tax years (generally, the three prior taxable years), and has concluded that no provision for federal income tax is required in the Funds’ financial statements. Additionally, Management is not aware
of any tax position for which it is reasonably possible that the total amounts of unrecognized tax benefits will change materially in the next twelve months.
f. CAPITAL LOSS CARRYOVERS AND DEFERRALS
As of October 31, 2022, the following Funds had capital loss carryovers for federal income tax purposes as shown in the following chart. These amounts may be used to offset future realized capital gains indefinitely, and retain their character as short-term and/or long-term.
| | | | | | | | | | | | |
| | | |
| Fund | | Short-Term | | | Long-Term | | | Total | |
| | | |
Core Bond ESG | | | $2,158,393 | | | | $1,330,012 | | | | $3,488,405 | |
| | | |
Emerging Markets Equity | | | 5,063,289 | | | | 469,966 | | | | 5,533,255 | |
| | | |
Emerging Wealth Equity | | | 25,084,682 | | | | — | | | | 25,084,682 | |
51
| | |
| | | Notes to Financial Statements (continued) |
| | | |
| | | |
As of October 31, 2022, Small/Mid Cap Growth had no capital loss carryovers for federal income tax purposes. Should the Fund incur net capital losses for the fiscal year ended October 31, 2023, such amounts may be used to offset future realized capital gains indefinitely, and retain their character as either short-term and/or long-term.
g. CAPITAL STOCK
The Trusts’ Declaration of Trust authorizes for each Fund the issuance of an unlimited number of shares of beneficial interest, without par value. Each Fund records sales and repurchases of its capital stock on the trade date.
For the fiscal years ended October 31, 2022 and October 31, 2021, the capital stock transactions by class for the Funds were as follows:
| | | | | | | | | | | | | | | | | | | | | | | | | | | | | | | | |
| | | Core Bond ESG | | | Emerging Markets Equity | |
| | | | |
| | | October 31, 2022 | | | October 31, 2021 | | | October 31, 2022 | | | October 31, 2021 | |
| | | Shares | | | Amount | | | Shares | | | Amount | | | Shares | | | Amount | | | Shares | | | Amount | |
| | | | | | | | |
Class N: | | | | | | | | | | | | | | | | | | | | | | | | | | | | | | | | |
| | | | | | | | |
Shares sold | | | 22,776 | | | | $217,694 | | | | 57,167 | | | | $617,603 | | | | 4,865 | | | | $42,095 | | | | 26,050 | | | | $301,090 | |
| | | | | | | | |
Shares issued in reinvestment of distributions | | | 7,601 | | | | 76,235 | | | | 1,982 | | | | 21,505 | | | | 247 | | | | 2,401 | | | | 1,571 | | | | 17,233 | |
| | | | | | | | |
Shares redeemed | | | (27,512 | ) | | | (279,182 | ) | | | (36,310 | ) | | | (394,283 | ) | | | (19,283 | ) | | | (154,135 | ) | | | (29,702 | ) | | | (340,566 | ) |
| | | | | | | | | | | | | | | | | | | | | | | | | | | | | | | | |
| | | | | | | | |
Net increase (decrease) | | | 2,865 | | | | $14,747 | | | | 22,839 | | | | $244,825 | | | | (14,171 | ) | | | $(109,639 | ) | | | (2,081 | ) | | | $(22,243 | ) |
| | | | | | | | | | | | | | | | | | | | | | | | | | | | | | | | |
| | | | | | | | |
Class I: | | | | | | | | | | | | | | | | | | | | | | | | | | | | | | | | |
| | | | | | | | |
Shares sold | | | 1,103,881 | | | | $10,593,164 | | | | 1,732,406 | | | | $18,782,363 | | | | 1,148,293 | | | | $10,979,868 | | | | 635,502 | | | | $7,074,008 | |
| | | | | | | | |
Shares issued in reinvestment of distributions | | | 700,717 | | | | 7,022,680 | | | | 244,961 | | | | 2,659,029 | | | | 9,086 | | | | 87,225 | | | | 35,661 | | | | 386,561 | |
| | | | | | | | |
Shares redeemed | | | (3,401,399 | ) | | | (32,959,317 | ) | | | (2,843,986 | ) | | | (30,881,158 | ) | | | (2,318,478 | ) | | | (18,580,334 | ) | | | (251,494 | ) | | | (2,698,418 | ) |
| | | | | | | | | | | | | | | | | | | | | | | | | | | | | | | | |
| | | | | | | | |
Net increase (decrease) | | | (1,596,801 | ) | | | $(15,343,473 | ) | | | (866,619 | ) | | | $(9,439,766 | ) | | | (1,161,099 | ) | | | $(7,513,241 | ) | | | 419,669 | | | | $4,762,151 | |
| | | | | | | | | | | | | | | | | | | | | | | | | | | | | | | | |
| | | | | | | | |
Class Z: | | | | | | | | | | | | | | | | | | | | | | | | | | | | | | | | |
| | | | | | | | |
Shares sold | | | 14,006 | | | | $139,190 | | | | 58,501 | | | | $638,670 | | | | 52,545 | | | | $454,281 | | | | 762,904 | | | | $8,699,676 | |
| | | | | | | | |
Shares issued in reinvestment of distributions | | | 11,298 | | | | 112,920 | | | | 5,343 | | | | 57,930 | | | | 40,063 | | | | 382,197 | | | | 115,827 | | | | 1,248,619 | |
| | | | | | | | |
Shares redeemed | | | (115,151 | ) | | | (1,206,439 | ) | | | (67,164 | ) | | | (733,649 | ) | | | (2,316,286 | ) | | | (18,867,345 | ) | | | (75,374 | ) | | | (830,676 | ) |
| | | | | | | | | | | | | | | | | | | | | | | | | | | | | | | | |
| | | | | | | | |
Net increase (decrease) | | | (89,847 | ) | | | $(954,329 | ) | | | (3,320 | ) | | | $(37,049 | ) | | | (2,223,678 | ) | | | $(18,030,867 | ) | | | 803,357 | | | | $9,117,619 | |
| | | | | | | | | | | | | | | | | | | | | | | | | | | | | | | | |
| | |
| | | Emerging Wealth Equity | | | Small/Mid Cap Growth | |
| | | | |
| | | October 31, 2022 | | | October 31, 2021 | | | October 31, 2022 | | | October 31, 2021 | |
| | | Shares | | | Amount | | | Shares | | | Amount | | | Shares | | | Amount | | | Shares | | | Amount | |
| | | | | | | | |
Class N: | | | | | | | | | | | | | | | | | | | | | | | | | | | | | | | | |
| | | | | | | | |
Shares sold | | | 3,331 | | | | $38,813 | | | | 8,974 | | | | $138,021 | | | | 50,329 | | | | $758,167 | | | | 91,217 | | | | $1,757,478 | |
| | | | | | | | |
Shares issued in reinvestment of distributions | | | 832 | | | | 10,519 | | | | — | | | | — | | | | — | | | | — | | | | 972,672 | | | | 14,770,300 | |
| | | | | | | | |
Shares redeemed | | | (38,704 | ) | | | (443,345 | ) | | | (66,077 | ) | | | (967,375 | ) | | | (311,956 | ) | | | (4,746,914 | ) | | | (311,010 | ) | | | (5,726,959 | ) |
| | | | | | | | | | | | | | | | | | | | | | | | | | | | | | | | |
| | | | | | | | |
Net increase (decrease) | | | (34,541 | ) | | | $(394,013 | ) | | | (57,103 | ) | | | $(829,354 | ) | | | (261,627 | ) | | | $(3,988,747 | ) | | | 752,879 | | | | $10,800,819 | |
| | | | | | | | | | | | | | | | | | | | | | | | | | | | | | | | |
| | | | | | | | |
Class I: | | | | | | | | | | | | | | | | | | | | | | | | | | | | | | | | |
| | | | | | | | |
Shares sold | | | 4,020,886 | | | | $51,172,610 | | | | 1,993,990 | | | | $30,549,706 | | | | 168,904 | | | | $2,592,371 | | | | 42,998 | | | | $900,118 | |
| | | | | | | | |
Shares issued in reinvestment of distributions | | | 32,510 | | | | 415,801 | | | | — | | | | — | | | | — | | | | — | | | | 202,482 | | | | 3,199,629 | |
| | | | | | | | |
Shares redeemed | | | (2,679,906 | ) | | | (30,270,347 | ) | | | (639,402 | ) | | | (9,207,782 | ) | | | (61,724 | ) | | | (883,953 | ) | | | (186,045 | ) | | | (3,412,645 | ) |
| | | | | | | | | | | | | | | | | | | | | | | | | | | | | | | | |
| | | | | | | | |
Net increase | | | 1,373,490 | | | | $21,318,064 | | | | 1,354,588 | | | | $21,341,924 | | | | 107,180 | | | | $1,708,418 | | | | 59,435 | | | | $687,102 | |
| | | | | | | | | | | | | | | | | | | | | | | | | | | | | | | | |
52
| | |
| | | Notes to Financial Statements (continued) |
| | | |
| | | |
| | | | | | | | | | | | | | | | | | | | | | | | | | | | | | | | |
| | | Emerging Wealth Equity | | | Small/Mid Cap Growth | |
| | | | |
| | | October 31, 2022 | | | October 31, 2021 | | | October 31, 2022 | | | October 31, 2021 | |
| | | | | | | | |
| | | Shares | | | Amount | | | Shares | | | Amount | | | Shares | | | Amount | | | Shares | | | Amount | |
| | | | | | | | |
Class Z:1 | | | | | | | | | | | | | | | | | | | | | | | | | | | | | | | | |
| | | | | | | | |
Shares sold | | | 574,616 | | | | $7,156,896 | | | | 3,554,557 | | | | $54,731,525 | | | | — | | | | — | | | | 841 | | | | $15,000 | |
| | | | | | | | |
Shares issued in reinvestment of distributions | | | 8,097 | | | | 103,399 | | | | 162 | | | | 2,470 | | | | — | | | | — | | | | — | | | | — | |
| | | | | | | | |
Shares redeemed | | | (10,481,116 | ) | | | (116,006,697 | ) | | | (3,925,460 | ) | | | (57,082,834 | ) | | | — | | | | — | | | | — | | | | — | |
| | | | | | | | | | | | | | | | | | | | | | | | | | | | | | | | |
| | | | | | | | |
Net increase (decrease) | | | (9,898,403 | ) | | | $(108,746,402 | ) | | | (370,741 | ) | | | $(2,348,839 | ) | | | — | | | | — | | | | 841 | | | | $15,000 | |
| | | | | | | | | | | | | | | | | | | | | | | | | | | | | | | | |
| 1 | Commencement of operations for Small/Mid Cap Growth was on August 31, 2021. |
At October 31, 2022, certain affiliated and unaffiliated shareholders of record individually or collectively held greater than 10% of the net assets of the Funds as follows: Emerging Markets Equity - two own 19%. Transactions by these shareholders may have a material impact on the Fund.
h. REPURCHASE AGREEMENTS AND JOINT REPURCHASE AGREEMENTS
The Funds may enter into third-party and bilateral repurchase agreements for temporary cash management purposes and third-party or bilateral joint repurchase agreements for reinvestment of cash collateral on securities lending transactions under the securities lending program offered by The Bank of New York Mellon (“BNYM”) (the “Program”) (collectively, “Repurchase Agreements”). The value of the underlying collateral, including accrued interest, must equal or exceed the value of the Repurchase Agreements during the term of the agreement. For joint repurchase agreements, the Funds participate on a pro rata basis with other clients of BNYM in its share of the underlying collateral under such joint repurchase agreements and in its share of proceeds from any repurchase or other disposition of the underlying collateral. The underlying collateral for all Repurchase Agreements is held in safekeeping by the Funds’ custodian or at the Federal Reserve Bank. If the seller defaults and the value of the collateral declines, or if bankruptcy proceedings commence with respect to the seller of the security, realization of the collateral by the Funds may be delayed or limited. Pursuant to the Program, the Funds are indemnified for such losses by BNYM on joint repurchase agreements.
At October 31, 2022, the market value of Repurchase Agreements outstanding for Core Bond ESG, Emerging Markets Equity, Emerging Wealth Equity and Small/Mid Cap Growth were $3,802,604, $468,214, $1,256,658 and $1,179,958, respectively.
i. FOREIGN CURRENCY TRANSLATION
The books and records of the Funds are maintained in U.S. Dollars. The value of investments, assets and liabilities denominated in currencies other than U.S. Dollars are translated into U.S. Dollars based upon current foreign exchange rates. Purchases and sales of foreign investments, income and expenses are converted into U.S. Dollars based on currency exchange rates prevailing on the respective dates of such transactions. Net realized and unrealized gain (loss) on foreign currency transactions represent: (1) foreign exchange gains and losses from the sale and holdings of foreign currencies; (2) gains and losses between trade date and settlement date on investment securities transactions and foreign currency exchange contracts; and (3) gains and losses from the difference between amounts of interest and dividends recorded and the amounts actually received.
The Funds do not isolate the net realized and unrealized gain or loss resulting from changes in exchange rates from the fluctuations in market prices of
securities held. Such fluctuations are included with the net realized and unrealized gain or loss on investments.
2. AGREEMENTS AND TRANSACTIONS WITH AFFILIATES
For each of the Funds, the Trusts have entered into an investment advisory agreement under which the Investment Manager, a subsidiary and the U.S. retail distribution arm of Affiliated Managers Group, Inc. (“AMG”), serves as investment manager to the Funds and is responsible for the Funds’ overall administration and operations. The Investment Manager selects one or more subadvisers for the Funds (subject to Board approval) and monitors each subadviser’s investment performance, security holdings and investment strategies. Each Fund’s investment portfolio is managed by GW&K, who serves pursuant to a subadvisory agreement with the Investment Manager. AMG indirectly owns a majority interest in GW&K.
Investment management fees are paid directly by the Funds to the Investment Manager based on average daily net assets. For the fiscal year ended October 31, 2022, the Funds’ investment management fees were paid at the following annual rate of each Fund’s respective average daily net assets:
| | |
| |
Core Bond ESG | | 0.30% |
| |
Emerging Markets Equity | | 0.55% |
| |
Emerging Wealth Equity | | 0.55% |
| |
Small/Mid Cap Growth1 | | 0.62% |
| 1 | Prior to June 18, 2021, the annual rate was 0.90%. |
The fee paid to GW&K for its services as subadviser is paid out of the fee the Investment Manager receives from each Fund and does not increase the expenses of each Fund.
The Investment Manager has contractually agreed, through at least March 1, 2023 for Core Bond ESG, Emerging Markets Equity, Emerging Wealth Equity, and Small/Mid Cap Growth, to waive management fees and/or pay or reimburse fund expenses in order to limit total annual Fund operating expenses after fee waiver and expense reimbursements (exclusive of taxes, interest (including interest incurred in connection with bank and custody overdrafts and in connection with securities sold short), shareholder servicing fees, distribution and service (12b-1) fees, brokerage commissions and other transaction costs, dividends payable with
53
| | |
| | | Notes to Financial Statements (continued) |
| | | |
| | | |
respect to securities sold short, acquired fund fees and expenses and extraordinary expenses) of Core Bond ESG, Emerging Markets Equity, Emerging Wealth Equity, and Small/Mid Cap Growth to 0.48%, 0.87%, 0.90%, and 0.82%, respectively, of each Fund’s average daily net assets (this annual rate or such other annual rate that may be in effect from time to time, the “Expense Cap”), subject to later reimbursement by the Funds in certain circumstances. Prior to June 18 2021, the total annual Fund operating expense limitation was 1.03% of Small/Mid Cap Growth’s average daily net assets.
In general, for a period of up to 36 months after the date any amounts are paid, waived or reimbursed by the Investment Manager, the Investment Manager may recover such amounts from a Fund, provided that such repayment would not cause the Fund’s total annual operating expenses after fee waiver and expense reimbursements (exclusive of the items noted in the parenthetical above) to exceed either (i) the Expense Cap in effect at the time such amounts were paid, waived or reimbursed, or (ii) the Expense Cap in effect at the time of such repayment by the Fund.
The contractual expense limitation may only be terminated in the event the Investment Manager or a successor ceases to be the investment manager of a Fund or a successor fund, by mutual agreement between the Investment Manager and the Board, or in the event of a Fund’s liquidation unless the Fund is reorganized or is a party to a merger in which the surviving entity is successor to the accounting and performance information of a Fund.
At October 31, 2022, the Funds’ expiration of reimbursements subject to recoupment is as follows:
| | | | | | | | | | | | |
Expiration Period | | Core Bond ESG | | | Emerging Markets Equity | | | Emerging Wealth Equity | |
| | | |
Less than 1 year | | | $159,696 | | | | $78,697 | | | | — | |
| | | |
1-2 years | | | 129,634 | | | | 58,087 | | | | — | |
| | | |
2-3 years | | | 121,994 | | | | 77,630 | | | | $11,356 | |
| | | | | | | | | | | | |
| | | |
Total | | | $411,324 | | | | $214,414 | | | | $11,356 | |
| | | | | | | | | | | | |
| | | | |
Expiration Period | | Small/Mid Cap Growth | |
| |
Less than 1 year | | | $111,190 | |
| |
1-2 years | | | 103,778 | |
| |
2-3 years | | | 89,139 | |
| | | | |
| |
Total | | | $304,107 | |
| | | | |
The Trusts, on behalf of the Funds, have entered into an amended and restated Administration Agreement under which the Investment Manager serves as the Funds’ administrator (the “Administrator”) and is responsible for all non-portfolio management aspects of managing the Funds’ operations, including administration and shareholder services to each Fund. Each Fund pays a fee to the Administrator at the rate of 0.15% per annum of the Fund’s average daily net assets for this service.
The Funds are distributed by AMG Distributors, Inc. (the “Distributor”), a wholly-owned subsidiary of the Investment Manager. The Distributor serves as the distributor and underwriter for each Fund and is a registered broker-dealer and member of the Financial Industry Regulatory Authority, Inc. (“FINRA”). Shares of
each Fund will be continuously offered and will be sold directly to prospective purchasers and through brokers, dealers or other financial intermediaries who have executed selling agreements with the Distributor. Generally the Distributor bears all or a portion of the expenses of providing services pursuant to the distribution agreement, including the payment of the expenses relating to the distribution of prospectuses for sales purposes and any advertising or sales literature.
The Trusts have adopted a distribution and service plan (the “Plan”) with respect to the Class N shares of each Fund, in accordance with the requirements of Rule 12b-1 under the 1940 Act and the requirements of the applicable rules of FINRA regarding asset-based sales charges. Pursuant to the Plan, each Fund may make payments to the Distributor for its expenditures in financing any activity primarily intended to result in the sale of each Fund’s Class N shares and for maintenance and personal service provided to existing shareholders of that class. The Plan authorized payments to the Distributor up to 0.25% annually of each Fund’s average daily net assets attributable to the Class N shares. For Small/Mid Cap Growth, the Plan is characterized as a reimbursement plan and is directly tied to expenses incurred by the Distributor; the payments the Distributor receives during any year may not exceed its actual expenses. The impact on the Class N annualized expense ratios for the fiscal year ended October 31, 2022, were 0.25% for Core Bond ESG, Emerging Markets Equity, and Emerging Wealth Equity and 0.19% for Small/Mid Cap Growth.
For Class N of Core Bond ESG, Emerging Markets Equity and Emerging Wealth Equity and for each of the Class I shares, the Board has approved reimbursement payments to the Investment Manager for shareholder servicing expenses (“shareholder servicing fees”) incurred. Shareholder servicing fees include payments to financial intermediaries, such as broker-dealers (including fund supermarket platforms), banks, and trust companies who provide shareholder recordkeeping, account servicing and other services. The Class N and Class I shares may reimburse the Investment Manager for the actual amount incurred up to a maximum annual rate of each Class’s average daily net assets as shown in the table below.
The impact on the annualized expense ratios for the fiscal year ended October 31, 2022, were as follows:
| | | | | | | | |
| | | Maximum Annual | | | Actual | |
| | | Amount | | | Amount | |
| Fund | | Approved | | | Incurred | |
| | |
Core Bond ESG | | | | | | | | |
| | |
Class N | | | 0.15% | | | | 0.15% | |
| | |
Class I | | | 0.10% | | | | 0.07% | |
|
Emerging Markets Equity | |
| | |
Class N | | | 0.15% | | | | 0.15% | |
| | |
Class I | | | 0.15% | | | | 0.10% | |
| | |
Emerging Wealth Equity | | | | | | | | |
| | |
Class N | | | 0.15% | | | | 0.15% | |
| | |
Class I | | | 0.15% | | | | 0.10% | |
| | |
Small/Mid Cap Growth | | | | | | | | |
| | |
Class I* | | | 0.05% | | | | 0.05% | |
| * | Prior to June 18, 2021, the maximum annual amount approved was 0.15%. Effective, June 18, 2021, the shareholder servicing fees for Class N was eliminated. |
54
| | |
| | | Notes to Financial Statements (continued) |
| | | |
| | | |
The Board provides supervision of the affairs of the Trusts and other trusts within the AMG Funds Family. The Trustees of the Trusts who are not affiliated with the Investment Manager receive an annual retainer and per meeting fees for regular, special and telephonic meetings, and they are reimbursed for out-of-pocket expenses incurred while carrying out their duties as Board members. The Chairman of the Board and the Audit Committee Chair receive additional annual retainers. Certain Trustees and Officers of the Funds are Officers and/or Directors of the Investment Manager, AMG and/or the Distributor.
The Securities and Exchange Commission (the “SEC”) granted an exemptive order that permits certain eligible funds in the AMG Funds Family to lend and borrow money for certain temporary purposes directly to and from other eligible funds in the AMG Funds Family. Participation in this interfund lending program is voluntary for both the borrowing and lending funds, and an interfund loan is only made if it benefits each participating fund. The Administrator manages the program according to procedures approved by the Board, and the Board monitors the operation of the program. An interfund loan must comply with certain conditions set out in the exemptive order, which are designed to assure fairness and protect all participating funds. The interest earned and interest paid on interfund loans are included on the Statement of Operations as interest income and interest expense, respectively. At October 31, 2022, the Funds had no interfund loans outstanding.
The following Funds utilized the interfund loan program during the fiscal year ended October 31, 2022 as follows:
| | | | | | | | | | | | | | | | |
| Fund | | Average
Lent | | | Number
of Days | | | Interest
Earned | | | Average
Interest Rate | |
| | | | |
Core Bond ESG | | | $1,707,714 | | | | 13 | | | | $771 | | | | 1.268 | % |
| | | | |
Emerging Markets Equity | | | 1,695,398 | | | | 4 | | | | 173 | | | | 0.930 | % |
| | | | |
Emerging Wealth Equity | | | 2,214,957 | | | | 5 | | | | 282 | | | | 0.928 | % |
| | | | |
Small/Mid Cap Growth | | | 175,689 | | | | 7 | | | | 133 | | | | 3.940 | % |
| | | | |
| Fund | | Average
Borrowed | | | Number
of Days | | | Interest
Paid | | | Average
Interest Rate | |
| | | | |
Emerging Markets Equity | | | $5,750,002 | | | | 20 | | | | $8,120 | | | | 2.577 | % |
| | | | |
Emerging Wealth Equity | | | 1,883,694 | | | | 12 | | | | 1,041 | | | | 1.681 | % |
3. PURCHASES AND SALES OF SECURITIES
Purchases and sales of securities (excluding short-term securities and U.S. Government Obligations) for the fiscal year ended October 31, 2022, were as follows:
| | | | | | | | |
| | | Long Term Securities | |
| Fund | | Purchases | | | Sales | |
| | |
Core Bond ESG | | | $23,183,411 | | | | $36,270,740 | |
| | |
Emerging Markets Equity | | | 19,825,477 | | | | 43,336,350 | |
| | |
Emerging Wealth Equity | | | 94,847,843 | | | | 183,782,480 | |
| | |
Small/Mid Cap Growth | | | 8,089,761 | | | | 10,660,698 | |
Core Bond ESG purchases and sales of U.S. Government obligations during the fiscal year ended October 31, 2022 were $32,736,095 and $34,878,482, respectively.
4. PORTFOLIO SECURITIES LOANED
The Funds participate in the Program providing for the lending of securities to qualified borrowers. Securities lending income includes earnings of such temporary cash investments, plus or minus any rebate to a borrower. These earnings (after any rebate) are then divided between BNYM, as a fee for its services under the Program, and the Funds, according to agreed-upon rates. Collateral on all securities loaned is accepted in cash, U.S. Treasury Obligations or U.S. Government Agency Obligations. Collateral is maintained at a minimum level of 102% (105% in the case of certain foreign securities) of the market value, plus interest, if applicable, of investments on loan. It is the Funds’ policy to obtain additional collateral from or return excess collateral to the borrower by the end of the next business day, following the valuation date of the securities loaned. Therefore, the value of the collateral held may be temporarily less than the value of the securities on loan. Lending securities entails a risk of loss to the Funds if and to the extent that the market value of the securities loaned were to increase and the borrower did not increase the collateral accordingly, and the borrower fails to return the securities. Under the terms of the Program, the Funds are indemnified for such losses by BNYM. Cash collateral is held in separate omnibus accounts managed by BNYM, who is authorized to exclusively enter into joint repurchase agreements for that cash collateral. Securities collateral is held in separate omnibus accounts managed by BNYM and cannot be sold or pledged. BNYM bears the risk of any deficiency in the amount of the cash collateral available for return to the borrower due to any loss on the collateral invested. Loans of securities are terminable at any time and the borrower, after notice, is required to return borrowed securities as soon as practical, which is normally within three business days.
The value of securities loaned on positions held, cash collateral and securities collateral received at October 31, 2022, were as follows:
| | | | | | | | |
| Fund | | Securities
Loaned | | Cash
Collateral
Received | | Securities
Collateral
Received | | Total Collateral Received |
| | | | |
Core Bond ESG | | $151,198 | | $157,604 | | — | | $157,604 |
| | | | |
Emerging Markets Equity | | 637,837 | | 383,214 | | $249,263 | | 632,477 |
| | | | |
Emerging Wealth Equity | | 1,183,977 | | 1,256,658 | | — | �� | 1,256,658 |
| | | | |
Small/Mid Cap Growth | | 1,104,767 | | 509,958 | | 630,523 | | 1,140,481 |
The following table summarizes the securities received as collateral for securities lending at October 31, 2022:
| | | | | | |
| Fund | | Collateral Type | | Coupon
Range | | Maturity
Date Range |
| | | |
Emerging Markets Equity | | U.S. Treasury Obligations | | 0.125%-4.750% | | 02/28/23-11/15/50 |
| | | |
Small/Mid Cap Growth | | U.S. Treasury Obligations | | 0.000%-4.750% | | 01/12/23-11/15/51 |
5. FOREIGN SECURITIES
Certain Funds invest in securities of foreign entities and in instruments denominated in foreign currencies which involve risks not typically associated with investments in domestic securities. Non-domestic securities carry special risks, such as exposure to currency fluctuations, less developed or less efficient trading markets, political instability, a lack of company information, differing auditing and legal standards, and, potentially, less liquidity. A Fund’s investments
55
| | |
| | | Notes to Financial Statements (continued) |
| | | |
| | | |
in emerging market countries are exposed to additional risks. A Fund’s performance will be influenced by political, social and economic factors affecting companies in emerging market countries. Emerging market countries generally have economic structures that are less diverse and mature, and political systems that are less stable, than those of developed countries. Realized gains in certain countries may be subject to foreign taxes at the Fund level and the Fund would pay such foreign taxes at the appropriate rate for each jurisdiction.
6. GEOGRAPHICAL FOCUS RISK
Emerging Markets Equity and Emerging Wealth Equity are particularly susceptible to risks in the Greater China region, which consists of the People’s Republic of China (“PRC”), Hong Kong, Taiwan or issuers that are not located in the Greater China region, but derive a majority (over 50%) of their income from the Greater China region. Economies in the Greater China region are dependent on the economies of other countries and can be significantly affected by currency fluctuations and increasing competition from other emerging economies in Asia with lower costs. Adverse events in any one country within the region may impact the other countries in the region or Asia as a whole. Markets in the Greater China region can experience significant volatility due to social, economic, regulatory and political uncertainties. Significant portions of the Chinese securities markets may become rapidly illiquid, as Chinese issuers have the ability to suspend the trading of their equity securities, and have shown a willingness to exercise that option in response to market volatility and other events. U.S. or foreign government restrictions or intervention could negatively affect the implementation of the Fund’s investment strategies, for example by precluding the Funds from making certain investments or causing the Funds to sell investments at disadvantageous times. China has yet to develop comprehensive securities, corporate, or
commercial laws, its market is relatively new and less developed, and its economy may be adversely impacted by a slowdown in export growth. Each Fund’s NAV may be more volatile than the NAV of a more geographically diversified fund and may result in losses.
7. COMMITMENTS AND CONTINGENCIES
Under the Trusts’ organizational documents, its Trustees and Officers are indemnified against certain liabilities arising out of the performance of their duties to the Trusts. In addition, in the normal course of business, the Funds may enter into contracts and agreements that contain a variety of representations and warranties, which provide general indemnifications. The maximum exposure to the Funds under these arrangements is unknown, as this would involve future claims that may be made against a Fund that have not yet occurred. However, based on experience, the Funds had no prior claims or losses and expect the risks of loss to be remote.
8. MASTER NETTING AGREEMENTS
The Funds may enter into master netting agreements with their counterparties for the Program and Repurchase Agreements, which provide the right, in the event of default (including bankruptcy or insolvency) for the non-defaulting party to liquidate the collateral and calculate net exposure to the defaulting party or request additional collateral. For financial reporting purposes, the Funds do not offset financial assets and financial liabilities that are subject to master netting agreements in the Statement of Assets and Liabilities. For securities lending transactions, see Note 4.
The following table is a summary of the Funds’ open Repurchase Agreements that are subject to a master netting agreement as of October 31, 2022:
| | | | | | | | | | | | | | | | | | | | | | | | | |
| | | | | Gross Amount Not Offset in the | | | | |
| | | | | Statement of Assets and Liabilities | | | | |
| Fund | | Gross Amounts of
Assets Presented in
the Statement of
Assets and Liabilities | | Offset Amount | | Net Asset Balance | | Collateral Received | | Net Amount |
| | | | | | | | | | | |
| | | | | |
Core Bond ESG | | | | | | | | | | | | | | | | | | | | | | | | | |
| | | | | |
HSBC Securities USA, Inc. | | | | $157,604 | | | | | — | | | | | $157,604 | | | | | $157,604 | | | | | — | |
| | | | | |
Fixed Income Clearing Corp. | | | | 3,645,000 | | | | | — | | | | | 3,645,000 | | | | | 3,645,000 | | | | | — | |
| | | | | | | | | | | | | | | | | | | | | | | | | |
| | | | | |
Total | | | | $3,802,604 | | | | | — | | | | | $3,802,604 | | | | | $3,802,604 | | | | | — | |
| | | | | | | | | | | | | | | | | | | | | | | | | |
| | | | | | | | | | | |
| | | | | |
Emerging Markets Equity | | | | | | | | | | | | | | | | | | | | | | | | | |
| | | | | |
National Bank Financial | | | | $383,214 | | | | | — | | | | | $383,214 | | | | | $383,214 | | | | | — | |
| | | | | |
Fixed Income Clearing Corp. | | | | 85,000 | | | | | — | | | | | 85,000 | | | | | 85,000 | | | | | — | |
| | | | | | | | | | | | | | | | | | | | | | | | | |
| | | | | |
Total | | | | $468,214 | | | | | — | | | | | $468,214 | | | | | $468,214 | | | | | — | |
| | | | | | | | | | | | | | | | | | | | | | | | | |
| | | | | | | | | | | |
| | | | | |
Emerging Wealth Equity | | | | | | | | | | | | | | | | | | | | | | | | | |
| | | | | |
Citigroup Global Markets, Inc. | | | | $256,658 | | | | | — | | | | | $256,658 | | | | | $256,658 | | | | | — | |
| | | | | |
RBC Dominion Securities, Inc. | | | | 1,000,000 | | | | | — | | | | | 1,000,000 | | | | | 1,000,000 | | | | | — | |
| | | | | | | | | | | | | | | | | | | | | | | | | |
| | | | | |
Total | | | | $1,256,658 | | | | | — | | | | | $1,256,658 | | | | | $1,256,658 | | | | | — | |
| | | | | | | | | | | | | | | | | | | | | | | | | |
56
| | |
| | | Notes to Financial Statements (continued) |
| | | |
| | | |
| | | | | | | | | | | | | | | | | | | | |
| | | | | | Gross Amount Not Offset in the | | | | | | | |
| | | | | | Statement of Assets and Liabilities | | | | | | | |
| Fund | | Gross Amounts of
Assets Presented in
the Statement of
Assets and Liabilities | | | Offset Amount | | | Net Asset Balance | | | Collateral Received | | | Net Amount | |
| |
| | | | | | | | | | | | | | | | |
| | | | | |
Small/Mid Cap Growth | | | | | | | | | | | | | | | | | | | | |
| | | | | |
Citigroup Global Markets, Inc. | | | $509,958 | | | | — | | | | $509,958 | | | | $509,958 | | | | — | �� |
| | | | | |
Fixed Income Clearing Corp. | | | 670,000 | | | | — | | | | 670,000 | | | | 670,000 | | | | — | |
| | | | | | | | | | | | | | | | | | | | |
| | | | | |
Total | | | $1,179,958 | | | | — | | | | $1,179,958 | | | | $1,179,958 | | | | — | |
| | | | | | | | | | | | | | | | | | | | |
9. SUBSEQUENT EVENTS
The Funds have determined that no material events or transactions occurred through the issuance date of the Funds’ financial statements which require an additional disclosure in or adjustment of the Funds’ financial statements.
57
| | |
| | | Report of Independent Registered Public Accounting Firm |
| | | |
| | | |
TO THE BOARD OF TRUSTEES OF AMG FUNDS, AMG FUNDS I, AND AMG FUNDS IV AND SHAREHOLDERS OF AMG GW&K CORE BOND ESG FUND, AMG GW&K EMERGING MARKETS EQUITY FUND, AMG GW&K EMERGING WEALTH EQUITY FUND, AND AMG GW&K SMALL/MID CAP GROWTH FUND
Opinions on the Financial Statements
We have audited the accompanying statements of assets and liabilities, including the schedules of portfolio investments, of AMG GW&K Core Bond ESG Fund (one of the funds constituting AMG Funds I), AMG GW&K Emerging Markets Equity Fund and AMG GW&K Emerging Wealth Equity Fund (two of the funds constituting AMG Funds), and AMG GW&K Small/Mid Cap Growth Fund (one of the funds constituting AMG Funds IV) (hereafter collectively referred to as the “Funds”) as of October 31, 2022, the related statements of operations for the year ended October 31, 2022, the statements of changes in net assets for each of the two years in the period ended October 31, 2022, including the related notes, and the financial highlights for each the periods indicated therein (collectively referred to as the “financial statements”). In our opinion, the financial statements present fairly, in all material respects, the financial position of each of the Funds as of October 31, 2022, the results of each of their operations for the year then ended, the changes in each of their net assets for each of the two years in the period ended October 31, 2022 and each of the financial highlights for each of the periods indicated therein in conformity with accounting principles generally accepted in the United States of America.
Basis for Opinions
These financial statements are the responsibility of the Funds’ management. Our responsibility is to express an opinion on the Funds’ financial statements based on our audits. We are a public accounting firm registered with the Public Company Accounting Oversight Board (United States) (PCAOB) and are required to be independent with respect to the Funds in accordance with the U.S. federal securities laws and the applicable rules and regulations of the Securities and Exchange Commission and the PCAOB.
We conducted our audits of these financial statements in accordance with the standards of the PCAOB. Those standards require that we plan and perform the audit to obtain reasonable assurance about whether the financial statements are free of material misstatement, whether due to error or fraud.
Our audits included performing procedures to assess the risks of material misstatement of the financial statements, whether due to error or fraud, and performing procedures that respond to those risks. Such procedures included examining, on a test basis, evidence regarding the amounts and disclosures in the financial statements. Our audits also included evaluating the accounting principles used and significant estimates made by management, as well as evaluating the overall presentation of the financial statements. Our procedures included confirmation of securities owned as of October 31, 2022 by correspondence with the custodian and brokers; when replies were not received from brokers, we performed other auditing procedures. We believe that our audits provide a reasonable basis for our opinions.
/s/PricewaterhouseCoopers LLP
Boston, Massachusetts
December 22, 2022
We have served as the auditor of one or more investment companies in the AMG Funds Family since 1993.
58
| | |
| | | Other Information (unaudited) |
| | | |
| | | |
TAX INFORMATION
AMG GW&K Core Bond ESG Fund, AMG GW&K Emerging Markets Equity Fund, AMG GW&K Emerging Wealth Equity Fund and AMG GW&K Small/Mid Cap Growth Fund each hereby designates the maximum amount allowable of their net taxable income as qualified dividends as provided in the Jobs and Growth Tax Relief Reconciliation Act of 2003. The 2021/2022 Form 1099-DIV you receive for each Fund will show the tax status of all distributions paid to you during the year.
In accordance with federal tax law, the following Fund elects to provide foreign taxes paid and the income sourced from foreign countries. Accordingly, the Fund hereby makes the following designations regarding its taxable period ended October 31, 2022:
AMG GW&K Emerging Markets Equity Fund
uThe total amount of taxes paid and income sourced from foreign countries was $112,101 and $902,096, respectively.
Pursuant to section 852 of the Internal Revenue Code, AMG GW&K Core Bond ESG Fund, AMG GW&K Emerging Markets Equity Fund, AMG GW&K Emerging Wealth Equity Fund and AMG GW&K Small/Mid Cap Growth Fund, each hereby designates as a capital gain distribution with respect to the taxable period ended October 31, 2022, $4,019,861, $211,238, $2,343,086 and $0, respectively, or, if subsequently determined to be different, the net capital gains of such period.
59
| | |
| | | AMG Funds Trustees and Officers |
| | | |
| | | |
| | | | |
The Trustees and Officers of the Trust, their business addresses, principal occupations for the past five years and ages are listed below. The Trustees provide broad supervision over the affairs of the Trust and the Funds. The Trustees are experienced executives who meet periodically throughout the year to oversee the Funds’ activities, review contractual arrangements with companies that provide services to the Funds, and | | review the Funds’ performance. Unless otherwise noted, the address of each Trustee or Officer is the address of the Trust: 680 Washington Blvd., Suite 500, Stamford, CT. 06901. There is no stated term of office for Trustees. Trustees serve until their resignation, retirement or removal in | | accordance with the Trust’s organizational documents and policies adopted by the Board from time to time. The Chairman of the Trustees, President, Treasurer and Secretary of the Trust are elected by the Trustees annually. Other officers hold office at the pleasure of the Trustees. |
Independent Trustees
The following Trustees are not “interested persons” of the Trust within the meaning of the 1940 Act:
| | |
Number of Funds Overseen in Fund Complex | | Name, Age, Principal Occupation(s) During Past 5 Years and Other Directorships Held by Trustee |
| | |
• Trustee since 2012 - AMG Funds • Trustee since 2012 - AMG Funds I • Trustee since 2014 - AMG Funds IV • Oversees 40 Funds in Fund Complex | | Bruce B. Bingham, 73 Partner, Hamilton Partners (real estate development firm) (1987-Present); Director of The Yacktman Funds, Inc. (2 portfolios) (2000-2012). |
| | |
• Trustee since 2013 - AMG Funds • Trustee since 2013 - AMG Funds I • Trustee since 2014 - AMG Funds IV • Chairman of the Audit Committee since 2021 - AMG Funds, AMG Funds I • Chairman of the Audit Committee since 2020 - AMG Funds IV • Oversees 44 Funds in Fund Complex | | Kurt A. Keilhacker, 59 Managing Partner, TechFund Europe (2000-Present); Managing Partner, TechFund Capital (1997-Present); Managing Partner, Elementum Ventures (2013-Present); Director, MetricStory, Inc. (2017-Present); Trustee, Wheaton College (2018-Present); Trustee, Gordon College (2001-2016); Board Member, 6wind SA (2002-2019). |
| | |
• Trustee since 2004 - AMG Funds • Trustee since 2000 - AMG Funds I • Trustee since 2010 - AMG Funds IV • Oversees 40 Funds in Fund Complex | | Steven J. Paggioli, 72 Independent Consultant (2002-Present); Trustee, Professionally Managed Portfolios (28 portfolios); Advisory Board Member, Sustainable Growth Advisors, LP; Independent Director, Muzinich BDC, Inc. (business development company) (2019-Present); Director, The Wadsworth Group; Independent Director, Chase Investment Counsel (2008–2019); Executive Vice President, Secretary and Director, Investment Company Administration, LLC and First Fund Distributors, INC. (1990-2001). |
| | |
• Independent Chairman of the Board of Trustees since 2017; Chairman of the Governance Committee since 2017 • Trustee since 1999 - AMG Funds • Trustee since 2000 - AMG Funds I • Trustee since 2010 - AMG Funds IV • Oversees 44 Funds in Fund Complex | | Eric Rakowski, 64 Professor of Law, University of California at Berkeley School of Law (1990-Present); Tax Attorney at Davis Polk & Wardwell and clerked for Judge Harry T. Edwards of the U.S. Court of Appeals for the District of Columbia Circuit and for Justice William J. Brennan Jr. of the U.S. Supreme Court; Director of Harding, Loevner Funds, Inc. (10 portfolios); Trustee of Third Avenue Trust (3 portfolios) (2002-2019); Trustee of Third Avenue Variable Trust (1 portfolio) (2002-2019). |
60
| | |
| | | AMG Funds Trustees and Officers (continued) |
| | | |
| | | |
| | |
Number of Funds Overseen in Fund Complex | | Name, Age, Principal Occupation(s) During Past 5 Years and Other Directorships Held by Trustee |
| | |
• Trustee since 2013 - AMG Funds • Trustee since 2013 - AMG Funds I • Trustee since 2014 - AMG Funds IV • Oversees 44 Funds in Fund Complex | | Victoria L. Sassine, 57 Adjunct Professor, Babson College (2007–Present); Director, Board of Directors, PRG Group (2017-Present); CEO, Founder, Scale Smarter Partners, LLC (2018-Present); Adviser, EVOFEM Biosciences (2019-Present); Chairperson of the Board of Directors of Business Management Associates (2018 to 2019). |
| | |
• Trustee since 2000 - AMG Funds I • Trustee since 2004 - AMG Funds • Trustee since 2010 - AMG Funds IV • Oversees 40 Funds in Fund Complex | | Thomas R. Schneeweis, 75* Professor Emeritus, University of Massachusetts (2013-Present); President, TRS Associates (1982-Present); Board Member, Chartered Alternative Investment Association (“CAIA”) (2002-Present); Co-Founder and Director, Institute for Global Asset and Risk Management (Education) (2010-Present); Co-Owner, Quantitative Investment Technologies (2014-Present); Co-Owner, Yes Wealth Management (2018-Present); Director, CAIA Foundation (2010-2019); Partner, S Capital Wealth Advisors (2015-2018); Partner, S Capital Management, LLC (2007-2015); President, Alternative Investment Analytics, LLC (formerly Schneeweis Partners, LLC) (2001-2013). |
*Mr. Schneeweis retired from the Board of Trustees of AMG Funds IV as of October 31, 2022 and will retire from the Board of Trustees of AMG Funds and AMG Funds I as of December 31, 2022.
Interested Trustee
The Trustee in the following table is an “interested person” of the Trust within the meaning of the 1940 Act.
| | |
Number of Funds Overseen in
Fund Complex | | Name, Age, Principal Occupation(s) During Past 5 Years and Other Directorships Held by Trustee |
| | |
• Trustee since 2021 - AMG Funds, AMG Funds I, AMG Funds IV • Oversees 44 Funds in Fund Complex | | Garret W. Weston, 41 Affiliated Managers Group, Inc. (2008-Present): Managing Director, Co-Head of Affiliate Engagement (2021-Present), Senior Vice President, Affiliate Development (2016-2021), Vice President, Office of the CEO (2015-2016), Vice President, New Investments (2012-2015), Senior Associate, New Investments (2008-2012); Associate, Madison Dearborn Partners (2006-2008); Analyst, Merrill Lynch (2004-2006). |
Officers
| | |
Position(s) Held with Fund and Length of Time Served | | Name, Age, Principal Occupation(s) During Past 5 Years |
| | |
• President since 2018 • Principal Executive Officer since 2018 • Chief Executive Officer since 2018 • Chief Operating Officer since 2007 (2016 for AMG Funds IV) | | Keitha L. Kinne, 64 Chief Operating Officer, AMG Funds LLC (2007-Present); Chief Investment Officer, AMG Funds LLC (2008-Present); President and Principal, AMG Distributors, Inc. (2018-Present); Chief Operating Officer, AMG Distributors, Inc. (2007-Present); President, Chief Executive Officer and Principal Executive Officer, AMG Funds, AMG Funds I, AMG Funds II, AMG Funds III and AMG Funds IV (2018-Present); Chief Operating Officer, AMG Funds, AMG Funds I, AMG Funds II, and AMG Funds III (2007-Present); Chief Operating Officer, AMG Funds IV (2016-Present); Chief Operating Officer and Chief Investment Officer, Aston Asset Management, LLC (2016); President and Principal Executive Officer, AMG Funds, AMG Funds I, AMG Funds II and AMG Funds III (2012-2014); Managing Partner, AMG Funds LLC (2007-2014); President and Principal, AMG Distributors, Inc. (2012-2014); Managing Director, Legg Mason & Co., LLC (2006-2007); Managing Director, Citigroup Asset Management (2004-2006). |
| | |
• Secretary since 2015 • Chief Legal Officer since 2015 | | Mark J. Duggan, 57 Managing Director and Senior Counsel, AMG Funds LLC (2021-Present); Senior Vice President and Senior Counsel, AMG Funds LLC (2015-2021); Secretary and Chief Legal Officer, AMG Funds, AMG Funds I, AMG Funds II, AMG Funds III and AMG Funds IV (2015-Present); Attorney, K&L Gates, LLP (2009-2015). |
| | |
• Chief Financial Officer since 2017 • Treasurer since 2017 • Principal Financial Officer since 2017 • Principal Accounting Officer since 2017 | | Thomas G. Disbrow, 56 Vice President, Mutual Fund Treasurer & CFO, AMG Funds, AMG Funds LLC (2017-Present); Chief Financial Officer, Principal Financial Officer, Treasurer and Principal Accounting Officer, AMG Funds, AMG Funds I, AMG Funds II, AMG Funds III and AMG Funds IV (2017-Present); Managing Director - Global Head of Traditional Funds Product Control, UBS Asset Management (Americas), Inc. (2015-2017); Managing Director - Head of North American Funds Treasury, UBS Asset Management (Americas), Inc. (2011-2015). |
61
| | |
| | | AMG Funds Trustees and Officers (continued) |
| | | |
| | | |
| | |
| Position(s) Held with Fund and Length of Time Served | | Name, Age, Principal Occupation(s) During Past 5 Years |
| | |
• Deputy Treasurer since 2017 | | John A. Starace, 51 Vice President, Mutual Fund Accounting, AMG Funds LLC (2021-Present); Director, Mutual Fund Accounting, AMG Funds LLC (2017-2021); Vice President, Deputy Treasurer of Mutual Funds Services, AMG Funds LLC (2014-2017); Deputy Treasurer, AMG Funds, AMG Funds I, AMG Funds II, AMG Funds III and AMG Funds IV (2017-Present); Vice President, Citi Hedge Fund Services (2010-2014); Audit Senior Manager (2005-2010) and Audit Manager (2001-2005), Deloitte & Touche LLP. |
| | |
• Chief Compliance Officer and Sarbanes-Oxley Code of Ethics Compliance Officer since 2019 • Anti-Money Laundering Compliance Officer since 2022 | | Patrick J. Spellman, 48 Vice President, Chief Compliance Officer, AMG Funds LLC (2017-Present); Chief Compliance Officer, AMG Distributors, Inc. (2010-Present); Chief Compliance Officer and Sarbanes-Oxley Code of Ethics Compliance Officer, AMG Funds, AMG Funds I, AMG Funds II, AMG Funds III and AMG Funds IV (2019-Present); Anti-Money Laundering Compliance Officer, AMG Funds, AMG Funds I, AMG Funds II, and AMG Funds III (2014-2019; 2022-Present); Anti-Money Laundering Compliance Officer, AMG Funds IV (2016-2019; 2022-Present); Senior Vice President, Chief Compliance Officer, AMG Funds LLC (2011-2017); Compliance Manager, Legal and Compliance, Affiliated Managers Group, Inc. (2005-2011). |
| | |
• Assistant Secretary since 2016 | | Maureen M. Kerrigan, 37 Vice President, Senior Counsel, AMG Funds LLC (2021-Present); Vice President, Counsel, AMG Funds LLC (2019-2021); Director, Counsel, AMG Funds LLC (2017-2018); Vice President, Counsel, AMG Funds LLC (2015-2017); Assistant Secretary, AMG Funds, AMG Funds I, AMG Funds II, AMG Funds III and AMG Funds IV (2016-Present); Associate, Ropes & Gray LLP (2011-2015); Law Fellow, Massachusetts Appleseed Center for Law and Justice (2010-2011). |
62
| | |
| | | Annual Renewal of Investment Management and Subadvisory Agreements |
| | | |
| | | |
| | | | | | | | |
AMG GW&K Emerging Markets Equity Fund, AMG GW&K Emerging Wealth Equity Fund, AMG GW&K Core Bond ESG Fund, and AMG GW&K Small/Mid Cap Growth Fund: Approval of Investment Management and Subadvisory Agreements on June 22, 2022 At an in-person meeting held on June 22, 2022, the Board of Trustees (the “Board” or the “Trustees”) of each of AMG Funds, AMG Funds I, and AMG Funds IV (each, a “Trust” and collectively, the “Trusts”), and separately a majority of the Trustees who are not “interested persons” of the Trusts (the “Independent Trustees”), approved (i) the Investment Management Agreement, as amended pursuant to letter agreements at any time prior to the date of the meeting, with AMG Funds LLC (the “Investment Manager”) and AMG Funds for each of AMG GW&K Emerging Markets Equity Fund and AMG GW&K Emerging Wealth Equity Fund, and separately each of Amendment No. 1 thereto dated July 1, 2015, and Amendment No. 2 thereto dated October 1, 2016; the Fund Management Agreement, as amended pursuant to letter agreements at any time prior to the date of the meeting, with the Investment Manager and AMG Funds I for AMG GW&K Core Bond ESG Fund, and separately each of Amendment No. 1 thereto dated July 1, 2015, and Amendment No. 2 thereto dated October 1, 2016; and the Investment Advisory Agreement, as amended pursuant to letter agreements at any time prior to the date of the meeting, with the Investment Manager and AMG Funds IV for AMG GW&K Small/Mid Cap Growth Fund, and separately Amendment No. 1 thereto dated October 1, 2016 (collectively, the “Investment Management Agreements”); and (ii) the Subadvisory Agreements, as amended at any time prior to the date of the meeting (collectively, the “Subadvisory Agreements”), with the Subadviser for each of AMG GW&K Emerging Markets Equity Fund, AMG GW&K Emerging Wealth Equity Fund, AMG GW&K Core Bond ESG Fund, and AMG GW&K Small/Mid Cap Growth Fund (each, a “Fund,” and collectively, the “Funds”). The Independent Trustees were separately represented by independent legal counsel in connection with their consideration of the approval of these agreements. In considering the Investment Management Agreements and the Subadvisory Agreements, the Trustees reviewed a variety of materials relating to each Fund, the Investment Manager and the Subadviser, including the nature, extent and quality of services, comparative performance, fee and expense information for an appropriate peer group of similar mutual funds for each Fund (each, a “Peer Group”), performance information for the relevant benchmark index for | | | | each Fund (each, a “Fund Benchmark”), other relevant matters, and other information provided to them on a periodic basis throughout the year. Prior to voting, the Independent Trustees: (a) reviewed the foregoing information with their independent legal counsel; (b) received materials from their independent legal counsel discussing the legal standards applicable to their consideration of the Investment Management Agreements and the Subadvisory Agreements; and (c) met with their independent legal counsel in private sessions at which no representatives of management were present. NATURE, EXTENT AND QUALITY OF SERVICES In considering the nature, extent and quality of the services provided by the Investment Manager, the Trustees reviewed information relating to the Investment Manager’s operations and personnel. Among other things, the Investment Manager provided financial information, information about its supervisory and professional staff and descriptions of its organizational and management structure. The Trustees also took into account information provided periodically throughout the previous year by the Investment Manager in Board meetings relating to the performance of its duties with respect to the Funds and the Trustees’ knowledge of the Investment Manager’s management and the quality of the performance of the Investment Manager’s duties under the Investment Management Agreements and Administration Agreement. In the course of their deliberations regarding the Investment Manager, the Trustees evaluated, among other things: (a) the extent and quality of the Investment Manager’s oversight of the operation and management of the Funds; (b) the quality of the Investment Manager’s oversight of the performance by the Subadviser of its portfolio management duties; (c) the Investment Manager’s ability to supervise the Funds’ other service providers; and (d) the Investment Manager’s compliance program. The Trustees also took into account that, in performing its functions under the Investment Management Agreements and supervising the Subadviser, the Investment Manager: performs periodic detailed analyses and reviews of the performance by the Subadviser of its obligations to each Fund, including without limitation, analysis and review of portfolio and other compliance matters and review of the Subadviser’s investment performance with respect to each Fund; prepares and presents periodic reports to the Board regarding the investment performance of the Subadviser and other information regarding the Subadviser, at such times and in such forms as the | | | | Board may reasonably request; reviews and considers any changes in the personnel of the Subadviser responsible for performing the Subadviser’s obligations and makes appropriate reports to the Board; reviews and considers any changes in the ownership or senior management of the Subadviser and makes appropriate reports to the Board; performs periodic in-person, telephonic or videoconference diligence meetings, including with respect to compliance matters, with representatives of the Subadviser; assists the Board and management of the Trusts in developing and reviewing information with respect to the initial approval of each Subadvisory Agreement and annual consideration of each Subadvisory Agreement thereafter; prepares recommendations with respect to the continued retention of the Subadviser or the replacement of the Subadviser, including at the request of the Board; identifies potential successors to, or replacements of, the Subadviser or potential additional subadvisers, including performing appropriate due diligence, and developing and presenting to the Board a recommendation as to any such successor, replacement, or additional subadviser, including at the request of the Board; designates and compensates from its own resources such personnel as the Investment Manager may consider necessary or appropriate to the performance of its services; and performs such other review and reporting functions as the Board shall reasonably request consistent with the Investment Management Agreements and applicable law. The Trustees noted the affiliation of the Subadviser with the Investment Manager, noting any potential conflicts of interest. The Trustees also took into account the financial condition of the Investment Manager with respect to its ability to provide the services required under the Investment Management Agreements and the Investment Manager’s undertaking to maintain contractual expense limitations for the Funds. The Trustees also considered the Investment Manager’s risk management processes. The Trustees also reviewed information relating to the Subadviser’s operations and personnel and the investment philosophy, strategies and techniques (its “Investment Strategy”) used in managing each Fund. Among other things, the Trustees reviewed information on portfolio management and other professional staff, information regarding the Subadviser’s organizational and management structure and the Subadviser’s brokerage policies and practices. The Trustees considered specific information provided regarding the experience of the individuals at the Subadviser with portfolio |
63
| | |
| | | Annual Renewal of Investment Management and Subadvisory Agreements (continued) |
| | | |
| | | |
| | | | | | | | |
management responsibility for each Fund, including the information set forth in the Fund’s prospectus and statement of additional information. In the course of their deliberations, the Trustees evaluated, among other things: (a) the services rendered by the Subadviser in the past; (b) the qualifications and experience of the Subadviser’s personnel; and (c) the Subadviser’s compliance program. The Trustees also took into account the financial condition of the Subadviser with respect to its ability to provide the services required under each Subadvisory Agreement. The Trustees also considered the Subadviser’s risk management processes. PERFORMANCE The Board considered each Fund’s net performance during relevant time periods as compared to the Fund’s Peer Group and Fund Benchmark, considered the gross performance of each Fund as compared to the Subadviser’s relevant performance composite that utilizes a similar investment strategy and approach, and noted that the Board reviews on a quarterly basis detailed information about both a Fund’s performance results and portfolio composition, as well as the Subadviser’s Investment Strategy. The Board was mindful of the Investment Manager’s expertise, resources and attention to monitoring the Subadviser’s performance, investment style and risk-adjusted performance with respect to the Funds and its discussions with the management of the Funds’ subadviser during the period regarding the factors that contributed to the performance of the Funds. With respect to AMG GW&K Emerging Markets Equity Fund, among other information relating to the Fund’s performance, the Trustees noted that the Fund’s performance for Class Z shares (which share class has one of the earliest inception dates and the largest amount of assets of all the share classes of the Fund) for the 1-year, 3-year, 5-year, and 10-year periods ended March 31, 2022 was below the median performance of the Peer Group and below the performance of the Fund Benchmark, the MSCI Emerging Markets Index. The Trustees took into account management’s discussion of the Fund’s performance, including the reasons for the Fund’s underperformance and the fact that the Fund’s recent underperformance has impacted the Fund’s longer-term performance. The Trustees concluded that the Fund’s overall performance has been satisfactory in light of the Fund’s investment objective, strategies and policies. With respect to AMG GW&K Emerging Wealth Equity Fund, among other information relating to the Fund’s performance, the Trustees noted that the Fund’s | | | | performance for Class Z shares (which share class has the largest amount of assets of all the share classes of the Fund) for the 1-year, 3-year, and 5-year periods ended March 31, 2022 and for the period from the Fund’s inception on March 19, 2015 through March 31, 2022 was below the median performance of the Peer Group and below the performance of the Fund Benchmark, the MSCI Emerging Markets Index. The Trustees took into account management’s discussion of the Fund’s performance, including the reasons for the Fund’s underperformance and the fact that the Fund’s recent underperformance has impacted the Fund’s longer-term performance. The Trustees concluded that the Fund’s overall performance has been satisfactory in light of the Fund’s investment objective, strategies and policies. With respect to AMG GW&K Core Bond ESG Fund, among other information relating to the Fund’s performance, the Trustees noted that the Fund’s performance for Class I shares (which share class has the earliest inception date and the largest amount of assets of all the share classes of the Fund) for the 1-year, 3-year, 5-year and 10-year periods ended March 31, 2022 was below, above, above, and above, respectively, the median performance of the Peer Group and below, at, below, and above, respectively, the performance of the Fund Benchmark, the Bloomberg U.S. Aggregate Bond Index. The Trustees took into account management’s discussion of the Fund’s performance, including the reasons for the Fund’s more recent underperformance relative to the Peer Group and the Fund Benchmark. The Trustees also noted the change in the Fund’s Subadviser in February 2015 and that the performance record prior to that time reflects that of the prior Subadviser. The Trustees also took into account the fact that the Fund’s investment strategy was changed in 2019. The Trustees concluded that the Fund’s overall performance has been satisfactory. With respect to AMG GW&K Small/Mid Cap Growth Fund, among other information relating to the Fund’s performance, the Trustees noted that the Fund’s performance for Class N shares (which share class has the earliest inception date and the largest amount of assets of all the share classes of the Fund) for the 1-year, 3-year, 5-year, and 10-year periods ended March 31, 2022 was above, below, below, and below, respectively, the median performance of the Peer Group and above, above, above, and below, respectively, the performance of the Fund Benchmark, the Russell 2500® Growth Index. The Trustees took into account management’s discussion of the Fund’s performance, including the reasons for the Fund’s recent outperformance | | | | relative to the Peer Group and the Fund Benchmark. The Trustees noted that Class N shares of the Fund ranked in the top third relative to its Peer Group for the 1-year period. The Trustees also took into account the fact that the Fund’s subadviser changed effective March 19, 2021, that the Fund’s investment strategy changed effective March 19, 2021 and further on May 21, 2021, that the Fund Benchmark changed effective May 21, 2021, and that the performance information prior to those dates reflected that of the Fund’s prior subadviser and investment strategy. The Trustees concluded that the Fund’s overall performance has been satisfactory in light of the Fund’s investment objective, strategies and policies. ADVISORY AND SUBADVISORY FEES; FUND EXPENSES; PROFITABILITY; AND ECONOMIES OF SCALE In considering the reasonableness of the advisory fee payable to the Investment Manager, the Trustees reviewed information provided by the Investment Manager at the June 22, 2022 and prior meetings setting forth all revenues and other benefits, both direct and indirect (including any so-called “fallout benefits” such as reputational value derived from the Investment Manager serving as Investment Manager to a Fund), received by the Investment Manager and its affiliates attributable to managing each Fund and all the mutual funds in the AMG Funds Family of Funds; the cost of providing such services; the significant risks undertaken as Investment Manager and sponsor of the Funds, including investment, operational, enterprise, entrepreneurial, litigation, regulatory and compliance risks; and the resulting profitability to the Investment Manager and its affiliates from these relationships. The Trustees also considered the amount of the advisory fee retained by the Investment Manager after payment of the subadvisory fee with respect to each Fund. The Trustees also noted payments are made from the Subadviser to the Investment Manager, and other payments are made from the Investment Manager to the Subadviser. The Trustees also considered management’s discussion of the current asset levels of the Funds, and the impact on profitability of both the current asset levels and any future growth of assets of the Funds. In considering the cost of services to be provided by the Investment Manager under each Investment Management Agreement and the profitability to the Investment Manager of its relationship with each Fund, the Trustees noted the undertaking by the Investment Manager to maintain contractual expense limitations for the Funds. The Board also took into account management’s discussion of the advisory fee structure, and the services the |
64
| | |
| | | Annual Renewal of Investment Management and Subadvisory Agreements (continued) |
| | | |
| | | |
| | | | | | | | |
Investment Manager provides in performing its functions under each Investment Management Agreement and supervising the Subadviser. Based on the foregoing, the Trustees concluded that the profitability to the Investment Manager is reasonable and that the Investment Manager is not realizing material benefits from economies of scale that would warrant adjustments to the advisory fee at this time. Also with respect to economies of scale, the Trustees noted that as each Fund’s assets increase over time, the Fund may realize other economies of scale to the extent the increase in assets is proportionally greater than the increase in certain other expenses. In considering the reasonableness of the subadvisory fees payable by the Investment Manager to the Subadviser, the Trustees reviewed information regarding the cost to the Subadviser of providing subadvisory services to each Fund and the resulting profitability from these relationships. The Trustees noted that, because the Subadviser is an affiliate of the Investment Manager, a portion of the Subadviser’s revenues or profits might be shared directly or indirectly with the Investment Manager. The Trustees also noted that the subadvisory fees are paid by the Investment Manager out of its advisory fee. The Board also took into account management’s discussion of the subadvisory fee structure, and the services the Subadviser provides in performing its functions under each Subadvisory Agreement. Based on the foregoing, the Trustees concluded that the profitability to the Subadviser is reasonable and that the Subadviser is not realizing material benefits from economies of scale that would warrant adjustments to the subadvisory fees at this time. Also with respect to economies of scale, the Trustees noted that as a Fund’s assets increase over time, the Fund may realize other economies of scale to the extent the increase in assets is proportionally greater than the increase in certain other expenses. With respect to AMG GW&K Emerging Markets Equity Fund, the Trustees noted that the management fees (which include both the advisory and administration fees) and total expenses (net of applicable expense waivers/reimbursements) of Class I shares (the class of shares which is the primary focus of the Fund’s distribution) of the Fund as of March 31, 2022 were both lower than the average for the Fund’s Peer Group. The Trustees took into account the fact that the Investment Manager has contractually agreed, through March 1, 2023, to limit the Fund’s net annual operating expenses (subject to certain excluded expenses) to 0.87%. The Trustees concluded that, in | | | | light of the nature, extent and quality of the services provided by the Investment Manager and the Subadviser (which is an affiliate of the Investment Manager), the foregoing expense limitation and the considerations noted above with respect to the Investment Manager and the Subadviser, the Fund’s advisory and subadvisory fees are reasonable. With respect to AMG GW&K Emerging Wealth Equity Fund, the Trustees noted that the management fees (which include both the advisory and administration fees) and total expenses (net of applicable expense waivers/reimbursements) of Class I shares (the class of shares which is the primary focus of the Fund’s distribution) of the Fund as of March 31, 2022 were both lower than the average for the Fund’s Peer Group. The Trustees took into account the fact that the Investment Manager has contractually agreed, through March 1, 2023, to limit the Fund’s net annual operating expenses (subject to certain excluded expenses) to 0.90%. The Trustees concluded that, in light of the nature, extent and quality of the services provided by the Investment Manager and the Subadviser (which is an affiliate of the Investment Manager), the foregoing expense limitation and the considerations noted above with respect to the Investment Manager and the Subadviser, the Fund’s advisory and subadvisory fees are reasonable. With respect to AMG GW&K Core Bond ESG Fund, the Trustees noted that the management fees (which include both the advisory and administration fees) and total expenses (net of applicable expense waivers/reimbursements) of Class I shares of the Fund as of March 31, 2022 were both higher than the average for the Fund’s Peer Group. The Trustees took into account the fact that the Investment Manager has contractually agreed, through March 1, 2023, to limit the Fund’s net annual operating expenses (subject to certain excluded expenses) to 0.48%. The Trustees also took into account management’s discussion of the Fund’s expenses and competitiveness with comparably sized funds and select competitors. The Trustees concluded that, in light of the nature, extent and quality of the services provided by the Investment Manager and the Subadviser (which is an affiliate of the Investment Manager), the foregoing expense limitation and the considerations noted above with respect to the Investment Manager and the Subadviser, the Fund’s advisory and subadvisory fees are reasonable. With respect to AMG GW&K Small/Mid Cap Growth Fund, the Trustees noted that the management fees | | | | (which include both the advisory and administration fees) and total expenses (net of applicable expense waivers/reimbursements) of Class I shares (the class of shares which is the primary focus of the Fund’s distribution) of the Fund as of March 31, 2022 were both higher than the average for the Fund’s Peer Group. The Trustees took into account the fact that the Investment Manager has contractually agreed, through March 1, 2023, to limit the Fund’s net annual operating expenses (subject to certain excluded expenses) to 0.82%. The Trustees also took into account management’s discussion of the Fund’s expenses, including fees and expenses relative to comparably sized funds and select competitors, and the Fund’s small size relative to its peer universe. The Trustees concluded that, in light of the nature, extent and quality of the services provided by the Investment Manager and the Subadviser (which is an affiliate of the Investment Manager), the foregoing expense limitation and the considerations noted above with respect to the Investment Manager and the Subadviser, the Fund’s advisory and subadvisory fees are reasonable. * * * * After consideration of the foregoing, the Trustees also reached the following conclusions (in addition to the conclusions discussed above) regarding the Investment Management and Subadvisory Agreements: (a) the Investment Manager and the Subadviser have demonstrated that they possess the capability and resources to perform the duties required of them under each Investment Management Agreement and each Subadvisory Agreement and (b) the Investment Manager and Subadviser maintain appropriate compliance programs. Based on all of the above-mentioned factors and their related conclusions, with no single factor or conclusion being determinative and with each Trustee not necessarily attributing the same weight to each factor, the Trustees concluded that approval of each Investment Management Agreement and each Subadvisory Agreement would be in the best interests of the applicable Fund and its shareholders. Accordingly, on June 22, 2022, the Trustees, and separately a majority of the Independent Trustees, voted to approve the Investment Management Agreement and the Subadvisory Agreement for each Fund. |
65
THIS PAGE INTENTIONALLY LEFT BLANK
THIS PAGE INTENTIONALLY LEFT BLANK
THIS PAGE INTENTIONALLY LEFT BLANK
|
|
| | | | | | | | |
INVESTMENT MANAGER AND ADMINISTRATOR AMG Funds LLC 680 Washington Blvd., Suite 500 Stamford, CT 06901 800.548.4539 DISTRIBUTOR AMG Distributors, Inc. 680 Washington Blvd., Suite 500 Stamford, CT 06901 800.548.4539 SUBADVISER GW&K Investment Management, LLC 222 Berkeley St. Boston, MA 02116 | | | | CUSTODIAN The Bank of New York Mellon Mutual Funds Custody 6023 Airport Road Oriskany, NY 13424 LEGAL COUNSEL Ropes & Gray LLP Prudential Tower, 800 Boylston Street Boston, MA 02199-3600 TRANSFER AGENT BNY Mellon Investment Servicing (US) Inc. Attn: AMG Funds 4400 Computer Drive Westborough, MA 01581 800.548.4539 | | | | This report is prepared for the Fund’s shareholders. It is authorized for distribution to prospective investors only when preceded or accompanied by an effective prospectus. To receive a free copy of the prospectus or Statement of Additional Information, which includes additional information about Fund Trustees, please contact us by calling 800.548.4539. Distributed by AMG Distributors, Inc., member FINRA/SIPC. Current net asset values per share for each Fund are available on the Fund’s website at amgfunds.com. A description of the policies and procedures each Fund uses to vote its proxies is available: (i) without charge, upon request, by calling 800.548.4539, or (ii) on the Securities and Exchange Commission’s (SEC) website at sec.gov. For information regarding each Fund’s proxy voting record for the 12-month period ended June 30, call 800.548.4539 or visit the SEC website at sec.gov. The Funds file their complete schedule of portfolio holdings with the SEC for the first and third quarters of each fiscal year as an exhibit to their reports on Form N-PORT. The Fund’s portfolio holdings on Form N-PORT are available on the SEC’s website at sec.gov and the Fund’s website at amgfunds.com. To review a complete list of the Fund’s portfolio holdings, or to view the most recent semiannual report or annual report, please visit amgfunds.com. |
| | | | | | | | | |
| | | | | | | | |
BALANCED FUNDS AMG GW&K Global Allocation GW&K Investment Management, LLC EQUITY FUNDS AMG Beutel Goodman International Equity Beutel, Goodman & Company Ltd. AMG Boston Common Global Impact Boston Common Asset Management, LLC AMG Frontier Small Cap Growth Frontier Capital Management Co., LLC AMG GW&K Small Cap Core AMG GW&K Small Cap Value AMG GW&K Small/Mid Cap AMG GW&K Small/Mid Cap Growth AMG GW&K Emerging Markets Equity AMG GW&K Emerging Wealth Equity AMG GW&K International Small Cap GW&K Investment Management, LLC AMG Montrusco Bolton Large Cap Growth Montrusco Bolton Investments, Inc. AMG Renaissance Large Cap Growth The Renaissance Group LLC | | | | AMG River Road Dividend All Cap Value AMG River Road Focused Absolute Value AMG River Road International Value Equity AMG River Road Large Cap Value Select AMG River Road Mid Cap Value AMG River Road Small-Mid Cap Value AMG River Road Small Cap Value River Road Asset Management, LLC AMG TimesSquare Emerging Markets Small Cap AMG TimesSquare Global Small Cap AMG TimesSquare International Small Cap AMG TimesSquare Mid Cap Growth AMG TimesSquare Small Cap Growth TimesSquare Capital Management, LLC AMG Veritas Asia Pacific AMG Veritas China AMG Veritas Global Focus AMG Veritas Global Real Return Veritas Asset Management LLP AMG Yacktman AMG Yacktman Focused AMG Yacktman Global AMG Yacktman Special Opportunities Yacktman Asset Management LP | | | | FIXED INCOME FUNDS AMG Beutel Goodman Core Plus Bond Beutel, Goodman & Company Ltd. AMG GW&K Core Bond ESG AMG GW&K Enhanced Core Bond ESG AMG GW&K ESG Bond AMG GW&K High Income AMG GW&K Municipal Bond AMG GW&K Municipal Enhanced Yield GW&K Investment Management, LLC |
| | | | | | | | | |
| | | | | | | | | |
| | | | | | | | | |
| | | | | | | | | |
| | | | | | | | | |
| | | | | | | | | |
| | | | | | | | | |
| | | | | | | | | |
| | | | | | | | | |
| | | | |
| amgfunds.com | | | | 103122 AR069 |
Registrant has adopted a Code of Ethics. See attached Exhibit (a)(1).
| Item 3. | AUDIT COMMITTEE FINANCIAL EXPERT |
Registrant’s Board of Trustees has determined that independent Trustee Mr. Steven J. Paggioli qualifies as an Audit Committee Financial Expert. Mr. Paggioli is “independent” as such term is defined in Form N-CSR.
| Item 4. | PRINCIPAL ACCOUNTANT FEES AND SERVICES |
(a) Audit Fees
The aggregate fees billed by the Funds’ independent registered public accounting firm, PricewaterhouseCoopers LLP (“PwC”), to the Funds for the Funds’ two most recent fiscal years for professional services rendered for audits of annual financial statements, or services that are normally provided in connection with statutory and regulatory filings or engagements (“Audit Fees”) were as follows:
| | | | | | | | |
Fund | | Fiscal 2022 | | | Fiscal 2021 | |
AMG GW&K Emerging Markets Equity Fund | | $ | 48,176 | | | $ | 44,929 | |
AMG GW&K Emerging Wealth Equity Fund | | $ | 64,076 | | | $ | 43,297 | |
(b) Audit-Related Fees
There were no fees billed by PwC to the Funds in their two recent fiscal years for services rendered for assurance and related services that are reasonably related to the performance of the audit or review of the Funds’ financial statements, but are not reported as Audit Fees (“Audit-Related Fees”).
For the Funds’ two most recent fiscal years, there were no Audit-Related Fees billed by PwC for engagements related directly to the operations and financial reporting of one or more Funds by a Fund Service Provider. A Fund Service Provider is (a) any investment adviser to a Fund (not including any Subadvisor whose role is primarily portfolio management and is subcontracted with or overseen by another investment adviser) or (b) any entity that provides ongoing services to a Fund and is controlling, controlled by or under common control with a Fund investment adviser described in (a).
(c) Tax Fees
The aggregate fees billed by PwC to the Funds for the two most recent fiscal years for professional services rendered for tax compliance, tax advice, and tax planning (“Tax Fees”) were as follows:
| | | | | | | | |
| | | Fiscal 2022 | | | Fiscal 2021 | |
AMG GW&K Emerging Markets Equity Fund | | $ | 6,540 | | | $ | 6,050 | |
AMG GW&K Emerging Wealth Equity Fund | | $ | 6,540 | | | $ | 6,050 | |
For the Funds’ two most recent fiscal years, Tax Fees billed by PwC for engagements by Fund Service Providers that related directly to the operations and financial reporting of the Funds were $0 for fiscal 2022 and $0 for fiscal 2021, respectively.
The services for which Tax Fees were charged comprise all services performed by professional staff in PwC’s tax division except those services related to the audit. Typically, this category would include fees for tax compliance, tax planning, and tax advice. Tax compliance, tax advice, and tax planning services include preparation of original and amended tax returns, claims for refund and tax payment-planning services, assistance with tax audits and appeals, tax advice related to mergers and acquisitions and requests for rulings or technical advice from taxing authorities.
(d) All Other Fees
There were no other fees billed by PwC to the Funds for all other non-audit services (“Other Fees”) during the Funds’ two most recent fiscal years. During the same period, there were no Other Fees billed by PwC for engagements by Fund Service Providers that related directly to the operations and financial reporting of the Funds.
(e) (1) According to policies adopted by the Audit Committee, services provided by PwC to the Funds must be pre-approved by the Audit Committee. On an annual basis, the Audit Committee reviews and pre-approves various types of services that PwC may perform for the Funds without specific approval of each engagement, subject to specified budget limitations. As contemplated by the Sarbanes-Oxley Act of 2002 and related SEC rules, the Audit Committee also pre-approves non-audit services provided by PwC to any Fund Service Provider for any engagement that relates directly to the operations and financial reporting of the Funds. Any engagement that is not already pre-approved or that will exceed a pre-approved budget must be submitted to the Audit Committee for pre-approval. The Chairman of the Audit Committee is authorized on behalf of the Board of Trustees and the Audit Committee to approve the engagement of PwC to perform non-audit services subject to certain conditions, including notification to the Audit Committee of such pre-approval not later than the next meeting of the Audit Committee following the date of such pre-approval.
(e)(2) None.
(f) Not applicable.
(g) The aggregate fees billed by PwC in 2022 and 2021 for non-audit services rendered to the Funds and Fund Service Providers were $49,747 and $53,683, respectively. For the fiscal year ended October 31, 2022, this amount reflects the amounts disclosed above in Item 4(b),(c),(d), plus $36,667 in fees billed to the Fund Service Providers for non-audit services that did not relate directly to the operations and financial reporting of the Funds. For the fiscal year ended October 31, 2021, this amount reflects the amounts disclosed above in Item 4(b),(c),(d), plus $41,583 in fees billed to the Fund Service Providers for non-audit services that did not relate directly to the operations and financial reporting of the Funds.
(h) The Trust’s Audit Committee has considered whether the provision of non-audit services by registrant’s independent registered public accounting firm to the registrant’s investment advisor, and any entity controlling, controlled, or under common control with the investment advisor that provided ongoing services to the registrant that were not pre-approved by the Committee (because such services did not relate directly to the operations and financial reporting of the registrant) was compatible with maintaining the independence of the independent registered public accounting firm.
| Item 5. | AUDIT COMMITTEE OF LISTED REGISTRANTS |
Not applicable.
| Item 6. | SCHEDULE OF INVESTMENTS |
The schedule of investments in securities of unaffiliated issuers as of the close of the reporting period is included as part of the shareholder report contained in Item 1 of this form.
| Item 7. | DISCLOSURE OF PROXY VOTING POLICIES AND PROCEDURES FOR CLOSED-END MANAGEMENT INVESTMENT COMPANIES |
Not applicable.
| Item 8. | PORTFOLIO MANAGERS OF CLOSED-END MANAGEMENT INVESTMENT COMPANIES |
Not applicable.
| Item 9. | PURCHASES OF EQUITY SECURITIES BY CLOSED-END MANAGEMENT INVESTMENT COMPANIES AND AFFILIATED PURCHASERS |
Not applicable.
| Item 10. | SUBMISSION OF MATTERS TO A VOTE OF SECURITY HOLDERS |
Not applicable.
| Item 11. | CONTROLS AND PROCEDURES |
(a) The Registrant’s principal executive and principal financial officers have concluded, based on their evaluation of the registrant’s disclosure controls and procedures as of a date within 90 days of the filing of this report, that the Registrant’s disclosure controls and procedures are reasonably designed to ensure that information required to be disclosed by the Registrant on Form N-CSR is recorded, processed, summarized and reported within the required time
periods and that information required to be disclosed by the registrant in the reports that it files or submits on Form N-CSR is accumulated and communicated to the Registrant’s management, including its principal executive and principal financial officers, as appropriate to allow timely decisions regarding required disclosure.
(b) There were no changes in the Registrant’s internal control over financial reporting during the period covered by this report that have materially affected, or are reasonably likely to materially affect, the internal control over financial reporting.
| Item 12. | DISCLOSURE OF SECURITIES LENDING ACTIVITIES FOR CLOSED-END MANAGEMENT INVESTMENT COMPANIES |
Not applicable.
SIGNATURES
Pursuant to the requirements of the Securities Exchange Act of 1934 and the Investment Company Act of 1940, the registrant has duly caused this report to be signed on its behalf by the undersigned, thereunto duly authorized.
| | |
| AMG FUNDS |
| |
| By: | | /s/ Keitha L. Kinne |
| | Keitha L. Kinne, Principal Executive Officer |
| |
| Date: | | January 6, 2023 |
Pursuant to the requirements of the Securities Exchange Act of 1934 and the Investment Company Act of 1940, this report has been signed below by the following persons on behalf of the registrant and in the capacities and on the dates indicated.
| | |
| |
| By: | | /s/ Keitha L. Kinne |
| | Keitha L. Kinne, Principal Executive Officer |
| |
| Date: | | January 6, 2023 |
| |
| By: | | /s/ Thomas Disbrow |
| | Thomas Disbrow, Principal Financial Officer |
| |
| Date: | | January 6, 2023 |