UNITED STATES
SECURITIES AND EXCHANGE COMMISSION
Washington, D.C. 20549
FORM N-CSR
CERTIFIED SHAREHOLDER REPORT OF
REGISTERED MANAGEMENT INVESTMENT COMPANIES
Investment Company Act file number: 811-09521
AMG FUNDS
(Exact name of registrant as specified in charter)
680 Washington Boulevard, Suite 500, Stamford, Connecticut 06901
(Address of principal executive offices) (Zip code)
AMG Funds LLC
680 Washington Boulevard, Suite 500, Stamford, Connecticut 06901
(Name and address of agent for service)
Registrant’s telephone number, including area code: (203) 299-3500
Date of fiscal year end: DECEMBER 31
Date of reporting period: JANUARY 1, 2023 – DECEMBER 31, 2023
(Annual Shareholder Report)
| Item 1. | Reports to Shareholders |
| | |
 | | ANNUAL REPORT |
| | |
| | | AMG Funds December 31, 2023 |
| | |
| | |  |
| | |
| | | AMG TimesSquare Small Cap Growth Fund |
| | |
| | | Class N: TSCPX | Class I: TSQIX | Class Z: TSCIX |
| | |
| | | AMG TimesSquare Mid Cap Growth Fund |
| | |
| | | Class N: TMDPX | Class I: TQMIX | Class Z: TMDIX |
| | |
| | | AMG TimesSquare International Small Cap Fund |
| | |
| | | Class N: TCMPX | Class I: TQTIX | Class Z: TCMIX |
| | |
| | | AMG TimesSquare Emerging Markets Small Cap Fund |
| | |
| | | Class N: TQENX | Class I: TQEIX | Class Z: TQEZX |
| | |
| | | AMG TimesSquare Global Small Cap Fund |
| | |
| | | Class N: TSYNX | Class I: TSYIX | Class Z: TSYZX |
| | | | |
| | | |
| wealth.amg.com | | | | 123123 AR012 |
| | |
| | | AMG Funds Annual Report — December 31, 2023 |
| | | | | | |
| | | |
| | | | | | |
| | | TABLE OF CONTENTS | | PAGE | |
| | | | |
| | | |
| | | LETTER TO SHAREHOLDERS | | | 2 | |
| | | |
| | | ABOUT YOUR FUND’S EXPENSES | | | 3 | |
| | | |
| | | PORTFOLIO MANAGER’S COMMENTS, FUND SNAPSHOTS AND SCHEDULES OF PORTFOLIO INVESTMENTS | | | | |
| | | |
| | | AMG TimesSquare Small Cap Growth Fund | | | 4 | |
| | | |
| | | AMG TimesSquare Mid Cap Growth Fund | | | 11 | |
| | | |
| | | AMG TimesSquare International Small Cap Fund | | | 19 | |
| | | |
| | | AMG TimesSquare Emerging Markets Small Cap Fund | | | 27 | |
| | | |
| | | AMG TimesSquare Global Small Cap Fund | | | 35 | |
| | | |
| | | FINANCIAL STATEMENTS | | | | |
| | | |
| | | Statement of Assets and Liabilities | | | 43 | |
| | | |
| | | Balance sheets, net asset value (NAV) per share computations and cumulative distributable earnings (loss) | | | | |
| | | |
| | | Statement of Operations | | | 45 | |
| | | |
| | | Detail of sources of income, expenses, and realized and unrealized gains (losses) during the fiscal year | | | | |
| | | |
| | | Statements of Changes in Net Assets | | | 46 | |
| | | |
| | | Detail of changes in assets for the past two fiscal years | | | | |
| | | |
| | | Financial Highlights | | | 48 | |
| | | |
| | | Historical net asset values per share, distributions, total returns, income and expense ratios, turnover ratios and net assets | | | | |
| | | |
| | | Notes to Financial Statements | | | 63 | |
| | | |
| | | Accounting and distribution policies, details of agreements and transactions with Fund management and affiliates, and descriptions of certain investment risks | | | | |
| | | |
| | | REPORT OF INDEPENDENT REGISTERED PUBLIC ACCOUNTING FIRM | | | 72 | |
| | | |
| | | OTHER INFORMATION | | | 73 | |
| | | |
| | | TRUSTEES AND OFFICERS | | | 74 | |
| | | | | | | |
|
Nothing contained herein is to be considered an offer, sale or solicitation of an offer to buy shares of any series of the AMG Funds Family of Funds. Such offering is made only by prospectus, which includes details as to offering price and other material information. | |
| | |
| | Letter to Shareholders |
Dear Shareholder:
We are pleased to provide this annual report for your investment with AMG Funds. Our foremost goal is to provide investment solutions that help our shareholders successfully achieve their long-term investment goals. We appreciate the privilege of providing you with investment tools.
Throughout most of the year, markets wrestled with uncertainties around tighter monetary policy, increased geopolitical tension, instability in the regional banking sector, and political handwringing over the U.S. debt ceiling. However, investors remained optimistic for an economic “soft landing” as inflation continued to ease and risk assets finally surged in the fourth quarter following a dovish pivot in the U.S. Federal Reserve (the “Fed”) policy. Bonds finished with a positive return; a remarkable development after struggling to move higher for most of the year as global central banks raised interest rates.
The S&P 500® Index gained 26.29% for the fiscal year ended December 31, 2023, fully recouping losses suffered in 2022. Large-cap stocks diverged from small-cap stocks, particularly driven by a handful of mega-cap technology and consumer discretionary stocks. The Russell 1000® Index gained 26.53% compared to the 16.93% return for the Russell 2000® Index. Nine out of eleven sectors posted positive returns, with information technology (60.93%), communication services (55.86%), and consumer discretionary (43.22%) leading the way. The weakest sectors were utilities (-7.08%), energy (-1.33%), and consumer staples (+0.55%). The strength in information technology drove growth stocks to strongly outperform value stocks with the Russell 1000® Growth Index gaining 42.68% compared to a 11.46% return for the Russell 1000® Value Index. Outside the U.S., foreign equity markets underperformed domestic equities, delivering a 15.62% return, as measured by the MSCI All Country World Index ex USA benchmark.
The Bloomberg U.S. Aggregate Bond Index, a broad measure of U.S. bond market performance, rebounded with a 5.53% return over the period. The 10-year Treasury yield climbed to post-GFC (Global Financial Crisis) highs through October as the Fed tightened policy throughout the year, leading many to expect another year of negative bond returns. However, investors received much needed relief as interest rates fell sharply in the final two months of the year following the Fed’s message signaling rate cuts in 2024. Looking across the broadest sectors of the market, investment-grade corporate bonds gained 8.52% for the year, while agency mortgage-backed securities rose 5.05%. High yield bonds were the best performing sector with a 13.44% return as measured by the return of the Bloomberg U.S. Corporate High Yield Bond Index. Municipal bonds outperformed the broader market with a 6.40% gain for the Bloomberg Municipal Bond Index. Outside the U.S., foreign bonds were also positive as the Bloomberg Global Aggregate ex-USD Index gained 5.72%.
AMG Funds provides access to a distinctive array of actively managed return-oriented investment strategies. You can rest assured that under all market conditions our team is focused on delivering excellent investment management services for your benefit. For more information about AMG Funds’ wide range of products and resources, please visit wealth.amg.com. We thank you for your investment and continued trust in AMG Funds.
Respectfully,

Keitha Kinne
President
AMG Funds
| | | | | | | | | | | | | | |
| | | | | Periods ended | |
| Average Annual Total Returns | | December 31, 2023* | |
| | | | |
| Stocks: | | | | 1 Year | | | 3 Years | | | 5 Years | |
| | | | |
Large Cap | | (S&P 500® Index) | | | 26.29% | | | | 10.00% | | | | 15.69% | |
| | | | |
Small Cap | | (Russell 2000® Index) | | | 16.93% | | | | 2.22% | | | | 9.97% | |
| | | | |
International | | (MSCI ACWI ex USA) | | | 15.62% | | | | 1.55% | | | | 7.08% | |
| | | | |
Bonds: | | | | | | | | | | | | | | |
| | | | |
Investment Grade | | (Bloomberg U.S. Aggregate Bond Index) | | | 5.53% | | | | (3.31)% | | | | 1.10% | |
| | | | |
High Yield | | (Bloomberg U.S. Corporate High Yield Bond Index) | | | 13.44% | | | | 1.98% | | | | 5.37% | |
| | | | |
Tax-exempt | | (Bloomberg Municipal Bond Index) | | | 6.40% | | | | (0.40)% | | | | 2.25% | |
| | | | |
Treasury Bills | | (ICE BofAML U.S. 6-Month Treasury Bill Index) | | | 5.14% | | | | 2.17% | | | | 2.02% | |
*Source: FactSet. Past performance is no guarantee of future results.
2
| | |
| | | About Your Fund’s Expenses |
| | | |
| | | |
| | | | | | | | |
As a shareholder of a Fund, you may incur two types of costs: (1) transaction costs, which may include sales charges (loads) on purchase payments; redemption fees; and exchange fees; and (2) ongoing costs, including management fees; distribution (12b-1) fees; and other Fund expenses. This example is intended to help you understand your ongoing costs (in dollars) of investing in the Fund and to compare these costs with the ongoing costs of investing in other mutual funds. The example is based on $1,000 invested at the beginning of the period and held for the entire period as indicated below. ACTUAL EXPENSES The first section of the following table provides information about the actual account values and | | | | actual expenses. You may use the information in this section, together with the amount you invested, to estimate the expenses that you paid over the period. Simply divide your account value by $1,000 (for example, an $8,600 account value divided by $1,000 = 8.6), then multiply the result by the number in the first section under the heading entitled “Expenses Paid During the Period” to estimate the expenses you paid on your account during this period. HYPOTHETICAL EXAMPLE FOR COMPARISON PURPOSES The second section of the following table provides information about hypothetical account values and hypothetical expenses based on the Fund’s actual expense ratio and an assumed annual rate of return of 5% before expenses, which is not the Fund’s | | | | actual return. The hypothetical account values and expenses may not be used to estimate the actual ending account balance or expenses you paid for the period. You may use this information to compare the ongoing costs of investing in the Fund and other funds by comparing this 5% hypothetical example with the 5% hypothetical examples that appear in the shareholder reports of other funds. Please note that the expenses shown in the table are meant to highlight your ongoing costs only and do not reflect any transactional costs, such as sales charges (loads), redemption fees, or exchange fees. Therefore, the second section of the table is useful in comparing ongoing costs only, and will not help you determine the relative total costs of owning different funds. |
| | | | | | | | |
| | | | | | | | | | |
Six Months Ended December 31, 2023 | | Expense
Ratio for
the Period | | Beginning
Account
Value
07/01/23 | | Ending
Account
Value
12/31/23 | | | Expenses
Paid
During
the Period* |
AMG TimesSquare Small Cap Growth Fund |
|
Based on Actual Fund Return |
Class N | | 1.19% | | $1,000 | | | $1,053 | | | $6.16 |
Class I | | 1.07% | | $1,000 | | | $1,054 | | | $5.54 |
Class Z | | 0.99% | | $1,000 | | | $1,054 | | | $5.12 |
|
Based on Hypothetical 5% Annual Return |
Class N | | 1.19% | | $1,000 | | | $1,019 | | | $6.06 |
Class I | | 1.07% | | $1,000 | | | $1,020 | | | $5.45 |
Class Z | | 0.99% | | $1,000 | | | $1,020 | | | $5.04 |
AMG TimesSquare Mid Cap Growth Fund |
|
Based on Actual Fund Return |
Class N | | 1.19% | | $1,000 | | | $1,087 | | | $6.26 |
Class I | | 1.04% | | $1,000 | | | $1,087 | | | $5.47 |
Class Z | | 0.99% | | $1,000 | | | $1,088 | | | $5.21 |
|
Based on Hypothetical 5% Annual Return |
Class N | | 1.19% | | $1,000 | | | $1,019 | | | $6.06 |
Class I | | 1.04% | | $1,000 | | | $1,020 | | | $5.30 |
Class Z | | 0.99% | | $1,000 | | | $1,020 | | | $5.04 |
AMG TimesSquare International Small Cap Fund |
|
Based on Actual Fund Return |
Class N | | 1.23% | | $1,000 | | | $1,030 | | | $6.29 |
Class I | | 1.07% | | $1,000 | | | $1,030 | | | $5.48 |
Class Z | | 0.98% | | $1,000 | | | $1,031 | | | $5.02 |
|
Based on Hypothetical 5% Annual Return |
Class N | | 1.23% | | $1,000 | | | $1,019 | | | $6.26 |
Class I | | 1.07% | | $1,000 | | | $1,020 | | | $5.45 |
Class Z | | 0.98% | | $1,000 | | | $1,020 | | | $4.99 |
| | | | | | | | | | |
Six Months Ended December 31, 2023 | | Expense
Ratio for
the Period | | Beginning
Account
Value
07/01/23 | | Ending
Account
Value
12/31/23 | | | Expenses
Paid
During
the Period* |
AMG TimesSquare Emerging Markets Small Cap Fund |
|
Based on Actual Fund Return |
Class N | | 1.65% | | $1,000 | | | $1,093 | | | $8.70 |
Class I | | 1.25% | | $1,000 | | | $1,095 | | | $6.60 |
Class Z | | 1.25% | | $1,000 | | | $1,095 | | | $6.60 |
|
Based on Hypothetical 5% Annual Return |
Class N | | 1.65% | | $1,000 | | | $1,017 | | | $8.39 |
Class I | | 1.25% | | $1,000 | | | $1,019 | | | $6.36 |
Class Z | | 1.25% | | $1,000 | | | $1,019 | | | $6.36 |
AMG TimesSquare Global Small Cap Fund |
|
Based on Actual Fund Return |
Class N | | 1.25% | | $1,000 | | | $1,053 | | | $6.47 |
Class I | | 1.00% | | $1,000 | | | $1,055 | | | $5.18 |
Class Z | | 1.00% | | $1,000 | | | $1,055 | | | $5.18 |
|
Based on Hypothetical 5% Annual Return |
Class N | | 1.25% | | $1,000 | | | $1,019 | | | $6.36 |
Class I | | 1.00% | | $1,000 | | | $1,020 | | | $5.09 |
Class Z | | 1.00% | | $1,000 | | | $1,020 | | | $5.09 |
| * | Expenses are equal to the Fund’s annualized expense ratio multiplied by the average account value over the period, multiplied by the number of days in the most recent fiscal half-year (184), then divided by 365. |
3
| | |
| | | AMG TimesSquare Small Cap Growth Fund Portfolio Manager’s Comments (unaudited) |
| | | |
| | | |
| | | | |
The Year In Review For the year ended December 31, 2023, AMG TimesSquare Small Cap Growth Fund (the “Fund”) Class N shares returned 16.41%, while the benchmark, the Russell 2000® Growth Index, returned 18.66%. 2023 started off with a rollercoaster ride for global equity markets in the first quarter, followed by a steady climb in the second quarter, a decline in the third quarter, and ended the year with a strong rebound in the fourth quarter. The fourth quarter was bolstered by central banks pausing rates increases, but it may be premature to declare victory over inflation and plot a near-term pivot to monetary easing. That speculation led to a rally benefiting global equities—especially small & microcaps and emerging markets. Concerns surrounding wage inflation and access to skilled workers generally subsided across markets, with the notable exception of Japan where that remains a significant challenge. Most factors finished the year in positive territory. However, it was Beta that significantly outpaced other style factors in 2023. Among U.S. small- to mid- cap growth stocks better performance was found in the information technology, industrials, and consumer discretionary sectors. Utilities and energy generally lagged. As our investment team meets with companies, reviews recent earnings reports, and surveys the global landscape, they note several investment dynamics that inform our positioning: • Technology: Cybersecurity remains a top priority for companies, propelled by recent well publicized cyberattacks and new SEC disclosure rules on cyber risks which took effect in December 2023. Our channel checks indicate that information technology (IT) budgets will continue growing, with cybersecurity becoming an increasing percentage. Interest continues to grow in machine learning and generative artificial intelligence (AI) tools and applications, though companies approach this area cautiously given the costs and fast paced changes. • Industrials: Many years of prior underinvestment leave significant ground to recover that recent government programs have only begun to address. Industrial capital expenditures may continue to be a bright spot for several years as structural labor challenges are addressed with greater automation and supply chains move closer to home, particularly away from China. | | • China: Localization and import substitution are major trends, either due to geopolitical concerns in the case of the technology industry, or trading down to cheaper domestic products due to consumer weakness. Meanwhile, both Chinese and multinational companies continue to seek other manufacturing centers in the region, or re-shore them completely, which should benefit Southeast Asia, Mexico, and India. Fund Performance Review At the start of 2023, the Fund lagged the Russell 2000® Growth Index during the market’s jump in January following 2022’s negative market. As the market tide ebbed, our relative performance improved, and we were ahead of the benchmark by early spring. Then market hype surrounding generative AI or GLP 1 (Glucagon-like peptide 1) obesity drugs lifted riskier small cap growth stocks far higher than our holdings. By the fall, we regained our relative performance lead when quality was favored while risk and high valuation were shunned. In the last two months of the year, the market rebounded sharply with expectations for both an economic soft landing and a near term pivot on monetary policy, leaving us behind the benchmark for the year. Our preferences in the consumer oriented sectors lean toward value oriented or specialty retailers, franchise models, or premium brands. This year, however, that proved challenging. We exited our positions in Planet Fitness and National Vision—each had a negative impact on performance. The fitness center franchisor Planet Fitness was down -39% while we held it in 2023. Early in the year, investors were disappointed that the company’s initial expectation for 160 new store openings was below expectations for 175. That pace continued to lag in subsequent quarters, and we trimmed our position. Then in September, the company’s board discharged its CEO over differing views on how best to move the company forward. In our follow up discussion with the CFO and interim CEO, we were not convinced a positive change was near, so we sold our remaining position. We left behind National Vision in early March with its shares down -40%. Earnings came up short versus expectations, though revenues were in line for this value oriented optical retail chain providing eye exams, eyeglasses, and contact lenses. The company’s management cited a difficult | | operating environment, particularly for their lower income customers. The company’s 2023 outlook was slightly below estimates, incorporating continuing constraints on eye exam capacity due to a shortage of optometrists. Faring far better was Wingstop, Inc., the franchisor and operator of quick service restaurants for cooked-to-order chicken wings. The company began the year with better-than-anticipated results thanks to higher levels of customer traffic and many recently opened locations. As its price rose in the spring, we trimmed our position. Late in the summer its share price faded, somewhat from market sentiment that the GLP 1 weight loss drugs would curb customer appetites for wings, and we added to our holdings. Toward the end of the year, Wingstop reported revenues and earnings well above expectations as transactions increased meaningfully with significant growth of digital sales. At the same time, chicken costs decreased, which led Wingstop’s management to increase its guidance for the balance of the year. We trimmed our position on that price strength, and Wingstop ended 2023 with a 78% gain. In the financials sector, we tend to avoid banks that face credit deterioration or rising deposit costs, preferring either asset managers or specialized insurance companies. That included private markets investment service provider Hamilton Lane and its 81% return. Quarter after quarter, the company exceeded expectations with ever-rising fee income. Fundraising was on track, especially for its new Evergreen products (most private investment funds have finite lifespans). That led to steady growth in the firm’s assets under management and fee earnings, and we trimmed our position during the second half of the year. Offsetting that was the 21% showing from ProAssurance. In May, the company’s underwriting results were lower than anticipated, caused by an atypical adverse reserve development that stemmed from a business ProAssurance acquired in 2021. Its shares gradually recovered, but then retreated again in November. Although its primary malpractice insurance business was good, its smaller workers’ compensation business fared poorly as it faced notable medical cost inflation. That was enough to weigh on overall underwriting results. We had trimmed the position prior to the report in the face of potential risks, and did so again afterward, though the company’s valuation based on the malpractice business remained very attractive. |
4
| | |
| | | AMG TimesSquare Small Cap Growth Fund Portfolio Manager’s Comments (continued) |
| | | |
| | | |
| | | | |
Our preferences among health care stocks are those companies providing novel therapies for unmet needs that deserve premium pricing, or specialized service providers. One of our top contributors had a short stay in the strategy this year, though during that time Reata Pharmaceuticals posted an 88% gain. In April we initiated a position in this biotechnology developer of therapies for types of chronic kidney and neurological diseases. At that time we had been following the company for some time and it recently gained Food and Drug Administration (FDA) approval for treating Friedreich’s Ataxia, an inherited genetic disorder affecting the nervous system. We saw a long-term opportunity and the company was moving toward more attractive profitability under a new CFO. Then in July it agreed to be acquired by Biogen and we subsequently exited the stock. Detracting from results was Treace Medical, an orthopedic medical device company focused on treating bunions. At the start of the year, Treace contributed to performance after reporting that business momentum was strong across several channels and the company soon preannounced better-than-expected revenues. Later its shares pulled back when the market seemed concerned about the pace of Treace’s quarterly sales, a slippage in its average selling price (“ASP”) for devices, and a wave of obesity treatments lessening the need for orthopedic devices. In our view, Treace should see a later reacceleration of sales, higher demand for more complex devices will lift its ASP, and podiatrists note that obesity does not drive the occurrence of bunions. Thus, we added to our holdings following Treace’s 45% price decline. Many of our industrials positions provide necessary business to business operational services, highly technical components, automation and efficiency improvements, or essential infrastructure services. One steady contributor throughout the year was the global welding company Esab Corporation. Business activity from Esab’s end customers—especially in the emerging markets—markedly improved during 2023. At the same time, ESAB was about to increase pricing, which led its management to repeatedly increase its forward guidance. We regularly trimmed | | our holdings as Esab’s shares climbed by 85%. At the other end of the scale was a -48% decline for Driven Brands, an automotive services company meeting a range of needs, including paint, collision, glass, vehicle repair, oil change, maintenance, and car washes. Midyear, the company reported fewer-than-expected new business openings (though same store sales were better than expected). Later there was a marked decline in car wash volumes, with management citing poor weather conditions as the culprit. Driven also noted competition was growing in that segment. Also challenged this year was WNS Holdings, which provides business process management services—including customer interaction, finance and accounting, and data analytics—to a variety of industries. The mania surrounding generative AI and its possibilities created volatility in several industries. AI has been a productivity tool for business process outsourcing companies. Therefore, it seemed to us there was an overreaction on the potential disruption for businesses such as WNS that provide value added services, enabling customers to save costs. However, later in the year WNS’s management reduced guidance for the balance of its fiscal year. Although the core business continued generating significant cash flows, WNS noted that a recently signed contract for a captive insurance operation was taking longer than expected to start—and generate revenues. The company also saw hesitancy from a travel industry client who projected more conservative growth levels. Out of caution, recognizing some of these one-offs need to clear before its shares reaccelerate, we trimmed our position, which had retreated by -21%. Among the wide variety of information technology companies, we prefer critical system providers, specialized component designers, systems that improve productivity or efficiency for their clients, and others that are closely tied to increasing shares of corporate IT budgets. One holding that consistently climbed in 2023 was Onto Innovation, which develops inspection technologies for use across the entire semiconductor fabrication process. Onto’s management was conservative with its initial | | guidance for 2023 and actively worked to cut costs, which investors rewarded. End market demand, growing complexity for semiconductors, and higher volume needs translated into a 125% gain for Onto. Also picking up new business was Vertex, Inc. Providing end-to-end tax compliance software for large businesses, Vertex’s rates of annual recurring revenues initially were stable and later increased in 2023. It also benefited from its partnership with SAP, Oracle, Workday, Microsoft, and Salesforce.com—all of which drive additional sales momentum. Then at the end of the year Vertex announced the end of its two year cycle of internal investments—including a new Enterprise resource planning (ERP) system—which should lead to improving margins in the future. Combined, that led to an 86% return for Vertex, and we trimmed our position at year end. Looking forward into 2024 markets will keep a close eye on central banks and the polls. Early indications are for some monetary easing, though there is a wide divergence on when that may occur. This year will also be one of the biggest for global elections. Including the U.S., Taiwan, India, Mexico, and expectations for the U.K., there will be nearly 40 national elections. That all but guarantees shifting fiscal policies as over 40% of the world’s population heads to the voting booths. With those influences beyond our control, we focus on how our portfolio companies plan to navigate this environment. Many showed improving fundamentals toward the end of 2023 that we expect to continue into 2024 and beyond. As bottom up investors, we seek underpinnings to near term valuations in the form of expected earnings growth and other business fundamentals. We continuously review the business models and management teams of current and potential holdings, and fine tune our own valuation models on an ongoing basis, as we endeavor to protect the assets you have entrusted with us. The views expressed represent the opinions of TimesSquare Capital Management, LLC as of December 31, 2023, and are not intended as a forecast or guarantee of future results, and are subject to change without notice. |
5
| | |
| | | AMG TimesSquare Small Cap Growth Fund Portfolio Manager’s Comments (continued) |
CUMULATIVE TOTAL RETURN PERFORMANCE
AMG TimesSquare Small Cap Growth Fund’s cumulative total return is based on the daily change in net asset value (NAV), and assumes that all dividends and distributions were reinvested. This graph compares a hypothetical $10,000 investment made in the AMG TimesSquare Small Cap Growth Fund’s Class N shares on December 31, 2013 to a $10,000 investment made in the Russell 2000® Growth Index for the same time period. The graph and table do not reflect the deduction of taxes that a shareholder would pay on a Fund distribution or redemption of shares. The listed returns for the Fund are net of expenses and the returns for the index exclude expenses. Total returns would have been lower had certain expenses not been reduced.
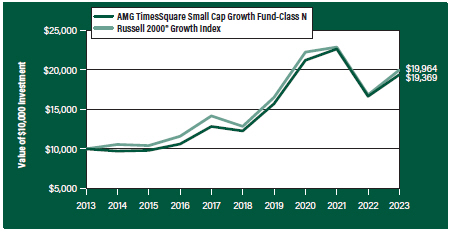
The table below shows the average annual total returns for the AMG TimesSquare Small Cap Growth Fund and the Russell 2000® Growth Index for the same time periods ended December 31, 2023.
| | | | | | | | | | | | | | | | | | | | |
| | | One | | | Five | | | Ten | | | Since | | | Inception | |
| Average Annual Total Returns1 | | Year | | | Years | | | Years | | | Inception | | | Date | |
AMG TimesSquare Small Cap Growth Fund2, 3, 4, 5, 6, 7, 8 | |
| | | | | |
Class N | | | 16.41 | % | | | 9.57 | % | | | 6.84% | | | | 8.47 | % | | | 01/21/00 | |
| | | | | |
Class I | | | 16.64 | % | | | 9.71 | % | | | — | | | | 8.67 | % | | | 02/24/17 | |
| | | | | |
Class Z | | | 16.73 | % | | | 9.80 | % | | | 7.07% | | | | 8.65 | % | | | 01/21/00 | |
| | | | | |
Russell 2000® Growth Index9 | | | 18.66 | % | | | 9.22 | % | | | 7.16% | | | | 5.12 | % | | | 01/21/00 | † |
The performance data shown represents past performance. Past performance is not a guarantee of future results. Current performance may be lower or higher than the performance data quoted. The investment return and principal value of an investment will fluctuate so that an investor’s shares, when redeemed, may be worth more or less than their original cost.
Investors should carefully consider the Fund’s investment objectives, risks, charges and expenses before investing. For performance information through the most recent month end, current net asset values per share for the Fund and other information, please call 800.548.4539 or visit our website at wealth.amg.com for a free prospectus. Read it carefully before investing or sending money.
Distributed by AMG Distributors, Inc., member FINRA/SIPC.
| † | Date reflects inception date of the Fund, not the index. |
| 1 | Total return equals income yield plus share price change and assumes reinvestment of all dividends and capital gain distributions. Returns are net of fees and may reflect offsets of Fund expenses as described in the prospectus. No adjustment has been made for taxes payable by shareholders on their reinvested dividends and |
|
capital gain distributions. Returns for periods greater than one year are annualized. The listed returns on the Fund are net of expenses and based on the published NAV as of December 31, 2023. All returns are in U.S. Dollars ($). 2 From time to time, the Fund’s Investment Manager has waived its fees and/or absorbed Fund expenses, which has resulted in higher returns. 3 The prices of equity securities of companies that are expected to experience relatively rapid earnings growth, or “growth stocks,” may be more sensitive to market movements because the prices tend to reflect future investor expectations rather than just current profits. 4 Issuers and companies that are in similar industry sectors may be similarly affected by particular economic or market events; to the extent the Fund has substantial holdings within a particular sector, the risks associated with that sector increase. 5 Market prices of investments held by the Fund may fall rapidly or unpredictably due to a variety of factors, including economic, political, or market conditions, or other factors including terrorism, war, natural disasters and the spread of infectious illness or other public health issues, including epidemics or pandemics, or in response to events that affect particular industries or companies. 6 Because the Fund is an actively managed investment portfolio, security selection or focus on securities in a particular style, market sector or group of companies may cause the Fund to incur losses or underperform relative to its benchmarks or other funds with a similar investment objective. There can be no guarantee that the Subadviser’s investment techniques and risk analysis will produce the desired result. 7 The stocks of small-capitalization companies often have greater price volatility, lower trading volume, and less liquidity than the stocks of larger, more established companies. 8 The Fund may not be able to dispose of particular investments, such as illiquid securities, readily at favorable times or prices or the Fund may have to sell them at a loss. 9 The Russell 2000® Growth Index measures the performance of the Russell 2000® companies with higher price-to-book ratios and higher forecasted growth values. Unlike the Fund, the Russell 2000® Growth Index is unmanaged, is not available for investment and does not incur expenses. The Russell 2000® Growth Index is a trademark of the London Stock Exchange Group companies. Not FDIC insured, nor bank guaranteed. May lose value. |
6
| | |
| | | AMG TimesSquare Small Cap Growth Fund Fund Snapshots (unaudited) December 31, 2023 |
PORTFOLIO BREAKDOWN
| | | | | |
| Sector | | % of
Net Assets |
| | |
Industrials | | 26.0 |
| | |
Information Technology | | 24.5 |
| | |
Health Care | | 16.7 |
| | |
Consumer Discretionary | | 8.3 |
| | |
Financials | | 8.0 |
| | |
Energy | | 4.4 |
| | |
Communication Services | | 3.6 |
| | |
Consumer Staples | | 2.8 |
| | |
Exchange Traded Funds | | 1.7 |
| | |
Real Estate | | 1.6 |
| | |
Materials | | 1.0 |
| | |
Short-Term Investments | | 2.5 |
| | |
Other Assets, less Liabilities | | (1.1) |
TOP TEN HOLDINGS
| | |
| Security Name | | % of Net Assets |
| | |
Casella Waste Systems, Inc., Class A | | 3.0 |
| | |
JFrog, Ltd. (Israel) | | 2.3 |
| | |
Hexcel Corp. | | 2.1 |
| | |
PowerSchool Holdings, Inc., Class A | | 2.1 |
| | |
Synaptics, Inc. | | 2.0 |
| | |
Esab Corp. | | 1.9 |
| | |
BJ’s Wholesale Club Holdings, Inc. | | 1.9 |
| | |
CyberArk Software, Ltd. (Israel) | | 1.9 |
| | |
Smartsheet, Inc., Class A | | 1.8 |
| | |
Vertex, Inc., Class A | | 1.8 |
| | |
| | | |
| | |
Top Ten as a Group | | 20.8 |
| | |
Because a fund’s strategy may result in multiple investments in particular sectors of the economy, its performance may depend on the performance of those sectors and may fluctuate more widely than investments diversified across more sectors. For additional information on these and other risk considerations, please see the Fund’s prospectus.
Any sectors, industries, or securities discussed should not be perceived as investment recommendations. Mention of a specific security should not be considered a recommendation to buy or solicitation to sell that security. Specific securities mentioned in this report may have been sold from the Fund’s portfolio of investments by the time you receive this report.
7
| | |
| | | AMG TimesSquare Small Cap Growth Fund Schedule of Portfolio Investments December 31, 2023 |
| | | | | | | | |
| | |
Shares | | | Value | |
| |
Common Stocks - 96.9% | | | | | |
| |
Communication Services - 3.6% | | | | | |
| | |
Bumble, Inc., Class A* | | | 112,500 | | | | $1,658,250 | |
| | |
IAC, Inc.* | | | 31,000 | | | | 1,623,780 | |
| | |
Integral Ad Science Holding Corp.* | | | 185,000 | | | | 2,662,150 | |
| | |
Total Communication Services | | | | | | | 5,944,180 | |
| | |
Consumer Discretionary - 8.3% | | | | | | | | |
| | |
Adtalem Global Education, Inc.* | | | 26,500 | | | | 1,562,175 | |
| | |
Boot Barn Holdings, Inc.* | | | 23,500 | | | | 1,803,860 | |
| | |
European Wax Center, Inc., Class A*,1 | | | 87,718 | | | | 1,192,088 | |
| | |
Global-e Online, Ltd. (Israel)* | | | 56,000 | | | | 2,219,280 | |
| | |
Savers Value Village, Inc.*,1 | | | 70,000 | | | | 1,216,600 | |
| | |
Topgolf Callaway Brands Corp.* | | | 97,400 | | | | 1,396,716 | |
| | |
Visteon Corp.* | | | 13,900 | | | | 1,736,110 | |
| | |
Warby Parker, Inc., Class A* | | | 49,700 | | | | 700,770 | |
| | |
Wingstop, Inc. | | | 7,600 | | | | 1,950,008 | |
| | |
Total Consumer Discretionary | | | | | | | 13,777,607 | |
| | |
Consumer Staples - 2.8% | | | | | | | | |
| | |
BJ’s Wholesale Club Holdings, Inc.* | | | 46,900 | | | | 3,126,354 | |
| | |
The Simply Good Foods Co.* | | | 38,500 | | | | 1,524,600 | |
| | |
Total Consumer Staples | | | | | | | 4,650,954 | |
| | |
Energy - 4.4% | | | | | | | | |
| | |
Cactus, Inc., Class A | | | 64,000 | | | | 2,905,600 | |
| | |
Magnolia Oil & Gas Corp., Class A | | | 75,300 | | | | 1,603,137 | |
| | |
Matador Resources Co. | | | 49,800 | | | | 2,831,628 | |
| | |
Total Energy | | | | | | | 7,340,365 | |
| | |
Financials - 8.0% | | | | | | | | |
| | |
AvidXchange Holdings, Inc.* | | | 154,000 | | | | 1,908,060 | |
| | |
Flywire Corp.* | | | 31,000 | | | | 717,650 | |
| | |
Hamilton Lane, Inc., Class A | | | 26,220 | | | | 2,974,397 | |
| | |
MVB Financial Corp. | | | 43,100 | | | | 972,336 | |
| | |
PJT Partners, Inc., Class A1 | | | 16,500 | | | | 1,680,855 | |
| | |
ProAssurance Corp. | | | 106,600 | | | | 1,470,014 | |
| | |
Safety Insurance Group, Inc. | | | 15,800 | | | | 1,200,642 | |
| | |
Victory Capital Holdings, Inc., Class A | | | 65,000 | | | | 2,238,600 | |
| | |
Total Financials | | | | | | | 13,162,554 | |
| | |
Health Care - 16.7% | | | | | | | | |
| | |
Addus HomeCare Corp.* | | | 22,000 | | | | 2,042,700 | |
| | |
Ascendis Pharma A/S, ADR (Denmark)* | | | 23,800 | | | | 2,997,610 | |
| | |
AtriCure, Inc.* | | | 72,900 | | | | 2,601,801 | |
| | |
Certara, Inc.* | | | 43,500 | | | | 765,165 | |
| | |
Day One Biopharmaceuticals, Inc.* | | | 135,900 | | | | 1,984,140 | |
| | |
HealthEquity, Inc.* | | | 22,600 | | | | 1,498,380 | |
| | | | | | | | |
| | |
Shares | | | Value | |
| | |
Intra-Cellular Therapies, Inc.* | | | 35,300 | | | | $2,528,186 | |
| | |
Krystal Biotech, Inc.* | | | 18,100 | | | | 2,245,486 | |
| | |
MoonLake Immunotherapeutics (Switzerland)*,1 | | | 35,300 | | | | 2,131,767 | |
| | |
Phreesia, Inc.* | | | 65,000 | | | | 1,504,750 | |
| | |
RAPT Therapeutics, Inc.* | | | 37,025 | | | | 920,071 | |
| | |
Shockwave Medical, Inc.* | | | 10,500 | | | | 2,000,880 | |
| | |
Treace Medical Concepts, Inc.* | | | 134,500 | | | | 1,714,875 | |
| | |
Xenon Pharmaceuticals, Inc. (Canada)* | | | 58,900 | | | | 2,712,934 | |
| | |
Total Health Care | | | | | | | 27,648,745 | |
| | |
Industrials - 26.0% | | | | | | | | |
| | |
ACV Auctions, Inc., Class A* | | | 106,000 | | | | 1,605,900 | |
| | |
Applied Industrial Technologies, Inc. | | | 5,100 | | | | 880,719 | |
| | |
The AZEK Co., Inc.* | | | 52,500 | | | | 2,008,125 | |
| | |
Casella Waste Systems, Inc., Class A* | | | 58,600 | | | | 5,007,956 | |
| | |
Comfort Systems USA, Inc. | | | 5,800 | | | | 1,192,886 | |
| | |
Driven Brands Holdings, Inc.* | | | 108,000 | | | | 1,540,080 | |
| | |
EMCOR Group, Inc. | | | 13,500 | | | | 2,908,305 | |
| | |
Esab Corp. | | | 36,700 | | | | 3,178,954 | |
| | |
Exponent, Inc. | | | 34,000 | | | | 2,993,360 | |
| | |
Hexcel Corp. | | | 46,400 | | | | 3,422,000 | |
| | |
ICF International, Inc. | | | 10,100 | | | | 1,354,309 | |
| | |
ITT, Inc. | | | 14,000 | | | | 1,670,480 | |
| | |
Marten Transport, Ltd. | | | 90,000 | | | | 1,888,200 | |
| | |
Paycor HCM, Inc.* | | | 62,400 | | | | 1,347,216 | |
| | |
RBC Bearings, Inc.*,1 | | | 5,932 | | | | 1,689,967 | |
| | |
Regal Rexnord Corp. | | | 19,200 | | | | 2,841,984 | |
| | |
Saia, Inc.* | | | 1,300 | | | | 569,686 | |
| | |
Tetra Tech, Inc. | | | 15,400 | | | | 2,570,722 | |
| | |
WillScot Mobile Mini Holdings Corp.* | | | 35,900 | | | | 1,597,550 | |
| | |
WNS Holdings, Ltd., ADR (India)* | | | 42,000 | | | | 2,654,400 | |
| | |
Total Industrials | | | | | | | 42,922,799 | |
| | |
Information Technology - 24.5% | | | | | | | | |
| | |
Allegro MicroSystems, Inc.* | | | 28,000 | | | | 847,560 | |
| | |
Clearwater Analytics Holdings, Inc., Class A* | | | 129,000 | | | | 2,583,870 | |
| | |
Cohu, Inc.* | | | 60,000 | | | | 2,123,400 | |
| | |
CyberArk Software, Ltd. (Israel)* | | | 14,000 | | | | 3,066,700 | |
| | |
FormFactor, Inc.* | | | 31,500 | | | | 1,313,865 | |
| | |
HashiCorp, Inc., Class A* | | | 58,900 | | | | 1,392,396 | |
| | |
JFrog, Ltd. (Israel)* | | | 111,000 | | | | 3,841,710 | |
| | |
Kulicke & Soffa Industries, Inc. (Singapore) | | | 51,000 | | | | 2,790,720 | |
| | |
MACOM Technology Solutions Holdings, Inc.* | | | 20,000 | | | | 1,859,000 | |
| | |
Onto Innovation, Inc.* | | | 13,500 | | | | 2,064,150 | |
| | |
PowerSchool Holdings, Inc., Class A*,1 | | | 144,000 | | | | 3,392,640 | |
The accompanying notes are an integral part of these financial statements.
8
| | |
| | | AMG TimesSquare Small Cap Growth Fund Schedule of Portfolio Investments (continued) |
| | | | | | | | |
| | |
Shares | | | Value | |
| | |
Information Technology - 24.5%
(continued) | | | | | | | | |
| | |
Q2 Holdings, Inc.* | | | 37,700 | | | | $1,636,557 | |
| | |
Smartsheet, Inc., Class A* | | | 64,000 | | | | 3,060,480 | |
| | |
Sprout Social, Inc., Class A*,1 | | | 21,000 | | | | 1,290,240 | |
| | |
Synaptics, Inc.* | | | 28,500 | | | | 3,251,280 | |
| | |
Vertex, Inc., Class A* | | | 112,000 | | | | 3,017,280 | |
| | |
Workiva, Inc.* | | | 28,502 | | | | 2,893,808 | |
| | |
Total Information Technology | | | | | | | 40,425,656 | |
| | |
Materials - 1.0% | | | | | | | | |
| | |
Avient Corp. | | | 40,500 | | | | 1,683,585 | |
| | |
Real Estate - 1.6% | | | | | | | | |
| | |
National Storage Affiliates Trust, REIT | | | 64,000 | | | | 2,654,080 | |
| |
Total Common Stocks | | | | | |
(Cost $135,217,055) | | | | | | | 160,210,525 | |
| | |
Exchange Traded Funds - 1.7% | | | | | | | | |
| | |
iShares Russell 2000 Growth ETF
(Cost $2,766,924) | | | 11,500 | | | | 2,900,530 | |
| | |
| | | Principal
Amount | | | | |
| |
Short-Term Investments - 2.5% | | | | | |
| |
Joint Repurchase Agreements - 1.2%2 | | | | | |
| | |
Daiwa Capital Markets America, dated 12/29/23, due 01/02/24, 5.380% total to be received $1,000,598 (collateralized by various U.S. Government Agency Obligations and U.S. Treasuries, 0.000% - 7.500%, 03/22/24 - 01/01/54, totaling $1,020,123) | | | $1,000,000 | | | | 1,000,000 | |
| | | | | | | | |
| | | Principal
Amount | | | Value | |
| | |
Deutsche Bank Securities, Inc., dated 12/29/23, due 01/02/24, 5.350% total to be received $20,787 (collateralized by various U.S. Government Agency Obligations, 2.000% -6.500%, 09/01/46 - 06/01/62, totaling $21,191) | | | $20,775 | | | | $20,775 | |
| | |
RBC Dominion Securities, Inc., dated 12/29/23, due 01/02/24, 5.340% total to be received $1,000,593 (collateralized by various U.S. Government Agency Obligations and U.S. Treasuries, 0.000% - 7.500%, 01/15/24 -12/01/53, totaling $1,020,000) | | | 1,000,000 | | | | 1,000,000 | |
| |
Total Joint Repurchase Agreements | | | | 2,020,775 | |
| | |
| | | Shares | | | | |
| |
Other Investment Companies - 1.3% | | | | | |
| | |
Dreyfus Government Cash Management Fund, Institutional Shares, 5.25%3 | | | 837,739 | | | | 837,739 | |
| | |
Dreyfus Institutional Preferred Government Money Market Fund, Institutional Shares, 5.32%3 | | | 1,256,608 | | | | 1,256,608 | |
| |
Total Other Investment Companies | | | | 2,094,347 | |
| |
Total Short-Term Investments | | | | | |
(Cost $4,115,122) | | | | | | | 4,115,122 | |
| |
Total Investments - 101.1% | | | | | |
(Cost $142,099,101) | | | | | | | 167,226,177 | |
| |
Other Assets, less Liabilities - (1.1)% | | | | (1,873,610 | ) |
| |
Net Assets - 100.0% | | | | $165,352,567 | |
| * | Non-income producing security. |
| 1 | Some of these securities, amounting to $8,292,535 or 5.0% of net assets, were out on loan to various borrowers and are collateralized by cash and various U.S. Treasury Obligations. See Note 4 of Notes to Financial Statements. |
| 2 | Cash collateral received for securities lending activity was invested in these joint repurchase agreements. |
| 3 | Yield shown represents the December 31, 2023, seven day average yield, which refers to the sum of the previous seven days’ dividends paid, expressed as an annual percentage. |
|
ADR American Depositary Receipt |
ETF Exchange Traded Fund |
| REIT Real Estate Investment Trust |
The accompanying notes are an integral part of these financial statements.
9
| | |
| | | AMG TimesSquare Small Cap Growth Fund Schedule of Portfolio Investments (continued) |
The following table summarizes the inputs used to value the Fund’s investments by the fair value hierarchy levels as of December 31, 2023:
| | | | | | | | | | | | | | | | |
| | | Level 1 | | | Level 2 | | | Level 3 | | | Total | |
| | | | |
Investments in Securities | | | | | | | | | | | | | | | | |
| | | | |
Common Stocks† | | $ | 160,210,525 | | | | — | | | | — | | | $ | 160,210,525 | |
| | | | |
Exchange Traded Funds | | | 2,900,530 | | | | — | | | | — | | | | 2,900,530 | |
| | | | |
Short-Term Investments | | | | | | | | | | | | | | | | |
| | | | |
Joint Repurchase Agreements | | | — | | | $ | 2,020,775 | | | | — | | | | 2,020,775 | |
| | | | |
Other Investment Companies | | | 2,094,347 | | | | — | | | | — | | | | 2,094,347 | |
| | | | | | | | | | | | | | | | |
| | | | |
Total Investments in Securities | | $ | 165,205,402 | | | $ | 2,020,775 | | | | — | | | $ | 167,226,177 | |
| | | | | | | | | | | | | | | | |
| † | All common stocks held in the Fund are Level 1 securities. For a detailed breakout of common stocks by major industry classification, please refer to the Fund’s Schedule of Portfolio Investments. |
For the fiscal year ended December 31, 2023, there were no transfers in or out of Level 3.
The accompanying notes are an integral part of these financial statements.
10
| | |
| | | AMG TimesSquare Mid Cap Growth Fund Portfolio Manager’s Comments (unaudited) |
| | | |
| | | |
| | | | |
The Year In Review For the year ended December 31, 2023, AMG TimesSquare Mid Cap Growth Fund (the “Fund”) Class N shares returned 24.82%, while its benchmark, the Russell Midcap® Growth Index, returned 25.87%. 2023 started off with a rollercoaster ride for global equity markets in the first quarter, followed by a steady climb in the second quarter, a decline in the third quarter, and ended the year with a strong rebound in the fourth quarter. The fourth quarter rebound was bolstered by central banks pausing rates increases, but it may be premature to declare victory over inflation and plot a near-term pivot to monetary easing. That speculation led to a rally benefiting global equities—especially small & microcaps and emerging markets. Concerns surrounding wage inflation and access to skilled workers generally subsided across markets, with the notable exception of Japan where that remains a significant challenge. Most factors finished the year in positive territory. However, it was Beta that significantly outpaced other style factors in 2023. Among U.S. small to mid cap growth stocks better performance was found in the information technology, industrials, and consumer discretionary sectors. Utilities and energy generally lagged. As our investment team meets with companies, reviews recent earnings reports, and surveys the global landscape, they note several investment dynamics that inform our positioning: • Technology: Cybersecurity remains a top priority for companies, propelled by recent well publicized cyberattacks and new SEC disclosure rules on cyber risks that took effect in December 2023. Our channel checks indicate that information technology (IT) budgets will continue growing, with cybersecurity becoming an increasing percentage. Interest continues to grow in machine learning and generative artificial intelligence (AI) tools and applications, though companies approach this area cautiously given the costs and fast paced changes. • Industrials: Many years of prior underinvestment leave significant ground to recover that recent government programs have only begun to address. Industrial capital expenditures may continue to be a bright spot for several years as structural labor challenges are addressed with greater automation and supply chains move closer to home, particularly away from China. | | • China: Localization and import substitution are major trends, either due to geopolitical concerns in the case of the technology industry, or trading down to cheaper domestic products due to consumer weakness. Meanwhile, both Chinese and multinational companies continue to seek other manufacturing centers in the region, or re-shore them completely, which should benefit Southeast Asia, Mexico, and India. Fund Performance Review Amid this environment, the Fund performed behind the Russell Midcap® Growth Index for the full year. The Fund experienced mixed performance across sectors. Relative weakness was found in consumer discretionary, industrials, financials, and real estate. This was partially offset by strength in health care, information technology, materials, and energy. In consumer-oriented sectors, we lean toward value-oriented or specialty retailers, franchise models, as well as premium brands. In our view, the timeshare space represents a better investment option to hotels due to the annual maintenance fee requirement from customers/owners. Another driver has been an increase in leisure travel post-pandemic. These were the underpinnings to the thesis for Marriott Vacations Worldwide, a timeshare and resort property management company. We held the stock up until their second quarter earnings report. The combination of weak results and lower forward guidance caused us to exit the position, which was down -16% for the time it was held during the year. Aptiv Plc designs and manufactures vehicle components focused on electronics and vehicle safety. The United Auto Workers’ strike, which occurred in the fall, had an adverse impact on demand for the company’s products, causing its stock to slide by -4%. We trimmed the position in the latter part of the year. Tractor Supply Co. is the largest retailer in the U.S. focused on the farm and ranch market, with over 2,000 stores. Customer service is a strong differentiator with knowledgeable sales staff. They have an extensive mix of products to care for home, land, pets, and animals. During the year, results were impacted by adverse weather conditions and economic headwinds that hampered consumer spending. This caused a -3% pullback in Tractor Supply. Turning to positives, shares of Floor & Decor Holdings gained 60%. They operate as a multi channel specialty retailer of hard surface flooring and related accessories. The company enjoys a | | strong position in a fragmented market. While it was aided by meaningful enrollment increases in its Premier rewards program (PRO), higher interest rates impacted the housing market and associated businesses. Of note, gross margins have improved along with lower supply chain costs. Brunswick, a manufacturer of recreational marine products including boats and engines, surged ahead by 37%. Management, while acknowledging a tough industry backdrop, remains upbeat about the long-term prospects for their business. Premium level customers remain resilient as evidenced by sales at a recent boat show. There was strong demand for Boston Whaler and Sea Ray boats and Mercury propulsion systems. There are also healthy usage trends in its Freedom Boat Club. Value-oriented consumers are demonstrating hesitancy around purchases as they are more sensitive to rising interest rates. In the industrials sector, we gravitate toward business service companies, those focused on automation and efficiency improvements, and essential infrastructure services. Paylocity Holding offers cloud-based human capital management and payroll software solutions. Its results were steady for most of the year up its their fiscal first quarter earnings report. In that early November release, management noted weakness with existing client headcounts and prompted fears among investors. That in turn triggered a 15% selloff. Booz Allen Hamilton Holding is a management and technology consulting services provider to U.S. government departments and agencies. We decided to exit the position, which was down -11% while we held it during the first quarter. While recent revenues and earnings were in line with expectations, delays in some large orders caused us to reassess the position and exit. Better performance was found in some of our business service companies. Copart, a provider of online auctions and vehicle remarketing, rallied 61%. These services are offered to insurance companies, rental car companies, local municipalities, financial institutions, and charities. There has been a continued pickup in total loss frequency for vehicles as repair costs remain high and used car pricing has declined. Cintas supplies uniforms and facilities services to approximately one million customers. The current penetration rate for ancillary products and services within the company’s uniform rental customer base is less than 20%. This implies a runway for growth. Customer |
11
| | |
| | | AMG TimesSquare Mid Cap Growth Fund Portfolio Manager’s Comments (continued) |
| | | |
| | | |
| | | | |
retention remains slightly above 95%. Operating margin has expanded due to higher utilization, route density, improved supply chain capabilities, and cost controls. The latest quarter exceeded expectations. This included beats to revenues and earnings estimates, as well as an increase in forward guidance. These developments lifted the stock of Cintas by 35% for the year. Verisk Analytics supplies data analytics solutions to the insurance industry. Its latest quarter represented the third consecutive period of higher-than-expected growth across Underwriting and Claims. That served to boost its shares by 36%. Verisk is focused on adding deeper and more extensive data to its products. Management believes its highly proprietary data assets position the company to capitalize on the benefits of AI and generative AI. In financials, we prefer well placed insurance companies and niche businesses while tending to avoid banks which face credit deterioration and rising deposit costs. The troubles for Silicon Valley Bank weighed on the rest of the banking industry, including our position in Signature Bank, a commercial bank serving businesses and private clients, predominantly in the New York metropolitan area. As concerns grew in early March about potential deposit outflows, we sold our remaining shares. Signature’s share price fell -35% during the first quarter while we owned it, though we exited before regulators closed the bank. Nasdaq operates as a technology company that serves capital markets and other industries worldwide. Earnings outpaced consensus estimates due to the combination of stronger revenues and lower operating expenses. We decided to sell out of the position due to the upcoming close on their Adenza acquisition. We question the merits of this deal and prefer to watch from the sidelines for the time being. Nasdaq’s shares dropped by -17% before we liquidated the position during the fourth quarter. Turning to credits, TPG operates as an alternative asset manager. Third quarter earnings were well above Street estimates, driven by management and performance fees. During the year they acquired Angelo Gordon. This significantly expands their product offering. Angelo Gordon is a well established and successful manager of private credit and real estate. TPG’s legacy business includes private equity, credit, growth equity, impact investing, real estate, public market solutions, and capital markets services. This deal along with a more bullish outlook for fundraising in 2024 lifted its shares by 62%. Brown & Brown, a marketer of insurance products and services, gained 26%. Its business lines include | | Retail, National Programs, Wholesale Brokerage, and Services. The latest quarter’s results included growth, with strong new business and retention across Retail, National Programs, and Wholesale. Its Services segment was driven by an increase in claims processing revenues. Within real estate, SBA Communications is a leading independent owner and operator of wireless communications infrastructure including towers and distributed antenna systems. We sold the stock during the third quarter due to interest rate sensitivity tied to its levered balance sheet and a slower-than-expected ramp in 5G spending by some wireless carriers. The stock tumbled by -21% while we owned it this year. Our preference within health care is for novel therapies to address unmet medical needs, specialized providers, and innovators. Envista Holdings develops and manufactures dental products. We exited the position during the fourth quarter on the combination of disappointing third quarter results and lowered forward guidance. They reported softness in adult orthodontics and high end implants. Its stock sold off by -32% while it was held during the year. Royalty Pharma Plc, a buyer of drug therapy royalties and funder of innovation in the biopharmaceutical space, declined by -31%. The stock has not been given credit for its differentiated business model and additions to its royalty stream. We decided to sell out of the position during the third quarter and potentially revisit Royalty Pharma in the future. Shockwave Medical is a medical device company that utilizes intravascular lithotripsy technology for treating calcified plaque in patients suffering from coronary disease. The company is well positioned and continues to expand its product offerings. It appears the stock has been caught up in the market’s medical technology unwind. While third quarter results were in line with expectations, management did not raise guidance for the first time since the pandemic. Two headwinds impaired the outlook: private insurers are increasing the need for preauthorization for treating peripheral arterial disease and the China anti corruption campaign is impacting restocking in their joint venture. Shockwave was added to the Fund in the third quarter and its shares lost -29% since then. The stock was sold in the fourth quarter. Better was the 36% return for IDEXX Laboratories. They develop, manufacture, and distribute products and services for veterinary, livestock, poultry, and dairy markets. Results were solid up until the third quarter. In that period, revenues missed estimates on weaker | | clinical veterinarian visits in the companion animal segment. Clinical vet visit softness was not entirely unexpected this quarter given publicly available VetSource data and management expects this to improve as capacity constraints ease. Operating margins improved. Pharmaceutical product distributor Cencora climbed 25%. It consistently posted strong results. Its mix is heavily weighted to specialty drugs and that continues to drive above market growth. The increased interest in GLP 1 (Glucagon-like peptide 1) drugs also served to benefit Cencora’s revenues, but they are a slight drag on operating margins due to the refrigeration requirement for shipping. During the third quarter, DexCom was added to the Fund. This is a medical device company focused on the design and development of continuous glucose monitoring systems. While GLP 1 drugs can help with weight loss, individuals with type 1 diabetes would remain insulin dependent. We used share price weakness as an opportunity to initiate the position. The stock rose 19% since then. Across the IT universe, we seek companies possessing differentiated capabilities, products, and services. Palo Alto Networks was the leading contributor for the year with its 111% return. This company supplies cybersecurity solutions worldwide. Revenues and earnings were continually higher than expected, although in the latter part of the year they fell short on billings growth. Management stressed that they are not seeing any change in the demand environment and that pipeline visibility remains high. Higher interest rates may well mean that customers are less willing to sign multi-year contracts. CrowdStrike Holdings, a provider of cybersecurity products and services to stop network breaches, jumped 142%. Its results were consistently solid throughout the year. Management noted increased momentum driven by strong product platform leading to vendor consolidation opportunities and go-to-market partnerships with Amazon, Dell, and others. Sales reps from the hiring spree 9 to 12 months ago have fully ramped up, and that further supports expectations. Annualized recurring revenues have accelerated. Synopsys provides electronic design automation software products used to design and test integrated circuits. The company continually has delivered quarterly results that were above the guidance and consensus range. Operating margins expanded. EDA (electronic design automation) and IP (intellectual property) solutions continue to be key growth drivers for the company and the momentum |
12
| | |
| | | AMG TimesSquare Mid Cap Growth Fund Portfolio Manager’s Comments (continued) |
| | | |
| | | |
| | | | |
is clearly sustaining into 2024. Its shares advanced 61%. Synopsys is well positioned to benefit from increasing complexity of AI chip development. Keysight Technologies supplies electronic design and test solutions to the communications, networking, aerospace, defense, automotive, energy, and semiconductor industries. We decided to sell the stock during the fourth quarter with the ongoing malaise in the telecommunications industry. That end market lacks visibility, and near-term estimates are being cut. Nevertheless, Keysight’s shares were down (28)% for the time the position was held. We used share price weakness to add HashiCorp during the third quarter. It provides multi-cloud infrastructure automation solutions and is well positioned to benefit long term from a myriad of secular tailwinds and architectural shifts in software. These include increasing adoption of infrastructure automation tools, sustained growth in the pace of applications development, and ongoing shifts of workloads to the cloud. In December, it reported fiscal third quarter results. Revenues beat estimates, but short-term bookings derived from backlog were soft and current subscription billings slowed. That caused an -18% pullback. Within materials we seek well positioned companies that are less susceptible to swings in commodity prices. FMC is an agricultural sciences company offering solutions in areas such as crop protection, plant health, professional pest, and turf management. Although the company’s outlook on revenues improved in the first quarter results, there were concerns surrounding FMC’s ability to recover | | from past margin weakness. That combination was repeated, with management counting on a significant upturn in the second half to meet its unflinching outlook for the year. In our view, this is too optimistic, and we sold our remaining shares during the second quarter, with the stock falling -13% for the time it was held. Martin Marietta Materials, a supplier of aggregates to the construction industry, surged ahead by 49%. Its third quarter included higher-than-expected earnings with inline revenues. Across its product lineup aggregate volumes declined, cement volumes were flat, ready mix volumes were up, and asphalt volumes were up. Its profit guidance was also increased. The company is well positioned to benefit from increased infrastructure spending measures including the Inflation Reduction Act and state highway programs. We often see the ebb and flow of the energy sector tied to underlying commodity prices. In this area we seek low cost exploration and production companies with high yielding acreage or specialized service providers. Antero Resources is an exploration and production company with operations in the Appalachian Basin. We sold out of the position in the second quarter due to continued deterioration of the U.S. natural gas market inclusive of pricing and declining rig count. Its shares slid -29% for the time it was held. Moving in the opposite direction with its 15% return was Cheniere Energy. This energy infrastructure company operates liquefied natural gas (“LNG”) terminals in Louisiana and Texas. Third quarter results were solid with lower-than-anticipated levels of expected capital | | expenditures, and management maintained full year guidance. Two important business drivers for its business include increased use of LNG as it represents a cleaner alternative to coal, and the export of LNG to areas such as Europe in their search for alternative energy sources. Looking forward into 2024, markets will keep a close eye on central banks and the polls. Early indications are for some monetary easing, though there is a wide divergence on when that may occur. This year will also be one of the biggest for global elections. Including the U.S., Taiwan, India, Mexico, and expectations for the U.K., there will be nearly 40 national elections. That all but guarantees shifting fiscal policies as over 40% of the world’s population heads to the voting booths. With those influences beyond our control, we focus on how our portfolio companies plan to navigate this environment. Many showed improving fundamentals toward the end of 2023 that we expect to continue into 2024 and beyond. As bottom up investors, we seek underpinnings to near term valuations in the form of expected earnings growth and other business fundamentals. We continuously review the business models and management teams of current and potential holdings, and fine tune our own valuation models on an ongoing basis, as we endeavor to protect the assets you have entrusted with us. The views expressed represent the opinions of TimesSquare Capital Management, LLC as of December 31, 2023, and are not intended as a forecast or guarantee of future results, and are subject to change without notice. |
13
|
AMG TimesSquare Mid Cap Growth Fund Portfolio Manager’s Comments (continued) |
CUMULATIVE TOTAL RETURN PERFORMANCE
AMG TimesSquare Mid Cap Growth Fund’s cumulative total return is based on the daily change in net asset value (NAV), and assumes that all dividends and distributions were reinvested. This graph compares a hypothetical $10,000 investment made in the AMG TimesSquare Mid Cap Growth Fund’s Class N shares on December 31, 2013 to a $10,000 investment made in the Russell Midcap® Growth Index for the same time period. The graph and table do not reflect the deduction of taxes that a shareholder would pay on a Fund distribution or redemption of shares. The listed returns for the Fund are net of expenses and the returns for the index exclude expenses. Total returns would have been lower had certain expenses not been reduced.
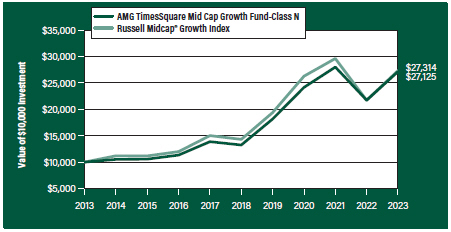
The table below shows the average annual total returns for the AMG TimesSquare Mid Cap Growth Fund and the Russell Midcap® Growth Index for the same time periods ended December 31, 2023.
| | | | | | | | | | | | | | | | | | | | |
| | | One | | | Five | | | Ten | | | Since | | | Inception | |
| Average Annual Total Returns1 | | Year | | | Years | | | Years | | | Inception | | | Date | |
| | |
AMG TimesSquare Mid Cap Growth Fund2, 3, 4, 5, 6, 7 | | | | | | | | | |
| | | | | |
Class N | | | 24.82 | % | | | 15.43 | % | | | 10.49% | | | | 10.49% | | | | 03/04/05 | |
| | | | | |
Class I | | | 24.94 | % | | | 15.59 | % | | | — | | | | 12.73% | | | | 02/24/17 | |
| | | | | |
Class Z | | | 25.03 | % | | | 15.66 | % | | | 10.72% | | | | 10.70% | | | | 03/04/05 | |
| | | | | |
Russell Midcap® Growth Index8 | | | 25.87 | % | | | 13.81 | % | | | 10.57% | | | | 9.93% | | | | 03/04/05 | † |
The performance data shown represents past performance. Past performance is not a guarantee of future results. Current performance may be lower or higher than the performance data quoted. The investment return and principal value of an investment will fluctuate so that an investor’s shares, when redeemed, may be worth more or less than their original cost.
Investors should carefully consider the Fund’s investment objectives, risks, charges and expenses before investing. For performance information through the most recent month end, current net asset values per share for the Fund and other information, please call 800.548.4539 or visit our website at wealth.amg.com for a free prospectus. Read it carefully before investing or sending money.
Distributed by AMG Distributors, Inc., member FINRA/SIPC.
† Date reflects inception date of the Fund, not the index.
| 1 | Total return equals income yield plus share price change and assumes reinvestment of all dividends and capital gain distributions. Returns are net of fees and may reflect offsets of Fund expenses as described in the prospectus. No adjustment has been made for taxes payable by shareholders on their reinvested dividends and |
|
capital gain distributions. Returns for periods greater than one year are annualized. The listed returns on the Fund are net of expenses and based on the published NAV as of December 31, 2023. All returns are in U.S. Dollars ($). 2 From time to time, the Fund’s Investment Manager has waived its fees and/or absorbed Fund expenses, which has resulted in higher returns. 3 The prices of equity securities of companies that are expected to experience relatively rapid earnings growth, or “growth stocks,” may be more sensitive to market movements because the prices tend to reflect future investor expectations rather than just current profits. 4 Issuers and companies that are in similar industry sectors may be similarly affected by particular economic or market events; to the extent the Fund has substantial holdings within a particular sector, the risks associated with that sector increase. 5 Market prices of investments held by the Fund may fall rapidly or unpredictably due to a variety of factors, including economic, political, or market conditions, or other factors including terrorism, war, natural disasters and the spread of infectious illness or other public health issues, including epidemics or pandemics, or in response to events that affect particular industries or companies. 6 Because the Fund is an actively managed investment portfolio, security selection or focus on securities in a particular style, market sector or group of companies may cause the Fund to incur losses or underperform relative to its benchmarks or other funds with a similar investment objective. There can be no guarantee that the Subadviser’s investment techniques and risk analysis will produce the desired result. 7 The stocks of mid-capitalization companies often have greater price volatility, lower trading volume, and less liquidity than the stocks of larger, more established companies. 8 The Russell Midcap® Growth Index measures the performance of those Russell Midcap® companies with higher price/book ratios and higher forecasted growth values. The stocks are also members of the Russell 1000® Growth Index. Unlike the Fund, the Russell Midcap® Growth Index is unmanaged, is not available for investment and does not incur expenses. The Russell Midcap® Growth Index is a trademark of the London Stock Exchange Group companies. Not FDIC insured, nor bank guaranteed. May lose value. |
14
| | |
| | | AMG TimesSquare Mid Cap Growth Fund Fund Snapshots (unaudited) December 31, 2023 |
PORTFOLIO BREAKDOWN
| | | | | |
| Sector | | % of Net Assets |
| | |
Information Technology | | | | 28.9 | |
| | |
Industrials | | | | 20.3 | |
| | |
Health Care | | | | 18.9 | |
| | |
Consumer Discretionary | | | | 10.8 | |
| | |
Financials | | | | 7.3 | |
| | |
Communication Services | | | | 3.4 | |
| | |
Energy | | | | 3.2 | |
| | |
Materials | | | | 2.3 | |
| | |
Consumer Staples | | | | 1.5 | |
| | |
Real Estate | | | | 1.4 | |
| | |
Short-Term Investments | | | | 3.2 | |
| | |
Other Assets, less Liabilities | | | | (1.2 | ) |
TOP TEN HOLDINGS
| | | | | |
| Security Name | | % of Net Assets |
| | |
Cintas Corp. | | | | 2.8 | |
| | |
O’Reilly Automotive, Inc. | | | | 2.5 | |
| | |
Crowdstrike Holdings, Inc., Class A | | | | 2.4 | |
| | |
Gartner, Inc. | | | | 2.4 | |
| | |
Cencora, Inc. | | | | 2.4 | |
| | |
Waste Connections, Inc. (Canada) | | | | 2.3 | |
| | |
Chemed Corp. | | | | 2.1 | |
| | |
Cheniere Energy, Inc. | | | | 2.1 | |
| | |
Dexcom, Inc. | | | | 2.1 | |
| | |
Veeva Systems, Inc., Class A | | | | 2.1 | |
| | |
| | | | | | |
| | |
Top Ten as a Group | | | | 23.2 | |
| | | | | |
Because a fund’s strategy may result in multiple investments in particular sectors of the economy, its performance may depend on the performance of those sectors and may fluctuate more widely than investments diversified across more sectors. For additional information on these and other risk considerations, please see the Fund’s prospectus.
Any sectors, industries, or securities discussed should not be perceived as investment recommendations. Mention of a specific security should not be considered a recommendation to buy or solicitation to sell that security. Specific securities mentioned in this report may have been sold from the Fund’s portfolio of investments by the time you receive this report.
15
| | |
| | | AMG TimesSquare Mid Cap Growth Fund Schedule of Portfolio Investments December 31, 2023 |
| | | | | | | | |
| | |
| | |
Shares | | | Value | |
| | |
Common Stocks - 98.0% | | | | | | | | |
| |
Communication Services - 3.4% | | | | | |
| | |
IAC, Inc.* | | | 254,500 | | | | $13,330,710 | |
| | |
Pinterest, Inc., Class A* | | | 558,400 | | | | 20,683,136 | |
| | |
Take-Two Interactive Software, Inc.* | | | 62,300 | | | | 10,027,185 | |
| | |
Total Communication Services | | | | | | | 44,041,031 | |
| | |
Consumer Discretionary - 10.8% | | | | | | | | |
| | |
Aptiv PLC (Ireland)* | | | 97,200 | | | | 8,720,784 | |
| | |
Brunswick Corp. | | | 197,500 | | | | 19,108,125 | |
| | |
Five Below, Inc.* | | | 56,300 | | | | 12,000,908 | |
| | |
Floor & Decor Holdings, Inc., Class A*,1 | | | 133,200 | | | | 14,859,792 | |
| | |
O’Reilly Automotive, Inc.* | | | 34,000 | | | | 32,302,720 | |
| | |
Pool Corp. | | | 43,275 | | | | 17,254,175 | |
| | |
Ross Stores, Inc. | | | 182,600 | | | | 25,270,014 | |
| | |
Tractor Supply Co. | | | 46,300 | | | | 9,955,889 | |
| | |
Total Consumer Discretionary | | | | | | | 139,472,407 | |
| | |
Consumer Staples - 1.5% | | | | | | | | |
| | |
BJ’s Wholesale Club Holdings, Inc.* | | | 291,900 | | | | 19,458,054 | |
| | |
Energy - 3.2% | | | | | | | | |
| | |
Cheniere Energy, Inc. | | | 162,200 | | | | 27,689,162 | |
| | |
Pioneer Natural Resources Co. | | | 62,100 | | | | 13,965,048 | |
| | |
Total Energy | | | | | | | 41,654,210 | |
| | |
Financials - 7.3% | | | | | | | | |
| | |
Brown & Brown, Inc. | | | 156,300 | | | | 11,114,493 | |
| | |
Interactive Brokers Group, Inc., Class A | | | 233,200 | | | | 19,332,280 | |
| | |
RenaissanceRe Holdings, Ltd. (Bermuda) | | | 122,200 | | | | 23,951,200 | |
| | |
TPG, Inc. | | | 566,320 | | | | 24,448,034 | |
| | |
WEX, Inc.* | | | 78,100 | | | | 15,194,355 | |
| | |
Total Financials | | | | | | | 94,040,362 | |
| | |
Health Care - 18.9% | | | | | | | | |
| | |
Argenx SE, ADR (Netherlands)* | | | 32,050 | | | | 12,192,781 | |
| | |
Ascendis Pharma A/S, ADR (Denmark)* | | | 126,800 | | | | 15,970,460 | |
| | |
Cencora, Inc. | | | 148,400 | | | | 30,478,392 | |
| | |
Charles River Laboratories International, Inc.* | | | 8,600 | | | | 2,033,040 | |
| | |
Chemed Corp. | | | 47,425 | | | | 27,731,769 | |
| | |
Dexcom, Inc.* | | | 220,400 | | | | 27,349,436 | |
| | |
Encompass Health Corp. | | | 286,500 | | | | 19,115,280 | |
| | |
ICON PLC (Ireland)* | | | 58,300 | | | | 16,502,981 | |
| | |
IDEXX Laboratories, Inc.* | | | 45,000 | | | | 24,977,250 | |
| | |
Legend Biotech Corp., ADR * | | | 287,292 | | | | 17,286,360 | |
| | |
Repligen Corp.*,1 | | | 58,106 | | | | 10,447,459 | |
| | |
Stevanato Group S.P.A. (Italy) | | | 501,045 | | | | 13,673,518 | |
| | | | | | | | |
| | |
| | |
Shares | | | Value | |
| | |
Veeva Systems, Inc., Class A* | | | 139,485 | | | | $26,853,652 | |
| | |
Total Health Care | | | | | | | 244,612,378 | |
| | |
Industrials - 20.3% | | | | | | | | |
| | |
AMETEK, Inc. | | | 111,800 | | | | 18,434,702 | |
| | |
Carlisle Cos., Inc. | | | 56,800 | | | | 17,746,024 | |
| | |
Cintas Corp. | | | 60,300 | | | | 36,340,398 | |
| | |
Copart, Inc.* | | | 191,900 | | | | 9,403,100 | |
| | |
EMCOR Group, Inc. | | | 62,938 | | | | 13,558,733 | |
| | |
Equifax, Inc. | | | 52,300 | | | | 12,933,267 | |
| | |
GFL Environmental, Inc. (Canada) | | | 441,304 | | | | 15,229,401 | |
| | |
Hexcel Corp. | | | 236,000 | | | | 17,405,000 | |
| | |
Nordson Corp. | | | 40,000 | | | | 10,566,400 | |
| | |
Paylocity Holding Corp.* | | | 73,600 | | | | 12,132,960 | |
| | |
Rockwell Automation, Inc. | | | 56,500 | | | | 17,542,120 | |
| | |
Saia, Inc.* | | | 27,220 | | | | 11,928,349 | |
| | |
Verisk Analytics, Inc., Class A | | | 100,000 | | | | 23,886,000 | |
| | |
Waste Connections, Inc. (Canada) | | | 201,775 | | | | 30,118,954 | |
| | |
Watsco, Inc. | | | 36,300 | | | | 15,553,461 | |
| | |
Total Industrials | | | | | | | 262,778,869 | |
| | |
Information Technology - 28.9% | | | | | | | | |
| | |
Amphenol Corp., Class A | | | 237,400 | | | | 23,533,462 | |
| | |
Aspen Technology, Inc.* | | | 52,900 | | | | 11,645,935 | |
| | |
Bentley Systems, Inc., Class B | | | 349,700 | | | | 18,247,346 | |
| | |
Crowdstrike Holdings, Inc., Class A* | | | 121,500 | | | | 31,021,380 | |
| | |
CyberArk Software, Ltd. (Israel)* | | | 81,800 | | | | 17,918,290 | |
| | |
Elastic, N.V.* | | | 154,900 | | | | 17,457,230 | |
| | |
Gartner, Inc.* | | | 68,425 | | | | 30,867,202 | |
| | |
HashiCorp, Inc., Class A* | | | 555,200 | | | | 13,124,928 | |
| | |
HubSpot, Inc.* | | | 43,700 | | | | 25,369,598 | |
| | |
Marvell Technology, Inc. | | | 181,560 | | | | 10,949,883 | |
| | |
Microchip Technology, Inc. | | | 245,800 | | | | 22,166,244 | |
| | |
Monolithic Power Systems, Inc. | | | 31,100 | | | | 19,617,258 | |
| | |
Nice, Ltd., Sponsored ADR (Israel)*,1 | | | 100,720 | | | | 20,094,647 | |
| | |
Palo Alto Networks, Inc.* | | | 83,917 | | | | 24,745,445 | |
| | |
Samsara, Inc., Class A* | | | 176,600 | | | | 5,894,908 | |
| | |
Smartsheet, Inc., Class A* | | | 348,600 | | | | 16,670,052 | |
| | |
Synopsys, Inc.* | | | 34,115 | | | | 17,566,155 | |
| | |
Teradyne, Inc. | | | 208,600 | | | | 22,637,272 | |
| | |
Tyler Technologies, Inc.* | | | 38,200 | | | | 15,972,184 | |
| | |
Universal Display Corp. | | | 49,164 | | | | 9,403,107 | |
| | |
Total Information Technology | | | | | | | 374,902,526 | |
| | |
Materials - 2.3% | | | | | | | | |
| | |
Martin Marietta Materials, Inc. | | | 34,100 | | | | 17,012,831 | |
The accompanying notes are an integral part of these financial statements.
16
| | |
| | | AMG TimesSquare Mid Cap Growth Fund Schedule of Portfolio Investments (continued) |
| | | | | | | | |
| | |
| | | Shares | | | Value | |
| | |
Materials - 2.3% (continued) | | | | | | | | |
| | |
RPM International, Inc. | | | 116,700 | | | $ | 13,027,221 | |
| | |
Total Materials | | | | | | | 30,040,052 | |
| | |
Real Estate - 1.4% | | | | | | | | |
| | |
CoStar Group, Inc.* | | | 212,700 | | | | 18,587,853 | |
| | |
Total Common Stocks
(Cost $832,973,797) | | | | | | | 1,269,587,742 | |
| | |
| | | Principal
Amount | | | | |
| |
Short-Term Investments - 3.2% | | | | | |
| |
Joint Repurchase Agreements - 1.2%2 | | | | | |
| | |
Cantor Fitzgerald Securities, Inc., dated 12/29/23, due 01/02/24, 5.470% total to be received $3,181,625 (collateralized by various U.S. Government Agency Obligations, 0.000% - 7.613%, 08/01/25 - 09/20/73, totaling $3,243,286) | | | $3,179,692 | | | | 3,179,692 | |
| | |
Daiwa Capital Markets America, dated 12/29/23, due 01/02/24, 5.380% total to be received $668,742 (collateralized by various U.S. Government Agency Obligations and U.S. Treasuries, 0.000% - 7.500%, 03/22/24 - 01/01/54, totaling $681,791) | | | 668,342 | | | | 668,342 | |
| | |
RBC Dominion Securities, Inc., dated 12/29/23, due 01/02/24, 5.340% total to be received $3,737,624 (collateralized by various U.S. Government Agency Obligations and U.S. Treasuries, 0.000% - 7.500%, 01/15/24 - 12/01/53, totaling $3,810,116) | | | 3,735,408 | | | | 3,735,408 | |
| | | | | | | | |
| | | Principal
Amount | | | Value | |
| | |
Santander U.S. Capital Markets LLC, dated 12/29/23, due 01/02/24, 5.390% total to be received $3,700,269 (collateralized by various U.S. Government Agency Obligations, 1.500% - 6.838%, 10/25/30 - 03/20/71, totaling $3,772,015) | | | $3,698,054 | | | | $3,698,054 | |
| | |
State of Wisconsin Investment Board, dated 12/29/23, due 01/02/24, 5.470% total to be received $3,662,925 (collateralized by various U.S. Treasuries, 0.125% - 3.625%, 04/15/25 - 02/15/53, totaling $3,731,226) | | | 3,660,700 | | | | 3,660,700 | |
| | |
Total Joint Repurchase Agreements | | | | | | | 14,942,196 | |
| | |
| | | Shares | | | | |
| |
Other Investment Companies - 2.0% | | | | | |
| | |
Dreyfus Government Cash Management Fund, Institutional Shares, 5.25%3 | | | 10,301,480 | | | | 10,301,480 | |
| | |
Dreyfus Institutional Preferred Government Money Market Fund, Institutional Shares, 5.32%3 | | | 15,452,221 | | | | 15,452,221 | |
| | |
Total Other Investment Companies | | | | | | | 25,753,701 | |
| | |
Total Short-Term Investments
(Cost $40,695,897) | | | | | | | 40,695,897 | |
| | |
Total Investments - 101.2%
(Cost $873,669,694) | | | | | | | 1,310,283,639 | |
| |
Other Assets, less Liabilities - (1.2)% | | | | (15,016,652 | ) |
| |
Net Assets - 100.0% | | | | $1,295,266,987 | |
| * | Non-income producing security. |
| 1 | Some of these securities, amounting to $36,651,313 or 2.8% of net assets, were out on loan to various borrowers and are collateralized by cash and various U.S. Treasury Obligations. See Note 4 of Notes to Financial Statements. |
| 2 | Cash collateral received for securities lending activity was invested in these joint repurchase agreements. |
| 3 | Yield shown represents the December 31, 2023, seven day average yield, which refers to the sum of the previous seven days’ dividends paid, expressed as an annual percentage. |
ADR American Depositary Receipt
The accompanying notes are an integral part of these financial statements.
17
| | |
| | | AMG TimesSquare Mid Cap Growth Fund Schedule of Portfolio Investments (continued) |
The following table summarizes the inputs used to value the Fund’s investments by the fair value hierarchy levels as of December 31, 2023:
| | | | | | | | | | | | | | | | |
| | | Level 1 | | | Level 2 | | | Level 3 | | | Total | |
| | | | |
Investments in Securities | | | | | | | | | | | | | | | | |
| | | | |
Common Stocks† | | | $1,269,587,742 | | | | — | | | | — | | | | $1,269,587,742 | |
| | | | |
Short-Term Investments | | | | | | | | | | | | | | | | |
| | | | |
Joint Repurchase Agreements | | | — | | | | $14,942,196 | | | | — | | | | 14,942,196 | |
| | | | |
Other Investment Companies | | | 25,753,701 | | | | — | | | | — | | | | 25,753,701 | |
| | | | | | | | | | | | | | | | |
| | | | |
Total Investments in Securities | | | $1,295,341,443 | | | | $14,942,196 | | | | — | | | | $1,310,283,639 | |
| | | | | | | | | | | | | | | | |
| † | All common stocks held in the Fund are Level 1 securities. For a detailed breakout of common stocks by major industry classification, please refer to the Fund’s Schedule of Portfolio Investments. |
For the fiscal year ended December 31, 2023, there were no transfers in or out of Level 3.
The accompanying notes are an integral part of these financial statements.
18
| | |
| | | AMG TimesSquare International Small Cap Fund Portfolio Manager’s Comments (unaudited) |
| | | | | | | | |
Year In Review For the year ended December 31, 2023, AMG TimesSquare International Small Cap Fund (the “Fund”) Class N shares returned 9.92%, while its benchmark, the MSCI EAFE Small Cap Index, returned 13.16%. 2023 started off with a rollercoaster ride for global equity markets in the first quarter, followed by a steady climb in the second quarter, a decline in the third quarter, and ended the year with a strong rebound in the fourth quarter. The fourth quarter rally was bolstered by central banks pausing rates increases, but it may be premature to declare victory over inflation and plot a near-term pivot to monetary easing. That speculation led to a rally benefiting global equities—especially small & microcaps and emerging markets. Concerns surrounding wage inflation and access to skilled workers generally subsided across markets, with the notable exception of Japan where that remains a significant challenge. Most factors finished the year in positive territory. However, it was Beta and Book to Price that significantly outpaced other style factors in 2023. Within the international small cap universe, Europe outperformed other regions with double-digit performance. All sectors generated positive returns with real estate, energy, and financials leading the way. As our investment team meets with companies, reviews recent earnings reports, and surveys the global landscape, they note several investment dynamics that inform our positioning: • Technology: Cybersecurity remains a top priority for companies, propelled by recent well publicized cyberattacks. Our channel checks indicate that information technology (IT) budgets will continue growing, with cybersecurity becoming an increasing percentage. Interest continues to grow in machine learning and generative artificial intelligence (AI) tools and applications, though companies approach this area cautiously given the costs and fast paced changes. • Industrials: Many years of prior underinvestment leave significant ground to recover. Industrial capital expenditures may continue to be a bright spot for several years as structural labor challenges are addressed with greater automation and supply chains move closer to home, particularly away from China. • China: Localization and import substitution are major trends, either due to geopolitical concerns in the case of the technology industry, or trading | | | | down to cheaper domestic products due to consumer weakness. Meanwhile, both Chinese and multinational companies continue to seek other manufacturing centers in the region, or reshore them completely, which should benefit Southeast Asia, Mexico, and India. Fund Performance Review The Fund underperformed the MSCI EAFE Small Cap benchmark during 2023 due to relative weakness in Europe and Japan. Regional Performance: Europe Recognizing the geopolitical landscape and economic reality, we reduced our position in Europe throughout the year. At the end of the year, the Fund had a slightly underweight position in Europe versus the benchmark. For the year, underperformance in the region was driven by stock selection. Holdings in the U.K. and Germany detracted while France and Sweden contributed. In the U.K., wealth manager St. James’s Place has been a long-time holding in the Fund. A regulatory change in the industry placed a lower cap on the company fees for long duration bond and pension investments. This will create headwinds for St. James going forward. Spirent Communications is a leading provider of automated testing and assurance solutions for networks, security, and positioning (GPS). The company noted prolonged order delays in 5G investment from telecom carriers, which led its FY23 revenue guidance lower. We exited our positions in St. James’s Place and Spirent, which lost -36% and- 31%, respectively, while they were held this year. The Fund’s largest detractor was Keywords Studios, a provider of outsourced creative and technical services to the video game industry. The company reported resilient first half 2023 results, but speculation on potential disruption by AI has created volatility for business outsourcing companies. The company also noted impact from the U.S. writer/actor strikes. As a result, the stock traded down -35%. We believe the company’s dominant exposure in the growing market and its long-standing client relationships will be beneficial in the long run, and the U.S. writer’s strike was resolved at the end of the third quarter. More positive was the U.K.-based online automotive platform Auto Trader. The company delivered strong results for the first half of 2024 and upgraded its FY24 outlook. The share price of Auto Trader surged 50%. Military spending in the world had been in a long-term decline, though given the current geopolitical situation there should be structural | | | | increases in spending. Our holdings here include Swedish defense equipment manufacturer Saab, which continued to post strong revenue growth and expand its margin. Saab’s share price improved 54%, making it the greatest contributor for the year. Earlier in the year, we initiated a position in Germany based pure play, platform agnostic defense electronics company, Hensoldt. The company’s sensors/radar and Optronics (precision vision guidance systems) are critical to military hardware. There was some concern over the loss making in their Optronics segment in the early quarter, but management reiterated the guidance for the full year. We remained confident in the company and gradually added to the position with the stock traded down -24% since it was first added to the Fund. Elsewhere in Europe, France’s Technip Energy is one of only a handful of companies that can build liquefied natural gas (“LNG”) plants. We trimmed the position with its share price up 52% for the year. Netherlands-based engineering consultant Arcadis reported strong performance throughout the year. The company also raised its organic revenue growth target over the next two fiscal years, driven by increased client spending on climate and sustainability-related and energy transition projects. This positive news served to lift its shares by 40% during the year. Regional Performance: Japan Within Japan there has been a significant shift to Value after the Tokyo Stock Exchange urged companies with low price to book ratios (P/B) to start focusing on using capital more efficiently. That led active investors to allocate capital into low P/B stocks and created a significant rotation to Value. Though in the short-term this stylistic headwind impacts some of our holdings, we believe this could be positive in the long term as companies will be more likely to take excess capital and reallocate to the market. This rotation to Value calmed down somewhat during the fourth quarter. Leading Japanese logistics provider AZ-COM has benefited from recent momentum of freight rate hikes in the logistics industry and ecommerce-related outsourcing services. The company announced the issuance of new shares and secondary offering of shares in November. The dilution in the share price and selling pressure from existing shareholders led to a -28% slide. We believe the company’s outlook remains solid but reached out |
19
| | |
| | | AMG TimesSquare International Small Cap Fund Portfolio Manager’s Comments (continued) |
| | | | | | | | |
to local brokers to voice our disapproval regarding this corporate action. Shoei is the world’s largest manufacturer of premium motorcycle helmets. The company is projecting lower sales volume as distributors work through excess inventories. We exited the position with its share price down -33% while it was in the portfolio during the year. There are also some bright spots in the Fund’s Japan holdings. A case in point is the water recycling services provider, Organo. The company announced upward revisions of guidance in October. In its quarterly earnings, the company noted strong order intakes due to acceleration of domestic projects and semiconductor projects in Taiwan and Southeast Asia. Share price surged 90% as a result. Socionext is a leading Japanese fabless semiconductor integrated circuit (“IC”) design company. The proliferation of artificial intelligence has increased the demand for customized application specific integrated circuits (“ASICs”). The construction of Japan-based semiconductor foundries by TSMC (the world’s largest fab foundry) and the desire among customers for IC design talent outside of mainland China should also be beneficial for Socionext. The company’s impressive results also further demonstrated the strength of its business model, though in our mind management was conservative about not upgrading guidance. We trimmed our position with the stock ascending 20% for the year. Regional Performance: Asia/Pacific ex Japan The Fund’s holdings in Asia/Pacific ex Japan performed in line with the benchmark’s regional performance. | | | | The share price of Australia’s intellectual property services provider IPH came under pressure due to increased leverage with its recent acquisition in Canada and the lack of organic growth in its home market. We believe the acquisition in Canada was attractive and the reasons for poor sentiment are increasingly behind us. We continue to hold the name even though its shares traded down -24%. Late in the year we parted ways with APM Human Services International, a leading human resources provider that focuses on disability, employment, and related services. Record low levels of unemployment in Australia and the U.K. remained a headwind, driving industry caseloads lower. Meanwhile, rising interest costs and taxes compounded the issue. Shares of APM declined -37% while they were held during the year. Jumping 55%, CAR Group (previously Carsales.com) is the #1 online classified platform in Australia with a growing presence in South Korea, Latin America, and the U.S. In September, the company hosted U.S. and Brazil investor days, which provided clarity on the company’s medium term outlook. Regional Performance: Emerging Markets Within the Emerging Markets, Taiwan-based Accton is a leading manufacturer of white box network devices, in particular network switches, for brand vendors (such as Broadcom and HP) and leading data center “hyperscalers” (such as Facebook and Amazon). Accton’s share price jumped 126% on the back of better-than-expected quarterly results helped by easing supply chain pressure and strong demand trend for 400G switches. | | | | Conclusion Looking forward into 2024, markets will keep a close eye on central banks and the polls. Early indications are for some monetary easing, though there is a wide divergence on when that may occur. This year will also be one of the biggest for global elections. Including the U.S., Taiwan, India, Mexico, and expectations for the U.K., there will be nearly 40 national elections. That all but guarantees shifting fiscal policies as over 40% of the world’s population heads to the voting booths. With those influences beyond our control, we focus on how our portfolio companies plan to navigate this environment. Many showed improving fundamentals toward the end of 2023 that we expect to continue into 2024 and beyond. As bottom up investors, we seek underpinnings to near term valuations in the form of expected earnings growth and other business fundamentals. We continuously review the business models and management teams of current and potential holdings, and fine tune our own valuation models on an ongoing basis, as we endeavor to protect the assets you have entrusted with us. The views expressed represent the opinions of TimesSquare Capital Management, LLC as of December 31, 2023, and are not intended as a forecast or guarantee of future results, and are subject to change without notice. |
20
|
AMG TimesSquare International Small Cap Fund Portfolio Manager’s Comments (continued) |
CUMULATIVE TOTAL RETURN PERFORMANCE
AMG TimesSquare International Small Cap Fund’s cumulative total return is based on the daily change in net asset value (NAV), and assumes that all dividends and distributions were reinvested. This graph compares a hypothetical $10,000 investment made in the AMG TimesSquare International Small Cap Fund’s Class N shares on December 31, 2013 to a $10,000 investment made in the MSCI EAFE Small Cap Index for the same time period. The graph and table do not reflect the deduction of taxes that a shareholder would pay on a Fund distribution or redemption of shares. The listed returns for the Fund are net of expenses and the returns for the index exclude expenses. Total returns would have been lower had certain expenses not been reduced.
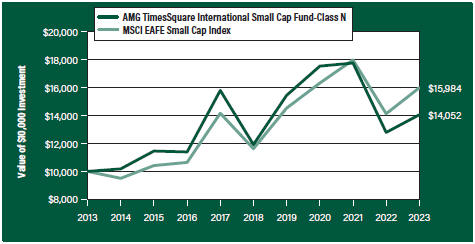
The table below shows the average annual total returns for the AMG TimesSquare International Small Cap Fund and the MSCI EAFE Small Cap Index for the same time periods ended December 31, 2023.
| | | | | | | | | | | | |
| | | One | | Five | | Ten | | | Since | | Inception |
| Average Annual Total Returns1 | | Year | | Years | | Years | | | Inception | | Date |
|
AMG TimesSquare International Small Cap Fund2, 3, 4, 5, 6, 7, 8, 9, 10, 11, 12, 13 |
| | | | | |
Class N | | 9.92% | | 3.36% | | | 3.46% | | | 5.25% | | 01/02/13 |
| | | | | |
Class I | | 10.11% | | 3.52% | | | — | | | 2.38% | | 02/24/17 |
| | | | | |
Class Z | | 10.22% | | 3.61% | | | 3.72% | | | 5.48% | | 01/02/13 |
| | | | | |
MSCI EAFE Small Cap Index14 | | 13.16% | | 6.58% | | | 4.80% | | | 6.67% | | 01/02/13† |
The performance data shown represents past performance. Past performance is not a guarantee of future results. Current performance may be lower or higher than the performance data quoted. The investment return and principal value of an investment will fluctuate so that an investor’s shares, when redeemed, may be worth more or less than their original cost.
Investors should carefully consider the Fund’s investment objectives, risks, charges and expenses before investing. For performance information through the most recent month end, current net asset values per share for the Fund and other information, please call 800.548.4539 or visit our website at wealth.amg.com for a free prospectus. Read it carefully before investing or sending money.
Distributed by AMG Distributors, Inc., member FINRA/SIPC.
| † | Date reflects inception date of the Fund, not the index. |
| 1 | Total return equals income yield plus share price change and assumes reinvestment of all dividends and capital gain distributions. Returns are net of fees and may reflect offsets of Fund expenses as described in the prospectus. No adjustment has been made for taxes payable by shareholders on their reinvested dividends and |
|
capital gain distributions. Returns for periods greater than one year are annualized. The listed returns on the Fund are net of expenses and based on the published NAV as of December 31, 2023. All returns are in U.S. Dollars ($). 2 From time to time, the Fund’s Investment Manager has waived its fees and/or absorbed Fund expenses, which has resulted in higher returns. 3 The prices of equity securities of companies that are expected to experience relatively rapid earnings growth, or “growth stocks,” may be more sensitive to market movements because the prices tend to reflect future investor expectations rather than just current profits. 4 Issuers and companies that are in similar industry sectors may be similarly affected by particular economic or market events; to the extent the Fund has substantial holdings within a particular sector, the risks associated with that sector increase. 5 Market prices of investments held by the Fund may fall rapidly or unpredictably due to a variety of factors, including economic, political, or market conditions, or other factors including terrorism, war, natural disasters and the spread of infectious illness or other public health issues, including epidemics or pandemics, or in response to events that affect particular industries or companies. 6 Because the Fund is an actively managed investment portfolio, security selection or focus on securities in a particular style, market sector or group of companies may cause the Fund to incur losses or underperform relative to its benchmarks or other funds with a similar investment objective. There can be no guarantee that the Subadviser’s investment techniques and risk analysis will produce the desired result. 7 The stocks of small-capitalization companies often have greater price volatility, lower trading volume, and less liquidity than the stocks of larger, more established companies 8 The Fund may not be able to dispose of particular investments, such as illiquid securities, readily at favorable times or prices or the Fund may have to sell them at a loss. 9 Investments in foreign issuers involve additional risks (such as risks arising from less frequent trading, changes in political or social conditions, and less publicly available information about non-U.S. issuers) that differ from those associated with investments in U.S. issuers and may result in greater price volatility. 10 Investments in emerging markets are subject to the general risks of foreign investments, as well as additional risks which can result in greater price volatility. Such additional risks include the risk that markets in emerging market countries are typically |
21
| | |
| | | AMG TimesSquare International Small Cap Fund Portfolio Manager’s Comments (continued) |
| | | | |
less developed and less liquid than markets in developed countries and such markets are subjected to increased economic, political, or regulatory uncertainties. 11 Changes in the general political and social environment of a country can have substantial effects on the value of investments exposed to that country. 12 To the extent the Fund focuses its investments in a particular country, group of countries or geographic region, the Fund is particularly susceptible to economic, political, regulatory or other events or conditions affecting such countries or region, and the Fund’s NAV may be more volatile than the NAV of a more geographically diversified fund and may result in losses. The Fund is highly susceptible to the social, political, economic, regulatory and other conditions or events that may affect Japan’s economy. The Japanese economy is heavily dependent upon international trade, and, therefore, is particularly exposed to the risks of currency fluctuation, foreign trade policy and regional and global economic disruption, including the risk of increased tariffs, | | embargoes, and other trade limitations or factors. Japanese government policy has been characterized by economic regulation, intervention, protectionism and large government deficits. The Japanese economy is also challenged by an unstable financial services sector, highly leveraged corporate balance sheets and extensive cross-ownership among major corporations. Structural social and labor market changes, including an aging workforce, population decline and traditional aversion to labor mobility may adversely affect Japan’s economic competitiveness and growth potential. The potential for natural disasters, such as earthquakes, volcanic eruptions, typhoons and tsunamis, could also have significant negative effects on Japan’s economy. 13 Fluctuations in exchange rates may affect the total loss or gain on a non-U.S. dollar investment when converted back to U.S. dollars and exposure to non-U.S. currencies may subject the Fund to the risk that those currencies will decline in value relative to the U.S. dollar. The values of foreign currencies relative to the U.S. dollar may fluctuate in response to, among other factors, interest rate changes, intervention (or failure to intervene) by national governments, central banks, or | | supranational entities such as the International Monetary Fund, the imposition of currency controls, and other political or regulatory developments. 14 The MSCI EAFE Small Cap Index covers all investable small-cap securities with a market capitalization below that of the companies in the MSCI Standard Indices of developed markets, excluding the U.S. and Canada. Please go to msci.com for most current list of countries represented by the index. Unlike the Fund, the MSCI EAFE Small Cap Index is unmanaged, is not available for investment and does not incur expenses. All MSCI data is provided “as is.” The products described herein are not sponsored or endorsed and have not been reviewed or passed on by MSCI. In no event shall MSCI, its affiliates or any MSCI data provider have any liability of any kind in connection with the MSCI data or the products described herein. Copying or redistributing the MSCI data is strictly prohibited. Not FDIC insured, nor bank guaranteed. May lose value. |
22
| | |
| | | AMG TimesSquare International Small Cap Fund Fund Snapshots (unaudited) December 31, 2023 |
PORTFOLIO BREAKDOWN
| | | | | |
| Sector | | % of
Net Assets |
| | |
Industrials | | 30.3 |
| | |
Financials | | 10.0 |
| | |
Information Technology | | 9.8 |
| | |
Consumer Discretionary | | 9.4 |
| | |
Consumer Staples | | 7.6 |
| | |
Communication Services | | 7.5 |
| | |
Health Care | | 6.0 |
| | |
Materials | | 5.5 |
| | |
Real Estate | | 5.1 |
| | |
Energy | | 2.8 |
| | |
Utilities | | 1.9 |
| | |
Short-Term Investments1 | | 5.1 |
| | |
Other Assets, less Liabilities2 | | (1.0) |
TOP TEN HOLDINGS
| | |
| Security Name | | % of
Net Assets |
| | |
Steadfast Group, Ltd. (Australia) | | 3.3 |
| | |
Saab AB, Class B (Sweden) | | 2.6 |
| | |
Arcadis, N.V. (Netherlands) | | 2.5 |
| | |
Diploma PLC (United Kingdom) | | 2.1 |
| | |
Internet Initiative Japan, Inc. (Japan) | | 2.1 |
| | |
Daiei Kankyo Co., Ltd. (Japan) | | 1.9 |
| | |
Nippon Gas Co., Ltd. (Japan) | | 1.9 |
| | |
Siegfried Holding AG (Switzerland) | | 1.9 |
| | |
Organo Corp. (Japan) | | 1.8 |
| | |
Rakuten Bank, Ltd. (Japan) | | 1.7 |
| | |
| | |
Top Ten as a Group | | 21.8 |
| | |
| 1 | Includes reinvestment of cash collateral into joint repurchase agreements on security lending transactions. |
| 2 | Includes repayment of cash collateral on securities lending transactions. |
Because a fund’s strategy may result in multiple investments in particular sectors of the economy, its performance may depend on the performance of those sectors and may fluctuate more widely than investments diversified across more sectors. For additional information on these and other risk considerations, please see the Fund’s prospectus.
Any sectors, industries, or securities discussed should not be perceived as investment recommendations. Mention of a specific security should not be considered a recommendation to buy or solicitation to sell that security. Specific securities mentioned in this report may have been sold from the Fund’s portfolio of investments by the time you receive this report.
23
| | |
| | | AMG TimesSquare International Small Cap Fund Schedule of Portfolio Investments December 31, 2023 |
| | | | | | | | |
| | |
| | | Shares | | | Value | |
| | |
Common Stocks - 95.4% | | | | | | | | |
| |
Communication Services - 7.5% | | | | | |
| | |
Auto Trader Group PLC (United Kingdom)1 | | | 312,310 | | | | $2,869,083 | |
| | |
CAR Group Ltd. (Australia)2 | | | 131,064 | | | | 2,777,414 | |
| | |
Internet Initiative Japan, Inc. (Japan) | | | 198,440 | | | | 4,048,739 | |
| | |
IPSOS S.A. (France) | | | 40,530 | | | | 2,544,804 | |
| | |
Kadokawa Corp. (Japan) | | | 99,590 | | | | 2,022,963 | |
| | |
Total Communication Services | | | | | | | 14,263,003 | |
| |
Consumer Discretionary - 9.4% | | | | | |
| | |
Adventure, Inc. (Japan)2 | | | 27,560 | | | | 1,084,039 | |
| | |
Arcos Dorados Holdings, Inc., Class A (Uruguay) | | | 209,280 | | | | 2,655,763 | |
| | |
CIE Automotive, S.A. (Spain)2 | | | 48,407 | | | | 1,377,707 | |
| | |
Dalata Hotel Group PLC (Ireland) | | | 561,596 | | | | 2,864,279 | |
| | |
Games Workshop Group PLC (United Kingdom) | | | 18,100 | | | | 2,274,710 | |
| | |
Goldwin, Inc. (Japan) | | | 29,490 | | | | 2,114,395 | |
| | |
KOMEDA Holdings Co., Ltd. (Japan) | | | 53,840 | | | | 1,047,043 | |
| | |
Samsonite International, S.A. (United States)*,1 | | | 568,320 | | | | 1,875,014 | |
| | |
Spin Master Corp. (Canada)1 | | | 59,990 | | | | 1,578,243 | |
| | |
Tod’s S.P.A. (Italy)*,2 | | | 25,260 | | | | 952,924 | |
| | |
Total Consumer Discretionary | | | | | | | 17,824,117 | |
| |
Consumer Staples - 7.6% | | | | | |
| | |
Kobe Bussan Co., Ltd. (Japan) | | | 99,768 | | | | 2,947,218 | |
| | |
Lawson, Inc. (Japan) | | | 47,410 | | | | 2,448,844 | |
| | |
Rohto Pharmaceutical Co., Ltd. (Japan) | | | 160,590 | | | | 3,229,352 | |
| | |
Sugi Holdings Co., Ltd. (Japan) | | | 30,227 | | | | 1,387,616 | |
| | |
Tate & Lyle PLC (United Kingdom) | | | 266,714 | | | | 2,240,383 | |
| | |
Viscofan, S.A. (Spain) | | | 39,320 | | | | 2,326,632 | |
| | |
Total Consumer Staples | | | | | | | 14,580,045 | |
| |
Energy - 2.8% | | | | | |
| | |
Pason Systems, Inc. (Canada) | | | 166,470 | | | | 2,031,486 | |
| | |
Technip Energies, N.V. (France) | | | 106,570 | | | | 2,487,583 | |
| | |
TGS ASA (Norway)2 | | | 57,050 | | | | 740,855 | |
| | |
Total Energy | | | | | | | 5,259,924 | |
| |
Financials - 10.0% | | | | | |
| | |
FinecoBank Banca Fineco S.P.A. (Italy) | | | 116,043 | | | | 1,745,770 | |
| | |
Integral Corp. (Japan)*,2 | | | 144,610 | | | | 2,720,290 | |
| | |
Nordnet AB publ (Sweden) | | | 94,437 | | | | 1,607,789 | |
| | |
Rakuten Bank, Ltd. (Japan)*,2 | | | 220,030 | | | | 3,290,776 | |
| | |
Ringkjoebing Landbobank A/S (Denmark) | | | 14,610 | | | | 2,145,786 | |
| | |
Steadfast Group, Ltd. (Australia) | | | 1,567,323 | | | | 6,225,278 | |
| | |
Topdanmark AS (Denmark) | | | 28,401 | | | | 1,356,219 | |
| | |
Total Financials | | | | | | | 19,091,908 | |
| | | | | | | | |
| | |
| | | Shares | | | Value | |
| |
Health Care - 6.0% | | | | | |
| | |
Ambu A/S, Class B (Denmark)* | | | 99,680 | | | | $1,552,897 | |
| | |
Amplifon S.P.A. (Italy)2 | | | 31,965 | | | | 1,107,607 | |
| | |
Carenet, Inc. (Japan)2 | | | 208,370 | | | | 1,618,399 | |
| | |
Gerresheimer AG (Germany) | | | 16,350 | | | | 1,700,983 | |
| | |
Nakanishi, Inc. (Japan) | | | 113,650 | | | | 1,906,867 | |
| | |
Siegfried Holding AG (Switzerland) | | | 3,490 | | | | 3,569,999 | |
| | |
Total Health Care | | | | | | | 11,456,752 | |
| |
Industrials - 29.8% | | | | | |
| | |
Ag Growth International, Inc. (Canada) | | | 63,390 | | | | 2,416,862 | |
| | |
ALS, Ltd. (Australia) | | | 341,490 | | | | 2,991,114 | |
| | |
Arcadis, N.V. (Netherlands) | | | 87,000 | | | | 4,699,850 | |
| | |
AZ-COM MARUWA Holdings, Inc. (Japan) | | | 175,380 | | | | 1,897,169 | |
| | |
Bodycote PLC (United Kingdom) | | | 340,239 | | | | 2,578,261 | |
| | |
Daiei Kankyo Co., Ltd. (Japan) | | | 208,920 | | | | 3,685,150 | |
| | |
Danieli & C Officine Meccaniche S.P.A. (Italy) | | | 28,200 | | | | 914,579 | |
| | |
Diploma PLC (United Kingdom) | | | 88,660 | | | | 4,049,255 | |
| | |
DMG Mori Co., Ltd. (Japan) | | | 163,260 | | | | 3,115,620 | |
| | |
Hensoldt AG (Germany) | | | 57,050 | | | | 1,536,499 | |
| | |
Howden Joinery Group PLC (United Kingdom) | | | 170,943 | | | | 1,769,733 | |
| | |
Interpump Group S.P.A. (Italy) | | | 18,707 | | | | 970,535 | |
| | |
IPH, Ltd. (Australia) | | | 738,320 | | | | 3,229,438 | |
| | |
MEITEC Group Holdings, Inc. (Japan) | | | 134,500 | | | | 2,691,121 | |
| | |
Nexans, S.A. (France) | | | 31,050 | | | | 2,724,072 | |
| | |
Organo Corp. (Japan) | | | 82,320 | | | | 3,396,579 | |
| | |
Rotork PLC (United Kingdom) | | | 426,840 | | | | 1,756,664 | |
| | |
Saab AB, Class B (Sweden) | | | 81,400 | | | | 4,905,462 | |
| | |
SGL Carbon SE (Germany)*,2 | | | 168,770 | | | | 1,213,825 | |
| | |
SMS Co., Ltd. (Japan) | | | 121,730 | | | | 2,495,666 | |
| | |
SPIE, S.A. (France) | | | 75,700 | | | | 2,369,546 | |
| | |
TRYT, Inc. (Japan)* | | | 172,630 | | | | 696,642 | |
| | |
Valmet Oyj (Finland)2 | | | 26,000 | | | | 751,856 | |
| | |
Total Industrials | | | | | | | 56,855,498 | |
| |
Information Technology - 9.8% | | | | | |
| | |
Accton Technology Corp. (Taiwan) | | | 117,140 | | | | 1,991,004 | |
| | |
CyberArk Software, Ltd. (Israel)* | | | 13,510 | | | | 2,959,366 | |
| | |
Fortnox AB (Sweden) | | | 161,240 | | | | 964,623 | |
| | |
Indra Sistemas, S.A. (Spain) | | | 95,000 | | | | 1,471,391 | |
| | |
Keywords Studios PLC (Ireland) | | | 129,080 | | | | 2,734,519 | |
| | |
Nova, Ltd. (Israel)* | | | 11,670 | | | | 1,603,341 | |
| | |
QT Group Oyj (Finland)*,2 | | | 15,080 | | | | 1,076,532 | |
| | |
Simplex Holdings, Inc. (Japan) | | | 60,180 | | | | 1,167,731 | |
| | |
Socionext, Inc. (Japan) | | | 105,750 | | | | 1,912,048 | |
The accompanying notes are an integral part of these financial statements.
24
| | |
| | | AMG TimesSquare International Small Cap Fund Schedule of Portfolio Investments (continued) |
| | | | | | | | |
| | |
| | | Shares | | | Value | |
| | |
Information Technology - 9.8% (continued) | | | | | | | | |
| | |
Sopra Steria Group SACA (France) | | | 12,583 | | | $ | 2,755,899 | |
| | |
Total Information Technology | | | | | | | 18,636,454 | |
| | |
Materials - 5.5% | | | | | | | | |
| | |
Acerinox, S.A. (Spain) | | | 202,580 | | | | 2,387,406 | |
| | |
Huhtamaki Oyj (Finland)2 | | | 70,560 | | | | 2,863,983 | |
| | |
Imdex, Ltd. (Australia) | | | 1,654,710 | | | | 2,123,230 | |
| | |
Osisko Gold Royalties, Ltd. (Canada) | | | 165,920 | | | | 2,367,871 | |
| | |
Verallia, S.A. (France)1 | | | 20,030 | | | | 771,692 | |
| | |
Total Materials | | | | | | | 10,514,182 | |
| |
Real Estate - 5.1% | | | | | |
| | |
KDX Realty Investment Corp., REIT (Japan) | | | 1,010 | | | | 1,150,424 | |
| | |
Merlin Properties Socimi SA, REIT (Spain) | | | 254,580 | | | | 2,826,622 | |
| | |
Safestore Holdings PLC, REIT (United Kingdom) | | | 244,290 | | | | 2,751,196 | |
| | |
The UNITE Group PLC, REIT (United Kingdom) | | | 221,230 | | | | 2,938,708 | |
| | |
Total Real Estate | | | | | | | 9,666,950 | |
| | |
Utilities - 1.9% | | | | | | | | |
| | |
Nippon Gas Co., Ltd. (Japan) | | | 217,370 | | | | 3,584,772 | |
| | |
Total Common Stocks
(Cost $149,754,286) | | | | | | | 181,733,605 | |
| |
Preferred Stock - 0.5% | | | | | |
| |
Industrials - 0.5% | | | | | |
| | |
Jungheinrich AG, 2.760% (Germany) | | | 28,110 | | | | 1,029,217 | |
| | |
Total Preferred Stock
(Cost $955,334) | | | | | | | 1,029,217 | |
| | |
| | | Principal
Amount | | | | |
| |
Short-Term Investments - 5.1% | | | | | |
| |
Joint Repurchase Agreements - 5.1%3 | | | | | |
| | |
Citigroup Global Markets, Inc., dated 12/29/23, due 01/02/24, 5.340% total to be received $2,424,673 (collateralized by various U.S. Government Agency Obligations, 2.000% - 7.500%, 07/20/37 - 12/20/53, totaling $2,471,700) | | | $2,423,235 | | | | 2,423,235 | |
| | | | | | | | |
| | | Principal
Amount | | | Value | |
| | |
Daiwa Capital Markets America, dated 12/29/23, due 01/02/24, 5.380% total to be received $2,424,684 (collateralized by various U.S. Government Agency Obligations and U.S. Treasuries, 0.000% - 7.500%, 03/22/24 - 01/01/54, totaling $2,471,998) | | | $2,423,235 | | | | $2,423,235 | |
| | |
Deutsche Bank Securities, Inc., dated 12/29/23, due 01/02/24, 5.350% total to be received $2,424,675 (collateralized by various U.S. Government Agency Obligations, 2.000% - 6.500%, 09/01/46 - 06/01/62, totaling $2,471,700) | | | 2,423,235 | | | | 2,423,235 | |
| | |
RBC Dominion Securities, Inc., dated 12/29/23, due 01/02/24, 5.340% total to be received $2,424,673 (collateralized by various U.S. Government Agency Obligations and U.S. Treasuries, 0.000% - 7.500%, 01/15/24 -12/01/53, totaling $2,471,700) | | | 2,423,235 | | | | 2,423,235 | |
| | |
Total Short-Term Investments
(Cost $9,692,940) | | | | | | | 9,692,940 | |
| | |
Total Investments - 101.0%
(Cost $160,402,560) | | | | | | | 192,455,762 | |
| |
Other Assets, less Liabilities - (1.0)% | | | | (1,975,765 | ) |
| | |
Net Assets - 100.0% | | | | | | | $190,479,997 | |
| * | Non-income producing security. |
| 1 | Security exempt from registration under Rule 144A of the Securities Act of 1933. These securities may be resold in transactions exempt from registration, normally to qualified institutional buyers. At December 31, 2023, the value of these securities amounted to $7,094,032 or 3.7% of net assets. |
| 2 | Some of these securities, amounting to $15,336,376 or 8.1% of net assets, were out on loan to various borrowers and are collateralized by cash and various U.S. Treasury Obligations. See Note 4 of Notes to Financial Statements. |
| 3 | Cash collateral received for securities lending activity was invested in these joint repurchase agreements. |
| | |
| REIT | | Real Estate Investment Trust |
The accompanying notes are an integral part of these financial statements.
25
| | |
| | | AMG TimesSquare International Small Cap Fund Schedule of Portfolio Investments (continued) |
The following table summarizes the inputs used to value the Fund’s investments by the fair value hierarchy levels as of December 31, 2023:
| | | | | | | | | | | | | | | | |
| | | Level 1 | | | Level 21 | | | Level 3 | | | Total | |
Investments in Securities | | | | | | | | | | | | | | | | |
| | | | |
Common Stocks | | | | | | | | | | | | | | | | |
Industrials | | $ | 5,691,765 | | | $ | 51,163,733 | | | | — | | | $ | 56,855,498 | |
| | | | |
Financials | | | — | | | | 19,091,908 | | | | — | | | | 19,091,908 | |
| | | | |
Information Technology | | | 7,297,226 | | | | 11,339,228 | | | | — | | | | 18,636,454 | |
| | | | |
Consumer Discretionary | | | 7,098,285 | | | | 10,725,832 | | | | — | | | | 17,824,117 | |
| | | | |
Consumer Staples | | | 7,015,859 | | | | 7,564,186 | | | | — | | | | 14,580,045 | |
| | | | |
Communication Services | | | — | | | | 14,263,003 | | | | — | | | | 14,263,003 | |
| | | | |
Health Care | | | — | | | | 11,456,752 | | | | — | | | | 11,456,752 | |
| | | | |
Materials | | | 2,367,871 | | | | 8,146,311 | | | | — | | | | 10,514,182 | |
| | | | |
Real Estate | | | — | | | | 9,666,950 | | | | — | | | | 9,666,950 | |
| | | | |
Energy | | | 2,031,486 | | | | 3,228,438 | | | | — | | | | 5,259,924 | |
| | | | |
Utilities | | | — | | | | 3,584,772 | | | | — | | | | 3,584,772 | |
Preferred Stock | | | | | | | | | | | | | | | | |
Industrials | | | — | | | | 1,029,217 | | | | — | | | | 1,029,217 | |
Short-Term Investments | | | | | | | | | | | | | | | | |
| | | | |
Joint Repurchase Agreements | | | — | | | | 9,692,940 | | | | — | | | | 9,692,940 | |
| | | | | | | | | | | | | | | | |
Total Investment in Securities | | $ | 31,502,492 | | | $ | 160,953,270 | | | | — | | | $ | 192,455,762 | |
| | | | | | | | | | | | | | | | |
| 1 | An external pricing service is used to reflect any impact on security value due to market movements between the time the Fund valued such foreign securities and the earlier closing of foreign markets. |
For the fiscal year ended December 31, 2023, there were no transfers in or out of Level 3.
The country allocation in the Schedule of Portfolio Investments at December 31, 2023, was as follows:
| | |
| Country | | % of Long-Term
Investments |
| |
Australia | | 9.5 |
| |
Canada | | 4.6 |
| |
Denmark | | 2.8 |
| |
Finland | | 2.6 |
| |
France | | 7.5 |
| |
Germany | | 3.0 |
| |
Ireland | | 3.1 |
| |
Israel | | 2.5 |
| |
Italy | | 3.1 |
| |
Japan | | 30.4 |
| |
Netherlands | | 2.6 |
| | |
| Country | | % of Long-Term
Investments |
| |
Norway | | 0.4 |
| |
Spain | | 5.7 |
| |
Sweden | | 4.1 |
| |
Switzerland | | 1.9 |
| |
Taiwan | | 1.1 |
| |
United Kingdom | | 12.7 |
| |
United States | | 1.0 |
| |
Uruguay | | 1.4 |
| | |
| |
| | | 100.0 |
| | |
The accompanying notes are an integral part of these financial statements.
26
| | |
| | | AMG TimesSquare Emerging Markets Small Cap Fund Portfolio Manager’s Comments (unaudited) |
| | | |
| | | |
| | | | | | | | |
Year in Review For the year ended December 31, 2023, AMG TimesSquare Emerging Markets Small Cap Fund (the “Fund”) Class I shares returned 24.46%, while its benchmark, the MSCI Emerging Markets Small Cap Index, returned 23.92%. 2023 started off with a rollercoaster ride for global equity markets in the first quarter, followed by a steady climb in the second quarter, a decline in the third quarter, and ended the year with a strong rebound in the fourth quarter. The fourth quarter rebound was bolstered by central banks pausing rates increases, but it may be premature to declare victory over inflation and plot a near term pivot to monetary easing. That speculation led to a rally benefiting global equities—especially small & microcaps and emerging markets. Most factors finished the year in positive territory. However, it was Beta and Book to Price that significantly outpaced other style factors in 2023. With the exception of consumer discretionary, all sectors generated positive returns with information technology, industrials, and financials leading the way. As our investment team meets with companies, reviews recent earnings reports, and surveys the global landscape, they note several investment dynamics that inform our positioning: • Technology investment & technology adoption remains an important theme throughout Emerging Markets (EM): Taiwanese and Korean companies are important enablers of latest advancements in hardware (driven by artificial intelligence (AI) and continued demand by companies to make chips smaller, faster, and more efficient). China’s self-sufficiency drive and the vast amount of related investment and government support continues unabated. India is investing heavily in attracting high tech manufacturing, tech localization, and moving up the value chain. We continue to see EM companies make use of the latest innovations in emarketing, CRM, Big Data, and even AI in their businesses. • Regional elections may present risks but are largely expected to extend the status quo: Taiwan, Indonesia, India, Mexico, and South Africa will hold presidential and key legislative elections. The U.S. Presidential election will also be held in 2024, and both the run up and election results could have global ramifications, especially as it relates to U.S.-China relations. | | | | • China: Localization and import substitution are major trends, either due to geopolitical concerns in the case of the technology industry, or trading down to cheaper domestic products due to consumer weakness. Meanwhile, both Chinese and multinational companies continue to seek other manufacturing centers in the region, or re-shore them completely, which should benefit Southeast Asia, Mexico, and India. The AMG TimesSquare Emerging Markets Small Cap Fund slightly outperformed the MSCI Emerging Markets Small Cap benchmark during 2023. Relative weakness in Asia was offset by relative strength in Europe, Middle East and Africa (EMEA) and Frontier markets. Regional Performance: Asia Within Asia, the Fund’s performance was mixed, with holdings in India, Korea, and Taiwan outperforming, while those in China, Malaysia, and Indonesia underperformed. Initial optimism surrounding China’s reopening evaporated, triggering a pullback, particularly among those companies that were viewed as beneficiaries. For example, the portfolio’s largest detractor, Hong Kong noodle restaurant chain Tam Jai International, noted that their Hong Kong restaurant traffic has returned near pre-COVID levels, with increasing visits from mainland Chinese tourists. While their pre-COVID new restaurant opening plan in mainland China remains on track, Tam Jai’s stock price still declined -48% this year. We capitalized on this weakness by adding to our position. In the first quarter we initiated positions in China’s largest private assisted reproduction service (“ARS”) provider, Jinxin Fertility Group and the country’s leading running shoe manufacturer, Xtep International Holding. As a leader in the ARS market and with China’s current demographic situation, we believe Jinxin stands to benefit from the long-term structural growth of China’s assisted reproductive market. In their latest update, management reiterated their full-year guidance. China’s weaker-than-expected consumer recovery weighed on Xtep. The company benefited from increased local buying versus global competitors with significantly improved quality, lower prices, and a shift in consumer sentiment favoring domestic brands. However, they faced challenges from overall weak | | | | consumer sentiment. Xtep reported soft Singles Day (China’s largest online shopping festival) sales and revised their annual guidance downwards. Jinxin and Xtep declined by -57% and -44%, respectively. Across the strait , two of our information technology holdings, Alchip Technologies and WinWay Technology, surged 305% and 98%, respectively. The Fund’s top contributor, Alchip, manufactures application specific IC (“ASIC”) as well as system on a chip (“SoC”) for complex, high growth applications such as AI and higher-performance computing. Management issued strong 2023 guidance and a bullish medium-term growth outlook. With end customers moving into more customized products, Alchip is seeing strong growing demand. WinWay Technology is a leading Taiwanese provider of semiconductor testing interfaces, with a particular focus on higher end interfaces. The company’s strong position in the TSMC (Taiwan Semiconductor Manufacturing Company) ecosystem has allowed it to benefit from more complex chipsets which require increasingly customized solutions, particularly for AI, high performance computing (“HPC”), and graphic processing applications. These higher complexity orders are more resilient than consumer / smartphone chipsets, which have allowed the company to charge higher prices (and achieve greater margins). WinWay will become more self sufficient in probe pins beginning in mid 2023, further supporting gross margin expansion. India has emerged as one of the beneficiaries of the shift in supply chains away from China. RailTel Corp. of India, which provides telecommunication services including video conferencing, data center, broadband, virtual private network, and consulting services, has seen its project revenues grow as supply chain pressures ease. The company’s order backlog remains healthy, and investors have been further encouraged by its recent success in securing several large contracts supporting connectivity investments for Indian railways. Kalyan Jewelers owns and operates jewelry stores that offer gold, diamond, platinum, and silver jewelry. Despite volatile gold prices, Kalyan delivered better results than its peers driven by franchise led retail expansion. BSE (formerly Bombay Stock Exchange) continues to benefit from the digitization of Indian capital market. Since the relaunch of the BSE Sensex 30 and Broker derivative contracts in mid May 2023, the exchange has seen better-than-expected growth |
27
| | |
| | | AMG TimesSquare Emerging Markets Small Cap Fund Portfolio Manager’s Comments (continued) |
| | | |
| | | |
| | | | | | | | |
and strong momentum. Cyient is an outsourced provider of engineering research and development services. The company reported solid quarterly results driven by steady growth in their consolidated services segment. Demand across its key verticals remains healthy and the company has undertaken multiple cost cutting initiatives, which should further drive margin improvement. We trimmed all four positions with them jumping 162%, 151%, 247%, and 167%, respectively. South Korea’s leading carrier-neutral internet data center and its only carrier-neutral internet exchange operator, KINX, continues to benefit from surging demand for data centers driven by the proliferation of AI and cloud computing. Shares of KINX rose 79%. Southeast Asia was an area of weakness in the region. Lower-than-targeted cash collection from both non-performing loans and non-performing assets hurt Thailand’s largest domestic non-performing asset manager, Bangkok Commercial Asset Management. The increase in operating expenses was another factor behind the company’s below-expectations third quarter results, which drove down its share price by 46%. One Enterprise (“ONEE”) is a leading media entertainment company that produces media content that gets monetized across both online platforms as well as its own traditional TV channels. We exited the position in the second quarter due to concerns over prolonged advertising weakness. The share price of ONEE declined -51% while it was held in the portfolio during the year. Regional Performance: EMEA While EMEA was the weakest performing region in the benchmark, the Fund’s relative strength can be attributed to positive stock selection. However, | | | | foreign exchange as well as geopolitical impacts weighed on some of our companies in this region. Case in point was AlAmar Foods, a master franchise operator for Domino’s in the MENAP (Middle East, North Africa and Pakistan) region and Dunkin’ Donuts in North Africa. The company reported a revenue decline (revenue increase in constant currency) due to devaluations of Egyptian Pound and Lebanese Lira, but we also became concerned over anti-American boycotts across Muslim countries due to the conflict in Israel. South Africa-based Transaction Capital operates through three major segments: SA Taxi, Transaction Capital Risk Services (“TCRS”), and WeBuyCars (“WBC”). SA Taxi specializes in financial vehicles in the minibus taxi industry, TCRS provides debt collection services, and WBC is a platform for buying or selling used vehicles. The company’s Webuycars platform is facing tough margin pressure while management indicated that its SA Taxi business is “unlikely to return to pre COVID levels in the short to medium term.” As a result, we liquidated our positions with both stocks falling -42% and -68% while they were held in the year. The largest outdoor advertiser in Saudi Arabia, Arabian Contracting Services, posted strong results throughout the year. The company is going through the transition of shifting its billboards from static to digital. This transition would expand ad inventory with little incremental spending, as the digital billboards offer more available ad space, are easier to update, can be more interactive, and can provide better measures for advertisers. With its dominant market share, Arabian Contracting Services is well positioned to benefit from the initiatives led by the Vision 2030 programs, which is expected to bring | | | | increased business and tourism activities. The company’s win of the Riyadh airport deal provided another boost to its share price, which ended the year up 121%. Conclusion Looking forward into 2024, markets will keep a close eye on central banks and the polls. Early indications are for some monetary easing, though there is a wide divergence on when that may occur. This year will also be one of the biggest for global elections. Including the U.S., Taiwan, India, Mexico, and expectations for the U.K., there will be nearly 40 national elections. That all but guarantees shifting fiscal policies as over 40% of the world’s population heads to the voting booths. With those influences beyond our control, we focus on how our portfolio companies plan to navigate this environment. Many showed improving fundamentals toward the end of 2023 that we expect to continue into 2024 and beyond. As bottom up investors, we seek underpinnings to near term valuations in the form of expected earnings growth and other business fundamentals. We continuously review the business models and management teams of current and potential holdings, and fine tune our own valuation models on an ongoing basis as we endeavor to protect the assets you have entrusted with us. The views expressed represent the opinions of TimesSquare Capital Management, LLC as of December 31, 2023, and are not intended as a forecast or guarantee of future results, and are subject to change without notice. |
28
|
AMG TimesSquare Emerging Markets Small Cap Fund Portfolio Manager’s Comments (continued) |
CUMULATIVE TOTAL RETURN PERFORMANCE
AMG TimesSquare Emerging Markets Small Cap Fund’s cumulative total return is based on the daily change in net asset value (NAV), and assumes that all dividends and distributions were reinvested. This graph compares a hypothetical $10,000 investment made in the AMG TimesSquare Emerging Markets Small Cap Fund’s Class I shares on December 14, 2016 (inception date), to a $10,000 investment made in the MSCI Emerging Markets Small Cap Index for the same time period. The graph and table do not reflect the deduction of taxes that a shareholder would pay on a Fund distribution or redemption of shares. The listed returns for the Fund are net of expenses and the returns for the index exclude expenses. Total returns would have been lower had certain expenses not been reduced.
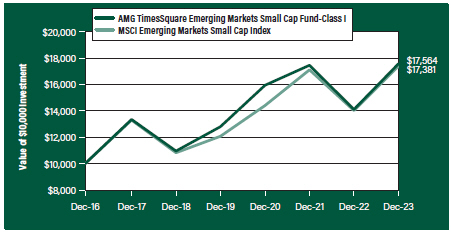
The table below shows the average annual total returns for the AMG TimesSquare Emerging Markets Small Cap Fund and the MSCI Emerging Markets Small Cap Index for the same time periods ended December 31, 2023.
| | | | | | | | | | | | | | | | |
| | | One | | | Five | | | Since | | | Inception | |
| Average Annual Total Returns1 | | Year | | | Years | | | Inception | | | Date | |
|
AMG TimesSquare Emerging Markets Small Cap Fund2,3, 4, 5, 6, 7, 8, 9, 10, 12, 13, 14, 15, 16, 17 | |
| | | | |
Class N | | | 23.90 | % | | | 9.46 | % | | | 6.74 | % | | | 02/24/17 | |
| | | | |
Class I | | | 24.46 | % | | | 9.89 | % | | | 8.32 | % | | | 12/14/16 | |
| | | | |
Class Z | | | 24.34 | % | | | 9.87 | % | | | 8.31 | % | | | 12/14/16 | |
| | | | |
MSCI Emerging Markets Small Cap Index18 | | | 23.92 | % | | | 9.92 | % | | | 8.16 | % | | | 12/14/16 | † |
The performance data shown represents past performance. Past performance is not a guarantee of future results. Current performance may be lower or higher than the performance data quoted. The investment return and principal value of an investment will fluctuate so that an investor’s shares, when redeemed, may be worth more or less than their original cost.
Investors should carefully consider the Fund’s investment objectives, risks, charges and expenses before investing. For performance information through the most recent month end, current net asset values per share for the Fund and other information, please call 800.548.4539 or visit our website at wealth.amg.com for a free prospectus. Read it carefully before investing or sending money.
Distributed by AMG Distributors, Inc., member FINRA/SIPC.
| † | Date reflects the inception date of the Fund, not the index. |
| 1 | Total return equals income yield plus share price change and assumes reinvestment of all dividends and capital gain distributions. Returns are net of fees and may reflect offsets of Fund expenses as described in the prospectus. No adjustment has been made for taxes payable by shareholders on their reinvested dividends and |
|
capital gain distributions. Returns for periods greater than one year are annualized. The listed returns on the Fund are net of expenses and based on the published NAV as of December 31, 2023. All returns are in U.S. Dollars ($). 2 From time to time, the Fund’s Investment Manager has waived its fees and/or absorbed Fund expenses, which has resulted in higher returns. 3 The prices of equity securities of companies that are expected to experience relatively rapid earnings growth, or “growth stocks,” may be more sensitive to market movements because the prices tend to reflect future investor expectations rather than just current profits. 4 Issuers and companies that are in similar industry sectors may be similarly affected by particular economic or market events; to the extent the Fund has substantial holdings within a particular sector, the risks associated with that sector increase. 5 Market prices of investments held by the Fund may fall rapidly or unpredictably due to a variety of factors, including economic, political, or market conditions, or other factors including terrorism, war, natural disasters and the spread of infectious illness or other public health issues, including epidemics or pandemics, or in response to events that affect particular industries or companies. 6 Because the Fund is an actively managed investment portfolio, security selection or focus on securities in a particular style, market sector or group of companies may cause the Fund to incur losses or underperform relative to its benchmarks or other funds with a similar investment objective. There can be no guarantee that the Subadviser’s investment techniques and risk analysis will produce the desired result. 7 The stocks of small-capitalization companies often have greater price volatility, lower trading volume, and less liquidity than the stocks of larger, more established companies. |
8 The Fund may not be able to dispose of particular investments, such as illiquid securities, readily at favorable times or prices or the Fund may have to sell them at a loss. 9 Investments in foreign issuers involve additional risks (such as risks arising from less frequent trading, changes in political or social conditions, and less publicly available information about non-U.S. issuers) that differ from those associated with investments in U.S. issuers and may result in greater price volatility. 10 Investments in emerging markets are subject to the general risks of foreign investments, as well as additional risks which can result in greater price volatility. Such additional risks include the risk that markets in emerging market countries are typically |
29
| | |
| | | AMG TimesSquare Emerging Markets Small Cap Fund Portfolio Manager’s Comments (continued) |
| | | |
| | | |
| | | | |
less developed and less liquid than markets in developed countries and such markets are subjected to increased economic, political, or regulatory uncertainties. 11 Changes in the general political and social environment of a country can have substantial effects on the value of investments exposed to that country. 12 Fluctuations in exchange rates may affect the total loss or gain on a non-U.S. dollar investment when converted back to U.S. dollars and exposure to non-U.S. currencies may subject the Fund to the risk that those currencies will decline in value relative to the U.S. dollar. The values of foreign currencies relative to the U.S. dollar may fluctuate in response to, among other factors, interest rate changes, intervention (or failure to intervene) by national governments, central banks, or supranational entities such as the International Monetary Fund, the imposition of currency controls, and other political or regulatory developments. 13 The use of derivatives involves costs, the risk that the value of derivatives may not correlate perfectly with their underlying assets, rates or indices, liquidity risk, and the risk of mispricing or improper valuation. The use of derivatives may not succeed for various reasons, and the complexity and rapidly | | changing structure of derivatives markets may increase the possibility of market losses. 14 Investments in frontier markets may be more volatile and less liquid than investments in more developed markets or in other emerging market countries. Risks that are characteristic of many emerging markets generally may be especially heightened in frontier markets due to political, economic, financial, or other factors. 15 Higher portfolio turnover may adversely affect Fund performance by increasing Fund transaction costs and may increase a shareholder’s tax liability. 16 Markets in different countries have different clearance and settlement procedures and in certain markets there have been times when settlements have been unable to keep pace with the volume of transactions. 17 To the extent that a large number of shares of the Fund is held by a single shareholder (e.g., an institutional investor) or a group of shareholders with a common investment strategy, the Fund is subject to the risk that a redemption or large purchase by that shareholder or group of all or a large portion of its Fund shares will require the Fund to sell securities, or to invest additional cash, as the case may be, at disadvantageous prices, disrupt the Fund’s operations, or force the Fund’s | | liquidation. Purchases of a large number of shares may adversely affect the Fund’s performance to the extent that it takes time to invest new cash and the Fund maintains a larger cash position than it ordinarily would. 18 MSCI Emerging Markets Small Cap Index includes small cap representation across 24 Emerging Markets countries. The small cap segment tends to capture more local economic and sector characteristics relative to larger Emerging Markets capitalization segments. Please go to msci.com for most current list of countries represented by the index. Unlike the Fund, the MSCI Emerging Markets Small Cap Index is unmanaged, is not available for investment and does not incur expenses. All MSCI data is provided “as is.” The products described herein are not sponsored or endorsed and have not been reviewed or passed on by MSCI. In no event shall MSCI, its affiliates or any MSCI data provider have any liability of any kind in connection with the MSCI data or the products described herein. Copying or redistributing the MSCI data is strictly prohibited. Not FDIC insured, nor bank guaranteed. May lose value. |
30
| | |
| | | AMG TimesSquare Emerging Markets Small Cap Fund Fund Snapshots (unaudited) December 31, 2023 |
PORTFOLIO BREAKDOWN
| | | | | |
| Sector | | % of Net Assets |
| | |
Information Technology | | 23.3 |
| | |
Consumer Discretionary | | 16.1 |
| | |
Industrials | | 13.9 |
| | |
Health Care | | 13.6 |
| | |
Financials | | 11.7 |
| | |
Communication Services | | 7.1 |
| | |
Consumer Staples | | 7.1 |
| | |
Materials | | 3.8 |
| | |
Real Estate | | 3.3 |
| | |
Energy | | 1.7 |
| | |
Utilities | | 0.7 |
| | |
Short-Term Investments | | 1.2 |
| | |
Other Assets, less Liabilities | | (3.5) |
TOP TEN HOLDINGS
| | |
| |
| Security Name | | % of Net Assets |
| | |
KINX, Inc. (South Korea) | | 2.4 |
| | |
LIG Nex1 Co., Ltd. (South Korea) | | 2.1 |
| | |
Andes Technology Corp. (Taiwan) | | 1.9 |
| | |
Green World FinTech Service Co., Ltd. (Taiwan) | | 1.9 |
| | |
M31 Technology Corp. (Taiwan) | | 1.8 |
| | |
Grupo Traxion SAB de CV (Mexico) | | 1.7 |
| | |
Kalyan Jewellers India, Ltd. (India) | | 1.7 |
| | |
Despegar.com Corp. (Argentina) | | 1.7 |
| | |
AKR Corporindo Tbk PT (Indonesia) | | 1.7 |
| | |
Cyient, Ltd. (India) | | 1.6 |
| | |
| | | |
| | |
Top Ten as a Group | | 18.5 |
| |
| | |
Because a fund’s strategy may result in multiple investments in particular sectors of the economy, its performance may depend on the performance of those sectors and may fluctuate more widely than investments diversified across more sectors. For additional information on these and other risk considerations, please see the Fund’s prospectus.
Any sectors, industries, or securities discussed should not be perceived as investment recommendations. Mention of a specific security should not be considered a recommendation to buy or solicitation to sell that security. Specific securities mentioned in this report may have been sold from the Fund’s portfolio of investments by the time you receive this report.
31
| | |
| | | AMG TimesSquare Emerging Markets Small Cap Fund Schedule of Portfolio Investments December 31, 2023 |
| | | | | | | | |
| | | Shares | | | Value | |
| | |
Common Stocks - 102.3% | | | | | | | | |
| |
Communication Services - 7.1% | | | | | |
| | |
Arabian Contracting Services Co. (Saudi Arabia) | | | 400 | | | | $25,280 | |
| | |
Converge ICT Solutions, Inc. (Philippines)* | | | 129,200 | | | | 19,553 | |
| | |
KINX, Inc. (South Korea)* | | | 600 | | | | 46,318 | |
| | |
Megacable Holdings SAB de CV (Mexico) | | | 8,100 | | | | 18,055 | |
| | |
Railtel Corp. of India, Ltd. (India) | | | 6,509 | | | | 26,435 | |
| | |
Total Communication Services | | | | | | | 135,641 | |
| |
Consumer Discretionary - 16.1% | | | | | |
| | |
Arcos Dorados Holdings, Inc., Class A (Uruguay) | | | 2,100 | | | | 26,649 | |
| | |
Cartrade Tech, Ltd. (India)* | | | 2,000 | | | | 17,143 | |
| | |
Despegar.com Corp. (Argentina)* | | | 3,400 | | | | 32,164 | |
| | |
JUMBO SA (Greece) | | | 700 | | | | 19,412 | |
| | |
Kalyan Jewellers India, Ltd. (India) | | | 7,669 | | | | 32,597 | |
| | |
Minor International PCL (Thailand) | | | 21,800 | | | | 18,814 | |
| | |
momo.com, Inc. (Taiwan) | | | 35 | | | | 580 | |
| | |
MR DIY Group M Bhd (Malaysia)1 | | | 64,400 | | | | 20,322 | |
| | |
OPAP, S.A. (Greece) | | | 1,200 | | | | 20,361 | |
| | |
PDS, Ltd. (India) | | | 2,390 | | | | 15,816 | |
| | |
Raymond, Ltd. (India) | | | 1,100 | | | | 22,761 | |
| | |
Restaurant Brands Asia, Ltd. (India)* | | | 11,523 | | | | 15,468 | |
| | |
Tam Jai International Co., Ltd. (Hong Kong) | | | 152,800 | | | | 24,645 | |
| | |
Varroc Engineering, Ltd. (India)*,1 | | | 3,100 | | | | 20,631 | |
| | |
Xtep International Holdings, Ltd. (China) | | | 35,100 | | | | 19,842 | |
| | |
Total Consumer Discretionary | | | | | | | 307,205 | |
| |
Consumer Staples - 7.1% | | | | | |
| | |
Al-Dawaa Medical Services Co. (Saudi Arabia) | | | 800 | | | | 22,513 | |
| | |
Coca-Cola Icecek A.S. (Turkey) | | | 1,400 | | | | 24,896 | |
| | |
Fraser & Neave Holdings Bhd (Malaysia) | | | 3,300 | | | | 20,224 | |
| | |
Giant Biogene Holding Co., Ltd. (Cayman Islands)*,1 | | | 5,032 | | | | 22,953 | |
| | |
Universal Robina Corp. (Philippines) | | | 9,400 | | | | 20,047 | |
| | |
ZJLD Group, Inc. (Cayman Islands)*,1 | | | 19,150 | | | | 24,085 | |
| | |
Total Consumer Staples | | | | | | | 134,718 | |
| |
Energy - 1.7% | | | | | |
| | |
AKR Corporindo Tbk PT (Indonesia) | | | 333,000 | | | | 31,901 | |
| |
Financials - 11.7% | | | | | |
| | |
Bangkok Commercial Asset Management PCL (Thailand) | | | 55,700 | | | | 13,276 | |
| | |
BSE, Ltd. (India) | | | 669 | | | | 17,843 | |
| | |
Central Depository Services India, Ltd. (India) | | | 1,020 | | | | 22,346 | |
| | |
The Co. for Cooperative Insurance (Saudi Arabia) | | | 300 | | | | 10,432 | |
| | |
Green World FinTech Service Co., Ltd. (Taiwan) | | | 2,387 | | | | 35,606 | |
| | |
| | | | | | | | |
| | | | | | | | |
| | | Shares | | | Value | |
| | |
Kfin Technologies, Ltd. (India)* | | | 3,300 | | | | $19,136 | |
| | |
One 97 Communications, Ltd. (India)* | | | 2,641 | | | | 20,144 | |
| | |
PB Fintech, Ltd. (India)* | | | 2,291 | | | | 21,857 | |
| | |
Prudent Corporate Advisory Services, Ltd. (India) | | | 1,300 | | | | 18,781 | |
| | |
Tracxn Technologies, Ltd. (India)* | | | 17,781 | | | | 23,290 | |
| | |
Yeahka, Ltd. (China)*,2 | | | 10,500 | | | | 19,823 | |
| | |
Total Financials | | | | | | | 222,534 | |
| |
Health Care - 13.6% | | | | | |
| | |
Arrail Group, Ltd. (China)*,1 | | | 21,700 | | | | 19,953 | |
| | |
Bio Plus Co., Ltd. (South Korea) | | | 5,300 | | | | 28,187 | |
| | |
Bora Pharmaceuticals Co., Ltd. (Taiwan) | | | 1,139 | | | | 23,715 | |
| | |
Burjeel Holdings PLC (United Arab Emirates) | | | 10,949 | | | | 9,271 | |
| | |
Caregen Co., Ltd. (South Korea) | | | 1,290 | | | | 27,472 | |
| | |
CM Hospitalar, S.A. (Brazil)* | | | 6,300 | | | | 18,092 | |
| | |
Jeisys Medical, Inc. (South Korea)* | | | 2,890 | | | | 23,456 | |
| | |
Jinxin Fertility Group, Ltd. (China)*,1 | | | 47,100 | | | | 20,213 | |
| | |
Lotus Pharmaceutical Co., Ltd. (Taiwan) | | | 3,100 | | | | 27,446 | |
| | |
PharmaResearch Co., Ltd. (South Korea)* | | | 200 | | | | 16,916 | |
| | |
Shanghai Kindly Medical Instruments Co., Ltd., Class H (China) | | | 3,800 | | | | 13,943 | |
| | |
T&L Co., Ltd. (South Korea) | | | 600 | | | | 18,610 | |
| | |
Universal Vision Biotechnology Co., Ltd. (Taiwan) | | | 1,206 | | | | 10,876 | |
| | |
Total Health Care | | | | | | | 258,150 | |
| |
Industrials - 13.9% | | | | | |
| | |
Allcargo Logistics, Ltd. (India) | | | 5,200 | | | | 20,093 | |
| | |
Allcargo Terminals, Ltd. (India) | | | 13,900 | | | | 8,752 | |
| | |
Container Corp. Of India, Ltd. (India) | | | 200 | | | | 2,064 | |
| | |
Frontken Corp. Bhd (Malaysia) | | | 28,850 | | | | 20,319 | |
| | |
GMM Pfaudler, Ltd. (India) | | | 1,000 | | | | 19,357 | |
| | |
Grupo Aeroportuario del Centro Norte SAB de CV (Mexico) | | | 2,800 | | | | 29,613 | |
| | |
Grupo Traxion SAB de CV (Mexico)*,1 | | | 16,300 | | | | 33,414 | |
| | |
Hanwha Aerospace Co., Ltd. (South Korea) | | | 250 | | | | 24,118 | |
| | |
InPost, S.A. (Poland)* | | | 1,271 | | | | 17,598 | |
| | |
LIG Nex1 Co., Ltd. (South Korea) | | | 400 | | | | 40,491 | |
| | |
Maharah Human Resources Co. (Saudi Arabia) | | | 1,260 | | | | 26,263 | |
| | |
Praj Industries, Ltd. (India) | | | 3,356 | | | | 22,413 | |
| | |
Total Industrials | | | | | | | 264,495 | |
| |
Information Technology - 23.3% | | | | | |
| | |
Accton Technology Corp. (Taiwan) | | | 100 | | | | 1,700 | |
| | |
Alchip Technologies, Ltd. (Taiwan) | | | 200 | | | | 21,252 | |
| | |
Andes Technology Corp. (Taiwan) | | | 2,300 | | | | 35,901 | |
| | |
Brogent Technologies, Inc. (Taiwan) | | | 2,500 | | | | 9,278 | |
| | |
Chinasoft International, Ltd. (China) | | | 37,800 | | | | 29,015 | |
| | |
| | | | | | | | |
The accompanying notes are an integral part of these financial statements.
32
| | |
| | | AMG TimesSquare Emerging Markets Small Cap Fund Schedule of Portfolio Investments (continued) |
| | | | | | | | |
| | | Shares | | | Value | |
| | |
Information Technology - 23.3% (continued) | | | | | | | | |
| | |
Cyient, Ltd. (India) | | | 1,104 | | | | $30,404 | |
| | |
eCloudvalley Digital Technology Co., Ltd. (Taiwan) | | | 6,851 | | | | 29,721 | |
| | |
Elite Material Co., Ltd. (Taiwan) | | | 1,750 | | | | 21,731 | |
| | |
Intellian Technologies, Inc. (South Korea) | | | 453 | | | | 25,388 | |
| | |
ISC Co., Ltd. (South Korea) | | | 250 | | | | 15,484 | |
| | |
Locaweb Servicos de Internet, S.A. (Brazil)1 | | | 17,400 | | | | 21,528 | |
| | |
M31 Technology Corp. (Taiwan) | | | 1,000 | | | | 34,425 | |
| | |
Metrodata Electronics Tbk PT (Indonesia) | | | 861,800 | | | | 29,945 | |
| | |
Route Mobile, Ltd. (India) | | | 982 | | | | 18,853 | |
| | |
SOLUM Co., Ltd. (South Korea)* | | | 1,350 | | | | 28,562 | |
| | |
Text S.A. (Poland) | | | 500 | | | | 14,715 | |
| | |
TOTVS, S.A. (Brazil) | | | 2,559 | | | | 17,748 | |
| | |
Venustech Group, Inc., Class A (China) | | | 4,800 | | | | 18,253 | |
| | |
WinWay Technology Co., Ltd. (Taiwan) | | | 1,000 | | | | 27,260 | |
| | |
WONIK IPS Co., Ltd. (South Korea) | | | 500 | | | | 13,107 | |
| | |
Total Information Technology | | | | | | | 444,270 | |
| |
Materials - 3.8% | | | | | |
| | |
EPL, Ltd. (India) | | | 10,000 | | | | 24,247 | |
| | |
NANOTIM Corp. (South Korea)* | | | 2,100 | | | | 25,140 | |
| | |
Samator Indo Gas Tbk PT (Indonesia) | | | 239,800 | | | | 23,673 | |
| | |
Total Materials | | | | | | | 73,060 | |
| |
Real Estate - 3.3% | | | | | |
| | |
Cencosud Shopping, S.A. (Chile) | | | 12,000 | | | | 19,205 | |
| | |
Corp. Inmobiliaria Vesta SAB de CV (Mexico) | | | 4,050 | | | | 16,061 | |
| | |
Multiplan Empreendimentos Imobiliarios, S.A. (Brazil) | | | 3,400 | | | | 19,892 | |
| | |
TransIndia Real Estate, Ltd. (India)* | | | 13,900 | | | | 7,584 | |
| | |
Total Real Estate | | | | | | | 62,742 | |
| | |
| | | | | | | | |
| * | Non-income producing security. |
| 1 | Security exempt from registration under Rule 144A of the Securities Act of 1933. These securities may be resold in transactions exempt from registration, normally to qualified institutional buyers. At December 31, 2023, the value of these securities amounted to $183,099 or 9.6% of net assets. |
| 2 | Some of these securities, amounting to $14,867 or 0.8% of net assets, were out on loan to various borrowers and are collateralized by cash. See Note 4 of Notes to Financial Statements. |
| | | | | | | | |
| | | Shares | | | Value | |
| |
Utilities - 0.7% | | | | | |
| | |
Emirates Central Cooling Systems Corp. (United Arab Emirates) | | | 27,600 | | | | $12,475 | |
| | |
Total Common Stocks
(Cost $1,638,430) | | | | | | | 1,947,191 | |
| | |
| | | Principal | | | | |
| | | Amount | | | | |
| |
Short-Term Investments - 1.2% | | | | | |
| |
Joint Repurchase Agreements - 0.8%3 | | | | | |
| | |
RBC Dominion Securities, Inc., dated 12/29/23, due 01/02/24, 5.340% total to be received $15,656 (collateralized by various U.S. Government Agency Obligations and U.S. Treasuries, 0.000% - 7.500%, 01/15/24 - 12/01/53, totaling $15,960) | | | $15,647 | | | | 15,647 | |
| | |
| | | Shares | | | | |
| |
Other Investment Companies - 0.4% | | | | | |
| | |
Dreyfus Government Cash Management Fund, Institutional Shares, 5.25%4 | | | 3,129 | | | | 3,129 | |
| | |
Dreyfus Institutional Preferred Government Money Market Fund, Institutional Shares, 5.32%4 | | | 4,693 | | | | 4,693 | |
| | |
Total Other Investment Companies | | | | | | | 7,822 | |
| | |
Total Short-Term Investments
(Cost $23,469) | | | | | | | 23,469 | |
| | |
Total Investments - 103.5%
(Cost $1,661,899) | | | | | | | 1,970,660 | |
| |
Other Assets, less Liabilities - (3.5)% | | | | (66,357 | ) |
| | |
Net Assets - 100.0% | | | | | | | $1,904,303 | |
| | |
| | | | | | | | |
| 3 | Cash collateral received for securities lending activity was invested in these joint repurchase agreements. |
| 4 | Yield shown represents the December 31, 2023, seven day average yield, which refers to the sum of the previous seven days’ dividends paid, expressed as an annual percentage. |
The accompanying notes are an integral part of these financial statements.
33
| | |
| | | AMG TimesSquare Emerging Markets Small Cap Fund Schedule of Portfolio Investments (continued) |
The following table summarizes the inputs used to value the Fund’s investments by the fair value hierarchy levels as of December 31, 2023:
| | | | | | | | | | | | | | | | |
| | | Level 1 | | | Level 21 | | | Level 3 | | | Total | |
| | | | |
Investments in Securities | | | | | | | | | | | | | | | | |
| | | | |
Common Stocks | | | | | | | | | | | | | | | | |
| | | | |
Information Technology | | | $83,936 | | | | $360,334 | | | | — | | | | $444,270 | |
| | | | |
Consumer Discretionary | | | 118,908 | | | | 188,297 | | | | — | | | | 307,205 | |
| | | | |
Industrials | | | 63,027 | | | | 201,468 | | | | — | | | | 264,495 | |
| | | | |
Health Care | | | 71,031 | | | | 187,119 | | | | — | | | | 258,150 | |
| | | | |
Financials | | | 10,432 | | | | 212,102 | | | | — | | | | 222,534 | |
| | | | |
Communication Services | | | 43,335 | | | | 92,306 | | | | — | | | | 135,641 | |
| | | | |
Consumer Staples | | | 20,224 | | | | 114,494 | | | | — | | | | 134,718 | |
| | | | |
Materials | | | 23,673 | | | | 49,387 | | | | — | | | | 73,060 | |
| | | | |
Real Estate | | | 62,742 | | | | — | | | | — | | | | 62,742 | |
| | | | |
Energy | | | 31,901 | | | | — | | | | — | | | | 31,901 | |
| | | | |
Utilities | | | 12,475 | | | | — | | | | — | | | | 12,475 | |
| | | | |
Short-Term Investments | | | | | | | | | | | | | | | | |
| | | | |
Joint Repurchase Agreements | | | — | | | | 15,647 | | | | — | | | | 15,647 | |
| | | | |
Other Investment Companies | | | 7,822 | | | | — | | | | — | | | | 7,822 | |
| | | | | | | | | | | | | | | | |
| | | | |
Total Investment in Securities | | | $549,506 | | | | $1,421,154 | | | | — | | | | $1,970,660 | |
| | | | | | | | | | | | | | | | |
| 1 | An external pricing service is used to reflect any impact on security value due to market movements between the time the Fund valued such foreign securities and the earlier closing of foreign markets. |
For the fiscal year ended December 31, 2023, there were no transfers in or out of Level 3.
The country allocation in the Schedule of Portfolio Investments at December 31, 2023, was as follows:
| | |
| |
| Country | | % of Long-Term Investments |
| |
Argentina | | 1.7 |
| |
Brazil | | 4.0 |
| |
Cayman Islands | | 2.4 |
| |
Chile | | 1.0 |
| |
China | | 7.2 |
| |
Greece | | 2.0 |
| |
Hong Kong | | 1.3 |
| |
India | | 23.0 |
| |
Indonesia | | 4.4 |
| |
Malaysia | | 3.1 |
| |
Mexico | | 5.0 |
| | |
| |
| Country | | % of Long-Term Investments |
| |
Philippines | | 2.0 |
| |
Poland | | 1.7 |
| |
Saudi Arabia | | 4.3 |
| |
South Korea | | 17.1 |
| |
Taiwan | | 14.4 |
| |
Thailand | | 1.6 |
| |
Turkey | | 1.3 |
| |
United Arab Emirates | | 1.1 |
| |
Uruguay | | 1.4 |
| | |
| |
| | 100.0 |
| |
| | |
The accompanying notes are an integral part of these financial statements.
34
| | |
| | | AMG TimesSquare Global Small Cap Fund Portfolio Manager’s Comments (unaudited) |
| | | |
| | | |
| | | | | | | | |
Year in Review For the year ended December 31, 2023, AMG TimesSquare Global Small Cap Fund (the “Fund”) Class N shares returned 13.62% while its benchmark, the MSCI World Small Cap Index, returned 15.76%. 2023 started off with a rollercoaster ride for global equity markets in the first quarter, followed by a steady climb in the second quarter, a decline in the third quarter, and ended the year with a strong rebound in the fourth quarter. The fourth quarter rebound was bolstered by central banks pausing rates increases, but it may be premature to declare victory over inflation and plot a near-term pivot to monetary easing. That speculation led to a rally benefiting global equities—especially small & microcaps and emerging markets. Concerns surrounding wage inflation and access to skilled workers generally subsided across markets, with the notable exception of Japan where that remains a significant challenge. Most factors finished the year in positive territory. However, it was Beta and Book to Price that significantly outpaced other style factors in 2023. Within the global small cap universe, the Americas outperformed other regions. With the exception of utilities, all sectors generated positive returns with information technology, industrials, and consumer discretionary leading the way. As our investment team meets with companies, reviews recent earnings reports, and surveys the global landscape, they note several investment dynamics that inform our positioning: • Technology: Cybersecurity remains a top priority for companies, propelled by recent well publicized cyberattacks and new Securities and Exchange Commission (SEC) disclosure rules on cyber risks that took effect in December 2023. Our channel checks indicate that information technology (IT) budgets will continue growing, with cybersecurity becoming an increasing percentage. Interest continues to grow in machine learning and generative artificial intelligence (AI) tools and applications, though companies approach this area cautiously given the costs and fast paced changes. • Industrials: Many years of prior underinvestment leave significant ground to recover that recent government programs have only begun to address. Industrial capital expenditures may continue to be a bright spot for several years as structural labor challenges are addressed with greater automation and supply chains move closer to home, particularly away from China. | | | | • China: Localization and import substitution are major trends, either due to geopolitical concerns in the case of the technology industry, or trading down to cheaper domestic products due to consumer weakness. Meanwhile, both Chinese and multinational companies continue to seek other manufacturing centers in the region, or re-shore them completely, which should benefit Southeast Asia, Mexico, and India. Fund Performance Review The Fund underperformed the MSCI World Small Cap benchmark during 2023 due to relative weakness in Europe, Japan, and Asia/Pacific ex Japan. Regional Performance: The Americas Strong stock selection in the Americas contributed to the Fund’s outperformance in the region. Within consumer discretionary, National Vision is an optical specialty retailer operating under the America’s Best, Eyeglass World, and Visa Optical brands. Their fourth quarter 2022 earnings came up short versus sell side projections, though revenues were in line. Management cited a difficult operating environment, particularly for their lower income customers. The company’s 2023 outlook was slightly below estimates, incorporating continuing constraints on eye exam capacity due to a shortage of optometrists. We decided to liquidate the position in the first quarter, which fell (40)% for the time it was held in 2023. Another sale was Planet Fitness, which franchises fitness centers across the U.S. Its shares had been weak earlier in the year and we trimmed ahead of its earnings report in early August given general concerns about consumer-focused businesses. While it subsequently reported better-than-expected trailing results, Planet announced a slower future pace for new store openings. Then in September the company’s board discharged its CEO over differing views on how best to move the company forward. In our follow-up discussion with the CFO and interim CEO, we were not convinced a positive change was near, so we sold our remaining position as the stock fell (35)% during the partial year. Many of our industrials positions provide necessary business to business operational services, highly technical components, automation and efficiency improvements, or essential infrastructure services. WNS Holdings is a business process management company supplying data, voice, analytical, and transformation services. Its results were in line with expectations, though management reduced guidance for the balance of its fiscal year. Although | | | | the core business continued generating significant cash flows, WNS noted that a recently signed contract for a captive insurance operation was taking longer than expected to start—and generate revenues. The company also saw hesitancy from a travel industry client who projected more conservative growth levels. Out of caution, recognizing some of these one-offs need to clear before its shares reaccelerate, we reduced our position in WNS. There was a strong contribution from the global welding company Easb Corporation. Revenues and earnings outstripped expectations. Business activity was stronger than anticipated with resilience in most markets and steady volumes, especially from emerging markets. Easb’s management increased its guidance, and we trimmed our position during its 85% climb. Improving 46% was EMCOR Group, which provides electrical, mechanical, and facilities services primarily in the U.S. and U.K. The company reported a better-than-expected quarter with improving margins and strong bookings momentum. Management increased guidance for the rest of the year. In the financials sector we tend to avoid banks that face credit deterioration or rising deposit costs. However, through our bottom up research process, we identified Webster Financial Corp. (the holding company for Webster Bank) as a high quality bank candidate that is suitable for this Fund. The company is seeing deposit costs moderating and benefiting from the increase in interest rates since the majority of the company’s loan book is floating rate. The bank reported solid third quarter results with an improving net interest margin driven by robust core deposit growth, and its share price jumped 40% since it was added to the Fund in the third quarter. A rebound in the PC and smartphone markets benefited Synaptics, a developer of human interface technologies for a variety of devices. Synaptics’ fiscal quarterly revenues and earnings surpassed expectations thanks to that stabilization, and its management expects a further recovery in 2024. The company also won several new design mandates. That gave its shares a 28% lift. |
35
| | |
| | | AMG TimesSquare Global Small Cap Fund Portfolio Manager’s Comments (continued) |
| | | |
| | | |
| | | | | | | | |
Regional Performance: Europe Recognizing the geopolitical landscape and economic reality, we continued to reduce our position in Europe. For the year, underperformance in the region was driven by stock selection. In the U.K., wealth manager St. James’s Place has been a long-time holding in the Fund. A regulatory change in the industry placed a lower cap on company fees for long-duration bond and pension investments. This will create headwinds for St. James going forward. Spirent Communications is a leading provider of automated testing and assurance solutions for networks, security, and positioning (GPS). The company noted prolonged order delays in 5G investment from telecom carriers, which led its FY23 revenue guidance lower. We exited our positions in St. James’s Place and Spirent, which lost (36)% and (31)%, respectively, while they were held this year. The Fund’s largest detractor was Keywords Studios, a provider of outsourced creative and technical services to the video game industry. The company reported resilient first half 2023 results, but speculation on potential disruption by Ai has created volatility for business outsourcing companies. The company also noted impact from the U.S. writer/actor strikes. As a result, the stock traded down (35)%. We believe Keywords Studios dominant exposure in the growing market and its long-standing client relationships will be beneficial in the long run, and the U.S. writer’s strike was resolved at the end of the third quarter. On the positive side, France’s Technip Energy is one of only a handful of companies that can build liquefied natural gas (“LNG”) plants. We trimmed the position with its share price up 52% for the year. Swedish defense equipment manufacturer Saab continued to post strong revenue growth and expand margin. Military spending in the world had been in a long-term decline, though given the current geopolitical situation there should be structural increases in spending. Saab’s share price improved 54%, making it one of the greatest contributors for the year. | | | | Regional Performance: Japan Within Japan there has been a significant shift to Value after the Tokyo Stock Exchange urged companies with low price to book ratios to start focusing on using capital more efficiently. That led active investors to allocate capital into low P/B stocks and created a significant rotation to Value. Though in the short term this stylistic headwind impacts some of our holdings, we believe this could be positive in the long term as companies will be more likely to take excess capital and reallocate to the market. This rotation to Value calmed down somewhat during the fourth quarter. Leading Japanese logistics provider AZ-Com has benefited from recent momentum of freight rate hikes in the logistics industry and ecommerce-related outsourcing services. The company announced the issuance of new shares and secondary offering of shares in November. The dilution in the share price and selling pressure from existing shareholders led to a (28)% slide. We believe the company’s outlook remains solid but reached out to local brokers to voice our disapproval regarding this corporate action. In November we initiated a position in Simplex Holdings, a provider of system development and financial solutions. The company reported impressive new order growth and robust backlog. Its newly released medium term business plan and long-term growth strategy further solidified our confidence in its future prospects. Regional Performance: Asia/Pacific ex Japan and Middle East The share price of Australia’s intellectual property services provider IPH came under pressure due to increased leverage with its recent acquisition in Canada and the lack of organic growth in its home market. We believe the acquisition in Canada was attractive and the reasons for poor sentiment are increasingly behind us. We continue to hold the name even though its shares traded down (24)%. | | | | In Israel CyberArk Software is a global leader in privileged access management (“PAM”). Recent high-profile data breaches fueled investor interest in CyberArk’s solutions. Contrast to its security software peers who reported before them, CyberArk surpassed expectations with stellar results and raised its full-year outlook. The share price of CyberArk climbed 68%, prompting us to trim our position on this price strength. Conclusion Looking forward into 2024, markets will keep a close eye on central banks and the polls. Early indications are for some monetary easing, though there is a wide divergence on when that may occur. This year will also be one of the biggest for global elections. Including the U.S., Taiwan, India, Mexico, and expectations for the U.K., there will be nearly 40 national elections. That all but guarantees shifting fiscal policies as over 40% of the world’s population heads to the voting booths. With those influences beyond our control, we focus on how our portfolio companies plan to navigate this environment. Many showed improving fundamentals toward the end of 2023 that we expect to continue into 2024 and beyond. As bottom up investors, we seek underpinnings to near term valuations in the form of expected earnings growth and other business fundamentals. We continuously review the business models and management teams of current and potential holdings, and fine tune our own valuation models on an ongoing basis, as we endeavor to protect the assets you have entrusted with us. The views expressed represent the opinions of TimesSquare Capital Management, LLC as of December 31, 2023, and are not intended as a forecast or guarantee of future results, and are subject to change without notice. |
36
|
AMG TimesSquare Global Small Cap Fund Portfolio Manager’s Comments (continued) |
CUMULATIVE TOTAL RETURN PERFORMANCE
AMG TimesSquare Global Small Cap Fund’s cumulative total return is based on the daily change in net asset value (NAV), and assumes that all dividends and distributions were reinvested. This graph compares a hypothetical $10,000 investment made in the AMG TimesSquare Global Small Cap Fund’s Class N shares on May 30, 2018 (inception date), to a $10,000 investment made in the MSCI World Small Cap Index for the same time period. The graph and table do not reflect the deduction of taxes that a shareholder would pay on a Fund distribution or redemption of shares. The listed returns for the Fund are net of expenses and the returns for the index exclude expenses. Total returns would have been lower had certain expenses not been reduced.
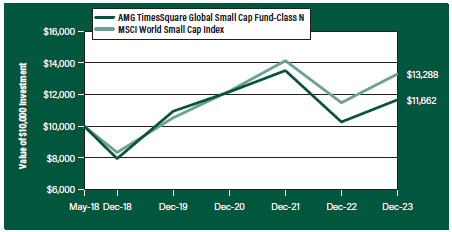
The table below shows the average annual total returns for the AMG TimesSquare Global Small Cap Fund and the MSCI World Small Cap Index for the same time periods ended December 31, 2023.
| | | | | | | | |
| | | One | | Five | | Since | | Inception |
| Average Annual Total Returns1 | | Year | | Years | | Inception | | Date |
|
AMG TimesSquare Global Small Cap Fund2, 3, 4, 5, 6, 7, 8, 9, 10, 11, 12, 13, 14 |
| | | | |
Class N | | 13.62% | | 7.97% | | 2.79% | | 05/30/18 |
| | | | |
Class I | | 13.94% | | 8.25% | | 3.05% | | 05/30/18 |
| | | | |
Class Z | | 13.94% | | 8.24% | | 3.05% | | 05/30/18 |
| | | | |
MSCI World Small Cap Index15 | | 15.76% | | 9.76% | | 5.22% | | 05/30/18† |
The performance data shown represents past performance. Past performance is not a guarantee of future results. Current performance may be lower or higher than the performance data quoted. The investment return and principal value of an investment will fluctuate so that an investor’s shares, when redeemed, may be worth more or less than their original cost.
Investors should carefully consider the Fund’s investment objectives, risks, charges and expenses before investing. For performance information through the most recent month end, current net asset values per share for the Fund and other information, please call 800.548.4539 or visit our website at wealth.amg.com for a free prospectus. Read it carefully before investing or sending money.
Distributed by AMG Distributors, Inc., member FINRA/SIPC.
| † | Date reflects inception date of the Fund, not the index. |
| 1 | Total return equals income yield plus share price change and assumes reinvestment of all dividends and capital gain distributions. Returns are net of fees and may reflect offsets of Fund expenses as described in the prospectus. No adjustment has been made for taxes payable by shareholders on their reinvested dividends and |
|
capital gain distributions. Returns for periods greater than one year are annualized. The listed returns on the Fund are net of expenses and based on the published NAV as of December 31, 2023. All returns are in U.S. Dollars ($). 2 From time to time, the Fund’s Investment Manager has waived its fees and/or absorbed Fund expenses, which has resulted in higher returns. 3 The prices of equity securities of companies that are expected to experience relatively rapid earnings growth, or “growth stocks,” may be more sensitive to market movements because the prices tend to reflect future investor expectations rather than just current profits. 4 Issuers and companies that are in similar industry sectors may be similarly affected by particular economic or market events; to the extent the Fund has substantial holdings within a particular sector, the risks associated with that sector increase. 5 Market prices of investments held by the Fund may fall rapidly or unpredictably due to a variety of factors, including economic, political, or market conditions, or other factors including terrorism, war, natural disasters and the spread of infectious illness or other public health issues, including epidemics or pandemics, or in response to events that affect particular industries or companies. 6 Because the Fund is an actively managed investment portfolio, security selection or focus on securities in a particular style, market sector or group of companies may cause the Fund to incur losses or underperform relative to its benchmarks or other funds with a similar investment objective. There can be no guarantee that the Subadviser’s investment techniques and risk analysis will produce the desired result. |
7 The stocks of small-capitalization companies often have greater price volatility, lower trading volume, and less liquidity than the stocks of larger, more established companies 8 The Fund may not be able to dispose of particular investments, such as illiquid securities, readily at favorable times or prices or the Fund may have to sell them at a loss. 9 Investments in foreign issuers involve additional risks (such as risks arising from less frequent trading, changes in political or social conditions, and less publicly available information about non-U.S. issuers) that differ from those associated with investments in U.S. issuers and may result in greater price volatility. 10 Investments in emerging markets are subject to the general risks of foreign investments, as well as additional risks which can result in greater price volatility. Such additional risks include the risk that markets in emerging market countries are typically |
| |
37
| | |
| | | AMG TimesSquare Global Small Cap Fund Portfolio Manager’s Comments (continued) |
| | | |
| | | |
| | | | |
less developed and less liquid than markets in developed countries and such markets are subjected to increased economic, political, or regulatory uncertainties. 11 Fluctuations in exchange rates may affect the total loss or gain on a non-U.S. dollar investment when converted back to U.S. dollars and exposure to non-U.S. currencies may subject the Fund to the risk that those currencies will decline in value relative to the U.S. dollar. The values of foreign currencies relative to the U.S. dollar may fluctuate in response to, among other factors, interest rate changes, intervention (or failure to intervene) by national governments, central banks, or supranational entities such as the International Monetary Fund, the imposition of currency controls, and other political or regulatory developments. 12 Changes in the general political and social environment of a country can have substantial effects on the value of investments exposed to that country. 13 To the extent that a large number of shares of the Fund is held by a single shareholder (e.g., an institutional investor) or a group of shareholders with a common investment strategy, the Fund is | | subject to the risk that a redemption or large purchase by that shareholder or group of all or a large portion of its Fund shares will require the Fund to sell securities, or to invest additional cash, as the case may be, at disadvantageous prices, disrupt the Fund’s operations, or force the Fund’s liquidation. Purchases of a large number of shares may adversely affect the Fund’s performance to the extent that it takes time to invest new cash and the Fund maintains a larger cash position than it ordinarily would. 14 Because applying the Fund’s ESG investment criteria may result in the selection or exclusion of securities of certain issuers for reasons other than financial performance, the Fund’s investment returns may underperform funds that do not incorporate ESG factors into their investment process. The incorporation of ESG criteria into the investment process may affect the Fund’s investment exposure to certain companies, sectors, regions, countries or types of investments, which could negatively impact the Fund’s performance depending on whether such investments are in or out of favor. Applying ESG criteria to investment decisions is qualitative and subjective by nature, and there is no guarantee that the criteria utilized by the Subadviser or any judgment exercised by the Subadviser will improve the financial | | performance of the Fund or reflect the beliefs or values of any particular investor. ESG standards differ by region and industry, and a company’s ESG practices or the Subadviser’s assessment of a company’s ESG practices may change over time. 15 The MSCI World Small Cap Index captures small cap representation across 23 Developed Markets countries. With over 4,000 constituents, the index covers approximately 14% of the free float-adjusted market capitalization in each country. Please go to msci.com for most current list of countries represented by the index. Unlike the Fund, the MSCI World Small Cap Index is unmanaged, is not available for investment and does not incur expenses. All MSCI data is provided “as is.” The products described herein are not sponsored or endorsed and have not been reviewed or passed on by MSCI. In no event shall MSCI, its affiliates or any MSCI data provider have any liability of any kind in connection with the MSCI data or the products described herein. Copying or redistributing the MSCI data is strictly prohibited. Not FDIC insured, nor bank guaranteed. May lose value. |
38
| | |
| | | AMG TimesSquare Global Small Cap Fund Fund Snapshots (unaudited) December 31, 2023 |
PORTFOLIO BREAKDOWN
| | | | | |
| Sector | | % of Net Assets |
| | |
Industrials | | 30.0 |
| | |
Information Technology | | 19.5 |
| | |
Financials | | 13.9 |
| | |
Consumer Discretionary | | 8.5 |
| | |
Health Care | | 7.6 |
| | |
Consumer Staples | | 7.5 |
| | |
Communication Services | | 4.2 |
| | |
Real Estate | | 2.3 |
| | |
Materials | | 1.9 |
| | |
Energy | | 1.8 |
| | |
Utilities | | 0.9 |
| | |
Short-Term Investments | | 4.7 |
| | |
Other Assets, less Liabilities | | (2.8) |
TOP TEN HOLDINGS
| | |
| Security Name | | % of Net Assets |
| | |
Synaptics, Inc. (United States) | | 3.0 |
| | |
CyberArk Software, Ltd. (Israel) | | 2.5 |
| | |
EMCOR Group, Inc. (United States) | | 2.4 |
| | |
Performance Food Group Co. (United States) | | 2.3 |
| | |
Steadfast Group, Ltd. (Australia) | | 2.3 |
| | |
Casella Waste Systems, Inc., Class A (United States) | | 2.3 |
| | |
Hexcel Corp. (United States) | | 2.1 |
| | |
Webster Financial Corp. (United States) | | 2.1 |
| | |
Esab Corp. (United States) | | 1.9 |
| | |
Integral Ad Science Holding Corp. (United States) | | 1.9 |
| | | |
| | |
Top Ten as a Group | | 22.8 |
| | |
Because a fund’s strategy may result in multiple investments in particular sectors of the economy, its performance may depend on the performance of those sectors and may fluctuate more widely than investments diversified across more sectors. For additional information on these and other risk considerations, please see the Fund’s prospectus.
Any sectors, industries, or securities discussed should not be perceived as investment recommendations. Mention of a specific security should not be considered a recommendation to buy or solicitation to sell that security. Specific securities mentioned in this report may have been sold from the Fund’s portfolio of investments by the time you receive this report.
39
| | |
| | | AMG TimesSquare Global Small Cap Fund Schedule of Portfolio Investments December 31, 2023 |
| | | | | | | | |
| | | Shares | | | Value | |
| |
Common Stocks - 98.1% | | | | | |
| |
Communication Services - 4.2% | | | | | |
| | |
Auto Trader Group PLC (United Kingdom)1 | | | 1,300 | | | | $11,943 | |
| | |
Integral Ad Science Holding Corp. (United States)* | | | 2,350 | | | | 33,816 | |
| | |
Internet Initiative Japan, Inc. (Japan) | | | 975 | | | | 19,893 | |
| | |
Kadokawa Corp. (Japan) | | | 450 | | | | 9,141 | |
| | |
Total Communication Services | | | | | | | 74,793 | |
| |
Consumer Discretionary - 8.5% | | | | | |
| | |
Arcos Dorados Holdings, Inc., Class A (Uruguay) | | | 1,400 | | | | 17,766 | |
| | |
Brunswick Corp. (United States) | | | 275 | | | | 26,606 | |
| | |
CIE Automotive, S.A. (Spain) | | | 425 | | | | 12,096 | |
| | |
Dalata Hotel Group PLC (Ireland) | | | 3,700 | | | | 18,871 | |
| | |
Games Workshop Group PLC (United Kingdom) | | | 100 | | | | 12,567 | |
| | |
Goldwin, Inc. (Japan) | | | 150 | | | | 10,755 | |
| | |
momo.com, Inc. (Taiwan) | | | 338 | | | | 5,596 | |
| | |
Spin Master Corp. (Canada)1 | | | 625 | | | | 16,443 | |
| | |
Topgolf Callaway Brands Corp. (United States)* | | | 775 | | | | 11,114 | |
| | |
Visteon Corp. (United States)* | | | 150 | | | | 18,735 | |
| | |
Total Consumer Discretionary | | | | | | | 150,549 | |
| |
Consumer Staples - 7.5% | | | | | |
| | |
Kobe Bussan Co., Ltd. (Japan) | | | 525 | | | | 15,509 | |
| | |
Lawson, Inc. (Japan) | | | 325 | | | | 16,787 | |
| | |
MatsukiyoCocokara & Co. (Japan) | | | 975 | | | | 17,232 | |
| | |
Performance Food Group Co. (United States)* | | | 600 | | | | 41,490 | |
| | |
Rohto Pharmaceutical Co., Ltd. (Japan) | | | 775 | | | | 15,584 | |
| | |
Tate & Lyle PLC (United Kingdom) | | | 1,000 | | | | 8,400 | |
| | |
Viscofan, S.A. (Spain) | | | 325 | | | | 19,231 | |
| | |
Total Consumer Staples | | | | | | | 134,233 | |
| |
Energy - 1.8% | | | | | |
| | |
Pason Systems, Inc. (Canada) | | | 950 | | | | 11,593 | |
| | |
Technip Energies, N.V. (France) | | | 525 | | | | 12,255 | |
| | |
TGS ASA (Norway) | | | 700 | | | | 9,090 | |
| | |
Total Energy | | | | | | | 32,938 | |
| |
Financials - 13.9% | | | | | |
| | |
FinecoBank Banca Fineco S.P.A. (Italy) | | | 900 | | | | 13,540 | |
| | |
Integral Corp. (Japan)* | | | 800 | | | | 15,049 | |
| | |
Jack Henry & Associates, Inc. (United States) | | | 125 | | | | 20,426 | |
| | |
MVB Financial Corp. (United States) | | | 1,000 | | | | 22,560 | |
| | |
Nordnet AB publ (Sweden) | | | 550 | | | | 9,364 | |
| | |
PJT Partners, Inc., Class A (United States)2 | | | 133 | | | | 13,549 | |
| | |
Rakuten Bank, Ltd. (Japan)* | | | 1,750 | | | | 26,173 | |
| | |
RenaissanceRe Holdings, Ltd. (Bermuda) | | | 135 | | | | 26,460 | |
| | |
| | | | | | | | |
| | | | | | | | |
| | | Shares | | | Value | |
| | |
Safety Insurance Group, Inc. (United States) | | | 175 | | | | $13,298 | |
| | |
Steadfast Group, Ltd. (Australia) | | | 10,425 | | | | 41,407 | |
| | |
Topdanmark AS (Denmark) | | | 200 | | | | 9,551 | |
| | |
Webster Financial Corp. (United States) | | | 725 | | | | 36,801 | |
| | |
Total Financials | | | | | | | 248,178 | |
| |
Health Care - 7.6% | | | | | |
| | |
Amplifon S.P.A. (Italy) | | | 300 | | | | 10,395 | |
| | |
Ascendis Pharma A/S, ADR (Denmark)* | | | 200 | | | | 25,190 | |
| | |
Chemed Corp. (United States) | | | 55 | | | | 32,162 | |
| | |
Encompass Health Corp. (United States) | | | 385 | | | | 25,687 | |
| | |
Nakanishi, Inc. (Japan) | | | 500 | | | | 8,389 | |
| | |
Treace Medical Concepts, Inc. (United States)* | | | 1,500 | | | | 19,125 | |
| | |
Xenon Pharmaceuticals, Inc. (Canada)* | | | 300 | | | | 13,818 | |
| | |
Total Health Care | | | | | | | 134,766 | |
| |
Industrials - 30.0% | | | | | |
| | |
Ag Growth International, Inc. (Canada) | | | 550 | | | | 20,970 | |
| | |
Arcadis, N.V. (Netherlands) | | | 225 | | | | 12,155 | |
| | |
AZ-COM MARUWA Holdings, Inc. (Japan) | | | 1,325 | | | | 14,333 | |
| | |
The AZEK Co., Inc. (United States)* | | | 525 | | | | 20,081 | |
| | |
Casella Waste Systems, Inc., Class A (United States)* | | | 475 | | | | 40,593 | |
| | |
Daiei Kankyo Co., Ltd. (Japan) | | | 900 | | | | 15,875 | |
| | |
Diploma PLC (United Kingdom) | | | 400 | | | | 18,269 | |
| | |
Driven Brands Holdings, Inc. (United States)* | | | 1,200 | | | | 17,112 | |
| | |
EMCOR Group, Inc. (United States) | | | 195 | | | | 42,009 | |
| | |
Esab Corp. (United States) | | | 400 | | | | 34,648 | |
| | |
Exponent, Inc. (United States) | | | 275 | | | | 24,211 | |
| | |
Hexcel Corp. (United States) | | | 500 | | | | 36,875 | |
| | |
Interpump Group S.P.A. (Italy) | | | 200 | | | | 10,376 | |
| | |
IPH, Ltd. (Australia) | | | 5,225 | | | | 22,854 | |
| | |
KION Group AG (Germany) | | | 266 | | | | 11,353 | |
| | |
Marten Transport, Ltd. (United States) | | | 1,000 | | | | 20,980 | |
| | |
Nexans, S.A. (France) | | | 150 | | | | 13,160 | |
| | |
Regal Rexnord Corp. (United States) | | | 200 | | | | 29,604 | |
| | |
Rotork PLC (United Kingdom) | | | 2,275 | | | | 9,363 | |
| | |
Saab AB, Class B (Sweden) | | | 400 | | | | 24,105 | |
| | |
SMS Co., Ltd. (Japan) | | | 725 | | | | 14,864 | |
| | |
Tetra Tech, Inc. (United States) | | | 100 | | | | 16,693 | |
| | |
The Weir Group PLC (United Kingdom) | | | 850 | | | | 20,424 | |
| | |
WillScot Mobile Mini Holdings Corp. (United States)* | | | 575 | | | | 25,588 | |
| | |
WNS Holdings, Ltd., ADR (India)* | | | 275 | | | | 17,380 | |
| | |
Total Industrials | | | | | | | 533,875 | |
| | |
| | | | | | | | |
The accompanying notes are an integral part of these financial statements.
40
| | |
| | | AMG TimesSquare Global Small Cap Fund Schedule of Portfolio Investments (continued) |
| | | | | | | | |
| | | Shares | | | Value | |
| |
Information Technology - 19.5% | | | | | |
| | |
Accton Technology Corp. (Taiwan) | | | 550 | | | | $9,348 | |
| | |
CyberArk Software, Ltd. (Israel)* | | | 200 | | | | 43,810 | |
| | |
Fortnox AB (Sweden) | | | 2,000 | | | | 11,965 | |
| | |
JFrog, Ltd. (Israel)* | | | 675 | | | | 23,362 | |
| | |
Keywords Studios PLC (Ireland) | | | 725 | | | | 15,359 | |
| | |
MACOM Technology Solutions Holdings, Inc. (United States)* | | | 225 | | | | 20,914 | |
| | |
Nice, Ltd., Sponsored ADR (Israel)* | | | 150 | | | | 29,926 | |
| | |
Onto Innovation, Inc. (United States)* | | | 140 | | | | 21,406 | |
| | |
Simplex Holdings, Inc. (Japan) | | | 1,500 | | | | 29,106 | |
| | |
Sopra Steria Group SACA (France) | | | 75 | | | | 16,426 | |
| | |
Synaptics, Inc. (United States)* | | | 475 | | | | 54,188 | |
| | |
TOTVS, S.A. (Brazil) | | | 1,783 | | | | 12,366 | |
| | |
Universal Display Corp. (United States) | | | 150 | | | | 28,689 | |
| | |
Workiva, Inc. (United States)* | | | 290 | | | | 29,444 | |
| | |
Total Information Technology | | | | | | | 346,309 | |
| |
Materials - 1.9% | | | | | |
| | |
Avient Corp. (United States) | | | 500 | | | | 20,785 | |
| | |
Huhtamaki Oyj (Finland)2 | | | 300 | | | | 12,177 | |
| | |
Total Materials | | | | | | | 32,962 | |
| |
Real Estate - 2.3% | | | | | |
| | |
National Storage Affiliates Trust, REIT (United States) | | | 625 | | | | 25,919 | |
| | |
The UNITE Group PLC, REIT (United Kingdom) | | | 1,200 | | | | 15,940 | |
| | |
Total Real Estate | | | | | | | 41,859 | |
| | |
| | | | | | | | |
| | | | | | | | |
| | | Shares | | | Value | |
| |
Utilities - 0.9% | | | | | |
| | |
Nippon Gas Co., Ltd. (Japan) | | | 975 | | | | $16,079 | |
| | |
Total Common Stocks
(Cost $1,468,034) | | | | | | | 1,746,541 | |
| | |
| | | Principal | | | | |
| | | Amount | | | | |
| |
Short-Term Investments - 4.7% | | | | | |
| |
Joint Repurchase Agreements - 1.3%3 | | | | | |
| | |
RBC Dominion Securities, Inc., dated 12/29/23, due 01/02/24, 5.340% total to be received $23,580 (collateralized by various U.S. Government Agency Obligations and U.S. Treasuries, 0.000% - 7.500%, 01/15/24 -12/01/53, totaling $24,037) | | | $23,566 | | | | 23,566 | |
| | |
| | | Shares | | | | |
| |
Other Investment Companies - 3.4% | | | | | |
| | |
Dreyfus Government Cash Management Fund, Institutional Shares, 5.25%4 | | | 23,737 | | | | 23,737 | |
| | |
Dreyfus Institutional Preferred Government Money Market Fund, Institutional Shares, 5.32%4 | | | 35,605 | | | | 35,605 | |
| | |
Total Other Investment Companies | | | | | | | 59,342 | |
| | |
Total Short-Term Investments
(Cost $82,908) | | | | | | | 82,908 | |
| | |
Total Investments - 102.8%
(Cost $1,550,942) | | | | | | | 1,829,449 | |
| |
Other Assets, less Liabilities - (2.8)% | | | | (49,089 | ) |
| | |
Net Assets - 100.0% | | | | | | | $1,780,360 | |
| | |
| | | | | | | | |
| * | Non-income producing security. |
| 1 | Security exempt from registration under Rule 144A of the Securities Act of 1933. These securities may be resold in transactions exempt from registration, normally to qualified institutional buyers. At December 31, 2023, the value of these securities amounted to $28,386 or 1.6% of net assets. |
| 2 | Some of these securities, amounting to $22,478 or 1.3% of net assets, were out on loan to various borrowers and are collateralized by cash. See Note 4 of Notes to Financial Statements. |
| 3 | Cash collateral received for securities lending activity was invested in these joint repurchase agreements. |
| 4 | Yield shown represents the December 31, 2023, seven day average yield, which refers to the sum of the previous seven days’ dividends paid, expressed as an annual percentage. |
ADR American Depositary Receipt
REIT Real Estate Investment Trust
The accompanying notes are an integral part of these financial statements.
41
| | |
| | | AMG TimesSquare Global Small Cap Fund Schedule of Portfolio Investments (continued) |
| | |
The following table summarizes the inputs used to value the Fund’s investments by the fair value hierarchy levels as of December 31, 2023:
| | | | | | | | | | | | | | | | |
| | | Level 1 | | | Level 21 | | | Level 3 | | | Total | |
Investments in Securities | | | | | | | | | | | | | | | | |
| | | | |
Common Stocks | | | | | | | | | | | | | | | | |
| | | | |
Industrials | | | $346,744 | | | | $187,131 | | | | — | | | | $533,875 | |
| | | | |
Information Technology | | | 279,464 | | | | 66,845 | | | | — | | | | 346,309 | |
| | | | |
Financials | | | 133,094 | | | | 115,084 | | | | — | | | | 248,178 | |
| | | | |
Consumer Discretionary | | | 109,535 | | | | 41,014 | | | | — | | | | 150,549 | |
| | | | |
Health Care | | | 115,982 | | | | 18,784 | | | | — | | | | 134,766 | |
| | | | |
Consumer Staples | | | 85,908 | | | | 48,325 | | | | — | | | | 134,233 | |
| | | | |
Communication Services | | | 33,816 | | | | 40,977 | | | | — | | | | 74,793 | |
| | | | |
Real Estate | | | 25,919 | | | | 15,940 | | | | — | | | | 41,859 | |
| | | | |
Materials | | | 20,785 | | | | 12,177 | | | | — | | | | 32,962 | |
| | | | |
Energy | | | 11,593 | | | | 21,345 | | | | — | | | | 32,938 | |
| | | | |
Utilities | | | — | | | | 16,079 | | | | — | | | | 16,079 | |
| | | | |
Short-Term Investments | | | | | | | | | | | | | | | | |
| | | | |
Joint Repurchase Agreements | | | — | | | | 23,566 | | | | — | | | | 23,566 | |
| | | | |
Other Investment Companies | | | 59,342 | | | | — | | | | — | | | | 59,342 | |
| | | | | | | | | | | | | | | | |
| | | | |
Total Investment in Securities | | | $1,222,182 | | | | $607,267 | | | | — | | | | $1,829,449 | |
| | | | | | | | | | | | | | | | |
| 1 | An external pricing service is used to reflect any impact on security value due to market movements between the time the Fund valued such foreign securities and the earlier closing of foreign markets. |
For the fiscal year ended December 31, 2023, there were no transfers in or out of Level 3.
The country allocation in the Schedule of Portfolio Investments at December 31, 2023, was as follows:
| | |
Country | | % of Long-Term
Investments |
| |
Australia | | 3.7 |
| |
Bermuda | | 1.5 |
| |
Brazil | | 0.7 |
| |
Canada | | 3.6 |
| |
Denmark | | 2.0 |
| |
Finland | | 0.7 |
| |
France | | 2.4 |
| |
Germany | | 0.6 |
| |
India | | 1.0 |
| |
Ireland | | 2.0 |
| |
Israel | | 5.6 |
| |
Italy | | 2.0 |
| | |
Country | | % of Long-Term
Investments |
| |
Japan | | 14.0 |
| |
Netherlands | | 0.7 |
| |
Norway | | 0.5 |
| |
Spain | | 1.8 |
| |
Sweden | | 2.6 |
| |
Taiwan | | 0.9 |
| |
United Kingdom | | 5.5 |
| |
United States | | 47.2 |
| |
Uruguay | | 1.0 |
| | |
| |
| | 100.0 |
| | |
The accompanying notes are an integral part of these financial statements.
42
| | |
| | | Statement of Assets and Liabilities December 31, 2023 |
| | | | | | | | | | | | | | | | | | | | | | | | | |
| | | AMG
TimesSquare
Small Cap
Growth Fund | | AMG
TimesSquare
Mid Cap
Growth Fund | | AMG
TimesSquare
International Small
Cap Fund | | AMG
TimesSquare
Emerging
Markets Small
Cap Fund | | AMG
TimesSquare
Global Small
Cap Fund |
| | | | | |
Assets: | | | | | | | | | | | | | | | | | | | | | | | | | |
| | | | | |
Investments at value1 (including securities on loan valued at $8,292,535, $36,651,313, $15,336,376, $14,867, and $22,478, respectively) | | | | $167,226,177 | | | | | $1,310,283,639 | | | | | $192,455,762 | | | | | $1,970,660 | | | | | $1,829,449 | |
| | | | | |
Foreign currency2 | | | | — | | | | | — | | | | | 728,714 | | | | | — | | | | | 1,921 | |
| | | | | |
Receivable for investments sold | | | | 121,636 | | | | | 1,996,835 | | | | | 16,580,501 | | | | | — | | | | | 5,067 | |
| | | | | |
Dividend and interest receivables | | | | 183,847 | | | | | 353,390 | | | | | 1,139,631 | | | | | 3,434 | | | | | 1,362 | |
| | | | | |
Securities lending income receivable | | | | 2,514 | | | | | 5,241 | | | | | 20,553 | | | | | 20 | | | | | 3 | |
| | | | | |
Receivable for Fund shares sold | | | | 49,463 | | | | | 518,344 | | | | | 1,122,857 | | | | | — | | | | | — | |
| | | | | |
Receivable from affiliate | | | | 5,683 | | | | | — | | | | | — | | | | | 20,200 | | | | | 7,803 | |
| | | | | |
Prepaid expenses and other assets | | | | 13,034 | | | | | 12,493 | | | | | 20,859 | | | | | 818 | | | | | 22 | |
| | | | | |
Total assets | | | | 167,602,354 | | | | | 1,313,169,942 | | | | | 212,068,877 | | | | | 1,995,132 | | | | | 1,845,627 | |
| | | | | |
Liabilities: | | | | | | | | | | | | | | | | | | | | | | | | | |
| | | | | |
Payable upon return of securities loaned | | | | 2,020,775 | | | | | 14,942,196 | | | | | 9,692,940 | | | | | 15,647 | | | | | 23,566 | |
| | | | | |
Payable for investments purchased | | | | — | | | | | 978,229 | | | | | 130,420 | | | | | — | | | | | — | |
| | | | | |
Payable for Fund shares repurchased | | | | 43,826 | | | | | 766,250 | | | | | 235,091 | | | | | — | | | | | — | |
| | | | | |
Payable for foreign capital gains tax | | | | — | | | | | — | | | | | — | | | | | 5,932 | | | | | — | |
| | | | | |
Interfund loan payable | | | | — | | | | | — | | | | | 11,278,643 | | | | | — | | | | | — | |
| | | | | |
Accrued expenses: | | | | | | | | | | | | | | | | | | | | | | | | | |
| | | | | |
Investment advisory and management fees | | | | 107,722 | | | | | 852,267 | | | | | 124,005 | | | | | 1,494 | | | | | 1,028 | |
| | | | | |
Administrative fees | | | | 20,454 | | | | | 161,823 | | | | | 24,801 | | | | | 236 | | | | | 220 | |
| | | | | |
Distribution fees | | | | — | | | | | — | | | | | — | | | | | 22 | | | | | 12 | |
| | | | | |
Shareholder service fees | | | | 2,685 | | | | | 85,467 | | | | | 1,436 | | | | | 13 | | | | | — | |
| | | | | |
Other | | | | 54,325 | | | | | 116,723 | | | | | 101,544 | | | | | 67,485 | | | | | 40,441 | |
| | | | | |
Total liabilities | | | | 2,249,787 | | | | | 17,902,955 | | | | | 21,588,880 | | | | | 90,829 | | | | | 65,267 | |
| | | | | |
Commitments and Contingencies (Notes 2 & 7) | | | | | | | | | | | | | | | | | | | | | | | | | |
| | | | | |
Net Assets | | | | $165,352,567 | | | | | $1,295,266,987 | | | | | $190,479,997 | | | | | $1,904,303 | | | | | $1,780,360 | |
| | | | | |
1 Investments at cost | | | | $142,099,101 | | | | | $873,669,694 | | | | | $160,402,560 | | | | | $1,661,899 | | | | | $1,550,942 | |
| | | | | |
2 Foreign currency at cost | | | | — | | | | | — | | | | | $735,107 | | | | | — | | | | | $1,920 | |
The accompanying notes are an integral part of these financial statements.
43
| | |
| | | Statement of Assets and Liabilities (continued) |
| | | | | | | | | | | | | | | | | | | | | | | | | |
| | | AMG
TimesSquare
Small Cap
Growth Fund | | AMG
TimesSquare
Mid Cap
Growth Fund | | AMG
TimesSquare
International Small
Cap Fund | | AMG
TimesSquare
Emerging
Markets Small
Cap Fund | | AMG
TimesSquare
Global Small
Cap Fund |
| | | | | |
Net Assets Represent: | | | | | | | | | | | | | | | | | | | | | | | | | |
| | | | | |
Paid-in capital | | | | $142,490,413 | | | | | $853,916,903 | | | | | $381,721,163 | | | | | $2,809,827 | | | | | $1,768,055 | |
| | | | | |
Total distributable earnings (loss) | | | | 22,862,154 | | | | | 441,350,084 | | | | | (191,241,166 | ) | | | | (905,524 | ) | | | | 12,305 | |
| | | | | |
Net Assets | | | | $165,352,567 | | | | | $1,295,266,987 | | | | | $190,479,997 | | | | | $1,904,303 | | | | | $1,780,360 | |
| | | | | |
Class N: | | | | | | | | | | | | | | | | | | | | | | | | | |
| | | | | |
Net Assets | | | | $12,717,092 | | | | | $411,238,320 | | | | | $9,101,185 | | | | | $107,384 | | | | | $57,620 | |
| | | | | |
Shares outstanding | | | | 1,127,213 | | | | | 26,687,368 | | | | | 637,868 | | | | | 10,680 | | | | | 5,354 | |
| | | | | |
Net asset value, offering and redemption price per share | | | | $11.28 | | | | | $15.41 | | | | | $14.27 | | | | | $10.05 | | | | | $10.76 | |
| | | | | |
Class I: | | | | | | | | | | | | | | | | | | | | | | | | | |
| | | | | |
Net Assets | | | | $9,563,607 | | | | | $401,600,814 | | | | | $96,333,408 | | | | | $424,749 | | | | | $35,485 | |
| | | | | |
Shares outstanding | | | | 793,266 | | | | | 24,337,556 | | | | | 6,736,787 | | | | | 41,863 | | | | | 3,283 | |
| | | | | |
Net asset value, offering and redemption price per share | | | | $12.06 | | | | | $16.50 | | | | | $14.30 | | | | | $10.15 | | | | | $10.81 | |
| | | | | |
Class Z: | | | | | | | | | | | | | | | | | | | | | | | | | |
| | | | | |
Net Assets | | | | $143,071,868 | | | | | $482,427,853 | | | | | $85,045,404 | | | | | $1,372,170 | | | | | $1,687,255 | |
| | | | | |
Shares outstanding | | | | 11,784,121 | | | | | 29,062,035 | | | | | 5,951,766 | | | | | 135,310 | | | | | 156,080 | |
| | | | | |
Net asset value, offering and redemption price per share | | | | $12.14 | | | | | $16.60 | | | | | $14.29 | | | | | $10.14 | | | | | $10.81 | |
The accompanying notes are an integral part of these financial statements.
44
| | |
| | | Statement of Operations For the fiscal year ended December 31, 2023 |
| | | | | | | | | | | | | | | | | | | | |
| | | AMG
TimesSquare
Small Cap
Growth Fund | | AMG
TimesSquare
Mid Cap
Growth Fund | | AMG
TimesSquare
International Small
Cap Fund | | AMG
TimesSquare
Emerging
Markets Small
Cap Fund | | AMG
TimesSquare
Global Small
Cap Fund |
| | | | | |
Investment Income: | | | | | | | | | | | | | | | | | | | | |
| | | | | |
Dividend income | | | $1,197,449 | | | | $9,355,123 | | | | $7,980,817 | | | | $50,521 | 1 | | | $27,500 | |
| | | | | |
Interest income | | | 2,545 | | | | 19,566 | | | | 2,315 | | | | — | | | | — | |
| | | | | |
Securities lending income | | | 29,191 | | | | 57,167 | | | | 102,617 | | | | 34 | | | | 73 | |
| | | | | |
Foreign withholding tax | | | — | | | | (42,711 | ) | | | (804,016 | ) | | | (6,066 | ) | | | (3,715) | |
| | | | | |
Total investment income | | | 1,229,185 | | | | 9,389,145 | | | | 7,281,733 | | | | 44,489 | | | | 23,858 | |
| | | | | |
Expenses: | | | | | | | | | | | | | | | | | | | | |
| | | | | |
Investment advisory and management fees | | | 1,532,079 | | | | 9,397,664 | | | | 2,366,131 | | | | 27,225 | | | | 12,039 | |
| | | | | |
Administrative fees | | | 290,901 | | | | 1,784,367 | | | | 473,226 | | | | 4,299 | | | | 2,580 | |
| | | | | |
Distribution fees - Class N | | | — | | | | — | | | | — | | | | 202 | | | | 138 | |
| | | | | |
Shareholder servicing fees - Class N | | | 44,678 | | | | 771,562 | | | | 25,890 | | | | 121 | | | | — | |
| | | | | |
Shareholder servicing fees - Class I | | | 6,767 | | | | 183,042 | | | | 148,961 | | | | — | | | | — | |
| | | | | |
Professional fees | | | 54,160 | | | | 125,822 | | | | 73,965 | | | | 70,925 | | | | 37,211 | |
| | | | | |
Custodian fees | | | 37,930 | | | | 90,051 | | | | 61,058 | | | | 75,645 | | | | 29,797 | |
| | | | | |
Registration fees | | | 36,595 | | | | 65,635 | | | | 52,716 | | | | 1,076 | | | | 188 | |
| | | | | |
Trustee fees and expenses | | | 13,874 | | | | 87,540 | | | | 22,466 | | | | 204 | | | | 126 | |
| | | | | |
Reports to shareholders | | | 10,491 | | | | 90,249 | | | | 48,813 | | | | 4,107 | | | | 3,865 | |
| | | | | |
Transfer agent fees | | | 7,327 | | | | 44,662 | | | | 26,353 | | | | 645 | | | | 392 | |
| | | | | |
Interest expense | | | 2,036 | | | | — | | | | 62,254 | | | | 1,577 | | | | 11 | |
| | | | | |
Miscellaneous | | | 13,346 | | | | 60,141 | | | | 21,075 | | | | 2,717 | | | | 2,607 | |
| | | | | |
Total expenses before offsets | | | 2,050,184 | | | | 12,700,735 | | | | 3,382,908 | | | | 188,743 | | | | 88,954 | |
| | | | | |
Expense reimbursements | | | (76,751 | ) | | | — | | | | — | | | | (149,056 | ) | | | (71,590 | ) |
| | | | | |
Expense reductions | | | (48,635 | ) | | | (72,753 | ) | | | — | | | | — | | | | — | |
| | | | | |
Net expenses | | | 1,924,798 | | | | 12,627,982 | | | | 3,382,908 | | | | 39,687 | | | | 17,364 | |
| | | | | | | | | | | | | | | | | | | | |
| | | | | |
Net investment income (loss) | | | (695,613 | ) | | | (3,238,837 | ) | | | 3,898,825 | | | | 4,802 | | | | 6,494 | |
| | | | | |
Net Realized and Unrealized Gain: | | | | | | | | | | | | | | | | | | | | |
| | | | | |
Net realized gain (loss) on investments | | | 14,608,737 | | | | 86,219,986 | | | | (633,858 | ) | | | 63,627 | | | | (649 | ) |
| | | | | |
Net realized gain (loss) on foreign currency transactions | | | — | | | | 141 | | | | (266,887 | ) | | | (4,098 | ) | | | (101 | ) |
| | | | | |
Net change in unrealized appreciation/depreciation on investments | | | 15,619,003 | | | | 185,202,792 | | | | 25,258,567 | | | | 463,062 | | | | 223,372 | |
| | | | | |
Net change in unrealized appreciation/depreciation on foreign currency translations | | | — | | | | — | | | | 39,716 | | | | 8,239 | | | | 46 | |
| | | | | |
Net realized and unrealized gain | | | 30,227,740 | | | | 271,422,919 | | | | 24,397,538 | | | | 530,830 | | | | 222,668 | |
| | | | | | | | | | | | | | | | | | | | |
| | | | | |
Net increase in net assets resulting from operations | | | $29,532,127 | | | | $268,184,082 | | | | $28,296,363 | | | | $535,632 | | | | $229,162 | |
1 Includes non-recurring dividends of $7,700.
The accompanying notes are an integral part of these financial statements.
45
| | |
| | | Statements of Changes in Net Assets For the fiscal years ended December 31, |
| | | | | | | | | | | | | | | | | | | | | | | | |
| | | AMG
TimesSquare
Small Cap
Growth Fund | | | AMG
TimesSquare
Mid Cap
Growth Fund | | | AMG
TimesSquare
International Small
Cap Fund | |
| | | | | | |
| | | 2023 | | | 2022 | | | 2023 | | | 2022 | | | 2023 | | | 2022 |
| | | | | | |
Increase (Decrease) in Net Assets Resulting From Operations: | | | | | | | | | | | | | | | | | | | | | | | | |
| | | | | | |
Net investment income (loss) | | | $(695,613 | ) | | | $(1,831,932 | ) | | | $(3,238,837 | ) | | | $(4,442,047 | ) | | | $3,898,825 | | | | $10,230,958 | |
| | | | | | |
Net realized gain (loss) on investments | | | 14,608,737 | | | | (14,588,698 | ) | | | 86,220,127 | | | | (14,032,359 | ) | | | (900,745 | ) | | | (155,938,549 | ) |
| | | | | | |
Net change in unrealized appreciation/depreciation on investments | | | 15,619,003 | | | | (86,795,211 | ) | | | 185,202,792 | | | | (375,856,383 | ) | | | 25,298,283 | | | | (147,722,857 | ) |
| | | | | | |
Net increase (decrease) in net assets resulting from operations | | | 29,532,127 | | | | (103,215,841 | ) | | | 268,184,082 | | | | (394,330,789 | ) | | | 28,296,363 | | | | (293,430,448 | ) |
| | | | | | |
Distributions to Shareholders: | | | | | | | | | | | | | | | | | | | | | | | | |
| | | | | | |
Class N | | | — | | | | (4,006,378 | ) | | | (17,077,801 | ) | | | (14,196,340 | ) | | | (155,058 | ) | | | (92,131 | ) |
| | | | | | |
Class I | | | — | | | | (580,982 | ) | | | (15,567,072 | ) | | | (12,340,247 | ) | | | (1,731,160 | ) | | | (2,705,146 | ) |
| | | | | | |
Class Z | | | — | | | | (11,346,058 | ) | | | (18,481,755 | ) | | | (15,739,439 | ) | | | (1,880,383 | ) | | | (1,955,638 | ) |
| | | | | | |
Total distributions to shareholders | | | — | | | | (15,933,418 | ) | | | (51,126,628 | ) | | | (42,276,026 | ) | | | (3,766,601 | ) | | | (4,752,915 | ) |
| | | | | | |
Capital Share Transactions:1 | | | | | | | | | | | | | | | | | | | | | | | | |
| | | | | | |
Net decrease from capital share transactions | | | (92,828,128 | ) | | | (64,127,267 | ) | | | (44,126,377 | ) | | | (218,353,331 | ) | | | (272,230,172 | ) | | | (295,725,740 | ) |
| | | | | | | | | | | | | | | | | | | | | | | | |
| | | | | | |
Total increase (decrease) in net assets | | | (63,296,001 | ) | | | (183,276,526 | ) | | | 172,931,077 | | | | (654,960,146 | ) | | | (247,700,410 | ) | | | (593,909,103 | ) |
| | | | | | |
Net Assets: | | | | | | | | | | | | | | | | | | | | | | | | |
| | | | | | |
Beginning of year | | | 228,648,568 | | | | 411,925,094 | | | | 1,122,335,910 | | | | 1,777,296,056 | | | | 438,180,407 | | | | 1,032,089,510 | |
| | | | | | |
End of year | | | $165,352,567 | | | | $228,648,568 | | | | $1,295,266,987 | | | | $1,122,335,910 | | | | $190,479,997 | | | | $438,180,407 | |
1 See Note 1(g) of the Notes to Financial Statements.
The accompanying notes are an integral part of these financial statements.
46
| | |
| | | Statements of Changes in Net Assets (continued) For the fiscal years ended December 31, |
| | | | | | | | | | | | | | | | |
| | | AMG
TimesSquare
Emerging
Markets Small Cap Fund | | | AMG
TimesSquare
Global Small
Cap Fund | |
| | | | |
| | | 2023 | | | 2022 | | | 2023 | | | 2022 |
| | | | |
Increase (Decrease) in Net Assets Resulting From Operations: | | | | | | | | | | | | | | | | |
| | | | |
Net investment income | | | $4,802 | | | | $41,925 | | | | $6,494 | | | | $8,002 | |
| | | | |
Net realized gain (loss) on investments | | | 59,529 | | | | (1,049,673 | ) | | | (750 | ) | | | (229,123 | ) |
| | | | |
Net change in unrealized appreciation/depreciation on investments | | | 471,301 | | | | (406,817 | ) | | | 223,418 | | | | (452,077 | ) |
| | | | |
Net increase (decrease) in net assets resulting from operations | | | 535,632 | | | | (1,414,565 | ) | | | 229,162 | | | | (673,198 | ) |
| | | | |
Distributions to Shareholders: | | | | | | | | | | | | | | | | |
| | | | |
Class N | | | (2,179 | ) | | | (1,423 | ) | | | (178 | ) | | | — | |
| | | | |
Class I | | | (9,752 | ) | | | (7,395 | ) | | | (193 | ) | | | (65 | ) |
| | | | |
Class Z | | | (31,518 | ) | | | (93,111 | ) | | | (9,197 | ) | | | (3,369 | ) |
| | | | |
Total distributions to shareholders | | | (43,449 | ) | | | (101,929 | ) | | | (9,568 | ) | | | (3,434 | ) |
| | | | |
Capital Share Transactions:1 | | | | | | | | | | | | | | | | |
| | | | |
Net decrease from capital share transactions | | | (3,292,898 | ) | | | (1,734,530 | ) | | | (142,183 | ) | | | (308,863 | ) |
| | | | | | | | | | | | | | | | |
| | | | |
Total increase (decrease) in net assets | | | (2,800,715 | ) | | | (3,251,024 | ) | | | 77,411 | | | | (985,495 | ) |
| | | | |
Net Assets: | | | | | | | | | | | | | | | | |
| | | | |
Beginning of year | | | 4,705,018 | | | | 7,956,042 | | | | 1,702,949 | | | | 2,688,444 | |
| | | | |
End of year | | | $1,904,303 | | | | $4,705,018 | | | | $1,780,360 | | | | $1,702,949 | |
1 See Note 1(g) of the Notes to Financial Statements.
The accompanying notes are an integral part of these financial statements.
47
| | |
| | | AMG TimesSquare Small Cap Growth Fund Financial Highlights For a share outstanding throughout each fiscal year |
| | | | | | | | | | | | | | | | | | | | |
| | | For the fiscal years ended December 31, |
| | | | | |
| Class N | | 2023 | | 2022 | | 2021 | | 2020 | | 2019 |
| | | | | |
Net Asset Value, Beginning of Year | | | $9.69 | | | | $14.09 | | | | $16.45 | | | | $13.96 | | | | $12.21 | |
| | | | | |
Income (loss) from Investment Operations: | | | | | | | | | | | | | | | | | | | | |
| | | | | |
Net investment loss1,2 | | | (0.06 | ) | | | (0.09 | ) | | | (0.17 | ) | | | (0.11 | )3 | | | (0.09 | ) |
| | | | | |
Net realized and unrealized gain (loss) on investments | | | 1.65 | | | | (3.62 | ) | | | 1.18 | | | | 4.92 | | | | 3.47 | |
| | | | | |
Total income (loss) from investment operations | | | 1.59 | | | | (3.71 | ) | | | 1.01 | | | | 4.81 | | | | 3.38 | |
| | | | | |
Less Distributions to Shareholders from: | | | | | | | | | | | | | | | | | | | | |
| | | | | |
Net realized gain on investments | | | — | | | | (0.69 | ) | | | (3.37 | ) | | | (2.32 | ) | | | (1.63 | ) |
| | | | | |
Net Asset Value, End of Year | | | $11.28 | | | | $9.69 | | | | $14.09 | | | | $16.45 | | | | $13.96 | |
| | | | | |
Total Return2,4 | | | 16.41 | % | | | (26.41 | )% | | | 6.72 | % | | | 34.96 | % | | | 27.98 | % |
| | | | | |
Ratio of net expenses to average net assets5 | | | 1.17 | % | | | 1.17 | % | | | 1.17 | %6 | | | 1.16 | % | | | 1.17 | % |
| | | | | |
Ratio of gross expenses to average net assets7 | | | 1.23 | % | | | 1.20 | % | | | 1.19 | %6 | | | 1.20 | % | | | 1.19 | % |
| | | | | |
Ratio of net investment loss to average net assets2 | | | (0.53 | )% | | | (0.79 | )% | | | (0.97 | )% | | | (0.79 | )% | | | (0.63 | )% |
| | | | | |
Portfolio turnover | | | 63 | % | | | 50 | % | | | 65 | % | | | 71 | % | | | 62 | % |
| | | | | |
Net assets end of year (000’s) omitted | | | $12,717 | | | | $38,225 | | | | $86,941 | | | | $112,740 | | | | $105,862 | |
| | | | | |
| | | | | | | | | | | | | | | | | | | | | |
48
| | |
| | | AMG TimesSquare Small Cap Growth Fund Financial Highlights For a share outstanding throughout each fiscal year |
| | | | | | | | | | | | | | | | | | | | |
| | | For the fiscal years ended December 31, |
| | | | | |
| Class I | | 2023 | | 2022 | | 2021 | | 2020 | | 2019 |
| | | | | |
Net Asset Value, Beginning of Year | | | $10.34 | | | | $14.96 | | | | $17.25 | | | | $14.53 | | | | $12.64 | |
| | | | | |
Income (loss) from Investment Operations: | | | | | | | | | | | | | | | | | | | | |
| | | | | |
Net investment loss1,2 | | | (0.05 | ) | | | (0.08 | ) | | | (0.15 | ) | | | (0.10 | )3 | | | (0.07 | ) |
| | | | | |
Net realized and unrealized gain (loss) on investments | | | 1.77 | | | | (3.85 | ) | | | 1.23 | | | | 5.14 | | | | 3.59 | |
| | | | | |
Total income (loss) from investment operations | | | 1.72 | | | | (3.93 | ) | | | 1.08 | | | | 5.04 | | | | 3.52 | |
| | | | | |
Less Distributions to Shareholders from: | | | | | | | | | | | | | | | | | | | | |
| | | | | |
Net realized gain on investments | | | — | | | | (0.69 | ) | | | (3.37 | ) | | | (2.32 | ) | | | (1.63 | ) |
| | | | | |
Net Asset Value, End of Year | | | $12.06 | | | | $10.34 | | | | $14.96 | | | | $17.25 | | | | $14.53 | |
| | | | | |
Total Return2,4 | | | 16.64 | % | | | (26.34 | )% | | | 6.81 | % | | | 35.19 | % | | | 28.13 | % |
| | | | | |
Ratio of net expenses to average net assets5 | | | 1.05 | % | | | 1.05 | % | | | 1.05 | %6 | | | 1.03 | % | | | 1.01 | % |
| | | | | |
Ratio of gross expenses to average net assets7 | | | 1.11 | % | | | 1.08 | % | | | 1.07 | %6 | | | 1.07 | % | | | 1.03 | % |
| | | | | |
Ratio of net investment loss to average net assets2 | | | (0.41 | )% | | | (0.67 | )% | | | (0.85 | )% | | | (0.66 | )% | | | (0.47 | )% |
| | | | | |
Portfolio turnover | | | 63 | % | | | 50 | % | | | 65 | % | | | 71 | % | | | 62 | % |
| | | | | |
Net assets end of year (000’s) omitted | | | $9,564 | | | | $9,185 | | | | $12,380 | | | | $12,062 | | | | $11,333 | |
| | | | | |
| | | | | | | | | | | | | | | | | | | | | |
49
| | |
| | | AMG TimesSquare Small Cap Growth Fund Financial Highlights For a share outstanding throughout each fiscal year |
| | | | | | | | | | | | | | | | | | | | |
| | | For the fiscal years ended December 31, |
| | | | | |
| Class Z | | 2023 | | 2022 | | 2021 | | 2020 | | 2019 |
| | | | | |
Net Asset Value, Beginning of Year | | | $10.40 | | | | $15.03 | | | | $17.30 | | | | $14.55 | | | | $12.65 | |
| | | | | |
Income (loss) from Investment Operations: | | | | | | | | | | | | | | | | | | | | |
| | | | | |
Net investment loss1,2 | | | (0.04 | ) | | | (0.07 | ) | | | (0.14 | ) | | | (0.09 | )3 | | | (0.07 | ) |
| | | | | |
Net realized and unrealized gain (loss) on investments | | | 1.78 | | | | (3.87 | ) | | | 1.24 | | | | 5.16 | | | | 3.60 | |
| | | | | |
Total income (loss) from investment operations | | | 1.74 | | | | (3.94 | ) | | | 1.10 | | | | 5.07 | | | | 3.53 | |
| | | | | |
Less Distributions to Shareholders from: | | | | | | | | | | | | | | | | | | | | |
| | | | | |
Net realized gain on investments | | | — | | | | (0.69 | ) | | | (3.37 | ) | | | (2.32 | ) | | | (1.63 | ) |
| | | | | |
Net Asset Value, End of Year | | | $12.14 | | | | $10.40 | | | | $15.03 | | | | $17.30 | | | | $14.55 | |
| | | | | |
Total Return2,4 | | | 16.73 | % | | | (26.29 | )% | | | 6.91 | % | | | 35.35 | % | | | 28.19 | % |
| | | | | |
Ratio of net expenses to average net assets5 | | | 0.97 | % | | | 0.97 | % | | | 0.97 | %6 | | | 0.96 | % | | | 0.97 | % |
| | | | | |
Ratio of gross expenses to average net assets7 | | | 1.03 | % | | | 1.00 | % | | | 0.99 | %6 | | | 1.00 | % | | | 0.99 | % |
| | | | | |
Ratio of net investment loss to average net assets2 | | | (0.33 | )% | | | (0.59 | )% | | | (0.77 | )% | | | (0.59 | )% | | | (0.43 | )% |
| | | | | |
Portfolio turnover | | | 63 | % | | | 50 | % | | | 65 | % | | | 71 | % | | | 62 | % |
| | | | | |
Net assets end of year (000’s) omitted | | | $143,072 | | | | $181,238 | | | | $312,604 | | | | $320,535 | | | | $367,787 | |
| | | | | |
| | | | | | | | | | | | | | | | | | | | | |
| 1 | Per share numbers have been calculated using average shares. |
| 2 | Total returns and net investment loss would have been lower had certain expenses not been offset. |
| 3 | Includes non-recurring dividends. Without these dividends, net investment loss per share would have been $(0.12), $(0.10) and $(0.09) for Class N, Class I and Class Z, respectively. |
| 4 | The total return is calculated using the published Net Asset Value as of fiscal year end. |
| 5 | Includes reduction from broker recapture amounting to 0.02%, 0.02%, 0.02%, 0.03% and 0.02% for the fiscal years ended December 31, 2023, 2022, 2021, 2020 and 2019, respectively. |
| 6 | Such ratio includes recapture of waived/reimbursed fees from prior periods amounting to 0.01%. |
| 7 | Excludes the impact of expense reimbursement or fee waivers and expense reductions such as brokerage credits, but includes expense repayments and non-reimbursable expenses, if any, such as interest, taxes, and extraordinary expenses. (See Note 1(c) and 2 in the Notes to Financial Statements.) |
50
| | |
| | | AMG TimesSquare Mid Cap Growth Fund Financial Highlights For a share outstanding throughout each fiscal year |
| | | | | | | | | | | | | | | | | | | | |
| | | For the fiscal years ended December 31, |
| | | | | |
| Class N | | 2023 | | 2022 | | 2021 | | 2020 | | 2019 |
| | | | | |
Net Asset Value, Beginning of Year | | | $12.88 | | | | $17.24 | | | | $19.66 | | | | $17.69 | | | | $15.00 | |
| | | | | |
Income (loss) from Investment Operations: | | | | | | | | | | | | | | | | | | | | |
| | | | | |
Net investment loss1,2 | | | (0.06 | ) | | | (0.06 | ) | | | (0.10 | )3 | | | (0.09 | )4 | | | (0.07 | ) |
| | | | | |
Net realized and unrealized gain (loss) on investments | | | 3.25 | | | | (3.79 | ) | | | 3.11 | | | | 5.84 | | | | 5.62 | |
| | | | | |
Total income (loss) from investment operations | | | 3.19 | | | | (3.85 | ) | | | 3.01 | | | | 5.75 | | | | 5.55 | |
| | | | | |
Less Distributions to Shareholders from: | | | | | | | | | | | | | | | | | | | | |
| | | | | |
Net realized gain on investments | | | (0.66 | ) | | | (0.51 | ) | | | (5.43 | ) | | | (3.78 | ) | | | (2.86 | ) |
| | | | | |
Net Asset Value, End of Year | | | $15.41 | | | | $12.88 | | | | $17.24 | | | | $19.66 | | | | $17.69 | |
| | | | | |
Total Return2,5 | | | 24.82 | % | | | (22.39 | )% | | | 15.92 | % | | | 33.03 | % | | | 37.15 | % |
| | | | | |
Ratio of net expenses to average net assets6 | | | 1.18 | % | | | 1.17 | % | | | 1.17 | % | | | 1.17 | % | | | 1.17 | % |
| | | | | |
Ratio of gross expenses to average net assets7 | | | 1.19 | % | | | 1.18 | % | | | 1.18 | % | | | 1.18 | % | | | 1.18 | % |
| | | | | |
Ratio of net investment loss to average net assets2 | | | (0.39 | )% | | | (0.45 | )% | | | (0.46 | )% | | | (0.48 | )% | | | (0.38 | )% |
| | | | | |
Portfolio turnover | | | 39 | % | | | 44 | % | | | 53 | % | | | 74 | % | | | 65 | % |
| | | | | |
Net assets end of year (000’s) omitted | | | $411,238 | | | | $368,938 | | | | $535,289 | | | | $613,501 | | | | $518,267 | |
| | | | | |
| | | | | | | | | | | | | | | | | | | | | |
51
| | |
| | | AMG TimesSquare Mid Cap Growth Fund Financial Highlights For a share outstanding throughout each fiscal year |
| | | | | | | | | | | | | | | | | | | | |
| | | For the fiscal years ended December 31, |
| | | | | |
| Class I | | 2023 | | 2022 | | 2021 | | 2020 | | 2019 |
| | | | | |
Net Asset Value, Beginning of Year | | | $13.73 | | | | $18.31 | | | | $20.58 | | | | $18.35 | | | | $15.46 | |
| | | | | |
Income (loss) from Investment Operations: | | | | | | | | | | | | | | | | | | | | |
| | | | | |
Net investment loss1,2 | | | (0.04 | ) | | | (0.04 | ) | | | (0.07 | )3 | | | (0.07 | )4 | | | (0.05 | ) |
| | | | | |
Net realized and unrealized gain (loss) on investments | | | 3.47 | | | | (4.03 | ) | | | 3.25 | | | | 6.08 | | | | 5.80 | |
| | | | | |
Total income (loss) from investment operations | | | 3.43 | | | | (4.07 | ) | | | 3.18 | | | | 6.01 | | | | 5.75 | |
| | | | | |
Less Distributions to Shareholders from: | | | | | | | | | | | | | | | | | | | | |
| | | | | |
Net investment income | | | — | | | | — | | | | (0.02 | ) | | | — | | | | — | |
| | | | | |
Net realized gain on investments | | | (0.66 | ) | | | (0.51 | ) | | | (5.43 | ) | | | (3.78 | ) | | | (2.86 | ) |
| | | | | |
Total distributions to shareholders | | | (0.66 | ) | | | (0.51 | ) | | | (5.45 | ) | | | (3.78 | ) | | | (2.86 | ) |
| | | | | |
Net Asset Value, End of Year | | | $16.50 | | | | $13.73 | | | | $18.31 | | | | $20.58 | | | | $18.35 | |
| | | | | |
Total Return2,5 | | | 24.94 | % | | | (22.23 | )% | | | 16.04 | % | | | 33.27 | % | | | 37.33 | % |
| | | | | |
Ratio of net expenses to average net assets6 | | | 1.03 | % | | | 1.02 | % | | | 1.02 | % | | | 1.04 | % | | | 1.07 | % |
| | | | | |
Ratio of gross expenses to average net assets7 | | | 1.04 | % | | | 1.03 | % | | | 1.03 | % | | | 1.05 | % | | | 1.08 | % |
| | | | | |
Ratio of net investment loss to average net assets2 | | | (0.24 | )% | | | (0.30 | )% | | | (0.31 | )% | | | (0.35 | )% | | | (0.28 | )% |
| | | | | |
Portfolio turnover | | | 39 | % | | | 44 | % | | | 53 | % | | | 74 | % | | | 65 | % |
| | | | | |
Net assets end of year (000’s) omitted | | | $401,601 | | | | $339,100 | | | | $431,797 | | | | $526,800 | | | | $472,524 | |
| | | | | |
| | | | | | | | | | | | | | | | | | | | | |
52
| | |
| | | AMG TimesSquare Mid Cap Growth Fund Financial Highlights For a share outstanding throughout each fiscal year |
| | | | | | | | | | | | | | | | | | | | |
| | | For the fiscal years ended December 31, |
| | | | | |
| Class Z | | 2023 | | 2022 | | 2021 | | 2020 | | 2019 |
| | | | | |
Net Asset Value, Beginning of Year | | | $13.81 | | | | $18.39 | | | | $20.65 | | | | $18.39 | | | | $15.48 | |
| | | | | |
Income (loss) from Investment Operations: | | | | | | | | | | | | | | | | | | | | |
| | | | | |
Net investment loss1,2 | | | (0.03 | ) | | | (0.04 | ) | | | (0.06 | )3 | | | (0.05 | )4 | | | (0.03 | ) |
| | | | | |
Net realized and unrealized gain (loss) on investments | | | 3.48 | | | | (4.03 | ) | | | 3.27 | | | | 6.09 | | | | 5.80 | |
| | | | | |
Total income (loss) from investment operations | | | 3.45 | | | | (4.07 | ) | | | 3.21 | | | | 6.04 | | | | 5.77 | |
| | | | | |
Less Distributions to Shareholders from: | | | | | | | | | | | | | | | | | | | | |
| | | | | |
Net investment income | | | — | | | | — | | | | (0.04 | ) | | | — | | | | — | |
| | | | | |
Net realized gain on investments | | | (0.66 | ) | | | (0.51 | ) | | | (5.43 | ) | | | (3.78 | ) | | | (2.86 | ) |
| | | | | |
Total distributions to shareholders | | | (0.66 | ) | | | (0.51 | ) | | | (5.47 | ) | | | (3.78 | ) | | | (2.86 | ) |
| | | | | |
Net Asset Value, End of Year | | | $16.60 | | | | $13.81 | | | | $18.39 | | | | $20.65 | | | | $18.39 | |
| | | | | |
Total Return2,5 | | | 25.03 | % | | | (22.18 | )% | | | 16.10 | % | | | 33.36 | % | | | 37.41 | % |
| | | | | |
Ratio of net expenses to average net assets6 | | | 0.98 | % | | | 0.97 | % | | | 0.97 | % | | | 0.97 | % | | | 0.97 | % |
| | | | | |
Ratio of gross expenses to average net assets7 | | | 0.99 | % | | | 0.98 | % | | | 0.98 | % | | | 0.98 | % | | | 0.98 | % |
| | | | | |
Ratio of net investment loss to average net assets2 | | | (0.19 | )% | | | (0.25 | )% | | | (0.26 | )% | | | (0.28 | )% | | | (0.18 | )% |
| | | | | |
Portfolio turnover | | | 39 | % | | | 44 | % | | | 53 | % | | | 74 | % | | | 65 | % |
| | | | | |
Net assets end of year (000’s) omitted | | | $482,428 | | | | $414,298 | | | | $810,210 | | | | $896,929 | | | | $894,390 | |
| | | | | |
| | | | | | | | | | | | | | | | | | | | | |
| 1 | Per share numbers have been calculated using average shares. |
| 2 | Total returns and net investment loss would have been lower had certain expenses not been offset. |
| 3 | Includes non-recurring dividends. Without these dividends, net investment loss per share would have been $(0.16), $(0.13) and $(0.12) for Class N, Class I and Class Z, respectively. |
| 4 | Includes non-recurring dividends. Without these dividends, net investment loss per share would have been $(0.11), $(0.08) and $(0.07) for Class N, Class I and Class Z, respectively. |
| 5 | The total return is calculated using the published Net Asset Value as of fiscal year end. |
| 6 | Includes reduction from broker recapture amounting to 0.01% for each fiscal year ended December 31, 2023, 2022, 2021, 2020 and 2019. |
| 7 | Excludes the impact of expense reimbursement or fee waivers and expense reductions such as brokerage credits, but includes expense repayments and non-reimbursable expenses, if any, such as interest, taxes, and extraordinary expenses. (See Note 1(c) and 2 in the Notes to Financial Statements.) |
53
| | |
| | | AMG TimesSquare International Small Cap Fund Financial Highlights For a share outstanding throughout each fiscal year |
| | | | | | | | | | | | | | | | | | | | |
| | | For the fiscal years ended December 31, |
| | | | | |
| Class N | | 2023 | | 2022 | | 2021 | | 2020 | | 2019 |
| | | | | |
Net Asset Value, Beginning of Year | | | $13.21 | | | | $18.49 | | | | $18.44 | | | | $16.24 | | | | $12.72 | |
| | | | | |
Income (loss) from Investment Operations: | | | | | | | | | | | | | | | | | | | | |
| | | | | |
Net investment income1,2 | | | 0.14 | | | | 0.19 | 3 | | | 0.09 | | | | 0.02 | | | | 0.21 | 4 |
| | | | | |
Net realized and unrealized gain (loss) on investments | | | 1.16 | | | | (5.36 | ) | | | 0.14 | | | | 2.18 | | | | 3.55 | |
| | | | | |
Total income (loss) from investment operations | | | 1.30 | | | | (5.17 | ) | | | 0.23 | | | | 2.20 | | | | 3.76 | |
| | | | | |
Less Distributions to Shareholders from: | | | | | | | | | | | | | | | | | | | | |
| | | | | |
Net investment income | | | (0.24 | ) | | | (0.11 | ) | | | (0.18 | ) | | | — | | | | (0.24 | ) |
| | | | | |
Net Asset Value, End of Year | | | $14.27 | | | | $13.21 | | | | $18.49 | | | | $18.44 | | | | $16.24 | |
| | | | | |
Total Return2,5 | | | 9.92 | % | | | (27.97 | )% | | | 1.25 | % | | | 13.55 | % | | | 29.56 | % |
| | | | | |
Ratio of net expenses to average net assets | | | 1.27 | %6 | | | 1.25 | % | | | 1.22 | % | | | 1.23 | % | | | 1.23 | % |
| | | | | |
Ratio of gross expenses to average net assets7 | | | 1.27 | %6 | | | 1.25 | % | | | 1.22 | % | | | 1.23 | % | | | 1.23 | % |
| | | | | |
Ratio of net investment income to average net assets2 | | | 1.04 | % | | | 1.33 | % | | | 0.47 | % | | | 0.17 | % | | | 1.43 | % |
| | | | | |
Portfolio turnover | | | 69 | % | | | 71 | % | | | 73 | % | | | 57 | % | | | 40 | % |
| | | | | |
Net assets end of year (000’s) omitted | | | $9,101 | | | | $10,977 | | | | $21,202 | | | | $45,389 | | | | $70,532 | |
| | | | | |
| | | | | | | | | | | | | | | | | | | | | |
54
| | |
| | | AMG TimesSquare International Small Cap Fund Financial Highlights For a share outstanding throughout each fiscal year |
| | | | | | | | | | | | | | | | | | | | |
| | | For the fiscal years ended December 31, |
| | | | | |
| Class I | | 2023 | | 2022 | | 2021 | | 2020 | | 2019 |
| | | | | |
Net Asset Value, Beginning of Year | | | $13.23 | | | | $18.52 | | | | $18.49 | | | | $16.26 | | | | $12.74 | |
| | | | | |
Income (loss) from Investment Operations: | | | | | | | | | | | | | | | | | | | | |
| | | | | |
Net investment income1,2 | | | 0.17 | | | | 0.21 | 3 | | | 0.12 | | | | 0.05 | | | | 0.24 | 4 |
| | | | | |
Net realized and unrealized gain (loss) on investments | | | 1.16 | | | | (5.37 | ) | | | 0.13 | | | | 2.19 | | | | 3.55 | |
| | | | | |
Total income (loss) from investment operations | | | 1.33 | | | | (5.16 | ) | | | 0.25 | | | | 2.24 | | | | 3.79 | |
| | | | | |
Less Distributions to Shareholders from: | | | | | | | | | | | | | | | | | | | | |
| | | | | |
Net investment income | | | (0.26 | ) | | | (0.13 | ) | | | (0.22 | ) | | | (0.01 | ) | | | (0.27 | ) |
| | | | | |
Net Asset Value, End of Year | | | $14.30 | | | | $13.23 | | | | $18.52 | | | | $18.49 | | | | $16.26 | |
| | | | | |
Total Return2,5 | | | 10.11 | % | | | (27.84 | )% | | | 1.36 | % | | | 13.75 | % | | | 29.78 | % |
| | | | | |
Ratio of net expenses to average net assets | | | 1.11 | %6 | | | 1.10 | % | | | 1.07 | % | | | 1.08 | % | | | 1.06 | % |
| | | | | |
Ratio of gross expenses to average net assets7 | | | 1.11 | %6 | | | 1.10 | % | | | 1.07 | % | | | 1.08 | % | | | 1.06 | % |
| | | | | |
Ratio of net investment income to average net assets2 | | | 1.20 | % | | | 1.48 | % | | | 0.62 | % | | | 0.32 | % | | | 1.60 | % |
| | | | | |
Portfolio turnover | | | 69 | % | | | 71 | % | | | 73 | % | | | 57 | % | | | 40 | % |
| | | | | |
Net assets end of year (000’s) omitted | | | $96,333 | | | | $260,896 | | | | $614,652 | | | | $629,502 | | | | $658,599 | |
| | | | | |
| | | | | | | | | | | | | | | | | | | | | |
55
| | |
| | | AMG TimesSquare International Small Cap Fund Financial Highlights For a share outstanding throughout each fiscal year |
| | | | | | | | | | | | | | | | | | | | |
| | | For the fiscal years ended December 31, |
| | | | | |
| Class Z | | 2023 | | 2022 | | 2021 | | 2020 | | 2019 |
| | | | | |
Net Asset Value, Beginning of Year | | | $13.23 | | | | $18.53 | | | | $18.50 | | | | $16.26 | | | | $12.75 | |
| | | | | |
Income (loss) from Investment Operations: | | | | | | | | | | | | | | | | | | | | |
| | | | | |
Net investment income1,2 | | | 0.18 | | | | 0.22 | 3 | | | 0.14 | | | | 0.06 | | | | 0.25 | 4 |
| | | | | |
Net realized and unrealized gain (loss) on investments | | | 1.16 | | | | (5.37 | ) | | | 0.12 | | | | 2.20 | | | | 3.55 | |
| | | | | |
Total income (loss) from investment operations | | | 1.34 | | | | (5.15 | ) | | | 0.26 | | | | 2.26 | | | | 3.80 | |
| | | | | |
Less Distributions to Shareholders from: | | | | | | | | | | | | | | | | | | | | |
| | | | | |
Net investment income | | | (0.28 | ) | | | (0.15 | ) | | | (0.23 | ) | | | (0.02 | ) | | | (0.29 | ) |
| | | | | |
Net Asset Value, End of Year | | | $14.29 | | | | $13.23 | | | | $18.53 | | | | $18.50 | | | | $16.26 | |
| | | | | |
Total Return2,5 | | | 10.22 | % | | | (27.78 | )% | | | 1.47 | % | | | 13.90 | % | | | 29.77 | % |
| | | | | |
Ratio of net expenses to average net assets | | | 1.02 | %6 | | | 1.00 | % | | | 0.97 | % | | | 0.98 | % | | | 0.98 | % |
| | | | | |
Ratio of gross expenses to average net assets7 | | | 1.02 | %6 | | | 1.00 | % | | | 0.97 | % | | | 0.98 | % | | | 0.98 | % |
| | | | | |
Ratio of net investment income to average net assets2 | | | 1.29 | % | | | 1.58 | % | | | 0.72 | % | | | 0.42 | % | | | 1.68 | % |
| | | | | |
Portfolio turnover | | | 69 | % | | | 71 | % | | | 73 | % | | | 57 | % | | | 40 | % |
| | | | | |
Net assets end of year (000’s) omitted | | | $85,045 | | | | $166,307 | | | | $396,236 | | | | $397,976 | | | | $401,528 | |
| | | | | |
| | | | | | | | | | | | | | | | | | | | | |
| 1 | Per share numbers have been calculated using average shares. |
| 2 | Total returns and net investment income would have been lower had certain expenses not been offset. |
| 3 | Includes non-recurring dividends. Without these dividends, net investment income per share would have been $0.15, $0.17 and $0.18 for Class N, Class I and Class Z, respectively. |
| 4 | Includes non-recurring dividends. Without these dividends, net investment income per share would have been $0.16, $0.18 and $0.20 for Class N, Class I and Class Z, respectively. |
| 5 | The total return is calculated using the published Net Asset Value as of fiscal year end. |
| 6 | Includes interest expense of 0.02% related to participation in the interfund lending program. |
| 7 | Excludes the impact of expense reimbursement or fee waivers and expense reductions such as brokerage credits, but includes expense repayments and non-reimbursable expenses, if any, such as interest, taxes, and extraordinary expenses. (See Note 1(c) and 2 in the Notes to Financial Statements.) |
56
| | |
| | | AMG TimesSquare Emerging Markets Small Cap Fund Financial Highlights For a share outstanding throughout each fiscal year |
| | | | | | | | | | | | | | | | | | | | |
| | | For the fiscal years ended December 31, |
| | | | | |
| Class N | | 2023 | | 2022 | | 2021 | | 2020 | | 2019 |
| | | | | |
Net Asset Value, Beginning of Year | | | $8.29 | | | | $10.52 | | | | $13.66 | | | | $11.03 | | | | $9.49 | |
| | | | | |
Income (loss) from Investment Operations: | | | | | | | | | | | | | | | | | | | | |
| | | | | |
Net investment income (loss)1,2 | | | (0.02 | )3 | | | 0.03 | | | | (0.03 | ) | | | 0.13 | 4 | | | 0.03 | |
| | | | | |
Net realized and unrealized gain (loss) on investments | | | 1.99 | | | | (2.08 | ) | | | 1.22 | | | | 2.50 | | | | 1.53 | |
| | | | | |
Total income (loss) from investment operations | | | 1.97 | | | | (2.05 | ) | | | 1.19 | | | | 2.63 | | | | 1.56 | |
| | | | | |
Less Distributions to Shareholders from: | | | | | | | | | | | | | | | | | | | | |
| | | | | |
Net investment income | | | (0.21 | ) | | | — | | | | (0.07 | ) | | | (0.00 | )5 | | | (0.02 | ) |
| | | | | |
Net realized gain on investments | | | — | | | | (0.18 | ) | | | (4.26 | ) | | | — | | | | — | |
| | | | | |
Paid in capital | | | — | | | | — | | | | — | | | | — | | | | (0.00 | )5 |
| | | | | |
Total distributions to shareholders | | | (0.21 | ) | | | (0.18 | ) | | | (4.33 | ) | | | (0.00 | )5 | | | (0.02 | ) |
| | | | | |
Net Asset Value, End of Year | | | $10.05 | | | | $8.29 | | | | $10.52 | | | | $13.66 | | | | $11.03 | |
| | | | | |
Total Return2,6 | | | 23.90 | % | | | (19.43 | )% | | | 9.10 | % | | | 23.86 | % | | | 16.49 | % |
| | | | | |
Ratio of net expenses to average net assets | | | 1.77 | %7 | | | 1.68 | %7 | | | 1.68 | %8 | | | 1.65 | % | | | 1.67 | %7 |
| | | | | |
Ratio of gross expenses to average net assets9 | | | 6.97 | %7 | | | 4.23 | %7 | | | 3.03 | %8 | | | 3.66 | % | | | 4.29 | %7 |
| | | | | |
Ratio of net investment income (loss) to average net assets2 | | | (0.22 | )% | | | 0.34 | % | | | (0.19 | )% | | | 1.22 | % | | | 0.31 | % |
| | | | | |
Portfolio turnover | | | 81 | % | | | 104 | % | | | 139 | % | | | 129 | % | | | 103 | % |
| | | | | |
Net assets end of year (000’s) omitted | | | $107 | | | | $65 | | | | $49 | | | | $43 | | | | $39 | |
| | | | | |
| | | | | | | | | | | | | | | | | | | | | |
57
| | |
| | | AMG TimesSquare Emerging Markets Small Cap Fund Financial Highlights For a share outstanding throughout each fiscal year |
| | | | | | | | | | | | | | | | | | | | |
| | | For the fiscal years ended December 31, |
| | | | | |
| Class I | | 2023 | | 2022 | | 2021 | | 2020 | | 2019 |
| | | | | |
Net Asset Value, Beginning of Year | | | $8.35 | | | | $10.56 | | | | $13.70 | | | | $11.05 | | | | $9.51 | |
| | | | | |
Income (loss) from Investment Operations: | | | | | | | | | | | | | | | | | | | | |
| | | | | |
Net investment income1,2 | | | 0.02 | 3 | | | 0.07 | | | | 0.03 | | | | 0.18 | 4 | | | 0.07 | |
| | | | | |
Net realized and unrealized gain (loss) on investments | | | 2.02 | | | | (2.10 | ) | | | 1.23 | | | | 2.51 | | | | 1.53 | |
| | | | | |
Total income (loss) from investment operations | | | 2.04 | | | | (2.03 | ) | | | 1.26 | | | | 2.69 | | | | 1.60 | |
| | | | | |
Less Distributions to Shareholders from: | | | | | | | | | | | | | | | | | | | | |
| | | | | |
Net investment income | | | (0.24 | ) | | | — | | | | (0.14 | ) | | | (0.04 | ) | | | (0.05 | ) |
| | | | | |
Net realized gain on investments | | | — | | | | (0.18 | ) | | | (4.26 | ) | | | — | | | | — | |
| | | | | |
Paid in capital | | | — | | | | — | | | | — | | | | — | | | | (0.01 | ) |
| | | | | |
Total distributions to shareholders | | | (0.24 | ) | | | (0.18 | ) | | | (4.40 | ) | | | (0.04 | ) | | | (0.06 | ) |
| | | | | |
Net Asset Value, End of Year | | | $10.15 | | | | $8.35 | | | | $10.56 | | | | $13.70 | | | | $11.05 | |
| | | | | |
Total Return2,6 | | | 24.46 | % | | | (19.16 | )% | | | 9.50 | % | | | 24.49 | % | | | 16.83 | % |
| | | | | |
Ratio of net expenses to average net assets | | | 1.37 | %7 | | | 1.28 | %7 | | | 1.28 | %8 | | | 1.25 | % | | | 1.27 | %7 |
| | | | | |
Ratio of gross expenses to average net assets9 | | | 6.57 | %7 | | | 3.83 | %7 | | | 2.63 | %8 | | | 3.26 | % | | | 3.89 | %7 |
| | | | | |
Ratio of net investment income to average net assets2 | | | 0.18 | % | | | 0.74 | % | | | 0.21 | % | | | 1.62 | % | | | 0.71 | % |
| | | | | |
Portfolio turnover | | | 81 | % | | | 104 | % | | | 139 | % | | | 129 | % | | | 103 | % |
| | | | | |
Net assets end of year (000’s) omitted | | | $425 | | | | $342 | | | | $434 | | | | $396 | | | | $310 | |
| | | | | |
| | | | | | | | | | | | | | | | | | | | | |
58
| | |
| | | AMG TimesSquare Emerging Markets Small Cap Fund Financial Highlights For a share outstanding throughout each fiscal year |
| | | | | | | | | | | | | | | | | | | | |
| | | For the fiscal years ended December 31, |
| | | | | |
| Class Z | | 2023 | | 2022 | | 2021 | | 2020 | | 2019 |
| | | | | |
Net Asset Value, Beginning of Year | | | $8.35 | | | | $10.55 | | | | $13.70 | | | | $11.05 | | | | $9.51 | |
| | | | | |
Income (loss) from Investment Operations: | | | | | | | | | | | | | | | | | | | | |
| | | | | |
Net investment income1,2 | | | 0.02 | 3 | | | 0.07 | | | | 0.03 | | | | 0.18 | 4 | | | 0.07 | |
| | | | | |
Net realized and unrealized gain (loss) on investments | | | 2.01 | | | | (2.09 | ) | | | 1.22 | | | | 2.51 | | | | 1.53 | |
| | | | | |
Total income (loss) from investment operations | | | 2.03 | | | | (2.02 | ) | | | 1.25 | | | | 2.69 | | | | 1.60 | |
| | | | | |
Less Distributions to Shareholders from: | | | | | | | | | | | | | | | | | | | | |
| | | | | |
Net investment income | | | (0.24 | ) | | | — | | | | (0.14 | ) | | | (0.04 | ) | | | (0.05 | ) |
| | | | | |
Net realized gain on investments | | | — | | | | (0.18 | ) | | | (4.26 | ) | | | — | | | | — | |
| | | | | |
Paid in capital | | | — | | | | — | | | | — | | | | — | | | | (0.01 | ) |
| | | | | |
Total distributions to shareholders | | | (0.24 | ) | | | (0.18 | ) | | | (4.40 | ) | | | (0.04 | ) | | | (0.06 | ) |
| | | | | |
Net Asset Value, End of Year | | | $10.14 | | | | $8.35 | | | | $10.55 | | | | $13.70 | | | | $11.05 | |
| | | | | |
Total Return2,6 | | | 24.34 | % | | | (19.09 | )% | | | 9.51 | % | | | 24.40 | % | | | 16.83 | % |
| | | | | |
Ratio of net expenses to average net assets | | | 1.37 | %7 | | | 1.28 | %7 | | | 1.28 | %8 | | | 1.25 | % | | | 1.27 | %7 |
| | | | | |
Ratio of gross expenses to average net assets9 | | | 6.57 | %7 | | | 3.83 | %7 | | | 2.63 | %8 | | | 3.26 | % | | | 3.89 | %7 |
| | | | | |
Ratio of net investment income to average net assets2 | | | 0.18 | % | | | 0.74 | % | | | 0.21 | % | | | 1.62 | % | | | 0.71 | % |
| | | | | |
Portfolio turnover | | | 81 | % | | | 104 | % | | | 139 | % | | | 129 | % | | | 103 | % |
| | | | | |
Net assets end of year (000’s) omitted | | | $1,372 | | | | $4,298 | | | | $7,473 | | | | $6,766 | | | | $5,473 | |
| | | | | |
| | | | | | | | | | | | | | | | | | | | | |
| 1 | Per share numbers have been calculated using average shares. |
| 2 | Total returns and net investment income (loss) would have been lower had certain expenses not been offset. |
| 3 | Includes non-recurring dividends. Without these dividends, net investment loss per share would have been $(0.05), $(0.01) and $(0.01) for Class N, Class I and Class Z, respectively. |
| 4 | Includes non-recurring dividends. Without these dividends, net investment income per share would have been $0.11, $0.16 and $0.16 for Class N, Class I and Class Z, respectively. |
| 5 | Less than $(0.005) per share. |
| 6 | The total return is calculated using the published Net Asset Value as of fiscal year end. |
| 7 | Includes interest expense totaling 0.12%, 0.03% and 0.02% for the fiscal years ended December 31, 2023, 2022 and 2019, respectively, related to participation in the interfund lending program and bank overdrafts. |
| 8 | Includes expense totaling 0.03% relating to excise tax expense. |
| 9 | Excludes the impact of expense reimbursement or fee waivers and expense reductions such as brokerage credits, but includes expense repayments and non-reimbursable expenses, if any, such as interest, taxes, and extraordinary expenses. (See Note 1(c) and 2 in the Notes to Financial Statements.) |
59
| | |
| | | AMG TimesSquare Global Small Cap Fund Financial Highlights For a share outstanding throughout each fiscal year |
| | | | | | | | | | | | | | | | | | | | |
| | | For the fiscal years ended December 31, |
| | | | | |
| Class N | | 2023 | | 2022 | | 2021 | | 2020 | | 2019 |
| | | | | |
Net Asset Value, Beginning of Year | | | $9.50 | | | | $12.50 | | | | $12.05 | | | | $10.84 | | | | $7.95 | |
| | | | | |
Income (loss) from Investment Operations: | | | | | | | | | | | | | | | | | | | | |
| | | | | |
Net investment income (loss)1,2 | | | 0.01 | | | | 0.01 | | | | 0.00 | 3,4 | | | (0.02 | ) | | | 0.04 | |
| | | | | |
Net realized and unrealized gain (loss) on investments | | | 1.28 | | | | (3.01 | ) | | | 1.31 | | | | 1.23 | | | | 2.95 | |
| | | | | |
Total income (loss) from investment operations | | | 1.29 | | | | (3.00 | ) | | | 1.31 | | | | 1.21 | | | | 2.99 | |
| | | | | |
Less Distributions to Shareholders from: | | | | | | | | | | | | | | | | | | | | |
| | | | | |
Net investment income | | | (0.03 | ) | | | — | | | | — | | | | — | | | | (0.10 | ) |
| | | | | |
Net realized gain on investments | | | — | | | | — | | | | (0.86 | ) | | | — | | | | — | |
| | | | | |
Total distributions to shareholders | | | (0.03 | ) | | | — | | | | (0.86 | ) | | | — | | | | (0.10 | ) |
| | | | | |
Net Asset Value, End of Year | | | $10.76 | | | | $9.50 | | | | $12.50 | | | | $12.05 | | | | $10.84 | |
| | | | | |
Total Return2,5 | | | 13.62 | % | | | (24.00 | )% | | | 11.08 | % | | | 11.16 | % | | | 37.60 | % |
| | | | | |
Ratio of net expenses to average net assets | | | 1.25 | % | | | 1.25 | % | | | 1.25 | % | | | 1.25 | % | | | 1.27 | %6 |
| | | | | |
Ratio of gross expenses to average net assets7 | | | 5.41 | % | | | 5.17 | % | | | 4.28 | % | | | 6.48 | % | | | 7.45 | %6 |
| | | | | |
Ratio of net investment income (loss) to average net assets2 | | | 0.14 | % | | | 0.15 | % | | | 0.00 | %8 | | | (0.18 | )% | | | 0.42 | % |
| | | | | |
Portfolio turnover | | | 59 | % | | | 51 | % | | | 59 | % | | | 42 | % | | | 80 | % |
| | | | | |
Net assets end of year (000’s) omitted | | | $58 | | | | $53 | | | | $69 | | | | $63 | | | | $44 | |
| | | | | |
| | | | | | | | | | | | | | | | | | | | | |
60
| | |
| | | AMG TimesSquare Global Small Cap Fund Financial Highlights For a share outstanding throughout each fiscal year |
| | | | | | | | | | | | | | | | | | | | |
| | | For the fiscal years ended December 31, |
| | | | | |
| Class I | | 2023 | | 2022 | | 2021 | | 2020 | | 2019 |
| | | | | |
Net Asset Value, Beginning of Year | | | $9.54 | | | | $12.54 | | | | $12.09 | | | | $10.85 | | | | $7.96 | |
| | | | | |
Income (loss) from Investment Operations: | | | | | | | | | | | | | | | | | | | | |
| | | | | |
Net investment income1,2 | | | 0.04 | | | | 0.04 | | | | 0.03 | 3 | | | 0.01 | | | | 0.06 | |
| | | | | |
Net realized and unrealized gain (loss) on investments | | | 1.29 | | | | (3.02 | ) | | | 1.31 | | | | 1.23 | | | | 2.96 | |
| | | | | |
Total income (loss) from investment operations | | | 1.33 | | | | (2.98 | ) | | | 1.34 | | | | 1.24 | | | | 3.02 | |
| | | | | |
Less Distributions to Shareholders from: | | | | | | | | | | | | | | | | | | | | |
| | | | | |
Net investment income | | | (0.06 | ) | | | (0.02 | ) | | | (0.03 | ) | | | — | | | | (0.13 | ) |
| | | | | |
Net realized gain on investments | | | — | | | | — | | | | (0.86 | ) | | | — | | | | — | |
| | | | | |
Total distributions to shareholders | | | (0.06 | ) | | | (0.02 | ) | | | (0.89 | ) | | | — | | | | (0.13 | ) |
| | | | | |
Net Asset Value, End of Year | | | $10.81 | | | | $9.54 | | | | $12.54 | | | | $12.09 | | | | $10.85 | |
| | | | | |
Total Return2,5 | | | 13.94 | % | | | (23.76 | )% | | | 11.29 | % | | | 11.43 | % | | | 37.96 | % |
| | | | | |
Ratio of net expenses to average net assets | | | 1.00 | % | | | 1.00 | % | | | 1.00 | % | | | 1.00 | % | | | 1.02 | %6 |
| | | | | |
Ratio of gross expenses to average net assets7 | | | 5.16 | % | | | 4.92 | % | | | 4.03 | % | | | 6.23 | % | | | 7.20 | %6 |
| | | | | |
Ratio of net investment income to average net assets2 | | | 0.39 | % | | | 0.40 | % | | | 0.25 | % | | | 0.07 | % | | | 0.67 | % |
| | | | | |
Portfolio turnover | | | 59 | % | | | 51 | % | | | 59 | % | | | 42 | % | | | 80 | % |
| | | | | |
Net assets end of year (000’s) omitted | | | $35 | | | | $31 | | | | $41 | | | | $37 | | | | $33 | |
| | | | | |
| | | | | | | | | | | | | | | | | | | | | |
61
| | |
| | | AMG TimesSquare Global Small Cap Fund Financial Highlights For a share outstanding throughout each fiscal year |
| | | | | | | | | | | | | | | | | | | | |
| | | For the fiscal years ended December 31, |
| | | | | |
| Class Z | | 2023 | | 2022 | | 2021 | | 2020 | | 2019 |
| | | | | |
Net Asset Value, Beginning of Year | | | $9.54 | | | | $12.55 | | | | $12.09 | | | | $10.86 | | | | $7.96 | |
| | | | | |
Income (loss) from Investment Operations: | | | | | | | | | | | | | | | | | | | | |
| | | | | |
Net investment income1,2 | | | 0.04 | | | | 0.04 | | | | 0.03 | 3 | | | 0.01 | | | | 0.06 | |
| | | | | |
Net realized and unrealized gain (loss) on investments | | | 1.29 | | | | (3.03 | ) | | | 1.32 | | | | 1.22 | | | | 2.97 | |
| | | | | |
Total income (loss) from investment operations | | | 1.33 | | | | (2.99 | ) | | | 1.35 | | | | 1.23 | | | | 3.03 | |
| | | | | |
Less Distributions to Shareholders from: | | | | | | | | | | | | | | | | | | | | |
| | | | | |
Net investment income | | | (0.06 | ) | | | (0.02 | ) | | | (0.03 | ) | | | — | | | | (0.13 | ) |
| | | | | |
Net realized gain on investments | | | — | | | | — | | | | (0.86 | ) | | | — | | | | — | |
| | | | | |
Total distributions to shareholders | | | (0.06 | ) | | | (0.02 | ) | | | (0.89 | ) | | | — | | | | (0.13 | ) |
| | | | | |
Net Asset Value, End of Year | | | $10.81 | | | | $9.54 | | | | $12.55 | | | | $12.09 | | | | $10.86 | |
| | | | | |
Total Return2,5 | | | 13.94 | % | | | (23.83 | )% | | | 11.38 | % | | | 11.33 | % | | | 38.09 | % |
| | | | | |
Ratio of net expenses to average net assets | | | 1.00 | % | | | 1.00 | % | | | 1.00 | % | | | 1.00 | % | | | 1.02 | %6 |
| | | | | |
Ratio of gross expenses to average net assets7 | | | 5.16 | % | | | 4.92 | % | | | 4.03 | % | | | 6.23 | % | | | 7.20 | %6 |
| | | | | |
Ratio of net investment income to average net assets2 | | | 0.39 | % | | | 0.40 | % | | | 0.25 | % | | | 0.07 | % | | | 0.67 | % |
| | | | | |
Portfolio turnover | | | 59 | % | | | 51 | % | | | 59 | % | | | 42 | % | | | 80 | % |
| | | | | |
Net assets end of year (000’s) omitted | | | $1,687 | | | | $1,619 | | | | $2,578 | | | | $2,186 | | | | $2,032 | |
| | | | | |
| | | | | | | | | | | | | | | | | | | | | |
| 1 | Per share numbers have been calculated using average shares. |
| 2 | Total returns and net investment income (loss) would have been lower had certain expenses not been offset. |
| 3 | Includes non-recurring dividends. Without these dividends, net investment income (loss) per share would have been $(0.02), $0.01 and $0.01 for Class N, Class I and Class Z, respectively. |
| 4 | Less than $0.005 per share. |
| 5 | The total return is calculated using the published Net Asset Value as of fiscal year end. |
| 6 | Includes interest expense related to participation in the interfund lending program and excise tax expense totaling 0.02%. |
| 7 | Excludes the impact of expense reimbursement or fee waivers and expense reductions such as brokerage credits, but includes expense repayments and non-reimbursable expenses, if any, such as interest, taxes, and extraordinary expenses. (See Note 1(c) and 2 in the Notes to Financial Statements.) |
62
| | |
| | | Notes to Financial Statements December 31, 2023 |
| | | |
| | | |
1. ORGANIZATION AND SUMMARY OF SIGNIFICANT ACCOUNTING POLICIES
AMG Funds (the “Trust”) is an open-end management investment company, organized as a Massachusetts business trust, and registered under the Investment Company Act of 1940, as amended (the “1940 Act”). Currently, the Trust consists of a number of different funds, each having distinct investment management objectives, strategies, risks, and policies. Included in this report are AMG TimesSquare Small Cap Growth Fund (“Small Cap”), AMG TimesSquare Mid Cap Growth Fund (“Mid Cap”), AMG TimesSquare International Small Cap Fund (“International Small Cap”), AMG TimesSquare Emerging Markets Small Cap Fund (“Emerging Markets Small Cap”) and AMG TimesSquare Global Small Cap Fund (“Global Small Cap”), each a “Fund” and collectively, the “Funds”.
Each Fund offers Class N, Class I and Class Z shares. Each class represents an interest in the same assets of the respective Fund. Although all share classes generally have identical voting rights, each share class votes separately when required by law. Different share classes may have different net asset values per share to the extent the share classes pay different distribution amounts and/or the expenses of such share classes differ. Each share class has its own expense structure. Please refer to a current prospectus for additional information on each share class.
Market prices of investments held by the Funds may fall rapidly or unpredictably due to a variety of economic or political factors, market conditions, disasters or public health issues, or in response to events that affect particular industries or companies.
The Funds’ financial statements are prepared in accordance with accounting principles generally accepted in the United States of America (“U.S. GAAP”), including accounting and reporting guidance pursuant to Accounting Standards Codification Topic 946 applicable to investment companies. U.S. GAAP requires management to make estimates and assumptions that affect the reported amounts of assets and liabilities and disclosure of contingent assets and liabilities at the date of the financial statements and the reported amounts of income and expenses during the reporting period. Actual results could differ from those estimates and such differences could be material. The following is a summary of significant accounting policies followed by the Funds in the preparation of their financial statements:
a. VALUATION OF INVESTMENTS
Equity securities traded on a national securities exchange or reported on the NASDAQ national market system (“NMS”) are valued at the last quoted sales price on the primary exchange or, if applicable, the NASDAQ official closing price or the official closing price of the relevant exchange or, lacking any sales, at the last quoted bid price. Equity securities held by the Funds that are traded in the over-the-counter market (other than NMS securities) are valued at the bid price. Foreign equity securities (securities principally traded in markets other than U.S. markets) held by the Funds are valued at the official closing price on the primary exchange or, for markets that either do not offer an official closing price or where the official closing price may not be representative of the overall market, the last quoted sale price.
Fixed income securities purchased with a remaining maturity of 60 days or less are valued at amortized cost, provided that the amortized cost value is approximately the same as the fair value of the security valued without the use of
amortized cost. Investments in other open-end registered investment companies are valued at their end of day net asset value per share.
The Funds’ portfolio investments are generally valued based on independent market quotations or prices or, if none, “evaluative” or other market based valuations provided by third party pricing services. Pursuant to Rule 2a-5 under the 1940 Act, the Funds’ Board of Trustees (the “Board”) designated AMG Funds LLC (the “Investment Manager”) as the Funds’ Valuation Designee to perform the Funds’ fair value determinations. Such determinations are subject to Board oversight and certain reporting and other requirements intended to ensure that the Board receives the information it needs to oversee the Investment Manager’s fair value determinations.
Under certain circumstances, the value of certain Fund portfolio investments may be based on an evaluation of fair value, pursuant to procedures established by the Investment Manager and under the general supervision of the Board. The Funds may use the fair value of a portfolio investment to calculate its net asset value (“NAV”) in the event that the market quotation, price or market based valuation for the portfolio investment is not readily available or otherwise not determinable pursuant to the Funds’ valuation procedures, if the Investment Manager believes the quotation, price or market based valuation to be unreliable, or in certain other circumstances. When determining the fair value of an investment, the Investment Manager seeks to determine the price that the Funds might reasonably expect to receive from current sale of that portfolio investment in an arms-length transaction. Fair value determinations shall be based upon consideration of all available facts and information, including, but not limited to (i) attributes specific to the investment; (ii) fundamental and analytical data relating to the investment; and (iii) the value of other comparable securities or relevant financial instruments, including derivative securities, traded on other markets or among dealers.
The values assigned to fair value portfolio investments are based on available information and do not necessarily represent amounts that might ultimately be realized in the future, since such amounts depend on future developments inherent in long-term investments. Because of the inherent uncertainty of valuation, those estimated values may differ significantly from the values that would have been used had a ready market for the investments existed, and the differences could be material. The Board will be presented with quarterly reports, as of the most recent quarter end, summarizing all fair value activity, material fair value matters that occurred during the quarter, and all outstanding securities fair valued by the Funds. Additionally, the Board will be presented with an annual report that assesses the adequacy and effectiveness of the Investment Manager’s process for determining the fair value of the Funds’ investments.
With respect to foreign equity securities and certain foreign fixed income securities, securities held in the Funds that can be fair valued by the applicable fair value pricing service are fair valued on each business day provided that each individual price exceeds a pre-established confidence level.
U.S. GAAP defines fair value as the price that a fund would receive to sell an asset or pay to transfer a liability in an orderly transaction between market participants at the measurement date. U.S. GAAP also establishes a framework for measuring fair value, and a three level hierarchy for fair value measurements based upon the transparency of inputs to the valuation of an asset or liability. Inputs may be observable or unobservable and refer broadly to the assumptions that market participants would use in pricing the asset or liability. Observable inputs reflect the assumptions market participants would use in pricing the asset or liability based on market data obtained from sources independent of the Funds.
Unobservable inputs reflect the Funds’ own assumptions about the assumptions
63
| | |
| | | Notes to Financial Statements (continued) |
| | | |
| | | |
that market participants would use in pricing the asset or liability developed based on the best information available in the circumstances. Each investment is assigned a level based upon the observability of the inputs which are significant to the overall valuation.
The three-tier hierarchy of inputs is summarized below:
Level 1 – inputs are quoted prices in active markets for identical investments (e.g., equity securities, open-end investment companies)
Level 2 – other observable inputs (including, but not limited to: quoted prices for similar assets or liabilities in markets that are active, quoted prices for identical or similar assets or liabilities in markets that are not active, inputs other than quoted prices that are observable for the assets or liabilities (such as interest rates, yield curves, volatilities, prepayment speeds, loss severities, credit risks and default rates) or other market corroborated inputs) (e.g., debt securities, government securities, foreign currency exchange contracts, foreign securities utilizing international fair value pricing, fair valued securities with observable inputs)
Level 3 – inputs are significant unobservable inputs (including the Fund’s own assumptions used to determine the fair value of investments) (e.g., fair valued securities with unobservable inputs)
Changes in inputs or methodologies used for valuing investments may result in a transfer in or out of levels within the fair value hierarchy. The inputs or methodologies used for valuing investments may not necessarily be an indication of the risk associated with investing in those investments.
b. SECURITY TRANSACTIONS
Security transactions are accounted for as of trade date. Realized gains and losses on securities sold are determined on the basis of identified cost.
c. INVESTMENT INCOME AND EXPENSES
Dividend income is recorded on the ex-dividend date. Dividends from foreign securities are recorded on the ex-dividend date, and if after the fact, as soon as the Funds become aware of the ex-dividend date, except for Korean securities where dividends are recorded on confirmation date. Interest income, which includes amortization of premium and accretion of discount on debt securities, is accrued as earned. Dividend and interest income on foreign securities is recorded gross of any withholding tax. Non-cash dividends included in dividend income, if any, are reported at the fair market value of the securities received. Upon notification from the issuer, distributions received from a real estate investment trust (REIT) may be
redesignated as a reduction of cost of investments and/or realized gain. Other income and expenses are recorded on an accrual basis. Expenses that cannot be directly attributed to a Fund are apportioned among the funds in the Trust and other trusts or funds within the AMG Funds Family of Funds (collectively, the “AMG Funds Family”) based upon their relative average net assets or number of shareholders. Investment income, realized and unrealized capital gains and losses, the common expenses of each Fund, and certain fund level expense reductions, if any, are allocated on a pro-rata basis to each class based on the relative net assets of each class to the total net assets of each Fund.
Small Cap and Mid Cap had certain portfolio trades directed to various brokers under a brokerage recapture program. Credits received from the brokerage recapture program are earned and paid on a monthly basis, and are recorded as expense offsets, which serve to reduce the Funds’ overall expense ratio. For the fiscal year ended December 31, 2023, the impact on the expenses and expense ratios, if any, were as follows: Small Cap - $48,635 or 0.02% and Mid Cap - $72,753 or 0.01%.
d. DIVIDENDS AND DISTRIBUTIONS
Fund distributions resulting from either net investment income or realized net capital gains, if any, will normally be declared and paid at least annually in December. Distributions to shareholders are recorded on the ex-dividend date. Distributions are determined in accordance with federal income tax regulations, which may differ from net investment income and net realized capital gains for financial statement purposes (U.S. GAAP). Differences may be permanent or temporary. Permanent differences are reclassified among capital accounts in the financial statements to reflect their tax character. Permanent book and tax basis differences, if any, relating to shareholder distributions will result in reclassifications to paid-in capital. Temporary differences arise when certain items of income, expense and gain or loss are recognized in different periods for financial statement and tax purposes; these differences will reverse at some time in the future. Permanent differences are primarily due to the write-off of net operating losses for Small Cap and Mid Cap. In addition, permanent differences for Mid Cap are due to tax equalization utilized. There were no permanent differences for International Small Cap, Emerging Markets Small Cap, or Global Small Cap. Temporary differences are primarily due to mark-to-market on passive foreign investment companies for Small Cap, International Small Cap, and Global Small Cap. Temporary differences for Emerging Markets Small Cap are due to cost adjustments on dividend income received from spinoffs and qualified late-year ordinary loss deferrals. In addition, each Fund had temporary differences due to wash sale loss deferrals.
The tax character of distributions paid during the fiscal years ended December 31, 2023 and December 31, 2022 was as follows:
| | | | | | | | | | | | | | | | | | | | | | | | |
| | | |
| | | Small Cap | | | Mid Cap | | | International Small Cap | |
| | | | | | |
Distributions paid from: | | | 2023 | | | | 2022 | | | | 2023 | | | | 2022 | | | | 2023 | | | | 2022 | |
| | | | | | |
Ordinary income | | | — | | | | — | | | | — | | | | — | | | | $3,766,601 | | | | $4,752,915 | |
| | | | | | |
Long-term capital gains | | | — | | | | $15,933,418 | | | | $51,126,628 | | | | $42,276,026 | | | | — | | | | — | |
| | | | | | | | | | | | | | | | | | | | | | | | |
| | | | | | |
| | | — | | | | $15,933,418 | | | | $51,126,628 | | | | $42,276,026 | | | | $3,766,601 | | | | $4,752,915 | |
| | | | | | | | | | | | | | | | | | | | | | | | |
64
| | |
| | | Notes to Financial Statements (continued) |
| | | |
| | | |
| | | | | | | | | | | | | | | | |
| | |
| | | Emerging Markets Small Cap | | | Global Small Cap | |
| | | | |
Distributions paid from: | | | 2023 | | | | 2022 | | | | 2023 | | | | 2022 | |
| | | | |
Ordinary income | | | $43,449 | | | | $40 | | | | $9,568 | | | | $3,434 | |
| | | | |
Long-term capital gains | | | — | | | | 101,889 | | | | — | | | | — | |
| | | | | | | | | | | | | | | | |
| | | | |
| | | $43,449 | | | | $101,929 | | | | $9,568 | | | | $3,434 | |
| | | | | | | | | | | | | | | | |
As of December 31, 2023, the components of distributable earnings (excluding unrealized appreciation/depreciation) on a tax basis consisted of:
| | | | | | | | | | | | | | | | | | | | |
| | | | | |
| | | Small Cap | | | Mid Cap | | | International Small Cap | | | Emerging Markets Small Cap | | | Global Small Cap | |
| | | | | |
Capital loss carryforward | | | — | | | | — | | | | $216,324,335 | | | | $1,128,187 | | | | $254,038 | |
| | | | | |
Undistributed ordinary income | | | — | | | | — | | | | 658,296 | | | | — | | | | 1,274 | |
| | | | | |
Undistributed long-term capital gains | | | $1,308,155 | | | | $15,599,257 | | | | — | | | | — | | | | — | |
| | | | | |
Late-year ordinary loss deferral | | | — | | | | — | | | | — | | | | 1,351 | | | | — | |
At December 31, 2023, the cost of investments and the aggregate gross unrealized appreciation and depreciation for federal income tax purposes were as follows:
| | | | | | | | | | | | | | | | |
| | | | |
| Fund | | Cost | | | Appreciation | | | Depreciation | | | Net Appreciation | |
| | | | |
Small Cap | | | $145,672,178 | | | | $33,874,858 | | | | $(12,320,859) | | | | $21,553,999 | |
| | | | |
Mid Cap | | | 884,532,812 | | | | 445,705,345 | | | | (19,954,518 | ) | | | 425,750,827 | |
| | | | |
International Small Cap | | | 167,960,653 | | | | 36,205,321 | | | | (11,780,448) | | | | 24,424,873 | |
| | | | |
Emerging Markets Small Cap | | | 1,740,770 | | | | 422,842 | | | | (198,828 | ) | | | 224,014 | |
| | | | |
Global Small Cap | | | 1,564,386 | | | | 330,205 | | | | (65,136) | | | | 265,069 | |
e. FEDERAL TAXES
Each Fund currently qualifies as an investment company and intends to comply with the requirements under Subchapter M of the Internal Revenue Code of 1986, as amended (the “Internal Revenue Code”), and to distribute substantially all of its taxable income and gains to its shareholders and to meet certain diversification and income requirements with respect to investment companies. The Investment Manager has analyzed the Funds’ tax positions taken on federal income tax returns as of December 31, 2023, and for all open tax years (generally, the three prior taxable years), and has concluded that no provision for federal income tax is required in the Funds’ financial statements. Additionally, the Investment Manager is not aware of any tax position for which it is reasonably possible that the total amounts of unrecognized tax benefit/detriment will change materially in the next twelve months.
Furthermore, based on each Fund’s understanding of the tax rules and rates related to income, gains and transactions for the foreign jurisdictions in which it invests, each Fund will provide for foreign taxes, and where appropriate, deferred foreign taxes.
f. CAPITAL LOSS CARRYOVERS AND DEFERRALS
As of December 31, 2023, the Funds had capital loss carryovers for federal income tax purposes as shown in the following chart. These amounts may be used to offset future realized capital gains indefinitely, and retain their character as short-term and/or long-term.
| | | | | | | | | | | | |
| | | |
| Fund | | Short-Term | | | Long-Term | | | Total | |
| | | |
International Small Cap | | | $148,363,459 | | | | $67,960,876 | | | | $216,324,335 | |
| | | |
Emerging Markets Small Cap | | | 885,714 | | | | 242,473 | | | | 1,128,187 | |
| | | |
Global Small Cap | | | 222,989 | | | | 31,049 | | | | 254,038 | |
As of December 31, 2023, Small Cap and Mid Cap had no capital loss carryovers for federal income tax purposes. Should the Funds incur net capital losses for the fiscal year ended December 31, 2024, such amounts may be used to offset future realized capital gains indefinitely, and retain their character as short-term and/or long-term.
For the fiscal year ended December 31, 2023, the following Funds utilized capital loss carryovers in the amount of:
| | | | | | | | | | |
| | | |
| Fund | | Short-Term | | | | | | Long-Term |
| | | |
Small Cap | | | $14,054,444 | | | | | | | — |
| | | |
Mid Cap | | | 16,021,723 | | | | | | | — |
| | | |
Emerging Markets Small Cap | | | 25,003 | | | | | | | — |
65
| | |
| | | Notes to Financial Statements (continued) |
| | | |
| | | |
g. CAPITAL STOCK
The Trust’s Amended and Restated Agreement and Declaration of Trust authorizes for each Fund the issuance of an unlimited number of shares of beneficial interest, without par value. Each Fund records sales and repurchases of its capital stock on the trade date.
For the fiscal years ended December 31, 2023 and December 31, 2022, the capital stock transactions by class for the Funds were as follows:
| | | | | | | | | | | | | | | | | | | | | | | | | | | | | | | | |
| | | Small Cap | | | Mid Cap | |
| | | | |
| | | December 31, 2023 | | | December 31, 2022 | | | December 31, 2023 | | | December 31, 2022 | |
| | | | | | | | |
| | | Shares | | | Amount | | | Shares | | | Amount | | | Shares | | | Amount | | | Shares | | | Amount | |
| | | | | | | | |
Class N: | | | | | | | | | | | | | | | | | | | | | | | | | | | | | | | | |
| | | | | | | | |
Shares sold | | | 149,591 | | | | $1,544,535 | | | | 896,662 | | | | $9,946,104 | | | | 1,274,860 | | | | $18,102,672 | | | | 2,655,998 | | | | $37,873,019 | |
| | | | | | | | |
Shares issued in reinvestment of distributions | | | — | | | | — | | | | 406,723 | | | | 4,006,213 | | | | 1,117,758 | | | | 17,056,989 | | | | 1,081,027 | | | | 14,183,075 | |
| | | | | | | | |
Shares redeemed | | | (2,966,125) | | | | (30,368,078) | | | | (3,529,240) | | | | (35,526,177) | | | | (4,347,913) | | | | (61,635,017) | | | | (6,145,647) | | | | (87,467,481) | |
| | | | | | | | | | | | | | | | | | | | | | | | | | | | | | | | |
| | | | | | | | |
Net decrease | | | (2,816,534) | | | | $(28,823,543) | | | | (2,225,855) | | | | $(21,573,860) | | | | (1,955,295) | | | | $(26,475,356) | | | | (2,408,622) | | | | $(35,411,387) | |
| | | | | | | | | | | | | | | | | | | | | | | | | | | | | | | | |
| | | | | | | | |
Class I: | | | | | | | | | | | | | | | | | | | | | | | | | | | | | | | | |
| | | | | | | | |
Shares sold | | | 134,221 | | | | $1,459,754 | | | | 111,079 | | | | $1,237,865 | | | | 3,605,178 | | | | $54,683,241 | | | | 6,003,888 | | | | $91,051,092 | |
| | | | | | | | |
Shares issued in reinvestment of distributions | | | — | | | | — | | | | 55,279 | | | | 580,981 | | | | 929,609 | | | | 15,189,815 | | | | 876,938 | | | | 12,268,364 | |
| | | | | | | | |
Shares redeemed | | | (228,887) | | | | (2,631,354) | | | | (105,953) | | | | (1,199,131) | | | | (4,886,026) | | | | (74,099,111) | | | | (5,771,917) | | | | (85,383,863) | |
| | | | | | | | | | | | | | | | | | | | | | | | | | | | | | | | |
| | | | | | | | |
Net increase (decrease) | | | (94,666) | | | | $(1,171,600) | | | | 60,405 | | | | $619,715 | | | | (351,239) | | | | $(4,226,055) | | | | 1,108,909 | | | | $17,935,593 | |
| | | | | | | | | | | | | | | | | | | | | | | | | | | | | | | | |
| | | | | | | | |
Class Z: | | | | | | | | | | | | | | | | | | | | | | | | | | | | | | | | |
| | | | | | | | |
Shares sold | | | 1,503,089 | | | | $16,617,655 | | | | 1,221,999 | | | | $14,450,187 | | | | 4,876,000 | | | | $73,516,898 | | | | 5,137,985 | | | | $78,962,853 | |
| | | | | | | | |
Shares issued in reinvestment of distributions | | | — | | | | — | | | | 1,010,145 | | | | 10,677,230 | | | | 1,056,143 | | | | 17,362,982 | | | | 1,089,566 | | | | 15,319,295 | |
| | | | | | | | |
Shares redeemed | | | (7,141,397) | | | | (79,450,640) | | | | (5,614,082) | | | | (68,300,539) | | | | (6,876,645) | | | | (104,304,846) | | | | (20,266,422) | | | | (295,159,685) | |
| | | | | | | | | | | | | | | | | | | | | | | | | | | | | | | | |
| | | | | | | | |
Net decrease | | | (5,638,308) | | | | $(62,832,985) | | | | (3,381,938) | | | | $(43,173,122) | | | | (944,502) | | | | $(13,424,966) | | | | (14,038,871) | | | | $(200,877,537) | |
| | | | | | | | | | | | | | | | | | | | | | | | | | | | | | | | |
| | |
| | | International Small Cap | | | Emerging Markets Small Cap | |
| | | | |
| | | December 31, 2023 | | | December 31, 2022 | | | December 31, 2023 | | | December 31, 2022 | |
| | | | | | | | |
| | | Shares | | | Amount | | | Shares | | | Amount | | | Shares | | | Amount | | | Shares | | | Amount | |
| | | | | | | | |
Class N: | | | | | | | | | | | | | | | | | | | | | | | | | | | | | | | | |
| | | | | | | | |
Shares sold | | | 71,119 | | | | $988,188 | | | | 143,240 | | | | $2,009,589 | | | | 3,784 | | | | $34,508 | | | | 5,117 | | | | $43,509 | |
| | | | | | | | |
Shares issued in reinvestment of distributions | | | 11,212 | | | | 155,058 | | | | 6,983 | | | | 92,109 | | | | 220 | | | | 2,179 | | | | 165 | | | | 1,353 | |
| | | | | | | | |
Shares redeemed | | | (275,623) | | | | (3,836,992) | | | | (465,959) | | | | (6,397,061) | | | | (1,178) | | | | (11,350) | | | | (2,100) | | | | (20,778) | |
| | | | | | | | | | | | | | | | | | | | | | | | | | | | | | | | |
| | | | | | | | |
Net increase (decrease) | | | (193,292) | | | | $(2,693,746) | | | | (315,736) | | | | $(4,295,363) | | | | 2,826 | | | | $25,337 | | | | 3,182 | | | | $24,084 | |
| | | | | | | | | | | | | | | | | | | | | | | | | | | | | | | | |
| | | | | | | | |
Class I: | | | | | | | | | | | | | | | | | | | | | | | | | | | | | | | | |
| | | | | | | | |
Shares sold | | | 859,552 | | | | $12,026,291 | | | | 8,648,988 | | | | $125,632,972 | | | | — | | | | — | | | | — | | | | — | |
| | | | | | | | |
Shares issued in reinvestment of distributions | | | 122,056 | | | | 1,691,697 | | | | 198,865 | | | | 2,627,008 | | | | 976 | | | | $9,752 | | | | 893 | | | | $7,395 | |
| | | | | | | | |
Shares redeemed | | | (13,966,035) | | | | (196,364,888) | | | | (22,311,931) | | | | (318,198,623) | | | | — | | | | — | | | | (1,083) | | | | (10,580) | |
| | | | | | | | | | | | | | | | | | | | | | | | | | | | | | | | |
| | | | | | | | |
Net increase (decrease) | | | (12,984,427) | | | | $(182,646,900) | | | | (13,464,078) | | | | $(189,938,643) | | | | 976 | | | | $9,752 | | | | (190) | | | | $(3,185) | |
| | | | | | | | | | | | | | | | | | | | | | | | | | | | | | | | |
| | | | | | | | |
Class Z: | | | | | | | | | | | | | | | | | | | | | | | | | | | | | | | | |
| | | | | | | | |
Shares sold | | | 2,367,890 | | | | $33,277,315 | | | | 4,355,478 | | | | $66,368,453 | | | | — | | | | — | | | | 527 | | | | $5,001 | |
| | | | | | | | |
Shares issued in reinvestment of distributions | | | 135,712 | | | | 1,879,620 | | | | 147,401 | | | | 1,947,166 | | | | 3,158 | | | | $31,518 | | | | 11,245 | | | | 93,111 | |
| | | | | | | | |
Shares redeemed | | | (9,121,849) | | | | (122,046,461) | | | | (13,315,597) | | | | (169,807,353) | | | | (382,669) | | | | (3,359,505) | | | | (205,101) | | | | (1,853,541) | |
| | | | | | | | | | | | | | | | | | | | | | | | | | | | | | | | |
| | | | | | | | |
Net decrease | | | (6,618,247) | | | | $(86,889,526) | | | | (8,812,718) | | | | $(101,491,734) | | | | (379,511) | | | | $(3,327,987) | | | | (193,329) | | | | $(1,755,429) | |
| | | | | | | | | | | | | | | | | | | | | | | | | | | | | | | | |
66
| | |
| | | Notes to Financial Statements (continued) |
| | | |
| | | |
| | | | | | | | | | | | | | | | |
| | | Global Small Cap | |
| | |
| | | December 31, 2023 | | | December 31, 2022 | |
| | | | |
| | | Shares | | | Amount | | | Shares | | | Amount | |
| | | | |
Class N: | | | | | | | | | | | | | | | | |
| | | | |
Shares issued in reinvestment of distributions | | | 13 | | | | $141 | | | | — | | | | — | |
| | | | |
Shares redeemed | | | (215) | | | | (2,247) | | | | — | | | | — | |
| | | | | | | | | | | | | | | | |
| | | | |
Net decrease | | | (202) | | | | $(2,106) | | | | — | | | | — | |
| | | | | | | | | | | | | | | | |
| | | | |
Class I: | | | | | | | | | | | | | | | | |
| | | | |
Shares issued in reinvestment of distributions | | | 18 | | | | $193 | | | | 7 | | | | $65 | |
| | | | |
Class Z: | | | | | | | | | | | | | | | | |
| | | | |
Shares sold | | | — | | | | — | | | | 4,549 | | | | $50,000 | |
| | | | |
Shares issued in reinvestment of distributions | | | 865 | | | | $9,197 | | | | 354 | | | | 3,369 | |
| | | | |
Shares redeemed | | | (14,446) | | | | (149,467) | | | | (40,733) | | | | (362,297) | |
| | | | | | | | | | | | | | | | |
| | | | |
Net decrease | | | (13,581) | | | | $(140,270) | | | | (35,830) | | | | $(308,928) | |
| | | | | | | | | | | | | | | | |
At December 31, 2023, certain shareholders of record individually or collectively held greater than 5% of the net assets of the Funds as follows: Emerging Markets Small Cap - four own 73%; Global Small Cap - three own 84%. At December 31, 2023, two affiliated investors, including TimesSquare Capital Management, LLC and the Investment Manager owned 15% of the net assets of Global Small Cap. Transactions by these shareholders may have a material impact on the Funds.
h. REPURCHASE AGREEMENTS AND JOINT REPURCHASE AGREEMENTS
The Funds may enter into third-party and bilateral repurchase agreements for temporary cash management purposes and for reinvestment of cash collateral on securities lending transactions under the securities lending program offered by The Bank of New York Mellon (“BNYM”) (the “Securities Lending Program”) (collectively, “Repurchase Agreements”). The value of the underlying collateral, including accrued interest, must equal or exceed the value of the Repurchase Agreements during the term of the agreement. For joint repurchase agreements, the Funds participate on a pro rata basis with other clients of BNYM in their share of the underlying collateral under such joint repurchase agreements and in their share of proceeds from any repurchase or other disposition of the underlying collateral. The underlying collateral for all Repurchase Agreements is held by the Funds’ custodian or at the Federal Reserve Bank. If the seller defaults and the value of the collateral declines, or if bankruptcy proceedings commence with respect to the seller of the security, realization of the collateral by the Funds may be delayed or limited. Pursuant to the Securities Lending Program, the Funds are indemnified for such losses by BNYM on joint repurchase agreements.
At December 31, 2023, the market value of Repurchase Agreements outstanding for Small Cap, Mid Cap, International Small Cap, Emerging Markets Small Cap and Global Small Cap was $2,020,775, $14,942,196, $9,692,940, $15,647 and $23,566 respectively.
i. FOREIGN CURRENCY TRANSLATION
The books and records of the Funds are maintained in U.S. Dollars. The value of investments, assets and liabilities denominated in currencies other than U.S. Dollars are translated into U.S. Dollars based upon current foreign exchange rates. Purchases and sales of foreign investments, income and expenses are converted into U.S. Dollars based on currency exchange rates prevailing on the respective dates of such transactions. Net realized and unrealized gain (loss) on
foreign currency transactions represent: (1) foreign exchange gains and losses from the sale and holdings of foreign currencies; (2) gains and losses between trade date and settlement date on investment securities transactions and foreign currency exchange contracts; and (3) gains and losses from the difference between amounts of interest and dividends recorded and the amounts actually received.
The Funds do not isolate the net realized and unrealized gain or loss resulting from changes in exchange rates from the fluctuations in market prices of securities held. Such fluctuations are included with the net realized and unrealized gain or loss on investments.
2. AGREEMENTS AND TRANSACTIONS WITH AFFILIATES
For each of the Funds, the Trust has entered into an investment advisory agreement under which the Investment Manager, a subsidiary and the U.S. wealth platform of Affiliated Managers Group, Inc. (“AMG”), serves as investment manager to the Funds and is responsible for the Funds’ overall administration and operations. The Investment Manager selects and recommends, subject to the approval of the Board and, in certain circumstances, shareholders, the subadviser for the Funds and monitors the subadviser’s investment performance, security holdings and investment strategies. Each Fund’s investment portfolio is managed by TimesSquare Capital Management, LLC (“TimesSquare”) who serves as subadviser pursuant to a subadvisory agreement with the Investment Manager. AMG indirectly owns a majority interest in TimesSquare.
Investment management fees are paid directly by the Funds to the Investment Manager based on average daily net assets. For the fiscal year ended December 31, 2023, the Funds’ investment management fees were paid at the following annual rates of each Fund’s respective average daily net assets:
67
| | |
| | | Notes to Financial Statements (continued) |
| | | |
| | | |
| | |
| |
Small Cap | | 0.79% |
| |
Mid Cap | | 0.79% |
| |
International Small Cap | | 0.75% |
| |
Emerging Markets Small Cap | | 0.95% |
| |
Global Small Cap | | 0.70% |
The fee paid to TimesSquare for its services as subadviser is paid out of the fee the Investment Manager receives from each Fund and does not increase the expenses of each Fund.
The Investment Manager has contractually agreed, through at least May 1, 2024, to waive management fees and/or pay or reimburse fund expenses in order to limit total annual Fund operating expenses after fee waiver and expense reimbursements (exclusive of taxes, interest (including interest incurred in connection with bank and custody overdrafts, and in connection with securities sold short), shareholder servicing fees, distribution and service (12b-1) fees, brokerage commissions and other transaction costs, dividends payable with respect to securities sold short, acquired fund fees and expenses and extraordinary expenses) of Small Cap, Mid Cap, International Small Cap, Emerging Markets Small Cap and Global Small Cap to the annual rate of 0.99%, 1.13%, 1.05%, 1.25% and 1.00%, respectively, of each Fund’s average daily net assets (this annual rate or such other annual rate that may be in effect from time to time, the “Expense Cap”), subject to later reimbursement by the Funds in certain circumstances.
In general, for a period of up to 36 months after the date any amounts are paid, waived or reimbursed by the Investment Manager, the Investment Manager may recover such amounts from a Fund, provided that such repayment would not cause the Fund’s total annual operating expenses after fee waiver and expense reimbursements (exclusive of the items noted in the parenthetical above) to exceed either (i) the Expense Cap in effect at the time such amounts were paid, waived or reimbursed, or (ii) the Expense Cap in effect at the time of such repayment by the Fund.
The contractual expense limitation may only be terminated in the event the Investment Manager or a successor ceases to be the investment manager of a Fund or a successor fund, by mutual agreement between the Investment Manager and the Board, or in the event of a Fund’s liquidation unless the Fund is reorganized or is a party to a merger in which the surviving entity is successor to the accounting and performance information of a Fund.
For the fiscal year ended December 31, 2023, the Investment Manager’s expense reimbursements, and repayments of prior reimbursements by the Funds to the Investment Manager, if any, are as follows:
| | | | |
| | | Expense
Reimbursements | | Repayment of
Prior Reimbursements |
| | |
Small Cap | | $76,751 | | — |
| | |
Mid Cap | | — | | — |
| | |
International Small Cap | | — | | — |
| | |
Emerging Markets Small Cap | | 149,056 | | — |
| | |
Global Small Cap | | 71,590 | | — |
At December 31, 2023, the Funds’ expiration of reimbursements subject to recoupment is as follows:
| | | | | | | | | | | | |
Expiration Period | | Small Cap | | | Emerging Markets Small Cap | | | Global Small Cap | |
| | | |
Less than 1 year | | | $4,404 | | | | $108,894 | | | | $76,549 | |
| | | |
1-2 years | | | 39,090 | | | | 144,775 | | | | 80,223 | |
| | | |
2-3 years | | | 76,751 | | | | 149,056 | | | | 71,590 | |
| | | | | | | | | | | | |
| | | |
Total | | | $120,245 | | | | $402,725 | | | | $228,362 | |
| | | | | | | | | | | | |
The Trust, on behalf of the Funds, has entered into an amended and restated Administration Agreement under which the Investment Manager serves as the Funds’ administrator (the “Administrator”) and is responsible for certain aspects of managing the Funds’ operations, including administration and shareholder services to each Fund. Each Fund pays a fee to the Administrator at the rate of 0.15% per annum of the Fund’s average daily net assets for this service.
The Funds are distributed by AMG Distributors, Inc. (the “Distributor”), a wholly-owned subsidiary of the Investment Manager. The Distributor serves as the distributor and underwriter for each Fund and is a registered broker-dealer and member of the Financial Industry Regulatory Authority, Inc. (“FINRA”). Shares of each Fund will be continuously offered and will be sold directly to prospective purchasers and through brokers, dealers or other financial intermediaries who have executed selling agreements with the Distributor. Generally, the Distributor bears all or a portion of the expenses of providing services pursuant to the distribution agreement, including the payment of the expenses relating to the distribution of prospectuses for sales purposes and any advertising or sales literature.
The Trust has adopted a distribution and service plan (the “Plan”) with respect to the Class N shares of Emerging Markets Small Cap and Global Small Cap, in accordance with the requirements of Rule 12b-1 under the 1940 Act and the requirements of the applicable rules of FINRA regarding asset-based sales charges. Pursuant to the Plan, Emerging Markets Small Cap and Global Small Cap may make payments to the Distributor for its expenditures in financing any activity primarily intended to result in the sale of Emerging Markets Small Cap and Global Small Cap’s Class N shares and for maintenance and personal service provided to existing shareholders of that class. The Plan authorizes payments to the Distributor up to 0.25% annually of Emerging Markets Small Cap’s and Global Small Cap’s average daily net assets attributable to the Class N shares.
For each of the Class N and Class I shares, the Board has approved reimbursement payments to the Investment Manager for shareholder servicing expenses (“shareholder servicing fees”) incurred. Shareholder servicing fees include payments to financial intermediaries, such as broker-dealers (including fund supermarket platforms), banks, and trust companies who provide shareholder recordkeeping, account servicing and other services. The Class N and Class I shares may reimburse the Investment Manager for the actual amount incurred up to a maximum annual rate of each Class’s average daily net assets as shown in the table below.
68
| | |
| | | Notes to Financial Statements (continued) |
| | | |
| | | |
The impact on the annualized expense ratios for the fiscal year ended December 31, 2023, was as follows:
| | | | | | | | |
| | | Maximum Annual | | Actual |
| | | Amount | | Amount |
| Fund | | Approved | | Incurred |
| | |
Small Cap | | | | | | | | |
| | |
Class N | | | 0.20% | | | | 0.20% | |
| | |
Class I | | | 0.10% | | | | 0.08% | |
| | |
Mid Cap | | | | | | | | |
| | |
Class N | | | 0.20% | | | | 0.20% | |
| | |
Class I | | | 0.05% | | | | 0.05% | |
| | |
International Small Cap | | | | | | | | |
| | |
Class N | | | 0.25% | | | | 0.25% | |
| | |
Class I | | | 0.10% | | | | 0.09% | |
| | |
Emerging Markets Small Cap | | | | | | | | |
| | |
Class N | | | 0.15% | | | | 0.15% | |
| | |
Class I | | | 0.15% | | | | — | |
| | |
Global Small Cap | | | | | | | | |
| | |
Class N | | | 0.15% | | | | — | |
| | |
Class I | | | 0.15% | | | | — | |
The Board provides supervision of the affairs of the Trust and other trusts within the AMG Funds Family. The Trustees of the Trust who are not affiliated with the Investment Manager receive an annual retainer and per meeting fees for regular, special and telephonic meetings, and they are reimbursed for out-of-pocket expenses incurred while carrying out their duties as Board members. The Chairman of the Board and the Audit Committee Chair receive additional annual retainers. On October 10, 2023, the shareholders of the Trust elected Trustees, including two new Trustees who are not “interested persons” of the Funds within the meaning of the 1940 Act. Certain Trustees and Officers of the Funds are Officers and/or Directors of the Investment Manager, AMG and/or the Distributor.
The Securities and Exchange Commission (the “SEC”) granted an exemptive order that permits certain eligible funds in the AMG Funds Family to lend and borrow money for certain temporary purposes directly to and from other eligible funds in the AMG Funds Family. Participation in this interfund lending program is voluntary for both the borrowing and lending funds, and an interfund loan is only made if it benefits each participating fund. The Administrator manages the program according to procedures approved by the Board, and the Board monitors the operation of the program. An interfund loan must comply with certain conditions set out in the exemptive order, which are designed to assure fairness and protect all participating funds. The interest earned and interest paid on interfund loans are included on the Statement of Operations as interest income and interest expense, respectively. At December 31, 2023, International Small Cap had an interfund loan payable outstanding of $11,278,643.
The following Funds utilized the interfund loan program during the fiscal year ended December 31, 2023 as follows:
| | | | | | | | | | | | | | | | |
| Fund | | Average
Lent | | | Number
of Days | | | Interest
Earned | | | Average
Interest Rate | |
| | | | |
Small Cap | | | $1,371,198 | | | | 11 | | | | $2,545 | | | | 6.158% | |
| | | | | | | | | | | | | | | | |
| Fund | | Average
Lent | | | Number
of Days | | | Interest
Earned | | | Average
Interest Rate | |
| | | | |
Mid Cap | | | 9,162,232 | | | | 13 | | | | $19,566 | | | | 5.996 | % |
| | | | |
International Small Cap | | | 1,571,996 | | | | 9 | | | | 2,315 | | | | 5.973 | % |
| | | | | | | | | | | | | | | | |
| Fund | | Average
Borrowed | | | Number
of Days | | | Interest
Paid | | | Average
Interest Rate | |
| | | | |
Small Cap | | | $6,208,279 | | | | 2 | | | | $2,036 | | | | 5.985% | |
| | | | |
International Small Cap | | | 11,537,782 | | | | 33 | | | | 62,254 | | | | 5.968% | |
| | | | |
Emerging Markets Small Cap | | | 710,099 | | | | 14 | | | | 1,577 | | | | 5.789% | |
| | | | |
Global Small Cap | | | 14,036 | | | | 5 | | | | 11 | | | | 5.965% | |
3. PURCHASES AND SALES OF SECURITIES
Purchases and sales of securities (excluding short-term securities and U.S. Government Obligations) for the fiscal year ended December 31, 2023, were as follows:
| | | | | | | | |
| | | Long Term Securities | |
| | |
| Fund | | Purchases | | | Sales | |
| | |
Small Cap | | | $117,658,266 | | | | $203,464,302 | |
| | |
Mid Cap | | | 458,270,716 | | | | 574,082,593 | |
| | |
International Small Cap | | | 211,548,937 | | | | 476,568,718 | |
| | |
Emerging Markets Small Cap | | | 2,322,101 | | | | 5,641,371 | |
| | |
Global Small Cap | | | 1,004,660 | | | | 1,201,391 | |
The Funds had no purchases or sales of U.S. Government Obligations during the fiscal year ended December 31, 2023.
4. PORTFOLIO SECURITIES LOANED
The Funds participate in the Securities Lending Program providing for the lending of securities to qualified borrowers. Securities lending income includes earnings of such temporary cash investments, plus or minus any rebate to a borrower. These earnings (after any rebate) are then divided between BNYM, as a fee for its services under the Securities Lending Program, and the Funds, according to agreed-upon rates. Collateral on all securities loaned is accepted in cash, U.S. Treasury Obligations or U.S. Government Agency Obligations. Collateral is maintained at a minimum level of 102% (105% in the case of certain foreign securities) of the market value, plus interest, if applicable, of investments on loan. It is the Funds’ policy to obtain additional collateral from or return excess collateral to the borrower by the end of the next business day, following the valuation date of the securities loaned. Therefore, the value of the collateral held may be temporarily less than the value of the securities on loan. Lending securities entails a risk of loss to the Funds if and to the extent that the market value of the securities loaned were to increase and the borrower did not increase the collateral accordingly, and the borrower fails to return the securities. Under the terms of the Securities Lending Program, the Funds are indemnified for such losses by BNYM. Cash collateral is held in separate omnibus accounts managed by BNYM, who is authorized to exclusively enter into joint repurchase agreements for that cash collateral. Securities collateral is held in separate omnibus accounts managed by BNYM and cannot be sold or pledged. BNYM bears the risk of any deficiency in the amount of the cash collateral available for return to the borrower due to any loss
69
| | |
| | | Notes to Financial Statements (continued) |
| | | |
| | | |
on the collateral invested. Loans of securities are terminable at any time and the borrower, after notice, is required to return borrowed securities as soon as practical, which is normally within three business days.
The value of securities loaned on positions held, cash collateral and securities collateral received at December 31, 2023, was as follows:
| | | | | | | | | | | | | | | | |
| | | | | | Cash | | | Securities | | | Total | |
| | | Securities | | | Collateral | | | Collateral | | | Collateral | |
| Fund | | Loaned | | | Received | | | Received | | | Received | |
| | | | |
Small Cap | | | $8,292,535 | | | | $2,020,775 | | | | $6,580,442 | | | | $8,601,217 | |
| | | | |
Mid Cap | | | 36,651,313 | | | | 14,942,196 | | | | 23,166,873 | | | | 38,109,069 | |
| | | | |
International Small Cap | | | 15,336,376 | | | | 9,692,940 | | | | 7,463,682 | | | | 17,156,622 | |
| | | | |
Emerging Markets Small Cap | | | 14,867 | | | | 15,647 | | | | — | | | | 15,647 | |
| | | | |
Global Small Cap | | | 22,478 | | | | 23,566 | | | | — | | | | 23,566 | |
The following table summarizes the securities received as collateral for securities lending at December 31, 2023:
| | | | | | |
| Fund | | Collateral Type | | Coupon Range | | Maturity Date Range |
| | | |
Small Cap | | U.S. Treasury Obligations | | 0.125%-5.368% | | 04/15/24-08/15/53 |
| | | |
Mid Cap | | U.S. Treasury Obligations | | 0.000%-7.500% | | 01/11/24-08/15/53 |
| | | |
International Small Cap | | U.S. Treasury Obligations | | 0.125%-4.750% | | 07/31/24-05/15/53 |
5. FOREIGN SECURITIES
Certain Funds may invest in securities of foreign entities and in instruments denominated in foreign currencies which involve risks not typically associated with investments in domestic securities, such as exposure to currency fluctuations, less developed or less efficient trading markets, political instability, a lack of company information, differing auditing and legal standards, and, potentially, less liquidity. A Fund’s investments in emerging market countries are exposed to additional risks. A Fund’s performance will be influenced by political, social and economic factors affecting companies in emerging market countries. Emerging market countries generally have economic structures that are less
diverse and mature, and political systems that are less stable, than those of developed countries. Realized gains in certain countries may be subject to foreign taxes at the Fund level and the Fund would pay such foreign taxes at the appropriate rate for each jurisdiction.
6. RISKS ASSOCIATED WITH INVESTMENT IN JAPAN
International Small Cap invests a significant portion of its net assets in Japan, which makes International Small Cap particularly susceptible to economic, political, regulatory or other events or conditions that may affect Japan’s economy. Therefore, International Small Cap’s NAV may be more volatile than the NAV of a more geographically diversified fund and may result in losses. The Japanese economy is heavily dependent upon international trade, and, therefore, is particularly exposed to the risks of currency fluctuation, foreign trade policy and regional and global economic disruption, including the risk of increased tariffs, embargoes, and other trade limitations or factors. Japanese government policy has been characterized by economic regulation, intervention, protectionism and large government deficits. The Japanese economy is also challenged by an unstable financial services sector, highly leveraged corporate balance sheets and extensive cross ownership among major corporations. Structural social and labor market changes, including an aging workforce, population decline and traditional aversion to labor mobility may adversely affect Japan’s economic competitiveness and growth potential. The potential for natural disasters, such as earthquakes, volcanic eruptions, typhoons and tsunamis, could also have significant negative effects on Japan’s economy.
7. COMMITMENTS AND CONTINGENCIES
Under the Trust’s organizational documents, its Trustees and Officers are indemnified against certain liabilities arising out of the performance of their duties to the Trust. In addition, in the normal course of business, the Funds may enter into contracts and agreements that contain a variety of representations and warranties, which provide general indemnifications. The maximum exposure to the Funds under these arrangements is unknown, as this would involve future claims that may be made against a Fund that have not yet occurred. However, based on experience, the Funds had no prior claims or losses and expect the risks of loss to be remote.
8. MASTER NETTING AGREEMENTS
The Funds may enter into master netting agreements with their counterparties for the Securities Lending Program and Repurchase Agreements, which provide the right, in the event of default (including bankruptcy or insolvency) for the non-defaulting party to liquidate the collateral and calculate net exposure to the defaulting party or request additional collateral. For financial reporting purposes, the Funds do not offset financial assets and financial liabilities that are subject to master netting agreements in the Statement of Assets and Liabilities. For securities lending transactions, see Note 4.
70
| | |
| | | Notes to Financial Statements (continued) |
| | | |
| | | |
The following table is a summary of the Funds’ open Repurchase Agreements that are subject to a master netting agreement as of December 31, 2023:
| | | | | | | | | | | | | | | | | | | | |
| | | | | Gross Amount Not Offset in the | | | | |
| | | | | Statement of Assets and Liabilities | | | | |
| Fund | | Gross Amounts of
Assets Presented in
the Statement of
Assets and Liabilities | | Offset Amount | | Net Asset Balance | | Collateral Received | | Net Amount |
| | | | | | | | | | | | | | | | | | | | | |
| | | | | |
Small Cap | | | | | | | | | | | | | | | | | | | | |
| | | | | |
Daiwa Capital Markets America | | | $1,000,000 | | | | — | | | | $1,000,000 | | | | $1,000,000 | | | | — | |
| | | | | |
Deutsche Bank Securities, Inc. | | | 20,775 | | | | — | | | | 20,775 | | | | 20,775 | | | | — | |
| | | | | |
RBC Dominion Securities, Inc. | | | 1,000,000 | | | | — | | | | 1,000,000 | | | | 1,000,000 | | | | — | |
| | | | | | | | | | | | | | | | | | | | |
| | | | | |
Total | | | $2,020,775 | | | | — | | | | $2,020,775 | | | | $2,020,775 | | | | — | |
| | | | | | | | | | | | | | | | | | | | |
| | | | | |
Mid Cap | | | | | | | | | | | | | | | | | | | | |
| | | | | |
Cantor Fitzgerald Securities, Inc. | | | $3,179,692 | | | | — | | | | $3,179,692 | | | | $3,179,692 | | | | — | |
| | | | | |
Daiwa Capital Markets America | | | 668,342 | | | | — | | | | 668,342 | | | | 668,342 | | | | — | |
| | | | | |
RBC Dominion Securities, Inc. | | | 3,735,408 | | | | — | | | | 3,735,408 | | | | 3,735,408 | | | | — | |
| | | | | |
Santander U.S. Capital Markets LLC | | | 3,698,054 | | | | — | | | | 3,698,054 | | | | 3,698,054 | | | | — | |
| | | | | |
State of Wisconsin Investment Board | | | 3,660,700 | | | | — | | | | 3,660,700 | | | | 3,660,700 | | | | — | |
| | | | | | | | | | | | | | | | | | | | |
| | | | | |
Total | | | $14,942,196 | | | | — | | | | $14,942,196 | | | | $14,942,196 | | | | — | |
| | | | | | | | | | | | | | | | | | | | |
| | | | | |
International Small Cap | | | | | | | | | | | | | | | | | | | | |
| | | | | |
Citigroup Global Markets, Inc. | | | $2,423,235 | | | | — | | | | $2,423,235 | | | | $2,423,235 | | | | — | |
| | | | | |
Daiwa Capital Markets America | | | 2,423,235 | | | | — | | | | 2,423,235 | | | | 2,423,235 | | | | — | |
| | | | | |
Deutsche Bank Securities, Inc. | | | 2,423,235 | | | | — | | | | 2,423,235 | | | | 2,423,235 | | | | — | |
| | | | | |
RBC Dominion Securities, Inc. | | | 2,423,235 | | | | — | | | | 2,423,235 | | | | 2,423,235 | | | | — | |
| | | | | | | | | | | | | | | | | | | | |
| | | | | |
Total | | | $9,692,940 | | | | — | | | | $9,692,940 | | | | $9,692,940 | | | | — | |
| | | | | | | | | | | | | | | | | | | | |
| | | | | |
Emerging Markets Small Cap | | | | | | | | | | | | | | | | | | | | |
| | | | | |
RBC Dominion Securities, Inc. | | | $15,647 | | | | — | | | | $15,647 | | | | $15,647 | | | | — | |
| | | | | |
Global Small Cap | | | | | | | | | | | | | | | | | | | | |
| | | | | |
RBC Dominion Securities, Inc. | | | $23,566 | | | | — | | | | $23,566 | | | | $23,566 | | | | — | |
9. SUBSEQUENT EVENTS
The Funds have determined that no material events or transactions occurred through the issuance date of the Funds’ financial statements which require an additional disclosure in or adjustment of the Funds’ financial statements.
71
|
Report of Independent Registered Public Accounting Firm |
To the Board of Trustees of AMG Funds and Shareholders of AMG TimesSquare Small Cap Growth Fund, AMG TimesSquare Mid Cap Growth Fund, AMG TimesSquare International Small Cap Fund, AMG TimesSquare Emerging Markets Small Cap Fund and AMG TimesSquare Global Small Cap Fund
Opinions on the Financial Statements
We have audited the accompanying statements of assets and liabilities, including the schedules of portfolio investments, of AMG TimesSquare Small Cap Growth Fund, AMG TimesSquare Mid Cap Growth Fund, AMG TimesSquare International Small Cap Fund, AMG TimesSquare Emerging Markets Small Cap Fund and AMG TimesSquare Global Small Cap Fund (five of the funds constituting AMG Funds, hereafter collectively referred to as the “Funds”) as of December 31, 2023, the related statements of operations for the year ended December 31, 2023, the statements of changes in net assets for each of the two years in the period ended December 31, 2023, including the related notes, and the financial highlights for each of the five years in the period ended December 31, 2023 (collectively referred to as the “financial statements”). In our opinion, the financial statements present fairly, in all material respects, the financial position of each of the Funds as of December 31, 2023, the results of each of their operations for the year then ended, the changes in each of their net assets for each of the two years in the period ended December 31, 2023 and each of the financial highlights for each of the five years in the period ended December 31, 2023 in conformity with accounting principles generally accepted in the United States of America.
Basis for Opinions
These financial statements are the responsibility of the Funds’ management. Our responsibility is to express an opinion on the Funds’ financial statements based on our audits. We are a public accounting firm registered with the Public Company Accounting Oversight Board (United States) (PCAOB) and are required to be independent with respect to the Funds in accordance with the U.S. federal securities laws and the applicable rules and regulations of the Securities and Exchange Commission and the PCAOB.
We conducted our audits of these financial statements in accordance with the standards of the PCAOB. Those standards require that we plan and perform the audit to obtain reasonable assurance about whether the financial statements are free of material misstatement, whether due to error or fraud.
Our audits included performing procedures to assess the risks of material misstatement of the financial statements, whether due to error or fraud, and performing procedures that respond to those risks. Such procedures included examining, on a test basis, evidence regarding the amounts and disclosures in the financial statements. Our audits also included evaluating the accounting principles used and significant estimates made by management, as well as evaluating the overall presentation of the financial statements. Our procedures included confirmation of securities owned as of December 31, 2023 by correspondence with the custodian and brokers; when replies were not received from brokers, we performed other auditing procedures. We believe that our audits provide a reasonable basis for our opinions.
/s/ PricewaterhouseCoopers LLP
Boston, Massachusetts
February 27, 2024
We have served as the auditor of one or more investment companies in the AMG Funds Family since 1993.
72
| | |
| | | Other Information (unaudited) |
| | | |
| | | |
TAX INFORMATION
AMG TimesSquare Small Cap Growth Fund, AMG TimesSquare Mid Cap Growth Fund, AMG TimesSquare International Small Cap Fund, AMG TimesSquare Emerging Markets Small Cap Fund and AMG TimesSquare Global Small Cap Fund each hereby designates the maximum amount allowable of its net taxable income as qualified dividends as provided in the Jobs and Growth Tax Relief Reconciliation Act of 2003. The 2023 Form 1099-DIV you receive for each Fund will show the tax status of all distributions paid to you during the year.
In accordance with federal tax law, the following Funds elect to provide foreign taxes paid and the income sourced from foreign countries. Accordingly, each Fund hereby makes the following designations regarding its taxable period ended December 31, 2023:
AMG TimesSquare International Small Cap Fund
uThe total amount of taxes paid and income sourced from foreign countries was $680,235 and $7,694,061, respectively.
AMG TimesSquare Emerging Markets Small Cap Fund
uThe total amount of taxes paid and income sourced from foreign countries was $11,239 and $63,734, respectively.
AMG TimesSquare Global Small Cap Fund
uThe total amount of taxes paid and income sourced from foreign countries was $3,124 and $21,541, respectively.
Pursuant to section 852 of the Internal Revenue Code, AMG TimesSquare Small Cap Growth Fund, AMG TimesSquare Mid Cap Growth Fund, AMG TimesSquare International Small Cap Fund, AMG TimesSquare Emerging Markets Small Cap Fund and AMG TimesSquare Global Small Cap Fund each hereby designates $0, $52,768,402, $0, $0 and $0, respectively, as a capital gain distribution with respect to the taxable period ended December 31, 2023, or, if subsequently determined to be different, the net capital gains of such period.
PROXY VOTE
A special meeting of the shareholders of AMG Funds (the “Trust”) was held on October 10, 2023, to vote on a proposal to elect trustees to the Board of Trustees of the Trust. The proposal and results of the vote are described below. Jill R. Cuniff, Kurt A. Keilhacker, Peter W. MacEwen, Steven J. Paggioli, Eric Rakowski, Victoria L. Sassine and Garret W. Weston were elected by shareholders at the special meeting on October 10, 2023. Bruce B. Bingham, an incumbent Trustee, served as a Trustee of the Trust until his retirement on December 31, 2023.
| | | | | | | | | | | | |
| AMG Funds | | All Funds in Trust* | |
| | | |
| Election of Trustees 1 | | For | | | | | | Withheld | |
| | | |
Jill R. Cuniff | | | 523,453,201 | | | | | | | | 50,330,270 | |
| | | |
Kurt A. Keilhacker | | | 563,642,997 | | | | | | | | 10,140,474 | |
| | | |
Peter W. MacEwen | | | 523,551,974 | | | | | | | | 50,231,497 | |
| | | |
Steven J. Paggioli | | | 561,225,673 | | | | | | | | 12,557,798 | |
| | | |
Eric Rakowski | | | 561,230,560 | | | | | | | | 12,552,911 | |
| | | |
Victoria L. Sassine | | | 563,668,874 | | | | | | | | 10,114,597 | |
| | | |
Garret W. Weston | | | 564,280,150 | | | | | | | | 9,503,321 | |
1 Ms. Cuniff and Mr. MacEwen were newly elected to the Board of Trustees on October 10, 2023; Messrs. Keilhacker, Paggioli, Rakowski, and Weston and Ms. Sassine are incumbent Trustees.
*Rounded to the nearest share.
73
| | |
| | | AMG Funds Trustees and Officers |
| | | |
| | | |
| | | | |
The Trustees and Officers of the Trust, their business addresses, principal occupations for the past five years and ages are listed below. The Trustees provide broad supervision over the affairs of the Trust and the Funds. The Trustees are experienced executives who meet periodically throughout the year to oversee the Funds’ activities, review contractual arrangements with companies that provide services to the Funds, and | | review the Funds’ performance. Unless otherwise noted, the address of each Trustee or Officer is the address of the Trust: 680 Washington Blvd., Suite 500, Stamford, CT. 06901. There is no stated term of office for Trustees. Trustees serve until their resignation, retirement or removal in accordance with the Trust’s organizational documents and policies adopted by the Board from time to time. | | The Chairman of the Board, the President, the Treasurer and the Secretary and such other Officers as the Trustees may in their discretion from time to time elect each hold office until his or her successor is elected and qualified, or until he or she sooner dies, resigns, is removed or becomes disqualified. Each Officer holds office at the pleasure of the Trustees. |
Independent Trustees
The following Trustees are not “interested persons” of the Trust within the meaning of the 1940 Act:
| | |
Number of Funds Overseen in Fund Complex | | Name, Age, Principal Occupation(s) During Past 5 Years and Other Directorships Held by Trustee |
| | |
• Trustee since 2012 • Oversees 37 Funds in Fund Complex | | Bruce B. Bingham, 75* Partner, Hamilton Partners (real estate development firm) (1987-Present); Director of The Yacktman Funds, Inc. (2 portfolios) (2000-2012). |
| | |
• Trustee since 2023 • Oversees 37 Funds in Fund Complex | | Jill R. Cuniff, 59** Director of Harding, Loevner Funds, Inc. (12 portfolios) (2018-Present); Retired (2016-Present); President & Portfolio Manager, Edge Asset Management (2009-2016); President & Chief Investment Officer, Morley Financial Services (2001-2009); President, Union Bond & Trust Company (2001-2009). |
| | |
• Trustee since 2013 • Chairman of the Audit Committee since 2021 • Oversees 39 Funds in Fund Complex | | Kurt A. Keilhacker, 60 Managing Partner, Elementum Ventures (2013-Present); Managing Partner, TechFund Europe (2000-Present); Managing Partner, TechFund Capital (1997-Present); Adjunct Professor, University of San Francisco (2022-Present); Trustee, Wheaton College (2018-Present); Director, Wheaton College Trust Company, N.A. (2018-Present). |
| | |
• Trustee since 2023 • Oversees 37 Funds in Fund Complex | | Peter W. MacEwen, 59** Private investor (2019-Present); Affiliated Managers Group, Inc. (2003-2018): Chief Administrative Officer, Office of the CEO (2013-2018); Senior Vice President, Finance (2007-2013); Vice President, Finance (2003-2007). |
| | |
• Trustee since 2004 • Oversees 37 Funds in Fund Complex | | Steven J. Paggioli, 73 Independent Consultant (2002-Present); Trustee, Professionally Managed Portfolios (28 portfolios); Independent Director, Muzinich BDC, Inc. (business development company) (2019-Present); Director, The Wadsworth Group; Independent Director, Chase Investment Counsel (2008–2019); Executive Vice President, Secretary and Director, Investment Company Administration, LLC and First Fund Distributors, INC. (1990-2001). |
| | |
• Independent Chairman of the Board of Trustees since 2017 • Chairman of the Governance Committee since 2017 • Trustee since 1999 • Oversees 39 Funds in Fund Complex | | Eric Rakowski, 65 Professor of Law, University of California at Berkeley School of Law (1990-Present); Tax Attorney at Davis Polk & Wardwell and clerked for Judge Harry T. Edwards of the U.S. Court of Appeals for the District of Columbia Circuit and for Justice William J. Brennan Jr. of the U.S. Supreme Court; Trustee of Parnassus Funds (4 portfolios) (2021-Present); Trustee of Parnassus Income Funds (2 portfolios) (2021-Present); Director of Harding, Loevner Funds, Inc. (10 portfolios); Trustee of Third Avenue Trust (3 portfolios) (2002-2019); Trustee of Third Avenue Variable Trust (1 portfolio) (2002-2019). |
| | |
• Trustee since 2013 • Oversees 39 Funds in Fund Complex | | Victoria L. Sassine, 58 Adjunct Professor, Babson College (2007–Present); Director, Board of Directors, PRG Group (2017-Present); CEO, Founder, Scale Smarter Partners, LLC (2018-Present); Adviser, EVOFEM Biosciences (2019-Present); Chairperson of the Board of Directors of Business Management Associates (2018-2019). |
*Mr. Bingham retired from the Board of Trustees of AMG Funds on December 31, 2023.
**Ms. Cuniff and Mr. MacEwen were elected to the Board of Trustees by the shareholders of AMG Funds on October 10, 2023.
74
| | |
| | | AMG Funds Trustees and Officers (continued) |
| | | |
| | | |
Interested Trustee
The Trustee in the following table is an “interested person” of the Trust within the meaning of the 1940 Act.
| | |
Number of Funds Overseen in
Fund Complex | | Name, Age, Principal Occupation(s) During Past 5 Years and Other Directorships Held by Trustee |
| | |
• Trustee since 2021 • Oversees 39 Funds in Fund Complex | | Garret W. Weston, 42 Affiliated Managers Group, Inc. (2008-Present): Managing Director, Head of Affiliate Product Strategy and Development (2023-Present), Managing Director, Co-Head of Affiliate Engagement, Distribution (2021-2022), Senior Vice President, Office of the CEO (2019-2021), Senior Vice President, Affiliate Development (2016-2019), Vice President, Office of the CEO (2015-2016), Vice President, New Investments (2008-2015); Associate, Madison Dearborn Partners (2006-2008); Analyst, Merrill Lynch (2004-2006). |
Officers
| | |
Position(s) Held with Fund and Length of Time Served | | Name, Age, Principal Occupation(s) During Past 5 Years |
| | |
| | |
• President since 2018 • Principal Executive Officer since 2018 • Chief Executive Officer since 2018 • Chief Operating Officer since 2007 | | Keitha L. Kinne, 65 Managing Director, Head of Platform and Operations, AMG Funds LLC (2023-Present); Chief Operating Officer, AMG Funds LLC (2007-Present); Chief Investment Officer, AMG Funds LLC (2008-Present); President and Principal, AMG Distributors, Inc. (2018-Present); Chief Operating Officer, AMG Distributors, Inc. (2007-Present); President, Chief Executive Officer and Principal Executive Officer, AMG Funds, AMG Funds I, AMG Funds II, AMG Funds III and AMG Funds IV (2018-Present); Chief Operating Officer, AMG Funds, AMG Funds I, AMG Funds II, and AMG Funds III (2007-Present); Chief Operating Officer, AMG Funds IV (2016-Present); Chief Operating Officer and Chief Investment Officer, Aston Asset Management, LLC (2016); President and Principal Executive Officer, AMG Funds, AMG Funds I, AMG Funds II and AMG Funds III (2012-2014); Managing Partner, AMG Funds LLC (2007-2014); President and Principal, AMG Distributors, Inc. (2012-2014); Managing Director, Legg Mason & Co., LLC (2006-2007); Managing Director, Citigroup Asset Management (2004-2006). |
| | |
• Secretary since 2015 • Chief Legal Officer since 2015 | | Mark J. Duggan, 58 Managing Director and Senior Counsel, AMG Funds LLC (2021-Present); Senior Vice President and Senior Counsel, AMG Funds LLC (2015-2021); Secretary and Chief Legal Officer, AMG Funds, AMG Funds I, AMG Funds II, AMG Funds III and AMG Funds IV (2015-Present); Attorney, K&L Gates, LLP (2009-2015). |
| | |
• Chief Financial Officer since 2017 • Treasurer since 2017 • Principal Financial Officer since 2017 • Principal Accounting Officer since 2017 | | Thomas G. Disbrow, 57 Vice President, Mutual Fund Treasurer & CFO, AMG Funds, AMG Funds LLC (2017-Present); Chief Financial Officer, Principal Financial Officer, Treasurer and Principal Accounting Officer, AMG Funds, AMG Funds I, AMG Funds II, AMG Funds III and AMG Funds IV (2017-Present); Managing Director - Global Head of Traditional Funds Product Control, UBS Asset Management (Americas), Inc. (2015-2017); Managing Director - Head of North American Funds Treasury, UBS Asset Management (Americas), Inc. (2011-2015). |
| | |
• Deputy Treasurer since 2017 | | John A. Starace, 53 Vice President, Mutual Fund Accounting, AMG Funds LLC (2021-Present); Director, Mutual Fund Accounting, AMG Funds LLC (2017-2021); Vice President, Deputy Treasurer of Mutual Funds Services, AMG Funds LLC (2014-2017); Deputy Treasurer, AMG Funds, AMG Funds I, AMG Funds II, AMG Funds III and AMG Funds IV (2017-Present); Vice President, Citi Hedge Fund Services (2010-2014); Audit Senior Manager (2005-2010) and Audit Manager (2001-2005), Deloitte & Touche LLP. |
| | |
• Chief Compliance Officer and Sarbanes-Oxley Code of Ethics Compliance Officer since 2019 • Anti-Money Laundering Compliance Officer since 2022 | | Patrick J. Spellman, 49 Vice President, Chief Compliance Officer, AMG Funds LLC (2017-Present); Chief Compliance Officer, AMG Distributors, Inc. (2010-Present); Chief Compliance Officer and Sarbanes-Oxley Code of Ethics Compliance Officer, AMG Funds, AMG Funds I, AMG Funds II, AMG Funds III and AMG Funds IV (2019-Present); Anti-Money Laundering Compliance Officer, AMG Funds, AMG Funds I, AMG Funds II, and AMG Funds III (2014-2019; 2022-Present); Anti-Money Laundering Compliance Officer, AMG Funds IV (2016-2019; 2022-Present); Senior Vice President, Chief Compliance Officer, AMG Funds LLC (2011-2017); Compliance Manager, Legal and Compliance, Affiliated Managers Group, Inc. (2005-2011). |
| | |
• Assistant Secretary since 2016 | | Maureen M. Kerrigan, 38 Vice President, Senior Counsel, AMG Funds LLC (2021-Present); Vice President, Counsel, AMG Funds LLC (2019-2021); Director, Counsel, AMG Funds LLC (2017-2018); Vice President, Counsel, AMG Funds LLC (2015-2017); Assistant Secretary, AMG Funds, AMG Funds I, AMG Funds II, AMG Funds III and AMG Funds IV (2016-Present); Associate, Ropes & Gray LLP (2011-2015); Law Fellow, Massachusetts Appleseed Center for Law and Justice (2010-2011). |
75
THIS PAGE INTENTIONALLY LEFT BLANK
| | |
 |
| | | |
| | | |
| | | | |
INVESTMENT MANAGER AND ADMINISTRATOR AMG Funds LLC 680 Washington Blvd., Suite 500 Stamford, CT 06901 800.548.4539 DISTRIBUTOR AMG Distributors, Inc. 680 Washington Blvd., Suite 500 Stamford, CT 06901 800.548.4539 SUBADVISER TimesSquare Capital Management, LLC 75 Rockefeller Plaza 30th Floor New York, NY 10019 CUSTODIAN The Bank of New York Mellon Mutual Funds Custody 6023 Airport Road Oriskany, NY 13424 | | LEGAL COUNSEL Ropes & Gray LLP Prudential Tower, 800 Boylston Street Boston, MA 02199-3600 TRANSFER AGENT BNY Mellon Investment Servicing (US) Inc. AMG Funds Attn: 534426 AIM 154-0520 500 Ross Street Pittsburgh, PA 15262 800.548.4539 | | This report is prepared for the Funds’ shareholders. It is authorized for distribution to prospective investors only when preceded or accompanied by an effective prospectus. To receive a free copy of the prospectus or Statement of Additional Information, which includes additional information about Fund Trustees, please contact us by calling 800.548.4539. Distributed by AMG Distributors, Inc., member FINRA/SIPC. Current net asset values per share for each Fund are available on the Funds’ website at wealth.amg.com. A description of the policies and procedures each Fund uses to vote its proxies is available: (i) without charge, upon request, by calling 800.548.4539, or (ii) on the Securities and Exchange Commission’s (SEC) website at sec.gov. For information regarding the Funds’ proxy voting record for the 12-month period ended June 30, call 800.548.4539 or visit the SEC website at sec.gov. The Funds file their complete schedule of portfolio holdings with the SEC for the first and third quarters of each fiscal year as an exhibit to their reports on Form N-PORT. The Funds’ portfolio holdings on Form N-PORT are available on the SEC’s website at sec.gov and the Funds’ website at wealth.amg.com. To review a complete list of the Funds’ portfolio holdings, or to view the most recent semi-annual report or annual report, please visit wealth.amg.com. |
| | |
|
| | | |
| | | |
| | | | | | |
EQUITY FUNDS AMG Beutel Goodman International Equity Beutel, Goodman & Company Ltd. AMG Boston Common Global Impact Boston Common Asset Management, LLC AMG Frontier Small Cap Growth Frontier Capital Management Co., LLC AMG GW&K Small Cap Core AMG GW&K Small Cap Value AMG GW&K Small/Mid Cap Core AMG GW&K Small/Mid Cap Growth AMG GW&K International Small Cap GW&K Investment Management, LLC AMG Montrusco Bolton Large Cap Growth Montrusco Bolton Investments, Inc. AMG Renaissance Large Cap Growth The Renaissance Group LLC | | | | AMG River Road Dividend All Cap Value AMG River Road Focused Absolute Value AMG River Road Large Cap Value Select AMG River Road Mid Cap Value AMG River Road Small-Mid Cap Value AMG River Road Small Cap Value River Road Asset Management, LLC AMG TimesSquare Emerging Markets Small Cap AMG TimesSquare Global Small Cap AMG TimesSquare International Small Cap AMG TimesSquare Mid Cap Growth AMG TimesSquare Small Cap Growth TimesSquare Capital Management, LLC AMG Veritas Asia Pacific AMG Veritas China AMG Veritas Global Focus AMG Veritas Global Real Return Veritas Asset Management LLP AMG Yacktman AMG Yacktman Focused AMG Yacktman Global AMG Yacktman Special Opportunities Yacktman Asset Management LP | | FIXED INCOME FUNDS AMG Beutel Goodman Core Plus Bond Beutel, Goodman & Company Ltd. AMG GW&K Core Bond ESG AMG GW&K Enhanced Core Bond ESG AMG GW&K ESG Bond AMG GW&K High Income AMG GW&K Municipal Bond AMG GW&K Municipal Enhanced Yield GW&K Investment Management, LLC |
| | | | | | |
| wealth.amg.com | | | | | | 123123 AR012 |
| | |
 | | ANNUAL REPORT |
| | |
| | | AMG Funds December 31, 2023 |
| | |
| | | 
|
| | |
| | | AMG Renaissance Large Cap Growth Fund |
| | |
| | | Class N: MRLTX | Class I: MRLSX | Class Z: MRLIX |
| | |
| | | |
| | |
| | | |
| | | | |
| wealth.amg.com | | | | 123123 AR024 |
| | |
| | | AMG Funds Annual Report — December 31, 2023 |
| | | | | | |
| | | |
| | | | | | |
| | | TABLE OF CONTENTS | | PAGE | |
| | | | |
| | | LETTER TO SHAREHOLDERS | | | 2 | |
| | | |
| | | ABOUT YOUR FUND’S EXPENSES | | | 3 | |
| | | |
| | | PORTFOLIO MANAGER’S COMMENTS, FUND SNAPSHOTS AND SCHEDULE OF PORTFOLIO INVESTMENTS | | | 4 | |
| | | |
| | | FINANCIAL STATEMENTS | | | | |
| | | |
| | | Statement of Assets and Liabilities | | | 10 | |
| | | |
| | | Balance sheet, net asset value (NAV) per share computations
and cumulative distributable earnings (loss) | | | | |
| | | |
| | | Statement of Operations | | | 12 | |
| | | |
| | | Detail of sources of income, expenses, and realized and
unrealized gains (losses) during the fiscal year | | | | |
| | | |
| | | Statements of Changes in Net Assets | | | 13 | |
| | | |
| | | Detail of changes in assets for the past two fiscal years | | | | |
| | | |
| | | Financial Highlights | | | 14 | |
| | | |
| | | Historical net asset values per share, distributions, total returns, income
and expense ratios, turnover ratios and net assets | | | | |
| | | |
| | | Notes to Financial Statements | | | 17 | |
| | | |
| | | Accounting and distribution policies, details of agreements and
transactions with Fund management and affiliates, and descriptions of
certain investment risks | | | | |
| | | |
| | | REPORT OF INDEPENDENT REGISTERED PUBLIC ACCOUNTING FIRM | | | 22 | |
| | | |
| | | OTHER INFORMATION | | | 23 | |
| | | |
| | | TRUSTEES AND OFFICERS | | | 24 | |
| | | |
| | | | | | | |
Nothing contained herein is to be considered an offer, sale or solicitation of an offer to buy shares of any series of the AMG Funds Family of Funds. Such offering is made only by prospectus, which includes details as to offering price and other material information.
| | |
| | Letter to Shareholders |
Dear Shareholder:
We are pleased to provide this annual report for your investment with AMG Funds. Our foremost goal is to provide investment solutions that help our shareholders successfully achieve their long-term investment goals. We appreciate the privilege of providing you with investment tools.
Throughout most of the year, markets wrestled with uncertainties around tighter monetary policy, increased geopolitical tension, instability in the regional banking sector, and political handwringing over the U.S. debt ceiling. However, investors remained optimistic for an economic “soft landing” as inflation continued to ease and risk assets finally surged in the fourth quarter following a dovish pivot in the U.S. Federal Reserve (the “Fed”) policy. Bonds finished with a positive return; a remarkable development after struggling to move higher for most of the year as global central banks raised interest rates.
The S&P 500® Index gained 26.29% for the fiscal year ended December 31, 2023, fully recouping losses suffered in 2022. Large-cap stocks diverged from small-cap stocks, particularly driven by a handful of mega-cap technology and consumer discretionary stocks. The Russell 1000® Index gained 26.53% compared to the 16.93% return for the Russell 2000® Index. Nine out of eleven sectors posted positive returns, with information technology (60.93%), communication services (55.86%), and consumer discretionary (43.22%) leading the way. The weakest sectors were utilities (-7.08%), energy (-1.33%), and consumer staples (+0.55%). The strength in information technology drove growth stocks to strongly outperform value stocks with the Russell 1000® Growth Index gaining 42.68% compared to a 11.46% return for the Russell 1000® Value Index. Outside the U.S., foreign equity markets underperformed domestic equities, delivering a 15.62% return, as measured by the MSCI All Country World Index ex USA benchmark.
The Bloomberg U.S. Aggregate Bond Index, a broad measure of U.S. bond market performance, rebounded with a 5.53% return over the period. The 10-year Treasury yield climbed to post-GFC (Global Financial Crisis) highs through October as the Fed tightened policy throughout the year, leading many to expect another year of negative bond returns. However, investors received much needed relief as interest rates fell sharply in the final two months of the year following the Fed’s message signaling rate cuts in 2024. Looking across the broadest sectors of the market, investment-grade corporate bonds gained 8.52% for the year, while agency mortgage-backed securities rose 5.05%. High yield bonds were the best performing sector with a 13.44% return as measured by the return of the Bloomberg U.S. Corporate High Yield Bond Index. Municipal bonds outperformed the broader market with a 6.40% gain for the Bloomberg Municipal Bond Index. Outside the U.S., foreign bonds were also positive as the Bloomberg Global Aggregate ex-USD Index gained 5.72%.
AMG Funds provides access to a distinctive array of actively managed return-oriented investment strategies. You can rest assured that under all market conditions our team is focused on delivering excellent investment management services for your benefit. For more information about AMG Funds’ wide range of products and resources, please visit wealth.amg.com. We thank you for your investment and continued trust in AMG Funds.
Respectfully,

Keitha Kinne
President
AMG Funds
| | | | | | | | | | | | | | |
| | | | | Periods ended | |
| Average Annual Total Returns | | December 31, 2023* | |
| | | | |
| Stocks: | | | | 1 Year | | | 3 Years | | | 5 Years | |
| | | | |
Large Cap | | (S&P 500® Index) | | | 26.29 | % | | | 10.00% | | | | 15.69% | |
| | | | |
Small Cap | | (Russell 2000® Index) | | | 16.93 | % | | | 2.22% | | | | 9.97% | |
| | | | |
International | | (MSCI ACWI ex USA) | | | 15.62 | % | | | 1.55% | | | | 7.08% | |
| | | | |
Bonds: | | | | | | | | | | | | | | |
| | | | |
Investment Grade | | (Bloomberg U.S. Aggregate Bond Index) | | | 5.53 | % | | | (3.31)% | | | | 1.10% | |
| | | | |
High Yield | | (Bloomberg U.S. Corporate High Yield Bond Index) | | | 13.44 | % | | | 1.98% | | | | 5.37% | |
| | | | |
Tax-exempt | | (Bloomberg Municipal Bond Index) | | | 6.40 | % | | | (0.40)% | | | | 2.25% | |
| | | | |
Treasury Bills | | (ICE BofAML U.S. 6-Month Treasury Bill Index) | | | 5.14 | % | | | 2.17% | | | | 2.02% | |
*Source: FactSet. Past performance is no guarantee of future results.
2
| | |
| | | About Your Fund’s Expenses |
| | | |
| | | |
| | | | | | | | |
As a shareholder of a Fund, you may incur two types of costs: (1) transaction costs, which may include sales charges (loads) on purchase payments; redemption fees; and exchange fees; and (2) ongoing costs, including management fees; distribution (12b-1) fees; and other Fund expenses. This example is intended to help you understand your ongoing costs (in dollars) of investing in the Fund and to compare these costs with the ongoing costs of investing in other mutual funds. The example is based on $1,000 invested at the beginning of the period and held for the entire period as indicated below. ACTUAL EXPENSES The first section of the following table provides information about the actual account values and | | | | actual expenses. You may use the information in this section, together with the amount you invested, to estimate the expenses that you paid over the period. Simply divide your account value by $1,000 (for example, an $8,600 account value divided by $1,000 = 8.6), then multiply the result by the number in the first section under the heading entitled “Expenses Paid During the Period” to estimate the expenses you paid on your account during this period. HYPOTHETICAL EXAMPLE FOR COMPARISON PURPOSES The second section of the following table provides information about hypothetical account values and hypothetical expenses based on the Fund’s actual expense ratio and an assumed annual rate of return of 5% before expenses, which is not the Fund’s | | | | actual return. The hypothetical account values and expenses may not be used to estimate the actual ending account balance or expenses you paid for the period. You may use this information to compare the ongoing costs of investing in the Fund and other funds by comparing this 5% hypothetical example with the 5% hypothetical examples that appear in the shareholder reports of other funds. Please note that the expenses shown in the table are meant to highlight your ongoing costs only and do not reflect any transactional costs, such as sales charges (loads), redemption fees, or exchange fees. Therefore, the second section of the table is useful in comparing ongoing costs only, and will not help you determine the relative total costs of owning different funds. |
| | | | | | | | |
| | | | | | | | | | |
Six Months Ended December 31, 2023 | | Expense
Ratio for
the Period | | Beginning
Account
Value
07/01/23 | | Ending
Account
Value
12/31/23 | | | Expenses
Paid
During
the Period* |
AMG Renaissance Large Cap Growth Fund |
|
Based on Actual Fund Return |
Class N | | 1.00% | | $1,000 | | | $1,093 | | | $5.28 |
Class I | | 0.73% | | $1,000 | | | $1,095 | | | $3.85 |
Class Z | | 0.66% | | $1,000 | | | $1,095 | | | $3.48 |
|
Based on Hypothetical 5% Annual Return |
Class N | | 1.00% | | $1,000 | | | $1,020 | | | $5.09 |
Class I | | 0.73% | | $1,000 | | | $1,022 | | | $3.72 |
Class Z | | 0.66% | | $1,000 | | | $1,022 | | | $3.36 |
| * | Expenses are equal to the Fund’s annualized expense ratio multiplied by the average account value over the period, multiplied by the number of days in the most recent fiscal half-year (184), then divided by 365. |
3
| | |
| | | AMG Renaissance Large Cap Growth Fund Portfolio Manager’s Comments (unaudited) |
| | | |
| | | |
| | | | | | | | |
AMG Renaissance Large Cap Growth Fund (the “Fund”) Class N shares returned 25.04% for the year ending December 31, 2023, trailing the Fund’s benchmark, the Russell 1000® Growth Index (the “Index”), which returned 42.68%. MARKET OVERVIEW Stocks continued their march higher during the first half of 2023, with the S&P 500® Index returning 16.89% and the Index returning 29.02%. After a modest pullback during the third quarter, primarily in August and September, markets surged forward again to finish the year significantly higher. For the entire period, the Index returned 42.68% while the S&P 500® Index returned 26.29%. Gains were broad based, as every sector within the Index was positive for the period. The information technology and communication services sectors led the way with gains of roughly 65% each, while the more defensive consumer staples, utilities, and energy sectors posted more modest, low single-digit gains. This year the financial press has focused its attention on a group of strong-performing information technology and consumer discretionary stocks, aptly referred to as the “Magnificent Seven” (Apple, Microsoft, Amazon, Alphabet, Tesla, NVIDIA, and Meta Platforms), which accounted for the lion’s share of returns across several key market indices this year as a result of their strong performance and large market capitalization, as most market indices are capitalization weighted. The returns of the Magnificent Seven have contributed to more than two-thirds of the total returns for both the Russell 1000® Index and the Index over the period. However, it is worth noting that the Magnificent Seven also declined more than the overall market during the market pullback that occurred in the last two months of the third quarter. In December 2022, a story in The Economist stated that 85% of economists polled expected a recession to occur over the next 12 months (i.e., 2023). The fact | | | | that the majority of economists were wrong should serve as a cautionary tale to anyone who makes economic projections. In 2023, the financial markets weathered the U.S. Federal Reserve’s raising of interest rates 11 times over the preceding 18 months to their highest level in over 20 years, weakness in regional banks and a significant bank failure (Silicon Valley Bank), the ongoing war in Ukraine, and the renewed war in the Middle East. Few would have expected that these events would be associated with a 20%+ gain in the stock market, but these results have nonetheless occurred, lending credence to the adage that “the stock market tends to climb a wall of worry.” PERFORMANCE REVIEW For 2023, stock selection in the communication services and real estate sectors was the largest positive contributor to relative performance. Notable individual contributors for the year included Meta Platforms, Inc. (+194%), Broadcom, Inc. (+104%), and Apple, Inc. (+49%). Stock selection in the health care and information technology sectors was the largest detractor from relative performance during the year. Notable individual detractors included Dollar General Corp. (-36%), Genpact, Ltd. (-27%), and PayPal Holdings, Inc. (-14%). We exited our positions in Dollar General and Genpact during the period. OUTLOOK The price-to-earnings (P/E) ratio of the S&P 500® Index, based on estimated earnings over the next 12 months, rose from 17.9x at the beginning of 2023 to 22.1x by the end of December. This 24% increase, which accounted for virtually all of the S&P 500® Index’s gain in 2023, was an unusual occurrence given the increases in short-term interest rates over the year. The median P/E ratio over the past 30 years was 17.9x, and current readings rank in the highest 18% of past periods, suggesting that further increases in the P/E ratio are less likely. While the market P/E ratio is relatively high, earnings growth for the S&P 500® Index appears to be transitioning to growth. The fourth quarter of 2023 is | | | | estimated to see positive growth after several quarters of negative year-over-year comparisons. Consensus forecasts now suggest double-digit growth in earnings for 2024, which, if achieved, may support further price gains in the market. The fourth quarter return for the equal-weighted S&P 500® Index was virtually the same as the cap-weighted index, but the equal-weighted index lagged the cap-weighted S&P 500® Index by -12.4% in 2023, marking the worst relative performance by the equal-weighted index since 1998. The poor performance was a direct result of the outperformance of a relatively small group of mega-cap stocks over the past year. The largest 10 stocks in the S&P 500® Index accounted for 86% of the overall index return in 2023 and accounted for a record 32.1% weight in the index at year-end, according to JP Morgan. Notably, a similar period of outperformance by mega-cap companies occurred in the late 1990s, followed by strong outperformance by the equal-weighted index over subsequent periods extending out from 3 to 20 years. We continue to believe that a willingness to look beyond the recent mega-cap market leaders will result in good relative returns going forward. We continue to focus our efforts on identifying high-quality companies with good growth opportunities that are selling at reasonable valuations. While the market outlook for 2024 is just as difficult to predict as it was in 2023, we believe that our disciplined investment approach will continue to reward patient investors with good long-term returns. The views expressed represent the opinions of Renaissance Investment Management as of December 31, 2023, and are not intended as a forecast or guarantee of future results, and are subject to change without notice. |
| | | | | | | | |
4
|
AMG Renaissance Large Cap Growth Fund Portfolio Manager’s Comments (continued) |
CUMULATIVE TOTAL RETURN PERFORMANCE
AMG Renaissance Large Cap Growth Fund’s cumulative total return is based on the daily change in net asset value (NAV), and assumes that all dividends and distributions were reinvested. This graph compares a hypothetical $10,000 investment made in the AMG Renaissance Large Cap Growth Fund’s Class N shares on December 31, 2013, to a $10,000 investment made in the Russell 1000® Growth Index for the same time period. The graph and table do not reflect the deduction of taxes that a shareholder would pay on a Fund distribution or redemption of shares. The listed returns for the Fund are net of expenses and the returns for the index exclude expenses. Total returns would have been lower had certain expenses not been reduced.
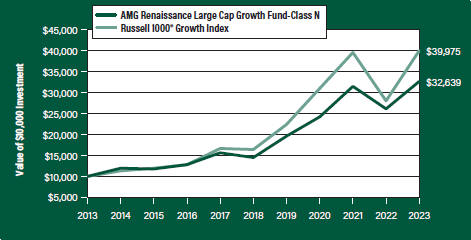
The table below shows the average annual total returns for the AMG Renaissance Large Cap Growth Fund and the Russell 1000® Growth Index for the same time periods ended December 31, 2023.
| | | | | | | | | | | | |
| | | One | | | Five | | | Ten | |
| Average Annual Total Returns1 | | Year | | | Years | | | Years | |
AMG Renaissance Large Cap Growth Fund2, 3, 4, 5, 6, 7, 8, 9 | |
| | | |
Class N | | | 25.04 | % | | | 17.63 | % | | | 12.56 | % |
| | | |
Class I | | | 25.47 | % | | | 17.92 | % | | | 12.89 | % |
| | | |
Class Z | | | 25.54 | % | | | 18.02 | % | | | 13.00 | % |
| | | |
Russell 1000® Growth Index10 | | | 42.68 | % | | | 19.50 | % | | | 14.86 | % |
The performance data shown represents past performance. Past performance is not a guarantee of future results. Current performance may be lower or higher than the performance data quoted. The investment return and principal value of an investment will fluctuate so that an investor’s shares, when redeemed, may be worth more or less than their original cost.
Investors should carefully consider the Fund’s investment objectives, risks, charges and expenses before investing. For performance information through the most recent month end, current net asset values per share for the Fund and other information, please call 800.548.4539 or visit our website at wealth.amg.com for a free prospectus. Read it carefully before investing or sending money.
Distributed by AMG Distributors, Inc., member FINRA/SIPC.
| 1 | Total return equals income yield plus share price change and assumes reinvestment of all dividends and capital gain distributions. Returns are net of fees and may reflect offsets of Fund expenses as described in the prospectus. No adjustment has been made for taxes payable by shareholders on their reinvested dividends and capital gain distributions. Returns for periods greater than one year are annualized. The listed returns on the Fund are net of expenses and based on the published NAV as of December 31, 2023. All returns are in U.S. Dollars ($). |
|
2 From time to time, the Fund’s Investment Manager has waived its fees and/or absorbed Fund expenses, which has resulted in higher returns. |
| |
3 Market prices of investments held by the Fund may fall rapidly or unpredictably due to a variety of factors, including economic, political, or market conditions, or other factors including terrorism, war, natural disasters and the spread of infectious illness or other public health issues, including epidemics or pandemics, or in response to events that affect particular industries or companies. |
| |
4 The stocks of large-capitalization companies are generally more mature and may not be able to reach the same levels of growth as the stocks of small- or mid-capitalization companies. |
| |
5 The stocks of mid-capitalization companies often have greater price volatility, lower trading volume, and less liquidity than the stocks of larger, more established companies. |
| |
6 The prices of equity securities of companies that are expected to experience relatively rapid earnings growth, or “growth stocks,” may be more sensitive to market movements because the prices tend to reflect future investor expectations rather than just current profits. |
| |
7 Because the Fund is an actively managed investment portfolio, security selection or focus on securities in a particular style, market sector or group of companies may cause the Fund to incur losses or underperform relative to its benchmarks or other funds with a similar investment objective. There can be no guarantee that the Subadviser’s investment techniques and risk analysis will produce the desired result. |
| |
8 Issuers and companies that are in similar industry sectors may be similarly affected by particular economic or market events; to the extent the Fund has substantial holdings within a particular sector, the risks associated with that sector increase. |
| |
9 When a quantitative model (“Model”) or information or data (“Data”) used in managing the Fund contains an error, or is incorrect or incomplete, any investment decision made in reliance on the Model or Data may not produce the desired results and the Fund may realize losses. In addition, any hedging based on a faulty Model or Data may prove to be unsuccessful. Furthermore, the success of a Model that is predictive in nature is dependent largely on the accuracy and reliability of the supplied historical data. All Models are susceptible to input errors or errors in design, which may cause the resulting output to be faulty. |
| |
10 The Russell 1000® Growth Index is a market capitalization weighted index that measures the performance of those Russell 1000® companies with higher price-to-book ratios and higher forecasted growth values. Unlike the Fund, the Russell 1000® |
5
| | |
| | | AMG Renaissance Large Cap Growth Fund Portfolio Manager’s Comments (continued) |
| | | |
| | | |
| | | | | | | | |
Growth Index is unmanaged, is not available for investment and does not incur expenses. The Russell 1000® Growth Index is a trademark of the London Stock Exchange Group companies. | | | | Not FDIC insured, nor bank guaranteed. May lose value. | | | | |
| | | | | | | | |
6
| | |
| | |
| | AMG Renaissance Large Cap Growth Fund Fund Snapshots (unaudited) December 31, 2023 |
| | |
| | | |
PORTFOLIO BREAKDOWN
| | | | | |
| Sector | | % of
Net Assets |
| | |
Information Technology | | 36.9 |
| | |
Health Care | | 19.8 |
| | |
Industrials | | 12.0 |
| | |
Financials | | 11.2 |
| | |
Consumer Discretionary | | 7.5 |
| | |
Communication Services | | 6.4 |
| | |
Consumer Staples | | 3.0 |
| | |
Energy | | 1.6 |
| | |
Short-Term Investments | | 1.6 |
| | |
Other Assets, less Liabilities | | 0.01 |
1 Less than (0.05)%
TOP TEN HOLDINGS
| | |
| Security Name | | % of
Net Assets |
| | |
Apple, Inc. | | 3.3 |
| | |
Microsoft Corp. | | 2.9 |
| | |
Amazon.com, Inc. | | 2.5 |
| | |
Alphabet, Inc., Class A | | 2.4 |
| | |
Meta Platforms, Inc., Class A | | 2.0 |
| | |
Lam Research Corp. | | 2.0 |
| | |
Netflix, Inc. | | 2.0 |
| | |
PTC, Inc. | | 1.9 |
| | |
Amphenol Corp., Class A | | 1.9 |
| | |
salesforce.com, Inc. | | 1.9 |
| | | |
| | |
Top Ten as a Group | | 22.8 |
| | |
Because a fund’s strategy may result in multiple investments in particular sectors of the economy, its performance may depend on the performance of those sectors and may fluctuate more widely than investments diversified across more sectors. For additional information on these and other risk considerations, please see the Fund’s prospectus.
Any sectors, industries, or securities discussed should not be perceived as investment recommendations. Mention of a specific security should not be considered a recommendation to buy or solicitation to sell that security. Specific securities mentioned in this report may have been sold from the Fund’s portfolio of investments by the time you receive this report.
7
| | |
| | |
| | AMG Renaissance Large Cap Growth Fund Schedule of Portfolio Investments December 31, 2023 |
| | |
| | | |
| | | | | | | | |
| | | Shares | | | Value | |
| | |
Common Stocks - 98.4% | | | | | | | | |
| | |
Communication Services - 6.4% | | | | | | | | |
| | |
Alphabet, Inc., Class A* | | | 22,921 | | | | $3,201,834 | |
| | |
Meta Platforms, Inc., Class A* | | | 7,796 | | | | 2,759,472 | |
| | |
Netflix, Inc.* | | | 5,412 | | | | 2,634,995 | |
| | |
Total Communication Services | | | | | | | 8,596,301 | |
| | |
Consumer Discretionary - 7.5% | | | | | | | | |
| | |
Amazon.com, Inc.* | | | 22,055 | | | | 3,351,037 | |
| | |
Lowe’s Cos., Inc. | | | 8,407 | | | | 1,870,978 | |
| | |
Marriott International, Inc., Class A | | | 11,219 | | | | 2,529,996 | |
| | |
O’Reilly Automotive, Inc.* | | | 2,423 | | | | 2,302,044 | |
| | |
Total Consumer Discretionary | | | | | | | 10,054,055 | |
| | |
Consumer Staples - 3.0% | | | | | | | | |
| | |
BJ’s Wholesale Club Holdings, Inc.* | | | 28,792 | | | | 1,919,275 | |
| | |
The Procter & Gamble Co. | | | 14,898 | | | | 2,183,153 | |
| | |
Total Consumer Staples | | | | | | | 4,102,428 | |
| | |
Energy - 1.6% | | | | | | | | |
| | |
EOG Resources, Inc. | | | 17,565 | | | | 2,124,487 | |
| | |
Financials - 11.2% | | | | | | | | |
| | |
Arch Capital Group, Ltd. (Bermuda)* | | | 26,694 | | | | 1,982,563 | |
| | |
Everest Group, Ltd. (Bermuda) | | | 5,583 | | | | 1,974,037 | |
| | |
Fiserv, Inc.* | | | 17,543 | | | | 2,330,412 | |
| | |
Mastercard, Inc., Class A | | | 5,550 | | | | 2,367,131 | |
| | |
PayPal Holdings, Inc.* | | | 28,503 | | | | 1,750,369 | |
| | |
Visa, Inc., Class A | | | 9,299 | | | | 2,420,995 | |
| | |
WEX, Inc.* | | | 11,402 | | | | 2,218,259 | |
| | |
Total Financials | | | | | | | 15,043,766 | |
| | |
Health Care - 19.8% | | | | | | | | |
| | |
Abbott Laboratories | | | 20,658 | | | | 2,273,826 | |
| | |
Cencora, Inc. | | | 11,798 | | | | 2,423,073 | |
| | |
Chemed Corp. | | | 4,076 | | | | 2,383,441 | |
| | |
Danaher Corp. | | | 10,009 | | | | 2,315,482 | |
| | |
HCA Healthcare, Inc. | | | 8,238 | | | | 2,229,862 | |
| | |
Humana, Inc. | | | 4,255 | | | | 1,947,982 | |
| | |
Johnson & Johnson | | | 13,702 | | | | 2,147,651 | |
| | |
McKesson Corp. | | | 4,813 | | | | 2,228,323 | |
| | |
The Cigna Group | | | 7,045 | | | | 2,109,625 | |
| | |
Thermo Fisher Scientific, Inc. | | | 3,707 | | | | 1,967,639 | |
| | |
UnitedHealth Group, Inc. | | | 4,167 | | | | 2,193,800 | |
| | |
Vertex Pharmaceuticals, Inc.* | | | 5,853 | | | | 2,381,527 | |
| | |
Total Health Care | | | | | | | 26,602,231 | |
| | |
Industrials - 12.0% | | | | | | | | |
| | |
Cintas Corp. | | | 4,227 | | | | 2,547,444 | |
| | |
| | | | | | | | |
| | | | | | | | |
| | | Shares | | | Value | |
| | |
Ferguson PLC (United Kingdom) | | | 12,529 | | | | $2,418,974 | |
| | |
Illinois Tool Works, Inc. | | | 7,825 | | | | 2,049,681 | |
| | |
Lincoln Electric Holdings, Inc. | | | 10,870 | | | | 2,363,790 | |
| | |
Lockheed Martin Corp. | | | 4,251 | | | | 1,926,723 | |
| | |
Union Pacific Corp. | | | 9,815 | | | | 2,410,760 | |
| | |
WW Grainger, Inc. | | | 2,882 | | | | 2,388,285 | |
| | |
Total Industrials | | | | | | | 16,105,657 | |
| |
Information Technology - 36.9% | | | | | |
| | |
Adobe, Inc.* | | | 4,019 | | | | 2,397,735 | |
| | |
Amphenol Corp., Class A | | | 26,164 | | | | 2,593,637 | |
| | |
ANSYS, Inc.* | | | 6,712 | | | | 2,435,651 | |
| | |
Apple, Inc. | | | 22,706 | | | | 4,371,586 | |
| | |
Applied Materials, Inc. | | | 15,344 | | | | 2,486,802 | |
| | |
Broadcom, Inc. | | | 2,304 | | | | 2,571,840 | |
| | |
Cadence Design Systems, Inc.* | | | 8,411 | | | | 2,290,904 | |
| | |
CDW Corp. | | | 11,083 | | | | 2,519,388 | |
| | |
Fortinet, Inc.* | | | 30,112 | | | | 1,762,455 | |
| | |
Gartner, Inc.* | | | 5,547 | | | | 2,502,307 | |
| | |
Keysight Technologies, Inc.* | | | 14,232 | | | | 2,264,169 | |
| | |
KLA Corp. | | | 4,189 | | | | 2,435,066 | |
| | |
Lam Research Corp. | | | 3,375 | | | | 2,643,503 | |
| | |
Microsoft Corp. | | | 10,451 | | | | 3,929,994 | |
| | |
Motorola Solutions, Inc. | | | 7,692 | | | | 2,408,288 | |
| | |
PTC, Inc.* | | | 14,865 | | | | 2,600,780 | |
| | |
Roper Technologies, Inc. | | | 4,406 | | | | 2,402,019 | |
| | |
salesforce.com, Inc.* | | | 9,840 | | | | 2,589,298 | |
| | |
ServiceNow, Inc.* | | | 3,419 | | | | 2,415,489 | |
| | |
Total Information Technology | | | | | | | 49,620,911 | |
| | |
Total Common Stocks
(Cost $86,443,251) | | | | | | | 132,249,836 | |
| | |
Short-Term Investments - 1.6% | | | | | | | | |
| |
Other Investment Companies - 1.6% | | | | | |
| | |
Dreyfus Government Cash Management Fund, Institutional Shares, 5.25%1 | | | 849,281 | | | | 849,281 | |
| | |
Dreyfus Institutional Preferred Government Money Market Fund, Institutional Shares, 5.32%1 | | | 1,273,922 | | | | 1,273,922 | |
| | |
Total Short-Term Investments
(Cost $2,123,203) | | | | | | | 2,123,203 | |
| | |
Total Investments - 100.0%
(Cost $88,566,454) | | | | | | | 134,373,039 | |
| | |
Other Assets, less Liabilities - 0.0%# | | | | | | | (37,765 | ) |
| | |
Net Assets - 100.0% | | | | | | $ | 134,335,274 | |
| | |
| | | | | | | | |
The accompanying notes are an integral part of these financial statements.
8
| | |
| | |
| | AMG Renaissance Large Cap Growth Fund Schedule of Portfolio Investments (continued) |
| | |
| | | |
| | * | Non-income producing security. |
| | 1 | Yield shown represents the December 31, 2023, seven day average yield, which refers to the sum of the previous seven days’ dividends paid, expressed as an annual percentage. |
The following table summarizes the inputs used to value the Fund’s investments by the fair value hierarchy levels as of December 31, 2023:
| | | | | | | | | | | | | | | | |
| | | Level 1 | | | Level 2 | | | Level 3 | | | Total | |
Investments in Securities | | | | | | | | | | | | | | | | |
| | | | |
Common Stocks† | | $ | 132,249,836 | | | | — | | | | — | | | | $132,249,836 | |
| | | | |
Short-Term Investments | | | | | | | | | | | | | | | | |
| | | | |
Other Investment Companies | | | 2,123,203 | | | | — | | | | — | | | | 2,123,203 | |
| | | | | | | | | | | | | | | | |
| | | | |
Total Investments in Securities | | $ | 134,373,039 | | | | — | | | | — | | | | $134,373,039 | |
| | | | | | | | | | | | | | | | |
| † | All common stocks held in the Fund are Level 1 securities. For a detailed breakout of common stocks by major industry classification, please refer to the Fund’s Schedule of Portfolio Investments. |
For the fiscal year ended December 31, 2023, there were no transfers in or out of Level 3.
The accompanying notes are an integral part of these financial statements.
9
| | |
| | | Statement of Assets and Liabilities December 31, 2023 |
| | | |
| | | |
| | | | | |
| | | AMG Renaissance
Large Cap
Growth Fund |
| |
Assets: | | | | | |
| |
Investments at value1 | | | | $134,373,039 | |
| |
Dividend and interest receivables | | | | 67,423 | |
| |
Securities lending income receivable | | | | 42 | |
| |
Receivable for Fund shares sold | | | | 91,823 | |
| |
Receivable from affiliate | | | | 15,372 | |
| |
Prepaid expenses and other assets | | | | 11,222 | |
| |
Total assets | | | | 134,558,921 | |
| |
Liabilities: | | | | | |
| |
Payable for Fund shares repurchased | | | | 78,239 | |
| |
Accrued expenses: | | | | | |
| |
Investment advisory and management fees | | | | 54,401 | |
| |
Administrative fees | | | | 16,817 | |
| |
Distribution fees | | | | 13,695 | |
| |
Shareholder service fees | | | | 10,416 | |
| |
Other | | | | 50,079 | |
| |
Total liabilities | | | | 223,647 | |
|
Commitments and Contingencies (Notes 2 & 5) | |
| |
Net Assets | | | | $134,335,274 | |
| |
1 Investments at cost | | | | $88,566,454 | |
The accompanying notes are an integral part of these financial statements.
10
| | |
| | | Statement of Assets and Liabilities (continued) |
| | | |
| | | |
| | | | | |
| | | AMG Renaissance
Large Cap
Growth Fund |
| |
Net Assets Represent: | | | | | |
| |
Paid-in capital | | | | $87,729,997 | |
| |
Total distributable earnings | | | | 46,605,277 | |
| |
Net Assets | | | | $134,335,274 | |
| |
Class N: | | | | | |
| |
Net Assets | | | | $65,422,254 | |
| |
Shares outstanding | | | | 3,939,206 | |
| |
Net asset value, offering and redemption price per share | | | | $16.61 | |
| |
Class I: | | | | | |
| |
Net Assets | | | | $44,970,021 | |
| |
Shares outstanding | | | | 2,671,143 | |
| |
Net asset value, offering and redemption price per share | | | | $16.84 | |
| |
Class Z: | | | | | |
| |
Net Assets | | | | $23,942,999 | |
| |
Shares outstanding | | | | 1,451,418 | |
| |
Net asset value, offering and redemption price per share | | | | $16.50 | |
The accompanying notes are an integral part of these financial statements.
11
| | |
| | | Statement of Operations For the fiscal year ended December 31, 2023 |
| | | |
| | | |
| | | | | |
| | | AMG Renaissance
Large Cap
Growth Fund |
| |
Investment Income: | | | | | |
| |
Dividend income | | | | $1,280,598 | |
| |
Interest income | | | | 287 | |
| |
Securities lending income | | | | 2,014 | |
| |
Total investment income | | | | 1,282,899 | |
| |
Expenses: | | | | | |
| |
Investment advisory and management fees | | | | 602,128 | |
| |
Administrative fees | | | | 183,610 | |
| |
Distribution fees - Class N | | | | 151,150 | |
| |
Shareholder servicing fees - Class N | | | | 54,764 | |
| |
Shareholder servicing fees - Class I | | | | 27,601 | |
| |
Professional fees | | | | 43,571 | |
| |
Registration fees | | | | 42,461 | |
| |
Custodian fees | | | | 27,059 | |
| |
Reports to shareholders | | | | 25,524 | |
| |
Transfer agent fees | | | | 15,909 | |
| |
Trustee fees and expenses | | | | 9,178 | |
| |
Interest expense | | | | 759 | |
| |
Miscellaneous | | | | 7,699 | |
| |
Total expenses before offsets | | | | 1,191,413 | |
| |
Expense reimbursements | | | | (149,132 | ) |
| |
Expense reductions | | | | (3,214 | ) |
| |
Net expenses | | | | 1,039,067 | |
| | | | | |
| |
Net investment income | | | | 243,832 | |
| |
Net Realized and Unrealized Gain: | | | | | |
| |
Net realized gain on investments | | | | 9,073,938 | |
| |
Net change in unrealized appreciation/depreciation on investments | | | | 18,753,772 | |
| |
Net realized and unrealized gain | | | | 27,827,710 | |
| | | | | |
| |
Net increase in net assets resulting from operations | | | | $28,071,542 | |
The accompanying notes are an integral part of these financial statements.
12
| | |
| | | Statements of Changes in Net Assets For the fiscal years ended December 31, |
| | | |
| | | |
| | | | | | | | | | |
| | | AMG Renaissance
Large Cap
Growth Fund |
| | |
| | | 2023 | | 2022 |
| | |
Increase (Decrease) in Net Assets Resulting From Operations: | | | | | | | | | | |
| | |
Net investment income | | | | $243,832 | | | | | $312,760 | |
| | |
Net realized gain on investments | | | | 9,073,938 | | | | | 5,552,868 | |
| | |
Net change in unrealized appreciation/depreciation on investments | | | | 18,753,772 | | | | | (24,391,584 | ) |
| | |
Net increase (decrease) in net assets resulting from operations | | | | 28,071,542 | | | | | (18,525,956 | ) |
| | |
Distributions to Shareholders: | | | | | | | | | | |
| | |
Class N | | | | (4,555,570 | ) | | | | (3,750,988 | ) |
| | |
Class I | | | | (3,137,397 | ) | | | | (1,502,447 | ) |
| | |
Class Z | | | | (1,750,282 | ) | | | | (1,496,106 | ) |
| | |
Total distributions to shareholders | | | | (9,443,249 | ) | | | | (6,749,541 | ) |
| | |
Capital Share Transactions:1 | | | | | | | | | | |
| | |
Net increase from capital share transactions | | | | 12,471,195 | | | | | 15,701,143 | |
| | | | | | | | | | |
| | |
Total increase (decrease) in net assets | | | | 31,099,488 | | | | | (9,574,354 | ) |
| | |
Net Assets: | | | | | | | | | | |
| | |
Beginning of year | | | | 103,235,786 | | | | | 112,810,140 | |
| | |
End of year | | | | $134,335,274 | | | | | $103,235,786 | |
1 See Note 1(g) of the Notes to Financial Statements.
The accompanying notes are an integral part of these financial statements.
13
| | |
| | | AMG Renaissance Large Cap Growth Fund Financial Highlights For a share outstanding throughout each fiscal year |
| | | |
| | | |
| | | | | | | | | | | | | | | | | | | | | | | | | |
| | | For the fiscal years ended December 31, |
| | | | | |
| Class N | | 2023 | | 2022 | | 2021 | | 2020 | | 2019 |
| | | | | |
Net Asset Value, Beginning of Year | | | | $14.28 | | | | | $18.41 | | | | | $15.31 | | | | | $13.01 | | | | | $10.48 | |
| | | | | |
Income (loss) from Investment Operations: | | | | | | | | | | | | | | | | | | | | | | | | | |
| | | | | |
Net investment income1,2 | | | | 0.01 | | | | | 0.03 | | | | | 0.00 | 3,4 | | | | 0.01 | | | | | 0.06 | |
| | | | | |
Net realized and unrealized gain (loss) on investments | | | | 3.55 | | | | | (3.16 | ) | | | | 4.57 | | | | | 3.04 | | | | | 3.61 | |
| | | | | |
Total income (loss) from investment operations | | | | 3.56 | | | | | (3.13 | ) | | | | 4.57 | | | | | 3.05 | | | | | 3.67 | |
| | | | | |
Less Distributions to Shareholders from: | | | | | | | | | | | | | | | | | | | | | | | | | |
| | | | | |
Net investment income | | | | (0.01 | ) | | | | (0.02 | ) | | | | (0.00 | )3 | | | | (0.02 | ) | | | | (0.08 | ) |
| | | | | |
Net realized gain on investments | | | | (1.22 | ) | | | | (0.98 | ) | | | | (1.47 | ) | | | | (0.73 | ) | | | | (1.06 | ) |
| | | | | |
Total distributions to shareholders | | | | (1.23 | ) | | | | (1.00 | ) | | | | (1.47 | ) | | | | (0.75 | ) | | | | (1.14 | ) |
| | | | | |
Net Asset Value, End of Year | | | | $16.61 | | | | | $14.28 | | | | | $18.41 | | | | | $15.31 | | | | | $13.01 | |
| | | | | |
Total Return2,5 | | | | 25.04 | % | | | | (17.05 | )% | | | | 30.02 | % | | | | 23.54 | % | | | | 35.16 | % |
| | | | | |
Ratio of net expenses to average net assets6 | | | | 1.00 | % | | | | 1.00 | % | | | | 1.00 | % | | | | 1.00 | % | | |
| 1.00
| %7
|
| | | | | |
Ratio of gross expenses to average net assets8 | | | | 1.12 | % | | | | 1.15 | % | | | | 1.13 | % | | | | 1.19 | % | | | | 1.17 | % |
| | | | | |
Ratio of net investment income to average net assets2 | | | | 0.05 | % | | | | 0.22 | % | | | | 0.00 | %9 | | | | 0.10 | % | | | | 0.48 | % |
| | | | | |
Portfolio turnover | | | | 35 | % | | | | 28 | % | | | | 18 | % | | | | 28 | % | | | | 40 | % |
| | | | | |
Net assets end of year (000’s) omitted | | | | $65,422 | | | | | $56,264 | | | | | $79,490 | | | | | $67,688 | | | | | $63,900 | |
14
| | |
| | | AMG Renaissance Large Cap Growth Fund Financial Highlights For a share outstanding throughout each fiscal year |
| | | |
| | | |
| | | | | | | | | | | | | | | | | | | | | | | | | |
| | | For the fiscal years ended December 31, |
| | | | | |
| Class I | | 2023 | | 2022 | | 2021 | | 2020 | | 2019 |
| | | | | |
Net Asset Value, Beginning of Year | | | | $14.46 | | | | | $18.63 | | | | | $15.48 | | | | | $13.14 | | | | | $10.58 | |
| | | | | |
Income (loss) from Investment Operations: | | | | | | | | | | | | | | | | | | | | | | | | | |
| | | | | |
Net investment income1,2 | | | | 0.05 | | | | | 0.07 | | | | | 0.04 | 4 | | | | 0.05 | | | | | 0.09 | |
| | | | | |
Net realized and unrealized gain (loss) on investments | | | | 3.60 | | | | | (3.19 | ) | | | | 4.62 | | | | | 3.07 | | | | | 3.64 | |
| | | | | |
Total income (loss) from investment operations | | | | 3.65 | | | | | (3.12 | ) | | | | 4.66 | | | | | 3.12 | | | | | 3.73 | |
| | | | | |
Less Distributions to Shareholders from: | | | | | | | | | | | | | | | | | | | | | | | | | |
| | | | | |
Net investment income | | | | (0.05 | ) | | | | (0.07 | ) | | | | (0.04 | ) | | | | (0.05 | ) | | | | (0.11 | ) |
| | | | | |
Net realized gain on investments | | | | (1.22 | ) | | | | (0.98 | ) | | | | (1.47 | ) | | | | (0.73 | ) | | | | (1.06 | ) |
| | | | | |
Total distributions to shareholders | | | | (1.27 | ) | | | | (1.05 | ) | | | | (1.51 | ) | | | | (0.78 | ) | | | | (1.17 | ) |
| | | | | |
Net Asset Value, End of Year | | | | $16.84 | | | | | $14.46 | | | | | $18.63 | | | | | $15.48 | | | | | $13.14 | |
| | | | | |
Total Return2,5 | | | | 25.47 | % | | | | (16.87 | )% | | | | 30.30 | % | | | | 23.90 | % | | | | 35.42 | % |
| | | | | |
Ratio of net expenses to average net assets6 | | | | 0.73 | % | | | | 0.73 | % | | | | 0.75 | % | | | | 0.75 | % | | |
| 0.75
| %7
|
| | | | | |
Ratio of gross expenses to average net assets8 | | | | 0.85 | % | | | | 0.88 | % | | | | 0.88 | % | | | | 0.94 | % | | | | 0.92 | % |
| | | | | |
Ratio of net investment income to average net assets2 | | | | 0.32 | % | | | | 0.48 | % | | | | 0.25 | % | | | | 0.35 | % | | | | 0.73 | % |
| | | | | |
Portfolio turnover | | | | 35 | % | | | | 28 | % | | | | 18 | % | | | | 28 | % | | | | 40 | % |
| | | | | |
Net assets end of year (000’s) omitted | | | | $44,970 | | | | | $25,585 | | | | | $12,599 | | | | | $9,414 | | | | | $8,410 | |
15
| | |
| | | AMG Renaissance Large Cap Growth Fund Financial Highlights For a share outstanding throughout each fiscal year |
| | | |
| | | |
| | | | | | | | | | | | | | | | | | | | | | | | | |
| | | For the fiscal years ended December 31, |
| | | | | |
| Class Z | | 2023 | | 2022 | | 2021 | | 2020 | | 2019 |
| | | | | |
Net Asset Value, Beginning of Year | | | | $14.18 | | | | | $18.31 | | | | | $15.22 | | | | | $12.94 | | | | | $10.43 | |
| | | | | |
Income (loss) from Investment Operations: | | | | | | | | | | | | | | | | | | | | | | | | | |
| | | | | |
Net investment income1,2 | | | | 0.06 | | | | | 0.09 | | | | | 0.06 | 4 | | | | 0.06 | | | | | 0.10 | |
| | | | | |
Net realized and unrealized gain (loss) on investments | | | | 3.54 | | | | | (3.16 | ) | | | | 4.56 | | | | | 3.01 | | | | | 3.60 | |
| | | | | |
Total income (loss) from investment operations | | | | 3.60 | | | | | (3.07 | ) | | | | 4.62 | | | | | 3.07 | | | | | 3.70 | |
| | | | | |
Less Distributions to Shareholders from: | | | | | | | | | | | | | | | | | | | | | | | | | |
| | | | | |
Net investment income | | | | (0.06 | ) | | | | (0.08 | ) | | | | (0.06 | ) | | | | (0.06 | ) | | | | (0.13 | ) |
| | | | | |
Net realized gain on investments | | | | (1.22 | ) | | | | (0.98 | ) | | | | (1.47 | ) | | | | (0.73 | ) | | | | (1.06 | ) |
| | | | | |
Total distributions to shareholders | | | | (1.28 | ) | | | | (1.06 | ) | | | | (1.53 | ) | | | | (0.79 | ) | | | | (1.19 | ) |
| | | | | |
Net Asset Value, End of Year | | | | $16.50 | | | | | $14.18 | | | | | $18.31 | | | | | $15.22 | | | | | $12.94 | |
| | | | | |
Total Return2,5 | | | | 25.54 | % | | | | (16.83 | )% | | | | 30.54 | % | | | | 23.90 | % | | | | 35.58 | % |
| | | | | |
Ratio of net expenses to average net assets6 | | | | 0.66 | % | | | | 0.66 | % | | | | 0.66 | % | | | | 0.66 | % | | | | 0.66 | %7 |
| | | | | |
Ratio of gross expenses to average net assets8 | | | | 0.78 | % | | | | 0.81 | % | | | | 0.79 | % | | | | 0.85 | % | | | | 0.83 | % |
| | | | | |
Ratio of net investment income to average net assets2 | | | | 0.39 | % | | | | 0.55 | % | | | | 0.34 | % | | | | 0.44 | % | | | | 0.82 | % |
| | | | | |
Portfolio turnover | | | | 35 | % | | | | 28 | % | | | | 18 | % | | | | 28 | % | | | | 40 | % |
| | | | | |
Net assets end of year (000’s) omitted | | | | $23,943 | | | | | $21,386 | | | | | $20,721 | | | | | $17,068 | | | | | $20,372 | |
| 1 | Per share numbers have been calculated using average shares. |
| 2 | Total returns and net investment income would have been lower had certain expenses not been offset. |
| 3 | Less than $0.005 or $(0.005) per share. |
| 4 | Includes non-recurring dividends. Without these dividends, net investment income (loss) per share would have been $(0.02), $0.02, and $0.04 for Class N, Class I and Class Z, respectively. |
| 5 | The total return is calculated using the published Net Asset Value as of fiscal year end. |
| 6 | Includes reduction from broker recapture amounting to less than 0.01% for the fiscal years ended December 31, 2023, 2022, 2021 and 2020, and 0.01% for the fiscal year ended December 31, 2019, respectively. |
| 7 | Includes interest expense of 0.01% of average net assets. |
| 8 | Excludes the impact of expense reimbursement or fee waivers and expense reductions such as brokerage credits, but includes expense repayments and non-reimbursable expenses, if any, such as interest, taxes, and extraordinary expenses. (See Note 1(c) and 2 in the Notes to Financial Statements.) |
16
| | |
| | | Notes to Financial Statements December 31, 2023 |
| | | |
| | | |
1. ORGANIZATION AND SUMMARY OF SIGNIFICANT ACCOUNTING POLICIES
AMG Funds (the “Trust”) is an open-end management investment company, organized as a Massachusetts business trust, and registered under the Investment Company Act of 1940, as amended (the “1940 Act”). Currently, the Trust consists of a number of different funds, each having distinct investment management objectives, strategies, risks, and policies. Included in this report is AMG Renaissance Large Cap Growth Fund (the “Fund”).
The Fund offers Class N, Class I, and Class Z shares. Each class represents an interest in the same assets of the Fund. Although all share classes generally have identical voting rights, each share class votes separately when required by law. Different share classes may have different net asset values per share to the extent the share classes pay different distribution amounts and/or the expenses of such share classes differ. Each share class has its own expense structure. Please refer to a current prospectus for additional information on each share class.
Stocks in the information technology sector comprise a significant portion of the Fund’s portfolio at December 31, 2023. The information technology sector may be affected by technological obsolescence, short product cycles, falling prices and profits, competitive pressures and general market conditions.
Market prices of investments held by the Fund may fall rapidly or unpredictably due to a variety of economic or political factors, market conditions, disasters or public health issues, or in response to events that affect particular industries or companies.
The Fund’s financial statements are prepared in accordance with accounting principles generally accepted in the United States of America (“U.S. GAAP”), including accounting and reporting guidance pursuant to Accounting Standards Codification Topic 946 applicable to investment companies. U.S. GAAP requires management to make estimates and assumptions that affect the reported amounts of assets and liabilities and disclosure of contingent assets and liabilities at the date of the financial statements and the reported amounts of income and expenses during the reporting period. Actual results could differ from those estimates and such differences could be material. The following is a summary of significant accounting policies followed by the Fund in the preparation of its financial statements:
a. VALUATION OF INVESTMENTS
Equity securities traded on a national securities exchange or reported on the NASDAQ national market system (“NMS”) are valued at the last quoted sales price on the primary exchange or, if applicable, the NASDAQ official closing price or the official closing price of the relevant exchange or, lacking any sales, at the last quoted bid price. Equity securities held by the Fund that are traded in the over-the-counter market (other than NMS securities) are valued at the bid price. Foreign equity securities (securities principally traded in markets other than U.S. markets) held by the Fund are valued at the official closing price on the primary exchange or, for markets that either do not offer an official closing price or where the official closing price may not be representative of the overall market, the last quoted sale price.
Fixed income securities purchased with a remaining maturity of 60 days or less are valued at amortized cost, provided that the amortized cost value is approximately the same as the fair value of the security valued without the use of amortized cost. Investments in other open-end registered investment companies are valued at their end of day net asset value per share.
The Fund’s portfolio investments are generally valued based on independent market quotations or prices or, if none, “evaluative” or other market based valuations provided by third party pricing services. Pursuant to Rule 2a-5 under the 1940 Act, the Fund’s Board of Trustees (the “Board”) designated AMG Funds LLC (the “Investment Manager”) as the Fund’s Valuation Designee to perform the Fund’s fair value determinations. Such determinations are subject to Board oversight and certain reporting and other requirements intended to ensure that the Board receives the information it needs to oversee the Investment Manager’s fair value determinations.
Under certain circumstances, the value of certain Fund portfolio investments may be based on an evaluation of fair value, pursuant to procedures established by the Investment Manager and under the general supervision of the Board. The Fund may use the fair value of a portfolio investment to calculate its net asset value (“NAV”) in the event that the market quotation, price or market based valuation for the portfolio investment is not readily available or otherwise not determinable pursuant to the Fund’s valuation procedures, if the Investment Manager believes the quotation, price or market based valuation to be unreliable, or in certain other circumstances. When determining the fair value of an investment, the Investment Manager seeks to determine the price that the Fund might reasonably expect to receive from current sale of that portfolio investment in an arms-length transaction. Fair value determinations shall be based upon consideration of all available facts and information, including, but not limited to (i) attributes specific to the investment; (ii) fundamental and analytical data relating to the investment; and (iii) the value of other comparable securities or relevant financial instruments, including derivative securities, traded on other markets or among dealers.
The values assigned to fair value portfolio investments are based on available information and do not necessarily represent amounts that might ultimately be realized in the future, since such amounts depend on future developments inherent in long-term investments. Because of the inherent uncertainty of valuation, those estimated values may differ significantly from the values that would have been used had a ready market for the investments existed, and the differences could be material. The Board will be presented with quarterly reports, as of the most recent quarter end, summarizing all fair value activity, material fair value matters that occurred during the quarter, and all outstanding securities fair valued by the Fund. Additionally, the Board will be presented with an annual report that assesses the adequacy and effectiveness of the Investment Manager’s process for determining the fair value of the Fund’s investments.
With respect to foreign equity securities and certain foreign fixed income securities, securities held in the Fund that can be fair valued by the applicable fair value pricing service are fair valued on each business day provided that each individual price exceeds a pre-established confidence level.
U.S. GAAP defines fair value as the price that a fund would receive to sell an asset or pay to transfer a liability in an orderly transaction between market participants at the measurement date. U.S. GAAP also establishes a framework for measuring fair value, and a three level hierarchy for fair value measurements based upon the transparency of inputs to the valuation of an asset or liability. Inputs may be observable or unobservable and refer broadly to the assumptions that market participants would use in pricing the asset or liability. Observable inputs reflect the assumptions market participants would use in pricing the asset or liability based on market data obtained from sources independent of the Fund. Unobservable inputs reflect the Fund’s own assumptions about the assumptions that market participants would use in pricing the asset or liability developed based on the best information available in the circumstances. Each investment is
17
| | |
| | | Notes to Financial Statements (continued) |
| | | |
| | | |
assigned a level based upon the observability of the inputs which are significant to the overall valuation.
The three-tier hierarchy of inputs is summarized below:
Level 1 – inputs are quoted prices in active markets for identical investments (e.g., equity securities, open-end investment companies)
Level 2 – other observable inputs (including, but not limited to: quoted prices for similar assets or liabilities in markets that are active, quoted prices for identical or similar assets or liabilities in markets that are not active, inputs other than quoted prices that are observable for the assets or liabilities (such as interest rates, yield curves, volatilities, prepayment speeds, loss severities, credit risks and default rates) or other market corroborated inputs) (e.g., debt securities, government securities, foreign currency exchange contracts, foreign securities utilizing international fair value pricing, fair valued securities with observable inputs)
Level 3 – inputs are significant unobservable inputs (including the Fund’s own assumptions used to determine the fair value of investments) (e.g., fair valued securities with unobservable inputs)
Changes in inputs or methodologies used for valuing investments may result in a transfer in or out of levels within the fair value hierarchy. The inputs or methodologies used for valuing investments may not necessarily be an indication of the risk associated with investing in those investments.
b. SECURITY TRANSACTIONS
Security transactions are accounted for as of trade date. Realized gains and losses on securities sold are determined on the basis of identified cost.
c. INVESTMENT INCOME AND EXPENSES
Dividend income is recorded on the ex-dividend date. Interest income, which includes amortization of premium and accretion of discount on debt securities, is accrued as earned. Dividend and interest income on foreign securities is recorded gross of any withholding tax. Non-cash dividends included in dividend income, if any, are reported at the fair market value of the securities received. Other income and expenses are recorded on an accrual basis. Expenses that cannot be directly attributed to the Fund are apportioned among the funds in the Trust and other trusts or funds within the AMG Funds Family of Funds (collectively, the “AMG Funds Family”) based upon their relative average net assets or number of shareholders. Investment income, realized and unrealized capital gains and losses, the common expenses of the Fund, and certain fund level expense reductions, if any, are allocated on a pro-rata basis to each class based on the relative net assets of each class to the total net assets of the Fund.
The Fund had certain portfolio trades directed to various brokers under a brokerage recapture program. Credits received from the brokerage recapture program are earned and paid on a monthly basis, and are recorded as expense offsets, which serve to reduce the Fund’s overall expense ratio. For the fiscal year ended December 31, 2023, the impact on the expenses and expense ratios was $3,214 and less than 0.01%, respectively.
d. DIVIDENDS AND DISTRIBUTIONS
Fund distributions resulting from either net investment income or realized net capital gains, if any, will normally be declared and paid at least annually in December. Distributions to shareholders are recorded on the ex-dividend date.
Distributions are determined in accordance with federal income tax regulations, which may differ from net investment income and net realized capital gains for financial statement purposes (U.S. GAAP). Differences may be permanent or temporary. Permanent differences are reclassified among capital accounts in the financial statements to reflect their tax character. Permanent book and tax basis differences, if any, relating to shareholder distributions will result in reclassifications to paid-in capital. Temporary differences arise when certain items of income, expense and gain or loss are recognized in different periods for financial statement and tax purposes; these differences will reverse at some time in the future. Permanent differences are primarily due to tax equalization utilized. Temporary differences are primarily due to wash sale loss deferrals.
The tax character of distributions paid during the fiscal years ended December 31, 2023 and December 31, 2022 was as follows:
| | | | | | | | |
| Distributions paid from: | | 2023 | | | 2022 | |
| | |
Ordinary income * | | | $823,992 | | | | $301,910 | |
| | |
Long-term capital gains | | | 8,619,257 | | | | 6,447,631 | |
| | | | | | | | |
| | |
| | | $9,443,249 | | | | $6,749,541 | |
| | | | | | | | |
| * | For tax purposes, short-term capital gain distributions, if any, are considered ordinary income distributions. |
As of December 31, 2023, the components of distributable earnings (excluding unrealized appreciation/depreciation) on a tax basis consisted of:
| | | | |
| |
Undistributed ordinary income | | | $178,935 | |
| |
Undistributed long-term capital gains | | | 644,766 | |
At December 31, 2023, the cost of investments and the aggregate gross unrealized appreciation and depreciation for federal income tax purposes were as follows:
| | | | | | | | | | | | |
| Cost | | Appreciation | | | Depreciation | | | Net Appreciation | |
| | | |
$88,591,463 | | | $47,220,260 | | | | $(1,438,684) | | | | $45,781,576 | |
e. FEDERAL TAXES
The Fund currently qualifies as an investment company and intends to comply with the requirements under Subchapter M of the Internal Revenue Code of 1986, as amended (the “Internal Revenue Code”), and to distribute substantially all of its taxable income and gains to its shareholders and to meet certain diversification and income requirements with respect to investment companies. The Investment Manager has analyzed the Fund’s tax positions taken on federal income tax returns as of December 31, 2023, and for all open tax years (generally, the three prior taxable years), and has concluded that no provision for federal income tax is required in the Fund’s financial statements. Additionally, the Investment Manager is not aware of any tax position for which it is reasonably possible that the total amounts of unrecognized tax benefit/detriment will change materially in the next twelve months.
Furthermore, based on the Fund’s understanding of the tax rules and rates related to income, gains and transactions for the foreign jurisdictions in which it invests, the Fund will provide for foreign taxes, and where appropriate, deferred foreign taxes.
18
| | |
| | | Notes to Financial Statements (continued) |
| | | |
| | | |
f. CAPITAL LOSS CARRYOVERS AND DEFERRALS
As of December 31, 2023, the Fund had no capital loss carryovers for federal income tax purposes. Should the Fund incur net capital losses for the fiscal year
ended December 31, 2024, such amounts may be used to offset future realized capital gains indefinitely, and retain their character as short-term and/or long-term.
g. CAPITAL STOCK
The Trust’s Amended and Restated Agreement and Declaration of Trust authorizes for the Fund the issuance of an unlimited number of shares of beneficial interest, without par value. The Fund records sales and repurchases of its capital stock on the trade date.
For the fiscal years ended December 31, 2023 and December 31, 2022, the capital stock transactions by class for the Fund were as follows:
| | | | | | | | | | | | | | | | |
| | |
| | | December 31, 2023 | | | December 31, 2022 | |
| | | | | | | | | | | | | | | | |
| | | | |
| | | Shares | | | Amount | | | Shares | | | Amount | |
| | | | |
Class N: | | | | | | | | | | | | | | | | |
| | | | |
Shares sold | | | 152,280 | | | | $2,409,381 | | | | 76,753 | | | | $1,159,718 | |
| | | | |
Shares issued in reinvestment of distributions | | | 243,694 | | | | 3,986,834 | | | | 226,359 | | | | 3,255,046 | |
| | | | |
Shares redeemed | | | (397,378 | ) | | | (6,282,365 | ) | | | (680,358 | ) | | | (10,668,386 | ) |
| | | | | | | | | | | | | | | | |
| | | | |
Net increase (decrease) | | | (1,404 | ) | | | $113,850 | | | | (377,246 | ) | | | $(6,253,622) | |
| | | | | | | | | | | | | | | | |
| | | | |
Class I: | | | | | | | | | | | | | | | | |
| | | | |
Shares sold | | | 1,841,207 | | | | $28,308,530 | | | | 1,270,962 | | | | $19,392,826 | |
| | | | |
Shares issued in reinvestment of distributions | | | 188,381 | | | | 3,125,239 | | | | 101,750 | | | | 1,480,470 | |
| | | | |
Shares redeemed | | | (1,128,271 | ) | | | (18,173,646 | ) | | | (279,075 | ) | | | (4,314,115 | ) |
| | | | | | | | | | | | | | | | |
| | | | |
Net increase | | | 901,317 | | | | $13,260,123 | | | | 1,093,637 | | | | $16,559,181 | |
| | | | | | | | | | | | | | | | |
| | | | |
Class Z: | | | | | | | | | | | | | | | | |
| | | | |
Shares sold | | | 109,971 | | | | $1,690,410 | | | | 446,235 | | | | $6,599,400 | |
| | | | |
Shares issued in reinvestment of distributions | | | 104,585 | | | | 1,699,513 | | | | 100,082 | | | | 1,429,170 | |
| | | | |
Shares redeemed | | | (270,825 | ) | | | (4,292,701 | ) | | | (170,599 | ) | | | (2,632,986 | ) |
| | | | | | | | | | | | | | | | |
| | | | |
Net increase (decrease) | | | (56,269 | ) | | | $(902,778) | | | | 375,718 | | | | $5,395,584 | |
| | | | | | | | | | | | | | | | |
h. REPURCHASE AGREEMENTS AND JOINT REPURCHASE AGREEMENTS
The Fund may enter into third-party and bilateral repurchase agreements for temporary cash management purposes and for reinvestment of cash collateral on securities lending transactions under the securities lending program offered by The Bank of New York Mellon (“BNYM”) (the “Securities Lending Program”) (collectively, “Repurchase Agreements”). The value of the underlying collateral, including accrued interest, must equal or exceed the value of the Repurchase Agreements during the term of the agreement. For joint repurchase agreements, the Fund participates on a pro rata basis with other clients of BNYM in its share of the underlying collateral under such joint repurchase agreements and in its share of proceeds from any repurchase or other disposition of the underlying collateral. The underlying collateral for all Repurchase Agreements is held by the Fund’s custodian or at the Federal Reserve Bank. If the seller defaults and the value of the collateral declines, or if bankruptcy proceedings commence with respect to the seller of the security, realization of the collateral by the Fund may be delayed or limited. Pursuant to the Securities Lending Program, the Fund is indemnified for such losses by BNYM on joint repurchase agreements.
At December 31, 2023, the Fund had no Repurchase Agreements outstanding.
2. AGREEMENTS AND TRANSACTIONS WITH AFFILIATES
The Trust has entered into an investment advisory agreement under which the Investment Manager, a subsidiary and the U.S. wealth platform of Affiliated Managers Group, Inc. (“AMG”), serves as investment manager to the Fund and is responsible for the Fund’s overall administration and operations. The Investment Manager selects and recommends, subject to the approval of the Board and, in certain circumstances, shareholders, the subadviser for the Fund and monitors the subadviser’s investment performance, security holdings and investment strategies. The Fund’s investment portfolio is managed by The Renaissance Group LLC (“Renaissance”) who serves as subadviser pursuant to a subadvisory agreement with the Investment Manager. AMG indirectly owns a majority interest in Renaissance.
Investment management fees are paid directly by the Fund to the Investment Manager based on average daily net assets. For the fiscal year ended December 31, 2023, the Fund paid an investment management fee at the following annual rates of the Fund’s average daily net assets:
19
| | |
| | | Notes to Financial Statements (continued) |
| | | |
| | | |
| | | | |
| |
on the first $50 million | | | 0.55 | % |
| |
on the next $25 million | | | 0.50 | % |
| |
on the next $25 million | | | 0.45 | % |
| |
on balance over $100 million | | | 0.40 | % |
The fee paid to Renaissance for its services as subadviser is paid out of the fee the Investment Manager receives from the Fund and does not increase the expenses of the Fund.
The Investment Manager has contractually agreed, through at least May 1, 2024, to waive management fees and/or pay or reimburse fund expenses in order to limit total annual Fund operating expenses after fee waiver and expense reimbursements (exclusive of taxes, interest (including interest incurred in connection with bank and custody overdrafts, and in connection with securities sold short), shareholder servicing fees, distribution and service (12b-1) fees, brokerage commissions and other transaction costs, dividends payable with respect to securities sold short, acquired fund fees and expenses and extraordinary expenses) of 0.66% of the Fund’s average daily net assets (this annual rate or such other annual rate that may be in effect from time to time, the “Expense Cap”), subject to later reimbursement by the Fund in certain circumstances.
In general, for a period of up to 36 months after the date any amounts are paid, waived or reimbursed by the Investment Manager, the Investment Manager may recover such amounts from the Fund, provided that such repayment would not cause the Fund’s total annual operating expenses after fee waiver and expense reimbursements (exclusive of the items noted in the parenthetical above) to exceed either (i) the Expense Cap in effect at the time such amounts were paid, waived or reimbursed, or (ii) the Expense Cap in effect at the time of such repayment by the Fund.
The contractual expense limitation may only be terminated in the event the Investment Manager or a successor ceases to be the investment manager of the Fund or a successor fund, by mutual agreement between the Investment Manager and the Board, or in the event of the Fund’s liquidation unless the Fund is reorganized or is a party to a merger in which the surviving entity is successor to the accounting and performance information of the Fund.
For the fiscal year ended December 31, 2023, the Investment Manager reimbursed the Fund $149,132, and did not recoup any previously reimbursed expenses. At December 31, 2023, the Fund’s expiration of reimbursements subject to recoupment is as follows:
| | | | |
Expiration Period | | | |
| |
Less than 1 year | | $ | 131,129 | |
| |
1-2 years | | | 145,481 | |
| |
2-3 years | | | 149,132 | |
| | | | |
| |
Total | | $ | 425,742 | |
| | | | |
The Trust, on behalf of the Fund, has entered into an amended and restated Administration Agreement under which the Investment Manager serves as the Fund’s administrator (the “Administrator”) and is responsible for certain aspects of
managing the Fund’s operations, including administration and shareholder services to the Fund. The Fund pays a fee to the Administrator at the rate of 0.15% per annum of the Fund’s average daily net assets for this service.
The Fund is distributed by AMG Distributors, Inc. (the “Distributor”), a wholly-owned subsidiary of the Investment Manager. The Distributor serves as the distributor and underwriter for the Fund and is a registered broker-dealer and member of the Financial Industry Regulatory Authority, Inc. (“FINRA”). Shares of the Fund will be continuously offered and will be sold directly to prospective purchasers and through brokers, dealers or other financial intermediaries who have executed selling agreements with the Distributor. Generally, the Distributor bears all or a portion of the expenses of providing services pursuant to the distribution agreement, including the payment of the expenses relating to the distribution of prospectuses for sales purposes and any advertising or sales literature.
The Trust has adopted a distribution and service plan (the “Plan”) with respect to the Class N shares, in accordance with the requirements of Rule 12b-1 under the 1940 Act and the requirements of the applicable rules of FINRA regarding asset-based sales charges. Pursuant to the Plan, the Fund may make payments to the Distributor for its expenditures in financing any activity primarily intended to result in the sale of the Fund’s Class N shares and for maintenance and personal service provided to existing shareholders of that class. The Plan authorizes payments to the Distributor up to 0.25% annually of the Fund’s average daily net assets attributable to the Class N shares.
For each of the Class N and Class I shares, the Board has approved reimbursement payments to the Investment Manager for shareholder servicing expenses (“shareholder servicing fees”) incurred. Shareholder servicing fees include payments to financial intermediaries, such as broker-dealers (including fund supermarket platforms), banks, and trust companies who provide shareholder recordkeeping, account servicing and other services. The Class N and Class I shares may reimburse the Investment Manager for the actual amount incurred up to a maximum annual rate of each Class’s average daily net assets as shown in the table below. Effective December 31, 2022, the Investment Manager agreed, through December 31, 2023, to waive a portion of shareholder servicing fees paid by Class I as necessary to ensure the fees were limited to 0.07%. On December 31, 2023, the Investment Manager agreed to renew the waiver through December 31, 2024.
The impact on the annualized expense ratios for the fiscal year ended December 31, 2023, was as follows:
| | | | | | | | | | |
| | | Maximum Annual
Amount
Approved | | | Actual
Amount
Incurred | | | |
| | | |
Class N | | | 0.15 | % | | | 0.09 | % | | |
| | | |
Class I | | | 0.15 | % | | | 0.07 | % | | |
The Board provides supervision of the affairs of the Trust and other trusts within the AMG Funds Family. The Trustees of the Trust who are not affiliated with the Investment Manager receive an annual retainer and per meeting fees for regular, special and telephonic meetings, and they are reimbursed for out-of-pocket expenses incurred while carrying out their duties as Board members. The Chairman of the Board and the Audit Committee Chair receive additional annual retainers. On October 10, 2023, the shareholders of the Trust elected Trustees, including two new Trustees who are not “interested persons” of the Fund within
20
| | |
| | | Notes to Financial Statements (continued) |
| | | |
| | | |
the meaning of the 1940 Act. Certain Trustees and Officers of the Fund are Officers and/or Directors of the Investment Manager, AMG and/or the Distributor.
The Securities and Exchange Commission (the “SEC”) granted an exemptive order that permits certain eligible funds in the AMG Funds Family to lend and borrow money for certain temporary purposes directly to and from other eligible funds in the AMG Funds Family. Participation in this interfund lending program is voluntary for both the borrowing and lending funds, and an interfund loan is only made if it benefits each participating fund. The Administrator manages the program according to procedures approved by the Board, and the Board monitors the operation of the program. An interfund loan must comply with certain conditions set out in the exemptive order, which are designed to assure fairness and protect all participating funds. The interest earned and interest paid on interfund loans are included on the Statement of Operations as interest income and interest expense, respectively. At December 31, 2023, the Fund had no interfund loans outstanding.
The Fund utilized the interfund loan program during the fiscal year ended December 31, 2023 as follows:
| | | | | | | | | | | | | | |
| | | Average
Lent | | Number
of Days | | | Interest
Earned | | | Average
Interest Rate | |
| | | | |
| | $2,007,897 | | | 1 | | | | $287 | | | | 5.208% | |
| | | | | | | | | | | | | | |
| | | Average
Borrowed | | Number
of Days | | | Interest
Paid | | | Average
Interest Rate | |
| | | | |
| | $2,307,515 | | | 2 | | | | $759 | | | | 6.000% | |
3. PURCHASES AND SALES OF SECURITIES
Purchases and sales of securities (excluding short-term securities and U.S. Government Obligations) for the fiscal year ended December 31, 2023, were $44,308,330 and $41,652,547, respectively.
The Fund had no purchases or sales of U.S. Government Obligations during the fiscal year ended December 31, 2023.
4. PORTFOLIO SECURITIES LOANED
The Fund participates in the Securities Lending Program providing for the lending of securities to qualified borrowers. Securities lending income includes earnings of such temporary cash investments, plus or minus any rebate to a borrower. These earnings (after any rebate) are then divided between BNYM, as a fee for its services under the Securities Lending Program, and the Fund, according to agreed-upon rates. Collateral on all securities loaned is accepted in cash, U.S. Treasury Obligations or U.S. Government Agency Obligations. Collateral is maintained at a minimum level of 102% (105% in the case of certain foreign securities) of the market value, plus interest, if applicable, of investments on loan. It is the Fund’s policy to obtain additional collateral from or return excess collateral to the borrower by the end of the next business day, following the valuation date of
the securities loaned. Therefore, the value of the collateral held may be temporarily less than the value of the securities on loan. Lending securities entails a risk of loss to the Fund if and to the extent that the market value of the securities loaned were to increase and the borrower did not increase the collateral accordingly, and the borrower fails to return the securities. Under the terms of the Securities Lending Program, the Fund is indemnified for such losses by BNYM. Cash collateral is held in separate omnibus accounts managed by BNYM, who is authorized to exclusively enter into joint repurchase agreements for that cash collateral. Securities collateral is held in separate omnibus accounts managed by BNYM and cannot be sold or pledged. BNYM bears the risk of any deficiency in the amount of the cash collateral available for return to the borrower due to any loss on the collateral invested. Loans of securities are terminable at any time and the borrower, after notice, is required to return borrowed securities as soon as practical, which is normally within three business days.
The Funds did not have any securities on loan at December 31, 2023.
5. COMMITMENTS AND CONTINGENCIES
Under the Trust’s organizational documents, its Trustees and Officers are indemnified against certain liabilities arising out of the performance of their duties to the Trust. In addition, in the normal course of business, the Fund may enter into contracts and agreements that contain a variety of representations and warranties, which provide general indemnifications. The maximum exposure to the Fund under these arrangements is unknown, as this would involve future claims that may be made against the Fund that have not yet occurred. However, based on experience, the Fund had no prior claims or losses and expects the risks of loss to be remote.
6. MASTER NETTING AGREEMENTS
The Fund may enter into master netting agreements with its counterparties for the Securities Lending Program and Repurchase Agreements, which provide the right, in the event of default (including bankruptcy or insolvency) for the non-defaulting party to liquidate the collateral and calculate net exposure to the defaulting party or request additional collateral. For financial reporting purposes, the Fund does not offset financial assets and financial liabilities that are subject to master netting agreements in the Statement of Assets and Liabilities. For securities lending transactions, see Note 4. At December 31, 2023, the Fund had no Repurchase Agreements outstanding.
7. SUBSEQUENT EVENTS
The Fund has determined that no material events or transactions occurred through the issuance date of the Fund’s financial statements which require an additional disclosure in or adjustment of the Fund’s financial statements.
21
| | |
| | | Report of Independent Registered Public Accounting Firm |
| | | |
| | | |
To the Board of Trustees of AMG Funds and Shareholders of AMG Renaissance Large Cap Growth Fund
Opinion on the Financial Statements
We have audited the accompanying statement of assets and liabilities, including the schedule of portfolio investments, of AMG Renaissance Large Cap Growth Fund (one of the funds constituting AMG Funds, referred to hereafter as the “Fund”) as of December 31, 2023, the related statement of operations for the year ended December 31, 2023, the statements of changes in net assets for each of the two years in the period ended December 31, 2023, including the related notes, and the financial highlights for each of the five years in the period ended December 31, 2023 (collectively referred to as the “financial statements”). In our opinion, the financial statements present fairly, in all material respects, the financial position of the Fund as of December 31, 2023, the results of its operations for the year then ended, the changes in its net assets for each of the two years in the period ended December 31, 2023 and the financial highlights for each of the five years in the period ended December 31, 2023 in conformity with accounting principles generally accepted in the United States of America.
Basis for Opinion
These financial statements are the responsibility of the Fund’s management. Our responsibility is to express an opinion on the Fund’s financial statements based on our audits. We are a public accounting firm registered with the Public Company Accounting Oversight Board (United States) (PCAOB) and are required to be independent with respect to the Fund in accordance with the U.S. federal securities laws and the applicable rules and regulations of the Securities and Exchange Commission and the PCAOB.
We conducted our audits of these financial statements in accordance with the standards of the PCAOB. Those standards require that we plan and perform the audit to obtain reasonable assurance about whether the financial statements are free of material misstatement, whether due to error or fraud.
Our audits included performing procedures to assess the risks of material misstatement of the financial statements, whether due to error or fraud, and performing procedures that respond to those risks. Such procedures included examining, on a test basis, evidence regarding the amounts and disclosures in the financial statements. Our audits also included evaluating the accounting principles used and significant estimates made by management, as well as evaluating the overall presentation of the financial statements. Our procedures included confirmation of securities owned as of December 31, 2023 by correspondence with the custodian. We believe that our audits provide a reasonable basis for our opinion.
/s/ PricewaterhouseCoopers LLP
Boston, Massachusetts
February 27, 2024
We have served as the auditor of one or more investment companies in the AMG Funds Family since 1993.
22
| | |
| | | Other Information (unaudited) |
| | | |
| | | |
TAX INFORMATION
AMG Renaissance Large Cap Growth Fund hereby designates the maximum amount allowable of its net taxable income as qualified dividends as provided in the Jobs and Growth Tax Relief Reconciliation Act of 2003. The 2023 Form 1099-DIV you receive for the Fund will show the tax status of all distributions paid to you during the year.
Pursuant to section 852 of the Internal Revenue Code, AMG Renaissance Large Cap Growth Fund hereby designates $9,170,218 as a capital gain distribution with respect to the taxable fiscal year ended December 31, 2023, or if subsequently determined to be different, the net capital gains of such year.
PROXY VOTE
A special meeting of the shareholders of AMG Funds (the “Trust”) was held on October 10, 2023, to vote on a proposal to elect trustees to the Board of Trustees of the Trust. The proposal and results of the vote are described below. Jill R. Cuniff, Kurt A. Keilhacker, Peter W. MacEwen, Steven J. Paggioli, Eric Rakowski, Victoria L. Sassine and Garret W. Weston were elected by shareholders at the special meeting on October 10, 2023. Bruce B. Bingham, an incumbent Trustee, served as a Trustee of the Trust until his retirement on December 31, 2023.
| | | | | | |
| AMG Funds | | All Funds in Trust* |
| | | |
| Election of Trustees 1 | | For | | Withheld | | |
| | | |
Jill R. Cuniff | | 523,453,201 | | 50,330,270 | | |
| | | |
Kurt A. Keilhacker | | 563,642,997 | | 10,140,474 | | |
| | | |
Peter W. MacEwen | | 523,551,974 | | 50,231,497 | | |
| | | |
Steven J. Paggioli | | 561,225,673 | | 12,557,798 | | |
| | | |
Eric Rakowski | | 561,230,560 | | 12,552,911 | | |
| | | |
Victoria L. Sassine | | 563,668,874 | | 10,114,597 | | |
| | | |
Garret W. Weston | | 564,280,150 | | 9,503,321 | | |
1 Ms. Cuniff and Mr. MacEwen were newly elected to the Board of Trustees on October 10, 2023; Messrs. Keilhacker, Paggioli, Rakowski, and Weston and Ms. Sassine are incumbent Trustees.
*Rounded to the nearest share.
23
| | |
| | | AMG Funds Trustees and Officers |
| | | |
| | | |
| | | | | | | | |
| The Trustees and Officers of the Trust, their business addresses, principal occupations for the past five years and ages are listed below. The Trustees provide broad supervision over the affairs of the Trust and the Fund. The Trustees are experienced executives who meet periodically throughout the year to oversee the Fund’s activities, review contractual arrangements with companies that provide services to the Fund, and | | | | review the Fund’s performance. Unless otherwise noted, the address of each Trustee or Officer is the address of the Trust: 680 Washington Blvd., Suite 500, Stamford, CT. 06901. There is no stated term of office for Trustees. Trustees serve until their resignation, retirement or removal in accordance with the Trust’s organizational documents and policies adopted by the Board from time to time. | | | | The Chairman of the Board, the President, the Treasurer and the Secretary and such other Officers as the Trustees may in their discretion from time to time elect each hold office until his or her successor is elected and qualified, or until he or she sooner dies, resigns, is removed or becomes disqualified. Each Officer holds office at the pleasure of the Trustees. |
| | | | | | | | | |
Independent Trustees
The following Trustees are not “interested persons” of the Trust within the meaning of the 1940 Act:
| | |
Number of Funds Overseen in Fund Complex | | Name, Age, Principal Occupation(s) During Past 5 Years and Other Directorships Held by Trustee |
| | |
• Trustee since 2012 • Oversees 37 Funds in Fund Complex | | Bruce B. Bingham, 75* Partner, Hamilton Partners (real estate development firm) (1987-Present); Director of The Yacktman Funds, Inc. (2 portfolios) (2000-2012). |
| | |
• Trustee since 2023 • Oversees 37 Funds in Fund Complex | | Jill R. Cuniff, 59** Director of Harding, Loevner Funds, Inc. (12 portfolios) (2018-Present); Retired (2016-Present); President & Portfolio Manager, Edge Asset Management (2009-2016); President & Chief Investment Officer, Morley Financial Services (2001-2009); President, Union Bond & Trust Company (2001-2009). |
| | |
• Trustee since 2013 • Chairman of the Audit Committee since 2021 • Oversees 39 Funds in Fund Complex | | Kurt A. Keilhacker, 60 Managing Partner, Elementum Ventures (2013-Present); Managing Partner, TechFund Europe (2000-Present); Managing Partner, TechFund Capital (1997-Present); Adjunct Professor, University of San Francisco
(2022-Present); Trustee, Wheaton College (2018-Present); Director, Wheaton College Trust Company, N.A.
(2018-Present). |
| | |
• Trustee since 2023 • Oversees 37 Funds in Fund Complex | | Peter W. MacEwen, 59** Private investor (2019-Present); Affiliated Managers Group, Inc. (2003-2018): Chief Administrative Officer, Office of the CEO (2013-2018); Senior Vice President, Finance (2007-2013); Vice President, Finance (2003-2007). |
| | |
• Trustee since 2004 • Oversees 37 Funds in Fund Complex | | Steven J. Paggioli, 73 Independent Consultant (2002-Present); Trustee, Professionally Managed Portfolios (28 portfolios); Independent Director, Muzinich BDC, Inc. (business development company) (2019-Present); Director, The Wadsworth Group; Independent Director, Chase Investment Counsel (2008–2019); Executive Vice President, Secretary and Director, Investment Company Administration, LLC and First Fund Distributors, INC.
(1990-2001). |
| | |
• Independent Chairman of the Board of Trustees since 2017 • Chairman of the Governance Committee since 2017 • Trustee since 1999 • Oversees 39 Funds in Fund Complex | | Eric Rakowski, 65 Professor of Law, University of California at Berkeley School of Law (1990-Present); Tax Attorney at Davis Polk & Wardwell and clerked for Judge Harry T. Edwards of the U.S. Court of Appeals for the District of Columbia Circuit and for Justice William J. Brennan Jr. of the U.S. Supreme Court; Trustee of Parnassus Funds (4 portfolios) (2021-Present); Trustee of Parnassus Income Funds (2 portfolios) (2021-Present); Director of Harding, Loevner Funds, Inc. (10 portfolios); Trustee of Third Avenue Trust (3 portfolios) (2002-2019); Trustee of Third Avenue Variable Trust (1 portfolio) (2002-2019). |
| | |
• Trustee since 2013 • Oversees 39 Funds in Fund Complex | | Victoria L. Sassine, 58 Adjunct Professor, Babson College (2007–Present); Director, Board of Directors, PRG Group (2017-Present); CEO, Founder, Scale Smarter Partners, LLC (2018-Present); Adviser, EVOFEM Biosciences (2019-Present); Chairperson of the Board of Directors of Business Management Associates (2018-2019). |
*Mr. Bingham retired from the Board of Trustees of AMG Funds on December 31, 2023.
**Ms. Cuniff and Mr. MacEwen were elected to the Board of Trustees by the shareholders of AMG Funds on October 10, 2023.
24
| | |
| | | AMG Funds Trustees and Officers (continued) |
| | | |
| | | |
Interested Trustee
The Trustee in the following table is an “interested person” of the Trust within the meaning of the 1940 Act.
| | |
Number of Funds Overseen in Fund Complex | | Name, Age, Principal Occupation(s) During Past 5 Years and Other Directorships Held by Trustee |
| | |
• Trustee since 2021 • Oversees 39 Funds in Fund Complex | | Garret W. Weston, 42 Affiliated Managers Group, Inc. (2008-Present): Managing Director, Head of Affiliate Product Strategy and Development (2023-Present), Managing Director, Co-Head of Affiliate Engagement, Distribution (2021-2022), Senior Vice President, Office of the CEO (2019-2021), Senior Vice President, Affiliate Development (2016-2019), Vice President, Office of the CEO (2015-2016), Vice President, New Investments (2008-2015); Associate, Madison Dearborn Partners (2006-2008); Analyst, Merrill Lynch (2004-2006). |
Officers
| | |
Position(s) Held with Fund and Length of Time Served | | Name, Age, Principal Occupation(s) During Past 5 Years |
| | |
• President since 2018 • Principal Executive Officer since 2018 • Chief Executive Officer since 2018 • Chief Operating Officer since 2007 | | Keitha L. Kinne, 65 Managing Director, Head of Platform and Operations, AMG Funds LLC (2023-Present); Chief Operating Officer, AMG Funds LLC (2007-Present); Chief Investment Officer, AMG Funds LLC (2008-Present); President and Principal, AMG Distributors, Inc. (2018-Present); Chief Operating Officer, AMG Distributors, Inc. (2007-Present); President, Chief Executive Officer and Principal Executive Officer, AMG Funds, AMG Funds I, AMG Funds II, AMG Funds III and AMG Funds IV (2018-Present); Chief Operating Officer, AMG Funds, AMG Funds I, AMG Funds II, and AMG Funds III (2007-Present); Chief Operating Officer, AMG Funds IV (2016-Present); Chief Operating Officer and Chief Investment Officer, Aston Asset Management, LLC (2016); President and Principal Executive Officer, AMG Funds, AMG Funds I, AMG Funds II and AMG Funds III (2012-2014); Managing Partner, AMG Funds LLC (2007-2014); President and Principal, AMG Distributors, Inc. (2012-2014); Managing Director, Legg Mason & Co., LLC (2006-2007); Managing Director, Citigroup Asset Management (2004-2006). |
| | |
• Secretary since 2015 • Chief Legal Officer since 2015 | | Mark J. Duggan, 58 Managing Director and Senior Counsel, AMG Funds LLC (2021-Present); Senior Vice President and Senior Counsel, AMG Funds LLC (2015-2021); Secretary and Chief Legal Officer, AMG Funds, AMG Funds I, AMG Funds II, AMG Funds III and AMG Funds IV (2015-Present); Attorney, K&L Gates, LLP (2009-2015). |
| | |
• Chief Financial Officer since 2017 • Treasurer since 2017 • Principal Financial Officer since 2017 • Principal Accounting Officer since 2017 | | Thomas G. Disbrow, 57 Vice President, Mutual Fund Treasurer & CFO, AMG Funds, AMG Funds LLC (2017-Present); Chief Financial Officer, Principal Financial Officer, Treasurer and Principal Accounting Officer, AMG Funds, AMG Funds I, AMG Funds II, AMG Funds III and AMG Funds IV (2017-Present); Managing Director - Global Head of Traditional Funds Product Control, UBS Asset Management (Americas), Inc. (2015-2017); Managing Director - Head of North American Funds Treasury, UBS Asset Management (Americas), Inc. (2011-2015). |
| | |
• Deputy Treasurer since 2017 | | John A. Starace, 53 Vice President, Mutual Fund Accounting, AMG Funds LLC (2021-Present); Director, Mutual Fund Accounting, AMG Funds LLC (2017-2021); Vice President, Deputy Treasurer of Mutual Funds Services, AMG Funds LLC (2014-2017); Deputy Treasurer, AMG Funds, AMG Funds I, AMG Funds II, AMG Funds III and AMG Funds IV (2017-Present); Vice President, Citi Hedge Fund Services (2010-2014); Audit Senior Manager (2005-2010) and Audit Manager (2001-2005), Deloitte & Touche LLP. |
| | |
• Chief Compliance Officer and Sarbanes-Oxley Code of Ethics Compliance Officer since 2019 • Anti-Money Laundering Compliance Officer since 2022 | | Patrick J. Spellman, 49 Vice President, Chief Compliance Officer, AMG Funds LLC (2017-Present); Chief Compliance Officer, AMG Distributors, Inc. (2010-Present); Chief Compliance Officer and Sarbanes-Oxley Code of Ethics Compliance Officer, AMG Funds, AMG Funds I, AMG Funds II, AMG Funds III and AMG Funds IV (2019-Present); Anti-Money Laundering Compliance Officer, AMG Funds, AMG Funds I, AMG Funds II, and AMG Funds III (2014-2019; 2022-Present); Anti-Money Laundering Compliance Officer, AMG Funds IV (2016-2019; 2022-Present); Senior Vice President, Chief Compliance Officer, AMG Funds LLC (2011-2017); Compliance Manager, Legal and Compliance, Affiliated Managers Group, Inc. (2005-2011). |
| | |
• Assistant Secretary since 2016 | | Maureen M. Kerrigan, 38 Vice President, Senior Counsel, AMG Funds LLC (2021-Present); Vice President, Counsel, AMG Funds LLC (2019-2021); Director, Counsel, AMG Funds LLC (2017-2018); Vice President, Counsel, AMG Funds LLC (2015-2017); Assistant Secretary, AMG Funds, AMG Funds I, AMG Funds II, AMG Funds III and AMG Funds IV (2016-Present); Associate, Ropes & Gray LLP (2011-2015); Law Fellow, Massachusetts Appleseed Center for Law and Justice (2010-2011). |
25
THIS PAGE INTENTIONALLY LEFT BLANK
THIS PAGE INTENTIONALLY LEFT BLANK
THIS PAGE INTENTIONALLY LEFT BLANK
| | |
| | |
| | | |
| | | |
| | | | | | | | | | | | |
INVESTMENT MANAGER AND ADMINISTRATOR AMG Funds LLC 680 Washington Blvd., Suite 500 Stamford, CT 06901 800.548.4539 DISTRIBUTOR AMG Distributors, Inc. 680 Washington Blvd., Suite 500 Stamford, CT 06901 800.548.4539 SUBADVISER The Renaissance Group LLC 50 East RiverCenter Boulevard Suite 1200 Covington, KY 41011 | | | | | | CUSTODIAN The Bank of New York Mellon Mutual Funds Custody 6023 Airport Road Oriskany, NY 13424 LEGAL COUNSEL Ropes & Gray LLP Prudential Tower, 800 Boylston Street Boston, MA 02199-3600 TRANSFER AGENT BNY Mellon Investment Servicing (US) Inc. AMG Funds Attn: 534426 AIM 154-0520 500 Ross Street Pittsburgh, PA 15262 800.548.4539 | | | | | | This report is prepared for the Fund’s shareholders. It is authorized for distribution to prospective investors only when preceded or accompanied by an effective prospectus. To receive a free copy of the prospectus or Statement of Additional Information, which includes additional information about Fund Trustees, please contact us by calling 800.548.4539. Distributed by AMG Distributors, Inc., member FINRA/SIPC. Current net asset values per share for the Fund are available on the Fund’s website at wealth.amg.com. A description of the policies and procedures the Fund uses to vote its proxies is available: (i) without charge, upon request, by calling 800.548.4539, or (ii) on the Securities and Exchange Commission’s (SEC) website at sec.gov. For information regarding the Fund’s proxy voting record for the 12-month period ended June 30, call 800.548.4539 or visit the SEC website at sec.gov. The Fund files its complete schedule of portfolio holdings with the SEC for the first and third quarters of each fiscal year as an exhibit to its reports on Form N-PORT. The Fund’s portfolio holdings on Form N-PORT are available on the SEC’s website at sec.gov and the Fund’s website at wealth.amg.com. To review a complete list of the Fund’s portfolio holdings, or to view the most recent semi-annual report or annual report, please visit wealth.amg.com. |
| | |
| | |
| | | |
| | | |
| | | | | | | | | | | | |
EQUITY FUNDS AMG Beutel Goodman International Equity Beutel, Goodman & Company Ltd. AMG Boston Common Global Impact Boston Common Asset Management, LLC AMG Frontier Small Cap Growth Frontier Capital Management Co., LLC AMG GW&K Small Cap Core AMG GW&K Small Cap Value AMG GW&K Small/Mid Cap Core AMG GW&K Small/Mid Cap Growth AMG GW&K International Small Cap GW&K Investment Management, LLC AMG Montrusco Bolton Large Cap Growth Montrusco Bolton Investments, Inc. AMG Renaissance Large Cap Growth The Renaissance Group LLC | | | | | | AMG River Road Dividend All Cap Value AMG River Road Focused Absolute Value AMG River Road Large Cap Value Select AMG River Road Mid Cap Value AMG River Road Small-Mid Cap Value AMG River Road Small Cap Value River Road Asset Management, LLC AMG TimesSquare Emerging Markets Small Cap AMG TimesSquare Global Small Cap AMG TimesSquare International Small Cap AMG TimesSquare Mid Cap Growth AMG TimesSquare Small Cap Growth TimesSquare Capital Management, LLC AMG Veritas Asia Pacific AMG Veritas China AMG Veritas Global Focus AMG Veritas Global Real Return Veritas Asset Management LLP AMG Yacktman AMG Yacktman Focused AMG Yacktman Global AMG Yacktman Special Opportunities Yacktman Asset Management LP | | | | | | FIXED INCOME FUNDS AMG Beutel Goodman Core Plus Bond Beutel, Goodman & Company Ltd. AMG GW&K Core Bond ESG AMG GW&K Enhanced Core Bond ESG AMG GW&K ESG Bond AMG GW&K High Income AMG GW&K Municipal Bond AMG GW&K Municipal Enhanced Yield GW&K Investment Management, LLC |
| | | | |
| wealth.amg.com | | | | 123123 AR024 |

| | | | |
| | | AMG Funds December 31, 2023 |
| | |  |
| | |
| | | AMG Yacktman Fund |
| | |
| | | Class I: YACKX |
| | |
| | | AMG Yacktman Focused Fund |
| | | |
| | | Class N: YAFFX | | Class I: YAFIX |
| | |
| | | AMG Yacktman Global Fund |
| | | |
| | | Class N: YFSNX | | Class I: YFSIX |
| | |
| | | AMG Yacktman Special Opportunities Fund |
| | | |
| | | Class I: YASSX | | Class Z: YASLX |
| | |
| | | |
| | | |
| | | | | |
| | | | |
| wealth.amg.com | | | | 123123 AR071 |
| | |
| | | AMG Funds Annual Report — December 31, 2023 |
| | | | | | |
| | |
| | | | | | | |
| | | TABLE OF CONTENTS | | PAGE | |
| | | | |
| | | LETTER TO SHAREHOLDERS | | | 2 | |
| | | |
| | | ABOUT YOUR FUND’S EXPENSES | | | 3 | |
| | | |
| | | PORTFOLIO MANAGER’S COMMENTS, FUND SNAPSHOTS AND SCHEDULES OF PORTFOLIO INVESTMENTS | | | | |
| | | |
| | | AMG Yacktman Fund | | | 4 | |
| | | |
| | | AMG Yacktman Focused Fund | | | 11 | |
| | | |
| | | AMG Yacktman Global Fund | | | 19 | |
| | | |
| | | AMG Yacktman Special Opportunities Fund | | | 26 | |
| | | |
| | | FINANCIAL STATEMENTS | | | | |
| | | |
| | | Statement of Assets and Liabilities | | | 34 | |
| | | |
| | | Balance sheets, net asset value (NAV) per share computations
and cumulative distributable earnings (loss) | | | | |
| | | |
| | | Statement of Operations | | | 36 | |
| | | |
| | | Detail of sources of income, expenses, and realized and
unrealized gains (losses) during the fiscal year | | | | |
| | | |
| | | Statements of Changes in Net Assets | | | 37 | |
| | | |
| | | Detail of changes in assets for the past two fiscal years | | | | |
| | | |
| | | Financial Highlights | | | 39 | |
| | | |
| | | Historical net asset values per share, distributions, total returns, income
and expense ratios, turnover ratios and net assets | | | | |
| | | |
| | | Notes to Financial Statements | | | 46 | |
| | | |
| | | Accounting and distribution policies, details of agreements and
transactions with Fund management and affiliates, and descriptions of
certain investment risks | | | | |
| | | |
| | | REPORT OF INDEPENDENT REGISTERED PUBLIC ACCOUNTING FIRM | | | 55 | |
| | | |
| | | OTHER INFORMATION | | | 56 | |
| | | |
| | | TRUSTEES AND OFFICERS | | | 57 | |
| | | |
| | | | | | | |
|
Nothing contained herein is to be considered an offer, sale or solicitation of an offer to buy shares of any series of the AMG Funds Family of Funds. Such offering is made only by prospectus, which includes details as to offering price and other material information. | |
| | |
 | | Letter to Shareholders |
Dear Shareholder:
We are pleased to provide this annual report for your investment with AMG Funds. Our foremost goal is to provide investment solutions that help our shareholders successfully achieve their long-term investment goals. We appreciate the privilege of providing you with investment tools.
Throughout most of the year, markets wrestled with uncertainties around tighter monetary policy, increased geopolitical tension, instability in the regional banking sector, and political handwringing over the U.S. debt ceiling. However, investors remained optimistic for an economic “soft landing” as inflation continued to ease and risk assets finally surged in the fourth quarter following a dovish pivot in the U.S. Federal Reserve (the “Fed”) policy. Bonds finished with a positive return; a remarkable development after struggling to move higher for most of the year as global central banks raised interest rates.
The S&P 500® Index gained 26.29% for the fiscal year ended December 31, 2023, fully recouping losses suffered in 2022. Large-cap stocks diverged from small-cap stocks, particularly driven by a handful of mega-cap technology and consumer discretionary stocks. The Russell 1000® Index gained 26.53% compared to the 16.93% return for the Russell 2000® Index. Nine out of eleven sectors posted positive returns, with information technology (60.93%), communication services (55.86%), and consumer discretionary (43.22%) leading the way. The weakest sectors were utilities (-7.08%), energy (-1.33%), and consumer staples (+0.55%). The strength in information technology drove growth stocks to strongly outperform value stocks with the Russell 1000® Growth Index gaining 42.68% compared to a 11.46% return for the Russell 1000® Value Index. Outside the U.S., foreign equity markets underperformed domestic equities, delivering a 15.62% return, as measured by the MSCI All Country World Index ex USA benchmark.
The Bloomberg U.S. Aggregate Bond Index, a broad measure of U.S. bond market performance, rebounded with a 5.53% return over the period. The 10-year Treasury yield climbed to post-GFC (Global Financial Crisis) highs through October as the Fed tightened policy throughout the year, leading many to expect another year of negative bond returns. However, investors received much needed relief as interest rates fell sharply in the final two months of the year following the Fed’s message signaling rate cuts in 2024. Looking across the broadest sectors of the market, investment-grade corporate bonds gained 8.52% for the year, while agency mortgage-backed securities rose 5.05%. High yield bonds were the best performing sector with a 13.44% return as measured by the return of the Bloomberg U.S. Corporate High Yield Bond Index. Municipal bonds outperformed the broader market with a 6.40% gain for the Bloomberg Municipal Bond Index. Outside the U.S., foreign bonds were also positive as the Bloomberg Global Aggregate ex-USD Index gained 5.72%.
AMG Funds provides access to a distinctive array of actively managed return-oriented investment strategies. You can rest assured that under all market conditions our team is focused on delivering excellent investment management services for your benefit. For more information about AMG Funds’ wide range of products and resources, please visit wealth.amg.com. We thank you for your investment and continued trust in AMG Funds.
Respectfully,

Keitha Kinne
President
AMG Funds
| | | | | | | | | | | | | | |
| | | | | Periods ended | |
| Average Annual Total Returns | | December 31, 2023* | |
| | | | |
| Stocks: | | | | 1 Year | | | 3 Years | | | 5 Years | |
| | | | |
Large Cap | | (S&P 500® Index) | | | 26.29 | % | | | 10.00 | % | | | 15.69 | % |
| | | | |
Small Cap | | (Russell 2000® Index) | | | 16.93 | % | | | 2.22 | % | | | 9.97 | % |
| | | | |
International | | (MSCI ACWI ex USA) | | | 15.62 | % | | | 1.55 | % | | | 7.08 | % |
| | | | |
Bonds: | | | | | | | | | | | | | | |
| | | | |
Investment Grade | | (Bloomberg U.S. Aggregate Bond Index) | | | 5.53 | % | | | (3.31 | )% | | | 1.10 | % |
| | | | |
High Yield | | (Bloomberg U.S. Corporate High Yield Bond Index) | | | 13.44 | % | | | 1.98 | % | | | 5.37 | % |
| | | | |
Tax-exempt | | (Bloomberg Municipal Bond Index) | | | 6.40 | % | | | (0.40 | )% | | | 2.25 | % |
| | | | |
Treasury Bills | | (ICE BofAML U.S. 6-Month Treasury Bill Index) | | | 5.14 | % | | | 2.17 | % | | | 2.02 | % |
*Source: FactSet. Past performance is no guarantee of future results.
2
| | |
| | | About Your Fund’s Expenses |
| | | |
| | | |
| | | | | | | | |
As a shareholder of a Fund, you may incur two types of costs: (1) transaction costs, which may include sales charges (loads) on purchase payments; redemption fees; and exchange fees; and (2) ongoing costs, including management fees; distribution (12b-1) fees; and other Fund expenses. This example is intended to help you understand your ongoing costs (in dollars) of investing in the Fund and to compare these costs with the ongoing costs of investing in other mutual funds. The example is based on $1,000 invested at the beginning of the period and held for the entire period as indicated below. ACTUAL EXPENSES The first section of the following table provides information about the actual account values and | | | | actual expenses. You may use the information in this section, together with the amount you invested, to estimate the expenses that you paid over the period. Simply divide your account value by $1,000 (for example, an $8,600 account value divided by $1,000 = 8.6), then multiply the result by the number in the first section under the heading entitled “Expenses Paid During the Period” to estimate the expenses you paid on your account during this period. HYPOTHETICAL EXAMPLE FOR COMPARISON PURPOSES The second section of the following table provides information about hypothetical account values and hypothetical expenses based on the Fund’s actual expense ratio and an assumed annual rate of return of 5% before expenses, which is not the Fund’s | | | | actual return. The hypothetical account values and expenses may not be used to estimate the actual ending account balance or expenses you paid for the period. You may use this information to compare the ongoing costs of investing in the Fund and other funds by comparing this 5% hypothetical example with the 5% hypothetical examples that appear in the shareholder reports of other funds. Please note that the expenses shown in the table are meant to highlight your ongoing costs only and do not reflect any transactional costs, such as sales charges (loads), redemption fees, or exchange fees. Therefore, the second section of the table is useful in comparing ongoing costs only, and will not help you determine the relative total costs of owning different funds. |
| | | | | | | | | | |
Six Months Ended December 31, 2023 | | Expense Ratio for the Period | | Beginning Account Value 07/01/23 | | Ending Account Value 12/31/23 | | | Expenses Paid During the Period* |
|
AMG Yacktman Fund |
|
Based on Actual Fund Return |
Class I | | 0.70% | | $1,000 | | | $1,088 | | | $3.68 |
|
Based on Hypothetical 5% Annual Return |
Class I | | 0.70% | | $1,000 | | | $1,022 | | | $3.57 |
|
AMG Yacktman Focused Fund |
|
Based on Actual Fund Return |
Class N | | 1.25% | | $1,000 | | | $1,087 | | | $6.57 |
Class I | | 1.06% | | $1,000 | | | $1,088 | | | $5.58 |
|
Based on Hypothetical 5% Annual Return |
Class N | | 1.25% | | $1,000 | | | $1,019 | | | $6.36 |
Class I | | 1.06% | | $1,000 | | | $1,020 | | | $5.40 |
|
AMG Yacktman Global Fund |
|
Based on Actual Fund Return |
Class N | | 1.13% | | $1,000 | | | $1,094 | | | $5.97 |
Class I | | 0.93% | | $1,000 | | | $1,095 | | | $4.91 |
|
Based on Hypothetical 5% Annual Return |
Class N | | 1.13% | | $1,000 | | | $1,020 | | | $5.75 |
Class I | | 0.93% | | $1,000 | | | $1,021 | | | $4.74 |
| | | | | | | | | | |
Six Months Ended December 31, 2023 | | Expense Ratio for the Period | | Beginning Account Value 07/01/23 | | Ending Account Value 12/31/23 | | | Expenses Paid During the Period* |
|
AMG Yacktman Special Opportunities Fund |
|
Based on Actual Fund Return |
Class I | | 1.34%† | | $1,000 | | | $1,018 | | | $6.82 |
Class Z | | 1.24%† | | $1,000 | | | $1,019 | | | $6.31 |
|
Based on Hypothetical 5% Annual Return |
Class I | | 1.34%† | | $1,000 | | | $1,018 | | | $6.82 |
Class Z | | 1.24%† | | $1,000 | | | $1,019 | | | $6.31 |
| † | Includes a performance fee adjustment amounting to (0.40)% of average daily net assets which is not annualized. (See Note 2 of Notes to Financial Statements.) |
| * | Expenses are equal to the Fund’s annualized expense ratio multiplied by the average account value over the period, multiplied by the number of days in the most recent fiscal half-year (184), then divided by 365. |
3
| | |
| | | AMG Yacktman Fund Portfolio Manager’s Comments (unaudited) |
| | | |
| | | |
| | | | | | | | |
For the 12 months ending December 31, 2023, the AMG Yacktman Fund (the “Fund”) Class I shares returned 15.39%, outperforming the 11.46% return of the Russell 1000® Value Index and lagging the 26.29% return of the S&P 500® Index. In many ways, 2023 was the mirror image of 2022. Although the Fund’s Class I shares lagged relative to the S&P 500® Index in 2023, it outperformed the S&P 500® Index on a two-year basis, returning a cumulative 6.89% versus the 3.42% cumulative return of the S&P 500® Index. We believe that our commitment to mitigating capital loss in a down market led to the outperformance over the two years despite the strong finish for the Russell 1000® Value Index and the broader S&P 500® Index in 2023. Contributors and Detractors Contributors to the year’s performance include Microsoft and Alphabet. These technology companies benefited from the enthusiasm in the market for artificial intelligence (“AI”) and represent two of the “Magnificent Seven”1 that drove the broad market performance for the year. Canadian Natural Resources, an oil sands producer in Canada, was also a leading contributor to performance, continuing its strong capital allocation discipline with growing dividends and share repurchases. Detractors to performance for the year include Charles Schwab and Northrup Grumman. Both companies are still held in the Fund and we maintain our conviction in these names. We exited our position in U.S. Bancorp during the acute but short-lived banking crisis in March of 2023. Concerns about the leverage and underlying risk in the loan portfolios of many financial institutions remain. High Conviction Names There are two companies that we believe are poised for a substantial period of performance. They trade at large discounts to their fundamental value, and we | | | | see the potential for that value to be unlocked and realized on the horizon. Samsung Electronics is one of them. Samsung’s memory chip business is emerging from a cyclical trough, plus memory chips play a critical role in supporting memory-hungry AI and machine learning applications. The foundry business is strategically important to the U.S. with its (largest ever in the U.S.) semiconductor production facility not far from our offices in Austin, Texas set to open later this year. Samsung will also participate in the regulatory and access unlocks that are underway. On December 14, 2023, South Korea abolished the 30-year-old foreign registration requirement plus other measures aimed at encouraging greater foreign investor participation in the market. Hundreds of Korean companies are preparing to adopt dividend payment processes that better align with global standards. We anticipate further regulatory and governance changes in 2024 that should make South Korea a more accessible and investable market for foreign investors. Eventually, we expect the country to be re-rated by MSCI as a developed market. Bolloré is another company that we firmly believe continues to set up well. It owns a large stake in Universal Music Group (“UMG”), traded on the Amsterdam stock exchange but headquartered in California. UMG performed very well in 2023 translating into additional value for Bolloré that was not reflected in the stock price. It also owns about 30% of Vivendi, a French media conglomerate, which is actively exploring opportunities to simplify its structure and unlock value. Last year, Bolloré signed an agreement for the sale of its European logistics business, which is expected to close later this year. (This follows on the sale of its African logistics | | | | business in 2022.) Once this occurs, Bolloré will effectively own two major media businesses plus a large pile of cash. Historically considered to be valued with a “conglomerate discount,” Bolloré will have simplified its structure significantly. Conclusion Passive fund assets now exceed active fund assets,2 while just ten years ago active fund assets were double passive fund assets. We maintain that most investors’ portfolios belong with active managers, especially those keen on managing risk. With numerous risks present in today’s world (geopolitical, interest rates above zero for consumers and companies alike, and expanding government balance sheets, to name a few), we believe that active fund management plays a vital role in protecting investors’ capital in challenging markets. While none of us know the source or timing of the next trigger that will impact the equity markets, at Yacktman, we constantly think about what could go wrong and when. We are excited about the Fund’s current positioning, and we believe that the companies we own are resilient and well-positioned in the current market. We remain focused on generating strong risk-adjusted returns over time. 1 Amazon, Apple, Alphabet (Google), Meta (Facebook), Microsoft, Nvidia, and Tesla. 2 Source: Morningstar (“It’s Official: Passive Funds Overtake Active Funds”), January 2024. The views expressed represent the opinions of Yacktman Asset Management LP as of December 31, 2023, and are not intended as a forecast or guarantee of future results, and are subject to change without notice. |
4
| | |
| | | AMG Yacktman Fund Portfolio Manager’s Comments (continued) |
CUMULATIVE TOTAL RETURN PERFORMANCE
AMG Yacktman Fund’s cumulative total return is based on the daily change in net asset value (NAV), and assumes that all dividends and distributions were reinvested. The graph compares a hypothetical $10,000 investment made in the AMG Yacktman Fund’s Class I shares on December 31, 2013 to a $10,000 investment made in the Russell 1000® Value Index and the S&P 500® Index for the same time period. The graph and table do not reflect the deduction of taxes that a shareholder would pay on a Fund distribution or redemption of shares. The listed returns for the Fund are net of expenses and the returns for the index exclude expenses. Total returns would have been lower had certain expenses not been reduced.
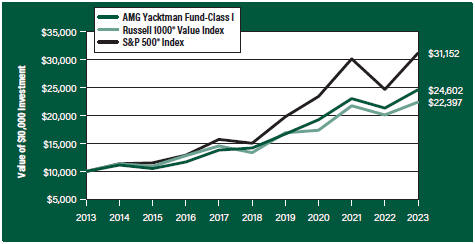
The table below shows the average annual total returns for the AMG Yacktman Fund, the Russell 1000® Value Index and the S&P 500® Index for the same time periods ended December 31, 2023.
| | | | | | | | | | | | |
| | | One | | | Five | | | Ten | |
| Average Annual Total Returns1 | | Year | | | Years | | | Years | |
|
AMG Yacktman Fund2, 3, 4, 5, 6, 7, 8, 9, 10, 11, 12, 13, 14, 15, 16 | |
| | | |
Class I | | | 15.39 | % | | | 11.64 | % | | | 9.42 | % |
| | | |
Russell 1000® Value Index17 | | | 11.46 | % | | | 10.91 | % | | | 8.40 | % |
| | | |
S&P 500® Index18 | | | 26.29 | % | | | 15.69 | % | | | 12.03 | % |
The performance data shown represents past performance. Past performance is not a guarantee of future results. Current performance may be lower or higher than the performance data quoted. The investment return and principal value of an investment will fluctuate so that an investor’s shares, when redeemed, may be worth more or less than their original cost.
Investors should carefully consider the Fund’s investment objectives, risks, charges and expenses before investing. For performance information through the most recent month end, current net asset values per share for the Fund and other information, please call 800.548.4539 or visit our website at wealth.amg.com for a free prospectus. Read it carefully before investing or sending money.
Distributed by AMG Distributors, Inc., member FINRA/SIPC.
| 1 | Total return equals income yield plus share price change and assumes reinvestment of all dividends and capital gain distributions. Returns are net of fees and may reflect offsets of Fund expenses as described in the prospectus. No adjustment has been made for taxes payable by shareholders on their reinvested dividends and capital gain distributions. Returns for periods greater than one year are annualized. The listed returns on the Fund are net of expenses and based on the published NAV as of December 31, 2023. All returns are in U.S. Dollars ($). |
| 2 | From time to time, the Fund’s Investment Manager has waived its fees and/or absorbed Fund expenses, which has resulted in higher returns. |
| 3 | Market prices of investments held by the Fund may fall rapidly or unpredictably due to a variety of factors, including economic, political, or market conditions, or other factors including terrorism, war, natural disasters and the spread of infectious illness or other public health issues, including epidemics or pandemics, or in response to events that affect particular industries or companies. |
| 4 | The stocks of large-capitalization companies are generally more mature and may not be able to reach the same levels of growth as the stocks of small- or mid-capitalization companies. |
| 5 | The stocks of small- and mid-capitalization companies often have greater price volatility, lower trading volume, and less liquidity than the stocks of larger, more established companies. |
| 6 | Value stocks may perform differently from the market as a whole and may be undervalued by the market for a long period of time. |
| 7 | Because the Fund is an actively managed investment portfolio, security selection or focus on securities in a particular style, market sector or group of companies may cause the Fund to incur losses or underperform relative to its benchmarks or other funds with a similar investment objective. To the extent the Fund invests a substantial portion of its assets in a relatively small number of securities, the Fund’s net asset value may be more volatile and the Fund may involve more risk than a fund that invests in a greater number of securities. There can be no guarantee that the Subadviser’s investment techniques and risk analysis will produce the desired result. |
| 8 | Investments in foreign issuers involve additional risks (such as risks arising from less frequent trading, changes in political or social conditions, and less publicly available information about non-U.S. issuers) that differ from those associated with investments in U.S. issuers and may result in greater price volatility. |
| 9 | Investments in emerging markets are subject to the general risks of foreign investments, as well as additional risks which can result in greater price volatility. Such additional risks include the risk that markets in emerging market countries are typically less developed and less liquid than markets in developed countries and such markets are subjected to increased economic, political, or regulatory uncertainties. |
| 10 | Fluctuations in exchange rates may affect the total loss or gain on a non-U.S. Dollar investment when converted back to U.S. Dollars and exposure to non-U.S. currencies may subject the Fund to the |
5
| | |
| | | AMG Yacktman Fund Portfolio Manager’s Comments (continued) |
| | | |
| | | |
| | | | | | | | |
risk that those currencies will decline in value relative to the U.S. Dollar. 11 Convertible preferred stocks, which are convertible into shares of the issuer’s common stock and pay regular dividends, and convertible debt securities, which are convertible into shares of the issuer’s common stock and bear interest, are subject to the risks of equity securities and fixed income securities. The lower the conversion premium, the more likely the price of the convertible security will follow the price of the underlying common stock. Conversely, higher premium convertible securities are more likely to exhibit the behavior of bonds because the likelihood of conversion is lower, which may cause their prices to fall as interest rates rise. There is the risk that the issuer of convertible preferred stock will not be able to make dividend payments or that the issuer of a convertible bond will not be able to make principal and/or interest payments. 12 The value of a debt security changes in response to various factors, including, for example, market-related factors, such as changes in interest rates or changes in the actual or perceived ability of an issuer to meet its obligations. Investments in debt securities are subject to, among other risks, credit risk, interest rate risk, extension risk, prepayment risk and liquidity risk. | | | | 13 Below investment grade debt securities and unrated securities of similar credit quality (commonly known as “junk bonds” or “high yield securities”) may be subject to greater levels of interest rate, credit, liquidity, and market risk than higher-rated securities. These securities are considered predominately speculative with respect to the issuer’s continuing ability to make principal and interest payments. 14 Fixed coupon payments (cash flows) of bonds and debt securities may become less competitive with the market in periods of rising interest rates and cause bond prices to decline. During periods of increasing interest rates, the Fund may experience high levels of volatility and shareholder redemptions, and may have to sell securities at times when it would otherwise not do so, and at unfavorable prices, which could reduce the returns of the Fund. 15 The issuer of bonds or other debt securities or a counterparty to a derivatives contract may be unable or unwilling, or may be perceived as unable or unwilling, to make timely interest, principal or settlement payments or otherwise honor its obligations. 16 Issuers and companies that are in similar industry sectors may be similarly affected by particular economic or market events; to the extent the Fund | | | | has substantial holdings within a particular sector, the risks associated with that sector increase. 17 The Russell 1000® Value Index is a market capitalization weighted index that measures the performance of those Russell 1000® companies with lower price-to-book ratios and lower forecasted growth values. Unlike the Fund, the Russell 1000® Value Index is unmanaged, is not available for investment and does not incur expenses. 18 The S&P 500® Index is a capitalization-weighted index of 500 stocks. The S&P 500® Index is designed to measure performance of the broad domestic economy through changes in the aggregate market value of 500 stocks representing all major industries. Unlike the Fund, the S&P 500® Index is unmanaged, is not available for investment and does not incur expenses. The Russell 1000® Value Index is a trademark of the London Stock Exchange Group companies. The S&P 500® Index is proprietary data of Standard & Poor’s, a division of McGraw-Hill Companies, Inc. All rights reserved. Not FDIC insured, nor bank guaranteed. May lose value. |
6
| | |
| | |
| | | AMG Yacktman Fund Fund Snapshots (unaudited) December 31, 2023 |
| | | |
| | |
PORTFOLIO BREAKDOWN
| | |
Sector | | % of
Net Assets |
| | |
Communication Services | | 17.1 |
| | |
Consumer Staples | | 14.8 |
| | |
Energy | | 14.4 |
| | |
Information Technology | | 14.4 |
| | |
Industrials | | 10.2 |
| | |
Financials | | 9.6 |
| | |
Consumer Discretionary | | 4.3 |
| | |
Materials | | 3.5 |
| | |
Health Care | | 3.4 |
| | |
Short-Term Investments | | 7.9 |
| | |
Other Assets, less Liabilities | | 0.4 |
TOP TEN HOLDINGS
| | |
Security Name | | % of
Net Assets |
| |
Bolloré SE (France) | | 7.1 |
| |
Canadian Natural Resources, Ltd. (Canada) | | 6.4 |
| |
Samsung Electronics Co., Ltd., 2.410% (South Korea) | | 6.3 |
| |
Microsoft Corp. | | 3.7 |
| |
Alphabet, Inc., Class C | | 3.4 |
| |
PepsiCo, Inc. | | 2.9 |
| |
The Charles Schwab Corp. | | 2.8 |
| |
News Corp., Class A | | 2.6 |
| |
U-Haul Holding Co., Non-Voting Shares | | 2.5 |
| |
Cognizant Technology Solutions Corp., Class A | | 2.4 |
| |
Top Ten as a Group | | 40.1 |
| | |
NEW POSITIONS 1
| | | | |
| Security Name | | Current
Shares Held |
| | |
Kenvue, Inc.2 | | | 3,300,000 | |
1 For the six months ended December 31, 2023
2 Acquired in a corporate action.
Because a fund’s strategy may result in multiple investments in particular sectors of the economy, its performance may depend on the performance of those sectors and may fluctuate more widely than investments diversified across more sectors. For additional information on these and other risk considerations, please see the Fund’s prospectus.
Any sectors, industries, or securities discussed should not be perceived as investment recommendations. Mention of a specific security should not be considered a recommendation to buy or solicitation to sell that security. Specific securities mentioned in this report may have been sold from the Fund’s portfolio of investments by the time you receive this report.
7
| | |
| | |
| | | AMG Yacktman Fund Schedule of Portfolio Investments December 31, 2023 |
| | | |
| | |
| | | | | | | | |
| | | Shares | | | Value | |
| | |
Common Stocks - 84.4% | | | | | | | | |
| |
Communication Services - 17.1% | | | | | |
| | |
Alphabet, Inc., Class C* | | | 2,070,000 | | | | $291,725,100 | |
| | |
Bolloré SE (France) | | | 96,200,000 | | | | 602,001,759 | |
| | |
Comcast Corp., Class A | | | 1,100,000 | | | | 48,235,000 | |
| | |
Fox Corp., Class A | | | 2,400,000 | | | | 71,208,000 | |
| | |
Fox Corp., Class B | | | 3,100,000 | | | | 85,715,000 | |
| | |
News Corp., Class A | | | 8,900,000 | | | | 218,495,000 | |
| | |
The Walt Disney Co. | | | 900,000 | | | | 81,261,000 | |
| | |
Warner Bros Discovery, Inc.* | | | 4,400,000 | | | | 50,072,000 | |
| | |
Total Communication Services | | | | | | | 1,448,712,859 | |
| |
Consumer Discretionary - 3.3% | | | | | |
| | |
Booking Holdings, Inc.* | | | 35,000 | | | | 124,152,700 | |
| | |
eBay, Inc. | | | 1,250,000 | | | | 54,525,000 | |
| | |
Hyundai Mobis Co., Ltd. (South Korea) | | | 550,000 | | | | 100,767,169 | |
| | |
Total Consumer Discretionary | | | | | | | 279,444,869 | |
| |
Consumer Staples - 14.8% | | | | | |
| | |
Associated British Foods PLC (United Kingdom) | | | 6,800,000 | | | | 204,945,337 | |
| | |
The Coca-Cola Co. | | | 1,385,000 | | | | 81,618,050 | |
| | |
Colgate-Palmolive Co. | | | 1,100,000 | | | | 87,681,000 | |
| | |
Ingredion, Inc. | | | 1,150,000 | | | | 124,809,500 | |
| | |
Kenvue, Inc. | | | 3,300,000 | | | | 71,049,000 | |
| | |
KT&G Corp. (South Korea) | | | 1,452,810 | | | | 97,873,157 | |
| | |
PepsiCo, Inc. | | | 1,450,000 | | | | 246,268,000 | |
| | |
The Procter & Gamble Co. | | | 1,350,000 | | | | 197,829,000 | |
| | |
Sysco Corp. | | | 920,000 | | | | 67,279,600 | |
| | |
Tyson Foods, Inc., Class A | | | 1,460,000 | | | | 78,475,000 | |
| | |
Total Consumer Staples | | | | | | | 1,257,827,644 | |
| |
Energy - 14.4% | | | | | |
| | |
Canadian Natural Resources, Ltd. (Canada)1 | | | 8,310,000 | | | | 544,471,200 | |
| | |
ConocoPhillips | | | 890,000 | | | | 103,302,300 | |
| | |
Devon Energy Corp. | | | 1,610,000 | | | | 72,933,000 | |
| | |
Diamondback Energy, Inc. | | | 800,000 | | | | 124,064,000 | |
| | |
EOG Resources, Inc. | | | 955,000 | | | | 115,507,250 | |
| | |
Pioneer Natural Resources Co. | | | 725,000 | | | | 163,038,000 | |
| | |
Weatherford International PLC* | | | 1,000,000 | | | | 97,830,000 | |
| | |
Total Energy | | | | | | | 1,221,145,750 | |
| |
Financials - 9.6% | | | | | |
| | |
The Bank of New York Mellon Corp. | | | 2,300,000 | | | | 119,715,000 | |
| | |
Berkshire Hathaway, Inc., Class B* | | | 340,000 | | | | 121,264,400 | |
| | |
The Charles Schwab Corp. | | | 3,400,000 | | | | 233,920,000 | |
| | |
First Hawaiian, Inc. | | | 1,530,000 | | | | 34,975,800 | |
| | |
The Goldman Sachs Group, Inc. | | | 130,000 | | | | 50,150,100 | |
| | | | | | | | |
| | | Shares | | | Value | |
| | |
State Street Corp. | | | 1,900,000 | | | | $147,174,000 | |
| | |
Wells Fargo & Co. | | | 2,110,000 | | | | 103,854,200 | |
| | |
Total Financials | | | | | | | 811,053,500 | |
| |
Health Care - 3.4% | | | | | |
| | |
Elevance Health, Inc. | | | 300,000 | | | | 141,468,000 | |
| | |
Embecta Corp. | | | 1,600,000 | | | | 30,288,000 | |
| | |
Johnson & Johnson | | | 767,682 | | | | 120,326,477 | |
| | |
Total Health Care | | | | | | | 292,082,477 | |
| |
Industrials - 10.2% | | | | | |
| | |
Armstrong World Industries, Inc.1 | | | 735,000 | | | | 72,265,200 | |
| | |
Brenntag SE (Germany) | | | 2,200,000 | | | | 202,196,489 | |
| | |
GrafTech International, Ltd. | | | 7,000,000 | | | | 15,330,000 | |
| | |
L3Harris Technologies, Inc. | | | 355,000 | | | | 74,770,100 | |
| | |
Lockheed Martin Corp. | | | 195,000 | | | | 88,381,800 | |
| | |
Northrop Grumman Corp. | | | 225,000 | | | | 105,331,500 | |
| | |
Samsung C&T Corp. (South Korea) | | | 700,000 | | | | 70,215,875 | |
| | |
U-Haul Holding Co.*,1 | | | 330,000 | | | | 23,694,000 | |
| | |
U-Haul Holding Co., Non-Voting Shares | | | 2,970,000 | | | | 209,206,800 | |
| | |
Total Industrials | | | | | | | 861,391,764 | |
| |
Information Technology - 8.1% | | | | | |
| | |
Cisco Systems, Inc. | | | 800,000 | | | | 40,416,000 | |
| | |
Cognizant Technology Solutions Corp., Class A | | | 2,750,000 | | | | 207,707,500 | |
| | |
Corning, Inc. | | | 1,100,000 | | | | 33,495,000 | |
| | |
Microsoft Corp. | | | 840,000 | | | | 315,873,600 | |
| | |
Oracle Corp. | | | 700,000 | | | | 73,801,000 | |
| | |
Samsung Electronics Co., Ltd. (South Korea) | | | 200,000 | | | | 12,139,368 | |
| | |
Total Information Technology | | | | | | | 683,432,468 | |
| |
Materials - 3.5% | | | | | |
| | |
Olin Corp. | | | 2,205,000 | | | | 118,959,750 | |
| | |
Reliance Steel & Aluminum Co. | | | 650,000 | | | | 181,792,000 | |
| | |
Total Materials | | | | | | | 300,751,750 | |
| |
Total Common Stocks | | | | | |
(Cost $4,476,932,916) | | | | | | | 7,155,843,081 | |
| | |
Preferred Stocks - 7.3% | | | | | | | | |
| |
Consumer Discretionary - 1.0% | | | | | |
| | |
Hyundai Motor Co., 1.360% (South Korea) | | | 400,000 | | | | 35,417,025 | |
| | |
Hyundai Motor Co., 1.370% (South Korea) | | | 523,882 | | | | 46,077,169 | |
| | |
Total Consumer Discretionary | | | | | | | 81,494,194 | |
| |
Information Technology - 6.3% | | | | | |
| | |
Samsung Electronics Co., Ltd., 2.410% (South Korea) | | | 11,050,000 | | | | 532,460,913 | |
| |
Total Preferred Stocks | | | | | |
(Cost $304,566,646) | | | | | | | 613,955,107 | |
The accompanying notes are an integral part of these financial statements.
8
| | |
| | |
| | | AMG Yacktman Fund Schedule of Portfolio Investments (continued) |
| | |
| | |
| | | | | | | | |
| | | Principal Amount | | | Value | |
| |
Short-Term Investments - 7.9% | | | | | |
| |
Joint Repurchase Agreements - 0.0%#,2 | | | | | |
| | |
Citigroup Global Markets, Inc., dated 12/29/23, due 01/02/24, 5.340% total to be received $1,131,122 (collateralized by various U.S. Government Agency Obligations, 2.000% -7.500%, 07/20/37 - 12/20/53, totaling $1,153,060) | | | $1,130,451 | | | | $1,130,451 | |
| | |
Daiwa Capital Markets America, dated 12/29/23, due 01/02/24, 5.380% total to be received $1,131,127 (collateralized by various U.S. Government Agency Obligations and U.S. Treasuries, 0.000% - 7.500%, 03/22/24 -01/01/54, totaling $1,153,199) | | | 1,130,451 | | | | 1,130,451 | |
| | |
Deutsche Bank Securities, Inc., dated 12/29/23, due 01/02/24, 5.350% total to be received $1,131,123 (collateralized by various U.S. Government Agency Obligations, 2.000% -6.500%, 09/01/46 - 06/01/62, totaling $1,153,060) | | | 1,130,451 | | | | 1,130,451 | |
| | |
RBC Dominion Securities, Inc., dated 12/29/23, due 01/02/24, 5.340% total to be received $1,131,122 (collateralized by various U.S. Government Agency Obligations and U.S. Treasuries, 0.000% - 7.500%, 01/15/24 -12/01/53, totaling $1,153,060) | | | 1,130,451 | | | | 1,130,451 | |
| | |
Total Joint Repurchase Agreements | | | | | | | 4,521,804 | |
| |
U.S. Government Obligations - 3.7% | | | | | |
| | |
U.S. Treasury Bills, 4.945%, 10/03/243 | | | 80,000,000 | | | | 77,122,430 | |
| | | | | | | | |
| | | Principal Amount | | | Value | |
| | |
U.S. Treasury Bills, 5.050%, 01/25/243 | | | $80,000,000 | | | | $79,730,504 | |
| | |
U.S. Treasury Bills, 5.251%, 06/13/243 | | | 82,000,000 | | | | 80,124,630 | |
| | |
U.S. Treasury Bills, 5.299%, 03/21/243 | | | 80,000,000 | | | | 79,088,559 | |
| | |
Total U.S. Government Obligations | | | | | | | 316,066,123 | |
| |
Repurchase Agreements - 2.1% | | | | | |
| | |
Fixed Income Clearing Corp., dated 12/29/23 due 01/02/24, 5.150% total to be received $1,969,126 (collateralized by a U.S. Treasury, 3.875%, 08/15/33, totaling $2,007,380) | | | 1,968,000 | | | | 1,968,000 | |
| | |
Fixed Income Clearing Corp., dated 12/29/23, due 01/02/24, 5.150% total to be received $174,226,639 (collateralized by a U.S. Treasury, 4.125%, 09/30/27, totaling $177,609,576) | | | 174,127,000 | | | | 174,127,000 | |
| | |
Total Repurchase Agreements | | | | | | | 176,095,000 | |
| | |
| | | Shares | | | | |
| |
Other Investment Companies - 2.1% | | | | | |
| | |
JPMorgan U.S. Government Money Market Fund, IM Shares, 5.30%4 | | | 174,622,794 | | | | 174,622,794 | |
| |
Total Short-Term Investments | | | | | |
(Cost $671,225,904) | | | | | | | 671,305,721 | |
| |
Total Investments - 99.6% | | | | | |
(Cost $5,452,725,466) | | | | | | | 8,441,103,909 | |
| |
Other Assets, less Liabilities - 0.4% | | | | 32,928,746 | |
| |
Net Assets - 100.0% | | | | $8,474,032,655 | |
| |
| | | | | |
| * | Non-income producing security. |
| 1 | Some of these securities, amounting to $21,398,538 or 0.3% of net assets, were out on loan to various borrowers and are collateralized by cash and various U.S. Treasury Obligations. See Note 4 of Notes to Financial Statements. |
| 2 | Cash collateral received for securities lending activity was invested in these joint repurchase agreements. |
| 3 | Represents yield to maturity at December 31, 2023. |
| 4 | Yield shown represents the December 31, 2023, seven day average yield, which refers to the sum of the previous seven days’ dividends paid, expressed as an annual percentage. |
The accompanying notes are an integral part of these financial statements.
9
| | |
| | |
| | | AMG Yacktman Fund Schedule of Portfolio Investments (continued) |
| | |
| | |
The following table summarizes the inputs used to value the Fund’s investments by the fair value hierarchy levels as of December 31, 2023:
| | | | | | | | | | | | | | | | |
| | | Level 1 | | | Level 21 | | | Level 3 | | | Total | |
| | | | |
Investments in Securities | | | | | | | | | | | | | | | | |
| | | | |
Common Stocks | | | | | | | | | | | | | | | | |
| | | | |
Communication Services | | | $846,711,100 | | | | $602,001,759 | | | | — | | | | $1,448,712,859 | |
| | | | |
Consumer Staples | | | 955,009,150 | | | | 302,818,494 | | | | — | | | | 1,257,827,644 | |
| | | | |
Energy | | | 1,221,145,750 | | | | — | | | | — | | | | 1,221,145,750 | |
| | | | |
Industrials | | | 588,979,400 | | | | 272,412,364 | | | | — | | | | 861,391,764 | |
| | | | |
Financials | | | 811,053,500 | | | | — | | | | — | | | | 811,053,500 | |
| | | | |
Information Technology | | | 671,293,100 | | | | 12,139,368 | | | | — | | | | 683,432,468 | |
| | | | |
Materials | | | 300,751,750 | | | | — | | | | — | | | | 300,751,750 | |
| | | | |
Health Care | | | 292,082,477 | | | | — | | | | — | | | | 292,082,477 | |
| | | | |
Consumer Discretionary | | | 178,677,700 | | | | 100,767,169 | | | | — | | | | 279,444,869 | |
| | | | |
Preferred Stocks† | | | — | | | | 613,955,107 | | | | — | | | | 613,955,107 | |
| | | | |
Short-Term Investments | | | | | | | | | | | | | | | | |
| | | | |
Joint Repurchase Agreements | | | — | | | | 4,521,804 | | | | — | | | | 4,521,804 | |
| | | | |
U.S. Government Obligations | | | — | | | | 316,066,123 | | | | — | | | | 316,066,123 | |
| | | | |
Repurchase Agreements | | | — | | | | 176,095,000 | | | | — | | | | 176,095,000 | |
| | | | |
Other Investment Companies | | | 174,622,794 | | | | — | | | | — | | | | 174,622,794 | |
| | | | | | | | | | | | | | | | |
| | | | |
Total Investments in Securities | | | $6,040,326,721 | | | | $2,400,777,188 | | | | — | | | | $8,441,103,909 | |
| | | | | | | | | | | | | | | | |
| † | All preferred stocks held in the Fund are Level 2 securities. For a detailed breakout of preferred stocks by major industry classification, please refer to Schedule of Portfolio Investments. |
| 1 | An external pricing service is used to reflect any impact on security value due to market movements between the time the Fund valued such foreign securities and the earlier closing of foreign markets. |
For the fiscal year ended December 31, 2023, there were no transfers in or out of Level 3.
The country allocation in the Schedule of Portfolio Investments at December 31, 2023, was as follows:
| | |
| Country | | % of Long-Term Investments |
| |
Canada | | 7.0 |
| |
France | | 7.8 |
| |
Germany | | 2.6 |
| |
South Korea | | 11.5 |
| |
United Kingdom | | 2.6 |
| |
United States | | 68.5 |
| |
| | |
| |
| | | 100.0 |
| | |
The accompanying notes are an integral part of these financial statements.
10
| | |
| | | AMG Yacktman Focused Fund Portfolio Manager’s Comments (unaudited) |
| | | |
| | | |
| | | | |
For the 12 months ending December 31, 2023, the AMG Yacktman Focused Fund (the “Fund”) Class N shares returned 16.45%, outperforming the 11.46% return of the Russell 1000® Value Index and lagging the 26.29% return of the S&P 500® Index. In many ways, 2023 was the mirror image of 2022. Although the Fund’s Class N shares lagged relative to the S&P 500® Index in 2023, it outperformed the S&P 500® Index on a two-year basis, returning a cumulative 7.06% versus the 3.42% cumulative return of the S&P 500® Index. We believe that our commitment to mitigating capital loss in a down market led to the outperformance over the two years despite the strong finish for the Russell 1000® Value Index and the broader S&P 500® Index in 2023. Contributors and Detractors Contributors to the year’s performance include Microsoft and Alphabet. These technology companies benefited from the enthusiasm in the market for artificial intelligence (“AI”) and represent two of the “Magnificent Seven”1 that drove the broad market performance for the year. Canadian Natural Resources, an oil sands producer in Canada, was also a leading contributor to performance, continuing its strong capital allocation discipline with growing dividends and share repurchases. Detractors to performance for the year include Charles Schwab and Northrup Grumman. Both companies are still held in the Fund and we maintain our conviction in these names. We exited our position in U.S. Bancorp during the acute but short-lived banking crisis in March of 2023. Concerns about the leverage and underlying risk in the loan portfolios of many financial institutions remain. High Conviction Names There are two companies that we believe are poised for a substantial period of performance. They trade at large discounts to their fundamental value, and we | | see the potential for that value to be unlocked and realized on the horizon. Samsung Electronics is one of them. Samsung’s memory chip business is emerging from a cyclical trough, plus memory chips play a critical role in supporting memory-hungry AI and machine learning applications. The foundry business is strategically important to the U.S. with its (largest ever in the U.S.) semiconductor production facility not far from our offices in Austin, Texas set to open later this year. Samsung will also participate in the regulatory and access unlocks that are underway. On December 14, 2023, South Korea abolished the 30-year-old foreign registration requirement plus other measures aimed at encouraging greater foreign investor participation in the market. Hundreds of Korean companies are preparing to adopt dividend payment processes that better align with global standards. We anticipate further regulatory and governance changes in 2024 that should make South Korea a more accessible and investable market for foreign investors. Eventually, we expect the country to be re-rated by MSCI as a developed market. Bolloré is another company that we firmly believe continues to set up well. It owns a large stake in Universal Music Group (“UMG”), traded on the Amsterdam stock exchange but headquartered in California. UMG performed very well in 2023 translating into additional value for Bolloré that was not reflected in the stock price. It also owns about 30% of Vivendi, a French media conglomerate, which is actively exploring opportunities to simplify its structure and unlock value. Last year, Bolloré signed an agreement for the sale of its European logistics business, which is expected to close later this year. (This follows the sale of its African logistics business | | in 2022.) Once this occurs, Bolloré will effectively own two major media businesses plus a large pile of cash. Historically considered to be valued with a “conglomerate discount,” Bolloré will have simplified its structure significantly. Conclusion Passive fund assets now exceed active fund assets,2 while just ten years ago active fund assets were double passive fund assets. We maintain that most investors’ portfolios belong with active managers, especially those keen on managing risk. With numerous risks present in today’s world (geopolitical, interest rates above zero for consumers and companies alike, and expanding government balance sheets, to name a few), we believe that active fund management plays a vital role in protecting investors’ capital in challenging markets. While none of us know the source or timing of the next trigger that will impact the equity markets, at Yacktman, we constantly think about what could go wrong and when. We are excited about the Fund’s current positioning, and we believe that the companies we own are resilient and well-positioned in the current market. We remain focused on generating strong risk-adjusted returns over time. 1 Amazon, Apple, Alphabet (Google), Meta (Facebook), Microsoft, Nvidia, and Tesla. 2 Source: Morningstar (“It’s Official: Passive Funds Overtake Active Funds”), January 2024. The views expressed represent the opinions of Yacktman Asset Management LP as of December 31, 2023, and are not intended as a forecast or guarantee of future results, and are subject to change without notice. |
11
| | |
| | | AMG Yacktman Focused Fund Portfolio Manager’s Comments (continued) |
| | | |
| | |
CUMULATIVE TOTAL RETURN PERFORMANCE
AMG Yacktman Focused Fund’s cumulative total return is based on the daily change in net asset value (NAV), and assumes that all dividends and distributions were reinvested. The graph compares a hypothetical $10,000 investment made in the AMG Yacktman Focused Fund’s Class N shares on December 31, 2013 to a $10,000 investment made in the Russell 1000® Value Index and the S&P 500® Index for the same time period. The graph and table do not reflect the deduction of taxes that a shareholder would pay on a Fund distribution or redemption of shares. The listed returns for the Fund are net of expenses and the returns for the index exclude expenses. Total returns would have been lower had certain expenses not been reduced.
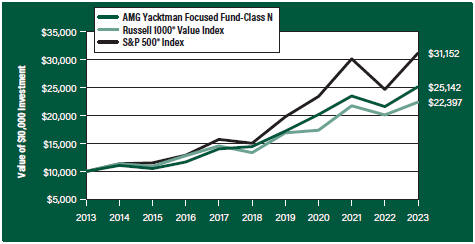
The table below shows the average annual total returns for the AMG Yacktman Focused Fund, the Russell 1000® Value Index and the S&P 500® Index for the same time periods ended December 31, 2023.
| | | | | | | | | | | | |
| | | One | | | Five | | | Ten | |
Average Annual Total Returns1 | | Year | | | Years | | | Years | |
|
AMG Yacktman Focused Fund2, 3, 4, 5, 6, 7, 8, 9, 10, 11, 12, 13, 14, 15, 16, 17, 18, 19, 20, 21, 22 | |
| | | |
Class N | | | 16.45 | % | | | 11.74 | % | | | 9.66 | % |
| | | |
Class I | | | 16.67 | % | | | 11.94 | % | | | 9.86 | % |
| | | |
Russell 1000® Value Index23 | | | 11.46 | % | | | 10.91 | % | | | 8.40 | % |
| | | |
S&P 500® Index24 | | | 26.29 | % | | | 15.69 | % | | | 12.03 | % |
The performance data shown represents past performance. Past performance is not a guarantee of future results. Current performance may be lower or higher than the performance data quoted. The investment return and principal value of an investment will fluctuate so that an investor’s shares, when redeemed, may be worth more or less than their original cost.
Investors should carefully consider the Fund’s investment objectives, risks, charges and expenses before investing. For performance information through the most recent month end, current net asset values per share for the Fund and other information, please call 800.548.4539 or visit our website at wealth.amg.com for a free prospectus. Read it carefully before investing or sending money.
Distributed by AMG Distributors, Inc., member FINRA/SIPC.
| 1 | Total return equals income yield plus share price change and assumes reinvestment of all dividends and capital gain distributions. Returns are net of fees and may reflect offsets of Fund expenses as described in the prospectus. No adjustment has been made for taxes payable by shareholders on their reinvested dividends and capital gain distributions. Returns for periods greater than one year are annualized. The listed returns on the Fund are net of expenses and based on the published NAV as of December 31, 2023. All returns are in U.S. Dollars ($). |
|
2 From time to time, the Fund’s Investment Manager has waived its fees and/or absorbed Fund expenses, which has resulted in higher returns. 3 Market prices of investments held by the Fund may fall rapidly or unpredictably due to a variety of factors, including economic, political, or market conditions, or other factors including terrorism, war, natural disasters and the spread of infectious illness or other public health issues, including epidemics or pandemics, or in response to events that affect particular industries or companies. 4 The stocks of large-capitalization companies are generally more mature and may not be able to reach the same levels of growth as the stocks of small- or mid-capitalization companies. 5 The stocks of small- and mid-capitalization companies often have greater price volatility, lower trading volume, and less liquidity than the stocks of larger, more established companies. 6 Value stocks may perform differently from the market as a whole and may be undervalued by the market for a long period of time. 7 The Fund may not be able to dispose of particular investments, such as illiquid securities, readily at favorable times or prices or the Fund may have to sell them at a loss. 8 Because the Fund is an actively managed investment portfolio, security selection or focus on securities in a particular style, market sector or group of companies may cause the Fund to incur losses or underperform relative to its benchmarks or other funds with a similar investment objective. There can be no guarantee that the Subadviser’s investment techniques and risk analysis will produce the desired result. |
9 The Fund is non-diversified and therefore a greater percentage of holdings may be focused in a small number of issuers or a single issuer, which can place the Fund at greater risk. Notwithstanding the Fund’s status as a “non-diversified” investment company under the Investment Company Act of 1940, as amended (the “1940 Act”), the Fund intends to qualify as a regulated investment company accorded favorable tax treatment under the Internal Revenue Code of 1986, as amended, which imposes its own diversification requirements that are less restrictive than the requirements applicable to “diversified” investment companies under the 1940 Act. The Fund’s intention to qualify as a regulated investment company may limit its pursuit of its investment strategy and its investment strategy could limit its ability to so qualify. 10 Issuers and companies that are in similar industry sectors may be similarly affected by particular economic or market events; to the extent the Fund has substantial holdings within a particular sector, the risks associated with that sector increase. |
12
| | |
| | | AMG Yacktman Focused Fund Portfolio Manager’s Comments (continued) |
| | | |
| | | |
| | | | |
11 To the extent the Fund invests a substantial portion of its assets in a relatively small number of securities or a particular market, industry, group of industries, country, region, group of countries, asset class or sector, it generally will be subject to greater risk than a fund that invests in a more diverse investment portfolio. In addition, the value of the Fund would be more susceptible to any single economic, market, political or regulatory occurrence affecting, for example, that particular market, industry, region or sector. 12 Investments in foreign issuers involve additional risks (such as risks arising from less frequent trading, changes in political or social conditions, and less publicly available information about non-U.S. issuers) that differ from those associated with investments in U.S. issuers and may result in greater price volatility. 13 Investments in emerging markets are subject to the general risks of foreign investments, as well as additional risks which can result in greater price volatility. Such additional risks include the risk that markets in emerging market countries are typically less developed and less liquid than markets in developed countries and such markets are subjected to increased economic, political, or regulatory uncertainties. 14 Fluctuations in exchange rates may affect the total loss or gain on a non-U.S. Dollar investment when converted back to U.S. Dollars and exposure to non-U.S. currencies may subject the Fund to the risk that those currencies will decline in value relative to the U.S. Dollar. 15 Convertible preferred stocks, which are convertible into shares of the issuer’s common stock and pay regular dividends, and convertible debt securities, which are convertible into shares of the issuer’s common stock and bear interest, are subject to the risks of equity securities and fixed income securities. The lower the conversion premium, the more likely the price of the convertible security will follow the price of the underlying common stock. Conversely, higher premium convertible securities | | are more likely to exhibit the behavior of bonds because the likelihood of conversion is lower, which may cause their prices to fall as interest rates rise. There is the risk that the issuer of convertible preferred stock will not be able to make dividend payments or that the issuer of a convertible bond will not be able to make principal and/or interest payments. 16 The value of a debt security changes in response to various factors, including, for example, market-related factors, such as changes in interest rates or changes in the actual or perceived ability of an issuer to meet its obligations. Investments in debt securities are subject to, among other risks, credit risk, interest rate risk, extension risk, prepayment risk and liquidity risk. 17 Below investment grade debt securities and unrated securities of similar credit quality (commonly known as “junk bonds” or “high yield securities”) may be subject to greater levels of interest rate, credit, liquidity, and market risk than higher-rated securities. These securities are considered predominately speculative with respect to the issuer’s continuing ability to make principal and interest payments. 18 Fixed coupon payments (cash flows) of bonds and debt securities may become less competitive with the market in periods of rising interest rates and cause bond prices to decline. During periods of increasing interest rates, the Fund may experience high levels of volatility and shareholder redemptions, and may have to sell securities at times when it would otherwise not do so, and at unfavorable prices, which could reduce the returns of the Fund. 19 The issuer of bonds or other debt securities or a counterparty to a derivatives contract may be unable or unwilling, or may be perceived as unable or unwilling, to make timely interest, principal or settlement payments or otherwise honor its obligations. 20 The use of derivatives involves costs, the risk that the value of derivatives may not correlate perfectly | | with their underlying assets, rates or indices, liquidity risk, and the risk of mispricing or improper valuation. The use of derivatives may not succeed for various reasons, and the complexity and rapidly changing structure of derivatives markets may increase the possibility of market losses. 21 There is no guarantee that hedging strategies will be successful. For example, changes in the value of a hedging transaction may not completely offset changes in the value of the assets and liabilities being hedged. Hedging transactions involve costs and may result in losses. 22 A short sale of a security involves the theoretical risk of unlimited loss because of potential unlimited increases in the market price of the security sold short. The Fund’s use of short sales, in certain circumstances, can result in significant losses. 23 The Russell 1000® Value Index is a market capitalization weighted index that measures the performance of those Russell 1000® companies with lower price-to-book ratios and lower forecasted growth values. Unlike the Fund, the Russell 1000® Value Index is unmanaged, is not available for investment and does not incur expenses. 24 The S&P 500® Index is a capitalization-weighted index of 500 stocks. The S&P 500® Index is designed to measure performance of the broad domestic economy through changes in the aggregate market value of 500 stocks representing all major industries. Unlike the Fund, the S&P 500® Index is unmanaged, is not available for investment and does not incur expenses. The Russell 1000® Value Index is a trademark of the London Stock Exchange Group companies. The S&P 500® Index is proprietary data of Standard & Poor’s, a division of McGraw-Hill Companies, Inc. All rights reserved. Not FDIC insured, nor bank guaranteed. May lose value. |
13
| | |
| | |
| | | AMG Yacktman Focused Fund Fund Snapshots (unaudited) December 31, 2023 |
| | | |
| | |
PORTFOLIO BREAKDOWN
| | | | | |
| Sector | | % of
Net Assets |
| | |
Communication Services | | | | 17.9 | |
| | |
Information Technology | | | | 17.7 | |
| | |
Consumer Staples | | | | 14.1 | |
| | |
Energy | | | | 13.6 | |
| | |
Industrials | | | | 12.1 | |
| | |
Financials | | | | 5.9 | |
| | |
Consumer Discretionary | | | | 5.6 | |
| | |
Materials | | | | 4.1 | |
| | |
Health Care | | | | 1.4 | |
| | |
Short-Term Investments | | | | 9.9 | |
| | |
Other Assets, less Liabilities | | | | (2.3 | ) |
TOP TEN HOLDINGS
| | |
| Security Name | | % of
Net Assets |
| |
Samsung Electronics Co., Ltd., 2.410% (South Korea) | | 10.7 |
| |
Bolloré SE (France) | | 8.5 |
| |
Canadian Natural Resources, Ltd. (Canada) | | 7.2 |
| |
Microsoft Corp. | | 3.8 |
| |
U-Haul Holding Co., Non-Voting Shares | | 3.7 |
| |
Alphabet, Inc., Class C | | 3.3 |
| |
KT&G Corp. (South Korea) | | 2.9 |
| |
PepsiCo, Inc. | | 2.5 |
| |
The Charles Schwab Corp. | | 2.5 |
| |
Cognizant Technology Solutions Corp., Class A | | 2.4 |
| |
Top Ten as a Group | | 47.5 |
| | |
NEW POSITIONS 1
| | | | | |
| Security Name | | Current Shares or Principal Held |
| | |
Kenvue, Inc.2 | | | | 783,745 | |
| | |
GrafTech Global Enterprises, Inc. 9.875%, 12/15/28 | | | | $10,00,000 | |
| | |
| | | | | |
| 1 | For the six months ended December 31, 2023 |
| 2 | Acquired in a corporate action. |
FULL SALES 1
| | | | |
| Security Name | | Net Shares, Contracts or Principal Sold | |
| |
Booking Holdings, Inc. | | | 24,000 | |
| |
Microsoft Corp., 2.000%, 08/08/23 | | | $11,500,000 | |
| |
eBay, Inc. (Call) | | | 9,500 | |
| |
Warner Bros Discovery, Inc. (Call) | | | 19,000 | |
| |
Booking Holdings, Inc. (Call) | | | 240 | |
Because a fund’s strategy may result in multiple investments in particular sectors of the economy, its performance may depend on the performance of those sectors and may fluctuate more widely than investments diversified across more sectors. For additional information on these and other risk considerations, please see the Fund’s prospectus.
Any sectors, industries, or securities discussed should not be perceived as investment recommendations. Mention of a specific security should not be considered a recommendation to buy or solicitation to sell that security. Specific securities mentioned in this report may have been sold from the Fund’s portfolio of investments by the time you receive this report.
14
| | |
| | |
| | | AMG Yacktman Focused Fund Schedule of Portfolio Investments December 31, 2023 |
| | | |
| | |
| | | | | | | | |
| | | Shares | | | Value | |
| | |
Common Stocks - 78.1% | | | | | | | | |
| |
Communication Services - 17.9% | | | | | |
| | |
Alphabet, Inc., Class C* | | | 860,000 | | | | $121,199,800 | |
| | |
Bolloré SE (France) | | | 50,300,000 | | | | 314,768,071 | |
| | |
Fox Corp., Class B | | | 3,000,000 | | | | 82,950,000 | |
| | |
News Corp., Class A | | | 3,685,000 | | | | 90,466,750 | |
| | |
News Corp., Class B | | | 200,000 | | | | 5,144,000 | |
| | |
The Walt Disney Co. | | | 300,000 | | | | 27,087,000 | |
| | |
Warner Bros Discovery, Inc.* | | | 1,900,000 | | | | 21,622,000 | |
| |
Total Communication Services | | | | 663,237,621 | |
| |
Consumer Discretionary - 3.0% | | | | | |
| | |
eBay, Inc. | | | 950,000 | | | | 41,439,000 | |
| | |
Hyundai Home Shopping Network Corp. (South Korea)1 | | | 600,000 | | | | 20,002,911 | |
| | |
Hyundai Mobis Co., Ltd. (South Korea) | | | 260,000 | | | | 47,635,389 | |
| |
Total Consumer Discretionary | | | | 109,077,300 | |
| |
Consumer Staples - 13.5% | | | | | |
| | |
Associated British Foods PLC (United Kingdom) | | | 2,700,000 | | | | 81,375,355 | |
| | |
The Coca-Cola Co. | | | 470,000 | | | | 27,697,100 | |
| | |
Ingredion, Inc. | | | 540,000 | | | | 58,606,200 | |
| | |
Kenvue, Inc. | | | 783,745 | | | | 16,874,030 | |
| | |
KT&G Corp. (South Korea) | | | 1,600,000 | | | | 107,789,078 | |
| | |
PepsiCo, Inc. | | | 540,000 | | | | 91,713,600 | |
| | |
The Procter & Gamble Co. | | | 540,000 | | | | 79,131,600 | |
| | |
Tyson Foods, Inc., Class A | | | 700,000 | | | | 37,625,000 | |
| |
Total Consumer Staples | | | | 500,811,963 | |
| |
Energy - 13.6% | | | | | |
| | |
Canadian Natural Resources, Ltd. (Canada)2 | | | 4,100,000 | | | | 268,632,000 | |
| | |
ConocoPhillips | | | 400,000 | | | | 46,428,000 | |
| | |
Devon Energy Corp. | | | 720,000 | | | | 32,616,000 | |
| | |
Diamondback Energy, Inc. | | | 326,000 | | | | 50,556,080 | |
| | |
EOG Resources, Inc. | | | 371,000 | | | | 44,872,450 | |
| | |
Pioneer Natural Resources Co. | | | 123,000 | | | | 27,660,240 | |
| | |
Weatherford International PLC* | | | 350,000 | | | | 34,240,500 | |
| |
Total Energy | | | | 505,005,270 | |
| |
Financials - 5.9% | | | | | |
| | |
The Bank of New York Mellon Corp. | | | 650,000 | | | | 33,832,500 | |
| | |
Berkshire Hathaway, Inc., Class B* | | | 100,000 | | | | 35,666,000 | |
| | |
The Charles Schwab Corp. | | | 1,325,000 | | | | 91,160,000 | |
| | |
State Street Corp. | | | 750,000 | | | | 58,095,000 | |
| |
Total Financials | | | | 218,753,500 | |
| |
Health Care - 1.4% | | | | | |
| | |
Johnson & Johnson | | | 322,427 | | | | 50,537,208 | |
| | | | | | | | |
| | | Shares | | | Value | |
| |
Industrials - 11.7% | | | | | |
| | |
Brenntag SE (Germany) | | | 967,236 | | | | $88,896,237 | |
| | |
L3Harris Technologies, Inc. | | | 170,000 | | | | 35,805,400 | |
| | |
Lockheed Martin Corp. | | | 95,000 | | | | 43,057,800 | |
| | |
Northrop Grumman Corp. | | | 110,000 | | | | 51,495,400 | |
| | |
Samsung C&T Corp. (South Korea) | | | 460,000 | | | | 46,141,861 | |
| | |
U-Haul Holding Co.*,2 | | | 59,000 | | | | 4,236,200 | |
| | |
U-Haul Holding Co., Non-Voting Shares | | | 1,950,000 | | | | 137,358,000 | |
| | |
Yuasa Trading Co., Ltd. (Japan) | | | 800,000 | | | | 26,836,549 | |
| | |
Total Industrials | | | | | | | 433,827,447 | |
| |
Information Technology - 7.0% | | | | | |
| | |
Cognizant Technology Solutions Corp., Class A | | | 1,200,000 | | | | 90,636,000 | |
| | |
Microsoft Corp. | | | 375,000 | | | | 141,015,000 | |
| | |
Oracle Corp. | | | 250,000 | | | | 26,357,500 | |
| |
Total Information Technology | | | | 258,008,500 | |
| |
Materials - 4.1% | | | | | |
| | |
Nihon Parkerizing Co., Ltd. (Japan) | | | 1,868,100 | | | | 15,030,989 | |
| | |
Olin Corp. | | | 995,000 | | | | 53,680,250 | |
| | |
Reliance Steel & Aluminum Co. | | | 300,000 | | | | 83,904,000 | |
| | |
Total Materials | | | | | | | 152,615,239 | |
| |
Total Common Stocks | | | | | |
(Cost $1,959,144,473) | | | | | | | 2,891,874,048 | |
| | |
| | | Principal Amount | | | | |
Corporate Bonds and Notes - 0.4% | | | | | |
| |
Industrials - 0.4% | | | | | |
| | |
GrafTech Finance, Inc. 4.625%, 12/15/283 | | | $10,600,000 | | | | 7,026,846 | |
| | |
GrafTech Global Enterprises, Inc. 9.875%, 12/15/282,3 | | | 10,000,000 | | | | 7,712,500 | |
| | |
Total Industrials | | | | | | | 14,739,346 | |
| |
Total Corporate Bonds and Notes | | | | | |
(Cost $15,610,454) | | | | | | | 14,739,346 | |
| | | Shares | | | | |
Preferred Stocks - 13.9% | | | | | |
| |
Consumer Discretionary - 2.6% | | | | | |
| | |
Hyundai Motor Co., 1.360% (South Korea) | | | 438,620 | | | | 38,836,538 | |
| | |
Hyundai Motor Co., 1.370% (South Korea) | | | 661,380 | | | | 58,170,577 | |
| |
Total Consumer Discretionary | | | | 97,007,115 | |
| |
Consumer Staples - 0.6% | | | | | |
| | |
Amorepacific Corp., 1.980% (South Korea) | | | 250,000 | | | | 7,088,413 | |
| | |
LG Household & Health Care Co., Ltd., 2.740% (South Korea) | | | 118,000 | | | | 14,451,254 | |
| |
Total Consumer Staples | | | | 21,539,667 | |
The accompanying notes are an integral part of these financial statements.
15
| | |
| | |
| | | AMG Yacktman Focused Fund Schedule of Portfolio Investments (continued) |
| | | |
| | |
| | | | | | | | |
| | | Shares | | | Value | |
| |
Information Technology - 10.7% | | | | | |
| | |
Samsung Electronics Co., Ltd., 2.410% (South Korea) | | | 8,200,000 | | | | $395,129,365 | |
| |
Total Preferred Stocks | | | | | |
(Cost $319,184,914) | | | | | | | 513,676,147 | |
| | |
| | | Principal Amount | | | | |
Short-Term Investments - 9.9% | | | | | |
| |
Joint Repurchase Agreements - 2.9%4 | | | | | |
| | |
Bethesda Securities LLC, dated 12/29/23, due 01/02/24, 5.470% total to be received $9,580,160 (collateralized by various U.S. Government Agency Obligations, 2.000% -5.881%, 10/01/27 - 01/01/57, totaling $9,765,828) | | | $9,574,341 | | | | 9,574,341 | |
| | |
Cantor Fitzgerald Securities, Inc., dated 12/29/23, due 01/02/24, 5.470% total to be received $23,101,408 (collateralized by various U.S. Government Agency Obligations, 1.500% -7.613%, 08/01/25 - 09/20/73, totaling $23,549,124) | | | 23,087,376 | | | | 23,087,376 | |
| | |
Citadel Securities LLC, dated 12/29/23, due 01/02/24, 5.480% total to be received $12,415,141 (collateralized by various U.S. Treasuries, 0.000% - 5.250%, 01/23/24 -11/15/53, totaling $12,663,444) | | | 12,407,586 | | | | 12,407,586 | |
| | |
Mirae Asset Securities USA, Inc., dated 12/29/23, due 01/02/24, 5.500% total to be received $11,151,147 (collateralized by various U.S. Government Agency Obligations and U.S. Treasuries, 0.000% - 8.000%, 02/02/24 -04/20/71, totaling $11,374,172) | | | 11,144,337 | | | | 11,144,337 | |
| | |
Mirae Asset Securities USA, Inc., dated 12/29/23, due 01/02/24, 5.540% total to be received $4,389,837 (collateralized by various U.S. Government Agency Obligations and U.S. Treasuries, 2.000% - 7.000%, 06/30/24 -09/15/65, totaling $4,477,633) | | | 4,387,136 | | | | 4,387,136 | |
| | |
RBC Dominion Securities, Inc., dated 12/29/23, due 01/02/24, 5.340% total to be received $12,267,850 (collateralized by various U.S. Government Agency Obligations and U.S. Treasuries, 0.000% - 7.500%, 01/15/24 -12/01/53, totaling $12,505,787) | | | 12,260,575 | | | | 12,260,575 | |
| | | | | | | | |
| | | Principal Amount | | | Value | |
| | |
Santander U.S. Capital Markets LLC, dated 12/29/23, due 01/02/24, 5.390% total to be received $13,882,022 (collateralized by various | | | | | | | | |
| | |
U.S. Government Agency Obligations, 1.500% -6.838%, 10/25/30 - 03/20/71, totaling $14,151,187) | | | $13,873,713 | | | | $13,873,713 | |
| | |
State of Wisconsin Investment Board, dated 12/29/23, due 01/02/24, 5.470% total to be received $21,766,823 (collateralized by various | | | | | | | | |
| | |
U.S. Treasuries, 0.125% - 3.625%, 04/15/25 -02/15/53, totaling $22,172,703) | | | 21,753,602 | | | | 21,753,602 | |
| |
Total Joint Repurchase Agreements | | | | 108,488,666 | |
| |
U.S. Government Obligations - 3.7% | | | | | |
| | |
U.S. Treasury Bills, 4.945%, 10/03/245 | | | 35,000,000 | | | | 33,741,063 | |
| | |
U.S. Treasury Bills, 5.050%, 01/25/245 | | | 35,000,000 | | | | 34,882,095 | |
| | |
U.S. Treasury Bills, 5.251%, 06/13/245 | | | 36,000,000 | | | | 35,176,667 | |
| | |
U.S. Treasury Bills, 5.299%, 03/21/245 | | | 35,000,000 | | | | 34,601,245 | |
| |
Total U.S. Government Obligations | | | | 138,401,070 | |
| |
Repurchase Agreements - 2.0% | | | | | |
| | |
Fixed Income Clearing Corp., dated 12/29/23 due 01/02/24, 5.150% total to be received $24,950,269 (collateralized by a U.S. Treasury, 0.125%, 01/15/32, totaling $25,434,737) | | | 24,936,000 | | | | 24,936,000 | |
| | |
Fixed Income Clearing Corp., dated 12/29/23, due 01/02/24, 5.150% total to be received $47,991,446 (collateralized by a U.S. Treasury, 4.125%, 09/30/27, totaling $48,923,305) | | | 47,964,000 | | | | 47,964,000 | |
| |
Total Repurchase Agreements | | | | 72,900,000 | |
| | |
| | | Shares | | | | |
| |
Other Investment Companies - 1.3% | | | | | |
| | |
JPMorgan U.S. Government Money Market Fund, IM Shares, 5.30%6 | | | 45,983,085 | | | | 45,983,085 | |
| |
Total Short-Term Investments | | | | | |
(Cost $365,737,833) | | | | | | | 365,772,821 | |
| |
Total Investments - 102.3% | | | | | |
(Cost $2,659,677,674) | | | | | | | 3,786,062,362 | |
| |
Other Assets, less Liabilities - (2.3)% | | | | (85,729,770 | ) |
| |
Net Assets - 100.0% | | | | $3,700,332,592 | |
| * | Non-income producing security. |
| 1 | Affiliated issuer. See schedule of affiliated investments for details. |
| 2 | Some of these securities, amounting to $125,117,590 or 3.4% of net assets, were out on loan to various borrowers and are collateralized by cash and various U.S. Treasury Obligations. See Note 4 of Notes to Financial Statements. |
| 3 | Security exempt from registration under Rule 144A of the Securities Act of 1933. These securities may be resold in transactions exempt from registration, normally to qualified institutional buyers. At December 31, 2023, the value of these securities amounted to $14,739,346 or 0.4% of net assets. |
| 4 | Cash collateral received for securities lending activity was invested in these joint repurchase agreements. |
| 5 | Represents yield to maturity at December 31, 2023. |
The accompanying notes are an integral part of these financial statements.
16
| | |
| | |
| | | AMG Yacktman Focused Fund Schedule of Portfolio Investments (continued) |
| | | |
| | |
| 6 | Yield shown represents the December 31, 2023, seven day average yield, which refers to the sum of the previous seven days’ dividends paid, expressed as an annual percentage. |
The following schedule shows the value of affiliated investments at December 31, 2023.
| | | | | | | | | | | | | | |
Affiliated Issuers | | Number of shares | | Purchases | | Sales | | Net realized gain (loss) for the period | | Net change in appreciation (depreciation) | | Amount of Dividends | | Value |
| | | | | | | |
Hyundai Home Shopping Network Corp. | | 600,000 | | — | | — | | — | | $(5,654,527) | | $1,303,559 | | $20,002,911 |
The following table summarizes the inputs used to value the Fund’s investments by the fair value hierarchy levels as of December 31, 2023:
| | | | | | | | | | | | | | | | |
| | | Level 1 | | | Level 21 | | Level 3 | | | Total |
| | | | |
Investments in Securities | | | | | | | | | | | | | | | | |
| | | | |
Common Stocks | | | | | | | | | | | | | | | | |
| | | | |
Communication Services | | | $348,469,550 | | | | $314,768,071 | | | | — | | | | $663,237,621 | |
| | | | |
Energy | | | 505,005,270 | | | | — | | | | — | | | | 505,005,270 | |
| | | | |
Consumer Staples | | | 311,647,530 | | | | 189,164,433 | | | | — | | | | 500,811,963 | |
| | | | |
Industrials | | | 271,952,800 | | | | 161,874,647 | | | | — | | | | 433,827,447 | |
| | | | |
Information Technology | | | 258,008,500 | | | | — | | | | — | | | | 258,008,500 | |
| | | | |
Financials | | | 218,753,500 | | | | — | | | | — | | | | 218,753,500 | |
| | | | |
Materials | | | 137,584,250 | | | | 15,030,989 | | | | — | | | | 152,615,239 | |
| | | | |
Consumer Discretionary | | | 41,439,000 | | | | 67,638,300 | | | | — | | | | 109,077,300 | |
| | | | |
Health Care | | | 50,537,208 | | | | — | | | | — | | | | 50,537,208 | |
| | | | |
Corporate Bonds and Notes† | | | — | | | | 14,739,346 | | | | — | | | | 14,739,346 | |
| | | | |
Preferred Stocks† | | | — | | | | 513,676,147 | | | | — | | | | 513,676,147 | |
| | | | |
Short-Term Investments | | | | | | | | | | | | | | | | |
| | | | |
Joint Repurchase Agreements | | | — | | | | 108,488,666 | | | | — | | | | 108,488,666 | |
| | | | |
U.S. Government Obligations | | | — | | | | 138,401,070 | | | | — | | | | 138,401,070 | |
| | | | |
Repurchase Agreements | | | — | | | | 72,900,000 | | | | — | | | | 72,900,000 | |
| | | | |
Other Investment Companies | | | 45,983,085 | | | | — | | | | — | | | | 45,983,085 | |
| | | | | | | | | | | | | | | | |
| | | | |
Total Investments in Securities | | $ | 2,189,380,693 | | | $ | 1,596,681,669 | | | | — | | | $ | 3,786,062,362 | |
| | | | | | | | | | | | | | | | |
| | † | All corporate bonds and notes and preferred stocks held in the Fund are level 2 securities. For a detailed breakout of corporate bonds and notes and preferred stocks by major industry classification, please refer to the Fund’s Schedule of Portfolio Investments. |
| | 1 | An external pricing service is used to reflect any impact on security value due to market movements between the time the Fund valued such foreign securities and the earlier closing of foreign markets. |
For the fiscal year ended December 31, 2023, there were no transfers in or out of Level 3.
For the fiscal year ended December 31, 2023, the effect of derivative instruments on the Statement of Operations for the Fund and the amount of realized gain/loss and unrealized appreciation/depreciation on derivatives recognized in income were as follows:
| | | | | | | | | | |
| | | Realized Gain | | Change in Unrealized Appreciation/Depreciation | |
| | | | | | | | | | |
| | | | |
Derivatives not accounted for as hedging instruments | | Statement of Operations Location | | Realized Gain | | Statement of Operations Location | | Change in Unrealized Appreciation/ Depreciation | |
Equity contracts | | Net realized gain on written options | | $7,628,769 | | Net change in unrealized appreciation/
depreciation on written options | | | $77,729 | |
The accompanying notes are an integral part of these financial statements.
17
| | |
| | |
| | | AMG Yacktman Focused Fund Schedule of Portfolio Investments (continued) |
| | | |
| | |
The country allocation in the Schedule of Portfolio Investments at December 31, 2023, was as follows:
| | |
| Country | | % of Long-Term Investments |
| |
Canada | | 7.9 |
| |
France | | 9.2 |
| |
Germany | | 2.6 |
| |
Japan | | 1.2 |
| |
South Korea | | 21.5 |
| |
United Kingdom | | 2.4 |
| |
United States | | 55.2 |
| | |
| |
| | | 100.0 |
| | |
The accompanying notes are an integral part of these financial statements.
18
| | |
| | | AMG Yacktman Global Fund Portfolio Manager’s Comments (unaudited) |
| | | |
| | | |
| | | | |
For the 12 months ending December 31, 2023, the AMG Yacktman Global Fund (the “Fund”) Class I shares returned 16.46%, underperforming the 23.79% return of the MSCI World Index. In many ways, 2023 was the mirror image of 2022. Although the Fund’s Class I shares lagged relative to the MSCI World Index in 2023, it outperformed the MSCI World Index over a two-year period, returning a cumulative 5.91% versus the 1.33% cumulative return of the MSCI World Index. We believe that our commitment to mitigating capital loss in a down market led to the outperformance over the previous two years. Contributors and Detractors Contributors to the year’s performance include Samsung Electronics and Canadian Natural Resources (“CNQ”). Samsung benefited somewhat from the enthusiasm for artificial intelligence (“AI”) that drove the broad market performance for the year. Samsung continues to be one of our largest holdings (see comments below). CNQ, an oil sands producer in Canada, continues its strong capital allocation discipline with growing dividends and share repurchases. Detractors to performance for the year include Total Energy Services and Charles Schwab. Total Energy’s share price declined in Q4 during a volatile market for oilfield services and the company had to pause share repurchases while working on mergers and acquisitions. In January of 2024, Total Energy announced an accretive deal to gain market share in drilling rigs in Australia. Schwab traded down during the acute but short-lived banking crisis in March of 2023. Both companies are still held in the Fund, and we maintain our conviction in these names. High Conviction Names There are two companies that we believe are poised for a substantial period of performance. They trade at large discounts to their fundamental value, and we | | see the potential for that value to be unlocked and realized on the horizon. Samsung is one of them. Samsung’s memory chip business is emerging from a cyclical trough, plus memory chips play a critical role in supporting memory-hungry AI and machine learning applications. The foundry business is strategically important to the U.S. with its (largest ever in the U.S.) semiconductor production facility not far from our offices in Austin, Texas set to open later this year. Samsung will also participate in the regulatory and access unlocks that are underway. On December 14, 2023, South Korea abolished the 30-year-old foreign registration requirement plus other measures aimed at encouraging greater foreign investor participation in the market. Hundreds of Korean companies are preparing to adopt dividend payment processes that better align with global standards. We anticipate further regulatory and governance changes in 2024 that should make South Korea a more accessible and investable market for foreign investors. Eventually, we expect the country to be re-rated by MSCI as a developed market. Bolloré is another company that we firmly believe continues to set up well. It owns a large stake in Universal Music Group (“UMG”), traded on the Amsterdam stock exchange but headquartered in California. UMG performed very well in 2023, translating into additional value for Bolloré that was not reflected in the stock price. It also owns about 30% of Vivendi, a French media conglomerate, which is actively exploring opportunities to simplify its structure and unlock value. Last year, Bolloré signed a purchase agreement for the sale of its European logistics business which is expected to close later | | this year. (This follows the sale of its African logistics business in 2022.) Once this occurs, Bolloré will effectively own two major media businesses plus a large pile of cash. Historically considered to be valued with a “conglomerate discount,” Bolloré will have simplified its structure significantly. Conclusion Passive fund assets now exceed active fund assets,1 while just ten years ago active fund assets were double those of passive fund assets. We maintain the belief that most investors’ portfolios belong with active managers, especially those keen on managing risk. With numerous risks present in today’s world (geopolitical issues, interest rates above zero for consumers and companies alike, and expanding government balance sheets, to name a few), we believe that active fund management plays a vital role in protecting investors’ capital in challenging markets. While none of us know the source or timing of the next trigger that will impact the equity markets, at Yacktman, we constantly think about what could go wrong. We are excited about the Fund’s current positioning, and we believe that the companies we own are resilient and well-positioned in the current market. We remain focused on generating strong risk-adjusted returns over time. 1 Source: Morningstar (“It’s Official: Passive Funds Overtake Active Funds”), January 2024. The views expressed represent the opinions of Yacktman Asset Management LP as of December 31, 2023, and are not intended as a forecast or guarantee of future results, and are subject to change without notice. |
19
| | |
| | | AMG Yacktman Global Fund Portfolio Manager’s Comments (continued) |
| | | |
| | |
CUMULATIVE TOTAL RETURN PERFORMANCE
AMG Yacktman Global Fund’s cumulative total return is based on the daily change in net asset value (NAV), and assumes that all dividends and distributions were reinvested. The graph compares a hypothetical $10,000 investment made in the AMG Yacktman Global Fund’s Class I shares on January 30, 2017 (inception date), to a $10,000 investment made in the MSCI World Index for the same time period. The graph and table do not reflect the deduction of taxes that a shareholder would pay on a Fund distribution or redemption of shares. The listed returns for the Fund are net of expenses and the returns for the index exclude expenses. Total returns would have been lower had certain expenses not been reduced.
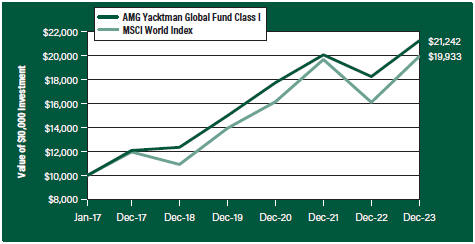
The table below shows the average annual total returns for the AMG Yacktman Global Fund and the MSCI World Index for the same time periods ended December 31, 2023.
| | | | | | | | | | | | | | | | |
| | | One | | | Five | | | Since | | | Inception | |
Average Annual Total Returns1 | | Year | | | Years | | | Inception | | | Date | |
|
AMG Yacktman Global Fund2, 3, 4, 5, 6, 7, 8, 9, 10, 11, 12, 13, 14, 15, 16, 17, 18, 19, 20, 21, 22, 23 | |
| | | | |
Class N | | | 16.30 | % | | | 11.35 | % | | | 11.42 | % | | | 01/30/17 | |
| | | | |
Class I | | | 16.46 | % | | | 11.48 | % | | | 11.51 | % | | | 01/30/17 | |
| | | | |
MSCI World Index24 | | | 23.79 | % | | | 12.80 | % | | | 10.48 | % | | | 01/30/17 | † |
The performance data shown represents past performance. Past performance is not a guarantee of future results. Current performance may be lower or higher than the performance data quoted. The investment return and principal value of an investment will fluctuate so that an investor’s shares, when redeemed, may be worth more or less than their original cost.
Investors should carefully consider the Fund’s investment objectives, risks, charges and expenses before investing. For performance information through the most recent month end, current net asset values per share for the Fund and other information, please call 800.548.4539 or visit our website at wealth.amg.com for a free prospectus. Read it carefully before investing or sending money.
Distributed by AMG Distributors, Inc., member FINRA/SIPC.
| † | Date reflects the inception date of the Fund, not the index. |
| 1 | Total return equals income yield plus share price change and assumes reinvestment of all dividends and capital gain distributions. Returns are net of fees and may reflect offsets of Fund expenses as described in the prospectus. No adjustment has been made for taxes payable by shareholders on their reinvested dividends and capital gain distributions. Returns for periods greater than one year are annualized. The listed returns on the Fund are net of expenses and based on the published NAV as of December 31, 2023. All returns are in U.S. Dollars ($). |
|
2 From time to time, the Fund’s Investment Manager has waived its fees and/or absorbed Fund expenses, which has resulted in higher returns. 3 Market prices of investments held by the Fund may fall rapidly or unpredictably due to a variety of factors, including economic, political, or market conditions, or other factors including terrorism, war, natural disasters and the spread of infectious illness or other public health issues, including epidemics or pandemics, or in response to events that affect particular industries or companies. 4 The stocks of large-capitalization companies are generally more mature and may not be able to reach the same levels of growth as the stocks of small- or mid-capitalization companies. 5 The stocks of small- and mid-capitalization companies often have greater price volatility, lower trading volume, and less liquidity than the stocks of larger, more established companies. 6 Value stocks may perform differently from the market as a whole and may be undervalued by the market for a long period of time. 7 The Fund may not be able to dispose of particular investments, such as illiquid securities, readily at favorable times or prices or the Fund may have to sell them at a loss. |
8 Because the Fund is an actively managed investment portfolio, security selection or focus on securities in a particular style, market sector or group of companies may cause the Fund to incur losses or underperform relative to its benchmark or other funds with a similar investment objective. There can be no guarantee that the Subadviser’s investment techniques and risk analysis will produce the desired result. 9 The Fund is non-diversified and therefore a greater percentage of holdings may be focused in a small number of issuers or a single issuer, which can place the Fund at greater risk. Notwithstanding the Fund’s status as a “non-diversified” investment company under the Investment Company Act of 1940, as amended (the “1940 Act”), the Fund intends to qualify as a regulated investment company accorded favorable tax treatment under the Internal Revenue Code of 1986, as amended, which imposes its own diversification requirements that are less restrictive than the requirements applicable to “diversified” investment companies under the 1940 Act. The Fund’s intention to qualify as a regulated investment company may limit its pursuit of its investment strategy and its investment strategy could limit its ability to so qualify. 10 To the extent the Fund invests a substantial portion of its assets in a relatively small number of securities or a particular market, industry, group of industries, country, region, group of countries, asset class or sector, it generally will be subject to |
20
| | |
| | | AMG Yacktman Global Fund Portfolio Manager’s Comments (continued) |
| | | |
| | | |
| | | | |
greater risk than a fund that invests in a more diverse investment portfolio. In addition, the value of the Fund would be more susceptible to any single economic, market, political or regulatory occurrence affecting, for example, that particular market, industry, region or sector. 11 Issuers and companies that are in similar industry sectors may be similarly affected by particular economic or market events; to the extent the Fund has substantial holdings within a particular sector, the risks associated with that sector increase. 12 Investments in foreign issuers involve additional risks (such as risks arising from less frequent trading, changes in political or social conditions, and less publicly available information about non-U.S. issuers) that differ from those associated with investments in U.S. issuers and may result in greater price volatility. 13 Investments in emerging markets are subject to the general risks of foreign investments, as well as additional risks which can result in greater price volatility. Such additional risks include the risk that markets in emerging market countries are typically less developed and less liquid than markets in developed countries and such markets are subjected to increased economic, political, or regulatory uncertainties. 14 Fluctuations in exchange rates may affect the total loss or gain on a non-U.S. Dollar investment when converted back to U.S. Dollars and exposure to non-U.S. currencies may subject the Fund to the risk that those currencies will decline in value relative to the U.S. Dollar. 15 To the extent the Fund focuses its investments in a particular country, group of countries or geographic region, the Fund is particularly susceptible to economic, political, regulatory or other events or conditions affecting such countries or region, and the Fund’s NAV may be more volatile than the NAV of a more geographically diversified fund and may result in losses. 16 Convertible preferred stocks, which are convertible into shares of the issuer’s common stock and pay | | regular dividends, and convertible debt securities, which are convertible into shares of the issuer’s common stock and bear interest, are subject to the risks of equity securities and fixed income securities. The lower the conversion premium, the more likely the price of the convertible security will follow the price of the underlying common stock. Conversely, higher premium convertible securities are more likely to exhibit the behavior of bonds because the likelihood of conversion is lower, which may cause their prices to fall as interest rates rise. There is the risk that the issuer of convertible preferred stock will not be able to make dividend payments or that the issuer of a convertible bond will not be able to make principal and/or interest payments. 17 The value of a debt security changes in response to various factors, including, for example, market-related factors, such as changes in interest rates or changes in the actual or perceived ability of an issuer to meet its obligations. Investments in debt securities are subject to, among other risks, credit risk, interest rate risk, extension risk, prepayment risk and liquidity risk. 18 Below investment grade debt securities and unrated securities of similar credit quality (commonly known as “junk bonds” or “high yield securities”) may be subject to greater levels of interest rate, credit, liquidity, and market risk than higher-rated securities. These securities are considered predominately speculative with respect to the issuer’s continuing ability to make principal and interest payments. 19 Fixed coupon payments (cash flows) of bonds and debt securities may become less competitive with the market in periods of rising interest rates and cause bond prices to decline. During periods of increasing interest rates, the Fund may experience high levels of volatility and shareholder redemptions, and may have to sell securities at times when it would otherwise not do so, and at unfavorable prices, which could reduce the returns of the Fund. 20 The issuer of bonds or other debt securities or a counterparty to a derivatives contract may be | | unable or unwilling, or may be perceived as unable or unwilling, to make timely interest, principal or settlement payments or otherwise honor its obligations. 21 The use of derivatives involves costs, the risk that the value of derivatives may not correlate perfectly with their underlying assets, rates or indices, liquidity risk, and the risk of mispricing or improper valuation. The use of derivatives may not succeed for various reasons, and the complexity and rapidly changing structure of derivatives markets may increase the possibility of market losses. 22 There is no guarantee that hedging strategies will be successful. For example, changes in the value of a hedging transaction may not completely offset changes in the value of the assets and liabilities being hedged. Hedging transactions involve costs and may result in losses. 23 A short sale of a security involves the theoretical risk of unlimited loss because of potential unlimited increases in the market price of the security sold short. The Fund’s use of short sales, in certain circumstances, can result in significant losses. 24 The MSCI World Index is a free float-adjusted market capitalization weighted index that is designed to measure the equity market performance of developed markets. Please go to msci.com for most current list of countries represented by the index. Unlike the Fund, the MSCI World Index is unmanaged, is not available for investment and does not incur expenses. All MSCI data is provided “as is”. The products described herein are not sponsored or endorsed and have not been reviewed or passed on by MSCI. In no event shall MSCI, its affiliates or any MSCI data provider have any liability of any kind in connection with the MSCI data or the products described herein. Copying or redistributing the MSCI data is strictly prohibited. Not FDIC insured, nor bank guaranteed. May lose value. |
21
| | |
| | |
| | | AMG Yacktman Global Fund Fund Snapshots (unaudited) December 31, 2023 |
| | | |
| | |
PORTFOLIO BREAKDOWN
| | | | | |
| Sector | | % of
Net Assets |
| | |
Industrials | | | | 24.2 | |
| | |
Communication Services | | | | 13.9 | |
| | |
Energy | | | | 13.8 | |
| | |
Consumer Discretionary | | | | 13.3 | |
| | |
Information Technology | | | | 12.5 | |
| | |
Consumer Staples | | | | 9.3 | |
| | |
Materials | | | | 3.3 | |
| | |
Health Care | | | | 2.3 | |
| | |
Financials | | | | 1.9 | |
| | |
Short-Term Investments | | | | 5.0 | |
| | |
Other Assets, less Liabilities | | | | 0.5 | |
TOP TEN HOLDINGS
| | |
| Security Name | | % of
Net Assets |
| |
Bolloré SE (France) | | 9.1 |
| |
Samsung Electronics Co., Ltd., 2.410% (South Korea) | | 8.1 |
| |
Canadian Natural Resources, Ltd. (Canada) | | 7.6 |
| |
Samsung C&T Corp. (South Korea) | | 4.5 |
| |
Cie de L’Odet SE (France) | | 3.8 |
| |
HI-LEX Corp. (Japan) | | 3.7 |
| |
Ocean Wilsons Holdings, Ltd. (Bermuda) | | 3.2 |
| |
KT&G Corp. (South Korea) | | 3.2 |
| |
Total Energy Services, Inc. (Canada) | | 3.2 |
| |
LG Household & Health Care Co., Ltd., 2.740% (South Korea) | | 3.0 |
| |
Top Ten as a Group | | 49.4 |
| | |
NEW POSITIONS 1
| | | | | |
| Security Name | | Current Shares Held |
| | |
Ajis Co., Ltd. (Japan) | | 19,400 |
| | |
BML, Inc. (Japan) | | 95,000 |
| | |
Kenvue, Inc. (United States) 2 | | 14,924 |
FULL SALES 1
| | | | |
| Security Name | | Net Shares Sold | |
| |
Tohokushinsha Film Corp. (Japan) | | | 200,000 | |
| |
Weatherford International PLC (United States) | | | 20,000 | |
| 1 | For the six months ended December 31, 2023 |
| 2 | Acquired in a corporate action. |
Because a fund’s strategy may result in multiple investments in particular sectors of the economy, its performance may depend on the performance of those sectors and may fluctuate more widely than investments diversified across more sectors. For additional information on these and other risk considerations, please see the Fund’s prospectus.
Any sectors, industries, or securities discussed should not be perceived as investment recommendations. Mention of a specific security should not be considered a recommendation to buy or solicitation to sell that security. Specific securities mentioned in this report may have been sold from the Fund’s portfolio of investments by the time you receive this report.
22
| | |
| | |
| | | AMG Yacktman Global Fund Schedule of Portfolio Investments December 31, 2023 |
| | | |
| | |
| | | | | | | | |
| | | Shares | | | Value | |
| | |
Common Stocks - 79.9% | | | | | | | | |
| |
Communication Services - 13.9% | | | | | |
| | |
Alphabet, Inc., Class C (United States)* | | | 7,000 | | | | $986,510 | |
| | |
Bolloré SE (France) | | | 2,750,000 | | | | 17,208,990 | |
| | |
Fox Corp., Class B (United States) | | | 130,000 | | | | 3,594,500 | |
| | |
News Corp., Class A (United States) | | | 130,000 | | | | 3,191,500 | |
| | |
Reading International, Inc., Class A (United States)* | | | 320,000 | | | | 611,200 | |
| | |
The Walt Disney Co. (United States) | | | 10,000 | | | | 902,900 | |
| |
Total Communication Services | | | | 26,495,600 | |
| |
Consumer Discretionary - 10.5% | | | | | |
| | |
Car Mate Manufacturing Co., Ltd. (Japan) | | | 52,500 | | | | 320,958 | |
| | |
Continental AG (Germany) | | | 10,000 | | | | 849,314 | |
| | |
Daewon San Up Co., Ltd. (South Korea) | | | 160,000 | | | | 724,825 | |
| | |
Dong Ah Tire & Rubber Co., Ltd. (South Korea) | | | 200,000 | | | | 1,859,883 | |
| | |
HI-LEX Corp. (Japan) | | | 730,000 | | | | 7,020,842 | |
| | |
Hyundai Home Shopping Network Corp. (South Korea) | | | 120,000 | | | | 4,000,582 | |
| | |
Hyundai Mobis Co., Ltd. (South Korea) | | | 25,000 | | | | 4,580,326 | |
| | |
Rinnai Corp. (Japan) | | | 24,000 | | | | 555,308 | |
| |
Total Consumer Discretionary | | | | 19,912,038 | |
| |
Consumer Staples - 5.9% | | | | | |
| | |
Associated British Foods PLC (United Kingdom) | | | 80,000 | | | | 2,411,122 | |
| | |
Kenvue, Inc. (United States) | | | 14,924 | | | | 321,314 | |
| | |
KT&G Corp. (South Korea) | | | 90,000 | | | | 6,063,136 | |
| | |
Naked Wines PLC (United Kingdom)* | | | 1,000,000 | | | | 701,057 | |
| | |
PepsiCo, Inc. (United States) | | | 5,000 | | | | 849,200 | |
| | |
The Procter & Gamble Co. (United States) | | | 6,000 | | | | 879,240 | |
| |
Total Consumer Staples | | | | 11,225,069 | |
| |
Energy - 13.8% | | | | | |
| | |
Amplify Energy Corp. (United States)* | | | 115,000 | | | | 681,950 | |
| | |
Canadian Natural Resources, Ltd. (Canada) | | | 220,000 | | | | 14,414,400 | |
| | |
Total Energy Services, Inc. (Canada) | | | 1,050,000 | | | | 5,990,717 | |
| | |
Unit Corp. (United States) | | | 120,000 | | | | 5,181,600 | |
| |
Total Energy | | | | 26,268,667 | |
| |
Financials - 1.9% | | | | | |
| | |
The Charles Schwab Corp. (United States) | | | 30,000 | | | | 2,064,000 | |
| | |
State Street Corp. (United States) | | | 20,000 | | | | 1,549,200 | |
| |
Total Financials | | | | 3,613,200 | |
| |
Health Care - 2.3% | | | | | |
| | |
BML, Inc. (Japan) | | | 95,000 | | | | 2,018,121 | |
| | |
Johnson & Johnson (United States) | | | 6,142 | | | | 962,697 | |
| | |
Kissei Pharmaceutical Co., Ltd. (Japan) | | | 9,400 | | | | 205,557 | |
| | | | | | | | |
| | | Shares | | | Value | |
| | |
Medipal Holdings Corp. (Japan) | | | 70,000 | | | | $1,133,188 | |
| |
Total Health Care | | | | 4,319,563 | |
| |
Industrials - 23.9% | | | | | |
| | |
Ajis Co., Ltd. (Japan) | | | 19,400 | | | | 314,803 | |
| | |
Brenntag SE (Germany) | | | 25,000 | | | | 2,297,687 | |
| | |
CB Industrial Product Holding Bhd (Malaysia) | | | 10,500,000 | | | | 3,062,024 | |
| | |
Cie de L’Odet SE (France) | | | 4,500 | | | | 7,231,792 | |
| | |
Komelon Corp. (South Korea) | | | 120,000 | | | | 849,492 | |
| | |
Ocean Wilsons Holdings, Ltd. (Bermuda) | | | 400,000 | | | | 6,118,320 | |
| | |
Parker Corp. (Japan) | | | 172,500 | | | | 938,413 | |
| | |
Rix Corp. (Japan) | | | 20,000 | | | | 480,802 | |
| | |
Sam Yung Trading Co., Ltd. (South Korea)* | | | 180,000 | | | | 1,731,656 | |
| | |
Samsung C&T Corp. (South Korea) | | | 86,000 | | | | 8,626,522 | |
| | |
Sekisui Jushi Corp. (Japan) | | | 140,000 | | | | 2,462,400 | |
| | |
Shinwa Co., Ltd./Nagoya (Japan) | | | 100,000 | | | | 1,672,606 | |
| | |
U-Haul Holding Co. (United States)* | | | 6,000 | | | | 430,800 | |
| | |
U-Haul Holding Co., Non-Voting Shares (United States) | | | 70,000 | | | | 4,930,800 | |
| | |
Yuasa Trading Co., Ltd. (Japan) | | | 130,000 | | | | 4,360,939 | |
| |
Total Industrials | | | | 45,509,056 | |
| |
Information Technology - 4.4% | | | | | |
| | |
CAC Holdings Corp. (Japan) | | | 240,000 | | | | 2,957,518 | |
| | |
Cognizant Technology Solutions Corp., Class A (United States) | | | 25,000 | | | | 1,888,250 | |
| | |
Hochiki Corp. (Japan) | | | 160,000 | | | | 1,979,794 | |
| | |
INFOvine Co., Ltd. (South Korea) | | | 20,000 | | | | 329,703 | |
| | |
Microsoft Corp. (United States) | | | 3,000 | | | | 1,128,120 | |
| |
Total Information Technology | | | | 8,283,385 | |
| |
Materials - 3.3% | | | | | |
| | |
KISCO Holdings Co., Ltd. (South Korea)* | | | 70,000 | | | | 1,291,282 | |
| | |
Kohsoku Corp. (Japan) | | | 90,000 | | | | 1,333,573 | |
| | |
Nihon Parkerizing Co., Ltd. (Japan) | | | 250,000 | | | | 2,011,534 | |
| | |
The Pack Corp. (Japan) | | | 70,000 | | | | 1,677,267 | |
| | |
Total Materials | | | | | | | 6,313,656 | |
| |
Total Common Stocks | | | | | |
(Cost $126,186,551) | | | | | | | 151,940,234 | |
| |
Preferred Stocks - 14.6% | | | | | |
| |
Consumer Discretionary - 2.8% | | | | | |
| | |
Hyundai Motor Co., 1.370% (South Korea) | | | 60,000 | | | | 5,277,200 | |
| |
Consumer Staples - 3.4% | | | | | |
| | |
Amorepacific Corp., 1.980% (South Korea) | | | 25,000 | | | | 708,841 | |
| | |
LG Household & Health Care Co., Ltd., 2.740% (South Korea) | | | 47,000 | | | | 5,756,008 | |
| |
Total Consumer Staples | | | | 6,464,849 | |
The accompanying notes are an integral part of these financial statements.
23
| | |
| | |
| | | AMG Yacktman Global Fund Schedule of Portfolio Investments (continued) |
| | | |
| | |
| | | | | | | | |
| | | Shares | | | Value | |
| |
Industrials - 0.3% | | | | | |
| | |
Sebang Co., Ltd., 4.360% (South Korea) | | | 106,126 | | | | $579,289 | |
| |
Information Technology - 8.1% | | | | | |
| | |
Samsung Electronics Co., Ltd., 2.410% (South Korea) | | | 320,000 | | | | 15,419,683 | |
| |
Total Preferred Stocks | | | | | |
(Cost $26,994,734) | | | | | | | 27,741,021 | |
| |
Short-Term Investments - 5.0% | | | | | |
| |
Other Investment Companies - 5.0% | | | | | |
| | |
Dreyfus Institutional Preferred Government Money Market Fund, Institutional Shares, 5.32%1 | | | 9,439,643 | | | | 9,439,643 | |
| |
Total Short-Term Investments | | | | | |
(Cost $9,439,643) | | | | | | | 9,439,643 | |
| | | | | | | | |
| | | | | | Value | |
| |
Total Investments - 99.5% | | | | | |
(Cost $162,620,928) | | | | | | | $189,120,898 | |
| |
Other Assets, less Liabilities - 0.5% | | | | 945,089 | |
| |
Net Assets - 100.0% | | | | $190,065,987 | |
| * | Non-income producing security. |
| 1 | Yield shown represents the December 31, 2023, seven day average yield, which refers to the sum of the previous seven days’ dividends paid, expressed as an annual percentage. |
The following table summarizes the inputs used to value the Fund’s investments by the fair value hierarchy levels as of December 31, 2023:
| | | | | | | | | | | | | | | | |
| | | Level 1 | | | Level 21 | | Level 3 | | | Total |
| | | | |
Investments in Securities | | | | | | | | | | | | | | | | |
| | | | |
Common Stocks | | | | | | | | | | | | | | | | |
| | | | |
Industrials | | | $16,588,403 | | | | $28,920,653 | | | | — | | | | $45,509,056 | |
| | | | |
Communication Services | | | 9,286,610 | | | | 17,208,990 | | | | — | | | | 26,495,600 | |
| | | | |
Energy | | | 26,268,667 | | | | — | | | | — | | | | 26,268,667 | |
| | | | |
Consumer Discretionary | | | 320,958 | | | | 19,591,080 | | | | — | | | | 19,912,038 | |
| | | | |
Consumer Staples | | | 2,750,811 | | | | 8,474,258 | | | | — | | | | 11,225,069 | |
| | | | |
Information Technology | | | 3,016,370 | | | | 5,267,015 | | | | — | | | | 8,283,385 | |
| | | | |
Materials | | | — | | | | 6,313,656 | | | | — | | | | 6,313,656 | |
| | | | |
Health Care | | | 962,697 | | | | 3,356,866 | | | | — | | | | 4,319,563 | |
| | | | |
Financials | | | 3,613,200 | | | | — | | | | — | | | | 3,613,200 | |
| | | | |
Preferred Stocks | | | | | | | | | | | | | | | | |
| | | | |
Information Technology | | | — | | | | 15,419,683 | | | | — | | | | 15,419,683 | |
| | | | |
Consumer Staples | | | — | | | | 6,464,849 | | | | — | | | | 6,464,849 | |
| | | | |
Consumer Discretionary | | | — | | | | 5,277,200 | | | | — | | | | 5,277,200 | |
| | | | |
Industrials | | | 579,289 | | | | — | | | | — | | | | 579,289 | |
| | | | |
Short-Term Investments | | | | | | | | | | | | | | | | |
| | | | |
Other Investment Companies | | | 9,439,643 | | | | — | | | | — | | | | 9,439,643 | |
| | | | | | | | | | | | | | | | |
| | | | |
Total Investments in Securities | | $ | 72,826,648 | | | $ | 116,294,250 | | | | — | | | $ | 189,120,898 | |
| | | | | | | | | | | | | | | | |
| | 1 | An external pricing service is used to reflect any impact on security value due to market movements between the time the Fund valued such foreign securities and the earlier closing of foreign markets. |
The accompanying notes are an integral part of these financial statements.
24
| | |
| | |
| | | AMG Yacktman Global Fund Schedule of Portfolio Investments (continued) |
| | | |
| | |
For the fiscal year ended December 31, 2023, there were no transfers in or out of Level 3.
The country allocation in the Schedule of Portfolio Investments at December 31, 2023, was as follows:
| | |
| Country | | % of Long-Term Investments |
| |
Bermuda | | 3.4 |
| |
Canada | | 11.4 |
| |
France | | 13.6 |
| |
Germany | | 1.7 |
| |
Japan | | 17.5 |
| |
Malaysia | | 1.7 |
| |
South Korea | | 32.2 |
| |
United Kingdom | | 1.7 |
| |
United States | | 16.8 |
| | |
| |
| | | 100.0 |
| | |
The accompanying notes are an integral part of these financial statements.
25
| | |
| | | AMG Yacktman Special Opportunities Fund Portfolio Manager’s Comments (unaudited) |
| | | |
| | | |
| | | | |
For the twelve months ending December 31, 2023, the AMG Yacktman Special Opportunities Fund (the “Fund”) Class I shares returned 3.24%, behind the 21.46% increase of the MSCI ACWI All Cap Index. After the Fund declined less than the market in a turbulent 2022, performance lagged the rally in 2023. This past year was almost a complete reversal of 2022. Strong enthusiasm for the latest “hit” product in artificial intelligence (AI) led to outsized performance in large tech stocks out of the gate. The top seven stocks now represent almost 15% of the Fund’s “broadly diversified” benchmark (which encompasses more than 15,000 securities). These mega-cap companies drove a significant amount of the market’s performance in 2023. Their concentration and outsized influence are even higher in domestic indexes. Index performance looked much different at the end of October—still positive for the year, but sentiment and performance were struggling. However, a few hints from the U.S. Federal Reserve (the “Fed”) about potential (key word: potential) rate cuts in 2024 caused the market to shoot up in the last eight weeks of the year. It remains to be seen whether market hopes jumped ahead of reality. Unfortunately, the optimistic valuations for many stocks leave little room for disappointment of any kind, Fed-induced or otherwise. Portfolio Review Our Fund did not participate in the enthusiasm for AI. In fact, we tend to avoid whatever the major buzzword may be in any given year. The “next big thing” makes for lively discussion at parties, but returns from today’s party topics tend to disappoint. While performance was positive, it was not a great year. Much of the disappointment stemmed from a steep decline in one of the Fund’s top holdings. Our stance on concentration hasn’t changed—we believe it remains a key element of outperformance over long periods—but a differentiated portfolio can cut both ways and it impacted performance this year. We ended the year with 45 positions, with the top ten representing 44.2% of the Fund’s net assets. For the first time in many years, the Fund’s weighting in domestic securities has increased. Within the top ten, four positions are U.S. companies. After years of U.S. small-caps underperforming their large-cap growth counterparts (which have dominated investor capital and attention), the widening spread has created a few interesting opportunities. However, our conviction remains that the best | | opportunities are outside the U.S., and the Fund remains overwhelmingly positioned in small international value stocks. Broadly, valuation differentials in that area are as extreme as we’ve seen in years, but stock picking is still crucial. Take the Fund’s exposure to energy—after a strong two years, the energy sector was down almost -5% in 2023 (only utilities were worse). Oil & gas equities faced a weak macro environment and extreme price volatility in the underlying commodity. Yet, the largest contributor to Fund performance was an upstream oil & gas stock, Unit Corp., with a total return of more than 40% during the year. Across the Fund’s energy sector holdings, the median stock was positive on the year. This demonstrates again that our willingness to search far and wide to find value can lead to differentiated returns. The goal is to translate that success to the rest of the Fund. Drive (or Invest?) to Survive In our last annual letter, we likened value investing to “steady treadmill work.” Fund performance this year was rather pedestrian (barely a walking pace?), but more importantly we kept moving. Meanwhile, the market feels like it’s ramped up its treadmill straight to a 12-mph sprint, but without any warm-up or conditioning to hold that pace safely. There are plenty of videos on YouTube to demonstrate treadmill mishaps at that speed. We’ll extend our analogy to an even more perilous activity than walking or running: auto racing. We recently watched the Netflix series Formula 1: Drive to Survive. It is an entertaining series, and we couldn’t help but think about its application to investing. Like the large-cap growth stocks today, the top F1 teams seem to keep on winning—they have significant advantages in technology, drivers, and capital (although budget rules have changed to help level the playing field). These are huge advantages, but it’s very hard to consistently win. Competition is brutal and constantly adapting. While we can appreciate the excellence of top stocks, just like Lewis Hamilton or Max Verstappen in F1, betting on them to win every race has minimal upside. However, while the performance of the top teams is impressive, much of the series focuses on the “midfield,” the pack of cars outside of the top few teams. For these teams, the glory of a podium finish is a rare occurrence. Considering their budget and skill level, scoring even a point or two is a significant achievement. By comparison, a tenth-place finish for Mercedes-AMG or Red Bull Racing would be a massive disappointment Yet, that is a solid finish for the other teams. Expectations are different. | | Especially for those midfield contenders, getting two drivers to the finish line itself is often an achievement. Cars in the middle of the pack are constantly jostling for position in the crowd, which means more collisions. An essential element of value investing is outperforming the market’s modest expectations. Sometimes that means just avoiding the big crashes. The goal is not necessarily to spray champagne on the podium after every race—it’s winning by not losing. An absolute prerequisite to scoring points is finishing the race. Just like investing. Contributors / Detractors The three most significant contributors were Unit, Legacy Housing, and Delfi. This lineup shows the range of investment ideas in the Fund: oil & gas, manufactured homes, and chocolate. Unit was added to the Fund in early 2023 and made an immediate impact. After emerging from a 2020 bankruptcy with a much better balance sheet, Unit traded on the over-the-counter exchange, out of sight for most investors. The company was also a grab-bag of assets across midstream gathering systems, land drilling services, and upstream oil & gas production. Unit benefited from a strong upswing in its rig business in 2023, divested its midstream segment, and pivoted toward a significant capital return program. Unit capped the year by paying $22.50 per share in distributions in December, or more than 45% of the Fund’s initial purchase price. Not a bad yield! Unit exemplifies our approach—finding truly off-the-radar securities where most funds cannot invest. We mentioned both Legacy and Delfi as top contributors in our semi-annual letter for the period ended June 30, 2023. Much of their contribution occurred in the first half of the year as both shares re-rated from significantly lower valuations. As a manufactured housing builder, Legacy’s more reasonably priced product stood out against the sky-high prices and affordability challenges in the traditional housing market. Legacy’s loan book remains a key competitive advantage and has helped the company grow its equity at double-digit rates for years. Delfi’s strong run in the first half of 2023 reversed a bit as the chocolate producer’s shares seemed to be under pressure due to rapidly rising cocoa prices. It may take some time for Delfi to pass along those costs to consumers, but we are |
26
| | |
| | | AMG Yacktman Special Opportunities Fund Portfolio Manager’s Comments (continued) |
| | | |
| | | |
| | | | |
confident that they will do so in time. In our opinion, Delfi remains a crown jewel asset if and when the family shareholders decide to sell. The top three detractors were Omni Bridgeway, Texhong International Group, and Naked Wines. As the Fund’s largest position entering the year (and for much of the Fund’s history), Omni’s share price performance in 2023 was disappointing. Given its weighting, it was by far the largest detractor. We believe the business is taking the necessary steps to demonstrate the inherent value in its case portfolio. The case-level returns are there (as evidence, all of the marque limited partners (LPs) in Omni’s recent funds have re-committed to hundreds of millions of new investment), but this has not yet shown up in shareholder returns. It will take a few quarters of steady case performance translating to consistent profits to restore market confidence in Omni’s shares. We like the non-correlated nature of this asset class but acknowledge that the next 12–18 months are an important testing point for Omni’s business model. Texhong faced a challenging year as the yarn industry lapped the record surge in demand through the pandemic. Texhong is one of the largest players in the industry with significant benefits from economies of scale—if they are struggling to this degree, we believe the rest of the players are in dire straits. Bear markets are when top companies can extend their leadership position. Management has | | recently sold some non-core, non-income producing assets to help delever the balance sheet. Sentiment toward anything Hong Kong/China-related is also at an all-time low. Given geopolitical challenges, this is the Fund’s only direct exposure to the region, and we are comforted that a large part of Texhong’s business is based outside of China (namely in Vietnam). Naked Wines has also suffered from post-pandemic headwinds. However, this was compounded by operational missteps and over-optimistic growth projections. In 2023, the company faced a shrinking top line and subscriber base, too much inventory, and tight financial covenants on its credit facility—a bad combination. The share price declined dramatically to below the net current assets on its balance sheet. The market was signaling the company was worth more dead than alive despite a subscriber base of over 600,000 customers (a valuable asset). The CEO resigned in response to these missteps. The original founder returned and immediately instituted self-help measures to right size the business, including much-needed cost reductions. The stock is still pricing in little upside potential, with the downside protected by its current assets. We expect material cash generation over the next 18 months. Conclusion: Investors have been conditioned for the past decade (or more) that every market pullback should be bought. First, the rationale was low interest rates. | | Then, because the Fed always rescued the market. Ultimately, we think it boils down to a sentiment that “markets always go up.” However, at some point, valuations exert an inexorable pull-on stock prices—even if business performance is decent. Ask an emerging market investor. The Hong Kong stock market is now at prices first seen in 1997. South Korean investors recently went through a 30+ year period where returns were flat in U.S. Dollar terms. Similar decade-plus stretches of low-to-no returns have happened in the U.S. market as well (yes, it’s true). When the market is going 200 mph, the margin between a podium finish and disaster is razor thin. Winning the race means avoiding a DNF (did not finish). Long-term success in investing requires a steady, disciplined approach—even though the all-out pace of an F1 driver can seem more exciting. Our goal remains to produce attractive risk-adjusted returns over a full market cycle. We appreciate the Fund’s shareholders who entrust us with their capital to pursue this goal. The views expressed represent the opinions of Yacktman Asset Management LP as of December 31, 2023, and are not intended as a forecast or guarantee of future results, and are subject to change without notice. |
27
| | |
| | | AMG Yacktman Special Opportunities Fund Portfolio Manager’s Comments (continued) |
| | | |
| | |
CUMULATIVE TOTAL RETURN PERFORMANCE
AMG Yacktman Special Opportunities Fund’s cumulative total return is based on the daily change in net asset value (NAV), and assumes that all dividends and distributions were reinvested. The graph compares a hypothetical $10,000 investment made in the AMG Yacktman Special Opportunities Fund’s Class Z shares on June 30, 2014 (inception date), to a $10,000 investment made in the MSCI ACWI All Cap Index for the same time period. The graph and table do not reflect the deduction of taxes that a shareholder would pay on a Fund distribution or redemption of shares. The listed returns for the Fund are net of expenses and the returns for the index exclude expenses. Total returns would have been lower had certain expenses not been reduced.
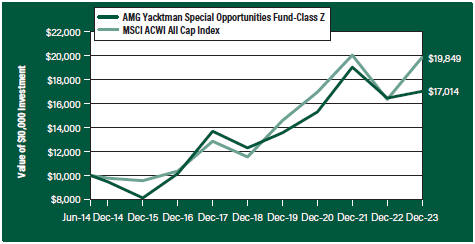
The table below shows the average annual total returns for the AMG Yacktman Special Opportunities Fund and the MSCI ACWI All Cap Index for the same time periods ended December 31, 2023.
| | | | | | | | | | | | | | | | |
| | | One | | | Five | | | Since | | | Inception | |
Average Annual Total Returns1 | | Year | | | Years | | | Inception | | | Date | |
|
AMG Yacktman Special Opportunities Fund2, 3, 4, 5, 6, 7, 8, 9, 10, 11, 12, 13, 14, 15, 16, 17, 18, 19, 20, 21, 22, 23, 24, 25 | |
| | | | |
Class I | | | 3.24 | % | | | 6.60 | % | | | 7.15 | % | | | 06/30/15 | |
| | | | |
Class Z | | | 3.44 | % | | | 6.71 | % | | | 5.75 | % | | | 06/30/14 | |
| | | | |
MSCI ACWI All Cap Index26 | | | 21.46 | % | | | 11.46 | % | | | 7.48 | % | | | 06/30/14 | † |
The performance data shown represents past performance. Past performance is not a guarantee of future results. Current performance may be lower or higher than the performance data quoted. The investment return and principal value of an investment will fluctuate so that an investor’s shares, when redeemed, may be worth more or less than their original cost.
Investors should carefully consider the Fund’s investment objectives, risks, charges and expenses before investing. For performance information through the most recent month end, current net asset values per share for the Fund and other information, please call 800.548.4539 or visit our website at wealth.amg.com for a free prospectus. Read it carefully before investing or sending money.
Distributed by AMG Distributors, Inc., member FINRA/SIPC.
| † | Date reflects the inception date of the Fund, not the index. |
| 1 | Total return equals income yield plus share price change and assumes reinvestment of all dividends and capital gain distributions. Returns are net of fees and may reflect offsets of Fund expenses as described in the prospectus. No adjustment has been made for taxes payable by shareholders on their reinvested dividends and capital gain distributions. Returns for periods greater than one year are annualized. The listed returns on the Fund are net of expenses and based on the published NAV as of December 31, 2023. All returns are in U.S. Dollars ($). |
|
2 From time to time, the Fund’s Investment Manager has waived its fees and/or absorbed Fund expenses, which has resulted in higher returns. 3 Market prices of investments held by the Fund may fall rapidly or unpredictably due to a variety of factors, including economic, political, or market conditions, or other factors including terrorism, war, natural disasters and the spread of infectious illness or other public health issues, including epidemics or pandemics, or in response to events that affect particular industries or companies. 4 The stocks of large-capitalization companies are generally more mature and may not be able to reach the same levels of growth as the stocks of small- or mid-capitalization companies. 5 The stocks of small- and mid-capitalization companies often have greater price volatility, lower trading volume, and less liquidity than the stocks of larger, more established companies. 6 The stocks of microcapitalization companies often have greater price volatility, lower trading volume, and less liquidity than the stocks of larger, more established companies. |
7 Value stocks may perform differently from the market as a whole and may be undervalued by the market for a long period of time. 8 The Fund may not be able to dispose of particular investments, such as illiquid securities, readily at favorable times or prices or the Fund may have to sell them at a loss. 9 Because the Fund is an actively managed investment portfolio, security selection or focus on securities in a particular style, market sector or group of companies may cause the Fund to incur losses or underperform relative to its benchmark or other funds with a similar investment objective. There can be no guarantee that the Subadviser’s investment techniques and risk analysis will produce the desired result. 10 The prospect of a positive or negative performance adjustment may create an incentive for the Fund’s portfolio manager to take greater risks with the Fund’s portfolio. In addition, because performance adjustments are based upon past performance, a shareholder may pay a higher or lower management fee for performance that occurred prior to the shareholder’s investment in the Fund. 11 The Fund is non-diversified and therefore a greater percentage of holdings may be focused in a small number of issuers or a single issuer, which can place the Fund at greater risk. Notwithstanding the Fund’s status as a “non-diversified” investment company under the Investment Company Act of 1940, as amended (the “1940 Act”), the Fund intends to qualify as a regulated investment company accorded favorable tax treatment under the Internal |
28
| | |
| | | AMG Yacktman Special Opportunities Fund Portfolio Manager’s Comments (continued) |
| | | |
| | | |
| | | | |
Revenue Code of 1986, as amended, which imposes its own diversification requirements that are less restrictive than the requirements applicable to “diversified” investment companies under the 1940 Act. The Fund’s intention to qualify as a regulated investment company may limit its pursuit of its investment strategy and its investment strategy could limit its ability to so qualify. 12 To the extent the Fund invests a substantial portion of its assets in a relatively small number of securities or a particular market, industry, group of industries, country, region, group of countries, asset class or sector, it generally will be subject to greater risk than a fund that invests in a more diverse investment portfolio. In addition, the value of the Fund would be more susceptible to any single economic, market, political or regulatory occurrence affecting, for example, that particular market, industry, region or sector. 13 Issuers and companies that are in similar industry sectors may be similarly affected by particular economic or market events; to the extent the Fund has substantial holdings within a particular sector, the risks associated with that sector increase. 14 Investments in foreign issuers involve additional risks (such as risks arising from less frequent trading, changes in political or social conditions, and less publicly available information about non-U.S. issuers) that differ from those associated with investments in U.S. issuers and may result in greater price volatility. 15 Investments in emerging markets are subject to the general risks of foreign investments, as well as additional risks which can result in greater price volatility. Such additional risks include the risk that markets in emerging market countries are typically less developed and less liquid than markets in developed countries and such markets are subjected to increased economic, political, or regulatory uncertainties. 16 Changes in the general political and social environment of a country can have substantial effects on the value of investments exposed to that country. 17 Fluctuations in exchange rates may affect the total loss or gain on a non-U.S. Dollar investment when converted back to U.S. Dollars and exposure to non-U.S. currencies may subject the Fund to the | | risk that those currencies will decline in value relative to the U.S. Dollar. 18 Convertible preferred stocks, which are convertible into shares of the issuer’s common stock and pay regular dividends, and convertible debt securities, which are convertible into shares of the issuer’s common stock and bear interest, are subject to the risks of equity securities and fixed income securities. The lower the conversion premium, the more likely the price of the convertible security will follow the price of the underlying common stock. Conversely, higher premium convertible securities are more likely to exhibit the behavior of bonds because the likelihood of conversion is lower, which may cause their prices to fall as interest rates rise. There is the risk that the issuer of convertible preferred stock will not be able to make dividend payments or that the issuer of a convertible bond will not be able to make principal and/or interest payments. 19 The value of a debt security changes in response to various factors, including, for example, market-related factors, such as changes in interest rates or changes in the actual or perceived ability of an issuer to meet its obligations. Investments in debt securities are subject to, among other risks, credit risk, interest rate risk, extension risk, prepayment risk and liquidity risk. 20 Below investment grade debt securities and unrated securities of similar credit quality (commonly known as “junk bonds” or “high yield securities”) may be subject to greater levels of interest rate, credit, liquidity, and market risk than higher-rated securities. These securities are considered predominately speculative with respect to the issuer’s continuing ability to make principal and interest payments. 21 Fixed coupon payments (cash flows) of bonds and debt securities may become less competitive with the market in periods of rising interest rates and cause bond prices to decline. During periods of increasing interest rates, the Fund may experience high levels of volatility and shareholder redemptions, and may have to sell securities at times when it would otherwise not do so, and at unfavorable prices, which could reduce the returns of the Fund. 22 The issuer of bonds or other debt securities or a counterparty to a derivatives contract may be | | unable or unwilling, or may be perceived as unable or unwilling, to make timely interest, principal or settlement payments or otherwise honor its obligations. 23 The use of derivatives involves costs, the risk that the value of derivatives may not correlate perfectly with their underlying assets, rates or indices, liquidity risk, and the risk of mispricing or improper valuation. The use of derivatives may not succeed for various reasons, and the complexity and rapidly changing structure of derivatives markets may increase the possibility of market losses. 24 There is no guarantee that hedging strategies will be successful. For example, changes in the value of a hedging transaction may not completely offset changes in the value of the assets and liabilities being hedged. Hedging transactions involve costs and may result in losses. 25 A short sale of a security involves the theoretical risk of unlimited loss because of potential unlimited increases in the market price of the security sold short. The Fund’s use of short sales, in certain circumstances, can result in significant losses. 26 The MSCI ACWI All Cap Index captures large-, mid-, small- and micro-capitalization representation across certain Developed Markets (DM) and large-, mid- and small-capitalization representation across certain Emerging Markets (EM). The Index is comprehensive, covering a significant percentage of the global equity investment opportunity set. Please go to msci.com for most current list of countries represented by the index. Unlike the Fund, the MSCI ACWI All Cap Index is unmanaged, is not available for investment and does not incur expenses. All MSCI data is provided “as is”. The products described herein are not sponsored or endorsed and have not been reviewed or passed on by MSCI. In no event shall MSCI, its affiliates or any MSCI data provider have any liability of any kind in connection with the MSCI data or the products described herein. Copying or redistributing the MSCI data is strictly prohibited. Not FDIC insured, nor bank guaranteed. May lose value. |
29
| | |
| | |
| | | AMG Yacktman Special Opportunities Fund Fund Snapshots (unaudited) December 31, 2023 |
| | | |
| | |
PORTFOLIO BREAKDOWN
| | | | | |
| Sector | | % of
Net Assets |
| | |
Industrials | | | | 23.9 | |
| | |
Energy | | | | 20.3 | |
| | |
Consumer Discretionary | | | | 15.7 | |
| | |
Materials | | | | 10.8 | |
| | |
Consumer Staples | | | | 9.8 | |
| | |
Financials | | | | 7.4 | |
| | |
Information Technology | | | | 2.4 | |
| | |
Utilities | | | | 0.6 | |
| | |
Communication Services | | | | 0.3 | |
| | |
Short-Term Investments | | | | 11.9 | |
| | |
Other Assets, less Liabilities | | | | (3.1 | ) |
TOP TEN HOLDINGS
| | |
| Security Name | | % of
Net Assets |
| |
Omni Bridgeway, Ltd. (Australia) | | 5.5 |
| |
Total Energy Services, Inc. (Canada) | | 5.3 |
| |
Legacy Housing Corp. (United States) | | 5.2 |
| |
U-Haul Holding Co., Non-Voting Shares (United States) | | 4.9 |
| |
Brickability Group PLC (United Kingdom) | | 4.4 |
| |
Unit Corp. (United States) | | 4.2 |
| |
Italian Wine Brands S.P.A (Italy) | | 3.8 |
| |
Cie de L’Odet SE (France) | | 3.7 |
| |
Macfarlane Group PLC (United Kingdom) | | 3.7 |
| |
America’s Car-Mart, Inc. (United States) | | 3.5 |
| |
Top Ten as a Group | | 44.2 |
| | |
NEW POSITIONS 1
| | | | | |
| Security Name | | Current Shares Held |
| | |
A-Mark Precious Metals, Inc. (United States) | | | | 45,000 | |
| | |
Italian Design Brands S.P.A. (Italy) | | | | 115,000 | |
| | |
| | | | | |
FULL SALES 1
| | | | |
| Security Name | | Net Shares Sold | |
| |
Ifis Japan, Ltd. (Japan) | | | 92,000 | |
| 1 | For the six months ended December 31, 2023 |
Because a fund’s strategy may result in multiple investments in particular sectors of the economy, its performance may depend on the performance of those sectors and may fluctuate more widely than investments diversified across more sectors. For additional information on these and other risk considerations, please see the Fund’s prospectus.
Any sectors, industries, or securities discussed should not be perceived as investment recommendations. Mention of a specific security should not be considered a recommendation to buy or solicitation to sell that security. Specific securities mentioned in this report may have been sold from the Fund’s portfolio of investments by the time you receive this report.
30
| | |
| | |
| | | AMG Yacktman Special Opportunities Fund Schedule of Portfolio Investments December 31, 2023 |
| | | |
| | |
| | | | | | | | |
| | | Shares | | | Value | |
| | |
Common Stocks - 89.6% | | | | | | | | |
| |
Communication Services - 0.3% | | | | | |
| | |
Reading International, Inc., Class A (United States)* | | | 120,000 | | | | $229,200 | |
| |
Consumer Discretionary - 15.7% | | | | | |
| | |
America’s Car-Mart, Inc. (United States)* | | | 34,000 | | | | 2,576,180 | |
| | |
B&S Group, S.A.R.L. (Luxembourg)1 | | | 185,000 | | | | 754,633 | |
| | |
Dong Ah Tire & Rubber Co., Ltd. (South Korea) | | | 70,000 | | | | 650,959 | |
| | |
Italian Design Brands S.P.A. (Italy)*,2 | | | 115,000 | | | | 1,292,394 | |
| | |
Legacy Housing Corp. (United States)* | | | 150,000 | | | | 3,783,000 | |
| | |
Texhong International Group, Ltd. (Hong Kong)* | | | 4,312,000 | | | | 2,418,718 | |
| |
Total Consumer Discretionary | | | | 11,475,884 | |
| |
Consumer Staples - 9.8% | | | | | |
| | |
Delfi, Ltd. (Singapore) | | | 3,000,000 | | | | 2,544,957 | |
| | |
Italian Wine Brands S.P.A (Italy) | | | 130,000 | | | | 2,735,569 | |
| | |
Naked Wines PLC (United Kingdom)* | | | 1,350,000 | | | | 946,428 | |
| | |
NeoPharm Co., Ltd. (South Korea) | | | 47,500 | | | | 952,191 | |
| |
Total Consumer Staples | | | | 7,179,145 | |
| |
Energy - 20.3% | | | | | |
| | |
Amplify Energy Corp. (United States)* | | | 120,000 | | | | 711,600 | |
| | |
Arrow Exploration Corp. (Canada)* | | | 7,850,000 | | | | 1,801,080 | |
| | |
Hargreaves Services PLC (United Kingdom) | | | 329,211 | | | | 1,741,460 | |
| | |
Hemisphere Energy Corp. (Canada) | | | 950,000 | | | | 924,871 | |
| | |
Horizon Oil, Ltd. (Australia) | | | 15,000,000 | | | | 1,584,985 | |
| | |
Noram Drilling A.S. (Norway) | | | 195,000 | | | | 785,859 | |
| | |
Pardee Resources Co., Inc. (United States) | | | 1,500 | | | | 382,500 | |
| | |
Total Energy Services, Inc. (Canada) | | | 675,800 | | | | 3,855,740 | |
| | |
Unit Corp. (United States) | | | 71,000 | | | | 3,065,780 | |
| |
Total Energy | | | | 14,853,875 | |
| |
Financials - 7.4% | | | | | |
| | |
A-Mark Precious Metals, Inc. (United States)2 | | | 45,000 | | | | 1,361,250 | |
| | |
Omni Bridgeway, Ltd. (Australia)* | | | 4,350,000 | | | | 4,018,089 | |
| |
Total Financials | | | | 5,379,339 | |
| |
Industrials - 23.9% | | | | | |
| | |
Boustead Singapore, Ltd. (Singapore) | | | 600,000 | | | | 390,750 | |
| | |
CB Industrial Product Holding Bhd (Malaysia) | | | 1,500,000 | | | | 437,432 | |
| | |
Cie de L’Odet SE (France) | | | 1,700 | | | | 2,732,010 | |
| | |
Fila S.P.A. (Italy) | | | 185,000 | | | | 1,793,146 | |
| | |
Komelon Corp. (South Korea) | | | 60,000 | | | | 424,746 | |
| | |
Macfarlane Group PLC (United Kingdom) | | | 1,825,175 | | | | 2,721,957 | |
| | |
Maezawa Industries, Inc. (Japan) | | | 115,000 | | | | 798,816 | |
| | |
Mitani Corp. (Japan) | | | 30,000 | | | | 414,402 | |
| | |
Ocean Wilsons Holdings, Ltd. (Bermuda) | | | 107,327 | | | | 1,641,652 | |
| | | | | | | | |
| | | Shares | | | Value | |
| | |
Sam Yung Trading Co., Ltd. (South Korea)* | | | 85,000 | | | | $817,726 | |
| | |
Sekisui Jushi Corp. (Japan) | | | 45,000 | | | | 791,486 | |
| | |
Sinko Industries, Ltd. (Japan) | | | 50,000 | | | | 945,140 | |
| | |
U-Haul Holding Co., Non-Voting Shares (United States) | | | 51,000 | | | | 3,592,440 | |
| |
Total Industrials | | | | 17,501,703 | |
| |
Information Technology - 0.8% | | | | | |
| | |
Bixolon Co., Ltd. (South Korea) | | | 130,000 | | | | 572,828 | |
| |
Materials - 10.8% | | | | | |
| | |
Amerigo Resources, Ltd. (Canada) | | | 975,000 | | | | 1,022,791 | |
| | |
Brickability Group PLC (United Kingdom) | | | 4,000,000 | | | | 3,212,444 | |
| | |
KISCO Holdings Co., Ltd. (South Korea)* | | | 55,000 | | | | 1,014,579 | |
| | |
Master Drilling Group, Ltd. (South Africa) | | | 641,581 | | | | 476,999 | |
| | |
Okamoto Industries, Inc. (Japan) | | | 39,000 | | | | 1,373,342 | |
| | |
Pumtech Korea Co., Ltd. (South Korea)* | | | 22,000 | | | | 407,844 | |
| | |
SK Kaken Co., Ltd. (Japan) | | | 7,000 | | | | 370,355 | |
| |
Total Materials | | | | 7,878,354 | |
| |
Utilities - 0.6% | | | | | |
| | |
Maxim Power Corp. (Canada)* | | | 140,000 | | | | 473,341 | |
| |
Total Common Stocks | | | | | |
(Cost $61,454,756) | | | | | | | 65,543,669 | |
| |
Preferred Stock - 1.6% | | | | | |
| |
Information Technology - 1.6% | | | | | |
| | |
Samsung Electronics Co., Ltd., 2.410% (South Korea) | | | 24,000 | | | | 1,156,476 | |
| |
Total Preferred Stock | | | | | |
(Cost $398,488) | | | | | | | 1,156,476 | |
| | |
| | | Principal Amount | | | | |
Short-Term Investments - 11.9% | | | | | |
| |
Joint Repurchase Agreements - 2.0%3 | | | | | |
| | |
Daiwa Capital Markets America, dated 12/29/23, due 01/02/24, 5.380% total to be received $475,774 (collateralized by various U.S. Government Agency Obligations and U.S. Treasuries, 0.000% - 7.500%, 03/22/24 -01/01/54, totaling $485,058) | | | $475,490 | | | | 475,490 | |
| | |
RBC Dominion Securities, Inc., dated 12/29/23, due 01/02/24, 5.340% total to be received $1,000,593 (collateralized by various U.S. Government Agency Obligations and U.S. Treasuries, 0.000% - 7.500%, 01/15/24 - 12/01/53, totaling $1,020,000) | | | 1,000,000 | | | | 1,000,000 | |
| |
Total Joint Repurchase Agreements | | | | 1,475,490 | |
The accompanying notes are an integral part of these financial statements.
31
| | |
| | |
| | | AMG Yacktman Special Opportunities Fund Schedule of Portfolio Investments (continued) |
| | | |
| | |
| | | | | | | | |
| | | Shares | | | Value | |
| |
Other Investment Companies - 9.9% | | | | | |
| | |
Dreyfus Institutional Preferred Government Money Market Fund, Institutional Shares, 5.32%4 | | | 7,222,819 | | | | $7,222,819 | |
| |
Total Short-Term Investments | | | | | |
(Cost $8,698,309) | | | | | | | 8,698,309 | |
| | | | | | | | |
| | | | | | Value | |
| |
Total Investments - 103.1% | | | | | |
(Cost $70,551,553) | | | | | | | $75,398,454 | |
| |
Other Assets, less Liabilities - (3.1)% | | | | (2,268,374 | ) |
| |
Net Assets - 100.0% | | | | ���$73,130,080 | |
| * | Non-income producing security. |
| 1 | Security exempt from registration under Rule 144A of the Securities Act of 1933. This security may be resold in transactions exempt from registration, normally to qualified institutional buyers. At December 31, 2023, the value of this security amounted to $754,633 or 1.0% of net assets. |
| 2 | Some of these securities, amounting to $1,379,835 or 1.9% of net assets, were out on loan to various borrowers and are collateralized by cash. See Note 4 of Notes to Financial Statements. |
| 3 | Cash collateral received for securities lending activity was invested in these joint repurchase agreements. |
| 4 | Yield shown represents the December 31, 2023, seven day average yield, which refers to the sum of the previous seven days’ dividends paid, expressed as an annual percentage. |
The following table summarizes the inputs used to value the Fund’s investments by the fair value hierarchy levels as of December 31, 2023:
| | | | | | | | | | | | | | | | |
| | | Level 1 | | | Level 21 | | Level 3 | | | Total |
| | | | |
Investments in Securities | | | | | | | | | | | | | | | | |
| | | | |
Common Stocks | | | | | | | | | | | | | | | | |
| | | | |
Industrials | | | $11,004,353 | | | | $6,497,350 | | | | — | | | | $17,501,703 | |
| | | | |
Energy | | | 12,483,031 | | | | 2,370,844 | | | | — | | | | 14,853,875 | |
| | | | |
Consumer Discretionary | | | 10,824,925 | | | | 650,959 | | | | — | | | | 11,475,884 | |
| | | | |
Materials | | | 1,499,790 | | | | 6,378,564 | | | | — | | | | 7,878,354 | |
| | | | |
Consumer Staples | | | 946,428 | | | | 6,232,717 | | | | — | | | | 7,179,145 | |
| | | | |
Financials | | | 1,361,250 | | | | 4,018,089 | | | | — | | | | 5,379,339 | |
| | | | |
Information Technology | | | — | | | | 572,828 | | | | — | | | | 572,828 | |
| | | | |
Utilities | | | 473,341 | | | | — | | | | — | | | | 473,341 | |
| | | | |
Communication Services | | | 229,200 | | | | — | | | | — | | | | 229,200 | |
| | | | |
Preferred Stock† | | | — | | | | 1,156,476 | | | | — | | | | 1,156,476 | |
| | | | |
Short-Term Investments | | | | | | | | | | | | | | | | |
| | | | |
Joint Repurchase Agreements | | | — | | | | 1,475,490 | | | | — | | | | 1,475,490 | |
| | | | |
Other Investment Companies | | | 7,222,819 | | | | — | | | | — | | | | 7,222,819 | |
| | | | | | | | | | | | | | | | |
| | | | |
Total Investments in Securities | | $ | 46,045,137 | | | $ | 29,353,317 | | | | — | | | $ | 75,398,454 | |
| | | | | | | | | | | | | | | | |
| | † | Preferred stock held in the Fund is a Level 2 security. For a detailed breakout of preferred stock by major industry classification, please refer to Schedule of Portfolio Investments. |
| | 1 | An external pricing service is used to reflect any impact on security value due to market movements between the time the Fund valued such foreign securities and the earlier closing of foreign markets. |
For the fiscal year ended December 31, 2023, there were no transfers in or out of Level 3.
The accompanying notes are an integral part of these financial statements.
32
| | |
| | |
| | | AMG Yacktman Special Opportunities Fund Schedule of Portfolio Investments (continued) |
| | | |
| | |
The country allocation in the Schedule of Portfolio Investments at December 31, 2023, was as follows:
| | |
| Country | | % of Long-Term Investments |
| |
Australia | | 8.4 |
| |
Bermuda | | 2.5 |
| |
Canada | | 12.1 |
| |
France | | 4.1 |
| |
Hong Kong | | 3.6 |
| |
Italy | | 8.7 |
| |
Japan | | 7.0 |
| |
Luxembourg | | 1.1 |
| |
Malaysia | | 0.7 |
| |
Norway | | 1.2 |
| |
Singapore | | 4.4 |
| |
South Africa | | 0.7 |
| |
South Korea | | 9.0 |
| |
United Kingdom | | 12.9 |
| |
United States | | 23.6 |
| | |
| |
| | | 100.0 |
| | |
The accompanying notes are an integral part of these financial statements.
33
| | |
| | |
| | | Statement of Assets and Liabilities December 31, 2023 |
| | | |
| | |
| | | | | | | | | | | | | | | | |
| | | AMG Yacktman
Fund | | AMG Yacktman
Focused Fund | | AMG Yacktman
Global Fund | | AMG Yacktman
Special
Opportunities Fund |
| | | | |
Assets: | | | | | | | | | | | | | | | | |
| | | | |
Investments at value1 (including securities on loan valued at $21,398,538, $125,117,590, $0, and $1,379,835, respectively) | | | $8,441,103,909 | | | | $3,766,059,451 | | | | $189,120,898 | | | | $75,398,454 | |
| | | | |
Affiliated Investments at value2 | | | — | | | | 20,002,911 | | | | — | | | | — | |
| | | | |
Cash | | | 7,392,335 | | | | 3,038,758 | | | | — | | | | — | |
| | | | |
Receivable for investments sold | | | — | | | | 11,529,858 | | | | — | | | | 6,147 | |
| | | | |
Interfund loan receivable | | | 11,278,643 | | | | — | | | | — | | | | — | |
| | | | |
Dividend and interest receivables | | | 25,220,632 | | | | 12,968,723 | | | | 1,496,899 | | | | 270,756 | |
| | | | |
Securities lending income receivable | | | 42,647 | | | | 29,891 | | | | — | | | | 341 | |
| | | | |
Receivable for Fund shares sold | | | 3,667,316 | | | | 1,403,281 | | | | 940,566 | | | | 33,305 | |
| | | | |
Receivable from affiliate | | | — | | | | — | | | | 10,325 | | | | 7,213 | |
| | | | |
Prepaid expenses and other assets | | | 35,289 | | | | 24,750 | | | | 19,869 | | | | 5,911 | |
| | | | |
Total assets | | | 8,488,740,771 | | | | 3,815,057,623 | | | | 191,588,557 | | | | 75,722,127 | |
| | | | |
Liabilities: | | | | | | | | | | | | | | | | |
| | | | |
Payable upon return of securities loaned | | | 4,521,804 | | | | 108,488,666 | | | | — | | | | 1,475,490 | |
| | | | |
Dividends payable to shareholders | | | — | | | | — | | | | 887,322 | | | | 314,875 | |
| | | | |
Payable for investments purchased | | | 873,900 | | | | 240,167 | | | | — | | | | 74,921 | |
| | | | |
Payable for Fund shares repurchased | | | 4,129,365 | | | | 2,287,830 | | | | 447,853 | | | | 631,041 | |
| | | | |
Accrued expenses: | | | | | | | | | | | | | | | | |
| | | | |
Investment advisory and management fees | | | 3,029,819 | | | | 2,681,842 | | | | 110,985 | | | | 33,856 | |
| | | | |
Administrative fees | | | 1,059,329 | | | | 462,387 | | | | 23,447 | | | | 9,265 | |
| | | | |
Shareholder service fees | | | 549,696 | | | | 273,710 | | | | 376 | | | | 3,303 | |
| | | | |
Other | | | 544,203 | | | | 290,429 | | | | 52,587 | | | | 49,296 | |
| | | | |
Total liabilities | | | 14,708,116 | | | | 114,725,031 | | | | 1,522,570 | | | | 2,592,047 | |
| | | | |
Commitments and Contingencies (Notes 2 & 6) | | | | | | | | | | | | | | | | |
| | | | |
Net Assets | | | $8,474,032,655 | | | | $3,700,332,592 | | | | $190,065,987 | | | | $73,130,080 | |
| | | | |
1 Investments at cost | | | $5,452,725,466 | | | | $2,606,162,787 | | | | $162,620,928 | | | | $70,551,553 | |
| | | | |
2 Affiliated Investments at cost | | | — | | | | $53,514,887 | | | | — | | | | — | |
The accompanying notes are an integral part of these financial statements.
34
| | |
| | |
| | | Statement of Assets and Liabilities (continued) |
| | | |
| | |
| | | | | | | | | | | | | | | | |
| | | AMG Yacktman
Fund | | AMG Yacktman
Focused Fund | | AMG Yacktman
Global Fund | | AMG Yacktman
Special
Opportunities Fund |
| | | | |
Net Assets Represent: | | | | | | | | | | | | | | | | |
| | | | |
Paid-in capital | | | $5,447,616,561 | | | | $2,531,934,462 | | | | $169,490,536 | | | | $70,496,498 | |
| | | | |
Total distributable earnings | | | 3,026,416,094 | | | | 1,168,398,130 | | | | 20,575,451 | | | | 2,633,582 | |
| | | | |
Net Assets | | | $8,474,032,655 | | | | $3,700,332,592 | | | | $190,065,987 | | | | $73,130,080 | |
| | | | |
Class N: | | | | | | | | | | | | | | | | |
| | | | |
Net Assets | | | — | | | | $1,798,470,900 | | | | $2,325,055 | | | | — | |
| | | | |
Shares outstanding | | | — | | | | 89,105,952 | | | | 151,929 | | | | — | |
| | | | |
Net asset value, offering and redemption price per share | | | — | | | | $20.18 | | | | $15.30 | | | | — | |
| | | | |
Class I: | | | | | | | | | | | | | | | | |
| | | | |
Net Assets | | | $8,474,032,655 | | | | $1,901,861,692 | | | | $187,740,932 | | | | $38,793,203 | |
| | | | |
Shares outstanding | | | 363,093,360 | | | | 94,627,543 | | | | 12,235,734 | | | | 3,631,798 | |
| | | | |
Net asset value, offering and redemption price per share | | | $23.34 | | | | $20.10 | | | | $15.34 | | | | $10.68 | |
| | | | |
Class Z: | | | | | | | | | | | | | | | | |
| | | | |
Net Assets | | | — | | | | — | | | | — | | | | $34,336,877 | |
| | | | |
Shares outstanding | | | — | | | | — | | | | — | | | | 3,204,864 | |
| | | | |
Net asset value, offering and redemption price per share | | | — | | | | — | | | | — | | | | $10.71 | |
The accompanying notes are an integral part of these financial statements.
35
| | |
| | |
| | | Statement of Operations For the fiscal year ended December 31, 2023 |
| | | |
| | |
| | | | | | | | | | | | | | | | |
| | | AMG Yacktman
Fund | | AMG Yacktman
Focused Fund | | AMG Yacktman
Global Fund | | AMG Yacktman
Special
Opportunities Fund |
| | | | |
Investment Income: | | | | | | | | | | | | | | | | |
| | | | |
Dividend income | | | $184,459,692 | | | | $78,638,276 | | | | $5,888,778 | 1 | | | $3,337,997 | 2 |
| | | | |
Interest income | | | 19,567,998 | | | | 7,392,604 | | | | 16,880 | | | | 2,883 | |
| | | | |
Dividends from affiliated securities | | | — | | | | 1,303,559 | | | | — | | | | — | |
| | | | |
Securities lending income | | | 108,588 | | | | 44,318 | | | | 165 | | | | 21,858 | |
| | | | |
Foreign withholding tax | | | (9,396,325 | ) | | | (6,014,672 | ) | | | (613,281 | ) | | | (160,130 | ) |
| | | | |
Total investment income | | | 194,739,953 | | | | 81,364,085 | | | | 5,292,542 | | | | 3,202,608 | |
| | | | |
Expenses: | | | | | | | | | | | | | | | | |
| | | | |
Investment advisory and management fees | | | 35,011,696 | | | | 31,218,159 | | | | 1,230,365 | | | | 619,235 | |
| | | | |
Administrative fees | | | 12,236,320 | | | | 5,382,441 | | | | 259,936 | | | | 121,829 | |
| | | | |
Shareholder servicing fees - Class N | | | — | | | | 3,254,610 | | | | 3,784 | | | | — | |
| | | | |
Shareholder servicing fees - Class I | | | 6,941,609 | | | | — | | | | — | | | | 44,956 | |
| | | | |
Professional fees | | | 740,346 | | | | 349,744 | | | | 52,299 | | | | 43,798 | |
| | | | |
Custodian fees | | | 733,328 | | | | 392,302 | | | | 50,964 | | | | 51,069 | |
| | | | |
Trustee fees and expenses | | | 601,271 | | | | 264,480 | | | | 12,843 | | | | 5,905 | |
| | | | |
Transfer agent fees | | | 427,990 | | | | 211,532 | | | | 7,791 | | | | 3,213 | |
| | | | |
Reports to shareholders | | | 342,905 | | | | 161,417 | | | | 7,881 | | | | 9,456 | |
| | | | |
Registration fees | | | 101,295 | | | | 92,946 | | | | 35,031 | | | | 20,780 | |
| | | | |
Miscellaneous | | | 398,715 | | | | 176,172 | | | | 9,198 | | | | 6,398 | |
| | | | |
Repayment of prior reimbursements | | | — | | | | 11,961 | | | | — | | | | — | |
| | | | |
Total expenses before offsets | | | 57,535,475 | | | | 41,515,764 | | | | 1,670,092 | | | | 926,639 | |
| | | | |
Expense reimbursements | | | — | | | | — | | | | (53,342 | ) | | | (43,125 | ) |
| | | | |
Fee waivers | | | (174,733 | ) | | | (33,458 | ) | | | — | | | | — | |
| | | | |
Net expenses | | | 57,360,742 | | | | 41,482,306 | | | | 1,616,750 | | | | 883,514 | |
| | | | | | | | | | | | | | | | |
| | | | |
Net investment income | | | 137,379,211 | | | | 39,881,779 | | | | 3,675,792 | | | | 2,319,094 | |
| | | | |
Net Realized and Unrealized Gain (Loss): | | | | | | | | | | | | | | | | |
| | | | |
Net realized gain on investments | | | 229,780,266 | | | | 156,618,332 | | | | 5,264,355 | | | | 2,257,143 | |
| | | | |
Net realized gain on written options | | | — | | | | 7,628,769 | | | | — | | | | — | |
| | | | |
Net realized loss on foreign currency transactions | | | (610,184 | ) | | | (766,378 | ) | | | (104,871 | ) | | | (30,184 | ) |
| | | | |
Net change in unrealized appreciation/depreciation on investments | | | 805,420,273 | | | | 353,260,143 | | | | 17,850,936 | | | | (2,611,187 | ) |
| | | | |
Net change in unrealized appreciation/depreciation on affiliated investments | | | — | | | | (5,654,527 | ) | | | — | | | | — | |
| | | | |
Net change in unrealized appreciation/depreciation on written options | | | — | | | | 77,729 | | | | — | | | | — | |
| | | | |
Net change in unrealized appreciation/depreciation on foreign currency translations | | | 379,376 | | | | 141,186 | | | | (1,403 | ) | | | 765 | |
| | | | |
Net realized and unrealized gain (loss) | | | 1,034,969,731 | | | | 511,305,254 | | | | 23,009,017 | | | | (383,463 | ) |
| | | | | | | | | | | | | | | | |
| | | | |
Net increase in net assets resulting from operations | | | $1,172,348,942 | | | | $551,187,033 | | | | $26,684,809 | | | | $1,935,631 | |
| 1 | Includes non-recurring dividends of $ 630,400. |
| 2 | Includes non-recurring dividends of $ 372,987. |
The accompanying notes are an integral part of these financial statements.
36
| | |
| | |
| | | Statements of Changes in Net Assets For the fiscal years ended December 31, |
| | | |
| | |
| | | | | | | | | | | | | | | | |
| | | AMG Yacktman
Fund | | | AMG Yacktman
Focused Fund | |
| | | | |
| | | 2023 | | | 2022 | | | 2023 | | | 2022 | |
| | | | |
Increase (Decrease) in Net Assets Resulting From Operations: | | | | | | | | | | | | | | | | |
| | | | |
Net investment income | | | $137,379,211 | | | | $131,992,691 | | | | $39,881,779 | | | | $48,203,876 | |
| | | | |
Net realized gain on investments | | | 229,170,082 | | | | 359,428,136 | | | | 163,480,723 | | | | 170,369,987 | |
| | | | |
Net change in unrealized appreciation/depreciation on investments | | | 805,799,649 | | | | (1,194,880,359 | ) | | | 347,824,531 | | | | (573,645,767 | ) |
| | | | | | | | | | | | | | | | |
| | | | |
Net increase (decrease) in net assets resulting from operations | | | 1,172,348,942 | | | | (703,459,532 | ) | | | 551,187,033 | | | | (355,071,904 | ) |
| | | | |
Distributions to Shareholders: | | | | | | | | | | | | | | | | |
| | | | |
Class N | | | — | | | | — | | | | (77,433,936 | ) | | | (124,361,503 | ) |
| | | | |
Class I | | | (360,103,585 | ) | | | (557,461,732 | ) | | | (84,719,132 | ) | | | (134,536,532 | ) |
| | | | |
Total distributions to shareholders | | | (360,103,585 | ) | | | (557,461,732 | ) | | | (162,153,068 | ) | | | (258,898,035 | ) |
| | | | |
Capital Share Transactions:1 | | | | | | | | | | | | | | | | |
| | | | |
Net decrease from capital share transactions | | | (311,253,360 | ) | | | (241,661,122 | ) | | | (225,102,893 | ) | | | (317,483,501 | ) |
| | | | | | | | | | | | | | | | |
| | | | |
Total increase (decrease) in net assets | | | 500,991,997 | | | | (1,502,582,386 | ) | | | 163,931,072 | | | | (931,453,440 | ) |
| | | | |
Net Assets: | | | | | | | | | | | | | | | | |
| | | | |
Beginning of year | | | 7,973,040,658 | | | | 9,475,623,044 | | | | 3,536,401,520 | | | | 4,467,854,960 | |
| | | | | | | | | | | | | | | | |
| | | | |
End of year | | | $8,474,032,655 | | | | $7,973,040,658 | | | | $3,700,332,592 | | | | $3,536,401,520 | |
1 See Note 1(g) of the Notes to Financial Statements.
The accompanying notes are an integral part of these financial statements.
37
| | |
| | |
| | | Statements of Changes in Net Assets (continued) For the fiscal years ended December 31, |
| | | |
| | |
| | | | | | | | | | | | | | | | |
| | | AMG Yacktman
Global Fund | | | AMG Yacktman
Special
Opportunities Fund | |
| | | | |
| | | 2023 | | | 2022 | | | 2023 | | | 2022 | |
| | | | |
Increase (Decrease) in Net Assets Resulting From Operations: | | | | | | | | | | | | | | | | |
| | | | |
Net investment income | | | $3,675,792 | | | | $2,582,542 | | | | $2,319,094 | | | | $742,278 | |
| | | | |
Net realized gain on investments | | | 5,159,484 | | | | 5,161,445 | | | | 2,226,959 | | | | 336,254 | |
| | | | |
Net change in unrealized appreciation/depreciation on investments | | | 17,849,533 | | | | (23,916,430 | ) | | | (2,610,422 | ) | | | (16,505,510 | ) |
| | | | | | | | | | | | | | | | |
| | | | |
Net increase (decrease) in net assets resulting from operations | | | 26,684,809 | | | | (16,172,443 | ) | | | 1,935,631 | | | | (15,426,978 | ) |
| | | | |
Distributions to Shareholders: | | | | | | | | | | | | | | | | |
| | | | |
Class N | | | (164,990 | ) | | | (51,267 | ) | | | — | | | | — | |
| | | | |
Class I | | | (14,169,608 | ) | | | (6,262,235 | ) | | | (3,386,442 | ) | | | (398,986 | ) |
| | | | |
Class Z | | | — | | | | — | | | | (2,979,968 | ) | | | (342,692 | ) |
| | | | |
Total distributions to shareholders | | | (14,334,598 | ) | | | (6,313,502 | ) | | | (6,366,410 | ) | | | (741,678 | ) |
| | | | |
Capital Share Transactions:1 | | | | | | | | | | | | | | | | |
| | | | |
Net increase (decrease) from capital share transactions | | | 26,870,906 | | | | 2,240,388 | | | | (6,245,176 | ) | | | (12,133,984 | ) |
| | | | | | | | | | | | | | | | |
| | | | |
Total increase (decrease) in net assets | | | 39,221,117 | | | | (20,245,557 | ) | | | (10,675,955 | ) | | | (28,302,640 | ) |
| | | | |
Net Assets: | | | | | | | | | | | | | | | | |
| | | | |
Beginning of year | | | 150,844,870 | | | | 171,090,427 | | | | 83,806,035 | | | | 112,108,675 | |
| | | | | | | | | | | | | | | | |
| | | | |
End of year | | | $190,065,987 | | | | $150,844,870 | | | | $73,130,080 | | | | $83,806,035 | |
1 See Note 1(g) of the Notes to Financial Statements.
The accompanying notes are an integral part of these financial statements.
38
| | |
| | |
| | | AMG Yacktman Fund Financial Highlights For a share outstanding throughout each fiscal year |
| | | |
| | |
| | | | | | | | | | | | | | | | | | | | |
| | | For the fiscal years ended December 31, | |
| | | | | |
| Class I | | 2023 | | | 2022 | | | 2021 | | | 2020 | | | 2019 |
| | | | | |
Net Asset Value, Beginning of Year | | | $21.13 | | | | $24.50 | | | | $21.26 | | | | $20.48 | | | | $19.05 | |
| | | | | |
Income (loss) from Investment Operations: | | | | | | | | | | | | | | | | | | | | |
| | | | | |
Net investment income1,2 | | | 0.38 | | | | 0.35 | | | | 0.26 | 3 | | | 0.27 | | | | 0.35 | |
| | | | | |
Net realized and unrealized gain (loss) on investments | | | 2.86 | | | | (2.17 | ) | | | 3.89 | | | | 2.81 | | | | 2.99 | |
| | | | | |
Total income (loss) from investment operations | | | 3.24 | | | | (1.82 | ) | | | 4.15 | | | | 3.08 | | | | 3.34 | |
| | | | | |
Less Distributions to Shareholders from: | | | | | | | | | | | | | | | | | | | | |
| | | | | |
Net investment income | | | (0.42 | ) | | | (0.33 | ) | | | (0.27 | ) | | | (0.28 | ) | | | (0.37 | ) |
| | | | | |
Net realized gain on investments | | | (0.61 | ) | | | (1.22 | ) | | | (0.64 | ) | | | (2.02 | ) | | | (1.54 | ) |
| | | | | |
Total distributions to shareholders | | | (1.03 | ) | | | (1.55 | ) | | | (0.91 | ) | | | (2.30 | ) | | | (1.91 | ) |
| | | | | |
Net Asset Value, End of Year | | | $23.34 | | | | $21.13 | | | | $24.50 | | | | $21.26 | | | | $20.48 | |
| | | | | |
Total Return2,4 | | | 15.39 | % | | | (7.37 | )% | | | 19.63 | % | | | 15.28 | % | | | 17.66 | % |
| | | | | |
Ratio of net expenses to average net assets | | | 0.70 | % | | | 0.70 | % | | | 0.70 | % | | | 0.70 | % | | | 0.70 | % |
| | | | | |
Ratio of gross expenses to average net assets5 | | | 0.70 | % | | | 0.70 | % | | | 0.70 | % | | | 0.71 | % | | | 0.71 | % |
| | | | | |
Ratio of net investment income to average net assets2 | | | 1.68 | % | | | 1.54 | % | | | 1.09 | % | | | 1.38 | % | | | 1.70 | % |
| | | | | |
Portfolio turnover | | | 5 | % | | | 11 | % | | | 15 | % | | | 27 | % | | | 35 | % |
| | | | | |
Net assets end of year (000’s) omitted | | | $8,474,033 | | | | $7,973,041 | | | | $9,475,623 | | | | $7,636,139 | | | | $8,242,523 | |
| | | | | | | | | | | | | | | | | | | | | |
| 1 | Per share numbers have been calculated using average shares. |
| 2 | Total returns and net investment income would have been lower had certain expenses not been offset. |
| 3 | Includes non-recurring dividends. Without these dividends, net investment income per share would have been $0.21. |
| 4 | The total return is calculated using the published Net Asset Value as of fiscal year end. |
| 5 | Excludes the impact of expense reimbursement or fee waivers and expense reductions such as brokerage credits, but includes expense repayments and non-reimbursable expenses, if any, such as interest, taxes, and extraordinary expenses. (See Note 1(c) and 2 in the Notes to Financial Statements.) |
39
| | |
| | |
| | | AMG Yacktman Focused Fund Financial Highlights For a share outstanding throughout each fiscal year |
| | | |
| | |
| | | | | | | | | | | | | | | | | | | | |
| | | For the fiscal years ended December 31, | |
| | | | | |
| Class N | | 2023 | | | 2022 | | | 2021 | | | 2020 | | | 2019 |
| | | | | |
Net Asset Value, Beginning of Year | | | $18.11 | | | | $21.21 | | | | $19.09 | | | | $18.25 | | | | $17.78 | |
| | | | | |
Income (loss) from Investment Operations: | | | | | | | | | | | | | | | | | | | | |
| | | | | |
Net investment income1,2 | | | 0.20 | | | | 0.22 | | | | 0.14 | 3 | | | 0.15 | | | | 0.23 | |
| | | | | |
Net realized and unrealized gain (loss) on investments | | | 2.76 | | | | (1.94 | ) | | | 2.98 | | | | 2.95 | | | | 3.13 | |
| | | | | |
Total income (loss) from investment operations | | | 2.96 | | | | (1.72 | ) | | | 3.12 | | | | 3.10 | | | | 3.36 | |
| | | | | |
Less Distributions to Shareholders from: | | | | | | | | | | | | | | | | | | | | |
| | | | | |
Net investment income | | | (0.25 | ) | | | (0.21 | ) | | | (0.16 | ) | | | (0.15 | ) | | | (0.25 | ) |
| | | | | |
Net realized gain on investments | | | (0.64 | ) | | | (1.17 | ) | | | (0.84 | ) | | | (2.11 | ) | | | (2.64 | ) |
| | | | | |
Total distributions to shareholders | | | (0.89 | ) | | | (1.38 | ) | | | (1.00 | ) | | | (2.26 | ) | | | (2.89 | ) |
| | | | | |
Net Asset Value, End of Year | | | $20.18 | | | | $18.11 | | | | $21.21 | | | | $19.09 | | | | $18.25 | |
| | | | | |
Total Return2,4 | | | 16.45 | % | | | (8.06 | )% | | | 16.45 | % | | | 17.26 | % | | | 19.13 | % |
| | | | | |
Ratio of net expenses to average net assets | | | 1.25 | %5 | | | 1.25 | %5 | | | 1.25 | %5 | | | 1.24 | % | | | 1.24 | % |
| | | | | |
Ratio of gross expenses to average net assets6 | | | 1.25 | %5 | | | 1.25 | %5 | | | 1.25 | %5 | | | 1.26 | % | | | 1.26 | % |
| | | | | |
Ratio of net investment income to average net assets2 | | | 1.02 | % | | | 1.14 | % | | | 0.68 | % | | | 0.85 | % | | | 1.20 | % |
| | | | | |
Portfolio turnover | | | 4 | % | | | 13 | % | | | 19 | % | | | 33 | % | | | 31 | % |
| | | | | |
Net assets end of year (000’s) omitted | | | $1,798,471 | | | | $1,730,316 | | | | $2,158,777 | | | | $1,943,998 | | | | $2,078,758 | |
| | | | | | | | | | | | | | | | | | | | | |
40
| | |
| | |
| | | AMG Yacktman Focused Fund Financial Highlights For a share outstanding throughout each fiscal year |
| | | |
| | |
| | | | | | | | | | | | | | | | | | | | |
| | | For the fiscal years ended December 31, | |
| | | | | |
| Class I | | 2023 | | | 2022 | | | 2021 | | | 2020 | | | 2019 |
| | | | | |
Net Asset Value, Beginning of Year | | | $18.04 | | | | $21.13 | | | | $19.03 | | | | $18.19 | | | | $17.74 | |
| | | | | |
Income (loss) from Investment Operations: | | | | | | | | | | | | | | | | | | | | |
| | | | | |
Net investment income1,2 | | | 0.23 | | | | 0.26 | | | | 0.18 | 3 | | | 0.18 | | | | 0.27 | |
| | | | | |
Net realized and unrealized gain (loss) on investments | | | 2.76 | | | | (1.93 | ) | | | 2.96 | | | | 2.96 | | | | 3.11 | |
| | | | | |
Total income (loss) from investment operations | | | 2.99 | | | | (1.67 | ) | | | 3.14 | | | | 3.14 | | | | 3.38 | |
| | | | | |
Less Distributions to Shareholders from: | | | | | | | | | | | | | | | | | | | | |
| | | | | |
Net investment income | | | (0.29 | ) | | | (0.25 | ) | | | (0.20 | ) | | | (0.19 | ) | | | (0.29 | ) |
| | | | | |
Net realized gain on investments | | | (0.64 | ) | | | (1.17 | ) | | | (0.84 | ) | | | (2.11 | ) | | | (2.64 | ) |
| | | | | |
Total distributions to shareholders | | | (0.93 | ) | | | (1.42 | ) | | | (1.04 | ) | | | (2.30 | ) | | | (2.93 | ) |
| | | | | |
Net Asset Value, End of Year | | | $20.10 | | | | $18.04 | | | | $21.13 | | | | $19.03 | | | | $18.19 | |
| | | | | |
Total Return2,4 | | | 16.67 | % | | | (7.85 | )% | | | 16.62 | % | | | 17.52 | % | | | 19.30 | % |
| | | | | |
Ratio of net expenses to average net assets | | | 1.06 | % | | | 1.06 | % | | | 1.06 | % | | | 1.06 | % | | | 1.06 | % |
| | | | | |
Ratio of gross expenses to average net assets6 | | | 1.06 | % | | | 1.06 | % | | | 1.06 | % | | | 1.07 | % | | | 1.07 | % |
| | | | | |
Ratio of net investment income to average net assets2 | | | 1.21 | % | | | 1.33 | % | | | 0.87 | % | | | 1.04 | % | | | 1.39 | % |
| | | | | |
Portfolio turnover | | | 4 | % | | | 13 | % | | | 19 | % | | | 33 | % | | | 31 | % |
| | | | | |
Net assets end of year (000’s) omitted | | | $1,901,862 | | | | $1,806,085 | | | | $2,309,078 | | | | $1,695,239 | | | | $1,554,975 | |
| | | | | | | | | | | | | | | | | | | | | |
| 1 | Per share numbers have been calculated using average shares. |
| 2 | Total returns and net investment income would have been lower had certain expenses not been offset. |
| 3 | Includes non-recurring dividends. Without these dividends, net investment income per share would have been $0.09 and $0.13 for Class N and Class I, respectively. |
| 4 | The total return is calculated using the published Net Asset Value as of fiscal year end. |
| 5 | Such ratio includes recapture of waived/reimbursed fees from prior periods amounting to less than 0.01%, less than 0.01% and 0.01% for the fiscal years ended 2023, 2022 and 2021, respectively. |
| 6 | Excludes the impact of expense reimbursement or fee waivers and expense reductions such as brokerage credits, but includes expense repayments and non-reimbursable expenses, if any, such as interest, taxes, and extraordinary expenses. (See Note 1(c) and 2 in the Notes to Financial Statements.) |
41
| | |
| | |
| | | AMG Yacktman Global Fund Financial Highlights For a share outstanding throughout each fiscal year |
| | | |
| | |
| | | | | | | | | | | | | | | | | | | | |
| | | For the fiscal years ended December 31, | |
| | | | | |
| Class N | | 2023 | | | 2022 | | | 2021 | | | 2020 | | | 2019 |
| | | | | |
Net Asset Value, Beginning of Year | | | $14.21 | | | | $16.36 | | | | $15.69 | | | | $13.90 | | | | $11.94 | |
| | | | | |
Income (loss) from Investment Operations: | | | | | | | | | | | | | | | | | | | | |
| | | | | |
Net investment income1,2 | | | 0.29 | 3 | | | 0.21 | | | | 0.19 | 4 | | | 0.18 | | | | 0.17 | |
| | | | | |
Net realized and unrealized gain (loss) on investments | | | 2.00 | | | | (1.74 | ) | | | 1.80 | | | | 2.35 | | | | 2.37 | |
| | | | | |
Total income (loss) from investment operations | | | 2.29 | | | | (1.53 | ) | | | 1.99 | | | | 2.53 | | | | 2.54 | |
| | | | | |
Less Distributions to Shareholders from: | | | | | | | | | | | | | | | | | | | | |
| | | | | |
Net investment income | | | (0.68 | ) | | | — | | | | (0.55 | ) | | | (0.23 | ) | | | (0.25 | ) |
| | | | | |
Net realized gain on investments | | | (0.52 | ) | | | (0.62 | ) | | | (0.77 | ) | | | (0.51 | ) | | | (0.33 | ) |
| | | | | |
Total distributions to shareholders | | | (1.20 | ) | | | (0.62 | ) | | | (1.32 | ) | | | (0.74 | ) | | | (0.58 | ) |
| | | | | |
Net Asset Value, End of Year | | | $15.30 | | | | $14.21 | | | | $16.36 | | | | $15.69 | | | | $13.90 | |
| | | | | |
Total Return2,5 | | | 16.30 | % | | | (9.31 | )% | | | 12.96 | % | | | 18.32 | % | | | 21.40 | % |
| | | | | |
Ratio of net expenses to average net assets | | | 1.13 | % | | | 1.13 | % | | | 1.16 | %6 | | | 1.19 | % | | | 1.12 | % |
| | | | | |
Ratio of gross expenses to average net assets7 | | | 1.16 | % | | | 1.17 | % | | | 1.18 | %6 | | | 1.25 | % | | | 1.22 | % |
| | | | | |
Ratio of net investment income to average net assets2 | | | 1.92 | % | | | 1.47 | % | | | 1.12 | % | | | 1.40 | % | | | 1.28 | % |
| | | | | |
Portfolio turnover | | | 11 | % | | | 11 | % | | | 17 | % | | | 27 | % | | | 23 | % |
| | | | | |
Net assets end of year (000’s) omitted | | | $2,325 | | | | $1,354 | | | | $775 | | | | $431 | | | | $183 | |
| | | | | | | | | | | | | | | | | | | | | |
42
| | |
| | |
| | | AMG Yacktman Global Fund Financial Highlights For a share outstanding throughout each fiscal year |
| | | |
| | |
| | | | | | | | | | | | | | | | | | | | |
| | | For the fiscal years ended December 31, | |
| | | | | |
| Class I | | 2023 | | | 2022 | | | 2021 | | | 2020 | | | 2019 |
| | | | | |
Net Asset Value, Beginning of Year | | | $14.25 | | | | $16.36 | | | | $15.69 | | | | $13.89 | | | | $11.94 | |
| | | | | |
Income (loss) from Investment Operations: | | | | | | | | | | | | | | | | | | | | |
| | | | | |
Net investment income1,2 | | | 0.32 | 3 | | | 0.25 | | | | 0.22 | 4 | | | 0.20 | | | | 0.17 | |
| | | | | |
Net realized and unrealized gain (loss) on investments | | | 2.00 | | | | (1.74 | ) | | | 1.79 | | | | 2.35 | | | | 2.36 | |
| | | | | |
Total income (loss) from investment operations | | | 2.32 | | | | (1.49 | ) | | | 2.01 | | | | 2.55 | | | | 2.53 | |
| | | | | |
Less Distributions to Shareholders from: | | | | | | | | | | | | | | | | | | | | |
| | | | | |
Net investment income | | | (0.71 | ) | | | — | | | | (0.57 | ) | | | (0.24 | ) | | | (0.25 | ) |
| | | | | |
Net realized gain on investments | | | (0.52 | ) | | | (0.62 | ) | | | (0.77 | ) | | | (0.51 | ) | | | (0.33 | ) |
| | | | | |
Total distributions to shareholders | | | (1.23 | ) | | | (0.62 | ) | | | (1.34 | ) | | | (0.75 | ) | | | (0.58 | ) |
| | | | | |
Net Asset Value, End of Year | | | $15.34 | | | | $14.25 | | | | $16.36 | | | | $15.69 | | | | $13.89 | |
| | | | | |
Total Return2,5 | | | 16.46 | % | | | (9.06 | )% | | | 13.08 | % | | | 18.47 | % | | | 21.32 | % |
| | | | | |
Ratio of net expenses to average net assets | | | 0.93 | % | | | 0.93 | % | | | 1.00 | %6 | | | 1.08 | % | | | 1.08 | % |
| | | | | |
Ratio of gross expenses to average net assets7 | | | 0.96 | % | | | 0.97 | % | | | 1.02 | %6 | | | 1.15 | % | | | 1.19 | % |
| | | | | |
Ratio of net investment income to average net assets2 | | | 2.12 | % | | | 1.67 | % | | | 1.28 | % | | | 1.51 | % | | | 1.31 | % |
| | | | | |
Portfolio turnover | | | 11 | % | | | 11 | % | | | 17 | % | | | 27 | % | | | 23 | % |
| | | | | |
Net assets end of year (000’s) omitted | | | $187,741 | | | | $149,491 | | | | $170,316 | | | | $132,758 | | | | $96,041 | |
| | | | | | | | | | | | | | | | | | | | | |
| 1 | Per share numbers have been calculated using average shares. |
| 2 | Total returns and net investment income would have been lower had certain expenses not been offset. |
| 3 | Includes non-recurring dividends. Without these dividends, net investment income per share would have been $0.23 and $0.26 for Class N and Class I, respectively. |
| 4 | Includes non-recurring dividends. Without these dividends, net investment income per share would have been $0.15 and $0.17 for Class N and Class I, respectively. |
| 5 | The total return is calculated using the published Net Asset Value as of fiscal year end. |
| 6 | Such ratio includes recapture of waived/reimbursed fees from prior periods amounting to less than 0.01%. |
| 7 | Excludes the impact of expense reimbursement or fee waivers and expense reductions such as brokerage credits, but includes expense repayments and non-reimbursable expenses, if any, such as interest, taxes, and extraordinary expenses. (See Note 1(c) and 2 in the Notes to Financial Statements.) |
43
| | |
| | |
| | | AMG Yacktman Special Opportunities Fund Financial Highlights For a share outstanding throughout each fiscal year |
| | | |
| | |
| | | | | | | | | | | | | | | | | | | | |
| | | For the fiscal years ended December 31, | |
| | | | | |
| Class I | | 2023 | | | 2022 | | | 2021 | | | 2020 | | | 2019 |
| | | | | |
Net Asset Value, Beginning of Year | | | $11.27 | | | | $13.16 | | | | $11.02 | | | | $10.04 | | | | $9.82 | |
| | | | | |
Income (loss) from Investment Operations: | | | | | | | | | | | | | | | | | | | | |
| | | | | |
Net investment income (loss)1,2 | | | 0.32 | 3 | | | 0.08 | | | | (0.01 | ) | | | 0.20 | 4 | | | 0.24 | |
| | | | | |
Net realized and unrealized gain (loss) on investments | | | 0.04 | | | | (1.87 | ) | | | 2.65 | | | | 1.06 | | | | 0.73 | |
| | | | | |
Total income (loss) from investment operations | | | 0.36 | | | | (1.79 | ) | | | 2.64 | | | | 1.26 | | | | 0.97 | |
| | | | | |
Less Distributions to Shareholders from: | | | | | | | | | | | | | | | | | | | | |
| | | | | |
Net investment income | | | (0.68 | ) | | | — | | | | (0.15 | ) | | | (0.23 | ) | | | (0.21 | ) |
| | | | | |
Net realized gain on investments | | | (0.27 | ) | | | (0.10 | ) | | | (0.35 | ) | | | (0.05 | ) | | | (0.54 | ) |
| | | | | |
Total distributions to shareholders | | | (0.95 | ) | | | (0.10 | ) | | | (0.50 | ) | | | (0.28 | ) | | | (0.75 | ) |
| | | | | |
Net Asset Value, End of Year | | | $10.68 | | | | $11.27 | | | | $13.16 | | | | $11.02 | | | | $10.04 | |
| | | | | |
Total Return2,5 | | | 3.24 | % | | | (13.59 | )% | | | 24.30 | % | | | 12.66 | % | | | 10.20 | % |
| | | | | |
Ratio of net expenses to average net assets6 | | | 1.13 | % | | | 1.96 | %7 | | | 2.29 | %7 | | | 1.14 | % | | | 1.29 | % |
| | | | | |
Ratio of gross expenses to average net assets6,8 | | | 1.19 | % | | | 2.00 | %7 | | | 2.29 | %7 | | | 1.23 | % | | | 1.47 | % |
| | | | | |
Ratio of net investment income (loss) to average net assets2,6 | | | 2.81 | % | | | 0.69 | % | | | (0.09 | )% | | | 2.27 | % | | | 2.32 | % |
| | | | | |
Portfolio turnover | | | 24 | % | | | 40 | % | | | 21 | % | | | 37 | % | | | 24 | % |
| | | | | |
Net assets end of year (000’s) omitted | | | $38,793 | | | | $47,024 | | | | $33,912 | | | | $13,881 | | | | $11,701 | |
| | | | | | | | | | | | | | | | | | | | | |
44
| | |
| | |
| | | AMG Yacktman Special Opportunities Fund Financial Highlights For a share outstanding throughout each fiscal year |
| | | |
| | |
| | | | | | | | | | | | | | | | | | | | |
| | | For the fiscal years ended December 31, | |
| | | | | |
| Class Z | | 2023 | | | 2022 | | | 2021 | | | 2020 | | | 2019 |
| | | | | |
Net Asset Value, Beginning of Year | | | $11.31 | | | | $13.20 | | | | $11.04 | | | | $10.06 | | | | $9.84 | |
| | | | | |
Income (loss) from Investment Operations: | | | | | | | | | | | | | | | | | | | | |
| | | | | |
Net investment income1,2 | | | 0.33 | 3 | | | 0.10 | | | | 0.00 | 9 | | | 0.21 | 4 | | | 0.25 | |
| | | | | |
Net realized and unrealized gain (loss) on investments | | | 0.03 | | | | (1.88 | ) | | | 2.67 | | | | 1.06 | | | | 0.72 | |
| | | | | |
Total income (loss) from investment operations | | | 0.36 | | | | (1.78 | ) | | | 2.67 | | | | 1.27 | | | | 0.97 | |
| | | | | |
Less Distributions to Shareholders from: | | | | | | | | | | | | | | | | | | | | |
| | | | | |
Net investment income | | | (0.69 | ) | | | (0.01 | ) | | | (0.16 | ) | | | (0.24 | ) | | | (0.21 | ) |
| | | | | |
Net realized gain on investments | | | (0.27 | ) | | | (0.10 | ) | | | (0.35 | ) | | | (0.05 | ) | | | (0.54 | ) |
| | | | | |
Total distributions to shareholders | | | (0.96 | ) | | | (0.11 | ) | | | (0.51 | ) | | | (0.29 | ) | | | (0.75 | ) |
| | | | | |
Net Asset Value, End of Year | | | $10.71 | | | | $11.31 | | | | $13.20 | | | | $11.04 | | | | $10.06 | |
| | | | | |
Total Return2,5 | | | 3.44 | % | | | (13.57 | )% | | | 24.42 | % | | | 12.83 | % | | | 10.27 | % |
| | | | | |
Ratio of net expenses to average net assets6 | | | 1.03 | % | | | 1.86 | %7 | | | 2.19 | %7 | | | 1.04 | % | | | 1.19 | % |
| | | | | |
Ratio of gross expenses to average net assets6,8 | | | 1.09 | % | | | 1.90 | %7 | | | 2.19 | %7 | | | 1.13 | % | | | 1.37 | % |
| | | | | |
Ratio of net investment income to average net assets2,6 | | | 2.91 | % | | | 0.79 | % | | | 0.01 | % | | | 2.37 | % | | | 2.42 | % |
| | | | | |
Portfolio turnover | | | 24 | % | | | 40 | % | | | 21 | % | | | 37 | % | | | 24 | % |
| | | | | |
Net assets end of year (000’s) omitted | | | $34,337 | | | | $36,782 | | | | $78,197 | | | | $64,908 | | | | $47,981 | |
| | | | | | | | | | | | | | | | | | | | | |
| 1 | Per share numbers have been calculated using average shares. |
| 2 | Total returns and net investment income (loss) would have been lower had certain expenses not been offset. |
| 3 | Includes non-recurring dividends. Without these dividends, net investment income per share would have been $0.27 and $0.28 for Class I and Class Z, respectively. |
| 4 | Includes non-recurring dividends. Without these dividends, net investment income per share would have been $0.17 and $0.18 for Class I and Class Z, respectively. |
| 5 | The total return is calculated using the published Net Asset Value as of fiscal year end. |
| 6 | Includes a performance adjustment amounting to (0.61)%, 0.22%, 0.55%, (0.60)% and (0.45)% for the fiscal years ended 2023, 2022, 2021, 2020 and 2019, respectively. (See Note 2 in the Notes to Financial Statements) |
| 7 | Such ratio includes recapture of waived/reimbursed fees from prior periods amounting to 0.01%. |
| 8 | Excludes the impact of expense reimbursement or fee waivers and expense reductions such as brokerage credits, but includes expense repayments and non-reimbursable expenses, if any, such as interest, taxes, and extraordinary expenses. (See Note 1(c) and 2 in the Notes to Financial Statements.) |
| 9 | Less than $0.005 per share. |
45
| | |
| | | Notes to Financial Statements December 31, 2023 |
| | | |
| | | |
1. ORGANIZATION AND SUMMARY OF SIGNIFICANT ACCOUNTING POLICIES
AMG Funds (the “Trust”) is an open-end management investment company, organized as a Massachusetts business trust, and registered under the Investment Company Act of 1940, as amended (the “1940 Act”). Currently, the Trust consists of a number of different funds, each having distinct investment management objectives, strategies, risks, and policies. Included in this report are AMG Yacktman Fund (“Yacktman Fund”), AMG Yacktman Focused Fund (“Yacktman Focused”), AMG Yacktman Global Fund (“Yacktman Global”) and AMG Yacktman Special Opportunities Fund (“Yacktman Special Opportunities”), each a “Fund” and collectively, the “Funds”.
Each Fund offers different classes of shares. Yacktman Fund and Yacktman Special Opportunities have established Class N, Class I and Class Z shares. Currently, Yacktman Fund offers only Class I shares and Yacktman Special Opportunities offers only Class I shares and Class Z shares. Yacktman Focused and Yacktman Global established and offer Class N and Class I shares. Each class represents an interest in the same assets of the respective Fund. Although all share classes generally have identical voting rights, each share class votes separately when required by law. Different share classes may have different net asset values per share to the extent the share classes pay different distribution amounts and/or the expenses of such share classes differ. Each share class has its own expense structure. Please refer to a current prospectus for additional information on each share class.
Yacktman Focused, Yacktman Global and Yacktman Special Opportunities are non-diversified. A greater percentage of the Funds’ holdings may be focused in a smaller number of securities which may place the Funds at greater risk than a more diversified fund.
Market prices of investments held by the Funds may fall rapidly or unpredictably due to a variety of economic or political factors, market conditions, disasters or public health issues, or in response to events that affect particular industries or companies.
The Funds’ financial statements are prepared in accordance with accounting principles generally accepted in the United States of America (“U.S. GAAP”), including accounting and reporting guidance pursuant to Accounting Standards Codification Topic 946 applicable to investment companies. U.S. GAAP requires management to make estimates and assumptions that affect the reported amounts of assets and liabilities and disclosure of contingent assets and liabilities at the date of the financial statements and the reported amounts of income and expenses during the reporting period. Actual results could differ from those estimates and such differences could be material. The following is a summary of significant accounting policies followed by the Funds in the preparation of their financial statements:
a. VALUATION OF INVESTMENTS
Equity securities, including options, traded on a national securities exchange or reported on the NASDAQ national market system (“NMS”) are valued at the last quoted sales price on the primary exchange or, if applicable, the NASDAQ official closing price or the official closing price of the relevant exchange or, lacking any sales, at the last quoted bid price. Equity securities held by the Funds that are traded in the over-the-counter market (other than NMS securities) are valued at the bid price. Foreign equity securities (securities principally traded in markets other than U.S. markets) held by the Funds are valued at the official closing price
on the primary exchange or, for markets that either do not offer an official closing price or where the official closing price may not be representative of the overall market, the last quoted sale price.
Fixed income securities purchased with a remaining maturity exceeding 60 days are valued at the evaluated bid price provided by an authorized pricing service or, if an evaluated price is not available, by reference to other securities which are considered comparable in credit rating, interest rate, due date and other features (generally referred to as “matrix pricing”) or other similar pricing methodologies.
Fixed income securities purchased with a remaining maturity of 60 days or less are valued at amortized cost, provided that the amortized cost value is approximately the same as the fair value of the security valued without the use of amortized cost. Investments in other open-end registered investment companies are valued at their end of day net asset value per share.
The Funds’ portfolio investments are generally valued based on independent market quotations or prices or, if none, “evaluative” or other market based valuations provided by third party pricing services. Pursuant to Rule 2a-5 under the 1940 Act, the Funds’ Board of Trustees (the “Board”) designated AMG Funds LLC (the “Investment Manager”) as the Funds’ Valuation Designee to perform the Funds’ fair value determinations. Such determinations are subject to Board oversight and certain reporting and other requirements intended to ensure that the Board receives the information it needs to oversee the Investment Manager’s fair value determinations.
Under certain circumstances, the value of certain Fund portfolio investments may be based on an evaluation of fair value, pursuant to procedures established by the Investment Manager and under the general supervision of the Board. The Funds may use the fair value of a portfolio investment to calculate its net asset value (“NAV”) in the event that the market quotation, price or market based valuation for the portfolio investment is not readily available or otherwise not determinable pursuant to the Funds’ valuation procedures, if the Investment Manager believes the quotation, price or market based valuation to be unreliable, or in certain other circumstances. When determining the fair value of an investment, the Investment Manager seeks to determine the price that the Funds might reasonably expect to receive from current sale of that portfolio investment in an arms-length transaction. Fair value determinations shall be based upon consideration of all available facts and information, including, but not limited to (i) attributes specific to the investment; (ii) fundamental and analytical data relating to the investment; and (iii) the value of other comparable securities or relevant financial instruments, including derivative securities, traded on other markets or among dealers.
The values assigned to fair value portfolio investments are based on available information and do not necessarily represent amounts that might ultimately be realized in the future, since such amounts depend on future developments inherent in long-term investments. Because of the inherent uncertainty of valuation, those estimated values may differ significantly from the values that would have been used had a ready market for the investments existed, and the differences could be material. The Board will be presented with quarterly reports, as of the most recent quarter end, summarizing all fair value activity, material fair value matters that occurred during the quarter, and all outstanding securities fair valued by the Funds. Additionally, the Board will be presented with an annual report that assesses the adequacy and effectiveness of the Investment Manager’s process for determining the fair value of the Funds’ investments.
With respect to foreign equity securities and certain foreign fixed income securities, securities held in the Funds that can be fair valued by the applicable
46
| | |
| | | Notes to Financial Statements (continued) |
| | | |
| | | |
fair value pricing service are fair valued on each business day provided that each individual price exceeds a pre-established confidence level.
U.S. GAAP defines fair value as the price that a fund would receive to sell an asset or pay to transfer a liability in an orderly transaction between market participants at the measurement date. U.S. GAAP also establishes a framework for measuring fair value, and a three level hierarchy for fair value measurements based upon the transparency of inputs to the valuation of an asset or liability. Inputs may be observable or unobservable and refer broadly to the assumptions that market participants would use in pricing the asset or liability. Observable inputs reflect the assumptions market participants would use in pricing the asset or liability based on market data obtained from sources independent of the Funds. Unobservable inputs reflect the Funds’ own assumptions about the assumptions that market participants would use in pricing the asset or liability developed based on the best information available in the circumstances. Each investment is assigned a level based upon the observability of the inputs which are significant to the overall valuation.
The three-tier hierarchy of inputs is summarized below:
Level 1 – inputs are quoted prices in active markets for identical investments (e.g., equity securities, open-end investment companies)
Level 2 – other observable inputs (including, but not limited to: quoted prices for similar assets or liabilities in markets that are active, quoted prices for identical or similar assets or liabilities in markets that are not active, inputs other than quoted prices that are observable for the assets or liabilities (such as interest rates, yield curves, volatilities, prepayment speeds, loss severities, credit risks and default rates) or other market corroborated inputs) (e.g., debt securities, government securities, foreign currency exchange contracts, foreign securities utilizing international fair value pricing, fair valued securities with observable inputs)
Level 3 – inputs are significant unobservable inputs (including the Fund’s own assumptions used to determine the fair value of investments) (e.g., fair valued securities with unobservable inputs)
Changes in inputs or methodologies used for valuing investments may result in a transfer in or out of levels within the fair value hierarchy. The inputs or methodologies used for valuing investments may not necessarily be an indication of the risk associated with investing in those investments.
b. SECURITY TRANSACTIONS
Security transactions are accounted for as of trade date. Realized gains and losses on securities sold are determined on the basis of identified cost.
c. INVESTMENT INCOME AND EXPENSES
Dividend income is recorded on the ex-dividend date. Dividends from foreign securities are recorded on the ex-dividend date, and if after the fact, as soon as the Funds become aware of the ex-dividend date, except for Korean securities where dividends are recorded on confirmation date. Interest income, which includes amortization of premium and accretion of discount on debt securities, is accrued as earned. Dividend and interest income on foreign securities is recorded gross of any withholding tax. Non-cash dividends included in dividend income, if any, are reported at the fair market value of the securities received. Other income and expenses are recorded on an accrual basis. Expenses that cannot be directly attributed to a Fund are apportioned among the funds in the Trust and other trusts or funds within the AMG Funds Family of Funds (collectively, the “AMG Funds Family”) based upon their relative average net assets or number of shareholders. Investment income, realized and unrealized capital gains and losses, the common expenses of each Fund, and certain fund level expense reductions, if any, are allocated on a pro-rata basis to each class based on the relative net assets of each class to the total net assets of each Fund.
d. DIVIDENDS AND DISTRIBUTIONS
Fund distributions resulting from either net investment income or realized net capital gains, if any, will normally be declared and paid at least annually in December. Distributions to shareholders are recorded on the ex-dividend date. Distributions are determined in accordance with federal income tax regulations, which may differ from net investment income and net realized capital gains for financial statement purposes (U.S. GAAP). Differences may be permanent or temporary. Permanent differences are reclassified among capital accounts in the financial statements to reflect their tax character. Permanent book and tax basis differences, if any, relating to shareholder distributions will result in reclassifications to paid-in capital. Temporary differences arise when certain items of income, expense and gain or loss are recognized in different periods for financial statement and tax purposes; these differences will reverse at some time in the future. Permanent differences for Yacktman Global are primarily due to passive foreign investment companies. There were no permanent differences during the year for Yacktman Fund, Yacktman Focused and Yacktman Special Opportunities. Temporary differences are primarily due to write-off of outstanding defaulted securities interest for Yacktman Fund and Yacktman Focused, and premium amortization on callable bonds for Yacktman Focused. In addition, temporary differences for each Fund are wash sale loss deferrals, and mark-to-market on passive foreign investment companies. Temporary differences also include taxable dividends payable in the following year for Yacktman Global.
The tax character of distributions paid during the fiscal years ended December 31, 2023 and December 31, 2022 was as follows:
| | | | | | | | | | | | | | | | |
| | | Yacktman Fund | | | Yacktman Focused | |
| | | | |
Distributions paid from: | | | 2023 | | | | 2022 | | | | 2023 | | | | 2022 | |
| | | | |
Ordinary income * | | | $143,368,137 | | | | $118,514,921 | | | | $48,551,185 | | | | $43,003,314 | |
| | | | |
Long-term capital gains | | | 216,735,448 | | | | 438,946,811 | | | | 113,601,883 | | | | 215,894,721 | |
| | | | | | | | | | | | | | | | |
| | | | |
| | | $360,103,585 | | | | $557,461,732 | | | | $162,153,068 | | | | $258,898,035 | |
| | | | | | | | | | | | | | | | |
47
| | |
| | | Notes to Financial Statements (continued) |
| | | |
| | | |
| | | | | | | | | | | | | | | | |
| | | Yacktman Global | | | Yacktman Special Opportunities | |
| | | | |
Distributions paid from: | | | 2023 | | | | 2022 | | | | 2023 | | | | 2022 | |
| | | | |
Ordinary income * | | | $8,710,103 | | | | $179,704 | | | | $4,343,593 | | | | $22,911 | |
| | | | |
Long-term capital gains | | | 5,624,495 | | | | 6,133,798 | | | | 2,022,817 | | | | 718,767 | |
| | | | | | | | | | | | | | | | |
| | | | |
| | | $14,334,598 | | | | $6,313,502 | | | | $6,366,410 | | | | $741,678 | |
| | | | | | | | | | | | | | | | |
* For tax purposes, short-term capital gain distributions, if any, are considered ordinary income distributions.
As of December 31, 2023, the components of distributable earnings (excluding unrealized appreciation/depreciation) on a tax basis consisted of:
| | | | | | | | | | | | | | | | |
| | | Yacktman Fund | | | Yacktman Focused | | | Yacktman Global | | | Yacktman Special Opportunities | |
| | | | |
Undistributed long-term capital gains | | | $41,925,926 | | | | $43,437,418 | | | | — | | | | $345,133 | |
At December 31, 2023, the cost of investments and the aggregate gross unrealized appreciation and depreciation for federal income tax purposes were as follows:
| | | | | | | | | | | | | | | | |
| Fund | | Cost | | | Appreciation | | | Depreciation | | | Net Appreciation | |
| | | | |
Yacktman Fund | | | $5,456,690,009 | | | | $3,159,644,673 | | | | $(175,154,505 | ) | | | $2,984,490,168 | |
| | | | |
Yacktman Focused | | | 2,661,161,934 | | | | 1,243,180,507 | | | | (118,219,795 | ) | | | 1,124,960,712 | |
| | | | |
Yacktman Global | | | 167,981,650 | | | | 37,027,148 | | | | (15,885,908 | ) | | | 21,141,240 | |
| | | | |
Yacktman Special Opportunities | | | 73,110,967 | | | | 16,278,776 | | | | (13,990,327 | ) | | | 2,288,449 | |
e. FEDERAL TAXES
Each Fund currently qualifies as an investment company and intends to comply with the requirements under Subchapter M of the Internal Revenue Code of 1986, as amended (the “Internal Revenue Code”), and to distribute substantially all of its taxable income and gains to its shareholders and to meet certain diversification and income requirements with respect to investment companies. The Investment Manager has analyzed the Funds’ tax positions taken on federal income tax returns as of December 31, 2023, and for all open tax years (generally, the three prior taxable years), and has concluded that no provision for federal income tax is required in the Funds’ financial statements. Additionally, the Investment Manager is not aware of any tax position for which it is reasonably possible that the total amounts of unrecognized tax benefit/detriment will change materially in the next twelve months.
Furthermore, based on each Fund’s understanding of the tax rules and rates related to income, gains and transactions for the foreign jurisdictions in which it invests, each Fund will provide for foreign taxes, and where appropriate, deferred foreign taxes.
f. CAPITAL LOSS CARRYOVERS AND DEFERRALS
As of December 31, 2023, the Funds had no capital loss carryovers for federal income tax purposes. Should the Funds incur net capital losses for the fiscal year ended December 31, 2024, such amounts may be used to offset future realized capital gains indefinitely, and retain their character as short-term and/or long-term.
g. CAPITAL STOCK
The Trust’s Amended and Restated Agreement and Declaration of Trust authorizes for each Fund the issuance of an unlimited number of shares of beneficial interest, without par value. Each Fund records sales and repurchases of its capital stock on the trade date.
48
| | |
| | | Notes to Financial Statements (continued) |
| | | |
| | | |
For the fiscal years ended December 31, 2023 and December 31, 2022, the capital stock transactions by class for the Funds were as follows:
| | | | | | | | | | | | | | | | | | | | | | | | | | | | | | | | |
| | |
| | | Yacktman Fund | | | Yacktman Focused | |
| | | | |
| | | December 31, 2023 | | | December 31, 2022 | | | December 31, 2023 | | | December 31, 2022 | |
| | | | | | | | |
| | | Shares | | | Amount | | | Shares | | | Amount | | | Shares | | | Amount | | | Shares | | | Amount | |
| | | | | | | | |
Class N: | | | | | | | | | | | | | | | | | | | | | | | | | | | | | | | | |
| | | | | | | | |
Shares sold | | | — | | | | — | | | | — | | | | — | | | | 4,984,313 | | | | $96,043,282 | | | | 5,851,238 | | | | $115,544,774 | |
| | | | | | | | |
Shares issued in reinvestment of distributions | | | — | | | | — | | | | — | | | | — | | | | 3,855,512 | | | | 76,339,138 | | | | 6,834,816 | | | | 122,548,252 | |
| | | | | | | | |
Shares redeemed | | | — | | | | — | | | | — | | | | — | | | | (15,257,857 | ) | | | (294,725,391 | ) | | | (18,963,976 | ) | | | (369,705,319 | ) |
| | | | | | | | | | | | | | | | | | | | | | | | | | | | | | | | |
| | | | | | | | |
Net decrease | | | — | | | | — | | | | — | | | | — | | | | (6,418,032 | ) | | | $(122,342,971 | ) | | | (6,277,922 | ) | | | $(131,612,293 | ) |
| | | | | | | | | | | | | | | | | | | | | | | | | | | | | | | | |
| | | | | | | | |
Class I: | | | | | | | | | | | | | | | | | | | | | | | | | | | | | | | | |
| | | | | | | | |
Shares sold | | | 34,457,972 | | | | $767,882,557 | | | | 45,550,372 | | | | $1,044,334,856 | | | | 13,130,392 | | | | $251,622,460 | | | | 19,648,527 | | | | $385,717,991 | |
| | | | | | | | |
Shares issued in reinvestment of distributions | | | 14,266,780 | | | | 327,850,612 | | | | 24,225,869 | | | | 507,774,202 | | | | 3,901,519 | | | | 76,937,961 | | | | 6,836,097 | | | | 122,024,342 | |
| | | | | | | | |
Shares redeemed | | | (62,958,568 | ) | | | (1,406,986,529 | ) | | | (79,153,813 | ) | | | (1,793,770,180 | ) | | | (22,520,182 | ) | | | (431,320,343 | ) | | | (35,653,583 | ) | | | (693,613,541 | ) |
| | | | | | | | | | | | | | | | | | | | | | | | | | | | | | | | |
| | | | | | | | |
Net decrease | | | (14,233,816 | ) | | | $(311,253,360 | ) | | | (9,377,572 | ) | | | $(241,661,122 | ) | | | (5,488,271 | ) | | | $(102,759,922 | ) | | | (9,168,959 | ) | | | $(185,871,208 | ) |
| | | | | | | | | | | | | | | | | | | | | | | | | | | | | | | | |
| | | | | | | | | | | | | | | | | | | | | | | | | | | | | | | | |
| | |
| | | Yacktman Global | | | Yacktman Special Opportunities | |
| | | | |
| | | December 31, 2023 | | | December 31, 2022 | | | December 31, 2023 | | | December 31, 2022 | |
| | | | | | | | |
| | | Shares | | | Amount | | | Shares | | | Amount | | | Shares | | | Amount | | | Shares | | | Amount | |
| | | | | | | | |
Class N: | | | | | | | | | | | | | | | | | | | | | | | | | | | | | | | | |
| | | | | | | | |
Shares sold | | | 98,793 | | | | $1,485,778 | | | | 74,515 | | | | $1,120,463 | | | | — | | | | — | | | | — | | | | — | |
| | | | | | | | |
Shares issued in reinvestment of distributions | | | 10,847 | | | | 164,235 | | | | 3,664 | | | | 51,082 | | | | — | | | | — | | | | — | | | | — | |
| | | | | | | | |
Shares redeemed | | | (52,936 | ) | | | (798,154 | ) | | | (30,314 | ) | | | (433,176 | ) | | | — | | | | — | | | | — | | | | — | |
| | | | | | | | | | | | | | | | | | | | | | | | | | | | | | | | |
| | | | | | | | |
Net increase | | | 56,704 | | | | $851,859 | | | | 47,865 | | | | $738,369 | | | | — | | | | — | | | | — | | | | — | |
| | | | | | | | | | | | | | | | | | | | | | | | | | | | | | | | |
| | | | | | | | |
Class I: | | | | | | | | | | | | | | | | | | | | | | | | | | | | | | | | |
| | | | | | | | |
Shares sold | | | 2,402,734 | | | | $35,786,674 | | | | 1,323,636 | | | | $19,495,639 | | | | 1,647,292 | | | | $18,841,654 | | | | 3,377,460 | | | | $40,334,837 | |
| | | | | | | | |
Shares issued in reinvestment of distributions | | | 559,170 | | | | 8,482,587 | | | | 275,730 | | | | 3,851,950 | | | | 320,890 | | | | 3,380,430 | | | | 35,664 | | | | 398,371 | |
| | | | | | | | |
Shares redeemed | | | (1,219,771 | ) | | | (18,250,214 | ) | | | (1,513,839 | ) | | | (21,845,570 | ) | | | (2,507,310 | ) | | | (27,923,527 | ) | | | (1,818,251 | ) | | | (21,433,664 | ) |
| | | | | | | | | | | | | | | | | | | | | | | | | | | | | | | | |
| | | | | | | | |
Net increase (decrease) | | | 1,742,133 | | | | $26,019,047 | | | | 85,527 | | | | $1,502,019 | | | | (539,128 | ) | | | $(5,701,443 | ) | | | 1,594,873 | | | | $19,299,544 | |
| | | | | | | | | | | | | | | | | | | | | | | | | | | | | | | | |
| | | | | | | | |
Class Z: | | | | | | | | | | | | | | | | | | | | | | | | | | | | | | | | |
| | | | | | | | |
Shares sold | | | — | | | | — | | | | — | | | | — | | | | 72,604 | | | | $820,680 | | | | 101,193 | | | | $1,143,070 | |
| | | | | | | | |
Shares issued in reinvestment of distributions | | | — | | | | — | | | | — | | | | — | | | | 161,282 | | | | 1,704,410 | | | | 17,985 | | | | 201,613 | |
| | | | | | | | |
Shares redeemed | | | — | | | | — | | | | — | | | | — | | | | (281,776 | ) | | | (3,068,823 | ) | | | (2,790,318 | ) | | | (32,778,211 | ) |
| | | | | | | | | | | | | | | | | | | | | | | | | | | | | | | | |
| | | | | | | | |
Net decrease | | | — | | | | — | | | | — | | | | — | | | | (47,890 | ) | | | $(543,733 | ) | | | (2,671,140 | ) | | | $(31,433,528 | ) |
| | | | | | | | | | | | | | | | | | | | | | | | | | | | | | | | |
At December 31, 2023, one affiliated investor, Yacktman Asset Management LP, owned 11% of the net assets in Yacktman Special Opportunities. Transactions by shareholders of record that individually or collectively hold greater than 5% of a Fund’s net assets may have a material impact on a Fund.
h. REPURCHASE AGREEMENTS AND JOINT REPURCHASE AGREEMENTS
The Funds may enter into third-party and bilateral repurchase agreements for temporary cash management purposes and for reinvestment of cash collateral on securities lending transactions under the securities lending program offered by The Bank of New York Mellon (“BNYM”) (the “Securities Lending Program”) (collectively, “Repurchase Agreements”). The value of the underlying collateral,
including accrued interest, must equal or exceed the value of the Repurchase Agreements during the term of the agreement. For joint repurchase agreements, the Funds participate on a pro rata basis with other clients of BNYM in their share of the underlying collateral under such joint repurchase agreements and in their share of proceeds from any repurchase or other disposition of the underlying collateral. The underlying collateral for all Repurchase Agreements is held by the Funds’ custodian or at the Federal Reserve Bank. If the seller defaults and the
49
| | |
| | | Notes to Financial Statements (continued) |
| | | |
| | | |
value of the collateral declines, or if bankruptcy proceedings commence with respect to the seller of the security, realization of the collateral by the Funds may be delayed or limited. Pursuant to the Securities Lending Program, the Funds are indemnified for such losses by BNYM on joint repurchase agreements.
At December 31, 2023, the market value of Repurchase Agreements outstanding for Yacktman Fund, Yacktman Focused, Yacktman Global and Yacktman Special Opportunities was $180,616,804, $181,388,666, $0 and $1,475,490, respectively.
i. FOREIGN CURRENCY TRANSLATION
The books and records of the Funds are maintained in U.S. Dollars. The value of investments, assets and liabilities denominated in currencies other than U.S. Dollars are translated into U.S. Dollars based upon current foreign exchange rates. Purchases and sales of foreign investments, income and expenses are converted into U.S. Dollars based on currency exchange rates prevailing on the respective dates of such transactions. Net realized and unrealized gain (loss) on foreign currency transactions represent: (1) foreign exchange gains and losses from the sale and holdings of foreign currencies; (2) gains and losses between trade date and settlement date on investment securities transactions and foreign currency exchange contracts; and (3) gains and losses from the difference between amounts of interest and dividends recorded and the amounts actually received.
The Funds do not isolate the net realized and unrealized gain or loss resulting from changes in exchange rates from the fluctuations in market prices of securities held. Such fluctuations are included with the net realized and unrealized gain or loss on investments.
2. AGREEMENTS AND TRANSACTIONS WITH AFFILIATES
For each of the Funds, the Trust has entered into an investment advisory agreement under which the Investment Manager, a subsidiary and the U.S. wealth platform of Affiliated Managers Group, Inc. (“AMG”), serves as investment manager to the Funds and is responsible for the Funds’ overall administration and operations. The Investment Manager selects and recommends, subject to the approval of the Board and, in certain circumstances, shareholders, the subadviser for the Funds and monitors the subadviser’s investment performance, security holdings and investment strategies. Each Fund’s investment portfolio is managed by Yacktman Asset Management LP (“Yacktman”) who serves as subadviser pursuant to a subadvisory agreement with the Investment Manager. AMG indirectly owns a majority interest in Yacktman.
Investment management fees are paid directly by the Funds to the Investment Manager based on average daily net assets. For the fiscal year ended December 31, 2023, the Funds’ investment management fees were paid at the following annual rates of each Fund’s respective average daily net assets:
| | | | |
| |
Yacktman Fund | | | | |
| |
on first $500 million | | | 0.52% | |
| |
next $500 million | | | 0.47% | |
| |
over $1 billion | | | 0.42% | |
| |
Yacktman Focused | | | 0.87% | |
| |
Yacktman Global | | | 0.71% | |
| |
Yacktman Special Opportunities | | | 1.37% | |
The fee paid to Yacktman for its services as subadviser is paid out of the fee the Investment Manager receives from each Fund and does not increase the expenses of each Fund.
Yacktman Special Opportunities has a performance-based fee structure that consists of an investment management fee and a performance adjustment (“Performance Adjustment”). The monthly investment management fee is increased or reduced by the Performance Adjustment, based on the Fund’s performance relative to the MSCI ACWI All Cap Index over the then preceding twelve months. The Performance Adjustment for the Fund may not exceed plus or minus 0.75%. For the fiscal year ended December 31, 2023, the Performance Adjustment decreased the management fee by a net amount of $493,466, resulting in an effective management fee rate of 0.76%.
The Investment Manager has contractually agreed, through at least May 1, 2024, to waive management fees and/or pay or reimburse fund expenses in order to limit total annual fund operating expenses after fee waiver and expense reimbursements (exclusive of taxes, interest (including interest incurred in connection with bank and custody overdrafts, and in connection with securities sold short), brokerage commissions and other transaction costs, dividends payable with respect to securities sold short, acquired fund fees and expenses, and extraordinary expenses, as well as shareholder servicing fees and distribution and service (12b-1) fees and, with respect to Yacktman Special Opportunities, investment management fees and administrative fees) of Yacktman Global and Yacktman Special Opportunities to the annual rate of 0.93% and 0.12%, respectively, of each Fund’s average daily net assets (this annual rate or such other annual rate that may be in effect for the applicable Fund or share class from time to time, the “Expense Cap”), subject to later reimbursement by the applicable Fund in certain circumstances. On May 1, 2023, the contractual expense limitation agreement relating to Class N shares of Yacktman Focused expired. As a result of the expense limitation agreement expiring, the Investment Manager waived its right to recover unexpired previously reimbursed amounts of $9,219. Prior to May 1, 2023, the Investment Manager contractually agreed to waive management fees and/or pay or reimburse fund expenses in order to limit total annual fund operating expenses after fee waiver and expense reimbursements (exclusive of taxes, interest (including interest incurred in connection with bank and custody overdrafts, and in connection with securities sold short), brokerage commissions and other transaction costs, dividends payable with respect to securities sold short, acquired fund fees and expenses, and extraordinary expenses) of Yacktman Focused Class N shares to the annual rate of 1.25% of the share class’s average daily net assets, subject to later reimbursement by the share class in certain circumstances.
In general, for a period of up to 36 months after the date any amounts are paid, waived or reimbursed by the Investment Manager, the Investment Manager may recover such amounts from a Fund, provided that such repayment would not cause the Fund’s total annual operating expenses after fee waiver and expense reimbursements (exclusive of the items noted in the parenthetical above) to exceed either (i) the Expense Cap in effect at the time such amounts were paid, waived or reimbursed, or (ii) the Expense Cap in effect at the time of such repayment by the Fund.
The contractual expense limitation may only be terminated in the event the Investment Manager or a successor ceases to be the investment manager of a Fund or a successor fund, by mutual agreement between the Investment Manager and the Board, or in the event of a Fund’s liquidation (unless the Fund is reorganized or is a party to a merger in which the surviving entity is successor to the accounting and performance information of a Fund).
50
| | |
| | | Notes to Financial Statements (continued) |
| | | |
| | | |
For the fiscal year ended December 31, 2023, the Investment Manager’s expense reimbursements, and repayments of prior reimbursements by the Funds to the Investment Manager, if any, are as follows:
| | | | |
| | | Expense
Reimbursements | | Repayment of
Prior Reimbursements |
| | |
Yacktman Focused | | — | | $11,961 |
| | |
Yacktman Global | | $53,342 | | — |
| | |
Yacktman Special Opportunities | | 43,125 | | — |
At December 31, 2023, the Funds’ expiration of reimbursements subject to recoupment, if any, is as follows:
| | | | | | | | |
Expiration Period | | Yacktman Global | | | Yacktman Special Opportunities | |
| | |
Less than 1 year | | | $33,935 | | | | $4,331 | |
| | |
1-2 years | | | 54,795 | | | | 34,769 | |
| | |
2-3 years | | | 53,342 | | | | 43,125 | |
| | | | | | | | |
| | |
Total | | | $142,072 | | | | $82,225 | |
| | | | | | | | |
The Investment Manager has agreed to waive a portion of its management fee in consideration of a shareholder servicing rebate that it has received from JPMorgan Distribution Services, Inc., with respect to direct investments in the JPMorgan U.S. Government Money Market Fund, IM Shares by Yacktman Fund and Yacktman Focused. For the fiscal year ended December 31, 2023, the investment management fees for Yacktman Fund and Yacktman Focused were reduced by $174,733 and $33,458, respectively, or less than 0.01% of average daily net assets.
The Trust, on behalf of the Funds, has entered into an amended and restated Administration Agreement under which the Investment Manager serves as the Funds’ administrator (the “Administrator”) and is responsible for certain aspects of managing the Funds’ operations, including administration and shareholder services to each Fund. Each Fund pays a fee to the Administrator at the rate of 0.15% per annum of the Fund’s average daily net assets for this service.
The Funds are distributed by AMG Distributors, Inc. (the “Distributor”), a wholly-owned subsidiary of the Investment Manager. The Distributor serves as the distributor and underwriter for each Fund and is a registered broker-dealer and member of the Financial Industry Regulatory Authority, Inc. (“FINRA”). Shares of each Fund will be continuously offered and will be sold directly to prospective purchasers and through brokers, dealers or other financial intermediaries who have executed selling agreements with the Distributor. Generally, the Distributor bears all or a portion of the expenses of providing services pursuant to the distribution agreement, including the payment of the expenses relating to the distribution of prospectuses for sales purposes and any advertising or sales literature.
For Class N of Yacktman Focused and Yacktman Global and for Class I of Yacktman Fund and Yacktman Special Opportunities, the Board has approved reimbursement payments to the Investment Manager for shareholder servicing expenses (“shareholder servicing fees”) incurred. Shareholder servicing fees include payments to financial intermediaries, such as broker-dealers (including fund supermarket platforms), banks, and trust companies who provide shareholder recordkeeping, account servicing and other services. The Class N shares of Yacktman Focused and Yacktman Global and Class I shares of Yacktman Fund and
Yacktman Special Opportunities may reimburse the Investment Manager for the actual amount incurred up to a maximum annual rate of each Class’s average daily net assets as shown in the table below.
The impact on the annualized expense ratios for the fiscal year ended December 31, 2023, was as follows:
| | | | | | | | | | | | |
| | | Maximum Annual | | | Actual | | | | |
| | | Amount | | | Amount | | | | |
| Fund | | Approved | | | Incurred | | | | |
| | | |
Yacktman Fund | | | | | | | | | | | | |
| | | |
Class I | | | 0.20% | | | | 0.09% | | | | | |
| | | |
Yacktman Focused | | | | | | | | | | | | |
| | | |
Class N | | | 0.20% | | | | 0.19% | | | | | |
| | | |
Yacktman Global | | | | | | | | | | | | |
| | | |
Class N | | | 0.20% | | | | 0.20% | | | | | |
| | | |
Yacktman Special Opportunities | | | | | | | | | | | | |
| | | |
Class I | | | 0.10% | | | | 0.10% | | | | | |
The Board provides supervision of the affairs of the Trust and other trusts within the AMG Funds Family. The Trustees of the Trust who are not affiliated with the Investment Manager receive an annual retainer and per meeting fees for regular, special and telephonic meetings, and they are reimbursed for out-of-pocket expenses incurred while carrying out their duties as Board members. The Chairman of the Board and the Audit Committee Chair receive additional annual retainers. On October 10, 2023, the shareholders of the Trust elected Trustees, including two new Trustees who are not “interested persons” of the Funds within the meaning of the 1940 Act. Certain Trustees and Officers of the Funds are Officers and/or Directors of the Investment Manager, AMG and/or the Distributor.
The Securities and Exchange Commission (the “SEC”) granted an exemptive order that permits certain eligible funds in the AMG Funds Family to lend and borrow money for certain temporary purposes directly to and from other eligible funds in the AMG Funds Family. Participation in this interfund lending program is voluntary for both the borrowing and lending funds, and an interfund loan is only made if it benefits each participating fund. The Administrator manages the program according to procedures approved by the Board, and the Board monitors the operation of the program. An interfund loan must comply with certain conditions set out in the exemptive order, which are designed to assure fairness and protect all participating funds. The interest earned and interest paid on interfund loans are included on the Statement of Operations as interest income and interest expense, respectively. At December 31, 2023, Yacktman Fund had an interfund loan receivable outstanding of $11,278,643. The Funds did not borrow during the fiscal year ended December 31, 2023.
The following Funds utilized the interfund loan program during the fiscal year ended December 31, 2023 as follows:
| | | | | | | | | | | | | | | | | | | | |
| Fund | | Average
Lent | | | Number
of Days | | | Interest
Earned | | | Average
Interest Rate | | | | |
| | | | | |
Yacktman Fund | | | $11,468,196 | | | | 22 | | | | $42,249 | | | | 6.112% | | | | | |
| | | | | |
Yacktman Focused | | | 3,802,709 | | | | 13 | | | | 7,685 | | | | 5.674% | | | | | |
| | | | | |
Yacktman Global | | | 1,998,622 | | | | 9 | | | | 2,835 | | | | 5.752% | | | | | |
| | | | | |
Yacktman Special Opportunities | | | 2,840,192 | | | | 6 | | | | 2,883 | | | | 6.176% | | | | | |
51
| | |
| | | Notes to Financial Statements (continued) |
| | | |
| | | |
3. PURCHASES AND SALES OF SECURITIES
Purchases and sales of securities (excluding short-term securities and U.S. Government Obligations) for the fiscal year ended December 31, 2023, were as follows:
| | | | | | | | | | | | |
| | | Long Term Securities | |
| | | |
| Fund | | Purchases | | | Sales | | | | |
| | | |
Yacktman Fund | | | $354,407,583 | | | | $730,517,405 | | | | | |
| | | |
Yacktman Focused | | | 143,234,818 | | | | 489,132,230 | | | | | |
| | | |
Yacktman Global | | | 33,733,955 | | | | 17,920,499 | | | | | |
| | | |
Yacktman Special Opportunities | | | 18,093,410 | | | | 27,382,438 | | | | | |
The Funds had no purchases or sales of U.S. Government Obligations during the fiscal year ended December 31, 2023.
4. PORTFOLIO SECURITIES LOANED
The Funds participate in the Securities Lending Program providing for the lending of securities to qualified borrowers. Securities lending income includes earnings of such temporary cash investments, plus or minus any rebate to a borrower. These earnings (after any rebate) are then divided between BNYM, as a fee for its services under the Securities Lending Program, and the Funds, according to agreed-upon rates. Collateral on all securities loaned is accepted in cash, U.S. Treasury Obligations or U.S. Government Agency Obligations. Collateral is maintained at a minimum level of 102% (105% in the case of certain foreign securities) of the market value, plus interest, if applicable, of investments on loan. It is the Funds’ policy to obtain additional collateral from or return excess collateral to the borrower by the end of the next business day, following the valuation date of the securities loaned. Therefore, the value of the collateral held may be temporarily less than the value of the securities on loan. Lending securities entails a risk of loss to the Funds if and to the extent that the market value of the securities loaned were to increase and the borrower did not increase the collateral accordingly, and the borrower fails to return the securities. Under the terms of the Securities Lending Program, the Funds are indemnified for such losses by BNYM. Cash collateral is held in separate omnibus accounts managed by BNYM, who is authorized to exclusively enter into joint repurchase agreements for that cash collateral. Securities collateral is held in separate omnibus accounts managed by BNYM and cannot be sold or pledged. BNYM bears the risk of any deficiency in the amount of the cash collateral available for return to the borrower due to any loss on the collateral invested. Loans of securities are terminable at any time and the borrower, after notice, is required to return borrowed securities as soon as practical, which is normally within three business days.
The value of securities loaned on positions held, cash collateral and securities collateral received at December 31, 2023, was as follows:
| | | | | | | | | | | | | | | | | | | | |
| | | | | | Cash | | | Securities | | | Total | | | | |
| | | Securities | | | Collateral | | | Collateral | | | Collateral | | | | |
| Fund | | Loaned | | | Received | | | Received | | | Received | | | | |
| | | | | |
Yacktman Fund | | | $21,398,538 | | | | $4,521,804 | | | | $17,653,220 | | | | $22,175,024 | | | | | |
| | | | | |
Yacktman Focused | | | 125,117,590 | | | | 108,488,666 | | | | 19,345,592 | | | | 127,834,258 | | | | | |
| | | | | |
Yacktman Special Opportunities | | | 1,379,835 | | | | 1,475,490 | | | | — | | | | 1,475,490 | | | | | |
The following table summarizes the securities received as collateral for securities lending at December 31, 2023:
| | | | | | | | | | |
| Fund | | Collateral Type | | Coupon Range | | Maturity
Date Range | | | |
| | | | |
Yacktman Fund | | U.S. Treasury Obligations | | 0.125%-4.750% | | 04/15/24-05/15/51 | | | | |
| | | | |
Yacktman Focused | | U.S. Treasury Obligations | | 0.125%-4.750% | | 04/15/24-05/15/51 | | | | |
5. FOREIGN SECURITIES
The Funds invest in securities of foreign entities and in instruments denominated in foreign currencies which involve risks not typically associated with investments in domestic securities, such as exposure to currency fluctuations, less developed or less efficient trading markets, political instability, a lack of company information, differing auditing and legal standards, and, potentially, less liquidity. A Fund’s investments in emerging market countries are exposed to additional risks. A Fund’s performance will be influenced by political, social and economic factors affecting companies in emerging market countries. Emerging market countries generally have economic structures that are less diverse and mature, and political systems that are less stable, than those of developed countries. Realized gains in certain countries may be subject to foreign taxes at the Fund level and the Fund would pay such foreign taxes at the appropriate rate for each jurisdiction.
6. COMMITMENTS AND CONTINGENCIES
Under the Trust’s organizational documents, its Trustees and Officers are indemnified against certain liabilities arising out of the performance of their duties to the Trust. In addition, in the normal course of business, the Funds may enter into contracts and agreements that contain a variety of representations and warranties, which provide general indemnifications. The maximum exposure to the Funds under these arrangements is unknown, as this would involve future claims that may be made against a Fund that have not yet occurred. However, based on experience, the Funds had no prior claims or losses and expect the risks of loss to be remote.
7. DERIVATIVE INSTRUMENTS
The following disclosures contain information on how and why certain Funds use derivative instruments, the credit risk and how derivative instruments affect the Fund’s financial position, and results of operations. The location and fair value amounts of these instruments on the Statement of Assets and Liabilities, and the realized gains and losses and changes in unrealized appreciation and depreciation on the Statement of Operations, each categorized by type of derivative contract, are included in a table at the end of the applicable Fund’s Schedule of Portfolio Investments.
For the fiscal year ended December 31, 2023, the average monthly balances of derivative financial instruments outstanding were as follows:
| | | | |
| | | Yacktman Focused | |
| |
Options | | | | |
| |
Average value of written option contracts | | | $4,671,534 | |
52
| | |
| | | Notes to Financial Statements (continued) |
| | | |
| | | |
8. OPTIONS
The Funds may purchase and write call options and put options on a variety of underlying securities and instruments, including, but not limited to, specific securities, securities indices, futures contracts and foreign currencies. The Funds purchase or write call and put options to generate income and hedge against losses or lock in gains of underlying portfolio security positions. A call option gives the purchaser the right to buy, and obligates the writer to sell, the underlying security or instrument at the agreed-upon price during the option period. A put option gives the purchaser the right to sell, and obligates the writer to buy, the underlying security or instrument at the agreed-upon price during the option period. Options purchased are recorded as an asset, while options written (sold) are recorded as liabilities. When a Fund writes options it bears the risk of an
unfavorable change in the market value of the instrument underlying the written option. When an option expires, the premium (original option value) is realized as a gain if the option was written or as a loss if the option was purchased. When the exercise of an option results in a cash settlement, the difference between the premium and the settlement proceeds is recognized as realized gain or loss. When securities are acquired or delivered upon exercise of an option, the acquisition cost or sale proceeds are adjusted by the amount of the premium. When an option is closed, the difference between the premium and the cost to close the position is realized as a gain or loss. During the fiscal year ended December 31, 2023, Yacktman Focused wrote call and put options and as of December 31, 2023, the Fund did not hold option contracts.
9. MASTER NETTING AGREEMENTS
The Funds may enter into master netting agreements with their counterparties for the Securities Lending Program, Repurchase Agreements and derivatives, which provide the right, in the event of default (including bankruptcy or insolvency) for the non-defaulting party to liquidate the collateral and calculate net exposure to the defaulting party or request additional collateral. For financial reporting purposes, the Funds do not offset financial assets and financial liabilities that are subject to master netting agreements in the Statement of Assets and Liabilities. For securities lending transactions, see Note 4.
The following table is a summary of the Funds’ open Repurchase Agreements that are subject to a master netting agreement as of December 31, 2023:
| | | | | | | | | | | | | | | | | | | | | | | | | | | | | | | | | | | | | | | | | | | | | | | | | | | | | | | | | | | | |
| | | | | | | | | | | | Gross Amount Not Offset in the
Statement of Assets and Liabilities | | | | | | | | | | | | | | | | | | | |
| Fund | | Gross Amounts of
Assets Presented in
the Statement of
Assets and Liabilities | | | Offset Amount | | | Net Asset Balance | | | Collateral Received | | | Net Amount | |
| |
| | | | | | | | | | | | | | | |
Yacktman Fund | | | | | | | | | | | | | | | | | | | | | | | | | | | | | | | | | | | | | | | | | | | | | | | | | | | | | | | | | | | | |
| | | | | | | | | | | | | | | |
Citigroup Global Markets, Inc. | | | | | | | $1,130,451 | | | | | | | | | | | | — | | | | | | | | | | | | $1,130,451 | | | | | | | | | | | | $1,130,451 | | | | | | | | | | | | — | | | | | |
| | | | | | | | | | | | | | | |
Daiwa Capital Markets America | | | | | | | 1,130,451 | | | | | | | | | | | | — | | | | | | | | | | | | 1,130,451 | | | | | | | | | | | | 1,130,451 | | | | | | | | | | | | — | | | | | |
| | | | | | | | | | | | | | | |
Deutsche Bank Securities, Inc. | | | | | | | 1,130,451 | | | | | | | | | | | | — | | | | | | | | | | | | 1,130,451 | | | | | | | | | | | | 1,130,451 | | | | | | | | | | | | — | | | | | |
| | | | | | | | | | | | | | | |
RBC Dominion Securities, Inc. | | | | | | | 1,130,451 | | | | | | | | | | | | — | | | | | | | | | | | | 1,130,451 | | | | | | | | | | | | 1,130,451 | | | | | | | | | | | | — | | | | | |
| | | | | | | | | | | | | | | |
Fixed Income Clearing Corp. | | | | | | | 1,968,000 | | | | | | | | | | | | — | | | | | | | | | | | | 1,968,000 | | | | | | | | | | | | 1,968,000 | | | | | | | | | | | | — | | | | | |
| | | | | | | | | | | | | | | |
Fixed Income Clearing Corp. | | | | | | | 174,127,000 | | | | | | | | | | | | — | | | | | | | | | | | | 174,127,000 | | | | | | | | | | | | 174,127,000 | | | | | | | | | | | | — | | | | | |
| | | | | | | | | | | | | | | | | | | | |
| | | | | | | | | | | | | | | |
Total | | | | | | | $180,616,804 | | | | | | | | | | | | — | | | | | | | | | | | | $180,616,804 | | | | | | | | | | | | $180,616,804 | | | | | | | | | | | | — | | | | | |
| | | | | | | | | | | | | | | | | | | | |
53
| | |
| | | Notes to Financial Statements (continued) |
| | | |
| | | |
| | | | | | | | | | | | | | | | | | | | | | | | | | | | | | | | | | | | | | | | | | | | | | | | | | | | | | | | | | | | |
| | | | | | | | | | | | Gross Amount Not Offset in the
Statement of Assets and Liabilities | | | | | | | | | | | | | | | | | | | |
| | | | | |
| Fund | | Gross Amounts of
Assets Presented in
the Statement of
Assets and Liabilities | | | Offset
Amount | | | Net Asset Balance | | | Collateral
Received | | | Net Amount | |
| | | | | | | | | | | | | | | |
Yacktman Focused | | | | | | | | | | | | | | | | | | | | | | | | | | | | | | | | | | | | | | | | | | | | | | | | | | | | | | | | | | | | |
| | | | | | | | | | | | | | | |
Bethesda Securities LLC | | | | | | | $9,574,341 | | | | | | | | | | | | — | | | | | | | | | | | | $9,574,341 | | | | | | | | | | | | $9,574,341 | | | | | | | | | | | | — | | | | | |
| | | | | | | | | | | | | | | |
Cantor Fitzgerald Securities, Inc. | | | | | | | 23,087,376 | | | | | | | | | | | | — | | | | | | | | | | | | 23,087,376 | | | | | | | | | | | | 23,087,376 | | | | | | | | | | | | — | | | | | |
| | | | | | | | | | | | | | | |
Citadel Securities LLC | | | | | | | 12,407,586 | | | | | | | | | | | | — | | | | | | | | | | | | 12,407,586 | | | | | | | | | | | | 12,407,586 | | | | | | | | | | | | — | | | | | |
| | | | | | | | | | | | | | | |
Mirae Asset Securities USA, Inc. | | | | | | | 11,144,337 | | | | | | | | | | | | — | | | | | | | | | | | | 11,144,337 | | | | | | | | | | | | 11,144,337 | | | | | | | | | | | | — | | | | | |
| | | | | | | | | | | | | | | |
Mirae Asset Securities USA, Inc. | | | | | | | 4,387,136 | | | | | | | | | | | | — | | | | | | | | | | | | 4,387,136 | | | | | | | | | | | | 4,387,136 | | | | | | | | | | | | — | | | | | |
| | | | | | | | | | | | | | | |
RBC Dominion Securities, Inc. | | | | | | | 12,260,575 | | | | | | | | | | | | — | | | | | | | | | | | | 12,260,575 | | | | | | | | | | | | 12,260,575 | | | | | | | | | | | | — | | | | | |
| | | | | | | | | | | | | | | |
Santander U.S. Capital Markets LLC | | | | | | | 13,873,713 | | | | | | | | | | | | — | | | | | | | | | | | | 13,873,713 | | | | | | | | | | | | 13,873,713 | | | | | | | | | | | | — | | | | | |
| | | | | | | | | | | | | | | |
State of Wisconsin Investment Board | | | | | | | 21,753,602 | | | | | | | | | | | | — | | | | | | | | | | | | 21,753,602 | | | | | | | | | | | | 21,753,602 | | | | | | | | | | | | — | | | | | |
| | | | | | | | | | | | | | | |
Fixed Income Clearing Corp. | | | | | | | 24,936,000 | | | | | | | | | | | | — | | | | | | | | | | | | 24,936,000 | | | | | | | | | | | | 24,936,000 | | | | | | | | | | | | — | | | | | |
| | | | | | | | | | | | | | | |
Fixed Income Clearing Corp. | | | | | | | 47,964,000 | | | | | | | | | | | | — | | | | | | | | | | | | 47,964,000 | | | | | | | | | | | | 47,964,000 | | | | | | | | | | | | — | | | | | |
| | | | | | | | | | | | | | | | | | | | |
| | | | | | | | | | | | | | | |
Total | | | | | | | $181,388,666 | | | | | | | | | | | | — | | | | | | | | | | | | $181,388,666 | | | | | | | | | | | | $181,388,666 | | | | | | | | | | | | — | | | | | |
| | | | | | | | | | | | | | | | | | | | |
| | | | | | | | | | | | | | | |
Yacktman Special Opportunities | | | | | | | | | | | | | | | | | | | | | | | | | | | | | | | | | | | | | | | | | | | | | | | | | | | | | | | | | | | | |
| | | | | | | | | | | | | | | |
Daiwa Capital Markets America | | | | | | | $475,490 | | | | | | | | | | | | — | | | | | | | | | | | | $475,490 | | | | | | | | | | | | $475,490 | | | | | | | | | | | | — | | | | | |
| | | | | | | | | | | | | | | |
RBC Dominion Securities, Inc. | | | | | | | 1,000,000 | | | | | | | | | | | | — | | | | | | | | | | | | 1,000,000 | | | | | | | | | | | | 1,000,000 | | | | | | | | | | | | — | | | | | |
| | | | | | | | | | | | | | | | | | | | |
| | | | | | | | | | | | | | | |
Total | | | | | | | $1,475,490 | | | | | | | | | | | | — | | | | | | | | | | | | $1,475,490 | | | | | | | | | | | | $1,475,490 | | | | | | | | | | | | — | | | | | |
| | | | | | | | | | | | | | | | | | | | |
10. SUBSEQUENT EVENTS
The Funds have determined that no material events or transactions occurred through the issuance date of the Funds’ financial statements which require an additional disclosure in or adjustment of the Funds’ financial statements.
54
| | |
| | | Report of Independent Registered Public Accounting Firm |
To the Board of Trustees of AMG Funds and Shareholders of AMG Yacktman Fund, AMG Yacktman Focused Fund, AMG Yacktman Global Fund and AMG Yacktman Special Opportunities Fund
Opinions on the Financial Statements
We have audited the accompanying statements of assets and liabilities, including the schedules of portfolio investments, of AMG Yacktman Fund, AMG Yacktman Focused Fund, AMG Yacktman Global Fund and AMG Yacktman Special Opportunities Fund (four of the funds constituting AMG Funds, hereafter collectively referred to as the “Funds”) as of December 31, 2023, the related statements of operations for the year ended December 31, 2023, the statements of changes in net assets for each of the two years in the period ended December 31, 2023, including the related notes, and the financial highlights for each of the five years in the period ended December 31, 2023 (collectively referred to as the “financial statements”). In our opinion, the financial statements present fairly, in all material respects, the financial position of each of the Funds as of December 31, 2023, the results of each of their operations for the year then ended, the changes in each of their net assets for each of the two years in the period ended December 31, 2023 and each of the financial highlights for each of the five years in the period ended December 31, 2023 in conformity with accounting principles generally accepted in the United States of America.
Basis for Opinions
These financial statements are the responsibility of the Funds’ management. Our responsibility is to express an opinion on the Funds’ financial statements based on our audits. We are a public accounting firm registered with the Public Company Accounting Oversight Board (United States) (PCAOB) and are required to be independent with respect to the Funds in accordance with the U.S. federal securities laws and the applicable rules and regulations of the Securities and Exchange Commission and the PCAOB.
We conducted our audits of these financial statements in accordance with the standards of the PCAOB. Those standards require that we plan and perform the audit to obtain reasonable assurance about whether the financial statements are free of material misstatement, whether due to error or fraud.
Our audits included performing procedures to assess the risks of material misstatement of the financial statements, whether due to error or fraud, and performing procedures that respond to those risks. Such procedures included examining, on a test basis, evidence regarding the amounts and disclosures in the financial statements. Our audits also included evaluating the accounting principles used and significant estimates made by management, as well as evaluating the overall presentation of the financial statements. Our procedures included confirmation of securities owned as of December 31, 2023 by correspondence with the custodians and broker. We believe that our audits provide a reasonable basis for our opinions.
/s/ PricewaterhouseCoopers LLP
Boston, Massachusetts
February 27, 2024
We have served as the auditor of one or more investment companies in the AMG Funds Family since 1993.
55
| | |
| | | Other Information (unaudited) |
| | | |
| | | |
TAX INFORMATION
AMG Yacktman Fund, AMG Yacktman Focused Fund, AMG Yacktman Global Fund and AMG Yacktman Special Opportunities Fund each hereby designates the maximum amount allowable of its net taxable income as qualified dividends as provided in the Jobs and Growth Tax Relief Reconciliation Act of 2003. The 2023 Form 1099-DIV you receive for each Fund will show the tax status of all distributions paid to you during the calendar year.
In accordance with federal tax law, the following Funds elected to provide foreign taxes paid and the income sourced from foreign countries. Accordingly, the funds below make the following designations regarding their periods ended December 31, 2023:
AMG Yacktman Global Fund
uThe total amount of taxes paid and income sourced from foreign countries was $580,002 and $4,173,032, respectively.
AMG Yacktman Special Opportunities Fund
uThe total amount of taxes paid and income sourced from foreign countries was $159,147 and $2,193,161, respectively.
Pursuant to section 852 of the Internal Revenue Code, AMG Yacktman Fund, AMG Yacktman Focused Fund, AMG Yacktman Global Fund and AMG Yacktman Special Opportunities Fund each hereby designates $216,735,448, $113,601,883, $5,624,495 and $2,022,817, respectively, as a capital gain distribution with respect to the taxable year ended December 31, 2023, or if subsequently determined to be different, the net capital gains of such year.
PROXY VOTE
A special meeting of the shareholders of AMG Funds (the “Trust”) was held on October 10, 2023, to vote on a proposal to elect trustees to the Board of Trustees of the Trust. The proposal and results of the vote are described below. Jill R. Cuniff, Kurt A. Keilhacker, Peter W. MacEwen, Steven J. Paggioli, Eric Rakowski, Victoria L. Sassine and Garret W. Weston were elected by shareholders at the special meeting on October 10, 2023. Bruce B. Bingham, an incumbent Trustee, served as a Trustee of the Trust until his retirement on December 31, 2023.
| | | | | | | | | | | | | | | | |
| AMG Funds | | All Funds in Trust* | |
| | | | |
| Election of Trustees 1 | | For | | | | | | Withheld | | | | |
| | | | |
Jill R. Cuniff | | | 523,453,201 | | | | | | | | 50,330,270 | | | | | |
| | | | |
Kurt A. Keilhacker | | | 563,642,997 | | | | | | | | 10,140,474 | | | | | |
| | | | |
Peter W. MacEwen | | | 523,551,974 | | | | | | | | 50,231,497 | | | | | |
| | | | |
Steven J. Paggioli | | | 561,225,673 | | | | | | | | 12,557,798 | | | | | |
| | | | |
Eric Rakowski | | | 561,230,560 | | | | | | | | 12,552,911 | | | | | |
| | | | |
Victoria L. Sassine | | | 563,668,874 | | | | | | | | 10,114,597 | | | | | |
| | | | |
Garret W. Weston | | | 564,280,150 | | | | | | | | 9,503,321 | | | | | |
1 Ms. Cuniff and Mr. MacEwen were newly elected to the Board of Trustees on October 10, 2023; Messrs. Keilhacker, Paggioli, Rakowski, and Weston and Ms. Sassine are incumbent Trustees.
*Rounded to the nearest share.
56
| | |
| | | AMG Funds Trustees and Officers |
| | | |
| | | |
| | | | |
The Trustees and Officers of the Trust, their business addresses, principal occupations for the past five years and ages are listed below. The Trustees provide broad supervision over the affairs of the Trust and the Funds. The Trustees are experienced executives who meet periodically throughout the year to oversee the Funds’ activities, review contractual arrangements with companies that provide services to the Funds, and | | review the Funds’ performance. Unless otherwise noted, the address of each Trustee or Officer is the address of the Trust: 680 Washington Blvd., Suite 500, Stamford, CT. 06901. There is no stated term of office for Trustees. Trustees serve until their resignation, retirement or removal in accordance with the Trust’s organizational documents and policies adopted by the Board from time to time. | | The Chairman of the Board, the President, the Treasurer and the Secretary and such other Officers as the Trustees may in their discretion from time to time elect each hold office until his or her successor is elected and qualified, or until he or she sooner dies, resigns, is removed or becomes disqualified. Each Officer holds office at the pleasure of the Trustees. |
Independent Trustees
The following Trustees are not “interested persons” of the Trust within the meaning of the 1940 Act:
| | |
| | |
Number of Funds Overseen in Fund Complex | | Name, Age, Principal Occupation(s) During Past 5 Years and Other Directorships Held by Trustee |
| |
• Trustee since 2012 • Oversees 37 Funds in Fund Complex | | Bruce B. Bingham, 75* Partner, Hamilton Partners (real estate development firm) (1987-Present); Director of The Yacktman Funds, Inc. (2 portfolios) (2000-2012). |
| |
• Trustee since 2023 • Oversees 37 Funds in Fund Complex | | Jill R. Cuniff, 59** Director of Harding, Loevner Funds, Inc. (12 portfolios) (2018-Present); Retired (2016-Present); President & Portfolio Manager, Edge Asset Management (2009-2016); President & Chief Investment Officer, Morley Financial Services (2001-2009); President, Union Bond & Trust Company (2001-2009). |
| |
• Trustee since 2013 • Chairman of the Audit Committee since 2021 • Oversees 39 Funds in Fund Complex | | Kurt A. Keilhacker, 60 Managing Partner, Elementum Ventures (2013-Present); Managing Partner, TechFund Europe (2000-Present); Managing Partner, TechFund Capital (1997-Present); Adjunct Professor, University of San Francisco (2022-Present); Trustee, Wheaton College (2018-Present); Director, Wheaton College Trust Company, N.A. (2018-Present). |
| |
• Trustee since 2023 • Oversees 37 Funds in Fund Complex | | Peter W. MacEwen, 59** Private investor (2019-Present); Affiliated Managers Group, Inc. (2003-2018): Chief Administrative Officer, Office of the CEO (2013-2018); Senior Vice President, Finance (2007-2013); Vice President, Finance (2003-2007). |
| |
• Trustee since 2004 • Oversees 37 Funds in Fund Complex | | Steven J. Paggioli, 73 Independent Consultant (2002-Present); Trustee, Professionally Managed Portfolios (28 portfolios); Independent Director, Muzinich BDC, Inc. (business development company) (2019-Present); Director, The Wadsworth Group; Independent Director, Chase Investment Counsel (2008–2019); Executive Vice President, Secretary and Director, Investment Company Administration, LLC and First Fund Distributors, INC. (1990-2001). |
| |
• Independent Chairman of the Board of Trustees since 2017 • Chairman of the Governance Committee since 2017 • Trustee since 1999 • Oversees 39 Funds in Fund Complex | | Eric Rakowski, 65 Professor of Law, University of California at Berkeley School of Law (1990-Present); Tax Attorney at Davis Polk & Wardwell and clerked for Judge Harry T. Edwards of the U.S. Court of Appeals for the District of Columbia Circuit and for Justice William J. Brennan Jr. of the U.S. Supreme Court; Trustee of Parnassus Funds (4 portfolios) (2021-Present); Trustee of Parnassus Income Funds (2 portfolios) (2021-Present); Director of Harding, Loevner Funds, Inc. (10 portfolios); Trustee of Third Avenue Trust (3 portfolios) (2002-2019); Trustee of Third Avenue Variable Trust (1 portfolio) (2002-2019). |
| |
• Trustee since 2013 • Oversees 39 Funds in Fund Complex | | Victoria L. Sassine, 58 Adjunct Professor, Babson College (2007–Present); Director, Board of Directors, PRG Group (2017-Present); CEO, Founder, Scale Smarter Partners, LLC (2018-Present); Adviser, EVOFEM Biosciences (2019-Present); Chairperson of the Board of Directors of Business Management Associates (2018-2019). |
*Mr. Bingham retired from the Board of Trustees of AMG Funds on December 31, 2023.
**Ms. Cuniff and Mr. MacEwen were elected to the Board of Trustees by the shareholders of AMG Funds on October 10, 2023.
57
| | |
| | | AMG Funds Trustees and Officers (continued) |
| | | |
| | | |
Interested Trustee
The Trustee in the following table is an “interested person” of the Trust within the meaning of the 1940 Act.
| | |
| Number of Funds Overseen in Fund Complex | | Name, Age, Principal Occupation(s) During Past 5 Years and Other Directorships Held by Trustee |
| |
• Trustee since 2021 • Oversees 39 Funds in Fund Complex | | Garret W. Weston, 42 Affiliated Managers Group, Inc. (2008-Present): Managing Director, Head of Affiliate Product Strategy and Development (2023-Present), Managing Director, Co-Head of Affiliate Engagement, Distribution (2021-2022), Senior Vice President, Office of the CEO (2019-2021), Senior Vice President, Affiliate Development (2016-2019), Vice President, Office of the CEO (2015-2016), Vice President, New Investments (2008-2015); Associate, Madison Dearborn Partners (2006-2008); Analyst, Merrill Lynch (2004-2006). |
| |
Officers | | |
| Position(s) Held with Fund and Length of Time Served | | Name, Age, Principal Occupation(s) During Past 5 Years |
| |
• President since 2018 • Principal Executive Officer since 2018 • Chief Executive Officer since 2018 • Chief Operating Officer since 2007 | | Keitha L. Kinne, 65 Managing Director, Head of Platform and Operations, AMG Funds LLC (2023-Present); Chief Operating Officer, AMG Funds LLC (2007-Present); Chief Investment Officer, AMG Funds LLC (2008-Present); President and Principal, AMG Distributors, Inc. (2018-Present); Chief Operating Officer, AMG Distributors, Inc. (2007-Present); President, Chief Executive Officer and Principal Executive Officer, AMG Funds, AMG Funds I, AMG Funds II, AMG Funds III and AMG Funds IV (2018-Present); Chief Operating Officer, AMG Funds, AMG Funds I, AMG Funds II, and AMG Funds III (2007-Present); Chief Operating Officer, AMG Funds IV (2016-Present); Chief Operating Officer and Chief Investment Officer, Aston Asset Management, LLC (2016); President and Principal Executive Officer, AMG Funds, AMG Funds I, AMG Funds II and AMG Funds III (2012-2014); Managing Partner, AMG Funds LLC (2007-2014); President and Principal, AMG Distributors, Inc. (2012-2014); Managing Director, Legg Mason & Co., LLC (2006-2007); Managing Director, Citigroup Asset Management (2004-2006). |
| |
• Secretary since 2015 • Chief Legal Officer since 2015 | | Mark J. Duggan, 58 Managing Director and Senior Counsel, AMG Funds LLC (2021-Present); Senior Vice President and Senior Counsel, AMG Funds LLC (2015-2021); Secretary and Chief Legal Officer, AMG Funds, AMG Funds I, AMG Funds II, AMG Funds III and AMG Funds IV (2015-Present); Attorney, K&L Gates, LLP (2009-2015). |
| |
• Chief Financial Officer since 2017 • Treasurer since 2017 • Principal Financial Officer since 2017 • Principal Accounting Officer since 2017 | | Thomas G. Disbrow, 57 Vice President, Mutual Fund Treasurer & CFO, AMG Funds, AMG Funds LLC (2017-Present); Chief Financial Officer, Principal Financial Officer, Treasurer and Principal Accounting Officer, AMG Funds, AMG Funds I, AMG Funds II, AMG Funds III and AMG Funds IV (2017-Present); Managing Director - Global Head of Traditional Funds Product Control, UBS Asset Management (Americas), Inc. (2015-2017); Managing Director - Head of North American Funds Treasury, UBS Asset Management (Americas), Inc. (2011-2015). |
| |
• Deputy Treasurer since 2017 | | John A. Starace, 53 Vice President, Mutual Fund Accounting, AMG Funds LLC (2021-Present); Director, Mutual Fund Accounting, AMG Funds LLC (2017-2021); Vice President, Deputy Treasurer of Mutual Funds Services, AMG Funds LLC (2014-2017); Deputy Treasurer, AMG Funds, AMG Funds I, AMG Funds II, AMG Funds III and AMG Funds IV (2017-Present); Vice President, Citi Hedge Fund Services (2010-2014); Audit Senior Manager (2005-2010) and Audit Manager (2001-2005), Deloitte & Touche LLP. |
| |
• Chief Compliance Officer and Sarbanes-Oxley Code of Ethics Compliance Officer since 2019 • Anti-Money Laundering Compliance Officer since 2022 | | Patrick J. Spellman, 49 Vice President, Chief Compliance Officer, AMG Funds LLC (2017-Present); Chief Compliance Officer, AMG Distributors, Inc. (2010-Present); Chief Compliance Officer and Sarbanes-Oxley Code of Ethics Compliance Officer, AMG Funds, AMG Funds I, AMG Funds II, AMG Funds III and AMG Funds IV (2019-Present); Anti-Money Laundering Compliance Officer, AMG Funds, AMG Funds I, AMG Funds II, and AMG Funds III (2014-2019; 2022-Present); Anti-Money Laundering Compliance Officer, AMG Funds IV (2016-2019; 2022-Present); Senior Vice President, Chief Compliance Officer, AMG Funds LLC (2011-2017); Compliance Manager, Legal and Compliance, Affiliated Managers Group, Inc. (2005-2011). |
| |
• Assistant Secretary since 2016 | | Maureen M. Kerrigan, 38 Vice President, Senior Counsel, AMG Funds LLC (2021-Present); Vice President, Counsel, AMG Funds LLC (2019-2021); Director, Counsel, AMG Funds LLC (2017-2018); Vice President, Counsel, AMG Funds LLC (2015-2017); Assistant Secretary, AMG Funds, AMG Funds I, AMG Funds II, AMG Funds III and AMG Funds IV (2016-Present); Associate, Ropes & Gray LLP (2011-2015); Law Fellow, Massachusetts Appleseed Center for Law and Justice (2010-2011). |
58
THIS PAGE INTENTIONALLY LEFT BLANK
THIS PAGE INTENTIONALLY LEFT BLANK
| | | | |
INVESTMENT MANAGER AND ADMINISTRATOR AMG Funds LLC 680 Washington Blvd., Suite 500 Stamford, CT 06901 800.548.4539 DISTRIBUTOR AMG Distributors, Inc. 680 Washington Blvd., Suite 500 Stamford, CT 06901 800.548.4539 SUBADVISER Yacktman Asset Management LP 6300 Bridgepoint Parkway Building One, Suite 500 Austin, TX 78730 CUSTODIAN The Bank of New York Mellon Mutual Funds Custody 6023 Airport Road Oriskany, NY 13424 | | LEGAL COUNSEL Ropes & Gray LLP Prudential Tower, 800 Boylston Street Boston, MA 02199-3600 TRANSFER AGENT BNY Mellon Investment Servicing (US) Inc. AMG Funds Attn: 534426 AIM 154-0520 500 Ross Street Pittsburgh, PA 15262 800.548.4539 | | This report is prepared for the Funds’ shareholders. It is authorized for distribution to prospective investors only when preceded or accompanied by an effective prospectus. To receive a free copy of the prospectus or Statement of Additional Information, which includes additional information about Fund Trustees, please contact us by calling 800.548.4539. Distributed by AMG Distributors, Inc., member FINRA/SIPC. Current net asset values per share for each Fund are available on the Funds’ website at wealth.amg.com. A description of the policies and procedures each Fund uses to vote its proxies is available: (i) without charge, upon request, by calling 800.548.4539, or (ii) on the Securities and Exchange Commission’s (SEC) website at sec.gov. For information regarding the Funds’ proxy voting record for the 12-month period ended June 30, call 800.548.4539 or visit the SEC website at sec.gov. The Funds file their complete schedule of portfolio holdings with the SEC for the first and third quarters of each fiscal year as an exhibit to their reports on Form N-PORT. The Funds’ portfolio holdings on Form N-PORT are available on the SEC’s website at sec.gov and the Funds’ website at wealth.amg.com. To review a complete list of the Funds’ portfolio holdings, or to view the most recent semi-annual report or annual report, please visit wealth.amg.com. |
| | | | | | | | |
EQUITY FUNDS AMG Beutel Goodman International Equity Beutel, Goodman & Company Ltd. AMG Boston Common Global Impact Boston Common Asset Management, LLC AMG Frontier Small Cap Growth Frontier Capital Management Co., LLC AMG GW&K Small Cap Core AMG GW&K Small Cap Value AMG GW&K Small/Mid Cap Core AMG GW&K Small/Mid Cap Growth AMG GW&K International Small Cap GW&K Investment Management, LLC AMG Montrusco Bolton Large Cap Growth Montrusco Bolton Investments, Inc. AMG Renaissance Large Cap Growth The Renaissance Group LLC | | | | AMG River Road Dividend All Cap Value AMG River Road Focused Absolute Value AMG River Road Large Cap Value Select AMG River Road Mid Cap Value AMG River Road Small-Mid Cap Value AMG River Road Small Cap Value River Road Asset Management, LLC AMG TimesSquare Emerging Markets Small Cap AMG TimesSquare Global Small Cap AMG TimesSquare International Small Cap AMG TimesSquare Mid Cap Growth AMG TimesSquare Small Cap Growth TimesSquare Capital Management, LLC AMG Veritas Asia Pacific AMG Veritas China AMG Veritas Global Focus AMG Veritas Global Real Return Veritas Asset Management LLP AMG Yacktman AMG Yacktman Focused AMG Yacktman Global AMG Yacktman Special Opportunities Yacktman Asset Management LP | | FIXED INCOME FUNDS AMG Beutel Goodman Core Plus Bond Beutel, Goodman & Company Ltd. AMG GW&K Core Bond ESG AMG GW&K Enhanced Core Bond ESG AMG GW&K ESG Bond AMG GW&K High Income AMG GW&K Municipal Bond AMG GW&K Municipal Enhanced Yield GW&K Investment Management, LLC | | |
| | | | | | |
wealth.amg.com | | | | | | 123123 AR071 |
| | |
| | ANNUAL REPORT |
| | |
| | | AMG Funds December 31, 2023 |
| | |
| | | 
|
| | |
| | | AMG GW&K ESG Bond Fund |
| | |
| | | Class N: MGFIX | Class I: MGBIX |
| | |
| | | AMG GW&K Enhanced Core Bond ESG Fund |
| | |
| | | Class N: MFDAX | Class I: MFDSX | Class Z: MFDYX |
| | |
| | | AMG GW&K High Income Fund |
| | |
| | | Class N: MGGBX | Class I: GWHIX |
| | |
| | | AMG GW&K Municipal Bond Fund |
| | |
| | | Class N: GWMTX | Class I: GWMIX |
| | |
| | | AMG GW&K Municipal Enhanced Yield Fund |
| | |
| | | Class N: GWMNX | Class I: GWMEX | Class Z: GWMZX |
| | | | |
| wealth.amg.com | | | | 123123 AR088 |
| | |
| | | AMG Funds Annual Report — December 31, 2023 |
| | | |
| | | |
| | | | | | |
| | | | | | |
| | | TABLE OF CONTENTS | | PAGE | |
| | | | |
| | | LETTER TO SHAREHOLDERS | | | 2 | |
| | | |
| | | ABOUT YOUR FUND’S EXPENSES | | | 3 | |
| | | |
| | | PORTFOLIO MANAGER’S COMMENTS, FUND SNAPSHOTS AND SCHEDULES OF PORTFOLIO INVESTMENTS | | | | |
| | | |
| | | AMG GW&K ESG Bond Fund | | | 4 | |
| | | |
| | | AMG GW&K Enhanced Core Bond ESG Fund | | | 14 | |
| | | |
| | | AMG GW&K High Income Fund | | | 23 | |
| | | |
| | | AMG GW&K Municipal Bond Fund | | | 30 | |
| | | |
| | | AMG GW&K Municipal Enhanced Yield Fund | | | 40 | |
| | | |
| | | FINANCIAL STATEMENTS | | | | |
| | | |
| | | Statement of Assets and Liabilities | | | 48 | |
| | | |
| | | Balance sheets, net asset value (NAV) per share computations
and cumulative distributable earnings (loss) | | | | |
| | | |
| | | Statement of Operations | | | 50 | |
| | | |
| | | Detail of sources of income, expenses, and realized and
unrealized gains (losses) during the fiscal year | | | | |
| | | |
| | | Statements of Changes in Net Assets | | | 51 | |
| | | |
| | | Detail of changes in assets for the past two fiscal years | | | | |
| | | |
| | | Financial Highlights | | | 53 | |
| | | |
| | | Historical net asset values per share, distributions, total returns, income
and expense ratios, turnover ratios and net assets | | | | |
| | | |
| | | Notes to Financial Statements | | | 65 | |
| | | |
| | | Accounting and distribution policies, details of agreements and
transactions with Fund management and affiliates, and descriptions of
certain investment risks | | | | |
| | | |
| | | REPORT OF INDEPENDENT REGISTERED PUBLIC ACCOUNTING FIRM | | | 74 | |
| | | |
| | | OTHER INFORMATION | | | 75 | |
| | | |
| | | TRUSTEES AND OFFICERS | | | 77 | |
| | | | | | |
Nothing contained herein is to be considered an offer, sale or solicitation of an offer to buy shares of any series of the AMG Funds Family of Funds. Such offering is made only by prospectus, which includes details as to offering price and other material information.
| | |
| | Letter to Shareholders |
| | | |
| | | |
Dear Shareholder:
We are pleased to provide this annual report for your investment with AMG Funds. Our foremost goal is to provide investment solutions that help our shareholders successfully achieve their long-term investment goals. We appreciate the privilege of providing you with investment tools.
Throughout most of the year, markets wrestled with uncertainties around tighter monetary policy, increased geopolitical tension, instability in the regional banking sector, and political handwringing over the U.S. debt ceiling. However, investors remained optimistic for an economic “soft landing” as inflation continued to ease and risk assets finally surged in the fourth quarter following a dovish pivot in the U.S. Federal Reserve (the “Fed”) policy. Bonds finished with a positive return; a remarkable development after struggling to move higher for most of the year as global central banks raised interest rates.
The S&P 500® Index gained 26.29% for the fiscal year ended December 31, 2023, fully recouping losses suffered in 2022. Large-cap stocks diverged from small-cap stocks, particularly driven by a handful of mega-cap technology and consumer discretionary stocks. The Russell 1000® Index gained 26.53% compared to the 16.93% return for the Russell 2000® Index. Nine out of eleven sectors posted positive returns, with information technology (60.93%), communication services (55.86%), and consumer discretionary (43.22%) leading the way. The weakest sectors were utilities (-7.08%), energy (-1.33%), and consumer staples (+0.55%). The strength in information technology drove growth stocks to strongly outperform value stocks with the Russell 1000® Growth Index gaining 42.68% compared to a 11.46% return for the Russell 1000® Value Index. Outside the U.S., foreign equity markets underperformed domestic equities, delivering a 15.62% return, as measured by the MSCI All Country World Index ex USA benchmark.
The Bloomberg U.S. Aggregate Bond Index, a broad measure of U.S. bond market performance, rebounded with a 5.53% return over the period. The 10-year Treasury yield climbed to post-GFC (Global Financial Crisis) highs through October as the Fed tightened policy throughout the year, leading many to expect another year of negative bond returns. However, investors received much needed relief as interest rates fell sharply in the final two months of the year following the Fed’s message signaling rate cuts in 2024. Looking across the broadest sectors of the market, investment-grade corporate bonds gained 8.52% for the year, while agency mortgage-backed securities rose 5.05%. High yield bonds were the best performing sector with a 13.44% return as measured by the return of the Bloomberg U.S. Corporate High Yield Bond Index. Municipal bonds outperformed the broader market with a 6.40% gain for the Bloomberg Municipal Bond Index. Outside the U.S., foreign bonds were also positive as the Bloomberg Global Aggregate ex-USD Index gained 5.72%.
AMG Funds provides access to a distinctive array of actively managed return-oriented investment strategies. You can rest assured that under all market conditions our team is focused on delivering excellent investment management services for your benefit. For more information about AMG Funds’ wide range of products and resources, please visit wealth.amg.com. We thank you for your investment and continued trust in AMG Funds.
Respectfully,

Keitha Kinne
President
AMG Funds
| | | | | | | | | | | | | | | | |
| | | | | | | Periods ended | |
| Average Annual Total Returns | | | | December 31, 2023* | |
| | | | | |
| Stocks: | | | | | | 1 Year | | | 3 Years | | | 5 Years | |
| | | | | |
Large Cap | | (S&P 500® Index) | | | | | 26.29 | % | | | 10.00 | % | | | 15.69 | % |
| | | | | |
Small Cap | | (Russell 2000® Index) | | | | | 16.93 | % | | | 2.22 | % | | | 9.97 | % |
| | | | | |
International | | (MSCI ACWI ex USA) | | | | | 15.62 | % | | | 1.55 | % | | | 7.08 | % |
| | | | | |
Bonds: | | | | | | | | | | | | | | | | |
| | | | | |
Investment Grade | | (Bloomberg U.S. Aggregate Bond Index) | | | | | 5.53 | % | | | (3.31 | )% | | | 1.10 | % |
| | | | | |
High Yield | | (Bloomberg U.S. Corporate High Yield Bond Index) | | | | | 13.44 | % | | | 1.98 | % | | | 5.37 | % |
| | | | | |
Tax-exempt | | (Bloomberg Municipal Bond Index) | | | | | 6.40 | % | | | (0.40 | )% | | | 2.25 | % |
| | | | | |
Treasury Bills | | (ICE BofAML U.S. 6-Month Treasury Bill Index) | | | | | 5.14 | % | | | 2.17 | % | | | 2.02 | % |
*Source: FactSet. Past performance is no guarantee of future results.
2
| | |
| | | About Your Fund’s Expenses |
| | | |
| | | |
| | | | | | | | |
As a shareholder of a Fund, you may incur two types of costs: (1) transaction costs, which may include sales charges (loads) on purchase payments; redemption fees; and exchange fees; and (2) ongoing costs, including management fees; distribution (12b-1) fees; and other Fund expenses. This example is intended to help you understand your ongoing costs (in dollars) of investing in the Fund and to compare these costs with the ongoing costs of investing in other mutual funds. The example is based on $1,000 invested at the beginning of the period and held for the entire period as indicated below. ACTUAL EXPENSES The first section of the following table provides information about the actual account values and | | | | actual expenses. You may use the information in this section, together with the amount you invested, to estimate the expenses that you paid over the period. Simply divide your account value by $1,000 (for example, an $8,600 account value divided by $1,000 = 8.6), then multiply the result by the number in the first section under the heading entitled “Expenses Paid During the Period” to estimate the expenses you paid on your account during this period. HYPOTHETICAL EXAMPLE FOR COMPARISON PURPOSES The second section of the following table provides information about hypothetical account values and hypothetical expenses based on the Fund’s actual expense ratio and an assumed annual rate of return of 5% before expenses, which is not the Fund’s | | | | actual return. The hypothetical account values and expenses may not be used to estimate the actual ending account balance or expenses you paid for the period. You may use this information to compare the ongoing costs of investing in the Fund and other funds by comparing this 5% hypothetical example with the 5% hypothetical examples that appear in the shareholder reports of other funds. Please note that the expenses shown in the table are meant to highlight your ongoing costs only and do not reflect any transactional costs, such as sales charges (loads), redemption fees, or exchange fees. Therefore, the second section of the table is useful in comparing ongoing costs only, and will not help you determine the relative total costs of owning different funds. |
| | | | | | | | | | |
Six Months Ended
December 31, 2023 | | Expense
Ratio for
the Period | | Beginning
Account
Value
07/01/23 | | Ending
Account
Value
12/31/23 | | | Expenses
Paid
During
the Period* |
AMG GW&K ESG Bond Fund |
|
Based on Actual Fund Return |
Class N | | 0.68% | | $1,000 | | | $1,037 | | | $3.49 |
Class I | | 0.48% | | $1,000 | | | $1,038 | | | $2.47 |
|
Based on Hypothetical 5% Annual Return |
Class N | | 0.68% | | $1,000 | | | $1,022 | | | $3.47 |
Class I | | 0.48% | | $1,000 | | | $1,023 | | | $2.45 |
AMG GW&K Enhanced Core Bond ESG Fund |
|
Based on Actual Fund Return |
Class N | | 0.73% | | $1,000 | | | $1,033 | | | $3.74 |
Class I | | 0.56% | | $1,000 | | | $1,032 | | | $2.87 |
Class Z | | 0.48% | | $1,000 | | | $1,034 | | | $2.46 |
|
Based on Hypothetical 5% Annual Return |
Class N | | 0.73% | | $1,000 | | | $1,022 | | | $3.72 |
Class I | | 0.56% | | $1,000 | | | $1,022 | | | $2.85 |
Class Z | | 0.48% | | $1,000 | | | $1,023 | | | $2.45 |
AMG GW&K High Income Fund |
|
Based on Actual Fund Return |
Class N | | 0.84% | | $1,000 | | | $1,053 | | | $4.35 |
Class I | | 0.64% | | $1,000 | | | $1,054 | | | $3.31 |
|
Based on Hypothetical 5% Annual Return |
Class N | | 0.84% | | $1,000 | | | $1,021 | | | $4.28 |
Class I | | 0.64% | | $1,000 | | | $1,022 | | | $3.26 |
| | | | | | | | | | |
Six Months Ended
December 31, 2023 | | Expense
Ratio for
the Period | | Beginning
Account
Value
07/01/23 | | Ending
Account
Value
12/31/23 | | | Expenses
Paid
During
the Period* |
AMG GW&K Municipal Bond Fund |
|
Based on Actual Fund Return |
Class N | | 0.72% | | $1,000 | | | $1,037 | | | $3.70 |
Class I | | 0.39% | | $1,000 | | | $1,039 | | | $2.00 |
|
Based on Hypothetical 5% Annual Return |
Class N | | 0.72% | | $1,000 | | | $1,022 | | | $3.67 |
Class I | | 0.39% | | $1,000 | | | $1,023 | | | $1.99 |
| | | | | | | | | | |
AMG GW&K Municipal Enhanced Yield Fund |
|
Based on Actual Fund Return |
Class N | | 0.99% | | $1,000 | | | $1,044 | | | $5.10 |
Class I | | 0.64% | | $1,000 | | | $1,046 | | | $3.30 |
Class Z | | 0.59% | | $1,000 | | | $1,046 | | | $3.04 |
|
Based on Hypothetical 5% Annual Return |
Class N | | 0.99% | | $1,000 | | | $1,020 | | | $5.04 |
Class I | | 0.64% | | $1,000 | | | $1,022 | | | $3.26 |
Class Z | | 0.59% | | $1,000 | | | $1,022 | | | $3.01 |
| * | Expenses are equal to the Fund’s annualized expense ratio multiplied by the average account value over the period, multiplied by the number of days in the most recent fiscal half-year (184), then divided by 365. |
3
| | |
| | | AMG GW&K ESG Bond Fund Portfolio Manager’s Comments (unaudited) |
| | | |
| | | |
| | | | | | | | |
THE YEAR IN REVIEW AMG GW&K ESG Bond Fund Class N (the “Fund”) shares returned 6.69% for the year ended December 31, 2023, compared with the 5.53% return for its current benchmark, the Bloomberg U.S. Aggregate Bond Index (the “Index”). MARKET OVERVIEW The fixed income market experienced a solid rally in the first quarter of 2023, rebounding from its worst year on record. Much of the period saw a continuation of the tension that drove trading in 2022: inflation continued to slow, but at a glacial pace; a moribund housing market and downbeat consumer had yet to manifest as a slowdown in spending; and a record pace of rate hikes was unable to cool a stubbornly hot labor market. Investors also struggled to anticipate the U.S. Federal Reserve’s (the “Fed) reaction function amid the various crosscurrents, while Chair Powell’s commentary offered few concrete insights beyond a firm resolve and data dependence. But the narrative shifted abruptly in the final weeks, as signs of systemic instability flared up amid a flurry of bank failures. The implications of this turmoil for financial conditions were not yet evident, but the stress in the banking sector was a complicating factor for both the Fed and the bond market. The market posted a small loss in the second quarter, giving back a portion of the banking crisis-inspired rally that occurred in the closing days of March. Sentiment was cautious at the outset and investors sought haven assets on the possibility of contagion in the financial sector. But as it became clear that fallout from the failure of several regional lenders was likely to be contained, attention returned to the underlying strength of the economy and the stubborn persistence of inflation. The labor market gave only the slightest indications of softening, the buoyant housing sector continued to defy higher mortgage rates, and consumer spending once again proved irrepressible. Inflation showed limited progress on its path lower, plateauing at a level solidly above the Fed’s 2% target. Against this backdrop, the Federal Open Market Committee (FOMC) endeavored to maintain restrictive financial conditions by raising rates and providing hawkish guidance. There was nevertheless scant evidence of the Fed’s success in curbing aggregate demand away from some narrow segments of the commercial real estate and consumer finance markets. Fixed income markets posted a significant loss in the third quarter that more than offset the gains achieved in the first half of the year. The | | | | higher-for-longer Fed narrative increasingly took center stage, driven by a surprisingly resilient economy, surging oil prices, and inflation that persisted well above the Fed’s 2% target. While there were subtle signs that the labor market and consumer credit metrics might be softening, the unemployment rate remained near cycle lows and the consumer continued to spend robustly. The undeniably strong cadence of the economy left economists upgrading their third-quarter GDP growth estimates and recharging optimism for a soft landing. Fed officials held rates steady at the September FOMC meeting, but thwarted hopes for a pivot by signaling the possibility of one more hike during the year and projecting less easing in 2024/2025. The market experienced an extraordinary rally in the fourth quarter on elevated odds of an economic soft landing and dovish signals from the Fed. The strong performance was a sharp reversal from the prior quarter, which briefly raised the specter of an unprecedented third consecutive annual loss for the bond market. Sentiment was bolstered first by news that the US Treasury’s borrowing needs were lower than feared and then lifted further by a series of upbeat economic readings and moderating price pressure. The final stage of the rally was powered by the arrival of the long-awaited Fed pivot, which left little doubt that the hiking cycle had concluded. Both the rates market and credit swiftly repriced to reflect a more rapid series of cuts and narrower risk premia, lifting asset prices across the board, and broadly easing financial conditions. FUND PERFORMANCE The Fund outperformed the Index for 2023. The Fund’s overweight to spread product was the main driver of outperformance, particularly the overweight to Corporates. Our out-of-benchmark allocation to high yield Corporates and overweight to lower rated investment grade Corporates were also significant positive contributors along with our overweight to Taxable Municipals. The Fund also benefited from its underweight to, and allocation within, Securitized. This was offset somewhat by modestly negative security selection within BBB-rated Corporates, particularly within the communications, basic industry, and banking sectors. The effects from duration and yield curve were muted given our general neutral positioning. The corporate bond market remains in a transition period with respect to ESG and sustainability. Many companies have set sustainability targets and are | | | | now shifting into the implementation phase, at times supported by public funds and incentives. However, higher inflation and increased regulatory costs of reporting have kept progress slow. Still, despite a sometimes-downbeat portrayal in media, investors continue to show a strong interest in ESG and sustainability, with fund flows and ESG bond issuance remaining roughly steady from last year. 2024 promises to be another important year for global ESG topics with many important regions poised for elections that could have a meaningful impact on the direction of ESG initiatives globally. Overall, we believe ESG and sustainability concerns will remain key issues for both companies and investors in the coming year. We continue to integrate ESG as a core part of our fundamental investment process and will closely monitor regulatory and policy actions that could influence the ESG investing landscape. OUTLOOK After a brief period in the second quarter that saw the bond market converge with the Fed’s dot plot, a rift has once again formed. The Fed projects three rate cuts in 2024 while the Fed Funds futures market expects more than six. Similarly, the persistent inversion of the yield curve suggests the bond market is pricing in elevated odds of a recession, while the Fed’s median projections don’t see Gross Domestic Product (GDP) growth falling below 1.4%. The inversion of the yield curve seems less likely to persist indefinitely, especially if rates normalize into a soft landing. A soft landing would provide a favorable backdrop for corporate fundamentals. By creating conditions that allow the Fed to cut rates, it would both support topline growth and promote favorable liquidity conditions, thereby easing future refinancing needs. It would also be constructive on a technical basis, given it would enhance the appeal of spread product. Valuations at current levels are less appealing, with breakevens versus Treasuries at the lower end of their historical range and leaving little room for error. As such, we believe this backdrop supports a neutral view of credit. Within the space, we favor names with defensive operating and financial metrics, given that investors do not seem to be assigning a meaningful discount to riskier business profiles. Within the mortgage-backed securities (MBS) space, we see a continued interest from banks helping support demand as valuations |
4
| | |
| | | AMG GW&K ESG Bond Fund Portfolio Manager’s Comments (continued) |
| | | |
| | | |
| | | | | | | | |
edge closer to long-term averages. We continue to favor seasoned, high-coupon pools that offer higher carry and better convexity profiles. The views expressed represent the opinions of GW&K Investment Management, LLC as of December 31, 2023, and are not intended as a forecast or guarantee of future results, and are subject to change without notice. | | | | | | | | |
5
| | |
| | | AMG GW&K ESG Bond Fund Portfolio Manager’s Comments (continued) |
| | | |
| | | |
CUMULATIVE TOTAL RETURN PERFORMANCE
AMG GW&K ESG Bond Fund’s cumulative total return is based on the daily change in net asset value (NAV), and assumes that all dividends and distributions were reinvested. The graph compares a hypothetical $10,000 investment made in the AMG GW&K ESG Bond Fund’s Class N shares on December 31, 2013, to a $10,000 investment made in the Bloomberg U.S. Aggregate Bond Index for the same time period. The graph and table do not reflect the deduction of taxes that a shareholder would pay on a Fund distribution or redemption of shares. The listed returns for the Fund are net of expenses and the returns for the index exclude expenses. Total returns would have been lower had certain expenses not been reduced.
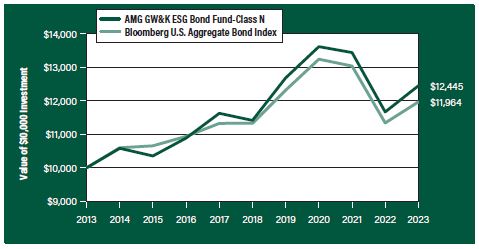
The table below shows the average annual total returns for the AMG GW&K ESG Bond Fund and the Bloomberg U.S. Aggregate Bond Index for the same time periods ended December 31, 2023.
| | | | | | | | | | | | |
| Average Annual Total Returns1 | | One
Year | | | Five
Years | | | Ten
Years | |
| AMG GW&K ESG Bond Fund2, 3, 4, 5, 6, 7, 8, 9, 10, 11, 12, 13, 14, 15, 16, 17, 18, 19, 20, 21, 22, 23 | |
| | | |
Class N | | | 6.69 | % | | | 1.75 | % | | | 2.21% | |
| | | |
Class I | | | 6.85 | % | | | 1.96 | % | | | 2.37% | |
| | | |
Bloomberg U.S. Aggregate Bond Index24 | | | 5.53 | % | | | 1.10 | % | | | 1.81% | |
The performance data shown represents past performance. Past performance is not a guarantee of future results. Current performance may be lower or higher than the performance data quoted. The investment return and principal value of an investment will fluctuate so that an investor’s shares, when redeemed, may be worth more or less than their original cost.
Investors should carefully consider the Fund’s investment objectives, risks, charges and expenses before investing. For performance information through the most recent month end, current net asset values per share for the Fund and other information, please call 800.548.4539 or visit our website at wealth.amg.com for a free prospectus. Read it carefully before investing or sending money.
Distributed by AMG Distributors, Inc., member FINRA/SIPC.
| 1 | Total return equals income yield plus share price change and assumes reinvestment of all dividends and capital gain distributions. Returns are net of fees and may reflect offsets of Fund expenses as described in the prospectus. No adjustment has been made for taxes payable by shareholders on their reinvested dividends and capital gain distributions. Returns for periods greater than one year are annualized. The listed returns on the Fund are net of expenses and based on the published NAV as of December 31, 2023. All returns are in U.S. Dollars($). |
| 2 | As of March 19, 2021, the Fund’s Subadviser was changed to GW&K Investment Management, LLC. Prior to |
|
March 19, 2021, the Fund was known as the AMG Managers Loomis Sayles Bond Fund and had different principal investment strategies and corresponding risks. Performance shown for periods prior to March 19, 2021, reflects the performance and investment strategies of the Fund’s previous Subadviser, Loomis, Sayles & Company, L.P. The Fund’s past performance would have been different if the Fund were managed by the current Subadviser and strategy, and the Fund’s prior performance record might be less pertinent for investors considering whether to purchase shares of the Fund. 3 From time to time, the Fund’s Investment Manager has waived fees and/or absorbed Fund expenses, which has resulted in higher returns. 4 Market prices of investments held by the Fund may fall rapidly or unpredictably due to a variety of factors, including economic, political, or market conditions, or other factors including terrorism, war, natural disasters and the spread of infectious illness or other public health issues, including epidemics or pandemics, or in response to events that affect particular industries or companies. 5 The Fund may not be able to dispose of particular investments, such as illiquid securities, readily at favorable times or prices or the Fund may have to sell them at a loss. 6 Because the Fund is an actively managed investment portfolio, security selection or focus on securities in a particular style, market sector or group of companies may cause the Fund to incur losses or underperform relative to its benchmarks or other funds with a similar investment objective. There can be no guarantee that the Subadviser’s investment techniques and risk analysis will produce the desired result. 7 The value of a debt security changes in response to various factors, including, for example, market-related factors, such as changes in interest rates or changes in the actual or perceived ability of an issuer to meet its obligations. Investments in debt securities are subject to, among other risks, credit risk, interest rate risk, extension risk, prepayment risk and liquidity risk. 8 Fixed coupon payments (cash flows) of bonds and debt securities may become less competitive with the market in periods of rising interest rates and cause bond prices to decline. During periods of increasing interest rates, the Fund may experience high levels of volatility and shareholder redemptions, and may have to sell securities at times when it would otherwise not do so, and at unfavorable prices, which could reduce the returns of the Fund. 9 The Fund will normally receive income which may include interest, dividends and/or capital gains, depending upon its investments. The distribution |
| |
6
| | |
| | | AMG GW&K ESG Bond Fund Portfolio Manager’s Comments (continued) |
| | | |
| | | |
| | | | | | | | |
amount paid by the Fund will vary and generally depends on the amount of income the Fund earns (less expenses) on its portfolio holdings, and capital gains or losses it recognizes. A decline in the Fund’s income or net capital gains arising from its investments may reduce its distribution level. 10 During periods of rising interest rates, a debtor may pay back a bond or other fixed income security slower than expected or required, and the value of such security may fall. 11 Inflation risk is the risk that the value of assets or income from investments will be worth less in the future. Inflation rates may change frequently and drastically as a result of various factors and the Fund’s investments may not keep pace with inflation, which may result in losses to Fund investors or adversely affect the real value of shareholders’ investments in the Fund. As inflation rates increase, fixed income securities markets may experience heightened levels of interest rate volatility and liquidity risk. Deflation risk is the risk that the prices throughout the economy decline over time – the opposite of inflation. Deflation may have an adverse effect on the creditworthiness of issuers and may make issuer default more likely, which may result in a decline in the value of the Fund’s portfolio. 12 Factors unique to the municipal bond market may negatively affect the value of municipal bonds. 13 A debtor may exercise its right to pay back a bond or other debt security earlier than expected or required during periods of decreasing interest rates. 14 The Fund may have difficulty reinvesting payments from debtors and may receive lower rates than from its original investments. 15 The issuer of bonds or other debt securities may be unable or unwilling, or may be perceived as unable or unwilling, to make timely interest or principal payments or otherwise honor its obligations. 16 Below investment grade debt securities and unrated securities of similar credit quality (commonly known as “junk bonds” or “high yield securities”) may be subject to greater levels of interest rate, credit, liquidity, and market risk than higher-rated securities. These securities are | | | | considered predominately speculative with respect to the issuer’s continuing ability to make principal and interest payments. 17 Obligations issued by some U.S. Government agencies, authorities, instrumentalities, or sponsored enterprises such as Government National Mortgage Association (“GNMA”) are backed by the full faith and credit of the U.S. Government, while obligations issued by others, such as Federal National Mortgage Association (“FNMA”), Federal Home Loan Mortgage Corporation (“FHLMC”), and Federal Home Loan Banks (“FHLBs”), are not backed by the full faith and credit of the U.S. Government and are backed solely by the entity’s own resources or by the ability of the entity to borrow from the U.S. Treasury. If one of these agencies defaults on a loan, there is no guarantee that the U.S. Government will provide financial support. 18 Investments in asset-backed and mortgage-backed securities involve risk of severe credit downgrades, loss due to prepayments that occur earlier or later than expected, illiquidity and default. 19 Investments in foreign issuers involve additional risks (such as risks arising from less frequent trading, changes in political or social conditions, and less publicly available information about non-U.S. issuers) that differ from those associated with investments in U.S. issuers and may result in greater price volatility. 20 Investments in emerging markets are subject to the general risks of foreign investments, as well as additional risks which can result in greater price volatility. Such additional risks include the risk that markets in emerging market countries are typically less developed and less liquid than markets in developed countries and such markets are subjected to increased economic, political, or regulatory uncertainties. 21 Fluctuations in exchange rates may affect the total loss or gain on a non-U.S. dollar investment when converted back to U.S. dollars and exposure to non-U.S. currencies may subject the Fund to the risk that those currencies will decline in value relative to the U.S. dollar. 22 Because exchange-traded funds incur their own | | | | costs, investing in them could result in a higher cost to the investor. 23 Because applying the Fund’s ESG investment criteria may result in the selection or exclusion of securities of certain issuers for reasons other than financial performance, the Fund’s investment returns may underperform funds that do not incorporate ESG factors into their investment process. The incorporation of ESG criteria into the investment process may affect the Fund’s investment exposure to certain companies, sectors, regions, countries or types of investments, which could negatively impact the Fund’s performance depending on whether such investments are in or out of favor. Applying ESG criteria to investment decisions is qualitative and subjective by nature, and there is no guarantee that the criteria utilized by the Subadviser or any judgment exercised by the Subadviser will improve the financial performance of the Fund or reflect the beliefs or values of any particular investor. ESG standards differ by region and industry, and a company’s ESG practices or the Subadviser’s assessment of a company’s ESG practices may change over time. 24 The Bloomberg U.S. Aggregate Bond Index is an index of the U.S. investment-grade fixed-rate bond market, including both government and corporate bonds. Unlike the Fund, the Bloomberg U.S. Aggregate Bond Index is unmanaged, is not available for investment and does not incur expenses. “Bloomberg®” and any Bloomberg index described herein are service marks of Bloomberg Finance L.P. and its affiliates, including Bloomberg Index Services Limited (“BISL”), the administrator of the index (collectively, “Bloomberg”) and have been licensed for use for certain purposes by AMG Funds LLC. Bloomberg is not affiliated with AMG Funds LLC, and Bloomberg does not approve, endorse, review, or recommend the fund described herein. Bloomberg does not guarantee the timeliness, accurateness, or completeness of any data or information relating to such fund. Not FDIC insured, nor bank guaranteed. May lose value. |
7
| | |
| | | AMG GW&K ESG Bond Fund Fund Snapshots (unaudited) December 31, 2023 |
| | | |
| | | |
PORTFOLIO BREAKDOWN
| | |
| Category | | % of
Net Assets |
| | |
Corporate Bonds and Notes | | 52.4 |
| | |
U.S. Government and Agency Obligations | | 39.3 |
| | |
Municipal Bonds | | 6.3 |
| | |
Asset-Backed Securities | | 1.2 |
| | |
Short-Term Investments | | 3.3 |
| | |
Other Assets, less Liabilities | | (2.5) |
| | |
| Rating | | % of Market Value1 |
| | |
U.S. Government and Agency Obligations | | 39.6 |
| | |
Aaa/AAA | | 3.4 |
| | |
Aa/AA | | 7.2 |
| | |
A | | 9.2 |
| | |
Baa/BBB | | 20.5 |
| | |
Ba/BB | | 19.8 |
| | |
B | | 0.3 |
| 1 | Includes market value of long-term fixed-income securities only. |
TOP TEN HOLDINGS
| | |
| Security Name | | % of
Net Assets |
| | |
FHLMC, 3.000%, 04/01/51 | | 3.1 |
| | |
U.S. Treasury Bonds, 2.250%, 05/15/41 | | 2.5 |
| | |
U.S. Treasury Bonds, 1.875%, 02/15/51 | | 2.2 |
| | |
FNMA, 3.500%, 08/01/49 | | 2.2 |
| | |
FNMA, 3.500%, 02/01/35 | | 2.2 |
| | |
Freddie Mac Multifamily Structured Pass Through Certificates, Series K134, Class A2, 2.243%, 10/25/31 | | 2.1 |
| | |
U.S. Treasury Bonds, 3.125%, 05/15/48 | | 2.1 |
| | |
FHLMC, 5.500%, 07/01/53 | | 2.1 |
| | |
FNMA, 3.500%, 02/01/47 | | 2.0 |
| | |
FNMA, 5.500%, 11/01/52 | | 1.9 |
| | | |
| | |
Top Ten as a Group | | 22.4 |
| | |
Credit quality ratings shown above reflect the highest rating assigned by either Standard & Poor’s (“S&P”), Moody’s Investors Service, Inc. (“Moody’s”) or Fitch. These rating agencies are independent, nationally recognized statistical rating organizations and are widely used. Investment grade ratings are credit ratings of BBB- or higher. Below investment grade ratings are credit ratings of BB+ or lower. Investments designated N/R are not rated by any of the rating agencies. Unrated investments do not necessarily indicate low credit quality. Credit quality ratings are subject to change.
Because a fund’s strategy may result in multiple investments in particular sectors of the economy, its performance may depend on the performance of those sectors and may fluctuate more widely than investments diversified across more sectors. For additional information on these and other risk considerations, please see the Fund’s prospectus.
Any sectors, industries, or securities discussed should not be perceived as investment recommendations. Mention of a specific security should not be considered a recommendation to buy or solicitation to sell that security. Specific securities mentioned in this report may have been sold from the Fund’s portfolio of investments by the time you receive this report.
8
| | |
| | | AMG GW&K ESG Bond Fund Schedule of Portfolio Investments December 31, 2023 |
| | | |
| | | |
| | | | | | | | |
| | | Principal
Amount | | | Value | |
| | |
Corporate Bonds and Notes - 52.4% | | | | | | | | |
| |
Financials - 11.0% | | | | | |
| | |
American Express Co. | | | | | | | | |
(3.550% to 09/15/26 then U.S. Treasury Yield Curve CMT 5 year + 2.854%), 3.550%, 09/15/261,2,3 | | | $1,195,000 | | | | $1,024,473 | |
| | |
Bank of America Corp. | | | | | | | | |
MTN, (4.330% to 03/15/49 then 3 month SOFR + 1.782%), 4.330%, 03/15/501,3 | | | 2,775,000 | | | | 2,442,491 | |
(5.872% to 09/15/33 then SOFR + 1.840%), 5.872%, 09/15/341,3,4 | | | 3,100,000 | | | | 3,244,988 | |
| | |
The Bank of New York Mellon Corp. | | | | | | | | |
Series G, (4.700% to 09/20/25 then U.S. Treasury Yield Curve CMT 5 year + 4.358%), 4.700%, 09/20/251,2,3 | | | 4,100,000 | | | | 3,995,562 | |
| | |
Citigroup, Inc. | | | | | | | | |
Series P, (5.950% to 05/15/25 then 3 month SOFR + 4.167%), 5.950%, 05/15/251,2,3 | | | 1,550,000 | | | | 1,517,152 | |
Series T, (6.250% to 08/15/26 then 3 month SOFR + 4.779%), 6.250%, 08/15/261,2,3,4 | | | 1,075,000 | | | | 1,061,022 | |
| | |
Crown Castle, Inc.
4.000%, 03/01/27 | | | 2,300,000 | | | | 2,223,045 | |
| | |
The Goldman Sachs Group, Inc. | | | | | | | | |
Series O, (5.300% to 11/10/26 then 3 month SOFR + 4.096%), 5.300%, 11/10/261,2,3,4 | | | 1,125,000 | | | | 1,098,853 | |
6.750%, 10/01/37 | | | 1,850,000 | | | | 2,036,362 | |
| | |
Huntington Bancshares, Inc. | | | | | | | | |
(4.443% to 08/04/27 then SOFR + 1.970%), 4.443%, 08/04/281,3 | | | 2,430,000 | | | | 2,355,353 | |
| | |
Morgan Stanley | | | | | | | | |
3.950%, 04/23/27 | | | 2,200,000 | | | | 2,135,560 | |
(4.431% to 01/23/29 then 3 month SOFR + 1.890%), 4.431%, 01/23/301,3 | | | 2,948,000 | | | | 2,871,285 | |
| | |
The PNC Financial Services Group, Inc. | | | | | | | | |
(5.068% to 01/24/33 then SOFR + 1.933%), 5.068%, 01/24/341,3 | | | 2,386,000 | | | | 2,334,607 | |
| | |
SBA Communications Corp.
3.875%, 02/15/27 | | | 2,950,000 | | | | 2,832,926 | |
| | |
SLM Corp. | | | | | | | | |
3.125%, 11/02/26 | | | 3,365,000 | | | | 3,137,644 | |
4.200%, 10/29/25 | | | 838,000 | | | | 812,860 | |
| | |
Starwood Property Trust, Inc.
4.750%, 03/15/25 | | | 1,700,000 | | | | 1,677,390 | |
| | |
Truist Financial Corp., MTN | | | | | | | | |
(5.867% to 06/08/33 then SOFR + 2.361%), 5.867%, 06/08/341,3 | | | 2,288,000 | | | | 2,333,975 | |
| | |
US Bancorp | | | | | | | | |
(5.775% to 06/12/28 then SOFR + 2.020%), 5.775%, 06/12/291,3 | | | 2,350,000 | | | | 2,414,282 | |
| | |
Wells Fargo & Co.
Series U, 5.875%, 06/15/252,3 | | | 3,400,000 | | | | 3,364,560 | |
| | | | | | | | |
| | | Principal
Amount | | | Value | |
| | |
Weyerhaeuser Co.
6.875%, 12/15/33 | | | $2,600,000 | | | | $2,857,623 | |
| | |
Total Financials | | | | | | | 47,772,013 | |
| |
Industrials - 39.7% | | | | | |
| | |
Advocate Health & Hospitals Corp.
4.272%, 08/15/48 | | | 1,700,000 | | | | 1,528,686 | |
| | |
AECOM
5.125%, 03/15/27 | | | 1,650,000 | | | | 1,638,118 | |
| | |
Air Canada (Canada)
3.875%, 08/15/265 | | | 1,200,000 | | | | 1,146,468 | |
| | |
Air Products and Chemicals, Inc. | | | | | | | | |
2.700%, 05/15/40 | | | 1,950,000 | | | | 1,485,379 | |
4.800%, 03/03/334 | | | 1,171,000 | | | | 1,208,340 | |
| | |
Alcoa Nederland Holding, B.V. (Netherlands)
4.125%, 03/31/294,5 | | | 5,150,000 | | | | 4,775,665 | |
| | |
Anheuser-Busch InBev Worldwide, Inc.
4.375%, 04/15/38 | | | 2,200,000 | | | | 2,086,313 | |
| | |
APi Group DE, Inc.
4.125%, 07/15/294,5 | | | 1,275,000 | | | | 1,160,194 | |
| | |
Aramark Services, Inc.
5.000%, 02/01/284,5 | | | 3,020,000 | | | | 2,929,520 | |
| | |
Ashtead Capital, Inc.
1.500%, 08/12/265 | | | 3,536,000 | | | | 3,205,920 | |
| | |
AT&T, Inc.
4.300%, 02/15/30 | | | 2,200,000 | | | | 2,154,253 | |
| | |
Ball Corp.
2.875%, 08/15/30 | | | 3,625,000 | | | | 3,110,195 | |
| | |
Broadcom, Inc.
4.300%, 11/15/32 | | | 2,820,000 | | | | 2,705,407 | |
| | |
BWX Technologies, Inc.
4.125%, 06/30/285 | | | 1,225,000 | | | | 1,135,930 | |
| | |
Campbell Soup Co.
2.375%, 04/24/30 | | | 2,680,000 | | | | 2,322,904 | |
| | |
CCO Holdings LLC/CCO Holdings Capital Corp.
5.500%, 05/01/265 | | | 2,000,000 | | | | 1,986,680 | |
| | |
Celanese US Holdings LLC
6.550%, 11/15/30 | | | 4,249,000 | | | | 4,491,732 | |
| | |
Centene Corp.
3.375%, 02/15/30 | | | 3,650,000 | | | | 3,274,890 | |
| | |
CF Industries, Inc.
5.150%, 03/15/344 | | | 1,170,000 | | | | 1,157,459 | |
| | |
Cisco Systems, Inc.
5.500%, 01/15/40 | | | 1,400,000 | | | | 1,490,285 | |
| | |
Clean Harbors, Inc.
4.875%, 07/15/275 | | | 2,520,000 | | | | 2,469,328 | |
| | |
Clearwater Paper Corp.
4.750%, 08/15/285 | | | 1,950,000 | | | | 1,807,654 | |
| | |
Cogent Communications Group, Inc.
3.500%, 05/01/265 | | | 3,365,000 | | | | 3,221,533 | |
| | |
Comcast Corp.
4.650%, 02/15/334 | | | 3,217,000 | | | | 3,236,379 | |
The accompanying notes are an integral part of these financial statements.
9
| | |
| | | AMG GW&K ESG Bond Fund Schedule of Portfolio Investments (continued) |
| | | |
| | | |
| | | | | | | | |
| | | Principal
Amount | | | Value | |
| | |
Industrials - 39.7% (continued) | | | | | | | | |
| | |
CommonSpirit Health | | | | | | | | |
3.347%, 10/01/29 | | | $1,950,000 | | | | $1,780,459 | |
| | |
Crowdstrike Holdings, Inc. | | | | | | | | |
3.000%, 02/15/294 | | | 1,285,000 | | | | 1,161,289 | |
| | |
Crown Americas LLC/Crown Americas Capital Corp. V | | | | | | | | |
4.250%, 09/30/26 | | | 2,850,000 | | | | 2,764,505 | |
| | |
Dell International LLC/EMC Corp. | | | | | | | | |
8.100%, 07/15/36 | | | 972,000 | | | | 1,195,462 | |
| | |
Delta Air Lines, Inc. | | | | | | | | |
7.375%, 01/15/264 | | | 2,475,000 | | | | 2,558,531 | |
| | |
Discovery Communications LLC | | | | | | | | |
3.950%, 03/20/28 | | | 2,047,000 | | | | 1,947,032 | |
| | |
FMG Resources August 2006 Pty, Ltd. (Australia) | | | | | | | | |
4.500%, 09/15/275 | | | 2,750,000 | | | | 2,642,157 | |
| | |
The Ford Foundation | | | | | | | | |
Series 2020, 2.415%, 06/01/50 | | | 2,725,000 | | | | 1,793,247 | |
| | |
Freeport-McMoRan, Inc. | | | | | | | | |
4.625%, 08/01/304 | | | 2,961,000 | | | | 2,893,538 | |
| | |
Graphic Packaging International LLC | | | | | | | | |
3.500%, 03/01/295 | | | 2,850,000 | | | | 2,566,093 | |
| | |
Hasbro, Inc. | | | | | | | | |
3.900%, 11/19/294 | | | 3,120,000 | | | | 2,901,510 | |
| | |
HB Fuller Co. | | | | | | | | |
4.250%, 10/15/28 | | | 3,150,000 | | | | 2,945,419 | |
| | |
HCA, Inc. | | | | | | | | |
3.500%, 09/01/304 | | | 3,050,000 | | | | 2,764,905 | |
| | |
Hilton Domestic Operating Co., Inc. | | | | | | | | |
4.875%, 01/15/30 | | | 2,600,000 | | | | 2,519,808 | |
| | |
The Home Depot, Inc. | | | | | | | | |
5.875%, 12/16/36 | | | 1,450,000 | | | | 1,620,728 | |
| | |
Howmet Aerospace, Inc. | | | | | | | | |
6.875%, 05/01/25 | | | 1,050,000 | | | | 1,063,611 | |
| | |
Jacobs Engineering Group, Inc. | | | | | | | | |
5.900%, 03/01/33 | | | 4,293,000 | | | | 4,382,461 | |
| | |
KB Home | | | | | | | | |
4.800%, 11/15/29 | | | 1,222,000 | | | | 1,167,621 | |
6.875%, 06/15/27 | | | 1,751,000 | | | | 1,819,724 | |
| | |
Kraft Heinz Foods Co. | | | | | | | | |
4.625%, 10/01/39 | | | 2,480,000 | | | | 2,305,206 | |
| | |
Lamar Media Corp. | | | | | | | | |
4.875%, 01/15/294 | | | 3,250,000 | | | | 3,137,287 | |
| | |
Methanex Corp. (Canada) | | | | | | | | |
5.125%, 10/15/27 | | | 1,205,000 | | | | 1,177,166 | |
| | |
Microsoft Corp. | | | | | | | | |
2.525%, 06/01/50 | | | 2,450,000 | | | | 1,672,549 | |
| | |
MSCI, Inc. | | | | | | | | |
3.250%, 08/15/335 | | | 2,015,000 | | | | 1,684,111 | |
| | |
Mueller Water Products, Inc. | | | | | | | | |
4.000%, 06/15/295 | | | 3,000,000 | | | | 2,732,997 | |
| | | | | | | | |
| | | Principal
Amount | | | Value | |
| | |
Murphy Oil USA, Inc. | | | | | | | | |
4.750%, 09/15/29 | | | $3,250,000 | | | | $3,079,375 | |
| | |
Novelis Corp. | | | | | | | | |
3.250%, 11/15/265 | | | 3,175,000 | | | | 2,988,941 | |
| | |
Owens Corning | | | | | | | | |
7.000%, 12/01/366 | | | 1,800,000 | | | | 2,064,599 | |
| | |
Packaging Corp. of America | | | | | | | | |
5.700%, 12/01/33 | | | 2,155,000 | | | | 2,268,525 | |
| | |
Parker-Hannifin Corp. | | | | | | | | |
3.250%, 06/14/29 | | | 1,650,000 | | | | 1,552,487 | |
| | |
Penske Automotive Group, Inc. | | | | | | | | |
3.500%, 09/01/25 | | | 2,000,000 | | | | 1,940,316 | |
| | |
Prime Security Services Borrower LLC/Prime Finance, Inc. | | | | | | | | |
5.750%, 04/15/265 | | | 2,800,000 | | | | 2,815,170 | |
| | |
PulteGroup, Inc. | | | | | | | | |
6.000%, 02/15/35 | | | 2,050,000 | | | | 2,152,619 | |
| | |
Sensata Technologies, B.V. | | | | | | | | |
4.000%, 04/15/295 | | | 1,275,000 | | | | 1,184,877 | |
| | |
SK Hynix, Inc. (South Korea) | | | | | | | | |
2.375%, 01/19/315 | | | 3,000,000 | | | | 2,431,860 | |
| | |
Sonoco Products Co. | | | | | | | | |
2.850%, 02/01/32 | | | 1,822,000 | | | | 1,550,301 | |
| | |
Sysco Corp. | | | | | | | | |
2.400%, 02/15/30 | | | 3,975,000 | | | | 3,506,270 | |
| | |
Teleflex, Inc. | | | | | | | | |
4.250%, 06/01/285 | | | 3,100,000 | | | | 2,938,133 | |
| | |
Tenet Healthcare Corp. | | | | | | | | |
4.875%, 01/01/26 | | | 3,250,000 | | | | 3,213,380 | |
| | |
Teva Pharmaceutical Finance Netherlands III, B.V. (Netherlands) | | | | | | | | |
5.125%, 05/09/294 | | | 2,300,000 | | | | 2,196,607 | |
| | |
Toll Brothers Finance Corp. | | | | | | | | |
4.875%, 03/15/274 | | | 2,750,000 | | | | 2,734,033 | |
| | |
Travel + Leisure Co. | | | | | | | | |
5.650%, 04/01/246 | | | 2,300,000 | | | | 2,297,125 | |
| | |
Twilio, Inc. | | | | | | | | |
3.625%, 03/15/294 | | | 600,000 | | | | 547,372 | |
3.875%, 03/15/31 | | | 2,194,000 | | | | 1,953,768 | |
| | |
United Parcel Service, Inc. | | | | | | | | |
6.200%, 01/15/38 | | | 1,500,000 | | | | 1,715,088 | |
| | |
United Rentals North America, Inc. | | | | | | | | |
3.875%, 02/15/314 | | | 3,400,000 | | | | 3,089,240 | |
| | |
Verizon Communications, Inc. | | | | | | | | |
3.875%, 02/08/29 | | | 4,408,000 | | | | 4,273,476 | |
| | |
Walgreens Boots Alliance, Inc. | | | | | | | | |
3.200%, 04/15/304 | | | 1,225,000 | | | | 1,078,332 | |
4.800%, 11/18/44 | | | 2,520,000 | | | | 2,099,608 | |
| | |
Walmart, Inc. | | | | | | | | |
4.050%, 06/29/48 | | | 1,850,000 | | | | 1,689,895 | |
The accompanying notes are an integral part of these financial statements.
10
| | |
| | | AMG GW&K ESG Bond Fund Schedule of Portfolio Investments (continued) |
| | | |
| | | |
| | | | | | | | |
| | | Principal
Amount | | | Value | |
| | |
Industrials - 39.7% (continued) | | | | | | | | |
| | |
Western Digital Corp. | | | | | | | | |
4.750%, 02/15/26 | | | $1,916,000 | | | | $1,879,631 | |
| | |
Yum! Brands, Inc. | | | | | | | | |
3.625%, 03/15/314 | | | 3,050,000 | | | | 2,750,472 | |
| | |
Total Industrials | | | | | | | 172,918,148 | |
| | |
Utilities - 1.7% | | | | | | | | |
| | |
National Rural Utilities Cooperative Finance Corp. | | | | | | | | |
1.350%, 03/15/31 | | | 4,635,000 | | | | 3,635,963 | |
| | |
Northern States Power Co. | | | | | | | | |
2.900%, 03/01/50 | | | 5,365,000 | | | | 3,758,287 | |
| | |
Total Utilities | | | | | | | 7,394,250 | |
| | |
Total Corporate Bonds and Notes
(Cost $243,221,612) | | | | | | | 228,084,411 | |
| | |
Asset-Backed Securities - 1.2% | | | | | | | | |
| | |
American Express Credit Account Master Trust | | | | | | | | |
Series 2022-4, Class A | | | | | | | | |
4.950%, 10/15/27 | | | 2,145,000 | | | | 2,151,940 | |
| | |
Ford Credit Auto Owner Trust | | | | | | | | |
Series 2022-B, Class A4 3.930%, 08/15/27 | | | 2,193,000 | | | | 2,155,037 | |
| | |
Toyota Auto Receivables Owner Trust | | | | | | | | |
Series 2021-B, Class A4 | | | | | | | | |
0.530%, 10/15/26 | | | 858,000 | | | | 811,310 | |
| | |
Total Asset-Backed Securities
(Cost $5,073,748) | | | | | | | 5,118,287 | |
| | |
Municipal Bonds - 6.3% | | | | | | | | |
| | |
California Health Facilities Financing Authority
4.190%, 06/01/37 | | | 3,500,000 | | | | 3,237,206 | |
| | |
California State General Obligation, School Improvements, Build America Bonds | | | | | | | | |
7.550%, 04/01/39 | | | 2,300,000 | | | | 2,903,999 | |
| | |
Commonwealth of Massachusetts, Series B | | | | | | | | |
4.110%, 07/15/31 | | | 2,380,694 | | | | 2,361,371 | |
| | |
Dallas Fort Worth International Airport, Series A | | | | | | | | |
4.507%, 11/01/51 | | | 1,000,000 | | | | 933,500 | |
| | |
JobsOhio Beverage System, Series A | | | | | | | | |
2.833%, 01/01/38 | | | 3,700,000 | | | | 3,015,869 | |
| | |
Los Angeles Unified School District, School Improvements, Build America Bonds | | | | | | | | |
5.750%, 07/01/34 | | | 3,225,000 | | | | 3,423,646 | |
| | |
Massachusetts School Building Authority, | | | | | | | | |
Series B, 1.753%, 08/15/30 | | | 4,500,000 | | | | 3,867,779 | |
| | |
New Jersey Economic Development Authority, Pension Funding, Series A (National Insured) | | | | | | | | |
7.425%, 02/15/29 | | | 3,300,000 | | | | 3,565,910 | |
| | |
Port Authority of New York & New Jersey | | | | | | | | |
6.040%, 12/01/29 | | | 2,000,000 | | | | 2,159,850 | |
| | | | | | | | |
| | | Principal
Amount | | | Value | |
| | |
University of California, Series BI | | | | | | | | |
1.697%, 05/15/29 | | | $2,400,000 | | | | $2,092,272 | |
| | |
Total Municipal Bonds
(Cost $31,662,496) | | | | | | | 27,561,402 | |
| |
U.S. Government and Agency Obligations - 39.3% | | | | | |
| |
Fannie Mae - 16.4% | | | | | |
| | |
FNMA | | | | | | | | |
3.500%, 02/01/35 to 02/01/51 | | | 35,224,804 | | | | 33,399,236 | |
4.000%, 07/01/44 to 01/01/51 | | | 21,674,568 | | | | 20,868,127 | |
4.500%, 05/01/48 to 06/01/49 | | | 6,084,577 | | | | 6,054,691 | |
5.000%, 05/01/50 | | | 2,762,454 | | | | 2,775,736 | |
5.500%, 11/01/52 | | | 8,270,894 | | | | 8,450,458 | |
| | |
Total Fannie Mae | | | | | | | 71,548,248 | |
| | |
Freddie Mac - 13.3% | | | | | | | | |
| | |
FHLMC | | | | | | | | |
2.000%, 03/01/36 | | | 7,738,239 | | | | 6,980,786 | |
3.000%, 04/01/51 | | | 15,264,033 | | | | 13,544,148 | |
3.500%, 02/01/50 | | | 8,607,304 | | | | 8,010,947 | |
4.500%, 10/01/48 to 12/01/48 | | | 9,140,912 | | | | 9,011,400 | |
5.500%, 07/01/53 | | | 8,859,092 | | | | 8,945,263 | |
| | |
Freddie Mac Multifamily Structured Pass Through Certificates | | | | | | | | |
Series K134, Class A2
2.243%, 10/25/313 | | | 10,730,000 | | | | 9,195,313 | |
| | |
Freddie Mac REMICS | | | | | | | | |
Series 5297, Class DA
5.000%, 12/25/52 | | | 2,148,576 | | | | 2,130,912 | |
| | |
Total Freddie Mac | | | | | | | 57,818,769 | |
| | |
Ginnie Mae - 0.5% | | | | | | | | |
| | |
GNMA | | | | | | | | |
Series 2023-111, Class FD
(SOFR + 1.000%, Cap 7.000%, Floor 1.000%), 6.338%, 08/20/533 | | | 2,122,350 | | | | 2,116,379 | |
| | |
U.S. Treasury Obligations - 9.1% | | | | | | | | |
| | |
U.S. Treasury Bonds | | | | | | | | |
1.250%, 05/15/50 | | | 4,625,000 | | | | 2,492,261 | |
1.875%, 02/15/51 | | | 15,247,000 | | | | 9,668,146 | |
2.250%, 05/15/41 | | | 14,109,000 | | | | 10,746,539 | |
2.500%, 02/15/46 | | | 2,096,000 | | | | 1,572,737 | |
3.125%, 05/15/48 | | | 10,968,000 | | | | 9,137,715 | |
3.500%, 02/15/39 | | | 6,477,000 | | | | 6,134,174 | |
| | |
Total U.S. Treasury Obligations | | | | | | | 39,751,572 | |
| | |
Total U.S. Government and Agency Obligations
(Cost $195,408,520) | | | | | | | 171,234,968 | |
| |
Short-Term Investments - 3.3% | | | | | |
| |
Joint Repurchase Agreements - 3.2%7 | | | | | |
| | |
Cantor Fitzgerald Securities, Inc., dated 12/29/23, due 01/02/24, 5.470% total to be received $3,008,261 (collateralized by various U.S. Government Agency Obligations, 0.000% - 7.613%, 08/01/25 - 09/20/73, totaling $3,066,563) | | | 3,006,434 | | | | 3,006,434 | |
The accompanying notes are an integral part of these financial statements.
11
| | |
| | | AMG GW&K ESG Bond Fund Schedule of Portfolio Investments (continued) |
| | | |
| | | |
| | | | | | | | |
| | | Principal
Amount | | | Value | |
| |
Joint Repurchase Agreements - 3.2%7 (continued) | | | | | |
| | |
Daiwa Capital Markets America, dated 12/29/23, due 01/02/24, 5.380% total to be received $632,324 (collateralized by various U.S. Government Agency Obligations and U.S. Treasuries, 0.000% - 7.500%, 03/22/24 - 01/01/54, totaling $644,663) | | | $631,946 | | | | $631,946 | |
| | |
RBC Dominion Securities, Inc., dated 12/29/23, due 01/02/24, 5.340% total to be received $3,533,991 (collateralized by various U.S. Government Agency Obligations and U.S. Treasuries, 0.000% - 7.500%, 01/15/24 - 12/01/53, totaling $3,602,533) | | | 3,531,895 | | | | 3,531,895 | |
| | |
Santander U.S. Capital Markets LLC, dated 12/29/23, due 01/02/24, 5.390% total to be received $3,498,670 (collateralized by various U.S. Government Agency Obligations, 1.500% - 6.838%, 10/25/30 - 03/20/71, totaling $3,566,507) | | | 3,496,576 | | | | 3,496,576 | |
| | | | | | | | |
| | | Principal
Amount | | | Value | |
| | |
State of Wisconsin Investment Board, dated 12/29/23, due 01/02/24, 5.470% total to be received $3,463,361 (collateralized by various U.S. Treasuries, 0.125% - 3.625%, 04/15/25 - 02/15/53, totaling $3,527,941) | | | $3,461,257 | | | | $3,461,257 | |
| | |
Total Joint Repurchase Agreements | | | | | | | 14,128,108 | |
| |
Repurchase Agreements - 0.1% | | | | | |
| | |
Fixed Income Clearing Corp., dated 12/29/23 due 01/02/24, 5.150% total to be received $293,168 (collateralized by a U.S. Treasury, 4.125%, 09/30/27, totaling $298,920) | | | 293,000 | | | | 293,000 | |
| | |
Total Short-Term Investments
(Cost $14,421,108) | | | | | | | 14,421,108 | |
| | |
Total Investments - 102.5%
(Cost $489,787,484) | | | | | | | 446,420,176 | |
| |
Other Assets, less Liabilities - (2.5)% | | | | (10,998,720 | ) |
| | |
Net Assets - 100.0% | | | | | | | $435,421,456 | |
| 1 | Fixed to variable rate investment. The rate shown reflects the fixed rate in effect at December 31, 2023. Rate will reset at a future date. |
| 2 | Perpetuity Bond. The date shown represents the next call date. |
| 3 | Variable rate security. The rate shown is based on the latest available information as of December 31, 2023. Certain variable rate securities are not based on a published reference rate and spread but are determined by the issuer or agent and are based on current market conditions. These securities do not indicate a reference rate and spread in their description above. |
| 4 | Some of these securities, amounting to $22,416,408 or 5.1% of net assets, were out on loan to various borrowers and are collateralized by cash and various U.S. Treasury Obligations. See Note 4 of Notes to Financial Statements. |
| 5 | Security exempt from registration under Rule 144A of the Securities Act of 1933. These securities may be resold in transactions exempt from registration, normally to qualified institutional buyers. At December 31, 2023, the value of these securities amounted to $45,823,231 or 10.5% of net assets. |
| 6 | Step Bond: A debt instrument with either deferred interest payments or an interest rate that resets at specific times during its term. |
| 7 | Cash collateral received for securities lending activity was invested in these joint repurchase agreements. |
| | |
| CMT | | Constant Maturity Treasury |
| |
| FHLMC | | Freddie Mac |
| |
| FNMA | | Fannie Mae |
| |
| GNMA | | Ginnie Mae |
| |
| MTN | | Medium-Term Note |
| |
| National Insured | | National Public Finance Guarantee Corp. |
| |
| REMICS | | Real Estate Mortgage Investment Conduit |
| |
| SOFR | | Secured Overnight Financing Rate |
The accompanying notes are an integral part of these financial statements.
12
| | |
| | | AMG GW&K ESG Bond Fund Schedule of Portfolio Investments (continued) |
| | | |
| | | |
The following table summarizes the inputs used to value the Fund’s investments by the fair value hierarchy levels as of December 31, 2023:
| | | | | | | | | | | | | | | | |
| | | Level 1 | | | Level 2 | | | Level 3 | | | Total | |
Investments in Securities | | | | | | | | | | | | | | | | |
| | | | |
Corporate Bonds and Notes† | | | — | | | $ | 228,084,411 | | | | — | | | $ | 228,084,411 | |
| | | | |
Asset-Backed Securities | | | — | | | | 5,118,287 | | | | — | | | | 5,118,287 | |
| | | | |
Municipal Bonds† | | | — | | | | 27,561,402 | | | | — | | | | 27,561,402 | |
| | | | |
U.S. Government and Agency Obligations† | | | — | | | | 171,234,968 | | | | — | | | | 171,234,968 | |
| | | | |
Short-Term Investments | | | | | | | | | | | | | | | | |
| | | | |
Joint Repurchase Agreements | | | — | | | | 14,128,108 | | | | — | | | | 14,128,108 | |
| | | | |
Repurchase Agreements | | | — | | | | 293,000 | | | | — | | | | 293,000 | |
| | | | | | | | | | | | | | | | |
| | | | |
Total Investments in Securities | | | — | | | $ | 446,420,176 | | | | — | | | $ | 446,420,176 | |
| | | | | | | | | | | | | | | | |
| † | All corporate bonds and notes, municipal bonds, and U.S. government and agency obligations held in the Fund are Level 2 securities. For a detailed breakout of corporate bonds and notes, municipal bonds, and U.S. government and agency obligations by major industry or agency classification, please refer to the Fund’s Schedule of Portfolio Investments. |
For the fiscal year ended December 31, 2023, there were no transfers in or out of Level 3.
The accompanying notes are an integral part of these financial statements.
13
| | |
| | | AMG GW&K Enhanced Core Bond ESG Fund Portfolio Manager’s Comments (unaudited) |
| | | |
| | | |
| | | | | | | | |
THE YEAR IN REVIEW AMG GW&K Enhanced Core Bond ESG Fund (the “Fund”) Class N shares returned 5.89% for the year ended December 31, 2023, compared to the return of 5.53% for Fund’s benchmark, the Bloomberg U.S. Aggregate Bond Index. MARKET OVERVIEW The fixed income market experienced a solid rally in the first quarter of 2023, rebounding from its worst year on record. Much of the period saw a continuation of the tension that drove trading in 2022: inflation continued to slow, but at a glacial pace; a moribund housing market and downbeat consumer had yet to manifest as a slowdown in spending; and a record pace of rate hikes was unable to cool a stubbornly hot labor market. Investors also struggled to anticipate the U.S, Federal Reserve (the Fed)’s reaction function amid the various crosscurrents, while Chair Powell’s commentary offered few concrete insights beyond a firm resolve and data dependence. But the narrative shifted abruptly in the final weeks, as signs of systemic instability flared up amid a flurry of bank failures. The implications of this turmoil for financial conditions were not yet evident, but the stress in the banking sector was a complicating factor for both the Fed and the bond market. The market posted a small loss in the second quarter, giving back a portion of the banking crisis-inspired rally that occurred in the closing days of March. Sentiment was cautious at the outset and investors sought haven assets on the possibility of contagion in the financial sector. But as it became clear that fallout from the failure of several regional lenders was likely to be contained, attention returned to the underlying strength of the economy and the stubborn persistence of inflation. The labor market gave only the slightest indications of softening, the buoyant housing sector continued to defy higher mortgage rates, and consumer spending once again proved irrepressible. Inflation showed limited progress on its path lower, plateauing at a level solidly above the Fed’s 2% target. Against this backdrop, the Federal Open Market Committee (FOMC) endeavored to maintain restrictive financial conditions by raising rates and providing hawkish guidance. There was nevertheless scant evidence of the Fed’s success in curbing aggregate demand away from some narrow segments of the commercial real estate and consumer finance markets. | | | | The market posted a significant loss in the third quarter that more than offset the gains achieved in the first half of the year. The higher-for-longer Fed narrative increasingly took center stage, driven by a surprisingly resilient economy, surging oil prices, and inflation that persisted well above the Fed’s 2% target. While there were subtle signs that the labor market and consumer credit metrics might be softening, the unemployment rate remained near cycle lows and the consumer continued to spend robustly. The undeniably strong cadence of the economy left economists upgrading their third-quarter Gross Domestic Product (GDP) growth estimates and recharging optimism for a soft landing. Fed officials held rates steady at the September FOMC meeting, but thwarted hopes for a pivot by signaling the possibility of one more hike during the year and projecting less easing in 2024/2025. The market experienced an extraordinary rally in the fourth quarter on elevated odds of an economic soft landing and dovish signals from the Fed. The strong performance was a sharp reversal from the prior quarter, which briefly raised the specter of an unprecedented third consecutive annual loss for the bond market. Sentiment was bolstered first by news that the U.S. Treasury’s borrowing needs were lower than feared and then lifted further by a series of upbeat economic readings and moderating price pressure. The final stage of the rally was powered by the arrival of the long-awaited Fed pivot, which left little doubt that the hiking cycle had concluded. Both the rates market and credit swiftly repriced to reflect a more rapid series of cuts and narrower risk premia, lifting asset prices across the board, and broadly easing financial conditions. FUND PERFORMANCE The Fund outperformed the Bloomberg U.S. Aggregate Index for 2023. The Fund’s overweight to spread product was the main driver of outperformance, particularly the overweight to Corporates. Our out-of-benchmark allocations to high yield Corporates and Preferreds were also positive contributors along with our overweight to Taxable Municipals and overweight to lower rated investment grade Corporates. This was offset somewhat by negative security selection within BBB-rated Corporates, particularly within the communications, consumer cyclical and finance companies sectors. The effects from duration and yield curve were negative, mostly from our overweight to intermediate rates which underperformed other parts of the curve. | | | | The corporate bond market remains in a transition period with respect to ESG and sustainability. Many companies have set sustainability targets and are now shifting into the implementation phase, at times supported by public funds and incentives. However, higher inflation and increased regulatory costs of reporting have kept progress slow. Still, despite a sometimes-downbeat portrayal in media, investors continue to show a strong interest in ESG and sustainability, with fund flows and ESG bond issuance remaining roughly steady from last year. 2024 promises to be another important year for global ESG topics with many important regions poised for elections that could have a meaningful impact on the direction of ESG initiatives globally. Overall, we believe ESG and sustainability concerns will remain key issues for both companies and investors in the coming year. We continue to integrate ESG as a core part of our fundamental investment process and will closely monitor regulatory and policy actions that could influence the ESG investing landscape. OUTLOOK After a brief period in the second quarter that saw the bond market converge with the Fed’s dot plot, a rift has once again formed. The Fed projects three rate cuts in 2024 while the Fed funds futures market expects more than six. Similarly, the persistent inversion of the yield curve suggests the bond market is pricing in elevated odds of a recession, while the Fed’s median projections don’t see GDP growth falling below 1.4%. The inversion of the yield curve seems less likely to persist indefinitely, especially if rates normalize into a soft landing. A soft landing would provide a favorable backdrop for corporate fundamentals. By creating conditions that allow the Fed to cut rates, it would both support topline growth and promote favorable liquidity conditions, thereby easing future refinancing needs. It would also be constructive on a technical basis, given that it would enhance the appeal of spread product. Valuations at current levels are less appealing, with breakevens versus Treasuries at the lower end of their historical range and leaving little room for error. As such, we believe this backdrop supports a neutral view of credit. Within the space, we favor names with defensive operating and financial metrics, given that investors do not seem to be assigning a meaningful discount to riskier business profiles. Within the mortgage-backed securities (MBS) space, we see a continued interest from banks helping support demand as valuations |
14
| | |
| | | AMG GW&K Enhanced Core Bond ESG Fund Portfolio Manager’s Comments (continued) |
| | | |
| | | |
| | | | | | | | |
edge closer to long-term averages. We continue to favor seasoned, high-coupon pools that offer higher carry and better convexity profiles. The views expressed represent the opinions of GW&K Investment Management, LLC as of December 31, 2023, and are not intended as a forecast or guarantee of future results, and are subject to change without notice. | | | | | | | | |
15
| | |
| | | AMG GW&K Enhanced Core Bond ESG Fund Portfolio Manager’s Comments (continued) |
| | | |
| | | |
CUMULATIVE TOTAL RETURN PERFORMANCE
AMG GW&K Enhanced Core Bond ESG Fund’s cumulative total return is based on the daily change in net asset value (NAV), and assumes that all dividends and distributions were reinvested. The graph compares a hypothetical $10,000 investment made in the AMG GW&K Enhanced Core Bond ESG Fund’s Class N shares on December 31, 2013, to a $10,000 investment made in the Bloomberg U.S. Aggregate Bond Index for the same time period. The graph and table do not reflect the deduction of taxes that a shareholder would pay on a Fund distribution or redemption of shares. The listed returns for the Fund are net of expenses and the returns for the index exclude expenses. Total returns would have been lower had certain expenses not been reduced.
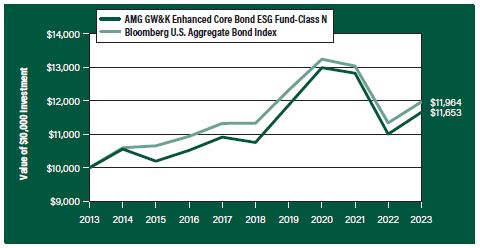
The table below shows the average annual total returns for the AMG GW&K Enhanced Core Bond ESG Fund and the Bloomberg U.S. Aggregate Bond Index for the same time periods ended December 31, 2023.
| | | | | | | | | | | | |
| | | One | | | | Five | | | | Ten | |
| Average Annual Total Returns1 | | Year | | | | Years | | | | Years | |
|
| AMG GW&K Enhanced Core Bond ESG Fund2, 3, 4, 5, 6, 7, 8, 9, 10, 11, 12, 13, 14, 15, 16, 17, 18 | |
| | | | | |
Class N | | 5.89% | | | | 1.62% | | | | | 1.54% | |
| | | | | |
Class I | | 6.05% | | | | 1.77% | | | | | 1.72% | |
| | | | | |
Class Z | | 6.13% | | | | 1.86% | | | | | 1.79% | |
| | | | | |
Bloomberg U.S. Aggregate Bond Index19 | | 5.53% | | | | 1.10% | | | | | 1.81% | |
The performance data shown represents past performance. Past performance is not a guarantee of future results. Current performance may be lower or higher than the performance data quoted. The investment return and principal value of an investment will fluctuate so that an investor’s shares, when redeemed, may be worth more or less than their original cost.
Investors should carefully consider the Fund’s investment objectives, risks, charges and expenses before investing. For performance information through the most recent month end, current net asset values per share for the Fund and other information, please call 800.548.4539 or visit our website at wealth.amg.com for a free prospectus. Read it carefully before investing or sending money.
Distributed by AMG Distributors, Inc., member FINRA/SIPC.
| 1 | Total return equals income yield plus share price change and assumes reinvestment of all dividends and capital gain distributions. Returns are net of fees and may reflect offsets of Fund expenses as described in the prospectus. No adjustment has been made for taxes payable by shareholders on their reinvested dividends and capital gain distributions. Returns for periods greater than one year are annualized. The listed returns on the Fund are net of expenses and based on the published NAV as of December 31, 2023. All returns are in U.S. Dollars ($). |
|
2 From time to time, the Fund’s Investment Manager has waived its fees and/or absorbed Fund expenses, which has resulted in higher returns. 3 Market prices of investments held by the Fund may fall rapidly or unpredictably due to a variety of factors, including economic, political, or market conditions, or other factors including terrorism, war, natural disasters and the spread of infectious illness or other public health issues, including epidemics or pandemics, or in response to events that affect particular industries or companies. 4 The Fund may not be able to dispose of particular investments, such as illiquid securities, readily at favorable times or prices or the Fund may have to sell them at a loss. 5 Because the Fund is an actively managed investment portfolio, security selection or focus on securities in a particular style, market sector or group of companies may cause the Fund to incur losses or underperform relative to its benchmarks or other funds with a similar investment objective. There can be no guarantee that the Subadviser’s investment techniques and risk analysis will produce the desired result. 6 The value of a debt security changes in response to various factors, including, for example, market-related factors, such as changes in interest rates or changes in the actual or perceived ability of an issuer to meet its obligations. Investments in debt securities are subject to, among other risks, credit risk, interest rate risk, extension risk, prepayment risk and liquidity risk. 7 Fixed coupon payments (cash flows) of bonds and debt securities may become less competitive with the market in periods of rising interest rates and cause bond prices to decline. During periods of increasing interest rates, the Fund may experience high levels of volatility and shareholder redemptions, and may have to sell securities at times when it would otherwise not do so, and at unfavorable prices, which could reduce the returns of the Fund. 8 The Fund will normally receive income which may include interest, dividends and/or capital gains, depending upon its investments. The distribution amount paid by the Fund will vary and generally depends on the amount of income the Fund earns (less expenses) on its portfolio holdings, and capital gains or losses it recognizes. A decline in the Fund’s income or net capital gains arising from its investments may reduce its distribution level. 9 During periods of rising interest rates, a debtor may pay back a bond or other fixed income security slower than expected or required, and the value of such security may fall. 10 Inflation risk is the risk that the value of assets or income from investments will be worth less in the |
| |
16
| | |
| | | AMG GW&K Enhanced Core Bond ESG Fund Portfolio Manager’s Comments (continued) |
| | | |
| | | |
| | | | | | | | |
future. Inflation rates may change frequently and drastically as a result of various factors and the Fund’s investments may not keep pace with inflation, which may result in losses to Fund investors or adversely affect the real value of shareholders’ investments in the Fund. As inflation rates increase, fixed income securities markets may experience heightened levels of interest rate volatility and liquidity risk. Deflation risk is the risk that the prices throughout the economy decline over time – the opposite of inflation. Deflation may have an adverse effect on the creditworthiness of issuers and may make issuer default more likely, which may result in a decline in the value of the Fund’s portfolio. 11 Factors unique to the municipal bond market may negatively affect the value of municipal bonds. 12 A debtor may exercise its right to pay back a bond or other debt security earlier than expected or required during periods of decreasing interest rates. 13 The Fund may have difficulty reinvesting payments from debtors and may receive lower rates than from its original investments. 14 The issuer of bonds or other debt securities may be unable or unwilling, or may be perceived as unable or unwilling, to make timely interest or principal payments or otherwise honor its obligations. 15 Below investment grade debt securities and unrated securities of similar credit quality (commonly known as “junk bonds” or “high yield securities”) may be subject to greater levels of interest rate, credit, liquidity, and market risk than | | | | higher-rated securities. These securities are considered predominately speculative with respect to the issuer’s continuing ability to make principal and interest payments. 16 Obligations issued by some U.S. Government agencies, authorities, instrumentalities, or sponsored enterprises such as Government National Mortgage Association (“GNMA”) are backed by the full faith and credit of the U.S. Government, while obligations issued by others, such as Federal National Mortgage Association (“FNMA”), Federal Home Loan Mortgage Corporation (“FHLMC”), and Federal Home Loan Banks (“FHLBs”), are not backed by the full faith and credit of the U.S. Government and are backed solely by the entity’s own resources or by the ability of the entity to borrow from the U.S. Treasury. If one of these agencies defaults on a loan, there is no guarantee that the U.S. Government will provide financial support. 17 Investments in asset-backed and mortgage-backed securities involve risk of severe credit downgrades, loss due to prepayments that occur earlier or later than expected, illiquidity and default. 18 Because applying the Fund’s ESG investment criteria may result in the selection or exclusion of securities of certain issuers for reasons other than financial performance, the Fund’s investment returns may underperform funds that do not incorporate ESG factors into their investment process. The incorporation of ESG criteria into the investment process may affect the Fund’s investment exposure to certain companies, sectors, regions, countries or types of investments, which could negatively impact the Fund’s performance | | | | depending on whether such investments are in or out of favor. Applying ESG criteria to investment decisions is qualitative and subjective by nature, and there is no guarantee that the criteria utilized by the Subadviser or any judgment exercised by the Subadviser will improve the financial performance of the Fund or reflect the beliefs or values of any particular investor. ESG standards differ by region and industry, and a company’s ESG practices or the Subadviser’s assessment of a company’s ESG practices may change over time. 19 The Bloomberg U.S. Aggregate Bond Index is an index of the U.S. investment-grade fixed-rate bond market, including both government and corporate bonds. Unlike the Fund, the Bloomberg U.S. Aggregate Bond Index is unmanaged, is not available for investment and does not incur expenses. “Bloomberg®” and any Bloomberg index described herein are service marks of Bloomberg Finance L.P. and its affiliates, including Bloomberg Index Services Limited (“BISL”), the administrator of the index (collectively, “Bloomberg”) and have been licensed for use for certain purposes by AMG Funds LLC. Bloomberg is not affiliated with AMG Funds LLC, and Bloomberg does not approve, endorse, review, or recommend the fund described herein. Bloomberg does not guarantee the timeliness, accurateness, or completeness of any data or information relating to such fund. Not FDIC insured, nor bank guaranteed. May lose value. |
17
| | |
| | | AMG GW&K Enhanced Core Bond ESG Fund Fund Snapshots (unaudited) December 31, 2023 |
| | | |
| | | |
PORTFOLIO BREAKDOWN
| | | | |
| Category | | % of
Net Assets | |
| | |
U.S. Government and Agency Obligations | | | 48.4 | |
| | |
Corporate Bonds and Notes | | | 42.6 | |
| | |
Municipal Bonds | | | 5.6 | |
| | |
Asset-Backed Securities | | | 1.3 | |
| | |
Short-Term Investments | | | 5.3 | |
| | |
Other Assets, less Liabilities | | | (3.2) | |
| | | | |
| Rating | | % of Market Value1 | |
| | |
U.S. Government and Agency Obligations | | | 49.4 | |
| | |
Aaa/AAA | | | 4.3 | |
| | |
Aa/AA | | | 5.2 | |
| | |
A | | | 8.9 | |
| | |
Baa/BBB | | | 20.0 | |
| | |
Ba/BB | | | 12.0 | |
| | |
B | | | 0.2 | |
| 1 | Includes market value of long-term fixed-income securities only. |
TOP TEN HOLDINGS
| | |
| Security Name | | % of
Net Assets |
| | |
U.S. Treasury Bonds, 2.250%, 05/15/41 | | 2.8 |
| | |
U.S. Treasury Bonds, 3.500%, 02/15/39 | | 2.7 |
| | |
U.S. Treasury Bonds, 1.875%, 02/15/51 | | 2.3 |
| | |
FNMA, 3.500%, 02/01/47 | | 2.1 |
| | |
FNMA, 4.000%, 10/01/43 | | 1.9 |
| | |
Freddie Mac Multifamily Structured Pass Through Certificates, Series K133, Class A2, 2.096%, 09/25/31 | | 1.8 |
| | |
FNMA, 4.500%, 09/01/46 | | 1.8 |
| | |
FHLMC, 3.000%, 03/01/51 | | 1.6 |
| | |
U.S. Treasury Bonds, 3.125%, 05/15/48 | | 1.6 |
| | |
California State General Obligation, School Improvements, Build America Bonds, 7.550%, 04/01/39 | | 1.6 |
| | | |
| | |
Top Ten as a Group | | 20.2 |
| | |
| | |
Credit quality ratings shown above reflect the highest rating assigned by either Standard & Poor’s (“S&P”), Moody’s Investors Service, Inc. (“Moody’s”) or Fitch. These rating agencies are independent, nationally recognized statistical rating organizations and are widely used. Investment grade ratings are credit ratings of BBB- or higher. Below investment grade ratings are credit ratings of BB+ or lower. Investments designated N/R are not rated by any of the rating agencies. Unrated investments do not necessarily indicate low credit quality. Credit quality ratings are subject to change.
Because a fund’s strategy may result in multiple investments in particular sectors of the economy, its performance may depend on the performance of those sectors and may fluctuate more widely than investments diversified across more sectors. For additional information on these and other risk considerations, please see the Fund’s prospectus.
Any sectors, industries, or securities discussed should not be perceived as investment recommendations. Mention of a specific security should not be considered a recommendation to buy or solicitation to sell that security. Specific securities mentioned in this report may have been sold from the Fund’s portfolio of investments by the time you receive this report.
18
| | |
| | | AMG GW&K Enhanced Core Bond ESG Fund Schedule of Portfolio Investments December 31, 2023 |
| | | |
| | | |
| | | | | | | | |
| | |
| | | Principal
Amount | | | Value | |
| | |
Corporate Bonds and Notes - 42.6% | | | | | | | | |
| | |
Financials - 11.7% | | | | | | | | |
| | |
AerCap Ireland Capital DAC/AerCap Global Aviation Trust (Ireland) 1.650%, 10/29/24 | | | $450,000 | | | | $434,297 | |
| | |
Air Lease Corp. | | | | | | | | |
2.875%, 01/15/26 | | | 248,000 | | | | 236,260 | |
| | |
American Express Co. | | | | | | | | |
(3.550% to 09/15/26 then U.S. Treasury Yield Curve CMT 5 year + 2.854%), 3.550%, 09/15/261,2,3 | | | 445,000 | | | | 381,498 | |
| | |
Bank of America Corp. | | | | | | | | |
MTN, (4.330% to 03/15/49 then 3 month SOFR + 1.782%), 4.330%, 03/15/501,3,4 | | | 390,000 | | | | 343,269 | |
| | |
The Bank of New York Mellon Corp. | | | | | | | | |
Series I, (3.750% to 12/20/26 then U.S. Treasury Yield Curve CMT 5 year + 2.630%), 3.750%, 12/20/261,2,3 | | | 61,000 | | | | 52,724 | |
Series G, (4.700% to 09/20/25 then U.S. Treasury Yield Curve CMT 5 year + 4.358%), 4.700%, 09/20/251,2,3 | | | 206,000 | | | | 200,753 | |
| | |
Citigroup, Inc. | | | | | | | | |
Series P, (5.950% to 05/15/25 then 3 month SOFR + 4.167%), 5.950%, 05/15/251,2,3 | | | 140,000 | | | | 137,033 | |
| | |
Crown Castle, Inc. | | | | | | | | |
4.300%, 02/15/29 | | | 375,000 | | | | 360,892 | |
| | |
The Goldman Sachs Group, Inc. | | | | | | | | |
Series O, (5.300% to 11/10/26 then 3 month SOFR + 4.096%), 5.300%, 11/10/261,2,3,4 | | | 193,000 | | | | 188,514 | |
| | |
JPMorgan Chase & Co. | | | | | | | | |
(6.254% to 10/23/33 then SOFR + 1.810%), 6.254%, 10/23/341,3,4 | | | 370,000 | | | | 401,075 | |
| | |
Morgan Stanley | | | | | | | | |
(4.431% to 01/23/29 then 3 month SOFR + 1.890%), 4.431%, 01/23/301,3 | | | 415,000 | | | | 404,201 | |
| | |
The PNC Financial Services Group, Inc. | | | | | | | | |
(5.068% to 01/24/33 then SOFR + 1.933%), 5.068%, 01/24/341,3 | | | 412,000 | | | | 403,126 | |
| | |
SBA Communications Corp. | | | | | | | | |
3.875%, 02/15/27 | | | 200,000 | | | | 192,063 | |
| | |
SLM Corp. | | | | | | | | |
3.125%, 11/02/26 | | | 275,000 | | | | 256,420 | |
| | |
US Bancorp | | | | | | | | |
(5.775% to 06/12/28 then SOFR + 2.020%), 5.775%, 06/12/291,3 | | | 375,000 | | | | 385,258 | |
| | |
Wells Fargo & Co. | | | | | | | | |
MTN, (2.879% to 10/30/29 then 3 month SOFR + 1.432%), 2.879%, 10/30/301,3 | | | 450,000 | | | | 400,033 | |
| | |
Total Financials | | | | | | | 4,777,416 | |
| | |
Industrials - 30.3% | | | | | | | | |
| | |
AECOM | | | | | | | | |
5.125%, 03/15/27 | | | 223,000 | | | | 221,394 | |
| | | | | | | | |
| | | | | | | | |
| | |
| | | Principal
Amount | | | Value | |
| | |
Air Canada (Canada) | | | | | | | | |
3.875%, 08/15/265 | | | $105,000 | | | | $100,316 | |
| | |
Air Products and Chemicals, Inc. | | | | | | | | |
4.800%, 03/03/334 | | | 246,000 | | | | 253,844 | |
| | |
Alcoa Nederland Holding, B.V. (Netherlands) | | | | | | | | |
4.125%, 03/31/294,5 | | | 480,000 | | | | 445,111 | |
| | |
APi Group DE, Inc. | | | | | | | | |
4.125%, 07/15/294,5 | | | 105,000 | | | | 95,545 | |
| | |
Aramark Services, Inc. | | | | | | | | |
5.000%, 02/01/284,5 | | | 207,000 | | | | 200,798 | |
| | |
Ashtead Capital, Inc. | | | | | | | | |
1.500%, 08/12/265 | | | 308,000 | | | | 279,249 | |
| | |
AT&T, Inc. | | | | | | | | |
1.650%, 02/01/28 | | | 205,000 | | | | 182,553 | |
4.300%, 02/15/30 | | | 190,000 | | | | 186,049 | |
| | |
Ball Corp. | | | | | | | | |
2.875%, 08/15/30 | | | 223,000 | | | | 191,331 | |
| | |
Broadcom, Inc. | | | | | | | | |
4.150%, 11/15/30 | | | 333,000 | | | | 318,075 | |
| | |
BWX Technologies, Inc. | | | | | | | | |
4.125%, 06/30/285 | | | 110,000 | | | | 102,002 | |
| | |
Campbell Soup Co. | | | | | | | | |
2.375%, 04/24/30 | | | 230,000 | | | | 199,354 | |
| | |
Celanese US Holdings LLC | | | | | | | | |
6.550%, 11/15/30 | | | 370,000 | | | | 391,137 | |
| | |
Charter Communications Operating LLC/Charter Communications Operating Capital | | | | | | | | |
4.908%, 07/23/25 | | | 307,000 | | | | 304,082 | |
| | |
Clean Harbors, Inc. | | | | | | | | |
4.875%, 07/15/275 | | | 195,000 | | | | 191,079 | |
| | |
Clearwater Paper Corp. | | | | | | | | |
4.750%, 08/15/285 | | | 214,000 | | | | 198,378 | |
| | |
Cogent Communications Group, Inc. | | | | | | | | |
3.500%, 05/01/265 | | | 267,000 | | | | 255,616 | |
| | |
Comcast Corp. | | | | | | | | |
4.150%, 10/15/28 | | | 85,000 | | | | 83,816 | |
4.650%, 02/15/334 | | | 105,000 | | | | 105,633 | |
| | |
CommonSpirit Health | | | | | | | | |
3.347%, 10/01/29 | | | 403,000 | | | | 367,962 | |
| | |
Crowdstrike Holdings, Inc. | | | | | | | | |
3.000%, 02/15/294 | | | 218,000 | | | | 197,012 | |
| | |
Crown Americas LLC/Crown Americas Capital Corp. V | | | | | | | | |
4.250%, 09/30/264 | | | 252,000 | | | | 244,440 | |
| | |
Delta Air Lines, Inc. | | | | | | | | |
4.375%, 04/19/28 | | | 70,000 | | | | 67,726 | |
| | |
Fiserv, Inc. | | | | | | | | |
4.200%, 10/01/284 | | | 353,000 | | | | 344,984 | |
| | |
FMG Resources August 2006 Pty, Ltd. (Australia) | | | | | | | | |
4.500%, 09/15/275 | | | 72,000 | | | | 69,177 | |
| | | | | | | | |
The accompanying notes are an integral part of these financial statements.
19
| | |
| | | AMG GW&K Enhanced Core Bond ESG Fund Schedule of Portfolio Investments (continued) |
| | | |
| | | |
| | | | | | | | |
| | |
| | | Principal
Amount | | | Value | |
| | |
Industrials - 30.3% (continued) | | | | | | | | |
| | |
The Ford Foundation | | | | | | | | |
Series 2020, 2.415%, 06/01/50 | | | $468,000 | | | | $307,978 | |
| | |
Freeport-McMoRan, Inc. | | | | | | | | |
4.625%, 08/01/304 | | | 306,000 | | | | 299,028 | |
| | |
Graphic Packaging International LLC | | | | | | | | |
4.750%, 07/15/275 | | | 60,000 | | | | 58,200 | |
| | |
HB Fuller Co. | | | | | | | | |
4.250%, 10/15/28 | | | 71,000 | | | | 66,389 | |
| | |
HCA, Inc. | | | | | | | | |
3.500%, 09/01/304 | | | 332,000 | | | | 300,967 | |
| | |
Hillenbrand, Inc. | | | | | | | | |
5.000%, 09/15/266 | | | 60,000 | | | | 59,312 | |
| | |
Hilton Domestic Operating Co., Inc. | | | | | | | | |
4.875%, 01/15/30 | | | 217,000 | | | | 210,307 | |
| | |
Howmet Aerospace, Inc. | | | | | | | | |
5.900%, 02/01/274 | | | 151,000 | | | | 154,875 | |
| | |
Jacobs Engineering Group, Inc. | | | | | | | | |
5.900%, 03/01/33 | | | 360,000 | | | | 367,502 | |
| | |
KB Home | | | | | | | | |
4.800%, 11/15/29 | | | 236,000 | | | | 225,498 | |
| | |
Kraft Heinz Foods Co. | | | | | | | | |
4.250%, 03/01/314 | | | 366,000 | | | | 358,517 | |
| | |
Lamar Media Corp. | | | | | | | | |
3.750%, 02/15/28 | | | 60,000 | | | | 56,281 | |
| | |
McDonald’s Corp. | | | | | | | | |
4.800%, 08/14/28 | | | 279,000 | | | | 283,813 | |
| | |
Merck & Co., Inc. | | | | | | | | |
1.900%, 12/10/284 | | | 159,000 | | | | 143,091 | |
| | |
Meritage Homes Corp. | | | | | | | | |
5.125%, 06/06/27 | | | 60,000 | | | | 59,120 | |
| | |
Methanex Corp. (Canada) | | | | | | | | |
5.125%, 10/15/27 | | | 97,000 | | | | 94,759 | |
| | |
Microsoft Corp. | | | | | | | | |
2.525%, 06/01/50 | | | 484,000 | | | | 330,414 | |
| | |
MSCI, Inc. | | | | | | | | |
3.250%, 08/15/335 | | | 273,000 | | | | 228,170 | |
| | |
Mueller Water Products, Inc. | | | | | | | | |
4.000%, 06/15/295 | | | 55,000 | | | | 50,105 | |
| | |
Murphy Oil USA, Inc. | | | | | | | | |
4.750%, 09/15/29 | | | 75,000 | | | | 71,063 | |
5.625%, 05/01/27 | | | 125,000 | | | | 123,911 | |
| | |
Novelis Corp. | | | | | | | | |
3.250%, 11/15/265 | | | 215,000 | | | | 202,401 | |
| | |
Packaging Corp. of America | | | | | | | | |
5.700%, 12/01/33 | | | 190,000 | | | | 200,009 | |
| | |
Prime Security Services Borrower LLC/Prime Finance, Inc. | | | | | | | | |
5.750%, 04/15/265 | | | 149,000 | | | | 149,807 | |
| | |
Sealed Air Corp. | | | | | | | | |
4.000%, 12/01/275 | | | 70,000 | | | | 65,700 | |
| | | | | | | | |
| | | | | | | | |
| | |
| | | Principal
Amount | | | Value | |
| | |
Sensata Technologies, B.V. | | | | | | | | |
4.000%, 04/15/295 | | | $200,000 | | | | $185,863 | |
| | |
Sonoco Products Co. | | | | | | | | |
2.850%, 02/01/32 | | | 279,000 | | | | 237,395 | |
| | |
Sysco Corp. | | | | | | | | |
2.400%, 02/15/30 | | | 420,000 | | | | 370,474 | |
| | |
Teleflex, Inc. | | | | | | | | |
4.250%, 06/01/285 | | | 70,000 | | | | 66,345 | |
| | |
Tenet Healthcare Corp. | | | | | | | | |
4.875%, 01/01/26 | | | 160,000 | | | | 158,197 | |
| | |
Teva Pharmaceutical Finance Netherlands III, B.V. (Netherlands) | | | | | | | | |
5.125%, 05/09/29 | | | 200,000 | | | | 191,009 | |
| | |
United Rentals North America, Inc. | | | | | | | | |
3.875%, 02/15/314 | | | 195,000 | | | | 177,177 | |
| | |
Verizon Communications, Inc. | | | | | | | | |
3.875%, 02/08/294 | | | 374,000 | | | | 362,586 | |
| | |
Walgreens Boots Alliance, Inc. | | | | | | | | |
3.200%, 04/15/304 | | | 469,000 | | | | 412,847 | |
| | |
WESCO Distribution, Inc. | | | | | | | | |
7.250%, 06/15/285 | | | 140,000 | | | | 143,896 | |
| | |
Total Industrials | | | | | | | 12,369,669 | |
| | |
Utilities - 0.6% | | | | | | | | |
| | |
National Rural Utilities Cooperative Finance Corp. | | | | | | | | |
1.350%, 03/15/31 | | | 332,000 | | | | 260,440 | |
| |
Total Corporate Bonds and Notes | | | | | |
(Cost $18,153,700) | | | | | | | 17,407,525 | |
| | |
Asset-Backed Securities - 1.3% | | | | | | | | |
| | |
American Express Credit Account Master Trust | | | | | | | | |
Series 2022-4, Class A
4.950%, 10/15/27 | | | 200,000 | | | | 200,647 | |
| | |
Ford Credit Auto Owner Trust
Series 2022-B, Class A4
3.930%, 08/15/27 | | | 205,000 | | | | 201,451 | |
| |
Toyota Auto Receivables Owner Trust | | | | | |
Series 2021-B, Class A3
0.260%, 11/17/25 | | | 40,731 | | | | 39,855 | |
Series 2021-B, Class A4
0.530%, 10/15/26 | | | 85,000 | | | | 80,375 | |
| | |
Total Asset-Backed Securities | | | | | | | | |
(Cost $517,991) | | | | | | | 522,328 | |
| |
Municipal Bonds - 5.6% | | | | | |
| | |
California Health Facilities Financing Authority | | | | | | | | |
4.190%, 06/01/37 | | | 240,000 | | | | 221,980 | |
| | |
California State General Obligation, School Improvements, Build America Bonds | | | | | | | | |
7.550%, 04/01/39 | | | 500,000 | | | | 631,304 | |
| | |
Commonwealth of Massachusetts, Series B | | | | | | | | |
4.110%, 07/15/31 | | | 226,015 | | | | 224,181 | |
| | |
County of Miami-Dade Florida Aviation Revenue | | | | | | | | |
Series C, 4.280%, 10/01/41 | | | 430,000 | | | | 390,437 | |
| | | | | | | | |
The accompanying notes are an integral part of these financial statements.
20
| | |
| | | AMG GW&K Enhanced Core Bond ESG Fund Schedule of Portfolio Investments (continued) |
| | | |
| | | |
| | | | | | | | |
| | |
| | | Principal
Amount | | | Value | |
| |
Municipal Bonds - 5.6% (continued) | | | | | |
| | |
Los Angeles Unified School District, School Improvements, Build America Bonds | | | | | | | | |
5.750%, 07/01/34 | | | $360,000 | | | | $382,174 | |
| |
Massachusetts School Building Authority, | | | | | |
Series B, 1.753%, 08/15/30 | | | 368,000 | | | | 316,298 | |
| | |
University of California, University & College Improvements, Series BD
3.349%, 07/01/29 | | | 120,000 | | | | 114,103 | |
| | |
Total Municipal Bonds | | | | | | | | |
(Cost $2,495,536) | | | | | | | 2,280,477 | |
| |
U.S. Government and Agency Obligations - 48.4% | | | | | |
| |
Fannie Mae - 24.8% | | | | | |
| | |
FNMA | | | | | | | | |
3.000%, 06/01/33 to 05/01/50 | | | 999,842 | | | | 934,815 | |
3.500%, 04/01/34 to 05/01/52 | | | 4,062,167 | | | | 3,831,516 | |
4.000%, 10/01/43 to 06/01/49 | | | 2,335,784 | | | | 2,264,693 | |
4.500%, 04/01/39 to 05/01/53 | | | 2,274,263 | | | | 2,249,179 | |
5.000%, 07/01/47 | | | 487,714 | | | | 495,597 | |
5.500%, 11/01/52 | | | 326,519 | | | | 333,608 | |
| | |
Total Fannie Mae | | | | | | | 10,109,408 | |
| | |
Freddie Mac - 9.2% | | | | | | | | |
| | |
FHLMC | | | | | | | | |
2.000%, 09/01/35 | | | 240,315 | | | | 216,981 | |
3.000%, 03/01/50 to 03/01/51 | | | 1,233,841 | | | | 1,105,846 | |
4.000%, 07/01/48 | | | 297,395 | | | | 286,860 | |
4.500%, 10/01/41 | | | 430,385 | | | | 429,830 | |
5.500%, 06/01/53 | | | 482,060 | | | | 486,818 | |
| | |
FHLMC Gold Pool | | | | | | | | |
3.500%, 02/01/30 to 01/01/31 | | | 222,381 | | | | 217,047 | |
| | |
Freddie Mac Multifamily Structured Pass Through Certificates | | | | | | | | |
Series K133, Class A2
2.096%, 09/25/31 | | | 880,000 | | | | 746,511 | |
Series K134, Class A2
2.243%, 10/25/313 | | | 95,000 | | | | 81,412 | |
| | |
Freddie Mac REMICS Series 5297, Class DA
5.000%, 12/25/52 | | | 204,853 | | | | 203,169 | |
| | |
Total Freddie Mac | | | | | | | 3,774,474 | |
| | |
Ginnie Mae - 0.5% | | | | | | | | |
| | |
GNMA | | | | | | | | |
Series 2023-111, Class FD
(SOFR + 1.000%, Cap 7.000%, Floor 1.000%),
6.338%, 08/20/533 | | | 197,428 | | | | 196,873 | |
| | | | | | | | |
| | | | | | | | |
| | |
| | | Principal
Amount | | | Value | |
| |
U.S. Treasury Obligations - 13.9% | | | | | |
| | |
U.S. Treasury Bonds | | | | | | | | |
1.875%, 02/15/51 | | | $1,487,000 | | | | $942,909 | |
2.250%, 05/15/41 | | | 1,508,000 | | | | 1,148,613 | |
2.500%, 02/15/46 | | | 338,000 | | | | 253,619 | |
3.125%, 05/15/48 | | | 771,000 | | | | 642,339 | |
3.500%, 02/15/39 | | | 1,148,000 | | | | 1,087,237 | |
3.625%, 02/15/53 | | | 225,000 | | | | 207,774 | |
3.875%, 02/15/43 | | | 397,000 | | | | 378,515 | |
5.000%, 05/15/37 | | | 163,000 | | | | 182,286 | |
| | |
U.S. Treasury Inflation Indexed Notes | | | | | | | | |
0.250%, 01/15/25 | | | 292,273 | | | | 283,689 | |
0.500%, 01/15/28 | | | 293,120 | | | | 277,345 | |
1.125%, 01/15/33 | | | 263,385 | | | | 249,135 | |
| | |
Total U.S. Treasury Obligations | | | | | | | 5,653,461 | |
| |
Total U.S. Government and Agency Obligations | | | | | |
(Cost $21,531,747) | | | | | | | 19,734,216 | |
| |
Short-Term Investments - 5.3% | | | | | |
| |
Joint Repurchase Agreements - 5.3%7 | | | | | |
| | |
Daiwa Capital Markets America, dated 12/29/23,due 01/02/24, 5.380% total to be received $1,000,598 (collateralized by various U.S. Government Agency Obligations and U.S. Treasuries, 0.000% - 7.500%, 03/22/24 - 01/01/54, totaling $1,020,123) | | | 1,000,000 | | | | 1,000,000 | |
| | |
Deutsche Bank Securities, Inc., dated 12/29/23,due 01/02/24, 5.350% total to be received $185,684 (collateralized by various U.S. Government Agency Obligations, 2.000% - 6.500%, 09/01/46 - 06/01/62, totaling $189,285) | | | 185,574 | | | | 185,574 | |
| | |
RBC Dominion Securities, Inc., dated 12/29/23,due 01/02/24, 5.340% total to be received $1,000,593 (collateralized by various U.S. Government Agency Obligations and U.S. Treasuries, 0.000% - 7.500%, 01/15/24 - 12/01/53, totaling $1,020,000) | | | 1,000,000 | | | | 1,000,000 | |
| |
Total Joint Repurchase Agreements | | | | 2,185,574 | |
| |
Total Short-Term Investments | | | | | |
(Cost $2,185,574) | | | | | | | 2,185,574 | |
| | |
Total Investments - 103.2% | | | | | | | | |
(Cost $44,884,548) | | | | | | | 42,130,120 | |
| |
Other Assets, less Liabilities - (3.2)% | | | | (1,313,459 | ) |
| |
Net Assets - 100.0% | | | | $40,816,661 | |
| 1 | Fixed to variable rate investment. The rate shown reflects the fixed rate in effect at December 31, 2023. Rate will reset at a future date. |
| 2 | Perpetuity Bond. The date shown represents the next call date. |
| 3 | Variable rate security. The rate shown is based on the latest available information as of December 31, 2023. Certain variable rate securities are not based on a published reference rate and spread but are determined by the issuer or agent and are based on current market conditions. These securities do not indicate a reference rate and spread in their description above. |
The accompanying notes are an integral part of these financial statements.
21
| | |
| | | AMG GW&K Enhanced Core Bond ESG Fund Schedule of Portfolio Investments (continued) |
| | | |
| | | |
| 4 | Some of these securities, amounting to $4,139,635 or 10.1% of net assets, were out on loan to various borrowers and are collateralized by cash and various U.S. Treasury Obligations. See Note 4 of Notes to Financial Statements. |
| 5 | Security exempt from registration under Rule 144A of the Securities Act of 1933. These securities may be resold in transactions exempt from registration, normally to qualified institutional buyers. At December 31, 2023, the value of these securities amounted to $3,087,758 or 7.6% of net assets. |
| 6 | Step Bond: A debt instrument with either deferred interest payments or an interest rate that resets at specific times during its term. |
| 7 | Cash collateral received for securities lending activity was invested in these joint repurchase agreements. |
| CMT | Constant Maturity Treasury |
| REMICS | Real Estate Mortgage Investment Conduit |
| SOFR | Secured Overnight Financing Rate |
The following table summarizes the inputs used to value the Fund’s investments by the fair value hierarchy levels as of December 31, 2023:
| | | | | | | | | | | | | | | | |
| | | Level 1 | | | Level 2 | | | Level 3 | | | Total | |
| | | | |
Investments in Securities | | | | | | | | | | | | | | | | |
| | | | |
Corporate Bonds and Notes† | | | — | | | $ | 17,407,525 | | | | — | | | $ | 17,407,525 | |
| | | | |
Asset-Backed Securities | | | — | | | | 522,328 | | | | — | | | | 522,328 | |
| | | | |
Municipal Bonds† | | | — | | | | 2,280,477 | | | | — | | | | 2,280,477 | |
| | | | |
U.S. Government and Agency Obligations† | | | — | | | | 19,734,216 | | | | — | | | | 19,734,216 | |
| | | | |
Short-Term Investments | | | | | | | | | | | | | | | | |
| | | | |
Joint Repurchase Agreements | | | — | | | | 2,185,574 | | | | — | | | | 2,185,574 | |
| | | | | | | | | | | | | | | | |
| | | | |
Total Investments in Securities | | | — | | | $ | 42,130,120 | | | | — | | | $ | 42,130,120 | |
| | | | | | | | | | | | | | | | |
| † | All corporate bonds and notes, municipal bonds, and U.S. government agency obligations held in the Fund are Level 2 securities. For a detailed breakout of corporate bonds and notes, municipal bonds, and U.S. government agency obligations by major industry or agency classification, please refer to the Fund’s Schedule of Portfolio Investments. |
For the fiscal year ended December 31, 2023, there were no transfers in or out of Level 3.
The accompanying notes are an integral part of these financial statements.
22
| | |
| | | AMG GW&K High Income Fund Portfolio Manager’s Comments (unaudited) |
| | | |
| | | |
| | | | | | | | |
THE YEAR IN REVIEW AMG GW&K High Income Fund (the “Fund”) Class N shares returned 9.13% during the year ended December 31, 2023, compared to the 9.65% return for the Bloomberg U.S. High Yield 1–5 Year Ba Index. MARKET OVERVIEW The fixed income market experienced a solid rally in the first quarter of 2023, rebounding from its worst year on record. Much of the period saw a continuation of the tension that drove trading in 2022: inflation continued to slow, but at a glacial pace; a moribund housing market and downbeat consumer had yet to manifest as a slowdown in spending; and a record pace of rate hikes was unable to cool a stubbornly hot labor market. Investors also struggled to anticipate the U. S Federal Reserve’s (the Fed) reaction function amid the various crosscurrents, while Chair Powell’s commentary offered few concrete insights beyond a firm resolve and data dependence. But the narrative shifted abruptly in the final weeks, as signs of systemic instability flared up amid a flurry of bank failures. The implications of this turmoil for financial conditions were not yet evident, but the stress in the banking sector was a complicating factor for both the Fed and the bond market. The market posted a small loss in the second quarter, giving back a portion of the banking crisis-inspired rally that occurred in the closing days of March. Sentiment was cautious at the outset and investors sought haven assets on the possibility of contagion in the financial sector. But as it became clear that fallout from the failure of several regional lenders was likely to be contained, attention returned to the underlying strength of the economy and the stubborn persistence of inflation. The labor market gave only the slightest indications of softening, the buoyant housing sector continued to defy higher mortgage rates, and consumer spending once again proved irrepressible. Inflation showed limited progress on its path lower, plateauing at a level solidly above the Fed’s 2% target. Against this backdrop, the Federal Open Market Committee (FOMC) endeavored to maintain restrictive financial conditions by raising rates and providing hawkish | | | | guidance. There was nevertheless scant evidence of the Fed’s success in curbing aggregate demand away from some narrow segments of the commercial real estate and consumer finance markets. The market posted a significant loss in the third quarter that more than offset the gains achieved in the first half of the year. The higher-for-longer Fed narrative increasingly took center stage, driven by a surprisingly resilient economy, surging oil prices, and inflation that persisted well above the Fed’s 2% target. While there were subtle signs that the labor market and consumer credit metrics might be softening, the unemployment rate remained near cycle lows and the consumer continued to spend robustly. The undeniably strong cadence of the economy left economists upgrading their third-quarter Gross Domestic Product (GDP) growth estimates and recharging optimism for a soft landing. Fed officials held rates steady at the September FOMC meeting, but thwarted hopes for a pivot by signaling the possibility of one more hike during the year and projecting less easing in 2024/2025. The market experienced an extraordinary rally in the fourth quarter on elevated odds of an economic soft landing and dovish signals from the Fed. The strong performance was a sharp reversal from the prior quarter, which briefly raised the specter of an unprecedented third consecutive annual loss for the bond market. Sentiment was bolstered first by news that the US Treasury’s borrowing needs were lower than feared and then lifted further by a series of upbeat economic readings and moderating price pressure. The final stage of the rally was powered by the arrival of the long-awaited Fed pivot, which left little doubt that the hiking cycle had concluded. Both the rates market and credit swiftly repriced to reflect a more rapid series of cuts and narrower risk premia, lifting asset prices across the board, and broadly easing financial conditions. FUND PERFORMANCE The Fund underperformed the Bloomberg U.S High Yield 1-5 Year Ba Index for 2023. The Fund’s out-of-benchmark allocation to BBB-rated | | | | Corporates was the main detractor from performance amidst the lower quality rally. Our longer duration and exposure to intermediate rates, particularly the 10- and 20-year part of the curve, detracted from returns given the re-steepening. This was mostly offset by the Fund’s out-of-benchmark allocation to single B-rated Corporates, which was a positive contributor. Security selection was similarly positive, particularly within the BB-rated consumer cyclical, utilities, and capital goods sectors. OUTLOOK After a brief period in the second quarter that saw the bond market converge with the Fed’s dot plot, a rift has once again formed. The Fed projects three rate cuts in 2024 while the Federal Funds futures market expects more than six. Similarly, the persistent inversion of the yield curve suggests the bond market is pricing in elevated odds of a recession, while the Fed’s median projections do not see GDP growth falling below 1.4%. The inversion of the yield curve seems less likely to persist indefinitely, especially if rates normalize into a soft landing. A soft landing would provide a favorable backdrop for corporate fundamentals. By creating conditions that allow the Fed to cut rates, it would both support topline growth and promote favorable liquidity conditions, thereby easing future refinancing needs. It would also be constructive on a technical basis, given that it would enhance the appeal of spread product. Valuations at current levels are less appealing, with breakevens versus Treasuries at the lower end of their historical range and leaving little room for error. As such, we believe this backdrop supports a neutral view of credit. Within the space, we favor names with defensive operating and financial metrics, given that investors do not seem to be assigning a meaningful discount to riskier business profiles. The views expressed represent the opinions of GW&K Investment Management, LLC as of December 31, 2023, and are not intended as a forecast or guarantee of future results, and are subject to change without notice. |
23
| | |
| | | AMG GW&K High Income Fund Portfolio Manager’s Comments (continued) |
| | | |
| | | |
CUMULATIVE TOTAL RETURN PERFORMANCE
AMG GW&K High Income Fund’s cumulative total return is based on the daily change in net asset value (NAV), and assumes that all dividends and distributions were reinvested. The graph compares a hypothetical $10,000 investment made in the AMG GW&K High Income Fund’s Class N shares on December 31, 2013, to a $10,000 investment made in the Bloomberg U.S. High Yield 1-5 Year Ba Index for the same time period. The graph and table do not reflect the deduction of taxes that a shareholder would pay on a Fund distribution or redemption of shares. The listed returns for the Fund are net of expenses and the returns for the index exclude expenses. Total returns would have been lower had certain expenses not been reduced.
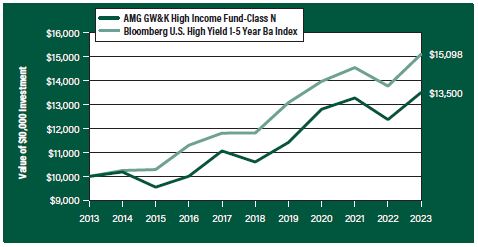
The table below shows the average annual total returns for the AMG GW&K High Income Fund and the Bloomberg U.S. High Yield 1-5 Year Ba Index for the same time periods ended December 31, 2023.
| | | | | | | | | | | | | | | | | | | | |
| Average Annual Total Returns1 | | One
Year | | | Five
Years | | | Ten
Years | | | Since
Inception | | | Inception
Date | |
|
| AMG GW&K High Income Fund2, 3, 4, 5, 6, 7, 8, 9, 10, 11, 12, 13, 14, 15, 16, 17, 18, 19 | |
| | | | | |
Class N | | | 9.13% | | | | 4.95% | | | | 3.05% | | | | 4.69% | | | | 03/25/94 | |
| | | | | |
Class I | | | 9.35% | | | | — | | | | — | | | | 2.05% | | | | 03/15/21 | |
| | | | | |
Bloomberg U.S. High Yield 1-5 Year Ba Index20 | | | 9.65% | | | | 5.04% | | | | 4.21% | | | | 6.49% | | | | 03/25/94 | † |
The performance data shown represents past performance. Past performance is not a guarantee of future results. Current performance may be lower or higher than the performance data quoted. The investment return and principal value of an investment will fluctuate so that an investor’s shares, when redeemed, may be worth more or less than their original cost.
Investors should carefully consider the Fund’s investment objectives, risks, charges and expenses before investing. For performance information through the most recent month end, current net asset values per share for the Fund and other information, please call 800.548.4539 or visit our website at wealth.amg.com for a free prospectus. Read it carefully before investing or sending money.
Distributed by AMG Distributors, Inc., member FINRA/SIPC.
| † | Date reflects the inception date of the Fund, not the index. |
| 1 | Total return equals income yield plus share price change and assumes reinvestment of all dividends and capital gain distributions. Returns are net of fees and may reflect offsets of Fund expenses as described in the prospectus. No adjustment has been made for taxes payable by shareholders on their reinvested dividends and |
|
capital gain distributions. Returns for periods greater than one year are annualized. The listed returns on the Fund are net of expenses and based on the published NAV as of December 31, 2023. All returns are in U.S. Dollars($). 2 From time to time, the Fund’s Investment Manager has waived its fees and/or absorbed Fund expenses, which has resulted in higher returns. 3 Market prices of investments held by the Fund may fall rapidly or unpredictably due to a variety of factors, including economic, political, or market conditions, or other factors including terrorism, war, natural disasters and the spread of infectious illness or other public health issues, including epidemics or pandemics, or in response to events that affect particular industries or companies. 4 The Fund may not be able to dispose of particular investments, such as illiquid securities, readily at favorable times or prices or the Fund may have to sell them at a loss. 5 Because the Fund is an actively managed investment portfolio, security selection or focus on securities in a particular style, market sector or group of companies may cause the Fund to incur losses or underperform relative to its benchmarks or other funds with a similar investment objective. There can be no guarantee that the Subadviser’s investment techniques and risk analysis will produce the desired result. 6 As of December 4, 2020, the Fund’s Subadviser was changed to GW&K Investment Management, LLC. Prior to December 4, 2020, the Fund was known as the AMG Managers Global Income Opportunity Fund, and had different principal investment strategies and corresponding risks. Performance shown for periods prior to December 4, 2020 reflects the performance and investment strategies of the Fund’s previous Subadviser, Loomis, Sayles & Company, L.P. The Fund’s past performance would have been different if the Fund were managed by the current Subadviser and strategy, and the Fund’s prior performance record might be less pertinent for investors considering whether to purchase shares of the Fund. 7 The value of a debt security changes in response to various factors, including, for example, market-related factors, such as changes in interest rates or changes in the actual or perceived ability of an issuer to meet its obligations. Investments in debt securities are subject to, among other risks, credit risk, interest rate risk, extension risk, prepayment risk and liquidity risk. 8 Fixed coupon payments (cash flows) of bonds and debt securities may become less competitive with the market in periods of rising interest rates and cause bond prices to decline. During periods of increasing interest rates, the Fund may experience high levels of volatility and shareholder |
| |
24
| | |
| | | AMG GW&K High Income Fund Portfolio Manager’s Comments (continued) |
| | | |
| | | |
| | | | | | | | |
redemptions, and may have to sell securities at times when it would otherwise not do so, and at unfavorable prices, which could reduce the returns of the Fund. 9 The Fund will normally receive income which may include interest, dividends and/or capital gains, depending upon its investments. The distribution amount paid by the Fund will vary and generally depends on the amount of income the Fund earns (less expenses) on its portfolio holdings, and capital gains or losses it recognizes. A decline in the Fund’s income or net capital gains arising from its investments may reduce its distribution level. 10 During periods of rising interest rates, a debtor may pay back a bond or other fixed income security slower than expected or required, and the value of such security may fall. 11 Inflation risk is the risk that the value of assets or income from investments will be worth less in the future. Inflation rates may change frequently and drastically as a result of various factors and the Fund’s investments may not keep pace with inflation, which may result in losses to Fund investors or adversely affect the real value of shareholders’ investments in the Fund. As inflation rates increase, fixed income securities markets may experience heightened levels of interest rate volatility and liquidity risk. Deflation risk is the risk that the prices throughout the economy decline over time – the opposite of inflation. Deflation may have an adverse effect on the creditworthiness of issuers and may make issuer default more likely, which may result in a decline in the value of the Fund’s portfolio. 12 Factors unique to the municipal bond market may negatively affect the value of municipal bonds. 13 A debtor may exercise its right to pay back a bond or other debt security earlier than expected or required during periods of decreasing interest rates. 14 The Fund may have difficulty reinvesting payments from debtors and may receive lower rates than from its original investments. | | | | 15 The issuer of bonds or other debt securities may be unable or unwilling, or may be perceived as unable or unwilling, to make timely interest or principal payments or otherwise honor its obligations. 16 Below investment grade debt securities and unrated securities of similar credit quality (commonly known as “junk bonds” or “high yield securities”) may be subject to greater levels of interest rate, credit, liquidity, and market risk than higher-rated securities. These securities are considered predominately speculative with respect to the issuer’s continuing ability to make principal and interest payments. 17 Obligations issued by some U.S. Government agencies, authorities, instrumentalities, or sponsored enterprises such as Government National Mortgage Association (“GNMA”) are backed by the full faith and credit of the U.S. Government, while obligations issued by others, such as Federal National Mortgage Association (“FNMA”), Federal Home Loan Mortgage Corporation (“FHLMC”), and Federal Home Loan Banks (“FHLBs”), are not backed by the full faith and credit of the U.S. Government and are backed solely by the entity’s own resources or by the ability of the entity to borrow from the U.S. Treasury. If one of these agencies defaults on a loan, there is no guarantee that the U.S. Government will provide financial support. 18 Investing in restricted securities (including, without limitation, Rule 144A securities) may reduce the liquidity of the Fund’s investments in the event that an adequate trading market does not exist for these securities. Limitations on the resale of restricted securities could adversely affect the marketability of the securities, and the Fund may be unable to sell the security at the desired time or price, if at all. The purchase price and subsequent valuation of restricted securities normally reflect a discount, which may be significant, from the market price of comparable unrestricted securities for which a liquid trading market exists. 19 Because applying the Fund’s ESG investment criteria may result in the selection or exclusion of securities of certain issuers for reasons other than | | | | financial performance, the Fund’s investment returns may underperform funds that do not incorporate ESG factors into their investment process. The incorporation of ESG criteria into the investment process may affect the Fund’s investment exposure to certain companies, sectors, regions, countries or types of investments, which could negatively impact the Fund’s performance depending on whether such investments are in or out of favor. Applying ESG criteria to investment decisions is qualitative and subjective by nature, and there is no guarantee that the criteria utilized by the Subadviser or any judgment exercised by the Subadviser will improve the financial performance of the Fund or reflect the beliefs or values of any particular investor. ESG standards differ by region and industry, and a company’s ESG practices or the Subadviser’s assessment of a company’s ESG practices may change over time. 20 The Bloomberg U.S. High Yield 1-5 Year Ba Index, a subset of the Bloomberg High Yield Index, is an unmanaged index comprised of fixed rate, publicly issued, non-investment grade debt registered with the Securities and Exchange Commission (SEC) where the middle rating of Moody’s, S&P and Fitch is BB and maturities range from 1 to 5 years. Unlike the Fund, the Bloomberg U.S. High Yield 1-5 Year Ba Index is unmanaged, is not available for investment and does not incur expenses. “Bloomberg®” and any Bloomberg index described herein are service marks of Bloomberg Finance L.P. and its affiliates, including Bloomberg Index Services Limited (“BISL”), the administrator of the index (collectively, “Bloomberg”) and have been licensed for use for certain purposes by AMG Funds LLC. Bloomberg is not affiliated with AMG Funds LLC, and Bloomberg does not approve, endorse, review, or recommend the fund described herein. Bloomberg does not guarantee the timeliness, accurateness, or completeness of any data or information relating to such fund. Not FDIC insured, nor bank guaranteed. May lose value. |
25
| | |
| | | AMG GW&K High Income Fund Fund Snapshots (unaudited) December 31, 2023 |
| | | |
| | | |
PORTFOLIO BREAKDOWN
| | |
| Category | | % of
Net Assets |
| | |
Corporate Bonds and Notes | | 97.9 |
| | |
Short-Term Investments1 | | 15.7 |
| | |
Other Assets, less Liabilities2 | | (13.6) |
| 1 | Includes reinvestment of cash collateral into joint repurchase agreements on security lending transactions. |
| 2 | Includes repayment of cash collateral on security lending transactions. |
| | |
| Rating | | % of Market Value1 |
| | |
A | | 1.0 |
| | |
Baa/BBB | | 25.4 |
| | |
Ba/BB | | 68.5 |
| | |
B | | 5.1 |
| 1 | Includes market value of long-term fixed-income securities only. |
TOP TEN HOLDINGS
| | |
| Security Name | | % of
Net Assets |
| | |
NuStar Logistics LP, 5.625%, 04/28/27 | | 2.0 |
| | |
SLM Corp., 4.200%, 10/29/25 | | 1.8 |
| | |
SM Energy Co., 5.625%, 06/01/25 | | 1.8 |
| | |
Matador Resources Co., 5.875%, 09/15/26 | | 1.6 |
| | |
Southwestern Energy Co., 8.375%, 09/15/28 | | 1.6 |
| | |
Citigroup, Inc., 3.875%, 02/18/26 | | 1.6 |
| | |
Prime Security Services Borrower LLC/Prime Finance, Inc., 5.750%, 04/15/26 | | 1.6 |
| | |
Starwood Property Trust, Inc., 4.750%, 03/15/25 | | 1.6 |
| | |
Navient Corp., 5.000%, 03/15/27 | | 1.5 |
| | |
MGM Resorts International, 5.750%, 06/15/25 | | 1.5 |
| | | |
| | |
Top Ten as a Group | | 16.6 |
| | |
Credit quality ratings shown above reflect the highest rating assigned by either Standard & Poor’s (“S&P”), Moody’s Investors Service, Inc. (“Moody’s”) or Fitch. These rating agencies are independent, nationally recognized statistical rating organizations and are widely used. Investment grade ratings are credit ratings of BBB- or higher. Below investment grade ratings are credit ratings of BB+ or lower. Investments designated N/R are not rated by any of the rating agencies. Unrated investments do not necessarily indicate low credit quality. Credit quality ratings are subject to change.
Because a fund’s strategy may result in multiple investments in particular sectors of the economy, its performance may depend on the performance of those sectors and may fluctuate more widely than investments diversified across more sectors. For additional information on these and other risk considerations, please see the Fund’s prospectus.
Any sectors, industries, or securities discussed should not be perceived as investment recommendations. Mention of a specific security should not be considered a recommendation to buy or solicitation to sell that security. Specific securities mentioned in this report may have been sold from the Fund’s portfolio of investments by the time you receive this report.
26
| | |
| | | AMG GW&K High Income Fund Schedule of Portfolio Investments December 31, 2023 |
| | | |
| | | |
| | | | | | | | |
| | |
| | | Principal
Amount | | | Value | |
| | |
Corporate Bonds and Notes - 97.9% | | | | | | | | |
| |
Financials - 17.5% | | | | | |
| | |
American Express Co.
(3.550% to 09/15/26 then U.S. Treasury Yield Curve CMT 5 year + 2.854%), 3.550%, 09/15/261,2,3 | | | $186,000 | | | | $159,458 | |
| | |
Citigroup, Inc.
(3.875% to 02/18/26 then U.S. Treasury Yield Curve CMT 5 year + 3.417%), 3.875%, 02/18/261,2,3 | | | 255,000 | | | | 225,758 | |
| | |
Fifth Third Bancorp | | | | | | | | |
3.650%, 01/25/24 | | | 25,000 | | | | 24,959 | |
| | |
The Goldman Sachs Group, Inc.
Series U
(3.650% to 08/10/26 then U.S. Treasury Yield Curve CMT 5 year + 2.915%), 3.650%, 08/10/261,2,3,4 | | | 151,000 | | | | 133,902 | |
| | |
Huntington Bancshares, Inc. | | | | | | | | |
2.625%, 08/06/24 | | | 75,000 | | | | 73,598 | |
| | |
JPMorgan Chase & Co.
Series S
(6.750% to 02/01/24 then 3 month SOFR + 4.042%), 6.750%, 02/01/241,2,3 | | | 167,000 | | | | 166,661 | |
| | |
KeyCorp | | | | | | | | |
(3.878% to 05/23/24 then SOFR Index + 1.250%), 3.878%, 05/23/251,3 | | | 75,000 | | | | 73,324 | |
| | |
M&T Bank Corp. | | | | | | | | |
(4.553% to 08/16/27 then SOFR Index + 1.780%), 4.553%, 08/16/281,3 | | | 39,000 | | | | 37,571 | |
| | |
MetLife, Inc.
Series G
(3.850% to 09/15/25 then U.S. Treasury Yield Curve CMT 5 year + 3.576%), 3.850%, 09/15/251,2,3,4 | | | 135,000 | | | | 127,791 | |
| | |
Morgan Stanley
Series M
5.875%, 09/15/262,3 | | | 174,000 | | | | 166,248 | |
| | |
Navient Corp. | | | | | | | | |
5.000%, 03/15/274 | | | 220,000 | | | | 212,400 | |
| | |
SBA Communications Corp. | | | | | | | | |
3.875%, 02/15/27 | | | 198,000 | | | | 190,142 | |
| | |
SLM Corp. | | | | | | | | |
4.200%, 10/29/25 | | | 264,000 | | | | 256,080 | |
| | |
Starwood Property Trust, Inc. | | | | | | | | |
4.750%, 03/15/25 | | | 223,000 | | | | 220,034 | |
| | |
Wells Fargo & Co.
Series U
5.875%, 06/15/252,3,4 | | | 209,000 | | | | 206,821 | |
| | |
Wynn Las Vegas LLC/Wynn Las Vegas Capital Corp. | | | | | | | | |
5.500%, 03/01/255 | | | 170,000 | | | | 169,135 | |
| | |
Total Financials | | | | | | | 2,443,882 | |
| | |
| | | | | | | | |
| | | | | | | | |
| | |
| | | Principal
Amount | | | Value | |
| | |
Industrials - 77.3% | | | | | | | | |
| | |
AECOM | | | | | | | | |
5.125%, 03/15/27 | | | $167,000 | | | | $165,797 | |
| | |
Air Canada (Canada) | | | | | | | | |
3.875%, 08/15/265 | | | 195,000 | | | | 186,301 | |
| | |
Alcoa Nederland Holding BV (Netherlands) | | | | | | | | |
6.125%, 05/15/285 | | | 200,000 | | | | 201,151 | |
| | |
American Airlines Inc/AAdvantage Loyalty IP, Ltd. | | | | | | | | |
5.500%, 04/20/265 | | | 149,167 | | | | 148,091 | |
| | |
Apache Corp. | | | | | | | | |
4.250%, 01/15/304 | | | 148,000 | | | | 138,287 | |
| | |
APi Group DE, Inc. | | | | | | | | |
4.125%, 07/15/294,5 | | | 200,000 | | | | 181,991 | |
| | |
Aramark Services, Inc. | | | | | | | | |
5.000%, 02/01/284,5 | | | 146,000 | | | | 141,626 | |
| | |
ATI, Inc. | | | | | | | | |
4.875%, 10/01/29 | | | 78,000 | | | | 72,693 | |
| | |
Avient Corp. | | | | | | | | |
5.750%, 05/15/255 | | | 66,000 | | | | 66,002 | |
| | |
Ball Corp. | | | | | | | | |
5.250%, 07/01/25 | | | 70,000 | | | | 69,913 | |
| | |
BWX Technologies, Inc. | | | | | | | | |
4.125%, 06/30/285 | | | 195,000 | | | | 180,822 | |
| | |
Caesars Entertainment, Inc. | | | | | | | | |
6.250%, 07/01/255 | | | 175,000 | | | | 175,476 | |
| | |
Callon Petroleum Co. | | | | | | | | |
6.375%, 07/01/264 | | | 185,000 | | | | 184,122 | |
| | |
CCO Holdings LLC/CCO Holdings Capital Corp. | | | | | | | | |
5.500%, 05/01/265 | | | 179,000 | | | | 177,808 | |
| | |
Celanese US Holdings LLC | | | | | | | | |
6.330%, 07/15/29 | | | 149,000 | | | | 156,193 | |
| | |
Centene Corp. | | | | | | | | |
4.250%, 12/15/27 | | | 93,000 | | | | 89,610 | |
| | |
Cheniere Energy Partners LP | | | | | | | | |
4.500%, 10/01/29 | | | 155,000 | | | | 148,252 | |
| | |
Chord Energy Corp. | | | | | | | | |
6.375%, 06/01/265 | | | 175,000 | | | | 175,000 | |
| | |
Cleveland-Cliffs, Inc. | | | | | | | | |
5.875%, 06/01/274 | | | 172,000 | | | | 171,385 | |
| | |
Cogent Communications Group, Inc. | | | | | | | | |
3.500%, 05/01/265 | | | 188,000 | | | | 179,985 | |
| | |
Commercial Metals Co. | | | | | | | | |
3.875%, 02/15/31 | | | 124,000 | | | | 109,712 | |
| | |
Crown Cork & Seal Co., Inc. | | | | | | | | |
7.375%, 12/15/26 | | | 185,000 | | | | 194,250 | |
| | |
Dana, Inc. | | | | | | | | |
5.625%, 06/15/28 | | | 123,000 | | | | 121,268 | |
| | |
Embraer Netherlands Finance BV (Netherlands) | | | | | | | | |
5.400%, 02/01/27 | | | 110,000 | | | | 109,283 | |
| | | | | | | | |
The accompanying notes are an integral part of these financial statements.
27
| | |
| | | AMG GW&K High Income Fund Schedule of Portfolio Investments (continued) |
| | | |
| | | |
| | | | | | | | |
| | |
| | | Principal
Amount | | | Value | |
| | |
Industrials - 77.3% (continued) | | | | | | | | |
| | |
Encompass Health Corp. | | | | | | | | |
4.500%, 02/01/28 | | | $146,000 | | | | $139,687 | |
| | |
EnLink Midstream LLC | | | | | | | | |
5.375%, 06/01/29 | | | 180,000 | | | | 176,122 | |
| | |
EQT Corp. | | | | | | | | |
5.700%, 04/01/28 | | | 105,000 | | | | 106,556 | |
| | |
FMG Resources August 2006 Pty, Ltd. (Australia) | | | | | | | | |
4.500%, 09/15/275 | | | 152,000 | | | | 146,039 | |
| | |
Ford Motor Credit Co. LLC | | | | | | | | |
4.134%, 08/04/25 | | | 200,000 | | | | 194,389 | |
| | |
General Motors Co. | | | | | | | | |
6.800%, 10/01/27 | | | 70,000 | | | | 74,204 | |
| | |
Graphic Packaging International LLC | | | | | | | | |
3.500%, 03/01/295 | | | 165,000 | | | | 148,563 | |
| | |
HB Fuller Co. | | | | | | | | |
4.250%, 10/15/28 | | | 154,000 | | | | 143,998 | |
| | |
Hudbay Minerals, Inc. (Canada) | | | | | | | | |
4.500%, 04/01/265 | | | 95,000 | | | | 91,891 | |
| | |
KB Home | | | | | | | | |
4.000%, 06/15/31 | | | 85,000 | | | | 76,128 | |
| | |
Lamar Media Corp. | | | | | | | | |
4.875%, 01/15/29 | | | 173,000 | | | | 167,000 | |
| | |
Matador Resources Co. | | | | | | | | |
5.875%, 09/15/264 | | | 231,000 | | | | 229,082 | |
| | |
Mattel, Inc. | | | | | | | | |
3.375%, 04/01/265 | | | 216,000 | | | | 205,408 | |
| | |
MEG Energy Corp. (Canada) | | | | | | | | |
5.875%, 02/01/295 | | | 185,000 | | | | 179,754 | |
| | |
Meritage Homes Corp. | | | | | | | | |
6.000%, 06/01/25 | | | 92,000 | | | | 91,754 | |
| | |
Methanex Corp. (Canada) | | | | | | | | |
5.125%, 10/15/27 | | | 183,000 | | | | 178,773 | |
| | |
MGM Resorts International | | | | | | | | |
5.750%, 06/15/25 | | | 210,000 | | | | 209,190 | |
| | |
Mueller Water Products, Inc. | | | | | | | | |
4.000%, 06/15/295 | | | 186,000 | | | | 169,446 | |
| | |
Murphy Oil Corp. | | | | | | | | |
6.375%, 07/15/28 | | | 170,000 | | | | 170,773 | |
| | |
Murphy Oil USA, Inc. | | | | | | | | |
5.625%, 05/01/27 | | | 178,000 | | | | 176,449 | |
| | |
Novelis Corp. | | | | | | | | |
3.250%, 11/15/265 | | | 192,000 | | | | 180,749 | |
| | |
NuStar Logistics LP | | | | | | | | |
5.625%, 04/28/27 | | | 276,000 | | | | 274,824 | |
| | |
Occidental Petroleum Corp. | | | | | | | | |
7.875%, 09/15/31 | | | 150,000 | | | | 170,634 | |
| | |
Olin Corp. | | | | | | | | |
5.125%, 09/15/27 | | | 202,000 | | | | 195,846 | |
| | | | | | | | |
| | | | | | | | |
| | |
| | | Principal
Amount | | | Value | |
| | |
Penn Entertainment, Inc. | | | | | | | | |
4.125%, 07/01/294,5 | | | $181,000 | | | | $154,755 | |
| | |
Penske Automotive Group, Inc. | | | | | | | | |
3.500%, 09/01/25 | | | 184,000 | | | | 178,509 | |
| | |
Permian Resources Operating LLC | | | | | | | | |
5.375%, 01/15/265 | | | 190,000 | | | | 187,470 | |
| | |
Prime Security Services Borrower LLC/Prime Finance, Inc. | | | | | | | | |
5.750%, 04/15/265 | | | 223,000 | | | | 224,208 | |
| | |
Sealed Air Corp. | | | | | | | | |
5.500%, 09/15/255 | | | 165,000 | | | | 165,000 | |
| | |
Sensata Technologies, B.V. | | | | | | | | |
4.000%, 04/15/295 | | | 200,000 | | | | 185,863 | |
| | |
Silgan Holdings, Inc. | | | | | | | | |
4.125%, 02/01/284 | | | 155,000 | | | | 148,031 | |
| | |
Southwestern Energy Co. | | | | | | | | |
8.375%, 09/15/28 | | | 220,000 | | | | 227,608 | |
| | |
Spirit AeroSystems, Inc. | | | | | | | | |
9.375%, 11/30/294,5 | | | 165,000 | | | | 180,555 | |
| | |
Teleflex, Inc. | | | | | | | | |
4.250%, 06/01/285 | | | 155,000 | | | | 146,907 | |
| | |
Tenet Healthcare Corp. | | | | | | | | |
4.875%, 01/01/26 | | | 180,000 | | | | 177,972 | |
| | |
Teva Pharmaceutical Finance Netherlands III, B.V. (Netherlands) | | | | | | | | |
3.150%, 10/01/26 | | | 199,000 | | | | 184,254 | |
| | |
Toll Brothers Finance Corp. | | | | | | | | |
4.350%, 02/15/284 | | | 120,000 | | | | 117,236 | |
| | |
Travel + Leisure Co. | | | | | | | | |
6.000%, 04/01/276 | | | 70,000 | | | | 69,610 | |
6.600%, 10/01/256 | �� | | 75,000 | | | | 75,075 | |
| | |
Trinity Industries, Inc. | | | | | | | | |
4.550%, 10/01/24 | | | 112,000 | | | | 110,320 | |
| | |
United Rentals North America, Inc. | | | | | | | | |
4.875%, 01/15/284 | | | 181,000 | | | | 176,699 | |
| | |
United States Steel Corp. | | | | | | | | |
6.875%, 03/01/294 | | | 133,000 | | | | 136,067 | |
| | |
Wabash National Corp. | | | | | | | | |
4.500%, 10/15/285 | | | 163,000 | | | | 147,078 | |
| | |
WESCO Distribution, Inc. | | | | | | | | |
7.250%, 06/15/285 | | | 103,000 | | | | 105,866 | |
| | |
Western Digital Corp. | | | | | | | | |
4.750%, 02/15/26 | | | 137,000 | | | | 134,399 | |
| | |
Western Midstream Operating LP | | | | | | | | |
4.650%, 07/01/26 | | | 162,000 | | | | 159,161 | |
| | |
Total Industrials | | | | | | | 10,834,920 | |
| | |
Utilities - 3.1% | | | | | | | | |
| | |
NRG Energy, Inc. | | | | | | | | |
5.250%, 06/15/295 | | | 195,000 | | | | 188,835 | |
| | | | | | | | |
The accompanying notes are an integral part of these financial statements.
28
| | |
| | | AMG GW&K High Income Fund Schedule of Portfolio Investments (continued) |
| | | |
| | | |
| | | | | | | | |
| | |
| | | Principal
Amount | | | Value | |
| | |
Utilities - 3.1% (continued) | | | | | | | | |
| | |
SM Energy Co. | | | | | | | | |
5.625%, 06/01/25 | | | $253,000 | | | | $250,018 | |
| | |
Total Utilities | | | | | | | 438,853 | |
| | |
Total Corporate Bonds and Notes
(Cost $13,776,553) | | | | | | | 13,717,655 | |
| |
Short-Term Investments - 15.7% | | | | | |
| |
Joint Repurchase Agreements - 14.7%7 | | | | | |
| | |
Daiwa Capital Markets America, dated 12/29/23,due 01/02/24, 5.380% total to be received $1,000,598 (collateralized by various U.S. Government Agency Obligations and U.S. Treasuries, 0.000% - 7.500%, 03/22/24 - 01/01/54, totaling $1,020,123) | | | 1,000,000 | | | | 1,000,000 | |
| | |
Deutsche Bank Securities, Inc., dated 12/29/23,due 01/02/24, 5.350% total to be received $57,825 (collateralized by various U.S. Government Agency Obligations, 2.000% - 6.500%, 09/01/46 - 06/01/62, totaling $58,947) | | | 57,791 | | | | 57,791 | |
| | | | | | | | |
| | |
| | | Principal
Amount | | | Value | |
| | |
RBC Dominion Securities, Inc., dated 12/29/23,due 01/02/24, 5.340% total to be received $1,000,593 (collateralized by various U.S. Government Agency Obligations and U.S. Treasuries, 0.000% - 7.500%, 01/15/24 - 12/01/53, totaling $1,020,000) | | | $1,000,000 | | | | $1,000,000 | |
| |
Total Joint Repurchase Agreements | | | | 2,057,791 | |
| |
Repurchase Agreements - 1.0% | | | | | |
| | |
Fixed Income Clearing Corp., dated 12/29/23 due 01/02/24, 5.150% total to be received $140,080 (collateralized by a U.S. Treasury, 4.125%, 09/30/27, totaling $142,856) | | | 140,000 | | | | 140,000 | |
| |
Total Short-Term Investments | | | | | |
(Cost $2,197,791) | | | | | | | 2,197,791 | |
| |
Total Investments - 113.6% | | | | | |
(Cost $15,974,344) | | | | | | | 15,915,446 | |
| |
Other Assets, less Liabilities - (13.6)% | | | | (1,900,272 | ) |
| |
Net Assets - 100.0% | | | | $14,015,174 | |
| 1 | Fixed to variable rate investment. The rate shown reflects the fixed rate in effect at December 31, 2023. Rate will reset at a future date. |
| 2 | Perpetuity Bond. The date shown represents the next call date. |
| 3 | Variable rate security. The rate shown is based on the latest available information as of December 31, 2023. Certain variable rate securities are not based on a published reference rate and spread but are determined by the issuer or agent and are based on current market conditions. These securities do not indicate a reference rate and spread in their description above. |
| 4 | Some of these securities, amounting to $2,406,325 or 17.2% of net assets, were out on loan to various borrowers and are collateralized by cash and various U.S. Treasury Obligations. See Note 4 of Notes to Financial Statements. |
| 5 | Security exempt from registration under Rule 144A of the Securities Act of 1933. These securities may be resold in transactions exempt from registration, normally to qualified institutional buyers. At December 31, 2023, the value of these securities amounted to $4,791,775 or 34.2% of net assets. |
| 6 | Step Bond: A debt instrument with either deferred interest payments or an interest rate that resets at specific times during its term. |
| 7 | Cash collateral received for securities lending activity was invested in these joint repurchase agreements. |
| | |
| CMT | | Constant Maturity Treasury |
| |
| SOFR | | Secured Overnight Financing Rate |
The following table summarizes the inputs used to value the Fund’s investments by the fair value hierarchy levels as of December 31, 2023:
| | | | | | | | | | | | | | | | |
| | | Level 1 | | | Level 2 | | | Level 3 | | | Total | |
| | | | |
Investments in Securities | | | | | | | | | | | | | | | | |
| | | | |
Corporate Bonds and Notes† | | | — | | | $ | 13,717,655 | | | | — | | | $ | 13,717,655 | |
| | | | |
Short-Term Investments | | | | | | | | | | | | | | | | |
| | | | |
Joint Repurchase Agreements | | | — | | | | 2,057,791 | | | | — | | | | 2,057,791 | |
| | | | |
Repurchase Agreements | | | — | | | | 140,000 | | | | — | | | | 140,000 | |
| | | | | | | | | | | | | | | | |
| | | | |
Total Investments in Securities | | | — | | | $ | 15,915,446 | | | | — | | | $ | 15,915,446 | |
| | | | | | | | | | | | | | | | |
| † | All corporate bonds and notes held in the Fund are level 2 securities. For a detailed breakout of corporate bonds and notes by major industry classification, please refer to the Fund’s Schedule of Portfolio Investments. |
For the fiscal year ended December 31, 2023, there were no transfers in or out of Level 3.
The accompanying notes are an integral part of these financial statements.
29
| | |
| | | AMG GW&K Municipal Bond Fund Portfolio Manager’s Comments (unaudited) |
| | | |
| | | |
| | | | | | | | |
THE YEAR IN REVIEW For the year ended December 31, 2023, AMG GW&K Municipal Bond Fund (the “Fund”) Class N shares returned 5.72%, compared to the 5.78% return for its benchmark, the Bloomberg 10-Year Municipal Bond Index (the “Index”). Municipal bonds posted solid gains in the first quarter, piggybacking a strong but extremely volatile rally in Treasuries. Although interest rates ultimately finished lower for the quarter, each month produced wildly different results. In January yields declined sharply as weak economic data fueled speculation of a U.S. Federal Reserve (the “Fed”) pivot. That notion gained more currency after the Federal Open Market Committee (FOMC) executed a slimmed-down quarter-point hike at its meeting on February 1, 2023. Two days later, however, a blowout jobs report undermined any thoughts of a slowdown, setting the stage for a violent reversal in rates. Worries over a recession faded, giving way to talk of a potential “no landing” scenario, where the economy continues to grow despite the Fed’s efforts to tame inflation. By early March, the yield curve had reached its deepest inversion in 40 years. The no-landing theory was ultimately done in, however, by the collapse of Silicon Valley Bank and subsequent turmoil in the banking industry. Rates plummeted into quarter end in a classic flight to safety, as investors worried that a pullback in lending posed a serious threat to future economic growth. As March ended, markets were anticipating multiple Fed cuts by year-end, even as central bank officials continued to forecast at least one more hike and no cuts until 2024. Municipal bonds posted modest losses in the second quarter, following the lead of a Treasury market that finally stopped fighting the Fed. Coming into April, investors were confident that the central bank would be forced to reverse its tightening campaign before year end. But that conviction didn’t last. Economic data stood firm against the torrent of rate hikes, defying predictions for a near-term recession. Regional banks earned back investor confidence, despite a third major failure. And while inflation slowed, it remained well above its 2% target, still threatening to become entrenched. Even when the FOMC stood pat in June, its first pause in 18 months of constant hiking, the committee refused to signal the all-clear, guiding for two more increases in 2023. The Street got the message. Short-term rates spiked more than 80 basis points over the quarter while the futures market erased bets that cuts would come later in the year. Long-term rates rose less dramatically, leading the yield curve to nearly match | | | | its March inversion, the deepest in over 40 years. An eventual recession is still the market’s base case, but exactly when or how deep remain open questions. The municipal market was a full participant in the global bond rout that unfolded over the third quarter. Broad fixed income losses piled up each month, but accelerated after the September FOMC meeting, where the Fed policymakers signaled a determination to hold interest rates higher for longer. Investors were taken off guard by the hawkish messaging, given the trajectory toward lower inflation and reduced froth in the labor markets, particularly over the last three months. But as Jay Powell pointed out in his post-meeting press conference, the recent jump in Treasury yields was less about inflation and more about real yields rising in response to stronger-than-expected economic data. The Fed Chair listed a number of plausible explanations for the economy’s surprising resilience (lagged effects of tightening, higher neutral rate, more durable consumer and business balance sheets), but emphasized the need to guard against overheated growth, lest it threaten the headway made to date in restoring price stability and full employment. The markets shared his caution, as the yield on the 10-year Treasury note climbed 73 basis points over the quarter, closing September at 4.57%, its highest level since 2007. As we ended the year, municipal bonds posted their best quarterly performance in nearly four decades, transforming 2023 into a year of solid gains after it looked like we were headed for a second consecutive annual loss. The remarkable turnaround was fueled by macro forces that unfolded over the final two months of the year. Recall that in October interest rates were still in selloff mode, as a stubbornly strong economy and persistently high inflation gave teeth to the Fed’s “higher-for-longer” mantra. Later that month, the yield on the 10-year Treasury had risen to 5%, a 16-year high. From that point on, however, the data began to shift. Job growth softened meaningfully while price pressures eased, increasing the odds of a soft landing and fueling speculation of an impending monetary pivot. Fed officials virtually confirmed this view when they unexpectedly penciled in 75 basis points of cuts for 2024 in the December FOMC projection materials. The bond market, already rallying coming into the meeting, continued to surge into the yearend. By the end of December, the 10-year yield had fallen to 3.88%, down almost 70 basis points for the quarter. | | | | While the Treasury rally was the key factor driving performance to finish the year, municipal bonds received additional boosts from limited issuance and skyrocketing demand. Even during the October selloff, retail investors were jumping at the chance to lock in tax-equivalent yields not seen in over a decade, keeping municipals relatively well bid. When the market then started to turn, a healthy appetite for paper turned into a mad scramble, reflecting a fierce competition for bonds amid an end-of-year slowdown in issuance. The frenzy was amplified by a spike in rollover flows as well as an explosion of tax-loss harvesting, as participants hastened to reinvest proceeds before the market moved away from them. Over the final two months of the year, the 10-year municipal yield fell 133 basis points. And when it was all said and done, you had to go back to 1986 to find a better quarterly return. 2023 now enters the history books as the sixth best annual return in the last two decades, an extraordinary outcome for a year that brought so much handwringing. FUND PERFORMANCE The Fund performed in line with the Bloomberg Municipal 10-Year Index for the year. A longer duration and an extension trade overweighting longer-term bonds were positives. An underweight to lower coupon structures and BBB-rated bonds were negatives. OUTLOOK Looking ahead to January, the combination of seasonally low supply, still-heavy reinvestment needs and an end to tax-loss selling should continue to foster the momentum built up over the past two months. Demand will be supported by a healthy fundamental backdrop and historically attractive tax-equivalent yields. The outlook for state and local governments remains solid, with most looking at low-single-digit revenue increases, manageable expense growth and significant financial flexibility, a product of record-high reserves. Investors will need to be alert to future volatility, especially with the market anticipating a sea change in monetary policy followed by a fast-approaching national election. One area to keep an eye on is how expensive valuations to Treasuries have become in the wake of the recent rally. While we don’t necessarily expect a quick unwind of these historically stretched ratios, municipal bonds are less likely to outperform Treasuries until we see those metrics improve. Even so, heading into a year with so much uncertainty, the |
30
| | |
| | | AMG GW&K Municipal Bond Fund Portfolio Manager’s Comments (continued) |
| | | |
| | | |
| | | | | | | | |
high-quality stability offered by municipal bonds promises to draw even more interest to the asset class in 2024. The views expressed represent the opinions of GW&K Investment Management, LLC as of December 31, 2023, and are not intended as a forecast or guarantee of future results, and are subject to change without notice. | | | | | | | | |
31
| | |
| | | AMG GW&K Municipal Bond Fund Portfolio Manager’s Comments (continued) |
| | | |
| | | |
CUMULATIVE TOTAL RETURN PERFORMANCE
AMG GW&K Municipal Bond Fund’s cumulative total return is based on the daily change in net asset value (NAV), and assumes that all dividends and distributions were reinvested. The graph compares a hypothetical $10,000 investment made in the AMG GW&K Municipal Bond Fund’s Class N shares on December 31, 2013, to a $10,000 investment made in the Bloomberg 10-Year Municipal Bond Index for the same time period. The graph and table do not reflect the deduction of taxes that a shareholder would pay on a Fund distribution or redemption of shares. The listed returns for the Fund are net of expenses and the returns for the index exclude expenses. Total returns would have been lower had certain expenses not been reduced.
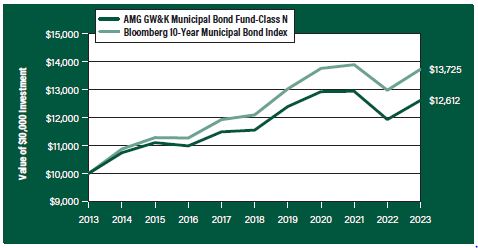
The table below shows the average annual total returns for the AMG GW&K Municipal Bond Fund and the Bloomberg 10-Year Municipal Bond Index for the same time periods ended December 31, 2023.
| | | | | | | | | | | | |
| Average Annual Total Returns1 | | One
Year | | | Five
Years | | | Ten
Years | |
AMG GW&K Municipal Bond Fund2, 3, 4, 5, 6, 7, 8, 9, 10, 11, 12, 13, 14, 15 | |
| | | |
Class N | | | 5.72 | % | | | 1.77 | % | | | 2.35% | |
| | | |
Class I | | | 6.04 | % | | | 2.11 | % | | | 2.71% | |
| | | |
Bloomberg 10-Year Municipal Bond Index16 | | | 5.78 | % | | | 2.57 | % | | | 3.22% | |
The performance data shown represents past performance. Past performance is not a guarantee of future results. Current performance may be lower or higher than the performance data quoted. The investment return and principal value of an investment will fluctuate so that an investor’s shares, when redeemed, may be worth more or less than their original cost.
Investors should carefully consider the Fund’s investment objectives, risks, charges and expenses before investing. For performance information through the most recent month end, current net asset values per share for the Fund and other information, please call 800.548.4539 or visit our website at wealth.amg.com for a free prospectus. Read it carefully before investing or sending money.
Distributed by AMG Distributors, Inc., member FINRA/SIPC.
| 1 | Total return equals income yield plus share price change and assumes reinvestment of all dividends and capital gain distributions. Returns are net of fees and may reflect offsets of Fund expenses as described in the prospectus. No adjustment has been made for taxes payable by shareholders on their reinvested dividends and capital gain distributions. Returns for periods greater than one year are annualized. The listed returns on the Fund are net of expenses and based on the published NAV as of December 31, 2023. All returns are in U.S. Dollars ($). |
|
2 From time to time, the Fund’s Investment Manager has waived its fees and/or absorbed Fund expenses, which has resulted in higher returns. 3 Market prices of investments held by the Fund may fall rapidly or unpredictably due to a variety of factors, including economic, political, or market conditions, or other factors including terrorism, war, natural disasters and the spread of infectious illness or other public health issues, including epidemics or pandemics, or in response to events that affect particular industries or companies. 4 The Fund may not be able to dispose of particular investments, such as illiquid securities, readily at favorable times or prices or the Fund may have to sell them at a loss. 5 Because the Fund is an actively managed investment portfolio, security selection or focus on securities in a particular style, market sector or group of companies may cause the Fund to incur losses or underperform relative to its benchmarks or other funds with a similar investment objective. There can be no guarantee that the Subadviser’s investment techniques and risk analysis will produce the desired result. 6 The value of a debt security changes in response to various factors, including, for example, market-related factors, such as changes in interest rates or changes in the actual or perceived ability of an issuer to meet its obligations. Investments in debt securities are subject to, among other risks, credit risk, interest rate risk, extension risk, prepayment risk and liquidity risk. 7 Fixed coupon payments (cash flows) of bonds and debt securities may become less competitive with the market in periods of rising interest rates and cause bond prices to decline. During periods of increasing interest rates, the Fund may experience high levels of volatility and shareholder redemptions, and may have to sell securities at times when it would otherwise not do so, and at unfavorable prices, which could reduce the returns of the Fund. 8 The Fund will normally receive income which may include interest, dividends and/or capital gains, depending upon its investments. The distribution amount paid by the Fund will vary and generally depends on the amount of income the Fund earns (less expenses) on its portfolio holdings, and capital gains or losses it recognizes. A decline in the Fund’s income or net capital gains arising from its investments may reduce its distribution level. 9 During periods of rising interest rates, a debtor may pay back a bond or other fixed income security slower than expected or required, and the value of such security may fall. 10 Inflation risk is the risk that the value of assets or income from investments will be worth less in the |
| |
32
| | |
| | | AMG GW&K Municipal Bond Fund Portfolio Manager’s Comments (continued) |
| | | |
| | | |
| | | | | | | | |
future. Inflation rates may change frequently and drastically as a result of various factors and the Fund’s investments may not keep pace with inflation, which may result in losses to Fund investors or adversely affect the real value of shareholders’ investments in the Fund. As inflation rates increase, fixed income securities markets may experience heightened levels of interest rate volatility and liquidity risk. Deflation risk is the risk that the prices throughout the economy decline over time – the opposite of inflation. Deflation may have an adverse effect on the creditworthiness of issuers and may make issuer default more likely, which may result in a decline in the value of the Fund’s portfolio. 11 Factors unique to the municipal bond market may negatively affect the value of municipal bonds. 12 A debtor may exercise its right to pay back a bond or other debt security earlier than expected or required during periods of decreasing interest rates. | | | | 13 The Fund may have difficulty reinvesting payments from debtors and may receive lower rates than from its original investments. 14 The issuer of bonds or other debt securities may be unable or unwilling, or may be perceived as unable or unwilling, to make timely interest or principal payments or otherwise honor its obligations. 15 Issuers and companies that are in similar industry sectors may be similarly affected by particular economic or market events; to the extent the Fund has substantial holdings within a particular sector, the risks associated with that sector increase. 16 The Bloomberg 10-Year Municipal Bond Index is the 10 Year (8-12) component of the Municipal Bond Index. It is a rules based, market-value-weighted index engineered for the tax-exempt bond market. The Index tracks general obligation bonds, revenue bonds, insured bonds, and prerefunded bonds rated Baa3/BBB- or higher by at least two of the | | | | ratings agencies: Moody’s, S&P, Fitch. Unlike the Fund, the Bloomberg 10-Year Municipal Bond Index is unmanaged, is not available for investment and does not incur expenses. “Bloomberg®” and any Bloomberg index described herein are service marks of Bloomberg Finance L.P. and its affiliates, including Bloomberg Index Services Limited (“BISL”), the administrator of the index (collectively, “Bloomberg”) and have been licensed for use for certain purposes by AMG Funds LLC. Bloomberg is not affiliated with AMG Funds LLC, and Bloomberg does not approve, endorse, review, or recommend the fund described herein. Bloomberg does not guarantee the timeliness, accurateness, or completeness of any data or information relating to such fund. Not FDIC insured, nor bank guaranteed. May lose value. |
33
| | |
| | | AMG GW&K Municipal Bond Fund Fund Snapshots (unaudited) December 31, 2023 |
| | | |
| | | |
PORTFOLIO BREAKDOWN
| | |
| Category | | % of
Net Assets |
| | |
General Obligation | | 39.9 |
| | |
Transportation | | 18.2 |
| | |
Airport | | 10.0 |
| | |
Medical | | 8.7 |
| | |
Water | | 6.1 |
| | |
Utilities | | 5.4 |
| | |
Education | | 5.4 |
| | |
Power | | 2.7 |
| | |
Tobacco Settlement | | 0.8 |
| | |
Development | | 0.8 |
| | |
Short term investments | | 1.5 |
| | |
Other assets and liabilities | | 0.5 |
| | |
| Rating | | % of Market Value1 |
| | |
Aaa/AAA | | 21.6 |
| | |
Aa/AA | | 46.6 |
| | |
A | | 23.5 |
| | |
Baa/BBB | | 8.3 |
| 1 | Includes market value of long-term fixed-income securities only. |
TOP TEN HOLDINGS
| | |
| Security Name | | % of
Net Assets |
| | |
Iowa Finance Authority, State Revolving Fund Green Bond, 5.000%, 08/01/30 | | 1.6 |
| | |
Metropolitan Transportation Authority, Green Bond, Series B, 5.000%, 11/15/27 | | 1.5 |
| | |
State of Maryland, Department of Transportation, 5.000%, 09/01/29 | | 1.3 |
| | |
State of Maryland, Department of Transportation, 5.000%, 10/01/28 | | 1.3 |
| | |
Louisiana Stadium & Exposition District, Series A, 5.000%, 07/01/42 | | 1.2 |
| | |
City of San Antonio Electric & Gas Systems, Series A, 5.000%, 02/01/31 | | 1.2 |
| | |
Illinois State Finance Authority, Clean Water Initiative, 5.000%, 07/01/27 | | 1.1 |
| | |
State of Wisconsin Transportation, Series 2, 5.000%, 07/01/29 | | 1.1 |
| | |
State of Illinois, Series B, 5.000%, 05/01/34 | | 1.1 |
| | |
Illinois State Toll Highway Authority, Senior Revenue, Series A, 5.000%, 01/01/30 | | 1.1 |
| | | |
| | |
Top Ten as a Group | | 12.5 |
| | |
Credit quality ratings shown above reflect the highest rating assigned by either Standard & Poor’s (“S&P”), Moody’s Investors Service, Inc. (“Moody’s”) or Fitch. These rating agencies are independent, nationally recognized statistical rating organizations and are widely used. Investment grade ratings are credit ratings of BBB- or higher. Below investment grade ratings are credit ratings of BB+ or lower. Investments designated N/R are not rated by any of the rating agencies. Unrated investments do not necessarily indicate low credit quality. Credit quality ratings are subject to change.
Because a fund’s strategy may result in multiple investments in particular sectors of the economy, its performance may depend on the performance of those sectors and may fluctuate more widely than investments diversified across more sectors. For additional information on these and other risk considerations, please see the Fund’s prospectus.
Any sectors, industries, or securities discussed should not be perceived as investment recommendations. Mention of a specific security should not be considered a recommendation to buy or solicitation to sell that security. Specific securities mentioned in this report may have been sold from the Fund’s portfolio of investments by the time you receive this report.
34
| | |
| | | AMG GW&K Municipal Bond Fund Schedule of Portfolio Investments December 31, 2023 |
| | | |
| | | |
| | | | | | | | |
| | | Principal
Amount | | | Value | |
| | |
Municipal Bonds - 98.0% | | | | | | | | |
| |
Alabama - 0.8% | | | | | |
| | |
Alabama Public School and College Authority, Series A | | | | | | | | |
5.000%, 11/01/34 | | | $7,500,000 | | | | $8,679,221 | |
| |
California - 4.0% | | | | | |
| | |
California Municipal Finance Authority, Community Medical Centers, Series A, | | | | | | | | |
5.000%, 02/01/31 | | | 900,000 | | | | 942,015 | |
5.000%, 02/01/32 | | | 1,855,000 | | | | 1,941,330 | |
| | |
City of Los Angeles Department of Airports, Series C | | | | | | | | |
5.000%, 05/15/30 | | | 5,515,000 | | | | 6,147,060 | |
| | |
San Francisco City & County Airport Commission, San Francisco International Airport, Series A, | | | | | | | | |
5.000%, 05/01/32 | | | 3,000,000 | | | | 3,366,044 | |
5.000%, 05/01/34 | | | 5,010,000 | | | | 5,459,889 | |
5.000%, 05/01/35 | | | 5,800,000 | | | | 6,305,526 | |
| | |
State of California, | | | | | | | | |
5.000%, 09/01/29 | | | 4,075,000 | | | | 4,327,770 | |
5.000%, 09/01/35 | | | 5,000,000 | | | | 6,117,302 | |
5.000%, 10/01/36 | | | 5,000,000 | | | | 6,020,468 | |
| | |
Total California | | | | | | | 40,627,404 | |
| |
Colorado - 0.5% | | | | | |
| | |
Colorado Health Facilities Authority, Series A | | | | | | | | |
5.000%, 08/01/33 | | | 4,260,000 | | | | 4,659,865 | |
| |
Connecticut - 4.0% | | | | | |
| | |
Connecticut State Health & Educational Facilities Authority, | | | | | | | | |
5.000%, 07/01/31 | | | 6,205,000 | | | | 6,886,101 | |
5.000%, 07/01/33 | | | 2,750,000 | | | | 3,068,705 | |
5.000%, 07/01/34 | | | 3,100,000 | | | | 3,451,072 | |
| | |
State of Connecticut Special Tax Obligation, Transportation Infrastructure, Series A | | | | | | | | |
5.000%, 01/01/30 | | | 10,180,000 | | | | 11,168,692 | |
| | |
State of Connecticut Special Tax Obligation, Transportation Infrastructure, Series B | | | | | | | | |
5.000%, 10/01/35 | | | 7,500,000 | | | | 8,298,373 | |
| | |
State of Connecticut, Series A | | | | | | | | |
5.000%, 01/15/31 | | | 7,650,000 | | | | 8,772,215 | |
| | |
Total Connecticut | | | | | | | 41,645,158 | |
| |
District of Columbia - 3.0% | | | | | |
| | |
District of Columbia, Series A | | | | | | | | |
5.000%, 06/01/30 | | | 6,020,000 | | | | 6,348,425 | |
| | |
District of Columbia, Series B | | | | | | | | |
5.000%, 06/01/31 | | | 5,080,000 | | | | 5,622,556 | |
| | |
District of Columbia, Series C, | | | | | | | | |
5.000%, 12/01/33 | | | 5,000,000 | | | | 6,067,577 | |
5.000%, 12/01/34 | | | 6,000,000 | | | | 7,258,290 | |
| | | | | | | | |
| | | | | | | | |
| | | Principal
Amount | | | Value | |
| | |
Washington DC Convention & Sports Authority, Series A | | | | | | | | |
5.000%, 10/01/27 | | | $4,845,000 | | | | $5,273,602 | |
| | |
Total District of Columbia | | | | | | | 30,570,450 | |
| |
Florida - 3.4% | | | | | |
| | |
Escambia County Health Facilities Authority | | | | | | | | |
5.000%, 08/15/37 | | | 6,000,000 | | | | 6,270,378 | |
| | |
Florida Development Finance Corp. | | | | | | | | |
4.000%, 11/15/33 | | | 10,000,000 | | | | 10,683,637 | |
| | |
Florida’s Turnpike Enterprise, Department of Transportation, Series C | | | | | | | | |
5.000%, 07/01/28 | | | 7,075,000 | | | | 7,462,288 | |
| | |
Lee Memorial Health System, Series A1 | | | | | | | | |
5.000%, 04/01/34 | | | 5,645,000 | | | | 6,140,364 | |
| | |
Orange County Health Facilities Authority, Series A | | | | | | | | |
5.000%, 10/01/31 | | | 4,525,000 | | | | 4,733,609 | |
| | |
Total Florida | | | | | | | 35,290,276 | |
| |
Illinois - 8.3% | | | | | |
| | |
Chicago O’Hare International Airport, Series A | | | | | | | | |
5.000%, 01/01/35 | | | 5,010,000 | | | | 5,677,060 | |
| | |
Chicago O’Hare International Airport, Senior Lien, Series A, | | | | | | | | |
5.000%, 01/01/36 | | | 10,050,000 | | | | 10,771,569 | |
5.000%, 01/01/38 | | | 5,500,000 | | | | 5,805,216 | |
| | |
Illinois Finance Authority, Series A | | | | | | | | |
4.000%, 08/15/37 | | | 5,910,000 | | | | 6,115,466 | |
| | |
Illinois State Finance Authority, Clean Water Initiative | | | | | | | | |
5.000%, 07/01/27 | | | 11,000,000 | | | | 11,500,487 | |
| | |
Illinois State Toll Highway Authority, Senior Revenue, Series A | | | | | | | | |
5.000%, 01/01/30 | | | 10,110,000 | | | | 11,297,940 | |
| | |
Illinois State Toll Highway Authority, Series A, | | | | | | | | |
5.000%, 12/01/31 | | | 9,735,000 | | | | 10,144,240 | |
5.000%, 01/01/361 | | | 3,000,000 | | | | 3,647,038 | |
| | |
State of Illinois, Series A | | | | | | | | |
5.250%, 03/01/37 | | | 8,500,000 | | | | 9,590,052 | |
| | |
State of Illinois, Series B | | | | | | | | |
5.000%, 05/01/34 | | | 10,000,000 | | | | 11,298,538 | |
| | |
Total Illinois | | | | | | | 85,847,606 | |
| |
Indiana - 2.3% | | | | | |
| | |
Indiana Finance Authority, Series 1, | | | | | | | | |
5.000%, 10/01/28 | | | 1,000,000 | | | | 1,112,994 | |
5.000%, 10/01/29 | | | 3,555,000 | | | | 4,029,228 | |
| | |
Indiana Finance Authority, Series A | | | | | | | | |
5.000%, 02/01/32 | | | 5,000,000 | | | | 5,844,870 | |
| | |
Indiana Finance Authority, Series B | | | | | | | | |
5.000%, 02/01/34 | | | 5,815,000 | | | | 6,902,059 | |
| | | | | | | | |
The accompanying notes are an integral part of these financial statements.
35
| | |
| | | AMG GW&K Municipal Bond Fund Schedule of Portfolio Investments (continued) |
| | | |
| | | |
| | | | | | | | |
| | | Principal
Amount | | | Value | |
| |
Indiana - 2.3% (continued) | | | | | |
| | |
Indiana Finance Authority, Series C | | | | | | | | |
5.000%, 06/01/29 | | | $4,800,000 | | | | $5,445,089 | |
| | |
Total Indiana | | | | | | | 23,334,240 | |
| |
Iowa - 1.6% | | | | | |
| | |
Iowa Finance Authority, State Revolving Fund Green Bond | | | | | | | | |
5.000%, 08/01/30 | | | 15,025,000 | | | | 16,350,860 | |
| |
Kentucky - 0.6% | | | | | |
| | |
Louisville/Jefferson County Metropolitan Government, Norton Healthcare Inc. | | | | | | | | |
5.000%, 10/01/29 | | | 5,505,000 | | | | 5,736,199 | |
| |
Louisiana - 1.8% | | | | | |
| | |
Louisiana Stadium & Exposition District, Series A, | | | | | | | | |
5.000%, 07/01/40 | | | 2,750,000 | | | | 3,091,859 | |
5.000%, 07/01/42 | | | 11,500,000 | | | | 12,803,435 | |
| | |
State of Louisiana, Series A | | | | | | | | |
5.000%, 09/01/30 | | | 2,000,000 | | | | 2,196,939 | |
| | |
Total Louisiana | | | | | | | 18,092,233 | |
| |
Maryland - 5.6% | | | | | |
| | |
Maryland State Transportation Authority | | | | | | | | |
5.000%, 07/01/33 | | | 6,350,000 | | | | 7,293,513 | |
| | |
State of Maryland, Department of Transportation, | | | | | | | | |
5.000%, 10/01/28 | | | 12,365,000 | | | | 13,185,922 | |
5.000%, 09/01/29 | | | 12,205,000 | | | | 13,278,244 | |
| | |
State of Maryland, Series C | | | | | | | | |
4.000%, 03/01/29 | | | 9,245,000 | | | | 10,033,854 | |
| | |
State of Maryland, Series D | | | | | | | | |
4.000%, 08/01/29 | | | 6,500,000 | | | | 7,092,470 | |
| | |
State of Maryland, State & Local Facilities Loan of 2019, 1st Series | | | | | | | | |
5.000%, 03/15/30 | | | 6,000,000 | | | | 6,797,039 | |
| | |
Total Maryland | | | | | | | 57,681,042 | |
| |
Massachusetts - 0.5% | | | | | |
| | |
Massachusetts Development Finance Agency | | | | | | | | |
5.250%, 07/01/48 | | | 4,250,000 | | | | 4,650,377 | |
| |
Michigan - 1.8% | | | | | |
| | |
Michigan Finance Authority, Henry Ford Health System | | | | | | | | |
5.000%, 11/15/29 | | | 8,000,000 | | | | 8,407,222 | |
| | |
Michigan State Building Authority, Series I | | | | | | | | |
5.000%, 04/15/27 | | | 5,700,000 | | | | 5,925,402 | |
| | |
Wayne County Airport Authority, Series A, | | | | | | | | |
5.000%, 12/01/37 | | | 2,285,000 | | | | 2,622,409 | |
5.000%, 12/01/39 | | | 1,800,000 | | | | 2,027,813 | |
| | |
Total Michigan | | | | | | | 18,982,846 | |
| |
New Jersey - 6.1% | | | | | |
| | |
New Jersey Economic Development Authority, Series A | | | | | | | | |
5.250%, 11/01/40 | | | 7,000,000 | | | | 8,004,278 | |
| | | | | | | | |
| | | | | | | | |
| | | Principal
Amount | | | Value | |
| | |
New Jersey Economic Development Authority, Series SSS, | | | | | | | | |
5.250%, 06/15/361 | | | $3,000,000 | | | | $3,578,244 | |
5.250%, 06/15/371 | | | 2,000,000 | | | | 2,361,193 | |
| | |
New Jersey State Turnpike Authority, Series D | | | | | | | | |
5.000%, 01/01/28 | | | 6,000,000 | | | | 6,328,709 | |
| | |
New Jersey Transportation Trust Fund Authority, Series A, | | | | | | | | |
5.250%, 06/15/41 | | | 2,700,000 | | | | 3,101,473 | |
5.250%, 06/15/42 | | | 2,500,000 | | | | 2,853,906 | |
| | |
New Jersey Transportation Trust Fund Authority, Series B, | | | | | | | | |
5.000%, 06/15/30 | | | 6,255,000 | | | | 7,145,934 | |
5.000%, 06/15/31 | | | 7,615,000 | | | | 8,837,368 | |
5.000%, 06/15/32 | | | 5,750,000 | | | | 6,658,256 | |
5.000%, 06/15/33 | | | 6,000,000 | | | | 6,923,775 | |
| | |
New Jersey Transportation Trust Fund Authority, Series BB | | | | | | | | |
4.000%, 06/15/37 | | | 3,000,000 | | | | 3,120,802 | |
| | |
South Jersey Transportation Authority, | | | | | | | | |
5.000%, 11/01/39 | | | 1,150,000 | | | | 1,254,629 | |
5.000%, 11/01/41 | | | 2,565,000 | | | | 2,772,413 | |
| | |
Total New Jersey | | | | | | | 62,940,980 | |
| |
New Mexico - 0.8% | | | | | |
| | |
New Mexico Finance Authority, Series A | | | | | | | | |
5.000%, 06/15/30 | | | 7,500,000 | | | | 8,678,672 | |
| |
New York - 19.9% | | | | | |
| | |
City of New York | | | | | | | | |
5.000%, 08/01/34 | | | 5,000,000 | | | | 6,080,926 | |
| | |
City of New York, Series B-1 | | | | | | | | |
5.000%, 08/01/32 | | | 3,000,000 | | | | 3,602,456 | |
| | |
City of New York, Series C, | | | | | | | | |
5.000%, 08/01/33 | | | 1,500,000 | | | | 1,734,229 | |
5.000%, 08/01/34 | | | 3,250,000 | | | | 3,749,886 | |
| | |
City of New York, Series L-5 | | | | | | | | |
5.000%, 04/01/33 | | | 6,500,000 | | | | 7,611,207 | |
| | |
Long Island Power Authority | | | | | | | | |
5.000%, 09/01/35 | | | 5,030,000 | | | | 5,548,408 | |
| | |
Long Island Power Authority, Series F | | | | | | | | |
5.000%, 09/01/33 | | | 3,000,000 | | | | 3,657,701 | |
| | |
Metropolitan Transportation Authority, Green Bond, Series B | | | | | | | | |
5.000%, 11/15/27 | | | 14,225,000 | | | | 15,339,569 | |
| | |
Metropolitan Transportation Authority, Series F | | | | | | | | |
5.000%, 11/15/28 | | | 4,760,000 | | | | 4,891,584 | |
| | |
New York City Transitional Finance Authority Building Aid Revenue, Series 1A, (State Aid Withholding) | | | | | | | | |
5.000%, 07/15/32 | | | 9,485,000 | | | | 11,114,279 | |
| | |
New York City Transitional Finance Authority Building Aid Revenue, Series S-3, (State Aid Withholding) | | | | | | | | |
5.000%, 07/15/31 | | | 5,080,000 | | | | 5,620,307 | |
| | | | | | | | |
The accompanying notes are an integral part of these financial statements.
36
| | |
| | | AMG GW&K Municipal Bond Fund Schedule of Portfolio Investments (continued) |
| | | |
| | | |
| | | | | | | | |
| | | Principal
Amount | | | Value | |
| |
New York - 19.9% (continued) | | | | | |
| | |
New York City Transitional Finance Authority, Future Tax Secured Subordinate, Series A-1, | | | | | | | | |
5.000%, 05/01/40 | | | $2,500,000 | | | | $2,897,950 | |
5.000%, 05/01/41 | | | 3,000,000 | | | | 3,456,590 | |
| | |
New York City Transitional Finance Authority, Future Tax Secured Subordinate, Series E-1 | | | | | | | | |
5.000%, 02/01/37 | | | 7,000,000 | | | | 8,063,556 | |
| | |
New York City Transitional Finance Authority, Future Tax Secured Subordinate, Series F-1, | | | | | | | | |
5.000%, 11/01/31 | | | 2,500,000 | | | | 2,949,430 | |
5.000%, 11/01/32 | | | 4,000,000 | | | | 4,716,026 | |
5.000%, 02/01/39 | | | 4,000,000 | | | | 4,586,182 | |
| | |
New York State Dormitory Authority | | | | | | | | |
4.000%, 05/01/39 | | | 2,000,000 | | | | 2,006,465 | |
| | |
New York State Dormitory Authority, Series 1 | | | | | | | | |
5.000%, 03/15/30 | | | 5,000,000 | | | | 5,755,145 | |
| | |
New York State Dormitory Authority, Series 2, | | | | | | | | |
5.000%, 09/15/30 | | | 5,000,000 | | | | 5,787,733 | |
5.000%, 09/15/33 | | | 5,000,000 | | | | 6,090,618 | |
| | |
New York State Dormitory Authority, Series A, | | | | | | | | |
5.000%, 03/15/31 | | | 7,670,000 | | | | 8,508,497 | |
5.000%, 03/15/32 | | | 8,000,000 | | | | 9,412,502 | |
5.000%, 03/15/32 | | | 3,000,000 | | | | 3,584,186 | |
5.000%, 03/15/33 | | | 3,200,000 | | | | 3,828,325 | |
| | |
New York State Dormitory Authority, Series E | | | | | | | | |
5.000%, 03/15/32 | | | 8,410,000 | | | | 8,659,439 | |
| | |
New York State Urban Development Corp. | | | | | | | | |
5.000%, 03/15/32 | | | 7,000,000 | | | | 8,137,707 | |
| | |
New York Transportation Development Corp., | | | | | | | | |
4.000%, 10/31/41 | | | 1,250,000 | | | | 1,193,464 | |
4.000%, 10/31/46 | | | 1,500,000 | | | | 1,376,950 | |
5.000%, 12/01/30 | | | 1,000,000 | | | | 1,113,142 | |
5.000%, 12/01/31 | | | 1,100,000 | | | | 1,219,769 | |
5.000%, 12/01/32 | | | 1,450,000 | | | | 1,602,216 | |
5.000%, 12/01/33 | | | 1,000,000 | | | | 1,100,873 | |
5.000%, 12/01/36 | | | 10,000,000 | | | | 10,993,744 | |
5.000%, 06/30/49 | | | 2,000,000 | | | | 2,089,260 | |
6.000%, 06/30/54 | | | 3,000,000 | | | | 3,312,704 | |
| | |
Port Authority of New York & New Jersey, Series 221 | | | | | | | | |
5.000%, 07/15/32 | | | 6,545,000 | | | | 7,309,965 | |
| | |
Triborough Bridge & Tunnel Authority, | | | | | | | | |
5.000%, 11/15/30 | | | 7,500,000 | | | | 8,759,409 | |
5.000%, 11/15/33 | | | 3,970,000 | | | | 4,881,630 | |
| | |
Triborough Bridge & Tunnel Authority, Series C | | | | | | | | |
5.000%, 11/15/35 | | | 2,000,000 | | | | 2,442,017 | |
| | |
Total New York | | | | | | | 204,786,046 | |
| |
North Carolina - 2.2% | | | | | |
| | |
County of Union NC Enterprise System Revenue, | | | | | | | | |
1.750%, 06/01/34 | | | 3,300,000 | | | | 2,721,036 | |
1.750%, 06/01/35 | | | 4,225,000 | | | | 3,419,927 | |
1.850%, 06/01/36 | | | 4,315,000 | | | | 3,446,981 | |
2.125%, 06/01/40 | | | 3,350,000 | | | | 2,480,530 | |
| | | | | | | | |
| | | | | | | | |
| | | Principal
Amount | | | Value | |
| | |
North Carolina State Limited Obligation, Series B | | | | | | | | |
5.000%, 05/01/28 | | | $10,000,000 | | | | $10,832,374 | |
| | |
Total North Carolina | | | | | | | 22,900,848 | |
| |
Ohio - 0.8% | | | | | |
| | |
Ohio State General Obligation, Series T | | | | | | | | |
5.000%, 05/01/30 | | | 5,000,000 | | | | 5,386,875 | |
| | |
Ohio Water Development Authority Water Pollution Control Loan Fund, Series B | | | | | | | | |
5.000%, 06/01/35 | | | 2,500,000 | | | | 3,032,038 | |
| | |
Total Ohio | | | | | | | 8,418,913 | |
| |
Pennsylvania - 3.1% | | | | | |
| | |
Allegheny County Airport Authority, Series A, | | | | | | | | |
5.000%, 01/01/31 | | | 1,350,000 | | | | 1,498,974 | |
5.000%, 01/01/32 | | | 2,215,000 | | | | 2,451,339 | |
| | |
Commonwealth Financing Authority, Pennsylvania Tobacco | | | | | | | | |
5.000%, 06/01/32 | | | 7,910,000 | | | | 8,557,422 | |
| | |
Hospitals & Higher Education Facilities Authority of Philadelphia, (AGM) | | | | | | | | |
4.000%, 07/01/38 | | | 2,500,000 | | | | 2,568,917 | |
4.000%, 07/01/39 | | | 2,000,000 | | | | 2,038,301 | |
| | |
Pennsylvania Economic Development Financing Authority, | | | | | | | | |
5.250%, 06/30/35 | | | 3,000,000 | | | | 3,367,654 | |
5.750%, 06/30/48 | | | 5,000,000 | | | | 5,483,578 | |
| | |
Pennsylvania Turnpike Commission, Series A | | | | | | | | |
5.000%, 12/01/33 | | | 5,000,000 | | | | 5,887,018 | |
| | |
Total Pennsylvania | | | | | | | 31,853,203 | |
| |
South Carolina - 1.2% | | | | | |
| | |
Richland County School District No 2, Series A, (South Carolina School District) | | | | | | | | |
2.000%, 03/01/38 | | | 6,190,000 | | | | 4,728,082 | |
2.000%, 03/01/39 | | | 10,080,000 | | | | 7,484,863 | |
| | |
Total South Carolina | | | | | | | 12,212,945 | |
| |
Tennessee - 0.6% | | | | | |
| | |
City of Chattanooga Electric System Revenue | | | | | | | | |
2.000%, 09/01/39 | | | 8,925,000 | | | | 6,582,298 | |
| |
Texas - 12.8% | | | | | |
| | |
City of Corpus Christi Utility System, Junior Lien Revenue Improvement | | | | | | | | |
5.000%, 07/15/29 | | | 3,125,000 | | | | 3,451,227 | |
| | |
City of Houston Airport System, Series A, | | | | | | | | |
4.000%, 07/01/35 | | | 1,100,000 | | | | 1,131,542 | |
4.000%, 07/01/36 | | | 1,100,000 | | | | 1,124,142 | |
5.000%, 07/01/34 | | | 2,835,000 | | | | 3,168,552 | |
| | |
City of San Antonio Electric & Gas Systems, Series A, | | | | | | | | |
5.000%, 02/01/31 | | | 10,715,000 | | | | 12,475,630 | |
5.000%, 02/01/34 | | | 5,460,000 | | | | 6,592,220 | |
5.000%, 02/01/35 | | | 3,000,000 | | | | 3,602,705 | |
5.000%, 02/01/37 | | | 3,010,000 | | | | 3,411,025 | |
5.000%, 02/01/38 | | | 2,985,000 | | | | 3,337,551 | |
| | | | | | | | |
The accompanying notes are an integral part of these financial statements.
37
| | |
| | | AMG GW&K Municipal Bond Fund Schedule of Portfolio Investments (continued) |
| | | |
| | | |
| | | | | | | | |
| | | Principal
Amount | | | Value | |
| |
Texas - 12.8% (continued) | | | | | |
| | |
County of Harris Toll Road First Lien, Series A | | | | | | | | |
5.000%, 08/15/34 | | | $5,000,000 | | | | $6,046,013 | |
| | |
Dallas Area Rapid Transit, Senior Lien, (AMBAC) | | | | | | | | |
5.250%, 12/01/28 | | | 8,865,000 | | | | 10,040,691 | |
| | |
Denton Independent School District, (PSF-GTD) | | | | | | | | |
5.000%, 08/15/33 | | | 5,000,000 | | | | 6,096,790 | |
5.000%, 08/15/35 | | | 3,000,000 | | | | 3,631,424 | |
| | |
Lamar Consolidated Independent School District | | | | | | | | |
5.000%, 02/15/34 | | | 7,965,000 | | | | 9,466,377 | |
| | |
Leander Independent School District, (PSF-GTD) | | | | | | | | |
5.000%, 02/15/32 | | | 6,795,000 | | | | 8,100,928 | |
| | |
Lower Colorado River Authority | | | | | | | | |
5.000%, 05/15/31 | | | 6,000,000 | | | | 6,950,513 | |
| | |
North Texas Municipal Water District Water System Revenue Refunding and Improvement | | | | | | | | |
5.000%, 09/01/29 | | | 7,350,000 | | | | 7,736,567 | |
| | |
North Texas Tollway Authority, 2nd Tier, Series B, | | | | | | | | |
5.000%, 01/01/31 | | | 2,000,000 | | | | 2,073,525 | |
5.000%, 01/01/32 | | | 3,010,000 | | | | 3,209,603 | |
| | |
North Texas Tollway Authority, Series A | | | | | | | | |
5.250%, 01/01/38 | | | 4,500,000 | | | | 5,184,275 | |
| | |
Prosper Independent School District, Series A, (PSF-GTD) | | | | | | | | |
1.750%, 02/15/34 | | | 3,565,000 | | | | 2,993,858 | |
1.750%, 02/15/35 | | | 5,155,000 | | | | 4,250,035 | |
| | |
State of Texas, Series A | | | | | | | | |
5.000%, 10/01/29 | | | 5,000,000 | | | | 5,180,485 | |
| | |
Texas Private Activity Bond Surface Transportation Corp., | | | | | | | | |
5.500%, 06/30/41 | | | 1,000,000 | | | | 1,074,602 | |
5.500%, 06/30/42 | | | 1,000,000 | | | | 1,073,747 | |
5.500%, 06/30/43 | | | 1,000,000 | | | | 1,072,449 | |
| | |
Texas Private Activity Bond Surface Transportation Corp., Series A, | | | | | | | | |
4.000%, 12/31/37 | | | 5,000,000 | | | | 5,042,783 | |
4.000%, 12/31/38 | | | 3,735,000 | | | | 3,748,732 | |
| | |
Total Texas | | | | | | | 131,267,991 | |
| |
Utah - 3.4% | | | | | |
| | |
Intermountain Power Agency, | | | | | | | | |
5.000%, 07/01/33 | | | 3,500,000 | | | | 4,199,534 | |
5.000%, 07/01/34 | | | 3,500,000 | | | | 4,189,452 | |
5.000%, 07/01/35 | | | 3,250,000 | | | | 3,870,903 | |
| | |
Intermountain Power Agency, Series A | | | | | | | | |
5.000%, 07/01/34 | | | 5,250,000 | | | | 6,196,768 | |
| | |
Salt Lake City Corp. Airport Revenue, Series A, | | | | | | | | |
5.000%, 07/01/29 | | | 3,450,000 | | | | 3,716,844 | |
5.000%, 07/01/30 | | | 6,585,000 | | | | 7,063,449 | |
| | |
University of Utah/The, Series B | | | | | | | | |
5.000%, 08/01/37 | | | 5,000,000 | | | | 5,880,418 | |
| | |
Total Utah | | | | | | | 35,117,368 | |
| | |
| | | | | | | | |
| | | | | | | | |
| | | Principal
Amount | | | Value | |
| |
Virginia - 1.6% | | | | | |
| | |
Virginia College Building Authority | | | | | | | | |
5.000%, 02/01/33 | | | $8,250,000 | | | | $10,027,020 | |
| | |
Virginia Small Business Financing Authority, | | | | | | | | |
4.000%, 01/01/37 | | | 3,000,000 | | | | 3,007,895 | |
4.000%, 01/01/38 | | | 3,000,000 | | | | 2,961,831 | |
| | |
Total Virginia | | | | | | | 15,996,746 | |
| |
Washington - 4.0% | | | | | |
| | |
Energy Northwest, Series A | | | | | | | | |
5.000%, 07/01/35 | | | 8,000,000 | | | | 9,620,579 | |
| | |
Port of Seattle, Series C | | | | | | | | |
5.000%, 08/01/31 | | | 5,000,000 | | | | 5,574,888 | |
| | |
State of Washington School Improvements, Series C | | | | | | | | |
5.000%, 02/01/28 | | | 7,370,000 | | | | 7,719,258 | |
| | |
State of Washington, Series B | | | | | | | | |
5.000%, 08/01/31 | | | 4,680,000 | | | | 4,942,310 | |
| | |
State of Washington, Series R | | | | | | | | |
5.000%, 07/01/31 | | | 9,975,000 | | | | 10,171,281 | |
| | |
Washington Health Care Facilities Authority, Series A | | | | | | | | |
5.000%, 08/01/38 | | | 3,270,000 | | | | 3,474,167 | |
| | |
Total Washington | | | | | | | 41,502,483 | |
| |
West Virginia - 1.6% | | | | | |
| | |
West Virginia Hospital Finance Authority, Series B | | | | | | | | |
6.000%, 09/01/48 | | | 5,250,000 | | | | 5,995,954 | |
| | |
West Virginia Parkways Authority, | | | | | | | | |
5.000%, 06/01/37 | | | 1,750,000 | | | | 2,001,874 | |
5.000%, 06/01/38 | | | 2,000,000 | | | | 2,265,797 | |
5.000%, 06/01/39 | | | 5,150,000 | | | | 5,807,313 | |
| | |
Total West Virginia | | | | | | | 16,070,938 | |
| |
Wisconsin - 1.7% | | | | | |
| | |
State of Wisconsin Transportation, Series 2 | | | | | | | | |
5.000%, 07/01/29 | | | 10,405,000 | | | | 11,331,694 | |
| | |
State of Wisconsin, Series 2 | | | | | | | | |
5.000%, 05/01/35 | | | 5,000,000 | | | | 6,049,663 | |
| | |
Total Wisconsin | | | | | | | 17,381,357 | |
| |
Total Municipal Bonds | | | | | |
(Cost $1,014,813,167) | | | | | | | 1,007,858,565 | |
| |
Short-Term Investments - 1.5% | | | | | |
| |
Repurchase Agreements - 1.5% | | | | | |
| | |
Fixed Income Clearing Corp., dated 12/29/23, due 01/02/24, 5.150% total to be received $7,903,520 (collateralized by a U.S. Treasury, 4.125%, 09/30/27, totaling $8,057,021) | | | 7,899,000 | | | | 7,899,000 | |
| | |
| | | | | | | | |
The accompanying notes are an integral part of these financial statements.
38
| | |
| | | AMG GW&K Municipal Bond Fund Schedule of Portfolio Investments (continued) |
| | | |
| | | |
| | | | | | | | |
| | | Principal
Amount | | | Value | |
| | |
Repurchase Agreements - 1.5% (continued) | | | | | | | | |
| | |
Fixed Income Clearing Corp., dated 12/29/23 due 01/02/24, 5.150% total to be received $7,321,187 (collateralized by a U.S. Treasury, 3.875%, 12/31/27, totaling $7,463,368) | | | $7,317,000 | | | | $7,317,000 | |
| |
Total Repurchase Agreements | | | | 15,216,000 | |
| |
Total Short-Term Investments | | | | | |
(Cost $15,216,000) | | | | | | | 15,216,000 | |
| | | | | | | | |
| 1 | All or part of a security is delayed delivery transaction. The market value for delayed delivery securities at December 31, 2023, amounted to $9,586,475, or 0.9% of net assets. |
| | |
| |
| AGM | | Assured Guaranty Municipal Corp. |
| | | | | | | | |
| | | | | |
Value | |
| | |
Total Investments - 99.5% | | | | | | | | |
(Cost $1,030,029,167) | | | | | | | $1,023,074,565 | |
| |
Other Assets, less Liabilities - 0.5% | | | | 5,613,991 | |
| |
Net Assets - 100.0% | | | | $1,028,688,556 | |
| | |
| |
| AMBAC | | American Municipal Bond Assurance Corp. |
| |
| GNMA | | PSF-GTD Permanent School Fund Guaranteed |
The following table summarizes the inputs used to value the Fund’s investments by the fair value hierarchy levels as of December 31, 2023:
| | | | | | | | | | | | | | | | |
| | | Level 1 | | | Level 2 | | | Level 3 | | | Total | |
| | | | |
Investments in Securities | | | | | | | | | | | | | | | | |
| | | | |
Municipal Bonds† | | | — | | | $ | 1,007,858,565 | | | | — | | | $ | 1,007,858,565 | |
| | | | |
Short-Term Investments | | | | | | | | | | | | | | | | |
| | | | |
Repurchase Agreements | | | — | | | | 15,216,000 | | | | — | | | | 15,216,000 | |
| | | | | | | | | | | | | | | | |
| | | | |
Total Investments in Securities | | | — | | | $ | 1,023,074,565 | | | | — | | | $ | 1,023,074,565 | |
| | | | | | | | | | | | | | | | |
| † | All municipal bonds held in the Fund are Level 2 securities. For a detailed breakout of municipal bonds by major classification, please refer to the Fund’s Schedule of Portfolio Investments. |
For the fiscal year ended December 31, 2023, there were no transfers in or out of Level 3.
The accompanying notes are an integral part of these financial statements.
39
| | |
| | | AMG GW&K Municipal Enhanced Yield Fund Portfolio Manager’s Comments (unaudited) |
| | | |
| | | |
| | | | | | | | | | | | |
THE YEAR IN REVIEW For the year ended December 31, 2023, AMG GW&K Municipal Enhanced Yield Fund’s (the “Fund”) Class N shares returned 10.53%, compared to the Bloomberg U.S. Municipal Bond BAA Index (the “Index”), which returned 8.93%. Municipal bonds posted solid gains in the first quarter, piggybacking a strong but extremely volatile, rally in Treasuries. Although interest rates ultimately finished lower for the quarter, each month produced wildly different results. In January, yields declined sharply as weak economic data fueled speculation of a U.S Federal Reverse (the “Fed”) pivot. That notion gained more currency after the Federal Open Market Committee (FOMC) executed a slimmed-down quarter-point hike at its meeting on February 1, 2023. Two days later, however, a blowout jobs report undermined any thoughts of a slowdown, setting the stage for a violent reversal in rates. Worries over a recession faded, giving way to talk of a potential “no landing” scenario, where the economy continues to grow despite the Fed’s efforts to tame inflation. By early March the yield curve had reached its deepest inversion in 40 years. The no-landing theory was ultimately done in, however, by the collapse of Silicon Valley Bank and subsequent turmoil in the banking industry. Rates plummeted into quarter end in a classic flight to safety, as investors worried that a pullback in lending posed a serious threat to future economic growth. As March ended, markets were anticipating multiple Fed cuts by year-end, even as central bank officials continued to forecast at least one more hike and no cuts until 2024. Municipal bonds posted modest losses in the second quarter, following the lead of a Treasury market that finally stopped fighting the Fed. Coming into April, investors were confident that the central bank would be forced to reverse its tightening campaign before year end. But that conviction didn’t last. Economic data stood firm against the torrent of rate hikes, defying predictions for a near-term recession. Regional banks earned back investor confidence, despite a third major failure. And while inflation slowed, it remained well above its 2% target, still threatening to become entrenched. Even when the FOMC stood pat in June, its first pause in 18 months of constant hiking, the committee refused to signal the all-clear, guiding for two more increases in 2023. The Street got the message. Short-term rates spiked more than 80 basis points over the quarter while the futures market erased bets that cuts would come later in the year. Long-term rates rose less dramatically, leading the yield curve to nearly match | | | | | | its March inversion, the deepest in over 40 years. An eventual recession is still the market’s base case, but exactly when or how deep remain open questions. The municipal market was a full participant in the global bond rout that unfolded over the third quarter. Broad fixed income losses piled up each month, but accelerated after the September FOMC meeting, where Fed policymakers signaled a determination to hold interest rates higher for longer. Investors were taken off guard by the hawkish messaging, given the trajectory toward lower inflation and reduced froth in the labor markets, particularly over the last three months. But as Jay Powell pointed out in his post-meeting press conference, the recent jump in Treasury yields was less about inflation and more about real yields rising in response to stronger-than-expected economic data. The Fed Chair listed a number of plausible explanations for the economy’s surprising resilience (lagged effects of tightening, higher neutral rate, more durable consumer and business balance sheets), but emphasized the need to guard against overheated growth, lest it threaten the headway made to date in restoring price stability and full employment. The markets shared his caution, as the yield on the 10-year Treasury note climbed 73 basis points over the quarter, closing September at 4.57%, its highest level since 2007. As we ended the year, municipal bonds posted their best quarterly performance in nearly four decades, transforming 2023 into a year of solid gains after it looked like we were headed for a second consecutive annual loss. The remarkable turnaround was fueled by macro forces that unfolded over the final two months of the year. Recall that in October interest rates were still in selloff mode, as a stubbornly strong economy and persistently high inflation gave teeth to the Feds “higher-for-longer” mantra. Later that month, the yield on the 10-year Treasury had risen to 5%, a 16-year high. From that point on, however, the data began to shift. Job growth softened meaningfully while price pressures eased, increasing the odds of a soft landing and fueling speculation of an impending monetary pivot. Fed officials virtually confirmed this view when they unexpectedly penciled in 75 basis points of cuts for 2024 in the December FOMC projection materials. The bond market, already rallying coming into the meeting, continued to surge into year-end. By the end of December, the 10-year yield had fallen to 3.88%, down almost 70 basis points for the quarter. While the Treasury rally was the key factor driving performance in the fourth quarter, municipal bonds received additional boosts from limited issuance and | | | | | | sky-rocketing demand. Even during the October selloff, retail investors were jumping at the chance to lock in tax-equivalent yields not seen in over a decade, keeping municipals relatively well bid. When the market then started to turn, a healthy appetite for paper turned into a mad scramble, reflecting a fierce competition for bonds amid an end-of-year slowdown in issuance. The frenzy was amplified by a spike in rollover flows as well as an explosion of tax-loss harvesting, as participants hastened to reinvest proceeds before the market moved away from them. Over the final two months of the year, the 10-year municipal yield fell 133 basis points. And when it was all said and done, you had to go back to 1986 to find a better quarterly return. 2023 now enters the history books as the sixth best annual return in the last two decades, an extraordinary outcome for a year that brought so much handwringing. FUND PERFORMANCE The Fund outperformed the Index for the year. The strong rally in the fourth quarter transformed 2023 into a year of solid gains and outweighed the performance of the previous three quarters. The Fund’s outperformance was driven mainly by its longer duration, its overweight to longer maturities, and the significant decline in interest rates in the quarter. Additionally, the Fund’s overweights to the hospital and transportation sectors contributed to performance. Lower quality benefited from the rally in the fourth quarter. The Fund’s higher quality bias detracted from performance, specifically the Fund’s overweight to Single A versus the BBB-rated bonds of the Index. An underweight to lower coupon bonds and security selection in the tobacco and housing sectors were also detractors from performance. OUTLOOK Looking ahead to January, the combination of seasonally low supply, still-heavy reinvestment needs and an end to tax-loss selling should continue to foster the momentum built up over the past two months. Demand will be supported by a healthy fundamental backdrop and historically attractive tax-equivalent yields. The outlook for state and local governments remains solid, with most looking at low-single-digit revenue increases, manageable expense growth and significant financial flexibility, a product of record-high reserves. Investors will need to be alert to future volatility, especially with the market anticipating a sea change in monetary policy |
40
| | |
| | | AMG GW&K Municipal Enhanced Yield Fund Portfolio Manager’s Comments (continued) |
| | | |
| | | |
| | | | | | | | | | | | |
followed by a fast-approaching national election. One area to keep an eye on is how expensive valuations to Treasuries have become in the wake of the recent rally. While we don’t necessarily expect a quick unwind of these historically stretched ratios, municipal bonds are less likely to outperform | | | | | | Treasuries until we see those metrics improve. Even so, heading into a year with so much uncertainty, the high-quality stability generally offered by municipal bonds promises to draw even more interest to the asset class in 2024. | | | | | | The views expressed represent the opinions of GW&K Investment Management, LLC as of December 31, 2023, and are not intended as a forecast or guarantee of future results, and are subject to change without notice. |
41
| | |
| | | AMG GW&K Municipal Enhanced Yield Fund Portfolio Manager’s Comments (continued) |
| | | |
| | | |
CUMULATIVE TOTAL RETURN PERFORMANCE
AMG GW&K Municipal Enhanced Yield Fund’s cumulative total return is based on the daily change in net asset value (NAV), and assumes that all dividends and distributions were reinvested. The graph compares a hypothetical $10,000 investment made in the AMG GW&K Municipal Enhanced Yield Fund’s Class N shares on December 31, 2013, to a $10,000 investment made in the Bloomberg U.S. Municipal Bond BAA Index for the same time period. The graph and table do not reflect the deduction of taxes that a shareholder would pay on a Fund distribution or redemption of shares. The listed returns for the Fund are net of expenses and the returns for the index exclude expenses. Total returns would have been lower had certain expenses not been reduced.

The table below shows the average annual total returns for the AMG GW&K Municipal Enhanced Yield Fund and the Bloomberg U.S. Municipal Bond BAA Index for the same time periods ended December 31, 2023.
| | | | | | | | | | | | | | | | | | | | |
| Average Annual Total Returns1 | | One
Year | | | Five
Years | | | Ten
Years | | | Since
Inception | | | Inception
Date | |
|
| AMG GW&K Municipal Enhanced Yield Fund2, 3, 4, 5, 6, 7, 8, 9, 10, 11, 12, 13, 14, 15, 16, 17 | |
| | | | | |
Class N | | | 10.53 | % | | | 1.94 | % | | | 3.83 | % | | | 4.77 | % | | | 07/27/09 | |
| | | | | |
Class I | | | 10.89 | % | | | 2.29 | % | | | 4.23 | % | | | 3.92 | % | | | 12/30/05 | |
| | | | | |
Class Z | | | 10.95 | % | | | 2.37 | % | | | — | | | | 2.89 | % | | | 02/24/17 | |
| | | | | |
Bloomberg U.S. Municipal Bond BAA Index18 | | | 8.93 | % | | | 3.02 | % | | | 4.42 | % | | | 4.81 | % | | | 07/27/09 | † |
The performance data shown represents past performance. Past performance is not a guarantee of future results. Current performance may be lower or higher than the performance data quoted. The investment return and principal value of an investment will fluctuate so that an investor’s shares, when redeemed, may be worth more or less than their original cost.
Investors should carefully consider the Fund’s investment objectives, risks, charges and expenses before investing. For performance information through the most recent month end, current net asset values per share for the Fund and other information, please call 800.548.4539 or visit our website at wealth.amg.com for a free prospectus. Read it carefully before investing or sending money.
Distributed by AMG Distributors, Inc., member FINRA/SIPC.
| † | Date reflects the inception date of the Fund, not the index. |
| 1 | Total return equals income yield plus share price change and assumes reinvestment of all dividends and capital gain distributions. Returns are net of fees and may reflect offsets of Fund expenses as described in the prospectus. No adjustment has been made for taxes payable by shareholders on their reinvested dividends and |
|
capital gain distributions. Returns for periods greater than one year are annualized. The listed returns on the Fund are net of expenses and based on the published NAV as of December 31, 2023. All returns are in U.S. Dollars ($). 2 From time to time, the Fund’s Investment Manager has waived its fees and/or absorbed Fund expenses, which has resulted in higher returns. 3 Market prices of investments held by the Fund may fall rapidly or unpredictably due to a variety of factors, including economic, political, or market conditions, or other factors including terrorism, war, natural disasters and the spread of infectious illness or other public health issues, including epidemics or pandemics, or in response to events that affect particular industries or companies. 4 The Fund may not be able to dispose of particular investments, such as illiquid securities, readily at favorable times or prices or the Fund may have to sell them at a loss. 5 Because the Fund is an actively managed investment portfolio, security selection or focus on securities in a particular style, market sector or group of companies may cause the Fund to incur losses or underperform relative to its benchmarks or other funds with a similar investment objective. There can be no guarantee that the Subadviser’s investment techniques and risk analysis will produce the desired result. 6 The value of a debt security changes in response to various factors, including, for example, market-related factors, such as changes in interest rates or changes in the actual or perceived ability of an issuer to meet its obligations. Investments in debt securities are subject to, among other risks, credit risk, interest rate risk, extension risk, prepayment risk and liquidity risk. 7 Fixed coupon payments (cash flows) of bonds and debt securities may become less competitive with the market in periods of rising interest rates and cause bond prices to decline. During periods of increasing interest rates, the Fund may experience high levels of volatility and shareholder redemptions, and may have to sell securities at times when it would otherwise not do so, and at unfavorable prices, which could reduce the returns of the Fund. 8 The Fund will normally receive income which may include interest, dividends and/or capital gains, depending upon its investments. The distribution amount paid by the Fund will vary and generally depends on the amount of income the Fund earns (less expenses) on its portfolio holdings, and capital gains or losses it recognizes. A decline in the Fund’s income or net capital gains arising from its investments may reduce its distribution level. 9 During periods of rising interest rates, a debtor may |
| |
42
| | |
| | | AMG GW&K Municipal Enhanced Yield Fund Portfolio Manager’s Comments (continued) |
| | | |
| | | |
| | | | | | | | |
pay back a bond or other fixed income security slower than expected or required, and the value of such security may fall. 10 Inflation risk is the risk that the value of assets or income from investments will be worth less in the future. Inflation rates may change frequently and drastically as a result of various factors and the Fund’s investments may not keep pace with inflation, which may result in losses to Fund investors or adversely affect the real value of shareholders’ investments in the Fund. As inflation rates increase, fixed income securities markets may experience heightened levels of interest rate volatility and liquidity risk. Deflation risk is the risk that the prices throughout the economy decline over time – the opposite of inflation. Deflation may have an adverse effect on the creditworthiness of issuers and may make issuer default more likely, which may result in a decline in the value of the Fund’s portfolio. 11 Factors unique to the municipal bond market may negatively affect the value of municipal bonds. 12 A debtor may exercise its right to pay back a bond or other debt security earlier than expected or required during periods of decreasing interest rates. 13 The Fund may have difficulty reinvesting payments | | | | from debtors and may receive lower rates than from its original investments. 14 Below investment grade debt securities and unrated securities of similar credit quality (commonly known as “junk bonds” or “high yield securities”) may be subject to greater levels of interest rate, credit, liquidity, and market risk than higher-rated securities. These securities are considered predominately speculative with respect to the issuer’s continuing ability to make principal and interest payments. 15 Issuers and companies that are in similar industry sectors may be similarly affected by particular economic or market events; to the extent the Fund has substantial holdings within a particular sector, the risks associated with that sector increase. 16 The issuer of bonds or other debt securities or a counterparty to a derivatives contract may be unable or unwilling, or may be perceived as unable or unwilling, to make timely interest, principal or settlement payments or otherwise honor its obligations. 17 The use of derivatives involves costs, the risk that the value of derivatives may not correlate perfectly with their underlying assets, rates or indices, liquidity risk, and the risk of mispricing or improper valuation. The use of derivatives may not succeed for various reasons, and the complexity and rapidly | | | | changing structure of derivatives markets may increase the possibility of market losses. 18 The Bloomberg U.S. Municipal Bond BAA Index is a subset of the Bloomberg U.S. Municipal Bond Index with an index rating of Baa1, Baa2, or Baa3. The Bloomberg U.S. Municipal Bond Index is a rules-based, market-value-weighted index engineered for the long-term, tax-exempt bond market. Unlike the Fund, the Bloomberg U.S. Municipal Bond BAA Index is unmanaged, is not available for investment and does not incur expenses. “Bloomberg®” and any Bloomberg index described herein are service marks of Bloomberg Finance L.P. and its affiliates, including Bloomberg Index Services Limited (“BISL”), the administrator of the index (collectively, “Bloomberg”) and have been licensed for use for certain purposes by AMG Funds LLC. Bloomberg is not affiliated with AMG Funds LLC, and Bloomberg does not approve, endorse, review, or recommend the fund described herein. Bloomberg does not guarantee the timeliness, accurateness, or completeness of any data or information relating to such fund. Not FDIC insured, nor bank guaranteed. May lose value. |
43
| | |
| | | AMG GW&K Municipal Enhanced Yield Fund Fund Snapshots (unaudited) December 31, 2023 |
| | | |
| | | |
PORTFOLIO BREAKDOWN
| | |
| Category | | % of
Net Assets |
| | |
Transportation | | 26.9 |
| | |
Medical | | 22.3 |
| | |
General Obligation | | 17.0 |
| | |
Higher Education | | 7.0 |
| | |
Airport | | 6.6 |
| | |
Industrial Development | | 5.8 |
| | |
Tobacco Settlement | | 4.4 |
| | |
Housing | | 3.1 |
| | |
School District | | 2.9 |
| | |
Utilities | | 2.6 |
| | |
Short-Term Investments | | 2.5 |
| | |
Other Assets, less Liabilities | | (1.1) |
| | |
| Rating | | % of Market Value1 |
| | |
Aa/AA | | 10.9 |
| | |
A | | 41.3 |
| | |
Baa/BBB | | 47.8 |
| 1 | Includes market value of long-term fixed-income securities only. |
TOP TEN HOLDINGS
| | |
| Security Name | | % of
Net Assets |
| | |
Texas Private Activity Bond Surface Transportation Corp., 5.000%, 06/30/58 | | 3.7 |
| | |
Public Authority for Colorado Energy Natural Gas Purchase Revenue, 6.500%, 11/15/38 | | 3.2 |
| | |
Richland County School District No 2, Series A, 1.875%, 03/01/38 | | 3.0 |
| | |
City of Chattanooga Electric, 2.000%, 09/01/40 | | 2.6 |
| | |
Philadelphia Authority for Industrial Development, 5.250%, 11/01/52 | | 2.6 |
| | |
Pennsylvania Economic Development Financing Authority, 5.250%, 06/30/53 | | 2.5 |
| | |
Central Plains Energy Project #3, Series A, 5.000%, 09/01/42 | | 2.4 |
| | |
New York Transportation Development Corp., 4.000%, 04/30/53 | | 2.4 |
| | |
Escambia County Health Facilities Authority, 4.000%, 08/15/50 | | 2.1 |
| | |
Colorado Health Facilities Authority, Series A, 5.000%, 08/01/44 | | 2.1 |
| | | |
| | |
Top Ten as a Group | | 26.6 |
| | |
Credit quality ratings shown above reflect the highest rating assigned by either Standard & Poor’s (“S&P”), Moody’s Investors Service, Inc. (“Moody’s”) or Fitch. These rating agencies are independent, nationally recognized statistical rating organizations and are widely used. Investment grade ratings are credit ratings of BBB- or higher. Below investment grade ratings are credit ratings of BB+ or lower. Investments designated N/R are not rated by any of the rating agencies. Unrated investments do not necessarily indicate low credit quality. Credit quality ratings are subject to change.
Because a fund’s strategy may result in multiple investments in particular sectors of the economy, its performance may depend on the performance of those sectors and may fluctuate more widely than investments diversified across more sectors. For additional information on these and other risk considerations, please see the Fund’s prospectus.
Any sectors, industries, or securities discussed should not be perceived as investment recommendations. Mention of a specific security should not be considered a recommendation to buy or solicitation to sell that security. Specific securities mentioned in this report may have been sold from the Fund’s portfolio of investments by the time you receive this report.
44
| | |
| | | AMG GW&K Municipal Enhanced Yield Fund Schedule of Portfolio Investments December 31, 2023 |
| | | |
| | | |
| | | | | | | | |
| | | Principal
Amount | | | Value | |
| | |
Municipal Bonds - 98.6% | | | | | | | | |
| | |
California - 5.5% | | | | | | | | |
| | |
California Municipal Finance Authority, | | | | | | | | |
| | |
5.000%, 05/15/43 | | | $2,515,000 | | | | $2,589,281 | |
| | |
5.000%, 05/15/48 | | | 3,855,000 | | | | 3,940,708 | |
| | |
California Municipal Finance Authority, Series A | | | | | | | | |
| | |
4.000%, 02/01/51 | | | 1,260,000 | | | | 1,142,127 | |
| | |
Riverside County Transportation Commission, Series B1 | | | | | | | | |
| | |
4.000%, 06/01/46 | | | 1,095,000 | | | | 1,096,857 | |
| | |
Riverside County Transportation Commission, Series C | | | | | | | | |
| | |
4.000%, 06/01/47 | | | 2,870,000 | | | | 2,818,641 | |
| | |
Total California | | | | | | | 11,587,614 | |
| | |
Colorado - 5.3% | | | | | | | | |
| | |
Colorado Health Facilities Authority, Series A | | | | | | | | |
| | |
5.000%, 08/01/44 | | | 4,185,000 | | | | 4,358,208 | |
| | |
Public Authority for Colorado Energy Natural Gas Purchase Revenue | | | | | | | | |
| | |
6.500%, 11/15/38 | | | 5,395,000 | | | | 6,797,330 | |
| | |
Total Colorado | | | | | | | 11,155,538 | |
| | |
Connecticut - 2.0% | | | | | | | | |
| | |
Connecticut State Health & Educational Facilities Authority, | | | | | | | | |
| | |
4.000%, 07/01/40 | | | 2,845,000 | | | | 2,808,496 | |
| | |
4.000%, 07/01/42 | | | 1,465,000 | | | | 1,421,282 | |
| | |
Total Connecticut | | | | | | | 4,229,778 | |
| | |
Florida - 12.5% | | | | | | | | |
| | |
Brevard County Health Facilities Authority, Series A | | | | | | | | |
| | |
5.000%, 04/01/47 | | | 4,025,000 | | | | 4,327,055 | |
| | |
City of Tampa, Series B | | | | | | | | |
| | |
5.000%, 07/01/50 | | | 2,065,000 | | | | 2,165,619 | |
| | |
County of Miami-Dade Florida Seaport Department, Series 1, (AGM) | | | | | | | | |
| | |
4.000%, 10/01/45 | | | 2,730,000 | | | | 2,604,753 | |
| | |
County of Miami-Dade Florida Seaport Department, Series A | | | | | | | | |
| | |
5.250%, 10/01/52 | | | 1,260,000 | | | | 1,370,269 | |
| | |
Escambia County Health Facilities Authority | | | | | | | | |
| | |
4.000%, 08/15/50 | | | 5,065,000 | | | | 4,455,095 | |
| | |
Florida Development Finance Corp., | | | | | | | | |
| | |
4.000%, 02/01/52 | | | 2,515,000 | | | | 1,932,696 | |
| | |
5.000%, 02/01/52 | | | 1,675,000 | | | | 1,552,354 | |
| | |
Hillsborough County Industrial Development Authority | | | | | | | | |
| | |
4.000%, 08/01/50 | | | 4,185,000 | | | | 3,907,709 | |
| | |
Miami Beach Health Facilities Authority | | | | | | | | |
| | |
4.000%, 11/15/46 | | | 4,185,000 | | | | 4,023,004 | |
| | |
Total Florida | | | | | | | 26,338,554 | |
| | |
| | | | | | | | |
| | | | | | | | |
| | | Principal
Amount | | | Value | |
| | |
Illinois - 8.3% | | | | | | | | |
| | |
Chicago O’Hare International Airport, Senior Lien, Series A | | | | | | | | |
| | |
5.000%, 01/01/48 | | | $3,000,000 | | | | $3,091,419 | |
| | |
Metropolitan Pier & Exposition Authority, | | | | | | | | |
| | |
4.000%, 12/15/42 | | | 1,675,000 | | | | 1,673,996 | |
| | |
4.000%, 06/15/52 | | | 2,515,000 | | | | 2,366,020 | |
| | |
5.000%, 06/15/50 | | | 4,185,000 | | | | 4,324,762 | |
| | |
State of Illinois | | | | | | | | |
| | |
5.750%, 05/01/45 | | | 2,515,000 | | | | 2,767,863 | |
| | |
State of Illinois, Series A, | | | | | | | | |
| | |
4.000%, 03/01/40 | | | 1,260,000 | | | | 1,265,476 | |
| | |
5.000%, 03/01/46 | | | 1,870,000 | | | | 1,980,535 | |
| | |
Total Illinois | | | | | | | 17,470,071 | |
| | |
Louisiana - 0.8% | | | | | | | | |
| | |
Louisiana Stadium & Exposition District, Series A | | | | | | | | |
| | |
5.250%, 07/01/53 | | | 1,500,000 | | | | 1,657,513 | |
| | |
Massachusetts - 3.2% | | | | | | | | |
| | |
Massachusetts Development Finance Agency, | | | | | | | | |
| | |
4.000%, 07/01/51 | | | 4,340,000 | | | | 3,649,185 | |
| | |
5.250%, 07/01/52 | | | 2,795,000 | | | | 3,037,554 | |
| | |
Total Massachusetts | | | | | | | 6,686,739 | |
| | |
Minnesota - 1.0% | | | | | | | | |
| | |
Duluth Economic Development Authority, Series A | | | | | | | | |
| | |
5.000%, 02/15/48 | | | 2,140,000 | | | | 2,178,542 | |
| | |
Nebraska - 2.4% | | | | | | | | |
| | |
Central Plains Energy Project #3, Series A | | | | | | | | |
| | |
5.000%, 09/01/42 | | | 4,655,000 | | | | 5,111,377 | |
| | |
New Jersey - 7.7% | | | | | | | | |
| | |
New Jersey Transportation Trust Fund Authority, Series AA, | | | | | | | | |
| | |
4.000%, 06/15/50 | | | 1,675,000 | | | | 1,623,985 | |
| | |
5.000%, 06/15/50 | | | 1,000,000 | | | | 1,066,287 | |
| | |
South Jersey Transportation Authority, | | | | | | | | |
| | |
4.625%, 11/01/47 | | | 2,930,000 | | | | 3,029,722 | |
| | |
5.250%, 11/01/52 | | | 3,770,000 | | | | 4,051,910 | |
| | |
Tobacco Settlement Financing Corp., Series A, | | | | | | | | |
| | |
5.000%, 06/01/46 | | | 2,095,000 | | | | 2,130,536 | |
| | |
5.250%, 06/01/46 | | | 2,755,000 | | | | 2,840,056 | |
| | |
Tobacco Settlement Financing Corp., Series B | | | | | | | | |
| | |
5.000%, 06/01/46 | | | 1,605,000 | | | | 1,629,093 | |
| | |
Total New Jersey | | | | | | | 16,371,589 | |
| | |
New York - 13.9% | | | | | | | | |
| | |
Metropolitan Transportation Authority, Series 1, | | | | | | | | |
| | |
4.750%, 11/15/45 | | | 2,660,000 | | | | 2,739,335 | |
| | |
5.000%, 11/15/50 | | | 1,955,000 | | | | 2,053,715 | |
| | |
5.250%, 11/15/55 | | | 2,530,000 | | | | 2,681,198 | |
| | |
New York State Dormitory Authority, Series A, | | | | | | | | |
| | |
4.000%, 07/01/47 | | | 1,675,000 | | | | 1,592,446 | |
| | |
4.000%, 07/01/52 | | | 1,775,000 | | | | 1,626,697 | |
| | |
| | | | | | | | |
The accompanying notes are an integral part of these financial statements.
45
| | |
| | | AMG GW&K Municipal Enhanced Yield Fund Schedule of Portfolio Investments (continued) |
| | | |
| | | |
| | | | | | | | |
| | | Principal
Amount | | | Value | |
| | |
New York - 13.9% (continued) | | | | | | | | |
| | |
New York Transportation Development Corp., | | | | | | | | |
| | |
4.000%, 12/01/39 | | | $1,000,000 | | | | $1,011,564 | |
| | |
4.000%, 04/30/53 | | | 5,790,000 | | | | 5,077,717 | |
| | |
5.000%, 12/01/40 | | | 1,000,000 | | | | 1,068,287 | |
| | |
5.000%, 12/01/41 | | | 2,185,000 | | | | 2,315,847 | |
| | |
5.625%, 04/01/40 | | | 4,000,000 | | | | 4,303,295 | |
| | |
6.000%, 04/01/35 | | | 2,500,000 | | | | 2,784,990 | |
| | |
6.000%, 06/30/54 | | | 2,000,000 | | | | 2,208,469 | |
| | |
Total New York | | | | | | | 29,463,560 | |
| | |
Pennsylvania - 10.8% | | | | | | | | |
| | |
Allegheny County Airport Authority, Series A | | | | | | | | |
| | |
5.000%, 01/01/51 | | | 4,185,000 | | | | 4,353,788 | |
| | |
Geisinger Authority | | | | | | | | |
| | |
4.000%, 04/01/50 | | | 1,610,000 | | | | 1,507,435 | |
| | |
Montgomery County Higher Education and Health Authority, Series B | | | | | | | | |
| | |
5.000%, 05/01/52 | | | 3,980,000 | | | | 4,195,197 | |
| | |
Pennsylvania Economic Development Financing Authority | | | | | | | | |
| | |
5.250%, 06/30/53 | | | 5,025,000 | | | | 5,259,596 | |
| | |
Pennsylvania Turnpike Commission, Series A | | | | | | | | |
| | |
4.000%, 12/01/50 | | | 2,065,000 | | | | 2,023,281 | |
| | |
Philadelphia Authority for Industrial Development | | | | | | | | |
| | |
5.250%, 11/01/52 | | | 5,185,000 | | | | 5,538,519 | |
| | |
Total Pennsylvania | | | | | | | 22,877,816 | |
| | |
Rhode Island - 1.3% | | | | | | | | |
| | |
Tobacco Settlement Financing Corp., Series A | | | | | | | | |
| | |
5.000%, 06/01/40 | | | 2,755,000 | | | | 2,776,829 | |
| | |
South Carolina - 2.9% | | | | | | | | |
| | |
Richland County School District No 2, Series A, (South Carolina School District) | | | | | | | | |
| | |
1.875%, 03/01/38 | | | 8,290,000 | | | | 6,198,756 | |
| | |
Tennessee - 3.7% | | | | | | | | |
| | |
City of Chattanooga Electric | | | | | | | | |
| | |
2.000%, 09/01/40 | | | 7,710,000 | | | | 5,547,400 | |
| | |
Metropolitan Government Nashville & Davidson County Health & Educational Facilities | | | | | | | | |
| | |
5.250%, 05/01/53 | | | 2,000,000 | | | | 2,173,140 | |
| | |
Total Tennessee | | | | | | | 7,720,540 | |
| | |
Texas - 9.7% | | | | | | | | |
| | |
Central Texas Regional Mobility | | | | | | | | |
| | |
Authority, Series B | | | | | | | | |
| | |
4.000%, 01/01/51 | | | 1,705,000 | | | | 1,675,799 | |
| | |
| | | | | | | | |
| | | | | | | | |
| | | Principal
Amount | | | Value | |
| | |
Texas Private Activity Bond Surface Transportation Corp., | | | | | | | | |
| | |
5.000%, 12/31/40 | | | $3,315,000 | | | | $3,341,377 | |
| | |
5.000%, 12/31/45 | | | 3,250,000 | | | | 3,269,647 | |
| | |
5.000%, 06/30/58 | | | 7,800,000 | | | | 7,881,991 | |
| | |
5.500%, 12/31/58 | | | 1,120,000 | | | | 1,214,576 | |
| | |
Texas Private Activity Bond Surface Transportation Corp., Series A | | | | | | | | |
| | |
4.000%, 12/31/39 | | | 3,155,000 | | | | 3,148,465 | |
| | |
Total Texas | | | | | | | 20,531,855 | |
| | |
Virginia - 6.2% | | | | | | | | |
| | |
Lynchburg Economic Development Authority | | | | | | | | |
| | |
4.000%, 01/01/55 | | | 1,260,000 | | | | 1,207,190 | |
| | |
Virginia Small Business Financing Authority, | | | | | | | | |
| | |
4.000%, 01/01/39 | | | 2,515,000 | | | | 2,471,081 | |
| | |
4.000%, 01/01/40 | | | 2,515,000 | | | | 2,460,321 | |
| | |
5.000%, 12/31/47 | | | 2,145,000 | | | | 2,256,075 | |
| | |
5.000%, 12/31/49 | | | 2,095,000 | | | | 2,104,292 | |
| | |
5.000%, 12/31/52 | | | 2,655,000 | | | | 2,663,413 | |
| | |
Total Virginia | | | | | | | 13,162,372 | |
| | |
West Virginia - 1.4% | | | | | | | | |
| | |
West Virginia Hospital Finance Authority, Series B | | | | | | | | |
| | |
6.000%, 09/01/53 | | | 2,625,000 | | | | 2,973,614 | |
| |
Total Municipal Bonds
(Cost $219,058,013) | | | | 208,492,657 | |
| |
Short-Term Investments - 2.5% | | | | | |
| | |
Repurchase Agreements - 2.5% | | | | | | | | |
| | |
Fixed Income Clearing Corp., dated 12/29/23 due 01/02/24, 5.150% total to be received $3,320,899 (collateralized by a U.S. Treasury, 3.875%, 08/15/33, totaling $3,385,422) | | | 3,319,000 | | | | 3,319,000 | |
| | |
Fixed Income Clearing Corp. dated 12/29/23, due 01/02/24, 5.150% total to be received $1,866,067 (collateralized by a U.S. Treasury, 4.125%, 09/30/27, totaling $1,902,338) | | | 1,865,000 | | | | 1,865,000 | |
| | |
Total Repurchase Agreements | | | | | | | 5,184,000 | |
| |
Total Short-Term Investments
(Cost $5,184,000) | | | | 5,184,000 | |
| |
Total Investments - 101.1%
(Cost $224,242,013) | | | | 213,676,657 | |
| |
Other Assets, less Liabilities - (1.1)% | | | | (2,268,391 | ) |
| |
Net Assets - 100.0% | | | | $211,408,266 | |
| |
| | | | | |
AGM Assured Guaranty Municipal Corp.
The accompanying notes are an integral part of these financial statements.
46
| | |
| | | AMG GW&K Municipal Enhanced Yield Fund Schedule of Portfolio Investments (continued) |
| | | |
| | | |
The following table summarizes the inputs used to value the Fund’s investments by the fair value hierarchy levels as of December 31, 2023:
| | | | | | | | | | | | | | | | |
| | | Level 1 | | | Level 2 | | | Level 3 | | | Total | |
| | | | |
Investments in Securities | | | | | | | | | | | | | | | | |
| | | | |
Municipal Bonds† | | | — | | | | $208,492,657 | | | | — | | | | $208,492,657 | |
| | | | |
Short-Term Investments | | | | | | | | | | | | | | | | |
| | | | |
Repurchase Agreements | | | — | | | | 5,184,000 | | | | — | | | | 5,184,000 | |
| | | | | | | | | | | | | | | | |
Total Investments in Securities | | | — | | | $ | 213,676,657 | | | | — | | | $ | 213,676,657 | |
| | | | | | | | | | | | | | | | |
| † | All municipal bonds held in the Fund are Level 2 securities. For a detailed breakout of municipal bonds by major classification, please refer to the Fund’s Schedule of Portfolio Investments. |
For the fiscal year ended December 31, 2023, there were no transfers in or out of Level 3.
The accompanying notes are an integral part of these financial statements.
47
| | |
| | | Statement of Assets and Liabilities December 31, 2023 |
| | | |
| | | |
| | | | | | | | | | | | | | | | | | | | |
| | | AMG GW&K
ESG
Bond Fund | | | AMG
GW&K Enhanced
Core Bond
ESG Fund | | | AMG
GW&K High
Income Fund | | | AMG
GW&K Municipal
Bond Fund | | | AMG
GW&K Municipal
Enhanced
Yield Fund | |
| | | | | |
Assets: | | | | | | | | | | | | | | | | | | | | |
| | | | | |
Investments at value1 (including securities on loan valued at $22,416,408, $4,139,635, $2,406,325, $0, and $0, respectively) | | | $431,999,068 | | | | $39,944,546 | | | | $13,717,655 | | | | $1,007,858,565 | | | | $208,492,657 | |
| | | | | |
Repurchase Agreements at value2 | | | 14,421,108 | | | | 2,185,574 | | | | 2,197,791 | | | | 15,216,000 | | | | 5,184,000 | |
| | | | | |
Cash | | | 764 | | | | — | | | | 576 | | | | 635,673 | | | | 217,952 | |
| | | | | |
Receivable for investments sold | | | — | | | | 751,395 | | | | — | | | | — | | | | — | |
| | | | | |
Interest receivables | | | 4,126,109 | | | | 334,577 | | | | 193,387 | | | | 13,533,410 | | | | 2,783,924 | |
| | | | | |
Securities lending income receivable | | | 7,508 | | | | 742 | | | | 1,343 | | | | — | | | | — | |
| | | | | |
Receivable for Fund shares sold | | | 240,282 | | | | 395,372 | | | | 8 | | | | 1,971,322 | | | | 541,498 | |
| | | | | |
Receivable from affiliate | | | 6,679 | | | | 11,110 | | | | 10,493 | | | | 66,004 | | | | 21,319 | |
| | | | | |
Prepaid expenses and other assets | | | 19,278 | | | | 12,838 | | | | 9,238 | | | | 17,465 | | | | 20,027 | |
| | | | | |
Total assets | | | 450,820,796 | | | | 43,636,154 | | | | 16,130,491 | | | | 1,039,298,439 | | | | 217,261,377 | |
| | | | | |
Liabilities: | | | | | | | | | | | | | | | | | | | | |
| | | | | |
Payable upon return of securities loaned | | | 14,128,108 | | | | 2,185,574 | | | | 2,057,791 | | | | — | | | | — | |
| | | | | |
Payable for delayed delivery investments purchased | | | — | | | | — | | | | — | | | | 8,929,520 | | | | — | |
| | | | | |
Payable for Fund shares repurchased | | | 972,511 | | | | 32,479 | | | | 1,357 | | | | 1,215,964 | | | | 5,679,877 | |
| | | | | |
Due to custodian | | | — | | | | 523,529 | | | | — | | | | — | | | | — | |
| | | | | |
Accrued expenses: | | | | | | | | | | | | | | | | | | | | |
| | | | | |
Investment advisory and management fees | | | 84,894 | | | | 10,570 | | | | 4,607 | | | | 180,610 | | | | 82,176 | |
| | | | | |
Administrative fees | | | 55,366 | | | | 5,285 | | | | 1,772 | | | | 129,884 | | | | 27,392 | |
| | | | | |
Distribution fees | | | — | | | | 2,374 | | | | — | | | | 2,545 | | | | 1,110 | |
| | | | | |
Shareholder service fees | | | 64,138 | | | | 1,956 | | | | 1,775 | | | | 43,538 | | | | 9,570 | |
| | | | | |
Other | | | 94,323 | | | | 57,726 | | | | 48,015 | | | | 107,822 | | | | 52,986 | |
| | | | | |
Total liabilities | | | 15,399,340 | | | | 2,819,493 | | | | 2,115,317 | | | | 10,609,883 | | | | 5,853,111 | |
| | | | | |
Commitments and Contingencies (Notes 2 & 5) | | | | | | | | | | | | | | | | | | | | |
| | | | | |
Net Assets | | | $435,421,456 | | | | $40,816,661 | | | | $14,015,174 | | | | $1,028,688,556 | | | | $211,408,266 | |
| | | | | |
1 Investments at cost | | | $475,366,376 | | | | $42,698,974 | | | | $13,776,553 | | | | $1,014,813,167 | | | | $219,058,013 | |
| | | | | |
2 Repurchase agreements at cost | | | $14,421,108 | | | | $2,185,574 | | | | $2,197,791 | | | | $15,216,000 | | | | $5,184,000 | |
The accompanying notes are an integral part of these financial statements.
48
| | |
| | | Statement of Assets and Liabilities (continued) |
| | | |
| | | |
| | | | | | | | | | | | | | | | | | | | |
| | | AMG GW&K
ESG
Bond Fund | | | AMG
GW&K Enhanced
Core Bond
ESG Fund | | | AMG
GW&K High
Income Fund | | | AMG
GW&K Municipal
Bond Fund | | | AMG
GW&K Municipal
Enhanced
Yield Fund | |
| | | | | |
Net Assets Represent: | | | | | | | | | | | | | | | | | | | | |
| | | | | |
Paid-in capital | | | $519,006,605 | | | | $50,366,220 | | | | $15,538,229 | | | | $1,062,346,645 | | | | $238,125,011 | |
| | | | | |
Total distributable loss | | | (83,585,149 | ) | | | (9,549,559 | ) | | | (1,523,055 | ) | | | (33,658,089 | ) | | | (26,716,745 | ) |
| | | | | |
Net Assets | | | $435,421,456 | | | | $40,816,661 | | | | $14,015,174 | | | | $1,028,688,556 | | | | $211,408,266 | |
| | | | | |
Class N: | | | | | | | | | | | | | | | | | | | | |
| | | | | |
Net Assets | | | $269,529,427 | | | | $11,370,215 | | | | $7,061,496 | | | | $12,081,330 | | | | $5,963,753 | |
| | | | | |
Shares outstanding | | | 12,337,059 | | | | 1,242,810 | | | | 337,682 | | | | 1,047,721 | | | | 648,395 | |
| | | | | |
Net asset value, offering and redemption price per share | | | $21.85 | | | | $9.15 | | | | $20.91 | | | | $11.53 | | | | $9.20 | |
| | | | | |
Class I: | | | | | | | | | | | | | | | | | | | | |
| | | | | |
Net Assets | | | $165,892,029 | | | | $21,804,982 | | | | $6,953,678 | | | | $1,016,607,226 | | | | $205,321,568 | |
| | | | | |
Shares outstanding | | | 7,592,307 | | | | 2,374,504 | | | | 332,687 | | | | 87,642,830 | | | | 23,045,193 | |
| | | | | |
Net asset value, offering and redemption price per share | | | $21.85 | | | | $9.18 | | | | $20.90 | | | | $11.60 | | | | $8.91 | |
| | | | | |
Class Z: | | | | | | | | | | | | | | | | | | | | |
| | | | | |
Net Assets | | | — | | | | $7,641,464 | | | | — | | | | — | | | | $122,945 | |
| | | | | |
Shares outstanding | | | — | | | | 832,312 | | | | — | | | | — | | | | 13,803 | |
| | | | | |
Net asset value, offering and redemption price per share | | | — | | | | $9.18 | | | | — | | | | — | | | | $8.91 | |
The accompanying notes are an integral part of these financial statements.
49
| | |
| | | Statement of Operations For the fiscal year ended December 31, 2023 |
| | | |
| | | |
| | | | | | | | | | | | | | | | | | | | |
| | | AMG GW&K
ESG
Bond Fund | | AMG
GW&K Enhanced
Core Bond
ESG Fund | | AMG
GW&K High
Income Fund | | AMG
GW&K Municipal
Bond Fund | | AMG
GW&K Municipal
Enhanced
Yield Fund |
| | | | | |
Investment Income: | | | | | | | | | | | | | | | | | | | | |
| | | | | |
Interest income | | $ | 16,708,574 | | | $ | 1,555,978 | | | $ | 843,707 | | | $ | 26,960,615 | | | $ | 9,453,149 | |
| | | | | |
Securities lending income | | | 54,288 | | | | 11,281 | | | | 29,590 | | | | — | | | | — | |
| | | | | |
Foreign withholding tax | | | (17,309 | ) | | | (257 | ) | | | (500 | ) | | | — | | | | — | |
| | | | | |
Total investment income | | | 16,745,553 | | | | 1,567,002 | | | | 872,797 | | | | 26,960,615 | | | | 9,453,149 | |
| | | | | |
Expenses: | | | | | | | | | | | | | | | | | | | | |
| | | | | |
Investment advisory and management fees | | | 1,063,895 | | | | 119,542 | | | | 61,171 | | | | 2,184,142 | | | | 1,101,809 | |
| | | | | |
Administrative fees | | | 693,844 | | | | 59,771 | | | | 23,527 | | | | 1,572,482 | | | | 367,270 | |
| | | | | |
Distribution fees - Class N | | | — | | | | 27,445 | | | | — | | | | 32,772 | | | | 9,305 | |
| | | | | |
Shareholder servicing fees - Class N | | | 707,619 | | | | — | | | | 16,782 | | | | 16,950 | | | | 5,583 | |
| | | | | |
Shareholder servicing fees - Class I | | | 89,758 | | | | 16,980 | | | | 4,486 | | | | 517,606 | | | | 120,504 | |
| | | | | |
Professional fees | | | 86,687 | | | | 55,137 | | | | 49,306 | | | | 123,287 | | | | 57,519 | |
| | | | | |
Reports to shareholders | | | 52,174 | | | | 10,858 | | | | 5,364 | | | | 52,620 | | | | 18,220 | |
| | | | | |
Registration fees | | | 50,458 | | | | 37,163 | | | | 26,291 | | | | 129,134 | | | | 48,578 | |
| | | | | |
Custodian fees | | | 46,034 | | | | 25,189 | | | | 21,895 | | | | 81,896 | | | | 31,805 | |
| | | | | |
Trustee fees and expenses | | | 34,002 | | | | 2,963 | | | | 1,140 | | | | 77,317 | | | | 17,753 | |
| | | | | |
Transfer agent fees | | | 25,407 | | | | 2,940 | | | | 1,177 | | | | 37,460 | | | | 8,680 | |
| | | | | |
Interest expense | | | — | | | | 990 | | | | — | | | | 1,144 | | | | 3,962 | |
| | | | | |
Miscellaneous | | | 27,341 | | | | 5,133 | | | | 3,059 | | | | 55,697 | | | | 14,624 | |
| | | | | |
Total expenses before offsets | | | 2,877,219 | | | | 364,111 | | | | 214,198 | | | | 4,882,507 | | | | 1,805,612 | |
| | | | | |
Expense reimbursements | | | (90,822 | ) | | | (127,203 | ) | | | (100,391 | ) | | | (749,681 | ) | | | (221,214 | ) |
| | | | | |
Net expenses | | | 2,786,397 | | | | 236,908 | | | | 113,807 | | | | 4,132,826 | | | | 1,584,398 | |
| | | | | |
| | | | | | | | | | | | | | | | | | | | |
| | | | | |
Net investment income | | | 13,959,156 | | | | 1,330,094 | | | | 758,990 | | | | 22,827,789 | | | | 7,868,751 | |
| | | | | |
Net Realized and Unrealized Gain: | | | | | | | | | | | | | | | | | | | | |
| | | | | |
Net realized loss on investments | | | (19,675,989 | ) | | | (1,593,070 | ) | | | (225,634 | ) | | | (16,640,418 | ) | | | (10,403,174 | )1 |
| | | | | |
Net change in unrealized appreciation/depreciation on investments | | | 34,991,525 | | | | 2,720,322 | | | | 825,281 | | | | 53,394,216 | | | | 24,812,114 | |
| | | | | |
Net realized and unrealized gain | | | 15,315,536 | | | | 1,127,252 | | | | 599,647 | | | | 36,753,798 | | | | 14,408,940 | |
| | | | | |
| | | | | | | | | | | | | | | | | | | | |
| | | | | |
Net increase in net assets resulting from operations | | $ | 29,274,692 | | | $ | 2,457,346 | | | $ | 1,358,637 | | | $ | 59,581,587 | | | $ | 22,277,691 | |
1 Includes realized losses of $4,997,167 relating to redemptions in-kind. See note 1(g) of the Notes to Financial Statements.
The accompanying notes are an integral part of these financial statements.
50
| | |
| | | Statements of Changes in Net Assets For the fiscal years ended December 31, |
| | | |
| | | |
| | | | | | | | | | | | | | | | | | | | | | | | |
| | | AMG GW&K
ESG Bond Fund | | | AMG
GW&K Enhanced
Core Bond ESG Fund | | | AMG
GW&K High
Income Fund | |
| | | 2023 | | | 2022 | | | 2023 | | | 2022 | | | 2023 | | | 2022 | |
| | | | | | |
Increase (Decrease) in Net Assets Resulting From Operations: | | | | | | | | | | | | | | | | | | | | | | | | |
| | | | | | |
Net investment income | | | $13,959,156 | | | | $12,222,196 | | | | $1,330,094 | | | | $1,041,080 | | | | $758,990 | | | | $618,650 | |
| | | | | | |
Net realized loss on investments | | | (19,675,989 | ) | | | (19,299,747 | ) | | | (1,593,070 | ) | | | (2,654,300 | ) | | | (225,634 | ) | | | (1,149,384 | ) |
| | | | | | |
Net change in unrealized appreciation/depreciation on investments | | | 34,991,525 | | | | (84,052,548 | ) | | | 2,720,322 | | | | (5,951,857 | ) | | | 825,281 | | | | (961,928 | ) |
| | | | | | |
Net increase (decrease) in net assets resulting from operations | | | 29,274,692 | | | | (91,130,099 | ) | | | 2,457,346 | | | | (7,565,077 | ) | | | 1,358,637 | | | | (1,492,662 | ) |
| | | | | | |
Distributions to Shareholders: | | | | | | | | | | | | | | | | | | | | | | | | |
| | | | | | |
Class N | | | (8,492,938 | ) | | | (7,736,535 | ) | | | (347,751 | ) | | | (235,849 | ) | | | (325,482 | ) | | | (277,251 | ) |
| | | | | | |
Class I | | | (5,729,614 | ) | | | (5,885,301 | ) | | | (691,238 | ) | | | (537,618 | ) | | | (446,846 | ) | | | (410,014 | ) |
| | | | | | |
Class Z | | | — | | | | — | | | | (280,142 | ) | | | (268,295 | ) | | | — | | | | — | |
| | | | | | |
Total distributions to shareholders | | | (14,222,552 | ) | | | (13,621,836 | ) | | | (1,319,131 | ) | | | (1,041,762 | ) | | | (772,328 | ) | | | (687,265 | ) |
| | | | | | |
Capital Share Transactions:1 | | | | | | | | | | | | | | | | | | | | | | | | |
| | | | | | |
Net decrease from capital share transactions | | | (72,637,330 | ) | | | (157,179,741 | ) | | | (768,427 | ) | | | (11,796,222 | ) | | | (3,839,684 | ) | | | (1,875,236 | ) |
| | | | | | |
| | | | | | | | | | | | | | | | | | | | | | | | |
| | | | | | |
Total increase (decrease) in net assets | | | (57,585,190 | ) | | | (261,931,676 | ) | | | 369,788 | | | | (20,403,061 | ) | | | (3,253,375 | ) | | | (4,055,163 | ) |
| | | | | | |
Net Assets: | | | | | | | | | | | | | | | | | | | | | | | | |
| | | | | | |
Beginning of year | | | 493,006,646 | | | | 754,938,322 | | | | 40,446,873 | | | | 60,849,934 | | | | 17,268,549 | | | | 21,323,712 | |
| | | | | | |
End of year | | | $435,421,456 | | | | $493,006,646 | | | | $40,816,661 | | | | $40,446,873 | | | | $14,015,174 | | | | $17,268,549 | |
1 See Note 1(g) of the Notes to Financial Statements.
The accompanying notes are an integral part of these financial statements.
51
| | |
| | | Statements of Changes in Net Assets (continued) For the fiscal years ended December 31, |
| | | |
| | | |
| | | | | | | | | | | | | | | | |
| | | AMG
GW&K Municipal
Bond Fund | | | AMG
GW&K Municipal
Enhanced Yield Fund | |
| | | 2023 | | | 2022 | | | 2023 | | | 2022 | |
| | | | |
Increase (Decrease) in Net Assets Resulting From Operations: | | | | | | | | | | | | | | | | |
| | | | |
Net investment income | | | $22,827,789 | | | | $19,705,256 | | | | $7,868,751 | | | | $8,043,373 | |
| | | | |
Net realized loss on investments | | | (16,640,418 | ) | | | (10,312,359 | ) | | | (10,403,174 | ) | | | (10,807,395 | ) |
| | | | |
Net change in unrealized appreciation/depreciation on investments | | | 53,394,216 | | | | (113,439,737 | ) | | | 24,812,114 | | | | (60,592,633 | ) |
| | | | |
Net increase (decrease) in net assets resulting from operations | | | 59,581,587 | | | | (104,046,840 | ) | | | 22,277,691 | | | | (63,356,655 | ) |
| | | | |
Distributions to Shareholders: | | | | | | | | | | | | | | | | |
| | | | |
Class N | | | (240,964 | ) | | | (212,610 | ) | | | (109,195 | ) | | | (79,222 | ) |
| | | | |
Class I | | | (22,338,212 | ) | | | (21,345,146 | ) | | | (7,709,369 | ) | | | (8,871,256 | ) |
| | | | |
Class Z | | | — | | | | — | | | | (3,806 | ) | | | (3,685 | ) |
| | | | |
Total distributions to shareholders | | | (22,579,176 | ) | | | (21,557,756 | ) | | | (7,822,370 | ) | | | (8,954,163 | ) |
| | | | |
Capital Share Transactions:1 | | | | | | | | | | | | | | | | |
| | | | |
Net decrease from capital share transactions | | | (89,576,367 | ) | | | (142,203,031 | ) | | | (62,041,101 | ) | | | (53,225,598 | ) |
| | | | |
| | | | | | | | | | | | | | | | |
| | | | |
Total decrease in net assets | | | (52,573,956 | ) | | | (267,807,627 | ) | | | (47,585,780 | ) | | | (125,536,416 | ) |
| | | | |
Net Assets: | | | | | | | | | | | | | | | | |
| | | | |
Beginning of year | | | 1,081,262,512 | | | | 1,349,070,139 | | | | 258,994,046 | | | | 384,530,462 | |
| | | | |
End of year | | | $1,028,688,556 | | | | $1,081,262,512 | | | | $211,408,266 | | | | $258,994,046 | |
1 See Note 1(g) of the Notes to Financial Statements.
The accompanying notes are an integral part of these financial statements.
52
| | |
| | | AMG GW&K ESG Bond Fund Financial Highlights For a share outstanding throughout each fiscal year |
| | | |
| | | |
| | | | | | | | | | | | | | | | | | | | |
| | | For the fiscal years ended December 31, |
| | | | | |
| Class N | | 2023 | | 2022 | | 2021 | | 2020 | | 2019 |
| | | | | |
Net Asset Value, Beginning of Year | | | $21.11 | | | | $24.88 | | | | $28.12 | | | | $27.14 | | | | $25.49 | |
| | | | | |
Income (loss) from Investment Operations: | �� | | | | | | | | | | | | | | | | | | | |
| | | | | |
Net investment income1,2 | | | 0.63 | | | | 0.44 | | | | 0.44 | | | | 0.90 | | | | 0.94 | |
| | | | | |
Net realized and unrealized gain (loss) on investments | | | 0.75 | | | | (3.70 | ) | | | (0.83 | ) | | | 1.03 | | | | 1.85 | |
| | | | | |
Total income (loss) from investment operations | | | 1.38 | | | | (3.26 | ) | | | (0.39 | ) | | | 1.93 | | | | 2.79 | |
| | | | | |
Less Distributions to Shareholders from: | | | | | | | | | | | | | | | | | | | | |
| | | | | |
Net investment income | | | (0.64 | ) | | | (0.47 | ) | | | (0.47 | ) | | | (0.88 | ) | | | (0.98 | ) |
| | | | | |
Net realized gain on investments | | | — | | | | (0.04 | ) | | | (2.38 | ) | | | (0.07 | ) | | | (0.16 | ) |
| | | | | |
Total distributions to shareholders | | | (0.64 | ) | | | (0.51 | ) | | | (2.85 | ) | | | (0.95 | ) | | | (1.14 | ) |
| | | | | |
Net Asset Value, End of Year | | | $21.85 | | | | $21.11 | | | | $24.88 | | | | $28.12 | | | | $27.14 | |
| | | | | |
Total Return2,3 | | | 6.69 | % | | | (13.17 | )% | | | (1.29 | )% | | | 7.34 | % | | | 11.10 | % |
| | | | | |
Ratio of net expenses to average net assets | | | 0.68 | % | | | 0.68 | % | | | 0.69 | %4 | | | 0.71 | % | | | 0.72 | %5 |
| | | | | |
Ratio of gross expenses to average net assets6 | | | 0.70 | % | | | 0.69 | % | | | 0.69 | %4 | | | 0.72 | % | | | 0.73 | %5 |
| | | | | |
Ratio of net investment income to average net assets2 | | | 2.94 | % | | | 1.98 | % | | | 1.71 | % | | | 3.31 | % | | | 3.53 | % |
| | | | | |
Portfolio turnover | | | 27 | % | | | 23 | % | | | 186 | % | | | 25 | % | | | 20 | % |
| | | | | |
Net assets end of year (000’s) omitted | | | $269,529 | | | | $301,028 | | | | $427,818 | | | | $555,124 | | | | $618,381 | |
| | |
53
| | |
| | | AMG GW&K ESG Bond Fund Financial Highlights For a share outstanding throughout each fiscal year |
| | | |
| | | |
| | | | | | | | | | | | | | | | | | | | |
| | | For the fiscal years ended December 31, |
| | | | | |
| Class I | | 2023 | | 2022 | | 2021 | | 2020 | | 2019 |
| | | | | |
Net Asset Value, Beginning of Year | | | $21.12 | | | | $24.89 | | | | $28.13 | | | | $27.14 | | | | $25.49 | |
| | | | | |
Income (loss) from Investment Operations: | | | | | | | | | | | | | | | | | | | | |
| | | | | |
Net investment income1,2 | | | 0.67 | | | | 0.49 | | | | 0.50 | | | | 0.95 | | | | 0.99 | |
| | | | | |
Net realized and unrealized gain (loss) on investments | | | 0.75 | | | | (3.71 | ) | | | (0.83 | ) | | | 1.05 | | | | 1.85 | |
| | | | | |
Total income (loss) from investment operations | | | 1.42 | | | | (3.22 | ) | | | (0.33 | ) | | | 2.00 | | | | 2.84 | |
| | | | | |
Less Distributions to Shareholders from: | | | | | | | | | | | | | | | | | | | | |
| | | | | |
Net investment income | | | (0.69 | ) | | | (0.51 | ) | | | (0.53 | ) | | | (0.94 | ) | | | (1.03 | ) |
| | | | | |
Net realized gain on investments | | | — | | | | (0.04 | ) | | | (2.38 | ) | | | (0.07 | ) | | | (0.16 | ) |
| | | | | |
Total distributions to shareholders | | | (0.69 | ) | | | (0.55 | ) | | | (2.91 | ) | | | (1.01 | ) | | | (1.19 | ) |
| | | | | |
Net Asset Value, End of Year | | | $21.85 | | | | $21.12 | | | | $24.89 | | | | $28.13 | | | | $27.14 | |
| | | | | |
Total Return2,3 | | | 6.85 | % | | | (12.99 | )% | | | (1.05 | )% | | | 7.57 | % | | | 11.32 | % |
| | | | | |
Ratio of net expenses to average net assets | | | 0.48 | % | | | 0.48 | % | | | 0.49 | %4 | | | 0.50 | % | | | 0.52 | %5 |
| | | | | |
Ratio of gross expenses to average net assets6 | | | 0.50 | % | | | 0.49 | % | | | 0.49 | %4 | | | 0.51 | % | | | 0.53 | %5 |
| | | | | |
Ratio of net investment income to average net assets2 | | | 3.14 | % | | | 2.18 | % | | | 1.91 | % | | | 3.52 | % | | | 3.73 | % |
| | | | | |
Portfolio turnover | | | 27 | % | | | 23 | % | | | 186 | % | | | 25 | % | | | 20 | % |
| | | | | |
Net assets end of year (000’s) omitted | | | $165,892 | | | | $191,979 | | | | $327,121 | | | | $546,698 | | | | $605,353 | |
| | |
| 1 | Per share numbers have been calculated using average shares. |
| 2 | Total returns and net investment income would have been lower had certain expenses not been offset. |
| 3 | The total return is calculated using the published Net Asset Value as of fiscal year end. |
| 4 | Ratio includes recapture of reimbursed fees from prior years amounting to less than 0.01% for the fiscal year ended December 31, 2021. |
| 5 | Includes 0.01% of extraordinary expense related to legal expense in support of an investment held in the portfolio. |
| 6 | Excludes the impact of expense reimbursement or fee waivers and expense reductions such as brokerage credits, but includes expense repayments and non-reimbursable expenses, if any, such as interest, taxes, and extraordinary expenses. (See Note 1(c) and 2 in the Notes to Financial Statements.) |
54
| | |
| | | AMG GW&K Enhanced Core Bond ESG Fund Financial Highlights For a share outstanding throughout each fiscal year |
| | | |
| | | |
| | | | | | | | | | | | | | | | | | | | |
| | | For the fiscal years ended December 31, |
| | | | | |
| Class N | | 2023 | | 2022 | | 2021 | | 2020 | | 2019 |
| | | | | |
Net Asset Value, Beginning of Year | | | $8.92 | | | | $10.61 | | | | $10.90 | | | | $10.15 | | | | $9.43 | |
| | | | | |
Income (loss) from Investment Operations: | | | | | | | | | | | | | | | | | | | | |
| | | | | |
Net investment income1,2 | | | 0.29 | | | | 0.19 | | | | 0.14 | | | | 0.20 | | | | 0.24 | |
| | | | | |
Net realized and unrealized gain (loss) on investments | | | 0.22 | | | | (1.69 | ) | | | (0.28 | ) | | | 0.75 | | | | 0.73 | |
| | | | | |
Total income (loss) from investment operations | | | 0.51 | | | | (1.50 | ) | | | (0.14 | ) | | | 0.95 | | | | 0.97 | |
| | | | | |
Less Distributions to Shareholders from: | | | | | | | | | | | | | | | | | | | | |
| | | | | |
Net investment income | | | (0.28 | ) | | | (0.19 | ) | | | (0.14 | ) | | | (0.20 | ) | | | (0.25 | ) |
| | | | | |
Paid in capital | | | — | | | | — | | | | (0.01 | ) | | | — | | | | — | |
| | | | | |
Total distributions to shareholders | | | (0.28 | ) | | | (0.19 | ) | | | (0.15 | ) | | | (0.20 | ) | | | (0.25 | ) |
| | | | | |
Net Asset Value, End of Year | | | $9.15 | | | | $8.92 | | | | $10.61 | | | | $10.90 | | | | $10.15 | |
| | | | | |
Total Return2,3 | | | 5.89 | % | | | (14.17 | )% | | | (1.26 | )% | | | 9.41 | % | | | 10.35 | % |
| | | | | |
Ratio of net expenses to average net assets | | | 0.73 | % | | | 0.73 | % | | | 0.73 | % | | | 0.73 | % | | | 0.73 | % |
| | | | | |
Ratio of gross expenses to average net assets4 | | | 1.05 | % | | | 1.00 | % | | | 0.93 | % | | | 1.06 | % | | | 1.16 | % |
| | | | | |
Ratio of net investment income to average net assets2 | | | 3.20 | % | | | 1.99 | % | | | 1.32 | % | | | 1.86 | % | | | 2.43 | % |
| | | | | |
Portfolio turnover | | | 51 | % | | | 54 | % | | | 86 | % | | | 101 | % | | | 71 | % |
| | | | | |
Net assets end of year (000’s) omitted | | | $11,370 | | | | $10,680 | | | | $13,736 | | | | $15,794 | | | | $14,779 | |
| | |
55
| | |
| | | AMG GW&K Enhanced Core Bond ESG Fund Financial Highlights For a share outstanding throughout each fiscal year |
| | | |
| | | |
| | | | | | | | | | | | | | | | | | | | |
| | | For the fiscal years ended December 31, |
| | | | | |
| Class I | | 2023 | | 2022 | | 2021 | | 2020 | | 2019 |
| | | | | |
Net Asset Value, Beginning of Year | | | $8.95 | | | | $10.65 | | | | $10.94 | | | | $10.19 | | | | $9.47 | |
| | | | | |
Income (loss) from Investment Operations: | | | | | | | | | | | | | | | | | | | | |
| | | | | |
Net investment income1,2 | | | 0.30 | | | | 0.21 | | | | 0.16 | | | | 0.22 | | | | 0.26 | |
| | | | | |
Net realized and unrealized gain (loss) on investments | | | 0.23 | | | | (1.70 | ) | | | (0.28 | ) | | | 0.75 | | | | 0.73 | |
| | | | | |
Total income (loss) from investment operations | | | 0.53 | | | | (1.49 | ) | | | (0.12 | ) | | | 0.97 | | | | 0.99 | |
| | | | | |
Less Distributions to Shareholders from: | | | | | | | | | | | | | | | | | | | | |
| | | | | |
Net investment income | | | (0.30 | ) | | | (0.21 | ) | | | (0.16 | ) | | | (0.22 | ) | | | (0.27 | ) |
| | | | | |
Paid in capital | | | — | | | | — | | | | (0.01 | ) | | | — | | | | — | |
| | | | | |
Total distributions to shareholders | | | (0.30 | ) | | | (0.21 | ) | | | (0.17 | ) | | | (0.22 | ) | | | (0.27 | ) |
| | | | | |
Net Asset Value, End of Year | | | $9.18 | | | | $8.95 | | | | $10.65 | | | | $10.94 | | | | $10.19 | |
| | | | | |
Total Return2,3 | | | 6.05 | % | | | (14.07 | )% | | | (1.07 | )% | | | 9.57 | % | | | 10.51 | % |
| | | | | |
Ratio of net expenses to average net assets | | | 0.56 | % | | | 0.56 | % | | | 0.56 | % | | | 0.55 | % | | | 0.55 | % |
| | | | | |
Ratio of gross expenses to average net assets4 | | | 0.88 | % | | | 0.83 | % | | | 0.76 | % | | | 0.88 | % | | | 0.98 | % |
| | | | | |
Ratio of net investment income to average net assets2 | | | 3.37 | % | | | 2.16 | % | | | 1.49 | % | | | 2.04 | % | | | 2.62 | % |
| | | | | |
Portfolio turnover | | | 51 | % | | | 54 | % | | | 86 | % | | | 101 | % | | | 71 | % |
| | | | | |
Net assets end of year (000’s) omitted | | | $21,805 | | | | $19,890 | | | | $33,402 | | | | $27,800 | | | | $8,502 | |
| | |
56
| | |
| | | AMG GW&K Enhanced Core Bond ESG Fund Financial Highlights For a share outstanding throughout each fiscal year |
| | | |
| | | |
| | | | | | | | | | | | | | | | | | | | |
| | | For the fiscal years ended December 31, |
| | | | | |
| Class Z | | 2023 | | 2022 | | 2021 | | 2020 | | 2019 |
| | | | | |
Net Asset Value, Beginning of Year | | | $8.95 | | | | $10.65 | | | | $10.93 | | | | $10.18 | | | | $9.46 | |
| | | | | |
Income (loss) from Investment Operations: | | | | | | | | | | | | | | | | | | | | |
| | | | | |
Net investment income1,2 | | | 0.31 | | | | 0.21 | | | | 0.17 | | | | 0.22 | | | | 0.27 | |
| | | | | |
Net realized and unrealized gain (loss) on investments | | | 0.23 | | | | (1.69 | ) | | | (0.27 | ) | | | 0.75 | | | | 0.72 | |
| | | | | |
Total income (loss) from investment operations | | | 0.54 | | | | (1.48 | ) | | | (0.10 | ) | | | 0.97 | | | | 0.99 | |
| | | | | |
Less Distributions to Shareholders from: | | | | | | | | | | | | | | | | | | | | |
| | | | | |
Net investment income | | | (0.31 | ) | | | (0.22 | ) | | | (0.17 | ) | | | (0.22 | ) | | | (0.27 | ) |
| | | | | |
Paid in capital | | | — | | | | — | | | | (0.01 | ) | | | — | | | | — | |
| | | | | |
Total distributions to shareholders | | | (0.31 | ) | | | (0.22 | ) | | | (0.18 | ) | | | (0.22 | ) | | | (0.27 | ) |
| | | | | |
Net Asset Value, End of Year | | | $9.18 | | | | $8.95 | | | | $10.65 | | | | $10.93 | | | | $10.18 | |
| | | | | |
Total Return2,3 | | | 6.13 | % | | | (14.00 | )% | | | (0.92 | )% | | | 9.65 | % | | | 10.59 | % |
| | | | | |
Ratio of net expenses to average net assets | | | 0.48 | % | | | 0.48 | % | | | 0.48 | % | | | 0.48 | % | | | 0.48 | % |
| | | | | |
Ratio of gross expenses to average net assets4 | | | 0.80 | % | | | 0.75 | % | | | 0.68 | % | | | 0.81 | % | | | 0.91 | % |
| | | | | |
Ratio of net investment income to average net assets2 | | | 3.45 | % | | | 2.24 | % | | | 1.57 | % | | | 2.11 | % | | | 2.72 | % |
| | | | | |
Portfolio turnover | | | 51 | % | | | 54 | % | | | 86 | % | | | 101 | % | | | 71 | % |
| | | | | |
Net assets end of year (000’s) omitted | | | $7,641 | | | | $9,877 | | | | $13,712 | | | | $11,552 | | | | $10,080 | |
| | |
| 1 | Per share numbers have been calculated using average shares. |
| 2 | Total returns and net investment income would have been lower had certain expenses not been offset. |
| 3 | The total return is calculated using the published Net Asset Value as of fiscal year end. |
| 4 | Excludes the impact of expense reimbursement or fee waivers and expense reductions such as brokerage credits, but includes expense repayments and non-reimbursable expenses, if any, such as interest, taxes, and extraordinary expenses. (See Note 1(c) and 2 in the Notes to Financial Statements.) |
57
| | |
| | | AMG GW&K High Income Fund Financial Highlights For a share outstanding throughout each fiscal year |
| | | |
| | | |
| | | | | | | | | | | | | | | | | | | | |
| | | For the fiscal years ended December 31, |
| | | | | |
| Class N | | 2023 | | 2022 | | 2021 | | 2020 | | 2019 |
| | | | | |
Net Asset Value, Beginning of Year | | | $20.11 | | | | $22.46 | | | | $22.23 | | | | $21.52 | | | | $20.04 | |
| | | | | |
Income (loss) from Investment Operations: | | | | | | | | | | | | | | | | | | | | |
| | | | | |
Net investment income1,2 | | | 0.96 | | | | 0.67 | | | | 0.53 | | | | 0.51 | | | | 0.57 | |
| | | | | |
Net realized and unrealized gain (loss) on investments | | | 0.83 | | | | (2.20 | ) | | | 0.28 | | | | 2.09 | | | | 0.98 | |
| | | | | |
Total income (loss) from investment operations | | | 1.79 | | | | (1.53 | ) | | | 0.81 | | | | 2.60 | | | | 1.55 | |
| | | | | |
Less Distributions to Shareholders from: | | | | | | | | | | | | | | | | | | | | |
| | | | | |
Net investment income | | | (0.99 | ) | | | (0.77 | ) | | | (0.53 | ) | | | (0.48 | ) | | | (0.07 | ) |
| | | | | |
Net realized gain on investments | | | — | | | | (0.05 | ) | | | (0.05 | ) | | | (1.41 | ) | | | — | |
| | | | | |
Total distributions to shareholders | | | (0.99 | ) | | | (0.82 | ) | | | (0.58 | ) | | | (1.89 | ) | | | (0.07 | ) |
| | | | | |
Net Asset Value, End of Year | | | $20.91 | | | | $20.11 | | | | $22.46 | | | | $22.23 | | | | $21.52 | |
| | | | | |
Total Return2,3 | | | 9.13 | % | | | (6.80 | )% | | | 3.67 | % | | | 12.16 | % | | | 7.67 | % |
| | | | | |
Ratio of net expenses to average net assets | | | 0.84 | % | | | 0.86 | %4 | | | 0.84 | % | | | 0.89 | % | | | 0.89 | % |
| | | | | |
Ratio of gross expenses to average net assets5 | | | 1.48 | % | | | 1.32 | % | | | 1.37 | % | | | 1.70 | % | | | 1.87 | % |
| | | | | |
Ratio of net investment income to average net assets2 | | | 4.72 | % | | | 3.22 | % | | | 2.36 | % | | | 2.28 | % | | | 2.70 | % |
| | | | | |
Portfolio turnover | | | 25 | % | | | 74 | % | | | 97 | % | | | 157 | % | | | 52 | % |
| | | | | |
Net assets end of year (000’s) omitted | | | $7,061 | | | | $6,528 | | | | $8,157 | | | | $10,302 | | | | $9,638 | |
| | |
58
| | |
| | | AMG GW&K High Income Fund Financial Highlights For a share outstanding throughout each fiscal period |
| | | |
| | | |
| | | | | | |
| | | For the fiscal years ended December 31, | | For the fiscal
period ended
December 31, |
| | | |
| Class I | | 2023 | | 2022 | | 20216 |
| | | |
Net Asset Value, Beginning of Period | | $20.10 | | $22.45 | | $22.27 |
| | | |
Income (loss) from Investment Operations: | | | | | | |
| | | |
Net investment income1,2 | | 1.00 | | 0.71 | | 0.46 |
| | | |
Net realized and unrealized gain (loss) on investments | | 0.83 | | (2.20) | | 0.35 |
| | | |
Total income (loss) from investment operations | | 1.83 | | (1.49) | | 0.81 |
| | | |
Less Distributions to Shareholders from: | | | | | | |
| | | |
Net investment income | | (1.03) | | (0.81) | | (0.58) |
| | | |
Net realized gain on investments | | — | | (0.05) | | (0.05) |
| | | |
Total distributions to shareholders | | (1.03) | | (0.86) | | (0.63) |
| | | |
Net Asset Value, End of Period | | $20.90 | | $20.10 | | $22.45 |
| | | |
Total Return2,3 | | 9.35% | | (6.63)% | | 3.68%7 |
| | | |
Ratio of net expenses to average net assets | | 0.64% | | 0.66%4 | | 0.64%8 |
| | | |
Ratio of gross expenses to average net assets5 | | 1.28% | | 1.12% | | 1.17%8 |
| | | |
Ratio of net investment income to average net assets2 | | 4.92% | | 3.42% | | 2.56%8 |
| | | |
Portfolio turnover | | 25% | | 74% | | 97% |
| | | |
Net assets end of period (000’s) omitted | | $6,954 | | $10,740 | | $13,166 |
| | | | | | | |
| 1 | Per share numbers have been calculated using average shares. |
| 2 | Total returns and net investment income would have been lower had certain expenses not been offset. |
| 3 | The total return is calculated using the published Net Asset Value as of fiscal year end. |
| 4 | Includes interest expense totaling 0.02% related to participation in the interfund lending program. |
| 5 | Excludes the impact of expense reimbursement or fee waivers and expense reductions such as brokerage credits, but includes expense repayments and non-reimbursable expenses, if any, such as interest, taxes, and extraordinary expenses. (See Note 1(c) and 2 in the Notes to Financial Statements.) |
| 6 | Commencement of operations was on March 15, 2021. |
59
| | |
| | | AMG GW&K Municipal Bond Fund Financial Highlights For a share outstanding throughout each fiscal year |
| | | |
| | | |
| | | | | | | | | | | | | | | | | | | | |
| | | For the fiscal years ended December 31, |
| | | | | |
| Class N | | 2023 | | 2022 | | 2021 | | 2020 | | 2019 |
| | | | | |
Net Asset Value, Beginning of Year | | | $11.11 | | | | $12.24 | | | | $12.45 | | | | $12.12 | | | | $11.48 | |
| | | | | |
Income (loss) from Investment Operations: | | | | | | | | | | | | | | | | | | | | |
| | | | | |
Net investment income1,2 | | | 0.21 | | | | 0.15 | | | | 0.13 | | | | 0.15 | | | | 0.19 | |
| | | | | |
Net realized and unrealized gain (loss) on investments | | | 0.42 | | | | (1.10 | ) | | | (0.11 | ) | | | 0.33 | | | | 0.64 | |
| | | | | |
Total income (loss) from investment operations | | | 0.63 | | | | (0.95 | ) | | | 0.02 | | | | 0.48 | | | | 0.83 | |
| | | | | |
Less Distributions to Shareholders from: | | | | | | | | | | | | | | | | | | | | |
| | | | | |
Net investment income | | | (0.21 | ) | | | (0.16 | ) | | | (0.13 | ) | | | (0.15 | ) | | | (0.19 | ) |
| | | | | |
Net realized gain on investments | | | — | | | | (0.02 | ) | | | (0.10 | ) | | | — | | | | — | |
| | | | | |
Total distributions to shareholders | | | (0.21 | ) | | | (0.18 | ) | | | (0.23 | ) | | | (0.15 | ) | | | (0.19 | ) |
| | | | | |
Net Asset Value, End of Year | | | $11.53 | | | | $11.11 | | | | $12.24 | | | | $12.45 | | | | $12.12 | |
| | | | | |
Total Return2,3 | | | 5.72 | % | | | (7.80 | )% | | | 0.10 | % | | | 4.31 | % | | | 7.29 | % |
| | | | | |
Ratio of net expenses to average net assets | | | 0.72 | % | | | 0.72 | % | | | 0.71 | % | | | 0.71 | % | | | 0.71 | % |
| | | | | |
Ratio of gross expenses to average net assets4 | | | 0.79 | % | | | 0.78 | % | | | 0.76 | % | | | 0.77 | % | | | 0.78 | % |
| | | | | |
Ratio of net investment income to average net assets2 | | | 1.85 | % | | | 1.35 | % | | | 1.01 | % | | | 1.25 | % | | | 1.59 | % |
| | | | | |
Portfolio turnover | | | 29 | % | | | 20 | % | | | 24 | % | | | 17 | % | | | 18 | % |
| | | | | |
Net assets end of year (000’s) omitted | | | $12,081 | | | | $12,972 | | | | $17,112 | | | | $18,153 | | | | $18,711 | |
| | | | | | | | | | | |
60
| | |
| | | AMG GW&K Municipal Bond Fund Financial Highlights For a share outstanding throughout each fiscal year |
| | | |
| | | |
| | | | | | | | | | | | | | | | | | | | |
| | | For the fiscal years ended December 31, |
| | | | | |
| Class I | | 2023 | | 2022 | | 2021 | | 2020 | | 2019 |
| | | | | |
Net Asset Value, Beginning of Year | | | $11.18 | | | | $12.31 | | | | $12.52 | | | | $12.18 | | | | $11.54 | |
| | | | | |
Income (loss) from Investment Operations: | | | | | | | | | | | | | | | | | | | | |
| | | | | |
Net investment income1,2 | | | 0.25 | | | | 0.19 | | | | 0.17 | | | | 0.19 | | | | 0.23 | |
| | | | | |
Net realized and unrealized gain (loss) on investments | | | 0.41 | | | | (1.11 | ) | | | (0.11 | ) | | | 0.34 | | | | 0.64 | |
| | | | | |
Total income (loss) from investment operations | | | 0.66 | | | | (0.92 | ) | | | 0.06 | | | | 0.53 | | | | 0.87 | |
| | | | | |
Less Distributions to Shareholders from: | | | | | | | | | | | | | | | | | | | | |
| | | | | |
Net investment income | | | (0.24 | ) | | | (0.19 | ) | | | (0.17 | ) | | | (0.19 | ) | | | (0.23 | ) |
| | | | | |
Net realized gain on investments | | | — | | | | (0.02 | ) | | | (0.10 | ) | | | — | | | | — | |
| | | | | |
Total distributions to shareholders | | | (0.24 | ) | | | (0.21 | ) | | | (0.27 | ) | | | (0.19 | ) | | | (0.23 | ) |
| | | | | |
Net Asset Value, End of Year | | | $11.60 | | | | $11.18 | | | | $12.31 | | | | $12.52 | | | | $12.18 | |
| | | | | |
Total Return2,3 | | | 6.04 | % | | | (7.45 | )% | | | 0.43 | % | | | 4.70 | % | | | 7.58 | % |
| | | | | |
Ratio of net expenses to average net assets | | | 0.39 | % | | | 0.39 | % | | | 0.39 | % | | | 0.39 | % | | | 0.39 | % |
| | | | | |
Ratio of gross expenses to average net assets4 | | | 0.46 | % | | | 0.45 | % | | | 0.44 | % | | | 0.45 | % | | | 0.46 | % |
| | | | | |
Ratio of net investment income to average net assets2 | | | 2.18 | % | | | 1.68 | % | | | 1.33 | % | | | 1.57 | % | | | 1.91 | % |
| | | | | |
Portfolio turnover | | | 29 | % | | | 20 | % | | | 24 | % | | | 17 | % | | | 18 | % |
| | | | | |
Net assets end of year (000’s) omitted | | | $1,016,607 | | | | $1,068,290 | | | | $1,331,958 | | | | $1,287,667 | | | | $1,014,514 | |
| | |
| 1 | Per share numbers have been calculated using average shares. |
| 2 | Total returns and net investment income would have been lower had certain expenses not been offset. |
| 3 | The total return is calculated using the published Net Asset Value as of fiscal year end. |
| 4 | Excludes the impact of expense reimbursement or fee waivers and expense reductions such as brokerage credits, but includes expense repayments and non-reimbursable expenses, if any, such as interest, taxes, and extraordinary expenses. (See Note 1(c) and 2 in the Notes to Financial Statements.) |
61
| | |
| | | AMG GW&K Municipal Enhanced Yield Fund Financial Highlights For a share outstanding throughout each fiscal year |
| | | |
| | | |
| | | | | | | | | | | | | | | | | | | | |
| | | For the fiscal years ended December 31, |
| | | | | |
| Class N | | 2023 | | 2022 | | 2021 | | 2020 | | 2019 |
| | | | | |
Net Asset Value, Beginning of Year | | | $8.56 | | | | $10.74 | | | | $10.69 | | | | $10.42 | | | | $9.69 | |
| | | | | |
Income (loss) from Investment Operations: | | | | | | | | | | | | | | | | | | | | |
| | | | | |
Net investment income1,2 | | | 0.25 | | | | 0.22 | | | | 0.20 | | | | 0.23 | | | | 0.26 | |
| | | | | |
Net realized and unrealized gain (loss) on investments | | | 0.64 | | | | (2.17 | ) | | | 0.18 | | | | 0.37 | | | | 0.78 | |
| | | | | |
Total income (loss) from investment operations | | | 0.89 | | | | (1.95 | ) | | | 0.38 | | | | 0.60 | | | | 1.04 | |
| | | | | |
Less Distributions to Shareholders from: | | | | | | | | | | | | | | | | | | | | |
| | | | | |
Net investment income | | | (0.25 | ) | | | (0.20 | ) | | | (0.19 | ) | | | (0.21 | ) | | | (0.25 | ) |
| | | | | |
Net realized gain on investments | | | — | | | | (0.03 | ) | | | (0.14 | ) | | | (0.12 | ) | | | (0.06 | ) |
| | | | | |
Total distributions to shareholders | | | (0.25 | ) | | | (0.23 | ) | | | (0.33 | ) | | | (0.33 | ) | | | (0.31 | ) |
| | | | | |
Net Asset Value, End of Year | | | $9.20 | | | | $8.56 | | | | $10.74 | | | | $10.69 | | | | $10.42 | |
| | | | | |
Total Return2,3 | | | 10.53 | % | | | (18.19 | )% | | | 3.59 | % | | | 5.95 | % | | | 10.92 | % |
| | | | | |
Ratio of net expenses to average net assets | | | 0.99 | % | | | 0.99 | % | | | 0.99 | % | | | 0.99 | % | | | 0.99 | % |
| | | | | |
Ratio of gross expenses to average net assets4 | | | 1.08 | % | | | 1.07 | % | | | 1.05 | % | | | 1.07 | % | | | 1.08 | % |
| | | | | |
Ratio of net investment income to average net assets2 | | | 2.87 | % | | | 2.39 | % | | | 1.85 | % | | | 2.17 | % | | | 2.56 | % |
| | | | | |
Portfolio turnover | | | 24 | % | | | 45 | % | | | 61 | % | | | 81 | % | | | 40 | % |
| | | | | |
Net assets end of year (000’s) omitted | | | $5,964 | | | | $2,955 | | | | $14,923 | | | | $5,015 | | | | $5,722 | |
| | |
62
| | |
| | | AMG GW&K Municipal Enhanced Yield Fund Financial Highlights For a share outstanding throughout each fiscal year |
| | | |
| | | |
| | | | | | | | | | | | | | | | | | | | |
| | | For the fiscal years ended December 31, |
| | | | | |
| Class I | | 2023 | | 2022 | | 2021 | | 2020 | | 2019 |
| | | | | |
Net Asset Value, Beginning of Year | | | $8.30 | | | | $10.43 | | | | $10.40 | | | | $10.15 | | | | $9.45 | |
| | | | | |
Income (loss) from Investment Operations: | | | | | | | | | | | | | | | | | | | | |
| | | | | |
Net investment income1,2 | | | 0.27 | | | | 0.24 | | | | 0.23 | | | | 0.25 | | | | 0.29 | |
| | | | | |
Net realized and unrealized gain (loss) on investments | | | 0.62 | | | | (2.09 | ) | | | 0.17 | | | | 0.37 | | | | 0.76 | |
| | | | | |
Total income (loss) from investment operations | | | 0.89 | | | | (1.85 | ) | | | 0.40 | | | | 0.62 | | | | 1.05 | |
| | | | | |
Less Distributions to Shareholders from: | | | | | | | | | | | | | | | | | | | | |
| | | | | |
Net investment income | | | (0.28 | ) | | | (0.25 | ) | | | (0.23 | ) | | | (0.25 | ) | | | (0.29 | ) |
| | | | | |
Net realized gain on investments | | | — | | | | (0.03 | ) | | | (0.14 | ) | | | (0.12 | ) | | | (0.06 | ) |
| | | | | |
Total distributions to shareholders | | | (0.28 | ) | | | (0.28 | ) | | | (0.37 | ) | | | (0.37 | ) | | | (0.35 | ) |
| | | | | |
Net Asset Value, End of Year | | | $8.91 | | | | $8.30 | | | | $10.43 | | | | $10.40 | | | | $10.15 | |
| | | | | |
Total Return2,3 | | | 10.89 | % | | | (17.86 | )% | | | 3.94 | % | | | 6.31 | % | | | 11.28 | % |
| | | | | |
Ratio of net expenses to average net assets | | | 0.64 | % | | | 0.64 | % | | | 0.64 | % | | | 0.64 | % | | | 0.64 | % |
| | | | | |
Ratio of gross expenses to average net assets4 | | | 0.73 | % | | | 0.72 | % | | | 0.70 | % | | | 0.72 | % | | | 0.73 | % |
| | | | | |
Ratio of net investment income to average net assets2 | | | 3.22 | % | | | 2.74 | % | | | 2.20 | % | | | 2.52 | % | | | 2.91 | % |
| | | | | |
Portfolio turnover | | | 24 | % | | | 45 | % | | | 61 | % | | | 81 | % | | | 40 | % |
| | | | | |
Net assets end of year (000’s) omitted | | | $205,322 | | | | $255,928 | | | | $369,473 | | | | $323,439 | | | | $273,228 | |
| | |
63
| | |
| | | AMG GW&K Municipal Enhanced Yield Fund Financial Highlights For a share outstanding throughout each fiscal year |
| | | |
| | | |
| | | | | | | | | | | | | | | | | | | | |
| | | For the fiscal years ended December 31, |
| | | | | |
| Class Z | | 2023 | | 2022 | | 2021 | | 2020 | | 2019 |
| | | | | |
Net Asset Value, Beginning of Year | | | $8.30 | | | | $10.43 | | | | $10.40 | | | | $10.15 | | | | $9.44 | |
| | | | | |
Income (loss) from Investment Operations: | | | | | | | | | | | | | | | | | | | | |
| | | | | |
Net investment income1,2 | | | 0.28 | | | | 0.25 | | | | 0.24 | | | | 0.26 | | | | 0.30 | |
| | | | | |
Net realized and unrealized gain (loss) on investments | | | 0.61 | | | | (2.10 | ) | | | 0.17 | | | | 0.37 | | | | 0.76 | |
| | | | | |
Total income (loss) from investment operations | | | 0.89 | | | | (1.85 | ) | | | 0.41 | | | | 0.63 | | | | 1.06 | |
| | | | | |
Less Distributions to Shareholders from: | | | | | | | | | | | | | | | | | | | | |
| | | | | |
Net investment income | | | (0.28 | ) | | | (0.25 | ) | | | (0.24 | ) | | | (0.26 | ) | | | (0.29 | ) |
| | | | | |
Net realized gain on investments | | | — | | | | (0.03 | ) | | | (0.14 | ) | | | (0.12 | ) | | | (0.06 | ) |
| | | | | |
Total distributions to shareholders | | | (0.28 | ) | | | (0.28 | ) | | | (0.38 | ) | | | (0.38 | ) | | | (0.35 | ) |
| | | | | |
Net Asset Value, End of Year | | | $8.91 | | | | $8.30 | | | | $10.43 | | | | $10.40 | | | | $10.15 | |
| | | | | |
Total Return2,3 | | | 10.95 | % | | | (17.82 | )% | | | 3.99 | % | | | 6.37 | % | | | 11.45 | % |
| | | | | |
Ratio of net expenses to average net assets | | | 0.59 | % | | | 0.59 | % | | | 0.59 | % | | | 0.59 | % | | | 0.59 | % |
| | | | | |
Ratio of gross expenses to average net assets4 | | | 0.68 | % | | | 0.67 | % | | | 0.65 | % | | | 0.67 | % | | | 0.68 | % |
| | | | | |
Ratio of net investment income to average net assets2 | | | 3.27 | % | | | 2.79 | % | | | 2.25 | % | | | 2.57 | % | | | 2.96 | % |
| | | | | |
Portfolio turnover | | | 24 | % | | | 45 | % | | | 61 | % | | | 81 | % | | | 40 | % |
| | | | | |
Net assets end of year (000’s) omitted | | | $123 | | | | $111 | | | | $135 | | | | $130 | | | | $120 | |
| | |
| 1 | Per share numbers have been calculated using average shares. |
| 2 | Total returns and net investment income would have been lower had certain expenses not been offset. |
| 3 | The total return is calculated using the published Net Asset Value as of fiscal year end. |
| 4 | Excludes the impact of expense reimbursement or fee waivers and expense reductions such as brokerage credits, but includes expense repayments and non-reimbursable expenses, if any, such as interest, taxes, and extraordinary expenses. (See Note 1(c) and 2 in the Notes to Financial Statements.) |
64
| | |
| | | Notes to Financial Statements December 31, 2023 |
| | | |
| | | |
1. ORGANIZATION AND SUMMARY OF SIGNIFICANT ACCOUNTING POLICIES
AMG Funds, AMG Funds II (“Trust II”) and AMG Funds III (“Trust III”) (the “Trusts”) are open-end management investment companies, organized as Massachusetts business trusts, and registered under the Investment Company Act of 1940, as amended (the “1940 Act”). Currently, the Trusts consist of a number of different funds, each having distinct investment management objectives, strategies, risks, and policies. Included in this report are AMG Funds: AMG GW&K Municipal Bond Fund (“Municipal Bond”), AMG GW&K Municipal Enhanced Yield Fund (“Municipal Enhanced”), Trust II: AMG GW&K Enhanced Core Bond ESG Fund (“Enhanced Core Bond ESG”) and Trust III: AMG GW&K ESG Bond Fund (“ESG Bond”) and AMG GW&K High Income Fund (“High Income”), each a “Fund” and collectively, the “Funds”.
Each Fund offers different classes of shares. All Funds offer Class N shares and Class I shares; and Enhanced Core Bond ESG and Municipal Enhanced offer Class Z shares. Each class represents an interest in the same assets of the respective Fund. Although all share classes generally have identical voting rights, each share class votes separately when required by law. Different share classes may have different net asset values per share to the extent the share classes pay different distribution amounts and/or the expenses of such share classes differ. Each share class has its own expense structure. Please refer to a current prospectus for additional information on each share class.
Market prices of investments held by the Funds may fall rapidly or unpredictably due to a variety of economic or political factors, market conditions, disasters or public health issues, or in response to events that affect particular industries or companies.
The Funds’ financial statements are prepared in accordance with accounting principles generally accepted in the United States of America (“U.S. GAAP”), including accounting and reporting guidance pursuant to Accounting Standards Codification Topic 946 applicable to investment companies. U.S. GAAP requires management to make estimates and assumptions that affect the reported amounts of assets and liabilities and disclosure of contingent assets and liabilities at the date of the financial statements and the reported amounts of income and expenses during the reporting period. Actual results could differ from those estimates and such differences could be material. The following is a summary of significant accounting policies followed by the Funds in the preparation of their financial statements:
a. VALUATION OF INVESTMENTS
Fixed income securities purchased with a remaining maturity exceeding 60 days are valued at the evaluated bid price provided by an authorized pricing service or, if an evaluated price is not available, by reference to other securities which are considered comparable in credit rating, interest rate, due date and other features (generally referred to as “matrix pricing”) or other similar pricing methodologies. Investments in certain mortgage-backed and stripped mortgage-backed securities, convertible securities, derivatives and other debt securities not traded on an organized securities market are valued on the basis of valuations provided by dealers or by a pricing service which uses information with respect to transactions in such securities and various relationships between such securities and yield to maturity in determining value.
Fixed income securities purchased with a remaining maturity of 60 days or less are valued at amortized cost, provided that the amortized cost value is approximately the same as the fair value of the security valued without the use of
amortized cost. Investments in other open-end registered investment companies are valued at their end of day net asset value per share.
The Funds’ portfolio investments are generally valued based on independent market quotations or prices or, if none, “evaluative” or other market based valuations provided by third party pricing services. Pursuant to Rule 2a-5 under the 1940 Act, the Funds’ Boards of Trustees (the “Board”) designated AMG Funds LLC (the “Investment Manager”) as the Funds’ Valuation Designee to perform the Funds’ fair value determinations. Such determinations are subject to Board oversight and certain reporting and other requirements intended to ensure that the Board receives the information it needs to oversee the Investment Manager’s fair value determinations.
Under certain circumstances, the value of certain Fund portfolio investments may be based on an evaluation of fair value, pursuant to procedures established by the Investment Manager and under the general supervision of the Board. The Funds may use the fair value of a portfolio investment to calculate its net asset value (“NAV”) in the event that the market quotation, price or market based valuation for the portfolio investment is not readily available or otherwise not determinable pursuant to the Funds’ valuation procedures, if the Investment Manager believes the quotation, price or market based valuation to be unreliable, or in certain other circumstances. When determining the fair value of an investment, the Investment Manager seeks to determine the price that the Funds might reasonably expect to receive from current sale of that portfolio investment in an arms-length transaction. Fair value determinations shall be based upon consideration of all available facts and information, including, but not limited to (i) attributes specific to the investment; (ii) fundamental and analytical data relating to the investment; and (iii) the value of other comparable securities or relevant financial instruments, including derivative securities, traded on other markets or among dealers.
The values assigned to fair value portfolio investments are based on available information and do not necessarily represent amounts that might ultimately be realized in the future, since such amounts depend on future developments inherent in long-term investments. Because of the inherent uncertainty of valuation, those estimated values may differ significantly from the values that would have been used had a ready market for the investments existed, and the differences could be material. The Board will be presented with quarterly reports, as of the most recent quarter end, summarizing all fair value activity, material fair value matters that occurred during the quarter, and all outstanding securities fair valued by the Funds. Additionally, the Board will be presented with an annual report that assesses the adequacy and effectiveness of the Investment Manager’s process for determining the fair value of the Funds’ investments.
With respect to foreign equity securities and certain foreign fixed income securities, securities held in the Funds that can be fair valued by the applicable fair value pricing service are fair valued on each business day provided that each individual price exceeds a pre-established confidence level.
U.S. GAAP defines fair value as the price that a fund would receive to sell an asset or pay to transfer a liability in an orderly transaction between market participants at the measurement date. U.S. GAAP also establishes a framework for measuring fair value, and a three level hierarchy for fair value measurements based upon the transparency of inputs to the valuation of an asset or liability. Inputs may be observable or unobservable and refer broadly to the assumptions that market participants would use in pricing the asset or liability. Observable inputs reflect the assumptions market participants would use in pricing the asset or liability based on market data obtained from sources independent of the Funds. Unobservable inputs reflect the Funds’ own assumptions about the assumptions
65
| | |
| | | Notes to Financial Statements (continued) |
| | | |
| | | |
that market participants would use in pricing the asset or liability developed based on the best information available in the circumstances. Each investment is assigned a level based upon the observability of the inputs which are significant to the overall valuation.
The three-tier hierarchy of inputs is summarized below:
Level 1 – inputs are quoted prices in active markets for identical investments (e.g., equity securities, open-end investment companies)
Level 2 – other observable inputs (including, but not limited to: quoted prices for similar assets or liabilities in markets that are active, quoted prices for identical or similar assets or liabilities in markets that are not active, inputs other than quoted prices that are observable for the assets or liabilities (such as interest rates, yield curves, volatilities, prepayment speeds, loss severities, credit risks and default rates) or other market corroborated inputs) (e.g., debt securities, government securities, foreign currency exchange contracts, foreign securities utilizing international fair value pricing, fair valued securities with observable inputs)
Level 3 – inputs are significant unobservable inputs (including the Fund’s own assumptions used to determine the fair value of investments) (e.g., fair valued securities with unobservable inputs)
Changes in inputs or methodologies used for valuing investments may result in a transfer in or out of levels within the fair value hierarchy. The inputs or methodologies used for valuing investments may not necessarily be an indication of the risk associated with investing in those investments.
b. SECURITY TRANSACTIONS
Security transactions are accounted for as of trade date. Realized gains and losses on securities sold are determined on the basis of identified cost.
c. INVESTMENT INCOME AND EXPENSES
Interest income, which includes amortization of premium and accretion of discount on debt securities, is accrued as earned. Interest income on foreign
securities is recorded gross of any withholding tax. Other income and expenses are recorded on an accrual basis. Expenses that cannot be directly attributed to a Fund are apportioned among the funds in the Trusts and other trusts or funds within the AMG Funds Family of Funds (collectively, the “AMG Funds Family”) based upon their relative average net assets or number of shareholders. Investment income, realized and unrealized capital gains and losses, the common expenses of each Fund, and certain fund level expense reductions, if any, are allocated on a pro-rata basis to each class based on the relative net assets of each class to the total net assets of each Fund.
d. DIVIDENDS AND DISTRIBUTIONS
Fund distributions resulting from net investment income, if any, will normally be declared and paid monthly by the Funds. Fund distributions resulting from realized net capital gains, if any, will normally be declared and paid at least annually in December. Distributions to shareholders are recorded on the ex-dividend date. Distributions are determined in accordance with federal income tax regulations, which may differ from net investment income and net realized capital gains for financial statement purposes (U.S. GAAP). Differences may be permanent or temporary. Permanent differences are reclassified among capital accounts in the financial statements to reflect their tax character. Permanent book and tax basis differences, if any, relating to shareholder distributions will result in reclassifications to paid-in capital. Temporary differences arise when certain items of income, expense and gain or loss are recognized in different periods for financial statement and tax purposes; these differences will reverse at some time in the future. Permanent differences are primarily due to redemptions in kind for Municipal Enhanced. There were no permanent differences for ESG Bond, Enhanced Core Bond ESG, High Income or Municipal Bond. Temporary differences are primarily due to wash sale loss deferrals for ESG Bond, Enhanced Core Bond ESG, High Income and Municipal Enhanced and premium amortization on callable bonds for ESG Bond and High Income. Municipal Bond had no temporary differences.
The tax character of distributions paid during the fiscal years ended December 31, 2023 and December 31, 2022 was as follows:
| | | | | | | | | | | | | | | | | | | | | | | | |
| | | |
| | | ESG Bond | | | Enhanced Core Bond ESG | | | High Income | |
| | | | | | |
Distributions paid from: | | | 2023 | | | | 2022 | | | | 2023 | | | | 2022 | | | | 2023 | | | | 2022 | |
| | | | | | |
Ordinary income * | | | $14,222,552 | | | | $12,655,107 | | | | $1,319,131 | | | | $1,041,762 | | | | $772,328 | | | | $684,311 | |
| | | | | | |
Tax-exempt income | | | — | | | | — | | | | — | | | | — | | | | — | | | | — | |
| | | | | | |
Long-term capital gains | | | — | | | | 966,729 | | | | — | | | | — | | | | — | | | | 2,954 | |
| | | | | | | | | | | | | | | | | | | | | | | | |
| | | | | | |
| | | $14,222,552 | | | | $13,621,836 | | | | $1,319,131 | | | | $1,041,762 | | | | $772,328 | | | | $687,265 | |
| | | | | | | | | | | | | | | | | | | | | | | | |
| | | | | | |
| | | | | | | | | | | | | | | | | | | | | | | | |
| | | | |
| | | | | | | | | Municipal Bond | | | Municipal Enhanced | |
| | | | | | |
Distributions paid from: | | | | | | | | | | | 2023 | | | | 2022 | | | | 2023 | | | | 2022 | |
| | | | | | |
Ordinary income * | | | | | | | | | | | $1,247,248 | | | | $551,119 | | | | $367,083 | | | | $207,654 | |
| | | | | | |
Tax-exempt income | | | | | | | | | | | 21,331,928 | | | | 19,272,793 | | | | 7,455,287 | | | | 7,931,831 | |
| | | | | | |
Long-term capital gains | | | | | | | | | | | — | | | | 1,733,844 | | | | — | | | | 814,678 | |
| | | | | | | | | | | | | | | | | | | | | | | | |
| | | | | | |
| | | | | | | | | | | $22,579,176 | | | | $21,557,756 | | | | $7,822,370 | | | | $8,954,163 | |
| | | | | | | | | | | | | | | | | | | | | | | | |
| * | For tax purposes, short-term capital gain distributions, if any, are considered ordinary income distributions. |
66
| | |
| | | Notes to Financial Statements (continued) |
| | | |
| | | |
As of December 31, 2023, the components of distributable earnings (excluding unrealized appreciation/depreciation) on a tax basis consisted of:
| | | | | | | | | | | | | | | | | | | | |
| | | | | |
| | | ESG Bond | | | Enhanced Core Bond ESG | | | High Income | | | Municipal Bond | | | Municipal Enhanced | |
| | | | | |
Capital loss carryforward | | | $39,808,360 | | | | $6,549,700 | | | | $1,435,297 | | | | $26,952,777 | | | | $16,215,360 | |
| | | | | |
Undistributed ordinary income | | | 82,816 | | | | 10,963 | | | | 9,749 | | | | — | | | | — | |
| | | | | |
Undistributed tax-exempt income | | | — | | | | — | | | | — | | | | 249,290 | | | | 76,439 | |
At December 31, 2023, the cost of investments and the aggregate gross unrealized appreciation and depreciation for federal income tax purposes were as follows:
| | | | | | | | | | | | | | | | |
| | | | |
| Fund | | Cost | | | Appreciation | | | Depreciation | | | Net Depreciation | |
| | | | |
ESG Bond | | | $490,317,269 | | | | $4,059,983 | | | | $(47,919,588 | ) | | | $(43,859,605 | ) |
| | | | |
Enhanced Core Bond ESG | | | 45,140,942 | | | | 274,109 | | | | (3,284,931 | ) | | | (3,010,822 | ) |
| | | | |
High Income | | | 16,013,211 | | | | 116,928 | | | | (214,435 | ) | | | (97,507 | ) |
| | | | |
Municipal Bond | | | 1,030,029,167 | | | | 16,415,545 | | | | (23,370,147 | ) | | | (6,954,602 | ) |
| | | | |
Municipal Enhanced | | | 224,254,481 | | | | 3,241,997 | | | | (13,819,821 | ) | | | (10,577,824 | ) |
e. FEDERAL TAXES
Each Fund currently qualifies as an investment company and intends to comply with the requirements under Subchapter M of the Internal Revenue Code of 1986, as amended (the “Internal Revenue Code”), and to distribute substantially all of its taxable income and gains to its shareholders and to meet certain diversification and income requirements with respect to investment companies. The Investment Manager has analyzed the Funds’ tax positions taken on federal income tax returns as of December 31, 2023, and for all open tax years (generally, the three prior taxable years), and has concluded that no provision for federal income tax is required in the Funds’ financial statements. Additionally, the Investment Manager is not aware of any tax position for which it is reasonably possible that the total amounts of unrecognized tax benefit/detriment will change materially in the next twelve months.
Furthermore, based on each Fund’s understanding of the tax rules and rates related to income, gains and transactions for the foreign jurisdictions in which it invests, each Fund will provide for foreign taxes, and where appropriate, deferred foreign taxes.
f. CAPITAL LOSS CARRYOVERS AND DEFERRALS
As of December 31, 2023, the Funds had capital loss carryovers for federal income tax purposes as shown in the following chart. These amounts may be used to offset future realized capital gains indefinitely, and retain their character as short-term and/or long-term.
| | | | | | | | | | | | |
| | | |
| Fund | | Short-Term | | | Long-Term | | | Total | |
| | | |
ESG Bond | | | $9,213,293 | | | | $30,595,067 | | | | $39,808,360 | |
| | | |
Enhanced Core Bond ESG | | | 2,675,067 | | | | 3,874,633 | | | | 6,549,700 | |
| | | |
High Income | | | 398,620 | | | | 1,036,677 | | | | 1,435,297 | |
| | | |
Municipal Bond | | | 1,211,437 | | | | 25,741,340 | | | | 26,952,777 | |
| | | |
Municipal Enhanced | | | 4,404,660 | | | | 11,810,700 | | | | 16,215,360 | |
g. CAPITAL STOCK
Each of AMG Funds’ Amended and Restated Agreement and Declaration of Trust, AMG Funds II’s Amended and Restated Declaration of Trust, and AMG Funds III’s Declaration of Trust authorizes for each applicable Fund the issuance of an unlimited number of shares of beneficial interest, without par value. Each Fund records sales and repurchases of its capital stock on the trade date. For the fiscal year ended December 31, 2023, Municipal Enhanced delivered securities, and cash in connection with redemptions in-kind transactions in the amount of $46,736,183 for subscriptions in-kind to AMG Municipal Enhanced SMA Shares, an affiliated fund, and a related party. For the purposes of U.S. GAAP, the transactions were treated as sales of securities and the resulting gain or loss was recognized based on the market value of the securities on the date of the transfer. For tax purposes, no gains or losses were recognized.
67
| | |
| | | Notes to Financial Statements (continued) |
| | | |
| | | |
For the fiscal years ended December 31, 2023 and December 31, 2022, the capital stock transactions by class for the Funds were as follows:
| | | | | | | | | | | | | | | | | | | | | | | | | | | | | | | | |
| | | ESG Bond | | | Enhanced Core Bond ESG | |
| | | | |
| | | December 31, 2023 | | | December 31, 2022 | | | December 31, 2023 | | | December 31, 2022 | |
| | | Shares | | | Amount | | | Shares | | | Amount | | | Shares | | | Amount | | | Shares | | | Amount | |
| | | | | | | | |
Class N: | | | | | | | | | | | | | | | | | | | | | | | | | | | | | | | | |
| | | | | | | | |
Shares sold | | | 502,045 | | | $ | 10,618,434 | | | | 434,859 | | | $ | 9,802,580 | | | | 384,052 | | | $ | 3,446,741 | | | | 151,245 | | | $ | 1,447,268 | |
| | | | | | | | |
Shares issued in reinvestment of distributions | | | 395,272 | | | | 8,384,556 | | | | 345,800 | | | | 7,627,326 | | | | 32,277 | | | | 287,738 | | | | 20,650 | | | | 192,586 | |
| | | | | | | | |
Shares redeemed | | | (2,817,229 | ) | | | (59,923,434 | ) | | | (3,716,450 | ) | | | (83,888,821 | ) | | | (370,741 | ) | | | (3,342,409 | ) | | | (268,963 | ) | | | (2,557,723 | ) |
| | | | | | | | | | | | | | | | | | | | | | | | | | | | | | | | |
| | | | | | | | |
Net increase (decrease) | | | (1,919,912 | ) | | $ | (40,920,444 | ) | | | (2,935,791 | ) | | $ | (66,458,915 | ) | | | 45,588 | | | $ | 392,070 | | | | (97,068 | ) | | $ | (917,869 | ) |
| | | | | | | | | | | | | | | | | | | | | | | | | | | | | | | | |
| | | | | | | | |
Class I: | | | | | | | | | | | | | | | | | | | | | | | | | | | | | | | | |
| | | | | | | | |
Shares sold | | | 1,156,432 | | | $ | 24,647,398 | | | | 1,292,769 | | | $ | 29,148,121 | | | | 1,011,926 | | | $ | 9,000,136 | | | | 1,447,204 | | | $ | 13,969,790 | |
| | | | | | | | |
Shares issued in reinvestment of distributions | | | 259,536 | | | | 5,507,823 | | | | 256,042 | | | | 5,663,172 | | | | 74,147 | | | | 663,551 | | | | 55,346 | | | | 519,860 | |
| | | | | | | | |
Shares redeemed | | | (2,914,785 | ) | | | (61,872,107 | ) | | | (5,602,000 | ) | | | (125,532,119 | ) | | | (933,098 | ) | | | (8,401,244 | ) | | | (2,416,748 | ) | | | (23,744,821 | ) |
| | | | | | | | | | | | | | | | | | | | | | | | | | | | | | | | |
| | | | | | | | |
Net increase (decrease) | | | (1,498,817 | ) | | $ | (31,716,886 | ) | | | (4,053,189 | ) | | $ | (90,720,826 | ) | | | 152,975 | | | $ | 1,262,443 | | | | (914,198 | ) | | $ | (9,255,171 | ) |
| | | | | | | | | | | | | | | | | | | | | | | | | | | | | | | | |
| | | | | | | | |
Class Z: | | | | | | | | | | | | | | | | | | | | | | | | | | | | | | | | |
| | | | | | | | |
Shares sold | | | — | | | | — | | | | — | | | | — | | | | 143,285 | | | | $1,297,193 | | | | 147,673 | | | | $1,476,721 | |
| | | | | | | | |
Shares issued in reinvestment of distributions | | | — | | | | — | | | | — | | | | — | | | | 30,302 | | | | 271,456 | | | | 27,916 | | | | 261,662 | |
| | | | | | | | |
Shares redeemed | | | — | | | | — | | | | — | | | | — | | | | (444,712) | | | | (3,991,589) | | | | (359,946) | | | | (3,361,565) | |
| | | | | | | | | | | | | | | | | | | | | | | | | | | | | | | | |
| | | | | | | | |
Net decrease | | | — | | | | — | | | | — | | | | — | | | | (271,125) | | | | $(2,422,940) | | | | (184,357) | | | | $(1,623,182) | |
| | | | | | | | | | | | | | | | | | | | | | | | | | | | | | | | |
| | |
| | | High Income | | | Municipal Bond | |
| | | | |
| | | December 31, 2023 | | | December 31, 2022 | | | December 31, 2023 | | | December 31, 2022 | |
| | | Shares | | | Amount | | | Shares | | | Amount | | | Shares | | | Amount | | | Shares | | | Amount | |
| | | | | | | | |
Class N: | | | | | | | | | | | | | | | | | | | | | | | | | | | | | | | | |
| | | | | | | | |
Shares sold | | | 80,767 | | | $ | 1,656,985 | | | | 18,712 | | | $ | 389,945 | | | | 418,863 | | | $ | 4,709,065 | | | | 647,098 | | | $ | 7,349,629 | |
| | | | | | | | |
Shares issued in reinvestment of distributions | | | 15,456 | | | | 314,368 | | | | 13,040 | | | | 267,721 | | | | 18,635 | | | | 207,971 | | | | 16,904 | | | | 188,374 | |
| | | | | | | | |
Shares redeemed | | | (83,177 | ) | | | (1,699,230 | ) | | | (70,270 | ) | | | (1,469,556 | ) | | | (556,927 | ) | | | (6,183,058 | ) | | | (895,246 | ) | | | (10,012,745 | ) |
| | | | | | | | | | | | | | | | | | | | | | | | | | | | | | | | |
| | | | | | | | |
Net increase (decrease) | | | 13,046 | | | $ | 272,123 | | | | (38,518 | ) | | $ | (811,890 | ) | | | (119,429 | ) | | $ | (1,266,022 | ) | | | (231,244 | ) | | $ | (2,474,742 | ) |
| | | | | | | | | | | | | | | | | | | | | | | | | | | | | | | | |
| | | | | | | | |
Class I: | | | | | | | | | | | | | | | | | | | | | | | | | | | | | | | | |
| | | | | | | | |
Shares sold | | | 58,087 | | | $ | 1,187,228 | | | | 484,312 | | | $ | 9,834,594 | | | | 37,373,757 | | | $ | 421,157,504 | | | | 81,732,933 | | | $ | 917,700,640 | |
| | | | | | | | |
Shares issued in reinvestment of distributions | | | 21,980 | | | | 446,846 | | | | 19,941 | | | | 410,014 | | | | 1,488,315 | | | | 16,699,309 | | | | 1,484,035 | | | | 16,631,130 | |
| | | | | | | | |
Shares redeemed | | | (281,706 | ) | | | (5,745,881 | ) | | | (556,443 | ) | | | (11,307,954 | ) | | | (46,781,942 | ) | | | (526,167,158 | ) | | | (95,879,229 | ) | | | (1,074,060,059 | ) |
| | | | | | | | | | | | | | | | | | | | | | | | | | | | | | | | |
| | | | | | | | |
Net decrease | | | (201,639 | ) | | $ | (4,111,807 | ) | | | (52,190 | ) | | $ | (1,063,346 | ) | | | (7,919,870 | ) | | $ | (88,310,345 | ) | | | (12,662,261 | ) | | $ | (139,728,289 | ) |
| | | | | | | | | | | | | | | | | | | | | | | | | | | | | | | | |
| | |
| | | Municipal Enhanced | | | | |
| | | | |
| | | December 31, 2023 | | | December 31, 2022 | | | | | | | |
| | | Shares | | | Amount | | | Shares | | | Amount | | | | | | | | | | | | | |
| | | | | | | | |
Class N: | | | | | | | | | | | | | | | | | | | | | | | | | | | | | | | | |
| | | | | | | | |
Shares sold | | | 1,862,046 | | | $ | 16,341,115 | | | | 616,950 | | | $ | 5,797,292 | | | | | | | | | | | | | | | | | |
| | | | | | | | |
Shares issued in reinvestment of distributions | | | 8,269 | | | | 72,921 | | | | 5,976 | | | | 53,425 | | | | | | | | | | | | | | | | | |
| | | | | | | | |
Shares redeemed | | | (1,567,017 | ) | | | (13,721,798 | ) | | | (1,667,635 | ) | | | (16,584,715 | ) | | | | | | | | | | | | | | | | |
| | | | | | | | | | | | | | | | | | | | | | | | | | | | | | | | |
| | | | | | | | |
Net increase (decrease) | | | 303,298 | | | $ | 2,692,238 | | | | (1,044,709 | ) | | $ | (10,733,998 | ) | | | | | | | | | | | | | | | | |
| | | | | | | | | | | | | | | | | | | | | | | | | | | | | | | | |
68
| | |
| | | Notes to Financial Statements (continued) |
| | | |
| | | |
| | | | | | | | | | | | | | | | | | | | | | | | | | | | | | | | |
| | | Municipal Enhanced | | | | |
| | | | |
| | | December 31, 2023 | | | December 31, 2022 | | | | | | | |
| | | | | | | | |
| | | Shares | | | Amount | | | Shares | | | Amount | | | | | | | | | | | | | |
| | | | | | | | |
Class I: | | | | | | | | | | | | | | | | | | | | | | | | | | | | | | | | |
| | | | | | | | |
Shares sold | | | 14,554,470 | | | | $124,614,205 | | | | 12,933,675 | | | | $112,341,447 | | | | | | | | | | | | | | | | | |
| | | | | | | | |
Shares issued in reinvestment of distributions | | | 330,028 | | | | 2,811,647 | | | | 534,430 | | | | 4,664,114 | | | | | | | | | | | | | | | | | |
| | | | | | | | |
Shares redeemed | | | (22,667,440 | ) | | | (192,162,997 | )1 | | | (18,061,842 | ) | | | (159,500,846 | ) | | | | | | | | | | | | | | | | |
| | | | | | | | | | | | | | | | | | | | | | | | | | | | | | | | |
| | | | | | | | |
Net decrease | | | (7,782,942 | ) | | | $(64,737,145 | ) | | | (4,593,737 | ) | | | $(42,495,285 | ) | | | | | | | | | | | | | | | | |
| | | | | | | | | | | | | | | | | | | | | | | | | | | | | | | | |
| | | | | | | | |
Class Z: | | | | | | | | | | | | | | | | | | | | | | | | | | | | | | | | |
| | | | | | | | |
Shares issued in reinvestment of distributions | | | 448 | | | | $3,806 | | | | 423 | | | | $3,685 | | | | | | | | | | | | | | | | | |
| | | | | | | | | | | | | | | | | | | | | | | | | | | | | | | | |
| | | | | | | | |
Net increase | | | 448 | | | $ | 3,806 | | | | 423 | | | $ | 3,685 | | | | | | | | | | | | | | | | | |
| | | | | | | | | | | | | | | | | | | | | | | | | | | | | | | | |
| 1 | Includes redemption in-kind in the amount of $46,736,183. |
h. REPURCHASE AGREEMENTS AND JOINT REPURCHASE AGREEMENTS
The Funds may enter into third-party and bilateral repurchase agreements for temporary cash management purposes and for reinvestment of cash collateral on securities lending transactions under the securities lending program offered by The Bank of New York Mellon (“BNYM”) (the “Securities Lending Program”) (collectively, “Repurchase Agreements”). The value of the underlying collateral, including accrued interest, must equal or exceed the value of the Repurchase Agreements during the term of the agreement. For joint repurchase agreements, the Funds participate on a pro rata basis with other clients of BNYM in their share of the underlying collateral under such joint repurchase agreements and in their share of proceeds from any repurchase or other disposition of the underlying collateral. The underlying collateral for all Repurchase Agreements is held by the Funds’ custodian or at the Federal Reserve Bank. If the seller defaults and the value of the collateral declines, or if bankruptcy proceedings commence with respect to the seller of the security, realization of the collateral by the Funds may be delayed or limited. Pursuant to the Securities Lending Program, the Funds are indemnified for such losses by BNYM on joint repurchase agreements.
At December 31, 2023, the market value of Repurchase Agreements outstanding for ESG Bond, Enhanced Core Bond ESG, High Income, Municipal Bond and Municipal Enhanced was $14,421,108, $2,185,574, $2,197,791, $15,216,000 and $5,184,000, respectively.
i. DELAYED DELIVERY TRANSACTIONS AND WHEN-ISSUED SECURITIES
The Funds may enter into securities transactions on a delayed delivery or when issued basis. Payment and delivery may take place after the customary settlement period for that security. The price of the underlying securities and the date when the securities will be delivered and paid for are fixed at the time the transaction is negotiated. During the time a delayed delivery sell is outstanding, the contract is marked to market daily and equivalent deliverable securities are held for the transaction. The value of the securities purchased on a delayed delivery or when-issued basis are identified as such in each Fund’s Schedule of Portfolio Investments. With respect to purchase commitments, the Funds identify securities as segregated in their records with a value at least equal to the amount of the commitment. Delayed delivery or when-issued securities that have been purchased from and sold to different brokers are reflected as an investment in
securities and a forward sale commitment in the Fund’s Statement of Assets and Liabilities. For financial reporting purposes, the Fund does offset the receivable and payable for delayed delivery investments purchased and sold. Losses may arise due to changes in the value of the underlying securities or if the counterparty does not perform under the contract, or if the issuer does not issue the securities due to political, economic, or other factors.
At December 31, 2023, the market value of delayed delivery securities held in Municipal Bond amounted to $9,586,475.
2. AGREEMENTS AND TRANSACTIONS WITH AFFILIATES
For each of the Funds, the Trusts have entered into investment advisory agreements under which the Investment Manager, a subsidiary and the U.S. wealth platform of Affiliated Managers Group, Inc. (“AMG”), serves as investment manager to the Funds and is responsible for the Funds’ overall administration and operations. The Investment Manager selects and recommends, subject to the approval of the Boards and, in certain circumstances, shareholders, the subadviser for the Funds and monitors the subadviser’s investment performance, security holdings and investment strategies. Each Fund’s investment portfolio is managed by GW&K Investment Management, LLC (“GW&K”), who serves as subadviser pursuant to a subadvisory agreement with the Investment Manager. AMG indirectly owns a majority interest in GW&K.
Investment management fees are paid directly by the Funds to the Investment Manager based on average daily net assets. For the fiscal year ended December 31, 2023, the Funds’ investment management fees were paid at the following annual rates of each Fund’s respective average daily net assets:
| | |
| |
ESG Bond | | 0.23% |
| |
Enhanced Core Bond ESG | | 0.30% |
| |
High Income | | 0.39% |
| |
Municipal Bond | | |
| |
on first $25 million | | 0.35% |
| |
on next $25 million | | 0.30% |
| |
on next $50 million | | 0.25% |
| |
on balance over $100 million | | 0.20% |
| |
Municipal Enhanced | | 0.45% |
69
| | |
| | | Notes to Financial Statements (continued) |
| | | |
| | | |
The fee paid to GW&K for its services as subadviser is paid out of the fee the Investment Manager receives from each Fund and does not increase the expenses of each Fund.
The Investment Manager has contractually agreed, through at least May 1, 2024, to waive management fees and/or pay or reimburse fund expenses in order to limit total annual Fund operating expenses after fee waiver and expense reimbursements (exclusive of taxes, interest (including interest incurred in connection with bank and custody overdrafts, and in connection with securities sold short), shareholder servicing fees, distribution and service (12b-1) fees, brokerage commissions and other transaction costs, dividends payable with respect to securities sold short, acquired fund fees and expenses and extraordinary expenses) of ESG Bond, Enhanced Core Bond ESG, High Income, Municipal Bond, and Municipal Enhanced to the annual rate of 0.43%, 0.48%, 0.59%, 0.34%, and 0.59%, respectively, of each Fund’s average daily net assets (this annual rate or such other annual rate that may be in effect from time to time, the “Expense Cap”), subject to later reimbursement by the Funds in certain circumstances.
In general, for a period of up to 36 months after the date any amounts are paid, waived or reimbursed by the Investment Manager, the Investment Manager may recover such amounts from a Fund, provided that such repayment would not cause the Fund’s total annual operating expenses after fee waiver and expense reimbursements (exclusive of the items noted in the parenthetical above) to exceed either (i) the Expense Cap in effect at the time such amounts were paid, waived or reimbursed, or (ii) the Expense Cap in effect at the time of such repayment by the Fund.
The contractual expense limitation may only be terminated in the event the Investment Manager or a successor ceases to be the investment manager of a Fund or a successor fund, by mutual agreement between the Investment Manager and the Board, or in the event of a Fund’s liquidation unless the Fund is reorganized or is a party to a merger in which the surviving entity is successor to the accounting and performance information of a Fund.
For the fiscal year ended December 31, 2023, the Investment Manager’s expense reimbursements, and repayments of prior reimbursements by the Funds to the Investment Manager, if any, are as follows:
| | | | | | |
| | | Expense
Reimbursements | | | Repayment of Prior
Reimbursements |
| | |
ESG Bond | | | $90,822 | | | — |
| | |
Enhanced Core Bond ESG | | | 127,203 | | | — |
| | |
High Income | | | 100,391 | | | — |
| | |
Municipal Bond | | | 749,681 | | | — |
| | |
Municipal Enhanced | | | 221,214 | | | — |
At December 31, 2023, the Funds’ expiration of reimbursements subject to recoupment is as follows:
| | | | | | | | | | | | |
Expiration Period | | ESG Bond | | | Enhanced Core Bond ESG | | | High Income | |
| | | |
Less than 1 year | | | $19,644 | | | | $113,335 | | | | $94,499 | |
| | | |
1-2 years | | | 72,842 | | | | 130,195 | | | | 88,045 | |
| | | |
2-3 years | | | 90,822 | | | | 127,203 | | | | 100,391 | |
| | | | | | | | | | | | |
| | | |
Total | | | $183,308 | | | | $370,733 | | | | $282,935 | |
| | | | | | | | | | | | |
| | | | | | | | |
Expiration Period | | Municipal Bond | | | Municipal Enhanced | |
| | |
Less than 1 year | | | $706,015 | | | | $230,390 | |
| | |
1-2 years | | | 726,185 | | | | 225,094 | |
| | |
2-3 years | | | 749,681 | | | | 221,214 | |
| | | | | | | | |
| | |
Total | | | $2,181,881 | | | | $676,698 | |
| | | | | | | | |
The Trusts, on behalf of the Funds, have entered into an amended and restated Administration Agreement under which the Investment Manager serves as the Funds’ administrator (the “Administrator”) and is responsible for certain aspects of managing the Funds’ operations, including administration and shareholder services to each Fund. Each Fund pays a fee to the Administrator at the rate of 0.15% per annum of the Fund’s average daily net assets for this service.
The Funds are distributed by AMG Distributors, Inc. (the “Distributor”), a wholly-owned subsidiary of the Investment Manager. The Distributor serves as the distributor and underwriter for each Fund and is a registered broker-dealer and member of the Financial Industry Regulatory Authority, Inc. (“FINRA”). Shares of each Fund will be continuously offered and will be sold directly to prospective purchasers and through brokers, dealers or other financial intermediaries who have executed selling agreements with the Distributor. Generally, the Distributor bears all or a portion of the expenses of providing services pursuant to the distribution agreement, including the payment of the expenses relating to the distribution of prospectuses for sales purposes and any advertising or sales literature.
The Trusts have adopted a distribution and service plan (the “Plan”) with respect to the Class N shares, in accordance with the requirements of Rule 12b-1 under the 1940 Act and the requirements of the applicable rules of FINRA regarding asset-based sales charges. Pursuant to the Plan, Enhanced Core Bond ESG, Municipal Bond and Municipal Enhanced may make payments to the Distributor for its expenditures in financing any activity primarily intended to result in the sale of each Fund’s Class N shares and for maintenance and personal service provided to existing shareholders of that class. The Plan authorizes payments to the Distributor up to 0.25% annually of Enhanced Core Bond ESG, Municipal Bond and Municipal Enhanced average daily net assets attributable to the Class N shares. The portion of payments made under the plan by Class N shares of Enhanced Core Bond ESG, Municipal Bond and Municipal Enhanced for shareholder servicing may not exceed an annual rate of 0.25% of the average daily net asset value of each Fund’s shares of that class owned by clients of such broker, dealer or financial intermediary.
For each of Class N and Class I shares of ESG Bond, High Income, Municipal Bond, and Municipal Enhanced, and for Enhanced Core Bond ESG’s Class I shares, the
70
| | |
| | | Notes to Financial Statements (continued) |
| | | |
| | | |
Board has approved reimbursement payments to the Investment Manager for shareholder servicing expenses (“shareholder servicing fees”) incurred. Shareholder servicing fees include payments to financial intermediaries, such as broker-dealers (including fund supermarket platforms), banks, and trust companies who provide shareholder recordkeeping, account servicing and other services. The Class N and Class I shares may reimburse the Investment Manager for the actual amount incurred up to a maximum annual rate of each Class’s average daily net assets as shown in the table below.
The impact on the annualized expense ratios for the fiscal year ended December 31, 2023, was as follows:
| | | | | | | | |
| | | Maximum Annual | | | Actual | |
| | | Amount | | | Amount | |
| Fund | | Approved | | | Incurred | |
| | |
ESG Bond | | | | | | | | |
| | |
Class N | | | 0.25% | | | | 0.25% | |
| | |
Class I | | | 0.05% | | | | 0.05% | |
|
Enhanced Core Bond ESG | |
| | |
Class I | | | 0.10% | | | | 0.08% | |
|
High Income | |
| | |
Class N | | | 0.25% | | | | 0.25% | |
| | |
Class I | | | 0.05% | | | | 0.05% | |
|
Municipal Bond | |
| | |
Class N | | | 0.15% | | | | 0.13% | |
| | |
Class I | | | 0.05 | | | | 0.05% | |
|
Municipal Enhanced | |
| | |
Class N | | | 0.15% | | | | 0.15% | |
| | |
Class I | | | 0.05% | | | | 0.05% | |
The Board provides supervision of the affairs of the Trusts and other trusts within the AMG Funds Family. The Trustees of the Trusts who are not affiliated with the Investment Manager receive an annual retainer and per meeting fees for regular, special and telephonic meetings, and they are reimbursed for out-of-pocket expenses incurred while carrying out their duties as Board members. The Chairman of the Board and the Audit Committee Chair receive additional annual retainers. On October 10, 2023, the shareholders of each Trust elected Trustees, including two new Trustees who are not “interested persons” of the Funds within the meaning of the 1940 Act. Certain Trustees and Officers of the Funds are Officers and/or Directors of the Investment Manager, AMG and/or the Distributor.
The Securities and Exchange Commission (the “SEC”) granted an exemptive order that permits certain eligible funds in the AMG Funds Family to lend and borrow money for certain temporary purposes directly to and from other eligible funds in the AMG Funds Family. Participation in this interfund lending program is voluntary for both the borrowing and lending funds, and an interfund loan is only made if it benefits each participating fund. The Administrator manages the program according to procedures approved by the Board, and the Board monitors the operation of the program. An interfund loan must comply with certain conditions set out in the exemptive order, which are designed to assure fairness and protect all participating funds. The interest earned and interest paid on interfund loans are included on the Statement of Operations as interest income and interest expense, respectively. At December 31, 2023, the Funds had no interfund loans outstanding.
The following Funds utilized the interfund loan program during the fiscal year ended December 31, 2023 as follows:
| | | | | | | | | | | | | | | | |
| Fund | | Average
Lent | | | Number
of Days | | | Interest
Earned | | | Average
Interest Rate | |
| | | | |
Municipal Bond | | | $7,448,357 | | | | 10 | | | | $12,158 | | | | 5.958 | % |
| | | | |
Municipal Enhanced | | | 1,723,990 | | | | 6 | | | | 1,748 | | | | 6.122 | % |
| | | | | | | | | | | | | | | | |
| Fund | | Average
Borrowed | | | Number
of Days | | | Interest
Paid | | | Average
Interest Rate | |
| | | | |
Enhanced Core Bond ESG | | | $1,432,227 | | | | 4 | | | | $990 | | | | 6.220 | % |
| | | | |
Municipal Bond | | | 2,344,795 | | | | 3 | | | | 1,144 | | | | 5.935 | % |
| | | | |
Municipal Enhanced | | | 1,802,749 | | | | 13 | | | | 3,962 | | | | 6.170 | % |
3. PURCHASES AND SALES OF SECURITIES
Purchases and sales of securities (excluding short-term securities and U.S. Government Obligations) for the fiscal year ended December 31, 2023, were as follows:
| | | | | | | | |
| | | Long Term Securities | |
| Fund | | Purchases | | | Sales | |
| | |
ESG Bond | | | $78,262,046 | | | | $115,067,183 | |
| | |
Enhanced Core Bond ESG | | | 11,200,578 | | | | 11,978,804 | |
| | |
High Income | | | 3,863,034 | | | | 7,666,292 | |
| | |
Municipal Bond | | | 301,623,507 | | | | 393,699,685 | |
| | |
Municipal Enhanced | | | 56,932,120 | | | | 70,231,619 | |
Purchases and sales of U.S. Government Obligations for the fiscal year ended December 31, 2023 were as follows:
| | | | | | | | |
| | | U.S. Government Obligations | |
| Fund | | Purchases | | | Sales | |
| | |
ESG Bond | | | $43,877,436 | | | | $74,388,537 | |
| | |
Enhanced Core Bond ESG | | | 8,566,832 | | | | 8,562,787 | |
4. PORTFOLIO SECURITIES LOANED
The Funds, except Municipal Bond and Municipal Enhanced, participate in the Securities Lending Program providing for the lending of securities to qualified borrowers. Securities lending income includes earnings of such temporary cash investments, plus or minus any rebate to a borrower. These earnings (after any rebate) are then divided between BNYM, as a fee for its services under the Securities Lending Program, and the Funds, according to agreed-upon rates. Collateral on all securities loaned is accepted in cash, U.S. Treasury Obligations or U.S. Government Agency Obligations. Collateral is maintained at a minimum level of 102% (105% in the case of certain foreign securities) of the market value, plus interest, if applicable, of investments on loan. It is the Funds’ policy to obtain additional collateral from or return excess collateral to the borrower by the end of the next business day, following the valuation date of the securities loaned. Therefore, the value of the collateral held may be temporarily less than the value of the securities on loan. Lending securities entails a risk of loss to the Funds if and to the extent that the market value of the securities loaned were to increase and
71
| | |
| | | Notes to Financial Statements (continued) |
| | | |
| | | |
the borrower did not increase the collateral accordingly, and the borrower fails to return the securities. Under the terms of the Securities Lending Program, the Funds are indemnified for such losses by BNYM. Cash collateral is held in separate omnibus accounts managed by BNYM, who is authorized to exclusively enter into joint repurchase agreements for that cash collateral. Securities collateral is held in separate omnibus accounts managed by BNYM and cannot be sold or pledged. BNYM bears the risk of any deficiency in the amount of the cash collateral available for return to the borrower due to any loss on the collateral invested. Loans of securities are terminable by a Fund at any time and the borrower, after notice, is required to return borrowed securities as soon as practical, which is normally within three business days.
The value of securities loaned on positions held, cash collateral and securities collateral received at December 31, 2023, was as follows:
| | | | | | | | | | | | | | | | |
| Fund | | Securities
Loaned | | | Cash
Collateral
Received | | | Securities
Collateral
Received | | | Total
Collateral
Received | |
| | | | |
ESG Bond | | | $22,416,408 | | | | $14,128,108 | | | | $9,203,847 | | | | $23,331,955 | |
| | | | |
Enhanced Core Bond ESG | | | 4,139,635 | | | | 2,185,574 | | | | 2,109,537 | | | | 4,295,111 | |
| | | | |
High Income | | | 2,406,325 | | | | 2,057,791 | | | | 456,310 | | | | 2,514,101 | |
The following table summarizes the securities received as collateral for securities lending at December 31, 2023:
| | | | | | |
| Fund | | Collateral Type | | Coupon
Range | | Maturity
Date Range |
| | | |
ESG Bond | | U.S. Treasury Obligations | | 0.125%-5.471% | | 04/15/24-05/15/51 |
| | | |
Enhanced Core Bond ESG | | U.S. Treasury Obligations | | 0.125%-4.750% | | 04/15/24-05/15/51 |
| | | |
High Income | | U.S. Treasury Obligations | | 0.000%-6.000% | | 02/01/24-08/15/53 |
5. COMMITMENTS AND CONTINGENCIES
Under the Trusts’ organizational documents, their Trustees and Officers are indemnified against certain liabilities arising out of the performance of their duties to the Trusts. In addition, in the normal course of business, the Funds may enter into contracts and agreements that contain a variety of representations and warranties, which provide general indemnifications. The maximum exposure to the Funds under these arrangements is unknown, as this would involve future claims
that may be made against a Fund that have not yet occurred. However, based on experience, the Funds had no prior claims or losses and expect the risks of loss to be remote.
6. RISKS ASSOCIATED WITH HIGH YIELD SECURITIES
Investing in high yield securities involves greater risks and considerations not typically associated with U.S. Government and other high quality/investment grade securities. High yield securities are generally below investment grade securities and do not have an established retail secondary market. Economic downturns may disrupt the high yield market and impair the issuer’s ability to repay principal and interest. Also, an increase in interest rates would likely have an adverse impact on the value of such obligations and could cause the securities to become less liquid.
7. CREDIT AGREEMENT
Effective April 12, 2023, the Trust III, on behalf of High Income and another fund in the Trust, became party to a Credit Agreement among BNYM, AMG Funds II, and AMG Funds IV (together with the Trust and AMG Funds II, the “Participating Trusts”) (the “Credit Agreement”) that provided a revolving line of credit of up to $50 million to certain funds in the Participating Trusts (such funds, the “Participating Funds”). On December 31, 2023, the Credit Agreement was terminated. The facility was shared by the Participating Funds, and was available for temporary, emergency purposes including liquidity needs in meeting redemptions. The interest rate on outstanding Alternate Base Rate Loans was equal to the greater of the Prime Rate plus 1.25%, or 0.50% plus the Federal Funds Effective Rate plus 1.25%. The interest rate on outstanding Overnight Loans was equal to the greater of the Federal Funds Effective Rate plus 1.25%, or the Adjusted Daily Simple SOFR plus 1.25%. The aforementioned Adjusted Daily Simple SOFR was the sum of Daily Simple SOFR plus 0.10% plus a floor rate of 0.00%. The Participating Funds paid a commitment fee on the unutilized commitment amount of 0.175% per annum, which was allocated to the Participating Funds based on average daily net assets and is included in miscellaneous expense on the Participating Funds’ Statement of Operations. Interest incurred on loans utilized, if any, is included in the Statement of Operations as interest expense.
High Income did not utilize the line of credit during the period April 12, 2023, through December 31, 2023.
8. MASTER NETTING AGREEMENTS
The Funds may enter into master netting agreements with their counterparties for the Securities Lending Program and Repurchase Agreements, which provide the right, in the event of default (including bankruptcy or insolvency) for the non-defaulting party to liquidate the collateral and calculate net exposure to the defaulting party or request additional collateral. For financial reporting purposes, the Funds do not offset financial assets and financial liabilities that are subject to master netting agreements in the Statement of Assets and Liabilities. For securities lending transactions, see Note 4.
The following table is a summary of the Funds’ open Repurchase Agreements that are subject to a master netting agreement as of December 31, 2023:
72
| | |
| | | Notes to Financial Statements (continued) |
| | | |
| | | |
| | | | | | | | | | | | | | | | | | | | | | | | | |
| | | | | Gross Amount Not Offset in the | | | | |
| | | | | Statement of Assets and Liabilities | | | | |
| Fund | | Gross Amounts of
Assets Presented in
the Statement of
Assets and Liabilities | | Offset Amount | | Net Asset Balance | | Collateral Received | | Net Amount |
| | | | | |
ESG Bond | | | | | | | | | | | | | | | | | | | | | | | | | |
| | | | | |
Cantor Fitzgerald Securities, Inc. | | | | $3,006,434 | | | | | — | | | | | $3,006,434 | | | | | $3,006,434 | | | | | — | |
| | | | | |
Daiwa Capital Markets America | | | | 631,946 | | | | | — | | | | | 631,946 | | | | | 631,946 | | | | | — | |
| | | | | |
RBC Dominion Securities, Inc. | | | | 3,531,895 | | | | | — | | | | | 3,531,895 | | | | | 3,531,895 | | | | | — | |
| | | | | |
Santander U.S. Capital Markets LLC | | | | 3,496,576 | | | | | — | | | | | 3,496,576 | | | | | 3,496,576 | | | | | — | |
| | | | | |
State of Wisconsin Investment Board | | | | 3,461,257 | | | | | — | | | | | 3,461,257 | | | | | 3,461,257 | | | | | — | |
| | | | | |
Fixed Income Clearing Corp. | | | | 293,000 | | | | | — | | | | | 293,000 | | | | | 293,000 | | | | | — | |
| | | | | | | | | | | | | | | | | | | | | | | | | |
| | | | | |
Total | | | | $14,421,108 | | | | | — | | | | | $14,421,108 | | | | | $14,421,108 | | | | | — | |
| | | | | | | | | | | | | | | | | | | | | | | | | |
| | | | | |
Enhanced Core Bond ESG | | | | | | | | | | | | | | | | | | | | | | | | | |
| | | | | |
Daiwa Capital Markets America | | | | $1,000,000 | | | | | — | | | | | $1,000,000 | | | | | $1,000,000 | | | | | — | |
| | | | | |
Deutsche Bank Securities, Inc. | | | | 185,574 | | | | | — | | | | | 185,574 | | | | | 185,574 | | | | | — | |
| | | | | |
RBC Dominion Securities, Inc. | | | | 1,000,000 | | | | | — | | | | | 1,000,000 | | | | | 1,000,000 | | | | | — | |
| | | | | | | | | | | | | | | | | | | | | | | | | |
| | | | | |
Total | | | | $2,185,574 | | | | | — | | | | | $2,185,574 | | | | | $2,185,574 | | | | | — | |
| | | | | | | | | | | | | | | | | | | | | | | | | |
| | | | | |
High Income | | | | | | | | | | | | | | | | | | | | | | | | | |
| | | | | |
Daiwa Capital Markets America | | | | $1,000,000 | | | | | — | | | | | $1,000,000 | | | | | $1,000,000 | | | | | — | |
| | | | | |
Deutsche Bank Securities, Inc. | | | | 57,791 | | | | | — | | | | | 57,791 | | | | | 57,791 | | | | | — | |
| | | | | |
RBC Dominion Securities, Inc. | | | | 1,000,000 | | | | | — | | | | | 1,000,000 | | | | | 1,000,000 | | | | | — | |
| | | | | |
Fixed Income Clearing Corp. | | | | 140,000 | | | | | — | | | | | 140,000 | | | | | 140,000 | | | | | — | |
| | | | | | | | | | | | | | | | | | | | | | | | | |
| | | | | |
Total | | | | $2,197,791 | | | | | — | | | | | $2,197,791 | | | | | $2,197,791 | | | | | — | |
| | | | | | | | | | | | | | | | | | | | | | | | | |
| | | | | |
Municipal Bond | | | | | | | | | | | | | | | | | | | | | | | | | |
| | | | | |
Fixed Income Clearing Corp. | | | | $7,899,000 | | | | | — | | | | | $7,899,000 | | | | | $7,899,000 | | | | | — | |
| | | | | |
Fixed Income Clearing Corp. | | | | 7,317,000 | | | | | — | | | | | 7,317,000 | | | | | 7,317,000 | | | | | — | |
| | | | | | | | | | | | | | | | | | | | | | | | | |
| | | | | |
Total | | | | $15,216,000 | | | | | — | | | | | $15,216,000 | | | | | $15,216,000 | | | | | — | |
| | | | | | | | | | | | | | | | | | | | | | | | | |
| | | | | |
Municipal Enhanced | | | | | | | | | | | | | | | | | | | | | | | | | |
| | | | | |
Fixed Income Clearing Corp. | | | | $3,319,000 | | | | | — | | | | | $3,319,000 | | | | | $3,319,000 | | | | | — | |
| | | | | |
Fixed Income Clearing Corp. | | | | 1,865,000 | | | | | — | | | | | 1,865,000 | | | | | 1,865,000 | | | | | — | |
| | | | | | | | | | | | | | | | | | | | | | | | | |
| | | | | |
Total | | | | $5,184,000 | | | | | — | | | | | $5,184,000 | | | | | $5,184,000 | | | | | — | |
| | | | | | | | | | | | | | | | | | | | | | | | | |
9. SUBSEQUENT EVENTS
The Funds have determined that no material events or transactions occurred through the issuance date of the Funds’ financial statements which require an additional disclosure in or adjustment of the Funds’ financial statements.
73
| | |
| | | Report of Independent Registered Public Accounting Firm |
| | | |
| | | |
To the Boards of Trustees of AMG Funds, AMG Funds II, and AMG Funds III and Shareholders of AMG GW&K Municipal Bond Fund, AMG GW&K Municipal Enhanced Yield Fund, AMG GW&K Enhanced Core Bond ESG Fund, AMG GW&K ESG Bond Fund and AMG GW&K High Income Fund
Opinions on the Financial Statements
We have audited the accompanying statements of assets and liabilities, including the schedules of portfolio investments, of AMG GW&K Municipal Bond Fund, AMG GW&K Municipal Enhanced Yield Fund (two of the funds constituting AMG Funds), AMG GW&K Enhanced Core Bond ESG Fund (one of the funds constituting AMG Funds II), AMG GW&K ESG Bond Fund and AMG GW&K High Income Fund (two of the funds constituting AMG Funds III) (hereafter collectively referred to as the “Funds”) as of December 31, 2023, the related statements of operations for the year ended December 31, 2023, the statements of changes in net assets for each of the two years in the period ended December 31, 2023, including the related notes, and the financial highlights for each of the periods indicated therein (collectively referred to as the “financial statements”). In our opinion, the financial statements present fairly, in all material respects, the financial position of each of the Funds as of December 31, 2023, the results of each of their operations for the year then ended, the changes in each of their net assets for each of the two years in the period ended December 31, 2023 and each of the financial highlights for each of the periods indicated therein in conformity with accounting principles generally accepted in the United States of America.
Basis for Opinions
These financial statements are the responsibility of the Funds’ management. Our responsibility is to express an opinion on the Funds’ financial statements based on our audits. We are a public accounting firm registered with the Public Company Accounting Oversight Board (United States) (PCAOB) and are required to be independent with respect to the Funds in accordance with the U.S. federal securities laws and the applicable rules and regulations of the Securities and Exchange Commission and the PCAOB.
We conducted our audits of these financial statements in accordance with the standards of the PCAOB. Those standards require that we plan and perform the audit to obtain reasonable assurance about whether the financial statements are free of material misstatement, whether due to error or fraud.
Our audits included performing procedures to assess the risks of material misstatement of the financial statements, whether due to error or fraud, and performing procedures that respond to those risks. Such procedures included examining, on a test basis, evidence regarding the amounts and disclosures in the financial statements. Our audits also included evaluating the accounting principles used and significant estimates made by management, as well as evaluating the overall presentation of the financial statements. Our procedures included confirmation of securities owned as of December 31, 2023 by correspondence with the custodian and brokers; when replies were not received from brokers, we performed other auditing procedures. We believe that our audits provide a reasonable basis for our opinions.
/s/ PricewaterhouseCoopers LLP
Boston, Massachusetts
February 27, 2024
We have served as the auditor of one or more investment companies in the AMG Funds Family since 1993.
74
| | |
| | | Other Information (unaudited) |
| | | |
| | | |
TAX INFORMATION
AMG GW&K ESG Bond Fund, AMG GW&K Enhanced Core Bond ESG Fund, AMG GW&K High Income Fund, AMG GW&K Municipal Bond Fund, and AMG GW&K Municipal Enhanced Yield Fund each hereby designate the maximum amount allowable of its net taxable income as qualified dividends as provided in the Jobs and Growth Tax Relief Reconciliation Act of 2003. The 2023 Form 1099-DIV you receive for each Fund will show the tax status of all distributions paid to you during the year.
Pursuant to section 852 of the Internal Revenue Code, AMG GW&K ESG Bond Fund, AMG GW&K Enhanced Core Bond ESG Fund, AMG GW&K High Income Fund, AMG GW&K Municipal Bond Fund, and AMG GW&K Municipal Enhanced Yield Fund, each hereby designates $0, as a capital gain distribution with respect to the taxable year ended December 31, 2023, or if subsequently determined to be different, the net capital gains of such fiscal year.
PROXY VOTE
A special meeting of the shareholders of AMG Funds, AMG Funds II and AMG Funds III (collectively the “Trusts”) was held on October 10, 2023, to vote on proposals to elect trustees to the Boards of Trustees of the Trusts and to amend certain fundamental restrictions of AMG High Income Fund. Jill R. Cuniff, Kurt A. Keilhacker, Peter W. MacEwen, Steven J. Paggioli, Eric Rakowski, Victoria L. Sassine and Garret W. Weston were elected by shareholders at the special meeting on October 10, 2023. Bruce B. Bingham, an incumbent Trustee, served as a Trustee of the Trusts until his retirement on December 31, 2023. The proposals and results of the votes are described below.
| | | | |
| AMG Funds | | All Funds in Trust* |
| | |
| Election of Trustees 1 | | For | | Withheld |
| | |
Jill R. Cuniff | | 523,453,201 | | 50,330,270 |
| | |
Kurt A. Keilhacker | | 563,642,997 | | 10,140,474 |
| | |
Peter W. MacEwen | | 523,551,974 | | 50,231,497 |
| | |
Steven J. Paggioli | | 561,225,673 | | 12,557,798 |
| | |
Eric Rakowski | | 561,230,560 | | 12,552,911 |
| | |
Victoria L. Sassine | | 563,668,874 | | 10,114,597 |
| | |
Garret W. Weston | | 564,280,150 | | 9,503,321 |
| |
| AMG Funds II | | All Funds in Trust* |
| | |
| Election of Trustees 1 | | For | | Withheld |
| | |
Jill R. Cuniff | | 4,796,336 | | 35,586 |
| | |
Kurt A. Keilhacker | | 4,798,616 | | 33,306 |
| | |
Peter W. MacEwen | | 4,797,782 | | 34,140 |
| | |
Steven J. Paggioli | | 4,797,674 | | 34,248 |
| | |
Eric Rakowski | | 4,803,644 | | 28,278 |
| | |
Victoria L. Sassine | | 4,801,440 | | 30,482 |
| | |
Garret W. Weston | | 4,798,028 | | 33,894 |
75
| | | | |
| AMG Funds III | | All Funds in Trust* |
| | |
| Election of Trustees 1 | | For | | Withheld |
| | |
Jill R. Cuniff | | 16,176,146 | | 1,292,448 |
| | |
Kurt A. Keilhacker | | 16,195,091 | | 1,273,503 |
| | |
Peter W. MacEwen | | 16,181,186 | | 1,287,408 |
| | |
Steven J. Paggioli | | 16,171,262 | | 1,297,332 |
| | |
Eric Rakowski | | 16,234,882 | | 1,233,712 |
| | |
Victoria L. Sassine | | 16,232,798 | | 1,235,796 |
| | |
Garret W. Weston | | 16,302,659 | | 1,165,935 |
| | | | | | | | |
| | | AMG High Income Fund* |
| To approve the amendment of the Fund’s fundamental investment restrictions | | For | | Against | | Abstain | | Broker
Non-Vote |
| | | | |
Borrowing | | 365,234 | | 2,237 | | 5,456 | | 205,732 |
| | | | |
Issuing Senior Securities | | 365,234 | | 2,189 | | 5,503 | | 205,733 |
| 1 | Ms. Cuniff and Mr. MacEwen were newly elected to the Boards of Trustees on October 10, 2023; Messrs. Keilhacker, Paggioli, Rakowski, and Weston and Ms. Sassine are incumbent Trustees. |
| * | Rounded to the nearest share. |
76
| | |
| | | AMG Funds Trustees and Officers |
| | | |
| | | |
| | | | | | |
The Trustees and Officers of the Trusts, their business addresses, principal occupations for the past five years and ages are listed below. The Trustees provide broad supervision over the affairs of the Trusts and the Funds. The Trustees are experienced executives who meet periodically throughout the year to oversee the Funds’ activities, review contractual arrangements with companies that provide services to the Funds, and | | | | review the Funds’ performance. Unless otherwise noted, the address of each Trustee or Officer is the address of the Trusts: 680 Washington Blvd., Suite 500, Stamford, CT. 06901. There is no stated term of office for Trustees. Trustees serve until their resignation, retirement or removal in accordance with the Trusts’ organizational documents and policies adopted by the Board from time to time. | | The Chairman of the Board, the President, the Treasurer and the Secretary and such other Officers as the Trustees may in their discretion from time to time elect each hold office until his or her successor is elected and qualified, or until he or she sooner dies, resigns, is removed or becomes disqualified. Each Officer holds office at the pleasure of the Trustees. |
Independent Trustees
The following Trustees are not “interested persons” of the Trusts within the meaning of the 1940 Act:
| | |
Number of Funds Overseen in Fund Complex | | Name, Age, Principal Occupation(s) During Past 5 Years and Other Directorships Held by Trustee |
| | |
• Trustee since 2012-AMG Funds • Trustee since 2012-AMG Funds II • Trustee since 2012-AMG Funds III • Oversees 37 Funds in Fund Complex | | Bruce B. Bingham, 75* Partner, Hamilton Partners (real estate development firm) (1987-Present); Director of The Yacktman Funds, Inc. (2 portfolios) (2000-2012). |
| | |
• Trustee since 2023-AMG Funds • Trustee since 2023-AMG Funds II • Trustee since 2023-AMG Funds III • Oversees 37 Funds in Fund Complex | | Jill R. Cuniff, 59** Director of Harding, Loevner Funds, Inc. (12 portfolios) (2018-Present); Retired (2016-Present); President & Portfolio Manager, Edge Asset Management (2009-2016); President & Chief Investment Officer, Morley Financial Services (2001-2009); President, Union Bond & Trust Company (2001-2009). |
| | |
• Chairman of the Audit Committee since 2021 • Trustee since 2013-AMG Funds • Trustee since 2013-AMG Funds II • Trustee since 2013-AMG Funds III • Oversees 39 Funds in Fund Complex | | Kurt A. Keilhacker, 60 Managing Partner, Elementum Ventures (2013-Present); Managing Partner, TechFund Europe (2000-Present); Managing Partner, TechFund Capital (1997-Present); Adjunct Professor, University of San Francisco (2022-Present); Trustee, Wheaton College (2018-Present); Director, Wheaton College Trust Company, N.A. (2018-Present). |
| | |
• Trustee since 2023-AMG Funds • Trustee since 2023-AMG Funds II • Trustee since 2023-AMG Funds III • Oversees 37 Funds in Fund Complex | | Peter W. MacEwen, 59** Private investor (2019-Present); Affiliated Managers Group, Inc. (2003-2018): Chief Administrative Officer, Office of the CEO (2013-2018); Senior Vice President, Finance (2007-2013); Vice President, Finance (2003-2007). |
| | |
• Trustee since 2004-AMG Funds • Trustee since 2000-AMG Funds II • Trustee since 1993-AMG Funds III • Oversees 37 Funds in Fund Complex | | Steven J. Paggioli, 73 Independent Consultant (2002-Present); Trustee, Professionally Managed Portfolios (28 portfolios); Independent Director, Muzinich BDC, Inc. (business development company) (2019-Present); Director, The Wadsworth Group; Independent Director, Chase Investment Counsel (2008–2019); Executive Vice President, Secretary and Director, Investment Company Administration, LLC and First Fund Distributors, INC. (1990-2001). |
77
| | |
| | | AMG Funds Trustees and Officers (continued) |
| | | |
| | | |
| | |
| | |
• Independent Chairman of the Board of Trustees since 2017 • Chairman of the Governance Committee since 2017 • Trustee since 1999-AMG Funds • Trustee since 2000-AMG Funds II • Trustee since 1999-AMG Funds III • Oversees 39 Funds in Fund Complex | | Eric Rakowski, 65 Professor of Law, University of California at Berkeley School of Law (1990-Present); Tax Attorney at Davis Polk & Wardwell and clerked for Judge Harry T. Edwards of the U.S. Court of Appeals for the District of Columbia Circuit and for Justice William J. Brennan Jr. of the U.S. Supreme Court; Trustee of Parnassus Funds (4 portfolios) (2021-Present); Trustee of Parnassus Income Funds (2 portfolios) (2021-Present); Director of Harding, Loevner Funds, Inc. (10 portfolios); Trustee of Third Avenue Trust (3 portfolios) (2002-2019); Trustee of Third Avenue Variable Trust (1 portfolio) (2002-2019). |
| | |
• Trustee since 2013-AMG Funds • Trustee since 2013-AMG Funds II • Trustee since 2013-AMG Funds III • Oversees 39 Funds in Fund Complex | | Victoria L. Sassine, 58 Adjunct Professor, Babson College (2007–Present); Director, Board of Directors, PRG Group (2017-Present); CEO, Founder, Scale Smarter Partners, LLC (2018-Present); Adviser, EVOFEM Biosciences (2019-Present); Chairperson of the Board of Directors of Business Management Associates (2018-2019). |
*Mr. Bingham retired from the Boards of Trustees of the Trusts on December 31, 2023.
**Ms. Cuniff and Mr. MacEwen were elected to the Boards of Trustees by the shareholders of the Trusts on October 10, 2023.
Interested Trustee
The Trustee in the following table is an “interested person” of the Trust within the meaning of the 1940 Act.
| | |
Number of Funds Overseen in Fund Complex | | Name, Age, Principal Occupation(s) During Past 5 Years and Other Directorships Held by Trustee |
| | |
• Trustee since 2021-AMG Funds • Trustee since 2021-AMG Funds II • Trustee since 2021-AMG Funds III • Oversees 39 Funds in Fund Complex | | Garret W. Weston, 42 Affiliated Managers Group, Inc. (2008-Present): Managing Director, Head of Affiliate Product Strategy and Development (2023-Present), Managing Director, Co-Head of Affiliate Engagement, Distribution (2021-2022), Senior Vice President, Office of the CEO (2019-2021), Senior Vice President, Affiliate Development (2016-2019), Vice President, Office of the CEO (2015-2016), Vice President, New Investments (2008-2015); Associate, Madison Dearborn Partners (2006-2008); Analyst, Merrill Lynch (2004-2006). |
Officers
| | |
Position(s) Held with Fund and Length of Time Served | | Name, Age, Principal Occupation(s) During Past 5 Years |
| | |
• President since 2018 • Principal Executive Officer since 2018 • Chief Executive Officer since 2018 • Chief Operating Officer since 2007 | | Keitha L. Kinne, 65 Managing Director, Head of Platform and Operations, AMG Funds LLC (2023-Present); Chief Operating Officer, AMG Funds LLC (2007-Present); Chief Investment Officer, AMG Funds LLC (2008-Present); President and Principal, AMG Distributors, Inc. (2018-Present); Chief Operating Officer, AMG Distributors, Inc. (2007-Present); President, Chief Executive Officer and Principal Executive Officer, AMG Funds, AMG Funds I, AMG Funds II, AMG Funds III and AMG Funds IV (2018-Present); Chief Operating Officer, AMG Funds, AMG Funds I, AMG Funds II, and AMG Funds III (2007-Present); Chief Operating Officer, AMG Funds IV (2016-Present); Chief Operating Officer and Chief Investment Officer, Aston Asset Management, LLC (2016); President and Principal Executive Officer, AMG Funds, AMG Funds I, AMG Funds II and AMG Funds III (2012-2014); Managing Partner, AMG Funds LLC (2007-2014); President and Principal, AMG Distributors, Inc. (2012-2014); Managing Director, Legg Mason & Co., LLC (2006-2007); Managing Director, Citigroup Asset Management (2004-2006). |
| | |
• Secretary since 2015 • Chief Legal Officer since 2015 | | Mark J. Duggan, 58 Managing Director and Senior Counsel, AMG Funds LLC (2021-Present); Senior Vice President and Senior Counsel, AMG Funds LLC (2015-2021); Secretary and Chief Legal Officer, AMG Funds, AMG Funds I, AMG Funds II, AMG Funds III and AMG Funds IV (2015-Present); Attorney, K&L Gates, LLP (2009-2015). |
| | |
• Chief Financial Officer since 2017 • Treasurer since 2017 • Principal Financial Officer since 2017 • Principal Accounting Officer since 2017 | | Thomas G. Disbrow, 57 Vice President, Mutual Fund Treasurer & CFO, AMG Funds, AMG Funds LLC (2017-Present); Chief Financial Officer, Principal Financial Officer, Treasurer and Principal Accounting Officer, AMG Funds, AMG Funds I, AMG Funds II, AMG Funds III and AMG Funds IV (2017-Present); Managing Director-Global Head of Traditional Funds Product Control, UBS Asset Management (Americas), Inc. (2015-2017); Managing Director-Head of North American Funds Treasury, UBS Asset Management (Americas), Inc. (2011-2015). |
78
| | |
| | | AMG Funds Trustees and Officers (continued) |
| | | |
| | | |
| | |
Position(s) Held with Fund and Length of Time Served | | Name, Age, Principal Occupation(s) During Past 5 Years |
| | |
• Deputy Treasurer since 2017 | | John A. Starace, 53 Vice President, Mutual Fund Accounting, AMG Funds LLC (2021-Present); Director, Mutual Fund Accounting, AMG Funds LLC (2017-2021); Vice President, Deputy Treasurer of Mutual Funds Services, AMG Funds LLC (2014-2017); Deputy Treasurer, AMG Funds, AMG Funds I, AMG Funds II, AMG Funds III and AMG Funds IV (2017-Present); Vice President, Citi Hedge Fund Services (2010-2014); Audit Senior Manager (2005-2010) and Audit Manager (2001-2005), Deloitte & Touche LLP. |
| | |
• Chief Compliance Officer and Sarbanes-Oxley Code of Ethics Compliance Officer since 2019 • Anti-Money Laundering Compliance Officer since 2022 | | Patrick J. Spellman, 49 Vice President, Chief Compliance Officer, AMG Funds LLC (2017-Present); Chief Compliance Officer, AMG Distributors, Inc. (2010-Present); Chief Compliance Officer and Sarbanes-Oxley Code of Ethics Compliance Officer, AMG Funds, AMG Funds I, AMG Funds II, AMG Funds III and AMG Funds IV (2019-Present); Anti-Money Laundering Compliance Officer, AMG Funds, AMG Funds I, AMG Funds II, and AMG Funds III (2014-2019; 2022-Present); Anti-Money Laundering Compliance Officer, AMG Funds IV (2016-2019; 2022-Present); Senior Vice President, Chief Compliance Officer, AMG Funds LLC (2011-2017); Compliance Manager, Legal and Compliance, Affiliated Managers Group, Inc. (2005-2011). |
| | |
• Assistant Secretary since 2016 | | Maureen M. Kerrigan, 38 Vice President, Senior Counsel, AMG Funds LLC (2021-Present); Vice President, Counsel, AMG Funds LLC (2019-2021); Director, Counsel, AMG Funds LLC (2017-2018); Vice President, Counsel, AMG Funds LLC (2015-2017); Assistant Secretary, AMG Funds, AMG Funds I, AMG Funds II, AMG Funds III and AMG Funds IV (2016-Present); Associate, Ropes & Gray LLP (2011-2015); Law Fellow, Massachusetts Appleseed Center for Law and Justice (2010-2011). |
79
THIS PAGE INTENTIONALLY LEFT BLANK
|
|
|

|
|
|
|
|
| | | | |
INVESTMENT MANAGER AND ADMINISTRATOR AMG Funds LLC 680 Washington Blvd., Suite 500 Stamford, CT 06901 800.548.4539 DISTRIBUTOR AMG Distributors, Inc. 680 Washington Blvd., Suite 500 Stamford, CT 06901 800.548.4539 SUBADVISER GW&K Investment Management, LLC 222 Berkeley St. Boston, MA 02116 | | CUSTODIAN The Bank of New York Mellon Mutual Funds Custody 6023 Airport Road Orisk any, NY 13424 LEGAL COUNSEL Ropes & Gray LLP Prudential Tower, 800 Boylston Street Boston, MA 02199-3600 TRANSFER AGENT BNY Mellon Investment Servicing (US) Inc. AMG Funds Attn: 534426 AIM 154-0520 500 Ross Street Pittsburgh, PA 15262 800.548.4539 | | This report is prepared for the Funds’ shareholders. It is authorized for distribution to prospective investors only when preceded or accompanied by an effective prospectus. To receive a free copy of the prospectus or Statement of Additional Information, which includes additional information about Fund Trustees, please contact us by calling 800.548.4539. Distributed by AMG Distributors, Inc., member FINRA/SIPC. Current net asset values per share for each Fund are available on the Funds’ website at wealth.amg.com. A description of the policies and procedures each Fund uses to vote its proxies is available: (i) without charge, upon request, by calling 800.548.4539, or (ii) on the Securities and Exchange Commission’s (SEC) website at sec.gov. For information regarding each Fund’s proxy voting record for the 12-month period ended June 30, call 800.548.4539 or visit the SEC website at sec.gov. The Funds file their complete schedule of portfolio holdings with the SEC for the first and third quarters of each fiscal year as an exhibit to their reports on Form N-PORT. The Funds’ portfolio holdings on Form N-PORT are available on the SEC’s website at sec.gov and the Funds’ website at wealth.amg.com. To review a complete list of the Funds’ portfolio holdings, or to view the most recent semi-annual report or annual report, please visit wealth.amg.com. |
|
|
|
|
|
|
|
|
| | | | | | |
EQUITY FUNDS AMG Beutel Goodman International Equity Beutel, Goodman & Company Ltd. AMG Boston Common Global Impact Boston Common Asset Management, LLC AMG Frontier Small Cap Growth Frontier Capital Management Co., LLC AMG GW&K Small Cap Core AMG GW&K Small Cap Value AMG GW&K Small/Mid Cap Core AMG GW&K Small/Mid Cap Growth AMG GW&K International Small Cap GW&K Investment Management, LLC AMG Montrusco Bolton Large Cap Growth Montrusco Bolton Investments, Inc. AMG Renaissance Large Cap Growth The Renaissance Group LLC | | | | AMG River Road Dividend All Cap Value AMG River Road Focused Absolute Value AMG River Road Large Cap Value Select AMG River Road Mid Cap Value AMG River Road Small-Mid Cap Value AMG River Road Small Cap Value River Road Asset Management, LLC AMG TimesSquare Emerging Markets Small Cap AMG TimesSquare Global Small Cap AMG TimesSquare International Small Cap AMG TimesSquare Mid Cap Growth AMG TimesSquare Small Cap Growth TimesSquare Capital Management, LLC AMG Veritas Asia Pacific AMG Veritas China AMG Veritas Global Focus AMG Veritas Global Real Return Veritas Asset Management LLP AMG Yacktman AMG Yacktman Focused AMG Yacktman Global AMG Yacktman Special Opportunities Yacktman Asset Management LP | | FIXED INCOME FUNDS AMG Beutel Goodman Core Plus Bond Beutel, Goodman & Company Ltd. AMG GW&K Core Bond ESG AMG GW&K Enhanced Core Bond ESG AMG GW&K ESG Bond AMG GW&K High Income AMG GW&K Municipal Bond AMG GW&K Municipal Enhanced Yield GW&K Investment Management, LLC |
| | | | |
| wealth.amg.com | | | | 123123 AR088 |
| | |

| | ANNUAL REPORT |
| | | |
| | | |
| | |
| | | AMG Funds December 31, 2023 |
| | |
| | | 
|
| | |
| | | AMG GW&K Small Cap Core Fund |
| | |
| | | Class N: GWETX | Class I: GWEIX | Class Z: GWEZX |
| | |
| | | AMG GW&K Small Cap Value Fund |
| | |
| | | Class N: SKSEX | Class I: SKSIX | Class Z: SKSZX |
| | |
| | | AMG GW&K Small/Mid Cap Core Fund (formerly AMG GW&K Small/Mid Cap Fund) |
| | |
| | | Class N: GWGVX | Class I: GWGIX | Class Z: GWGZX |
| | |
| | | AMG GW&K Global Allocation Fund |
| | |
| | | Class N: MBEAX | Class I: MBESX | Class Z: MBEYX |
| | |
| | | |
| | |
| | | |
| | | | |
| wealth.amg.com | | | | 123123 AR089 |
| | |
| | | AMG Funds Annual Report — December 31, 2023 |
| | | |
| | | |
| | | | | | |
| | |
| | | | | | | |
| | | TABLE OF CONTENTS | | PAGE | |
| | | | |
| | | |
| | | LETTER TO SHAREHOLDERS | | | 2 | |
| | | |
| | | ABOUT YOUR FUND’S EXPENSES | | | 3 | |
| | | |
| | | PORTFOLIO MANAGER’S COMMENTS, FUND SNAPSHOTS AND SCHEDULES OF PORTFOLIO INVESTMENTS | | | | |
| | | |
| | | AMG GW&K Small Cap Core Fund | | | 4 | |
| | | |
| | | AMG GW&K Small Cap Value Fund | | | 10 | |
| | | |
| | | AMG GW&K Small/Mid Cap Core Fund | | | 17 | |
| | | |
| | | AMG GW&K Global Allocation Fund | | | 22 | |
| | | |
| | | FINANCIAL STATEMENTS | | | | |
| | | |
| | | Statement of Assets and Liabilities | | | 27 | |
| | | |
| | | Balance sheets, net asset value (NAV) per share computations
and cumulative distributable earnings (loss) | | | | |
| | | |
| | | Statement of Operations | | | 29 | |
| | | |
| | | Detail of sources of income, expenses, and realized and
unrealized gains (losses) during the fiscal year | | | | |
| | | |
| | | Statements of Changes in Net Assets | | | 30 | |
| | | |
| | | Detail of changes in assets for the past two fiscal years | | | | |
| | | |
| | | Financial Highlights | | | 32 | |
| | | |
| | | Historical net asset values per share, distributions, total returns, income
and expense ratios, turnover ratios and net assets | | | | |
| | | |
| | | Notes to Financial Statements | | | 44 | |
| | | |
| | | Accounting and distribution policies, details of agreements and
transactions with Fund management and affiliates, and descriptions of
certain investment risks | | | | |
| | | |
| | | REPORT OF INDEPENDENT REGISTERED PUBLIC ACCOUNTING FIRM | | | 52 | |
| | | |
| | | OTHER INFORMATION | | | 53 | |
| | | |
| | | TRUSTEES AND OFFICERS | | | 55 | |
| | | | | | | |
|
Nothing contained herein is to be considered an offer, sale or solicitation of an offer to buy shares of any series of the AMG Funds Family of Funds. Such offering is made only by prospectus, which includes details as to offering price and other material information. | |
| | |
| | Letter to Shareholders |
| | | |
| | | |
Dear Shareholder:
We are pleased to provide this annual report for your investment with AMG Funds. Our foremost goal is to provide investment solutions that help our shareholders successfully achieve their long-term investment goals. We appreciate the privilege of providing you with investment tools.
Throughout most of the year, markets wrestled with uncertainties around tighter monetary policy, increased geopolitical tension, instability in the regional banking sector, and political handwringing over the U.S. debt ceiling. However, investors remained optimistic for an economic “soft landing” as inflation continued to ease and risk assets finally surged in the fourth quarter following a dovish pivot in the U.S. Federal Reserve (the “Fed”) policy. Bonds finished with a positive return; a remarkable development after struggling to move higher for most of the year as global central banks raised interest rates.
The S&P 500® Index gained 26.29% for the fiscal year ended December 31, 2023, fully recouping losses suffered in 2022. Large-cap stocks diverged from small-cap stocks, particularly driven by a handful of mega-cap technology and consumer discretionary stocks. The Russell 1000® Index gained 26.53% compared to the 16.93% return for the Russell 2000® Index. Nine out of eleven sectors posted positive returns, with information technology (60.93%), communication services (55.86%), and consumer discretionary (43.22%) leading the way. The weakest sectors were utilities (-7.08%), energy (-1.33%), and consumer staples (+0.55%). The strength in information technology drove growth stocks to strongly outperform value stocks with the Russell 1000® Growth Index gaining 42.68% compared to a 11.46% return for the Russell 1000® Value Index. Outside the U.S., foreign equity markets underperformed domestic equities, delivering a 15.62% return, as measured by the MSCI All Country World Index ex USA benchmark.
The Bloomberg U.S. Aggregate Bond Index, a broad measure of U.S. bond market performance, rebounded with a 5.53% return over the period. The 10-year Treasury yield climbed to post-GFC (Global Financial Crisis) highs through October as the Fed tightened policy throughout the year, leading many to expect another year of negative bond returns. However, investors received much needed relief as interest rates fell sharply in the final two months of the year following the Fed’s message signaling rate cuts in 2024. Looking across the broadest sectors of the market, investment-grade corporate bonds gained 8.52% for the year, while agency mortgage-backed securities rose 5.05%. High yield bonds were the best performing sector with a 13.44% return as measured by the return of the Bloomberg U.S. Corporate High Yield Bond Index. Municipal bonds outperformed the broader market with a 6.40% gain for the Bloomberg Municipal Bond Index. Outside the U.S., foreign bonds were also positive as the Bloomberg Global Aggregate ex-USD Index gained 5.72%.
AMG Funds provides access to a distinctive array of actively managed return-oriented investment strategies. You can rest assured that under all market conditions our team is focused on delivering excellent investment management services for your benefit. For more information about AMG Funds’ wide range of products and resources, please visit wealth.amg.com. We thank you for your investment and continued trust in AMG Funds.
Respectfully,
Keitha Kinne
President
AMG Funds
| | | | | | | | | | | | | | |
| | | | | Periods ended | |
| Average Annual Total Returns | | December 31, 2023* | |
| | | | |
| Stocks: | | | | 1 Year | | | 3 Years | | | 5 Years | |
| | | | |
Large Cap | | (S&P 500® Index) | | | 26.29 | % | | | 10.00 | % | | | 15.69 | % |
| | | | |
Small Cap | | (Russell 2000® Index) | | | 16.93 | % | | | 2.22 | % | | | 9.97 | % |
| | | | |
International | | (MSCI ACWI ex USA) | | | 15.62 | % | | | 1.55 | % | | | 7.08 | % |
| | | | |
Bonds: | | | | | | | | | | | | | | |
| | | | |
Investment Grade | | (Bloomberg U.S. Aggregate Bond Index) | | | 5.53 | % | | | (3.31 | )% | | | 1.10 | % |
| | | | |
High Yield | | (Bloomberg U.S. Corporate High Yield Bond Index) | | | 13.44 | % | | | 1.98 | % | | | 5.37 | % |
| | | | |
Tax-exempt | | (Bloomberg Municipal Bond Index) | | | 6.40 | % | | | (0.40 | )% | | | 2.25 | % |
| | | | |
Treasury Bills | | (ICE BofAML U.S. 6-Month Treasury Bill Index) | | | 5.14 | % | | | 2.17 | % | | | 2.02 | % |
*Source: FactSet. Past performance is no guarantee of future results.
2
| | |
| | | About Your Fund’s Expenses |
| | | |
| | | |
| | | | | | | | |
As a shareholder of a Fund, you may incur two types of costs: (1) transaction costs, which may include sales charges (loads) on purchase payments; redemption fees; and exchange fees; and (2) ongoing costs, including management fees; distribution (12b-1) fees; and other Fund expenses. This example is intended to help you understand your ongoing costs (in dollars) of investing in the Fund and to compare these costs with the ongoing costs of investing in other mutual funds. The example is based on $1,000 invested at the beginning of the period and held for the entire period as indicated below. ACTUAL EXPENSES The first section of the following table provides information about the actual account values and | | | | actual expenses. You may use the information in this section, together with the amount you invested, to estimate the expenses that you paid over the period. Simply divide your account value by $1,000 (for example, an $8,600 account value divided by $1,000 = 8.6), then multiply the result by the number in the first section under the heading entitled “Expenses Paid During the Period” to estimate the expenses you paid on your account during this period. HYPOTHETICAL EXAMPLE FOR COMPARISON PURPOSES The second section of the following table provides information about hypothetical account values and hypothetical expenses based on the Fund’s actual expense ratio and an assumed annual rate of return of 5% before expenses, which is not the Fund’s | | | | actual return. The hypothetical account values and expenses may not be used to estimate the actual ending account balance or expenses you paid for the period. You may use this information to compare the ongoing costs of investing in the Fund and other funds by comparing this 5% hypothetical example with the 5% hypothetical examples that appear in the shareholder reports of other funds. Please note that the expenses shown in the table are meant to highlight your ongoing costs only and do not reflect any transactional costs, such as sales charges (loads), redemption fees, or exchange fees. Therefore, the second section of the table is useful in comparing ongoing costs only, and will not help you determine the relative total costs of owning different funds. |
| | | | | | | | |
| | | | | | | | | | |
Six Months Ended
December 31, 2023 | | Expense
Ratio for
the Period | | Beginning
Account
Value
07/01/23 | | Ending
Account
Value
12/31/23 | | | Expenses
Paid
During
the Period* |
AMG GW&K Small Cap Core Fund |
|
Based on Actual Fund Return |
Class N | | 1.30% | | $1,000 | | | $1,046 | | | $6.70 |
Class I | | 0.95% | | $1,000 | | | $1,048 | | | $4.90 |
Class Z | | 0.90% | | $1,000 | | | $1,048 | | | $4.65 |
|
Based on Hypothetical 5% Annual Return |
Class N | | 1.30% | | $1,000 | | | $1,019 | | | $6.61 |
Class I | | 0.95% | | $1,000 | | | $1,020 | | | $4.84 |
Class Z | | 0.90% | | $1,000 | | | $1,021 | | | $4.58 |
AMG GW&K Small Cap Value Fund |
|
Based on Actual Fund Return |
Class N | | 1.15% | | $1,000 | | | $1,118 | | | $6.14 |
Class I | | 0.95% | | $1,000 | | | $1,119 | | | $5.07 |
Class Z | | 0.90% | | $1,000 | | | $1,119 | | | $4.81 |
|
Based on Hypothetical 5% Annual Return |
Class N | | 1.15% | | $1,000 | | | $1,019 | | | $5.85 |
Class I | | 0.95% | | $1,000 | | | $1,020 | | | $4.84 |
Class Z | | 0.90% | | $1,000 | | | $1,021 | | | $4.58 |
AMG GW&K Small/Mid Cap Core Fund |
|
Based on Actual Fund Return |
Class N | | 1.07% | | $1,000 | | | $1,079 | | | $5.61 |
Class I | | 0.87% | | $1,000 | | | $1,080 | | | $4.56 |
Class Z | | 0.82% | | $1,000 | | | $1,081 | | | $4.30 |
|
Based on Hypothetical 5% Annual Return |
Class N | | 1.07% | | $1,000 | | | $1,020 | | | $5.45 |
Class I | | 0.87% | | $1,000 | | | $1,021 | | | $4.43 |
Class Z | | 0.82% | | $1,000 | | | $1,021 | | | $4.18 |
| | | | | | | | | | |
Six Months Ended
December 31, 2023 | | Expense
Ratio for
the Period | | Beginning
Account
Value
07/01/23 | | Ending
Account
Value
12/31/23 | | | Expenses
Paid
During
the Period* |
AMG GW&K Global Allocation Fund |
|
Based on Actual Fund Return |
Class N | | 0.99% | | $1,000 | | | $993 | | | $4.97 |
Class I | | 0.85% | | $1,000 | | | $993 | | | $4.27 |
Class Z | | 0.77% | | $1,000 | | | $995 | | | $3.87 |
|
Based on Hypothetical 5% Annual Return |
Class N | | 0.99% | | $1,000 | | | $1,020 | | | $5.04 |
Class I | | 0.85% | | $1,000 | | | $1,021 | | | $4.33 |
Class Z | | 0.77% | | $1,000 | | | $1,021 | | | $3.92 |
| * | Expenses are equal to the Fund’s annualized expense ratio multiplied by the average account value over the period, multiplied by the number of days in the most recent fiscal half-year (184), then divided by 365. |
3
| | |
| | | AMG GW&K Small Cap Core Fund Portfolio Manager’s Comments (unaudited) |
| | | |
| | | |
| | | | | | | | |
THE YEAR IN REVIEW For the year ended December 31, 2023, AMG GW&K Small Cap Core Fund (the “Fund”) Class N shares returned 8.02%, compared with the Fund’s benchmark, the Russell 2000® Index (the “Index”), which returned 16.93%. If we are anything alike, you are hoping the words “pivot” and “landing” are retired from the financial lexicon in 2024. The past year has been ALL about the macro and the U.S. Federal Reserve’s (the “Fed”) activities. Will they keep raising, stay higher for longer, or could they pause? By the time we reached December, investors pivoted to arguing about how many rate cuts were coming. Market participants shifted their views of economic conditions in 2023 as many times as Sam Bankman-Fried was convicted for fraud. Hard landing, soft landing, no landing. Bulls continuously thought there would be no recession and a pivot was just around the corner. Bears figured either the Fed’s rapid interest-rate increase would break something, causing earnings estimates to fall, or stickier inflation would keep the Fed firm. For now, it appears the bulls were correct. However, given the rapid change in perspectives during 2023, investors assuming the bulls get the last word might also be shocked when a Barbie movie sequel or spinoff is announced. In fact, it is possible the Oppenheimer-Barbie cinematic linkage is the best example of 2023 markets you can find: two polar opposite experiences, improbably embraced simultaneously and relatedly. Inflation, higher interest rates, a banking crisis, and higher for longer in one theater, while the other audience watches a resilient economy, peaking monetary policy, and a bull market for financial assets. Stock investors were especially rewarded as the year came to a close, this time even those owning US small caps. The bulls emerge victorious for now but keep watch for changes to the outlook and the release of a Ken movie prequel. The Index jumped 14.0% in the fourth quarter to finish the year with an impressive 16.9% return. During the year, sector leadership came from information technology, consumer discretionary, and industrials. Lagging performance came especially | | | | from utilities, while health care and communication services delivered less than half of the Index return. Housing-related industries were up well over 50% and some extraordinary individual stocks drove high returns in technology hardware, personal care, and beverages. Banks were just below flat on the year and joined life science tools & services, food, and containers/packaging among the laggards. Related to these last two industries, the lowest-beta quintile of the Index was ignored in the rally, increasing just 6.7%. Other factor oddities included the 30.3% return from the lowest-valuation quintile and languishing returns from the middle Return-on-Equity (ROE) group. Stepping back, it appears our lower risk profile and lack of exposure in areas such as biotech, unprofitable tech, and housing or building products played a factor in our underperformance. We were far too cautiously positioned relative to the benchmark in areas such as housing and related construction materials and services, missed some critical one-off big winners, and suffered selection challenges which could not be overcome. The macro-centric backdrop certainly played a role, as likely did the ebbing of the tide from two previous strong years of Fund relative performance. By sector, health care suffered half our deficit, although it is still our best performer over three years. Our holdings had nearly universally weak stock performance, although in most cases the fundamentals were sound and results not meaningfully different from our expectations in January 2023. We missed several benchmark names with truly epic price appreciation, which cost over 100 bps of performance. Information technology experienced a dual hit to relative results from both our holdings and a few moon shots in the Index, where investors fancied a host of bitcoin and artificial intelligence (AI) related stocks. Totaling the impact of just six of these stocks created a headwind of 90 bps given their size and triple-digit returns. Finally, we were absent the cyclical semi cap equipment space, which jumped 55%. | | | | Other sectors worth mentioning include financials and energy on the negative side of the ledger and industrials in the plus column. Financials suffered from weak stock selection in banks and Insurance. Higher exposure to commercial Real Estate (particularly office) and unanticipated credit events during the year were the main issues, but even those with solid execution suffered if they had above industry average valuations. In energy, our exploration & production holdings mostly hit numbers but lagged more dynamic performers. The industrials sector was a lone bright spot with strongly positive stock selection. The common theme among the best performers was solid revenue and order growth relative to expectations, good margin performance, and valuation expansion. As we look forward into 2024, we are hopeful for a shift within the investing environment. Instead of pivots and landings or bitcoin and AI vaporware, we would prefer to focus on near and intermediate term earnings and cash-flow generation potential. While the market was hypersensitive to macro outcomes in 2023, consistent and sustainable earnings growth was often not the driving factor for returns. There are lessons to be learned from our stock selection, and we will study those and use them to improve our analytical thinking and investment process. We continue to believe consistent and sustainable growers will outperform the benchmark over long periods, as investors tire of rebound trades and other short-term infatuations. We think it is a mistake to assume the outcome of this economic cycle is decided. The yield curve remains inverted, and the resilient economy has of late been partially supported by fiscal stimulus. It is uncertain if we will be able to avoid a recession over the next 12 months. As we enter 2024, we’re hoping it is the year where stock-specific fundamentals and small cap stocks trump the macro. The views expressed represent the opinions of GW&K Investment Management, LLC as of December 31, 2023, and are not intended as a forecast or guarantee of future results, and are subject to change without notice. |
4
|
AMG GW&K Small Cap Core Fund Portfolio Manager’s Comments (continued) |
CUMULATIVE TOTAL RETURN PERFORMANCE
AMG GW&K Small Cap Core Fund’s cumulative total return is based on the daily change in net asset value (NAV), and assumes that all dividends and distributions were reinvested. The graph compares a hypothetical $10,000 investment made in the AMG GW&K Small Cap Core Fund’s Class N shares on December 31, 2013, to a $10,000 investment made in the Russell 2000® Index for the same time period. The graph and table do not reflect the deduction of taxes that a shareholder would pay on a Fund distribution or redemption of shares. The listed returns for the Fund are net of expenses and the returns for the index exclude expenses. Total returns would have been lower had certain expenses not been reduced.
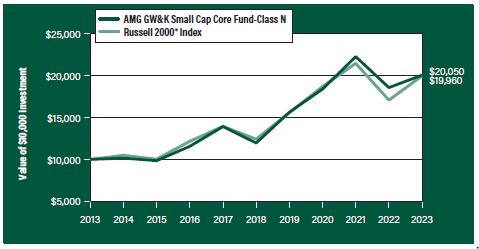
The table below shows the average annual total returns for the AMG GW&K Small Cap Core Fund and the Russell 2000® Index for the same time periods ended December 31, 2023.
| | | | | | | | | | | | | | | | | | | | |
| | | One | | | Five | | | Ten | | | Since | | | Inception | |
| Average Annual Total Returns1 | | Year | | | Years | | | Years | | | Inception | | | Date | |
AMG GW&K Small Cap Core Fund2, 3, 4, 5, 6, 7, 8 | |
| | | | | |
Class N | | | 8.02% | | | | 10.90% | | | | 7.20% | | | | 8.08% | | | | 12/10/96 | |
| | | | | |
Class I | | | 8.39% | | | | 11.29% | | | | 7.60% | | | | 12.03% | | | | 07/27/09 | |
| | | | | |
Class Z | | | 8.44% | | | | 11.33% | | | | — | | | | 8.01% | | | | 02/24/17 | |
| | | | | |
Russell 2000® Index9 | | | 16.93% | | | | 9.97% | | | | 7.16% | | | | 8.01% | | | | 12/10/96 | † |
The performance data shown represents past performance. Past performance is not a guarantee of future results. Current performance may be lower or higher than the performance data quoted. The investment return and principal value of an investment will fluctuate so that an investor’s shares, when redeemed, may be worth more or less than their original cost.
Investors should carefully consider the Fund’s investment objectives, risks, charges and expenses before investing. For performance information through the most recent month end, current net asset values per share for the Fund and other information, please call 800.548.4539 or visit our website at wealth.amg.com for a free prospectus. Read it carefully before investing or sending money.
Distributed by AMG Distributors, Inc., member FINRA/SIPC.
| † | Date reflects the inception date of the Fund, not the index. |
| 1 | Total return equals income yield plus share price change and assumes reinvestment of all dividends and capital gain distributions. Returns are net of fees and may reflect offsets of Fund expenses as described in the prospectus. No adjustment has been made for taxes payable by shareholders on their reinvested dividends and |
| | capital gain distributions. Returns for periods greater than one year are annualized. The listed returns on the Fund are net of expenses and based on the published NAV as of December 31, 2023. All returns are in U.S. Dollars ($). |
| 2 | From time to time, the Fund’s Investment Manager has waived its fees and/or absorbed Fund expenses, which has resulted in higher returns. |
| 3 | Market prices of investments held by the Fund may fall rapidly or unpredictably due to a variety of factors, including economic, political, or market conditions, or other factors including terrorism, war, natural disasters and the spread of infectious illness or other public health issues, including epidemics or pandemics, or in response to events that affect particular industries or companies. |
| 4 | The stocks of small-capitalization companies often have greater price volatility, lower trading volume, and less liquidity than the stocks of larger, more established companies. |
| 5 | The prices of equity securities of companies that are expected to experience relatively rapid earnings growth, or “growth stocks,” may be more sensitive to market movements because the prices tend to reflect future investor expectations rather than just current profits. |
| 6 | Value stocks may perform differently from the market as a whole and may be undervalued by the market for a long period of time. |
| 7 | Because the Fund is an actively managed investment portfolio, security selection or focus on securities in a particular style, market sector or group of companies may cause the Fund to incur losses or underperform relative to its benchmarks or other funds with a similar investment objective. There can be no guarantee that the Subadviser’s investment techniques and risk analysis will produce the desired result. |
| 8 | The Fund may not be able to dispose of particular investments, such as illiquid securities, readily at favorable times or prices or the Fund may have to sell them at a loss. |
| 9 | The Russell 2000® Index is composed of the 2,000 smallest stocks in the Russell 3000® Index and is widely regarded in the industry as the premier measure of small-cap stock performance. Unlike the Fund, the Russell 2000® Index is unmanaged, is not available for investment and does not incur expenses. |
The Russell Indices are trademarks of the London Stock Exchange Group companies.
Not FDIC insured, nor bank guaranteed. May lose value.
5
| | |
| | | AMG GW&K Small Cap Core Fund Fund Snapshots (unaudited) December 31, 2023 |
| | | |
| | | |
PORTFOLIO BREAKDOWN
| | |
Sector | | % of
Net Assets |
| | |
Industrials | | 18.5 |
| | |
Health Care | | 17.2 |
| | |
Financials | | 16.2 |
| | |
Consumer Discretionary | | 13.2 |
| | |
Information Technology | | 13.0 |
| | |
Materials | | 6.0 |
| | |
Real Estate | | 5.3 |
| | |
Energy | | 4.4 |
| | |
Consumer Staples | | 2.8 |
| | |
Utilities | | 2.2 |
| | |
Short-Term Investments | | 1.2 |
| | |
Other Assets, less Liabilities | | 0.01 |
TOP TEN HOLDINGS
| | |
Security Name | | % of
Net Assets |
| | |
Texas Roadhouse, Inc. | | 2.1 |
| | |
SPX Technologies, Inc. | | 2.0 |
| | |
RBC Bearings, Inc. | | 2.0 |
| | |
Matador Resources Co. | | 1.9 |
| | |
STAG Industrial, Inc. | | 1.9 |
| | |
UFP Industries, Inc. | | 1.9 |
| | |
Novanta, Inc. | | 1.9 |
| | |
Avient Corp. | | 1.8 |
| | |
Medpace Holdings, Inc. | | 1.8 |
| | |
MACOM Technology Solutions Holdings, Inc. | | 1.7 |
| | | |
| | |
Top Ten as a Group | | 19.0 |
| | |
Because a fund’s strategy may result in multiple investments in particular sectors of the economy, its performance may depend on the performance of those sectors and may fluctuate more widely than investments diversified across more sectors. For additional information on these and other risk considerations, please see the Fund’s prospectus.
Any sectors, industries, or securities discussed should not be perceived as investment recommendations. Mention of a specific security should not be considered a recommendation to buy or solicitation to sell that security. Specific securities mentioned in this report may have been sold from the Fund’s portfolio of investments by the time you receive this report.
6
| | |
| | | AMG GW&K Small Cap Core Fund Schedule of Portfolio Investments December 31, 2023 |
| | | |
| | | |
| | | | | | | | |
| | |
Shares | | | Value | |
| | |
Common Stocks - 98.8% | | | | | | | | |
| |
Consumer Discretionary - 13.2% | | | | | |
| | |
Boot Barn Holdings, Inc.* | | | 84,120 | | | | $6,457,051 | |
| | |
Chuy’s Holdings, Inc.* | | | 124,174 | | | | 4,747,172 | |
| | |
First Watch Restaurant Group, Inc.* | | | 81,662 | | | | 1,641,406 | |
| | |
Fox Factory Holding Corp.* | | | 66,016 | | | | 4,454,760 | |
| | |
Grand Canyon Education, Inc.* | | | 66,609 | | | | 8,795,052 | |
| | |
Helen of Troy, Ltd.* | | | 39,844 | | | | 4,813,554 | |
| | |
Lithia Motors, Inc. | | | 29,876 | | | | 9,837,569 | |
| | |
Oxford Industries, Inc. | | | 76,851 | | | | 7,685,100 | |
| | |
Patrick Industries, Inc. | | | 66,007 | | | | 6,623,802 | |
| | |
Revolve Group, Inc.*,1 | | | 122,856 | | | | 2,036,953 | |
| | |
Skyline Champion Corp.* | | | 123,935 | | | | 9,203,413 | |
| | |
Texas Roadhouse, Inc. | | | 110,798 | | | | 13,542,840 | |
| | |
Tri Pointe Homes, Inc.* | | | 137,784 | | | | 4,877,554 | |
| | |
Total Consumer Discretionary | | | | | | | 84,716,226 | |
| |
Consumer Staples - 2.8% | | | | | |
| | |
Central Garden & Pet Co., Class A* | | | 241,084 | | | | 10,617,340 | |
| | |
Utz Brands, Inc. | | | 253,393 | | | | 4,115,102 | |
| | |
The Vita Coco Co., Inc.* | | | 122,275 | | | | 3,136,354 | |
| | |
Total Consumer Staples | | | | | | | 17,868,796 | |
| |
Energy - 4.4% | | | | | |
| | |
ChampionX Corp. | | | 165,498 | | | | 4,834,197 | |
| | |
Magnolia Oil & Gas Corp., Class A | | | 422,889 | | | | 9,003,307 | |
| | |
Matador Resources Co. | | | 218,634 | | | | 12,431,529 | |
| | |
Patterson-UTI Energy, Inc. | | | 206,944 | | | | 2,234,995 | |
| | |
Total Energy | | | | | | | 28,504,028 | |
| |
Financials - 16.2% | | | | | |
| | |
Ameris Bancorp | | | 171,780 | | | | 9,112,929 | |
| | |
AMERISAFE, Inc. | | | 93,685 | | | | 4,382,584 | |
| | |
Cathay General Bancorp | | | 165,340 | | | | 7,369,204 | |
| | |
Cohen & Steers, Inc.1 | | | 126,124 | | | | 9,551,371 | |
| | |
Flywire Corp.* | | | 387,237 | | | | 8,964,537 | |
| | |
Glacier Bancorp, Inc. | | | 133,092 | | | | 5,499,361 | |
| | |
Horace Mann Educators Corp. | | | 229,815 | | | | 7,514,950 | |
| | |
Houlihan Lokey, Inc. | | | 76,204 | | | | 9,137,622 | |
| | |
Independent Bank Corp. | | | 92,564 | | | | 6,091,637 | |
| | |
OceanFirst Financial Corp. | | | 352,295 | | | | 6,115,841 | |
| | |
Pacific Premier Bancorp, Inc. | | | 276,783 | | | | 8,057,153 | |
| | |
Seacoast Banking Corp. of Florida | | | 268,572 | | | | 7,643,559 | |
| | |
Stifel Financial Corp. | | | 138,217 | | | | 9,557,706 | |
| | |
UMB Financial Corp. | | | 55,000 | | | | 4,595,250 | |
| | |
Total Financials | | | | | | | 103,593,704 | |
| | | | | | | | |
| | |
Shares | | | Value | |
| |
Health Care - 17.2% | | | | | |
| | |
Arcutis Biotherapeutics, Inc.* | | | 338,381 | | | | $1,092,971 | |
| | |
Artivion, Inc.* | | | 233,943 | | | | 4,182,901 | |
| | |
AtriCure, Inc.* | | | 156,909 | | | | 5,600,082 | |
| | |
Azenta, Inc.* | | | 90,584 | | | | 5,900,642 | |
| | |
BioCryst Pharmaceuticals, Inc.* | | | 341,024 | | | | 2,042,734 | |
| | |
CryoPort, Inc.*,1 | | | 128,417 | | | | 1,989,179 | |
| | |
Globus Medical, Inc., Class A* | | | 147,942 | | | | 7,883,829 | |
| | |
Halozyme Therapeutics, Inc.* | | | 208,179 | | | | 7,694,296 | |
| | |
HealthEquity, Inc.* | | | 138,878 | | | | 9,207,611 | |
| | |
ICU Medical, Inc.* | | | 30,265 | | | | 3,018,631 | |
| | |
Insmed, Inc.* | | | 162,863 | | | | 5,047,124 | |
| | |
Integra LifeSciences Holdings Corp.* | | | 119,865 | | | | 5,220,121 | |
| | |
Intra-Cellular Therapies, Inc.* | | | 129,579 | | | | 9,280,448 | |
| | |
Medpace Holdings, Inc.* | | | 37,391 | | | | 11,461,463 | |
| | |
Phreesia, Inc.* | | | 292,061 | | | | 6,761,212 | |
| | |
Progyny, Inc.* | | | 149,613 | | | | 5,562,611 | |
| | |
Supernus Pharmaceuticals, Inc.* | | | 237,168 | | | | 6,863,642 | |
| | |
US Physical Therapy, Inc. | | | 59,441 | | | | 5,536,335 | |
| | |
Veracyte, Inc.* | | | 223,656 | | | | 6,152,777 | |
| | |
Total Health Care | | | | | | | 110,498,609 | |
| |
Industrials - 18.5% | | | | | |
| | |
Alamo Group, Inc. | | | 50,881 | | | | 10,694,677 | |
| | |
Allegiant Travel Co. | | | 37,517 | | | | 3,099,279 | |
| | |
CBIZ, Inc.* | | | 155,811 | | | | 9,752,211 | |
| | |
Chart Industries, Inc.*,1 | | | 44,070 | | | | 6,008,063 | |
| | |
Ducommun, Inc.* | | | 63,417 | | | | 3,301,489 | |
| | |
Heartland Express, Inc. | | | 153,339 | | | | 2,186,614 | |
| | |
ICF International, Inc. | | | 65,209 | | | | 8,743,875 | |
| | |
ITT, Inc. | | | 77,066 | | | | 9,195,515 | |
| | |
Paycor HCM, Inc.* | | | 311,685 | | | | 6,729,279 | |
| | |
Primoris Services Corp. | | | 269,791 | | | | 8,959,759 | |
| | |
RBC Bearings, Inc.* | | | 44,709 | | | | 12,737,147 | |
| | |
Shoals Technologies Group, Inc., Class A* | | | 332,567 | | | | 5,168,091 | |
| | |
SPX Technologies, Inc.* | | | 130,085 | | | | 13,139,886 | |
| | |
Terex Corp. | | | 122,987 | | | | 7,066,833 | |
| | |
UFP Industries, Inc. | | | 94,741 | | | | 11,894,733 | |
| | |
Total Industrials | | | | | | | 118,677,451 | |
| |
Information Technology - 13.0% | | | | | |
| | |
Allegro MicroSystems, Inc.* | | | 214,263 | | | | 6,485,741 | |
| | |
Appfolio, Inc., Class A* | | | 54,972 | | | | 9,523,349 | |
| | |
The Descartes Systems Group, Inc. (Canada)* | | | 114,038 | | | | 9,586,034 | |
| | |
Endava PLC, Sponsored ADR (United Kingdom)* | | | 89,019 | | | | 6,930,129 | |
The accompanying notes are an integral part of these financial statements.
7
| | |
| | | AMG GW&K Small Cap Core Fund Schedule of Portfolio Investments (continued) |
| | | |
| | | |
| | | | | | | | |
| | |
Shares | | | Value | |
| |
Information Technology - 13.0% | | | | | |
| | |
(continued) | | | | | | | | |
| | |
Intapp, Inc.*,1 | | | 220,306 | | | | $8,376,034 | |
| | |
MACOM Technology Solutions Holdings, Inc.* | | | 119,723 | | | | 11,128,253 | |
| | |
Novanta, Inc.* | | | 70,613 | | | | 11,891,936 | |
| | |
Rapid7, Inc.* | | | 91,963 | | | | 5,251,087 | |
| | |
Silicon Laboratories, Inc.* | | | 51,383 | | | | 6,796,430 | |
| | |
Viavi Solutions, Inc.* | | | 722,159 | | | | 7,272,141 | |
| | |
Total Information Technology | | | | | | | 83,241,134 | |
| |
Materials - 6.0% | | | | | |
| | |
Avient Corp. | | | 277,293 | | | | 11,527,070 | |
| | |
Balchem Corp. | | | 57,203 | | | | 8,508,946 | |
| | |
Minerals Technologies, Inc. | | | 122,847 | | | | 8,760,220 | |
| | |
Silgan Holdings, Inc. | | | 208,354 | | | | 9,428,018 | |
| | |
Total Materials | | | | | | | 38,224,254 | |
| |
Real Estate - 5.3% | | | | | |
| | |
Agree Realty Corp., REIT | | | 101,393 | | | | 6,382,689 | |
| | |
National Health Investors, Inc., REIT | | | 86,016 | | | | 4,803,993 | |
| | |
Ryman Hospitality Properties, Inc., REIT | | | 97,877 | | | | 10,772,343 | |
| | |
STAG Industrial, Inc., REIT | | | 310,922 | | | | 12,206,798 | |
| | |
Total Real Estate | | | | | | | 34,165,823 | |
| |
Utilities - 2.2% | | | | | |
| | |
IDACORP, Inc. | | | 64,930 | | | | 6,383,917 | |
| | |
Northwestern Energy Group, Inc. | | | 149,247 | | | | 7,595,180 | |
| |
Total Utilities | | | | 13,979,097 | |
| |
Total Common Stocks | | | | | |
(Cost $474,239,143) | | | | | | | 633,469,122 | |
| | |
| | | | | | | | |
| | | | | | | | |
| | | Principal
Amount | | | Value | |
| |
Short-Term Investments - 1.2% | | | | | |
| |
Joint Repurchase Agreements - 0.3%2 | | | | | |
| | |
Daiwa Capital Markets America, dated 12/29/23, due 01/02/24, 5.380% total to be received $795,438 (collateralized by various U.S. Government Agency Obligations and U.S. Treasuries, 0.000% - 7.500%, 03/22/24 - 01/01/54, totaling $810,960) | | | $794,963 | | | | $794,963 | |
| | |
RBC Dominion Securities, Inc., dated 12/29/23, due 01/02/24, 5.340% total to be received $1,000,593 (collateralized by various U.S. Government Agency Obligations and U.S. Treasuries, 0.000% - 7.500%, 01/15/24 - 12/01/53, totaling $1,020,000) | | | 1,000,000 | | | | 1,000,000 | |
| |
Total Joint Repurchase Agreements | | | | 1,794,963 | |
| |
Repurchase Agreements - 0.9% | | | | | |
| | |
Fixed Income Clearing Corp., dated 12/29/23 due 01/02/24, 5.150% total to be received $2,328,332 (collateralized by a U.S. Treasury, 0.125%, 01/15/32, totaling $2,373,602) | | | 2,327,000 | | | | 2,327,000 | |
| | |
Fixed Income Clearing Corp., dated 12/29/23, due 01/02/24, 5.150% total to be received $3,389,939 (collateralized by a U.S. Treasury, 4.125%, 09/30/27, totaling $3,455,767) | | | 3,388,000 | | | | 3,388,000 | |
| |
Total Repurchase Agreements | | | | 5,715,000 | |
| |
Total Short-Term Investments | | | | | |
(Cost $7,509,963) | | | | | | | 7,509,963 | |
| |
Total Investments - 100.0% | | | | | |
(Cost $481,749,106) | | | | | | | 640,979,085 | |
| |
Other Assets, less Liabilities - 0.0%# | | | | (263,811 | ) |
| |
Net Assets - 100.0% | | | | $640,715,274 | |
| |
| | | | | |
| * | Non-income producing security. |
| 1 | Some of these securities, amounting to $10,123,784 or 1.6% of net assets, were out on loan to various borrowers and are collateralized by cash and various U.S. Treasury Obligations. See Note 4 of Notes to Financial Statements. |
| 2 | Cash collateral received for securities lending activity was invested in these joint repurchase agreements. |
ADR American Depositary Receipt
REIT Real Estate Investment Trust
The accompanying notes are an integral part of these financial statements.
8
| | |
| | | AMG GW&K Small Cap Core Fund Schedule of Portfolio Investments (continued) |
| | | |
| | | |
The following table summarizes the inputs used to value the Fund’s investments by the fair value hierarchy levels as of December 31, 2023:
| | | | | | | | | | | | | | | | |
| | | Level 1 | | | Level 2 | | | Level 3 | | | Total | |
Investments in Securities | | | | | | | | | | | | | | | | |
| | | | |
Common Stocks† | | | $633,469,122 | | | | — | | | | — | | | | $633,469,122 | |
| | | | |
Short-Term Investments | | | | | | | | | | | | | | | | |
| | | | |
Joint Repurchase Agreements | | | — | | | | $1,794,963 | | | | — | | | | 1,794,963 | |
| | | | |
Repurchase Agreements | | | — | | | | 5,715,000 | | | | — | | | | 5,715,000 | |
| | | | | | | | | | | | | | | | |
| | | | |
Total Investments in Securities | | | $633,469,122 | | | | $7,509,963 | | | | — | | | | $640,979,085 | |
| | | | | | | | | | | | | | | | |
| † | All common stocks held in the Fund are Level 1 securities. For a detailed breakout of common stocks by major industry classification, please refer to the Fund’s Schedule of Portfolio Investments. |
For the fiscal year ended December 31, 2023, there were no transfers in or out of Level 3.
The accompanying notes are an integral part of these financial statements.
9
| | |
| | | AMG GW&K Small Cap Value Fund Portfolio Manager’s Comments (unaudited) |
| | | |
| | | |
| | | | | | | | |
For the fiscal year ended December 31, 2023, AMG GW&K Small Cap Value Fund (the “Fund”) Class N shares returned 17.43%, compared to a 14.65% return for the Russell 2000® Value Index (the “Index”), the Fund’s benchmark. If we are anything alike, you are hoping the words “pivot” and “landing” are retired from the financial lexicon in 2024. The past year has been ALL about the macro and the U.S Federal Reserve’s (the “Fed”) activities. Will they keep raising, stay higher for longer, or could they pause? By the time we reached December, investors pivoted to arguing about how many rate cuts were coming. Market participants shifted their views of economic conditions in 2023 as many times as Sam Bankman-Fried was convicted for fraud. Hard landing, soft landing, no landing. Bulls continuously thought there would be no recession and a pivot was just around the corner. Bears figured either the Fed’s rapid interest-rate increase would break something, causing earnings estimates to fall, or stickier inflation would keep the Fed firm. For now, it appears the bulls were correct. However, given the rapid change in perspectives during 2023, investors assuming the bulls get the last word might also be shocked when a Barbie movie sequel or spinoff is announced. In fact, it is possible the Oppenheimer-Barbie cinematic linkage is the best example of 2023 markets you can find: two polar opposite experiences, improbably embraced simultaneously and relatedly. Inflation, higher interest rates, a banking crisis, and higher for longer in one theater, while the other audience watches a resilient economy, peaking monetary policy, and a bull market for financial assets. Stock investors were especially rewarded to finish out the year, this time even those owning U.S. small caps. The bulls emerge victorious for now, but keep watch for changes to the outlook and the release of a Ken movie prequel. | | | | Focusing on the broader small cap market, the Russell 2000® Index jumped 14.0% in the fourth quarter to finish the year with an impressive 16.9% return. Sector leadership came from consumer discretionary, industrials, and information technology. Lagging performance came especially from utilities, while health care, communication services, and consumer staples delivered less than half of the Russell 2000® Index return. Housing-related industries were up well over 50% and some extraordinary individual stocks drove high returns in technology hardware, software, and construction & engineering. Banks were just below flat on the year, and joined broadline retail, communications equipment, and health care technology among the worst-performing industries. Compared to the Russell 2000 Value Index, our relative outperformance was driven by both strong stock selection and favorable sector allocation. Our strongest sectors were Health Care, Financials, Industrials, and Consumer Staples. In Health Care, performance benefited from both allocation and stock selection. Our underweight position in biotech helped performance, and was boosted by solid returns from several names, including Tenet Healthcare, NeoGenomics, Integer Holdings, and Albireo Pharma. Similarly, in financials both sector allocation (a slight underweight), and stock selection drove relative performance. Industrials benefited most from our overweight in construction & engineering, with strong selection across the sector. In Consumer Staples, our two holdings, Hostess Brands and Central Garden & Pet, outperformed by a wide margin, helped by the acquisition of Hostess by J.M. Smucker. The utilities and materials sectors also produced relative outperformance. | | | | Other sectors worth mentioning in brief include real estate and information technology on the negative side of the ledger. Poor stock selection drove relative performance in real estate as several of our long-term holdings suffered from the impact of rising interest rates. In information technology, our biggest headwind was our lack of exposure in software, an industry that was up 58.4% for the year. As we look forward into 2024, we are hopeful for a shift in the investing environment. Instead of pivots and landings or bitcoin and artificial intelligence (AI) vaporware, we would prefer to focus on near- and intermediate-term earnings and cash-flow generation potential. While the market was hypersensitive to macro outcomes in 2023, consistent and sustainable earnings growth was often not the driving factor for returns. There are lessons to be learned from our stock selection, and we will study those and use them to improve our analytical thinking and investment process. We continue to believe consistent and sustainable growers will outperform the benchmark over long periods, as investors tire of rebound trades and other short-term infatuations. We think it is a mistake to assume the outcome of this economic cycle is decided. The yield curve remains inverted, and the resilient economy has of late been partially supported by fiscal stimulus. It is uncertain if we will be able to avoid a recession over the next 12 months. As we enter 2024, we’re hoping it is the year where stock-specific fundamentals and small cap stocks trump the macro. The views expressed represent the opinions of GW&K Investment Management, LLC as of December 31, 2023, and are not intended as a forecast or guarantee of future results, and are subject to change without notice. |
| | | | | | | | |
10
|
AMG GW&K Small Cap Value Fund Portfolio Manager’s Comments (continued) |
| |
| |
CUMULATIVE TOTAL RETURN PERFORMANCE
AMG GW&K Small Cap Value Fund’s cumulative total return is based on the daily change in net asset value (NAV), and assumes that all dividends and distributions were reinvested. The graph compares a hypothetical $10,000 investment made in the AMG GW&K Small Cap Value Fund’s Class N shares on December 31, 2013, to a $10,000 investment made in the Russell 2000® Value Index for the same time period. The graph and table do not reflect the deduction of taxes that a shareholder would pay on a Fund distribution or redemption of shares. The listed returns for the Fund are net of expenses and the returns for the index exclude expenses. Total returns would have been lower had certain expenses not been reduced.
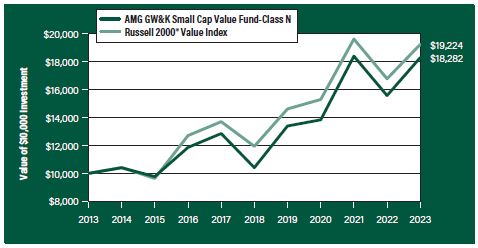
The table below shows the average annual total returns for the AMG GW&K Small Cap Value Fund and the Russell 2000® Value Index for the same time periods ended December 31, 2023.
| | | | | | | | | | | | | | | | | | | | |
| | | One | | | Five | | | Ten | | | Since | | | Inception | |
| Average Annual Total Returns1 | | Year | | | Years | | | Years | | | Inception | | | Date | |
AMG GW&K Small Cap Value Fund2, 3, 4, 5, 6, 7, 8, 9, 10 | | | | | | | | | |
| | | | | |
Class N | | | 17.43% | | | | 11.92% | | | | 6.22% | | | | 11.11% | | | | 04/23/87 | |
| | | | | |
Class I | | | 17.73% | | | | 12.14% | | | | — | | | | 6.61% | | | | 02/24/17 | |
| | | | | |
Class Z | | | 17.77% | | | | 12.20% | | | | — | | | | 6.67% | | | | 02/24/17 | |
| | | | | |
Russell 2000® Value Index11 | | | 14.65% | | | | 10.00% | | | | 6.76% | | | | — | | | | — | |
The performance data shown represents past performance. Past performance is not a guarantee of future results. Current performance may be lower or higher than the performance data quoted. The investment return and principal value of an investment will fluctuate so that an investor’s shares, when redeemed, may be worth more or less than their original cost.
Investors should carefully consider the Fund’s investment objectives, risks, charges and expenses before investing. For performance information through the most recent month end, current net asset values per share for the Fund and other information, please call 800.548.4539 or visit our website at wealth.amg.com for a free prospectus. Read it carefully before investing or sending money.
Distributed by AMG Distributors, Inc., member FINRA/SIPC.
| 1 | Total return equals income yield plus share price change and assumes reinvestment of all dividends and capital gain distributions. Returns are net of fees and may reflect offsets of Fund expenses as described in the prospectus. No adjustment has been made for taxes payable by shareholders on their reinvested dividends and capital gain distributions. Returns for periods greater than one year are annualized. The listed returns on the Fund are net of expenses and based on the published NAV as of December 31, 2023. All returns are in U.S. Dollars ($). |
| 2 | As of December 4, 2020, the Fund’s Subadviser was changed to GW&K Investment Management, LLC. Prior to December 4, 2020, the Fund was known as the AMG Managers Skyline Special Equities Fund, and had different principal investment strategies and corresponding risks. Performance shown for periods prior to December 4, 2020 reflects the performance and investment strategies of the Fund’s previous Subadviser, Skyline Asset Management, L.P. The Fund’s past performance would have been different if the Fund were managed by the current Subadviser and strategy, and the Fund’s prior performance record might be less pertinent for investors considering whether to purchase shares of the Fund. |
| 3 | From time to time, the Fund’s Investment Manager has waived its fees and/or absorbed Fund expenses, which has resulted in higher returns. |
| 4 | Market prices of investments held by the Fund may fall rapidly or unpredictably due to a variety of factors, including economic, political, or market conditions, or other factors including terrorism, war, natural disasters and the spread of infectious illness or other public health issues, including epidemics or pandemics, or in response to events that affect particular industries or companies. |
| 5 | The stocks of small-capitalization companies often have greater price volatility, lower trading volume, and less liquidity than the stocks of larger, more established companies. |
| 6 | Value stocks may perform differently from the market as a whole and may be undervalued by the market for a long period of time. |
| 7 | Because the Fund is an actively managed investment portfolio, security selection or focus on securities in a particular style, market sector or group of companies may cause the Fund to incur losses or underperform relative to its benchmarks or other funds with a similar investment objective. There can be no guarantee that the Subadviser’s investment techniques and risk analysis will produce the desired result. |
| 8 | The Fund may not be able to dispose of particular investments, such as illiquid securities, readily at favorable times or prices or the Fund may have to sell them at a loss. |
| 9 | Investments in the Fund may be subject to many of the same risks as a direct investment in real estate. The stock prices of companies in the real estate industry, including real estate investment trusts (“REITs”), are typically sensitive to changes in real estate values, property taxes, interest rates, cash flow of underlying real estate assets, occupancy rates, government regulations affecting zoning, land use, and rents, as well as the management skill and creditworthiness of the issuer. REITs also depend generally on their ability to generate cash flow to make distributions to shareholders or |
11
| | |
| | | AMG GW&K Small Cap Value Fund Portfolio Manager’s Comments (continued) |
| | | |
| | | |
| | | | | | | | |
unitholders and are subject to the risk of failing to qualify for favorable tax treatment under the Internal Revenue Code of 1986, as amended. 10 Issuers and companies that are in similar industry sectors may be similarly affected by particular economic or market events; to the extent the Fund has substantial holdings within a particular sector, the risks associated with that sector increase. | | | | 11 The Russell 2000® Value Index is an unmanaged, market-value weighted, value-oriented index comprised of small stocks that have relatively low price-to-book ratios and lower forecasted growth values. Unlike the Fund, the Russell 2000® Value Index is unmanaged, is not available for investment and does not incur expenses. | | | | The Russell Indices are trademarks of the London Stock Exchange Group companies. Not FDIC insured, nor bank guaranteed. May lose value. |
12
| | |
| | | AMG GW&K Small Cap Value Fund Fund Snapshots (unaudited) December 31, 2023 |
| | | |
| | | |
PORTFOLIO BREAKDOWN
| | |
Sector | | % of
Net Assets |
| | |
Financials | | 28.6 |
| | |
Industrials | | 15.4 |
| | |
Consumer Discretionary | | 12.3 |
| | |
Real Estate | | 10.0 |
| | |
Energy | | 8.9 |
| | |
Health Care | | 8.4 |
| | |
Information Technology | | 4.6 |
| | |
Materials | | 4.4 |
| | |
Utilities | | 3.1 |
| | |
Consumer Staples | | 2.0 |
| | |
Communication Services | | 1.4 |
| | |
Short-Term Investments | | 1.2 |
| | |
Other Assets, less Liabilities | | (0.3) |
TOP TEN HOLDINGS
| | | | |
Security Name | | % of
Net Assets | |
| | |
Group 1 Automotive, Inc. | | | 2.4 | |
| | |
Federal Agricultural Mortgage Corp., Class C | | | 2.3 | |
| | |
Selective Insurance Group, Inc. | | | 2.2 | |
| | |
Comfort Systems USA, Inc. | | | 2.2 | |
| | |
CBIZ, Inc. | | | 2.2 | |
| | |
Walker & Dunlop, Inc. | | | 2.1 | |
| | |
Piper Sandler Cos. | | | 2.1 | |
| | |
Orion, S.A. | | | 2.0 | |
| | |
Central Garden & Pet Co. | | | 2.0 | |
| | |
PJT Partners, Inc., Class A | | | 1.8 | |
| | | | | |
| | |
Top Ten as a Group | | | 21.3 | |
| | | | |
Because a fund’s strategy may result in multiple investments in particular sectors of the economy, its performance may depend on the performance of those sectors and may fluctuate more widely than investments diversified across more sectors. For additional information on these and other risk considerations, please see the Fund’s prospectus.
Any sectors, industries, or securities discussed should not be perceived as investment recommendations. Mention of a specific security should not be considered a recommendation to buy or solicitation to sell that security. Specific securities mentioned in this report may have been sold from the Fund’s portfolio of investments by the time you receive this report.
13
| | |
| | | AMG GW&K Small Cap Value Fund Schedule of Portfolio Investments December 31, 2023 |
| | | |
| | | |
| | | | | | | | |
| | |
Shares | | | Value | |
| | |
Common Stocks - 99.1% | | | | | | | | |
| |
Communication Services - 1.4% | | | | | |
| | |
IMAX Corp. (Canada)* | | | 138,360 | | | | $2,078,167 | |
| | |
Ziff Davis, Inc.* | | | 22,549 | | | | 1,515,068 | |
| | |
Total Communication Services | | | | | | | 3,593,235 | |
| |
Consumer Discretionary - 12.3% | | | | | |
| | |
Academy Sports & Outdoors, Inc. | | | 59,621 | | | | 3,934,986 | |
| | |
BJ’s Restaurants, Inc.* | | | 55,100 | | | | 1,984,151 | |
| | |
Boot Barn Holdings, Inc.* | | | 60,619 | | | | 4,653,115 | |
| | |
First Watch Restaurant Group, Inc.* | | | 233,901 | | | | 4,701,410 | |
| | |
Group 1 Automotive, Inc. | | | 19,937 | | | | 6,075,601 | |
| | |
Helen of Troy, Ltd.* | | | 22,125 | | | | 2,672,921 | |
| | |
Topgolf Callaway Brands Corp.* | | | 139,299 | | | | 1,997,548 | |
| | |
Tri Pointe Homes, Inc.* | | | 78,500 | | | | 2,778,900 | |
| | |
Worthington Enterprises, Inc.1 | | | 48,973 | | | | 2,818,396 | |
| | |
Total Consumer Discretionary | | | | | | | 31,617,028 | |
| |
Consumer Staples - 2.0% | | | | | |
| | |
Central Garden & Pet Co.*,1 | | | 101,330 | | | | 5,077,646 | |
| |
Energy - 8.9% | | | | | |
| | |
California Resources Corp. | | | 39,335 | | | | 2,150,838 | |
| | |
Chord Energy Corp | | | 23,026 | | | | 3,827,612 | |
| | |
Crescent Energy Co., Class A1 | | | 170,520 | | | | 2,252,569 | |
| | |
Magnolia Oil & Gas Corp., Class A | | | 135,130 | | | | 2,876,918 | |
| | |
Matador Resources Co. | | | 57,756 | | | | 3,284,006 | |
| | |
Northern Oil and Gas, Inc.1 | | | 70,220 | | | | 2,603,055 | |
| | |
Permian Resources Corp. | | | 325,793 | | | | 4,430,785 | |
| | |
Solaris Oilfield Infrastructure, Inc., Class A | | | 197,190 | | | | 1,569,632 | |
| | |
Total Energy | | | | | | | 22,995,415 | |
| |
Financials - 28.6% | | | | | |
| | |
Ameris Bancorp | | | 80,054 | | | | 4,246,865 | |
| | |
Atlantic Union Bankshares Corp. | | | 116,294 | | | | 4,249,383 | |
| | |
Cathay General Bancorp | | | 75,122 | | | | 3,348,188 | |
| | |
City Holding Co. | | | 33,366 | | | | 3,678,935 | |
| | |
Community Bank System, Inc. | | | 54,395 | | | | 2,834,523 | |
| | |
Enterprise Financial Services Corp. | | | 52,030 | | | | 2,323,140 | |
| | |
Federal Agricultural Mortgage Corp., Class C | | | 30,667 | | | | 5,864,144 | |
| | |
First Financial Bancorp | | | 121,829 | | | | 2,893,439 | |
| | |
First Interstate BancSystem, Inc., Class A | | | 114,430 | | | | 3,518,722 | |
| | |
Glacier Bancorp, Inc.1 | | | 56,260 | | | | 2,324,663 | |
| | |
International Bancshares Corp. | | | 74,848 | | | | 4,065,743 | |
| | |
OceanFirst Financial Corp. | | | 129,553 | | | | 2,249,040 | |
| | |
Pacific Premier Bancorp, Inc. | | | 92,274 | | | | 2,686,096 | |
| | |
Piper Sandler Cos. | | | 30,549 | | | | 5,342,104 | |
| | | | | | | | |
| | |
Shares | | | Value | |
| | |
PJT Partners, Inc., Class A1 | | | 46,851 | | | | $4,772,711 | |
| | |
Seacoast Banking Corp. of Florida | | | 80,102 | | | | 2,279,703 | |
| | |
Selective Insurance Group, Inc. | | | 58,415 | | | | 5,811,124 | |
| | |
Stifel Financial Corp. | | | 55,442 | | | | 3,833,814 | |
| | |
Walker & Dunlop, Inc. | | | 48,718 | | | | 5,408,185 | |
| | |
WesBanco, Inc. | | | 63,078 | | | | 1,978,757 | |
| | |
Total Financials | | | | | | | 73,709,279 | |
| |
Health Care - 8.4% | | | | | |
| | |
BioCryst Pharmaceuticals, Inc.* | | | 250,010 | | | | 1,497,560 | |
| | |
Integer Holdings Corp.* | | | 46,176 | | | | 4,575,118 | |
| | |
Ligand Pharmaceuticals, Inc.* | | | 49,825 | | | | 3,558,502 | |
| | |
NeoGenomics, Inc.* | | | 212,308 | | | | 3,435,143 | |
| | |
OmniAb, Inc.*,2,3 | | | 10,502 | | | | 0 | |
| | |
OmniAb, Inc.*,2,3 | | | 10,502 | | | | 0 | |
| | |
Paragon 28, Inc.* | | | 248,742 | | | | 3,091,863 | |
| | |
Supernus Pharmaceuticals, Inc.* | | | 103,046 | | | | 2,982,151 | |
| | |
Ultragenyx Pharmaceutical, Inc.* | | | 53,944 | | | | 2,579,602 | |
| | |
Total Health Care | | | | | | | 21,719,939 | |
| |
Industrials - 15.4% | | | | | |
| | |
Atkore, Inc.* | | | 27,211 | | | | 4,353,760 | |
| | |
CBIZ, Inc.* | | | 88,947 | | | | 5,567,193 | |
| | |
Columbus McKinnon Corp. | | | 91,447 | | | | 3,568,262 | |
| | |
Comfort Systems USA, Inc. | | | 27,781 | | | | 5,713,718 | |
| | |
Herc Holdings, Inc. | | | 19,176 | | | | 2,855,115 | |
| | |
Hillenbrand, Inc. | | | 60,296 | | | | 2,885,163 | |
| | |
ICF International, Inc. | | | 14,607 | | | | 1,958,653 | |
| | |
Primoris Services Corp. | | | 110,220 | | | | 3,660,406 | |
| | |
Terex Corp. | | | 76,265 | | | | 4,382,187 | |
| | |
UFP Industries, Inc. | | | 37,194 | | | | 4,669,707 | |
| | |
Total Industrials | | | | | | | 39,614,164 | |
| |
Information Technology - 4.6% | | | | | |
| | |
Endava PLC, Sponsored ADR (United Kingdom)* | | | 50,107 | | | | 3,900,830 | |
| | |
Power Integrations, Inc. | | | 31,205 | | | | 2,562,243 | |
| | |
Silicon Laboratories, Inc.* | | | 25,713 | | | | 3,401,059 | |
| | |
Viavi Solutions, Inc.* | | | 202,350 | | | | 2,037,664 | |
| | |
Total Information Technology | | | | | | | 11,901,796 | |
| |
Materials - 4.4% | | | | | |
| | |
Minerals Technologies, Inc. | | | 38,987 | | | | 2,780,163 | |
| | |
Orion, S.A. | | | 186,576 | | | | 5,173,752 | |
| | |
Schnitzer Steel Industries, Inc., Class A | | | 61,985 | | | | 1,869,468 | |
| | |
Worthington Steel, Inc.*,1 | | | 48,973 | | | | 1,376,141 | |
| | |
Total Materials | | | | | | | 11,199,524 | |
The accompanying notes are an integral part of these financial statements.
14
| | |
| | | AMG GW&K Small Cap Value Fund Schedule of Portfolio Investments (continued) |
| | | |
| | | |
| | | | | | | | |
| | |
Shares | | | Value | |
| |
Real Estate - 10.0% | | | | | |
| | |
Acadia Realty Trust, REIT | | | 123,030 | | | | $2,090,280 | |
| | |
Agree Realty Corp., REIT | | | 44,330 | | | | 2,790,574 | |
| | |
Four Corners Property Trust, Inc., REIT 1 | | | 135,268 | | | | 3,422,280 | |
| | |
Getty Realty Corp., REIT | | | 111,617 | | | | 3,261,449 | |
| | |
Independence Realty Trust, Inc., REIT | | | 289,397 | | | | 4,427,774 | |
| | |
LXP Industrial Trust, REIT | | | 158,624 | | | | 1,573,550 | |
| | |
Plymouth Industrial REIT, Inc. | | | 107,330 | | | | 2,583,433 | |
| | |
STAG Industrial, Inc., REIT | | | 84,920 | | | | 3,333,959 | |
| | |
Xenia Hotels & Resorts, Inc., REIT | | | 170,671 | | | | 2,324,539 | |
| | |
Total Real Estate | | | | | | | 25,807,838 | |
| |
Utilities - 3.1% | | | | | |
| | |
IDACORP, Inc. | | | 33,552 | | | | 3,298,833 | |
| | |
Northwestern Energy Group, Inc. | | | 47,853 | | | | 2,435,239 | |
| | |
Southwest Gas Holdings, Inc. | | | 36,798 | | | | 2,331,153 | |
| |
Total Utilities | | | | 8,065,225 | |
| |
Total Common Stocks | | | | | |
(Cost $195,571,246) | | | | | | | 255,301,089 | |
| | |
| | | Principal
Amount | | | | |
| |
Short-Term Investments - 1.2% | | | | | |
| |
Joint Repurchase Agreements - 0.4%4 | | | | | |
| | |
Daiwa Capital Markets America, dated 12/29/23, due 01/02/24, 5.380% total to be received $78,423 (collateralized by various U.S. Government Agency Obligations and U.S. Treasuries, 0.000% - 7.500%, 03/22/24 - 01/01/54, totaling $79,953) | | | $78,376 | | | | 78,376 | |
| | |
| | | | | | | | |
| | | | | | | | |
| | | Principal
Amount | | | Value | |
| | |
RBC Dominion Securities, Inc., dated 12/29/23, due 01/02/24, 5.340% total to be received $1,000,593 (collateralized by various U.S. Government Agency Obligations and U.S. Treasuries, 0.000% - 7.500%, 01/15/24 - 12/01/53, totaling $1,020,000) | | | $1,000,000 | | | | $1,000,000 | |
| |
Total Joint Repurchase Agreements | | | | 1,078,376 | |
| |
Repurchase Agreements - 0.8% | | | | | |
| | |
Fixed Income Clearing Corp., dated 12/29/23 due 01/02/24, 5.150% total to be received $2,066,182 (collateralized by a U.S. Treasury, 4.125%, 09/30/27, totaling $2,106,360) | | | 2,065,000 | | | | 2,065,000 | |
| |
Total Short-Term Investments | | | | | |
(Cost $3,143,376) | | | | | | | 3,143,376 | |
| |
Total Investments - 100.3% | | | | | |
(Cost $198,714,622) | | | | | | | 258,444,465 | |
| |
Other Assets, less Liabilities - (0.3)% | | | | (845,701 | ) |
| |
Net Assets - 100.0% | | | | $257,598,764 | |
| |
| | | | | |
| * | Non-income producing security. |
| 1 | Some of these securities, amounting to $17,250,209 or 6.7% of net assets, were out on loan to various borrowers and are collateralized by cash and various U.S. Treasury Obligations. See Note 4 of Notes to Financial Statements. |
| 2 | Security’s value was determined by using significant unobservable inputs. |
| 3 | These securities are restricted and are not available for re-sale. Ligand Pharmaceuticals, Inc. (“Ligand”) completed a spin-off of OmniAb, Inc on November 2, 2022. Ligand shareholders received new holdings of OmniAb earn-out shares. The market value of earn-out shares was $0 on the date of the spin-off. At December 31, 2023, for each holding of OmniAb earn-out shares, the cost was $19,190 and the market value of each was $0, which represents 0% of net assets. |
| 4 | Cash collateral received for securities lending activity was invested in these joint repurchase agreements. |
ADR American Depositary Receipt
REIT Real Estate Investment Trust
The accompanying notes are an integral part of these financial statements.
15
| | |
| | | AMG GW&K Small Cap Value Fund Schedule of Portfolio Investments (continued) |
| | | |
| | | |
The following table summarizes the inputs used to value the Fund’s investments by the fair value hierarchy levels as of December 31, 2023:
| | | | | | | | | | | | | | | | |
| | | Level 1 | | | Level 2 | | | Level 3 | | | Total | |
Investments in Securities | | | | | | | | | | | | | | | | |
| | | | |
Common Stocks | | | | | | | | | | | | | | | | |
| | | | |
Financials | | | $73,709,279 | | | | — | | | | — | | | | $73,709,279 | |
| | | | |
Industrials | | | 39,614,164 | | | | — | | | | — | | | | 39,614,164 | |
| | | | |
Consumer Discretionary | | | 31,617,028 | | | | — | | | | — | | | | 31,617,028 | |
| | | | |
Real Estate | | | 25,807,838 | | | | — | | | | — | | | | 25,807,838 | |
| | | | |
Energy | | | 22,995,415 | | | | — | | | | — | | | | 22,995,415 | |
| | | | |
Health Care | | | 21,719,939 | | | | — | | | | $0 | | | | 21,719,939 | |
| | | | |
Information Technology | | | 11,901,796 | | | | — | | | | — | | | | 11,901,796 | |
| | | | |
Materials | | | 11,199,524 | | | | — | | | | — | | | | 11,199,524 | |
| | | | |
Utilities | | | 8,065,225 | | | | — | | | | — | | | | 8,065,225 | |
| | | | |
Consumer Staples | | | 5,077,646 | | | | — | | | | — | | | | 5,077,646 | |
| | | | |
Communication Services | | | 3,593,235 | | | | — | | | | — | | | | 3,593,235 | |
| | | | |
Short-Term Investments | | | | | | | | | | | | | | | | |
| | | | |
Joint Repurchase Agreements | | | — | | | | $1,078,376 | | | | — | | | | 1,078,376 | |
| | | | |
Repurchase Agreements | | | — | | | | 2,065,000 | | | | — | | | | 2,065,000 | |
| | | | | | | | | | | | | | | | |
| | | | |
Total Investments in Securities | | | $255,301,089 | | | | $3,143,376 | | | | $0 | | | | $258,444,465 | |
| | | | | | | | | | | | | | | | |
The Level 3 common stocks were received as a result of a corporate action. The security’s value was determined by using significant unobservable inputs. For the current period ended December 31, 2023, the change in unrealized depreciation was $0.
For the fiscal year ended December 31, 2023, there were no transfers in or out of Level 3. The Fund did not have any purchases and sales of Level 3 securities for the same period.
The accompanying notes are an integral part of these financial statements.
16
| | |
| | | AMG GW&K Small/Mid Cap Core Fund Portfolio Manager’s Comments (unaudited) |
| | | |
| | | |
| | | | | | | | |
THE YEAR IN REVIEW For the year ended December 31, 2023, AMG GW&K Small/Mid Cap Core Fund (the “Fund”) Class I shares returned 14.76%, compared to the Fund’s benchmark, the Russell 2500® Index (the “Index”), which returned 17.42%. If we are anything alike, you are hoping the words “pivot” and “landing” are retired from the financial lexicon in 2024. The past year has been ALL about the macro and the U.S Federal Reserve’s (the “Fed”) activities. Will they keep raising, stay higher for longer, or could they pause? By the time we reached December, investors pivoted to arguing about how many rate cuts were coming. Market participants shifted their views of economic conditions in 2023 as many times as Sam Bankman-Fried was convicted for fraud. Hard landing, soft landing, no landing. Bulls continuously thought there would be no recession and a pivot was just around the corner. Bears figured either the Fed’s rapid interest-rate increase would break something, causing earnings estimates to fall, or stickier inflation would keep the Fed firm. For now, it appears the bulls were correct. However, given the rapid change in perspectives during 2023, investors assuming the bulls get the last word might also be shocked when a Barbie movie sequel or spinoff is announced. In fact, it is possible the Oppenheimer-Barbie cinematic linkage is the best example of 2023 markets you can find: two polar opposite experiences, improbably embraced simultaneously and relatedly. Inflation, higher interest rates, a banking crisis, and higher for longer in one theater, while the other audience watches a resilient economy, peaking monetary policy, and a bull market for financial assets. Stock investors were especially rewarded as the year came to a close, this time even those owning US small/mid (smid) caps. The bulls emerge victorious for now but keep watch for changes to the outlook and the release of a Ken movie prequel. During the year, sector leadership in the Index came from information technology, industrials, and consumer discretionary. Lagging performance came | | | | especially from utilities, while health care and energy offered only modest positive returns. Housing-related industries were up close to 60%, and some extraordinary individual stocks drove high returns in technology hardware, personal care, and beverages. Banks were just below flat on the year and joined health care equipment/supplies and communications equipment among the negative performers. Among factor details, the lowest-beta quintile of the benchmark was ignored in the rally, increasing just 6.5%. Other factor oddities included the 25.0% return from the lowest-valuation quintile and languishing returns from the middle Return-on-Equity (ROE) group (+12.6%). Stepping back, it appears our lower risk profile and lack of exposure in areas such as biotech, unprofitable software, and housing or building products played a factor, in addition to stock selection. We were too cautiously positioned relative to the benchmark in areas such as housing and related construction materials and services, missed some critical one-off big winners, and suffered selection challenges which could not be overcome. The macro centric backdrop certainly played a role. By sector, Health Care suffered the majority of our deficit, although it is still our best performer over three years. We missed several benchmark names with truly epic price appreciation, which cost us in addition to our biotech underweight. Performance issues in the Financials sector were mostly due to our selection in banks. Our holdings were hit hard during the March banking crisis, with Signature Bank taken over by New York state regulators and Western Alliance doing everything they could not to follow that pathway. We sold Western Alliance and replaced it with other banking exposure, but the impact of both stocks was nearly 150 bps, a portion of which was earned back elsewhere in the sector. Finally, consumer staples was hurt by a drop in Lancaster Colony due to disappointing margin performance and BJ’s Wholesale, which grew | | | | earnings but saw its multiple degrade to generate a flat stock on the year. In the plus column, information technology benefited from broadly excellent stock selection in software. Outperformance was all the more remarkable given investor obsession with a host of bitcoin and artificial intelligence (AI) related stocks. Totaling the impact of just six of these stocks created a headwind of 40 bps given their size and triple-digit returns. The materials sector was also additive. As we look forward into 2024, we are hopeful for a shift within the investing environment. Instead of pivots and landings or bitcoin and AI vaporware, we would prefer to focus on near- and intermediate-term earnings and cash-flow generation potential. While the market was hypersensitive to macro outcomes in 2023, consistent and sustainable earnings growth was often not the driving factor for returns. There are lessons to be learned from our stock selection, and we will study those and use them to improve our analytical thinking and investment process. We continue to believe consistent and sustainable growers will outperform the benchmark over long periods, as investors tire with rebound trades and other short-term infatuations. We think it is a mistake to assume the outcome of this economic cycle is decided. The yield curve remains inverted, and the resilient economy has of late been partially supported by fiscal stimulus. It is uncertain if we will be able to avoid a recession over the next 12 months. As we enter 2024, we’re hoping it is the year where stock-specific fundamentals and small cap stocks trump the macro. The views expressed represent the opinions of GW&K Investment Management, LLC as of December 31, 2023, and are not intended as a forecast or guarantee of future results, and are subject to change without notice. |
| | | | | | | | |
17
|
AMG GW&K Small/Mid Cap Core Fund Portfolio Manager’s Comments (continued) |
| |
| |
CUMULATIVE TOTAL RETURN PERFORMANCE
AMG GW&K Small/Mid Cap Core Fund’s cumulative total return is based on the daily change in net asset value (NAV), and assumes that all dividends and distributions were reinvested. The graph compares a hypothetical $10,000 investment made in the AMG GW&K Small/Mid Cap Core Fund’s Class I shares on June 30, 2015, to a $10,000 investment made in the Russell 2500® Index for the same time period. The graph and table do not reflect the deduction of taxes that a shareholder would pay on a Fund distribution or redemption of shares. The listed returns for the Fund are net of expenses and the returns for the index exclude expenses. Total returns would have been lower had certain expenses not been reduced.
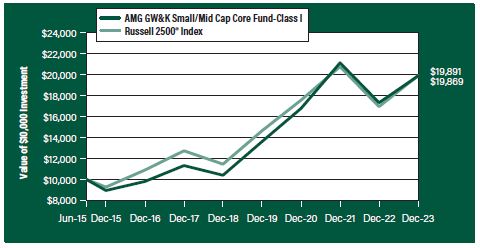
The table below shows the average annual total returns for the AMG GW&K Small/Mid Cap Core Fund and the Russell 2500® Index for the same time periods ended December 31, 2023.
| | | | | | | | | | | | | | | | |
| | | One | | | Five | | | Since | | | Inception | |
| Average Annual Total Returns1 | | Year | | | Years | | | Inception | | | Date | |
AMG GW&K Small/Mid Cap Core Fund2, 3, 4, 5, 6, 7, 8 | | | | | |
| | | | |
Class N | | | 14.51 | % | | | 13.62 | % | | | 9.80 | % | | | 02/24/17 | |
| | | | |
Class I | | | 14.76 | % | | | 13.84 | % | | | 8.41 | % | | | 06/30/15 | |
| | | | |
Class Z | | | 14.78 | % | | | 13.90 | % | | | 10.07 | % | | | 02/24/17 | |
| | | | |
Russell 2500® Index9 | | | 17.42 | % | | | 11.67 | % | | | 8.42 | % | | | 06/30/15 | † |
The performance data shown represents past performance. Past performance is not a guarantee of future results. Current performance may be lower or higher than the performance data quoted. The investment return and principal value of an investment will fluctuate so that an investor’s shares, when redeemed, may be worth more or less than their original cost.
Investors should carefully consider the Fund’s investment objectives, risks, charges and expenses before investing. For performance information through the most recent month end, current net asset values per share for the Fund and other information, please call 800.548.4539 or visit our website at wealth.amg.com for a free prospectus. Read it carefully before investing or sending money.
Distributed by AMG Distributors, Inc., member FINRA/SIPC.
| † | Date reflects the inception date of the Fund, not the index |
| 1 | Total return equals income yield plus share price change and assumes reinvestment of all dividends and capital gain distributions. Returns are net of fees and may reflect offsets of Fund expenses as described in the prospectus. No adjustment has been made for taxes payable by shareholders on their reinvested dividends and |
| | capital gain distributions. Returns for periods greater than one year are annualized. The listed returns on the Fund are net of expenses and based on the published NAV as of December 31, 2023. All returns are in U.S. Dollars ($). |
| 2 | From time to time, the Fund’s Investment Manager has waived its fees and/or absorbed Fund expenses, which has resulted in higher returns. |
| 3 | Market prices of investments held by the Fund may fall rapidly or unpredictably due to a variety of factors, including economic, political, or market conditions, or other factors including terrorism, war, natural disasters and the spread of infectious illness or other public health issues, including epidemics or pandemics, or in response to events that affect particular industries or companies. |
| 4 | The prices of equity securities of companies that are expected to experience relatively rapid earnings growth, or “growth stocks,” may be more sensitive to market movements because the prices tend to reflect future investor expectations rather than just current profits. |
| 5 | Value stocks may perform differently from the market as a whole and may be undervalued by the market for a long period of time. |
| 6 | Because the Fund is an actively managed investment portfolio, security selection or focus on securities in a particular style, market sector or group of companies may cause the Fund to incur losses or underperform relative to its benchmarks or other funds with a similar investment objective. There can be no guarantee that the Subadviser’s investment techniques and risk analysis will produce the desired result. |
| 7 | The Fund may not be able to dispose of particular investments, such as illiquid securities, readily at favorable times or prices or the Fund may have to sell them at a loss. |
| 8 | The stocks of small- and mid-capitalization companies often have greater price volatility, lower trading volume, and less liquidity than the stocks of larger, more established companies. |
| 9 | The Russell 2500® Index is composed of the 2,500 smallest stocks in the Russell 3000® Index and is widely regarded in the industry as the premier measure of small/mid cap stock performance. Unlike the Fund, the Russell 2500® Index is unmanaged, is not available for investment and does not incur expenses. |
The Russell Indices are trademarks of the London Stock Exchange Group companies.
Not FDIC insured, nor bank guaranteed. May lose value.
18
| | |
| | | AMG GW&K Small/Mid Cap Core Fund Fund Snapshots (unaudited) December 31, 2023 |
| | | |
| | | |
PORTFOLIO BREAKDOWN
| | |
Sector | | % of
Net Assets |
| | |
Industrials | | 23.4 |
| | |
Health Care | | 14.7 |
| | |
Information Technology | | 14.6 |
| | |
Consumer Discretionary | | 13.9 |
| | |
Financials | | 11.4 |
| | |
Materials | | 6.7 |
| | |
Real Estate | | 5.3 |
| | |
Consumer Staples | | 4.6 |
| | |
Energy | | 3.6 |
| | |
Utilities | | 2.0 |
| | |
Short-Term Investments | | 1.4 |
| | |
Other Assets, less Liabilities | | (1.6) |
TOP TEN HOLDINGS
| | |
Security Name | | % of
Net Assets |
| | |
RBC Bearings, Inc. | | 2.0 |
| | |
CyberArk Software, Ltd. (Israel) | | 1.9 |
| | |
Texas Roadhouse, Inc. | | 1.8 |
| | |
BJ’s Wholesale Club Holdings, Inc. | | 1.8 |
| | |
Voya Financial, Inc. | | 1.8 |
| | |
Comfort Systems USA, Inc. | | 1.8 |
| | |
Booz Allen Hamilton Holding Corp. | | 1.8 |
| | |
Cavco Industries, Inc. | | 1.8 |
| | |
Nordson Corp. | | 1.8 |
| | |
Globant SA (Uruguay) | | 1.7 |
| | | |
| | |
Top Ten as a Group | | 18.2 |
| | |
Because a fund’s strategy may result in multiple investments in particular sectors of the economy, its performance may depend on the performance of those sectors and may fluctuate more widely than investments diversified across more sectors. For additional information on these and other risk considerations, please see the Fund’s prospectus.
Any sectors, industries, or securities discussed should not be perceived as investment recommendations. Mention of a specific security should not be considered a recommendation to buy or solicitation to sell that security. Specific securities mentioned in this report may have been sold from the Fund’s portfolio of investments by the time you receive this report.
The accompanying notes are an integral part of these financial statements.
19
| | |
| | | AMG GW&K Small/Mid Cap Core Fund Schedule of Portfolio Investments December 31, 2023 |
| | | | | | | | |
| | | Shares | | | Value | |
| | |
Common Stocks - 100.2% | | | | | | | | |
| |
Consumer Discretionary - 13.9% | | | | | |
| | |
Bright Horizons Family Solutions, Inc.*,1 | | | 83,246 | | | | $7,845,103 | |
| | |
Burlington Stores, Inc.* | | | 40,115 | | | | 7,801,565 | |
| | |
Carter’s, Inc. | | | 46,759 | | | | 3,501,781 | |
| | |
Cavco Industries, Inc.* | | | 35,570 | | | | 12,329,273 | |
| | |
Dorman Products, Inc.* | | | 78,107 | | | | 6,514,905 | |
| | |
Five Below, Inc.* | | | 46,178 | | | | 9,843,302 | |
| | |
Gentherm, Inc.* | | | 88,679 | | | | 4,643,232 | |
| | |
Grand Canyon Education, Inc.* | | | 42,567 | | | | 5,620,547 | |
| | |
Krispy Kreme, Inc.1 | | | 197,240 | | | | 2,976,352 | |
| | |
Lithia Motors, Inc. | | | 35,001 | | | | 11,525,129 | |
| | |
Polaris, Inc.1 | | | 67,101 | | | | 6,359,162 | |
| | |
Texas Roadhouse, Inc. | | | 104,513 | | | | 12,774,624 | |
| | |
Vail Resorts, Inc. | | | 24,397 | | | | 5,208,028 | |
| | |
Total Consumer Discretionary | | | | | | | 96,943,003 | |
| |
Consumer Staples - 4.6% | | | | | |
| | |
BJ’s Wholesale Club Holdings, Inc.* | | | 191,548 | | | | 12,768,590 | |
| | |
Lancaster Colony Corp. | | | 45,974 | | | | 7,649,614 | |
| | |
Performance Food Group Co.* | | | 167,261 | | | | 11,566,098 | |
| | |
Total Consumer Staples | | | | | | | 31,984,302 | |
| |
Energy - 3.6% | | | | | |
| | |
ChampionX Corp. | | | 133,691 | | | | 3,905,114 | |
| | |
Magnolia Oil & Gas Corp., Class A | | | 272,876 | | | | 5,809,530 | |
| | |
Matador Resources Co. | | | 114,281 | | | | 6,498,018 | |
| | |
Ovintiv, Inc. | | | 118,080 | | | | 5,186,073 | |
| | |
SM Energy Co. | | | 96,186 | | | | 3,724,322 | |
| | |
Total Energy | | | | | | | 25,123,057 | |
| |
Financials - 11.4% | | | | | |
| | |
Atlantic Union Bankshares Corp. | | | 195,181 | | | | 7,131,914 | |
| | |
Glacier Bancorp, Inc. | | | 130,065 | | | | 5,374,286 | |
| | |
Kinsale Capital Group, Inc. | | | 33,862 | | | | 11,340,722 | |
| | |
MarketAxess Holdings, Inc. | | | 19,332 | | | | 5,661,376 | |
| | |
Pinnacle Financial Partners, Inc. | | | 130,089 | | | | 11,346,363 | |
| | |
Piper Sandler Cos. | | | 61,778 | | | | 10,803,119 | |
| | |
Stifel Financial Corp. | | | 98,598 | | | | 6,818,052 | |
| | |
Voya Financial, Inc. | | | 172,118 | | | | 12,557,729 | |
| | |
Wintrust Financial Corp. | | | 87,854 | | | | 8,148,458 | |
| | |
Total Financials | | | | | | | 79,182,019 | |
| |
Health Care - 14.7% | | | | | |
| | |
Acadia Healthcare Co., Inc.* | | | 96,855 | | | | 7,531,445 | |
| | |
Azenta, Inc.* | | | 135,592 | | | | 8,832,463 | |
| | |
Bio-Rad Laboratories, Inc., Class A* | | | 22,266 | | | | 7,189,469 | |
| | | | | | | | |
| | | Shares | | | Value | |
| | |
Catalent, Inc.* | | | 88,067 | | | | $3,956,850 | |
| | |
Globus Medical, Inc., Class A* | | | 153,656 | | | | 8,188,328 | |
| | |
Halozyme Therapeutics, Inc.* | | | 167,670 | | | | 6,197,083 | |
| | |
Hologic, Inc.* | | | 101,759 | | | | 7,270,681 | |
| | |
Integer Holdings Corp.* | | | 97,690 | | | | 9,679,125 | |
| | |
Intra-Cellular Therapies, Inc.* | | | 139,882 | | | | 10,018,349 | |
| | |
Jazz Pharmaceuticals PLC* | | | 63,671 | | | | 7,831,533 | |
| | |
Molina Healthcare, Inc.* | | | 10,991 | | | | 3,971,158 | |
| | |
Neurocrine Biosciences, Inc.* | | | 80,879 | | | | 10,656,617 | |
| | |
Tandem Diabetes Care, Inc.*,1 | | | 207,853 | | | | 6,148,292 | |
| | |
Vericel Corp.* | | | 131,497 | | | | 4,682,608 | |
| | |
Total Health Care | | | | | | | 102,154,001 | |
| |
Industrials - 23.4% | | | | | |
| | |
Atkore, Inc.* | | | 62,254 | | | | 9,960,640 | |
| | |
Booz Allen Hamilton Holding Corp. | | | 97,082 | | | | 12,417,759 | |
| | |
Chart Industries, Inc.*,1 | | | 30,628 | | | | 4,175,515 | |
| | |
Columbus McKinnon Corp. | | | 152,243 | | | | 5,940,522 | |
| | |
Comfort Systems USA, Inc. | | | 60,570 | | | | 12,457,432 | |
| | |
Exponent, Inc. | | | 79,173 | | | | 6,970,391 | |
| | |
Federal Signal Corp. | | | 132,079 | | | | 10,135,742 | |
| | |
Gates Industrial Corp. PLC* | | | 537,651 | | | | 7,215,276 | |
| | |
Gibraltar Industries, Inc.* | | | 103,161 | | | | 8,147,656 | |
| | |
Hexcel Corp. | | | 117,453 | | | | 8,662,159 | |
| | |
IDEX Corp. | | | 43,505 | | | | 9,445,370 | |
| | |
ITT, Inc. | | | 76,937 | | | | 9,180,123 | |
| | |
Lincoln Electric Holdings, Inc. | | | 46,531 | | | | 10,118,631 | |
| | |
Nordson Corp. | | | 46,571 | | | | 12,302,195 | |
| | |
Paylocity Holding Corp.* | | | 52,343 | | | | 8,628,744 | |
| | |
RBC Bearings, Inc.*,1 | | | 48,817 | | | | 13,907,475 | |
| | |
Schneider National, Inc., Class B | | | 216,377 | | | | 5,506,795 | |
| | |
The Toro Co. | | | 82,342 | | | | 7,904,009 | |
| | |
Total Industrials | | | | | | | 163,076,434 | |
| |
Information Technology - 14.6% | | | | | |
| | |
CCC Intelligent Solutions Holdings, Inc.* | | | 722,419 | | | | 8,228,352 | |
| | |
Cognex Corp. | | | 228,107 | | | | 9,521,186 | |
| | |
CyberArk Software, Ltd. (Israel)* | | | 61,711 | | | | 13,517,795 | |
| | |
Entegris, Inc. | | | 98,833 | | | | 11,842,170 | |
| | |
Globant SA (Uruguay)* | | | 50,828 | | | | 12,096,047 | |
| | |
MACOM Technology Solutions Holdings, Inc.* | | | 78,849 | | | | 7,329,015 | |
| | |
Manhattan Associates, Inc.* | | | 52,091 | | | | 11,216,234 | |
| | |
Procore Technologies, Inc.* | | | 114,100 | | | | 7,898,002 | |
| | |
Rapid7, Inc.* | | | 96,866 | | | | 5,531,049 | |
| | |
Silicon Laboratories, Inc.* | | | 53,782 | | | | 7,113,745 | |
The accompanying notes are an integral part of these financial statements.
20
| | |
| | | AMG GW&K Small/Mid Cap Core Fund Schedule of Portfolio Investments (continued) |
| | | | | | | | |
| | |
| | |
Shares | | | Value | |
| | |
Information Technology - 14.6% (continued) | | | | | | | | |
| | |
Zebra Technologies Corp., Class A* | | | 27,047 | | | | $7,392,757 | |
| | |
Total Information Technology | | | | | | | 101,686,352 | |
| |
Materials - 6.7% | | | | | |
| | |
AptarGroup, Inc. | | | 39,428 | | | | 4,874,089 | |
| | |
Eagle Materials, Inc. | | | 57,818 | | | | 11,727,803 | |
| | |
Element Solutions, Inc. | | | 438,743 | | | | 10,152,513 | |
| | |
Quaker Chemical Corp. | | | 48,637 | | | | 10,380,109 | |
| | |
RPM International, Inc. | | | 87,750 | | | | 9,795,532 | |
| | |
Total Materials | | | | | | | 46,930,046 | |
| |
Real Estate - 5.3% | | | | | |
| | |
Agree Realty Corp., REIT | | | 105,078 | | | | 6,614,660 | |
| | |
Easterly Government Properties, Inc., REIT1 | | | 417,062 | | | | 5,605,313 | |
| | |
EastGroup Properties, Inc., REIT | | | 42,168 | | | | 7,739,515 | |
| | |
National Storage Affiliates Trust, REIT | | | 122,629 | | | | 5,085,425 | |
| | |
Physicians Realty Trust, REIT | | | 263,427 | | | | 3,506,213 | |
| | |
Sun Communities, Inc., REIT | | | 63,469 | | | | 8,482,632 | |
| | |
Total Real Estate | | | | | | | 37,033,758 | |
| |
Utilities - 2.0% | | | | | |
| | |
IDACORP, Inc. | | | 75,009 | | | | 7,374,885 | |
| | |
Portland General Electric Co. | | | 157,274 | | | | 6,816,255 | |
| | |
Total Utilities | | | | | | | 14,191,140 | |
| |
Total Common Stocks | | | | | |
(Cost $580,215,613) | | | | | | | 698,304,112 | |
| | | | | | | | |
| | |
| | | Principal
Amount | | | Value | |
| |
Short-Term Investments - 1.4% | | | | | |
| |
Joint Repurchase Agreements - 0.0%#,2 | | | | | |
| | |
RBC Dominion Securities, Inc., dated 12/29/23, due 01/02/24, 5.340% total to be received $38,408 (collateralized by various U.S. Government Agency Obligations and U.S. Treasuries, 0.000% - 7.500%, 01/15/24 -12/01/53, totaling $39,153) | | | $38,385 | | | | $38,385 | |
| |
Repurchase Agreements - 1.4% | | | | | |
| | |
Fixed Income Clearing Corp., dated 12/29/23 due 01/02/24, 5.150% total to be received $1,203,688 (collateralized by a U.S. Treasury, 0.125%, 01/15/32, totaling $1,227,142) | | | 1,203,000 | | | | 1,203,000 | |
| | |
Fixed Income Clearing Corp., dated 12/29/23, due 01/02/24, 5.150% total to be received $8,469,844 (collateralized by a U.S. Treasury, 4.125%, 09/30/27, totaling $8,634,337) | | | 8,465,000 | | | | 8,465,000 | |
| |
Total Repurchase Agreements | | | | 9,668,000 | |
| |
Total Short-Term Investments | | | | | |
(Cost $9,706,385) | | | | | | | 9,706,385 | |
| |
Total Investments - 101.6% | | | | | |
(Cost $589,921,998) | | | | | | | 708,010,497 | |
| |
Other Assets, less Liabilities - (1.6)% | | | | (11,097,449 | ) |
| |
Net Assets - 100.0% | | | | $696,913,048 | |
| * | Non-income producing security. |
| 1 | Some of these securities, amounting to $18,547,638 or 2.7% of net assets, were out on loan to various borrowers and are collateralized by cash and various U.S. Treasury Obligations. See Note 4 of Notes to Financial Statements. |
| 2 | Cash collateral received for securities lending activity was invested in these joint repurchase agreements. |
REIT Real Estate Investment Trust
The following table summarizes the inputs used to value the Fund’s investments by the fair value hierarchy levels as of December 31, 2023:
| | | | | | | | | | | | | | | | |
| | | Level 1 | | | Level 2 | | | Level 3 | | | Total | |
Investments in Securities | | | | | | | | | | | | | | | | |
| | | | |
Common Stocks† | | $ | 698,304,112 | | | | — | | | | — | | | $ | 698,304,112 | |
| | | | |
Short-Term Investments | | | | | | | | | | | | | | | | |
| | | | |
Joint Repurchase Agreements | | | — | | | $ | 38,385 | | | | — | | | | 38,385 | |
| | | | |
Repurchase Agreements | | | — | | | | 9,668,000 | | | | — | | | | 9,668,000 | |
| | | | | | | | | | | | | | | | |
| | | | |
Total Investments in Securities | | $ | 698,304,112 | | | $ | 9,706,385 | | | | — | | | $ | 708,010,497 | |
| | | | | | | | | | | | | | | | |
| † | All common stocks held in the Fund are Level 1 securities. For a detailed breakout of common stocks by major industry classification, please refer to the Fund’s Schedule of Portfolio Investments. |
For the fiscal year ended December 31, 2023, there were no transfers in or out of Level 3.
The accompanying notes are an integral part of these financial statements.
21
| | |
| | | AMG GW&K Global Allocation Fund Portfolio Manager’s Comments (unaudited) |
| | | |
| | | |
| | | | | | | | |
THE YEAR IN REVIEW For the year ended December 31, 2023, AMG GW&K Global Allocation Fund (the “Fund”) Class N shares returned 5.35%, compared to the 15.48% return for its blended benchmark which consists of 60% the MSCI All Country World (ACWI) Index (“MSCI ACWI Index”) and 40% the Bloomberg Global Aggregate Bond Index. The Board of Trustees of AMG Funds II has approved to liquidate and close the Fund on February 9, 2024. Therefore, the Fund liquidated all of its investment positions during December 2023. ASSET ALLOCATION The asset allocation framework for the Fund favored equities over fixed income in 2023. In the fourth quarter, the equity/fixed income asset allocation stood at 60%/40%, where it has remained since early 2023. For the full year, the 60% MSCI ACWI Index/40% Bloomberg Global Aggregate Index gained 15.5% with more than one half of the benchmark’s gain coming in the final quarter. The Fund’s modest tilt toward equities reflected our judgment that global equities should outperform global fixed income over the coming quarters, albeit with significant volatility along the way. The tilt toward equities is based on both quantitative and qualitative judgments. First, relative asset-class valuations continue to support a significant allocation to equities, despite the rise in most developed market government bond yields since 2021. Second, we expect the global economy to continue to expand for the next several years, although recession risks are significant for both the U.S. and Europe. Inflation moderated significantly in 2023, which should permit many central banks to cut interest rates over the coming year. The U.S. Federal Reserve (the “Fed“) has projected that it will cut the upper range of the federal funds rate to 4.75% by the end of 2024 compared to its 5.5% level at the end of 2023. Except for the Bank of Japan, most other major central banks are also expected to cut rates in response to easing inflation. Expectations for moderating inflation and lower rates provided favorable tailwinds to global equity and bond markets last year. That said, recession risks in many nations remain elevated based on the lagged effects of monetary tightening since 2021. Fortunately, easing inflation and improving financial conditions have raised the odds that global economic growth will continue in 2024, albeit with sluggish growth widely expected for developed market (DM) economies in the first half of the year. | | | | Emerging market (EM) economies are also expected to post solid growth in 2024 based on broad-based monetary easing. In the case of China, active support from fiscal policy is also expected. In short, we remain cautiously optimistic that the global economy has sufficient momentum to continue to expand despite higher rates and that a positive tailwind of corporate earnings growth should still favor equities over fixed income. A key valuation metric for global equities is the Long-term Earnings Yield of the MSCI ACWI Index. That stood at 5.0% at the end of 2023 and is based on the inverse of the corresponding Shiller PE ratio of 20 times. By way of comparison, the Long-term Earnings Yield of MSCI ACWI Index has averaged 5.5% since 2006, corresponding to an average Shiller PE ratio of 18.2 times. Those figures suggest that equities are modestly expensive relative to their own history. For asset allocation purposes, a relevant comparison of the Long-term Earnings Yield is to the real yield of US Treasuries. At the end of 2023, the yield on 10-Year U.S. Treasury Inflation-Protected Securities (TIPS) stood at 1.7%. The gap between the Long-term Earnings Yield of 5.0 for global equities and 1.7% for TIPS securities suggests the potential for global equities to outperform bonds by about 3.3% per annum in inflation-adjusted terms over the next five to ten years. In short, investors continue to have reasonable incentive to favor equities over fixed income, notwithstanding the potential for greater volatility in equities. Key risks would be if the ongoing expansion that is evident in global economic data gives way to pronounced weakness or if major central banks fail to deliver on the rate cuts that are currently priced into markets. Financial market volatility may also be subject to ongoing geopolitical risks involving Russia-Ukraine, Israel-Hamas, and China-Taiwan. These types of risks will be monitored carefully, but we currently view such risks as sufficiently discounted by markets to justify a significant tilt toward equities. EQUITY Global equity markets rebounded in 2023 on expectations that softer inflation would lead to rate cuts in several countries, particularly the U.S. Developed markets delivered particularly strong results, but China weighed on emerging markets due to ongoing stress in the property market and relatively weak consumer demand. The MSCI ACWI Index returned 22.2%, led by the Americas and Europe, while Asia underperformed as the MSCI | | | | China Index fell -11.2%. Sector performance was broadly positive with information technology, driven by artificial intelligence (AI) enthusiasm, communication services, and consumer discretionary among the leaders. Utilities, consumer staples, and health care trailed the MSCI ACWI Index. The Fund’s equity component underperformed the MSCI ACWI Index for 2023. Stock selection in the financials and consumer discretionary sectors was a key detractor, accounting for nearly 70% of the performance shortfall. Additionally, less exposure to the outperforming IT sector was a drag on relative returns. Within financials, Charles Schwab declined due to increased funding costs caused by higher U.S. interest rates. Hong Kong based life insurer AIA Group was down on falling bond yields in China, though new business continued to recover as the year progressed. Demand concerns caused selling pressure in the Fund’s consumer positions in China—quick service restaurant operator Yum China Holdings, hotel operator H World Group and ecommerce platform Alibaba. Health care was a standout sector, due to positive stock selection. Idexx, a leader in companion animal health diagnostics, ended the year on a positive note as fundamentals began to stabilize. Our newer holding in Switzerland-based Ypsomed, maker of specialty injection systems for the biopharmaceutical industry, delivered positive earnings which led to incrementally positive estimate revisions and strong stock performance. On a geographic level, Asia was the Fund’s worst performing region due to the Fund’s higher weight in China and stock selection in the country. This combination accounted for over 40% of the Fund’s underperformance. The U.S. also detracted from results due to an underweight allocation and stock selection. In addition to Schwab, interest-rate sensitive names in the utilities and real estate sectors, NextEra Energy and American Tower, were also down during the year. Finally, higher exposure to the Europe, the Middle East and Africa (EMEA) region was a positive contributor. Due to exceptional fourth quarter performance, the larger global equity markets, excluding China, have mostly recouped 2022 losses, reflecting the view that central banks have largely tamed inflation without undue economic costs. This could set the stage for a near-term pause in market momentum ahead of the fourth-quarter earnings season when the focus will shift to 2024 guidance. With policy normalization behind us and rate reductions expected in several countries, the longer-term outlook for global equity markets is promising. Valuations are attractive, |
22
| | |
| | | AMG GW&K Global Allocation Fund Portfolio Manager’s Comments (continued) |
| | | |
| | | |
| | | | | | | | |
particularly outside the U.S., input costs are leveling off and, in some cases, declining, and top-line forecasts remain conservative. Additionally, there could be more stimulus on the way in China, as the government has become increasingly vocal about the need to support economic growth and opportunity. FIXED INCOME The Fund’s fixed income component underperformed the Bloomberg Global Aggregate Bond Index for | | | | 2023. An overweight to U.S. rates was a negative contributor as rates were broadly higher over this time period. This was offset somewhat by the Fund’s overweight to spread, particularly Corporates. The underweight to, and allocation within, the Securitized sector was also a positive contributor, but was entirely offset by the overweight to Government Related. Security selection was mixed but ultimately a negative contributor, particularly from within the BBB-rated communications and finance companies sectors. | | | | The views expressed represent the opinions of GW&K Investment Management, LLC as of December 31, 2023, and are not intended as a forecast or guarantee of future results, and are subject to change without notice. |
23
|
AMG GW&K Global Allocation Fund Portfolio Manager’s Comments (continued) |
CUMULATIVE TOTAL RETURN PERFORMANCE
AMG GW&K Global Allocation Fund’s cumulative total return is based on the daily change in net asset value (NAV), and assumes that all dividends and distributions were reinvested. The graph compares a hypothetical $10,000 investment made in the AMG GW&K Global Allocation Fund’s Class N shares on December 31, 2013, to a $10,000 investment made in the 60% MSCI ACWI/40% Bloomberg Global Aggregate Bond Index for the same time period. The graph and table do not reflect the deduction of taxes that a shareholder would pay on a Fund distribution or redemption of shares. The listed returns for the Fund are net of expenses and the returns for the indexes exclude expenses. Total returns would have been lower had certain expenses not been reduced.
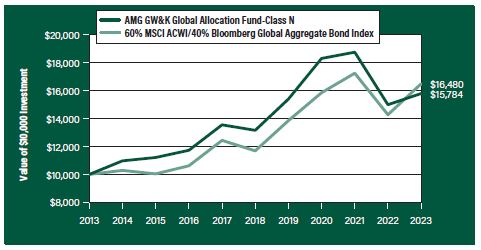
The table below shows the average annual total returns for the AMG GW&K Global Allocation Fund and the 60% MSCI ACWI/40% Bloomberg Global Aggregate Bond Index for the same time periods ended December 31, 2023.
| | | | | | |
| | | One | | Five | | Ten |
| Average Annual Total Returns1 | | Year | | Years | | Years |
|
AMG GW&K Global Allocation Fund2, 3, 4, 5, 6, 7, 8, 9, 10, 11, 12, 13, 14, 15, 16, 17, 18, 19, 20, 21, 22, 23, 24, 25, 26, 27, 28 |
| | | |
Class N | | 5.35% | | 3.72% | | 4.67% |
| | | |
Class I | | 5.50% | | 3.88% | | 4.83% |
| | | |
Class Z | | 5.65% | | 3.99% | | 4.94% |
| | | |
60% MSCI ACWI/40% Bloomberg Global Aggregate Bond Index29, 30 | | 15.48% | | 7.12% | | 5.12% |
| | | |
MSCI ACWI Index 29 | | 22.20% | | 11.72% | | 7.93% |
| | | |
Bloomberg Global Aggregate Bond Index30 | | 5.72% | | (0.32%) | | 0.38% |
The performance data shown represents past performance. Past performance is not a guarantee of future results. Current performance may be lower or higher than the performance data quoted. The investment return and principal value of an investment will fluctuate so that an investor’s shares, when redeemed, may be worth more or less than their original cost.
Investors should carefully consider the Fund’s investment objectives, risks, charges and expenses before investing. For performance information through the most recent month end, current net asset values per share for the Fund and other information, please call 800.548.4539 or visit our website at wealth.amg.com for a free prospectus. Read it carefully before investing or sending money.
Distributed by AMG Distributors, Inc., member FINRA/SIPC.
| 1 | Total return equals income yield plus share price change and assumes reinvestment of all dividends and capital gain distributions. Returns are net of fees and may reflect offsets of Fund expenses as described in the prospectus. No adjustment has been made for taxes payable by shareholders on their reinvested dividends and capital gain |
| | |
| | | distributions. Returns for periods greater than one year are annualized. The listed returns on the Fund are net of expenses and based on the published NAV as of December 31, 2023. All returns are in U.S. Dollars ($). 2 As of April 17, 2020, the Fund’s Subadviser was changed to GW&K Investment Management, LLC. Prior to April 17, 2020, the Fund was known as the AMG Chicago Equity Partners Balanced Fund, and had different principal investment strategies and corresponding risks. Performance shown for periods prior to April 17, 2020 reflects the performance and investment strategies of the Fund’s previous Subadviser, Chicago Equity Partners, LLC. The Fund’s past performance would have been different if the Fund were managed by the current Subadviser and strategy, and the Fund’s prior performance record might be less pertinent for investors considering whether to purchase shares of the Fund. 3 From time to time, the Fund’s Investment Manager has waived its fees and/or absorbed Fund expenses, which has resulted in higher returns. 4 Market prices of investments held by the Fund may fall rapidly or unpredictably due to a variety of factors, including economic, political, or market conditions, or other factors including terrorism, war, natural disasters and the spread of infectious illness or other public health issues, including epidemics or pandemics, or in response to events that affect particular industries or companies. 5 The stocks of small-capitalization companies often have greater price volatility, lower trading volume, and less liquidity than the stocks of larger, more established companies. 6 The prices of equity securities of companies that are expected to experience relatively rapid earnings growth, or “growth stocks,” may be more sensitive to market movements because the prices tend to reflect future investor expectations rather than just current profits. 7 Value stocks may perform differently from the market as a whole and may be undervalued by the market for a long period of time. 8 Because the Fund is an actively managed investment portfolio, security selection or focus on securities in a particular style, market sector or group of companies may cause the Fund to incur losses or underperform relative to its benchmarks or other funds with a similar investment objective. There can be no guarantee that the Subadviser’s investment techniques and risk analysis will produce the desired result. 9 The Fund may not be able to dispose of particular investments, such as illiquid securities, readily at favorable times or prices or the Fund may have to sell them at a loss. 10 The Fund’s investments may not be allocated in the best performing asset classes. |
24
| | |
| | | AMG GW&K Global Allocation Fund Portfolio Manager’s Comments (continued) |
| | | |
| | | |
| | | | | | | | |
11 Investments in foreign issuers involve additional risks (such as risks arising from less frequent trading, changes in political or social conditions, and less publicly available information about non-U.S. issuers) that differ from those associated with investments in U. S. issuers and may result in greater price volatility. 12 Investments in emerging markets are subject to the general risks of foreign investments, as well as additional risks which can result in greater price volatility. Such additional risks include the risk that markets in emerging market countries are typically less developed and less liquid than markets in developed countries and such markets are subjected to increased economic, political, or regulatory uncertainties. 13 Fluctuations in exchange rates may affect the total loss or gain on a non-U.S. dollar investment when converted back to U.S. dollars and exposure to non-U.S. currencies may subject the Fund to the risk that those currencies will decline in value relative to the U.S. dollar. 14 Changes in the general political and social environment of a country can have substantial effects on the value of investments exposed to that country. 15 The value of a debt security changes in response to various factors, including, for example, market-related factors, such as changes in interest rates or changes in the actual or perceived ability of an issuer to meet its obligations. Investments in debt securities are subject to, among other risks, credit risk, interest rate risk, extension risk, prepayment risk and liquidity risk. 16 Investments in asset-backed and mortgage-backed securities involve risk of severe credit downgrades, loss due to prepayments that occur earlier or later than expected, illiquidity and default. 17 The issuer of bonds or other debt securities may be unable or unwilling, or may be perceived as unable or unwilling, to make timely interest or principal payments or otherwise honor its obligations. 18 Because applying the Fund’s ESG investment criteria may result in the selection or exclusion of securities of certain issuers for reasons other than financial performance, the Fund’s investment returns may underperform funds that do not incorporate ESG factors into their investment process. The incorporation of ESG criteria into the investment process may affect the Fund’s investment exposure to certain companies, sectors, regions, countries or types of investments, which could negatively impact the Fund’s performance depending on whether such investments are in or out of favor. Applying ESG criteria to investment decisions is qualitative and subjective by nature, and there is no guarantee that the criteria utilized by the Subadviser or any judgment exercised by the Subadviser will improve the financial performance of the Fund or reflect the beliefs or values of any particular investor. ESG standards differ by region and industry, and a company’s ESG practices or | | | | the Subadviser’s assessment of a company’s ESG practices may change over time. 19 During periods of rising interest rates, a debtor may pay back a bond or other fixed income security slower than expected or required, and the value of such security may fall. 20 Below investment grade debt securities and unrated securities of similar credit quality (commonly known as “junk bonds” or “high yield securities”) may be subject to greater levels of interest rate, credit, liquidity, and market risk than higher-rated securities. These securities are considered predominately speculative with respect to the issuer’s continuing ability to make principal and interest payments. 21 Inflation risk is the risk that the value of assets or income from investments will be worth less in the future. Inflation rates may change frequently and drastically as a result of various factors and the Fund’s investments may not keep pace with inflation, which may result in losses to Fund investors or adversely affect the real value of shareholders’ investments in the Fund. As inflation rates increase, fixed income securities markets may experience heightened levels of interest rate volatility and liquidity risk. Deflation risk is the risk that the prices throughout the economy decline over time – the opposite of inflation. Deflation may have an adverse effect on the creditworthiness of issuers and may make issuer default more likely, which may result in a decline in the value of the Fund’s portfolio. 22 Fixed coupon payments (cash flows) of bonds and debt securities may become less competitive with the market in periods of rising interest rates and cause bond prices to decline. During periods of increasing interest rates, the Fund may experience high levels of volatility and shareholder redemptions, and may have to sell securities at times when it would otherwise not do so, and at unfavorable prices, which could reduce the returns of the Fund. 23 The stocks of large-capitalization companies are generally more mature and may not be able to reach the same levels of growth as the stocks of small- or mid-capitalization companies. 24 The stocks of mid-capitalization companies often have greater price volatility, lower trading volume, and less liquidity than the stocks of larger, more established companies. 25 Factors unique to the municipal bond market may negatively affect the value of municipal bonds. 26 A debtor may exercise its right to pay back a bond or other debt security earlier than expected or required during periods of decreasing interest rates. 27 The Fund may have difficulty reinvesting payments from debtors and may receive lower rates than from its original investments. 28 Obligations issued by some U.S. Government agencies, | | | | authorities,instrumentalities, or sponsored enterprises such as Government National Mortgage Association (“GNMA”) are backed by the full faith and credit of the U.S. Government, while obligations issued by others, such as Federal National Mortgage Association (“FNMA”), Federal Home Loan Mortgage Corporation (“FHLMC”), and Federal Home Loan Banks (“FHLBs”), are not backed by the full faith and credit of the U.S. Government and are backed solely by the entity’s own resources or by the ability of the entity to borrow from the U.S. Treasury. If one of these agencies defaults on a loan, there is no guarantee that the U.S. Government will provide financial support. 29 The MSCI All Country World Index (ACWI) is a free-float adjusted market capitalization weighted index that is designed to measure the equity market performance of developed and emerging markets. Please go to msci.com for most current list of countries represented by the Index. Unlike the Fund, the MSCI All Country World Index (ACWI) is unmanaged, is not available for investment and does not incur expenses. 30 The Bloomberg Global Aggregate Bond Index provides a broad-based measure of the global investment-grade fixed income markets. The three major components of this index are the U.S. Aggregate, the Pan-European Aggregate, and the Asian-Pacific Aggregate Indices. The Index also includes Eurodollar and Euro-Yen corporate bonds, Canadian government, agency and corporate securities, and USD investment grade 144A securities. Unlike the Fund, the Bloomberg Global Aggregate Bond Index is unmanaged, is not available for investment and does not incur expenses. All MSCI data is provided “as is”. The products described herein are not sponsored or endorsed and have not been reviewed or passed on by MSCI. In no event shall MSCI, its affiliates or any MSCI data provider have any liability of any kind in connection with the MSCI data or the products described herein. Copying or redistributing the MSCI data is strictly prohibited. “Bloomberg®” and any Bloomberg index described herein are service marks of Bloomberg Finance L.P. and its affiliates, including Bloomberg Index Services Limited (“BISL”), the administrator of the index (collectively, “Bloomberg”) and have been licensed for use for certain purposes by AMG Funds LLC. Bloomberg is not affiliated with AMG Funds LLC, and Bloomberg does not approve, endorse, review, or recommend the fund described herein. Bloomberg does not guarantee the timeliness, accurateness, or completeness of any data or information relating to such fund. Not FDIC insured, nor bank guaranteed. May lose value. |
25
| | |
| | | AMG GW&K Global Allocation Fund Schedule of Portfolio Investments December 31, 2023 |
| | | |
| | | |
| | | | | | | | |
| | | Shares | | | Value | |
Short-Term Investments - 100.3% | | | | | | | | |
| |
Other Investment Companies - 100.3% | | | | | |
| | |
Dreyfus Institutional Preferred Government Money Market Fund, Institutional Shares, 5.32%1 | | | 27,228,212 | | | | $27,228,212 | |
| | |
Total Short-Term Investments
(Cost $27,228,212) | | | | | | | 27,228,212 | |
| | | | | | |
| | | | | Value | |
| |
Total Investments - 100.3%
(Cost $27,228,212) | | | $27,228,212 | |
| |
Other Assets, less Liabilities - (0.3)% | | | (76,749 | ) |
| |
Net Assets - 100.0% | | | $27,151,463 | |
| 1 | Yield shown represents the December 31, 2023, seven day average yield, which refers to the sum of the previous seven days’ dividends paid, expressed as an annual percentage. |
The following table summarizes the inputs used to value the Fund’s investments by the fair value hierarchy levels as of December 31, 2023:
| | | | | | | | | | | | | | | | |
| | | Level 1 | | | Level 2 | | | Level 3 | | | Total | |
Investments in Securities | | | | | | | | | | | | | | | | |
| | | | |
Short-Term Investments | | | | | | | | | | | | | | | | |
| | | | |
Other Investment Companies | | $ | 27,228,212 | | | | — | | | | — | | | $ | 27,228,212 | |
| | | | | | | | | | | | | | | | |
Total Investments in Securities | | $ | 27,228,212 | | | | — | | | | — | | | $ | 27,228,212 | |
| | | | | | | | | | | | | | | | |
For the fiscal year ended December 31, 2023, there were no transfers in or out of Level 3.
The accompanying notes are an integral part of these financial statements.
26
| | |
| | | Statement of Assets and Liabilities December 31, 2023 |
| | | |
| | | |
| | | | | | | | | | | | | | | | | | | | |
| | | AMG
GW&K Small Cap
Core Fund | | AMG
GW&K Small Cap
Value Fund | | AMG
GW&K Small/Mid
Cap Core Fund | | AMG
GW&K Global
Allocation Fund |
| | | | |
Assets: | | | | | | | | | | | | | | | | | | | | |
| | | | |
Investments at value1 (including securities on loan valued at $10,123,784, $17,250,209, $18,547,638, and $0, respectively) | | | | $640,979,085 | | | | | $258,444,465 | | | | | $708,010,497 | | | | | $27,228,212 | |
| | | | |
Cash | | | | 239,637 | | | | | 170,687 | | | | | 404,030 | | | | | — | |
| | | | |
Receivable for investments sold | | | | 1,681,731 | | | | | — | | | | | 3,693,352 | | | | | 4,422 | |
| | | | |
Dividend and interest receivables | | | | 517,716 | | | | | 354,458 | | | | | 405,254 | | | | | 87,162 | |
| | | | |
Securities lending income receivable | | | | 2,402 | | | | | 1,006 | | | | | 1,881 | | | | | 124 | |
| | | | |
Receivable for Fund shares sold | | | | 214,835 | | | | | 25,763 | | | | | 532,138 | | | | | — | |
| | | | |
Receivable from affiliate | | | | 8,765 | | | | | 8,208 | | | | | 16,951 | | | | | 70,746 | |
| | | | |
Prepaid expenses and other assets | | | | 20,305 | | | | | 11,663 | | | | | 19,926 | | | | | — | |
| | | | |
Total assets | | | | 643,664,476 | | | | | 259,016,250 | | | | | 713,084,029 | | | | | 27,390,666 | |
| | | | |
Liabilities: | | | | | | | | | | | | | | | | | | | | |
| | | | |
Payable upon return of securities loaned | | | | 1,794,963 | | | | | 1,078,376 | | | | | 38,385 | | | | | — | |
| | | | |
Payable for investments purchased | | | | 221,854 | | | | | — | | | | | — | | | | | — | |
| | | | |
Payable for Fund shares repurchased | | | | 382,933 | | | | | 60,821 | | | | | 15,578,005 | | | | | 134,105 | |
| | | | |
Accrued expenses: | | | | | | | | | | | | | | | | | | | | |
| | | | |
Investment advisory and management fees | | | | 372,330 | | | | | 148,647 | | | | | 363,367 | | | | | 15,130 | |
| | | | |
Administrative fees | | | | 79,785 | | | | | 31,853 | | | | | 87,911 | | | | | 3,782 | |
| | | | |
Distribution fees | | | | 1,717 | | | | | — | | | | | 10,953 | | | | | 1,453 | |
| | | | |
Shareholder service fees | | | | 18,385 | | | | | 37,490 | | | | | 12,186 | | | | | 367 | |
| | | | |
Other | | | | 77,235 | | | | | 60,299 | | | | | 80,174 | | | | | 84,366 | |
| | | | |
Total liabilities | | | | 2,949,202 | | | | | 1,417,486 | | | | | 16,170,981 | | | | | 239,203 | |
| | | | | | | | | | | | | | | | | | | | |
Commitments and Contingencies (Notes 2 & 6) | | | | | | | | | | | | | | | | | | | | |
| | | | | | | | | | | | | | | | | | | | |
| | | | |
Net Assets | | | | $640,715,274 | | | | | $257,598,764 | | | | | $696,913,048 | | | | | $27,151,463 | |
| | | | |
1 Investments at cost | | | | $481,749,106 | | | | | $198,714,622 | | | | | $589,921,998 | | | | | $27,228,212 | |
The accompanying notes are an integral part of these financial statements.
27
| | |
| | | Statement of Assets and Liabilities (continued) |
| | | |
| | | |
| | | | | | | | | | | | | | | | | | | | |
| | | AMG
GW&K Small Cap
Core Fund | | AMG
GW&K Small Cap
Value Fund | | AMG
GW&K Small/Mid Cap
Core Fund | | AMG
GW&K Global
Allocation Fund |
| | | | |
Net Assets Represent: | | | | | | | | | | | | | | | | | | | | |
| | | | |
Paid-in capital | | | | $484,094,439 | | | | | $196,070,190 | | | | | $591,426,301 | | | | | $27,151,308 | |
| | | | |
Total distributable earnings | | | | 156,620,835 | | | | | 61,528,574 | | | | | 105,486,747 | | | | | 155 | |
| | | | |
Net Assets | | | | $640,715,274 | | | | | $257,598,764 | | | | | $696,913,048 | | | | | $27,151,463 | |
| | | | |
Class N: | | | | | | | | | | | | | | | | | | | | |
| | | | |
Net Assets | | | | $8,335,778 | | | | | $165,039,759 | | | | | $53,075,606 | | | | | $19,457,460 | |
| | | | |
Shares outstanding | | | | 283,346 | | | | | 5,545,091 | | | | | 3,085,279 | | | | | 1,684,053 | |
| | | | |
Net asset value, offering and redemption price per share | | | | $29.42 | | | | | $29.76 | | | | | $17.20 | | | | | $11.55 | |
| | | | |
Class I: | | | | | | | | | | | | | | | | | | | | |
| | | | |
Net Assets | | | | $421,135,676 | | | | | $86,356,848 | | | | | $296,659,228 | | | | | $6,596,583 | |
| | | | |
Shares outstanding | | | | 13,899,802 | | | | | 2,905,123 | | | | | 17,183,794 | | | | | 560,223 | |
| | | | |
Net asset value, offering and redemption price per share | | | | $30.30 | | | | | $29.73 | | | | | $17.26 | | | | | $11.77 | |
| | | | |
Class Z: | | | | | | | | | | | | | | | | | | | | |
| | | | |
Net Assets | | | | $211,243,820 | | | | | $6,202,157 | | | | | $347,178,214 | | | | | $1,097,420 | |
| | | | |
Shares outstanding | | | | 6,967,046 | | | | | 209,495 | | | | | 20,075,991 | | | | | 93,352 | |
| | | | |
Net asset value, offering and redemption price per share | | | | $30.32 | | | | | $29.61 | | | | | $17.29 | | | | | $11.76 | |
The accompanying notes are an integral part of these financial statements.
28
| | |
| | | Statement of Operations For the fiscal year ended December 31, 2023 |
| | | |
| | | |
| | | | | | | | | | | | | | | | | | | | |
| | | AMG
GW&K Small Cap
Core Fund | | AMG
GW&K Small Cap
Value Fund | | AMG
GW&K Small/Mid
Cap Core Fund | | AMG
GW&K Global
Allocation Fund |
| | | | |
Investment Income: | | | | | | | | | | | | | | | | | | | | |
| | | | |
Dividend income | | | | $7,957,059 | | | | | $4,259,085 | | | | | $6,276,650 | | | | | $270,841 | |
| | | | |
Interest income | | | | 749,293 | | | | | 190,143 | | | | | 570,716 | | | | | 564,489 | |
| | | | |
Securities lending income | | | | 29,141 | | | | | 17,333 | | | | | 31,348 | | | | | 5,544 | |
| | | | |
Foreign withholding tax | | | | (328 | ) | | | | (2,455 | ) | | | | (798 | ) | | | | (47,258 | ) |
| | | | |
Total investment income | | | | 8,735,165 | | | | | 4,464,106 | | | | | 6,877,916 | | | | | 793,616 | |
| | | | |
Expenses: | | | | | | | | | | | | | | | | | | | | |
| | | | |
Investment advisory and management fees | | | | 4,659,582 | | | | | 1,749,632 | | | | | 4,039,089 | | | | | 221,209 | |
| | | | |
Administrative fees | | | | 998,482 | | | | | 374,921 | | | | | 977,199 | | | | | 55,302 | |
| | | | |
Distribution fees - Class N | | | | 20,421 | | | | | — | | | | | 128,855 | | | | | 53,720 | |
| | | | |
Shareholder servicing fees - Class N | | | | 12,253 | | | | | 399,819 | | | | | — | | | | | — | |
| | | | |
Shareholder servicing fees - Class I | | | | 214,973 | | | | | 41,857 | | | | | 133,003 | | | | | 10,418 | |
| | | | |
Professional fees | | | | 84,285 | | | | | 57,883 | | | | | 87,706 | | | | | 46,356 | |
| | | | |
Custodian fees | | | | 66,012 | | | | | 32,125 | | | | | 65,430 | | | | | 30,488 | |
| | | | |
Registration fees | | | | 54,157 | | | | | 44,110 | | | | | 61,394 | | | | | 66,220 | |
| | | | |
Reports to shareholders | | | | 52,859 | | | | | 28,014 | | | | | 57,645 | | | | | 23,808 | |
| | | | |
Trustee fees and expenses | | | | 48,143 | | | | | 18,126 | | | | | 48,229 | | | | | 2,690 | |
| | | | |
Transfer agent fees | | | | 26,407 | | | | | 24,714 | | | | | 33,088 | | | | | 6,496 | |
| | | | |
Interest expense | | | | 5,929 | | | | | — | | | | | — | | | | | — | |
| | | | |
Miscellaneous | | | | 35,862 | | | | | 14,499 | | | | | 32,602 | | | | | 23,549 | |
| | | | |
Repayment of prior reimbursements | | | | 9,858 | | | | | — | | | | | 2,140 | | | | | — | |
| | | | |
Total expenses before offsets | | | | 6,289,223 | | | | | 2,785,700 | | | | | 5,666,380 | | | | | 540,256 | |
| | | | |
Expense reimbursements | | | | (44,646 | ) | | | | (94,496 | ) | | | | (62,502 | ) | | | | (178,130 | ) |
| | | | |
Expense reductions | | | | (38,740 | ) | | | | (16,749 | ) | | | | (13,277 | ) | | | | — | |
| | | | |
Fee waivers | | | | — | | | | | — | | | | | — | | | | | (6,447 | ) |
| | | | |
Net expenses | | | | 6,205,837 | | | | | 2,674,455 | | | | | 5,590,601 | | | | | 355,679 | |
| | | | | | | | | | | | | | | | | | | | |
| | | | |
Net investment income | | | | 2,529,328 | | | | | 1,789,651 | | | | | 1,287,315 | | | | | 437,937 | |
| | | | |
Net Realized and Unrealized Gain: | | | | | | | | | | | | | | | | | | | | |
| | | | |
Net realized gain (loss) on investments | | | | 1,660,979 | | | | | 2,909,094 | | | | | (7,110,048 | ) | | | | 5,789,015 | |
| | | | |
Net realized loss on foreign currency transactions | | | | — | | | | | — | | | | | — | | | | | (5,890 | ) |
| | | | |
Net change in unrealized appreciation/depreciation on investments | | | | 44,726,622 | | | | | 35,560,602 | | | | | 92,679,674 | | | | | (4,181,179 | ) |
| | | | |
Net change in unrealized appreciation/depreciation on foreign currency translations | | | | — | | | | | — | | | | | — | | | | | 1,554 | |
| | | | |
Net realized and unrealized gain | | | | 46,387,601 | | | | | 38,469,696 | | | | | 85,569,626 | | | | | 1,603,500 | |
| | | | | | | | | | | | | | | | | | | | |
| | | | |
Net increase in net assets resulting from operations | | | | $48,916,929 | | | | | $40,259,347 | | | | | $86,856,941 | | | | | $2,041,437 | |
The accompanying notes are an integral part of these financial statements.
29
| | |
| | | Statements of Changes in Net Assets For the fiscal years ended December 31, |
| | | |
| | | |
| | | | | | | | | | | | | | | | | | | | |
| | | AMG
GW&K Small Cap
Core Fund | | AMG
GW&K Small Cap
Value Fund |
| | | | |
| | | 2023 | | 2022 | | 2023 | | 2022 |
| | | | |
Increase (Decrease) in Net Assets Resulting From Operations: | | | | | | | | | | | | | | | | | | | | |
| | | | |
Net investment income | | | | $2,529,328 | | | | | $980,632 | | | | | $1,789,651 | | | | | $1,649,617 | |
| | | | |
Net realized gain on investments | | | | 1,660,979 | | | | | 8,194,929 | | | | | 2,909,094 | | | | | 2,350,459 | |
| | | | |
Net change in unrealized appreciation/depreciation on investments | | | | 44,726,622 | | | | | (135,195,014 | ) | | | | 35,560,602 | | | | | (58,011,614 | ) |
| | | | | | | | | | | | | | | | | | | | |
| | | | |
Net increase (decrease) in net assets resulting from operations | | | | 48,916,929 | | | | | (126,019,453 | ) | | | | 40,259,347 | | | | | (54,011,538 | ) |
| | | | |
Distributions to Shareholders: | | | | | | | | | | | | | | | | | | | | |
| | | | |
Class N | | | | (58,273 | ) | | | | (64,594 | ) | | | | (2,472,103 | ) | | | | (2,695,354 | ) |
| | | | |
Class I | | | | (4,206,615 | ) | | | | (3,756,002 | ) | | | | (1,481,630 | ) | | | | (1,530,323 | ) |
| | | | |
Class Z | | | | (2,323,516 | ) | | | | (2,006,227 | ) | | | | (107,131 | ) | | | | (164,728 | ) |
| | | | |
Total distributions to shareholders | | | | (6,588,404 | ) | | | | (5,826,823 | ) | | | | (4,060,864 | ) | | | | (4,390,405 | ) |
| | | | |
Capital Share Transactions:1 | | | | | | | | | | | | | | | | | | | | |
| | | | |
Net increase (decrease) from capital share transactions | | | | (62,153,366 | ) | | | | 34,931,383 | | | | | (30,511,025 | ) | | | | (61,819,336 | ) |
| | | | | | | | | | | | | | | | | | | | |
| | | | |
Total increase (decrease) in net assets | | | | (19,824,841 | ) | | | | (96,914,893 | ) | | | | 5,687,458 | | | | | (120,221,279 | ) |
| | | | |
Net Assets: | | | | | | | | | | | | | | | | | | | | |
| | | | |
Beginning of year | | | | 660,540,115 | | | | | 757,455,008 | | | | | 251,911,306 | | | | | 372,132,585 | |
| | | | | | | | | | | | | | | | | | | | |
| | | | |
End of year | | | | $640,715,274 | | | | | $660,540,115 | | | | | $257,598,764 | | | | | $251,911,306 | |
1 See Note 1(g) of the Notes to Financial Statements.
The accompanying notes are an integral part of these financial statements.
30
| | |
| | | Statements of Changes in Net Assets (continued) For the fiscal years ended December 31, |
| | | |
| | | |
| | | | | | | | | | | | | | | | |
| | | AMG
GW&K Small/Mid Cap
Core Fund | | | AMG
GW&K Global
Allocation Fund | |
| | | | |
| | | 2023 | | | 2022 | | | 2023 | | | 2022 | |
| | | | |
Increase (Decrease) in Net Assets Resulting From Operations: | | | | | | | | | | | | | | | | |
| | | | |
Net investment income | | | $1,287,315 | | | | $1,413,863 | | | | $437,937 | | | | $348,609 | |
| | | | |
Net realized gain (loss) on investments | | | (7,110,048 | ) | | | 11,157,155 | | | | 5,783,125 | | | | 2,887,870 | |
| | | | |
Net change in unrealized appreciation/depreciation on investments | | | 92,679,674 | | | | (126,909,129 | ) | | | (4,179,625 | ) | | | (28,082,042 | ) |
| | | | | | | | | | | | | | | | |
| | | | |
Net increase (decrease) in net assets resulting from operations | | | 86,856,941 | | | | (114,338,111 | ) | | | 2,041,437 | | | | (24,845,563 | ) |
| | | | |
Distributions to Shareholders: | | | | | | | | | | | | | | | | |
| | | | |
Class N | | | — | | | | (2,004,795 | ) | | | (4,440,153 | ) | | | (2,644,479 | ) |
| | | | |
Class I | | | (568,708 | ) | | | (10,257,877 | ) | | | (1,823,450 | ) | | | (1,798,913 | ) |
| | | | |
Class Z | | | (857,186 | ) | | | (10,783,979 | ) | | | (261,489 | ) | | | (201,039 | ) |
| | | | |
Total distributions to shareholders | | | (1,425,894 | ) | | | (23,046,651 | ) | | | (6,525,092 | ) | | | (4,644,431 | ) |
| | | | |
Capital Share Transactions:1 | | | | | | | | | | | | | | | | |
| | | | |
Net increase (decrease) from capital share transactions | | | 47,327,881 | | | | 138,227,537 | | | | (9,414,026 | ) | | | (56,032,680 | ) |
| | | | | | | | | | | | | | | | |
| | | | |
Total increase (decrease) in net assets | | | 132,758,928 | | | | 842,775 | | | | (13,897,681 | ) | | | (85,522,674 | ) |
| | | | |
Net Assets: | | | | | | | | | | | | | | | | |
| | | | |
Beginning of year | | | 564,154,120 | | | | 563,311,345 | | | | 41,049,144 | | | | 126,571,818 | |
| | | | | | | | | | | | | | | | |
| | | | |
End of year | | | $696,913,048 | | | | $564,154,120 | | | | $27,151,463 | | | | $41,049,144 | |
1 See Note 1(g) of the Notes to Financial Statements.
The accompanying notes are an integral part of these financial statements.
31
| | |
| | | AMG GW&K Small Cap Core Fund Financial Highlights For a share outstanding throughout each fiscal year |
| | | |
| | | |
| | | | | | | | | | | | | | | | | | | | |
| | | For the fiscal years ended December 31, | |
| | | | | |
| Class N | | 2023 | | | 2022 | | | 2021 | | | 2020 | | | 2019 |
| | | | | |
Net Asset Value, Beginning of Year | | | $27.43 | | | | $33.13 | | | | $29.97 | | | | $26.09 | | | | $21.03 | |
| | | | | |
Income (loss) from Investment Operations: | | | | | | | | | | | | | | | | | | | | |
| | | | | |
Net investment income (loss)1,2 | | | 0.00 | 3 | | | (0.06 | ) | | | (0.15 | ) | | | (0.03 | ) | | | (0.04 | ) |
| | | | | |
Net realized and unrealized gain (loss) on investments | | | 2.19 | | | | (5.43 | ) | | | 6.34 | | | | 4.64 | | | | 6.47 | |
| | | | | | | | | | | | | | | | | | | | |
| | | | | |
Total income (loss) from investment operations | | | 2.19 | | | | (5.49 | ) | | | 6.19 | | | | 4.61 | | | | 6.43 | |
| | | | | |
Less Distributions to Shareholders from: | | | | | | | | | | | | | | | | | | | | |
| | | | | |
Net investment income | | | (0.03 | ) | | | — | | | | — | | | | — | | | | — | |
| | | | | |
Net realized gain on investments | | | (0.17 | ) | | | (0.21 | ) | | | (3.03 | ) | | | (0.73 | ) | | | (1.37 | ) |
| | | | | | | | | | | | | | | | | | | | |
| | | | | |
Total distributions to shareholders | | | (0.20 | ) | | | (0.21 | ) | | | (3.03 | ) | | | (0.73 | ) | | | (1.37 | ) |
| | | | | |
Net Asset Value, End of Year | | | $29.42 | | | | $27.43 | | | | $33.13 | | | | $29.97 | | | | $26.09 | |
| | | | | | | | | | | | | | | | | | | | |
| | | | | |
Total Return2,4 | | | 8.02 | % | | | (16.58 | )% | | | 21.01 | % | | | 17.73 | % | | | 30.66 | % |
| | | | | |
Ratio of net expenses to average net assets5 | | | 1.30 | %6 | | | 1.29 | %6 | | | 1.30 | %6 | | | 1.29 | % | | | 1.29 | % |
| | | | | |
Ratio of gross expenses to average net assets7 | | | 1.31 | %6 | | | 1.30 | %6 | | | 1.30 | %6 | | | 1.30 | % | | | 1.31 | % |
| | | | | |
Ratio of net investment income (loss) to average net assets2 | | | 0.02 | % | | | (0.22 | )% | | | (0.45 | )% | | | (0.14 | )% | | | (0.15 | )% |
| | | | | |
Portfolio turnover | | | 20 | % | | | 25 | % | | | 33 | % | | | 37 | % | | | 20 | % |
| | | | | |
Net assets end of year (000’s) omitted | | | $8,336 | | | | $8,533 | | | | $11,278 | | | | $8,667 | | | | $10,239 | |
| | | | | | | | | | | | | | | | | | | | | |
32
| | |
| | | AMG GW&K Small Cap Core Fund Financial Highlights For a share outstanding throughout each fiscal year |
| | | |
| | | |
| | | | | | | | | | | | | | | | | | | | |
| | | For the fiscal years ended December 31, | |
| | | | | |
| Class I | | 2023 | | | 2022 | | | 2021 | | | 2020 | | | 2019 |
| | | | | | | | | | | | | | | | | | | | |
| | | | | |
Net Asset Value, Beginning of Year | | | $28.24 | | | | $34.02 | | | | $30.61 | | | | $26.57 | | | | $21.37 | |
| | | | | |
Income (loss) from Investment Operations: | | | | | | | | | | | | | | | | | | | | |
| | | | | |
Net investment income (loss)1,2 | | | 0.11 | | | | 0.04 | | | | (0.03 | ) | | | 0.05 | | | | 0.05 | |
| | | | | |
Net realized and unrealized gain (loss) on investments | | | 2.25 | | | | (5.57 | ) | | | 6.47 | | | | 4.76 | | | | 6.58 | |
| | | | | | | | | | | | | | | | | | | | |
| | | | | |
Total income (loss) from investment operations | | | 2.36 | | | | (5.53 | ) | | | 6.44 | | | | 4.81 | | | | 6.63 | |
| | | | | |
Less Distributions to Shareholders from: | | | | | | | | | | | | | | | | | | | | |
| | | | | |
Net investment income | | | (0.13 | ) | | | (0.04 | ) | | | — | | | | (0.04 | ) | | | (0.06 | ) |
| | | | | |
Net realized gain on investments | | | (0.17 | ) | | | (0.21 | ) | | | (3.03 | ) | | | (0.73 | ) | | | (1.37 | ) |
| | | | | | | | | | | | | | | | | | | | |
| | | | | |
Total distributions to shareholders | | | (0.30 | ) | | | (0.25 | ) | | | (3.03 | ) | | | (0.77 | ) | | | (1.43 | ) |
| | | | | |
Net Asset Value, End of Year | | | $30.30 | | | | $28.24 | | | | $34.02 | | | | $30.61 | | | | $26.57 | |
| | | | | | | | | | | | | | | | | | | | |
| | | | | |
Total Return2,4 | | | 8.39 | % | | | (16.27 | )% | | | 21.38 | % | | | 18.16 | % | | | 31.13 | % |
| | | | | |
Ratio of net expenses to average net assets5 | | | 0.95 | %6 | | | 0.94 | %6 | | | 0.95 | %6 | | | 0.94 | % | | | 0.94 | % |
| | | | | |
Ratio of gross expenses to average net assets7 | | | 0.96 | %6 | | | 0.95 | %6 | | | 0.95 | %6 | | | 0.95 | % | | | 0.96 | % |
| | | | | |
Ratio of net investment income (loss) to average net assets2 | | | 0.37 | % | | | 0.13 | % | | | (0.10 | )% | | | 0.21 | % | | | 0.20 | % |
| | | | | |
Portfolio turnover | | | 20 | % | | | 25 | % | | | 33 | % | | | 37 | % | | | 20 | % |
| | | | | |
Net assets end of year (000’s) omitted | | | $421,136 | | | | $433,066 | | | | $546,326 | | | | $470,373 | | | | $331,703 | |
| | | | | | | | | | | | | | | | | | | | | |
33
| | |
| | | AMG GW&K Small Cap Core Fund Financial Highlights For a share outstanding throughout each fiscal year |
| | | |
| | | |
| | | | | | | | | | | | | | | | | | | | |
| | | For the fiscal years ended December 31, |
| | | | | |
| Class Z | | 2023 | | 2022 | | 2021 | | 2020 | | 2019 |
| | | | | | | | | | | | | | | | | | | | |
| | | | | |
Net Asset Value, Beginning of Year | | | $28.26 | | | | $34.05 | | | | $30.61 | | | | $26.57 | | | | $21.37 | |
| | | | | |
Income (loss) from Investment Operations: | | | | | | | | | | | | | | | | | | | | |
| | | | | |
Net investment income (loss)1,2 | | | 0.12 | | | | 0.05 | | | | (0.02 | ) | | | 0.07 | | | | 0.06 | |
| | | | | |
Net realized and unrealized gain (loss) on investments | | | 2.26 | | | | (5.58 | ) | | | 6.49 | | | | 4.75 | | | | 6.59 | |
| | | | | | | | | | | | | | | | | | | | |
| | | | | |
Total income (loss) from investment operations | | | 2.38 | | | | (5.53 | ) | | | 6.47 | | | | 4.82 | | | | 6.65 | |
| | | | | |
Less Distributions to Shareholders from: | | | | | | | | | | | | | | | | | | | | |
| | | | | |
Net investment income | | | (0.15 | ) | | | (0.05 | ) | | | — | | | | (0.05 | ) | | | (0.08 | ) |
| | | | | |
Net realized gain on investments | | | (0.17 | ) | | | (0.21 | ) | | | (3.03 | ) | | | (0.73 | ) | | | (1.37 | ) |
| | | | | | | | | | | | | | | | | | | | |
| | | | | |
Total distributions to shareholders | | | (0.32 | ) | | | (0.26 | ) | | | (3.03 | ) | | | (0.78 | ) | | | (1.45 | ) |
| | | | | |
Net Asset Value, End of Year | | | $30.32 | | | | $28.26 | | | | $34.05 | | | | $30.61 | | | | $26.57 | |
| | | | | | | | | | | | | | | | | | | | |
| | | | | |
Total Return2,4 | | | 8.44 | % | | | (16.25 | )% | | | 21.48 | % | | | 18.21 | % | | | 31.13 | % |
| | | | | |
Ratio of net expenses to average net assets5 | | | 0.90 | %6 | | | 0.89 | %6 | | | 0.90 | %6 | | | 0.89 | % | | | 0.89 | % |
| | | | | |
Ratio of gross expenses to average net assets7 | | | 0.91 | %6 | | | 0.90 | %6 | | | 0.90 | %6 | | | 0.90 | % | | | 0.91 | % |
| | | | | |
Ratio of net investment income (loss) to average net assets2 | | | 0.42 | % | | | 0.18 | % | | | (0.05 | )% | | | 0.26 | % | | | 0.25 | % |
| | | | | |
Portfolio turnover | | | 20 | % | | | 25 | % | | | 33 | % | | | 37 | % | | | 20 | % |
| | | | | |
Net assets end of year (000’s) omitted | | | $211,244 | | | | $218,941 | | | | $199,851 | | | | $125,848 | | | | $110,020 | |
| | | | | | | | | | | | | | | | | | | | | |
| 1 | Per share numbers have been calculated using average shares. |
| 2 | Total returns and net investment income (loss) would have been lower had certain expenses not been offset. |
| 3 | Less than $0.005 per share. |
| 4 | The total return is calculated using the published Net Asset Value as of fiscal year end. |
| 5 | Includes reduction from broker recapture amounting to less than 0.01%, 0.01%, less than 0.01%, 0.01% and 0.01% for the fiscal years ended December 31, 2023, 2022, 2021, 2020 and 2019, respectively. |
| 6 | Such ratio includes recapture of waived/reimbursed fees from prior periods amounting to less than 0.01%, less than 0.01% and 0.01% for the fiscal years ended December 31, 2023, 2022 and 2021, respectively. |
| 7 | Excludes the impact of expense reimbursement or fee waivers and expense reductions such as brokerage credits, but includes expense repayments and non-reimbursable expenses, if any, such as interest, taxes, and extraordinary expenses. (See Note 1(c) and 2 in the Notes to Financial Statements.) |
34
| | |
| | | AMG GW&K Small Cap Value Fund Financial Highlights For a share outstanding throughout each fiscal year |
| | | |
| | | |
| | | | | | | | | | | | | | | | | | | | |
| | | For the fiscal years ended December 31, |
| | | | | |
| Class N | | 2023 | | 2022 | | 2021 | | 2020 | | 2019 |
| | | | | | | | | | | | | | | | | | | | |
| | | | | |
Net Asset Value, Beginning of Year | | | $25.73 | | | | $30.90 | | | | $26.71 | | | | $37.16 | | | | $30.93 | |
| | | | | |
Income (loss) from Investment Operations: | | | | | | | | | | | | | | | | | | | | |
| | | | | |
Net investment income1,2 | | | 0.17 | | | | 0.13 | | | | 0.09 | | | | 0.08 | | | | 0.07 | |
| | | | | |
Net realized and unrealized gain (loss) on investments | | | 4.31 | | | | (4.87 | ) | | | 8.41 | | | | 1.00 | | | | 8.79 | |
| | | | | | | | | | | | | | | | | | | | |
| | | | | |
Total income (loss) from investment operations | | | 4.48 | | | | (4.74 | ) | | | 8.50 | | | | 1.08 | | | | 8.86 | |
| | | | | |
Less Distributions to Shareholders from: | | | | | | | | | | | | | | | | | | | | |
| | | | | |
Net investment income | | | (0.20 | ) | | | (0.15 | ) | | | (0.08 | ) | | | (0.08 | ) | | | (0.09 | ) |
| | | | | |
Net realized gain on investments | | | (0.25 | ) | | | (0.28 | ) | | | (4.23 | ) | | | (11.45 | ) | | | (2.54 | ) |
| | | | | | | | | | | | | | | | | | | | |
| | | | | |
Total distributions to shareholders | | | (0.45 | ) | | | (0.43 | ) | | | (4.31 | ) | | | (11.53 | ) | | | (2.63 | ) |
| | | | | |
Net Asset Value, End of Year | | | $29.76 | | | | $25.73 | | | | $30.90 | | | | $26.71 | | | | $37.16 | |
| | | | | | | | | | | | | | | | | | | | |
| | | | | |
Total Return2,3 | | | 17.43 | % | | | (15.33 | )% | | | 32.93 | % | | | 3.29 | % | | | 28.64 | % |
| | | | | |
Ratio of net expenses to average net assets | | | 1.14 | %4 | | | 1.13 | %4 | | | 1.13 | %4 | | | 1.17 | % | | | 1.17 | % |
| | | | | |
Ratio of gross expenses to average net assets5 | | | 1.19 | % | | | 1.18 | % | | | 1.17 | % | | | 1.21 | % | | | 1.20 | % |
| | | | | |
Ratio of net investment income to average net assets2 | | | 0.64 | % | | | 0.47 | % | | | 0.28 | % | | | 0.28 | % | | | 0.19 | % |
| | | | | |
Portfolio turnover | | | 14 | % | | | 19 | % | | | 41 | % | | | 115 | % | | | 20 | % |
| | | | | |
Net assets end of year (000’s) omitted | | | $165,040 | | | | $162,011 | | | | $223,586 | | | | $243,655 | | | | $359,550 | |
| | | | | | | | | | | | | | | | | | | | | |
35
| | |
| | | AMG GW&K Small Cap Value Fund Financial Highlights For a share outstanding throughout each fiscal year |
| | | |
| | | |
| | | | | | | | | | | | | | | | | | | | |
| | | For the fiscal years ended December 31, |
| | | | | |
| Class I | | 2023 | | 2022 | | 2021 | | 2020 | | 2019 |
| | | | | | | | | | | | | | | | | | | | |
| | | | | |
Net Asset Value, Beginning of Year | | | $25.69 | | | | $30.87 | | | | $26.79 | | | | $37.23 | | | | $31.05 | |
| | | | | |
Income (loss) from Investment Operations: | | | | | | | | | | | | | | | | | | | | |
| | | | | |
Net investment income1,2 | | | 0.23 | | | | 0.18 | | | | 0.15 | | | | 0.14 | | | | 0.13 | |
| | | | | |
Net realized and unrealized gain (loss) on investments | | | 4.31 | | | | (4.87 | ) | | | 8.42 | | | | 1.02 | | | | 8.83 | |
| | | | | | | | | | | | | | | | | | | | |
| | | | | |
Total income (loss) from investment operations | | | 4.54 | | | | (4.69 | ) | | | 8.57 | | | | 1.16 | | | | 8.96 | |
| | | | | |
Less Distributions to Shareholders from: | | | | | | | | | | | | | | | | | | | | |
| | | | | |
Net investment income | | | (0.25 | ) | | | (0.21 | ) | | | (0.26 | ) | | | (0.15 | ) | | | (0.24 | ) |
| | | | | |
Net realized gain on investments | | | (0.25 | ) | | | (0.28 | ) | | | (4.23 | ) | | | (11.45 | ) | | | (2.54 | ) |
| | | | | | | | | | | | | | | | | | | | |
| | | | | |
Total distributions to shareholders | | | (0.50 | ) | | | (0.49 | ) | | | (4.49 | ) | | | (11.60 | ) | | | (2.78 | ) |
| | | | | |
Net Asset Value, End of Year | | | $29.73 | | | | $25.69 | | | | $30.87 | | | | $26.79 | | | | $37.23 | |
| | | | | | | | | | | | | | | | | | | | |
| | | | | |
Total Return2,3 | | | 17.73 | % | | | (15.19 | )% | | | 33.17 | % | | | 3.50 | % | | | 28.86 | % |
| | | | | |
Ratio of net expenses to average net assets | | | 0.94 | %4 | | | 0.93 | %4 | | | 0.93 | %4 | | | 0.99 | % | | | 1.01 | % |
| | | | | |
Ratio of gross expenses to average net assets5 | | | 0.99 | % | | | 0.98 | % | | | 0.97 | % | | | 1.03 | % | | | 1.04 | % |
| | | | | |
Ratio of net investment income to average net assets2 | | | 0.84 | % | | | 0.67 | % | | | 0.48 | % | | | 0.46 | % | | | 0.35 | % |
| | | | | |
Portfolio turnover | | | 14 | % | | | 19 | % | | | 41 | % | | | 115 | % | | | 20 | % |
| | | | | |
Net assets end of year (000’s) omitted | | | $86,357 | | | | $81,319 | | | | $115,837 | | | | $83,003 | | | | $122,323 | |
| | | | | | | | | | | | | | | | | | | | | |
36
| | |
| | | AMG GW&K Small Cap Value Fund Financial Highlights For a share outstanding throughout each fiscal year |
| | | |
| | | |
| | | | | | | | | | | | | | | | | | | | |
| | | For the fiscal years ended December 31, |
| | | | | |
| Class Z | | 2023 | | 2022 | | 2021 | | 2020 | | 2019 |
| | | | | | | | | | | | | | | | | | | | |
| | | | | |
Net Asset Value, Beginning of Year | | | $25.59 | | | | $30.76 | | | | $26.72 | | | | $37.16 | | | | $31.10 | |
| | | | | |
Income (loss) from Investment Operations: | | | | | | | | | | | | | | | | | | | | |
| | | | | |
Net investment income1,2 | | | 0.24 | | | | 0.20 | | | | 0.16 | | | | 0.16 | | | | 0.16 | |
| | | | | |
Net realized and unrealized gain (loss) on investments | | | 4.30 | | | | (4.87 | ) | | | 8.41 | | | | 1.02 | | | | 8.84 | |
| | | | | | | | | | | | | | | | | | | | |
| | | | | |
Total income (loss) from investment operations | | | 4.54 | | | | (4.67 | ) | | | 8.57 | | | | 1.18 | | | | 9.00 | |
| | | | | |
Less Distributions to Shareholders from: | | | | | | | | | | | | | | | | | | | | |
| | | | | |
Net investment income | | | (0.27 | ) | | | (0.22 | ) | | | (0.30 | ) | | | (0.17 | ) | | | (0.40 | ) |
| | | | | |
Net realized gain on investments | | | (0.25 | ) | | | (0.28 | ) | | | (4.23 | ) | | | (11.45 | ) | | | (2.54 | ) |
| | | | | | | | | | | | | | | | | | | | |
| | | | | |
Total distributions to shareholders | | | (0.52 | ) | | | (0.50 | ) | | | (4.53 | ) | | | (11.62 | ) | | | (2.94 | ) |
| | | | | |
Net Asset Value, End of Year | | | $29.61 | | | | $25.59 | | | | $30.76 | | | | $26.72 | | | | $37.16 | |
| | | | | | | | | | | | | | | | | | | | |
| | | | | |
Total Return2,3 | | | 17.77 | % | | | (15.16 | )% | | | 33.27 | % | | | 3.57 | % | | | 28.94 | % |
| | | | | |
Ratio of net expenses to average net assets | | | 0.89 | %4 | | | 0.88 | %4 | | | 0.88 | %4 | | | 0.92 | % | | | 0.92 | % |
| | | | | |
Ratio of gross expenses to average net assets5 | | | 0.94 | % | | | 0.93 | % | | | 0.92 | % | | | 0.96 | % | | | 0.95 | % |
| | | | | |
Ratio of net investment income to average net assets2 | | | 0.89 | % | | | 0.72 | % | | | 0.53 | % | | | 0.53 | % | | | 0.44 | % |
| | | | | |
Portfolio turnover | | | 14 | % | | | 19 | % | | | 41 | % | | | 115 | % | | | 20 | % |
| | | | | |
Net assets end of year (000’s) omitted | | | $6,202 | | | | $8,582 | | | | $32,710 | | | | $10,481 | | | | $11,815 | |
| | | | | | | | | | | | | | | | | | | | | |
| 1 | Per share numbers have been calculated using average shares. |
| 2 | Total returns and net investment income (loss) would have been lower had certain expenses not been offset. |
| 3 | The total return is calculated using the published Net Asset Value as of fiscal year end. |
| 4 | Includes reduction from broker recapture amounting to 0.01%, 0.01% and 0.02% for the fiscal years ended December 31, 2023, 2022 and 2021, respectively. |
| 5 | Excludes the impact of expense reimbursement or fee waivers and expense reductions such as brokerage credits, but includes expense repayments and non-reimbursable expenses, if any, such as interest, taxes, and extraordinary expenses. (See Note 1(c) and 2 in the Notes to Financial Statements.) |
37
| | |
| | | AMG GW&K Small/Mid Cap Core Fund Financial Highlights For a share outstanding throughout each fiscal year |
| | | |
| | | |
| | | | | | | | | | | | | | | | | | | | |
| | | For the fiscal years ended December 31, |
| | | | | |
| Class N | | 2023 | | 2022 | | 2021 | | 2020 | | 2019 |
| | | | | | | | | | | | | | | | | | | | |
| | | | | |
Net Asset Value, Beginning of Year | | | $15.02 | | | | $19.08 | | | | $16.04 | | | | $13.03 | | | | $9.99 | |
| | | | | |
Income (loss) from Investment Operations: | | | | | | | | | | | | | | | | | | | | |
| | | | | |
Net investment income (loss)1,2 | | | (0.00 | )3 | | | 0.01 | | | | (0.06 | ) | | | (0.01 | ) | | | 0.00 | 4 |
| | | | | |
Net realized and unrealized gain (loss) on investments | | | 2.18 | | | | (3.47 | ) | | | 4.14 | | | | 3.02 | | | | 3.07 | |
| | | | | | | | | | | | | | | | | | | | |
| | | | | |
Total income (loss) from investment operations | | | 2.18 | | | | (3.46 | ) | | | 4.08 | | | | 3.01 | | | | 3.07 | |
| | | | | |
Less Distributions to Shareholders from: | | | | | | | | | | | | | | | | | | | | |
| | | | | |
Net investment income | | | — | | | | (0.00 | )3 | | | — | | | | — | | | | (0.01 | ) |
| | | | | |
Net realized gain on investments | | | — | | | | (0.60 | ) | | | (1.04 | ) | | | — | | | | (0.02 | ) |
| | | | | | | | | | | | | | | | | | | | |
| | | | | |
Total distributions to shareholders | | | — | | | | (0.60 | ) | | | (1.04 | ) | | | — | | | | (0.03 | ) |
| | | | | |
Net Asset Value, End of Year | | | $17.20 | | | | $15.02 | | | | $19.08 | | | | $16.04 | | | | $13.03 | |
| | | | | | | | | | | | | | | | | | | | |
| | | | | |
Total Return2,5 | | | 14.51 | % | | | (18.15 | )% | | | 25.63 | % | | | 23.10 | % | | | 30.64 | % |
| | | | | |
Ratio of net expenses to average net assets6 | | | 1.07 | %7 | | | 1.06 | %7 | | | 1.06 | %7 | | | 1.10 | % | | | 1.09 | % |
| | | | | |
Ratio of gross expenses to average net assets8 | | | 1.08 | %7 | | | 1.08 | %7 | | | 1.08 | %7 | | | 1.13 | % | | | 1.14 | % |
| | | | | |
Ratio of net investment income (loss) to average net assets2 | | | (0.01 | )% | | | 0.04 | % | | | (0.32 | )% | | | (0.07 | )% | | | 0.02 | % |
| | | | | |
Portfolio turnover | | | 19 | % | | | 25 | % | | | 19 | % | | | 29 | % | | | 18 | % |
| | | | | |
Net assets end of year (000’s) omitted | | | $53,076 | | | | $51,333 | | | | $70,736 | | | | $224 | | | | $172 | |
| | | | | | | | | | | | | | | | | | | | | |
38
| | |
| | | AMG GW&K Small/Mid Cap Core Fund Financial Highlights For a share outstanding throughout each fiscal year |
| | | |
| | | |
| | | | | | | | | | | | | | | | | | | | |
| | | For the fiscal years ended December 31, |
| | | | | |
| Class I | | 2023 | | 2022 | | 2021 | | 2020 | | 2019 |
| | | | | | | | | | | | | | | | | | | | |
| | | | | |
Net Asset Value, Beginning of Year | | | $15.07 | | | | $19.15 | | | | $16.06 | | | | $13.04 | | | | $9.99 | |
| | | | | |
Income (loss) from Investment Operations: | | | | | | | | | | | | | | | | | | | | |
| | | | | |
Net investment income (loss)1,2 | | | 0.03 | | | | 0.04 | | | | (0.02 | ) | | | 0.01 | | | | 0.02 | |
| | | | | |
Net realized and unrealized gain (loss) on investments | | | 2.19 | | | | (3.48 | ) | | | 4.15 | | | | 3.03 | | | | 3.07 | |
| | | | | | | | | | | | | | | | | | | | |
| | | | | |
Total income (loss) from investment operations | | | 2.22 | | | | (3.44 | ) | | | 4.13 | | | | 3.04 | | | | 3.09 | |
| | | | | |
Less Distributions to Shareholders from: | | | | | | | | | | | | | | | | | | | | |
| | | | | |
Net investment income | | | (0.03 | ) | | | (0.04 | ) | | | — | | | | (0.02 | ) | | | (0.02 | ) |
| | | | | |
Net realized gain on investments | | | — | | | | (0.60 | ) | | | (1.04 | ) | | | — | | | | (0.02 | ) |
| | | | | | | | | | | | | | | | | | | | |
| | | | | |
Total distributions to shareholders | | | (0.03 | ) | | | (0.64 | ) | | | (1.04 | ) | | | (0.02 | ) | | | (0.04 | ) |
| | | | | |
Net Asset Value, End of Year | | | $17.26 | | | | $15.07 | | | | $19.15 | | | | $16.06 | | | | $13.04 | |
| | | | | | | | | | | | | | | | | | | | |
| | | | | |
Total Return2,5 | | | 14.76 | % | | | (18.01 | )% | | | 25.91 | % | | | 23.31 | % | | | 30.86 | % |
| | | | | |
Ratio of net expenses to average net assets6 | | | 0.87 | %7 | | | 0.86 | %7 | | | 0.86 | %7 | | | 0.92 | % | | | 0.94 | % |
| | | | | |
Ratio of gross expenses to average net assets8 | | | 0.88 | %7 | | | 0.88 | %7 | | | 0.88 | %7 | | | 0.95 | % | | | 0.99 | % |
| | | | | |
Ratio of net investment income (loss) to average net assets2 | | | 0.19 | % | | | 0.24 | % | | | (0.12 | )% | | | 0.11 | % | | | 0.17 | % |
| | | | | |
Portfolio turnover | | | 19 | % | | | 25 | % | | | 19 | % | | | 29 | % | | | 18 | % |
| | | | | |
Net assets end of year (000’s) omitted | | | $296,659 | | | | $250,024 | | | | $293,614 | | | | $165,840 | | | | $102,784 | |
| | | | | | | | | | | | | | | | | | | | | |
39
| | |
| | | AMG GW&K Small/Mid Cap Core Fund Financial Highlights For a share outstanding throughout each fiscal year |
| | | |
| | | |
| | | | | | | | | | | | | | | | | | | | |
| | | For the fiscal years ended December 31, |
| | | | | |
| Class Z | | 2023 | | 2022 | | 2021 | | 2020 | | 2019 |
| | | | | | | | | | | | | | | | | | | | |
| | | | | |
Net Asset Value, Beginning of Year | | | $15.10 | | | | $19.18 | | | | $16.07 | | | | $13.05 | | | | $10.00 | |
| | | | | |
Income (loss) from Investment Operations: | | | | | | | | | | | | | | | | | | | | |
| | | | | |
Net investment income (loss)1,2 | | | 0.04 | | | | 0.05 | | | | (0.01 | ) | | | 0.02 | | | | 0.03 | |
| | | | | |
Net realized and unrealized gain (loss) on investments | | | 2.19 | | | | (3.48 | ) | | | 4.16 | | | | 3.03 | | | | 3.07 | |
| | | | | | | | | | | | | | | | | | | | |
| | | | | |
Total income (loss) from investment operations | | | 2.23 | | | | (3.43 | ) | | | 4.15 | | | | 3.05 | | | | 3.10 | |
| | | | | |
Less Distributions to Shareholders from: | | | | | | | | | | | | | | | | | | | | |
| | | | | |
Net investment income | | | (0.04 | ) | | | (0.05 | ) | | | — | | | | (0.03 | ) | | | (0.03 | ) |
| | | | | |
Net realized gain on investments | | | — | | | | (0.60 | ) | | | (1.04 | ) | | | — | | | | (0.02 | ) |
| | | | | | | | | | | | | | | | | | | | |
| | | | | |
Total distributions to shareholders | | | (0.04 | ) | | | (0.65 | ) | | | (1.04 | ) | | | (0.03 | ) | | | (0.05 | ) |
| | | | | |
Net Asset Value, End of Year | | | $17.29 | | | | $15.10 | | | | $19.18 | | | | $16.07 | | | | $13.05 | |
| | | | | | | | | | | | | | | | | | | | |
| | | | | |
Total Return2,5 | | | 14.78 | % | | | (17.94 | )% | | | 26.02 | % | | | 23.37 | % | | | 30.94 | % |
| | | | | |
Ratio of net expenses to average net assets6 | | | 0.82 | %7 | | | 0.81 | %7 | | | 0.81 | %7 | | | 0.83 | % | | | 0.84 | % |
| | | | | |
Ratio of gross expenses to average net assets8 | | | 0.83 | %7 | | | 0.83 | %7 | | | 0.83 | %7 | | | 0.86 | % | | | 0.89 | % |
| | | | | |
Ratio of net investment income (loss) to average net assets2 | | | 0.24 | % | | | 0.29 | % | | | (0.07 | )% | | | 0.19 | % | | | 0.27 | % |
| | | | | |
Portfolio turnover | | | 19 | % | | | 25 | % | | | 19 | % | | | 29 | % | | | 18 | % |
| | | | | |
Net assets end of year (000’s) omitted | | | $347,178 | | | | $262,798 | | | | $198,961 | | | | $104,705 | | | | $95,884 | |
| | | | | | | | | | | | | | | | | | | | | |
| 1 | Per share numbers have been calculated using average shares. |
| 2 | Total returns and net investment income (loss) would have been lower had certain expenses not been offset. |
| 3 | Less than $(0.005) per share. |
| 4 | Less than $0.005 per share. |
| 5 | The total return is calculated using the published Net Asset Value as of fiscal year end. |
| 6 | Includes reduction from broker recapture amounting to less than 0.01%, less than 0.01%, 0.01%, 0.01% and 0.01% for the fiscal years ended December 31, 2023, 2022, 2021, 2020 and 2019, respectively. |
| 7 | Such ratio includes recapture of waived/reimbursed fees from prior periods amounting to less than 0.01%. |
| 8 | Excludes the impact of expense reimbursement or fee waivers and expense reductions such as brokerage credits, but includes expense repayments and non-reimbursable expenses, if any, such as interest, taxes, and extraordinary expenses. (See Note 1(c) and 2 in the Notes to Financial Statements.) |
40
| | |
| | | AMG GW&K Global Allocation Fund Financial Highlights For a share outstanding throughout each fiscal year |
| | | |
| | | |
| | | | | | | | | | | | | | | | | | | | |
| | | For the fiscal years ended December 31, | |
| | | | | |
| Class N | | 2023 | | | 2022 | | | 2021 | | | 2020 | | | 2019 | |
| | | | | | | | | | | | | | | | | | | | |
| | | | | |
Net Asset Value, Beginning of Year | | | $13.93 | | | | $19.50 | | | | $19.50 | | | | $17.04 | | | | $15.45 | |
| | | | | |
Income (loss) from Investment Operations: | | | | | | | | | | | | | | | | | | | | |
| | | | | |
Net investment income (loss)1,2 | | | 0.16 | | | | 0.06 | | | | (0.04 | ) | | | 0.10 | | | | 0.25 | |
| | | | | |
Net realized and unrealized gain (loss) on investments | | | 0.59 | | | | (3.94 | ) | | | 0.51 | | | | 2.93 | | | | 2.35 | |
| | | | | | | | | | | | | | | | | | | | |
| | | | | |
Total income (loss) from investment operations | | | 0.75 | | | | (3.88 | ) | | | 0.47 | | | | 3.03 | | | | 2.60 | |
| | | | | |
Less Distributions to Shareholders from: | | | | | | | | | | | | | | | | | | | | |
| | | | | |
Net investment income | | | (0.19 | ) | | | (0.02 | ) | | | (0.00 | )3 | | | (0.09 | ) | | | (0.27 | ) |
| | | | | |
Net realized gain on investments | | | (2.94 | ) | | | (1.67 | ) | | | (0.47 | ) | | | (0.48 | ) | | | (0.74 | ) |
| | | | | |
Paid in capital | | | — | | | | — | | | | — | | | | (0.00 | )3 | | | — | |
| | | | | | | | | | | | | | | | | | | | |
| | | | | |
Total distributions to shareholders | | | (3.13 | ) | | | (1.69 | ) | | | (0.47 | ) | | | (0.57 | ) | | | (1.01 | ) |
| | | | | |
Net Asset Value, End of Year | | | $11.55 | | | | $13.93 | | | | $19.50 | | | | $19.50 | | | | $17.04 | |
| | | | | | | | | | | | | | | | | | | | |
| | | | | |
Total Return2,4 | | | 5.35 | % | | | (20.04 | )% | | | 2.44 | % | | | 18.92 | % | | | 16.96 | % |
| | | | | |
Ratio of net expenses to average net assets | | | 1.03 | %5 | | | 1.07 | %6 | | | 1.06 | % | | | 1.07 | %7 | | | 1.08 | %7 |
| | | | | |
Ratio of gross expenses to average net assets8 | | | 1.53 | % | | | 1.23 | %6 | | | 1.10 | % | | | 1.19 | % | | | 1.16 | % |
| | | | | |
Ratio of net investment income (loss) to average net assets2 | | | 1.12 | % | | | 0.38 | % | | | (0.21 | )% | | | 0.60 | % | | | 1.51 | % |
| | | | | |
Portfolio turnover | | | 20 | % | | | 36 | % | | | 36 | % | | | 156 | % | | | 123 | % |
| | | | | |
Net assets end of year (000’s) omitted | | | $19,457 | | | | $23,430 | | | | $41,939 | | | | $51,415 | | | | $69,774 | |
| | | | | | | | | | | | | | | | | | | | | |
41
| | |
| | | AMG GW&K Global Allocation Fund Financial Highlights For a share outstanding throughout each fiscal year |
| | | |
| | | |
| | | | | | | | | | | | | | | | | | | | |
| | | For the fiscal years ended December 31, | |
| | | | | |
| Class I | | 2023 | | | 2022 | | | 2021 | | | 2020 | | | 2019 | |
| | | | | | | | | | | | | | | | | | | | |
| | | | | |
Net Asset Value, Beginning of Year | | | $14.14 | | | | $19.75 | | | | $19.71 | | | | $17.22 | | | | $15.60 | |
| | | | | |
Income (loss) from Investment Operations: | | | | | | | | | | | | | | | | | | | | |
| | | | | |
Net investment income (loss)1,2 | | | 0.19 | | | | 0.09 | | | | (0.01 | ) | | | 0.13 | | | | 0.28 | |
| | | | | |
Net realized and unrealized gain (loss) on investments | | | 0.59 | | | | (4.00 | ) | | | 0.53 | | | | 2.95 | | | | 2.38 | |
| | | | | | | | | | | | | | | | | | | | |
| | | | | |
Total income (loss) from investment operations | | | 0.78 | | | | (3.91 | ) | | | 0.52 | | | | 3.08 | | | | 2.66 | |
| | | | | |
Less Distributions to Shareholders from: | | | | | | | | | | | | | | | | | | | | |
| | | | | |
Net investment income | | | (0.21 | ) | | | (0.03 | ) | | | (0.01 | ) | | | (0.11 | ) | | | (0.30 | ) |
| | | | | |
Net realized gain on investments | | | (2.94 | ) | | | (1.67 | ) | | | (0.47 | ) | | | (0.48 | ) | | | (0.74 | ) |
| | | | | |
Paid in capital | | | — | | | | — | | | | — | | | | (0.00 | )3 | | | — | |
| | | | | | | | | | | | | | | | | | | | |
| | | | | |
Total distributions to shareholders | | | (3.15 | ) | | | (1.70 | ) | | | (0.48 | ) | | | (0.59 | ) | | | (1.04 | ) |
| | | | | |
Net Asset Value, End of Year | | | $11.77 | | | | $14.14 | | | | $19.75 | | | | $19.71 | | | | $17.22 | |
| | | | | | | | | | | | | | | | | | | | |
| | | | | |
Total Return2,4 | | | 5.50 | % | | | (19.91 | )% | | | 2.60 | % | | | 19.08 | % | | | 17.17 | % |
| | | | | |
Ratio of net expenses to average net assets | | | 0.87 | %5 | | | 0.91 | %6 | | | 0.91 | % | | | 0.92 | %7 | | | 0.93 | %7 |
| | | | | |
Ratio of gross expenses to average net assets8 | | | 1.37 | % | | | 1.07 | %6 | | | 0.95 | % | | | 1.04 | % | | | 1.01 | % |
| | | | | |
Ratio of net investment income (loss) to average net assets2 | | | 1.28 | % | | | 0.54 | % | | | (0.06 | )% | | | 0.75 | % | | | 1.66 | % |
| | | | | |
Portfolio turnover | | | 20 | % | | | 36 | % | | | 36 | % | | | 156 | % | | | 123 | % |
| | | | | |
Net assets end of year (000’s) omitted | | | $6,597 | | | | $16,074 | | | | $81,515 | | | | $97,869 | | | | $173,575 | |
| | | | | | | | | | | | | | | | | | | | | |
42
| | |
| | | AMG GW&K Global Allocation Fund Financial Highlights For a share outstanding throughout each fiscal year |
| | | |
| | | |
| | | | | | | | | | | | | | | | | | | | |
| | | For the fiscal years ended December 31, | |
| | | | | |
| Class Z | | 2023 | | | 2022 | | | 2021 | | | 2020 | | | 2019 | |
| | | | | | | | | | | | | | | | | | | | |
| | | | | |
Net Asset Value, Beginning of Year | | | $14.13 | | | | $19.76 | | | | $19.71 | | | | $17.21 | | | | $15.60 | |
| | | | | |
Income (loss) from Investment Operations: | | | | | | | | | | | | | | | | | | | | |
| | | | | |
Net investment income1,2 | | | 0.20 | | | | 0.10 | | | | 0.01 | | | | 0.14 | | | | 0.30 | |
| | | | | |
Net realized and unrealized gain (loss) on investments | | | 0.60 | | | | (3.99 | ) | | | 0.52 | | | | 2.97 | | | | 2.37 | |
| | | | | | | | | | | | | | | | | | | | |
| | | | | |
Total income (loss) from investment operations | | | 0.80 | | | | (3.89 | ) | | | 0.53 | | | | 3.11 | | | | 2.67 | |
| | | | | |
Less Distributions to Shareholders from: | | | | | | | | | | | | | | | | | | | | |
| | | | | |
Net investment income | | | (0.23 | ) | | | (0.07 | ) | | | (0.01 | ) | | | (0.13 | ) | | | (0.32 | ) |
| | | | | |
Net realized gain on investments | | | (2.94 | ) | | | (1.67 | ) | | | (0.47 | ) | | | (0.48 | ) | | | (0.74 | ) |
| | | | | |
Paid in capital | | | — | | | | — | | | | — | | | | (0.00 | )3 | | | — | |
| | | | | | | | | | | | | | | | | | | | |
| | | | | |
Total distributions to shareholders | | | (3.17 | ) | | | (1.74 | ) | | | (0.48 | ) | | | (0.61 | ) | | | (1.06 | ) |
| | | | | |
Net Asset Value, End of Year | | | $11.76 | | | | $14.13 | | | | $19.76 | | | | $19.71 | | | | $17.21 | |
| | | | | | | | | | | | | | | | | | | | |
| | | | | |
Total Return2,4 | | | 5.65 | % | | | (19.85 | )% | | | 2.73 | % | | | 19.28 | % | | | 17.21 | % |
| | | | | |
Ratio of net expenses to average net assets | | | 0.79 | %5 | | | 0.82 | %6 | | | 0.81 | % | | | 0.82 | %7 | | | 0.83 | %7 |
| | | | | |
Ratio of gross expenses to average net assets8 | | | 1.29 | % | | | 0.98 | %6 | | | 0.85 | % | | | 0.94 | % | | | 0.91 | % |
| | | | | |
Ratio of net investment income to average net assets2 | | | 1.36 | % | | | 0.63 | % | | | 0.04 | % | | | 0.85 | % | | | 1.76 | % |
| | | | | |
Portfolio turnover | | | 20 | % | | | 36 | % | | | 36 | % | | | 156 | % | | | 123 | % |
| | | | | |
Net assets end of year (000’s) omitted | | | $1,097 | | | | $1,545 | | | | $3,118 | | | | $3,733 | | | | $8,358 | |
| | | | | | | | | | | | | | | | | | | | | |
| 1 | Per share numbers have been calculated using average shares. |
| 2 | Total returns and net investment income (loss) would have been lower had certain expenses not been offset. |
| 3 | Less than $(0.005) per share. |
| 4 | The total return is calculated using the published Net Asset Value as of fiscal year end. |
| 5 | Includes voluntary waiver of 0.02%. |
| 6 | Includes interest expense totaling 0.01% related to participation in the interfund lending program. |
| 7 | Includes reduction from broker recapture amounting to less than 0.01% and 0.01% for the fiscal years ended December 31, 2020 and 2019, respectively. |
| 8 | Excludes the impact of expense reimbursement or fee waivers and expense reductions such as brokerage credits, but includes expense repayments and non-reimbursable expenses, if any, such as interest, taxes, and extraordinary expenses. (See Note 1(c) and 2 in the Notes to Financial Statements.) |
43
| | |
| | | Notes to Financial Statements December 31, 2023 |
| | | |
| | | |
1. ORGANIZATION AND SUMMARY OF SIGNIFICANT ACCOUNTING POLICIES
AMG Funds and AMG Funds II (“Trust II” and, together with AMG Funds, the “Trusts”) are open-end management investment companies, organized as Massachusetts business trusts, and registered under the Investment Company Act of 1940, as amended (the “1940 Act”). Currently, the Trusts consist of a number of different funds, each having distinct investment management objectives, strategies, risks, and policies. Included in this report are AMG Funds: AMG GW&K Small Cap Core Fund (“Small Cap Core”), AMG GW&K Small Cap Value Fund (“Small Cap Value”) and AMG GW&K Small/Mid Cap Core Fund (“Small/Mid Cap Core”) (formerly, AMG GW&K Small/Mid Cap Fund) and Trust II: AMG GW&K Global Allocation Fund (“Global Allocation”), each a “Fund” and collectively, the “Funds”.
Each Fund offers Class N shares, Class I shares and Class Z shares. Each class represents an interest in the same assets of the respective Fund. Although all share classes generally have identical voting rights, each share class votes separately when required by law. Different share classes may have different net asset values per share to the extent the share classes pay different distribution amounts and/or the expenses of such share classes differ. Each share class has its own expense structure. Please refer to a current prospectus for additional information on each share class.
The Board of Trustees of Trust II approved a plan to liquidate and terminate Global Allocation (the “Liquidation”). In conjunction with the Liquidation, the Fund sold its portfolio investments and invested the proceeds in cash and cash equivalents. Effective December 12, 2023, Global Allocation discontinued accruing 12b-1 distribution fees through the liquidation date and effective December 18, 2023, and through the liquidation date, the Investment Manager waived its management fee and will waive the right to recoup any prior reimbursed expenses under the Fund’s Expense Limitation Agreement.
Market prices of investments held by the Funds may fall rapidly or unpredictably due to a variety of economic or political factors, market conditions, disasters or public health issues, or in response to events that affect particular industries or companies.
The Funds’ financial statements are prepared in accordance with accounting principles generally accepted in the United States of America (“U.S. GAAP”), including accounting and reporting guidance pursuant to Accounting Standards Codification Topic 946 applicable to investment companies. U.S. GAAP requires management to make estimates and assumptions that affect the reported amounts of assets and liabilities and disclosure of contingent assets and liabilities at the date of the financial statements and the reported amounts of income and expenses during the reporting period. Actual results could differ from those estimates and such differences could be material. The following is a summary of significant accounting policies followed by the Funds in the preparation of their financial statements:
a. VALUATION OF INVESTMENTS
Equity securities traded on a national securities exchange or reported on the NASDAQ national market system (“NMS”) are valued at the last quoted sales price on the primary exchange or, if applicable, the NASDAQ official closing price or the official closing price of the relevant exchange or, lacking any sales, at the last quoted bid price. Equity securities held by the Funds that are traded in the over-the-counter market (other than NMS securities) are valued at the bid price. Foreign equity securities (securities principally traded in markets other than U.S.
markets) held by the Funds are valued at the official closing price on the primary exchange or, for markets that either do not offer an official closing price or where the official closing price may not be representative of the overall market, the last quoted sale price.
Fixed income securities purchased with a remaining maturity exceeding 60 days are valued at the evaluated bid price provided by an authorized pricing service or, if an evaluated price is not available, by reference to other securities which are considered comparable in credit rating, interest rate, due date and other features (generally referred to as “matrix pricing”) or other similar pricing methodologies.
Fixed income securities purchased with a remaining maturity of 60 days or less are valued at amortized cost, provided that the amortized cost value is approximately the same as the fair value of the security valued without the use of amortized cost. Investments in other open-end registered investment companies are valued at their end of day net asset value per share.
The Funds’ portfolio investments are generally valued based on independent market quotations or prices or, if none, “evaluative” or other market based valuations provided by third party pricing services. Pursuant to Rule 2a-5 under the 1940 Act, the Funds’ Boards of Trustees (the “Board”) designated AMG Funds LLC (the “Investment Manager”) as the Funds’ Valuation Designee to perform the Funds’ fair value determinations. Such determinations are subject to Board oversight and certain reporting and other requirements intended to ensure that the Board receives the information it needs to oversee the Investment Manager’s fair value determinations.
Under certain circumstances, the value of certain Fund portfolio investments may be based on an evaluation of fair value, pursuant to procedures established by the Investment Manager and under the general supervision of the Board. The Funds may use the fair value of a portfolio investment to calculate its net asset value (“NAV”) in the event that the market quotation, price or market based valuation for the portfolio investment is not readily available or otherwise not determinable pursuant to the Funds’ valuation procedures, if the Investment Manager believes the quotation, price or market based valuation to be unreliable, or in certain other circumstances. When determining the fair value of an investment, the Investment Manager seeks to determine the price that the Funds might reasonably expect to receive from current sale of that portfolio investment in an arms-length transaction. Fair value determinations shall be based upon consideration of all available facts and information, including, but not limited to (i) attributes specific to the investment; (ii) fundamental and analytical data relating to the investment; and (iii) the value of other comparable securities or relevant financial instruments, including derivative securities, traded on other markets or among dealers.
The values assigned to fair value portfolio investments are based on available information and do not necessarily represent amounts that might ultimately be realized in the future, since such amounts depend on future developments inherent in long-term investments. Because of the inherent uncertainty of valuation, those estimated values may differ significantly from the values that would have been used had a ready market for the investments existed, and the differences could be material. The Board will be presented with quarterly reports, as of the most recent quarter end, summarizing all fair value activity, material fair value matters that occurred during the quarter, and all outstanding securities fair valued by the Funds. Additionally, the Board will be presented with an annual report that assesses the adequacy and effectiveness of the Investment Manager’s process for determining the fair value of the Funds’ investments.
With respect to foreign equity securities and certain foreign fixed income securities, securities held in the Funds that can be fair valued by the applicable
44
| | |
| | | Notes to Financial Statements (continued) |
| | | |
| | | |
fair value pricing service are fair valued on each business day provided that each individual price exceeds a pre-established confidence level.
U.S. GAAP defines fair value as the price that a fund would receive to sell an asset or pay to transfer a liability in an orderly transaction between market participants at the measurement date. U.S. GAAP also establishes a framework for measuring fair value, and a three level hierarchy for fair value measurements based upon the transparency of inputs to the valuation of an asset or liability. Inputs may be observable or unobservable and refer broadly to the assumptions that market participants would use in pricing the asset or liability. Observable inputs reflect the assumptions market participants would use in pricing the asset or liability based on market data obtained from sources independent of the Funds.
Unobservable inputs reflect the Funds’ own assumptions about the assumptions that market participants would use in pricing the asset or liability developed based on the best information available in the circumstances. Each investment is assigned a level based upon the observability of the inputs which are significant to the overall valuation.
The three-tier hierarchy of inputs is summarized below:
Level 1 – inputs are quoted prices in active markets for identical investments (e.g., equity securities, open-end investment companies)
Level 2 – other observable inputs (including, but not limited to: quoted prices for similar assets or liabilities in markets that are active, quoted prices for identical or similar assets or liabilities in markets that are not active, inputs other than quoted prices that are observable for the assets or liabilities (such as interest rates, yield curves, volatilities, prepayment speeds, loss severities, credit risks and default rates) or other market corroborated inputs) (e.g., debt securities, government securities, foreign currency exchange contracts, foreign securities utilizing international fair value pricing, fair valued securities with observable inputs)
Level 3 – inputs are significant unobservable inputs (including the Fund’s own assumptions used to determine the fair value of investments) (e.g., fair valued securities with unobservable inputs)
Changes in inputs or methodologies used for valuing investments may result in a transfer in or out of levels within the fair value hierarchy. The inputs or
methodologies used for valuing investments may not necessarily be an indication of the risk associated with investing in those investments.
b. SECURITY TRANSACTIONS
Security transactions are accounted for as of trade date. Realized gains and losses on securities sold are determined on the basis of identified cost.
c. INVESTMENT INCOME AND EXPENSES
Dividend income is recorded on the ex-dividend date. Dividends from foreign securities are recorded on the ex-dividend date, and if after the fact, as soon as the Funds become aware of the ex-dividend date. Interest income, which includes amortization of premium and accretion of discount on debt securities, is accrued as earned. Dividend and interest income on foreign securities is recorded gross of any withholding tax. Non-cash dividends included in dividend income, if any, are reported at the fair market value of the securities received. Upon notification from the issuer, distributions received from a real estate investment trust (REIT) may be redesignated as a reduction of cost of investments and/or realized gain. Other income and expenses are recorded on an accrual basis. Expenses that cannot be directly attributed to a Fund are apportioned among the funds in the Trusts and other funds within the AMG Funds Family of Funds (collectively, the “AMG Funds Family”) based upon their relative average net assets or number of shareholders. Investment income, realized and unrealized capital gains and losses, the common expenses of each Fund, and certain fund level expense reductions, if any, are allocated on a pro- rata basis to each class based on the relative net assets of each class to the total net assets of each Fund.
Small Cap Core, Small Cap Value and Small/Mid Cap Core had certain portfolio trades directed to various brokers under a brokerage recapture program. Credits received from the brokerage recapture program are earned and paid on a monthly basis, and are recorded as expense offsets, which serve to reduce the Fund’s overall expense ratio. For the fiscal year ended December 31, 2023, the impact on the expenses and expense ratios were as follows: Small Cap Core $38,740 or less than 0.01%, Small Cap Value $16,749 or 0.01% and Small/Mid Cap Core $13,277 or less than 0.01%.
d. DIVIDENDS AND DISTRIBUTIONS
Fund distributions resulting from either net investment income or realized net capital gains, if any, will normally be declared and paid at least annually in December. Distributions to shareholders are recorded on the ex-dividend date. Distributions are determined in accordance with federal income tax regulations, which may differ from net investment income and net realized capital gains for financial statement purposes (U.S. GAAP). Differences may be permanent or temporary. Permanent differences are reclassified among capital accounts in the financial statements to reflect their tax character. Permanent book and tax basis differences, if any, relating to shareholder distributions will result in reclassifications to paid-in capital. Temporary differences arise when certain items of income, expense and gain or loss are recognized in different periods for financial statement and tax purposes; these differences will reverse at some time in the future. Permanent differences for Global Allocation are primarily due to equalization utilized. There were no permanent differences during the year for Small Cap Core, Small Cap Value, and Small/Mid Cap Core. Temporary differences for Small Cap Core, Small Cap Value, and Small/Mid Cap Core are primarily due to wash sale loss deferrals. There were no temporary differences for Global Allocation.
The tax character of distributions paid during the fiscal years ended December 31, 2023 and December 31, 2022 was as follows:
| | | | | | | | | | | | | | | | |
| | |
| | | Small Cap Core | | | Small Cap Value | |
| | | | |
Distributions paid from: | | | 2023 | | | | 2022 | | | | 2023 | | | | 2022 | |
| | | | |
Ordinary income * | | | $2,576,784 | | | | $983,753 | | | | $1,865,133 | | | | $2,858,422 | |
| | | | |
Long-term capital gains | | | 4,011,620 | | | | 4,843,070 | | | | 2,195,731 | | | | 1,531,983 | |
| | | | | | | | | | | | | | | | |
| | | | |
| | | $6,588,404 | | | | $5,826,823 | | | | $4,060,864 | | | | $4,390,405 | |
| | | | | | | | | | | | | | | | |
45
| | |
| | | Notes to Financial Statements (continued) |
| | | |
| | | |
| | | | | | | | | | | | | | | | |
| | |
| | | Small/Mid Cap Core | | | Global Allocation | |
| | | | |
Distributions paid from: | | | 2023 | | | | 2022 | | | | 2023 | | | | 2022 | |
| | | | |
Ordinary income * | | | $1,425,894 | | | | $3,063,625 | | | | $728,606 | | | | $70,230 | |
| | | | |
Long-term capital gains | | | — | | | | 19,983,026 | | | | 5,796,486 | | | | 4,574,201 | |
| | | | | | | | | | | | | | | | |
| | | | |
| | | $1,425,894 | | | | $23,046,651 | | | | $6,525,092 | | | | $4,644,431 | |
| | | | | | | | | | | | | | | | |
| * | For tax purposes, short-term capital gain distributions, if any, are considered ordinary income distributions. |
As of December 31, 2023, the components of distributable earnings (excluding unrealized appreciation/depreciation) on a tax basis consisted of:
| | | | | | | | | | | | | | | | |
| | | | |
| | | Small Cap Core | | | Small Cap Value | | | Small/Mid Cap Core | | | Global Allocation | |
| | | | |
Capital loss carryforward | | | — | | | | — | | | | $10,955,179 | | | | — | |
| | | | |
Undistributed ordinary income | | | — | | | | $2,425,103 | | | | — | | | | — | |
| | | | |
Late-year capital loss deferral | | | $60,816 | | | | — | | | | — | | | | — | |
At December 31, 2023, the cost of investments and the aggregate gross unrealized appreciation and depreciation for federal income tax purposes were as follows:
| | | | | | | | | | | | | | | | |
| | | | |
| Fund | | Cost | | | Appreciation | | | Depreciation | | | Net Appreciation | |
| | | | |
Small Cap Core | | | $484,297,434 | | | | $192,231,577 | | | | $(35,549,926 | ) | | | $156,681,651 | |
| | | | |
Small Cap Value | | | 199,338,228 | | | | 67,950,258 | | | | (8,844,021 | ) | | | 59,106,237 | |
| | | | |
Small/Mid Cap Core | | | 591,568,572 | | | | 142,005,936 | | | | (25,564,010 | ) | | | 116,441,926 | |
| | | | |
Global Allocation | | | 27,228,212 | | | | 155 | | | | — | | | | 155 | |
e. FEDERAL TAXES
Each Fund currently qualifies as an investment company and intends to comply with the requirements under Subchapter M of the Internal Revenue Code of 1986, as amended (the “Internal Revenue Code”), and to distribute substantially all of its taxable income and gains to its shareholders and to meet certain diversification and income requirements with respect to investment companies. The Investment Manager has analyzed the Funds’ tax positions taken on federal income tax returns as of December 31, 2023, and for all open tax years (generally, the three prior taxable years), and has concluded that no provision for federal income tax is required in the Funds’ financial statements. Additionally, the Investment Manager is not aware of any tax position for which it is reasonably possible that the total amounts of unrecognized tax benefit/detriment will change materially in the next twelve months.
Furthermore, based on each Fund’s understanding of the tax rules and rates related to income, gains and transactions for the foreign jurisdictions in which it invests, each Fund will provide for foreign taxes, and where appropriate, deferred foreign taxes.
f. CAPITAL LOSS CARRYOVERS AND DEFERRALS
As of December 31, 2023, the following Fund had capital loss carryovers for federal income tax purposes as shown in the following chart. These amounts may be used to offset future realized capital gains indefinitely, and retain their character as short-term and/or long-term.
| | | | | | | | | | | | |
| | | |
| Fund | | Short-Term | | | Long-Term | | | Total | |
| | | |
Small/Mid Cap Core | | | $9,038,319 | | | | $1,916,860 | | | | $10,955,179 | |
As of December 31, 2023, Small Cap Core, Small Cap Value and Global Allocation had no capital loss carryovers for federal income tax purposes. Should the Funds incur net capital losses for the fiscal year ended December 31, 2024, such amounts may be used to offset future realized capital gains indefinitely, and retain their character as either short-term and/or long-term.
g. CAPITAL STOCK
Each of AMG Funds’ Amended and Restated Agreement and Declaration of Trust and AMG Funds II’s Amended and Restated Declaration of Trust authorizes for each applicable Fund the issuance of an unlimited number of shares of beneficial interest, without par value. Each Fund records sales and repurchases of its capital stock on the trade date.
46
| | |
| | | Notes to Financial Statements (continued) |
| | | |
| | | |
For the fiscal years ended December 31, 2023 and December 31, 2022, the capital stock transactions by class for the Funds were as follows:
| | | | | | | | | | | | | | | | | | | | | | | | | | | | | | | | |
| | | Small Cap Core | | | Small Cap Value | |
| | | | |
| | | December 31, 2023 | | | December 31, 2022 | | | December 31, 2023 | | | December 31, 2022 | |
| | | | | | | | |
| | | Shares | | | Amount | | | Shares | | | Amount | | | Shares | | | Amount | | | Shares | | | Amount | |
| | | | | | | | |
Class N: | | | | | | | | | | | | | | | | | | | | | | | | | | | | | | | | |
| | | | | | | | |
Shares sold | | | 29,118 | | | | $817,133 | | | | 37,881 | | | | $1,067,824 | | | | 180,373 | | | | $4,935,921 | | | | 328,009 | | | | $9,251,175 | |
| | | | | | | | |
Shares issued in reinvestment of distributions | | | 2,003 | | | | 58,273 | | | | 2,347 | | | | 64,594 | | | | 82,894 | | | | 2,445,379 | | | | 103,980 | | | | 2,676,448 | |
| | | | | | | | |
Shares redeemed | | | (58,835 | ) | | | (1,645,587 | ) | | | (69,611 | ) | | | (2,001,608 | ) | | | (1,015,943 | ) | | | (27,541,793 | ) | | | (1,369,396 | ) | | | (38,000,949 | ) |
| | | | | | | | | | | | | | | | | | | | | | | | | | | | | | | | |
| | | | | | | | |
Net decrease | | | (27,714 | ) | | | $(770,181 | ) | | | (29,383 | ) | | | $(869,190 | ) | | | (752,676 | ) | | | $(20,160,493 | ) | | | (937,407 | ) | | | $(26,073,326 | ) |
| | | | | | | | | | | | | | | | | | | | | | | | | | | | | | | | |
| | | | | | | | |
Class I: | | | | | | | | | | | | | | | | | | | | | | | | | | | | | | | | |
| | | | | | | | |
Shares sold | | | 2,751,955 | | | | $79,493,243 | | | | 4,099,105 | | | | $120,153,569 | | | | 288,685 | | | | $7,769,687 | | | | 175,101 | | | | $4,827,765 | |
| | | | | | | | |
Shares issued in reinvestment of distributions | | | 128,635 | | | | 3,852,621 | | | | 120,360 | | | | 3,408,606 | | | | 48,671 | | | | 1,433,860 | | | | 58,116 | | | | 1,494,168 | |
| | | | | | | | |
Shares redeemed | | | (4,316,175 | ) | | | (122,609,775 | ) | | | (4,942,007 | ) | | | (145,337,666 | ) | | | (597,479 | ) | | | (16,210,599 | ) | | | (820,535 | ) | | | (22,214,607 | ) |
| | | | | | | | | | | | | | | | | | | | | | | | | | | | | | | | |
| | | | | | | | |
Net decrease | | | (1,435,585 | ) | | | $(39,263,911 | ) | | | (722,542 | ) | | | $(21,775,491 | ) | | | (260,123 | ) | | | $(7,007,052 | ) | | | (587,318 | ) | | | $(15,892,674 | ) |
| | | | | | | | | | | | | | | | | | | | | | | | | | | | | | | | |
| | | | | | | | |
Class Z: | | | | | | | | | | | | | | | | | | | | | | | | | | | | | | | | |
| | | | | | | | |
Shares sold | | | 1,965,678 | | | | $58,356,284 | | | | 3,687,440 | | | | $109,560,529 | | | | 47,660 | | | | $1,319,831 | | | | 234,844 | | | | $6,285,035 | |
| | | | | | | | |
Shares issued in reinvestment of distributions | | | 74,897 | | | | 2,244,651 | | | | 67,660 | | | | 1,917,493 | | | | 3,651 | | | | 107,131 | | | | 6,435 | | | | 164,728 | |
| | | | | | | | |
Shares redeemed | | | (2,820,695 | ) | | | (82,720,209 | ) | | | (1,877,449 | ) | | | (53,901,958 | ) | | | (177,185 | ) | | | (4,770,442 | ) | | | (969,451 | ) | | | (26,303,099 | ) |
| | | | | | | | | | | | | | | | | | | | | | | | | | | | | | | | |
| | | | | | | | |
Net increase (decrease) | | | (780,120 | ) | | | $(22,119,274 | ) | | | 1,877,651 | | | | $57,576,064 | | | | (125,874 | ) | | | $(3,343,480 | ) | | | (728,172 | ) | | | $(19,853,336 | ) |
| | | | | | | | | | | | | | | | | | | | | | | | | | | | | | | | |
| | |
| | | Small/Mid Cap Core | | | Global Allocation | |
| | | | |
| | | December 31, 2023 | | | December 31, 2022 | | | December 31, 2023 | | | December 31, 2022 | |
| | | | | | | | |
| | | Shares | | | Amount | | | Shares | | | Amount | | | Shares | | | Amount | | | Shares | | | Amount | |
| | | | | | | | |
Class N: | | | | | | | | | | | | | | | | | | | | | | | | | | | | | | | | |
| | | | | | | | |
Shares sold | | | 102,414 | | | | $1,577,823 | | | | 79,691 | | | | $1,266,688 | | | | 131,305 | | | | $1,825,500 | | | | 185,281 | | | | $2,987,760 | |
| | | | | | | | |
Shares issued in reinvestment of distributions | | | — | | | | — | | | | 125,984 | | | | 1,906,132 | | | | 349,449 | | | | 4,029,141 | | | | 168,475 | | | | 2,382,240 | |
| | | | | | | | |
Shares redeemed | | | (434,221 | ) | | | (6,733,845 | ) | | | (495,033 | ) | | | (7,984,813 | ) | | | (478,305 | ) | | | (6,574,736 | ) | | | (822,318 | ) | | | (13,591,753 | ) |
| | | | | | | | | | | | | | | | | | | | | | | | | | | | | | | | |
| | | | | | | | |
Net increase (decrease) | | | (331,807 | ) | | | $(5,156,022 | ) | | | (289,358 | ) | | | $(4,811,993 | ) | | | 2,449 | | | | $(720,095 | ) | | | (468,562 | ) | | | $(8,221,753 | ) |
| | | | | | | | | | | | | | | | | | | | | | | | | | | | | | | | |
| | | | | | | | |
Class I: | | | | | | | | | | | | | | | | | | | | | | | | | | | | | | | | |
| | | | | | | | |
Shares sold | | | 3,440,965 | | | | $54,073,777 | | | | 5,005,682 | | | | $81,783,320 | | | | 31,228 | | | | $447,025 | | | | 101,204 | | | | $1,688,772 | |
| | | | | | | | |
Shares issued in reinvestment of distributions | | | 31,529 | | | | 535,995 | | | | 638,185 | | | | 9,687,652 | | | | 153,180 | | | | 1,799,865 | | | | 111,655 | | | | 1,601,140 | |
| | | | | | | | |
Shares redeemed | | | (2,874,163 | ) | | | (45,263,249 | ) | | | (4,388,574 | ) | | | (68,857,138 | ) | | | (760,841 | ) | | | (10,682,407 | ) | | | (3,204,309 | ) | | | (50,332,935 | ) |
| | | | | | | | | | | | | | | | | | | | | | | | | | | | | | | | |
| | | | | | | | |
Net increase (decrease) | | | 598,331 | | | | $9,346,523 | | | | 1,255,293 | | | | $22,613,834 | | | | (576,433 | ) | | | $(8,435,517 | ) | | | (2,991,450 | ) | | | $(47,043,023 | ) |
| | | | | | | | | | | | | | | | | | | | | | | | | | | | | | | | |
| | | | | | | | |
Class Z: | | | | | | | | | | | | | | | | | | | | | | | | | | | | | | | | |
| | | | | | | | |
Shares sold | | | 7,272,985 | | | | $116,360,111 | | | | 8,639,083 | | | | $147,447,070 | | | | 3,175 | | | | $47,299 | | | | 8,240 | | | | $131,446 | |
| | | | | | | | |
Shares issued in reinvestment of distributions | | | 47,547 | | | | 809,723 | | | | 666,057 | | | | 10,124,070 | | | | 20,831 | | | | 244,352 | | | | 13,576 | | | | 194,542 | |
| | | | | | | | |
Shares redeemed | | | (4,648,999 | ) | | | (74,032,454 | ) | | | (2,272,861 | ) | | | (37,145,444 | ) | | | (39,978 | ) | | | (550,065 | ) | | | (70,316 | ) | | | (1,093,892 | ) |
| | | | | | | | | | | | | | | | | | | | | | | | | | | | | | | | |
| | | | | | | | |
Net increase (decrease) | | | 2,671,533 | | | | $43,137,380 | | | | 7,032,279 | | | | $120,425,696 | | | | (15,972 | ) | | | $(258,414 | ) | | | (48,500 | ) | | | $(767,904 | ) |
| | | | | | | | | | | | | | | | | | | | | | | | | | | | | | | | |
47
| | |
| | | Notes to Financial Statements (continued) |
| | | |
| | | |
h. REPURCHASE AGREEMENTS AND JOINT REPURCHASE AGREEMENTS
The Funds may enter into third-party and bilateral repurchase agreements for temporary cash management purposes and for reinvestment of cash collateral on securities lending transactions under the securities lending program offered by The Bank of New York Mellon (“BNYM”) (the “Securities Lending Program”) (collectively, “Repurchase Agreements”). The value of the underlying collateral, including accrued interest, must equal or exceed the value of the Repurchase Agreements during the term of the agreement. For joint repurchase agreements, the Funds participate on a pro rata basis with other clients of BNYM in their share of the underlying collateral under such joint repurchase agreements and in their share of proceeds from any repurchase or other disposition of the underlying collateral. The underlying collateral for all Repurchase Agreements is held by the Funds’ custodian or at the Federal Reserve Bank. If the seller defaults and the value of the collateral declines, or if bankruptcy proceedings commence with respect to the seller of the security, realization of the collateral by the Funds may be delayed or limited. Pursuant to the Securities Lending Program, the Funds are indemnified for such losses by BNYM on joint repurchase agreements.
At December 31, 2023, the market value of Repurchase Agreements outstanding for Small Cap Core, Small Cap Value, Small/Mid Cap Core and Global Allocation was $7,509,963, $3,143,376, $9,706,385 and $0, respectively.
i. FOREIGN CURRENCY TRANSLATION
The books and records of the Funds are maintained in U.S. Dollars. The value of investments, assets and liabilities denominated in currencies other than U.S. Dollars are translated into U.S. Dollars based upon current foreign exchange rates. Purchases and sales of foreign investments, income and expenses are converted into U.S. Dollars based on currency exchange rates prevailing on the respective dates of such transactions. Net realized and unrealized gain (loss) on foreign currency transactions represent: (1) foreign exchange gains and losses from the sale and holdings of foreign currencies; (2) gains and losses between trade date and settlement date on investment securities transactions and foreign currency exchange contracts; and (3) gains and losses from the difference between amounts of interest and dividends recorded and the amounts actually received.
The Funds do not isolate the net realized and unrealized gain or loss resulting from changes in exchange rates from the fluctuations in market prices of securities held. Such fluctuations are included with the net realized and unrealized gain or loss on investments.
2. AGREEMENTS AND TRANSACTIONS WITH AFFILIATES
For each of the Funds, the Trusts have entered into investment advisory agreements under which the Investment Manager, a subsidiary and the U.S. wealth platform of Affiliated Managers Group, Inc. (“AMG”), serves as investment manager to the Funds and is responsible for the Funds’ overall administration and operations. The Investment Manager selects and recommends, subject to the approval of the Board and, in certain circumstances, shareholders, the subadviser for the Funds and monitors the subadviser’s investment performance, security holdings and investment strategies. Each Fund’s investment portfolio is managed by GW&K Investment Management, LLC (“GW&K”), who serves as subadviser pursuant to a subadvisory agreement with the Investment Manager. AMG indirectly owns a majority interest in GW&K.
Investment management fees are paid directly by the Funds to the Investment Manager based on average daily net assets. For the fiscal year ended December 31, 2023, the Funds’ investment management fees were paid at the following annual rates of each Fund’s respective average daily net assets:
| | |
| |
Small Cap Core | | 0.70% |
| |
Small Cap Value | | 0.70% |
| |
Small/Mid Cap Core | | 0.62% |
| |
Global Allocation | | 0.60%1 |
| 1 | Effective December 18, 2023, the investment management fee was waived. |
The fee paid to GW&K for its services as subadviser is paid out of the fee the Investment Manager receives from each Fund and does not increase the expenses of each Fund.
The Investment Manager has contractually agreed, through at least May 1, 2024, to waive management fees and/or pay or reimburse fund expenses in order to limit total annual Fund operating expenses after fee waiver and expense reimbursements (exclusive of taxes, interest (including interest incurred in connection with bank and custody overdrafts, and in connection with securities sold short), shareholder servicing fees, distribution and service (12b-1) fees, brokerage commissions and other transaction costs, dividends payable with respect to securities sold short, acquired fund fees and expenses and extraordinary expenses) of Small Cap Core, Small Cap Value, Small/Mid Cap Core and Global Allocation to the annual rate of 0.90%, 0.90%, 0.82% and 0.81%, respectively, of each Fund’s average daily net assets (this annual rate or such other annual rate that may be in effect from time to time, the “Expense Cap”), subject to later reimbursement by the Funds in certain circumstances.
In general, for a period of up to 36 months after the date any amounts are paid, waived or reimbursed by the Investment Manager, the Investment Manager may recover such amounts from a Fund, provided that such repayment would not cause the Fund’s total annual operating expenses after fee waiver and expense reimbursements (exclusive of the items noted in the parenthetical above) to exceed either (i) the Expense Cap in effect at the time such amounts were paid, waived or reimbursed, or (ii) the Expense Cap in effect at the time of such repayment by the Fund.
The contractual expense limitation may only be terminated in the event the Investment Manager or a successor ceases to be the investment manager of a Fund or a successor fund, by mutual agreement between the Investment Manager and the Board, or in the event of a Fund’s liquidation unless the Fund is reorganized or is a party to a merger in which the surviving entity is successor to the accounting and performance information of a Fund.
For the fiscal year ended December 31, 2023, the Investment Manager’s expense reimbursements, and repayments of prior reimbursements by the Funds to the Investment Manager, if any, are as follows:
48
| | |
| | | Notes to Financial Statements (continued) |
| | | |
| | | |
| | | | | | | | | | |
| | | Expense
Reimbursements | | Repayment of
Prior
Reimbursements |
| | |
Small Cap Core | | | | $44,646 | | | | | $9,858 | |
| | |
Small Cap Value | | | | 94,496 | | | | | — | |
| | |
Small/Mid Cap Core | | | | 62,502 | | | | | 2,140 | |
| | |
Global Allocation | | | | 178,130 | | | | | — | |
At December 31, 2023, the Funds’ expiration of reimbursements subject to recoupment is as follows:
| | | | | | | | | | | | | | | |
Expiration Period | | Small Cap Core | | Small Cap Value | | Small/Mid Cap Core |
| | | |
Less than 1 year | | | | — | | | | | $52,722 | | | | | $42,690 | |
| | | |
1-2 years | | | | $4,130 | | | | | 93,363 | | | | | 39,766 | |
| | | |
2-3 years | | | | 44,646 | | | | | 94,496 | | | | | 62,502 | |
| | | | | | | | | | | | | | | |
| | | |
Total | | | | $48,776 | | | | | $240,581 | | | | | $144,958 | |
| | | | | | | | | | | | | | | |
Effective December 18, 2023, for Global Allocation the Investment Manager waived its management fee and right to recoup any prior reimbursed expenses under each Fund’s Expense Limitation Agreement. For the fiscal year ended December 31, 2023, the investment management fees for Global Allocation were reduced by $6,447, or 0.02% of average daily net assets.
The Trusts, on behalf of the Funds, have entered into an amended and restated Administration Agreement under which the Investment Manager serves as the Funds’ administrator (the “Administrator”) and is responsible for certain aspects of managing the Funds’ operations, including administration and shareholder services to each Fund. Each Fund pays a fee to the Administrator at the rate of 0.15% per annum of the Fund’s average daily net assets for this service.
The Funds are distributed by AMG Distributors, Inc. (the “Distributor”), a wholly-owned subsidiary of the Investment Manager. The Distributor serves as the distributor and underwriter for each Fund and is a registered broker-dealer and member of the Financial Industry Regulatory Authority, Inc. (“FINRA”). Shares of each Fund will be continuously offered and will be sold directly to prospective purchasers and through brokers, dealers or other financial intermediaries who have executed selling agreements with the Distributor. Generally, the Distributor bears all or a portion of the expenses of providing services pursuant to the distribution agreement, including the payment of the expenses relating to the distribution of prospectuses for sales purposes and any advertising or sales literature.
The Trusts have adopted a distribution and service plan (the “Plan”) with respect to the Class N shares of each Fund, except Small Cap Value, in accordance with the requirements of Rule 12b-1 under the 1940 Act and the requirements of the applicable rules of FINRA regarding asset-based sales charges. Pursuant to the Plan, each Fund, except Small Cap Value, may make payments to the Distributor for its expenditures in financing any activity primarily intended to result in the sale of each Fund’s Class N shares and for maintenance and personal service provided to existing shareholders of that class. The Plan authorizes payments to the Distributor up to 0.25% annually of each Fund’s, except Small Cap Value’s, average daily net assets attributable to the Class N shares. The portion of payments made under the plan by Class N shares of each Fund, except Small Cap Value, for shareholder servicing may not exceed an annual rate of 0.25% of the average daily net asset
value of each Fund’s shares of that class owned by clients of such broker, dealer or financial intermediary.
For each of Class N and Class I shares of Small Cap Core and Small Cap Value, and for Small/Mid Cap Core and Global Allocation’s Class I shares, the Board has approved reimbursement payments to the Investment Manager for shareholder servicing expenses (“shareholder servicing fees”) incurred. Shareholder servicing fees include payments to financial intermediaries, such as broker-dealers (including fund supermarket platforms), banks, and trust companies who provide shareholder recordkeeping, account servicing and other services. The Class N and Class I shares may reimburse the Investment Manager for the actual amount incurred up to a maximum annual rate of each Class’s average daily net assets as shown in the table below.
The impact on the annualized expense ratios for the fiscal year ended December 31, 2023, was as follows:
| | | | | | | | | | | | |
| | | Maximum Annual | | | Actual | | | | |
| | | Amount | | | Amount | | | | |
| Fund | | Approved | | | Incurred | | | | |
| | | |
Small Cap Core | | | | | | | | | | | | |
| | | |
Class N | | | 0.15 | % | | | 0.15 | % | | | | |
| | | |
Class I | | | 0.05 | % | | | 0.05 | % | | | | |
| | | |
Small Cap Value | | | | | | | | | | | | |
| | | |
Class N | | | 0.25 | % | | | 0.25 | % | | | | |
| | | |
Class I | | | 0.05 | % | | | 0.05 | % | | | | |
| | | |
Small/Mid Cap Core | | | | | | | | | | | | |
| | | |
Class I | | | 0.05 | % | | | 0.05 | % | | | | |
| | | |
Global Allocation | | | | | | | | | | | | |
| | | |
Class I | | | 0.10 | % | | | 0.08 | % | | | | |
The Board provides supervision of the affairs of the Trusts and other trusts within the AMG Funds Family. The Trustees of the Trusts who are not affiliated with the Investment Manager receive an annual retainer and per meeting fees for regular, special and telephonic meetings, and they are reimbursed for out-of-pocket expenses incurred while carrying out their duties as Board members. The Chairman of the Board and the Audit Committee Chair receive additional annual retainers. On October 10, 2023, the shareholders of each Trust elected Trustees, including two new Trustees who are not “interested persons” of the Funds within the meaning of the 1940 Act. Certain Trustees and Officers of the Funds are Officers and/or Directors of the Investment Manager, AMG and/or the Distributor.
The Securities and Exchange Commission (the “SEC”) granted an exemptive order that permits certain eligible funds in the AMG Funds Family to lend and borrow money for certain temporary purposes directly to and from other eligible funds in the AMG Funds Family. Participation in this interfund lending program is voluntary for both the borrowing and lending funds, and an interfund loan is only made if it benefits each participating fund. The Administrator manages the program according to procedures approved by the Board, and the Board monitors the operation of the program. An interfund loan must comply with certain conditions set out in the exemptive order, which are designed to assure fairness and protect all participating funds. The interest earned and interest paid on interfund loans are included on the Statement of Operations as interest income and interest expense, respectively. At December 31, 2023, the Funds had no interfund loans outstanding.
49
| | |
| | | Notes to Financial Statements (continued) |
| | | |
| | | |
The following Funds utilized the interfund loan program during the fiscal year ended December 31, 2023 as follows:
| | | | | | | | | | | | | | | | | | | | |
| Fund | | Average
Lent | | | Number
of Days | | | Interest
Earned | | | Average
Interest Rate | | | | |
| | | | | |
Small Cap Core | | $ | 6,812,514 | | | | 6 | | | $ | 6,389 | | | | 5.705 | % | | | | |
| | | | | |
Small/Mid Cap Core | | | 1,814,515 | | | | 1 | | | | 271 | | | | 5.450 | % | | | | |
| | | | | |
Global Allocation | | | 1,372,065 | | | | 3 | | | | 586 | | | | 5.200 | % | | | | |
| | | | | |
| Fund | | Average
Borrowed | | | Number
of Days | | | Interest
Paid | | | Average
Interest Rate | | | | |
| | | | | |
Small Cap Core | | $ | 5,806,086 | | | | 6 | | | $ | 5,929 | | | | 6.212 | % | | | | |
Small Cap Value did not have any interfund lending activity for the fiscal year ended December 31, 2023.
3. PURCHASES AND SALES OF SECURITIES
Purchases and sales of securities (excluding short-term securities and U.S. Government Obligations) for the fiscal year ended December 31, 2023, were as follows:
| | | | | | | | |
| | | Long Term Securities | |
| | |
| Fund | | Purchases | | | Sales | |
| | |
Small Cap Core | | | $132,668,535 | | | | $194,185,898 | |
| | |
Small Cap Value | | | 35,598,022 | | | | 66,173,311 | |
| | |
Small/Mid Cap Core | | | 178,822,371 | | | | 123,919,851 | |
| | |
Global Allocation | | | 5,711,397 | | | | 42,058,168 | |
Global Allocation purchases and sales of U.S. Government Obligations for the fiscal year ended December 31, 2023 were $1,005,553 and $6,285,160, respectively.
4. PORTFOLIO SECURITIES LOANED
The Funds participate in the Securities Lending Program providing for the lending of securities to qualified borrowers. Securities lending income includes earnings of such temporary cash investments, plus or minus any rebate to a borrower. These earnings (after any rebate) are then divided between BNYM, as a fee for its services under the Securities Lending Program, and the Funds, according to agreed-upon rates. Collateral on all securities loaned is accepted in cash, U.S. Treasury Obligations or U.S. Government Agency Obligations. Collateral is maintained at a minimum level of 102% (105% in the case of certain foreign securities) of the market value, plus interest, if applicable, of investments on loan. It is the Funds’ policy to obtain additional collateral from or return excess collateral to the borrower by the end of the next business day, following the valuation date of the securities loaned. Therefore, the value of the collateral held may be temporarily less than the value of the securities on loan. Lending securities entails a risk of loss to the Funds if and to the extent that the market value of the securities loaned were to increase and the borrower did not increase the collateral accordingly, and the borrower fails to return the securities. Under the terms of the Securities Lending Program, the Funds are indemnified for such losses by BNYM. Cash collateral is held in separate omnibus accounts managed by BNYM, who is authorized to exclusively enter into joint repurchase agreements for that cash collateral. Securities collateral is held in separate omnibus accounts managed by
BNYM and cannot be sold or pledged. BNYM bears the risk of any deficiency in the amount of the cash collateral available for return to the borrower due to any loss on the collateral invested. Loans of securities are terminable by a Fund at any time and the borrower, after notice, is required to return borrowed securities as soon as practical, which is normally within three business days.
The value of securities loaned on positions held, cash collateral and securities collateral received at December 31, 2023, was as follows:
| | | | | | | | | | | | | | | | |
| Fund | | Securities
Loaned | | | Cash
Collateral
Received | | | Securities
Collateral
Received | | | Total
Collateral
Received | |
| | | | |
Small Cap Core | | | $10,123,784 | | | | $1,794,963 | | | | $8,822,681 | | | | $10,617,644 | |
| | | | |
Small Cap Value | | | 17,250,209 | | | | 1,078,376 | | | | 16,764,826 | | | | 17,843,202 | |
| | | | |
Small/Mid Cap Core | | | 18,547,638 | | | | 38,385 | | | | 19,226,148 | | | | 19,264,533 | |
The following table summarizes the securities received as collateral for securities lending at December 31, 2023:
| | | | | | |
| Fund | | Collateral
Type | | Coupon
Range | | Maturity
Date Range |
| | | |
Small Cap Core | | U.S. Treasury Obligations | | 0.125%-5.368% | | 04/15/24-08/15/53 |
| | | |
Small Cap Value | | U.S. Treasury Obligations | | 0.125%-4.750% | | 04/15/24-05/15/51 |
| | | |
Small/Mid Cap Core | | U.S. Treasury Obligations | | 0.125%-4.750% | | 04/15/24-05/15/51 |
5. FOREIGN SECURITIES
Global Allocation invested in securities of foreign entities and in instruments denominated in foreign currencies which involve risks not typically associated with investments in domestic securities, such as exposure to currency fluctuations, less developed or less efficient trading markets, political instability, a lack of company information, differing auditing and legal standards, and, potentially, less liquidity. A Fund’s investments in emerging market countries are exposed to additional risks. A Fund’s performance will be influenced by political, social and economic factors affecting companies in emerging market countries. Emerging market countries generally have economic structures that are less diverse and mature, and political systems that are less stable, than those of developed countries. Realized gains in certain countries may be subject to foreign taxes at the Fund level and the Fund would pay such foreign taxes at the appropriate rate for each jurisdiction.
6. COMMITMENTS AND CONTINGENCIES
Under the Trusts’ organizational documents, their Trustees and Officers are indemnified against certain liabilities arising out of the performance of their duties to the Trusts. In addition, in the normal course of business, the Funds may enter into contracts and agreements that contain a variety of representations and warranties, which provide general indemnifications. The maximum exposure to the Funds under these arrangements is unknown, as this would involve future claims that may be made against a Fund that have not yet occurred. However, based on experience, the Funds had no prior claims or losses and expect the risks of loss to be remote.
50
| | |
| | | Notes to Financial Statements (continued) |
| | | |
| | | |
7. CREDIT AGREEMENT
Effective April 12, 2023, the Trust II, on behalf of Global Allocation, and another fund in the Trust, became party to a Credit Agreement among BNYM, AMG Funds III, and AMG Funds IV (together with Trust and AMG Funds III, the “Participating Trusts”) (the “Credit Agreement”) that provided a revolving line of credit of up to $50 million to certain funds in the Participating Trusts (such funds, the “Participating Funds”). On December 31, 2023, the Credit Agreement was terminated. The facility was shared by the Participating Funds, and was available for temporary, emergency purposes including liquidity needs in meeting redemptions. The interest rate on outstanding Alternate Base Rate Loans was equal to the greater of the Prime Rate plus 1.25%, or 0.50% plus the Federal Funds
Effective Rate plus 1.25%. The interest rate on outstanding Overnight Loans was equal to the greater of the Federal Funds Effective Rate plus 1.25%, or the Adjusted Daily Simple SOFR plus 1.25%. The aforementioned Adjusted Daily Simple SOFR was the sum of Daily Simple SOFR plus 0.10% plus a floor rate of 0.00%. The Participating Funds paid a commitment fee on the unutilized commitment amount of 0.175% per annum, which was allocated to the Participating Funds based on average daily net assets and is included in miscellaneous expense on the Participating Funds’ Statement of Operations. Interest incurred on loans utilized, if any, is included in the Statement of Operations as interest expense.
Global Allocation did not utilize the line of credit during the period April 12, 2023, through December 31, 2023.
8. MASTER NETTING AGREEMENTS
The Funds may enter into master netting agreements with their counterparties for the Securities Lending Program and Repurchase Agreements, which provide the right, in the event of default (including bankruptcy or insolvency) for the non-defaulting party to liquidate the collateral and calculate net exposure to the defaulting party or request additional collateral. For financial reporting purposes, the Funds do not offset financial assets and financial liabilities that are subject to master netting agreements in the Statement of Assets and Liabilities. For securities lending transactions, see Note 4.
The following table is a summary of the Funds’ open Repurchase Agreements that are subject to a master netting agreement as of December 31, 2023:
| | | | | | | | | | | | | | | | | | | | |
| | | | | Gross Amount Not Offset in the
Statement of Assets and Liabilities | | | | |
| Fund | | Gross Amounts of
Assets Presented in
the Statement of
Assets and Liabilities | | Offset
Amount | | Net Asset
Balance | | Collateral Received | | Net Amount |
| | | | | |
Small Cap Core | | | | | | | | | | | | | | | | | | | | |
| | | | | |
Daiwa Capital Markets America | | | $794,963 | | | | — | | | | $794,963 | | | | $794,963 | | | | — | |
| | | | | |
RBC Dominion Securities, Inc. | | | 1,000,000 | | | | — | | | | 1,000,000 | | | | 1,000,000 | | | | — | |
| | | | | |
Fixed Income Clearing Corp. | | | 2,327,000 | | | | — | | | | 2,327,000 | | | | 2,327,000 | | | | — | |
| | | | | |
Fixed Income Clearing Corp. | | | 3,388,000 | | | | — | | | | 3,388,000 | | | | 3,388,000 | | | | — | |
| | | | | | | | | | | | | | | | | | | | |
| | | | | |
Total | | | $7,509,963 | | | | — | | | | $7,509,963 | | | | $7,509,963 | | | | — | |
| | | | | | | | | | | | | | | | | | | | |
| | | | | |
Small Cap Value | | | | | | | | | | | | | | | | | | | | |
| | | | | |
Daiwa Capital Markets America | | | $78,376 | | | | — | | | | $78,376 | | | | $78,376 | | | | — | |
| | | | | |
RBC Dominion Securities, Inc. | | | 1,000,000 | | | | — | | | | 1,000,000 | | | | 1,000,000 | | | | — | |
| | | | | |
Fixed Income Clearing Corp. | | | 2,065,000 | | | | — | | | | 2,065,000 | | | | 2,065,000 | | | | — | |
| | | | | | | | | | | | | | | | | | | | |
| | | | | |
Total | | | $3,143,376 | | | | — | | | | $3,143,376 | | | | $3,143,376 | | | | — | |
| | | | | | | | | | | | | | | | | | | | |
| | | | |
Small/Mid Cap Core | | | | | | | | | | | | | | | | | |
| | | | | |
RBC Dominion Securities, Inc. | | | $38,385 | | | | — | | | | $38,385 | | | | $38,385 | | | | — | |
| | | | | |
Fixed Income Clearing Corp. | | | 1,203,000 | | | | — | | | | 1,203,000 | | | | 1,203,000 | | | | — | |
| | | | | |
Fixed Income Clearing Corp. | | | 8,465,000 | | | | — | | | | 8,465,000 | | | | 8,465,000 | | | | — | |
| | | | | | | | | | | | | | | | | | | | |
| | | | | |
Total | | | $9,706,385 | | | | — | | | | $9,706,385 | | | | $9,706,385 | | | | — | |
| | | | | | | | | | | | | | | | | | | | |
9. SUBSEQUENT EVENTS
The Funds have determined that no material events or transactions occurred through the issuance date of the Funds’ financial statements which require an
additional disclosure in or adjustment of the Funds’ financial statements except, Global Allocation liquidated on February 9, 2024.
51
|
Report of Independent Registered Public Accounting Firm |
To the Boards of Trustees of AMG Funds and AMG Funds II and Shareholders of AMG GW&K Small Cap Core Fund, AMG GW&K Small Cap Value Fund, AMG GW&K Small/Mid Cap Core Fund and AMG GW&K Global Allocation Fund
Opinions on the Financial Statements
We have audited the accompanying statements of assets and liabilities, including the schedules of portfolio investments, of AMG GW&K Small Cap Core Fund, AMG GW&K Small Cap Value Fund, AMG GW&K Small/Mid Cap Core Fund (three of the funds constituting AMG Funds) and AMG GW&K Global Allocation Fund (one of the funds constituting AMG Funds II) (hereafter collectively referred to as the “Funds”) as of December 31, 2023, the related statements of operations for the year ended December 31, 2023, the statements of changes in net assets for each of the two years in the period ended December 31, 2023, including the related notes, and the financial highlights for each of the five years in the period ended December 31, 2023 (collectively referred to as the “financial statements”). In our opinion, the financial statements present fairly, in all material respects, the financial position of each of the Funds as of December 31, 2023, the results of each of their operations for the year then ended, the changes in each of their net assets for each of the two years in the period ended December 31, 2023 and each of the financial highlights for each of the five years in the period ended December 31, 2023 in conformity with accounting principles generally accepted in the United States of America.
Basis for Opinions
These financial statements are the responsibility of the Funds’ management. Our responsibility is to express an opinion on the Funds’ financial statements based on our audits. We are a public accounting firm registered with the Public Company Accounting Oversight Board (United States) (PCAOB) and are required to be independent with respect to the Funds in accordance with the U.S. federal securities laws and the applicable rules and regulations of the Securities and Exchange Commission and the PCAOB.
We conducted our audits of these financial statements in accordance with the standards of the PCAOB. Those standards require that we plan and perform the audit to obtain reasonable assurance about whether the financial statements are free of material misstatement, whether due to error or fraud.
Our audits included performing procedures to assess the risks of material misstatement of the financial statements, whether due to error or fraud, and performing procedures that respond to those risks. Such procedures included examining, on a test basis, evidence regarding the amounts and disclosures in the financial statements. Our audits also included evaluating the accounting principles used and significant estimates made by management, as well as evaluating the overall presentation of the financial statements. Our procedures included confirmation of securities owned as of December 31, 2023 by correspondence with the custodian and broker; when replies were not received from brokers, we performed other auditing procedures. We believe that our audits provide a reasonable basis for our opinions.
/s/ PricewaterhouseCoopers LLP
Boston, Massachusetts
February 27, 2024
We have served as the auditor of one or more investment companies in the AMG Funds Family since 1993.
52
| | |
| | | Other Information (unaudited) |
| | | |
| | | |
TAX INFORMATION
AMG GW&K Small Cap Core Fund, AMG GW&K Small Cap Value Fund, AMG GW&K Small/Mid Cap Core Fund and AMG GW&K Global Allocation Fund each hereby designate the maximum amount allowable of its net taxable income as qualified dividends as provided in the Jobs and Growth Tax Relief Reconciliation Act of 2003. The 2023 Form 1099-DIV you receive for each Fund will show the tax status of all distributions paid to you during the year.
Pursuant to section 852 of the Internal Revenue Code, AMG GW&K Small Cap Core Fund, AMG GW&K Small Cap Value Fund, AMG GW&K Small/Mid Cap Core Fund and AMG GW&K Global Allocation Fund each hereby designates $4,011,620, $2,195,731, $0 and $5,796,486, respectively, as a capital gain distribution with respect to the taxable year ended December 31, 2023, or if subsequently determined to be different, the net capital gains of such fiscal year.
PROXY VOTE
A special meeting of the shareholders of AMG Funds and AMG Funds II (collectively the “Trusts”) was held on October 10, 2023, to vote on proposals to elect trustees to the Boards of Trustees of the Trusts and to amend certain fundamental restrictions of AMG GW&K Global Allocation Fund. With respect to the proposal to amend certain fundamental restrictions of AMG GW&K Global Allocation Fund, the meeting was adjourned to October 31, 2023, November 21, 2023 and December 11, 2023. Jill R. Cuniff, Kurt A. Keilhacker, Peter W. MacEwen, Steven J. Paggioli, Eric Rakowski, Victoria L. Sassine and Garret W. Weston were elected by shareholders at the special meeting on October 10, 2023. Bruce B. Bingham, an incumbent Trustee, served as a Trustee of the Trusts until his retirement on December 31, 2023. The proposals and results of the votes are described below.
| | | | | | | | |
| AMG Funds | | All Funds in Trust* | |
| Election of Trustees1 | | For | | | Withheld | |
| | |
Jill R. Cuniff | | | 523,453,201 | | | | 50,330,270 | |
| | |
Kurt A. Keilhacker | | | 563,642,997 | | | | 10,140,474 | |
| | |
Peter W. MacEwen | | | 523,551,974 | | | | 50,231,497 | |
| | |
Steven J. Paggioli | | | 561,225,673 | | | | 12,557,798 | |
| | |
Eric Rakowski | | | 561,230,560 | | | | 12,552,911 | |
| | |
Victoria L. Sassine | | | 563,668,874 | | | | 10,114,597 | |
| | |
Garret W. Weston | | | 564,280,150 | | | | 9,503,321 | |
| |
| AMG Funds II | | All Funds in Trust* | |
| Election of Trustees1 | | For | | | Withheld | |
| | |
Jill R. Cuniff | | | 4,796,336 | | | | 35,586 | |
| | |
Kurt A. Keilhacker | | | 4,798,616 | | | | 33,306 | |
| | |
Peter W. MacEwen | | | 4,797,782 | | | | 34,140 | |
| | |
Steven J. Paggioli | | | 4,797,674 | | | | 34,248 | |
| | |
Eric Rakowski | | | 4,803,644 | | | | 28,278 | |
| | |
Victoria L. Sassine | | | 4,801,440 | | | | 30,482 | |
| | |
Garret W. Weston | | | 4,798,028 | | | | 33,894 | |
53
| | | | | | | | | | | | | | | | |
| | | AMG GW&K Global Allocation Fund* | |
| To approve the amendment of the Fund’s fundamental investment restrictions | | For | | | Against | | | Abstain | | | Broker
Non-Vote | |
| | | | |
Borrowing | | | 828,792 | | | | 38,339 | | | | 54,533 | | | | 619,284 | |
| | | | |
Issuing Senior Securities | | | 830,187 | | | | 35,803 | | | | 55,674 | | | | 619,284 | |
| 1 | Ms. Cuniff and Mr. MacEwen were newly elected to the Boards of Trustees on October 10, 2023; Messrs. Keilhacker, Paggioli, Rakowski, and Weston and Ms. Sassine are incumbent Trustees. |
| *Rounded | to the nearest share. |
54
| | |
| | | AMG Funds Trustees and Officers |
| | | |
| | | |
| | | | |
The Trustees and Officers of the Trusts, their business addresses, principal occupations for the past five years and ages are listed below. The Trustees provide broad supervision over the affairs of the Trusts and the Funds. The Trustees are experienced executives who meet periodically throughout the year to oversee the Funds’ activities, review contractual arrangements with companies that provide services to the Funds, and | | review the Funds’ performance. Unless otherwise noted, the address of each Trustee or Officer is the address of the Trusts: 680 Washington Blvd., Suite 500, Stamford, CT. 06901. There is no stated term of office for Trustees. Trustees serve until their resignation, retirement or removal in accordance with the Trusts’ organizational documents and policies adopted by the Board from time to time. | | The Chairman of the Board, the President, the Treasurer and the Secretary and such other Officers as the Trustees may in their discretion from time to time elect each hold office until his or her successor is elected and qualified, or until he or she sooner dies, resigns, is removed or becomes disqualified. Each Officer holds office at the pleasure of the Trustees. |
Independent Trustees
The following Trustees are not “interested persons” of the Trust within the meaning of the 1940 Act:
| | |
Number of Funds Overseen in Fund Complex | | Name, Age, Principal Occupation(s) During Past 5 Years and Other Directorships Held by
Trustee |
| | |
• Trustee since 2012 - AMG Funds • Trustee since 2012 - AMG Funds II • Oversees 37 Funds in Fund Complex | | Bruce B. Bingham, 75* Partner, Hamilton Partners (real estate development firm) (1987-Present); Director of The Yacktman Funds, Inc. (2 portfolios) (2000-2012). |
| | |
• Trustee since 2023 - AMG Funds • Trustee since 2023 - AMG Funds II • Oversees 37 Funds in Fund Complex | | Jill R. Cuniff, 59** Director of Harding, Loevner Funds, Inc. (12 portfolios) (2018-Present); Retired (2016-Present); President & Portfolio Manager, Edge Asset Management (2009-2016); President & Chief Investment Officer, Morley Financial Services (2001-2009); President, Union Bond & Trust Company (2001-2009). |
| | |
• Chairman of the Audit Committee since 2021 • Trustee since 2013 - AMG Funds • Trustee since 2013 - AMG Funds II • Oversees 39 Funds in Fund Complex | | Kurt A. Keilhacker, 60 Managing Partner, Elementum Ventures (2013-Present); Managing Partner, TechFund Europe (2000-Present); Managing Partner, TechFund Capital (1997-Present); Adjunct Professor, University of San Francisco (2022-Present); Trustee, Wheaton College (2018-Present); Director, Wheaton College Trust Company, N.A. (2018-Present). |
| | |
• Trustee since 2023 - AMG Funds • Trustee since 2023 - AMG Funds II • Oversees 37 Funds in Fund Complex | | Peter W. MacEwen, 59** Private investor (2019-Present); Affiliated Managers Group, Inc. (2003-2018): Chief Administrative Officer, Office of the CEO (2013-2018); Senior Vice President, Finance (2007-2013); Vice President, Finance (2003-2007). |
| | |
• Trustee since 2004 - AMG Funds • Trustee since 2000 - AMG Funds II • Oversees 37 Funds in Fund Complex | | Steven J. Paggioli, 73 Independent Consultant (2002-Present); Trustee, Professionally Managed Portfolios (28 portfolios); Independent Director, Muzinich BDC, Inc. (business development company) (2019-Present); Director, The Wadsworth Group; Independent Director, Chase Investment Counsel (2008–2019); Executive Vice President, Secretary and Director, Investment Company Administration, LLC and First Fund Distributors, INC. (1990-2001). |
| | |
• Independent Chairman of the Board of Trustees since 2017 • Chairman of the Governance Committee since 2017 • Trustee since 1999 - AMG Funds • Trustee since 2000 - AMG Funds II • Oversees 39 Funds in Fund Complex | | Eric Rakowski, 65 Professor of Law, University of California at Berkeley School of Law (1990-Present); Tax Attorney at Davis Polk & Wardwell and clerked for Judge Harry T. Edwards of the U.S. Court of Appeals for the District of Columbia Circuit and for Justice William J. Brennan Jr. of the U.S. Supreme Court; Trustee of Parnassus Funds (4 portfolios) (2021-Present); Trustee of Parnassus Income Funds (2 portfolios) (2021-Present); Director of Harding, Loevner Funds, Inc. (10 portfolios); Trustee of Third Avenue Trust (3 portfolios) (2002-2019); Trustee of Third Avenue Variable Trust (1 portfolio) (2002-2019). |
55
| | |
| | | AMG Funds Trustees and Officers (continued) |
| | | |
| | | |
| | |
| | |
• Trustee since 2013 - AMG Funds • Trustee since 2013 - AMG Funds II • Oversees 39 Funds in Fund Complex | | Victoria L. Sassine, 58 Adjunct Professor, Babson College (2007–Present); Director, Board of Directors, PRG Group (2017-Present); CEO, Founder, Scale Smarter Partners, LLC (2018-Present); Adviser, EVOFEM Biosciences (2019-Present); Chairperson of the Board of Directors of Business Management Associates (2018-2019). |
| *Mr. | Bingham retired from the Boards of Trustees of the Trusts on December 31, 2023. |
| **Ms. | Cuniff and Mr. MacEwen were elected to the Boards of Trustees by the shareholders of the Trusts on October 10, 2023. |
Interested Trustee
The Trustee in the following table is an “interested person” of the Trust within the meaning of the 1940 Act.
| | |
| | |
Number of Funds Overseen in Fund Complex | | Name, Age, Principal Occupation(s) During Past 5 Years and Other Directorships Held by Trustee |
| | |
• Trustee since 2021 - AMG Funds • Trustee since 2021 - AMG Funds II • Oversees 39 Funds in Fund Complex | | Garret W. Weston, 42 Affiliated Managers Group, Inc. (2008-Present): Managing Director, Head of Affiliate Product Strategy and Development (2023-Present), Managing Director, Co-Head of Affiliate Engagement, Distribution (2021-2022), Senior Vice President, Office of the CEO (2019-2021), Senior Vice President, Affiliate Development (2016-2019), Vice President, Office of the CEO (2015-2016), Vice President, New Investments (2008-2015); Associate, Madison Dearborn Partners (2006-2008); Analyst, Merrill Lynch (2004-2006). |
Officers
| | |
| | |
Position(s) Held with Fund and Length of Time Served | | Name, Age, Principal Occupation(s) During Past 5 Years |
| | |
• President since 2018 • Principal Executive Officer since 2018 • Chief Executive Officer since 2018 • Chief Operating Officer since 2007 | | Keitha L. Kinne, 65 Managing Director, Head of Platform and Operations, AMG Funds LLC (2023-Present); Chief Operating Officer, AMG Funds LLC (2007-Present); Chief Investment Officer, AMG Funds LLC (2008-Present); President and Principal, AMG Distributors, Inc. (2018-Present); Chief Operating Officer, AMG Distributors, Inc. (2007-Present); President, Chief Executive Officer and Principal Executive Officer, AMG Funds, AMG Funds I, AMG Funds II, AMG Funds III and AMG Funds IV (2018-Present); Chief Operating Officer, AMG Funds, AMG Funds I, AMG Funds II, and AMG Funds III (2007-Present); Chief Operating Officer, AMG Funds IV (2016-Present); Chief Operating Officer and Chief Investment Officer, Aston Asset Management, LLC (2016); President and Principal Executive Officer, AMG Funds, AMG Funds I, AMG Funds II and AMG Funds III (2012-2014); Managing Partner, AMG Funds LLC (2007-2014); President and Principal, AMG Distributors, Inc. (2012-2014); Managing Director, Legg Mason & Co., LLC (2006-2007); Managing Director, Citigroup Asset Management (2004-2006). |
| | |
• Secretary since 2015 • Chief Legal Officer since 2015 | | Mark J. Duggan, 58 Managing Director and Senior Counsel, AMG Funds LLC (2021-Present); Senior Vice President and Senior Counsel, AMG Funds LLC (2015-2021); Secretary and Chief Legal Officer, AMG Funds, AMG Funds I, AMG Funds II, AMG Funds III and AMG Funds IV (2015-Present); Attorney, K&L Gates, LLP (2009-2015). |
| | |
• Chief Financial Officer since 2017 • Treasurer since 2017 • Principal Financial Officer since 2017 • Principal Accounting Officer since 2017 | | Thomas G. Disbrow, 57 Vice President, Mutual Fund Treasurer & CFO, AMG Funds, AMG Funds LLC (2017-Present); Chief Financial Officer, Principal Financial Officer, Treasurer and Principal Accounting Officer, AMG Funds, AMG Funds I, AMG Funds II, AMG Funds III and AMG Funds IV (2017-Present); Managing Director - Global Head of Traditional Funds Product Control, UBS Asset Management (Americas), Inc. (2015-2017); Managing Director - Head of North American Funds Treasury, UBS Asset Management (Americas), Inc. (2011-2015). |
| | |
• Deputy Treasurer since 2017 | | John A. Starace, 53 Vice President, Mutual Fund Accounting, AMG Funds LLC (2021-Present); Director, Mutual Fund Accounting, AMG Funds LLC (2017-2021); Vice President, Deputy Treasurer of Mutual Funds Services, AMG Funds LLC (2014-2017); Deputy Treasurer, AMG Funds, AMG Funds I, AMG Funds II, AMG Funds III and AMG Funds IV (2017-Present); Vice President, Citi Hedge Fund Services (2010-2014); Audit Senior Manager (2005-2010) and Audit Manager (2001-2005), Deloitte & Touche LLP. |
| | |
• Chief Compliance Officer and Sarbanes-Oxley Code of Ethics Compliance Officer since 2019 • Anti-Money Laundering Compliance Officer since 2022 | | Patrick J. Spellman, 49 Vice President, Chief Compliance Officer, AMG Funds LLC (2017-Present); Chief Compliance Officer, AMG Distributors, Inc. (2010-Present); Chief Compliance Officer and Sarbanes-Oxley Code of Ethics Compliance Officer, AMG Funds, AMG Funds I, AMG Funds II, AMG Funds III and AMG Funds IV (2019-Present); Anti-Money Laundering Compliance Officer, AMG Funds, AMG Funds I, AMG Funds II, and AMG Funds III (2014-2019; 2022-Present); Anti-Money Laundering Compliance Officer, AMG Funds IV (2016-2019; 2022-Present); Senior Vice President, Chief Compliance Officer, AMG Funds LLC (2011-2017); Compliance Manager, Legal and Compliance, Affiliated Managers Group, Inc. (2005-2011). |
56
| | |
| | | AMG Funds Trustees and Officers (continued) |
| | | |
| | | |
| | |
| | |
Position(s) Held with Fund and Length of Time Served | | Name, Age, Principal Occupation(s) During Past 5 Years |
| | |
• Assistant Secretary since 2016 | | Maureen M. Kerrigan, 38 Vice President, Senior Counsel, AMG Funds LLC (2021-Present); Vice President, Counsel, AMG Funds LLC (2019-2021); Director, Counsel, AMG Funds LLC (2017-2018); Vice President, Counsel, AMG Funds LLC (2015-2017); Assistant Secretary, AMG Funds, AMG Funds I, AMG Funds II, AMG Funds III and AMG Funds IV (2016-Present); Associate, Ropes & Gray LLP (2011-2015); Law Fellow, Massachusetts Appleseed Center for Law and Justice (2010-2011). |
57
THIS PAGE INTENTIONALLY LEFT BLANK
THIS PAGE INTENTIONALLY LEFT BLANK
THIS PAGE INTENTIONALLY LEFT BLANK
| | |
| | |
| | | |
| | | |
| | | | |
INVESTMENT MANAGER AND ADMINISTRATOR AMG Funds LLC 680 Washington Blvd., Suite 500 Stamford, CT 06901 800.548.4539 DISTRIBUTOR AMG Distributors, Inc. 680 Washington Blvd., Suite 500 Stamford, CT 06901 800.548.4539 SUBADVISER GW&K Investment Management, LLC 222 Berkeley St. Boston, MA 02116 | | CUSTODIAN The Bank of New York Mellon Mutual Funds Custody 6023 Airport Road Oriskany, NY 13424 LEGAL COUNSEL Ropes & Gray LLP Prudential Tower, 800 Boylston Street Boston, MA 02199-3600 TRANSFER AGENT BNY Mellon Investment Servicing (US) Inc. AMG Funds Attn: 534426 AIM 154-0520 500 Ross Street Pittsburgh, PA 15262 800.548.4539 | | This report is prepared for the Funds’ shareholders. It is authorized for distribution to prospective investors only when preceded or accompanied by an effective prospectus. To receive a free copy of the prospectus or Statement of Additional Information, which includes additional information about Fund Trustees, please contact us by calling 800.548.4539. Distributed by AMG Distributors, Inc., member FINRA/SIPC. Current net asset values per share for each Fund are available on the Funds’ website at wealth.amg.com. A description of the policies and procedures each Fund uses to vote its proxies is available: (i) without charge, upon request, by calling 800.548.4539, or (ii) on the Securities and Exchange Commission’s (SEC) website at sec.gov. For information regarding each Fund’s proxy voting record for the 12-month period ended June 30, call 800.548.4539 or visit the SEC website at sec.gov. The Funds file their complete schedule of portfolio holdings with the SEC for the first and third quarters of each fiscal year as an exhibit to their reports on Form N-PORT. The Funds’ portfolio holdings on Form N-PORT are available on the SEC’s website at sec.gov and the Funds’ website at wealth.amg.com. To review a complete list of the Funds’ portfolio holdings, or to view the most recent semi-annual report or annual report, please visit wealth.amg.com. |
| | |
| | |
| | | |
| | | |
| | | | | | | | |
EQUITY FUNDS AMG Beutel Goodman International Equity Beutel, Goodman & Company Ltd. AMG Boston Common Global Impact Boston Common Asset Management, LLC AMG Frontier Small Cap Growth Frontier Capital Management Co., LLC AMG GW&K Small Cap Core AMG GW&K Small Cap Value AMG GW&K Small/Mid Cap Core AMG GW&K Small/Mid Cap Growth AMG GW&K International Small Cap GW&K Investment Management, LLC AMG Montrusco Bolton Large Cap Growth Montrusco Bolton Investments, Inc. AMG Renaissance Large Cap Growth The Renaissance Group LLC | | | | AMG River Road Dividend All Cap Value AMG River Road Focused Absolute Value AMG River Road Large Cap Value Select AMG River Road Mid Cap Value AMG River Road Small-Mid Cap Value AMG River Road Small Cap Value River Road Asset Management, LLC AMG TimesSquare Emerging Markets Small Cap AMG TimesSquare Global Small Cap AMG TimesSquare International Small Cap AMG TimesSquare Mid Cap Growth AMG TimesSquare Small Cap Growth TimesSquare Capital Management, LLC AMG Veritas Asia Pacific AMG Veritas China AMG Veritas Global Focus AMG Veritas Global Real Return Veritas Asset Management LLP AMG Yacktman AMG Yacktman Focused AMG Yacktman Global AMG Yacktman Special Opportunities Yacktman Asset Management LP | | FIXED INCOME FUNDS AMG Beutel Goodman Core Plus Bond Beutel, Goodman & Company Ltd. AMG GW&K Core Bond ESG AMG GW&K Enhanced Core Bond ESG AMG GW&K ESG Bond AMG GW&K High Income AMG GW&K Municipal Bond AMG GW&K Municipal Enhanced Yield GW&K Investment Management, LLC | | |
| | | | | | |
| wealth.amg.com | | | | | | 123123 AR089 |
| | |
 | | ANNUAL REPORT |
| | |
| | | AMG Funds December 31, 2023 |
| | |
| | |  |
| | |
| | | AMG GW&K Municipal Enhanced SMA Shares |
| | |
| | | Ticker: MESHX |
| | |
| | | |
| | |
| | | |
| | | | |
| wealth.amg.com | | | | 123123 AR090 |
| | |
| | | AMG Funds Annual Report — December 31, 2023 |
| | | | | | |
| | | |
| | | | | | |
| | | TABLE OF CONTENTS | | PAGE | |
| | | |
| | | LETTER TO SHAREHOLDERS | | | 2 | |
| | | |
| | | ABOUT YOUR FUND’S EXPENSES | | | 3 | |
| | | |
| | | PORTFOLIO MANAGER’S COMMENTS, FUND SNAPSHOTS AND SCHEDULE OF PORTFOLIO INVESTMENTS | | | 4 | |
| | | |
| | | FINANCIAL STATEMENTS | | | | |
| | | |
| | | Statement of Assets and Liabilities | | | 11 | |
| | | |
| | | Balance sheet, net asset value (NAV) per share computations
and cumulative distributable earnings (loss) | | | | |
| | | |
| | | Statement of Operations | | | 12 | |
| | | |
| | | Detail of sources of income, expenses, and realized and
unrealized gains (losses) during the fiscal year | | | | |
| | | |
| | | Statement of Changes in Net Assets | | | 13 | |
| | | |
| | | Detail of changes in assets for the past fiscal period | | | | |
| | | |
| | | Financial Highlights | | | 14 | |
| | | |
| | | Historical net asset values per share, distributions, total returns, income
and expense ratios, turnover ratios and net assets | | | | |
| | | |
| | | Notes to Financial Statements | | | 15 | |
| | | |
| | | Accounting and distribution policies, details of agreements and
transactions with Fund management and affiliates, and descriptions of
certain investment risks | | | | |
| | | |
| | | REPORT OF INDEPENDENT REGISTERED PUBLIC ACCOUNTING FIRM | | | 19 | |
| | | |
| | | OTHER INFORMATION | | | 20 | |
| | | |
| | | TRUSTEES AND OFFICERS | | | 21 | |
Nothing contained herein is to be considered an offer, sale or solicitation of an offer to buy shares of any series of the AMG Funds Family of Funds. Such offering is made only by prospectus, which includes details as to offering price and other material information.
| | |
| | Letter to Shareholders |
Dear Shareholder:
We are pleased to provide this annual report for your investment with AMG Funds. Our foremost goal is to provide investment solutions that help our shareholders successfully achieve their long-term investment goals. We appreciate the privilege of providing you with investment tools.
Throughout most of the year, markets wrestled with uncertainties around tighter monetary policy, increased geopolitical tension, instability in the regional banking sector, and political handwringing over the U.S. debt ceiling. However, investors remained optimistic for an economic “soft landing” as inflation continued to ease and risk assets finally surged in the fourth quarter following a dovish pivot in the U.S. Federal Reserve (the “Fed”) policy. Bonds finished with a positive return; a remarkable development after struggling to move higher for most of the year as global central banks raised interest rates.
The S&P 500® Index gained 26.29% for the fiscal year ended December 31, 2023, fully recouping losses suffered in 2022. Large-cap stocks diverged from small-cap stocks, particularly driven by a handful of mega-cap technology and consumer discretionary stocks. The Russell 1000® Index gained 26.53% compared to the 16.93% return for the Russell 2000® Index. Nine out of eleven sectors posted positive returns, with information technology (60.93%), communication services (55.86%), and consumer discretionary (43.22%) leading the way. The weakest sectors were utilities (-7.08%), energy (-1.33%), and consumer staples (+0.55%). The strength in information technology drove growth stocks to strongly outperform value stocks with the Russell 1000® Growth Index gaining 42.68% compared to a 11.46% return for the Russell 1000® Value Index. Outside the U.S., foreign equity markets underperformed domestic equities, delivering a 15.62% return, as measured by the MSCI All Country World Index ex USA benchmark.
The Bloomberg U.S. Aggregate Bond Index, a broad measure of U.S. bond market performance, rebounded with a 5.53% return over the period. The 10-year Treasury yield climbed to post-GFC (Global Financial Crisis) highs through October as the Fed tightened policy throughout the year, leading many to expect another year of negative bond returns. However, investors received much needed relief as interest rates fell sharply in the final two months of the year following the Fed’s message signaling rate cuts in 2024. Looking across the broadest sectors of the market, investment-grade corporate bonds gained 8.52% for the year, while agency mortgage-backed securities rose 5.05%. High yield bonds were the best performing sector with a 13.44% return as measured by the return of the Bloomberg U.S. Corporate High Yield Bond Index. Municipal bonds outperformed the broader market with a 6.40% gain for the Bloomberg Municipal Bond Index. Outside the U.S., foreign bonds were also positive as the Bloomberg Global Aggregate ex-USD Index gained 5.72%.
AMG Funds provides access to a distinctive array of actively managed return-oriented investment strategies. You can rest assured that under all market conditions our team is focused on delivering excellent investment management services for your benefit. For more information about AMG Funds’ wide range of products and resources, please visit wealth.amg.com. We thank you for your investment and continued trust in AMG Funds.
Respectfully,

Keitha Kinne
President
AMG Funds
| | | | | | | | | | | | | | |
| | | | | Periods ended | |
| Average Annual Total Returns | | December 31, 2023* | |
| | | | |
| Stocks: | | | | 1 Year | | | 3 Years | | | 5 Years | |
| | | | |
Large Cap | | (S&P 500® Index) | | | 26.29% | | | | 10.00% | | | | 15.69% | |
| | | | |
Small Cap | | (Russell 2000® Index) | | | 16.93% | | | | 2.22% | | | | 9.97% | |
| | | | |
International | | (MSCI ACWI ex USA) | | | 15.62% | | | | 1.55% | | | | 7.08% | |
| | | | |
Bonds: | | | | | | | | | | | | | | |
| | | | |
Investment Grade | | (Bloomberg U.S. Aggregate Bond Index) | | | 5.53% | | | | (3.31)% | | | | 1.10% | |
| | | | |
High Yield | | (Bloomberg U.S. Corporate High Yield Bond Index) | | | 13.44% | | | | 1.98% | | | | 5.37% | |
| | | | |
Tax-exempt | | (Bloomberg Municipal Bond Index) | | | 6.40% | | | | (0.40)% | | | | 2.25% | |
| | | | |
Treasury Bills | | (ICE BofAML U.S. 6-Month Treasury Bill Index) | | | 5.14% | | | | 2.17% | | | | 2.02% | |
*Source: FactSet. Past performance is no guarantee of future results.
2
| | |
| | | About Your Fund’s Expenses |
| | | |
| | | |
| | | | | | | | |
As a shareholder of a Fund, you may incur two types of costs: (1) transaction costs, which may include sales charges (loads) on purchase payments; redemption fees; and exchange fees; and (2) ongoing costs, including management fees; distribution (12b-1) fees; and other Fund expenses. This example is intended to help you understand your ongoing costs (in dollars) of investing in the Fund and to compare these costs with the ongoing costs of investing in other mutual funds. The example is based on $1,000 invested at the beginning of the period and held for the entire period as indicated below. ACTUAL EXPENSES The first section of the following table provides information about the actual account values and | | | | actual expenses. You may use the information in this section, together with the amount you invested, to estimate the expenses that you paid over the period. Simply divide your account value by $1,000 (for example, an $8,600 account value divided by $1,000 = 8.6), then multiply the result by the number in the first section under the heading entitled “Expenses Paid During the Period” to estimate the expenses you paid on your account during this period. HYPOTHETICAL EXAMPLE FOR COMPARISON PURPOSES The second section of the following table provides information about hypothetical account values and hypothetical expenses based on the Fund’s actual expense ratio and an assumed annual rate of return of 5% before expenses, which is not the Fund’s | | | | actual return. The hypothetical account values and expenses may not be used to estimate the actual ending account balance or expenses you paid for the period. You may use this information to compare the ongoing costs of investing in the Fund and other funds by comparing this 5% hypothetical example with the 5% hypothetical examples that appear in the shareholder reports of other funds. Please note that the expenses shown in the table are meant to highlight your ongoing costs only and do not reflect any transactional costs, such as sales charges (loads), redemption fees, or exchange fees. Therefore, the second section of the table is useful in comparing ongoing costs only, and will not help you determine the relative total costs of owning different funds. |
| | | | | | | | |
| | | | | | | | | | |
Six Months Ended December 31, 2023 | | Expense
Ratio for
the Period | | Beginning
Account
Value
07/01/23 | | Ending
Account
Value
12/31/23 | | | Expenses
Paid During
the Period*,** |
AMG GW&K Municipal Enhanced SMA Shares |
|
Based on Actual Fund Return |
| | | 0.00% | | $1,000 | | | $1,048 | | | $0.00 |
|
Based on Hypothetical 5% Annual Return |
| | | 0.00% | | $1,000 | | | $1,025 | | | $0.00 |
| * | Expenses are equal to the Fund’s annualized expense ratio multiplied by the average account value over the period, multiplied by the number of days in the most recent fiscal half-year (184), then divided by 365. |
| ** | The figures in the example do not reflect the effect of fees and expenses associated with a separately managed account, nor a management fee or other operating expenses of the Fund. Such management fees are paid directly or indirectly by the separately managed account sponsor to the Fund’s investment manager or subadviser. All operating expenses of the Fund were reimbursed by the investment manager, pursuant to an expense reimbursement arrangement between the Fund and the investment manager. |
3
| | |
| | | AMG GW&K Municipal Enhanced SMA Shares Portfolio Manager’s Comments (unaudited) |
| | | |
| | | |
| | | | | | | | |
THE YEAR IN REVIEW AMG GW&K Municipal Enhanced SMA Shares (the “Fund”) Class N shares returned 8.81% since inception on February 28, 2023 through December 31, 2023, compared to the Bloomberg U.S. Municipal Bond BAA Index (the “Index”), which returned 7.63% over the same period. Municipal bonds posted solid gains in the Fund’s first full month after inception, piggybacking on a strong rally in Treasuries. Then municipal bonds posted modest losses in the second quarter, following the lead of a Treasury market that finally stopped fighting the Fed. Coming into April, investors were confident that the central bank would be forced to reverse its tightening campaign before year end. But that conviction didn’t last. Economic data stood firm against the torrent of rate hikes, defying predictions for a near-term recession. Regional banks earned back investor confidence, despite a third major failure. And while inflation slowed, it remained well above its 2% target, still threatening to become entrenched. Even when the FOMC stood pat in June, its first pause in 18 months of constant hiking, the committee refused to signal the all-clear, guiding for two more increases in 2023. The street got the message. Short-term rates spiked more than 80 basis points over the quarter while the futures market erased bets that cuts would come later in the year. Long-term rates rose less dramatically, leading the yield curve to nearly match its March inversion, the deepest in over 40 years. An eventual recession is still the market’s base case, but exactly when or how deep remain open questions. The municipal market was a full participant in the global bond rout that unfolded over the third quarter. Broad fixed income losses piled up each month, but accelerated after the September FOMC meeting, where Fed policymakers signaled a determination to hold interest rates higher for longer. Investors were taken off guard by the hawkish messaging, given the trajectory toward lower inflation and reduced froth in the labor markets, particularly over the last three months. But as Jay Powell pointed out in his post-meeting press conference, the recent jump in Treasury yields was less about inflation and more about real yields rising in response to stronger-than-expected economic data. The Fed chair listed a number of plausible explanations for the economy’s surprising resilience (lagged effects of tightening, higher neutral rate, more durable consumer and business balance sheets), but | | | | emphasized the need to guard against overheated growth, lest it threaten the headway made to date in restoring price stability and full employment. The markets shared his caution, as the yield on the 10-year Treasury note climbed 73 basis points over the quarter, closing September at 4.57%, its highest level since 2007. As we ended the year, municipal bonds posted their best quarterly performance in nearly four decades, transforming 2023 into a year of solid gains after it looked like we were headed for a second consecutive annual loss. The remarkable turnaround was fueled by macro forces that unfolded over the final two months of the year. Recall that in October interest rates were still in selloff mode, as a stubbornly strong economy and persistently high inflation gave teeth to the Fed’s “higher-for-longer” mantra. Later that month, the yield on the 10-year Treasury had risen to 5%, a 16-year high. From that point on, however, the data began to shift. Job growth softened meaningfully while price pressures eased, increasing the odds of a soft landing and fueling speculation of an impending monetary pivot. Fed officials virtually confirmed this view when they unexpectedly penciled in 75 basis points of cuts for 2024 in the December FOMC projection materials. The bond market, already rallying coming into the meeting, continued to surge into year-end. By the end of December, the 10-year yield had fallen to 3.88%, down almost 70 basis points for the quarter. While the Treasury rally was the key factor driving performance in the fourth quarter, municipal bonds received additional boosts from limited issuance and sky-rocketing demand. Even during the October selloff, retail investors were jumping at the chance to lock in tax-equivalent yields not seen in over a decade, keeping municipals relatively well bid. When the market then started to turn, a healthy appetite for paper turned into a mad scramble, reflecting a fierce competition for bonds amid an end-of-year slowdown in issuance. The frenzy was amplified by a spike in rollover flows as well as an explosion of tax-loss harvesting, as participants hastened to reinvest proceeds before the market moved away from them. Over the final two months of the year, the 10-year municipal yield fell 133 basis points. And when it was all said and done, you had to go back to 1986 to find a better quarterly return. 2023 now enters the history books as the sixth best annual return in the last two decades, an extraordinary outcome for a year that brought so much handwringing. | | | | FUND REVIEW The Fund outperformed the Index from inception through year-end. The strong rally in the fourth quarter transformed 2023 into a year of solid gains and outweighed the performance of the previous three quarters. The Fund’s outperformance was driven mainly by its longer duration, its overweight to longer maturities, and the significant decline in interest rates in the quarter. Additionally, the Fund’s overweights to the hospital and transportation sectors contributed to performance. Lower quality benefited from the rally in the fourth quarter. The Fund’s higher quality bias detracted from performance, specifically the Fund’s overweight to Single A versus the BBB-rated bonds of the Index. An underweight to lower coupon bonds and security selection in the tobacco and housing sectors were also detractors from performance. OUTLOOK Looking ahead to January, the combination of seasonally low supply, still-heavy reinvestment needs and an end to tax-loss selling should continue to foster the momentum built up over the past two months. Demand will be supported by a healthy fundamental backdrop and historically attractive tax-equivalent yields. The outlook for state and local governments remains solid, with most looking at low-single-digit revenue increases, manageable expense growth and significant financial flexibility, a product of record-high reserves. Investors will need to be alert to future volatility, especially with the market anticipating a sea change in monetary policy followed by a fast-approaching national election. One area to keep an eye on is how expensive valuations to Treasuries have become in the wake of the recent rally. While we don’t necessarily expect a quick unwind of these historically stretched ratios, municipal bonds are less likely to outperform Treasuries until we see those metrics improve. Even so, heading into a year with so much uncertainty, the high-quality stability offered by municipal bonds promises to draw even more interest to the asset class in 2024. The views expressed represent the opinions of GW&K Investment Management, LLC as of December 31, 2023, and are not intended as a forecast or guarantee of future results, and are subject to change without notice. |
4
| | |
| | | AMG GW&K Municipal Enhanced SMA Shares Portfolio Manager’s Comments (continued) |
| | | |
| | | |
CUMULATIVE TOTAL RETURN PERFORMANCE
AMG GW&K Municipal Enhanced SMA Shares’s cumulative total return is based on the daily change in net asset value (NAV), and assumes that all dividends and distributions were reinvested. This graph compares a hypothetical $10,000 investment made in the AMG GW&K Municipal Enhanced SMA Shares on February 28, 2023 (inception date), to a $10,000 investment made in the Bloomberg U.S. Municipal Bond BAA Index for the same time period. The graph and table do not reflect the deduction of taxes that a shareholder would pay on a Fund distribution or redemption of shares. The listed returns for the Fund are net of expenses and the returns for the index exclude expenses. Total returns would have been lower had certain expenses not been reduced.
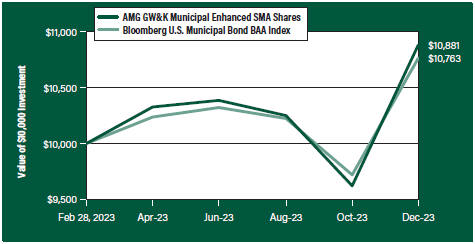
The table below shows the average annual total returns for the AMG GW&K Municipal Enhanced SMA Shares and the Bloomberg U.S. Municipal Bond BAA Index for the same time periods ended December 31, 2023.
| | | | | | | | |
| | | Since | | | Inception | |
| Average Annual Total Returns1 | | Inception* | | | Date | |
AMG GW&K Municipal Enhanced SMA Shares2, 3, 4, 5, 6, 7, 8, 9, 10, 11, 12, 13, 14, 15, 16, 17, 18 | |
| | |
AMG GW&K Municipal Enhanced SMA Shares | | | 8.81% | | | | 02/28/23 | |
| | |
Bloomberg U.S. Municipal Bond BAA Index19 | | | 7.63% | | | | 02/28/23 | † |
The performance data shown represents past performance. Past performance is not a guarantee of future results. Current performance may be lower or higher than the performance data quoted. The investment return and principal value of an investment will fluctuate so that an investor’s shares, when redeemed, may be worth more or less than their original cost.
Investors should carefully consider the Fund’s investment objectives, risks, charges and expenses before investing. For performance information through the most recent month end, current net asset values per share for the Fund and other information, please call 800.548.4539 or visit our website at wealth.amg.com for a free prospectus. Read it carefully before investing or sending money.
Distributed by AMG Distributors, Inc., member FINRA/SIPC.
| † | Date reflects the inception date of the Fund, not the index. |
| 1 | Total return equals income yield plus share price change and assumes reinvestment of all dividends and capital gain distributions. Returns are net of fees and may reflect offsets of Fund expenses as described in the prospectus. No adjustment has been made for taxes payable by shareholders on their reinvested dividends and capital gain distributions. Returns for periods greater than one year are annualized. The listed returns on the Fund are net of expenses and based on the published NAV as of December 31, 2023. All returns are in U.S. Dollars ($). |
|
2 From time to time, the Fund’s Investment Manager has waived its fees and/or absorbed Fund expenses, which has resulted in higher returns. 3 The value of a debt security changes in response to various factors, including, for example, market-related factors, such as changes in interest rates or changes in the actual or perceived ability of an issuer to meet its obligations. Investments in debt securities are subject to, among other risks, credit risk, interest rate risk, extension risk, prepayment risk and liquidity risk. 4 Factors unique to the municipal bond market may negatively affect the value of municipal bonds. 5 Fixed coupon payments (cash flows) of bonds and debt securities may become less competitive with the market in periods of rising interest rates and cause bond prices to decline. During periods of increasing interest rates, the Fund may experience high levels of volatility and shareholder redemptions, and may have to sell securities at times when it would otherwise not do so, and at unfavorable prices, which could reduce the returns of the Fund. 6 The issuer of bonds or other debt securities or a counterparty to a derivatives contract may be unable or unwilling, or may be perceived as unable or unwilling, to make timely interest, principal or settlement payments or otherwise honor its obligations. 7 A debtor may exercise its right to pay back a bond or other debt security earlier than expected or required during periods of decreasing interest rates. 8 The Fund will normally receive income which may include interest, dividends and/or capital gains, depending upon its investments. The distribution amount paid by the Fund will vary and generally depends on the amount of income the Fund earns (less expenses) on its portfolio holdings, and capital gains or losses it recognizes. A decline in the Fund’s income or net capital gains arising from its investments may reduce its distribution level. |
9 The Fund may have difficulty reinvesting payments from debtors and may receive lower rates than from its original investments. 10 During periods of rising interest rates, a debtor may pay back a bond or other fixed income security slower than expected or required, and the value of such security may fall. 11 Below investment grade debt securities and unrated securities of similar credit quality (commonly known as “junk bonds” or “high yield securities”) may be subject to greater levels of interest rate, credit, liquidity, and market risk than higher-rated securities. These securities are considered predominately speculative with respect |
5
| | |
| | | AMG GW&K Municipal Enhanced SMA Shares Portfolio Manager’s Comments (continued) |
| | | |
| | | |
| | | | | | | | |
to the issuer’s continuing ability to make principal and interest payments. 12 Inflation risk is the risk that the value of assets or income from investments will be worth less in the future. Inflation rates may change frequently and drastically as a result of various factors and the Fund’s investments may not keep pace with inflation, which may result in losses to Fund investors or adversely affect the real value of shareholders’ investments in the Fund. Recently, inflation levels have been at their highest point in nearly 40 years, and the U.S. Federal Reserve has begun an aggressive campaign to raise certain benchmark interest rates in an effort to combat inflation. As such, fixed income securities markets may experience heightened levels of interest rate volatility and liquidity risk. Deflation risk is the risk that the prices throughout the economy decline over time – the opposite of inflation. Deflation may have an adverse effect on the creditworthiness of issuers and may make issuer default more likely, which may result in a decline in the value of the Fund’s portfolio. 13 Because the Fund is an actively managed investment portfolio, security selection or focus on securities in a particular style, market sector or group of companies may cause the Fund to incur losses or underperform relative to its benchmarks or other funds with a similar investment objective. There can be no guarantee that the Subadviser’s investment techniques and risk analysis will produce the desired result. | | | | 14 Market prices of investments held by the Fund may fall rapidly or unpredictably due to a variety of factors, including economic, political, or market conditions, or other factors including terrorism, war, natural disasters and the spread of infectious illness or other public health issues, including epidemics or pandemics, or in response to events that affect particular industries or companies. 15 The Fund is a new fund, which may result in additional risk. There can be no assurance that the Fund will grow to an economically viable size, in which case the Fund may cease operations. In such an event, investors may be required to liquidate or transfer their investments at an inopportune time. In addition, until the Fund achieves sufficient scale, a Fund shareholder may experience proportionally higher Fund expenses than would be experienced by shareholders of a fund with a larger asset base. 16 The Fund may not be able to dispose of particular investments, such as illiquid securities, readily at favorable times or prices or the Fund may have to sell them at a loss. 17 The use of derivatives involves costs, the risk that the value of derivatives may not correlate perfectly with their underlying assets, rates or indices, liquidity risk, and the risk of mispricing or improper valuation. The use of derivatives may not succeed for various reasons, and the complexity and rapidly changing structure of derivatives markets may increase the possibility of market losses. | | | | 18 Issuers and companies that are in similar industry sectors may be similarly affected by particular economic or market events; to the extent the Fund has substantial holdings within a particular sector, the risks associated with that sector increase. 19 The Bloomberg U.S. Municipal Bond BAA Index is a subset of the Bloomberg U.S. Municipal Bond Index with an index rating of Baa1, Baa2, or Baa3. The Bloomberg U.S. Municipal Bond Index is a rules-based, market-value-weighted index engineered for the long-term, tax-exempt bond market. Unlike the Fund, the Bloomberg U.S. Municipal Bond BAA Index is unmanaged, is not available for investment and does not incur expenses. “Bloomberg®” and any Bloomberg index described herein are service marks of Bloomberg Finance L.P. and its affiliates, including Bloomberg Index Services Limited (“BISL”), the administrator of the index (collectively, “Bloomberg”) and have been licensed for use for certain purposes by AMG Funds LLC. Bloomberg is not affiliated with AMG Funds LLC, and Bloomberg does not approve, endorse, review, or recommend the fund described herein. Bloomberg does not guarantee the timeliness, accurateness, or completeness of any data or information relating to such fund. Not FDIC insured, nor bank guaranteed. May lose value. |
6
| | |
| | | AMG GW&K Municipal Enhanced SMA Shares Fund Snapshots (unaudited) December 31, 2023 |
PORTFOLIO BREAKDOWN
| | |
| Category | | %of
Net Assets |
| | |
Transportation | | 24.0 |
| | |
General Obligation | | 24.0 |
| | |
Medical | | 17.9 |
| | |
Airport | | 8.6 |
| | |
Higher Education | | 4.5 |
| | |
Water | | 4.5 |
| | |
Industrial Development | | 2.7 |
| | |
School District | | 2.4 |
| | |
Tobacco Settlement | | 1.8 |
| | |
Power | | 1.5 |
| | |
Housing | | 1.3 |
| | |
Utilities | | 1.0 |
| | |
Short-Term Investments | | 4.1 |
| | |
Other Assets, less Liabilities | | 1.7 |
| | |
| Rating | | % of Market Value1 |
| | |
Aaa/AAA | | 4.2 |
| | |
Aa/AA | | 19.2 |
| | |
A | | 43.7 |
| | |
Baa/BBB | | 32.9 |
| 1 | Includes market value of long-term fixed-income securities only. |
TOP TEN HOLDINGS
| | |
| Security Name | | % of
Net Assets |
| | |
Louisiana Stadium & Exposition District, Series A, 5.250%, 07/01/53 | | 3.0 |
| | |
New York City Transitional Finance Authority Future Tax Secured, Series 1, 5.000%, 05/01/48 | | 2.8 |
| | |
New York Transportation Development Corp., 6.000%, 06/30/54 | | 2.8 |
| | |
Great Lakes Water Authority Water Supply System Revenue, Series B, 5.250%, 07/01/53 | | 2.8 |
| | |
Massachusetts Development Finance Agency, 5.250%, 07/01/52 | | 2.5 |
| | |
Pennsylvania Economic Development Financing Authority, 5.250%, 06/30/53 | | 2.3 |
| | |
Miami Beach Health Facilities Authority, 4.000%, 11/15/46 | | 2.3 |
| | |
New Jersey Transportation Trust Fund Authority, Series BB, 5.250%, 06/15/50 | | 2.3 |
| | |
County of Miami-Dade Florida Seaport Department, Series 1, 4.000%, 10/01/45 | | 2.2 |
| | |
Texas Private Activity Bond Surface Transportation Corp., 5.000%, 06/30/58 | | 2.1 |
| | | |
| | |
Top Ten as a Group | | 25.1 |
| | |
Credit quality ratings shown above reflect the highest rating assigned by either Standard & Poor’s (“S&P”), Moody’s Investors Service, Inc. (“Moody’s”) or Fitch. These rating agencies are independent, nationally recognized statistical rating organizations and are widely used. Investment grade ratings are credit ratings of BBB- or higher. Below investment grade ratings are credit ratings of BB+ or lower. Investments designated N/R are not rated by any of the rating agencies. Unrated investments do not necessarily indicate low credit quality. Credit quality ratings are subject to change.
Because a fund’s strategy may result in multiple investments in particular sectors of the economy, its performance may depend on the performance of those sectors and may fluctuate more widely than investments diversified across more sectors. For additional information on these and other risk considerations, please see the Fund’s prospectus.
Any sectors, industries, or securities discussed should not be perceived as investment recommendations. Mention of a specific security should not be considered a recommendation to buy or solicitation to sell that security. Specific securities mentioned in this report may have been sold from the Fund’s portfolio of investments by the time you receive this report.
7
| | |
| | | AMG GW&K Municipal Enhanced SMA Shares Schedule of Portfolio Investments December 31, 2023 |
| | | | | | | | |
| | | Principal
Amount | | | Value | |
| | |
Municipal Bonds - 94.2% | | | | | | | | |
| | |
California - 2.9% | | | | | | | | |
| | |
California Municipal Finance Authority, | | | | | | | | |
5.000%, 05/15/43 | | | $485,000 | | | | $499,325 | |
5.000%, 05/15/48 | | | 795,000 | | | | 812,675 | |
| | |
California Municipal Finance Authority, Series A | | | | | | | | |
4.000%, 02/01/51 | | | 240,000 | | | | 217,548 | |
| | |
Riverside County Transportation Commission, Series B1 | | | | | | | | |
4.000%, 06/01/46 | | | 420,000 | | | | 420,712 | |
| | |
Riverside County Transportation Commission, Series C | | | | | | | | |
4.000%, 06/01/47 | | | 555,000 | | | | 545,068 | |
| | |
San Diego County Regional Airport Authority, Series B | | | | | | | | |
4.000%, 07/01/51 | | | 325,000 | | | | 310,600 | |
| | |
Total California | | | | | | | 2,805,928 | |
| | |
Colorado - 2.3% | | | | | | | | |
| | |
Colorado Health Facilities Authority, Series A | | | | | | | | |
5.000%, 08/01/44 | | | 930,000 | | | | 968,491 | |
| | |
Public Authority for Colorado Energy Natural Gas Purchase Revenue | | | | | | | | |
6.500%, 11/15/38 | | | 1,050,000 | | | | 1,322,928 | |
| | |
Total Colorado | | | | | | | 2,291,419 | |
| | |
Connecticut - 1.3% | | | | | | | | |
| | |
Connecticut State Health & Educational Facilities Authority, | | | | | | | | |
4.000%, 07/01/39 | | | 485,000 | | | | 482,910 | |
4.000%, 07/01/40 | | | 555,000 | | | | 547,879 | |
4.000%, 07/01/42 | | | 285,000 | | | | 276,495 | |
| | |
Total Connecticut | | | | | | | 1,307,284 | |
| | |
Florida - 10.8% | | | | | | | | |
| | |
Brevard County Health Facilities Authority, Series A | | | | | | | | |
5.000%, 04/01/47 | | | 1,185,000 | | | | 1,273,928 | |
| | |
City of Tampa, Series B | | | | | | | | |
5.000%, 07/01/50 | | | 495,000 | | | | 519,120 | |
| | |
County of Miami-Dade Florida Seaport Department, Series 1, (AGM) | | | | | | | | |
4.000%, 10/01/45 | | | 2,265,000 | | | | 2,161,086 | |
| | |
County of Miami-Dade Florida Seaport Department, Series A | | | | | | | | |
5.250%, 10/01/52 | | | 365,000 | | | | 396,943 | |
| | |
County of Miami-Dade Florida Water & Sewer System | | | | | | | | |
4.000%, 10/01/48 | | | 1,675,000 | | | | 1,673,224 | |
| | |
Escambia County Health Facilities Authority | | | | | | | | |
4.000%, 08/15/50 | | | 985,000 | | | | 866,391 | |
| | |
Florida Development Finance Corp., | | | | | | | | |
4.000%, 02/01/52 | | | 485,000 | | | | 372,707 | |
5.000%, 02/01/52 | | | 325,000 | | | | 301,203 | |
| | | | | | | | |
| | | Principal
Amount | | | Value | |
| | |
Hillsborough County Industrial Development Authority | | | | | | | | |
4.000%, 08/01/50 | | | $815,000 | | | | $760,999 | |
| | |
Miami Beach Health Facilities Authority | | | | | | | | |
4.000%, 11/15/46 | | | 2,370,000 | | | | 2,278,260 | |
| | |
Total Florida | | | | | | | 10,603,861 | |
| | |
Georgia - 1.5% | | | | | | | | |
| | |
Columbia County Hospital Authority | | | | | | | | |
5.750%, 04/01/53 | | | 1,250,000 | | | | 1,426,884 | |
| | |
Illinois - 7.9% | | | | | | | | |
| | |
Chicago O’Hare International Airport, Senior Lien, Series A | | | | | | | | |
5.000%, 01/01/48 | | | 1,100,000 | | | | 1,133,520 | |
| | |
Illinois State Toll Highway Authority, Series A | | | | | | | | |
5.000%, 01/01/391 | | | 1,000,000 | | | | 1,175,169 | |
| | |
Metropolitan Pier & Exposition Authority, | | | | | | | | |
4.000%, 12/15/42 | | | 325,000 | | | | 324,805 | |
4.000%, 06/15/52 | | | 485,000 | | | | 456,270 | |
5.000%, 06/15/50 | | | 815,000 | | | | 842,218 | |
| | |
State of Illinois, | | | | | | | | |
5.500%, 05/01/39 | | | 650,000 | | | | 719,652 | |
5.750%, 05/01/45 | | | 485,000 | | | | 533,763 | |
| | |
State of Illinois, Series A, | | | | | | | | |
4.000%, 03/01/40 | | | 1,240,000 | | | | 1,245,389 | |
5.000%, 03/01/46 | | | 355,000 | | | | 375,984 | |
| | |
State of Illinois, Series B | | | | | | | | |
5.500%, 05/01/47 | | | 815,000 | | | | 895,340 | |
| | |
Total Illinois | | | | | | | 7,702,110 | |
| | |
Kentucky - 1.2% | | | | | | | | |
| | |
Kentucky State Property & Building Commission, Series A | | | | | | | | |
5.500%, 11/01/43 | | | 1,025,000 | | | | 1,180,170 | |
| | |
Louisiana - 3.0% | | | | | | | | |
| | |
Louisiana Stadium & Exposition District, Series A | | | | | | | | |
5.250%, 07/01/53 | | | 2,615,000 | | | | 2,889,598 | |
| | |
Massachusetts - 3.3% | | | | | | | | |
| | |
Massachusetts Development Finance Agency, | | | | | | | | |
4.000%, 07/01/51 | | | 970,000 | | | | 815,601 | |
5.250%, 07/01/52 | | | 2,205,000 | | | | 2,396,353 | |
| | |
Total Massachusetts | | | | | | | 3,211,954 | |
| | |
Michigan - 4.3% | | | | | | | | |
| | |
Great Lakes Water Authority Water Supply System Revenue | | | | | | | | |
5.250%, 07/01/53 | | | 2,405,000 | | | | 2,717,435 | |
| | |
State of Michigan Trunk Line | | | | | | | | |
5.250%, 11/15/49 | | | 1,300,000 | | | | 1,494,596 | |
| | |
Total Michigan | | | | | | | 4,212,031 | |
| | |
Minnesota - 0.4% | | | | | | | | |
| | |
Duluth Economic Development Authority, Series A | | | | | | | | |
5.000%, 02/15/48 | | | 410,000 | | | | 417,384 | |
The accompanying notes are an integral part of these financial statements.
8
| | |
| | | AMG GW&K Municipal Enhanced SMA Shares Schedule of Portfolio Investments (continued) |
| | | | | | | | |
| | | Principal
Amount | | | Value | |
| | |
Missouri - 1.5% | | | | | | | | |
| | |
Health & Educational Facilities Authority of the State of Missouri | | | | | | | | |
4.000%, 06/01/53 | | | $1,500,000 | | | | $1,453,640 | |
| | |
Nebraska - 1.1% | | | | | | | | |
| | |
Central Plains Energy Project #3, Series A | | | | | | | | |
5.000%, 09/01/42 | | | 995,000 | | | | 1,092,550 | |
| | |
New Jersey - 6.9% | | | | | | | | |
| | |
New Jersey Economic Development Authority, Series QQQ, | | | | | | | | |
4.000%, 06/15/46 | | | 240,000 | | | | 237,514 | |
4.000%, 06/15/50 | | | 340,000 | | | | 328,589 | |
| | |
New Jersey Transportation Trust Fund Authority | | | | | | | | |
5.250%, 06/15/46 | | | 325,000 | | | | 361,227 | |
| | |
New Jersey Transportation Trust Fund Authority, Series AA, | | | | | | | | |
4.000%, 06/15/45 | | | 340,000 | | | | 339,144 | |
4.000%, 06/15/50 | | | 325,000 | | | | 315,102 | |
5.000%, 06/15/50 | | | 240,000 | | | | 255,909 | |
| | |
New Jersey Transportation Trust Fund Authority, Series BB | | | | | | | | |
5.250%, 06/15/50 | | | 2,000,000 | | | | 2,219,757 | |
| | |
South Jersey Transportation Authority, | | | | | | | | |
4.625%, 11/01/47 | | | 570,000 | | | | 589,400 | |
5.250%, 11/01/52 | | | 820,000 | | | | 881,317 | |
| | |
Tobacco Settlement Financing Corp., Series A, | | | | | | | | |
5.000%, 06/01/46 | | | 405,000 | | | | 411,870 | |
5.250%, 06/01/46 | | | 530,000 | | | | 546,363 | |
| | |
Tobacco Settlement Financing Corp., Series B | | | | | | | | |
5.000%, 06/01/46 | | | 310,000 | | | | 314,653 | |
| | |
Total New Jersey | | | | | | | 6,800,845 | |
| | |
New York - 17.7% | | | | | | | | |
| | |
Metropolitan Transportation Authority, Series 1, | | | | | | | | |
4.750%, 11/15/45 | | | 1,625,000 | | | | 1,673,466 | |
5.000%, 11/15/50 | | | 1,000,000 | | | | 1,050,494 | |
5.250%, 11/15/55 | | | 490,000 | | | | 519,283 | |
| | |
New York City Transitional Finance Authority Future Tax Secured, Series 1 | | | | | | | | |
5.000%, 05/01/48 | | | 2,500,000 | | | | 2,780,311 | |
| | |
New York State Dormitory Authority | | | | | | | | |
5.000%, 05/01/52 | | | 485,000 | | | | 517,540 | |
| | |
New York State Dormitory Authority, Series A, | | | | | | | | |
4.000%, 07/01/47 | | | 550,000 | | | | 522,893 | |
4.000%, 07/01/52 | | | 340,000 | | | | 311,593 | |
| | |
New York State Thruway Authority, Series B | | | | | | | | |
4.000%, 01/01/45 | | | 325,000 | | | | 324,897 | |
| | |
New York State Urban Development Corp., Series A | | | | | | | | |
4.000%, 03/15/48 | | | 1,175,000 | | | | 1,177,480 | |
| | | | | | | | |
| | | Principal
Amount | | | Value | |
| | |
New York Transportation Development Corp., | | | | | | | | |
4.000%, 12/01/39 | | | $295,000 | | | | $298,411 | |
4.000%, 04/30/53 | | | 1,125,000 | | | | 986,603 | |
5.000%, 12/01/40 | | | 845,000 | | | | 902,702 | |
5.000%, 12/01/41 | | | 815,000 | | | | 863,806 | |
5.000%, 06/30/49 | | | 1,000,000 | | | | 1,044,630 | |
5.625%, 04/01/40 | | | 1,000,000 | | | | 1,075,824 | |
6.000%, 04/01/35 | | | 500,000 | | | | 556,998 | |
6.000%, 06/30/54 | | | 2,500,000 | | | | 2,760,586 | |
| | |
Total New York | | | | | | | 17,367,517 | |
| | |
Pennsylvania - 7.9% | | | | | | | | |
| | |
Allegheny County Airport Authority, Series A | | | | | | | | |
5.000%, 01/01/51 | | | 815,000 | | | | 847,870 | |
| | |
Geisinger Authority | | | | | | | | |
4.000%, 04/01/50 | | | 340,000 | | | | 318,340 | |
| | |
Montgomery County Higher Education and Health Authority, Series B | | | | | | | | |
5.000%, 05/01/52 | | | 770,000 | | | | 811,634 | |
| | |
Pennsylvania Economic Development Financing Authority | | | | | | | | |
5.250%, 06/30/53 | | | 2,185,000 | | | | 2,287,009 | |
| | |
Pennsylvania Economic Development Financing Authority, (AGM) | | | | | | | | |
5.000%, 12/31/57 | | | 1,240,000 | | | | 1,279,885 | |
| | |
Pennsylvania Turnpike Commission, Series A | | | | | | | | |
4.000%, 12/01/50 | | | 1,135,000 | | | | 1,112,070 | |
| | |
Philadelphia Authority for Industrial Development | | | | | | | | |
5.250%, 11/01/52 | | | 1,010,000 | | | | 1,078,863 | |
| | |
Total Pennsylvania | | | | | | | 7,735,671 | |
| | |
Rhode Island - 1.7% | | | | | | | | |
| | |
Rhode Island Health and Educational Building Corp. | | | | | | | | |
5.000%, 11/01/53 | | | 1,020,000 | | | | 1,108,096 | |
| | |
Tobacco Settlement Financing Corp., Series A | | | | | | | | |
5.000%, 06/01/40 | | | 530,000 | | | | 534,199 | |
| | |
Total Rhode Island | | | | | | | 1,642,295 | |
| | |
South Carolina - 1.2% | | | | | | | | |
| | |
Richland County School District No 2, Series A, (South Carolina School District) | | | | | | | | |
1.875%, 03/01/38 | | | 1,600,000 | | | | 1,196,382 | |
| | |
Tennessee - 1.6% | | | | | | | | |
| | |
City of Chattanooga Electric | | | | | | | | |
2.000%, 09/01/40 | | | 1,400,000 | | | | 1,007,310 | |
| | |
Metropolitan Government Nashville & Davidson County Health & Educational Facilities | | | | | | | | |
5.250%, 05/01/53 | | | 520,000 | | | | 565,016 | |
| | |
Total Tennessee | | | | | | | 1,572,326 | |
The accompanying notes are an integral part of these financial statements.
9
| | |
| | | AMG GW&K Municipal Enhanced SMA Shares Schedule of Portfolio Investments (continued) |
| | | | | | | | |
| | | Principal
Amount | | | Value | |
| | |
Texas - 10.4% | | | | | | | | |
| | |
Central Texas Regional Mobility Authority, Series B, | | | | | | | | |
4.000%, 01/01/51 | | | $665,000 | | | | $653,611 | |
5.000%, 01/01/45 | | | 1,590,000 | | | | 1,695,036 | |
| | |
City of Houston Airport System, Series A | | | | | | | | |
4.000%, 07/01/48 | | | 240,000 | | | | 230,386 | |
| | |
Lower Colorado River Authority | | | | | | | | |
5.000%, 05/15/51 | | | 1,365,000 | | | | 1,457,247 | |
| | |
Northwest Independent School District, (PSF-GTD) | | | | | | | | |
5.000%, 02/15/491 | | | 1,000,000 | | | | 1,110,498 | |
| | |
Texas Private Activity Bond Surface Transportation Corp., | | | | | | | | |
5.000%, 12/31/40 | | | 640,000 | | | | 645,092 | |
5.000%, 12/31/45 | | | 630,000 | | | | 633,808 | |
5.000%, 06/30/58 | | | 2,020,000 | | | | 2,041,234 | |
5.500%, 12/31/58 | | | 650,000 | | | | 704,888 | |
| | |
Texas Private Activity Bond Surface Transportation Corp., Series A | | | | | | | | |
4.000%, 12/31/39 | | | 995,000 | | | | 992,939 | |
| | |
Total Texas | | | | | | | 10,164,739 | |
| | |
Virginia - 4.1% | | | | | | | | |
| | |
Lynchburg Economic Development Authority | | | | | | | | |
4.000%, 01/01/55 | | | 240,000 | | | | 229,941 | |
| | |
Virginia Small Business Financing Authority, | | | | | | | | |
4.000%, 01/01/39 | | | 485,000 | | | | 476,530 | |
4.000%, 01/01/40 | | | 485,000 | | | | 474,456 | |
5.000%, 12/31/47 | | | 425,000 | | | | 447,008 | |
5.000%, 12/31/49 | | | 1,905,000 | | | | 1,913,449 | |
5.000%, 12/31/52 | | | 515,000 | | | | 516,632 | |
| | |
Total Virginia | | | | | | | 4,058,016 | |
| | | | | | | | |
| | | Principal
Amount | | | Value | |
| | |
West Virginia - 1.2% | | | | | | | | |
| | |
West Virginia Hospital Finance Authority, Series B | | | | | | | | |
6.000%, 09/01/53 | | | $1,000,000 | | | | $1,132,805 | |
| | |
Total Municipal Bonds | | | | | | | | |
(Cost $88,284,424) | | | | | | | 92,265,409 | |
| | |
Short-Term Investments - 4.1% | | | | | | | | |
| | |
Repurchase Agreements - 4.1% | | | | | | | | |
| | |
Fixed Income Clearing Corp. dated 12/29/23 due 01/02/24, 5.150% total to be received $4,002,289 (collateralized by a U.S. Treasury, 4.125%, 08/15/33, totaling $4,080,024) | | | 4,000,000 | | | | 4,000,000 | |
| | |
Total Short-Term Investments | | | | | | | | |
(Cost $4,000,000) | | | | | | | 4,000,000 | |
| | |
Total Investments - 98.3% | | | | | | | | |
(Cost $92,284,424) | | | | | | | 96,265,409 | |
| | |
Other Assets, less Liabilities - 1.7% | | | | | | | 1,664,901 | |
| | |
Net Assets - 100.0% | | | | | | | $97,930,310 | |
| 1 | All or part of a security is delayed delivery transaction. The market value for delayed delivery securities at December 31, 2023, amounted to $2,285,667, or 2.3% of net assets. |
AGM Assured Guaranty Municipal Corp.
PSF-GTD Permanent School Fund Guaranteed
The following table summarizes the inputs used to value the Fund’s investments by the fair value hierarchy levels as of December 31, 2023:
| | | | | | | | | | | | | | | | |
| | | Level 1 | | | Level 2 | | | Level 3 | | | Total | |
| | | | |
Investments in Securities | | | | | | | | | | | | | | | | |
| | | | |
Municipal Bonds† | | | — | | | $ | 92,265,409 | | | | — | | | $ | 92,265,409 | |
| | | | |
Short-Term Investments | | | | | | | | | | | | | | | | |
| | | | |
Repurchase Agreements | | | — | | | | 4,000,000 | | | | — | | | | 4,000,000 | |
| | | | | | | | | | | | | | | | |
| | | | |
Total Investments in Securities | | | — | | | $ | 96,265,409 | | | | — | | | $ | 96,265,409 | |
| | | | | | | | | | | | | | | | |
| † | All municipal bonds held in the Fund are Level 2 securities. For a detailed breakout of municipal bonds by major classification, please refer to the Fund’s Schedule of Portfolio Investments. |
For the period ended December 31, 2023, there were no transfers in or out of Level 3.
The accompanying notes are an integral part of these financial statements.
10
| | |
| | | Statement of Assets and Liabilities December 31, 2023 |
| | | | | |
| | | AMG
GW&K Municipal
Enhanced SMA Shares |
| |
Assets: | | | | | |
| |
Investments at value1 | | | | $96,265,409 | |
| |
Cash | | | | 4,081,362 | |
| |
Interest receivables | | | | 1,105,919 | |
| |
Receivable for Fund shares sold | | | | 159,752 | |
| |
Receivable from affiliate | | | | 13,513 | |
| |
Prepaid expenses and other assets | | | | 7,575 | |
| |
Total assets | | | | 101,633,530 | |
| |
Liabilities: | | | | | |
| |
Payable for investments purchased | | | | 1,443,934 | |
| |
Payable for delayed delivery investments purchased | | | | 2,217,380 | |
| |
Accrued expenses: | | | | | |
| |
Other | | | | 41,906 | |
| |
Total liabilities | | | | 3,703,220 | |
|
Commitments and Contingencies (Notes 2 & 4) | |
| |
Net Assets | | | | $97,930,310 | |
| |
1 Investments at cost | | | | $92,284,424 | |
| |
Net Assets Represent: | | | | | |
| |
Paid-in capital | | | | $93,963,236 | |
| |
Total distributable earnings | | | | 3,967,074 | |
| |
Net Assets | | | | $97,930,310 | |
| |
| | | | | |
| |
Net assets | | | | $97,930,310 | |
| |
Shares outstanding | | | | 9,321,134 | |
| |
Net asset value, offering and redemption price per share | | | | $10.51 | |
The accompanying notes are an integral part of these financial statements.
11
| | |
| | | Statement of Operations For the period ended December 31, 2023 |
| | | | |
| | | AMG
GW&K Municipal
Enhanced SMA Shares1 |
| |
Investment Income: | | | | |
| |
Dividend income | | | $3,306 | |
| |
Interest income | | | 2,001,673 | |
| |
Total investment income | | | 2,004,979 | |
| |
Expenses: | | | | |
| |
Professional fees | | | 40,509 | |
| |
Custodian fees | | | 15,125 | |
| |
Reports to shareholders | | | 13,424 | |
| |
Registration fees | | | 12,189 | |
| |
Trustee fees and expenses | | | 3,487 | |
| |
Transfer agent fees | | | 1,416 | |
| |
Miscellaneous | | | 873 | |
| |
Total expenses before offsets | | | 87,023 | |
| |
Expense reimbursements | | | (87,023 | ) |
| |
Net expenses | | | — | |
| | | | |
| |
Net investment income | | | 2,004,979 | |
| |
Net Realized and Unrealized Gain: | | | | |
| |
Net realized loss on investments | | | (93,911 | ) |
| | | | |
| |
Net change in unrealized appreciation/depreciation on investments | | | 3,980,985 | |
| |
Net realized and unrealized gain | | | 3,887,074 | |
| | | | |
| |
Net increase in net assets resulting from operations | | | $5,892,053 | |
1 Commencement of operations was February 28, 2023.
The accompanying notes are an integral part of these financial statements.
12
| | |
| | | Statement of Changes in Net Assets For the period ended December 31, 2023 |
| | | | | |
| | | AMG
GW&K Municipal
Enhanced SMA Shares1 |
| |
Increase in Net Assets Resulting From Operations: | | | | | |
| |
Net investment income | | | | $2,004,979 | |
| |
Net realized loss on investments | | | | (93,911 | ) |
| |
Net change in unrealized appreciation/depreciation on investments | | | | 3,980,985 | |
| |
Net increase in net assets resulting from operations | | | | 5,892,053 | |
| |
Distributions to Shareholders: | | | | (1,924,979 | ) |
| |
Capital Share Transactions:2 | | | | | |
| |
Net increase from capital share transactions | | | | 93,963,236 | |
| | | | | |
| |
Total increase in net assets | | | | 97,930,310 | |
| |
Net Assets: | | | | | |
| |
Beginning of period | | | | — | |
| |
End of period | | | | $97,930,310 | |
1 Commencement of operations was February 28, 2023.
2 See Note 1(g) of the Notes to Financial Statements.
The accompanying notes are an integral part of these financial statements.
13
| | |
| | | AMG GW&K Municipal Enhanced SMA Shares Financial Highlights For a share outstanding throughout the fiscal period |
| | | | |
| | | For the fiscal
period ended
December 31, | |
| |
| | | 20231 | |
| |
Net Asset Value, Beginning of Period | | | $10.00 | |
| |
Income from Investment Operations: | | | | |
| |
Net investment income2,3 | | | 0.38 | |
| |
Net realized and unrealized gain on investments | | | 0.48 | |
| |
Total income from investment operations | | | 0.86 | |
| |
Less Distributions to Shareholders from: | | | | |
| |
Net investment income | | | (0.35) | |
| |
Net Asset Value, End of Period | | | $10.51 | |
| |
Total Return3,4 | | | 8.81%5 | |
| |
Ratio of net expenses to average net assets | | | 0.00%6 | |
| |
Ratio of gross expenses to average net assets7 | | | 0.20%6 | |
| |
Ratio of net investment income to average net assets3 | | | 4.55%6 | |
| |
Portfolio turnover | | | 12%5,8 | |
| |
Net assets end of period (000’s) omitted | | | $97,930 | |
| | | | | |
| 1 | Commencement of operations was February 28, 2023. |
| 2 | Per share numbers have been calculated using average shares. |
| 3 | Total returns and net investment income would have been lower had certain expenses not been offset. |
| 4 | The total return is calculated using the published Net Asset Value as of period end. |
| 7 | Excludes the impact of expense reimbursement or fee waivers and expense reductions such as brokerage credits, but includes expense repayments and non-reimbursable expenses, if any, such as interest, taxes, and extraordinary expenses. (See Note 1(c) and 2 in the Notes to Financial Statements.) |
| 8 | Portfolio turnover rate excludes securities received from processing a subscription in-kind. |
14
| | |
| | | Notes to Financial Statements December 31, 2023 |
| | | |
| | | |
1. ORGANIZATION AND SUMMARY OF SIGNIFICANT ACCOUNTING POLICIES
AMG Funds (the “Trust”) is an open-end management investment company, organized as a Massachusetts business trust, and registered under the Investment Company Act of 1940, as amended (the “1940 Act”). Currently, the Trust consists of a number of different funds, each having distinct investment management objectives, strategies, risks, and policies. Included in this report is AMG GW&K Municipal Enhanced SMA Shares (“the “Fund”).
The Fund offers a single class of shares for purchase. Shares of the Fund may be purchased only by or on behalf of separately managed account clients where GW&K Investment Management, LLC (“GW&K”), the Fund’s subadviser, has an agreement with sponsors of separately managed account programs (“Program Sponsors”), or directly with the client, to provide management or advisory services to the managed account or to the Program Sponsor for its use in managing such account.
Market prices of investments held by the Fund may fall rapidly or unpredictably due to a variety of economic or political factors, market conditions, disasters or public health issues, or in response to events that affect particular industries or companies.
The Fund’s financial statements are prepared in accordance with accounting principles generally accepted in the United States of America (“U.S. GAAP”), including accounting and reporting guidance pursuant to Accounting Standards Codification Topic 946 applicable to investment companies. U.S. GAAP requires management to make estimates and assumptions that affect the reported amounts of assets and liabilities and disclosure of contingent assets and liabilities at the date of the financial statements and the reported amounts of income and expenses during the reporting period. Actual results could differ from those estimates and such differences could be material. The following is a summary of significant accounting policies followed by the Fund in the preparation of its financial statements:
a. VALUATION OF INVESTMENTS
Fixed income securities purchased with a remaining maturity exceeding 60 days are valued at the evaluated bid price provided by an authorized pricing service or, if an evaluated price is not available, by reference to other securities which are considered comparable in credit rating, interest rate, due date and other features (generally referred to as “matrix pricing”) or other similar pricing methodologies.
Fixed income securities purchased with a remaining maturity of 60 days or less are valued at amortized cost, provided that the amortized cost value is approximately the same as the fair value of the security valued without the use of amortized cost. Investments in other open-end registered investment companies are valued at their end of day net asset value per share.
The Fund’s portfolio investments are generally valued based on independent market quotations or prices or, if none, “evaluative” or other market based valuations provided by third party pricing services. Pursuant to Rule 2a-5 under the 1940 Act, the Fund’s Board of Trustees (the “Board”) designated AMG Funds LLC (the “Investment Manager”) as the Fund’s Valuation Designee to perform the Fund’s fair value determinations. Such determinations are subject to Board oversight and certain reporting and other requirements intended to ensure that the Board receives the information it needs to oversee the Investment Manager’s fair value determinations.
Under certain circumstances, the value of certain Fund portfolio investments may be based on an evaluation of fair value, pursuant to procedures established by the Investment Manager and under the general supervision of the Board. The Fund may use the fair value of a portfolio investment to calculate its net asset value (“NAV”) in the event that the market quotation, price or market based valuation for the portfolio investment is not readily available or otherwise not determinable pursuant to the Fund’s valuation procedures, if the Investment Manager believes the quotation, price or market based valuation to be unreliable, or in certain other circumstances. When determining the fair value of an investment, the Investment Manager seeks to determine the price that the Fund might reasonably expect to receive from current sale of that portfolio investment in an arms-length transaction. Fair value determinations shall be based upon consideration of all available facts and information, including, but not limited to (i) attributes specific to the investment; (ii) fundamental and analytical data relating to the investment; and (iii) the value of other comparable securities or relevant financial instruments, including derivative securities, traded on other markets or among dealers.
The values assigned to fair value portfolio investments are based on available information and do not necessarily represent amounts that might ultimately be realized in the future, since such amounts depend on future developments inherent in long-term investments. Because of the inherent uncertainty of valuation, those estimated values may differ significantly from the values that would have been used had a ready market for the investments existed, and the differences could be material. The Board will be presented with quarterly reports, as of the most recent quarter end, summarizing all fair value activity, material fair value matters that occurred during the quarter, and all outstanding securities fair valued by the Fund. Additionally, the Board will be presented with an annual report that assesses the adequacy and effectiveness of the Investment Manager’s process for determining the fair value of the Fund’s investments.
U.S. GAAP defines fair value as the price that a fund would receive to sell an asset or pay to transfer a liability in an orderly transaction between market participants at the measurement date. U.S. GAAP also establishes a framework for measuring fair value, and a three level hierarchy for fair value measurements based upon the transparency of inputs to the valuation of an asset or liability. Inputs may be observable or unobservable and refer broadly to the assumptions that market participants would use in pricing the asset or liability. Observable inputs reflect the assumptions market participants would use in pricing the asset or liability based on market data obtained from sources independent of the Fund. Unobservable inputs reflect the Fund’s own assumptions about the assumptions that market participants would use in pricing the asset or liability developed based on the best information available in the circumstances. Each investment is assigned a level based upon the observability of the inputs which are significant to the overall valuation.
The three-tier hierarchy of inputs is summarized below:
Level 1 – inputs are quoted prices in active markets for identical investments (e.g., equity securities, open-end investment companies)
Level 2 – other observable inputs (including, but not limited to: quoted prices for similar assets or liabilities in markets that are active, quoted prices for identical or similar assets or liabilities in markets that are not active, inputs other than quoted prices that are observable for the assets or liabilities (such as interest rates, yield curves, volatilities, prepayment speeds, loss severities, credit risks and default rates) or other market corroborated inputs) (e.g., debt securities, government securities, foreign currency exchange contracts, foreign securities utilizing international fair value pricing, fair valued securities with observable inputs)
15
| | |
| | | Notes to Financial Statements (continued) |
| | | |
| | | |
Level 3 – inputs are significant unobservable inputs (including the Fund’s own assumptions used to determine the fair value of investments) (e.g., fair valued securities with unobservable inputs)
Changes in inputs or methodologies used for valuing investments may result in a transfer in or out of levels within the fair value hierarchy. The inputs or methodologies used for valuing investments may not necessarily be an indication of the risk associated with investing in those investments.
b. SECURITY TRANSACTIONS
Security transactions are accounted for as of trade date. Realized gains and losses on securities sold are determined on the basis of identified cost.
c. INVESTMENT INCOME AND EXPENSES
Interest income, which includes amortization of premium and accretion of discount on debt securities, is accrued as earned. Dividend income is recorded on the ex-dividend date and other income and expenses are recorded on an accrual basis. Expenses that cannot be directly attributed to the Fund are apportioned among the funds in the Trust and other trusts or funds within the AMG Funds Family of Funds (collectively, the “AMG Funds Family”) based upon their relative average net assets or number of shareholders.
d. DIVIDENDS AND DISTRIBUTIONS
Fund distributions resulting from net investment income, if any, will normally be declared and paid monthly. Fund distributions resulting from net realized capital gains, if any, will normally be declared and paid at least annually in December. Distributions to shareholders are recorded on the ex-dividend date. Distributions are determined in accordance with federal income tax regulations, which may differ from net investment income and net realized capital gains for financial statement purposes (U.S. GAAP). Differences may be permanent or temporary. Permanent differences are reclassified among capital accounts in the financial statements to reflect their tax character. Permanent book and tax basis differences, if any, relating to shareholder distributions will result in reclassifications to paid-in capital. Temporary differences arise when certain items of income, expense and gain or loss are recognized in different periods for financial statement and tax purposes; these differences will reverse at some time in the future. There were no permanent or temporary differences during the period.
The tax character of distributions paid during the fiscal period ended December 31, 2023 was as follows:
| | | | |
Distributions paid from: | | 2023 | |
| |
Ordinary income * | | | $156,575 | |
| |
Tax-exempt income | | | 1,768,404 | |
| | | | |
| |
| | | $1,924,979 | |
| | | | |
| * | For tax purposes, short-term capital gain distributions, if any, are considered ordinary income distributions. |
As of December 31, 2023, the components of distributable earnings (excluding unrealized appreciation/depreciation) on a tax basis consisted of:
| | | | |
| |
Capital loss carryforward | | | $93,911 | |
| |
Undistributed tax-exempt income | | | 80,000 | |
At December 31, 2023, the cost of investments and the aggregate gross unrealized appreciation and depreciation for federal income tax purposes were as follows:
| | | | | | | | | | | | |
| Cost | | Appreciation | | | Depreciation | | | Net Appreciation | |
| | | |
$92,284,424 | | | $4,010,660 | | | | $(29,675) | | | | $3,980,985 | |
e. FEDERAL TAXES
The Fund currently qualifies as an investment company and intends to comply with the requirements under Subchapter M of the Internal Revenue Code of 1986, as amended (the “Internal Revenue Code”), and to distribute substantially all of its taxable income and gains to its shareholders and to meet certain diversification and income requirements with respect to investment companies. The Investment Manager has analyzed the Fund’s tax positions taken on federal income tax returns as of December 31, 2023, and for all open tax years (generally, the three prior taxable years), and has concluded that no provision for federal income tax is required in the Fund’s financial statements. Additionally, the Investment Manager is not aware of any tax position for which it is reasonably possible that the total amounts of unrecognized tax benefit/detriment will change materially in the next twelve months.
Furthermore, based on the Fund’s understanding of the tax rules and rates related to income, gains and transactions for the foreign jurisdictions in which it invests, the Fund will provide for foreign taxes, and where appropriate, deferred foreign taxes.
f. CAPITAL LOSS CARRYOVERS AND DEFERRALS
As of December 31, 2023, the Fund had capital loss carryovers for federal income tax purposes as shown in the following chart. These amounts may be used to offset future realized capital gains indefinitely, and retain their character as short-term and/or long-term.
| | | | |
| Short-Term | | Long-Term | | Total |
| | |
| $93,911 | | — | | $93,911 |
g. CAPITAL STOCK
The Trust’s Amended and Restated Agreement and Declaration of Trust authorizes for the Fund the issuance of an unlimited number of shares of beneficial interest, without par value. The Fund records sales and repurchases of its capital stock on the trade date. For the fiscal period ended December 31, 2023, the Fund received securities and cash in connection with subscriptions in-kind transactions in the amount of $46,736,183 from a redemption in-kind from the AMG Municipal Enhanced Fund, an affiliated fund, and a related party. For the purposes of U.S. GAAP, the transactions were treated as purchases of securities at a cost equal to the market value of the securities on the date of the transfer.
16
| | |
| | | Notes to Financial Statements (continued) |
| | | |
| | | |
For the fiscal period ended December 31, 2023, the capital stock transactions for the Fund was as follows:
| | | | | | | | |
| |
| | | December 31, 2023 | |
| | | | | | | | |
| | |
| | | Shares | | | Amount | |
| | |
| | | | | | | | |
| | |
Shares sold | | | 9,760,519 | | | | $98,358,593 | 1 |
| | |
Shares issued in reinvestment of distributions | | | 168,047 | | | | 1,683,854 | |
| | |
Shares redeemed | | | (607,432) | | | | (6,079,211) | |
| | | | | | | | |
| | |
Net increase | | | 9,321,134 | | | | $93,963,236 | |
| | | | | | | | |
| 1 | Includes subscriptions in-kind in the amount of $46,736,183. |
h. REPURCHASE AGREEMENTS
The Fund may enter into third-party and bilateral repurchase agreements for temporary cash management purposes. The value of the underlying collateral, including accrued interest, must equal or exceed the value of the repurchase agreements during the term of the agreement. The underlying collateral for all repurchase agreements is held by the Fund’s custodian or at the Federal Reserve Bank. If the seller defaults and the value of the collateral declines, or if bankruptcy proceedings commence with respect to the seller of the security, realization of the collateral by the Fund may be delayed or limited.
At December 31, 2023, the market value of repurchase agreements outstanding was $4,000,000.
i. DELAYED DELIVERY TRANSACTIONS AND WHEN-ISSUED SECURITIES
The Fund may enter into securities transactions on a delayed delivery or when issued basis. Payment and delivery may take place after the customary settlement period for that security. The price of the underlying securities and the date when the securities will be delivered and paid for are fixed at the time the transaction is negotiated. During the time a delayed delivery sell is outstanding, the contract is marked to market daily and equivalent deliverable securities are held for the transaction. The value of the securities purchased on a delayed delivery or when-issued basis are identified as such in the Fund’s Schedule of Portfolio Investments. With respect to purchase commitments, the Fund identifies securities as segregated in its records with a value at least equal to the amount of the commitment. Delayed delivery or when-issued securities that have been purchased from and sold to different brokers are reflected as an investment in securities and a forward sale commitment in the Fund’s Statement of Assets and Liabilities. For financial reporting purposes, the Fund does offset the receivable and payable for delayed delivery investments purchased and sold. Losses may arise due to changes in the value of the underlying securities or if the counterparty does not perform under the contract, or if the issuer does not issue the securities due to political, economic, or other factors.
At December 31, 2023, the market value of delayed delivery securities held in the Fund amounted to $2,285,667.
2. AGREEMENTS AND TRANSACTIONS WITH AFFILIATES
The Trust has entered into an investment advisory agreement under which the Investment Manager, a subsidiary and the U.S. wealth platform of Affiliated
Managers Group, Inc. (“AMG”), serves as investment manager to the Fund and is responsible for the Fund’s overall administration and operations. The Investment Manager selects and recommends, subject to the approval of the Board and, in certain circumstances, shareholders, the Fund’s subadviser and monitors the subadviser’s investment performance, security holdings and investment strategies. The Fund’s investment portfolio is managed by GW&K, who serves as subadviser pursuant to a subadvisory agreement with the Investment Manager. AMG indirectly owns a majority interest in GW&K.
The Fund does not pay advisory fees to the Investment Manager or GW&K. Shareholders should be aware, however, that the Fund is an integral part of separately managed account programs, and the Investment Manager or GW&K will be compensated directly or indirectly by Program Sponsors or program participants for managed account advisory services.
The Investment Manager has contractually agreed, through at least May 1, 2024, to waive fees and/or pay or reimburse the Fund’s expenses in order to limit total annual operating expenses (exclusive of taxes, interest (including interest incurred in connection with bank and custody overdrafts and in connection with securities sold short), brokerage commissions and other transaction costs, dividends payable with respect to securities sold short, acquired fund fees and expenses, and extraordinary expenses) of the Fund to the annual rate of 0.00% of the average daily net assets attributable to the Fund. The contractual expense limitation may only be terminated in the event the Investment Manager or a successor ceases to be the investment manager of the Fund or a successor fund, by mutual agreement between the Investment Manager and the Board or in the event of the Fund’s liquidation unless the Fund is reorganized or is a party to a merger in which the surviving entity is successor to the accounting and performance information of the Fund.
For the fiscal period ended December 31, 2023, the Investment Manager reimbursed the Fund $87,023.
The Trust, on behalf of the Fund, has entered into an amended and restated Administration Agreement under which the Investment Manager serves as the Fund’s administrator (the “Administrator”) and is responsible for certain aspects of managing the Fund’s operations, including administration and shareholder services to the Fund. The Fund does not pay administrative fees to the Investment Manager for these services.
The Fund is distributed by AMG Distributors, Inc. (the “Distributor”), a wholly-owned subsidiary of the Investment Manager. The Distributor serves as the distributor and underwriter for the Fund and is a registered broker-dealer and member of the Financial Industry Regulatory Authority, Inc. (“FINRA”). Shares of the Fund may be purchased only by or on behalf of separately managed account clients where GW&K has an agreement with the Program Sponsor (typically, a registered investment adviser or broker-dealer), or directly with the client, to provide management or advisory services to the managed account. Generally, the Distributor bears all or a portion of the expenses of providing services pursuant to the distribution agreement, including the payment of the expenses relating to the distribution of prospectuses for sales purposes and any advertising or sales literature.
The Board provides supervision of the affairs of the Trust and other trusts within the AMG Funds Family. The Trustees of the Trust who are not affiliated with the Investment Manager receive an annual retainer and per meeting fees for regular, special and telephonic meetings, and they are reimbursed for out-of-pocket expenses incurred while carrying out their duties as Board members. The Chairman of the Board and the Audit Committee Chair receive additional annual
17
| | |
| | | Notes to Financial Statements (continued) |
| | | |
| | | |
retainers. On October 10, 2023, the shareholders of the Trust elected Trustees, including two new Trustees who are not “interested persons” of the Fund within the meaning of the 1940 Act. Certain Trustees and Officers of the Fund are Officers and/or Directors of the Investment Manager, AMG and/or the Distributor.
The Securities and Exchange Commission (the “SEC”) granted an exemptive order that permits certain eligible funds in the AMG Funds Family to lend and borrow money for certain temporary purposes directly to and from other eligible funds in the AMG Funds Family. Participation in this interfund lending program is voluntary for both the borrowing and lending funds, and an interfund loan is only made if it benefits each participating fund. The Administrator manages the program according to procedures approved by the Board, and the Board monitors the operation of the program. An interfund loan must comply with certain conditions set out in the exemptive order, which are designed to assure fairness and protect all participating funds. The interest earned and interest paid on interfund loans are included on the Statement of Operations as interest income and interest expense, respectively. At December 31, 2023, the Fund had no interfund loans outstanding.
The Fund utilized the interfund loan program during the fiscal period ended December 31, 2023 as follows:
| | | | | | | | | | | | | | | | | | | | | | | | |
Average Lent | | Number
of Days | | | | | | Interest
Earned | | | | | | Average
Interest Rate | | | | |
| | | | | | |
$1,173,168 | | | 13 | | | | | | | | $2,538 | | | | | | | | 6.075% | | | | | |
3. PURCHASES AND SALES OF SECURITIES
Purchases and sales of securities (excluding short-term securities and U.S. Government Obligations) for the fiscal period ended December 31, 2023, were $49,745,596 and $5,758,118, respectively.
The Fund had no purchases or sales of U.S. Government Obligations during the fiscal period ended December 31, 2023.
4. COMMITMENTS AND CONTINGENCIES
Under the Trust’s organizational documents, its Trustees and Officers are indemnified against certain liabilities arising out of the performance of their duties to the Trust. In addition, in the normal course of business, the Fund may enter into contracts and agreements that contain a variety of representations and warranties, which provide general indemnifications. The maximum exposure to the Fund under these arrangements is unknown, as this would involve future claims that may be made against the Fund that have not yet occurred. However, based on experience, the Fund had no prior claims or losses and expects the risks of loss to be remote.
5. RISKS ASSOCIATED WITH HIGH YIELD SECURITIES
Investing in high yield securities involves greater risks and considerations not typically associated with U.S. Government and other high quality/investment grade securities. High yield securities are generally below investment grade securities and do not have an established retail secondary market. Economic downturns may disrupt the high yield market and impair the issuer’s ability to repay principal and interest. Also, an increase in interest rates would likely have an adverse impact on the value of such obligations and could cause the securities to become less liquid.
6. MASTER NETTING AGREEMENTS
The Fund may enter into master netting agreements with its counterparties for repurchase agreements, which provide the right, in the event of default (including bankruptcy or insolvency) for the non-defaulting party to liquidate the collateral and calculate net exposure to the defaulting party or request additional collateral. For financial reporting purposes, the Fund does not offset financial assets and financial liabilities that are subject to master netting agreements in the Statement of Assets and Liabilities.
The following table is a summary of the Fund’s open Repurchase Agreements that are subject to a master netting agreement as of December 31, 2023:
| | | | | | | | | | | | |
| | | |
| | | | | Gross Amount Not Offset in the Statement of Assets and Liabilities | | |
| | | | | | |
| | | Gross Amounts of Assets Presented in
the Statement of Assets and Liabilities | | Offset Amount | | Net Asset Balance | | Collateral
Received | | | | Net
Amount |
| | | | | | |
| | | | | | | | | | | | |
| | | | | | |
Fixed Income Clearing Corp. | | $4,000,000 | | — | | $4,000,000 | | $4,000,000 | | | | — |
7. SUBSEQUENT EVENTS
The Fund has determined that no material events or transactions occurred through the issuance date of the Fund’s financial statements which require an additional disclosure in or adjustment of the Fund’s financial statements.
18
| | |
| | | Report of Independent Registered Public Accounting Firm |
| | | |
| | | |
To the Board of Trustees of AMG Funds and Shareholders of AMG GW&K Municipal Enhanced SMA Shares
Opinion on the Financial Statements
We have audited the accompanying statement of assets and liabilities, including the schedule of portfolio investments, of AMG GW&K Municipal Enhanced SMA Shares (one of the funds constituting AMG Funds, referred to hereafter as the “Fund”) as of December 31, 2023, and the related statements of operations and changes in net assets, including the related notes, and the financial highlights for the period February 28, 2023 (commencement of operations) through December 31, 2023 (collectively referred to as the “financial statements”). In our opinion, the financial statements present fairly, in all material respects, the financial position of the Fund as of December 31, 2023, and the results of its operations, changes in its net assets, and the financial highlights for the period February 28, 2023 (commencement of operations) through December 31, 2023 in conformity with accounting principles generally accepted in the United States of America.
Basis for Opinion
These financial statements are the responsibility of the Fund’s management. Our responsibility is to express an opinion on the Fund’s financial statements based on our audit. We are a public accounting firm registered with the Public Company Accounting Oversight Board (United States) (PCAOB) and are required to be independent with respect to the Fund in accordance with the U.S. federal securities laws and the applicable rules and regulations of the Securities and Exchange Commission and the PCAOB.
We conducted our audit of these financial statements in accordance with the standards of the PCAOB. Those standards require that we plan and perform the audit to obtain reasonable assurance about whether the financial statements are free of material misstatement, whether due to error or fraud.
Our audit included performing procedures to assess the risks of material misstatement of the financial statements, whether due to error or fraud, and performing procedures that respond to those risks. Such procedures included examining, on a test basis, evidence regarding the amounts and disclosures in the financial statements. Our audit also included evaluating the accounting principles used and significant estimates made by management, as well as evaluating the overall presentation of the financial statements. Our procedures included confirmation of securities owned as of December 31, 2023 by correspondence with the custodian and brokers; when replies were not received from brokers, we performed other auditing procedures. We believe that our audit provides a reasonable basis for our opinion.
/s/ PricewaterhouseCoopers LLP
Boston, Massachusetts
February 27, 2024
We have served as the auditor of one or more investment companies in the AMG Funds Family since 1993.
19
| | |
| | | Other Information (unaudited) |
| | | |
| | | |
TAX INFORMATION
AMG GW&K Municipal Enhanced SMA Shares hereby designates the maximum amount allowable of its net taxable income as qualified dividends as provided in the Jobs and Growth Tax Relief Reconciliation Act of 2003. The 2023 Form 1099-DIV you receive for the Fund will show the tax status of all distributions paid to you during the year.
Pursuant to section 852 of the Internal Revenue Code, AMG GW&K Municipal Enhanced SMA Shares hereby designates $0 as a capital gain distribution with respect to the taxable year ended December 31, 2023, or if subsequently determined to be different, the net capital gains of such fiscal year.
PROXY VOTE
A special meeting of the shareholders of AMG Funds (the “Trust”) was held on October 10, 2023, to vote on a proposal to elect trustees to the Board of Trustees of the Trust. The proposal and results of the vote are described below. Jill R. Cuniff, Kurt A. Keilhacker, Peter W. MacEwen, Steven J. Paggioli, Eric Rakowski, Victoria L. Sassine and Garret W. Weston were elected by shareholders at the special meeting on October 10, 2023. Bruce B. Bingham, an incumbent Trustee, served as a Trustee of the Trust until his retirement on December 31, 2023.
| | | | | | | | | | | | |
| AMG Funds | | All Funds in Trust* | |
| | | |
| Election of Trustees 1 | | For | | | | | | Withheld | |
| | | |
Jill R. Cuniff | | | 523,453,201 | | | | | | | | 50,330,270 | |
| | | |
Kurt A. Keilhacker | | | 563,642,997 | | | | | | | | 10,140,474 | |
| | | |
Peter W. MacEwen | | | 523,551,974 | | | | | | | | 50,231,497 | |
| | | |
Steven J. Paggioli | | | 561,225,673 | | | | | | | | 12,557,798 | |
| | | |
Eric Rakowski | | | 561,230,560 | | | | | | | | 12,552,911 | |
| | | |
Victoria L. Sassine | | | 563,668,874 | | | | | | | | 10,114,597 | |
| | | |
Garret W. Weston | | | 564,280,150 | | | | | | | | 9,503,321 | |
1 Ms. Cuniff and Mr. MacEwen were newly elected to the Board of Trustees on October 10, 2023; Messrs. Keilhacker, Paggioli, Rakowski, and Weston and Ms. Sassine are incumbent Trustees.
*Rounded to the nearest share.
20
| | |
| | | AMG Funds Trustees and Officers |
| | | |
| | | |
| | | | | | | | |
| The Trustees and Officers of the Trust, their business addresses, principal occupations for the past five years and ages are listed below. The Trustees provide broad supervision over the affairs of the Trust and the Fund. The Trustees are experienced executives who meet periodically throughout the year to oversee the Fund’s activities, review contractual arrangements with companies that provide services to the Fund, and | | | | review the Fund’s performance. Unless otherwise noted, the address of each Trustee or Officer is the address of the Trust: 680 Washington Blvd., Suite 500, Stamford, CT. 06901. There is no stated term of office for Trustees. Trustees serve until their resignation, retirement or removal in accordance with the Trust’s organizational documents and policies adopted by the Board from time to time. | | | | The Chairman of the Board, the President, the Treasurer and the Secretary and such other Officers as the Trustees may in their discretion from time to time elect each hold office until his or her successor is elected and qualified, or until he or she sooner dies, resigns, is removed or becomes disqualified. Each Officer holds office at the pleasure of the Trustees. |
| | | | | | | | | |
Independent Trustees
The following Trustees are not “interested persons” of the Trust within the meaning of the 1940 Act:
| | |
Number of Funds Overseen in Fund Complex | | Name, Age, Principal Occupation(s) During Past 5 Years and Other Directorships Held by Trustee |
| | |
• Trustee since 2012 • Oversees 37 Funds in Fund Complex | | Bruce B. Bingham, 75* Partner, Hamilton Partners (real estate development firm) (1987-Present); Director of The Yacktman Funds, Inc. (2 portfolios) (2000-2012). |
| | |
• Trustee since 2023 • Oversees 37 Funds in Fund Complex | | Jill R. Cuniff, 59** Director of Harding, Loevner Funds, Inc. (12 portfolios) (2018-Present); Retired (2016-Present); President & Portfolio Manager, Edge Asset Management (2009-2016); President & Chief Investment Officer, Morley Financial Services (2001-2009); President, Union Bond & Trust Company (2001-2009). |
| | |
• Trustee since 2013 • Chairman of the Audit Committee since 2021 • Oversees 39 Funds in Fund Complex | | Kurt A. Keilhacker, 60 Managing Partner, Elementum Ventures (2013-Present); Managing Partner, TechFund Europe (2000-Present); Managing Partner, TechFund Capital (1997-Present); Adjunct Professor, University of San Francisco (2022-Present); Trustee, Wheaton College (2018-Present); Director, Wheaton College Trust Company, N.A. (2018-Present). |
| | |
• Trustee since 2023 • Oversees 37 Funds in Fund Complex | | Peter W. MacEwen, 59** Private investor (2019-Present); Affiliated Managers Group, Inc. (2003-2018): Chief Administrative Officer, Office of the CEO (2013-2018); Senior Vice President, Finance (2007-2013); Vice President, Finance (2003-2007). |
| | |
• Trustee since 2004 • Oversees 37 Funds in Fund Complex | | Steven J. Paggioli, 73 Independent Consultant (2002-Present); Trustee, Professionally Managed Portfolios (28 portfolios); Independent Director, Muzinich BDC, Inc. (business development company) (2019-Present); Director, The Wadsworth Group; Independent Director, Chase Investment Counsel (2008–2019); Executive Vice President, Secretary and Director, Investment Company Administration, LLC and First Fund Distributors, INC. (1990-2001). |
| | |
• Independent Chairman of the Board of Trustees since 2017 • Chairman of the Governance Committee since 2017 • Trustee since 1999 • Oversees 39 Funds in Fund Complex | | Eric Rakowski, 65 Professor of Law, University of California at Berkeley School of Law (1990-Present); Tax Attorney at Davis Polk & Wardwell and clerked for Judge Harry T. Edwards of the U.S. Court of Appeals for the District of Columbia Circuit and for Justice William J. Brennan Jr. of the U.S. Supreme Court; Trustee of Parnassus Funds (4 portfolios) (2021-Present); Trustee of Parnassus Income Funds (2 portfolios) (2021-Present); Director of Harding, Loevner Funds, Inc. (10 portfolios); Trustee of Third Avenue Trust (3 portfolios) (2002-2019); Trustee of Third Avenue Variable Trust (1 portfolio) (2002-2019). |
| | |
• Trustee since 2013 • Oversees 39 Funds in Fund Complex | | Victoria L. Sassine, 58 Adjunct Professor, Babson College (2007–Present); Director, Board of Directors, PRG Group (2017-Present); CEO, Founder, Scale Smarter Partners, LLC (2018-Present); Adviser, EVOFEM Biosciences (2019-Present); Chairperson of the Board of Directors of Business Management Associates (2018-2019). |
*Mr. Bingham retired from the Board of Trustees of AMG Funds on December 31, 2023.
**Ms. Cuniff and Mr. MacEwen were elected to the Board of Trustees by the shareholders of AMG Funds on October 10, 2023.
21
| | |
| | | AMG Funds Trustees and Officers (continued) |
| | | |
| | | |
Interested Trustee
The Trustee in the following table is an “interested person” of the Trust within the meaning of the 1940 Act.
| | |
Number of Funds Overseen in Fund Complex | | Name, Age, Principal Occupation(s) During Past 5 Years and Other Directorships Held by Trustee |
| | |
• Trustee since 2021 • Oversees 39 Funds in Fund Complex | | Garret W. Weston, 42 Affiliated Managers Group, Inc. (2008-Present): Managing Director, Head of Affiliate Product Strategy and Development (2023-Present), Managing Director, Co-Head of Affiliate Engagement, Distribution (2021-2022), Senior Vice President, Office of the CEO (2019-2021), Senior Vice President, Affiliate Development (2016-2019), Vice President, Office of the CEO (2015-2016), Vice President, New Investments (2008-2015); Associate, Madison Dearborn Partners (2006-2008); Analyst, Merrill Lynch (2004-2006). |
Officers
| | |
Position(s) Held with Fund and Length of Time Served | | Name, Age, Principal Occupation(s) During Past 5 Years |
| | |
• President since 2018 • Principal Executive Officer since 2018 • Chief Executive Officer since 2018 • Chief Operating Officer since 2007 | | Keitha L. Kinne, 65 Managing Director, Head of Platform and Operations, AMG Funds LLC (2023-Present); Chief Operating Officer, AMG Funds LLC (2007-Present); Chief Investment Officer, AMG Funds LLC (2008-Present); President and Principal, AMG Distributors, Inc. (2018-Present); Chief Operating Officer, AMG Distributors, Inc. (2007-Present); President, Chief Executive Officer and Principal Executive Officer, AMG Funds, AMG Funds I, AMG Funds II, AMG Funds III and AMG Funds IV (2018-Present); Chief Operating Officer, AMG Funds, AMG Funds I, AMG Funds II, and AMG Funds III (2007-Present); Chief Operating Officer, AMG Funds IV (2016-Present); Chief Operating Officer and Chief Investment Officer, Aston Asset Management, LLC (2016); President and Principal Executive Officer, AMG Funds, AMG Funds I, AMG Funds II and AMG Funds III (2012-2014); Managing Partner, AMG Funds LLC (2007-2014); President and Principal, AMG Distributors, Inc. (2012-2014); Managing Director, Legg Mason & Co., LLC (2006-2007); Managing Director, Citigroup Asset Management (2004-2006). |
| | |
• Secretary since 2015 • Chief Legal Officer since 2015 | | Mark J. Duggan, 58 Managing Director and Senior Counsel, AMG Funds LLC (2021-Present); Senior Vice President and Senior Counsel, AMG Funds LLC (2015-2021); Secretary and Chief Legal Officer, AMG Funds, AMG Funds I, AMG Funds II, AMG Funds III and AMG Funds IV (2015-Present); Attorney, K&L Gates, LLP (2009-2015). |
| | |
• Chief Financial Officer since 2017 • Treasurer since 2017 • Principal Financial Officer since 2017 • Principal Accounting Officer since 2017 | | Thomas G. Disbrow, 57 Vice President, Mutual Fund Treasurer & CFO, AMG Funds, AMG Funds LLC (2017-Present); Chief Financial Officer, Principal Financial Officer, Treasurer and Principal Accounting Officer, AMG Funds, AMG Funds I, AMG Funds II, AMG Funds III and AMG Funds IV (2017-Present); Managing Director - Global Head of Traditional Funds Product Control, UBS Asset Management (Americas), Inc. (2015-2017); Managing Director - Head of North American Funds Treasury, UBS Asset Management (Americas), Inc. (2011-2015). |
| | |
• Deputy Treasurer since 2017 | | John A. Starace, 53 Vice President, Mutual Fund Accounting, AMG Funds LLC (2021-Present); Director, Mutual Fund Accounting, AMG Funds LLC (2017-2021); Vice President, Deputy Treasurer of Mutual Funds Services, AMG Funds LLC (2014-2017); Deputy Treasurer, AMG Funds, AMG Funds I, AMG Funds II, AMG Funds III and AMG Funds IV (2017-Present); Vice President, Citi Hedge Fund Services (2010-2014); Audit Senior Manager (2005-2010) and Audit Manager (2001-2005), Deloitte & Touche LLP. |
| | |
• Chief Compliance Officer and Sarbanes-Oxley Code of Ethics Compliance Officer since 2019 • Anti-Money Laundering Compliance Officer since 2022 | | Patrick J. Spellman, 49 Vice President, Chief Compliance Officer, AMG Funds LLC (2017-Present); Chief Compliance Officer, AMG Distributors, Inc. (2010-Present); Chief Compliance Officer and Sarbanes-Oxley Code of Ethics Compliance Officer, AMG Funds, AMG Funds I, AMG Funds II, AMG Funds III and AMG Funds IV (2019-Present); Anti-Money Laundering Compliance Officer, AMG Funds, AMG Funds I, AMG Funds II, and AMG Funds III (2014-2019; 2022-Present); Anti-Money Laundering Compliance Officer, AMG Funds IV (2016-2019; 2022-Present); Senior Vice President, Chief Compliance Officer, AMG Funds LLC (2011-2017); Compliance Manager, Legal and Compliance, Affiliated Managers Group, Inc. (2005-2011). |
| | |
• Assistant Secretary since 2016 | | Maureen M. Kerrigan, 38 Vice President, Senior Counsel, AMG Funds LLC (2021-Present); Vice President, Counsel, AMG Funds LLC (2019-2021); Director, Counsel, AMG Funds LLC (2017-2018); Vice President, Counsel, AMG Funds LLC (2015-2017); Assistant Secretary, AMG Funds, AMG Funds I, AMG Funds II, AMG Funds III and AMG Funds IV (2016-Present); Associate, Ropes & Gray LLP (2011-2015); Law Fellow, Massachusetts Appleseed Center for Law and Justice (2010-2011). |
22
THIS PAGE INTENTIONALLY LEFT BLANK
THIS PAGE INTENTIONALLY LEFT BLANK
THIS PAGE INTENTIONALLY LEFT BLANK
| | | | | | | | | | | | |
INVESTMENT MANAGER AND ADMINISTRATOR AMG Funds LLC 680 Washington Blvd., Suite 500 Stamford, CT 06901 800.548.4539 DISTRIBUTOR AMG Distributors, Inc. 680 Washington Blvd., Suite 500 Stamford, CT 06901 800.548.4539 SUBADVISER GW&K Investment Management, LLC 222 Berkeley St. Boston, MA 02116 | | | | | | CUSTODIAN The Bank of New York Mellon Mutual Funds Custody 6023 Airport Road Oriskany, NY 13424 LEGAL COUNSEL Ropes & Gray LLP Prudential Tower, 800 Boylston Street Boston, MA 02199-3600 TRANSFER AGENT BNY Mellon Investment Servicing (US) Inc. AMG Funds Attn: 534426 AIM 154-0520 500 Ross Street Pittsburgh, PA 15262 800.548.4539 | | | | | | This report is prepared for the Fund’s shareholders. It is authorized for distribution to prospective investors only when preceded or accompanied by an effective prospectus. To receive a free copy of the prospectus or Statement of Additional Information, which includes additional information about Fund Trustees, please contact us by calling 800.548.4539. Distributed by AMG Distributors, Inc., member FINRA/SIPC. Current net asset values per share for the Fund are available on the Fund’s website at wealth.amg.com. A description of the policies and procedures the Fund uses to vote its proxies is available: (i) without charge, upon request, by calling 800.548.4539, or (ii) on the Securities and Exchange Commission’s (SEC) website at sec.gov. For information regarding the Fund’s proxy voting record for the 12-month period ended June 30, call 800.548.4539 or visit the SEC website at sec.gov. The Fund files its complete schedule of portfolio holdings with the SEC for the first and third quarters of each fiscal year as an exhibit to its reports on Form N-PORT. The Fund’s portfolio holdings on Form N-PORT are available on the SEC’s website at sec.gov and the Fund’s website at wealth.amg.com. To review a complete list of the Fund’s portfolio holdings, or to view the most recent semi-annual report or annual report, please visit wealth.amg.com. |
Registrant has adopted a Code of Ethics. See attached Exhibit (a)(1).
| Item 3. | AUDIT COMMITTEE FINANCIAL EXPERT |
Registrant’s Board of Trustees has determined that independent Trustee Mr. Steven J. Paggioli qualifies as an Audit Committee Financial Expert. Mr. Paggioli is “independent” as such term is defined in Form N-CSR.
| Item 4. | PRINCIPAL ACCOUNTANT FEES AND SERVICES |
(a) Audit Fees
The aggregate fees billed by the Funds’ independent registered public accounting firm, PricewaterhouseCoopers LLP (“PwC”), to the Funds for the Funds’ two most recent fiscal years for professional services rendered for audits of annual financial statements, or services that are normally provided in connection with statutory and regulatory filings or engagements (“Audit Fees”) were as follows:
| | | | | | | | |
Fund - AMG Funds | | Fiscal 2023 | | | Fiscal
2022 | |
AMG GW&K Municipal Enhanced Yield Fund | | $ | 34,220 | | | $ | 35,531 | |
AMG GW&K Small Cap Core Fund | | $ | 32,460 | | | $ | 30,944 | |
AMG GW&K Municipal Bond Fund | | $ | 47,904 | | | $ | 47,220 | |
AMG GW&K Small/Mid Cap Core Fund | | $ | 36,332 | | | $ | 34,064 | |
AMG GW&K Small Cap Value Fund | | $ | 33,826 | | | $ | 32,631 | |
AMG TimesSquare Mid Cap Growth Fund | | $ | 39,299 | | | $ | 39,048 | |
AMG TimesSquare Small Cap Growth Fund | | $ | 33,860 | | | $ | 33,298 | |
AMG TimesSquare International Small Cap Fund | | $ | 31,600 | | | $ | 32,709 | |
AMG TimesSquare Emerging Markets Small Cap Fund | | $ | 31,653 | | | $ | 30,527 | |
AMG TimesSquare Global Small Cap Fund | | $ | 27,064 | | | $ | 26,089 | |
AMG Renaissance Large Cap Growth Fund | | $ | 27,473 | | | $ | 26,158 | |
AMG Yacktman Focused Fund | | $ | 66,954 | | | $ | 63,822 | |
AMG Yacktman Fund | | $ | 108,395 | | | $ | 101,012 | |
AMG Yacktman Special Opportunities Fund | | $ | 30,139 | | | $ | 29,042 | |
AMG Yacktman Global Fund | | $ | 30,086 | | | $ | 28,667 | |
AMG GW&K Municipal Enhanced SMA Shares | | $ | 31,039 | | | $ | 0 | |
(b) Audit-Related Fees
There were no fees billed by PwC to the Funds in their two most recent fiscal years for services rendered for assurance and related services that are reasonably related to the performance of the audit or review of the Funds’ financial statements, but are not reported as Audit Fees (“Audit-Related Fees”).
For the Funds’ two most recent fiscal years, there were no Audit-Related Fees billed by PwC for engagements related directly to the operations and financial reporting of one or more Funds by a Fund Service Provider. A Fund Service Provider is (a) any investment adviser to the Fund (not including any Subadviser whose role is primarily portfolio management and is subcontracted with or overseen by another investment adviser) or (b) any entity that provides ongoing services to the Fund and is controlling, controlled by or under common control with a Fund investment adviser described in (a).
(c) Tax Fees
The aggregate fees billed by PwC to the Funds for the two most recent fiscal years for professional services rendered for tax compliance, tax advice, and tax planning (“Tax Fees”) were as follows:
| | | | | | | | |
Fund - AMG Funds | | Fiscal 2023 | | | Fiscal
2022 | |
AMG GW&K Municipal Enhanced Yield Fund | | $ | 7,030 | | | $ | 6,760 | |
AMG GW&K Small Cap Core Fund | | $ | 7,030 | | | $ | 6,760 | |
AMG GW&K Municipal Bond Fund | | $ | 7,030 | | | $ | 6,760 | |
AMG GW&K Small/Mid Cap Core Fund | | $ | 7,030 | | | $ | 7,760 | |
AMG GW&K Small Cap Value Fund | | $ | 7,030 | | | $ | 6,760 | |
AMG TimesSquare Mid Cap Growth Fund | | $ | 7,030 | | | $ | 6,760 | |
AMG TimesSquare Small Cap Growth Fund | | $ | 7,030 | | | $ | 6,760 | |
AMG TimesSquare International Small Cap Fund | | $ | 8,370 | | | $ | 8,050 | |
AMG TimesSquare Emerging Markets Small Cap Fund | | $ | 8,370 | | | $ | 8,050 | |
AMG TimesSquare Global Small Cap Fund | | $ | 8,370 | | | $ | 8,050 | |
AMG Renaissance Large Cap Growth Fund | | $ | 7,030 | | | $ | 7,760 | |
AMG Yacktman Focused Fund | | $ | 7,030 | | | $ | 7,760 | |
AMG Yacktman Fund | | $ | 7,030 | | | $ | 7,760 | |
AMG Yacktman Special Opportunities Fund | | $ | 7,030 | | | $ | 7,760 | |
AMG Yacktman Global Fund | | $ | 8,370 | | | $ | 8,050 | |
AMG GW&K Municipal Enhanced SMA Shares | | $ | 7,030 | | | $ | 0 | |
For the Funds’ two most recent fiscal years, Tax Fees billed by PwC for engagements by Fund Service Providers that related directly to the operations and financial reporting of the Funds were $0 for fiscal 2023 and $0 for fiscal 2022, respectively.
The services for which Tax Fees were charged comprise all services performed by professional staff in PwC’s tax division except those services related to the audit. Typically, this category would include fees for tax compliance, tax planning, and tax advice. Tax compliance, tax advice, and tax planning services include preparation of original and amended tax returns, claims for refund and tax payment-planning services, assistance with tax audits and appeals, tax advice related to mergers and acquisitions and requests for rulings or technical advice from taxing authorities.
(d) All Other Fees
There were no other fees billed by PwC to the Funds for all other non-audit services (“Other Fees”) during the Funds’ two most recent fiscal years. During the same period, there were no Other Fees billed by PwC for engagements by Fund Service Providers that related directly to the operations and financial reporting of the Funds.
(e)(1)According to policies adopted by the Audit Committee, services provided by PwC to the Funds must be pre-approved by the Audit Committee. On an annual basis, the Audit Committee reviews and pre-approves various types of services that PwC may perform for the Funds without specific approval of each engagement, subject to specified budget limitations. As contemplated by the Sarbanes-Oxley Act of 2002 and related SEC rules, the Audit Committee also pre-approves non-audit services provided by PwC to any Fund Service Provider for any engagement that relates directly to the operations and financial reporting of the Funds. Any engagement that is not already pre-approved or that will exceed a pre-approved budget must be submitted to the Audit Committee for pre-approval. The Chairman of the Audit Committee is authorized on behalf of the Board of Trustees and the Audit Committee to approve the engagement of PwC to perform non-audit services subject to certain conditions, including notification to the Audit Committee of such pre-approval not later than the next meeting of the Audit Committee following the date of such pre-approval.
(e)(2) None.
(f) Not applicable.
(g) The aggregate fees billed by PwC in 2023 and 2022 for non-audit services rendered to the Funds and Fund Service Providers were $157,840 and $147,560, respectively. For the fiscal year ended December 31, 2023, this amount reflects the amounts disclosed above in Item 4(b),(c),(d), plus $40,000 in fees billed to the Fund Service Providers for non-audit services that did not relate directly to the operations and financial reporting of the Funds. For the fiscal year ended December 31, 2022, this amount reflects the amounts disclosed above in Item 4(b),(c),(d), plus $36,000 in additional fees billed to the Fund Service Providers for non-audit services that did not relate directly to the operations and financial reporting of the Funds.
(h) The Trust’s Audit Committee has considered whether the provision of non-audit services by registrant’s independent registered public accounting firm to the registrant’s investment adviser, and any entity controlling, controlled by, or under common control with the investment adviser that provided ongoing services to the registrant that were not pre-approved by the Committee (because such services did not relate directly to the operations and financial reporting of the registrant) was compatible with maintaining the independence of the independent registered public accounting firm.
| Item 5. | AUDIT COMMITTEE OF LISTED REGISTRANTS |
Not applicable.
| Item 6. | SCHEDULE OF INVESTMENTS |
The schedule of investments in securities of unaffiliated issuers as of the close of the reporting period is included as part of the report to shareholders filed under Item 1 of this form.
| Item 7. | DISCLOSURE OF PROXY VOTING POLICIES AND PROCEDURES FOR CLOSED-END MANAGEMENT INVESTMENT COMPANIES |
Not applicable.
| Item 8. | PORTFOLIO MANAGERS OF CLOSED-END MANAGEMENT INVESTMENT COMPANIES |
Not applicable.
| Item 9. | PURCHASES OF EQUITY SECURITIES BY CLOSED-END MANAGEMENT INVESTMENT COMPANIES AND AFFILIATED PURCHASERS |
Not applicable.
| Item 10. | SUBMISSION OF MATTERS TO A VOTE OF SECURITY HOLDERS |
Not applicable.
| Item 11. | CONTROLS AND PROCEDURES |
(a) The Registrant’s principal executive and principal financial officers have concluded, based on their evaluation of the registrant’s disclosure controls and procedures as of a date within 90 days of the filing of this report, that the Registrant’s disclosure controls and procedures are reasonably designed to ensure that information required to be disclosed by the Registrant on Form N-CSR is recorded, processed, summarized and reported within the required time periods and that information required to be disclosed by the registrant in the reports that it files or submits on Form N-CSR is accumulated and communicated to the Registrant’s management, including its principal executive and principal financial officers, as appropriate to allow timely decisions regarding required disclosure.
(b) There were no changes in the Registrant’s internal control over financial reporting during the period covered by this report that have materially affected, or are reasonably likely to materially affect, the internal control over financial reporting.
| Item 12. | DISCLOSURE OF SECURITIES LENDING ACTIVITIES FOR CLOSED-END MANAGEMENT INVESTMENT COMPANIES |
Not applicable.
SIGNATURES
Pursuant to the requirements of the Securities Exchange Act of 1934 and the Investment Company Act of 1940, the registrant has duly caused this report to be signed on its behalf by the undersigned, thereunto duly authorized.
AMG FUNDS
| | |
| By: | | /s/ Keitha L. Kinne |
| | Keitha L. Kinne, Principal Executive Officer |
| |
| Date: | | March 7, 2024 |
Pursuant to the requirements of the Securities Exchange Act of 1934 and the Investment Company Act of 1940, this report has been signed below by the following persons on behalf of the registrant and in the capacities and on the dates indicated.
| | |
| By: | | /s/ Keitha L. Kinne |
| | Keitha L. Kinne, Principal Executive Officer |
| |
| Date: | | March 7, 2024 |
| |
| By: | | /s/ Thomas Disbrow |
| | Thomas Disbrow, Principal Financial Officer |
| |
| Date: | | March 7, 2024 |