UNITED STATES
SECURITIES AND EXCHANGE COMMISSION
Washington, D.C. 20549
Form N-CSR
CERTIFIED SHAREHOLDER REPORT OF
REGISTERED MANAGEMENT INVESTMENT COMPANIES
Investment Company Act file number: 811-09477
Voya Variable Insurance Trust
(Exact name of registrant as specified in charter)
| 7337 East Doubletree Ranch Road, Suite 100, Scottsdale, AZ | | 85258 |
| (Address of principal executive offices) | | (Zip code) |
The Corporation Trust Company, 1209 Orange Street, Wilmington, DE 19801
(Name and address of agent for service)
Registrant’s telephone number, including area code: 1-800-992-0180
Date of fiscal year end: December 31
Date of reporting period: December 31, 2021
Item 1. Reports to Stockholders.
The following is a copy of the report transmitted to stockholders pursuant to Rule 30e-1 under the Act (17 CFR 270.30e-1):
Annual Report
December 31, 2021
Voya Investors Trust | | Voya Variable Insurance Trust |
| ■ | | VY® BlackRock Inflation Protected Bond Portfolio
Classes ADV, I and S | | ■ | VY® BrandywineGLOBAL — Bond Portfolio |
As permitted by regulations adopted by the U.S. Securities and Exchange Commission, paper copies of each portfolio’s annual and semi-annual shareholder reports, like this annual report, are not sent by mail, unless you specifically request paper copies of the reports. Instead, the reports will be made available on a website and you will be notified by mail each time a report is posted and provided with a website link to access the report.
If you already elected to receive shareholder reports electronically, you need not take any action. You may elect to receive shareholder reports and other communications from your insurance carrier electronically by contacting them directly.
You may elect to receive all future reports in paper free of charge. If you received this document in the mail, please follow the instructions provided to elect to continue receiving paper copies of your shareholder reports. You can inform us that you wish to continue receiving paper copies by calling 1-866-345-5954. Your election to receive reports in paper will apply to all the funds in which you invest. |
| This report is submitted for general information to shareholders of the Voya mutual funds. It is not authorized for distribution to prospective shareholders unless accompanied or preceded by a prospectus which includes details regarding the funds’ investment objectives, risks, charges, expenses and other information. This information should be read carefully. |
INVESTMENT MANAGEMENT
voyainvestments.com |  |
TABLE OF CONTENTS
| | | | | 1 | |
| | | | | 3 | |
| | | | | 8 | |
| | | | | 9 | |
| | | | | 10 | |
| | | | | 12 | |
| | | | | 13 | |
| | | | | 14 | |
| | | | | 15 | |
| | | | | 28 | |
| | | | | 56 | |
| | | | | 57 | |
| | | | | 61 | |
PROXY VOTING INFORMATION
A description of the policies and procedures that the Portfolios use to determine how to vote proxies related to portfolio securities is available: (1) without charge, upon request, by calling Shareholder Services toll-free at (800) 992-0180; (2) on the Portfolios’ website at www.voyainvestments.com; and (3) on the U.S. Securities and Exchange Commission’s (“SEC’s”) website at www.sec.gov. Information regarding how the Portfolios voted proxies related to portfolio securities during the most recent 12-month period ended June 30 is available without charge on the Portfolios’ website at www.voyainvestments.com and on the SEC’s website at www.sec.gov.
QUARTERLY PORTFOLIO HOLDINGS
The Portfolios file their complete schedule of portfolio holdings with the SEC for the first and third quarters of each fiscal year on Form NPORT-P. The Portfolios’ Forms NPORT-P are available on the SEC’s website at www.sec.gov. Each Portfolio’s complete schedule of portfolio holdings is available at: www.voyainvestments.com and without charge upon request from the Portfolio by calling Shareholder Services toll-free at (800) 992-0180.
(THIS PAGE INTENTIONALLY LEFT BLANK)
PRESIDENT’S LETTER

A Solid Year Ends for the Financial Markets, Gauging the Policy Shifts to Come
Dear Shareholder,
The 12-month period ended December 31, 2021, marked another strong year for stocks. Forcefully accommodative and persistent monetary and fiscal policy, along with the COVID-19 vaccine rollouts and an impressively adaptable global economy, drove big gains within risk assets. The ascent wasn’t particularly smooth, as several new COVID-19 variants thwarted attempts at a full-fledged reopening. Besides the distress induced by a public health crisis, prolongation of the pandemic negatively impacted the supply of labor and costs of core goods. These two factors, combined with others such as economic stimulus and rising commodity prices, drove inflation higher. As economic activity proved resilient, however, investors shrugged off soaring prices and continued to buy stocks.
The U.S. unemployment rate declined to 3.9% in December and job openings continued to exceed job seekers, indicating the labor market is approaching full employment. This dynamic is pressuring wages upward and has contributed to inflation running above the U.S Federal Reserve Board’s (the “Fed”) 2% target since April. Sharply higher prices have caused the Fed to hasten its plans to withdraw stimulus. We recognize that in 2022, monetary and fiscal policy are likely to become less supportive of the global economy. Yet in our view, we also see potential offsets to tightening financial conditions, including consumer spending and corporate inventory rebuilding, which make us believe there is scope for continued global equity gains.
The pace and path to policy normalization will be a key market factor for the year ahead. A sharp rise in wages from prolonged labor market tightness is possible, but firms, particularly larger ones, have been able to pass through rising input costs to maintain margins. In our view, this is likely to continue and, combined with still above trend GDP growth, will support earnings growth in 2022.
As we’ve often noted, it’s important to have a plan for investing consistently through headwinds and tailwinds. Keep focused on your long-term goals and don’t get distracted by short-term fluctuations, however compelling or distracting they may seem. Should your long-term goals change, discuss the situation thoroughly with your investment advisor before making any changes to your investment portfolio.
Regardless of events, at Voya we remain well prepared for and fully committed to serving our clients without disruption. We appreciate your continued confidence in us, and we look forward to working with you in the future.
Sincerely,

Dina Santoro
President
Voya Family of Funds
January 21, 2022
The views expressed in the President’s Letter reflect those of the President as of the date of the letter. Any such views are subject to change at any time based upon market or other conditions and the Voya mutual funds disclaim any responsibility to update such views. These views may not be relied on as investment advice and because investment decisions for a Voya mutual fund are based on numerous factors, may not be relied on as an indication of investment intent on behalf of any Voya mutual fund. Reference to specific company securities should not be construed as recommendations or investment advice. International investing poses special risks including currency fluctuation, economic and political risks not found in investments that are solely domestic.
International investing poses special risks including currency fluctuation, economic and political risks not found in investments that are solely domestic.
1
BENCHMARK DESCRIPTIONS
| Index | | Description |
|---|
Bloomberg U.S. Aggregate Bond Index
(“Bloomberg U.S. Aggregate Bond”) | | An index of publicly issued investment grade U.S. government, mortgage-backed, asset-backed and corporate debt securities. |
| Bloomberg U.S. Treasury Inflation Protected Securities Index (“TIPS Index”) | | A market index comprised of all U.S. Treasury Inflation Linked Securities. |
2
PORTFOLIO MANAGERS’ REPORT | VY® BLACKROCK INFLATION PROTECTED
BOND PORTFOLIO |
VVY® BlackRock Inflation Protected Bond Portfolio (the “Portfolio”) seeks to maximize real return, consistent with preservation of real capital and prudent investment management. The Portfolio is managed by Chris Allen, Managing Director and Akiva Dickstein, Managing Director, Portfolio Managers of BlackRock Financial Management, Inc. — the Sub-Adviser.
Performance: For the year ended December 31, 2021, the Portfolio’s Class I shares provided a total return of 5.25% compared to the Bloomberg U.S. Treasury Inflation Protected Securities Index (“TIPS Index” or “TIPS”) which returned 5.96% for the same period.
Portfolio Specifics: The Portfolio was broadly positioned for a risk-on, reflationary environment entering 2021. The Portfolio’s tactical underweight positions in U.S. treasury inflation protected securities detracted from performance as heightened inflation prints and concerns of prolonged inflation pushed real rates lower across the curve. This triggered a significant rally in US real rates, especially in the second quarter. The Portfolio’s outright short in UK breakevens also detracted from performance as inflation expectations in the UK rose significantly over 2021. This was materially exacerbated in late third quarter as the acute energy shortage in the UK caused a material spike in front-end breakevens. Against a similar backdrop, persistent upside surprises in European inflation data fueled a sizeable expansion in EU inflation expectations that hurt the Portfolio’s short in Germany breakevens.
| | Investment Type Allocation
as of December 31, 2021
(as a percentage of net assets) | |
| | U.S. Treasury Obligations | | 50.8 | % | |
| | Corporate Bonds/Notes | | 26.7 | % | |
| | U.S. Government Agency Obligations | | 9.8 | % | |
| | Commercial Mortgage-Backed Securities | | 4.5 | % | |
| | Sovereign Bonds | | 2.3 | % | |
| | Asset-Backed Securities | | 2.0 | % | |
| | Certificates of Deposit | | 1.8 | % | |
| | Purchased Options | | 0.4 | % | |
| | Assets in Excess of Other Liabilities* | | 1.7 | % | |
| | Net Assets | | 100.0 | % | |
| | * Includes short-term investments. |
| | Portfolio holdings are subject to change daily. | |
| | | | | | |
The Portfolio’s relative value positions between U.S. vs. EU breakevens detracted from performance. Our tactical interest rate volatility positions erased their gains from the first half of the year and the third quarter as interest rate volatility increased over November and December. Our structural underweight in U.S. nominal rates was the most notable contributor to performance over the year. Hawkish comments from the U.S. Federal Reserve Board (the “Fed”) brought forward market participants’ timeline on the tapering of asset purchase program and rate hike projections, triggering a significant repricing in the rates market. Our tactical positions in Italy, Spain, and New Zealand breakevens further pared some of the underperformance. The Portfolio also benefitted from overweight allocations in agency mortgages, investment grade credit, and securitized assets.
| | Top Ten Holdings
as of December 31, 2021*
(as a percentage of net assets)
| |
| | United States Treasury Inflation Indexed Bonds, 0.500%, 01/15/28 | | 3.4 | % | |
| | United States Treasury Inflation Indexed Bonds, 0.750%, 07/15/28 | | 3.3 | % | |
| | United States Treasury Inflation Indexed Bonds, 0.375%, 07/15/27 | | 3.0 | % | |
| | United States Treasury Inflation Indexed Bonds, 0.125%, 01/15/30 | | 2.9 | % | |
| | United States Treasury Inflation Indexed Bonds, 0.125%, 07/15/30 | | 2.8 | % | |
| | United States Treasury Inflation Indexed Bonds, 0.125%, 01/15/31 | | 2.7 | % | |
| | United States Treasury Inflation Indexed Bonds, 0.125%, 07/15/31 | | 2.4 | % | |
| | United States Treasury Inflation Indexed Bonds, 0.375%, 01/15/27 | | 2.3 | % | |
| | United States Treasury Inflation Indexed Bonds, 1.375%, 02/15/44 | | 2.2 | % | |
| | United States Treasury Inflation Indexed Bonds, 0.750%, 02/15/45 | | 2.1 | % | |
| | * Excludes short-term investments. |
| | Portfolio holdings are subject to change daily. | |
| | | | | | |
Market Overview: The global markets in 2021 were influenced by the COVID-19 pandemic and geopolitical uncertainty. The year started with a reflationary outlook and increased expectations for stronger growth as interest rates moved higher and spread sectors moved marginally tighter. A few key events led to the rise in yields throughout January and February, in our view. Notably, the vaccine rollout that had accelerated, and the passing of the $1.9 trillion fiscal stimulus package with the potential of more infrastructure stimulus in the coming months. The significant pick-up in government bond yields rattled investors’ confidence as the market pulled forward its estimate on when the Fed would start lifting rates, but the Fed remained dovish for much of 2021 which kept interest rates in the long end of the curve anchored along with general demand from pensions funds. Inflation expectations moved higher over this period given the strong risk sentiment. As we moved into the summer, COVID-19 was not as much of a risk in the market given the vaccination progress and the economy continued to reopen. Spread sectors continued to perform well given this optimism and the curve flattened as inflation moved higher and continued to price in a more hawkish Fed. Risk assts remained resilient for much of the rest of the year but wobbled around concerns stemming from the Delta and Omicron variants and their risks to the economy and slowing growth in China. Late in the year the Fed became even more hawkish to combat higher inflation announcing it was doubling the pace of tapering to end in March and signaling three rate hikes in 2022. Overall, the consumer was extremely healthy in 2021, the employment picture continued to improve with record numbers of jobs added and inflation was running at elevated levels. Inflation prints in Europe and the UK surpassed consensus expectations over the period, pointing toward a steady increase in price levels, in our opinion. In December, the Bank of England (“BoE”) became one of the first major central banks to raise interest rates to 0.25% since the pandemic.
Current Strategy and Outlook: U.S.: In our view, the sharp hawkish pivot from the Fed in late 2021 will result in a bearish shift and significant repricing in the rates market. We believe by increasing the pace of taper and pulling forward rate hikes,
3
VY® BLACKROCK INFLATION PROTECTED
BOND PORTFOLIO | PORTFOLIO MANAGERS’ REPORT |
the Fed’s hawkish pivot will likely exert pressure on duration-sensitive assets and push yields higher across the curve. We believe the Fed indicated the shift in policy as warranted given incoming data on wages, inflation, and employment, all of which suggested that the economy was rapidly closing in on full employment, and inflationary pressures were proving more persistent than expected. The Fed now sees the inflation side of its dual mandate as being met and is now priming the market for rate hikes to reach maximum employment. In our view, the Fed has established a degree of distinction between short-run and long-run maximum employment and, as a result, could lift off from the zero-lower bound before participation has fully rebounded. We expect three 25 bps rate hikes in 2022, with the first one coming in March.
On the inflation front, CPI data in the fourth quarter continued to be strong, in our view. Details showed that the price level in reopening sensitive categories regained some traction partly due to the holiday season. In the meantime, core components, such as Rents and Owners’ Equivalent Rent, continued to strengthen. We believe inflation to be sticky and above the pre-pandemic trend level for the near to medium term, driven primarily by lingering supply chain issues and higher goods prices through 2022. We see the firming of the core components are likely to account for a more significant portion of inflation in the upcoming months before the strong base effects kick in and push inflation lower. Our current forecasts have headline CPI peaking in the first quarter of 2022 at approximately 7% year-over-year and core at approximately 6.4% year-over-year. By year-end 2022, we believe that the headline CPI will likely move lower but remain elevated at approximately 3% year-over-year, with core CPI at approximately 3.8% year-over-year.
Europe (incl. UK) — We view the near-term policy path as well communicated by the European Central Bank (“ECB”), with asset purchases lasting at the very minimum to the end of 2022. We believe that this helps balance the uncertainty around the longer-term policy path from 2023 onwards. At the December ECB meeting, President Lagarde announced a step-by-step reduction of monetary policy stimulus, and the reduction plan is similar to the our base case. In our opinion, the added ability to reactivate the Pandemic Emergency Purchase Program provides a dovish touch to the otherwise hawkish narrative, as funds can be diverted to any EU country or asset classes as needed.
We view that the ECB’s guidance on inflation (approximately 1.8% from the second quarter of 2023 to the fourth quarter of 2024) provides a high bar for rate hikes before the end of 2023 due to bullish underlying assumptions on medium-term wages and GDP growth. We think the current price momentum is unlikely to fade quickly, especially if Omicron variant restrictions exacerbate supply-chain disruptions. With gas and oil prices surging in December, we believe energy inflation will likely push headline inflation higher in the short term. We forecast inflation to moderate into the second half of 2022, with the EU inflation rate below 2% year-over-year by the end of 2022.
In the UK, the spread of the Omicron variant elevated the uncertainty concerning the country’s economic outlook. Despite this, the BoE surprise 15 basis points (0.15%) hike in December highlighted the Bank’s greater emphasis on labor market tightness and inflationary pressures. We see the probability for further tightening in 2022 as significant. However, we do not think the BoE has a solid case to lift rates above 0.75% by year-end 2022. By then, in our opinion, we see inflation is likely to decline as the recent monetary tightening makes its way through the economy, and the expansionary fiscal policy gradually rolls off.
In Japan — In December, the Bank of Japan (“BoJ”) maintained its current easing policies centered around yield curve controls, as expected, in our view. However, the BoJ did note that inflation expectations have picked up, suggesting the Bank is actively monitoring the possibility that the recent price increase will lead to a self-fulfilling acceleration of inflation and subsequent upward revisions. The latest BoJ Tankan showed the 1-year inflation outlook of enterprises strengthened to a multi-year high at approximately 1.1% year over year in December. In the near term, in our view, we see the recent pick-up in price momentum as likely to provide a brief positive inflationary backdrop. We believe the higher import prices for energy and food, exacerbated by the Yen’s depreciation, hold the potential to push the core CPI towards the BoJ’s 2% year-over-year target. However, we expect the BoJ to stick with its current monetary easing through 2022, assuming the acceleration of CPI inflation driven by supply-side constraints and higher energy prices will be transitory. We expect core CPI to likely peak in the first quarter of 2022 and weaken after that. To sustain a higher level of inflation, we believe it is essential to induce a higher level of labor productivity alongside dovish monetary policy. Any sustained inflation will need robust growth in fundamental economic components (i.e., wage inflation). Otherwise, in our opinion, inflation will likely remain fleeting.
The views expressed in this commentary are informed opinions. They should not be considered promises or advice. The views expressed reflect those of the portfolio managers, only through the end of the period as stated on the cover. The portfolio managers’ views are subject to change at any time based on market and other conditions.
Portfolio holdings and characteristics are subject to change and may not be representative of current holdings and characteristics. Portfolio holdings are subject to change daily. The outlook for this Portfolio may differ from that presented for other Voya mutual funds. This report contains statements that may be “forward-looking” statements. Actual results may differ materially from those projected in the “forward-looking” statements. The Portfolio’s performance returns shown reflect applicable fee waivers and/or expense limits in effect during this period. Absent such fee waivers/expense limitations, if any, performance would have been lower. Performance for the different classes of shares will vary based on differences in fees associated with each class. An index has no cash in its portfolio and imposes no sales charges. An investor cannot invest directly in an index.
4
| PORTFOLIO MANAGERS’ REPORT | VY® BLACKROCK INFLATION PROTECTED
BOND PORTFOLIO |
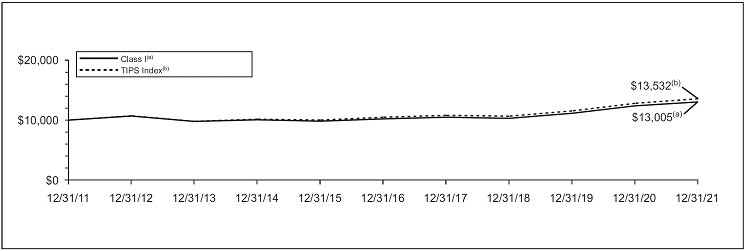
| | Average Annual Total Returns for the Periods Ended December 31, 2021 | |
| | | | | | 1 Year | | 5 Year | | 10 Year | |
|---|
| | Class ADV | | | | | 4.54 | % | | | 4.40 | % | | | 2.05 | % | |
| | Class I | | | | | 5.25 | % | | | 5.02 | % | | | 2.66 | % | |
| | Class S | | | | | 4.94 | % | | | 4.77 | % | | | 2.41 | % | |
| | TIPS | | | | | 5.96 | % | | | 5.34 | % | | | 3.09 | % | |
Based on a $10,000 initial investment, the graph and table above illustrate the total return of VY® BlackRock Inflation Protected Bond Portfolio against the index indicated. The index is unmanaged and has no cash in its portfolio and imposes no sales charges. An investor cannot invest directly in an index.
The Portfolio’s performance is shown without the imposition of any expenses or charges which are, or may be, imposed under your variable annuity contract or variable life insurance policy. Total returns would have been lower if such expenses or charges were included.
The performance graph and table do not reflect the deduction of taxes that a shareholder will pay on Portfolio distributions or the redemption of Portfolio shares.
The performance shown includes, if applicable, the effect of fee waivers and/or expense reimbursements by the Investment Adviser and/or other
service providers, which have the effect of increasing total return. Had all fees and expenses been considered, the total returns would have been lower.
The performance update illustrates performance for a variable investment option available through a variable annuity contract or a variable life insurance policy. The performance shown indicates past performance and is not a projection or prediction of future results. Actual investment returns and principal value will fluctuate so that shares and/or units, at redemption, may be worth more or less than their original cost. Please log on to www.voyainvestments.com or call (800) 366-0066 to get performance through the most recent month end.
Portfolio holdings are subject to change daily.
5
VY® BRANDYWINEGLOBAL —
BOND PORTFOLIO | PORTFOLIO MANAGERS’ REPORT |
Investment Type Allocation
as of December 31, 2021
(as a percentage of net assets)
| U.S. Treasury Obligations | | | | | 49.8 | % |
| Corporate Bonds/Notes | | | | | 25.9 | % |
| U.S. Government Agency Obligations | | | | | 17.0 | % |
| Commercial Mortgage-Backed Securities | | | | | 4.8 | % |
| Collateralized Mortgage Obligations | | | | | 0.5 | % |
| Asset-Backed Securities | | | | | 0.2 | % |
| Assets in Excess of Other Liabilities* | | | | | 1.8 | % |
| Net Assets | | | | | 100.0 | % |
| * | | Includes short-term investments. |
Portfolio holdings are subject to change daily.
VY® BrandywineGLOBAL — Bond Portfolio (the “Portfolio”) seeks total return consisting of capital appreciation and income. The Portfolio is managed by David F. Hoffman, CFA, John P. McIntyre, CFA, and Anujeet Sareen, CFA, Portfolio Managers of Brandywine Global Investment Management, LLC (“Brandywine”). — the Sub-Adviser.
Performance: For the year-ended December 31, 2021, the Portfolio’s shares provided a total return of 1.15% compared to the Bloomberg U.S. Aggregate Bond Index (“Bloomberg U.S. Aggregate Bond”), which returned -1.54% for the same period.
Portfolio Specifics — We maintained an underweight duration position versus the Bloomberg U.S. Aggregate Bond for the full calendar year in 2021. We felt that interest rates had the potential to rise as the economy re-opened and normalized and we wanted to minimize interest rate sensitivity in the Portfolio. This underweight positioning was the primary driver of both absolute and relative returns for the full calendar year as rates moved higher during the year. However, the move higher in rates was not linear as U.S. rates increased in the first few months of the year, declined in the summer months, and then moved higher again to finish the calendar year.
We began the year with a significant underweight in U.S. treasury duration which included a short exposure to longer dated U.S. treasuries. This positioning contributed to significant outperformance during the first quarter of the year as rates moved significantly higher. The short exposure was used as an offset to the duration of our corporate credit positions, with an aim to reduce interest sensitivity of the Portfolio. As rates declined in the summer months and began to move higher in the fall, our macro outlook shifted, and we modestly increased U.S. treasury duration and closed our short treasury position.
Top Ten Holdings
as of December 31, 2021
(as a percentage of net assets)
| United States Treasury Floating Rate Note, 0.140%, 10/31/22 | | | | | 18.6 | % |
| United States Treasury Floating Rate Note, 0.134%, 01/31/23 | | | | | 15.1 | % |
| Federal Home Loan Banks, 0.125%, 03/17/23 | | | | | 8.5 | % |
| Freddie Mac, 0.375%, 05/05/23 | | | | | 8.5 | % |
| United States Treasury Floating Rate Note, 0.140%, 07/31/22 | | | | | 7.7 | % |
| United States Treasury Bond, 2.000%, 08/15/51 | | | | | 4.1 | % |
| FREMF 2012-K23 B Mortgage Trust, 3.656%, 10/25/45 | | | | | 2.8 | % |
| Marathon Oil Corp., 6.600%, 10/01/37 | | | | | 2.4 | % |
| United States Treasury Bond, 1.875%, 11/15/51 | | | | | 2.2 | % |
| United States Treasury Floating Rate Note, 0.119%, 04/30/23 | | | | | 2.1 | % |
Portfolio holdings are subject to change daily.
Our investment grade corporate credit exposures contributed to performance in 2021 but we continued to reduce exposure to this sector throughout the year due to rich valuations. Corporate credit spreads are close to all time highs and we tend to exit the sector when spreads tighten. We finished the year with approximately one year of corporate credit duration exposure which is down from a high of over four years in calendar year 2020.
Current Strategy and Outlook: Our outlook for 2022 remains constructive for growth in the U.S. and Globally. We expect global markets to move from a recovery phase to an expansion phase with the U.S. leading and China lagging from a growth perspective. We are closely monitoring a number of important macro considerations as we move into the new year. A few of the key areas of focus will be on household savings, bank lending, inflation, global monetary policy, and the continuing COVID-19 pandemic. We are maintaining an underweight duration position to protect against the potential of a further rise in rates.
The views expressed in this commentary are informed opinions. They should not be considered promises or advice. The views expressed reflect those of the portfolio managers, only through the end of the period as stated on the cover. The portfolio managers’ views are subject to change at any time based on market and other conditions.
Portfolio holdings and characteristics are subject to change and may not be representative of current holdings and characteristics. Portfolio holdings are subject to change daily. The outlook for this Portfolio may differ from that presented for other Voya mutual funds. This report contains statements that may be “forward-looking” statements. Actual results may differ materially from those projected in the “forward-looking” statements. The Portfolio’s performance returns shown reflect applicable fee waivers and/or expense limits in effect during this period. Absent such fee waivers/expense limitations, if any, performance would have been lower. Performance for the different classes of shares will vary based on differences in fees associated with each class. An index has no cash in its portfolio and imposes no sales charges. An investor cannot invest directly in an index.
6
| PORTFOLIO MANAGERS’ REPORT | VY® BRANDYWINEGLOBAL —
BOND PORTFOLIO |
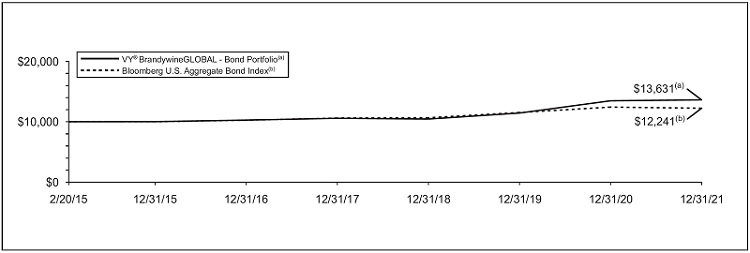
| Average Annual Total Returns for the Periods Ended December 31, 2021 |
|---|
| | | | 1 Year | | 5 Year | | Since Inception
February 20, 2015 |
|---|
VY® BrandywineGLOBAL - Bond Portfolio | | | | | 1.15 | % | | | 5.78 | % | | | 4.62 | % |
| Bloomberg U.S. Aggregate Bond Index | | | | | -1.54 | % | | | 3.57 | % | | | 2.99 | % |
Based on a $10,000 initial investment, the graph and table above illustrate the total return of VY® BrandywineGLOBAL - Bond Portfolio against the index indicated. The index is unmanaged and has no cash in its portfolio and imposes no sales charges. An investor cannot invest directly in an index.
The Portfolio’s performance is shown without the imposition of any expenses or charges which are, or may be, imposed under your variable annuity contract and/or variable life insurance policy. Total returns would have been lower if such expenses or charges were included.
The performance graph and table do not reflect the deduction of taxes that a shareholder will pay on Portfolio distributions or the redemption of Portfolio shares.
The performance shown includes, if applicable, the effect of fee waivers and/or expense reimbursements by the Investment Adviser and/or other service providers, which have the effect of increasing total return. Had all fees and expenses been considered, the total returns would have been lower.
The performance update illustrates performance for a variable investment option available through a variable annuity contract and/or a variable life insurance policy. The performance shown indicates past performance and is not a projection or prediction of future results. Actual investment returns and principal value will fluctuate so that shares and/or units, at redemption, may be worth more or less than their original cost. Please log on to www.voyainvestments.com or call (800) 992-0180 to get performance through the most recent month end.
Portfolio holdings are subject to change daily.
Prior to August 9, 2019, the Portfolio was managed by a different sub-adviser.
The Portfolio’s performance information for these periods reflects returns achieved by different sub-advisers.
7
SHAREHOLDER EXPENSE EXAMPLES (UNAUDITED) As a shareholder of a Portfolio, you incur two types of costs: (1) transaction costs, including redemption fees and exchange fees; and (2) ongoing costs, including management fees, distribution and/or service (12b-1) fees and other Portfolio expenses. These Examples are intended to help you understand your ongoing costs (in dollars) of investing in a Portfolio and to compare these costs with the ongoing costs of investing in other mutual funds.
The Examples are based on an investment of $1,000 invested at the beginning of the period and held for the entire period from July 1, 2021 to December 31, 2021. The Portfolios’ expenses are shown without the imposition of any charges which are, or may be, imposed under your variable annuity contract, variable life insurance policy, qualified pension, or retirement plan. Expenses would have been higher if such charges were included.
Actual Expenses
The left section of the table shown below, “Actual Portfolio Return,” provides information about actual account values and actual expenses. You may use the information in this section, together with the amount you invested, to estimate the expenses that you paid over the period. Simply divide your account value by $1,000 (for example, an $8,600 account value divided by $1,000 = 8.6), then multiply the result by the number in the first section under the heading entitled “Expenses Paid During the Period” to estimate the expenses you paid on your account during this period.
Hypothetical Example for Comparison Purposes
The right section of the table shown below, “Hypothetical (5% return before expenses),” provides information about hypothetical account values and hypothetical expenses based on a Portfolio’s actual expense ratio and an assumed rate of return of 5% per year before expenses, which is not a Portfolio’s actual return. The hypothetical account values and expenses may not be used to estimate the actual ending account balance or expenses you paid for the period. You may use this information to compare the ongoing costs of investing in a Portfolio and other mutual funds. To do so, compare this 5% hypothetical example with the 5% hypothetical examples that appear in the shareholder reports of the other mutual funds.
Please note that the expenses shown in the table are meant to highlight your ongoing costs only and do not reflect any transactional costs, such as redemption fees or exchange fees. Therefore, the hypothetical section of the table is useful in comparing ongoing costs only, and will not help you determine the relative total costs of owning different mutual funds. In addition, if these transactional costs were included, your costs would have been higher.
| | | | Actual Portfolio Return | | Hypothetical (5% return before expenses) | |
|---|
| | | | Beginning
Account
Value
July 1,
2021 | | Ending
Account
Value
December 31,
2021 | | Annualized
Expense
Ratio | | Expenses Paid
During the
Period Ended
December 31,
2021* | | Beginning
Account
Value
July 1,
2021 | | Ending
Account
Value
December 31,
2021 | | Annualized
Expense
Ratio | | Expenses Paid
During the
Period Ended
December 31,
2021* | |
|---|
| | VY® BlackRock Inflation Protected Bond Portfolio |
| Class ADV | | $ | 1,000.00 | | | $ | 1,034.10 | | | | 1.18 | % | | $ | 6.05 | | | $ | 1,000.00 | | | $ | 1,019.26 | | | | 1.18 | % | | $ | 6.01 | | |
| Class I | | | 1,000.00 | | | | 1,036.70 | | | | 0.58 | | | | 2.98 | | | | 1,000.00 | | | | 1,022.28 | | | | 0.58 | | | | 2.96 | | |
| Class S | | | 1,000.00 | | | | 1,035.70 | | | | 0.83 | | | | 4.26 | | | | 1,000.00 | | | | 1,021.02 | | | | 0.83 | | | | 4.23 | | |
| | | | | | | | | | | | | | | | | | | | | | | | | | | | | | | | | | | |
| | VY® BrandywineGLOBAL — Bond Portfolio |
| | | | $ | 1,000.00 | | | $ | 998.30 | | | | 0.58 | % | | $ | 2.92 | | | $ | 1,000.00 | | | $ | 1,022.28 | | | | 0.58 | % | | $ | 2.96 | | |
| * | | Expenses are equal to each Portfolio’s respective annualized expense ratios multiplied by the average account value over the period, multiplied by 184/365 to reflect the most recent fiscal half-year. |
8
REPORT OF INDEPENDENT REGISTERED PUBLIC ACCOUNTING FIRM
To the Shareholders of VY® BlackRock Inflation Protected Bond Portfolio and VY® BrandywineGLOBAL — Bond Portfolio and the Boards of Trustees of Voya Investors Trust and Voya Variable Insurance Trust
Opinion on the Financial Statements
We have audited the accompanying statements of assets and liabilities of VY® BlackRock Inflation Protected Bond Portfolio and VY® BrandywineGLOBAL — Bond Portfolio (collectively referred to as the “Portfolios”) (each a portfolio of Voya Investors Trust and Voya Variable Insurance Trust, respectively (collectively referred to as the “Trusts”)), including the portfolios of investments, as of December 31, 2021, and the related statements of operations for the year then ended, and the statements of changes in net assets and the financial highlights for each of the two years in the period then ended and the related notes (collectively referred to as the “financial statements”). In our opinion, the financial statements present fairly, in all material respects, the financial position of the Portfolios at December 31, 2021, the results of their operations for the year then ended, and the changes in their net assets and their financial highlights for each of the two years in the period then ended, in conformity with U.S. generally accepted accounting principles.
The financial highlights for each of the periods in the three-year period ended December 31, 2019, were audited by another independent registered public accounting firm whose report, dated February 21, 2020, expressed an unqualified opinion on those financial highlights.
Basis for Opinion
These financial statements are the responsibility of the Trusts’ management. Our responsibility is to express an opinion on the Portfolios’ financial statements based on our audits. We are a public accounting firm registered with the Public Company Accounting Oversight Board (United States) (“PCAOB”) and are required to be independent with respect to the Trusts in accordance with the U.S. federal securities laws and the applicable rules and regulations of the Securities and Exchange Commission and the PCAOB.
We conducted our audits in accordance with the standards of the PCAOB. Those standards require that we plan and perform the audits to obtain reasonable assurance about whether the financial statements are free of material misstatement, whether due to error or fraud. The Trusts are not required to have, nor were we engaged to perform, an audit of the Trusts’ internal control over financial reporting. As part of our audits, we are required to obtain an understanding of internal control over financial reporting, but not for the purpose of expressing an opinion on the effectiveness of the Trusts’ internal control over financial reporting. Accordingly, we express no such opinion.
Our audits included performing procedures to assess the risks of material misstatement of the financial statements, whether due to error or fraud, and performing procedures that respond to those risks. Such procedures included examining, on a test basis, evidence regarding the amounts and disclosures in the financial statements. Our procedures included confirmation of securities owned as of December 31, 2021, by correspondence with the custodian and others or by other appropriate auditing procedures where replies from others were not received. Our audits also included evaluating the accounting principles used and significant estimates made by management, as well as evaluating the overall presentation of the financial statements. We believe that our audits provide a reasonable basis for our opinion.
We have served as the auditor of one or more Voya investment companies since 2019.
Boston, Massachusetts
February 24, 2022
9
STATEMENTS OF ASSETS AND LIABILITIES AS OF DECEMBER 31, 2021 | | | VY®
BlackRock
Inflation
Protected
Bond
Portfolio | | VY®
BrandywineGLOBAL —
Bond
Portfolio |
ASSETS: | | | | | | | | | | |
| Investments in securities at fair value* | | | $ | 319,111,129 | | | | $ | 337,265,517 | |
| Short-term investments at fair value† | | | | 25,893,895 | | | | | 5,134,368 | |
| Cash collateral for futures contracts | | | | — | | | | | 480,927 | |
| Cash pledged for centrally cleared swaps (Note 2) | | | | 4,179,490 | | | | | — | |
| Cash pledged as collateral for OTC derivatives (Note 2) | | | | 360,000 | | | | | — | |
| Foreign currencies at value‡ | | | | 621,216 | | | | | — | |
| Receivables: | | | | | | | | | | |
| Investment securities sold | | | | 1,701,739 | | | | | — | |
| Investment securities sold on a delayed-delivery or when-issued basis | | | | 15,969,709 | | | | | — | |
| Fund shares sold | | | | 667,717 | | | | | 100,930 | |
| Dividends | | | | 173 | | | | | 136 | |
| Interest | | | | 1,142,898 | | | | | 817,590 | |
| Unrealized appreciation on forward foreign currency contracts | | | | 114,662 | | | | | — | |
| Unrealized appreciation on OTC swap agreements | | | | 1,463,650 | | | | | — | |
| Prepaid expenses | | | | 27 | | | | | 28 | |
| Other assets | | | | 18,983 | | | | | 6,467 | |
| Total assets | | | | 371,245,288 | | | | | 343,805,963 | |
| | | | | | | | | | | |
LIABILITIES: | | | | | | | | | | |
| Payable for investment securities purchased | | | | 2,051,836 | | | | | — | |
| Payable for investment securities purchased on a delayed-delivery or when-issued basis | | | | 40,384,957 | | | | | — | |
| Payable for fund shares redeemed | | | | 62,082 | | | | | 128,419 | |
| Unrealized depreciation on forward foreign currency contracts | | | | 43,132 | | | | | — | |
| Unrealized depreciation on OTC swap agreements | | | | 180,826 | | | | | — | |
| Variation margin payable on centrally cleared swaps | | | | 153,258 | | | | | — | |
| Variation margin payable on futures contracts | | | | 192,922 | | | | | 75,224 | |
| Cash received as collateral for OTC derivatives (Note 2) | | | | 1,532,000 | | | | | — | |
| Payable for investment management fees | | | | 131,574 | | | | | 178,142 | |
| Payable for distribution and shareholder service fees | | | | 64,770 | | | | | — | |
| Payable to trustees under the deferred compensation plan (Note 6) | | | | 18,983 | | | | | 6,467 | |
| Payable for trustee fees | | | | 1,543 | | | | | 1,691 | |
| Other accrued expenses and liabilities | | | | 100,854 | | | | | 87,053 | |
| Written options, at fair valueˆ | | | | 1,685,413 | | | | | — | |
| Total liabilities | | | | 46,604,150 | | | | | 476,996 | |
NET ASSETS | | | $ | 324,641,138 | | | | $ | 343,328,967 | |
| | | | | | | | | | | |
NET ASSETS WERE COMPRISED OF: | | | | | | | | | | |
| Paid-in capital | | | $ | 362,024,315 | | | | $ | 321,276,107 | |
| Total distributable earnings (loss) | | | | (37,383,177 | ) | | | | 22,052,860 | |
NET ASSETS | | | $ | 324,641,138 | | | | $ | 343,328,967 | |
| | | | | | | | | | | | |
| * Cost of investments in securities | | | $ | 301,545,535 | | | | $ | 332,305,058 | |
† Cost of short-term investments | | | $ | 26,000,285 | | | | $ | 5,134,368 | |
‡ Cost of foreign currencies | | | $ | 614,657 | | | | $ | — | |
| ^ Premiums received on written options | | | $ | 1,729,882 | | | | $ | — | |
See Accompanying Notes to Financial Statements
10
STATEMENTS OF ASSETS AND LIABILITIES AS OF DECEMBER 31, 2021 (CONTINUED)
| | | VY®
BlackRock
Inflation
Protected
Bond
Portfolio | | VY®
BrandywineGLOBAL —
Bond
Portfolio |
Class ADV | | | | | | | | | | |
| Net assets | | | $ | 56,856,802 | | | | | n/a | |
| Shares authorized | | | | unlimited | | | | | n/a | |
| Par value | | | $ | 0.001 | | | | | n/a | |
| Shares outstanding | | | | 5,411,724 | | | | | n/a | |
| Net asset value and redemption price per share | | | $ | 10.51 | | | | | n/a | |
| | | | | | | | | | | |
Class I | | | | | | | | | | |
| Net assets | | | $ | 94,962,489 | | | | | n/a | |
| Shares authorized | | | | unlimited | | | | | n/a | |
| Par value | | | $ | 0.001 | | | | | n/a | |
| Shares outstanding | | | | 8,683,399 | | | | | n/a | |
| Net asset value and redemption price per share | | | $ | 10.94 | | | | | n/a | |
| | | | | | | | | | | |
Class S | | | | | | | | | | |
| Net assets | | | $ | 172,821,847 | | | | | n/a | |
| Shares authorized | | | | unlimited | | | | | n/a | |
| Par value | | | $ | 0.001 | | | | | n/a | |
| Shares outstanding | | | | 15,933,497 | | | | | n/a | |
| Net asset value and redemption price per share | | | $ | 10.85 | | | | | n/a | |
| | | | | | | | | | | |
Portfolio(1) | | | | | | | | | | |
| Net assets | | | | n/a | | | | $ | 343,328,967 | |
| Shares authorized | | | | n/a | | | | | unlimited | |
| Par value | | | | n/a | | | | $ | 0.001 | |
| Shares outstanding | | | | n/a | | | | | 30,601,792 | |
| Net asset value and redemption price per share | | | | n/a | | | | $ | 11.22 | |
| (1) | Portfolio does not have a share class designation. |
See Accompanying Notes to Financial Statements
11
STATEMENTS OF OPERATIONS FOR THE YEAR ENDED DECEMBER 31, 2021 | | | VY®
BlackRock
Inflation
Protected
Bond
Portfolio | | VY®
BrandywineGLOBAL —
Bond
Portfolio |
| | | | | | | | | | |
|---|
INVESTMENT INCOME: | | | | | | | | | | |
| Dividends | | | $ | 2,257 | | | | $ | 2,339 | |
| Interest, net of foreign taxes withheld* | | | | 10,228,729 | (1) | | | | 4,797,971 | |
| Total investment income | | | | 10,230,986 | | | | | 4,800,310 | |
EXPENSES: | | | | | | | | | | |
| Investment management fees | | | | 1,642,904 | | | | | 1,690,421 | |
| Distribution and shareholder service fees: | | | | | | | | | | |
| Class ADV | | | | 301,871 | | | | | — | |
| Class S | | | | 407,397 | | | | | — | |
| Transfer agent fees: | | | | — | | | | | 1,762 | |
| Class ADV | | | | 13,273 | | | | | — | |
| Class I | | | | 25,146 | | | | | — | |
| Class S | | | | 42,989 | | | | | — | |
| Shareholder reporting expense | | | | 12,211 | | | | | 1,930 | |
| Registration fees | | | | — | | | | | 5,169 | |
| Professional fees | | | | 51,081 | | | | | 51,072 | |
| Custody and accounting expense | | | | 111,120 | | | | | 58,690 | |
| Trustee fees | | | | 12,343 | | | | | 13,523 | |
| Miscellaneous expense | | | | 10,063 | | | | | 6,276 | |
| Interest expense | | | | 156 | | | | | — | |
| Total expenses | | | | 2,630,554 | | | | | 1,828,843 | |
| Recouped/(Waived and reimbursed fees) | | | | (134,225 | ) | | | | 138,785 | |
| Net expenses | | | | 2,496,329 | | | | | 1,967,628 | |
| Net investment income | | | | 7,734,657 | | | | | 2,832,682 | |
REALIZED AND UNREALIZED GAIN (LOSS): | | | | | | | | | | |
| Net realized gain (loss) on: | | | | | | | | | | |
| Investments | | | | 6,941,094 | | | | | 9,687,393 | |
| Forward foreign currency contracts | | | | 486,557 | | | | | — | |
| Foreign currency related transactions | | | | 31,580 | | | | | — | |
| Futures | | | | (340,900 | ) | | | | 5,033,822 | |
| Swaps | | | | 2,067,768 | | | | | — | |
| Written options | | | | 368,489 | | | | | — | |
| Net realized gain | | | | 9,554,588 | | | | | 14,721,215 | |
| Net change in unrealized appreciation (depreciation) on: | | | | | | | | | | |
| Investments | | | | (8,006,328 | ) | | | | (13,348,508 | ) |
| Forward foreign currency contracts | | | | 308,830 | | | | | — | |
| Foreign currency related transactions | | | | 4,914 | | | | | — | |
| Futures | | | | (304,458 | ) | | | | (453,656 | ) |
| Swaps | | | | 5,651,419 | | | | | — | |
| Written options | | | | (171,019 | ) | | | | — | |
| Net change in unrealized appreciation (depreciation) | | | | (2,516,642 | ) | | | | (13,802,164 | ) |
| Net realized and unrealized gain | | | | 7,037,946 | | | | | 919,051 | |
Increase in net assets resulting from operations | | | $ | 14,772,603 | | | | $ | 3,751,733 | |
| | | | | | | | | | | |
| | | | | | | | | | | | |
| * Foreign taxes withheld | | | $ | 159 | | | | $ | — | |
| | |
| (1) | Includes net inflationary and deflationary adjustments. See Note 2 of the Notes to Financial Statements. |
See Accompanying Notes to Financial Statements
12
STATEMENTS OF CHANGES IN NET ASSETS | | VY® BlackRock Inflation
Protected Bond Portfolio | | VY® BrandywineGLOBAL —
Bond Portfolio |
| | Year Ended December 31,
2021 | | Year Ended
December 31,
2020 | | Year Ended
December 31,
2021 | | Year Ended
December 31,
2020 |
FROM OPERATIONS: | | | | | | | | | | | | | | | | |
| Net investment income | | $ | 7,734,657 | | | $ | 2,498,353 | | | $ | 2,832,682 | | | $ | 5,435,938 | |
| Net realized gain | | | 9,554,588 | | | | 8,870,565 | | | | 14,721,215 | | | | 21,289,037 | |
| Net change in unrealized appreciation (depreciation) | | | (2,516,642 | ) | | | 18,038,735 | | | | (13,802,164 | ) | | | 18,184,526 | |
| Increase in net assets resulting from operations | | | 14,772,603 | | | | 29,407,653 | | | | 3,751,733 | | | | 44,909,501 | |
| | | | | | | | | | | | | | | | | |
FROM DISTRIBUTIONS TO SHAREHOLDERS: | | | | | | | | | | | | | | | | |
| Total distributions (excluding return of capital): | | | | | | | | | | | (27,082,394 | ) | | | (7,776,746 | ) |
| Class ADV | | | (1,140,854 | ) | | | (369,573 | ) | | | — | | | | — | |
| Class I | | | (2,600,461 | ) | | | (1,038,565 | ) | | | — | | | | — | |
| Class S | | | (4,058,689 | ) | | | (1,464,646 | ) | | | — | | | | — | |
| Return of capital: | | | | | | | | | | | | | | | | |
| Class ADV | | | — | | | | (258,130 | ) | | | — | | | | — | |
| Class I | | | — | | | | (465,220 | ) | | | — | | | | — | |
| Class S | | | — | | | | (834,668 | ) | | | — | | | | — | |
| Total distributions | | | (7,800,004 | ) | | | (4,430,802 | ) | | | (27,082,394 | ) | | | (7,776,746 | ) |
| | | | | | | | | | | | | | | | | |
FROM CAPITAL SHARE TRANSACTIONS: | | | | | | | | | | | | | | | | |
| Net proceeds from sale of shares | | | 83,578,121 | | | | 59,965,213 | | | | 86,294,017 | | | | 216,779,069 | |
| Reinvestment of distributions | | | 7,796,663 | | | | 4,430,802 | | | | 27,082,394 | | | | 7,776,746 | |
| | | | 91,374,784 | | | | 64,396,015 | | | | 113,376,411 | | | | 224,555,815 | |
| Cost of shares redeemed | | | (73,208,287 | ) | | | (67,828,595 | ) | | | (65,382,155 | ) | | | (125,915,207 | ) |
| Net increase (decrease) in net assets resulting from capital share transactions | | | 18,166,497 | | | | (3,432,580 | ) | | | 47,994,256 | | | | 98,640,608 | |
| Net increase in net assets | | | 25,139,096 | | | | 21,544,271 | | | | 24,663,595 | | | | 135,773,363 | |
| | | | | | | | | | | | | | | | | |
NET ASSETS: | | | | | | | | | | | | | | | | |
| Beginning of year or period | | | 299,502,042 | | | | 277,957,771 | | | | 318,665,372 | | | | 182,892,009 | |
| End of year or period | | $ | 324,641,138 | | | $ | 299,502,042 | | | $ | 343,328,967 | | | $ | 318,665,372 | |
See Accompanying Notes to Financial Statements
13
Selected data for a share of beneficial interest outstanding throughout each year or period.
| | | | | | | Income (loss)
from investment
operations | | | | | | Less distributions | | | | | | | | | | | | | | | | | | Ratios to average
net assets | | Supplemental
data |
|---|
| Year or period | | Net asset
value,
beginning
of year
or period | | Net
investment
income
(loss) | | Net
realized
and
unrealized
gain (loss) | | Total from
investment
operations | | From net
investment
income | | From net
realized
gains | | From
return of
capital | | Total
distributions | | Payment
by
affiliate | | Net asset
value,
end of
year or
period | | Total
Return(1) | | Expenses
before
reductions/
additions(2)(3)(4) | | Expenses
net of fee
waivers
and/or
recoupments
if any(2)(3)(4) | | Expenses
net of all
reductions/
additions(2)(3)(4) | | Net
investment
income
(loss)(2)(3) | | Net assets,
end of
year or
period | | Portfolio
turnover
rate |
|---|
| ended | | ($) | | ($) | | ($) | | ($) | | ($) | | ($) | | ($) | | ($) | | ($) | | ($) | | (%) | | (%) | | (%) | | (%) | | (%) | | ($000’s) | | (%) |
|---|
VY® BlackRock Inflation Protected Bond Portfolio | | | | | | | | | | | | | | | | | | | | | | | | | | | | | | | | | | | | | | | | | | | | | | | | | | | | | | | | | | |
Class ADV | | | | | | | | | | | | | | | | | | | | | | | | | | | | | | | | | | | | | | | | | | | | | | | | | | | | | | | | | | | | | | | | | | | | |
| 12-31-21 | | | 10.28 | | | | 0.22 | • | | | 0.24 | | | | 0.46 | | | | 0.23 | | | | — | | | | — | | | | 0.23 | | | | — | | | | 10.51 | | | | 4.54 | | | | 1.22 | | | | 1.18 | | | | 1.18 | | | | 2.14 | | | | 56,857 | | | | 156 | |
| 12-31-20 | | | 9.42 | | | | 0.05 | | | | 0.95 | | | | 1.00 | | | | 0.08 | | | | — | | | | 0.06 | | | | 0.14 | | | | — | | | | 10.28 | | | | 10.65 | | | | 1.26 | | | | 1.22 | | | | 1.22 | | | | 0.52 | | | | 47,352 | | | | 87 | |
| 12-31-19 | | | 8.93 | | | | 0.11 | | | | 0.56 | | | | 0.67 | | | | 0.18 | | | | — | | | | — | | | | 0.18 | | | | — | | | | 9.42 | | | | 7.53 | | | | 1.20 | | | | 1.16 | | | | 1.16 | | | | 1.23 | | | | 44,885 | | | | 72 | |
| 12-31-18 | | | 9.30 | | | | 0.14 | | | | (0.36 | ) | | | (0.22 | ) | | | 0.15 | | | | — | | | | — | | | | 0.15 | | | | — | | | | 8.93 | | | | (2.39 | ) | | | 1.18 | | | | 1.14 | | | | 1.14 | | | | 1.47 | | | | 44,035 | | | | 63 | |
| 12-31-17 | | | 9.17 | | | | 0.09 | | | | 0.11 | | | | 0.20 | | | | 0.07 | | | | — | | | | — | | | | 0.07 | | | | — | | | | 9.30 | | | | 2.16 | | | | 1.17 | | | | 1.13 | | | | 1.13 | | | | 0.94 | | | | 49,769 | | | | 101 | |
Class I | | | | | | | | | | | | | | | | | | | | | | | | | | | | | | | | | | | | | | | | | | | | | | | | | | | | | | | | | | | | | | | | | | | | |
| 12-31-21 | | | 10.68 | | | | 0.30 | • | | | 0.25 | | | | 0.55 | | | | 0.29 | | | | — | | | | — | | | | 0.29 | | | | — | | | | 10.94 | | | | 5.25 | | | | 0.62 | | | | 0.58 | | | | 0.58 | | | | 2.75 | | | | 94,962 | | | | 156 | |
| 12-31-20 | | | 9.78 | | | | 0.12 | | | | 0.97 | | | | 1.09 | | | | 0.13 | | | | — | | | | 0.06 | | | | 0.19 | | | | — | | | | 10.68 | | | | 11.15 | | | | 0.66 | | | | 0.62 | | | | 0.62 | | | | 1.11 | | | | 92,767 | | | | 87 | |
| 12-31-19 | | | 9.26 | | | | 0.18 | | | | 0.57 | | | | 0.75 | | | | 0.23 | | | | — | | | | — | | | | 0.23 | | | | — | | | | 9.78 | | | | 8.21 | | | | 0.60 | | | | 0.56 | | | | 0.56 | | | | 1.98 | | | | 88,759 | | | | 72 | |
| 12-31-18 | | | 9.66 | | | | 0.20 | • | | | (0.37 | ) | | | (0.17 | ) | | | 0.23 | | | | — | | | | — | | | | 0.23 | | | | — | | | | 9.26 | | | | (1.75 | ) | | | 0.58 | | | | 0.54 | | | | 0.54 | | | | 2.14 | | | | 40,731 | | | | 63 | |
| 12-31-17 | | | 9.55 | | | | 0.15 | | | | 0.11 | | | | 0.26 | | | | 0.15 | | | | — | | | | — | | | | 0.15 | | | | — | | | | 9.66 | | | | 2.72 | | | | 0.57 | | | | 0.53 | | | | 0.53 | | | | 1.55 | | | | 223,463 | | | | 101 | |
Class S | | | | | | | | | | | | | | | | | | | | | | | | | | | | | | | | | | | | | | | | | | | | | | | | | | | | | | | | | | | | | | | | | | | | |
| 12-31-21 | | | 10.60 | | | | 0.26 | • | | | 0.26 | | | | 0.52 | | | | 0.27 | | | | — | | | | — | | | | 0.27 | | | | — | | | | 10.85 | | | | 4.94 | | | | 0.87 | | | | 0.83 | | | | 0.83 | | | | 2.48 | | | | 172,822 | | | | 156 | |
| 12-31-20 | | | 9.70 | | | | 0.09 | | | | 0.97 | | | | 1.06 | | | | 0.10 | | | | — | | | | 0.06 | | | | 0.16 | | | | — | | | | 10.60 | | | | 10.95 | | | | 0.91 | | | | 0.87 | | | | 0.87 | | | | 0.86 | | | | 159,383 | | | | 87 | |
| 12-31-19 | | | 9.18 | | | | 0.15 | | | | 0.58 | | | | 0.73 | | | | 0.21 | | | | — | | | | — | | | | 0.21 | | | | — | | | | 9.70 | | | | 8.01 | | | | 0.85 | | | | 0.81 | | | | 0.81 | | | | 1.57 | | | | 144,313 | | | | 72 | |
| 12-31-18 | | | 9.57 | | | | 0.17 | | | | (0.36 | ) | | | (0.19 | ) | | | 0.20 | | | | — | | | | — | | | | 0.20 | | | | — | | | | 9.18 | | | | (2.04 | ) | | | 0.83 | | | | 0.79 | | | | 0.79 | | | | 1.83 | | | | 153,793 | | | | 63 | |
| 12-31-17 | | | 9.45 | | | | 0.13 | | | | 0.10 | | | | 0.23 | | | | 0.11 | | | | — | | | | — | | | | 0.11 | | | | — | | | | 9.57 | | | | 2.48 | | | | 0.82 | | | | 0.78 | | | | 0.78 | | | | 1.29 | | | | 160,890 | | | | 101 | |
VY® BrandywineGLOBAL- Bond Portfolio | | | | | | | | | | | | | | | | | | | | | | | | | | | | | | | | | | | | | | | | | | | | | | | | | | | | | | | | | | |
| 12-31-21 | | | 12.03 | | | | 0.10 | • | | | 0.04 | | | | 0.14 | | | | 0.19 | | | | 0.76 | | | | — | | | | 0.95 | | | | — | | | | 11.22 | | | | 1.15 | | | | 0.54 | | | | 0.58 | | | | 0.58 | | | | 0.84 | | | | 343,329 | | | | 57 | |
| 12-31-20 | | | 10.51 | | | | 0.22 | • | | | 1.59 | | | | 1.81 | | | | 0.21 | | | | 0.08 | | | | — | | | | 0.29 | | | | — | | | | 12.03 | | | | 17.47 | | | | 0.56 | | | | 0.58 | | | | 0.58 | | | | 1.92 | | | | 318,665 | | | | 134 | |
| 12-31-19 | | | 9.73 | | | | 0.25 | • | | | 0.73 | | | | 0.98 | | | | 0.20 | | | | — | | | | — | | | | 0.20 | | | | — | | | | 10.51 | | | | 10.12 | | | | 0.61 | | | | 0.58 | | | | 0.58 | | | | 2.48 | | | | 182,892 | | | | 449 | |
| 12-31-18 | | | 10.12 | | | | 0.26 | • | | | (0.43 | ) | | | (0.17 | ) | | | 0.22 | | | | — | | | | — | | | | 0.22 | | | | — | | | | 9.73 | | | | (1.65 | ) | | | 0.71 | | | | 0.58 | | | | 0.58 | | | | 2.61 | | | | 194,159 | | | | 457 | |
| 12-31-17 | | | 10.06 | | | | 0.22 | • | | | 0.07 | | | | 0.29 | | | | 0.23 | | | | — | | | | — | | | | 0.23 | | | | — | | | | 10.12 | | | | 2.93 | | | | 0.69 | | | | 0.58 | | | | 0.58 | | | | 2.16 | | | | 214,952 | | | | 345 | |
(1) | | Total return is calculated assuming reinvestment of all dividends, capital gain distributions and return of capital distributions, if any, at net asset value and does not reflect the effect of insurance contract charges. Total return for periods less than one year is not annualized. |
(2) | | Annualized for periods less than one year. |
(3) | | Ratios reflect operating expenses of a Portfolio. Expenses before reductions/additions do not reflect amounts reimbursed or recouped by the Investment Adviser and/or Distributor or reductions from brokerage service arrangements or other expense offset arrangements and do not represent the amount paid by a Portfolio during periods when reimbursements or reductions occur. |
| | | Expenses net of fee waivers reflect expenses after reimbursement by the Investment Adviser and/or Distributor or recoupment of previously reimbursed fees by the Investment Adviser, but prior to reductions from brokerage service arrangements or other expense offset arrangements. Expenses net of all reductions/additions represent the net expenses paid by a Portfolio. Net investment income (loss) is net of all such additions or reductions. |
(4) | | Ratios do not include fees and expenses charged under the variable annuity contract or variable life insurance policy. |
• | | Calculated using average number of shares outstanding throughout the year or period. |
See Accompanying Notes to Financial Statements
14
NOTES TO FINANCIAL STATEMENTS AS OF DECEMBER 31, 2021 NOTE 1 — ORGANIZATION
Voya Investors Trust is registered under the Investment Company Act of 1940, as amended (the “1940 Act”), as an open-end management investment company and was organized as a Massachusetts business trust on August 3, 1988. Voya Investors Trust currently consists of twenty-two active separate investment series. The one series included in this report is: VY® BlackRock Inflation Protected Bond Portfolio (“BlackRock Inflation Protected Bond”), a diversified series of Voya Investors Trust.
Voya Variable Insurance Trust is registered under the 1940 Act as an open-end management investment company and was organized as a Delaware statutory trust on July 15, 1999. Voya Variable Insurance Trust consists of one active investment series which is included in this report: VY® BrandywineGLOBAL — Bond Portfolio (“Bond Portfolio”), a diversified series of Voya Variable Insurance Trust.
Voya Investors Trust and Voya Variable Insurance Trust are collectively referred to as the “Trusts.” BlackRock Inflation Protected Bond and Bond Portfolio are each, a “Portfolio” and together, the “Portfolios.” The investment objective of the Portfolios is described in each Portfolio’s Prospectus.
The classes of shares included in this report for BlackRock Inflation Protected Bond are: Adviser (“Class ADV”), Institutional (“Class I”), and Service (“Class S”). With the exception of class specific matters, each class has equal voting rights as to voting privileges. For class specific proposals, only the applicable class would have voting privileges. The classes differ principally in the applicable distribution and shareholder service fees, as well as differences in the amount of waiver of fees and reimbursement of expenses, if any. Generally, shareholders of each class also bear certain expenses that pertain to that particular class. All shareholders are allocated the common expenses of a portfolio and earn income and realized gains/losses from a portfolio pro rata based on the daily ending net assets of each class, without distinction between share classes. Expenses that are specific to a portfolio or a class are charged directly to that portfolio or class. Other operating expenses shared by several portfolios are generally allocated among those portfolios based on average net assets. Distributions are determined separately for each class based on income and expenses allocated to each class. Realized gain distributions are allocated to each class pro rata based on the shares outstanding of each class on the date of distribution. Differences in per share dividend rates generally result from differences in separate class expenses, including distribution and shareholder service fees, if any, as well as differences in the amount of waiver
of fees and reimbursement of expenses between the separate classes, if any. Bond Portfolio does not have a share class designation.
Voya Investments, LLC (“Voya Investments” or the “Investment Adviser”), an Arizona limited liability company, serves as the Investment Adviser to the Portfolios. Voya Investments Distributor, LLC (“VID” or the “Distributor”), a Delaware limited liability company, serves as the principal underwriter to the Portfolios.
NOTE 2 — SIGNIFICANT ACCOUNTING POLICIES
The following significant accounting policies are consistently followed by the Portfolios in the preparation of their financial statements. Each Portfolio is considered an investment company under U.S. generally accepted accounting principles (“GAAP”) and follows the accounting and reporting guidance applicable to investment companies.
A. Security Valuation. Each Portfolio is open for business every day the New York Stock Exchange (“NYSE”) opens for regular trading (each such day, a “Business Day”). The net asset value (“NAV”) per share for each class, if applicable, of each Portfolio is determined each Business Day as of the close of the regular trading session (“Market Close”), as determined by the Consolidated Tape Association (“CTA”), the central distributor of transaction prices for exchange-traded securities (normally 4:00 p.m. Eastern time unless otherwise designated by the CTA). The data reflected on the consolidated tape provided by the CTA is generated by various market centers, including all securities exchanges, electronic communications networks, and third-market broker-dealers. The NAV per share of each class of each Portfolio is calculated by taking the value of the Portfolio’s assets attributable to that class, subtracting the Portfolio’s liabilities attributable to that class, and dividing by the number of shares of that class that are outstanding. On days when a Portfolio is closed for business, Portfolio shares will not be priced and a Portfolio does not transact purchase and redemption orders. To the extent a Portfolio’s assets are traded in other markets on days when a Portfolio does not price its shares, the value of a Portfolio’s assets will likely change and you will not be able to purchase or redeem shares of a Portfolio.
Assets for which market quotations are readily available are valued at market value. A security listed or traded on an exchange is valued at its last sales price or official closing price as of the close of the regular trading session on the exchange where the security is principally traded or, if such price is not available, at the last sale price as of the Market Close for such security provided by the CTA. Bank loans are valued at the average of the averages of the bid and ask prices provided to an independent loan pricing service by
15
NOTES TO FINANCIAL STATEMENTS AS OF DECEMBER 31, 2021 (CONTINUED)
NOTE 2 — SIGNIFICANT ACCOUNTING POLICIES (continued)
brokers. Futures contracts are valued at the final settlement price set by an exchange on which they are principally traded. Listed options are valued at the mean between the last bid and ask prices from the exchange on which they are principally traded. Investments in open-end registered investment companies that do not trade on an exchange are valued at the end of day NAV per share. Investments in registered investment companies that trade on an exchange are valued at the last sales price or official closing price as of the close of the regular trading session on the exchange where the security is principally traded.
When a market quotation is not readily available or is deemed unreliable, each Portfolio will determine a fair value for the relevant asset in accordance with procedures adopted by the Portfolios’ Boards of Trustees (“Board”). Such procedures provide, for example, that: (a) Exchange-traded securities are valued at the mean of the closing bid and ask; (b) Debt obligations are valued using an evaluated price provided by an independent pricing service. Evaluated prices provided by the pricing service may be determined without exclusive reliance on quoted prices, and may reflect factors such as institution-size trading in similar groups of securities, developments related to specific securities, benchmark yield, quality, type of issue, coupon rate, maturity, individual trading characteristics and other market data; (c) Securities traded in the over-the-counter (“OTC”) market are valued based on prices provided by independent pricing services or market makers; (d) Options not listed on an exchange are valued by an independent source using an industry accepted model, such as Black-Scholes; (e) Centrally cleared swap agreements are valued using a price provided by an independent pricing service; (f) OTC swap agreements are valued using a price provided by an independent pricing service; (g) Forward foreign currency exchange contracts are valued utilizing current and forward rates obtained from an independent pricing service. Such prices from the third party pricing service are for specific settlement periods and each Portfolio’s forward foreign currency exchange contracts are valued at an interpolated rate between the closest preceding and subsequent period reported by the independent pricing service; and (h) Securities for which market prices are not provided by any of the above methods may be valued based upon quotes furnished by brokers.
The prospectuses of the open-end registered investment companies in which each Portfolio may invest explain the circumstances under which they will use fair value pricing and the effects of using fair value pricing.
Foreign securities’ (including forward foreign currency exchange contracts) prices are converted into U.S. dollar
amounts using the applicable exchange rates as of Market Close. If market quotations are available and believed to be reliable for foreign exchange-traded equity securities, the securities will be valued at the market quotations. Because trading hours for certain foreign securities end before Market Close, closing market quotations may become unreliable. An independent pricing service determines the degree of certainty, based on historical data, that the closing price in the principal market where a foreign security trades is not the current value as of Market Close. Foreign securities’ prices meeting the approved degree of certainty that the price is not reflective of current value will be valued by the independent pricing service using pricing models designed to estimate likely changes in the values of those securities between the times in which the trading in those securities is substantially completed and Market Close. Multiple factors may be considered by the independent pricing service in determining the value of such securities and may include information relating to sector indices, American Depositary Receipts and domestic and foreign index futures.
All other assets for which market quotations are not readily available or became unreliable (or if the above fair valuation methods are unavailable or determined to be unreliable) are valued at fair value as determined in good faith by or under the supervision of the Board following procedures approved by the Board. The Board has delegated to the Investment Adviser responsibility for overseeing the implementation of the Portfolios’ valuation procedures; a “Pricing Committee” comprised of employees of the Investment Adviser or its affiliates has responsibility for applying the fair valuation methods set forth in the procedures and, if a fair valuation cannot be determined pursuant to the fair valuation methods, determining the fair value of assets held by the Portfolios. Issuer specific events, transaction price, position size, nature and duration of restrictions on disposition of the security, market trends, bid/ask quotes of brokers and other market data may be reviewed in the course of making a good faith determination of a security’s fair value. Valuations change in response to many factors including the historical and prospective earnings of the issuer, the value of the issuer’s assets, general economic conditions, interest rates, investor perceptions and market liquidity. Because of the inherent uncertainties of fair valuation, the values used to determine each Portfolio’s NAV may materially differ from the value received upon actual sale of those investments. Thus, fair valuation may have an unintended dilutive or accretive effect on the value of shareholders’ investments in each Portfolio.
Each investment asset or liability of the Portfolios is assigned a level at measurement date based on the significance and source of the inputs to its valuation.
16
NOTES TO FINANCIAL STATEMENTS AS OF DECEMBER 31, 2021 (CONTINUED)
NOTE 2 — SIGNIFICANT ACCOUNTING POLICIES (continued)
Quoted prices in active markets for identical securities are classified as “Level 1,” inputs other than quoted prices for an asset or liability that are observable are classified as “Level 2” and significant unobservable inputs, including the sub-advisers’ or Pricing Committee’s judgment about the assumptions that a market participant would use in pricing an asset or liability are classified as “Level 3.” The inputs used for valuing securities are not necessarily an indication of the risks associated with investing in those securities. Short-term securities of sufficient credit quality are generally considered to be Level 2 securities under applicable accounting rules. A table summarizing the Portfolios’ investments under these levels of classification is included within the Portfolio of Investments.
GAAP requires a reconciliation of the beginning to ending balances for reported fair values that presents changes attributable to total realized and unrealized gains or losses, purchases and sales, and transfers in or out of the Level 3 category during the period. A reconciliation of Level 3 investments within the Portfolio of Investments is presented only when a Portfolio has a significant amount of Level 3 investments.
B. Securities Transactions and Revenue Recognition. Securities transactions are accounted for on the trade date. Realized gains and losses are reported on the basis of identified cost of securities sold. Interest income is recorded on an accrual basis. Dividend income is recorded on the ex-dividend date, or for certain foreign securities, when the information becomes available to the Portfolios. Premium amortization and discount accretion are determined by the effective yield method.
C. Foreign Currency Translation. The books and records of the Portfolios are maintained in U.S. dollars. Any foreign currency amounts are translated into U.S. dollars on the following basis:
| (1) | | Market value of investment securities, other assets and liabilities — at the exchange rates prevailing at Market Close. |
| | | |
| (2) | | Purchases and sales of investment securities, income and expenses — at the rates of exchange prevailing on the respective dates of such transactions. |
Although the net assets and the market values are presented at the foreign exchange rates at Market Close, the Portfolios do not isolate the portion of their results of operations resulting from changes in foreign exchange rates on investments from the fluctuations arising from changes in market prices of securities held. Such fluctuations are included with the net realized and
unrealized gains or losses from investments. For securities, which are subject to foreign withholding tax upon disposition, liabilities are recorded on the Statement of Assets and Liabilities for the estimated tax withholding based on the securities’ current market value. Upon disposition, realized gains or losses on such securities are recorded net of foreign withholding tax.
Reported net realized foreign exchange gains or losses arise from sales of foreign currencies, currency gains or losses realized between the trade and settlement dates on securities transactions, the difference between the amounts of dividends, interest, and foreign withholding tax reclaims recorded on the Portfolios’ books, and the U.S. dollar equivalent of the amounts actually received or paid. Net unrealized foreign exchange gains and losses arise from changes in the value of assets and liabilities other than investments in securities, resulting from changes in the exchange rate. Foreign security and currency transactions may involve certain considerations and risks not typically associated with investing in U.S. companies and U.S. government securities. These risks include, but are not limited to, revaluation of currencies and future adverse political and economic developments which could cause securities and their markets to be less liquid and prices more volatile than those of comparable U.S. companies and U.S. government securities. The foregoing risks are even greater with respect to securities of issuers in emerging markets.
D. Distributions to Shareholders. Net investment income dividends and net capital gain distributions, if any, for Bond Portfolio are declared and paid annually. For BlackRock Inflation Protected Bond, dividends from net investment income, if any, are declared and paid monthly and distributions of net capital gains, if any, are declared and paid annually. The Portfolios may make distributions on a more frequent basis to comply with the distribution requirements of the Internal Revenue Code. The characteristics of income and gains to be distributed are determined in accordance with income tax regulations, which may differ from GAAP for investment companies.
E. Federal Income Taxes. It is the policy of each Portfolio to comply with the requirements of subchapter M of the Internal Revenue Code that are applicable to regulated investment companies and to distribute substantially all of its net investment income and any net realized capital gains to its shareholders. Therefore, a federal income tax or excise tax provision is not required. Management has considered the sustainability of the Portfolios’ tax positions taken on federal income tax returns for all open tax years in making this determination. No capital gain distributions shall be made until the capital loss carryforwards have been fully utilized.
17
NOTES TO FINANCIAL STATEMENTS AS OF DECEMBER 31, 2021 (CONTINUED)
NOTE 2 — SIGNIFICANT ACCOUNTING POLICIES (continued)
The Portfolios may utilize equalization accounting for tax purposes, whereby a portion of redemption payments are treated as distributions of income or gain.
F. Use of Estimates. The preparation of financial statements in conformity with GAAP requires management to make estimates and assumptions that affect the reported amounts of assets and liabilities and disclosure of contingent assets and liabilities at the date of the financial statements and the reported amounts of increases and decreases in net assets from operations during the reporting period. Actual results could differ from those estimates.
G. Risk Exposures and the Use of Derivative Instruments. The Portfolios’ investment strategies permit the Portfolios to enter into various types of derivatives contracts, including, but not limited to, futures contracts, forward foreign currency exchange contracts, credit default swaps, interest rate swaps, total return swaps, and purchased and written options. In doing so, a Portfolio will employ strategies in differing combinations to permit it to increase or decrease the level of risk, or change the level or types of exposure to risk factors. This may allow a Portfolio to pursue its objectives more quickly, and efficiently than if it were to make direct purchases or sales of securities capable of affecting a similar response to market or credit factors.
In pursuit of its investment objectives, a Portfolio may seek to increase or decrease its exposure to the following market or credit risk factors:
Credit Risk. The price of a bond or other debt instrument is likely to fall if the issuer’s actual or perceived financial health deteriorates, whether because of broad economic or issuer-specific reasons. In certain cases, the issuer could be late in paying interest or principal, or could fail to pay its financial obligations altogether.
Equity Risk. Stock prices may be volatile or have reduced liquidity in response to real or perceived impacts of factors including, but not limited to, economic conditions, changes in market interest rates, and political events. Stock markets tend to be cyclical, with periods when stock prices generally rise and periods when stock prices generally decline. Any given stock market segment may remain out of favor with investors for a short or long period of time, and stocks as an asset class may underperform bonds or other asset classes during some periods. Additionally, legislative, regulatory or tax policies or developments in these areas may adversely impact the investment techniques available to a manager, add to costs and impair the ability of a Portfolio to achieve its investment objectives.
Foreign Exchange Rate Risk. To the extent that a Portfolio invests directly in foreign (non-U.S.) currencies or in securities denominated in, or that trade in, foreign (non-U.S.) currencies, it is subject to the risk that those foreign (non-U.S.) currencies will decline in value relative to the U.S. dollar or, in the case of hedging positions, that the U.S. dollar will decline in value relative to the currency being hedged by a Portfolio through foreign currency exchange transactions.
Currency rates may fluctuate significantly over short periods of time. Currency rates may be affected by changes in market interest rates, intervention (or the failure to intervene) by U.S. or foreign governments, central banks or supranational entities such as the International Monetary Fund, by the imposition of currency controls, or other political or economic developments in the United States or abroad.
Interest Rate Risk. With bonds and other fixed rate debt instruments, a rise in market interest rates generally causes values to fall; conversely, values generally rise as market interest rates fall. The higher the credit quality of the instrument, and the longer its maturity or duration, the more sensitive it is likely to be to interest rate risk. In the case of inverse securities, the interest rate paid by the securities is a floating rate, which generally will decrease when the market rate of interest to which the inverse security is indexed increases and will increase when the market rate of interest to which the inverse security is indexed decreases. As of the date of this report, the United States experiences a low interest rate environment, which may increase a Portfolio’s exposure to risks associated with rising market interest rates. Rising market interest rates could have unpredictable effects on the markets and may expose fixed-income and related markets to heightened volatility. For a fund that invests in fixed-income securities, an increase in market interest rates may lead to increased redemptions and increased portfolio turnover, which could reduce liquidity for certain investments, adversely affect values, and increase costs. If dealer capacity in fixed-income markets is insufficient for market conditions, it may further inhibit liquidity and increase volatility in the fixed-income markets. Further, recent and potential changes in government policy may affect interest rates.
Risks of Investing in Derivatives. A Portfolio’s use of derivatives can result in losses due to unanticipated changes in the market or credit risk factors and the overall market. In instances where a Portfolio is using derivatives to decrease, or hedge, exposures to market or credit risk factors for securities held by a Portfolio, there are also risks that those derivatives may not perform as expected resulting in losses for the combined or hedged positions.
18
NOTES TO FINANCIAL STATEMENTS AS OF DECEMBER 31, 2021 (CONTINUED)
NOTE 2 — SIGNIFICANT ACCOUNTING POLICIES (continued)
Derivative instruments are subject to a number of risks, including the risk of changes in the market price of the underlying securities, credit risk with respect to the counterparty, risk of loss due to changes in market interest rates and liquidity and volatility risk. The amounts required to purchase certain derivatives may be small relative to the magnitude of exposure assumed by a Portfolio. Therefore, the purchase of certain derivatives may have an economic leveraging effect on a Portfolio and exaggerate any increase or decrease in the NAV. Derivatives may not perform as expected, so a Portfolio may not realize the intended benefits. When used for hedging purposes, the change in value of a derivative may not correlate as expected with the currency, security or other risk being hedged. When used as an alternative or substitute for direct cash investments, the return provided by the derivative may not provide the same return as direct cash investment. In addition, given their complexity, derivatives expose a Portfolio to the risk of improper valuation.
Generally, derivatives are sophisticated financial instruments whose performance is derived, at least in part, from the performance of an underlying asset or assets. Derivatives include, among other things, swap agreements, options, forwards and futures. Investments in derivatives are generally negotiated OTC with a single counterparty and as a result are subject to credit risks related to the counterparty’s ability or willingness to perform its obligations; any deterioration in the counterparty’s creditworthiness could adversely affect the value of the derivative. In addition, derivatives and their underlying securities may experience periods of illiquidity which could cause a Portfolio to hold a security it might otherwise sell, or to sell a security it otherwise might hold at inopportune times or at an unanticipated price. A manager might imperfectly judge the direction of the market. For instance, if a derivative is used as a hedge to offset investment risk in another security, the hedge might not correlate to the market’s movements and may have unexpected or undesired results such as a loss or a reduction in gains.
Counterparty Credit Risk and Credit Related Contingent Features. Certain derivative positions are subject to counterparty credit risk, which is the risk that the counterparty will not fulfill its obligation to a Portfolio. Each Portfolio’s derivative counterparties are financial institutions who are subject to market conditions that may weaken their financial position. A Portfolio intends to enter into financial transactions with counterparties that it believes to be creditworthy at the time of the transaction. To reduce this risk, a Portfolio has entered into master netting arrangements, established within each Portfolio’s
International Swap and Derivatives Association, Inc. (“ISDA”) Master Agreements (“Master Agreements”). These Master Agreements are with select counterparties and they govern transactions, including certain OTC derivative and forward foreign currency contracts, entered into by a Portfolio and the counterparty. The Master Agreements maintain provisions for general obligations, representations, agreements, collateral, and events of default or termination. The occurrence of a specified event of termination may give a counterparty the right to terminate all of its contracts and affect settlement of all outstanding transactions under the applicable Master Agreement.
A Portfolio may also enter into collateral agreements with certain counterparties to further mitigate counterparty credit risk on OTC derivative and forward foreign currency contracts. Subject to established minimum levels, collateral is generally determined based on the net aggregate unrealized gain or loss on contracts with a certain counterparty. Collateral pledged to or from a Portfolio is held in a segregated account by a third-party agent and can be in the form of cash or debt securities issued by the U.S. government or related agencies.
At December 31, 2021, the maximum amount of loss that BlackRock Inflation Protected Bond would incur if the counterparties to its derivative transactions failed to perform would be $2,954,576 which represents the gross payments to be received by the Portfolio on OTC purchased options, forward foreign currency contracts, and OTC interest rate swaps were they to be unwound as of December 31, 2021. At December 31, 2021, BlackRock Inflation Protected Bond had received $1,532,000 in cash collateral from certain counterparties.
Each Portfolio has credit related contingent features that if triggered would allow its derivative counterparties to close out and demand payment or additional collateral to cover their exposure from a Portfolio. Credit related contingent features are established between a Portfolio and its derivatives counterparties to reduce the risk that a Portfolio will not fulfill its payment obligations to its counterparties. These triggering features include, but are not limited to, a percentage decrease in a Portfolio’s net assets and/or a percentage decrease in a Portfolio’s NAV, which could cause a Portfolio to accelerate payment of any net liability owed to the counterparty. The contingent features are established within each Portfolio’s Master Agreements.
At December 31, 2021, BlackRock Inflation Protected Bond had a liability position of $1,907,512 on forward foreign currency contracts, OTC written options and OTC interest rate swaps with credit related contingent features. If a contingent feature would have been triggered as of December 31, 2021, the Portfolio could have been required to pay this amount in cash to its counterparties. At
19
NOTES TO FINANCIAL STATEMENTS AS OF DECEMBER 31, 2021 (CONTINUED)
NOTE 2 — SIGNIFICANT ACCOUNTING POLICIES (continued)
December 31, 2021, BlackRock Inflation Protected Bond pledged $360,000 in cash collateral for its open OTC derivative transactions.
H. Forward Foreign Currency Contracts. A Portfolio may enter into forward foreign currency contracts primarily to hedge against foreign currency exchange rate risk on its non-U.S. dollar denominated investment securities. When entering into a forward foreign currency contract, a Portfolio agrees to receive or deliver a fixed quantity of foreign currency for an agreed-upon price on an agreed future date. These contracts are valued daily and a Portfolio’s net equity therein, representing unrealized gain or loss on the contracts as measured by the difference between the forward foreign exchange rates at the dates of entry into the contracts and the forward rates at the reporting date, is included in the Statements of Assets and Liabilities. Realized and unrealized gains and losses are included in the Statements of Operations. These instruments involve market and/or credit risk in excess of the amount recognized in the Statements of Assets and Liabilities. Risks arise from the possible inability of counterparties to meet the terms of their contracts and from movement in currency and securities values and interest rates. Open forward foreign currency contracts are presented within the Portfolio of Investments.
For the year ended December 31, 2021, BlackRock Inflation Protected Bond had entered into forward foreign currency contracts with the obligation to buy and sell specified foreign currencies in the future at a currently negotiated forward rate in order to increase or decrease exposure to foreign exchange rate risk. The Portfolio uses forward foreign currency contracts primarily to protect any non-U.S. dollar-denominated holdings from adverse currency movements and to gain exposure to currencies for the purposes of risk management or enhanced return.
During the year ended December 31, 2021, BlackRock Inflation Protected Bond had average contract amounts of $9,640,310 and $19,245,263 on forward foreign currency contracts purchased and sold, respectively. Please refer to the tables within the Portfolio of Investments for open forward foreign currency contracts at December 31, 2021.
I. Futures Contracts. Each Portfolio may enter into futures contracts involving foreign currency, interest rates, securities and security indices. A futures contract is a commitment to buy or sell a specific amount of a financial instrument at a negotiated price on a stipulated future date. Each Portfolio may buy and sell futures contracts. Futures contracts traded on a commodities or futures exchange will be valued at the final settlement price or official closing price on the principal exchange as reported by such
principal exchange at its trading session ending at, or most recently prior to, the time when a Portfolio’s assets are valued.
Upon entering into a futures contract, a Portfolio is required to deposit either cash or securities (initial margin) in an amount equal to a certain percentage of the contract value. Subsequent payments (variation margin) are made or received by a Portfolio each day. The variation margin payments are equal to the daily changes in the contract value and are recorded as unrealized gains and losses and included within Cash collateral for futures contracts on the Statement of Assets and Liabilities. Open futures contracts are reported on a table within the Portfolio of Investments. Securities held in collateralized accounts to cover initial margin requirements on open futures contracts are footnoted in the Portfolio of Investments. Cash collateral held by the broker to cover initial margin requirements on open futures contracts are noted in the Statements of Assets and Liabilities. The net change in unrealized appreciation and depreciation is reported in the Statements of Operations. Realized gains (losses) are reported in the Statements of Operations at the closing or expiration of futures contracts.
Futures contracts are exposed to the market risk factor of the underlying financial instrument. Additional associated risks of entering into futures contracts include the possibility that there may be an illiquid market where a Portfolio is unable to liquidate the contract or enter into an offsetting position and, if used for hedging purposes, the risk that the price of the contract will correlate imperfectly with the prices of a Portfolio’s securities. With futures, there is minimal counterparty credit risk to a Portfolio since futures are exchange traded and the exchange’s clearinghouse, as counterparty to all exchange traded futures, guarantees the futures against default. During the year ended December 31, 2021, BlackRock Inflation Protected Bond and Bond Portfolio had purchased and sold futures contracts on various bonds and notes as part of their duration strategy. During the year ended December 31, 2021, the following Portfolios had average notional values on futures contracts purchased and sold as disclosed below:
| | Purchased | | Sold |
|---|
| BlackRock Inflation Protected Bond | | $ | 79,136,617 | | | $ | 61,341,819 | |
| Bond Portfolio | | | 7,687,875 | | | | 30,842,961 | |
Please refer to the tables within each respective Portfolio of Investments for the above Portfolios’ open futures contracts at December 31, 2021.
At December 31, 2021, BlackRock Inflation Protected Bond had pledged U.S. Treasuries with an original par value of $803,000 as collateral for open futures contracts.
20
NOTES TO FINANCIAL STATEMENTS AS OF DECEMBER 31, 2021 (CONTINUED)
NOTE 2 — SIGNIFICANT ACCOUNTING POLICIES (continued)
J. Options Contracts. The Portfolios may purchase put and call options and may write (sell) put options and covered call options. The Portfolios may engage in option transactions as a hedge against adverse movements in the value of portfolio holdings or to increase market exposure. Option contracts are valued daily and unrealized gains or losses are recorded based upon the last sales price on the principal exchange on which the options are traded. An amount equal to the premium received by the Portfolios upon the writing of a put or call option is included in the Statements of Assets and Liabilities as a liability which is subsequently marked-to-market until it is exercised or closed, or it expires. The Portfolios will realize a gain or loss upon the expiration or closing of the option contract. When an option is exercised, the proceeds on sales of the underlying security for a written call option, the purchase cost of the security for a written put option, or the cost of the security for a purchased put or call option is adjusted by the amount of premium received or paid. Realized and unrealized gains or losses on option contracts are reflected in the accompanying financial statements. The risk in writing a covered call option is that a Portfolio gives up the opportunity for profit if the market price of the security increases and the option is exercised. The risk in writing a put option is that a Portfolio may incur a loss if the market price of the security decreases and the option is exercised. The risk in buying an option is that a Portfolio pays a premium whether or not the option is exercised. Risks may also arise from an illiquid secondary market or from the inability of counterparties to meet the terms of the contract.
During the year ended December 31, 2021, BlackRock Inflation Protected Bond had purchased and written exchange-traded futures contracts to manage its duration strategy and to generate income. BlackRock Inflation Protected Bond had average notional values of $16,852,631 and $14,381,614, respectively, on purchased and written exchange-traded futures contracts. Please refer to the tables within the Portfolio of Investments for open purchased and written options on exchange-traded futures contracts at December 31, 2021.
During the year ended December 31, 2021, BlackRock Inflation Protected Bond had purchased and written interest rate swap options (“swaptions”) to manage its duration strategy and to generate income. BlackRock Inflation Protected Bond had average notional values of $54,319,339 and $165,509,755, respectively, on purchased and written interest rate swaptions. Please refer to the tables within the Portfolio of Investments for open purchased and written interest rate swaptions at December 31, 2021.
During the year ended December 31, 2021, BlackRock Inflation Protected Bond had purchased foreign currency options to manage its foreign exchange exposure. BlackRock Inflation Protected Bond had an average notional value of $737,016 on purchased foreign currency options. There were no open purchased foreign currency options at December 31, 2021.
During the year ended December 31, 2021, BlackRock Inflation Protected Bond had purchased and written inflation rate caps to gain exposure to interest rates and generate income as disclosed below. There were no open purchased and written inflation rate caps at December 31, 2021.
| | | Purchased | | Written |
| Inflation rate caps | | $ | 17,550,000 | | | $ | 17,550,000 | |
K. Swap Agreements. The Portfolios may enter into swap agreements. A swap is an agreement between two parties pursuant to which each party agrees to make one or more payments to the other at specified future intervals based on the return of an asset (such as a stock, bond or currency) or non-asset reference (such as an interest rate or index). Swap agreements are privately negotiated in the OTC market and may be executed in a multilateral or other trade facility platform, such as a registered commodities exchange (“centrally cleared swaps”).
The swap agreement will specify the “notional” amount of the asset or non-asset reference to which the contract relates. Subsequent changes in market value, if any, are calculated based upon changes in the performance of the asset or non-asset reference multiplied by the notional value of the contract. The Portfolios may enter into credit default, interest rate, total return and currency swaps to manage its exposure to credit, currency and interest rate risk. All outstanding swap agreements are reported within the Portfolio of Investments.
Swaps are marked to market daily using quotations primarily from third party pricing services, counterparties or brokers. The value of the swap contract is recorded on the Statements of Assets and Liabilities. During the term of the swap, changes in the value of the swap, if any, are recorded as unrealized gains or losses on the Statements of Operations. Upfront payments paid or received by a Portfolio when entering into the agreements are reported on the Statements of Assets and Liabilities and as a component of the changes in unrealized gains or losses on the Statements of Operations. These upfront payments represent the amounts paid or received when initially entering into the swap agreement to compensate for differences between the stated terms of the swap agreement and the prevailing market conditions. The upfront payments are included as a component in the realized gains or losses on the Statements of Operations
21
NOTES TO FINANCIAL STATEMENTS AS OF DECEMBER 31, 2021 (CONTINUED)
NOTE 2 — SIGNIFICANT ACCOUNTING POLICIES (continued)
upon termination or maturity of the swap. A Portfolio also records net periodic payments paid or received on the swap contract as a realized gain or loss on the Statements of Operations.
In a centrally cleared swap, immediately following execution of the swap agreement, the swap agreement is novated to a central counterparty (the “CCP”) and a Portfolio’s counterparty on the swap agreement becomes the CCP. A Portfolio is required to interface with the CCP through a broker. Upon entering into a centrally cleared swap, a Portfolio is required to deposit initial margin with the broker in the form of cash or securities in an amount that varies depending on the size and risk profile of the particular swap. Securities deposited as initial margin are footnoted as pledged on the Portfolio of Investments and cash deposited is recorded on the Statements of Assets and Liabilities as cash pledged for centrally cleared swaps. The daily change in valuation of centrally cleared swaps is recorded as a receivable or payable for variation margin in the Statements of Assets and Liabilities. Payments received from (paid to) the counterparty, including at termination, are recorded as realized gain (loss) on the Statements of Operations.
Entering into swap agreements involves the risk that the maximum potential loss of an investment exceeds the current value of the investment as reported on the Statements of Assets and Liabilities. Other risks involve the possibility that the counterparty to the agreements may default on its obligation to perform, that there will be no liquid market for these investments and that unfavorable changes in the market will have a negative impact on the value of the index or securities underlying the respective swap agreement.
Interest Rate Swap Contracts. An interest rate swap involves the agreement between counterparties to exchange periodic payments based on interest rates. One payment will be based on a floating rate of a specified interest rate while the other will be a fixed rate. Risks involve the future fluctuations of interest rates in which a Portfolio may make payments that are greater than what a Portfolio received from the counterparty. Other risks include credit, liquidity and market risk.
For the year ended December 31, 2021, BlackRock Inflation Protected Bond had entered into interest rate swaps in which they pay a floating interest rate and receive a fixed interest rate (“Long interest rate swap”) in order to increase exposure to interest rate risk. Average notional amount on long interest rate swaps for BlackRock Inflation Protected Bond was $45,160,273.
For the year ended December 31, 2021, BlackRock Inflation Protected Bond had entered into interest rate swaps in which they pay a fixed interest rate and receives a floating interest rate (“Short interest rate swap”) in order to decrease exposure to interest rate risk. Average notional amount on short interest rate swaps for BlackRock Inflation Protected Bond was $68,218,687.
The Portfolios enter into interest rate swaps to adjust interest rate and yield curve exposures and to substitute for physical fixed-income securities. Please refer to the tables within the Portfolio of Investments for BlackRock Inflation Protected Bond for open interest rate swaps at December 31, 2021.
At December 31, 2021, BlackRock Inflation Protected Bond pledged $4,179,490 in cash collateral for open centrally cleared swaps.
Inflation-linked Swap Contracts. In an inflation-linked swap, one party pays a fixed interest rate on a notional amount while the other party pays a floating rate linked to an inflation index on that same notional amount. The party paying the floating rate pays the inflation adjusted rate multiplied by the notional amount.
For the year ended December 31, 2021, BlackRock Inflation Protected Bond had entered into inflation-linked swaps in which they pay a floating rate linked to an inflation index and receive a fixed interest rate (“Long inflation-linked swap”). Average notional amount on long inflation-linked swaps for BlackRock Inflation Protected Bond was $32,652,765.
For the year ended December 31, 2021, BlackRock Inflation Protected Bond had entered into inflation-linked swaps in which it pays a fixed interest rate and receives a floating rate linked to an inflation index (“Short inflation-linked swap”). Average notional amount on short inflation linked-bonds was $155,507,184.
BlackRock Inflation Protected Bond used inflation-linked swaps as part of their inflation strategy. Please refer to the tables within the Portfolio of Investments for BlackRock Inflation Protected Bond for open inflation-linked swaps at December 31, 2021.
L. Inflation-Indexed Bonds. Inflation-indexed bonds are fixed income securities whose principal value is periodically adjusted according to the rate of inflation. If the index measuring inflation rises or falls, the principal value of inflation-indexed bonds will be adjusted upward or downward, and consequently the interest payable on these securities (calculated with respect to a larger or smaller principal amount) will be increased or reduced, respectively. Any upward or downward adjustment in the principal amount of an inflation-indexed bond will be
22
NOTES TO FINANCIAL STATEMENTS AS OF DECEMBER 31, 2021 (CONTINUED)
NOTE 2 — SIGNIFICANT ACCOUNTING POLICIES (continued)
included in interest income in the Statement of Operations, even though investors do not receive their principal until maturity. Repayment of the original bond principal upon maturity (as adjusted for inflation) is guaranteed in the case of US Treasury inflation-indexed bonds. For bonds that do not provide a similar guarantee, the adjusted principal value of the bond repaid at maturity may be less than the original principal.
M. Securities Lending. Each Portfolio may temporarily loan up to 33 1/3% of its total assets to brokers, dealers or other financial institutions in exchange for a negotiated lender’s fee. Securities lending involves two primary risks: “investment risk” and “borrower default risk.” When lending securities, the Portfolios will receive cash or U.S. government securities as collateral. Investment risk is the risk that the Portfolios will lose money from the investment of the cash collateral received from the borrower. Borrower default risk is the risk that the Portfolios will lose money due to the failure of a borrower to return a borrowed security. Loans are subject to termination at the option of the borrower or the Portfolios. Securities lending may result in leverage. The use of leverage may exaggerate any increase or decrease in the NAV, causing the Portfolios to be more volatile. The use of leverage may increase expenses and increase the impact of the Portfolios’ other risks.
N. Indemnifications. In the normal course of business, the Portfolios may enter into contracts that provide certain indemnifications. The Trusts’ maximum exposure under these arrangements is dependent on future claims that may be made against the Portfolios and, therefore, cannot be estimated; however, based on experience, management considers the risk of loss from such claims remote.
NOTE 3 — INVESTMENT TRANSACTIONS
For the year ended December 31, 2021, the cost of purchases and the proceeds from the sales of securities, excluding U.S. government and short-term securities were as follows:
| | | Purchases | | Sales |
| BlackRock Inflation Protected Bond | | $ | 176,565,308 | | | $ | 154,620,082 | |
| Bond Portfolio | | | 47,788,323 | | | | 128,273,576 | |
U.S. government securities not included above were as follows:
| | | Purchases | | Sales |
| BlackRock Inflation Protected Bond | | $ | 319,665,746 | | | $ | 313,583,977 | |
| Bond Portfolio | | | 181,419,531 | | | | 58,451,263 | |
NOTE 4 — INVESTMENT MANAGEMENT FEES
The Portfolios have entered into investment management agreements (“Management Agreements”) with the Investment Adviser. The Investment Adviser has overall responsibility for the management of the Portfolios. The Investment Adviser oversees all investment management and portfolio management services for the Portfolios and assists in managing and supervising all aspects of the general day-to-day business activities and operations of the Portfolios, including custodial, transfer agency, dividend disbursing, accounting, auditing, compliance and related services. Each Management Agreement compensates the Investment Adviser with a management fee, computed daily and payable monthly, based on the average daily net assets of each Portfolio, at the following annual rates:
| Portfolio | | Fee |
BlackRock Inflation Protected Bond(1) | | 0.55% on the first $200 million; 0.50% on the next $800 million; and 0.40% thereafter |
| Bond Portfolio | | 0.50% on the first $750 million; and 0.48% thereafter |
(1) | | Effective September 1, 2021, the Investment Adviser has contractually agreed to waive 0.05% of the management fee. Any fees waived or reimbursed are not eligible for recoupment. Termination or modification of this obligation requires approval by the Board. Prior to September 1, 2021, the management fee waiver was 0.04%. |
The Investment Adviser has entered into sub-advisory agreements with each sub-adviser. These sub-advisers provide investment advice for the Portfolios and are paid by the Investment Adviser based on the average daily net assets of each Portfolio. Subject to such policies as the Board or the Investment Adviser may determine, the sub-advisers manage each Portfolio’s assets in accordance with that Portfolio’s investment objectives, policies, and limitations.
| Portfolio | | Sub-Adviser |
| BlackRock Inflation Protected Bond | | BlackRock Financial Management, Inc. |
| Bond Portfolio | | Brandywine Global Investment Management, LLC |
NOTE 5 — DISTRIBUTION AND SERVICE FEE
Voya Investors Trust has entered into a shareholder service plan (the “Plan”) for the Class S shares of BlackRock Inflation Protected Bond. The Plan compensates the Distributor for the provision of shareholder services and/or account maintenance services to direct or indirect beneficial owners of Class S shares. Under the Plan, the Portfolio makes payments to the Distributor at an annual rate of 0.25% of the Portfolio’s average daily net assets attributable to Class S shares.
23
NOTES TO FINANCIAL STATEMENTS AS OF DECEMBER 31, 2021 (CONTINUED)
NOTE 5 — DISTRIBUTION AND SERVICE FEE (continued)
Class ADV shares of BlackRock Inflation Protected Bond have a shareholder service and distribution plan. The Portfolio pays the Distributor a shareholder service fee of 0.25% and a distribution fee of 0.35% of the Portfolio’s average daily net assets attributable to Class ADV shares.
NOTE 6 — OTHER TRANSACTIONS WITH AFFILIATES AND RELATED PARTIES
At December 31, 2021, the following direct or indirect, wholly-owned subsidiaries of Voya Financial, Inc. or affiliated investment companies owned more than 5% of the following Portfolios:
Subsidiary/Affiliated
Investment Company | | Portfolio | | Percentage |
| Voya Institutional Trust Company | | BlackRock Inflation Protected Bond | | | 18.47 | % |
| Voya Solution 2025 Portfolio | | Bond Portfolio | | | 17.70 | |
| Voya Solution 2035 Portfolio | | Bond Portfolio | | | 7.86 | |
| Voya Solution Income Portfolio | | Bond Portfolio | | | 11.46 | |
The Portfolios have adopted a deferred compensation plan (the “DC Plan”), which allows eligible independent trustees, as described in the DC Plan, to defer the receipt of all or a portion of the trustees’ fees that they are entitled to receive from the Portfolios. For purposes of determining the amount owed to the trustee under the DC Plan, the amounts deferred are invested in shares of the funds selected by the trustee (the “Notional Funds”). When the Portfolios purchase shares of the Notional Funds, which are all advised by Voya Investments, in amounts equal to the trustees’ deferred fees, this results in a Portfolio asset equal to the deferred compensation liability. Such assets, if applicable, are included as a component of “Other assets” on the accompanying Statements of Assets and Liabilities. Deferral of trustees’ fees under the DC Plan will not affect net assets of the Portfolios, and will not materially affect a Portfolio’s assets, liabilities or net investment income per share. Amounts will be deferred until distributed in accordance with the DC Plan.
The Portfolios may pay per account fees to affiliates of Voya Investments for recordkeeping services provided on certain assets. For the year ended December 31, 2021, the per account fees for affiliated recordkeeping services paid by each Portfolio were as follows:
| Portfolio | | Amount |
| BlackRock Inflation Protected Bond | | $ | 79,957 | |
| Bond Portfolio | | | — | |
NOTE 7 — EXPENSE LIMITATION AGREEMENTS
The Investment Adviser has entered into written expense limitation agreements (“Expense Limitation Agreements”) with the below Portfolios, whereby the Investment Adviser has agreed to limit expenses, excluding interest, taxes, investment-related costs, leverage expenses, extraordinary expenses, and acquired fund fees and expenses to the levels listed below:
| Portfolio | | Maximum Operating Expense Limit
(as a percentage of net assets) |
| BlackRock Inflation Protected Bond | | Class ADV: 1.23%
Class I: 0.63%
Class S: 0.88% |
| Bond Portfolio | | 0.58% |
With the exception of the non-recoupable management fee waiver for BlackRock Inflation Protected Bond, the Investment Adviser may, at a later date, recoup from a Portfolio for fees waived and/or other expenses reimbursed by the Investment Adviser during the previous 36 months, but only if, after such recoupment, a Portfolio’s expense ratio does not exceed the percentage described above. Waived and reimbursed fees net of any recoupment by the Investment Adviser of such waived and reimbursed fees are reflected on the accompanying Statements of Operations. Amounts payable by the Investment Adviser are reflected on the accompanying Statements of Assets and Liabilities.
As of December 31, 2021, the amounts of waived and/or reimbursed fees that are subject to possible recoupment by the Investment Adviser and the related expiration dates, are as follows:
| | | December 31, | | | | |
| Portfolio | | 2022 | | 2023 | | 2024 | | Total |
| Bond Portfolio | | $ | 46,992 | | | $ | — | | | $ | — | | | $ | 46,992 | |
The Expense Limitation Agreements are contractual through May 1, 2022 and shall renew automatically for one-year terms. Termination or modification of these obligations requires approval by the Board.
NOTE 8 — LINE OF CREDIT
Effective June 14, 2021, the Portfolios, in addition to certain other funds managed by the Investment Adviser, entered into a 364-day unsecured committed revolving line of credit agreement (the “Credit Agreement”) with The Bank of New York Mellon (“BNY”) for an aggregate amount of $400,000,000 through June 13, 2022. The proceeds may be used only to finance temporarily: (1) the purchase or sale of investment securities; or (2) the repurchase or redemption of shares of a Portfolio or certain other funds managed by the Investment Adviser. The funds to which the line of credit is available pay a commitment fee equal to 0.15% per annum on the daily unused portion of the
24
NOTES TO FINANCIAL STATEMENTS AS OF DECEMBER 31, 2021 (CONTINUED)
NOTE 8 — LINE OF CREDIT (continued)
committed line amount payable quarterly in arrears. Prior to June 14, 2021, the predecessor line of credit was for an aggregate amount of $400,000,000 and the funds to which the line of credit was available paid a commitment fee equal to 0.15% per annum on the daily unused portion of the committed line amount through June 14, 2021.
Borrowings under the Credit Agreement accrue interest at the federal funds rate plus a specified margin. Repayments generally must be made within 60 days after the date of a revolving credit advance.
The following Portfolio utilized the line of credit during the year ended December 31, 2021.
| Portfolio | | Days
Utilized | | Approximate
Average
Daily
Balance For
Days Utilized | | Approximate
Weighted
Average
Interest Rate
For Days
Utilized |
| BlackRock Inflation Protected Bond | | | 2 | | | $ | 2,146,500 | | | | 1.31 | % |
NOTE 9 — CAPITAL SHARES
Transactions in capital shares and dollars were as follows:
| | | Shares
sold | | Shares
issued in
merger | | Reinvestment
of
distributions | | Shares
redeemed | | Net increase
(decrease)
in shares
outstanding | | Shares
sold | | Proceeds
from shares
issued in
merger | | Reinvestment
of
distributions | | Shares
redeemed | | Net increase
(decrease) |
| Year or period ended | | # | | # | | # | | # | | # | | ($) | | ($) | | ($) | | ($) | | ($) |
BlackRock Inflation Protected Bond | | | | | | | | | | | | | | | | | | | | | | | | | | | | | |
Class ADV | | | | | | | | | | | | | | | | | | | | | | | | | | | | | | | | | | | | | | | | |
| 12/31/2021 | | | 1,290,830 | | | | — | | | | 109,761 | | | | (597,143 | ) | | | 803,448 | | | | 13,417,739 | | | | — | | | | 1,140,854 | | | | (6,152,184 | ) | | | 8,406,409 | |
| 12/31/2020 | | | 577,915 | | | | — | | | | 63,818 | | | | (796,757 | ) | | | (155,024 | ) | | | 5,686,844 | | | | — | | | | 627,703 | | | | (7,736,821 | ) | | | (1,422,274 | ) |
Class I | | | | | | | | | | | | | | | | | | | | | | | | | | | | | | | | | | | | | | | | |
| 12/31/2021 | | | 3,024,968 | | | | — | | | | 240,645 | | | | (3,264,739 | ) | | | 874 | | | | 32,490,424 | | | | — | | | | 2,597,120 | | | | (35,144,233 | ) | | | (56,689 | ) |
| 12/31/2020 | | | 3,301,547 | | | | — | | | | 146,726 | | | | (3,843,806 | ) | | | (395,533 | ) | | | 33,787,048 | | | | — | | | | 1,503,785 | | | | (38,878,240 | ) | | | (3,587,407 | ) |
Class S | | | | | | | | | | | | | | | | | | | | | | | | | | | | | | | | | | | | | | | | |
| 12/31/2021 | | | 3,522,483 | | | | — | | | | 378,853 | | | | (3,005,965 | ) | | | 895,371 | | | | 37,669,958 | | | | — | | | | 4,058,689 | | | | (31,911,870 | ) | | | 9,816,777 | |
| 12/31/2020 | | | 2,037,324 | | | | — | | | | 225,742 | | | | (2,105,881 | ) | | | 157,185 | | | | 20,491,321 | | | | — | | | | 2,299,314 | | | | (21,213,534 | ) | | | 1,577,101 | |
Bond Portfolio | | | | | | | | | | | | | | | | | | | | | | | | | | | | | | | | | | | | | |
| 12/31/2021 | | | 7,344,730 | | | | — | | | | 2,407,324 | | | | (5,631,258 | ) | | | 4,120,796 | | | | 86,294,017 | | | | — | | | | 27,082,394 | | | | (65,382,155 | ) | | | 47,994,256 | |
| 12/31/2020 | | | 19,460,953 | | | | — | | | | 684,573 | | | | (11,060,737 | ) | | | 9,084,789 | | | | 216,779,069 | | | | — | | | | 7,776,746 | | | | (125,915,207 | ) | | | 98,640,608 | |
NOTE 10 — SECURITIES LENDING
Under an agreement with BNY, the Portfolios can lend its securities to approved brokers, dealers and other financial institutions. Loans are collateralized by cash and U.S. government securities. The collateral must be equal to at least 105% of the market value of non-U.S. securities loaned and 102% of the market value of U.S. securities loaned. The market value of the loaned securities is determined at Market Close of a Portfolio at their last sale price or official closing price on the principal exchange or system on which they are traded and any additional collateral is delivered to a Portfolio on the next business day. The cash collateral received is invested in approved investments as defined in the Securities Lending Agreement with BNY (the “Agreement”). The Portfolios bear the risk of loss with respect to the investment of collateral with the following exception: BNY provides the Portfolios indemnification from loss with respect to the investment of collateral to the extent the cash collateral is invested in overnight repurchase agreements.
Cash collateral received in connection with securities lending is invested in cash equivalents, money market
funds, repurchase agreements with maturities of not more than 99 days that are collateralized with U.S. Government securities, or certain short-term investments that have a remaining maturity of 190 days or less (“Permitted Investments”). Short-term investments include: securities, units, shares or other participations in short-term investment funds, pools or trusts; commercial paper, notes, bonds or other debt obligations, certificates of deposit, time deposits and other bank obligations and asset-backed commercial paper backed by diversified receivables and repurchase-backed programs. Permitted Investments are subject to certain guidelines established by the Adviser regarding liquidity, diversification, credit quality and average credit life/duration requirements. The securities purchased with cash collateral received are reflected in the Portfolio of Investments under Short-Term Investments.
Generally, in the event of counterparty default, a Portfolio has the right to use the collateral to offset losses incurred. The Agreement contains certain guarantees by BNY in the event of counterparty default and/or a borrower’s failure to return a loaned security; however, there would be a potential loss to a Portfolio in the event a Portfolio is delayed
25
NOTES TO FINANCIAL STATEMENTS AS OF DECEMBER 31, 2021 (CONTINUED)
NOTE 10 — SECURITIES LENDING (continued)
or prevented from exercising its right to dispose of the collateral. Engaging in securities lending could have a leveraging effect, which may intensify the credit, market and other risks associated with investing in a portfolio.
At December 31, 2021, the Portfolios did not have any outstanding securities on loan.
NOTE 11 — FEDERAL INCOME TAXES
The amount of distributions from net investment income and net realized capital gains are determined in accordance with federal income tax regulations, which may differ from GAAP for investment companies. These book/tax differences may be either temporary or permanent. Permanent differences are reclassified within the capital accounts based on their federal tax-basis treatment; temporary differences are not reclassified. Key differences include the treatment of foreign currency transactions, futures contracts, paydowns, capital loss carryforwards, straddle loss deferrals and wash sale deferrals. Distributions in excess of net investment income and/or net realized capital gains for tax purposes are reported as return of capital.
Dividends paid by the Portfolios from net investment income and distributions of net realized short-term capital gains are, for federal income tax purposes, taxable as ordinary income to shareholders.
The tax composition of dividends and distributions to shareholders was as follows:
| | | Year Ended
December 31, 2021 | | Year Ended
December 31, 2020 |
| | | Ordinary
Income | | Long-term
Capital Gain | | Ordinary
Income | | Return of
Capital |
| BlackRock Inflation Protected Bond | | $ | 7,800,004 | | | $ | — | | | $ | 2,872,784 | | | $ | 1,558,018 | |
| Bond Portfolio | | | 24,050,464 | | | | 3,031,930 | | | | 7,776,746 | | | | — | |
The tax-basis components of distributable earnings and the capital loss carryforwards which may be used to offset future realized capital gains for federal income tax purposes as of December 31, 2021 were:
| | | Undistributed
Ordinary | | Undistributed
Long-term | | | Unrealized
Appreciation/ | | Capital Loss Carryforwards | | | | | | Total
Distributable |
| | | Income | | Capital Gain | | (Depreciation) | | Amount | | Character | | Expiration | | Other | | Earnings/(Loss) |
| BlackRock Inflation Protected Bond | | $ | 514,798 | | | $ | — | | | $ | 24,935,546 | | | $ | (1,477,247 | ) | | Short-term | | | None | | | $ | (779,238 | ) | | $ | (37,383,177 | ) |
| | | | | | | | | | | | | | | | (60,577,036 | ) | | Long-term | | | None | | | | | | | | | |
| | | | | | | | | | | | | | | $ | (62,054,283 | ) | | | | | | | | | | | | | | |
| Bond Portfolio | | | 11,931,574 | | | | 5,175,566 | | | | 4,960,459 | | | $ | — | | | — | | | — | | | | (14,739) | | | | 22,052,860 | |
The Portfolios’ major tax jurisdictions are U.S. federal, Arizona state, and Massachusetts state (BlackRock Inflation Protected Bond).
As of December 31, 2021, no provision for income tax is required in the Portfolios’ financial statements as a result of tax positions taken on federal and state income tax returns for open tax years. The Portfolios’ federal and state income and federal excise tax returns for tax years for which the applicable statutes of limitations have not expired are subject to examination by the Internal Revenue Service and state department of revenue. Generally, the preceding four tax years remain subject to examination by these jurisdictions.
NOTE 12 — LONDON INTERBANK OFFERED RATE (“LIBOR”)
In 2017, the UK Financial Conduct Authority announced its intention to cease compelling banks to provide the quotations needed to sustain LIBOR after 2021. On March 5, 2021, ICE Benchmark Administration, the administrator of LIBOR, stated that non-U.S. dollar LIBOR reference rates and the one-week and two-month LIBOR reference rates will cease to be provided or no longer be representative immediately after December 31, 2021 and the remaining more commonly used LIBOR settings will
cease to be provided or no longer be representative immediately after June 30, 2023. In addition, global regulators have announced that, with limited exceptions, no new LIBOR-based contracts should be entered into after 2021. Actions by regulators have resulted in the establishment of alternative reference rates to LIBOR in most major currencies (e.g., the Secured Overnight Financing Rate for U.S. Dollar LIBOR and the Sterling Overnight Interbank Average Rate for Sterling LIBOR).
Discontinuance of LIBOR and adoption/implementation of alternative rates pose a number of risks, including among
26
NOTES TO FINANCIAL STATEMENTS AS OF DECEMBER 31, 2021 (CONTINUED)
NOTE 12 — LONDON INTERBANK OFFERED RATE (“LIBOR”) (continued)
others whether any substitute rate will experience the market participation and liquidity necessary to provide a workable substitute for LIBOR; the effect on parties’ existing contractual arrangements, hedging transactions, and investment strategies generally from a conversion from LIBOR to alternative rates; the effect on a Portfolio’s existing investments (including, for example, fixed-income investments; senior loans; CLOs and CDOs; and derivatives transactions), including the possibility that some of those investments may terminate or their terms may be adjusted to the disadvantage of a Portfolio; and the risk of general market disruption during the period of the conversion. It is difficult to predict at this time the likely impact of the transition away from LIBOR on a Portfolio.
NOTE 13 — MARKET DISRUPTION
A Portfolio is subject to the risk that geopolitical events will disrupt securities markets and adversely affect global economies and markets. Due to the increasing interdependence among global economies and markets, conditions in one country, market, or region might adversely impact markets, issuers and/or foreign exchange rates in other countries, including the United States. Wars, terrorism, global health crises and pandemics, and other geopolitical events have led, and in the future may lead, to increased market volatility and may have adverse short- or long-term effects on U.S. and world economies and markets generally. For example, the COVID-19 pandemic has resulted, and may continue to result, in significant market volatility, exchange trading suspensions and closures, declines in global financial markets, higher default rates, and a substantial economic downturn in economies throughout the world. Natural and environmental disasters and systemic market dislocations are also highly disruptive to economies and markets. Those events as well as other changes in non-U.S. and domestic economic, social, and political conditions also could adversely affect individual issuers or related groups
of issuers, securities markets, interest rates, credit ratings, inflation, investor sentiment, and other factors affecting the value of the investments of the portfolio and of the Portfolios. Any of these occurrences could disrupt the operations of a Portfolio and of the Portfolios’ service providers.
NOTE 14 — OTHER ACCOUNTING PRONOUNCEMENTS
In March 2020, the Financial Accounting Standards Board issued Accounting Standards Update No. 2020-04 (“ASU 2020-04”), Reference Rate Reform (Topic 848) — Facilitation of the Effects of Reference Rate Reform on Financial Reporting. The amendments in ASU 2020-04 provide optional temporary financial reporting relief from the effect of certain types of contract modifications due to the planned discontinuation of LIBOR and other interbank-offered based reference rates as of the end of 2021. ASU 2020-04 is effective for certain reference rate-related contract modifications that occur during the period March 12, 2020 through December 31, 2022. Management is currently evaluating the impact, if any, of applying ASU 2020-04.
NOTE 15 — SUBSEQUENT EVENTS
Dividends: Subsequent to December 31, 2021, the following Portfolio paid dividends from net investment income of:
| | | Per Share
Amount | | Payable
Date | | Record
Date |
BlackRock Inflation Protected Bond | | |
| Class ADV | | $ | 0.0313 | | | February 1, 2022 | | January 28, 2022 |
| Class I | | $ | 0.0365 | | | February 1, 2022 | | January 28, 2022 |
| Class S | | $ | 0.0343 | | | February 1, 2022 | | January 28, 2022 |
The Portfolios have evaluated events occurring after the Statements of Assets and Liabilities date through the date that the financial statements were issued (“subsequent events”) to determine whether any subsequent events necessitated adjustment to or disclosure in the financial statements. Other than the above, no such subsequent events were identified.
27
VY® BLACKROCK INFLATION
PROTECTED BOND PORTFOLIO | PORTFOLIO OF INVESTMENTS
AS OF DECEMBER 31, 2021 |
Principal
Amount† | | | | | | | | Value | | | Percentage
of Net
Assets |
|---|
| |
CORPORATE BONDS/NOTES: 26.7% |
| | | | | | | Basic Materials: 0.8% |
| 45,000 | | | | | | Air Products and Chemicals, Inc., 2.800%, 05/15/2050 | | $ | 46,237 | | | | 0.0 | |
| 200,000 | | | | (1) | | Corp Nacional del Cobre de Chile, 3.750%,
01/15/2031 | | | 213,360 | | | | 0.1 | |
| 246,000 | | | | | | DuPont de Nemours, Inc., 4.493%, 11/15/2025 | | | 272,037 | | | | 0.1 | |
| 4,000 | | | | | | Ecolab, Inc., 2.700%, 12/15/2051 | | | 3,937 | | | | 0.0 | |
| 81,000 | | | | | | Ecolab, Inc., 2.750%, 08/18/2055 | | | 79,722 | | | | 0.0 | |
| 746,000 | | | | (1) | | Georgia-Pacific LLC, 0.625%, 05/15/2024 | | | 736,637 | | | | 0.2 | |
| 371,000 | | | | (1) | | Glencore Funding LLC, 2.500%, 09/01/2030 | | | 359,719 | | | | 0.1 | |
| 51,000 | | | | | | LYB International Finance III LLC, 4.200%, 05/01/2050 | | | 59,104 | | | | 0.0 | |
| 200,000 | | | | (1) | | MEGlobal Canada ULC, 5.875%, 05/18/2030 | | | 242,875 | | | | 0.1 | |
| 222,000 | | | | (1) | | Orbia Advance Corp. SAB de CV, 1.875%, 05/11/2026 | | | 218,991 | | | | 0.1 | |
| 213,000 | | | | (1) | | Suzano Austria GmbH, 5.750%, 07/14/2026 | | | 243,409 | | | | 0.1 | |
| 71,000 | | | | | | Westlake Chemical Corp., 3.375%,
08/15/2061 | | | 67,919 | | | | 0.0 | |
| | | | | | | | | | 2,543,947 | | | | 0.8 | |
| |
| | | | | | | Communications: 2.9% |
| 33,000 | | | | | | AT&T, Inc., 1.650%, 02/01/2028 | | | 32,330 | | | | 0.0 | |
| 33,000 | | | | | | AT&T, Inc., 2.250%, 02/01/2032 | | | 31,924 | | | | 0.0 | |
| 249,000 | | | | | | AT&T, Inc., 3.100%, 02/01/2043 | | | 242,574 | | | | 0.1 | |
| 355,000 | | | | | | AT&T, Inc., 3.300%, 02/01/2052 | | | 348,652 | | | | 0.1 | |
| 32,000 | | | | | | AT&T, Inc., 3.500%, 06/01/2041 | | | 32,958 | | | | 0.0 | |
| 142,000 | | | | | | AT&T, Inc., 3.800%, 12/01/2057 | | | 148,168 | | | | 0.1 | |
| 348,000 | | | | | | AT&T, Inc., 4.300%, 02/15/2030 | | | 392,074 | | | | 0.1 | |
| 430,000 | | | | | | AT&T, Inc., 4.350%, 03/01/2029 | | | 483,416 | | | | 0.2 | |
| 28,000 | | | | | | AT&T, Inc., 4.500%, 05/15/2035 | | | 32,397 | | | | 0.0 | |
| 120,000 | | | | | | AT&T, Inc., 5.150%, 02/15/2050 | | | 153,695 | | | | 0.1 | |
| 200,000 | | | | (1) | | Bharti Airtel Ltd., 3.250%, 06/03/2031 | | | 202,431 | | | | 0.1 | |
| 99,000 | | | | | | Charter Communications Operating LLC / Charter Communications Operating Capital, 3.950%, 06/30/2062 | | | 95,618 | | | | 0.0 | |
| 728,000 | | | | | | Charter Communications Operating LLC / Charter Communications Operating Capital, 5.750%, 04/01/2048 | | | 909,909 | | | | 0.3 | |
| 223,000 | | | | | | Comcast Corp., 2.450%, 08/15/2052 | | | 200,269 | | | | 0.1 | |
Principal
Amount† | | | | | | | | Value | | | Percentage
of Net
Assets |
|---|
| |
CORPORATE BONDS/NOTES: (continued) |
| | | | | | | Communications: (continued) |
| 499,000 | | | | | | Comcast Corp., 3.400%, 04/01/2030 | | $ | 545,143 | | | | 0.2 | |
| 395,000 | | | | | | Comcast Corp., 4.150%, 10/15/2028 | | | 448,700 | | | | 0.1 | |
| 98,000 | | | | | | Comcast Corp., 4.600%, 10/15/2038 | | | 119,121 | | | | 0.0 | |
| 83,000 | | | | (1) | | Cox Communications, Inc., 3.600%, 06/15/2051 | | | 87,130 | | | | 0.0 | |
| 74,000 | | | | | | eBay, Inc., 1.400%, 05/10/2026 | | | 72,936 | | | | 0.0 | |
| 31,000 | | | | | | Expedia Group, Inc., 3.250%, 02/15/2030 | | | 31,669 | | | | 0.0 | |
| 483,000 | | | | | | Motorola Solutions, Inc., 2.750%, 05/24/2031 | | | 484,374 | | | | 0.2 | |
| 15,000 | | | | (1) | | T-Mobile USA, Inc., 3.400%, 10/15/2052 | | | 14,959 | | | | 0.0 | |
| 1,124,000 | | | | | | T-Mobile USA, Inc., 3.750%, 04/15/2027 | | | 1,217,743 | | | | 0.4 | |
| 1,051,000 | | | | | | Verizon Communications, Inc., 2.100%, 03/22/2028 | | | 1,053,767 | | | | 0.3 | |
| 929,000 | | | | (1) | | Verizon Communications, Inc., 2.355%, 03/15/2032 | | | 916,420 | | | | 0.3 | |
| 137,000 | | | | | | Verizon Communications, Inc., 3.550%, 03/22/2051 | | | 147,877 | | | | 0.0 | |
| 500,000 | | | | | | Verizon Communications, Inc., 4.400%, 11/01/2034 | | | 583,298 | | | | 0.2 | |
| 102,000 | | | | | | ViacomCBS, Inc., 4.375%, 03/15/2043 | | | 116,308 | | | | 0.0 | |
| 111,000 | | | | | | Vodafone Group PLC, 4.250%, 09/17/2050 | | | 128,455 | | | | 0.0 | |
| | | | | | | | | | 9,274,315 | | | | 2.9 | |
| |
| | | | | | | Consumer, Cyclical: 1.6% |
| 53,000 | | | | (1) | | Alimentation Couche-Tard, Inc., 3.439%,
05/13/2041 | | | 54,650 | | | | 0.0 | |
| 70,000 | | | | | | American Honda Finance Corp., 2.900%,
02/16/2024 | | | 72,659 | | | | 0.0 | |
| 391,000 | | | | (1) | | Daimler Finance North America LLC, 1.450%, 03/02/2026 | | | 387,443 | | | | 0.1 | |
| 531,000 | | | | | | General Motors Financial Co., Inc., 1.500%,
06/10/2026 | | | 522,988 | | | | 0.2 | |
| 79,000 | | | | | | General Motors Financial Co., Inc., 2.750%,
06/20/2025 | | | 81,583 | | | | 0.0 | |
| 2,500,000 | | | | (1) | | Hyundai Capital America, 2.650%, 02/10/2025 | | | 2,563,860 | | | | 0.8 | |
| 400,000 | | | | | | Lowe’s Cos, Inc., 1.700%, 09/15/2028 | | | 392,266 | | | | 0.1 | |
| 35,000 | | | | | | Lowe’s Cos, Inc., 2.800%, 09/15/2041 | | | 34,208 | | | | 0.0 | |
| 38,000 | | | | | | Marriott International, Inc./MD, 2.750%,
10/15/2033 | | | 36,910 | | | | 0.0 | |
| 240,000 | | | | | | McDonald’s Corp., 3.600%, 07/01/2030 | | | 265,447 | | | | 0.1 | |
| 30,000 | | | | | | McDonald’s Corp., 3.625%, 09/01/2049 | | | 33,262 | | | | 0.0 | |
| 46,000 | | | | | | McDonald’s Corp., 4.200%, 04/01/2050 | | | 55,827 | | | | 0.0 | |
| 434,000 | | | | (1) | | Nissan Motor Co. Ltd., 4.810%, 09/17/2030 | | | 485,889 | | | | 0.2 | |
See Accompanying Notes to Financial Statements
28
VY® BLACKROCK INFLATION
PROTECTED BOND PORTFOLIO | PORTFOLIO OF INVESTMENTS
AS OF DECEMBER 31, 2021 (CONTINUED) |
Principal
Amount† | | | | | | | | Value | | | Percentage
of Net
Assets |
|---|
| |
CORPORATE BONDS/NOTES: (continued) |
| | | | | | | Consumer, Cyclical: (continued) |
| 144,000 | | | | | | Starbucks Corp., 2.550%, 11/15/2030 | | $ | 147,032 | | | | 0.1 | |
| 68,000 | | | | | | Walmart, Inc., 4.050%, 06/29/2048 | | | 86,636 | | | | 0.0 | |
| | | | | | | | | | 5,220,660 | | | | 1.6 | |
| |
| | | | | | | Consumer, Non-cyclical: 2.9% |
| 574,000 | | | | | | AbbVie, Inc., 4.500%, 05/14/2035 | | | 687,731 | | | | 0.2 | |
| 708,000 | | | | | | Altria Group, Inc., 3.400%, 02/04/2041 | | | 654,239 | | | | 0.2 | |
| 84,000 | | | | | | Amgen, Inc., 4.663%, 06/15/2051 | | | 107,756 | | | | 0.0 | |
| 154,000 | | | | | | Anheuser-Busch Cos LLC / Anheuser-Busch InBev Worldwide, Inc., 4.700%, 02/01/2036 | | | 186,143 | | | | 0.1 | |
| 885,000 | | | | | | Anheuser-Busch InBev Worldwide, Inc., 4.000%, 04/13/2028 | | | 984,981 | | | | 0.3 | |
| 183,000 | | | | | | Anheuser-Busch InBev Worldwide, Inc., 4.500%, 06/01/2050 | | | 226,071 | | | | 0.1 | |
| 82,000 | | | | | | Anthem, Inc., 3.600%, 03/15/2051 | | | 91,232 | | | | 0.0 | |
| 32,000 | | | | | | Astrazeneca Finance LLC, 2.250%, 05/28/2031 | | | 32,259 | | | | 0.0 | |
| 109,000 | | | | | | AstraZeneca PLC, 1.375%, 08/06/2030 | | | 103,022 | | | | 0.0 | |
| 201,000 | | | | | | BAT Capital Corp., 4.540%, 08/15/2047 | | | 210,698 | | | | 0.1 | |
| 633,000 | | | | | | BAT International Finance PLC, 1.668%, 03/25/2026 | | | 622,045 | | | | 0.2 | |
| 74,000 | | | | | | Biogen, Inc., 3.150%, 05/01/2050 | | | 71,327 | | | | 0.0 | |
| 31,000 | | | | | | Boston Scientific Corp., 2.650%, 06/01/2030 | | | 31,637 | | | | 0.0 | |
| 51,000 | | | | (1) | | Cargill, Inc., 0.400%, 02/02/2024 | | | 50,517 | | | | 0.0 | |
| 299,000 | | | | | | Cigna Corp., 4.125%, 11/15/2025 | | | 327,232 | | | | 0.1 | |
| 191,000 | | | | | | Coca-Cola Co/The, 1.450%, 06/01/2027 | | | 190,013 | | | | 0.1 | |
| 42,000 | | | | | | Coca-Cola Co/The, 2.250%, 01/05/2032 | | | 42,734 | | | | 0.0 | |
| 431,000 | | | | | | CVS Health Corp., 3.875%, 07/20/2025 | | | 463,570 | | | | 0.1 | |
| 177,000 | | | | | | CVS Health Corp., 4.250%, 04/01/2050 | | | 214,509 | | | | 0.1 | |
| 200,000 | | | | (1) | | DP World Crescent Ltd., 3.750%, 01/30/2030 | | | 212,020 | | | | 0.1 | |
| 150,000 | | | | (1) | | Embotelladora Andina SA, 3.950%, 01/21/2050 | | | 155,559 | | | | 0.0 | |
| 33,000 | | | | | | Equifax, Inc., 2.350%, 09/15/2031 | | | 32,590 | | | | 0.0 | |
| 185,000 | | | | | | Gilead Sciences, Inc., 2.600%, 10/01/2040 | | | 178,606 | | | | 0.1 | |
| 142,000 | | | | | | Global Payments, Inc., 2.150%, 01/15/2027 | | | 142,646 | | | | 0.0 | |
| 208,000 | | | | | | Global Payments, Inc., 2.900%, 05/15/2030 | | | 212,010 | | | | 0.1 | |
| 200,000 | | | | (1) | | Grupo Bimbo SAB de CV, 4.000%, 09/06/2049 | | | 214,355 | | | | 0.1 | |
| 986,000 | | | | | | HCA, Inc., 5.250%,
06/15/2026 | | | 1,109,882 | | | | 0.3 | |
Principal
Amount† | | | | | | | | Value | | | Percentage
of Net
Assets |
|---|
| |
CORPORATE BONDS/NOTES: (continued) |
| | | | | | | Consumer, Non-cyclical: (continued) |
| 92,000 | | | | | | Humana, Inc., 1.350%, 02/03/2027 | | $ | 89,503 | | | | 0.0 | |
| 26,000 | | | | | | Merck & Co., Inc., 2.750%, 12/10/2051 | | | 25,776 | | | | 0.0 | |
| 80,000 | | | | | | Moody’s Corp., 3.100%, 11/29/2061 | | | 79,548 | | | | 0.0 | |
| 104,000 | | | | | | Philip Morris International, Inc., 1.500%, 05/01/2025 | | | 104,176 | | | | 0.0 | |
| 187,000 | | | | | | Philip Morris International, Inc., 2.625%, 03/06/2023 | | | 191,335 | | | | 0.1 | |
| 144,000 | | | | | | RELX Capital, Inc., 3.000%, 05/22/2030 | | | 151,135 | | | | 0.0 | |
| 297,000 | | | | (1) | | Roche Holdings, Inc., 1.930%, 12/13/2028 | | | 299,015 | | | | 0.1 | |
| 286,000 | | | | | | Shire Acquisitions Investments Ireland DAC, 3.200%, 09/23/2026 | | | 303,690 | | | | 0.1 | |
| 206,000 | | | | | | Takeda Pharmaceutical Co. Ltd., 2.050%,
03/31/2030 | | | 201,958 | | | | 0.1 | |
| 284,000 | | | | | | Thermo Fisher Scientific, Inc., 2.000%, 10/15/2031 | | | 280,092 | | | | 0.1 | |
| 212,000 | | | | | | UnitedHealth Group, Inc., 2.900%, 05/15/2050 | | | 216,547 | | | | 0.1 | |
| | | | | | | | | | 9,498,159 | | | | 2.9 | |
| |
| | | | | | | Energy: 1.7% |
| 34,000 | | | | | | BP Capital Markets America, Inc., 3.001%, 03/17/2052 | | | 33,346 | | | | 0.0 | |
| 117,000 | | | | | | BP Capital Markets America, Inc., 2.772%, 11/10/2050 | | | 110,522 | | | | 0.0 | |
| 44,000 | | | | | | Cenovus Energy, Inc./CA, 3.750%, 02/15/2052 | | | 44,209 | | | | 0.0 | |
| 274,000 | | | | | | Cheniere Corpus Christi Holdings LLC, 5.125%, 06/30/2027 | | | 309,369 | | | | 0.1 | |
| 60,000 | | | | | | Chevron USA, Inc., 2.343%, 08/12/2050 | | | 55,494 | | | | 0.0 | |
| 54,000 | | | | | | Devon Energy Corp., 4.750%, 05/15/2042 | | | 62,659 | | | | 0.0 | |
| 46,000 | | | | | | Devon Energy Corp., 5.000%, 06/15/2045 | | | 55,733 | | | | 0.0 | |
| 2,000 | | | | | | Devon Energy Corp., 5.875%, 06/15/2028 | | | 2,167 | | | | 0.0 | |
| 35,000 | | | | | | Diamondback Energy, Inc., 2.875%, 12/01/2024 | | | 36,334 | | | | 0.0 | |
| 267,000 | | | | | | Diamondback Energy, Inc., 3.125%, 03/24/2031 | | | 275,462 | | | | 0.1 | |
| 7,000 | | | | | | Diamondback Energy, Inc., 3.250%, 12/01/2026 | | | 7,388 | | | | 0.0 | |
| 651,000 | | | | | | Diamondback Energy, Inc., 3.500%, 12/01/2029 | | | 691,036 | | | | 0.2 | |
| 65,000 | | | | | | Energy Transfer L.P., 5.000%, 05/15/2050 | | | 74,977 | | | | 0.0 | |
| 772,000 | | | | | | Energy Transfer L.P., 5.500%, 06/01/2027 | | | 881,207 | | | | 0.3 | |
| 175,000 | | | | | | Enterprise Products Operating LLC, 3.300%, 02/15/2053 | | | 174,437 | | | | 0.1 | |
| 200,000 | | | | (1) | | KazMunayGas National Co. JSC, 3.500%,
04/14/2033 | | | 207,894 | | | | 0.1 | |
See Accompanying Notes to Financial Statements
29
VY® BLACKROCK INFLATION
PROTECTED BOND PORTFOLIO | PORTFOLIO OF INVESTMENTS
AS OF DECEMBER 31, 2021 (CONTINUED) |
Principal
Amount† | | | | | | | | Value | | | Percentage
of Net
Assets |
|---|
| |
CORPORATE BONDS/NOTES: (continued) |
| | | | | | | Energy: (continued) |
| 96,000 | | | | (1) | | NGPL PipeCo LLC, 3.250%, 07/15/2031 | | $ | 97,637 | | | | 0.0 | |
| 200,000 | | | | (1) | | Pertamina Persero PT, 4.150%, 02/25/2060 | | | 201,569 | | | | 0.1 | |
| 200,000 | | | | (1) | | Petronas Capital Ltd., 3.500%, 04/21/2030 | | | 216,600 | | | | 0.1 | |
| 200,000 | | | | (1) | | Qatar Energy, 3.300%, 07/12/2051 | | | 206,605 | | | | 0.1 | |
| 797,000 | | | | | | Sabine Pass Liquefaction LLC, 4.200%, 03/15/2028 | | | 873,720 | | | | 0.3 | |
| 196,000 | | | | | | Sabine Pass Liquefaction LLC, 5.875%, 06/30/2026 | | | 225,086 | | | | 0.1 | |
| 152,000 | | | | (1) | | Schlumberger Finance Canada Ltd., 2.650%, 11/20/2022 | | | 154,479 | | | | 0.0 | |
| 438,000 | | | | (1) | | Texas Eastern Transmission L.P., 3.500%, 01/15/2028 | | | 468,276 | | | | 0.1 | |
| 78,000 | | | | | | Transcontinental Gas Pipe Line Co. LLC, 7.850%, 02/01/2026 | | | 95,295 | | | | 0.0 | |
| | | | | | | | | | 5,561,501 | | | | 1.7 | |
| |
| | | | | | | Financial: 10.4% |
| 72,000 | | | | (1) | | AIG Global Funding, 0.450%, 12/08/2023 | | | 71,332 | | | | 0.0 | |
| 49,000 | | | | | | Air Lease Corp., 2.875%, 01/15/2026 | | | 50,589 | | | | 0.0 | |
| 26,000 | | | | | | American International Group, Inc., 4.375%, 06/30/2050 | | | 32,498 | | | | 0.0 | |
| 113,000 | | | | | | American International Group, Inc., 4.500%, 07/16/2044 | | | 139,494 | | | | 0.0 | |
| 183,000 | | | | | | American Tower Corp., 2.700%, 04/15/2031 | | | 183,751 | | | | 0.1 | |
| 593,000 | | | | | | American Tower Corp., 3.800%, 08/15/2029 | | | 645,766 | | | | 0.2 | |
| 148,000 | | | | | | Aon Corp., 2.800%, 05/15/2030 | | | 152,699 | | | | 0.0 | |
| 317,000 | | | | | | Ares Capital Corp., 2.150%, 07/15/2026 | | | 313,028 | | | | 0.1 | |
| 200,000 | | | | (1) | | Banco Nacional de Panama, 2.500%,
08/11/2030 | | | 188,002 | | | | 0.1 | |
| 1,000,000 | | | | (2) | | Banco Santander SA, 0.701%, 06/30/2024 | | | 995,000 | | | | 0.3 | |
| 484,000 | | | | (2) | | Bank of America Corp., 0.523%, 06/14/2024 | | | 480,944 | | | | 0.1 | |
| 1,719,000 | | | | (2) | | Bank of America Corp., 1.319%, 06/19/2026 | | | 1,702,090 | | | | 0.5 | |
| 1,314,000 | | | | (2) | | Bank of America Corp., 1.734%, 07/22/2027 | | | 1,305,154 | | | | 0.4 | |
| 25,000 | | | | (2) | | Bank of America Corp., 1.898%, 07/23/2031 | | | 23,954 | | | | 0.0 | |
| 376,000 | | | | (2) | | Bank of America Corp., 2.015%, 02/13/2026 | | | 381,110 | | | | 0.1 | |
| 838,000 | | | | (2) | | Bank of America Corp., 2.299%, 07/21/2032 | | | 824,825 | | | | 0.3 | |
| 103,000 | | | | (2) | | Bank of America Corp., 2.572%, 10/20/2032 | | | 103,570 | | | | 0.0 | |
| 66,000 | | | | (2) | | Bank of America Corp., 2.687%, 04/22/2032 | | | 67,049 | | | | 0.0 | |
| 199,000 | | | | (2) | | Bank of America Corp., 3.559%, 04/23/2027 | | | 212,920 | | | | 0.1 | |
Principal
Amount† | | | | | | | | Value | | | Percentage
of Net
Assets |
|---|
| |
CORPORATE BONDS/NOTES: (continued) |
| | | | | | | Financial: (continued) |
| 55,000 | | | | (2) | | Bank of America Corp., 3.705%, 04/24/2028 | | $ | 59,731 | | | | 0.0 | |
| 290,000 | | | | (2) | | Bank of America Corp., 3.864%, 07/23/2024 | | | 302,247 | | | | 0.1 | |
| 368,000 | | | | | | Bank of America Corp., 3.950%, 04/21/2025 | | | 393,665 | | | | 0.1 | |
| 379,000 | | | | (2) | | Bank of America Corp., 4.078%, 04/23/2040 | | | 436,211 | | | | 0.1 | |
| 253,000 | | | | (2) | | Barclays PLC, 2.667%, 03/10/2032 | | | 251,178 | | | | 0.1 | |
| 200,000 | | | | (2) | | Barclays PLC, 3.811%, 03/10/2042 | | | 213,608 | | | | 0.1 | |
| 342,000 | | | | (2) | | Barclays PLC, 4.338%, 05/16/2024 | | | 356,126 | | | | 0.1 | |
| 194,000 | | | | (1) | | Blackstone Private Credit Fund, 3.250%,
03/15/2027 | | | 196,123 | | | | 0.1 | |
| 9,000 | | | | (2) | | Citigroup, Inc., 2.520%, 11/03/2032 | | | 8,999 | | | | 0.0 | |
| 689,000 | | | | (2) | | Citigroup, Inc., 2.561%, 05/01/2032 | | | 693,302 | | | | 0.2 | |
| 302,000 | | | | (2) | | Citigroup, Inc., 2.666%, 01/29/2031 | | | 306,889 | | | | 0.1 | |
| 31,000 | | | | (2) | | Citigroup, Inc., 2.976%, 11/05/2030 | | | 32,224 | | | | 0.0 | |
| 29,000 | | | | (2) | | Citigroup, Inc., 3.980%, 03/20/2030 | | | 32,042 | | | | 0.0 | |
| 500,000 | | | | | | Credit Suisse AG/New York NY, 1.250%,
08/07/2026 | | | 487,930 | | | | 0.2 | |
| 53,000 | | | | | | Crown Castle International Corp., 1.350%, 07/15/2025 | | | 52,329 | | | | 0.0 | |
| 178,000 | | | | | | Crown Castle International Corp., 2.250%, 01/15/2031 | | | 173,632 | | | | 0.1 | |
| 118,000 | | | | | | Crown Castle International Corp., 3.700%, 06/15/2026 | | | 126,593 | | | | 0.0 | |
| 545,000 | | | | | | Crown Castle International Corp., 3.800%, 02/15/2028 | | | 593,501 | | | | 0.2 | |
| 1,020,000 | | | | (1),(2) | | Danske Bank A/S, 0.976%, 09/10/2025 | | | 1,004,882 | | | | 0.3 | |
| 200,000 | | | | (1),(2) | | Danske Bank A/S, 1.171%, 12/08/2023 | | | 199,997 | | | | 0.1 | |
| 150,000 | | | | | | Deutsche Bank AG/New York NY, 1.686%,
03/19/2026 | | | 149,405 | | | | 0.0 | |
| 150,000 | | | | (2) | | Deutsche Bank AG/New York NY, 2.129%,
11/24/2026 | | | 149,813 | | | | 0.0 | |
| 405,000 | | | | | | Equinix, Inc., 3.200%, 11/18/2029 | | | 426,074 | | | | 0.1 | |
| 73,000 | | | | | | GLP Capital L.P. / GLP Financing II, Inc., 3.250%, 01/15/2032 | | | 73,512 | | | | 0.0 | |
| 30,000 | | | | | | GLP Capital L.P. / GLP Financing II, Inc., 4.000%, 01/15/2031 | | | 32,053 | | | | 0.0 | |
| 1,000,000 | | | | (2) | | Goldman Sachs Group, Inc./The, 2.905%,
07/24/2023 | | | 1,011,395 | | | | 0.3 | |
| 542,000 | | | | (2) | | Goldman Sachs Group, Inc./The, 2.908%,
07/21/2042 | | | 539,885 | | | | 0.2 | |
See Accompanying Notes to Financial Statements
30
VY® BLACKROCK INFLATION
PROTECTED BOND PORTFOLIO | PORTFOLIO OF INVESTMENTS
AS OF DECEMBER 31, 2021 (CONTINUED) |
Principal
Amount† | | | | | | | | Value | | | Percentage
of Net
Assets |
|---|
| |
CORPORATE BONDS/NOTES: (continued) |
| | | | | | | Financial: (continued) |
| 1,794,000 | | | | | | Goldman Sachs Group, Inc./The, 3.500%,
04/01/2025 | | $ | 1,898,376 | | | | 0.6 | |
| 497,000 | | | | (2) | | HSBC Holdings PLC, 1.589%, 05/24/2027 | | | 486,326 | | | | 0.2 | |
| 200,000 | | | | (2) | | HSBC Holdings PLC, 2.251%, 11/22/2027 | | | 200,534 | | | | 0.1 | |
| 123,000 | | | | | | Intercontinental Exchange, Inc., 2.100%, 06/15/2030 | | | 121,681 | | | | 0.0 | |
| 41,000 | | | | | | Invitation Homes Operating Partnership L.P., 2.300%, 11/15/2028 | | | 40,587 | | | | 0.0 | |
| 387,000 | | | | (2) | | JPMorgan Chase & Co., 1.578%, 04/22/2027 | | | 382,640 | | | | 0.1 | |
| 40,000 | | | | (2) | | JPMorgan Chase & Co., 1.953%, 02/04/2032 | | | 38,567 | | | | 0.0 | |
| 2,623,000 | | | | (2) | | JPMorgan Chase & Co., 2.005%, 03/13/2026 | | | 2,655,870 | | | | 0.8 | |
| 87,000 | | | | (2) | | JPMorgan Chase & Co., 2.525%, 11/19/2041 | | | 82,905 | | | | 0.0 | |
| 107,000 | | | | (2) | | JPMorgan Chase & Co., 2.580%, 04/22/2032 | | | 108,489 | | | | 0.0 | |
| 31,000 | | | | (2) | | JPMorgan Chase & Co., 3.157%, 04/22/2042 | | | 32,421 | | | | 0.0 | |
| 31,000 | | | | (2) | | JPMorgan Chase & Co., 3.220%, 03/01/2025 | | | 32,244 | | | | 0.0 | |
| 167,000 | | | | (2) | | JPMorgan Chase & Co., 3.328%, 04/22/2052 | | | 179,131 | | | | 0.1 | |
| 495,000 | | | | (2) | | JPMorgan Chase & Co., 3.559%, 04/23/2024 | | | 511,682 | | | | 0.2 | |
| 241,000 | | | | | | JPMorgan Chase & Co., 3.900%, 07/15/2025 | | | 260,997 | | | | 0.1 | |
| 25,000 | | | | (2) | | JPMorgan Chase & Co., 4.493%, 03/24/2031 | | | 28,959 | | | | 0.0 | |
| 200,000 | | | | | | Lloyds Banking Group PLC, 4.375%, 03/22/2028 | | | 224,546 | | | | 0.1 | |
| 105,000 | | | | | | Marsh & McLennan Cos, Inc., 2.250%, 11/15/2030 | | | 104,903 | | | | 0.0 | |
| 225,000 | | | | (2) | | Mitsubishi UFJ Financial Group, Inc., 1.538%, 07/20/2027 | | | 221,118 | | | | 0.1 | |
| 2,000,000 | | | | | | Mitsubishi UFJ Financial Group, Inc., 3.218%, 03/07/2022 | | | 2,010,052 | | | | 0.6 | |
| 30,000 | | | | | | Mitsubishi UFJ Financial Group, Inc., 3.407%, 03/07/2024 | | | 31,421 | | | | 0.0 | |
| 567,000 | | | | (2) | | Mizuho Financial Group, Inc., 2.260%, 07/09/2032 | | | 554,670 | | | | 0.2 | |
| 690,000 | | | | (2) | | Morgan Stanley, 0.790%, 05/30/2025 | | | 681,347 | | | | 0.2 | |
| 1,755,000 | | | | (2) | | Morgan Stanley, 1.512%, 07/20/2027 | | | 1,728,007 | | | | 0.5 | |
| 24,000 | | | | (2) | | Morgan Stanley, 1.593%, 05/04/2027 | | | 23,776 | | | | 0.0 | |
| 49,000 | | | | (2) | | Morgan Stanley, 2.511%, 10/20/2032 | | | 49,006 | | | | 0.0 | |
| 37,000 | | | | (2) | | Morgan Stanley, 3.217%, 04/22/2042 | | | 38,835 | | | | 0.0 | |
| 72,000 | | | | (2) | | Morgan Stanley, 3.772%, 01/24/2029 | | | 78,410 | | | | 0.0 | |
| 167,000 | | | | | | Morgan Stanley, 4.000%, 07/23/2025 | | | 181,137 | | | | 0.1 | |
Principal
Amount† | | | | | | | | Value | | | Percentage
of Net
Assets |
|---|
| |
CORPORATE BONDS/NOTES: (continued) |
| | | | | | | Financial: (continued) |
| 1,029,000 | | | | (2) | | Morgan Stanley, 4.431%, 01/23/2030 | | $ | 1,173,637 | | | | 0.4 | |
| 188,000 | | | | | | National Retail Properties, Inc., 3.000%, 04/15/2052 | | | 178,269 | | | | 0.1 | |
| 204,000 | | | | | | Nomura Holdings, Inc., 2.608%, 07/14/2031 | | | 201,530 | | | | 0.1 | |
| 85,000 | | | | (1) | | Principal Life Global Funding II, 0.750%, 04/12/2024 | | | 84,428 | | | | 0.0 | |
| 232,000 | | | | (2) | | Santander UK Group Holdings PLC, 1.089%, 03/15/2025 | | | 229,970 | | | | 0.1 | |
| 261,000 | | | | | | Sumitomo Mitsui Financial Group, Inc., 1.902%, 09/17/2028 | | | 256,071 | | | | 0.1 | |
| 800,000 | | | | | | Sumitomo Mitsui Financial Group, Inc., 2.846%, 01/11/2022 | | | 800,366 | | | | 0.2 | |
| 113,000 | | | | (1) | | SURA Asset Management SA, 4.875%, 04/17/2024 | | | 119,275 | | | | 0.0 | |
| 310,000 | | | | (1),(2) | | UBS Group AG, 1.494%, 08/10/2027 | | | 302,571 | | | | 0.1 | |
| 31,000 | | | | (2) | | Wells Fargo & Co., 2.393%, 06/02/2028 | | | 31,529 | | | | 0.0 | |
| 187,000 | | | | (2) | | Wells Fargo & Co., 2.572%, 02/11/2031 | | | 191,101 | | | | 0.1 | |
| 187,000 | | | | (2) | | Wells Fargo & Co., 3.068%, 04/30/2041 | | | 192,161 | | | | 0.1 | |
| 104,000 | | | | | | Wells Fargo & Co., 3.000%, 10/23/2026 | | | 109,335 | | | | 0.0 | |
| 351,000 | | | | | | Wells Fargo & Co., 3.500%, 03/08/2022 | | | 353,020 | | | | 0.1 | |
| 236,000 | | | | (2) | | Wells Fargo & Co., 3.584%, 05/22/2028 | | | 253,893 | | | | 0.1 | |
| 159,000 | | | | | | Wells Fargo & Co., 4.150%, 01/24/2029 | | | 178,139 | | | | 0.1 | |
| | | | | | | | | | 33,821,053 | | | | 10.4 | |
| |
| | | | | | | Industrial: 1.3% |
| 150,000 | | | | | | Agilent Technologies, Inc., 2.300%, 03/12/2031 | | | 148,697 | | | | 0.0 | |
| 270,000 | | | | | | Amcor Flexibles North America, Inc., 2.690%, 05/25/2031 | | | 273,939 | | | | 0.1 | |
| 20,000 | | | | | | Burlington Northern Santa Fe LLC, 2.875%, 06/15/2052 | | | 20,056 | | | | 0.0 | |
| 209,000 | | | | | | Burlington Northern Santa Fe LLC, 3.300%, 09/15/2051 | | | 227,470 | | | | 0.1 | |
| 184,000 | | | | | | CSX Corp., 2.500%, 05/15/2051 | | | 170,540 | | | | 0.1 | |
| 45,000 | | | | | | CSX Corp., 3.250%, 06/01/2027 | | | 48,290 | | | | 0.0 | |
| 214,000 | | | | | | FedEx Corp., 2.400%, 05/15/2031 | | | 214,660 | | | | 0.1 | |
| 122,000 | | | | | | General Dynamics Corp., 3.750%, 05/15/2028 | | | 134,924 | | | | 0.0 | |
| 363,000 | | | | (1) | | Huntington Ingalls Industries, Inc., 2.043%, 08/16/2028 | | | 355,651 | | | | 0.1 | |
| 54,000 | | | | | | L3Harris Technologies, Inc., 3.850%, 12/15/2026 | | | 58,762 | | | | 0.0 | |
See Accompanying Notes to Financial Statements
31
VY® BLACKROCK INFLATION
PROTECTED BOND PORTFOLIO | PORTFOLIO OF INVESTMENTS
AS OF DECEMBER 31, 2021 (CONTINUED) |
Principal
Amount† | | | | | | | | Value | | | Percentage
of Net
Assets |
|---|
| |
CORPORATE BONDS/NOTES: (continued) |
| | | | | | | Industrial: (continued) |
| 241,000 | | | | | | Lockheed Martin Corp., 2.800%, 06/15/2050 | | $ | 240,897 | | | | 0.1 | |
| 163,000 | | | | | | Norfolk Southern Corp., 3.050%, 05/15/2050 | | | 166,521 | | | | 0.0 | |
| 234,000 | | | | | | Northrop Grumman Corp., 2.930%,
01/15/2025 | | | 243,922 | | | | 0.1 | |
| 230,000 | | | | | | Northrop Grumman Corp., 5.250%,
05/01/2050 | | | 322,990 | | | | 0.1 | |
| 59,000 | | | | | | nVent Finance Sarl, 2.750%, 11/15/2031 | | | 58,819 | | | | 0.0 | |
| 102,000 | | | | | | Packaging Corp. of America, 3.050%,
10/01/2051 | | | 101,763 | | | | 0.0 | |
| 32,000 | | | | (1) | | Penske Truck Leasing Co. Lp / PTL Finance Corp., 1.700%,
06/15/2026 | | | 31,664 | | | | 0.0 | |
| 34,000 | | | | | | Raytheon Technologies Corp., 2.820%,
09/01/2051 | | | 32,914 | | | | 0.0 | |
| 242,000 | | | | | | Raytheon Technologies Corp., 3.125%,
07/01/2050 | | | 247,871 | | | | 0.1 | |
| 607,000 | | | | | | Raytheon Technologies Corp., 4.125%,
11/16/2028 | | | 679,561 | | | | 0.2 | |
| 26,000 | | | | | | Raytheon Technologies Corp., 4.625%,
11/16/2048 | | | 33,391 | | | | 0.0 | |
| 55,000 | | | | | | Republic Services, Inc., 2.375%, 03/15/2033 | | | 54,812 | | | | 0.0 | |
| 201,000 | | | | | | Union Pacific Corp., 3.200%, 05/20/2041 | | | 214,391 | | | | 0.1 | |
| 202,000 | | | | | | Union Pacific Corp., 3.250%, 02/05/2050 | | | 217,112 | | | | 0.1 | |
| | | | | | | | | | 4,299,617 | | | | 1.3 | |
| |
| | | | | | | Technology: 2.9% |
| 38,000 | | | | | | Activision Blizzard, Inc., 2.500%, 09/15/2050 | | | 33,381 | | | | 0.0 | |
| 121,000 | | | | | | Analog Devices, Inc., 3.500%, 12/05/2026 | | | 132,050 | | | | 0.0 | |
| 186,000 | | | | | | Autodesk, Inc., 2.400%, 12/15/2031 | | | 185,669 | | | | 0.1 | |
| 528,000 | | | | | | Broadcom Corp. / Broadcom Cayman Finance Ltd., 3.500%, 01/15/2028 | | | 564,571 | | | | 0.2 | |
| 221,000 | | | | | | Broadcom Corp. / Broadcom Cayman Finance Ltd., 3.875%, 01/15/2027 | | | 239,759 | | | | 0.1 | |
| 348,000 | | | | (1) | | Broadcom, Inc., 3.419%, 04/15/2033 | | | 365,200 | | | | 0.1 | |
| 157,000 | | | | (1) | | Broadcom, Inc., 3.469%, 04/15/2034 | | | 164,535 | | | | 0.1 | |
| 10,000 | | | | | | Broadcom, Inc., 4.150%, 11/15/2030 | | | 11,099 | | | | 0.0 | |
| 15,000 | | | | | | Dell International LLC / EMC Corp., 8.350%, 07/15/2046 | | | 24,991 | | | | 0.0 | |
| 33,000 | | | | | | DXC Technology Co., 2.375%, 09/15/2028 | | | 32,285 | | | | 0.0 | |
Principal
Amount† | | | | | | | | Value | | | Percentage
of Net
Assets |
|---|
| |
CORPORATE BONDS/NOTES: (continued) |
| | | | | | | Technology: (continued) |
| 265,000 | | | | | | Electronic Arts, Inc., 1.850%, 02/15/2031 | | $ | 254,269 | | | | 0.1 | |
| 143,000 | | | | | | Fidelity National Information Services, Inc., 3.100%, 03/01/2041 | | | 144,657 | | | | 0.0 | |
| 485,000 | | | | | | Fiserv, Inc., 3.500%, 07/01/2029 | | | 522,101 | | | | 0.2 | |
| 142,000 | | | | | | Intel Corp., 3.200%, 08/12/2061 | | | 145,852 | | | | 0.1 | |
| 100,000 | | | | | | International Business Machines Corp., 3.300%, 05/15/2026 | | | 107,012 | | | | 0.0 | |
| 169,000 | | | | | | International Business Machines Corp., 4.150%, 05/15/2039 | | | 195,526 | | | | 0.1 | |
| 76,000 | | | | | | KLA Corp., 3.300%, 03/01/2050 | | | 81,424 | | | | 0.0 | |
| 33,000 | | | | | | Lam Research Corp., 2.875%, 06/15/2050 | | | 32,975 | | | | 0.0 | |
| 341,000 | | | | | | Leidos, Inc., 2.300%, 02/15/2031 | | | 328,862 | | | | 0.1 | |
| 568,000 | | | | | | NVIDIA Corp., 1.550%, 06/15/2028 | | | 563,912 | | | | 0.2 | |
| 122,000 | | | | (1) | | NXP BV / NXP Funding LLC / NXP USA, Inc., 2.500%, 05/11/2031 | | | 122,429 | | | | 0.0 | |
| 133,000 | | | | (1) | | NXP BV / NXP Funding LLC / NXP USA, Inc., 3.150%, 05/01/2027 | | | 139,971 | | | | 0.0 | |
| 617,000 | | | | (1) | | NXP BV / NXP Funding LLC / NXP USA, Inc., 4.300%, 06/18/2029 | | | 691,921 | | | | 0.2 | |
| 1,322,000 | | | | | | Oracle Corp., 1.650%, 03/25/2026 | | | 1,312,897 | | | | 0.4 | |
| 1,000,000 | | | | | | Oracle Corp., 2.500%, 05/15/2022 | | | 1,004,165 | | | | 0.3 | |
| 31,000 | | | | | | Oracle Corp., 3.600%, 04/01/2040 | | | 31,143 | | | | 0.0 | |
| 55,000 | | | | | | Oracle Corp., 3.600%, 04/01/2050 | | | 53,957 | | | | 0.0 | |
| 1,208,000 | | | | | | Oracle Corp., 3.650%, 03/25/2041 | | | 1,223,118 | | | | 0.4 | |
| 80,000 | | | | | | QUALCOMM, Inc., 3.250%, 05/20/2050 | | | 88,060 | | | | 0.0 | |
| 36,000 | | | | | | salesforce.com, Inc., 3.050%, 07/15/2061 | | | 37,135 | | | | 0.0 | |
| 219,000 | | | | | | ServiceNow, Inc., 1.400%, 09/01/2030 | | | 204,098 | | | | 0.1 | |
| 212,000 | | | | | | VMware, Inc., 1.800%, 08/15/2028 | | | 206,474 | | | | 0.1 | |
| 114,000 | | | | | | VMware, Inc., 2.200%, 08/15/2031 | | | 112,094 | | | | 0.0 | |
| 21,000 | | | | | | Western Digital Corp., 2.850%, 02/01/2029 | | | 21,236 | | | | 0.0 | |
| | | | | | | | | | 9,378,828 | | | | 2.9 | |
| |
| | | | | | | Utilities: 2.2% |
| 41,000 | | | | | | AEP Texas, Inc., 3.450%, 05/15/2051 | | | 41,396 | | | | 0.0 | |
| 467,000 | | | | | | AEP Transmission Co. LLC, 2.750%, 08/15/2051 | | | 445,428 | | | | 0.1 | |
| 308,000 | | | | | | Alabama Power Co., 3.125%, 07/15/2051 | | | 314,857 | | | | 0.1 | |
| 32,000 | | | | | | Ameren Illinois Co., 2.900%, 06/15/2051 | | | 32,525 | | | | 0.0 | |
See Accompanying Notes to Financial Statements
32
VY® BLACKROCK INFLATION
PROTECTED BOND PORTFOLIO | PORTFOLIO OF INVESTMENTS
AS OF DECEMBER 31, 2021 (CONTINUED) |
Principal
Amount† | | | | | | | | Value | | | Percentage
of Net
Assets |
|---|
| |
CORPORATE BONDS/NOTES: (continued) |
| | | | | | | Utilities: (continued) |
| 94,000 | | | | (1) | | American Transmission Systems, Inc., 2.650%, 01/15/2032 | | $ | 94,978 | | | | 0.0 | |
| 67,000 | | | | | | Atmos Energy Corp., 2.850%, 02/15/2052 | | | 65,280 | | | | 0.0 | |
| 79,000 | | | | | | CenterPoint Energy Resources Corp., 1.750%, 10/01/2030 | | | 74,912 | | | | 0.0 | |
| 35,000 | | | | | | CenterPoint Energy Houston Electric LLC, 3.350%, 04/01/2051 | | | 38,565 | | | | 0.0 | |
| 77,000 | | | | | | Commonwealth Edison Co., 2.750%, 09/01/2051 | | | 74,637 | | | | 0.0 | |
| 220,000 | | | | (1) | | Consorcio Transmantaro SA, 4.700%, 04/16/2034 | | | 242,043 | | | | 0.1 | |
| 199,000 | | | | | | Consumers Energy Co., 2.650%, 08/15/2052 | | | 194,182 | | | | 0.1 | |
| 42,000 | | | | | | DTE Electric Co., 3.950%, 03/01/2049 | | | 49,758 | | | | 0.0 | |
| 71,000 | | | | | | Duke Energy Carolinas LLC, 3.450%, 04/15/2051 | | | 77,838 | | | | 0.0 | |
| 137,000 | | | | | | Duke Energy Florida LLC, 1.750%, 06/15/2030 | | | 131,633 | | | | 0.0 | |
| 68,000 | | | | | | Duke Energy Florida LLC, 3.000%, 12/15/2051 | | | 68,706 | | | | 0.0 | |
| 262,000 | | | | | | Duke Energy Florida LLC, 3.800%, 07/15/2028 | | | 288,920 | | | | 0.1 | |
| 262,000 | | | | | | Duke Energy Progress LLC, 2.900%, 08/15/2051 | | | 260,412 | | | | 0.1 | |
| 185,000 | | | | | | Entergy Louisiana LLC, 2.350%, 06/15/2032 | | | 184,654 | | | | 0.1 | |
| 32,000 | | | | | | Exelon Corp., 4.700%, 04/15/2050 | | | 40,277 | | | | 0.0 | |
| 2,089,000 | | | | | | Florida Power & Light Co., 0.300%, (SOFRRATE + 0.250%), 05/10/2023 | | | 2,083,375 | | | | 0.6 | |
| 265,000 | | | | | | Florida Power & Light Co., 2.875%, 12/04/2051 | | | 269,439 | | | | 0.1 | |
| 30,000 | | | | | | Florida Power & Light Co., 3.950%, 03/01/2048 | | | 35,666 | | | | 0.0 | |
| 200,000 | | | | (1) | | Interchile SA, 4.500%, 06/30/2056 | | | 212,817 | | | | 0.1 | |
| 241,000 | | | | | | MidAmerican Energy Co., 2.700%, 08/01/2052 | | | 234,583 | | | | 0.1 | |
| 53,000 | | | | | | Northern States Power Co/MN, 2.600%,
06/01/2051 | | | 50,712 | | | | 0.0 | |
| 213,000 | | | | (1) | | NRG Energy, Inc., 4.450%, 06/15/2029 | | | 231,986 | | | | 0.1 | |
| 150,000 | | | | | | Ohio Power Co., 2.900%, 10/01/2051 | | | 145,024 | | | | 0.1 | |
| 15,000 | | | | (1) | | Oncor Electric Delivery Co. LLC, 2.700%,
11/15/2051 | | | 14,463 | | | | 0.0 | |
| 47,000 | | | | | | Oncor Electric Delivery Co. LLC, 3.100%,
09/15/2049 | | | 49,178 | | | | 0.0 | |
| 8,000 | | | | | | Pacific Gas and Electric Co., 2.500%, 02/01/2031 | | | 7,630 | | | | 0.0 | |
| 67,000 | | | | | | Pacific Gas and Electric Co., 3.250%, 06/01/2031 | | | 67,291 | | | | 0.0 | |
| 102,000 | | | | | | Pacific Gas and Electric Co., 4.950%, 07/01/2050 | | | 111,349 | | | | 0.0 | |
| 238,000 | | | | | | PECO Energy Co., 2.850%, 09/15/2051 | | | 236,303 | | | | 0.1 | |
Principal
Amount† | | | | | | | | Value | | | Percentage
of Net
Assets |
|---|
| |
CORPORATE BONDS/NOTES: (continued) |
| | | | | | | Utilities: (continued) |
| 200,000 | | | | | | Saudi Electricity Global Sukuk Co. 5, 2.413%, 09/17/2030 | | $ | 200,998 | | | | 0.1 | |
| 200,000 | | | | | | Southern California Edison Co., 1.200%, 02/01/2026 | | | 196,169 | | | | 0.1 | |
| 31,000 | | | | | | Southwestern Public Service Co., 3.150%, 05/01/2050 | | | 32,396 | | | | 0.0 | |
| 27,000 | | | | | | Tampa Electric Co., 4.300%, 06/15/2048 | | | 33,173 | | | | 0.0 | |
| 149,000 | | | | | | Virginia Electric and Power Co., 2.450%, 12/15/2050 | | | 137,673 | | | | 0.1 | |
| | | | | | | | | | 7,071,226 | | | | 2.2 | |
| | | | | | | Total Corporate Bonds/Notes | | | | | | | | |
| | | | | | | (Cost $86,781,777) | | | 86,669,306 | | | | 26.7 | |
| |
U.S. TREASURY OBLIGATIONS: 50.8% |
| | | | | | | Treasury Inflation Indexed Protected Securities: 49.5% |
| 2,107,414 | | | | | | 0.125%, 10/15/2026 | | | 2,292,753 | | | | 0.7 | |
| 8,350,381 | | | | | | 0.125%, 01/15/2030 | | | 9,274,957 | | | | 2.9 | |
| 8,195,910 | | | | | | 0.125%, 07/15/2030 | | | 9,176,973 | | | | 2.8 | |
| 7,737,326 | | | | | | 0.125%, 01/15/2031 | | | 8,670,251 | | | | 2.7 | |
| 6,910,636 | | | | | | 0.125%, 07/15/2031 | | | 7,774,768 | | | | 2.4 | |
| 3,817,606 | | | | | | 0.125%, 02/15/2051 | | | 4,531,182 | | | | 1.4 | |
| 29,223 | | | | | | 0.250%, 01/15/2025 | | | 31,316 | | | | 0.0 | |
| 5,974,572 | | | | | | 0.250%, 07/15/2029 | | | 6,698,951 | | | | 2.1 | |
| 3,133,692 | | | | | | 0.250%, 02/15/2050 | | | 3,800,136 | | | | 1.2 | |
| 11,897 | | | | | | 0.375%, 07/15/2023 | | | 12,510 | | | | 0.0 | |
| 1,021,536 | | | | | | 0.375%, 07/15/2025 | | | 1,109,853 | | | | 0.3 | |
| 6,651,795 | | | | | | 0.375%, 01/15/2027 | | | 7,319,639 | | | | 2.3 | |
| 8,692,224 | | | | | | 0.375%, 07/15/2027 | | | 9,648,324 | | | | 3.0 | |
| 9,728,264 | | | | | | 0.500%, 01/15/2028 | | | 10,891,008 | | | | 3.4 | |
| 23,630 | | | | | | 0.625%, 04/15/2023 | | | 24,705 | | | | 0.0 | |
| 3,672,810 | | | | | | 0.625%, 02/15/2043 | | | 4,572,587 | | | | 1.4 | |
| 9,468,826 | | | | | | 0.750%, 07/15/2028 | | | 10,849,956 | | | | 3.3 | |
| 4,802,612 | | | | | | 0.750%, 02/15/2042 | | | 6,077,769 | | | | 1.9 | |
| 5,361,238 | | | | (3) | | 0.750%, 02/15/2045 | | | 6,912,149 | | | | 2.1 | |
| 2,666,481 | | | | | | 0.875%, 01/15/2029 | | | 3,085,438 | | | | 1.0 | |
| 3,331,803 | | | | | | 0.875%, 02/15/2047 | | | 4,507,841 | | | | 1.4 | |
| 2,868,569 | | | | | | 1.000%, 02/15/2046 | | | 3,926,557 | | | | 1.2 | |
| 2,615,938 | | | | | | 1.000%, 02/15/2048 | | | 3,674,887 | | | | 1.1 | |
| 2,222,485 | | | | | | 1.000%, 02/15/2049 | | | 3,160,692 | | | | 1.0 | |
| 5,001,227 | | | | (3) | | 1.375%, 02/15/2044 | | | 7,147,868 | | | | 2.2 | |
| 2,965,558 | | | | (3) | | 1.750%, 01/15/2028 | | | 3,559,428 | | | | 1.1 | |
| 2,012,725 | | | | | | 2.125%, 02/15/2040 | | | 3,084,282 | | | | 0.9 | |
| 2,825,599 | | | | | | 2.125%, 02/15/2041 | | | 4,379,348 | | | | 1.3 | |
| 3,894,832 | | | | | | 2.375%, 01/15/2027 | | | 4,705,974 | | | | 1.4 | |
| 2,282,450 | | | | | | 2.500%, 01/15/2029 | | | 2,919,511 | | | | 0.9 | |
| 1,980,908 | | | | | | 3.375%, 04/15/2032 | | | 2,948,695 | | | | 0.9 | |
| 1,049,303 | | | | | | 3.625%, 04/15/2028 | | | 1,394,762 | | | | 0.4 | |
| 1,823,913 | | | | | | 3.875%, 04/15/2029 | | | 2,541,745 | | | | 0.8 | |
| | | | | | | | | | 160,706,815 | | | | 49.5 | |
| |
| | | | | | | U.S. Treasury Bonds: 1.3% |
| 4,350,000 | | | | | | 1.750%, 08/15/2041 | | | 4,218,820 | | | | 1.3 | |
| | | | | | | Total U.S. Treasury Obligations | | | | | | | | |
| | | | | | | (Cost $147,310,419) | | | 164,925,635 | | | | 50.8 | |
See Accompanying Notes to Financial Statements
33
VY® BLACKROCK INFLATION
PROTECTED BOND PORTFOLIO | PORTFOLIO OF INVESTMENTS
AS OF DECEMBER 31, 2021 (CONTINUED) |
Principal
Amount† | | | | | | | | Value | | | Percentage
of Net
Assets |
|---|
| |
U.S. GOVERNMENT AGENCY OBLIGATIONS: 9.8% |
| | | | | | | Government National Mortgage Association: 2.2% |
| 1,894,000 | | | | (4) | | 2.000%, 01/15/2052 | | $ | 1,911,247 | | | | 0.6 | |
| 1,342,000 | | | | (4) | | 2.500%, 01/15/2052 | | | 1,374,395 | | | | 0.4 | |
| 300,000 | | | | (4) | | 2.500%, 02/15/2052 | | | 306,574 | | | | 0.1 | |
| 1,345,000 | | | | (4) | | 3.000%, 01/15/2052 | | | 1,391,713 | | | | 0.4 | |
| 740,761 | | | | | | 3.500%, 05/20/2047 | | | 778,395 | | | | 0.3 | |
| 300,000 | | | | (4) | | 3.500%, 01/15/2052 | | | 312,397 | | | | 0.1 | |
| 323,728 | | | | | | 4.000%, 09/20/2048 | | | 342,979 | | | | 0.1 | |
| 184,000 | | | | (4) | | 4.000%, 01/20/2050 | | | 193,773 | | | | 0.1 | |
| 254,826 | | | | | | 4.500%, 08/20/2048 | | | 270,017 | | | | 0.1 | |
| 79,000 | | | | (4) | | 4.500%, 01/15/2052 | | | 83,449 | | | | 0.0 | |
| | | | | | | | | | 6,964,939 | | | | 2.2 | |
| |
| | | | | | | Uniform Mortgage-Backed Securities: 7.6% |
| 992,000 | | | | (4) | | 1.500%, 01/15/2037 | | | 994,732 | | | | 0.3 | |
| 1,044,000 | | | | (4) | | 1.500%, 01/15/2052 | | | 1,008,240 | | | | 0.3 | |
| 1,427,000 | | | | (4) | | 2.000%, 01/15/2037 | | | 1,461,254 | | | | 0.4 | |
| 202,000 | | | | (4) | | 2.000%, 01/15/2052 | | | 201,393 | | | | 0.1 | |
| 6,417,000 | | | | (4) | | 2.000%, 02/15/2052 | | | 6,383,442 | | | | 2.0 | |
| 132,000 | | | | (4) | | 2.500%, 01/15/2037 | | | 136,448 | | | | 0.0 | |
| 192,000 | | | | (4) | | 2.500%, 01/15/2052 | | | 195,901 | | | | 0.1 | |
| 4,548,000 | | | | (4) | | 2.500%, 02/15/2052 | | | 4,628,856 | | | | 1.4 | |
| 72,000 | | | | (4) | | 3.000%, 01/15/2037 | | | 75,288 | | | | 0.0 | |
| 1,428,000 | | | | (4) | | 3.000%, 01/15/2052 | | | 1,479,467 | | | | 0.5 | |
| 400,000 | | | | (4) | | 3.000%, 02/15/2052 | | | 413,807 | | | | 0.1 | |
| 61,000 | | | | (4) | | 3.500%, 01/15/2037 | | | 64,210 | | | | 0.0 | |
| 794,000 | | | | (4) | | 3.500%, 01/15/2052 | | | 835,925 | | | | 0.3 | |
| 2,000 | | | | (4) | | 4.000%, 01/15/2052 | | | 2,128 | | | | 0.0 | |
| 572,000 | | | | (4) | | 4.000%, 02/15/2052 | | | 608,128 | | | | 0.2 | |
| 329,000 | | | | (4) | | 4.500%, 01/15/2052 | | | 352,486 | | | | 0.1 | |
| 744,133 | | | | | | 2.500%, 10/01/2036 | | | 777,439 | | | | 0.2 | |
| 496,713 | | | | | | 3.000%, 01/01/2036 | | | 523,275 | | | | 0.2 | |
| 1,108,406 | | | | | | 3.000%, 09/01/2051 | | | 1,170,168 | | | | 0.4 | |
| 182,890 | | | | | | 3.500%, 05/01/2036 | | | 195,286 | | | | 0.1 | |
| 1,321,625 | | | | | | 3.500%, 09/01/2051 | | | 1,433,718 | | | | 0.4 | |
| 907,532 | | | | | | 4.000%, 04/01/2050 | | | 984,899 | | | | 0.3 | |
| 721,835 | | | | | | 4.500%, 03/01/2048 | | | 781,013 | | | | 0.2 | |
| | | | | | | | | | 24,707,503 | | | | 7.6 | |
| | | | | | | Total U.S. Government Agency Obligations | | | | | | | | |
| | | | | | | (Cost $31,733,333) | | | 31,672,442 | | | | 9.8 | |
| |
CERTIFICATES OF DEPOSIT: 1.8% |
| 2,600,000 | | | | | | MUFG BK LTD 0.3% 10/25/22, 0.300%,
10/25/2022 | | | 2,596,863 | | | | 0.8 | |
| 3,300,000 | | | | | | TORONTO DOMINI 10/28/22, 0.340%,
10/28/2022 | | | 3,297,629 | | | | 1.0 | |
| | | | | | | Total Certificates of Deposit | | | | | | | | |
| | | | | | | (Cost $5,900,000) | | | 5,894,492 | | | | 1.8 | |
| |
SOVEREIGN BONDS: 2.3% | | |
| 200,000 | | | | (1) | | Abu Dhabi Government International Bond, 3.875%, 04/16/2050 | | | 233,479 | | | | 0.1 | |
| 200,000 | | | | | | Chile Government International Bond, 3.860%, 06/21/2047 | | | 222,252 | | | | 0.1 | |
EUR 1,085,000 | | | | (1) | | Finland Government Bond, 0.125%,
04/15/2052 | | | 1,110,417 | | | | 0.3 | |
Principal
Amount† | | | | | | | | Value | | | Percentage
of Net
Assets |
|---|
| |
SOVEREIGN BONDS: (continued) |
| 52,000 | | | | | | Hungary Government International Bond, 7.625%, 03/29/2041 | | $ | 85,166 | | | | 0.0 | |
| 200,000 | | | | (1) | | Indonesia Government International Bond, 6.750%, 01/15/2044 | | | 296,259 | | | | 0.1 | |
| 200,000 | | | | (1) | | Kazakhstan Government International Bond, 4.875%, 10/14/2044 | | | 246,070 | | | | 0.1 | |
EUR 530,000 | | | | | | Mexico Government International Bond, 1.450%, 10/25/2033 | | | 561,646 | | | | 0.2 | |
| 300,000 | | | | | | Mexico Government International Bond, 4.600%, 02/10/2048 | | | 320,792 | | | | 0.1 | |
NZD 289,000 | | | | | | New Zealand Government Inflation Linked Bond, 2.500%, 09/20/2040 | | | 289,388 | | | | 0.1 | |
NZD 395,000 | | | | | | New Zealand Government Bond, 1.750%, 05/15/2041 | | | 228,601 | | | | 0.1 | |
NZD 2,762,000 | | | | | | New Zealand Government Inflation Linked Bond, 2.000%, 09/20/2025 | | | 2,355,268 | | | | 0.7 | |
| 200,000 | | | | | | Panama Government International Bond, 4.500%, 04/01/2056 | | | 221,052 | | | | 0.1 | |
EUR 140,000 | | | | | | Peru Government Bond, 1.250%, 03/11/2033 | | | 152,844 | | | | 0.0 | |
| 46,000 | | | | | | Peruvian Government International Bond, 4.125%, 08/25/2027 | | | 50,707 | | | | 0.0 | |
| 103,000 | | | | | | Peruvian Government International Bond, 2.783%, 01/23/2031 | | | 102,744 | | | | 0.0 | |
| 53,000 | | | | | | Peruvian Government International Bond, 3.300%, 03/11/2041 | | | 53,199 | | | | 0.0 | |
| 200,000 | | | | | | Philippine Government International Bond, 3.700%, 02/02/2042 | | | 218,675 | | | | 0.1 | |
| 200,000 | | | | (1) | | Qatar Government International Bond, 5.103%, 04/23/2048 | | | 271,135 | | | | 0.1 | |
| 50,000 | | | | (1) | | Romanian Government International Bond, 3.000%, 02/14/2031 | | | 50,900 | | | | 0.0 | |
EUR 280,000 | | | | | | Romanian Government International Bond, 3.624%, 05/26/2030 | | | 346,347 | | | | 0.1 | |
| 94,000 | | | | (1) | | Romanian Government International Bond, 4.000%, 02/14/2051 | | | 94,292 | | | | 0.0 | |
| 51,256 | | | | | | Uruguay Government International Bond, 4.375%, 01/23/2031 | | | 59,137 | | | | 0.0 | |
| 45,049 | | | | | | Uruguay Government International Bond, 5.100%, 06/18/2050 | | | 59,681 | | | | 0.0 | |
| | | | | | | Total Sovereign Bonds | | | | | | | | |
| | | | | | | (Cost $7,677,362) | | | 7,630,051 | | | | 2.3 | |
See Accompanying Notes to Financial Statements
34
VY® BLACKROCK INFLATION
PROTECTED BOND PORTFOLIO | PORTFOLIO OF INVESTMENTS
AS OF DECEMBER 31, 2021 (CONTINUED) |
Principal
Amount† | | | | | | | | Value | | | Percentage
of Net
Assets |
|---|
| |
COMMERCIAL MORTGAGE-BACKED SECURITIES: 4.5% |
| 366,000 | | | | | | BANK 2019-BNK23 A3, 2.920%, 12/15/2052 | | $ | 386,870 | | | | 0.1 | |
| 300,000 | | | | | | Barclays Commercial Mortgage Trust 2019-C3 B, 4.096%, 05/15/2052 | | | 328,231 | | | | 0.1 | |
| 1,000,000 | | | | | | BENCHMARK 2018-B3 A5 Mortgage Trust, 4.025%, 04/10/2051 | | | 1,111,603 | | | | 0.3 | |
| 350,000 | | | | | | Benchmark 2019-B15 A5 Mortgage Trust, 2.928%, 12/15/2072 | | | 368,911 | | | | 0.1 | |
| 1,000,000 | | | | (1) | | BX Commercial Mortgage Trust 2021-XL2 A, 0.799%, (US0001M + 0.689%), 10/15/2038 | | | 995,243 | | | | 0.3 | |
| 800,000 | | | | (1) | | BX Trust 2021-ARIA A, 1.009%, (US0001M + 0.899%), 10/15/2036 | | | 799,737 | | | | 0.3 | |
| 410,000 | | | | | | CD 2017-CD3 A4 Mortgage Trust, 3.631%, 02/10/2050 | | | 441,719 | | | | 0.1 | |
| 500,000 | | | | | | CD 2017-CD6 Mortgage Trust A5, 3.456%,
11/13/2050 | | | 538,962 | | | | 0.2 | |
| 800,000 | | | | (1) | | Credit Suisse Mortgage Capital Certificates 2019-ICE4 A, 1.090%, (US0001M + 0.980%), 05/15/2036 | | | 800,673 | | | | 0.3 | |
| 730,000 | | | | (1),(5) | | Credit Suisse Mortgage Capital Certificates 2021-BHAR A, 1.260%, (US0001M + 1.150%), 11/15/2038 | | | 730,000 | | | | 0.2 | |
| 205,000 | | | | | | CSAIL 2015-C3 A4 Commercial Mortgage Trust, 3.718%,
08/15/2048 | | | 218,110 | | | | 0.1 | |
| 550,000 | | | | (1) | | ELP Commercial Mortgage Trust 2021-ELP A, 0.811%, (US0001M + 0.701%), 11/15/2038 | | | 547,557 | | | | 0.2 | |
| 387,982 | | | | (1) | | Extended Stay America Trust 2021-ESH A, 1.190%, (US0001M + 1.080%), 07/15/2038 | | | 389,097 | | | | 0.1 | |
| 1,000,000 | | | | | | GS Mortgage Securities Trust 2017-GS7 A4, 3.430%, 08/10/2050 | | | 1,073,488 | | | | 0.3 | |
| 498,000 | | | | | | GS Mortgage Securities Trust 2015-GC32 A4, 3.764%, 07/10/2048 | | | 531,331 | | | | 0.2 | |
| 1,000,000 | | | | | | GS Mortgage Securities Trust 2016-GS2 A4, 3.050%, 05/10/2049 | | | 1,046,881 | | | | 0.3 | |
| 600,000 | | | | (1) | | JP Morgan Chase Commercial Mortgage Securities Corp. 2021-HYAH A, 0.870%, (US0001M + 0.760%), 06/15/2038 | | | 599,355 | | | | 0.2 | |
| 380,000 | | | | (1) | | Med Trust 2021-MDLN A, 1.060%, (US0001M + 0.950%), 11/15/2038 | | | 380,154 | | | | 0.1 | |
Principal
Amount† | | | | | | | | Value | | | Percentage
of Net
Assets |
|---|
| |
COMMERCIAL MORTGAGE-BACKED SECURITIES: (continued) |
| 100,000 | | | | (1) | | MF1 2021-W10 A, 1.123%, (SOFR30A + 1.070%), 12/15/2034 | | $ | 99,914 | | | | 0.0 | |
| 1,100,000 | | | | | | Morgan Stanley Bank of America Merrill Lynch Trust 2014-C15 A4, 4.051%, 04/15/2047 | | | 1,155,161 | | | | 0.4 | |
| 800,000 | | | | (1) | | SREIT Trust 2021-PALM A, 0.700%, (US0001M + 0.590%), 10/15/2034 | | | 795,562 | | | | 0.3 | |
| 422,500 | | | | | | Wells Fargo Commercial Mortgage Trust 2015-C26 B, 3.783%, 02/15/2048 | | | 436,762 | | | | 0.1 | |
| 700,000 | | | | | | Wells Fargo Commercial Mortgage Trust 2017-C39 A5, 3.418%, 09/15/2050 | | | 754,231 | | | | 0.2 | |
| | | | | | | Total Commercial Mortgage-Backed Securities | | | | | | | | |
| | | | | | | (Cost $14,280,083) | | | 14,529,552 | | | | 4.5 | |
| |
ASSET-BACKED SECURITIES: 2.0% |
| | | | | | | Automobile Asset-Backed Securities: 0.1% |
| 430,000 | | | | (1) | | Credit Acceptance Auto Loan Trust 2021-4 A, 1.260%, 10/15/2030 | | | 426,981 | | | | 0.1 | |
| |
| | | | | | | Student Loan Asset-Backed Securities: 1.9% |
| 177,721 | | | | (1) | | College Avenue Student Loans LLC 2021-B A2, 1.760%, 06/25/2052 | | | 175,169 | | | | 0.1 | |
| 1,032,026 | | | | (1) | | Navient Private Education Refi Loan Trust 2021-EA A, 0.970%, 12/16/2069 | | | 1,015,386 | | | | 0.3 | |
| 207,285 | | | | (1) | | Navient Student Loan Trust 2019-BA A2A, 3.390%, 12/15/2059 | | | 213,700 | | | | 0.1 | |
| 878,273 | | | | (1) | | Nelnet Student Loan Trust 2021-BA AFL, 0.884%, (US0001M + 0.780%), 04/20/2062 | | | 880,234 | | | | 0.3 | |
| 1,067,564 | | | | (1) | | Nelnet Student Loan Trust 2021-CA AFL, 0.844%, (US0001M + 0.740%), 04/20/2062 | | | 1,071,408 | | | | 0.3 | |
| 738,563 | | | | | | SLM Private Credit Student Loan Trust 2005-A A4, 0.513%, (US0003M + 0.310%), 12/15/2038 | | | 726,579 | | | | 0.2 | |
| 613,747 | | | | (1) | | SMB Private Education Loan Trust 2021-D A1A, 1.340%, 03/17/2053 | | | 604,866 | | | | 0.2 | |
| 860,000 | | | | (1) | | SMB Private Education Loan Trust 2021-E A1A, 1.680%, 02/15/2051 | | | 853,819 | | | | 0.3 | |
| 428,675 | | | | (1) | | Sofi Professional Loan Program 2018-C A2FX Trust, 3.590%,
01/25/2048 | | | 439,401 | | | | 0.1 | |
| | | | | | | | | | 5,980,562 | | | | 1.9 | |
| | | | | | | Total Asset-Backed Securities | | | | | | | | |
| | | | | | | (Cost $6,420,017) | | | 6,407,543 | | | | 2.0 | |
See Accompanying Notes to Financial Statements
35
VY® BLACKROCK INFLATION
PROTECTED BOND PORTFOLIO | PORTFOLIO OF INVESTMENTS
AS OF DECEMBER 31, 2021 (CONTINUED) |
| | | | | | | | | Value | | | Percentage
of Net
Assets |
|---|
| |
PURCHASED OPTIONS (6): 0.4% |
| | | | | | | Total Purchased Options | | | | | | | | |
| | | | | | | (Cost $1,442,544) | | $ | 1,382,108 | | | | 0.4 | |
| | | | | | | Total Long-Term Investments | | | | | | | | |
| | | | | | | (Cost $301,545,535) | | | 319,111,129 | | | | 98.3 | |
Principal
Amount† | | | | | | | | Value | | | Percentage
of Net
Assets |
|---|
| |
SHORT-TERM INVESTMENTS: 8.0% |
| | | | | | | Commercial Paper: 3.2% |
| 3,300,000 | | | | | | Australia & New Zealand Banking Group Ltd., 0.280%, 07/28/2022 | | | 3,294,655 | | | | 1.0 | |
| 3,600,000 | | | | | | Commonwealth Bank of Australia,
0.410%, 10/21/2022 | | | 3,588,181 | | | | 1.1 | |
| 3,600,000 | | | | | | Nordea Bank ABP, 0.340%, 10/21/2022 | | | 3,590,121 | | | | 1.1 | |
| | | | | | | Total Commercial Paper | | | | | | | | |
| | | | | | | (Cost $10,477,625) | | | 10,472,957 | | | | 3.2 | |
| Shares | | | | | | | | Value | | | Percentage
of Net
Assets |
|---|
| | | | | | | Mutual Funds: 2.8% |
| 9,030,640 | | | | (7) | | BlackRock Liquidity Funds, FedFund, Institutional Class, 0.030%
(Cost $9,030,640) | | | 9,030,640 | | | | 2.8 | |
| |
| | | | | | | Sovereign Bill: 2.0% |
| 735,000,000 | | | | (8) | | Japan Treasury Discount Bill (0.100)%
(Cost $6,492,020) | | | 6,390,298 | | | | 2.0 | |
| | | | | | | Total Short-Term Investments | | | | | | | | |
| | | | | | | (Cost $26,000,285) | | | 25,893,895 | | | | 8.0 | |
| | | | | | | Total Investments in Securities
(Cost $327,545,820) | | $ | 345,005,024 | | | | 106.3 | |
| | | | | | | Liabilities in Excess of
Other Assets | | | (20,363,886 | ) | | | (6.3 | ) |
| | | | | | | Net Assets | | $ | 324,641,138 | | | | 100.0 | |
| † | | Unless otherwise indicated, principal amount is shown in USD. |
| (1) | | Securities with purchases pursuant to Rule 144A or section 4(a)(2), under the Securities Act of 1933 and may not be resold subject to that rule except to qualified institutional buyers. |
| (2) | | Variable rate security. Rate shown is the rate in effect as of December 31, 2021. |
| (3) | | All or a portion of this security has been pledged as collateral in connection with open futures contracts. Please refer to Note 2 for additional details. |
| (4) | | Represents or includes a TBA transaction. |
| (5) | | For fair value measurement disclosure purposes, security is categorized as Level 3, whose value was determined using significant unobservable inputs. |
| (6) | | The tables within the Portfolio of Investments detail open purchased options which are non-income producing securities. |
| (7) | | Rate shown is the 7-day yield as of December 31, 2021. |
| (8) | | Represents a zero coupon bond. Rate shown reflects the effective yield as of December 31, 2021. |
| Currency Abbreviations: |
| EUR | | EU Euro |
| NZD | | New Zealand Dollar |
| Reference Rate Abbreviations: |
| SOFRRATE | | 1-day Secured Overnight Financing Rate |
| SOFR30A | | 30-day Secured Overnight Financing Rate |
| US0001M | | 1-month LIBOR |
| US0003M | | 3-month LIBOR |
See Accompanying Notes to Financial Statements
36
VY® BLACKROCK INFLATION
PROTECTED BOND PORTFOLIO | PORTFOLIO OF INVESTMENTS
AS OF DECEMBER 31, 2021 (CONTINUED) |
Fair Value Measurementsˆ
The following is a summary of the fair valuations according to the inputs used as of December 31, 2021 in valuing the assets and liabilities:
| | Quoted Prices
in Active Markets
for Identical
Investments
(Level 1) | | Significant
Other
Observable
Inputs
(Level 2) | | Significant
Unobservable
Inputs
(Level 3) | | Fair Value
at
December 31, 2021 |
|---|
Asset Table | | | | | | | | | | | | | | | | | | | | |
Investments, at fair value | | | | | | | | | | | | | | | | | | | | |
| Purchased Options | | | $ | 5,844 | | | | $ | 1,376,264 | | | | $ | — | | | | $ | 1,382,108 | |
| Corporate Bonds/Notes | | | | — | | | | | 86,669,306 | | | | | — | | | | | 86,669,306 | |
| U.S. Government Agency Obligations | | | | — | | | | | 31,672,442 | | | | | — | | | | | 31,672,442 | |
| Commercial Mortgage-Backed Securities | | | | — | | | | | 13,799,552 | | | | | 730,000 | | | | | 14,529,552 | |
| Sovereign Bonds | | | | — | | | | | 7,630,051 | | | | | — | | | | | 7,630,051 | |
| Asset-Backed Securities | | | | — | | | | | 6,407,543 | | | | | — | | | | | 6,407,543 | |
| Certificates of Deposit | | | | — | | | | | 5,894,492 | | | | | — | | | | | 5,894,492 | |
| U.S. Treasury Obligations | | | | — | | | | | 164,925,635 | | | | | — | | | | | 164,925,635 | |
| Short-Term Investments | | | | 9,030,640 | | | | | 16,863,255 | | | | | — | | | | | 25,893,895 | |
| Total Investments, at fair value | | | $ | 9,036,484 | | | | $ | 335,238,540 | | | | $ | 730,000 | | | | $ | 345,005,024 | |
Other Financial Instruments+ | | | | | | | | | | | | | | | | | | | | |
| Centrally Cleared Swaps | | | | — | | | | | 9,035,054 | | | | | — | | | | | 9,035,054 | |
| Forward Foreign Currency Contracts | | | | — | | | | | 114,662 | | | | | — | | | | | 114,662 | |
| Futures | | | | 419,059 | | | | | — | | | | | — | | | | | 419,059 | |
| OTC Swaps | | | | — | | | | | 1,463,650 | | | | | — | | | | | 1,463,650 | |
| Total Assets | | | $ | 9,455,543 | | | | $ | 345,851,906 | | | | $ | 730,000 | | | | $ | 356,037,449 | |
Liabilities Table | | | | | | | | | | | | | | | | | | | | |
Other Financial Instruments+ | | | | | | | | | | | | | | | | | | | | |
| Centrally Cleared Swaps | | | $ | — | | | | $ | (2,724,557 | ) | | | $ | — | | | | $ | (2,724,557 | ) |
| Forward Foreign Currency Contracts | | | | — | | | | | (43,132 | ) | | | | — | | | | | (43,132 | ) |
| Futures | | | | (661,282 | ) | | | | — | | | | | — | | | | | (661,282 | ) |
| OTC Swaps | | | | — | | | | | (180,826 | ) | | | | — | | | | | (180,826 | ) |
| Written Options | | | | (1,859 | ) | | | | (1,683,554 | ) | | | | — | | | | | (1,685,413 | ) |
| Total Liabilities | | | $ | (663,141 | ) | | | $ | (4,632,069 | ) | | | $ | — | | | | $ | (5,295,210 | ) |
| ˆ | | See Note 2, “Significant Accounting Policies” in the Notes to Financial Statements for additional information. |
| + | | Other Financial Instruments may include open forward foreign currency contracts, futures, centrally cleared swaps, OTC swaps and written options. Forward foreign currency contracts, futures and centrally cleared swaps are fair valued at the unrealized appreciation (depreciation) on the instrument. OTC swaps and written options are valued at the fair value of the instrument. |
At December 31, 2021, the following forward foreign currency contracts were outstanding for VY® BlackRock Inflation Protected Bond Portfolio:
| Currency Purchased | | | Currency Sold | | Counterparty | | Settlement Date | | Unrealized
Appreciation
(Depreciation) |
|---|
| USD | 1,808,033 | | | EUR | 1,601,000 | | Bank of America N.A. | | 02/02/22 | | | $ | (15,807 | ) |
| USD | 89,153 | | | EUR | 79,000 | | Bank of America N.A. | | 02/02/22 | | | | (843 | ) |
| USD | 257,200 | | | GBP | 194,074 | | Standard Chartered Bank | | 02/02/22 | | | | (5,471 | ) |
| USD | 12,525 | | | EUR | 11,000 | | Standard Chartered Bank | | 02/02/22 | | | | (6 | ) |
| USD | 2,838,074 | | | NZD | 4,169,000 | | Standard Chartered Bank | | 02/02/22 | | | | (16,172 | ) |
| USD | 6,500,046 | | | JPY | 734,387,328 | | Standard Chartered Bank | | 02/07/22 | | | | 114,004 | |
| GBP | 19,165 | | | USD | 25,376 | | Toronto Dominion Securities | | 02/02/22 | | | | 563 | |
| USD | 170,537 | | | EUR | 151,193 | | Toronto Dominion Securities | | 02/02/22 | | | | (1,701 | ) |
| USD | 55,743 | | | AUD | 78,569 | | Toronto Dominion Securities | | 02/02/22 | | | | (1,426 | ) |
| USD | 149,715 | | | EUR | 132,414 | | UBS AG | | 02/02/22 | | | | (1,129 | ) |
| USD | 62,078 | | | EUR | 55,000 | | UBS AG | | 02/02/22 | | | | (577 | ) |
| USD | 5,423 | | | JPY | 612,672 | | UBS AG | | 02/07/22 | | | | 95 | |
| | | | | | | | | | | | | $ | 71,530 | |
See Accompanying Notes to Financial Statements
37
VY® BLACKROCK INFLATION
PROTECTED BOND PORTFOLIO | PORTFOLIO OF INVESTMENTS
AS OF DECEMBER 31, 2021 (CONTINUED) |
At December 31, 2021, the following futures contracts were outstanding for VY® BlackRock Inflation Protected Bond Portfolio:
| Description | | Number
of Contracts | | Expiration
Date | | Notional
Amount | | Unrealized
Appreciation/
(Depreciation) |
|---|
| Long Contracts: | | | | | | | | | | | | | | | | | | |
| 3-Month SONIA Index | | | 47 | | | | 12/20/22 | | | | $ | 15,731,609 | | | | $ | (31,740 | ) |
| 90-Day Bank Accepted Bills | | | 46 | | | | 12/08/22 | | | | | 33,384,883 | | | | | 14,776 | |
| Canadian Bankers’ Acceptance | | | 40 | | | | 06/13/22 | | | | | 7,807,423 | | | | | (37,425 | ) |
| Euro-Bund | | | 1 | | | | 03/08/22 | | | | | 195,104 | | | | | (2,625 | ) |
| U.S. Treasury 2-Year Note | | | 24 | | | | 03/31/22 | | | | | 5,236,125 | | | | | 1,212 | |
| U.S. Treasury 5-Year Note | | | 340 | | | | 03/31/22 | | | | | 41,132,031 | | | | | 154,993 | |
| | | | | | | | | | | | $ | 103,487,175 | | | | $ | 99,191 | |
| Short Contracts: | | | | | | | | | | | | | | | | | | |
| 90-Day Eurodollar | | | (13 | ) | | | 12/16/24 | | | | | (3,194,425 | ) | | | | 8,350 | |
| Canadian Bankers’ Acceptance | | | (40 | ) | | | 03/14/22 | | | | | (7,840,231 | ) | | | | (3,768 | ) |
| Euro-Bobl 5-Year | | | (2 | ) | | | 03/08/22 | | | | | (303,387 | ) | | | | 1,826 | |
Euro-Buxl® 30-year German Government Bond | | | (20 | ) | | | 03/08/22 | | | | | (4,707,463 | ) | | | | 212,740 | |
| Long Gilt | | | (18 | ) | | | 03/29/22 | | | | | (3,043,043 | ) | | | | 25,162 | |
| U.S. Treasury 10-Year Note | | | (71 | ) | | | 03/22/22 | | | | | (9,263,281 | ) | | | | (19,792 | ) |
| U.S. Treasury Long Bond | | | (86 | ) | | | 03/22/22 | | | | | (13,797,625 | ) | | | | (196,776 | ) |
| U.S. Treasury Ultra 10-Year Note | | | (97 | ) | | | 03/22/22 | | | | | (14,204,437 | ) | | | | (177,799 | ) |
| U.S. Treasury Ultra Long Bond | | | (81 | ) | | | 03/22/22 | | | | | (15,967,125 | ) | | | | (191,357 | ) |
| | | | | | | | | | | | $ | (72,321,017 | ) | | | $ | (341,414 | ) |
At December 31, 2021, the following centrally cleared interest rate swaps were outstanding for VY® BlackRock Inflation Protected Bond Portfolio:
Pay/Receive
Floating Rate | | Floating Rate Index | | Floating Rate
Index Payment
Frequency | | Fixed
Rate | | Fixed Rate
Payment
Frequency | | | Maturity
Date | | | Notional Amount | | | Fair
Value | | Unrealized
Appreciation/
(Depreciation) |
|---|
| Pay | | 6-month EUR-EURIBOR | | Semi-Annual | | | (0.085 | )% | | Annual | | | 08/15/26 | | | | EUR 2,905,000 | | | $ | (11,494 | ) | | $ | (11,494 | ) |
| Pay | | 3-month USD-LIBOR | | Quarterly | | | 0.259 | | | Semi-Annual | | | 03/23/23 | | | | USD 3,450,000 | | | | (15,635 | ) | | | (15,593 | ) |
| Pay | | 3-month USD-LIBOR | | Quarterly | | | 0.353 | | | Semi-Annual | | | 11/18/23 | | | | USD 2,610,000 | | | | (26,183 | ) | | | (26,183 | ) |
| Pay | | 3-month USD-LIBOR | | Quarterly | | | 0.500 | | | Semi-Annual | | | 12/08/23 | | | | USD 2,500,000 | | | | (19,513 | ) | | | (19,513 | ) |
| Pay | | 3-month USD-LIBOR | | Quarterly | | | 0.450 | | | Semi-Annual | | | 12/14/23 | | | | USD 2,482,000 | | | | (22,242 | ) | | | (22,242 | ) |
| Pay | | 3-month USD-LIBOR | | Quarterly | | | 1.000 | | | Semi-Annual | | | 12/31/23 | | | | USD 5,110,000 | | | | (3,170 | ) | | | (2,936 | ) |
| Pay | | 3-month USD-LIBOR | | Quarterly | | | 0.592 | | | Semi-Annual | | | 04/20/24 | | | | USD 1,490,000 | | | | (16,277 | ) | | | (16,277 | ) |
| Pay | | 3-month USD-LIBOR | | Quarterly | | | 1.170 | | | Semi-Annual | | | 06/21/24 | | | | USD 405,000 | | | | (591 | ) | | | (591 | ) |
| Pay | | 3-month USD-LIBOR | | Quarterly | | | 1.180 | | | Semi-Annual | | | 06/21/24 | | | | USD 405,000 | | | | (515 | ) | | | (515 | ) |
| Pay | | 3-month USD-LIBOR | | Quarterly | | | 3.090 | | | Semi-Annual | | | 11/29/24 | | | | USD 3,970,000 | | | | 221,817 | | | | 221,817 | |
| Pay | | 3-month USD-LIBOR | | Quarterly | | | 0.358 | | | Semi-Annual | | | 06/02/25 | | | | USD 860,000 | | | | (24,962 | ) | | | (24,962 | ) |
| Pay | | 1-day Secured Overnight Financing Rate | | Annual | | | 1.073 | | | Annual | | | 12/15/26 | | | | USD 310,000 | | | | (419 | ) | | | (419 | ) |
| Pay | | 3-month USD-LIBOR | | Quarterly | | | 1.405 | | | Semi-Annual | | | 01/20/27 | | | | USD 612,000 | | | | 798 | | | | 798 | |
| Pay | | 3-month USD-LIBOR | | Quarterly | | | 1.430 | | | Semi-Annual | | | 01/20/27 | | | | USD 613,000 | | | | 1,546 | | | | 1,546 | |
| Pay | | 3-month USD-LIBOR | | Quarterly | | | 1.445 | | | Semi-Annual | | | 01/20/27 | | | | USD 612,000 | | | | 1,990 | | | | 1,990 | |
| Pay | | 3-month USD-LIBOR | | Quarterly | | | 1.335 | | | Semi-Annual | | | 01/21/27 | | | | USD 613,000 | | | | (1,319 | ) | | | (1,319 | ) |
| Pay | | 3-month USD-LIBOR | | Quarterly | | | 1.535 | | | Semi-Annual | | | 02/24/27 | | | | USD 670,000 | | | | 4,166 | | | | 4,166 | |
| Pay | | 3-month USD-LIBOR | | Quarterly | | | 1.561 | | | Semi-Annual | | | 02/25/27 | | | | USD 670,000 | | | | 4,979 | | | | 4,979 | |
| Pay | | 3-month USD-LIBOR | | Quarterly | | | 1.366 | | | Semi-Annual | | | 03/22/27 | | | | USD 490,000 | | | | (1,493 | ) | | | (1,493 | ) |
| Pay | | 3-month USD-LIBOR | | Quarterly | | | 1.541 | | | Semi-Annual | | | 05/20/27 | | | | USD 420,000 | | | | 1,358 | | | | 1,358 | |
| Pay | | 3-month USD-LIBOR | | Quarterly | | | 1.630 | | | Semi-Annual | | | 05/26/27 | | | | USD 335,000 | | | | 2,459 | | | | 2,459 | |
| Pay | | 3-month USD-LIBOR | | Quarterly | | | 1.635 | | | Semi-Annual | | | 05/26/27 | | | | USD 1,340,000 | | | | 10,128 | | | | 10,128 | |
| Pay | | 1-day Secured Overnight Financing Rate | | Annual | | | 1.231 | | | Annual | | | 06/14/27 | | | | USD 165,000 | | | | 7 | | | | 7 | |
| Pay | | 3-month USD-LIBOR | | Quarterly | | | 0.652 | | | Semi-Annual | | | 06/20/27 | | | | USD 870,000 | | | | (35,567 | ) | | | (35,567 | ) |
| Pay | | 3-month USD-LIBOR | | Quarterly | | | 0.680 | | | Semi-Annual | | | 06/20/27 | | | | USD 870,000 | | | | (34,408 | ) | | | (34,408 | ) |
| Pay | | 1-day Secured Overnight Financing Rate | | Annual | | | 1.247 | | | Annual | | | 07/05/27 | | | | USD 335,000 | | | | — | | | | — | |
| Pay | | 3-month USD-LIBOR | | Quarterly | | | 1.350 | | | Semi-Annual | | | 07/08/27 | | | | USD 1,210,000 | | | | (9,229 | ) | | | (9,229 | ) |
| Pay | | 3-month USD-LIBOR | | Quarterly | | | 1.190 | | | Semi-Annual | | | 07/19/27 | | | | USD 960,000 | | | | (15,064 | ) | | | (15,064 | ) |
| Pay | | 3-month USD-LIBOR | | Quarterly | | | 1.578 | | | Semi-Annual | | | 07/27/27 | | | | USD 120,000 | | | | 338 | | | | 338 | |
| Pay | | 1-day Secured Overnight Financing Rate | | Annual | | | 1.297 | | | Annual | | | 07/28/27 | | | | USD 170,000 | | | | 351 | | | | 351 | |
See Accompanying Notes to Financial Statements
38
VY® BLACKROCK INFLATION
PROTECTED BOND PORTFOLIO | PORTFOLIO OF INVESTMENTS
AS OF DECEMBER 31, 2021 (CONTINUED) |
Pay/Receive
Floating Rate | | Floating Rate Index | | Floating Rate
Index Payment
Frequency | | Fixed
Rate | | Fixed Rate
Payment
Frequency | | Maturity
Date | | | Notional Amount | | | Fair
Value | | | Unrealized
Appreciation/
(Depreciation) |
|---|
| Pay | | 3-month USD-LIBOR | | Quarterly | | | 1.483 | % | | Semi-Annual | | 08/01/27 | | | | USD 1,020,000 | | | $ | (1,978 | ) | | $ | (1,978 | ) |
| Pay | | 3-month USD-LIBOR | | Quarterly | | | 1.493 | | | Semi-Annual | | 08/01/27 | | | | USD 1,020,000 | | | | (1,485 | ) | | | (1,485 | ) |
| Pay | | 1-day Secured Overnight Financing Rate | | Annual | | | 1.220 | | | Annual | | 08/05/27 | | | | USD 250,000 | | | | (477 | ) | | | (477 | ) |
| Pay | | 3-month USD-LIBOR | | Quarterly | | | 1.224 | | | Semi-Annual | | 08/16/27 | | | | USD 320,000 | | | | (4,754 | ) | | | (4,754 | ) |
| Pay | | 3-month USD-LIBOR | | Quarterly | | | 1.677 | | | Semi-Annual | | 11/21/27 | | | | USD 420,000 | | | | 1,886 | | | | 1,886 | |
| Pay | | 3-month USD-LIBOR | | Quarterly | | | 0.654 | | | Semi-Annual | | 07/12/28 | | | | USD 900,000 | | | | (43,366 | ) | | | (43,383 | ) |
| Pay | | 1-day Secured Overnight Financing Rate | | Annual | | | 1.196 | | | Annual | | 11/15/28 | | | | USD 490,000 | | | | (1,634 | ) | | | (1,634 | ) |
| Pay | | 3-month USD-LIBOR | | Quarterly | | | 0.819 | | | Semi-Annual | | 04/14/30 | | | | USD 610,000 | | | | (33,946 | ) | | | (33,946 | ) |
| Pay | | 1-day Secured Overnight Financing Rate | | Annual | | | 1.254 | | | Annual | | 08/15/31 | | | | USD 290,000 | | | | (2,089 | ) | | | (2,089 | ) |
| Pay | | 1-day Secured Overnight Financing Rate | | Annual | | | 1.460 | | | Annual | | 08/15/31 | | | | USD 1,120,000 | | | | 12,527 | | | | 9,470 | |
| Pay | | 3-month USD-LIBOR | | Quarterly | | | 1.513 | | | Semi-Annual | | 08/19/31 | | | | USD 60,000 | | | | (270 | ) | | | (270 | ) |
| Pay | | 1-day Secured Overnight Financing Rate | | Annual | | | 1.315 | | | Annual | | 11/30/31 | | | | USD 280,000 | | | | 431 | | | | 431 | |
| Pay | | 1-day Secured Overnight Financing Rate | | Annual | | | 1.275 | | | Annual | | 12/02/31 | | | | USD 170,000 | | | | (411 | ) | | | (411 | ) |
| Pay | | 1-day Secured Overnight Financing Rate | | Annual | | | 1.275 | | | Annual | | 12/02/31 | | | | USD 170,000 | | | | (403 | ) | | | (403 | ) |
| Pay | | 1-day Secured Overnight Financing Rate | | Annual | | | 1.277 | | | Annual | | 12/02/31 | | | | USD 170,000 | | | | (379 | ) | | | (379 | ) |
| Pay | | 1-day Secured Overnight Financing Rate | | Annual | | | 1.298 | | | Annual | | 12/02/31 | | | | USD 170,000 | | | | (39 | ) | | | (39 | ) |
| Pay | | 1-day Secured Overnight Financing Rate | | Annual | | | 1.186 | | | Annual | | 12/07/31 | | | | USD 112,000 | | | | (1,240 | ) | | | (1,240 | ) |
| Pay | | 1-day Secured Overnight Financing Rate | | Annual | | | 1.238 | | | Annual | | 12/07/31 | | | | USD 340,000 | | | | (2,081 | ) | | | (2,081 | ) |
| Pay | | 1-day Secured Overnight Financing Rate | | Annual | | | 1.307 | | | Annual | | 12/13/31 | | | | USD 170,000 | | | | 31 | | | | 31 | |
| Pay | | 1-day Secured Overnight Financing Rate | | Annual | | | 1.272 | | | Annual | | 12/16/31 | | | | USD 165,000 | | | | (546 | ) | | | (546 | ) |
| Pay | | 1-day Secured Overnight Financing Rate | | Annual | | | 1.239 | | | Annual | | 12/20/31 | | | | USD 85,000 | | | | (561 | ) | | | (561 | ) |
| Pay | | 1-day Secured Overnight Financing Rate | | Annual | | | 1.247 | | | Annual | | 12/20/31 | | | | USD 85,000 | | | | (496 | ) | | | (496 | ) |
| Pay | | 1-day Secured Overnight Financing Rate | | Annual | | | 1.196 | | | Annual | | 12/21/31 | | | | USD 90,000 | | | | (965 | ) | | | (965 | ) |
| Pay | | 1-day Secured Overnight Financing Rate | | Annual | | | 1.208 | | | Annual | | 12/21/31 | | | | USD 165,000 | | | | (1,580 | ) | | | (1,580 | ) |
| Pay | | 1-day Secured Overnight Financing Rate | | Annual | | | 1.192 | | | Annual | | 12/22/31 | | | | USD 82,500 | | | | (922 | ) | | | (922 | ) |
| Pay | | 3-month USD-LIBOR | | Quarterly | | | 1.775 | | | Semi-Annual | | 01/26/32 | | | | USD 270,000 | | | | 4,757 | | | | 4,757 | |
| Pay | | 1-day Secured Overnight Financing Rate | | Annual | | | 1.362 | | | Annual | | 05/15/47 | | | | USD 520,000 | | | | (14,481 | ) | | | (14,481 | ) |
| Pay | | 3-month USD-LIBOR | | Quarterly | | | 1.828 | | | Semi-Annual | | 02/10/50 | | | | USD 120,000 | | | | 2,556 | | | | 2,556 | |
| Pay | | 3-month USD-LIBOR | | Quarterly | | | 1.250 | | | Semi-Annual | | 09/08/50 | | | | USD 92,000 | | | | (10,403 | ) | | | (10,403 | ) |
| Pay | | 3-month USD-LIBOR | | Quarterly | | | 1.870 | | | Semi-Annual | | 02/19/51 | | | | USD 220,000 | | | | 7,296 | | | | 7,296 | |
| Pay | | 3-month USD-LIBOR | | Quarterly | | | 1.905 | | | Semi-Annual | | 02/22/51 | | | | USD 110,000 | | | | 4,565 | | | | 4,565 | |
| Pay | | 3-month USD-LIBOR | | Quarterly | | | 1.904 | | | Semi-Annual | | 06/11/51 | | | | USD 50,000 | | | | 2,097 | | | | 2,097 | |
| Pay | | 1-day Secured Overnight Financing Rate | | Annual | | | 1.389 | | | Annual | | 12/15/51 | | | | USD 70,000 | | | | (1,103 | ) | | | (1,103 | ) |
| Pay | | 3-month USD-LIBOR | | Quarterly | | | 1.929 | | | Semi-Annual | | 12/01/56 | | | | USD 25,000 | | | | 1,032 | | | | 1,032 | |
| Receive | | 6-month EUR-EURIBOR | | Semi-Annual | | | 0.185 | | | Annual | | 01/16/30 | | | | EUR 270,000 | | | | 55 | | | | 55 | |
| Receive | | 6-month EUR-EURIBOR | | Semi-Annual | | | 0.440 | | | Annual | | 05/16/33 | | | | EUR 140,000 | | | | 560 | | | | 560 | |
| Receive | | 3-month USD-LIBOR | | Quarterly | | | 1.771 | | | Semi-Annual | | 07/12/23 | | | | USD 8,275,000 | | | | (64,375 | ) | | | (64,375 | ) |
| Receive | | 3-month USD-LIBOR | | Quarterly | | | 0.473 | | | Semi-Annual | | 10/14/23 | | | | USD 1,440,000 | | | | 9,763 | | | | 9,763 | |
| Receive | | 3-month USD-LIBOR | | Quarterly | | | 0.649 | | | Semi-Annual | | 01/18/24 | | | | USD 1,630,000 | | | | 10,177 | | | | 10,177 | |
| Receive | | 3-month USD-LIBOR | | Quarterly | | | 1.059 | | | Semi-Annual | | 02/24/24 | | | | USD 1,640,000 | | | | (754 | ) | | | (754 | ) |
| Receive | | 3-month USD-LIBOR | | Quarterly | | | 1.069 | | | Semi-Annual | | 02/25/24 | | | | USD 1,640,000 | | | | (1,007 | ) | | | (1,007 | ) |
| Receive | | 3-month USD-LIBOR | | Quarterly | | | 1.053 | | | Semi-Annual | | 02/28/24 | | | | USD 3,260,000 | | | | (600 | ) | | | (600 | ) |
| Receive | | 3-month USD-LIBOR | | Quarterly | | | 1.060 | | | Semi-Annual | | 02/29/24 | | | | USD 815,000 | | | | (258 | ) | | | (258 | ) |
| Receive | | 3-month USD-LIBOR | | Quarterly | | | 0.563 | | | Semi-Annual | | 03/24/24 | | | | USD 360,000 | | | | 3,788 | | | | 3,788 | |
| Receive | | 3-month USD-LIBOR | | Quarterly | | | 1.097 | | | Semi-Annual | | 04/04/24 | | | | USD 410,000 | | | | — | | | | — | |
See Accompanying Notes to Financial Statements
39
VY® BLACKROCK INFLATION
PROTECTED BOND PORTFOLIO | PORTFOLIO OF INVESTMENTS
AS OF DECEMBER 31, 2021 (CONTINUED) |
Pay/Receive
Floating Rate | | | | Floating Rate Index | | Floating Rate
Index Payment
Frequency | | Fixed
Rate | | Fixed Rate
Payment
Frequency | | | Maturity
Date | | | Notional Amount | | | Fair
Value | | | Unrealized
Appreciation/
(Depreciation) |
|---|
| Receive | | | | 3-month USD-LIBOR | | Quarterly | | 1.087% | | Semi-Annual | | | 04/05/24 | | | | USD 850,000 | | | $ | 449 | | | $ | 449 | |
| Receive | | | | 3-month USD-LIBOR | | Quarterly | | 0.640 | | Semi-Annual | | | 04/08/24 | | | | USD 2,910,000 | | | | 27,655 | | | | 27,655 | |
| Receive | | | | 3-month USD-LIBOR | | Quarterly | | 0.649 | | Semi-Annual | | | 04/11/24 | | | | USD 1,610,000 | | | | 15,161 | | | | 15,161 | |
| Receive | | | | 3-month USD-LIBOR | | Quarterly | | 0.677 | | Semi-Annual | | | 04/12/24 | | | | USD 1,620,000 | | | | 14,413 | | | | 14,413 | |
| Receive | | | | 3-month USD-LIBOR | | Quarterly | | 0.689 | | Semi-Annual | | | 04/12/24 | | | | USD 1,620,000 | | | | 14,031 | | | | 14,032 | |
| Receive | | | | 3-month USD-LIBOR | | Quarterly | | 0.728 | | Semi-Annual | | | 04/14/24 | | | | USD 1,010,000 | | | | 8,079 | | | | 8,079 | |
| Receive | | | | 3-month USD-LIBOR | | Quarterly | | 0.789 | | Semi-Annual | | | 04/14/24 | | | | USD 1,620,000 | | | | 10,999 | | | | 10,999 | |
| Receive | | | | 3-month USD-LIBOR | | Quarterly | | 0.797 | | Semi-Annual | | | 04/14/24 | | | | USD 1,620,000 | | | | 10,719 | | | | 10,719 | |
| Receive | | | | 3-month USD-LIBOR | | Quarterly | | 0.761 | | Semi-Annual | | | 04/19/24 | | | | USD 890,000 | | | | 6,659 | | | | 6,659 | |
| Receive | | | | 3-month USD-LIBOR | | Quarterly | | 0.762 | | Semi-Annual | | | 04/19/24 | | | | USD 890,000 | | | | 6,638 | | | | 6,639 | |
| Receive | | | | 3-month USD-LIBOR | | Quarterly | | 0.808 | | Semi-Annual | | | 04/20/24 | | | | USD 820,000 | | | | 5,431 | | | | 5,431 | |
| Receive | | | | 3-month USD-LIBOR | | Quarterly | | 0.815 | | Semi-Annual | | | 04/20/24 | | | | USD 820,000 | | | | 5,324 | | | | 5,324 | |
| Receive | | | | 3-month USD-LIBOR | | Quarterly | | 0.919 | | Semi-Annual | | | 04/20/24 | | | | USD 15,000 | | | | 66 | | | | 66 | |
| Receive | | | | 3-month USD-LIBOR | | Quarterly | | 0.935 | | Semi-Annual | | | 04/20/24 | | | | USD 1,190,000 | | | | 4,884 | | | | 4,884 | |
| Receive | | | | 3-month USD-LIBOR | | Quarterly | | 0.913 | | Semi-Annual | | | 04/25/24 | | | | USD 1,640,000 | | | | 7,675 | | | | 7,675 | |
| Receive | | | | 3-month USD-LIBOR | | Quarterly | | 0.945 | | Semi-Annual | | | 04/25/24 | | | | USD 1,633,000 | | | | 6,607 | | | | 6,607 | |
| Receive | | | | 3-month USD-LIBOR | | Quarterly | | 0.975 | | Semi-Annual | | | 04/26/24 | | | | USD 820,000 | | | | 2,853 | | | | 2,853 | |
| Receive | | | | 3-month USD-LIBOR | | Quarterly | | 0.985 | | Semi-Annual | | | 04/26/24 | | | | USD 820,000 | | | | 2,694 | | | | 2,694 | |
| Receive | | | | 3-month USD-LIBOR | | Quarterly | | 0.993 | | Semi-Annual | | | 04/26/24 | | | | USD 820,000 | | | | 2,560 | | | | 2,560 | |
| Receive | | | | 3-month USD-LIBOR | | Quarterly | | 0.997 | | Semi-Annual | | | 04/29/24 | | | | USD 820,000 | | | | 2,569 | | | | 2,569 | |
| Receive | | | | 3-month USD-LIBOR | | Quarterly | | 1.007 | | Semi-Annual | | | 05/03/24 | | | | USD 2,485,000 | | | | 7,682 | | | | 7,682 | |
| Receive | | | | 3-month USD-LIBOR | | Quarterly | | 1.018 | | Semi-Annual | | | 05/03/24 | | | | USD 2,485,000 | | | | 7,166 | | | | 7,166 | |
| Receive | | | | 3-month USD-LIBOR | | Quarterly | | 1.053 | | Semi-Annual | | | 05/12/24 | | | | USD 1,650,000 | | | | 4,140 | | | | 4,140 | |
| Receive | | | | 3-month USD-LIBOR | | Quarterly | | 1.059 | | Semi-Annual | | | 05/12/24 | | | | USD 820,000 | | | | 1,963 | | | | 1,963 | |
| Receive | | | | 3-month USD-LIBOR | | Quarterly | | 1.075 | | Semi-Annual | | | 05/12/24 | | | | USD 820,000 | | | | 1,712 | | | | 1,712 | |
| Receive | | | | 3-month USD-LIBOR | | Quarterly | | 1.224 | | Semi-Annual | | | 06/07/24 | | | | USD 820,000 | | | | (37 | ) | | | (37 | ) |
| Receive | | | | 3-month USD-LIBOR | | Quarterly | | 1.252 | | Semi-Annual | | | 06/07/24 | | | | USD 820,000 | | | | (491 | ) | | | (491 | ) |
| Receive | | | | 1-day Secured Overnight Financing Rate | | Annual | | 1.012 | | Annual | | | 06/09/24 | | | | USD 810,000 | | | | (531 | ) | | | (531 | ) |
| Receive | | | | 3-month USD-LIBOR | | Quarterly | | 1.271 | | Semi-Annual | | | 06/17/24 | | | | USD 810,000 | | | | (527 | ) | | | (527 | ) |
| Receive | | | | 3-month USD-LIBOR | | Quarterly | | 1.277 | | Semi-Annual | | | 06/17/24 | | | | USD 810,000 | | | | (615 | ) | | | (615 | ) |
| Receive | | | | 3-month USD-LIBOR | | Quarterly | | 0.729 | | Semi-Annual | | | 06/21/24 | | | | USD 1,500,000 | | | | 15,266 | | | | 15,266 | |
| Receive | | | | 3-month USD-LIBOR | | Quarterly | | 0.744 | | Semi-Annual | | | 08/12/24 | | | | USD 1,800,000 | | | | 20,497 | | | | 20,497 | |
| Receive | | | | 3-month USD-LIBOR | | Quarterly | | 0.782 | | Semi-Annual | | | 08/15/24 | | | | USD 990,000 | | | | 10,588 | | | | 10,588 | |
| Receive | | | | 3-month USD-LIBOR | | Quarterly | | 0.623 | | Semi-Annual | | | 04/14/25 | | | | USD 1,180,000 | | | | 22,124 | | | | 22,124 | |
| Receive | | | | 3-month USD-LIBOR | | Quarterly | | 0.820 | | Semi-Annual | | | 09/08/25 | | | | USD 540,000 | | | | 8,428 | | | | 8,428 | |
| Receive | | | | 3-month USD-LIBOR | | Quarterly | | 1.548 | | Semi-Annual | | | 02/25/26 | | | | USD 830,000 | | | | 890 | | | | 890 | |
| Receive | | | | 3-month USD-LIBOR | | Quarterly | | 1.710 | | Semi-Annual | | | 03/06/26 | | | | USD 620,000 | | | | (297 | ) | | | (297 | ) |
| Receive | | | | 3-month USD-LIBOR | | Quarterly | | 1.455 | | Semi-Annual | | | 05/31/26 | | | | USD 2,170,000 | | | | (6,010 | ) | | | (5,879 | ) |
| Receive | | | | 3-month USD-LIBOR | | Quarterly | | 1.330 | | Semi-Annual | | | 11/23/26 | | | | USD 200,000 | | | | 229 | | | | 229 | |
| Receive | | | | 1-day Secured Overnight Financing Rate | | Annual | | 1.018 | | Annual | | | 12/02/26 | | | | USD 630,000 | | | | 2,246 | | | | 2,246 | |
| Receive | | | | 1-day Secured Overnight Financing Rate | | Annual | | 1.080 | | Annual | | | 12/03/26 | | | | USD 315,000 | | | | 172 | | | | 172 | |
| Receive | | | | 1-day Secured Overnight Financing Rate | | Annual | | 1.082 | | Annual | | | 12/03/26 | | | | USD 315,000 | | | | 141 | | | | 141 | |
| Receive | | | | 1-day Secured Overnight Financing Rate | | Annual | | 1.038 | | Annual | | | 12/06/26 | | | | USD 390,000 | | | | 1,070 | | | | 1,070 | |
| Receive | | | | 1-day Secured Overnight Financing Rate | | Annual | | 1.030 | | Annual | | | 12/20/26 | | | | USD 310,000 | | | | 1,139 | | | | 1,139 | |
| Receive | | | | 1-day Secured Overnight Financing Rate | | Annual | | 1.092 | | Annual | | | 12/23/26 | | | | USD 310,000 | | | | 222 | | | | 222 | |
| Receive | | | | 3-month USD-LIBOR | | Quarterly | | 1.350 | | Semi-Annual | | | 01/10/27 | | | | USD 380,000 | | | | 376 | | | | 376 | |
| Receive | | | | 3-month USD-LIBOR | | Quarterly | | 1.425 | | Semi-Annual | | | 01/10/27 | | | | USD 400,000 | | | | (1,066 | ) | | | (1,066 | ) |
| Receive | | | | 3-month USD-LIBOR | | Quarterly | | 1.400 | | Semi-Annual | | | 01/12/27 | | | | USD 610,000 | | | | (844 | ) | | | (844 | ) |
| Receive | | | | 1-day Secured Overnight Financing Rate | | Annual | | 1.168 | | Annual | | | 03/09/27 | | | | USD 660,000 | | | | (93 | ) | | | (93 | ) |
| Receive | | | | 3-month USD-LIBOR | | Quarterly | | 1.445 | | Semi-Annual | | | 04/12/27 | | | | USD 650,000 | | | | 18 | | | | 18 | |
| Receive | | | | 3-month USD-LIBOR | | Quarterly | | 1.285 | | Semi-Annual | | | 04/20/27 | | | | USD 610,000 | | | | 4,935 | | | | 4,935 | |
| Receive | | | | 1-day Secured Overnight Financing Rate | | Annual | | 1.239 | | Annual | | | 06/29/27 | | | | USD 165,000 | | | | (6 | ) | | | (6 | ) |
| Receive | | | | 1-day Secured Overnight Financing Rate | | Annual | | 1.247 | | Annual | | | 06/29/27 | | | | USD 165,000 | | | | (70 | ) | | | (70 | ) |
| Receive | | | | 3-month USD-LIBOR | | Quarterly | | 0.512 | | Semi-Annual | | | 08/17/27 | | | | USD 230,000 | | | | 11,118 | | | | 11,118 | |
See Accompanying Notes to Financial Statements
40
VY® BLACKROCK INFLATION
PROTECTED BOND PORTFOLIO | PORTFOLIO OF INVESTMENTS
AS OF DECEMBER 31, 2021 (CONTINUED) |
Pay/Receive
Floating Rate | | | | Floating Rate Index | | Floating Rate
Index Payment
Frequency | | Fixed
Rate | | Fixed Rate
Payment
Frequency | | | Maturity
Date | | | Notional Amount | | | Fair
Value | | | Unrealized
Appreciation/
(Depreciation) |
|---|
| Receive | | | | 3-month USD-LIBOR | | Quarterly | | 0.845% | | Semi-Annual | | | 11/15/27 | | | | USD 470,000 | | | $ | 15,118 | | | $ | 15,112 | |
| Receive | | | | 1-day Secured Overnight Financing Rate | | Annual | | 1.245 | | Annual | | | 11/15/27 | | | | USD 420,000 | | | | 1,279 | | | | 1,279 | |
| Receive | | | | 3-month USD-LIBOR | | Quarterly | | 1.271 | | Semi-Annual | | | 02/15/28 | | | | USD 1,350,000 | | | | 12,196 | | | | 12,196 | |
| Receive | | | | 1-day Secured Overnight Financing Rate | | Annual | | 1.355 | | Annual | | | 11/15/28 | | | | USD 2,940,000 | | | | (20,317 | ) | | | (17,530 | ) |
| Receive | | | | 3-month USD-LIBOR | | Quarterly | | 0.648 | | Semi-Annual | | | 06/02/30 | | | | USD 440,000 | | | | 31,000 | | | | 31,000 | |
| Receive | | | | 3-month USD-LIBOR | | Quarterly | | 2.788 | | Semi-Annual | | | 03/10/31 | | | | USD 522,000 | | | | (56,309 | ) | | | (56,309 | ) |
| Receive | | | | 3-month USD-LIBOR | | Quarterly | | 2.504 | | Semi-Annual | | | 03/20/31 | | | | USD 3,000 | | | | (101 | ) | | | (101 | ) |
| Receive | | | | 1-day Secured Overnight Financing Rate | | Annual | | 1.520 | | Annual | | | 08/15/31 | | | | USD 570,000 | | | | (9,422 | ) | | | (9,422 | ) |
| Receive | | | | 3-month USD-LIBOR | | Quarterly | | 1.429 | | Semi-Annual | | | 09/21/31 | | | | USD 490,000 | | | | 6,173 | | | | 6,173 | |
| Receive | | | | 3-month USD-LIBOR | | Quarterly | | 1.391 | | Semi-Annual | | | 09/22/31 | | | | USD 270,000 | | | | 4,341 | | | | 4,341 | |
| Receive | | | | 3-month USD-LIBOR | | Quarterly | | 1.521 | | Semi-Annual | | | 09/24/31 | | | | USD 990,000 | | | | 4,165 | | | | 4,165 | |
| Receive | | | | 3-month USD-LIBOR | | Quarterly | | 1.775 | | Semi-Annual | | | 10/18/31 | | | | USD 540,000 | | | | (10,306 | ) | | | (10,306 | ) |
| Receive | | | | 1-day Secured Overnight Financing Rate | | Annual | | 1.424 | | Annual | | | 11/18/31 | | | | USD 230,000 | | | | (2,848 | ) | | | (2,848 | ) |
| Receive | | | | 1-day Secured Overnight Financing Rate | | Annual | | 1.452 | | Annual | | | 11/19/31 | | | | USD 90,000 | | | | (1,351 | ) | | | (1,351 | ) |
| Receive | | | | 1-day Secured Overnight Financing Rate | | Annual | | 1.401 | | Annual | | | 11/22/31 | | | | USD 210,000 | | | | (2,110 | ) | | | (2,110 | ) |
| Receive | | | | 1-day Secured Overnight Financing Rate | | Annual | | 1.431 | | Annual | | | 11/22/31 | | | | USD 210,000 | | | | (2,717 | ) | | | (2,717 | ) |
| Receive | | | | 1-day Secured Overnight Financing Rate | | Annual | | 1.421 | | Annual | | | 11/24/31 | | | | USD 170,000 | | | | (2,019 | ) | | | (2,019 | ) |
| Receive | | | | 1-day Secured Overnight Financing Rate | | Annual | | 1.442 | | Annual | | | 11/24/31 | | | | USD 170,000 | | | | (2,359 | ) | | | (2,359 | ) |
| Receive | | | | 1-day Secured Overnight Financing Rate | | Annual | | 1.477 | | Annual | | | 11/26/31 | | | | USD 230,000 | | | | (3,939 | ) | | | (3,939 | ) |
| Receive | | | | 1-day Secured Overnight Financing Rate | | Annual | | 1.333 | | Annual | | | 12/10/31 | | | | USD 170,000 | | | | (469 | ) | | | (468 | ) |
| Receive | | | | 1-day Secured Overnight Financing Rate | | Annual | | 1.314 | | Annual | | | 12/28/31 | | | | USD 170,000 | | | | (27 | ) | | | (27 | ) |
| Receive | | | | 1-day Secured Overnight Financing Rate | | Annual | | 1.357 | | Annual | | | 12/31/31 | | | | USD 83,000 | | | | (347 | ) | | | (347 | ) |
| Receive | | | | 1-day Secured Overnight Financing Rate | | Annual | | 1.367 | | Annual | | | 12/31/31 | | | | USD 82,000 | | | | (416 | ) | | | (416 | ) |
| Receive | | | | 1-day Secured Overnight Financing Rate | | Annual | | 1.354 | | Annual | | | 01/03/32 | | | | USD 82,000 | | | | (303 | ) | | | (303 | ) |
| Receive | | | | 1-day Secured Overnight Financing Rate | | Annual | | 1.311 | | Annual | | | 01/04/32 | | | | USD 83,000 | | | | — | | | | — | |
| Receive | | | | 1-day Secured Overnight Financing Rate | | Annual | | 1.310 | | Annual | | | 01/26/32 | | | | USD 196,000 | | | | 278 | | | | 278 | |
| Receive | | | | 3-month USD-LIBOR | | Quarterly | | 1.594 | | Semi-Annual | | | 02/22/32 | | | | USD 550,000 | | | | 351 | | | | 351 | |
| Receive | | | | 3-month USD-LIBOR | | Quarterly | | 1.621 | | Semi-Annual | | | 02/22/32 | | | | USD 275,000 | | | | (522 | ) | | | (522 | ) |
| Receive | | | | 3-month USD-LIBOR | | Quarterly | | 0.760 | | Semi-Annual | | | 05/03/32 | | | | USD 800,000 | | | | 65,498 | | | | 65,498 | |
| Receive | | | | 3-month USD-LIBOR | | Quarterly | | 0.765 | | Semi-Annual | | | 05/04/32 | | | | USD 820,000 | | | | 66,789 | | | | 66,789 | |
| Receive | | | | 3-month USD-LIBOR | | Quarterly | | 0.770 | | Semi-Annual | | | 05/06/32 | | | | USD 190,000 | | | | 15,401 | | | | 15,401 | |
| Receive | | | | 3-month USD-LIBOR | | Quarterly | | 1.645 | | Semi-Annual | | | 08/22/34 | | | | USD 300,000 | | | | 4,394 | | | | 4,394 | |
| Receive | | | | 3-month USD-LIBOR | | Quarterly | | 1.907 | | Semi-Annual | | | 10/21/34 | | | | USD 320,000 | | | | (2,734 | ) | | | (2,734 | ) |
| Receive | | | | 3-month USD-LIBOR | | Quarterly | | 1.921 | | Semi-Annual | | | 10/22/34 | | | | USD 300,000 | | | | (2,940 | ) | | | (2,940 | ) |
| Receive | | | | 3-month USD-LIBOR | | Quarterly | | 1.982 | | Semi-Annual | | | 10/23/34 | | | | USD 15,000 | | | | (229 | ) | | | (229 | ) |
| Receive | | | | 3-month USD-LIBOR | | Quarterly | | 0.973 | | Semi-Annual | | | 08/17/40 | | | | USD 150,000 | | | | 18,954 | | | | 18,954 | |
| Receive | | | | 3-month USD-LIBOR | | Quarterly | | 2.110 | | Semi-Annual | | | 11/15/44 | | | | USD 90,000 | | | | (1,350 | ) | | | (1,350 | ) |
| Receive | | | | 1-day Secured Overnight Financing Rate | | Annual | | 1.473 | | Annual | | | 05/15/47 | | | | USD 170,000 | | | | 749 | | | | 749 | |
| Receive | | | | 1-day Secured Overnight Financing Rate | | Annual | | 1.640 | | Annual | | | 05/15/47 | | | | USD 980,000 | | | | (30,458 | ) | | | (23,853 | ) |
| Receive | | | | 3-month USD-LIBOR | | Quarterly | | 2.378 | | Semi-Annual | | | 07/05/49 | | | | USD 140,000 | | | | (6,185 | ) | | | (6,185 | ) |
| Receive | | | | 3-month USD-LIBOR | | Quarterly | | 1.709 | | Semi-Annual | | | 08/16/49 | | | | USD 130,000 | | | | 393 | | | | 393 | |
| Receive | | | | 3-month USD-LIBOR | | Quarterly | | 1.667 | | Semi-Annual | | | 08/17/49 | | | | USD 100,000 | | | | 603 | | | | 603 | |
| Receive | | | | 3-month USD-LIBOR | | Quarterly | | 1.090 | | Semi-Annual | | | 06/20/52 | | | | USD 160,000 | | | | 25,428 | | | | 25,428 | |
| Receive | | | | 3-month USD-LIBOR | | Quarterly | | 1.136 | | Semi-Annual | | | 06/20/52 | | | | USD 160,000 | | | | 23,654 | | | | 23,654 | |
See Accompanying Notes to Financial Statements
41
VY® BLACKROCK INFLATION
PROTECTED BOND PORTFOLIO | PORTFOLIO OF INVESTMENTS
AS OF DECEMBER 31, 2021 (CONTINUED) |
Pay/Receive
Floating Rate | | | | Floating Rate Index | | Floating Rate
Index Payment
Frequency | | Fixed
Rate | | Fixed Rate
Payment
Frequency | | | Maturity
Date | | | Notional Amount | | | Fair
Value | | | Unrealized
Appreciation/
(Depreciation) |
|---|
| Receive | | | | 3-month USD-LIBOR | | Quarterly | | 0.881% | | Semi-Annual | | | 07/12/53 | | | | USD 160,000 | | | $ | 33,876 | | | $ | 33,872 | |
| | | | | | | | | | | | | | | | | | | | | $ | 318,637 | | | $ | 325,355 | |
At December 31, 2021, the following centrally cleared inflation-linked swaps were outstanding for VY® BlackRock Inflation Protected Bond Portfolio:
Pay/Receive
Floating Rate | | | | Floating Rate
Index | | Floating Rate
Index Payment Frequency | | Fixed
Rate | | Fixed Rate
Payment
Frequency | | | Maturity
Date | | | | Notional Amount | | | | Fair
Value | | | | Unrealized
Appreciation/
(Depreciation) | |
|---|
| Pay | | | | Eurostat Eurozone HICP ex Tobacco NSA (CPTFEMU) | | At Termination Date | | 1.793% | | At Termination Date | | | 07/15/51 | | | | EUR 130,000 | | | $ | (33,017 | ) | | $ | (33,017 | ) |
| Pay | | | | Eurostat Eurozone HICP ex Tobacco NSA (CPTFEMU) | | At Termination Date | | 1.886 | | At Termination Date | | | 08/15/51 | | | | EUR 260,000 | | | | (53,060 | ) | | | (53,060 | ) |
| Pay | | | | Eurostat Eurozone HICP ex Tobacco NSA (CPTFEMU) | | At Termination Date | | 2.132 | | At Termination Date | | | 10/15/51 | | | | EUR 180,000 | | | | (11,715 | ) | | | (11,715 | ) |
| Pay | | | | Eurostat Eurozone HICP ex Tobacco NSA (CPTFEMU) | | At Termination Date | | 2.205 | | At Termination Date | | | 10/15/51 | | | | EUR 835,000 | | | | (19,628 | ) | | | (19,628 | ) |
| Pay | | | | Eurostat Eurozone HICP ex Tobacco NSA (CPTFEMU) | | At Termination Date | | 2.221 | | At Termination Date | | | 10/15/51 | | | | EUR 180,000 | | | | (2,545 | ) | | | (2,545 | ) |
| Pay | | | | Eurostat Eurozone HICP ex Tobacco NSA (CPTFEMU) | | At Termination Date | | 2.277 | | At Termination Date | | | 10/15/51 | | | | EUR 180,000 | | | | 3,287 | | | | 3,287 | |
| Pay | | | | Eurostat Eurozone HICP ex Tobacco NSA (CPTFEMU) | | At Termination Date | | 2.320 | | At Termination Date | | | 10/15/51 | | | | EUR 175,000 | | | | 7,602 | | | | 7,602 | |
| Pay | | | | Eurostat Eurozone HICP ex Tobacco NSA (CPTFEMU) | | At Termination Date | | 2.206 | | At Termination Date | | | 11/15/51 | | | | EUR 75,000 | | | | (1,733 | ) | | | (1,910 | ) |
| Pay | | | | Eurostat Eurozone HICP ex Tobacco NSA (CPTFEMU) | | At Termination Date | | 2.096 | | At Termination Date | | | 12/15/51 | | | | EUR 40,000 | | | | (3,266 | ) | | | (3,266 | ) |
| Pay | | | | Eurostat Eurozone HICP ex Tobacco NSA (CPTFEMU) | | At Termination Date | | 2.125 | | At Termination Date | | | 12/15/51 | | | | EUR 135,000 | | | | (8,864 | ) | | | (8,864 | ) |
| Pay | | | | Eurostat Eurozone HICP ex Tobacco NSA (CPTFEMU) | | At Termination Date | | 2.170 | | At Termination Date | | | 12/15/51 | | | | EUR 135,000 | | | | (5,430 | ) | | | (5,430 | ) |
| Pay | | | | U.K. RPI All Items Monthly | | At Termination Date | | 3.574 | | At Termination Date | | | 10/15/30 | | | | GBP 1,415,000 | | | | (210,038 | ) | | | (211,479 | ) |
| Pay | | | | U.K. RPI All Items Monthly | | At Termination Date | | 3.746 | | At Termination Date | | | 04/15/31 | | | | GBP 400,000 | | | | (51,549 | ) | | | (51,549 | ) |
| Pay | | | | U.K. RPI All Items Monthly | | At Termination Date | | 4.415 | | At Termination Date | | | 11/15/31 | | | | GBP 440,000 | | | | 12,014 | | | | 12,014 | |
| Pay | | | | U.K. RPI All Items Monthly | | At Termination Date | | 4.265 | | At Termination Date | | | 12/15/31 | | | | GBP 600,000 | | | | 10,053 | | | | 11,714 | |
| Pay | | | | U.K. RPI All Items Monthly | | At Termination Date | | 3.360 | | At Termination Date | | | 10/15/39 | | | | GBP 2,025,000 | | | | (388,352 | ) | | | (388,352 | ) |
| Pay | | | | U.K. RPI All Items Monthly | | At Termination Date | | 3.310 | | At Termination Date | | | 01/15/40 | | | | GBP 900,000 | | | | (209,863 | ) | | | (209,863 | ) |
| Pay | | | | U.K. RPI All Items Monthly | | At Termination Date | | 3.341 | | At Termination Date | | | 01/15/40 | | | | GBP 800,000 | | | | (175,965 | ) | | | (175,965 | ) |
| Pay | | | | U.K. RPI All Items Monthly | | At Termination Date | | 3.336 | | At Termination Date | | | 11/15/40 | | | | GBP 310,000 | | | | (82,123 | ) | | | (82,144 | ) |
| Pay | | | | U.K. RPI All Items Monthly | | At Termination Date | | 3.560 | | At Termination Date | | | 03/15/41 | | | | GBP 330,000 | | | | (57,510 | ) | | | (57,510 | ) |
| Pay | | | | U.K. RPI All Items Monthly | | At Termination Date | | 3.270 | | At Termination Date | | | 10/15/44 | | | | GBP 1,560,000 | | | | (381,827 | ) | | | (381,826 | ) |
| Pay | | | | U.K. RPI All Items Monthly | | At Termination Date | | 3.220 | | At Termination Date | | | 01/15/45 | | | | GBP 700,000 | | | | (205,909 | ) | | | (205,909 | ) |
| Pay | | | | U.K. RPI All Items Monthly | | At Termination Date | | 3.239 | | At Termination Date | | | 01/15/45 | | | | GBP 600,000 | | | | (169,794 | ) | | | (169,794 | ) |
See Accompanying Notes to Financial Statements
42
VY® BLACKROCK INFLATION
PROTECTED BOND PORTFOLIO | PORTFOLIO OF INVESTMENTS
AS OF DECEMBER 31, 2021 (CONTINUED) |
Pay/Receive
Floating Rate | | | | Floating Rate
Index | | Floating Rate
Index Payment Frequency | | Fixed
Rate | | Fixed Rate
Payment
Frequency | | | Maturity
Date | | | | Notional Amount | | | | Fair
Value | | | | Unrealized
Appreciation/
(Depreciation) | |
|---|
| Pay | | | | U.S. CPI Urban Consumers NSA (CPURNSA) | | At Termination Date | | 2.755% | | At Termination Date | | | 10/22/31 | | | | USD 290,000 | | | $ | (3,221 | ) | | $ | (3,221 | ) |
| Pay | | | | U.S. CPI Urban Consumers NSA (CPURNSA) | | At Termination Date | | 2.827 | | At Termination Date | | | 10/25/31 | | | | USD 290,000 | | | | (860 | ) | | | (860 | ) |
| Pay | | | | U.S. CPI Urban Consumers NSA (CPURNSA) | | At Termination Date | | 2.855 | | At Termination Date | | | 10/26/31 | | | | USD 290,000 | | | | 54 | | | | 54 | |
| Pay | | | | U.S. CPI Urban Consumers NSA (CPURNSA) | | At Termination Date | | 2.890 | | At Termination Date | | | 10/28/31 | | | | USD 290,000 | | | | 1,201 | | | | 1,201 | |
| Pay | | | | U.S. CPI Urban Consumers NSA (CPURNSA) | | At Termination Date | | 2.825 | | At Termination Date | | | 11/03/31 | | | | USD 560,000 | | | | (1,792 | ) | | | (1,792 | ) |
| Pay | | | | U.S. CPI Urban Consumers NSA (CPURNSA) | | At Termination Date | | 2.628 | | At Termination Date | | | 11/15/51 | | | | USD 195,000 | | | | 5,218 | | | | 5,218 | |
| Pay | | | | U.S. CPI Urban Consumers NSA (CPURNSA) | | At Termination Date | | 2.676 | | At Termination Date | | | 11/17/51 | | | | USD 195,000 | | | | 9,090 | | | | 9,090 | |
| Pay | | | | U.S. CPI Urban Consumers NSA (CPURNSA) | | At Termination Date | | 2.626 | | At Termination Date | | | 11/22/51 | | | | USD 60,000 | | | | 1,568 | | | | 1,568 | |
| Pay | | | | U.S. CPI Urban Consumers NSA (CPURNSA) | | At Termination Date | | 2.613 | | At Termination Date | | | 11/24/51 | | | | USD 200,000 | | | | 4,174 | | | | 4,174 | |
| Receive | | | | Eurostat Eurozone HICP ex Tobacco NSA (CPTFEMU) | | At Termination Date | | 1.956 | | At Termination Date | | | 10/15/31 | | | | EUR 180,000 | | | | 3,372 | | | | 3,372 | |
| Receive | | | | Eurostat Eurozone HICP ex Tobacco NSA (CPTFEMU) | | At Termination Date | | 2.044 | | At Termination Date | | | 10/15/31 | | | | EUR 180,000 | | | | 1,234 | | | | 1,234 | |
| Receive | | | | Eurostat Eurozone HICP ex Tobacco NSA (CPTFEMU) | | At Termination Date | | 2.091 | | At Termination Date | | | 10/15/31 | | | | EUR 180,000 | | | | 85 | | | | 85 | |
| Receive | | | | Eurostat Eurozone HICP ex Tobacco NSA (CPTFEMU) | | At Termination Date | | 2.134 | | At Termination Date | | | 10/15/31 | | | | EUR 175,000 | | | | (944 | ) | | | (944 | ) |
| Receive | | | | Eurostat Eurozone HICP ex Tobacco NSA (CPTFEMU) | | At Termination Date | | 2.004 | | At Termination Date | | | 11/15/31 | | | | EUR 330,000 | | | | 3,912 | | | | 3,961 | |
| Receive | | | | Eurostat Eurozone HICP ex Tobacco NSA (CPTFEMU) | | At Termination Date | | 2.127 | | At Termination Date | | | 11/15/51 | | | | EUR 135,000 | | | | 9,182 | | | | 9,182 | |
| Receive | | | | Eurostat Eurozone HICP ex Tobacco NSA (CPTFEMU) | | At Termination Date | | 2.170 | | At Termination Date | | | 11/15/51 | | | | EUR 50,000 | | | | 2,185 | | | | 2,185 | |
| Receive | | | | Eurostat Eurozone HICP ex Tobacco NSA (CPTFEMU) | | At Termination Date | | 2.184 | | At Termination Date | | | 11/15/51 | | | | EUR 130,000 | | | | 4,658 | | | | 4,658 | |
| Receive | | | | Eurostat Eurozone HICP ex Tobacco NSA (CPTFEMU) | | At Termination Date | | 2.194 | | At Termination Date | | | 11/15/51 | | | | EUR 135,000 | | | | 4,049 | | | | 4,049 | |
| Receive | | | | U.K. RPI All Items Monthly | | At Termination Date | | 3.623 | | At Termination Date | | | 04/15/31 | | | | GBP 560,000 | | | | 84,041 | | | | 84,041 | |
| Receive | | | | U.K. RPI All Items Monthly | | At Termination Date | | 4.228 | | At Termination Date | | | 12/15/31 | | | | GBP 440,000 | | | | (4,416 | ) | | | (4,416 | ) |
| Receive | | | | U.K. RPI All Items Monthly | | At Termination Date | | 3.420 | | At Termination Date | | | 10/15/34 | | | | GBP 2,025,000 | | | | 298,294 | | | | 298,294 | |
| Receive | | | | U.K. RPI All Items Monthly | | At Termination Date | | 3.360 | | At Termination Date | | | 01/15/35 | | | | GBP 900,000 | | | | 164,117 | | | | 164,117 | |
| Receive | | | | U.K. RPI All Items Monthly | | At Termination Date | | 3.390 | | At Termination Date | | | 01/15/35 | | | | GBP 800,000 | | | | 139,007 | | | | 139,007 | |
| Receive | | | | U.K. RPI All Items Monthly | | At Termination Date | | 3.725 | | At Termination Date | | | 12/15/41 | | | | GBP 300,000 | | | | 9,725 | | | | 9,033 | |
See Accompanying Notes to Financial Statements
43
VY® BLACKROCK INFLATION
PROTECTED BOND PORTFOLIO | PORTFOLIO OF INVESTMENTS
AS OF DECEMBER 31, 2021 (CONTINUED) |
Pay/Receive
Floating Rate | | | | Floating Rate
Index | | Floating Rate
Index Payment Frequency | | Fixed
Rate | | Fixed Rate
Payment
Frequency | | | Maturity
Date | | | | Notional Amount | | | | Fair
Value | | | | Unrealized
Appreciation/
(Depreciation) | |
|---|
| Receive | | | | U.K. RPI All Items Monthly | | At Termination Date | | 3.774% | | At Termination Date | | | 12/15/41 | | | | GBP 165,000 | | | $ | 1,673 | | | $ | 2,412 | |
| Receive | | | | U.K. RPI All Items Monthly | | At Termination Date | | 3.855 | | At Termination Date | | | 12/15/41 | | | | GBP 165,000 | | | | (4,536 | ) | | | (4,536 | ) |
| Receive | | | | U.K. RPI All Items Monthly | | At Termination Date | | 3.160 | | At Termination Date | | | 10/15/49 | | | | GBP 1,560,000 | | | | 475,696 | | | | 475,696 | |
| Receive | | | | U.K. RPI All Items Monthly | | At Termination Date | | 3.111 | | At Termination Date | | | 01/15/50 | | | | GBP 700,000 | | | | 253,898 | | | | 253,898 | |
| Receive | | | | U.K. RPI All Items Monthly | | At Termination Date | | 3.133 | | At Termination Date | | | 01/15/50 | | | | GBP 600,000 | | | | 207,697 | | | | 207,697 | |
| Receive | | | | U.S. CPI Urban Consumers NSA (CPURNSA) | | At Termination Date | | 2.260 | | At Termination Date | | | 05/03/23 | | | | USD 9,000,000 | | | | 387,301 | | | | 387,301 | |
| Receive | | | | U.S. CPI Urban Consumers NSA (CPURNSA) | | At Termination Date | | 1.957 | | At Termination Date | | | 02/06/24 | | | | USD 12,000,000 | | | | 825,096 | | | | 825,096 | |
| Receive | | | | U.S. CPI Urban Consumers NSA (CPURNSA) | | At Termination Date | | 2.339 | | At Termination Date | | | 02/17/24 | | | | USD 5,300,000 | | | | 320,711 | | | | 320,711 | |
| Receive | | | | U.S. CPI Urban Consumers NSA (CPURNSA) | | At Termination Date | | 1.991 | | At Termination Date | | | 03/04/24 | | | | USD 3,000,000 | | | | 211,102 | | | | 211,102 | |
| Receive | | | | U.S. CPI Urban Consumers NSA (CPURNSA) | | At Termination Date | | 2.248 | | At Termination Date | | | 03/21/24 | | | | USD 4,900,000 | | | | 259,516 | | | | 259,516 | |
| Receive | | | | U.S. CPI Urban Consumers NSA (CPURNSA) | | At Termination Date | | 2.023 | | At Termination Date | | | 05/02/24 | | | | USD 3,500,000 | | | | 248,121 | | | | 248,121 | |
| Receive | | | | U.S. CPI Urban Consumers NSA (CPURNSA) | | At Termination Date | | 1.829 | | At Termination Date | | | 07/31/24 | | | | USD 600,000 | | | | 47,628 | | | | 47,628 | |
| Receive | | | | U.S. CPI Urban Consumers NSA (CPURNSA) | | At Termination Date | | 1.706 | | At Termination Date | | | 08/12/24 | | | | USD 1,300,000 | | | | 112,812 | | | | 112,812 | |
| Receive | | | | U.S. CPI Urban Consumers NSA (CPURNSA) | | At Termination Date | | 2.351 | | At Termination Date | | | 09/28/24 | | | | USD 4,500,000 | | | | 219,097 | | | | 219,097 | |
| Receive | | | | U.S. CPI Urban Consumers NSA (CPURNSA) | | At Termination Date | | 0.945 | | At Termination Date | | | 03/12/25 | | | | USD 1,650,000 | | | | 213,419 | | | | 213,419 | |
| Receive | | | | U.S. CPI Urban Consumers NSA (CPURNSA) | | At Termination Date | | 1.908 | | At Termination Date | | | 05/24/25 | | | | USD 4,500,000 | | | | 395,667 | | | | 395,667 | |
| Receive | | | | U.S. CPI Urban Consumers NSA (CPURNSA) | | At Termination Date | | 2.658 | | At Termination Date | | | 06/29/25 | | | | USD 3,900,000 | | | | 173,122 | | | | 173,122 | |
| Receive | | | | U.S. CPI Urban Consumers NSA (CPURNSA) | | At Termination Date | | 1.783 | | At Termination Date | | | 11/04/25 | | | | USD 1,300,000 | | | | 132,285 | | | | 132,238 | |
| Receive | | | | U.S. CPI Urban Consumers NSA (CPURNSA) | | At Termination Date | | 2.098 | | At Termination Date | | | 11/29/25 | | | | USD 1,600,000 | | | | 123,177 | | | | 123,177 | |
| Receive | | | | U.S. CPI Urban Consumers NSA (CPURNSA) | | At Termination Date | | 2.534 | | At Termination Date | | | 04/01/26 | | | | USD 16,750,000 | | | | 1,018,223 | | | | 1,018,223 | |
| Receive | | | | U.S. CPI Urban Consumers NSA (CPURNSA) | | At Termination Date | | 2.600 | | At Termination Date | | | 06/17/26 | | | | USD 5,495,000 | | | | 274,879 | | | | 274,879 | |
| Receive | | | | U.S. CPI Urban Consumers NSA (CPURNSA) | | At Termination Date | | 1.853 | | At Termination Date | | | 06/28/26 | | | | USD 450,000 | | | | 44,302 | | | | 44,302 | |
| Receive | | | | U.S. CPI Urban Consumers NSA (CPURNSA) | | At Termination Date | | 2.687 | | At Termination Date | | | 08/31/26 | | | | USD 5,050,000 | | | | 145,920 | | | | 145,920 | |
| Receive | | | | U.S. CPI Urban Consumers NSA (CPURNSA) | | At Termination Date | | 3.136 | | At Termination Date | | | 11/10/26 | | | | USD 1,700,000 | | | | 956 | | | | 956 | |
See Accompanying Notes to Financial Statements
44
VY® BLACKROCK INFLATION
PROTECTED BOND PORTFOLIO | PORTFOLIO OF INVESTMENTS
AS OF DECEMBER 31, 2021 (CONTINUED) |
Pay/Receive
Floating Rate | | | | Floating Rate
Index | | Floating Rate
Index Payment Frequency | | Fixed
Rate | | Fixed Rate
Payment
Frequency | | | Maturity
Date | | | | Notional Amount | | | | Fair
Value | | | | Unrealized
Appreciation/
(Depreciation) | |
|---|
| Receive | | | | U.S. CPI Urban Consumers NSA (CPURNSA) | | At Termination Date | | 3.045% | | At Termination Date | | | 12/02/26 | | | | USD 2,165,000 | | | $ | 10,244 | | | $ | 10,244 | |
| Receive | | | | U.S. CPI Urban Consumers NSA (CPURNSA) | | At Termination Date | | 2.894 | | At Termination Date | | | 12/14/26 | | | | USD 1,490,000 | | | | 13,857 | | | | 13,857 | |
| Receive | | | | U.S. CPI Urban Consumers NSA (CPURNSA) | | At Termination Date | | 1.285 | | At Termination Date | | | 05/05/30 | | | | USD 4,860,000 | | | | 907,195 | | | | 907,195 | |
| Receive | | | | U.S. CPI Urban Consumers NSA (CPURNSA) | | At Termination Date | | 1.983 | | At Termination Date | | | 10/13/30 | | | | USD 1,430,000 | | | | 181,599 | | | | 181,541 | |
| Receive | | | | U.S. CPI Urban Consumers NSA (CPURNSA) | | At Termination Date | | 2.468 | | At Termination Date | | | 04/19/31 | | | | USD 535,000 | | | | 37,969 | | | | 37,969 | |
| Receive | | | | U.S. CPI Urban Consumers NSA (CPURNSA) | | At Termination Date | | 2.530 | | At Termination Date | | | 09/02/31 | | | | USD 1,850,000 | | | | 74,297 | | | | 74,297 | |
| Receive | | | | U.S. CPI Urban Consumers NSA (CPURNSA) | | At Termination Date | | 2.813 | | At Termination Date | | | 11/02/31 | | | | USD 2,570,000 | | | | 11,886 | | | | 11,886 | |
| Receive | | | | U.S. CPI Urban Consumers NSA (CPURNSA) | | At Termination Date | | 2.570 | | At Termination Date | | | 10/22/51 | | | | USD 290,000 | | | | (788 | ) | | | (788 | ) |
| Receive | | | | U.S. CPI Urban Consumers NSA (CPURNSA) | | At Termination Date | | 2.606 | | At Termination Date | | | 10/25/51 | | | | USD 1,255,000 | | | | (21,758 | ) | | | (21,758 | ) |
| Receive | | | | U.S. CPI Urban Consumers NSA (CPURNSA) | | At Termination Date | | 2.624 | | At Termination Date | | | 10/25/51 | | | | USD 290,000 | | | | (7,161 | ) | | | (7,161 | ) |
| Receive | | | | U.S. CPI Urban Consumers NSA (CPURNSA) | | At Termination Date | | 2.620 | | At Termination Date | | | 10/26/51 | | | | USD 290,000 | | | | (6,689 | ) | | | (6,689 | ) |
| Receive | | | | U.S. CPI Urban Consumers NSA (CPURNSA) | | At Termination Date | | 2.625 | | At Termination Date | | | 10/28/51 | | | | USD 290,000 | | | | (7,300 | ) | | | (7,300 | ) |
| Receive | | | | U.S. CPI Urban Consumers NSA (CPURNSA) | | At Termination Date | | 2.540 | | At Termination Date | | | 11/03/51 | | | | USD 165,000 | | | | 1,519 | | | | 1,519 | |
| Receive | | | | U.S. CPI Urban Consumers NSA (CPURNSA) | | At Termination Date | | 2.445 | | At Termination Date | | | 12/20/51 | | | | USD 200,000 | | | | 7,795 | | | | 7,795 | |
| | | | | | | | | | | | | | | | | | | | | $ | 5,985,128 | | | $ | 5,985,142 | |
At December 31, 2021, the following OTC inflation-linked swaps were outstanding for VY® BlackRock Inflation Protected Bond Portfolio:
| Counterparty | | | | Pay/
Receive
Floating
Rate | | Floating
Rate Index | | Floating Rate
Index Payment
Frequency | | Fixed
Rate | | Fixed Rate
Payment
Frequency | | | Maturity
Date | | | | Notional Amount | | | | Fair
Value | | | Upfront
Payments
Paid/
(Received) | | Unrealized
Appreciation/
(Depreciation) | |
|---|
| Citibank N.A. | | | | Receive | | U.S. CPI Urban Consumers NSA (CPURNSA) | | At Termination Date | | 1.560% | | At Termination Date | | | 01/15/23 | | | | USD 10,250,000 | | | $ | 933,191 | | | $ | — | | | $ | 933,191 | |
| Citibank N.A. | | | | Receive | | U.S. CPI Urban Consumers NSA (CPURNSA) | | At Termination Date | | 4.167 | | At Termination Date | | | 07/15/23 | | | | USD 5,500,000 | | | | (22,308 | ) | | | — | | | | (22,308 | ) |
| Citibank N.A. | | | | Receive | | U.S. CPI Urban Consumers NSA (CPURNSA) | | At Termination Date | | 1.660 | | At Termination Date | | | 09/22/23 | | | | USD 5,500,000 | | | | 530,459 | | | | — | | | | 530,459 | |
| Citibank N.A. | | | | Receive | | U.S. CPI Urban Consumers NSA (CPURNSA) | | At Termination Date | | 3.562 | | At Termination Date | | | 01/15/25 | | | | USD 14,500,000 | | | | (120,993 | ) | | | — | | | | (120,993 | ) |
See Accompanying Notes to Financial Statements
45
VY® BLACKROCK INFLATION
PROTECTED BOND PORTFOLIO | PORTFOLIO OF INVESTMENTS
AS OF DECEMBER 31, 2021 (CONTINUED) |
| Counterparty | | | | Pay/
Receive
Floating
Rate | | Floating
Rate Index | | Floating Rate
Index Payment
Frequency | | Fixed
Rate | | Fixed Rate
Payment
Frequency | | | Maturity
Date | | | | Notional Amount | | | | Fair
Value | | | Upfront
Payments
Paid/
(Received) | | Unrealized
Appreciation/
(Depreciation) | |
|---|
| Citibank N.A. | | | | Receive | | U.S. CPI Urban Consumers NSA (CPURNSA) | | At Termination Date | | 3.410% | | At Termination Date | | | 01/15/26 | | | | USD 3,600,000 | | | $ | (37,525 | ) | | $ | — | | | $ | (37,525 | ) |
| | | | | | | | | | | | | | | | | | | | | | | $ | 1,282,824 | | | $ | — | | | $ | 1,282,824 | |
At December 31, 2021, the following purchased exchange-traded options were outstanding for VY® BlackRock Inflation Protected Bond Portfolio:
| Description | | | Put/Call | | Expiration
Date | | Exercise
Price | | Number of
Contracts | | Notional Amount | | Cost | | | Fair
Value | |
|---|
| U.S. Treasury 10-Year Note | | | Call | | 01/21/22 | | 131.00 USD | | 17 | | USD 2,217,969 | | $ | 9,588 | | | $ | 5,844 | |
| | | | | | | | | | | | | | $ | 9,588 | | | $ | 5,844 | |
At December 31, 2021, the following exchange-traded written options were outstanding for VY® BlackRock Inflation Protected Bond Portfolio:
| Description | | | Put/Call | | Expiration
Date | | Exercise
Price | | Number of
Contracts | | Notional Amount | | Premiums
Received | | Fair
Value | |
|---|
| U.S. Treasury 10-Year Note | | | Call | | 01/21/22 | | 132.00 USD | | 17 | | USD 2,217,969 | | | $ 3,959 | | | $ | (1,859 | ) |
| | | | | | | | | | | | | | | $ 3,959 | | | $ | (1,859 | ) |
At December 31, 2021, the following OTC purchased interest rate swaptions were outstanding for VY® BlackRock Inflation Protected Bond Portfolio:
| Description | | | | Counterparty | | Pay/
Receive
Exercise
Rate | | Exercise
Rate | | Floating Rate
Index | | Expiration
Date | | | Notional Amount | | | Cost | | Fair
Value | |
|---|
Call on 10-Year Interest Rate Swap(1) | | | | Barclays Bank PLC | | Receive | | 2.950% | | 3-month USD-LIBOR | | 03/12/24 | | | USD 870,000 | | | $ | 39,215 | | | $ | 101,041 | |
Call on 10-Year Interest Rate Swap(1) | | | | Barclays Bank PLC | | Receive | | 2.978% | | 3-month USD-LIBOR | | 03/07/24 | | | USD 874,500 | | | | 40,205 | | | | 103,486 | |
Call on 10-Year Interest Rate Swap(1) | | | | Barclays Bank PLC | | Receive | | 3.052% | | 3-month USD-LIBOR | | 01/10/29 | | | USD 220,000 | | | | 12,430 | | | | 26,782 | |
Call on 10-Year Interest Rate Swap(1) | | | | Barclays Bank PLC | | Receive | | 3.083% | | 3-month USD-LIBOR | | 01/29/29 | | | USD 220,000 | | | | 12,496 | | | | 27,232 | |
Call on 10-Year Interest Rate Swap(1) | | | | Barclays Bank PLC | | Receive | | 3.088% | | 3-month USD-LIBOR | | 12/06/38 | | | USD 570,000 | | | | 26,505 | | | | 71,469 | |
Call on 10-Year Interest Rate Swap(1) | | | | Citibank N.A. | | Receive | | 1.492% | | 3-month USD-LIBOR | | 02/25/25 | | | USD 550,000 | | | | 28,889 | | | | 17,441 | |
Call on 10-Year Interest Rate Swap(1) | | | | Citibank N.A. | | Receive | | 2.824% | | 3-month USD-LIBOR | | 01/31/39 | | | USD 120,000 | | | | 6,149 | | | | 13,357 | |
Call on 10-Year Interest Rate Swap(1) | | | | Citibank N.A. | | Receive | | 2.978% | | 3-month USD-LIBOR | | 01/31/29 | | | USD 100,000 | | | | 5,780 | | | | 11,691 | |
Call on 10-Year Interest Rate Swap(1) | | | | Citibank N.A. | | Receive | | 2.985% | | 3-month USD-LIBOR | | 04/27/38 | | | USD 10,000 | | | | 493 | | | | 1,192 | |
Call on 10-Year Interest Rate Swap(1) | | | | Deutsche Bank AG | | Receive | | 0.890% | | 3-month USD-LIBOR | | 04/30/25 | | | USD 360,000 | | | | 19,422 | | | | 5,638 | |
Call on 10-Year Interest Rate Swap(1) | | | | Deutsche Bank AG | | Receive | | 1.423% | | 3-month USD-LIBOR | | 06/05/25 | | | USD 255,000 | | | | 13,668 | | | | 7,765 | |
Call on 10-Year Interest Rate Swap(1) | | | | Deutsche Bank AG | | Receive | | 1.550% | | 3-month USD-LIBOR | | 07/29/24 | | | USD 750,000 | | | | 27,225 | | | | 23,363 | |
Call on 10-Year Interest Rate Swap(1) | | | | Deutsche Bank AG | | Receive | | 1.938% | | 3-month USD-LIBOR | | 11/15/23 | | | USD 990,000 | | | | 39,724 | | | | 44,629 | |
Call on 10-Year Interest Rate Swap(1) | | | | Deutsche Bank AG | | Receive | | 2.602% | | 3-month USD-LIBOR | | 04/07/26 | | | USD 620,000 | | | | 34,689 | | | | 57,787 | |
Call on 10-Year Interest Rate Swap(1) | | | | Goldman Sachs International | | Receive | | 1.283% | | 3-month USD-LIBOR | | 06/04/25 | | | USD 255,000 | | | | 13,795 | | | | 6,598 | |
Call on 10-Year Interest Rate Swap(1) | | | | Goldman Sachs International | | Receive | | 1.675% | | 3-month USD-LIBOR | | 07/22/24 | | | USD 490,000 | | | | 21,756 | | | | 17,730 | |
Call on 10-Year Interest Rate Swap(1) | | | | Goldman Sachs International | | Receive | | 1.970% | | 3-month USD-LIBOR | | 06/24/24 | | | USD 420,000 | | | | 19,194 | | | | 21,087 | |
Call on 10-Year Interest Rate Swap(1) | | | | Goldman Sachs International | | Receive | | 2.000% | | 3-month USD-LIBOR | | 06/28/24 | | | USD 420,000 | | | | 18,501 | | | | 21,794 | |
Call on 10-Year Interest Rate Swap(1) | | | | JPMorgan Chase Bank N.A. | | Receive | | 2.860% | | 3-month USD-LIBOR | | 02/22/39 | | | USD 232,500 | | | | 11,503 | | | | 26,332 | |
Call on 10-Year Interest Rate Swap(1) | | | | JPMorgan Chase Bank N.A. | | Receive | | 2.985% | | 3-month USD-LIBOR | | 04/27/38 | | | USD 200,000 | | | | 9,400 | | | | 23,839 | |
Call on 10-Year Interest Rate Swap(1) | | | | Morgan Stanley & Co. International PLC | | Receive | | 1.680% | | 3-month USD-LIBOR | | 08/02/24 | | | USD 490,000 | | | | 21,970 | | | | 17,910 | |
See Accompanying Notes to Financial Statements
46
VY® BLACKROCK INFLATION
PROTECTED BOND PORTFOLIO | PORTFOLIO OF INVESTMENTS
AS OF DECEMBER 31, 2021 (CONTINUED) |
| Description | | | | Counterparty | | Pay/
Receive
Exercise
Rate | | Exercise
Rate | | Floating Rate
Index | | Expiration
Date | | | Notional Amount | | | Cost | | Fair
Value | |
|---|
Call on 10-Year Interest Rate Swap(1) | | | | Morgan Stanley & Co. International PLC | | Receive | | 3.037% | | 3-month USD-LIBOR | | 01/11/29 | | | USD 220,000 | | | $ | 12,523 | | | $ | 26,562 | |
Call on 30-Year Interest Rate Swap(1) | | | | Deutsche Bank AG | | Receive | | 1.705% | | 3-month USD-LIBOR | | 05/31/22 | | | USD 290,000 | | | | 16,429 | | | | 12,164 | |
Call on 5-Year Interest Rate Swap(1) | | | | Deutsche Bank AG | | Receive | | 1.200% | | 3-month USD-LIBOR | | 04/28/22 | | | USD 3,320,000 | | | | 32,503 | | | | 11,461 | |
Call on 5-Year Interest Rate Swap(1) | | | | Deutsche Bank AG | | Receive | | 1.540% | | 3-month USD-LIBOR | | 08/03/22 | | | USD 1,500,000 | | | | 19,200 | | | | 17,843 | |
Call on 5-Year Interest Rate Swap(1) | | | | JPMorgan Chase Bank N.A. | | Receive | | 1.324% | | 3-month USD-LIBOR | | 07/01/22 | | | USD 2,880,000 | | | | 32,724 | | | | 18,593 | |
Call on 5-Year Interest Rate Swap(1) | | | | JPMorgan Chase Bank N.A. | | Receive | | 1.525% | | 3-month USD-LIBOR | | 04/05/22 | | | USD 1,210,000 | | | | 17,636 | | | | 12,216 | |
Call on 5-Year Interest Rate Swap(1) | | | | Morgan Stanley & Co. International PLC | | Receive | | 1.385% | | 3-month USD-LIBOR | | 04/08/22 | | | USD 2,360,000 | | | | 35,211 | | | | 15,095 | |
Put on 10-Year Interest Rate Swap(2) | | | | Barclays Bank PLC | | Pay | | 1.042% | | 1-day Overnight Tokyo Average Rate | | 06/29/22 | | | JPY 692,890,000 | | | | — | | | | 31 | |
Put on 10-Year Interest Rate Swap(3) | | | | Barclays Bank PLC | | Pay | | 2.250% | | 3-month USD-LIBOR | | 08/08/22 | | | USD 960,000 | | | | 22,728 | | | | 6,282 | |
Put on 10-Year Interest Rate Swap(3) | | | | Barclays Bank PLC | | Pay | | 2.950% | | 3-month USD-LIBOR | | 03/12/24 | | | USD 870,000 | | | | 39,215 | | | | 9,326 | |
Put on 10-Year Interest Rate Swap(3) | | | | Barclays Bank PLC | | Pay | | 2.978% | | 3-month USD-LIBOR | | 03/07/24 | | | USD 874,500 | | | | 40,205 | | | | 9,030 | |
Put on 10-Year Interest Rate Swap(3) | | | | Barclays Bank PLC | | Pay | | 3.052% | | 3-month USD-LIBOR | | 01/10/29 | | | USD 220,000 | | | | 12,430 | | | | 5,982 | |
Put on 10-Year Interest Rate Swap(3) | | | | Barclays Bank PLC | | Pay | | 3.083% | | 3-month USD-LIBOR | | 01/29/29 | | | USD 220,000 | | | | 12,496 | | | | 5,882 | |
Put on 10-Year Interest Rate Swap(3) | | | | Barclays Bank PLC | | Pay | | 3.088% | | 3-month USD-LIBOR | | 12/06/38 | | | USD 570,000 | | | | 26,505 | | | | 17,937 | |
Put on 10-Year Interest Rate Swap(3) | | | | Citibank N.A. | | Pay | | 1.492% | | 3-month USD-LIBOR | | 02/25/25 | | | USD 550,000 | | | | 28,889 | | | | 33,816 | |
Put on 10-Year Interest Rate Swap(3) | | | | Citibank N.A. | | Pay | | 2.824% | | 3-month USD-LIBOR | | 01/31/39 | | | USD 120,000 | | | | 6,025 | | | | 4,326 | |
Put on 10-Year Interest Rate Swap(3) | | | | Citibank N.A. | | Pay | | 2.978% | | 3-month USD-LIBOR | | 01/31/29 | | | USD 100,000 | | | | 5,778 | | | | 2,876 | |
Put on 10-Year Interest Rate Swap(3) | | | | Citibank N.A. | | Pay | | 2.985% | | 3-month USD-LIBOR | | 04/27/38 | | | USD 10,000 | | | | 461 | | | | 333 | |
Put on 10-Year Interest Rate Swap(3) | | | | Deutsche Bank AG | | Pay | | 0.890% | | 3-month USD-LIBOR | | 04/30/25 | | | USD 360,000 | | | | 19,422 | | | | 35,897 | |
Put on 10-Year Interest Rate Swap(3) | | | | Deutsche Bank AG | | Pay | | 1.423% | | 3-month USD-LIBOR | | 06/05/25 | | | USD 255,000 | | | | 13,668 | | | | 17,122 | |
Put on 10-Year Interest Rate Swap(3) | | | | Deutsche Bank AG | | Pay | | 1.800% | | 3-month USD-LIBOR | | 08/05/24 | | | USD 1,080,000 | | | | 42,552 | | | | 46,002 | |
Put on 10-Year Interest Rate Swap(3) | | | | Deutsche Bank AG | | Pay | | 1.938% | | 3-month USD-LIBOR | | 11/15/23 | | | USD 990,000 | | | | 39,724 | | | | 30,435 | |
Put on 10-Year Interest Rate Swap(3) | | | | Deutsche Bank AG | | Pay | | 2.602% | | 3-month USD-LIBOR | | 04/07/26 | | | USD 620,000 | | | | 34,689 | | | | 17,237 | |
Put on 10-Year Interest Rate Swap(3) | | | | Goldman Sachs International | | Pay | | 1.283% | | 3-month USD-LIBOR | | 06/04/25 | | | USD 255,000 | | | | 13,795 | | | | 19,132 | |
Put on 10-Year Interest Rate Swap(3) | | | | Goldman Sachs International | | Pay | | 1.675% | | 3-month USD-LIBOR | | 07/22/24 | | | USD 490,000 | | | | 21,756 | | | | 23,460 | |
Put on 10-Year Interest Rate Swap(3) | | | | Goldman Sachs International | | Pay | | 1.970% | | 3-month USD-LIBOR | | 06/24/24 | | | USD 420,000 | | | | 19,194 | | | | 14,682 | |
Put on 10-Year Interest Rate Swap(3) | | | | Goldman Sachs International | | Pay | | 2.000% | | 3-month USD-LIBOR | | 06/28/24 | | | USD 420,000 | | | | 18,501 | | | | 14,269 | |
Put on 10-Year Interest Rate Swap(3) | | | | JPMorgan Chase Bank N.A. | | Pay | | 2.250% | | 3-month USD-LIBOR | | 08/02/22 | | | USD 950,000 | | | | 25,650 | | | | 5,995 | |
Put on 10-Year Interest Rate Swap(3) | | | | JPMorgan Chase Bank N.A. | | Pay | | 2.860% | | 3-month USD-LIBOR | | 02/22/39 | | | USD 232,500 | | | | 11,503 | | | | 8,221 | |
Put on 10-Year Interest Rate Swap(3) | | | | JPMorgan Chase Bank N.A. | | Pay | | 2.985% | | 3-month USD-LIBOR | | 04/27/38 | | | USD 200,000 | | | | 9,400 | | | | 6,664 | |
Put on 10-Year Interest Rate Swap(3) | | | | Morgan Stanley & Co. International PLC | | Pay | | 1.680% | | 3-month USD-LIBOR | | 08/02/24 | | | USD 490,000 | | | | 21,970 | | | | 23,472 | |
Put on 10-Year Interest Rate Swap(3) | | | | Morgan Stanley & Co. International PLC | | Pay | | 2.500% | | 3-month USD-LIBOR | | 06/13/24 | | | USD 930,000 | | | | 41,811 | | | | 18,294 | |
Put on 10-Year Interest Rate Swap(3) | | | | Morgan Stanley & Co. International PLC | | Pay | | 2.500% | | 3-month USD-LIBOR | | 06/20/24 | | | USD 930,000 | | | | 37,600 | | | | 18,415 | |
Put on 10-Year Interest Rate Swap(3) | | | | Morgan Stanley & Co. International PLC | | Pay | | 3.037% | | 3-month USD-LIBOR | | 01/11/29 | | | USD 220,000 | | | | 12,523 | | | | 6,049 | |
Put on 30-Year Interest Rate Swap(3) | | | | Barclays Bank PLC | | Pay | | 2.850% | | 3-month USD-LIBOR | | 05/09/22 | | | USD 1,170,000 | | | | 67,934 | | | | 1,584 | |
See Accompanying Notes to Financial Statements
47
VY® BLACKROCK INFLATION
PROTECTED BOND PORTFOLIO | PORTFOLIO OF INVESTMENTS
AS OF DECEMBER 31, 2021 (CONTINUED) |
| Description | | | | Counterparty | | Pay/
Receive
Exercise
Rate | | Exercise
Rate | | Floating Rate
Index | | Expiration
Date | | | Notional Amount | | | Cost | | Fair
Value | |
|---|
Put on 30-Year Interest Rate Swap(3) | | | | Deutsche Bank AG | | Pay | | 1.705% | | 3-month USD-LIBOR | | 05/31/22 | | | USD 290,000 | | | $ | 16,429 | | | $ | 15,103 | |
Put on 5-Year Interest Rate Swap(3) | | | | Barclays Bank PLC | | Pay | | 1.250% | | 3-month USD-LIBOR | | 07/15/22 | | | USD 3,630,000 | | | | 43,016 | | | | 65,922 | |
Put on 5-Year Interest Rate Swap(3) | | | | Deutsche Bank AG | | Pay | | 1.540% | | 3-month USD-LIBOR | | 08/03/22 | | | USD 1,500,000 | | | | 19,200 | | | | 16,757 | |
Put on 5-Year Interest Rate Swap(3) | | | | JPMorgan Chase Bank N.A. | | Pay | | 1.324% | | 3-month USD-LIBOR | | 07/01/22 | | | USD 2,880,000 | | | | 32,724 | | | | 44,001 | |
Put on 5-Year Interest Rate Swap(3) | | | | JPMorgan Chase Bank N.A. | | Pay | | 1.335% | | 3-month USD-LIBOR | | 01/19/22 | | | USD 1,225,000 | | | | 7,381 | | | | 5,487 | |
Put on 5-Year Interest Rate Swap(3) | | | | JPMorgan Chase Bank N.A. | | Pay | | 1.450% | | 3-month USD-LIBOR | | 07/06/22 | | | USD 2,880,000 | | | | 26,675 | | | | 34,753 | |
Put on 5-Year Interest Rate Swap(3) | | | | JPMorgan Chase Bank N.A. | | Pay | | 1.525% | | 3-month USD-LIBOR | | 04/05/22 | | | USD 1,210,000 | | | | 17,636 | | | | 7,357 | |
Put on 5-Year Interest Rate Swap(3) | | | | Morgan Stanley & Co. International PLC | | Pay | | 1.385% | | 3-month USD-LIBOR | | 04/08/22 | | | USD 2,360,000 | | | | 34,236 | | | | 22,036 | |
| | | | | | | | | | | | | | | | | | | $ | 1,432,956 | | | $ | 1,376,264 | |
At December 31, 2021, the following OTC written interest rate swaptions were outstanding for VY® BlackRock Inflation Protected Bond Portfolio:
| Description | | | | Counterparty | | Pay/
Receive
Exercise
Rate | | Exercise
Rate | | Floating Rate
Index | | Expiration
Date | | | Notional Amount | | | Premiums
Received | | Fair
Value | |
|---|
Call on 10-Year interest Rate Swap(3) | | | | Barclays Bank PLC | | Pay | | 3.050% | | 3-month USD-LIBOR | | 03/12/29 | | | USD 700,000 | | | $ | 37,135 | | | $ | (85,060 | ) |
Call on 10-Year Interest Rate Swap(3) | | | | Barclays Bank PLC | | Pay | | 1.248% | | 3-month USD-LIBOR | | 01/27/22 | | | USD 600,000 | | | | 14,130 | | | | (252 | ) |
Call on 10-Year Interest Rate Swap(3) | | | | Barclays Bank PLC | | Pay | | 1.438% | | 3-month USD-LIBOR | | 01/09/23 | | | USD 870,000 | | | | 28,362 | | | | (14,150 | ) |
Call on 10-Year Interest Rate Swap(3) | | | | Barclays Bank PLC | | Pay | | 1.620% | | 3-month USD-LIBOR | | 02/18/22 | | | USD 580,000 | | | | 15,384 | | | | (6,639 | ) |
Call on 10-Year Interest Rate Swap(3) | | | | Barclays Bank PLC | | Pay | | 2.012% | | 3-month USD-LIBOR | | 03/01/23 | | | USD 900,000 | | | | 34,290 | | | | (40,619 | ) |
Call on 10-Year Interest Rate Swap(3) | | | | Citibank N.A. | | Pay | | 1.254% | | 3-month USD-LIBOR | | 12/30/22 | | | USD 470,000 | | | | 15,498 | | | | (5,067 | ) |
Call on 10-Year Interest Rate Swap(3) | | | | Deutsche Bank AG | | Pay | | 0.740% | | 3-month USD-LIBOR | | 05/02/22 | | | USD 550,000 | | | | 19,030 | | | | (374 | ) |
Call on 10-Year Interest Rate Swap(3) | | | | Deutsche Bank AG | | Pay | | 1.000% | | 3-month USD-LIBOR | | 01/27/22 | | | USD 660,000 | | | | 9,042 | | | | (19 | ) |
Call on 10-Year Interest Rate Swap(3) | | | | Deutsche Bank AG | | Pay | | 1.064% | | 3-month USD-LIBOR | | 10/11/22 | | | USD 460,000 | | | | 15,473 | | | | (2,633 | ) |
Call on 10-Year Interest Rate Swap(3) | | | | Deutsche Bank AG | | Pay | | 1.400% | | 3-month USD-LIBOR | | 03/01/22 | | | USD 680,000 | | | | 3,604 | | | | (3,008 | ) |
Call on 10-Year Interest Rate Swap(3) | | | | Deutsche Bank AG | | Pay | | 1.795% | | 3-month USD-LIBOR | | 10/13/22 | | | USD 670,000 | | | | 18,241 | | | | (20,085 | ) |
Call on 10-Year Interest Rate Swap(3) | | | | Deutsche Bank AG | | Pay | | 1.800% | | 3-month USD-LIBOR | | 10/07/22 | | | USD 670,000 | | | | 18,425 | | | | (20,173 | ) |
Call on 10-Year Interest Rate Swap(3) | | | | Deutsche Bank AG | | Pay | | 1.848% | | 3-month USD-LIBOR | | 11/15/22 | | | USD 1,380,000 | | | | 40,779 | | | | (46,320 | ) |
Call on 10-Year Interest Rate Swap(3) | | | | Goldman Sachs International | | Pay | | 1.233% | | 3-month USD-LIBOR | | 12/16/22 | | | USD 427,500 | | | | 13,979 | | | | (4,289 | ) |
Call on 10-Year Interest Rate Swap(3) | | | | Goldman Sachs International | | Pay | | 1.245% | | 3-month USD-LIBOR | | 12/16/22 | | | USD 427,500 | | | | 13,979 | | | | (4,412 | ) |
Call on 10-Year Interest Rate Swap(3) | | | | JPMorgan Chase Bank N.A. | | Pay | | 1.400% | | 3-month USD-LIBOR | | 06/07/22 | | | USD 775,000 | | | | 7,362 | | | | (7,231 | ) |
Call on 10-Year Interest Rate Swap(3) | | | | JPMorgan Chase Bank N.A. | | Pay | | 1.421% | | 1-day Secured Overnight Financing Rate | | 12/15/22 | | | USD 1,090,000 | | | | 30,629 | | | | (27,668 | ) |
Call on 10-Year Interest Rate Swap(3) | | | | JPMorgan Chase Bank N.A. | | Pay | | 1.450% | | 1-day Secured Overnight Financing Rate | | 12/05/22 | | | USD 680,000 | | | | 20,740 | | | | (18,019 | ) |
Call on 10-Year Interest Rate Swap(3) | | | | Morgan Stanley & Co. International PLC | | Pay | | 1.433% | | 1-day Secured Overnight Financing Rate | | 12/13/22 | | | USD 1,090,000 | | | | 30,847 | | | | (28,242 | ) |
Call on 10-Year Interest Rate Swap(3) | | | | Morgan Stanley & Co. International PLC | | Pay | | 1.525% | | 3-month USD-LIBOR | | 09/01/22 | | | USD 1,310,000 | | | | 34,764 | | | | (21,302 | ) |
Call on 2-Year Interest Rate Swap(3) | | | | Citibank N.A. | | Pay | | 0.518% | | 3-month USD-LIBOR | | 03/03/22 | | | USD 3,045,000 | | | | 8,869 | | | | (272 | ) |
See Accompanying Notes to Financial Statements
48
VY® BLACKROCK INFLATION
PROTECTED BOND PORTFOLIO | PORTFOLIO OF INVESTMENTS
AS OF DECEMBER 31, 2021 (CONTINUED) |
| Description | | | | Counterparty | | Pay/
Receive
Exercise
Rate | | Exercise
Rate | | Floating Rate
Index | | Expiration
Date | | | Notional Amount | | | Premiums
Received | | Fair
Value | |
|---|
Call on 2-Year Interest Rate Swap(3) | | | | Deutsche Bank AG | | Pay | | 0.508% | | 3-month USD-LIBOR | | 03/01/22 | | | USD 5,910,000 | | | $ | 18,543 | | | $ | (470 | ) |
Call on 2-Year Interest Rate Swap(3) | | | | Deutsche Bank AG | | Pay | | 0.562% | | 3-month USD-LIBOR | | 03/21/22 | | | USD 3,045,000 | | | | 10,239 | | | | (520 | ) |
Call on 2-Year Interest Rate Swap(3) | | | | Deutsche Bank AG | | Pay | | 0.568% | | 3-month USD-LIBOR | | 03/23/22 | | | USD 5,960,000 | | | | 19,370 | | | | (1,084 | ) |
Call on 2-Year Interest Rate Swap(3) | | | | Deutsche Bank AG | | Pay | | 1.020% | | 3-month USD-LIBOR | | 05/03/22 | | | USD 4,500,000 | | | | 17,775 | | | | (9,373 | ) |
Call on 2-Year Interest Rate Swap(3) | | | | JPMorgan Chase Bank N.A. | | Pay | | 0.606% | | 3-month USD-LIBOR | | 04/01/22 | | | USD 8,750,000 | | | | 20,825 | | | | (2,163 | ) |
Call on 2-Year Interest Rate Swap(3) | | | | Morgan Stanley & Co. International PLC | | Pay | | 0.508% | | 3-month USD-LIBOR | | 01/10/22 | | | USD 6,630,000 | | | | 19,669 | | | | — | |
Call on 2-Year Interest Rate Swap(3) | | | | Morgan Stanley & Co. International PLC | | Pay | | 1.235% | | 3-month USD-LIBOR | | 10/25/22 | | | USD 2,160,000 | | | | 12,906 | | | | (7,903 | ) |
Call on 2-Year Interest Rate Swap(3) | | | | Morgan Stanley & Co. International PLC | | Pay | | 1.238% | | 3-month USD-LIBOR | | 10/25/22 | | | USD 3,230,000 | | | | 19,219 | | | | (11,889 | ) |
Call on 2-Year Interest Rate Swap(3) | | | | Morgan Stanley & Co. International PLC | | Pay | | 1.250% | | 3-month USD-LIBOR | | 11/04/22 | | | USD 3,195,000 | | | | 17,573 | | | | (12,018 | ) |
Call on 30-Year Interest Rate Swap(3) | | | | Barclays Bank PLC | | Pay | | 2.000% | | 3-month USD-LIBOR | | 09/30/24 | | | USD 220,000 | | | | 22,825 | | | | (29,332 | ) |
Call on 30-Year Interest Rate Swap(3) | | | | Deutsche Bank AG | | Pay | | 1.848% | | 3-month USD-LIBOR | | 09/17/24 | | | USD 310,000 | | | | 32,317 | | | | (34,887 | ) |
Call on 30-Year Interest Rate Swap(3) | | | | Goldman Sachs International | | Pay | | 1.375% | | 1-day Secured Overnight Financing Rate | | 12/02/26 | | | USD 120,000 | | | | 16,692 | | | | (12,968 | ) |
Call on 30-Year Interest Rate Swap(3) | | | | JPMorgan Chase Bank N.A. | | Pay | | 1.975% | | 3-month USD-LIBOR | | 10/19/26 | | | USD 130,000 | | | | 16,380 | | | | (19,738 | ) |
Call on 5-Year Interest Rate Swap(3) | | | | Barclays Bank PLC | | Pay | | 0.900% | | 3-month USD-LIBOR | | 04/22/22 | | | USD 1,660,000 | | | | 8,632 | | | | (1,507 | ) |
Call on 5-Year Interest Rate Swap(3) | | | | Deutsche Bank AG | | Pay | | 0.900% | | 3-month USD-LIBOR | | 04/28/22 | | | USD 4,990,000 | | | | 22,284 | | | | (4,835 | ) |
Put on 10-Year interest Rate Swap(1) | | | | Barclays Bank PLC | | Receive | | 3.050% | | 3-month USD-LIBOR | | 03/12/29 | | | USD 700,000 | | | | 37,135 | | | | (19,324 | ) |
Put on 10-Year Interest Rate Swap(4) | | | | Barclays Bank PLC | | Receive | | 0.700% | | 6-month EUR-EURIBOR | | 05/15/23 | | | EUR 1,070,000 | | | | 28,654 | | | | (25,334 | ) |
Put on 10-Year Interest Rate Swap(1) | | | | Barclays Bank PLC | | Receive | | 1.248% | | 3-month USD-LIBOR | | 01/27/22 | | | USD 600,000 | | | | 14,130 | | | | (19,520 | ) |
Put on 10-Year Interest Rate Swap(1) | | | | Barclays Bank PLC | | Receive | | 1.438% | | 3-month USD-LIBOR | | 01/09/23 | | | USD 870,000 | | | | 28,362 | | | | (37,262 | ) |
Put on 10-Year Interest Rate Swap(1) | | | | Barclays Bank PLC | | Receive | | 1.620% | | 3-month USD-LIBOR | | 02/18/22 | | | USD 580,000 | | | | 15,384 | | | | (5,593 | ) |
Put on 10-Year Interest Rate Swap(1) | | | | Barclays Bank PLC | | Receive | | 2.012% | | 3-month USD-LIBOR | | 03/01/23 | | | USD 900,000 | | | | 34,290 | | | | (17,756 | ) |
Put on 10-Year Interest Rate Swap(1) | | | | Barclays Bank PLC | | Receive | | 2.100% | | 3-month USD-LIBOR | | 01/06/22 | | | USD 900,000 | | | | 20,644 | | | | — | |
Put on 10-Year Interest Rate Swap(1) | | | | Barclays Bank PLC | | Receive | | 2.150% | | 3-month USD-LIBOR | | 01/10/22 | | | USD 890,000 | | | | 20,692 | | | | — | |
Put on 10-Year Interest Rate Swap(1) | | | | Barclays Bank PLC | | Receive | | 2.750% | | 3-month USD-LIBOR | | 05/09/22 | | | USD 2,550,000 | | | | 73,975 | | | | (2,014 | ) |
Put on 10-Year Interest Rate Swap(1) | | | | Barclays Bank PLC | | Receive | | 2.750% | | 3-month USD-LIBOR | | 08/08/22 | | | USD 960,000 | | | | 11,568 | | | | (2,221 | ) |
Put on 10-Year Interest Rate Swap(1) | | | | Barclays Bank PLC | | Receive | | 3.250% | | 3-month USD-LIBOR | | 08/08/22 | | | USD 960,000 | | | | 5,712 | | | | (860 | ) |
Put on 10-Year Interest Rate Swap(1) | | | | Citibank N.A. | | Receive | | 1.254% | | 3-month USD-LIBOR | | 12/30/22 | | | USD 470,000 | | | | 15,498 | | | | (25,490 | ) |
Put on 10-Year Interest Rate Swap(1) | | | | Deutsche Bank AG | | Receive | | 0.740% | | 3-month USD-LIBOR | | 05/02/22 | | | USD 550,000 | | | | 19,030 | | | | (46,454 | ) |
Put on 10-Year Interest Rate Swap(1) | | | | Deutsche Bank AG | | Receive | | 1.064% | | 3-month USD-LIBOR | | 10/11/22 | | | USD 460,000 | | | | 15,473 | | | | (29,735 | ) |
Put on 10-Year Interest Rate Swap(1) | | | | Deutsche Bank AG | | Receive | | 1.500% | | 3-month USD-LIBOR | | 01/27/22 | | | USD 660,000 | | | | 9,042 | | | | (8,277 | ) |
Put on 10-Year Interest Rate Swap(1) | | | | Deutsche Bank AG | | Receive | | 1.570% | | 1-day Secured Overnight Financing Rate | | 03/01/22 | | | USD 830,000 | | | | 3,922 | | | | (2,358 | ) |
Put on 10-Year Interest Rate Swap(1) | | | | Deutsche Bank AG | | Receive | | 1.600% | | 3-month USD-LIBOR | | 02/28/22 | | | USD 600,000 | | | | 10,950 | | | | (7,105 | ) |
Put on 10-Year Interest Rate Swap(1) | | | | Deutsche Bank AG | | Receive | | 1.795% | | 3-month USD-LIBOR | | 10/13/22 | | | USD 670,000 | | | | 18,241 | | | | (14,089 | ) |
Put on 10-Year Interest Rate Swap(1) | | | | Deutsche Bank AG | | Receive | | 1.800% | | 3-month USD-LIBOR | | 10/07/22 | | | USD 670,000 | | | | 18,425 | | | | (13,757 | ) |
See Accompanying Notes to Financial Statements
49
VY® BLACKROCK INFLATION
PROTECTED BOND PORTFOLIO | PORTFOLIO OF INVESTMENTS
AS OF DECEMBER 31, 2021 (CONTINUED) |
| Description | | | | Counterparty | | Pay/
Receive
Exercise
Rate | | Exercise
Rate | | Floating Rate
Index | | Expiration
Date | | | Notional Amount | | | Premiums
Received | | Fair
Value | |
|---|
Put on 10-Year Interest Rate Swap(1) | | | | Deutsche Bank AG | | Receive | | 1.848% | | 3-month USD-LIBOR | | 11/15/22 | | | USD 1,380,000 | | | $ | 40,779 | | | $ | (28,532 | ) |
Put on 10-Year Interest Rate Swap(1) | | | | Goldman Sachs International | | Receive | | 1.233% | | 3-month USD-LIBOR | | 12/16/22 | | | USD 427,500 | | | | 13,979 | | | | (23,564 | ) |
Put on 10-Year Interest Rate Swap(1) | | | | Goldman Sachs International | | Receive | | 1.245% | | 3-month USD-LIBOR | | 12/16/22 | | | USD 427,500 | | | | 13,979 | | | | (23,191 | ) |
Put on 10-Year Interest Rate Swap(1) | | | | JPMorgan Chase Bank N.A. | | Receive | | 1.421% | | 1-day Secured Overnight Financing Rate | | 12/15/22 | | | USD 1,090,000 | | | | 30,629 | | | | (31,549 | ) |
Put on 10-Year Interest Rate Swap(1) | | | | JPMorgan Chase Bank N.A. | | Receive | | 1.450% | | 1-day Secured Overnight Financing Rate | | 12/05/22 | | | USD 680,000 | | | | 20,740 | | | | (18,463 | ) |
Put on 10-Year Interest Rate Swap(1) | | | | JPMorgan Chase Bank N.A. | | Receive | | 2.400% | | 3-month USD-LIBOR | | 06/07/22 | | | USD 775,000 | | | | 8,680 | | | | (2,211 | ) |
Put on 10-Year Interest Rate Swap(1) | | | | JPMorgan Chase Bank N.A. | | Receive | | 2.750% | | 3-month USD-LIBOR | | 08/02/22 | | | USD 950,000 | | | | 13,015 | | | | (2,087 | ) |
Put on 10-Year Interest Rate Swap(1) | | | | JPMorgan Chase Bank N.A. | | Receive | | 3.250% | | 3-month USD-LIBOR | | 08/02/22 | | | USD 950,000 | | | | 6,222 | | | | (797 | ) |
Put on 10-Year Interest Rate Swap(1) | | | | Morgan Stanley & Co. International PLC | | Receive | | 1.433% | | 1-day Secured Overnight Financing Rate | | 12/13/22 | | | USD 1,090,000 | | | | 30,847 | | | | (30,844 | ) |
Put on 10-Year Interest Rate Swap(1) | | | | Morgan Stanley & Co. International PLC | | Receive | | 1.525% | | 3-month USD-LIBOR | | 09/01/22 | | | USD 1,310,000 | | | | 34,764 | | | | (40,772 | ) |
Put on 10-Year Interest Rate Swap(1) | | | | Morgan Stanley & Co. International PLC | | Receive | | 2.250% | | 3-month USD-LIBOR | | 08/20/24 | | | USD 980,000 | | | | 29,054 | | | | (26,576 | ) |
Put on 10-Year Interest Rate Swap(1) | | | | Morgan Stanley & Co. International PLC | | Receive | | 3.000% | | 3-month USD-LIBOR | | 06/13/24 | | | USD 930,000 | | | | 25,539 | | | | (10,693 | ) |
Put on 10-Year Interest Rate Swap(1) | | | | Morgan Stanley & Co. International PLC | | Receive | | 3.000% | | 3-month USD-LIBOR | | 06/20/24 | | | USD 930,000 | | | | 22,714 | | | | (10,785 | ) |
Put on 10-Year Interest Rate Swap(1) | | | | Morgan Stanley & Co. International PLC | | Receive | | 3.500% | | 3-month USD-LIBOR | | 06/13/24 | | | USD 930,000 | | | | 15,565 | | | | (6,363 | ) |
Put on 10-Year Interest Rate Swap(1) | | | | Morgan Stanley & Co. International PLC | | Receive | | 3.500% | | 3-month USD-LIBOR | | 06/20/24 | | | USD 930,000 | | | | 13,630 | | | | (6,429 | ) |
Put on 2-Year interest Rate Swap(1) | | | | Citibank N.A. | | Receive | | 0.518% | | 3-month USD-LIBOR | | 03/03/22 | | | USD 3,045,000 | | | | 8,869 | | | | (32,856 | ) |
Put on 2-Year interest Rate Swap(1) | | | | Deutsche Bank AG | | Receive | | 0.562% | | 3-month USD-LIBOR | | 03/21/22 | | | USD 3,045,000 | | | | 10,239 | | | | (32,485 | ) |
Put on 2-Year Interest Rate Swap(1) | | | | Deutsche Bank AG | | Receive | | 0.500% | | 3-month USD-LIBOR | | 01/19/22 | | | USD 1,770,000 | | | | 3,328 | | | | (16,539 | ) |
Put on 2-Year Interest Rate Swap(1) | | | | Deutsche Bank AG | | Receive | | 0.508% | | 3-month USD-LIBOR | | 03/01/22 | | | USD 5,910,000 | | | | 18,543 | | | | (64,369 | ) |
Put on 2-Year Interest Rate Swap(1) | | | | Deutsche Bank AG | | Receive | | 0.568% | | 3-month USD-LIBOR | | 03/23/22 | | | USD 5,960,000 | | | | 19,370 | | | | (63,189 | ) |
Put on 2-Year Interest Rate Swap(1) | | | | Deutsche Bank AG | | Receive | | 0.750% | | 3-month USD-LIBOR | | 02/25/22 | | | USD 4,490,000 | | | | 10,566 | | | | (28,202 | ) |
Put on 2-Year Interest Rate Swap(1) | | | | Deutsche Bank AG | | Receive | | 1.020% | | 3-month USD-LIBOR | | 05/03/22 | | | USD 4,500,000 | | | | 17,775 | | | | (22,561 | ) |
Put on 2-Year Interest Rate Swap(1) | | | | JPMorgan Chase Bank N.A. | | Receive | | 0.606% | | 3-month USD-LIBOR | | 04/01/22 | | | USD 8,750,000 | | | | 20,825 | | | | (90,156 | ) |
Put on 2-Year Interest Rate Swap(1) | | | | JPMorgan Chase Bank N.A. | | Receive | | 0.740% | | 3-month USD-LIBOR | | 04/06/22 | | | USD 8,750,000 | | | | 14,000 | | | | (70,631 | ) |
Put on 2-Year Interest Rate Swap(1) | | | | JPMorgan Chase Bank N.A. | | Receive | | 1.480% | | 3-month USD-LIBOR | | 11/02/22 | | | USD 1,930,000 | | | | 9,747 | | | | (9,855 | ) |
Put on 2-Year Interest Rate Swap(1) | | | | Morgan Stanley & Co. International PLC | | Receive | | 0.508% | | 3-month USD-LIBOR | | 01/10/22 | | | USD 6,630,000 | | | | 18,640 | | | | (58,363 | ) |
Put on 2-Year Interest Rate Swap(1) | | | | Morgan Stanley & Co. International PLC | | Receive | | 1.235% | | 3-month USD-LIBOR | | 10/25/22 | | | USD 2,160,000 | | | | 12,906 | | | | (15,640 | ) |
Put on 2-Year Interest Rate Swap(1) | | | | Morgan Stanley & Co. International PLC | | Receive | | 1.238% | | 3-month USD-LIBOR | | 10/25/22 | | | USD 3,230,000 | | | | 19,218 | | | | (23,300 | ) |
Put on 2-Year Interest Rate Swap(1) | | | | Morgan Stanley & Co. International PLC | | Receive | | 1.250% | | 3-month USD-LIBOR | | 11/04/22 | | | USD 3,195,000 | | | | 17,573 | | | | (23,342 | ) |
Put on 30-Year Interest Rate Swap(1) | | | | Barclays Bank PLC | | Receive | | 2.000% | | 3-month USD-LIBOR | | 09/30/24 | | | USD 220,000 | | | | 22,825 | | | | (17,460 | ) |
Put on 30-Year Interest Rate Swap(1) | | | | Deutsche Bank AG | | Receive | | 1.848% | | 3-month USD-LIBOR | | 09/17/24 | | | USD 310,000 | | | | 32,317 | | | | (29,131 | ) |
Put on 30-Year Interest Rate Swap(1) | | | | Goldman Sachs International | | Receive | | 1.375% | | 1-day Secured Overnight Financing Rate | | 12/02/26 | | | USD 120,000 | | | | 16,692 | | | | (16,951 | ) |
Put on 30-Year Interest Rate Swap(1) | | | | JPMorgan Chase Bank N.A. | | Receive | | 1.975% | | 3-month USD-LIBOR | | 10/19/26 | | | USD 130,000 | | | | 16,380 | | | | (13,041 | ) |
See Accompanying Notes to Financial Statements
50
VY® BLACKROCK INFLATION
PROTECTED BOND PORTFOLIO | PORTFOLIO OF INVESTMENTS
AS OF DECEMBER 31, 2021 (CONTINUED) |
| Description | | | | Counterparty | | Pay/
Receive
Exercise
Rate | | Exercise
Rate | | Floating Rate
Index | | Expiration
Date | | | Notional Amount | | | Premiums
Received | | Fair
Value | |
|---|
Put on 5-Year Interest Rate Swap(4) | | | | Goldman Sachs International | | Receive | | 0.270% | | 6-month EUR-EURIBOR | | 04/19/22 | | | EUR 2,830,000 | | | $ | 9,036 | | | $ | (10,957 | ) |
| | | | | | | | | | | | | | | | | | | $ | 1,725,923 | | | $ | (1,683,554 | ) |
(1) | | Portfolio receives the exercise rate semi-annually and pays the floating rate index quarterly. |
(2) | | Portfolio pays the exercise rate semi-annually and receives the floating rate index semi-annually. |
(3) | | Portfolio pays the exercise rate semi-annually and receives the floating rate index quarterly. |
(4) | | Portfolio receives the exercise rate annually and pays the floating rate index semi-annually. |
| | | |
Currency Abbreviations
AUD — Australian Dollar
EUR — EU Euro
GBP — British Pound
JPY — Japanese Yen
NZD — New Zealand Dollar
USD — United States Dollar
A summary of derivative instruments by primary risk exposure is outlined in the following tables.
The fair value of derivative instruments as of December 31, 2021 was as follows:
Derivatives not accounted for as
hedging instruments
| | | | Location on Statement
of Assets and Liabilities | | Fair Value | |
|---|
Asset Derivatives | | | | | | | | | | |
| Interest rate contracts | | | | Investments in securities at value* | | $ | 1,382,108 | |
| Foreign exchange contracts | | | | Unrealized appreciation on forward foreign currency contracts | | | 114,662 | |
| Interest rate contracts | | | | Variation margin receivable on futures contracts** | | | 419,059 | |
| Interest rate contracts | | | | Variation margin receivable on centrally cleared swaps** | | | 9,035,053 | |
| Interest rate contracts | | | | Unrealized appreciation on OTC swap agreements | | | 1,463,650 | |
Total Asset Derivatives | | | | | | $ | 12,414,532 | |
Liability Derivatives | | | | | | | | |
| Foreign exchange contracts | | | | Unrealized depreciation on forward foreign currency contracts | | $ | 43,132 | |
| Interest rate contracts | | | | Variation margin payable on futures contracts** | | | 661,282 | |
| Interest rate contracts | | | | Variation margin payable on centrally cleared swaps** | | | 2,905,383 | |
| Interest rate contracts | | | | Written options, at fair value | | | 1,685,413 | |
Total Liability Derivatives | | | | | | $ | 5,295,210 | |
| * | | Includes purchased options. |
| ** | | The fair value presented above represents the cumulative unrealized appreciation (depreciation) on futures contracts and centrally cleared swaps as reported in the tables within the Portfolio of Investments. In the |
Statement of Assets and Liabilities, only current day’s unsettled variation margin is reported in receivables or payables on futures contracts and centrally cleared swaps and the net cumulative unrealized appreciation (depreciation) is included in total distributable earnings (loss).
The effect of derivative instruments on the Portfolio’s Statement of Operations for the year ended December 31, 2021 was as follows:
| | | | Amount of Realized Gain or (Loss) on Derivatives Recognized in Income | |
|---|
Derivatives not accounted for as
hedging instruments | | | | Investments* | | Forward foreign
currency contracts | | Futures | | Swaps | | Written
options | | Total | |
|---|
| Foreign exchange contracts | | | | | $(14,122 | ) | | | $486,557 | | | $ | — | | | $ | — | | $ — | | $ 472,435 | |
| Interest rate contracts | | | | | 6,082 | | | | — | | | | (340,900 | ) | | | 2,067,768 | | 368,489 | | 2,101,439 | |
Total | | | | | $ (8,040 | ) | | | $486,557 | | | $ | (340,900 | ) | | $ | 2,067,768 | | $368,489 | | $2,573,874 | |
See Accompanying Notes to Financial Statements
51
VY® BLACKROCK INFLATION
PROTECTED BOND PORTFOLIO | PORTFOLIO OF INVESTMENTS
AS OF DECEMBER 31, 2021 (CONTINUED) |
| | | | Change in Unrealized Appreciation or (Depreciation) on Derivatives Recognized in Income | |
|---|
Derivatives not accounted for
as hedging instruments | | | | Investments* | | Forward foreign
currency contracts | | Futures | | Swaps | | Written
options | | Total | |
|---|
| Foreign exchange contracts | | | | | $ — | | | | $308,830 | | | $ | — | | | $ | — | | $ — | | $ 308,830 | |
| Interest rate contracts | | | | | (70,008 | ) | | | — | | | | (304,458 | ) | | | 5,651,419 | | (171,019) | | 5,105,934 | |
Total | | | | | $ (70,008 | ) | | | $308,830 | | | $ | (304,458 | ) | | $ | 5,651,419 | | $(171,019) | | $5,414,764 | |
| * | | Amounts recognized for purchased options are included in net realized gain (loss) on investments and net change in unrealized appreciation or depreciation on investments. |
The following is a summary by counterparty of the fair value of OTC derivative instruments subject to Master Netting Agreements and collateral pledged (received), if any, at December 31, 2021:
| | | | Bank of
America
N.A. | | | Barclays
Bank
PLC | | | Citibank
N.A. | | | Deutsche
Bank AG | | | Goldman
Sachs
International | | | JPMorgan
Chase
Bank N.A. | | Morgan Stanley
& Co.
International PLC | | Standard
Chartered
Bank | | | Toronto
Dominion
Securities | | UBS
AG | | Totals | |
|---|
Assets: | | | | | | | | | | | | | | | | | | | | | | | | | | | | | | | | | | | | | | | | | | |
| Purchased options | | | | $ | — | | | $ | 451,986 | | | $ | 85,032 | | | $ | 359,203 | | | $ | 138,752 | | | $ | 193,458 | | | $ | 147,833 | | | $ | — | | | $ | — | | $ — | | $ 1,376,264 | |
| Forward foreign currency contracts | | | | | — | | | | — | | | | — | | | | — | | | | — | | | | — | | | | — | | | | 114,004 | | | | 563 | | 95 | | 114,662 | |
| OTC Interest rate swaps | | | | | — | | | | — | | | | 1,463,650 | | | | — | | | | — | | | | — | | | | — | | | | — | | | | — | | — | | 1,463,650 | |
Total Assets | | | | $ | — | | | $ | 451,986 | | | $ | 1,548,682 | | | $ | 359,203 | | | $ | 138,752 | | | $ | 193,458 | | | $ | 147,833 | | | $ | 114,004 | | | $ | 563 | | $ 95 | | $ 2,954,576 | |
Liabilities: | | | | | | | | | | | | | | | | | | | | | | | | | | | | | | | | | | | | | | |
| Forward foreign currency contracts | | | | $ | 16,650 | | | $ | — | | | $ | — | | | $ | — | | | $ | — | | | $ | — | | | $ | — | | | $ | 21,649 | | | $ | 3,127 | | $ 1,706 | | $ 43,132 | |
| OTC Interest rate swaps | | | | | — | | | | — | | | | 180,826 | | | | — | | | | — | | | | — | | | | — | | | | — | | | | — | | — | | 180,826 | |
| Written options | | | | | — | | | | 324,903 | | | | 63,685 | | | | 550,564 | | | | 96,332 | | | | 313,609 | | | | 334,461 | | | | — | | | | — | | — | | 1,683,554 | |
Total Liabilities | | | | $ | 16,650 | | | $ | 324,903 | | | $ | 244,511 | | | $ | 550,564 | | | $ | 96,332 | | | $ | 313,609 | | | $ | 334,461 | | | $ | 21,649 | | | $ | 3,127 | | $ 1,706 | | $ 1,907,512 | |
Net OTC derivative instruments by counterparty, at fair value | | | | $ | (16,650 | ) | | $ | 127,083 | | | $ | 1,304,171 | | | $ | (191,361 | ) | | $ | 42,420 | | | $ | (120,151 | ) | | $ | (186,628 | ) | | $ | 92,355 | | | $ | (2,564 | ) | $(1,611) | | $ 1,047,064 | |
Total collateral pledged by the Portfolio/(Received from counterparty) | | | | $ | — | | | $ | (127,083 | ) | | $ | (1,304,171 | ) | | $ | 191,361 | | | $ | (40,000 | ) | | $ | 120,000 | | | $ | 40,000 | | | $ | — | | | $ | — | | $ — | | $(1,119,893) | |
Net Exposure(1)(2) | | | | $ | (16,650 | ) | | $ | — | | | $ | — | | | $ | — | | | $ | 2,420 | | | $ | (151 | ) | | $ | (146,628 | ) | | $ | 92,355 | | | $ | (2,564 | ) | $(1,611) | | $(72,829) | |
(1) | | Positive net exposure represents amounts due from each respective counterparty. Negative exposure represents amounts due from the Portfolio. Please refer to Note 2 for additional details regarding counterparty credit risk and credit related contingent features. |
| | | |
(2) | | At December 31, 2021, the Portfolio had pledged $200,000 in cash collateral to Deutsche Bank AG. In addition, the Portfolio had received $142,000 and $1,350,000 in cash collateral from Barclays Bank PLC and Citibank N.A., respectively. Excess cash collateral is not shown for financial reporting purposes. |
At December 31, 2021, the aggregate cost of securities and other investments and the composition of unrealized appreciation and depreciation of securities and other investments on a tax basis were:
| Cost for federal income tax purposes was $326,425,696. | | | | | | |
| Net unrealized appreciation consisted of: | | | | | | |
| Gross Unrealized Appreciation | | | | $ | 30,276,276 | |
| Gross Unrealized Depreciation | | | | | (5,340,730 | ) |
| Net Unrealized Appreciation | | | | $ | 24,935,546 | |
See Accompanying Notes to Financial Statements
52
VY® BRANDYWINEGLOBAL —
BOND PORTFOLIO | PORTFOLIO OF INVESTMENTS
AS OF DECEMBER 31, 2021 |
Principal
Amount† | | | | | | | Value | | | Percentage
of Net
Assets | |
| | | | | | | | | | | | | | |
CORPORATE BONDS/NOTES: 25.9% |
| | | | | | Consumer, Cyclical: 3.2% |
| 3,010,000 | | | (1) | | Delta Air Lines, Inc. / SkyMiles IP Ltd., 4.750%, 10/20/2028 | | $ | 3,289,273 | | | | 1.0 | |
| 1,335,000 | | | | | General Motors Co., 6.250%, 10/02/2043 | | | 1,830,763 | | | | 0.5 | |
| 920,000 | | | | | General Motors Co., 6.800%, 10/01/2027 | | | 1,130,060 | | | | 0.3 | |
| 4,605,000 | | | | | General Motors Financial Co., Inc., 1.250%, (SOFRRATE + 1.200%), 11/17/2023 | | | 4,655,751 | | | | 1.4 | |
| | | | | | | | | 10,905,847 | | | | 3.2 | |
| | | | | | | | | | | | | | |
| | | | | | Energy: 4.6% |
| 6,245,000 | | | | | Marathon Oil Corp., 6.600%, 10/01/2037 | | | 8,173,695 | | | | 2.4 | |
| 3,905,000 | | | | | Occidental Petroleum Corp., 3.500%,
08/15/2029 | | | 4,018,362 | | | | 1.2 | |
| 3,610,000 | | | | | Petroleos Mexicanos, 7.690%, 01/23/2050 | | | 3,490,780 | | | | 1.0 | |
| | | | | | | | | 15,682,837 | | | | 4.6 | |
| | | | | | | | | | | | | | |
| | | | | | Financial: 11.2% |
| 5,510,000 | | | (1) | | Athene Global Funding, 0.750%, (SOFRRATE + 0.700%), 05/24/2024 | | | 5,526,978 | | | | 1.6 | |
| 5,635,000 | | | | | Bank of Montreal, 0.730%, (SOFRRATE + 0.680%), 03/10/2023 | | | 5,662,884 | | | | 1.6 | |
| 7,100,000 | | | | | Bank of Nova Scotia/The, 0.600%, (SOFRRATE + 0.550%), 09/15/2023 | | | 7,124,784 | | | | 2.1 | |
| 2,280,000 | | | (1) | | Blue Owl Finance LLC, 3.125%, 06/10/2031 | | | 2,233,524 | | | | 0.6 | |
| 5,095,000 | | | | | Canadian Imperial Bank of Commerce, 0.850%, (SOFRRATE + 0.800%), 03/17/2023 | | | 5,122,824 | | | | 1.5 | |
| 6,990,000 | | | (1) | | Commonwealth Bank of Australia, 0.449%, (SOFRRATE + 0.400%), 07/07/2025 | | | 7,001,115 | | | | 2.0 | |
| 2,695,000 | | | | | Golub Capital BDC, Inc., 2.500%, 08/24/2026 | | | 2,651,328 | | | | 0.8 | |
| 3,300,000 | | | (1) | | Metropolitan Life Global Funding I, 0.619%, (SOFRRATE + 0.570%), 01/13/2023 | | | 3,313,772 | | | | 1.0 | |
| | | | | | | | | 38,637,209 | | | | 11.2 | |
| | | | | | | | | | | | | | |
| | | | | | Industrial: 3.2% |
| 1,230,000 | | | | | Boeing Co/The, 3.950%, 08/01/2059 | | | 1,281,564 | | | | 0.4 | |
| 800,000 | | | | | Boeing Co/The, 5.705%, 05/01/2040 | | | 1,029,010 | | | | 0.3 | |
| 2,065,000 | | | | | Boeing Co/The, 5.805%, 05/01/2050 | | | 2,801,599 | | | | 0.8 | |
| 1,225,000 | | | | | Boeing Co/The, 5.930%, 05/01/2060 | | | 1,704,618 | | | | 0.5 | |
| 4,280,000 | | | | | Caterpillar Financial Services Corp., 0.200%, (SOFRRATE + 0.150%), 11/17/2022 | | | 4,275,312 | | | | 1.2 | |
| | | | | | | | | 11,092,103 | | | | 3.2 | |
Principal
Amount† | | | | | | | Value | | | Percentage
of Net
Assets | |
| | | | | | | | | | | | | | |
CORPORATE BONDS/NOTES: (continued) |
| | | | | | Technology: 2.0% |
| 5,885,000 | | | | | Dell International LLC / EMC Corp., 5.300%, 10/01/2029 | | $ | 6,905,149 | | | | 2.0 | |
| | | | | | | | | | | | | | |
| | | | | | Utilities: 1.7% |
| 2,960,000 | | | (1) | | AES Corp./The, 3.950%, 07/15/2030 | | | 3,159,282 | | | | 0.9 | |
| 2,530,000 | | | (1) | | AES Panama Generation Holdings SRL, 4.375%, 05/31/2030 | | | 2,638,284 | | | | 0.8 | |
| | | | | | | | | 5,797,566 | | | | 1.7 | |
| | | | | | Total Corporate Bonds/Notes
(Cost $83,683,569) | | | 89,020,711 | | | | 25.9 | |
| | | | | | | | | | | | | | |
COLLATERALIZED MORTGAGE OBLIGATIONS: 0.5% |
| 608,081 | | | (1),(2) | | Angel Oak Mortgage Trust 2019-6 A1, 2.620%, 11/25/2059 | | | 607,953 | | | | 0.2 | |
| 230,883 | | | (1),(2) | | Angel Oak Mortgage Trust I LLC 2019-2 A1, 3.628%, 03/25/2049 | | | 231,994 | | | | 0.1 | |
| 851,027 | | | (1),(2) | | Residential Mortgage Loan Trust 2019-3 A1, 2.633%, 09/25/2059 | | | 852,149 | | | | 0.2 | |
| | | | | | Total Collateralized Mortgage Obligations
(Cost $1,666,338) | | | 1,692,096 | | | | 0.5 | |
| | | | | | | | | | | | | | |
U.S. TREASURY OBLIGATIONS: 49.8% |
| | | | | | U.S. Treasury Bonds: 6.3% |
| 7,660,000 | | | | | 1.875%, 11/15/2051 | | | 7,601,353 | | | | 2.2 | |
| 13,940,000 | | | | | 2.000%, 08/15/2051 | | | 14,214,444 | | | | 4.1 | |
| | | | | | | | | 21,815,797 | | | | 6.3 | |
| |
| | | | | | U.S. Treasury Floating Rate Notes: 43.5% |
| 7,175,000 | | | | | 0.119%, (USBMMY3M + 0.034%), 04/30/2023 | | | 7,175,744 | | | | 2.1 | |
| 51,910,000 | | | | | 0.134%, (USBMMY3M + 0.049%), 01/31/2023 | | | 51,932,867 | | | | 15.1 | |
| 26,545,000 | | | | | 0.140%, (USBMMY3M + 0.055%), 07/31/2022 | | | 26,554,028 | | | | 7.7 | |
| 63,640,000 | | | | | 0.140%, (USBMMY3M + 0.055%), 10/31/2022 | | | 63,665,903 | | | | 18.6 | |
| | | | | | | | | 149,328,542 | | | | 43.5 | |
| | | | | | Total U.S. Treasury Obligations
(Cost $171,186,293) | | | 171,144,339 | | | | 49.8 | |
| | | | | | | | | | | | | | |
U.S. GOVERNMENT AGENCY OBLIGATIONS: 17.0% |
| | | | | | Federal Home Loan Bank: 8.5% |
| 29,280,000 | | | | | 0.125%, 03/17/2023 | | | 29,146,934 | | | | 8.5 | |
| |
| | | | | | Federal Home Loan Mortgage Corporation: 8.5%(3) |
| 29,190,000 | | | | | 0.375%, 05/05/2023 | | | 29,128,459 | | | | 8.5 | |
| | | | | | Total U.S. Government Agency Obligations
(Cost $58,508,182) | | | 58,275,393 | | | | 17.0 | |
| | | | | | | | | | | | | | |
COMMERCIAL MORTGAGE-BACKED SECURITIES: 4.8% |
| 3,089,000 | | | (2) | | Benchmark 2020-B18 C Mortgage Trust, 3.647%, 07/15/2053 | | | 3,220,568 | | | | 0.9 | |
See Accompanying Notes to Financial Statements
53
VY® BRANDYWINEGLOBAL —
BOND PORTFOLIO | PORTFOLIO OF INVESTMENTS
AS OF DECEMBER 31, 2021 (CONTINUED) |
Principal
Amount† | | | | | | | Value | | | Percentage
of Net
Assets | |
| | | | | | | | | | | | | | |
COMMERCIAL MORTGAGE-BACKED SECURITIES: (continued) | |
| 1,520,000 | | | (1) | | Credit Suisse Mortgage Capital Certificates 2019-ICE4 A, 1.090%, (US0001M + 0.980%), 05/15/2036 | | $ | 1,521,279 | | | | 0.5 | |
| 9,370,000 | | | (1),(2) | | FREMF 2012-K23 B Mortgage Trust, 3.656%, 10/25/2045 | | | 9,524,104 | | | | 2.8 | |
| 2,000,000 | | | (2) | | JPMDB Commercial Mortgage Securities Trust 2018-C8 C, 4.726%, 06/15/2051 | | | 2,106,243 | | | | 0.6 | |
| | | | | | Total Commercial Mortgage-Backed Securities
(Cost $16,564,491) | | | 16,372,194 | | | | 4.8 | |
| | | | | | | | | | | | | | |
ASSET-BACKED SECURITIES: 0.2% |
| | | | | | Other Asset-Backed Securities: 0.2% |
| 720,000 | | | (1),(2) | | Towd Point Mortgage Trust 2018-3 A2, 3.875%, 05/25/2058 | | | 760,784 | | | | 0.2 | |
| | | | | | Total Asset-Backed Securities
(Cost $696,185) | | | 760,784 | | | | 0.2 | |
| | | | | | | | | | | | | | |
| | | | | | Total Long-Term Investments
(Cost $332,305,058) | | | 337,265,517 | | | | 98.2 | |
| Shares | | | | | | | Value | | | Percentage
of Net
Assets | |
| | | | | | | | | | | | | | |
SHORT-TERM INVESTMENTS: 1.5% |
| | | | | | Mutual Funds: 1.5% |
| 5,134,368 | | | (4) | | BlackRock Liquidity Funds, FedFund, Institutional Class, 0.030%
(Cost $5,134,368) | | $ | 5,134,368 | | | | 1.5 | |
| | | | | | Total Short-Term Investments
(Cost $5,134,368) | | | 5,134,368 | | | | 1.5 | |
| | | | | | Total Investments in Securities
(Cost $337,439,426) | | $ | 342,399,885 | | | | 99.7 | |
| | | | | | Assets in Excess of Other Liabilities | | | 929,082 | | | | 0.3 | |
| | | | | | Net Assets | | $ | 343,328,967 | | | | 100.0 | |
| † | | Unless otherwise indicated, principal amount is shown in USD. |
| (1) | | Securities with purchases pursuant to Rule 144A or section 4(a)(2), under the Securities Act of 1933 and may not be resold subject to that rule except to qualified institutional buyers. |
| (2) | | Variable rate security. Rate shown is the rate in effect as of December 31, 2021. |
| (3) | | The Federal Housing Finance Agency (“FHFA”) placed the Federal Home Loan Mortgage Corporation and Federal National Mortgage Association into conservatorship with FHFA as the conservator. As such, the FHFA oversees the continuing affairs of these companies. |
| (4) | | Rate shown is the 7-day yield as of December 31, 2021. |
Reference Rate Abbreviations:
| SOFRRATE | | 1-day Secured Overnight Financing Rate |
| US0001M | | 1-month LIBOR |
| USBMMY3M | | U.S. Treasury 3-month Bill Money Market Yield |
Fair Value Measurementsˆ
The following is a summary of the fair valuations according to the inputs used as of December 31, 2021 in valuing the assets and liabilities:
| | Quoted Prices
in Active Markets
for Identical
Investments
(Level 1) | | Significant
Other
Observable
Inputs
(Level 2) | | Significant
Unobservable
Inputs
(Level 3) | | Fair Value
at
December 31, 2021 | |
|---|
Asset Table | | | | | | | | | | | | | | | | |
Investments, at fair value | | | | | | | | | | | | | | | | |
| Corporate Bonds/Notes | | $ | — | | | $ | 89,020,711 | | | | $— | | | $ | 89,020,711 | |
| Collateralized Mortgage Obligations | | | — | | | | 1,692,096 | | | | — | | | | 1,692,096 | |
| Commercial Mortgage-Backed Securities | | | — | | | | 16,372,194 | | | | — | | | | 16,372,194 | |
| U.S. Government Agency Obligations | | | — | | | | 58,275,393 | | | | — | | | | 58,275,393 | |
| Asset-Backed Securities | | | — | | | | 760,784 | | | | — | | | | 760,784 | |
| U.S. Treasury Obligations | | | — | | | | 171,144,339 | | | | — | | | | 171,144,339 | |
| Short-Term Investments | | | 5,134,368 | | | | — | | | | — | | | | 5,134,368 | |
| Total Investments, at fair value | | $ | 5,134,368 | | | $ | 337,265,517 | | | | $— | | | $ | 342,399,885 | |
Liabilities Table | | | | | | | | | | | | | | | | |
Other Financial Instruments+ | | | | | | | | | | | | | | | | |
| Futures | | $ | (75,297 | ) | | $ | — | | | | $— | | | $ | (75,297 | ) |
| Total Liabilities | | $ | (75,297 | ) | | $ | — | | | | $— | | | $ | (75,297 | ) |
| ˆ | | See Note 2, “Significant Accounting Policies” in the Notes to Financial Statements for additional information. |
See Accompanying Notes to Financial Statements
54
VY® BRANDYWINEGLOBAL —
BOND PORTFOLIO | PORTFOLIO OF INVESTMENTS
AS OF DECEMBER 31, 2021 (CONTINUED) |
| + | | Other Financial Instruments may include open forward foreign currency contracts, futures, centrally cleared swaps, OTC swaps and written options. Forward foreign currency contracts, futures and centrally cleared swaps are fair valued at the unrealized appreciation (depreciation) on the instrument. OTC swaps and written options are valued at the fair value of the instrument. |
At December 31, 2021, the following futures contracts were outstanding for VY® BrandywineGLOBAL- Bond Portfolio:
| Description | | | | Number
of Contracts | | Expiration
Date | | Notional
Amount | | Unrealized
Appreciation/
(Depreciation) |
|---|
| Long Contracts: | | | | | | | | | | | | | | | | | | |
| U.S. Treasury Ultra Long Bond | | | | | 39 | | | | 03/22/22 | | | $ | 7,687,875 | | | $ | (75,297 | ) |
| | | | | | | | | | | | | $ | 7,687,875 | | | $ | (75,297 | ) |
A summary of derivative instruments by primary risk exposure is outlined in the following tables.
The fair value of derivative instruments as of December 31, 2021 was as follows:
Derivatives not accounted for as
hedging instruments | | | | Location on Statement
of Assets and Liabilities | | Fair Value | |
|---|
Liability Derivatives | | | | | | | | |
| Interest rate contracts | | | | Variation margin payable on futures contracts* | | $ | 75,297 | |
Total Liability Derivatives | | | | | | $ | 75,297 | |
| * | | The fair value presented above represents the cumulative unrealized appreciation (depreciation) on futures contracts as reported in the table within the Portfolio of Investments. In the Statement of Assets and Liabilities, only current day’s unsettled variation margin is reported in receivables or payables on futures contracts and the net cumulative unrealized appreciation (depreciation) is included in total distributable earnings (loss). |
The effect of derivative instruments on the Portfolio’s Statement of Operations for the year ended December 31, 2021 was as follows:
| | | | Amount of Realized Gain
or (Loss) on Derivatives Recognized in Income |
|---|
Derivatives not accounted for
as hedging instruments | | | Futures |
|---|
| Interest rate contracts | | | | $ | 5,033,822 | |
Total | | | | $ | 5,033,822 | |
| | | Change in Unrealized
Appreciation or
(Depreciation) on
Derivatives Recognized
in Income |
|---|
Derivatives not accounted for
as hedging instruments | | | Futures |
|---|
| Interest rate contracts | | | | $ | (453,656 | ) |
Total | | | | $ | (453,656 | ) |
At December 31, 2021, the aggregate cost of securities and other investments and the composition of unrealized appreciation and depreciation of securities and other investments on a tax basis were:
| Cost for federal income tax purposes was $337,364,129. |
| Net unrealized appreciation consisted of: | | | | | |
| Gross Unrealized Appreciation | | | | $5,597,307 | |
| Gross Unrealized Depreciation | | | | (636,848 | ) |
| Net Unrealized Appreciation | | | | $4,960,459 | |
See Accompanying Notes to Financial Statements
55
TAX INFORMATION (UNAUDITED)
Dividends and distributions paid during the year ended December 31, 2021 were as follows:
| Portfolio Name | | | | Type | | Per Share Amount |
|---|
VY® BlackRock Inflation Protected Bond Portfolio | | | | | | | | | | |
| Class ADV | | | | NII | | $ | 0.2317 | |
| Class I | | | | NII | | $ | 0.2934 | |
| Class S | | | | NII | | $ | 0.2667 | |
VY® BrandywineGLOBAL — Bond Portfolio | | | | NII | | $ | 0.1910 | |
| | | | | STCG | | $ | 0.6538 | |
| | | | | LTCG | | $ | 0.1065 | |
NII — Net investment income
STCG — Short-term capital gain
LTCG — Long-term capital gain
VY® BrandywineGLOBAL — Bond Portfolio designates $3,031,930 of long-term capital gain distributions as 20% rate long-term capital gain dividends under Internal Revenue Code Section 852(b)(3)(C).
Above figures may differ from those cited elsewhere in this report due to differences in the calculation of income and gains under U.S. generally accepted accounting principles (book) purposes and Internal Revenue Service(tax) purposes.
Shareholders are strongly advised to consult their own tax advisers with respect to the tax consequences of their investments in the Portfolios. In January, shareholders, excluding corporate shareholders, receive an IRS 1099-DIV regarding the federal tax status of the dividends and distributions they received in the calendar year.
56
TRUSTEE AND OFFICER INFORMATION (UNAUDITED) The business and affairs of each Trust are managed under the direction of the Board. A Trustee, who is not an interested person of a Trust, as defined in the 1940 Act, is an independent trustee (“Independent Trustee”). The Trustees and Officers of each Trust are listed below. The Statement of Additional Information includes additional information about trustees of the Trust and is available, without charge, upon request at (800) 992-0180 for Voya Variable Insurance Trust (“VVIT”) and (800) 366-0066 for Voya Investors Trust (“VIT”).
| Name, Address and Age | | Position(s)
Held with
the Trust | | Term of Office
and Length of
Time Served(1) | | Principal
Occupation(s) —
During the Past 5 Years | | Number of
funds in
Fund
Complex
Overseen
by
Trustee(2) | | Other Board
Positions
Held by
Trustee |
| | | | | | | | | | | |
Independent Trustees: | | | | | | |
| | | | | | | | | | | |
Colleen D. Baldwin
7337 East Doubletree Ranch Rd.
Suite 100
Scottsdale, Arizona 85258
Age: 61 | | Trustee
Chairperson | | November 2007–Present
January 2020–Present | | President, Glantuam Partners, LLC, a business consulting firm (January 2009–Present). | | 131 | | Dentaquest (February 2014–Present); RSR Partners, Inc. (2016–Present). |
| | | | | | | | | | | |
John V. Boyer
7337 East Doubletree Ranch Rd.
Suite 100
Scottsdale, Arizona 85258
Age: 68 | | Trustee | | January 2005–Present | | Retired. Formerly, President and Chief Executive Officer, Bechtler Arts Foundation, an arts and education foundation (January 2008–December 2019). | | 131 | | None. |
| | | | | | | | | | | |
Patricia W. Chadwick
7337 East Doubletree Ranch Rd.
Suite 100
Scottsdale, Arizona 85258
Age: 73 | | Trustee | | January 2006–Present | | Consultant and President, Ravengate Partners LLC, a consulting firm that provides advice regarding financial markets and the global economy (January 2000–Present). | | 131 | | Wisconsin Energy Corporation (June 2006–Present); The Royce Funds (22 funds) (December 2009–Present); and AMICA Mutual Insurance Company (1992–Present). |
| | | | | | | | | | | |
Martin J. Gavin
7337 East Doubletree Ranch Rd.
Suite 100
Scottsdale, AZ 85258
Age: 71 | | Trustee | | August 2015–Present | | Retired. | | 131 | | None. |
| | | | | | | | | | | |
Joseph E. Obermeyer
7337 East Doubletree Ranch Rd.
Suite 100
Scottsdale, Arizona 85258
Age: 64 | | Trustee | | May 2013–Present | | President, Obermeyer & Associates, Inc., a provider of financial and economic consulting services (November 1999–Present). | | 131 | | None. |
| | | | | | | | | | | |
Sheryl K. Pressler
7337 East Doubletree Ranch Rd.
Suite 100
Scottsdale, Arizona 85258
Age: 71 | | Trustee | | January 2006–Present | | Consultant (May 2001–Present). | | 131 | | Centerra Gold Inc. (May 2008–Present). |
| | | | | | | | | | | |
Christopher P. Sullivan
7337 East Doubletree Ranch Rd.
Suite 100
Scottsdale, Arizona 85258
Age: 68 | | Trustee | | October 2015–Present | | Retired. | | 131 | | None. |
57
TRUSTEE AND OFFICER INFORMATION (UNAUDITED) (CONTINUED)
| Name, Address and Age | | Position(s)
Held with
the Trust | | Term of Office
and Length of
Time Served(1) | | Principal
Occupation(s) —
During the Past 5 Years | | Number of
funds in
Fund
Complex
Overseen
by
Trustee(2) | | Other Board
Positions
Held by
Trustee |
| | | | | | | | | | | |
| Trustee who is an “interested person”: | | | | | | |
| | | | | | | | | | | |
Dina Santoro
230 Park Avenue
New York, New York 10169
Age: 48 | | Trustee | | July 2018–Present | | President, Voya Investments, LLC and Voya Capital, LLC (March 2018–Present); Senior Vice President, Voya Investments Distributor, LLC (April 2018–Present); Chief Operating Officer and Senior Managing Director, Voya Investment Management (January 2022–Present). Formerly, Senior Managing Director, Head of Product and Marketing Strategy, Voya Investment Management (September 2017–January 2022); Managing Director, Quantitative Management Associates, LLC (January 2004–August 2017). | | 131 | | Voya Investments, LLC, Voya Capital, LLC, and Voya Funds Services, LLC (March 2018–Present); Voya Investments Distributor, LLC (April 2018–Present). |
(1) | | Trustees serve until their successors are duly elected and qualified. The tenure of each Trustee who is not an “interested person” as defined in the 1940 Act, of each Portfolio (“Independent Trustee”) is subject to the Board’s retirement policy which states that each duly elected or appointed Independent Trustee shall retire from and cease to be a member of the Board of Trustees at the close of business on December 31 of the calendar year in which the Independent Trustee attains the age of 75. A majority vote of the Board’s other Independent Trustees may extend the retirement date of an Independent Trustee if the retirement would trigger a requirement to hold a meeting of shareholders of the Trust under applicable law, whether for the purposes of appointing a successor to the Independent Trustee or otherwise comply under applicable law, in which case the extension would apply until such time as the shareholder meeting can be held or is no longer required (as determined by a vote of a majority of the other Independent Trustees). |
| | | |
(2) | | For the purposes of this table, “Fund Complex” means the Voya family of funds including the following investment companies: Voya Asia Pacific High Dividend Equity Income Fund; Voya Balanced Portfolio, Inc.; Voya Emerging Markets High Dividend Equity Fund; Voya Equity Trust; Voya Funds Trust; Voya Global Advantage and Premium Opportunity Fund; Voya Global Equity Dividend and Premium Opportunity Fund; Voya Government Money Market Portfolio; Voya Infrastructure, Industrials and Materials Fund; Voya Intermediate Bond Portfolio; Voya Investors Trust; Voya Mutual Funds; Voya Partners, Inc.; Voya Senior Income Fund; Voya Separate Portfolios Trust; Voya Strategic Allocation Portfolios, Inc.; Voya Variable Funds; Voya Variable Insurance Trust; Voya Variable Portfolios, Inc.; and Voya Variable Products Trust. The number of funds in the Fund Complex is as of January 31, 2022. |
58
TRUSTEE AND OFFICER INFORMATION (UNAUDITED) (CONTINUED)
| Name, Address and Age | | Position(s) Held
With the Trust | | Term of Office
and Length of
Time Served(1) | | Principal Occupation(s) —
During the Past 5 Years |
| | | | | | | |
Michael Bell
One Orange Way
Windsor, Connecticut 06095
Age: 53 | | Chief Executive Officer | | March 2018–Present | | Chief Executive Officer and Director, Voya Investments, LLC, Voya Capital, LLC, and Voya Funds Services, LLC (March 2018–Present); Senior Vice President, Voya Investments Distributor, LLC (March 2020–Present); Chief Financial Officer, Voya Investment Management (September 2014–Present). Formerly, Senior Vice President and Chief Financial Officer, Voya Investments Distributor, LLC (September 2019–March 2020); Senior Vice President and Treasurer, Voya Investments Distributor, LLC (November 2015–September 2019); Senior Vice President, Chief Financial Officer and Treasurer, Voya Investments, LLC (November 2015–March 2018). |
| | | | | | | |
Dina Santoro
230 Park Avenue
New York, New York 10169
Age: 48 | | President | | March 2018–Present | | President and Director, Voya Investments, LLC and Voya Capital, LLC (March 2018–Present); Director, Voya Funds Services, LLC (March 2018–Present); Director and Senior Vice President, Voya Investments Distributor, LLC (April 2018–Present); Chief Operating Officer and Senior Managing Director, Voya Investment Management (January 2022–Present). Formerly, Senior Managing Director, Head of Product and Marketing Strategy, Voya Investment Management (September 2017–January 2022); Managing Director, Quantitative Management Associates, LLC (January 2004–August 2017). |
| | | | | | | |
Jonathan Nash
230 Park Avenue
New York, New York 10169
Age: 54 | | Executive Vice President
Chief Investment Risk Officer | | March 2020 – Present
March 2020–Present | | Executive Vice President and Chief Investment Risk Officer, Voya Investments, LLC (March 2020–Present) and Senior Vice President, Investment Risk Management, Voya Investment Management (March 2017–Present). Formerly, Vice President, Voya Investments, LLC (September 2018–March 2020); Consultant, DA Capital LLC (January 2016–March 2017). |
| | | | | | | |
James M. Fink
5780 Powers Ferry Road NW
Atlanta, Georgia 30327
Age: 63 | | Executive Vice President | | March 2018–Present | | Managing Director, Voya Investments, LLC, Voya Capital, LLC, and Voya Funds Services, LLC (March 2018–Present); Senior Vice President, Voya Investments Distributor, LLC (April 2018–Present); Chief Administrative Officer, Voya Investment Management (September 2017–Present). Formerly, Managing Director, Operations, Voya Investment Management (March 1999–September 2017). |
| | | | | | | |
Kevin M. Gleason
7337 East Doubletree Ranch Rd.
Suite 100
Scottsdale, Arizona 85258
Age: 55 | | Chief Compliance Officer | | February 2012–Present | | Senior Vice President, Voya Investment Management and Chief Compliance Officer, Voya Family of Funds (February 2012–Present). |
| | | | | | | |
Todd Modic
7337 East Doubletree Ranch Rd.
Suite 100
Scottsdale, Arizona 85258
Age: 54 | | Senior Vice President, Chief/Principal Financial Officer and Assistant Secretary | | March 2005–Present | | President, Voya Funds Services, LLC (March 2018–Present) and Senior Vice President, Voya Investments, LLC (April 2005–Present). |
| | | | | | | |
Kimberly A. Anderson
7337 East Doubletree Ranch Rd.
Suite 100
Scottsdale, Arizona 85258
Age: 57 | | Senior Vice President | | November 2003–Present | | Senior Vice President, Voya Investments, LLC (September 2003–Present). |
| | | | | | | |
Micheline S. Faver
7337 East Doubletree Ranch Rd.
Suite 100
Scottsdale, Arizona 85258
Age: 44 | | Senior Vice President | | September 2020 – Present | | Senior Vice President, Head of Fund Compliance and Chief Compliance Officer, Voya Investments, LLC (March 2021–Present). Formerly, Vice President, Head of Fund Compliance and Chief Compliance Officer, Voya Investments, LLC (June 2016–March 2021). |
59
TRUSTEE AND OFFICER INFORMATION (UNAUDITED) (CONTINUED)
| Name, Address and Age | | Position(s) Held
With the Trust | | Term of Office
and Length of
Time Served(1) | | Principal Occupation(s) —
During the Past 5 Years |
| | | | | | | |
Robert Terris
5780 Powers Ferry Road NW
Atlanta, Georgia 30327
Age: 51 | | Senior Vice President | | May 2006–Present | | Senior Vice President, Voya Investments Distributor, LLC (April 2018–Present); Senior Vice President, Head of Investment Services, Voya Investments, LLC (April 2018–Present) and Voya Funds Services, LLC (March 2006–Present). Formerly, Senior Vice President, Head of Division Operations, Voya Investments, LLC (October 2015–April 2018). |
| | | | | | | |
Fred Bedoya
7337 East Doubletree Ranch Rd.
Suite 100
Scottsdale, Arizona 85258
Age: 49 | | Vice President
Treasurer | | September 2012 –Present | | Vice President, Voya Investments, LLC (October 2015–Present) and Voya Funds Services, LLC (July 2012–Present). |
| | | | | | | |
Maria M. Anderson
7337 East Doubletree Ranch Rd.
Suite 100
Scottsdale, Arizona 85258
Age: 63 | | Vice President | | September 2004–Present | | Vice President, Voya Investments, LLC (October 2015–Present) and Voya Funds Services, LLC (September 2004–Present). |
| | | | | | | |
Sara M. Donaldson
7337 East Doubletree Ranch Rd.
Suite 100
Scottsdale, Arizona 85258
Age: 62 | | Vice President | | September 2014–Present | | Vice President, Voya Investments, LLC (October 2015–Present). |
| | | | | | | |
Robyn L. Ichilov
7337 East Doubletree Ranch Rd.
Suite 100
Scottsdale, Arizona 85258
Age: 54 | | Vice President | | VIT: November 1999–Present
VVIT: October 2000–Present | | Vice President, Voya Funds Services, LLC (November 1995–Present) and Voya Investments, LLC (August 1997–Present). |
| | | | | | | |
Jason Kadavy
7337 East Doubletree Ranch Rd.
Suite 100
Scottsdale, Arizona 85258
Age: 45 | | Vice President | | September 2012–Present | | Vice President, Voya Investments, LLC (October 2015–Present) and Voya Funds Services, LLC (July 2007–Present). |
| | | | | | | |
Andrew K. Schlueter
7337 East Doubletree Ranch Rd.
Suite 100
Scottsdale, Arizona 85258
Age: 45 | | Vice President | | March 2018–Present | | Vice President, Voya Investments Distributor, LLC (April 2018–Present); Vice President, Voya Investments, LLC and Voya Funds Services, LLC (March 2018–Present); Vice President, Head of Mutual Fund Operations, Voya Investment Management (February 2018–Present). Formerly, Vice President, Voya Investment Management (March 2014–February 2018). |
| | | | | | | |
Craig Wheeler
7337 East Doubletree Ranch Rd.
Suite 100
Scottsdale, Arizona 85258
Age: 52 | | Vice President | | May 2013–Present | | Vice President—Director of Tax, Voya Investments, LLC (October 2015–Present). |
| | | | | | | |
Monia Piacenti
One Orange Way
Windsor, Connecticut 06095
Age: 45 | | Anti-Money Laundering Officer | | June 2018–Present | | Anti-Money Laundering Officer, Voya Investments Distributor, LLC, Voya Investment Management and Voya Investment Management Trust Co. (June 2018–Present); Compliance Consultant, Voya Financial, Inc. (January 2019–Present). Formerly, Senior Compliance Officer, Voya Investment Management (December 2009–December 2018). |
| | | | | | | |
Joanne F. Osberg
7337 East Doubletree Ranch Rd.
Suite 100
Scottsdale, Arizona 85258
Age: 40 | | Secretary | | September 2020–Present | | Vice President and Senior Counsel, Voya Investment Management — Mutual Fund Legal Department (September 2020–Present). Formerly, Vice President, Counsel, Voya Investment Management — Mutual Fund Legal Department (January 2013–September 2020). |
| | | | | | | |
Paul A. Caldarelli
7337 East Doubletree Ranch Rd.
Suite 100
Scottsdale, Arizona 85258
Age: 70 | | Assistant Secretary | | June 2010–Present | | Vice President and Senior Counsel, Voya Investment Management — Mutual Fund Legal Department (March 2010–Present). |
(1) | | The Officers hold office until the next annual meeting of the Board of Trustees and until their successors shall have been elected and qualified. |
60
ADVISORY AND SUB-ADVISORY CONTRACT APPROVAL DISCUSSION (UNAUDITED) BOARD CONSIDERATION AND APPROVAL OF INVESTMENT MANAGEMENT CONTRACTS, SUB-ADVISORY CONTRACTS, AND SUB-SUB-ADVISORY CONTRACTS
At a meeting held on November 18, 2021, the Boards of Trustees (“Board”) of Voya Investors Trust (“VIT”) and Voya Variable Insurance Trust (“VVIT,” and together with VIT, the “Trusts”), including a majority of the Board members who have no direct or indirect interest in the investment management, sub-advisory, and sub-sub-advisory contracts, and who are not “interested persons” of VY® BlackRock Inflation Protected Bond Portfolio (the “BlackRock Portfolio”), a series of VIT, and VY® BrandywineGLOBAL — Bond Portfolio (the “Brandywine Portfolio”), a series of VVIT (together, the “Portfolios”), as such term is defined under the Investment Company Act of 1940, as amended (the “Independent Trustees”), considered and approved the renewal of the investment management contracts (the “Management Contracts”) between Voya Investments, LLC (the “Manager”) and the Trusts, on behalf of the Portfolios; the sub-advisory contracts (the “Sub-Advisory Contracts”) with BlackRock Financial Management, Inc. and Brandywine Global Investment Management, LLC, the respective sub-advisers to each Portfolio (the “Sub-Advisers”); and the sub-sub-advisory contract (the “Sub-Sub-Advisory Contract,” and together with the Management Contracts and Sub-Advisory Contracts, the “Contracts”) with BlackRock International Limited, the sub-sub-adviser to the BlackRock Portfolio (the “Sub-Sub-Adviser”) for an additional one year period ending November 30, 2022.
In addition to the Board meeting on November 18, 2021, the Independent Trustees also held meetings outside the presence of representatives of the Manager, Sub-Advisers, or Sub-Advisers (collectively, such persons are referred to herein as “management”) on October 7-8, 2021, and November 16, 2021. At those meetings, the Board members reviewed and considered materials related to the proposed continuance of the Contracts that they had requested and believed to be relevant to the renewal of the Contracts in light of their own business judgment and the legal advice furnished to them by K&L Gates LLP, their independent legal counsel. The Board also considered information furnished to it throughout the year at meetings of the Board and its committees, including information regarding performance, expenses, and other relevant matters. While the Board considered the renewal of the management contracts, sub-advisory contracts, and sub-sub-advisory contracts for all of the applicable investment companies in the Voya family of funds at the same meetings, the Board considered each Voya fund’s investment management, sub-advisory, and sub-sub-advisory relationships separately.
The Board has established a Contracts Committee and two Investment Review Committees (the “IRCs”), each of which includes only Independent Trustees as members. The Contracts Committee meets several times throughout the year to provide oversight with respect to the management, sub-advisory, and sub-sub-advisory contracts approval and renewal process for the Voya funds, among other functions, and each IRC meets several times throughout the year with respect to each Voya fund (assigned to that IRC) to provide oversight regarding the investment performance of the sub-advisers and sub-sub-advisers, as well as the Manager’s role in monitoring the sub-advisers and sub-sub-advisers.
The Contracts Committee oversees, and annually recommends Board approval of updates to, a methodology guide for the Voya funds (“Methodology Guide”), which sets out a framework pursuant to which the Independent Trustees request, and management provides, certain information that the Independent Trustees deem to be important or potentially relevant. The Independent Trustees retain the services of an independent consultant with experience in the mutual fund industry to assist the Contracts Committee in developing and recommending to the Board: (1) a selected peer group of investment companies for each Portfolio (“Selected Peer Group”) based on that Portfolio’s particular attributes, such as fund type and size, fund category (as determined by Morningstar, Inc., an independent provider of mutual fund data (“Morningstar”)), sales channels and structure and the Portfolio share class being compared to the Selected Peer Group; and (2) updates to the Methodology Guide with respect to the content and format of various data prepared in connection with the renewal process, including, but not limited to, investment performance, fee structure, and expense information. In addition, the Independent Trustees periodically have retained an independent firm to test and verify the accuracy of certain information presented to the Board for a representative sample of the Voya funds.
The Manager, the Sub-Advisers, or the Sub-Sub-Adviser may not have been able to, or opted not to, provide information in response to certain information requests, in which case the Board conducted its evaluation based on the information that was provided. In such cases, the Board determined that the omission of any such information was not material to its considerations. Additionally, the Board considered the impact of significant market volatility that occurred during and after the period for which information was requested in conducting its evaluation of the Manager, the Sub-Advisers, and the Sub-Sub-Adviser.
Provided below is an overview of certain material factors that the Board considered at its meetings regarding the renewal of the Contracts and the compensation to be paid
61
ADVISORY AND SUB-ADVISORY CONTRACT APPROVAL DISCUSSION (UNAUDITED) (CONTINUED)
thereunder. The Board members did not identify any particular information or factor that was most relevant to its consideration, and each Board member may have accorded different weight to the various factors in reaching his or her conclusions with respect to each Portfolio’s investment management, sub-advisory and, as applicable, sub-sub-advisory arrangements.
Nature, Extent and Quality of Services
The Manager oversees, subject to the authority of the Board, and is responsible for the provision of, all investment advisory and portfolio management services for the Portfolios, but may delegate certain of these responsibilities to one or more sub-advisers and their sub-sub-advisers, if any. In addition, the Manager provides administrative services reasonably necessary for the operation of the Portfolios as set forth in the Management Contracts, including oversight of the Portfolios’ operations and risk management and the oversight of their various other service providers.
The Board considered the “manager-of-managers” structure of the Voya funds that has been developed by the Manager pursuant to which the Manager selects, subject to the Board’s approval, sub-advisers and their sub-sub-advisers, if any, to provide day-to-day management services to all or a portion of each Voya fund. The Board recognized that the Manager is responsible for monitoring the Sub-Advisers’ and Sub-Sub-Adviser’s investment programs, performance, developments, ongoing operations, and compliance with applicable regulations and investment policies and restrictions with respect to the Portfolios under this manager-of-managers arrangement. The Board also considered the techniques and resources that the Manager has developed to provide this ongoing due diligence and oversight with respect to the sub-advisers and sub-sub-advisers and to recommend appropriate changes in investment strategies, sub-advisers, sub-sub-advisers, or allocation among sub-advisers in an effort to improve a Voya fund’s performance. In connection with the Manager’s performance of these duties, the Board considered that the Manager has developed an oversight process formulated by its Manager Research & Selection Group that reviews, among other matters, performance data, each Sub-Adviser’s and the Sub-Sub-Adviser’s management team, portfolio data and attribution analysis related to each Sub-Adviser and the Sub-Sub-Adviser through various means, including, but not limited to, in-person meetings, on-site or virtual visits, and telephonic meetings with each Sub-Adviser and the Sub-Sub-Adviser.
Further, the Board considered periodic compliance reports it receives from the Trusts’ Chief Compliance Officer evaluating whether the regulatory compliance systems and procedures of the Manager, Sub-Advisers, and Sub-Sub-
Adviser are reasonably designed to ensure compliance with the federal securities laws and whether the investment policies and restrictions for each Portfolio are consistently complied with, and other periodic reports covering related matters.
The Board considered the portfolio management team assigned by the Sub-Advisers and Sub-Sub-Adviser to the Portfolios and the level of resources committed to the Portfolios (and other relevant funds in the Voya funds) by the Manager, Sub-Advisers, and Sub-Sub-Adviser, and whether those resources are sufficient to provide high-quality services to the Portfolios.
Based on their deliberations and the materials presented to them, the Board concluded that the nature, extent and quality of the overall services provided by the Manager, each Sub-Adviser, and the Sub-Sub-Adviser under the Contracts were appropriate.
Portfolio Performance
In assessing the investment management, sub-advisory, and sub-sub-advisory relationships, the Board placed emphasis on the investment returns of each Portfolio, including its investment performance over certain time periods compared to the Portfolio’s Morningstar category and primary benchmark, a broad-based securities market index identified in the Portfolio’s prospectus. The Board also considered information from the Manager Research & Selection Group and received reports summarizing a separate analysis of each Portfolio’s performance and risk, including risk-adjusted investment return information, from the Trusts’ Chief Investment Risk Officer.
Economies of Scale
When evaluating the reasonableness of the management fee schedules, the Board considered whether economies of scale have been or likely will be realized by the Manager, Sub-Advisers, and Sub-Sub-Adviser as a Portfolio grows larger and the extent to which any such economies are shared with the Portfolio. In this regard, the Board noted any breakpoints in the management fee schedules that will result in a lower management fee rate when a Portfolio achieves sufficient asset levels to receive a breakpoint discount. The Board also considered that, in addition to the management fee breakpoints, the Portfolios have fee waiver and expense reimbursement arrangements. The Board considered the extent to which economies of scale realized by the Manager, Sub-Advisers, or Sub-Sub-Adviser could be shared with each Portfolio through such fee waivers, expense reimbursements or other expense reductions. In evaluating these matters, the Board also considered periodic management reports, Selected Peer Group comparisons, and industry information regarding economies of scale. In the case of sub-advisory or sub-sub-advisory fees, the Board considered that breakpoints, if
62
ADVISORY AND SUB-ADVISORY CONTRACT APPROVAL DISCUSSION (UNAUDITED) (CONTINUED)
any, would inure to the benefit of the Manager or relevant Sub-Adviser, respectively.
Information Regarding Services, Performance, and Fee Schedules Offered to Other Clients
The Board considered comparative information regarding the nature of services, performance, and fee schedules offered by the Manager, Sub-Advisers, and Sub-Sub-Adviser to other clients with similar investment objectives, if applicable, including other registered investment companies and relevant institutional accounts. When the fee schedules offered to or the performance of such other clients differed materially from a Portfolio, the Board took into account the underlying rationale provided by the Manager, Sub-Advisers, or Sub-Sub-Adviser, as applicable, for these differences. For the non-Voya-affiliated Sub-Advisers and Sub-Sub-Adviser, the Board viewed the information related to any material differences in the fee schedules as not being a key factor in its deliberations because of the arm’s-length nature of negotiations between the Manager and non-Voya-affiliated Sub-Advisers and the Sub-Sub-Adviser with respect to sub-advisory and sub-sub-advisory fee schedules, that the Manager is responsible for paying the fees of the Sub-Advisers and that the applicable Sub-Adviser is responsible for paying the fees of the Sub-Sub-Adviser.
Fee Schedules, Profitability, and Fall-out Benefits
The Board reviewed and considered the contractual management fee schedule and net management fee rate payable by each Portfolio to the Manager compared to the Portfolio’s Selected Peer Group. The Board also considered the compensation payable by the Manager to each Sub-Adviser for sub-advisory services for each Portfolio, including the portion of the contractual and net management fee rates that are paid to each Sub-Adviser, as compared to the compensation paid to the Manager, and the contractual sub-sub-advisory fee schedule payable to the Sub-Sub-Adviser by the relevant Sub-Adviser. In this regard, the Board considered that the Sub-Sub-Adviser is compensated by its relevant Sub-Adviser and not the Manager. In addition, the Board considered any fee waivers, expense limitations, and recoupment arrangements that apply to the fees payable by the Portfolios, including whether the Manager intends to propose any changes thereto. For each Portfolio, the Board separately determined that the fees payable to the Manager and the fee schedule payable to each Sub-Adviser and Sub-Sub-Adviser are reasonable for the services that each performs, which were considered in light of the nature, extent and quality of the services that each has performed and is expected to perform.
For each Portfolio, the Board considered information on revenues, costs and profits or losses realized by the
Manager related to its services to the Portfolio. In analyzing the profitability of the Manager and its affiliates in connection with services they render to a Portfolio, the Board took into account the sub-advisory fee rate payable by the Manager to each Sub-Adviser. The Board also considered the profitability of the Manager attributable to servicing each Portfolio both with and without taking into account the profitability of the distributor of the Portfolios and any revenue sharing payments made by the Manager and both before and after giving effect to any expenses incurred by the Manager in making payments to affiliated insurance companies. The Board did not request profitability data from the Sub-Advisers and the Sub-Sub-Adviser, which are not affiliated with the Manager because the Board did not view this data as a key factor to its deliberations given the arm’s-length nature of the relationship between the Manager and these non-Voya-affiliated Sub-Advisers and Sub-Sub-Adviser with respect to the negotiation of sub-advisory and sub-sub-advisory fee schedules. In addition, the Board noted that non-Voya-affiliated sub-advisers or sub-sub-advisers may not account for their profits on an account-by-account basis and those that do often employ different methodologies in connection with these calculations.
Although the Methodology Guide establishes a framework for profit calculation, the Board recognized that there is no uniform methodology within the asset management industry for determining profitability for this purpose. The Board also recognized that the use of different reasonable methodologies can give rise to dramatically different reported profit and loss results with respect to the Manager, as well as other industry participants with whom the profits of the Manager could be compared. In addition, the Board recognized that management’s calculations regarding its costs incurred in establishing the infrastructure necessary for the Portfolios’ operations may not be fully reflected in the expenses allocated to each Portfolio in determining profitability. The Board also recognized that the information presented may not portray all of the costs borne by the Manager or reflect all of the risks associated with offering and managing a mutual fund complex in the current regulatory and market environment, including entrepreneurial, regulatory, legal and operational risks.
The Board also considered that the Manager is entitled to earn a reasonable level of profits for the services that it provides to the Portfolios. The Board also considered information regarding the potential fall-out benefits to the Manager, Sub-Advisers, and Sub-Sub-Adviser and their respective affiliates from their association with the Portfolios, including their ability to engage in soft-dollar transactions on behalf of the Portfolios. Following its reviews, the Board determined that the Manager’s profitability with respect to its services to the Portfolios and
63
ADVISORY AND SUB-ADVISORY CONTRACT APPROVAL DISCUSSION (UNAUDITED) (CONTINUED)
the Manager’s, Sub-Advisers’ and Sub-Sub-Adviser’s potential fall-out benefits were not unreasonable.
Portfolio-by-Portfolio Analysis
Set forth below are certain of the specific factors that the Board considered at its October 7-8, 2021, November 16, 2021, and/or November 18, 2021 meetings in relation to approving each Portfolio’s Contracts and the conclusions reached by the Board. These specific factors are in addition to those considerations discussed above. In each case, the Portfolio’s performance was compared to its Morningstar category, as well as its primary benchmark. The performance data provided to the Board primarily was for various periods ended March 31, 2021. In addition, the Board also considered at its October 7-8, 2021, November 16, 2021, and/or November 18, 2021 meetings certain additional data regarding each Portfolio’s more recent performance, asset levels and asset flows. Each Portfolio’s management fee rate and expense ratio were compared to the management fee rates and expense ratios of the funds in its Selected Peer Group. With respect to the quintile rankings noted below, the first quintile represents the range of funds with the highest performance or the lowest management fee rate or expense ratio, as applicable, and the fifth quintile represents the range of funds with the lowest performance or the highest management fee rate or expense ratio, as applicable.
VY® BlackRock Inflation Protected Bond Portfolio
In considering whether to approve the renewal of the Contracts for VY® BlackRock Inflation Protected Bond Portfolio, the Board considered that, based on performance data for the periods ended March 31, 2021: (1) the Portfolio is ranked in the second quintile of its Morningstar category for the one-year period, the third quintile for the three-year, five-year and ten-year periods, and the fourth quintile for the year-to-date period; and (2) the Portfolio underperformed its primary benchmark for all periods presented, with the exception of the one-year period, during which it outperformed. In analyzing this performance data, the Board took into account Management’s representations regarding the competitiveness of the Portfolio’s performance during certain periods.
In considering the fees payable under the Contracts for the Portfolio, the Board took into account the factors described above and also considered: (1) the economies of scale benefits to the Portfolio and its shareholders from breakpoint discounts applicable to the Portfolio’s management fee rate, which result in lower fees at higher asset levels; and (2) the pricing structure (including the net expense ratio to be borne by shareholders) of the Portfolio, as compared to its Selected Peer Group, including that: (a) the net management fee rate for the Portfolio is ranked in
the third quintile of net management fee rates of the funds in its Selected Peer Group; (b) the contractual management fee rate for the Portfolio is ranked in the third quintile of contractual management fee rates of the funds in its Selected Peer Group; and (c) the net expense ratio for the Portfolio is ranked in the third quintile of net expense ratios of the funds in its Selected Peer Group.
VY® BrandywineGLOBAL — Bond Portfolio
In considering whether to approve the renewal of the Contracts for VY® BrandywineGLOBAL — Bond Portfolio, the Board considered that, based on performance data for the periods ended March 31, 2021: (1) the Portfolio is ranked in the first quintile of its Morningstar category for all periods presented; and (2) the Portfolio outperformed its primary benchmark for all periods presented.
In considering the fees payable under the Contracts for the Portfolio, the Board took into account the factors described above and also considered: (1) the fairness of the compensation under a Management Contract with a breakpoint fee schedule where the asset level necessary to achieve a breakpoint discount had not been reached by the Portfolio; and (2) the pricing structure (including the net expense ratio to be borne by shareholders) of the Portfolio, as compared to its Selected Peer Group, including that: (a) the net management fee rate for the Portfolio is ranked in the fourth quintile of net management fee rates of the funds in its Selected Peer Group; (b) the contractual management fee rate for the Portfolio is ranked in the third quintile of contractual management fee rates of the funds in its Selected Peer Group; and (c) the net expense ratio for the Portfolio is ranked in the second quintile of net expense ratios of the funds in its Selected Peer Group.
Board Conclusions
After its deliberation, the Board concluded that, in its business judgment, the terms of the Contracts are fair and reasonable to each Portfolio and that approval of the continuation of the Contracts is in the best interests of each Portfolio and its shareholders. In doing so, the Board reviewed all factors it considered to be material, including those discussed above. Within the context of its overall conclusions regarding the Contracts, and based on the information provided and management’s related representations, the Board concluded that it was satisfied with management’s responses relating to each Portfolio’s investment performance and the fees payable under the Contracts. During this renewal process, different Board members may have given different weight to different individual factors and related conclusions. Based on these conclusions and other factors, the Board voted to renew the Contracts for each Portfolio for the year ending November 30, 2022.
64
(THIS PAGE INTENTIONALLY LEFT BLANK)
(THIS PAGE INTENTIONALLY LEFT BLANK)
(THIS PAGE INTENTIONALLY LEFT BLANK)
Investment Adviser
Voya Investments, LLC
7337 East Doubletree Ranch Road, Suite 100
Scottsdale, Arizona 85258
Distributor
Voya Investments Distributor, LLC
7337 East Doubletree Ranch Road, Suite 100
Scottsdale, Arizona 85258
Transfer Agent
BNY Mellon Investment Servicing (U.S.) Inc.
301 Bellevue Parkway
Wilmington, Delaware 19809
Independent Registered Public Accounting Firm
Ernst & Young LLP
200 Clarendon Street
Boston, Massachusetts 02116
Custodian
The Bank of New York Mellon
225 Liberty Street
New York, New York 10286
Legal Counsel
Ropes & Gray LLP
Prudential Tower
800 Boylston Street
Boston, Massachusetts 02199
Before investing, carefully consider the investment objectives, risks, charges and expenses of the variable annuity contract or variable life insurance policy and the underlying variable investment options. This and other information is contained in the prospectus for the variable annuity contract or variable life insurance policy and the underlying variable investment options. Obtain these prospectuses from your agent/registered representative and read them carefully before investing.
| RETIREMENT | INVESTMENTS | INSURANCE | |
| |
| voyainvestments.com | VPAR-VIT3AIS (1221-022422) |
Item 2. Code of Ethics.
As of the end of the period covered by this report, Registrant had adopted a code of ethics, as defined in Item 2 of Form N-CSR, that applies to the Registrant’s principal executive officer and principal financial officer. There were no amendments to the Code during the period covered by the report. The Registrant did not grant any waivers, including implicit waivers, from any provisions of the Code during the period covered by this report. The code of ethics is filed herewith pursuant to Item 10(a)(1), Ex-99.CODE ETH.
Item 3. Audit Committee Financial Expert.
The Board of Trustees has determined that Colleen D. Baldwin, Martin J. Gavin, and Joseph E. Obermeyer are audit committee financial experts, as defined in Item 3 of Form N-CSR. Ms. Baldwin, Mr. Gavin, and Mr. Obermeyer are “independent” for purposes of Item 3 of Form N-CSR.
Item 4. Principal Accountant Fees and Services.
Below are the amount of fees that Ernst & Young LLP (“EY”), the Fund’s current Independent Registered Public Accounting Firm, billed to the Fund during the Fund’s fiscal year ended December 31, 2021 and December 31, 2020 and the amount of fees that the previous independent public accounting firm billed to the Fund during the Fund’s fiscal year ended December 31, 2021 and December 31, 2020.
| (a) | Audit Fees: The aggregate fees billed for each of the last two fiscal years for professional services rendered by EY, the principal accountant for the audit of the registrant’s annual financial statements or services that are normally provided by the accountant in connection with statutory and regulatory filings or engagements for those fiscal years were $29,517 for the year ended December 31, 2021 and $29,628 for the year ended December 31, 2020. |
| (b) | Audit-Related Fees: The aggregate fees billed in each of the last two fiscal years for assurance and related services by EY that are reasonably related to the performance of the audit of each respective registrant’s financial statements and are not reported under paragraph (a) of this Item were $0 for the year ended December 31, 2021 and $0 for the year ended December 31, 2020. |
| (c) | Tax Fees(1): The aggregate fees billed in each of the last two fiscal years for professional services rendered by EY for tax compliance, tax advice, and tax planning were $5,300 for the year ended December 31, 2021 and $1,325 for the year ended December 31, 2020. Such services included review of excise distribution calculations (if applicable), preparation of the Funds’ federal, state, and excise tax returns, tax services related to mergers and routine consulting. |
| (d) | All Other Fees: The aggregate fees billed in each of the last two fiscal years for products and services provided by EY, other than the services reported in paragraphs (a) through (c) of this Item were $0 for the year ended December 31, 2021 and $0 for the year ended December 31, 2020. |
(1) For the fiscal years ended December 31, 2021, and December 31, 2020, the previous independent public accounting firm billed $0 and $22, respectively, for Tax Fees.
| (e)(1) | Audit Committee Pre-Approval Policies and Procedures |
Appendix A
AUDIT AND NON-AUDIT SERVICES
PRE-APPROVAL POLICY
I. Statement of Principles
Under the Sarbanes-Oxley Act of 2002 (the “Act”), the Audit Committee of the Board of Directors or Trustees (the “Committee”) of the Voya funds (each a “Fund,” collectively, the “Funds”) set out on Exhibit A to this Audit and Non-Audit Services Pre-Approval Policy (“Policy”) is responsible for the oversight of the work of the Funds’ independent auditors. As part of its responsibilities, the Committee must pre-approve the audit and non-audit services performed by the auditors in order to assure that the provision of these services does not impair the auditors’ independence from the Funds. The Committee has adopted, and the Board has ratified, this Policy, which sets out the procedures and conditions under which the services of the independent auditors may be pre-approved.
Under Securities and Exchange Commission (“SEC”) rules promulgated in accordance with the Act, the Funds may establish two different approaches to pre-approving audit and non-audit services. The Committee may approve services without consideration of specific case-by-case services (“general pre-approval”) or it may pre-approve specific services (“specific pre-approval”). The Committee believes that the combination of these approaches contemplated in this Policy results in an effective and efficient method for pre-approving audit and non-audit services to be performed by the Funds’ independent auditors. Under this Policy, services that are not of a type that may receive general pre-approval require specific pre-approval by the Committee. Any proposed services that exceed pre-approved cost levels or budgeted amounts will also require the Committee’s specific pre-approval.
For both types of approval, the Committee considers whether the subject services are consistent with the SEC’s rules on auditor independence and that such services are compatible with maintaining the auditors independence. The Committee also considers whether a particular audit firm is in the best position to provide effective and efficient services to the Funds. Reasons that the auditors are in the best position include the auditors’ familiarity with the Funds’ business, personnel, culture, accounting systems, risk profile, and other factors, and whether the services will enhance the Funds’ ability to manage and control risk or improve audit quality. Such factors will be considered as a whole, with no one factor being determinative.
The appendices attached to this Policy describe the audit, audit-related, tax-related, and other services that have the Committee’s general pre-approval. For any service that has been approved through general pre-approval, the general pre-approval will remain in place for a period 12 months from the date of pre-approval, unless the Committee determines that a different period is appropriate. The Committee will annually review and pre-approve the services that may be provided by the independent auditors without specific pre-approval. The Committee will revise the list of services subject to general pre-approval as appropriate. This Policy does not serve as a delegation to Fund management of the Committee’s duty to pre-approve services performed by the Funds’ independent auditors.
II. Audit Services
The annual audit services engagement terms and fees are subject to the Committee’s specific pre-approval. Audit services are those services that are normally provided by auditors in connection with statutory and regulatory filings or engagements or those that generally only independent auditors can reasonably provide. They include the Funds’ annual financial statement audit and procedures that the independent auditors must perform in order to form an opinion on the Funds’ financial statements (e.g., information systems and procedural reviews and testing). The Committee will monitor the audit services engagement and approve any changes in terms, conditions or fees deemed by the Committee to be necessary or appropriate.
The Committee may grant general pre-approval to other audit services, such as statutory audits and services associated with SEC registration statements, periodic reports and other documents filed with the SEC or issued in connection with securities offerings.
The Committee has pre-approved the audit services listed on Appendix A. The Committee must specifically approve all audit services not listed on Appendix A.
III. Audit-related Services
Audit-related services are assurance and related services that are reasonably related to the performance of the audit or the review of the Funds’ financial statements or are traditionally performed by the independent auditors. The Committee believes that the provision of audit-related services will not impair the independent auditors’ independence, and therefore may grant pre-approval to audit-related services. Audit-related services include accounting consultations related to accounting, financial reporting or disclosure matters not classified as “audit services;” assistance with understanding and implementing new accounting and financial reporting guidance from rulemaking authorities; agreed-upon or expanded audit procedures relating to accounting and/or billing records required to respond to or comply with financial, accounting or regulatory reporting matters; and assistance with internal control reporting requirements under Form N-CEN or Form N-CSR.
The Committee has pre-approved the audit-related services listed on Appendix B. The Committee must specifically approve all audit-related services not listed on Appendix B.
IV. Tax Services
The Committee believes the independent auditors can provide tax services to the Funds, including tax compliance, tax planning, and tax advice, without compromising the auditors’ independence. Therefore, the Committee may grant general pre-approval with respect to tax services historically provided by the Funds’ independent auditors that do not, in the Committee’s view, impair auditor independence and that are consistent with the SEC’s rules on auditor independence.
The Committee will not grant pre-approval if the independent auditors initially recommends a transaction the sole business purpose of which is tax avoidance and the tax treatment of which may not be supported in the Internal Revenue Code and related regulations. The Committee may consult outside counsel to determine that tax planning and reporting positions are consistent with this Policy.
The Committee has pre-approved the tax-related services listed on Appendix C. The Committee must specifically approve all tax-related services not listed on Appendix C.
V. Other Services
The Committee believes it may grant approval of non-audit services that are permissible services for independent auditors to a Fund. The Committee has determined to grant general pre-approval to other services that it believes are routine and recurring, do not impair auditor independence, and are consistent with SEC rules on auditor independence.
The Committee has pre-approved the non-audit services listed on Appendix D. The Committee must specifically approve all non-audit services not listed on Appendix D.
A list of the SEC’s prohibited non-audit services is attached to this Policy as Appendix E. The SEC’s rules and relevant guidance should be consulted to determine the precise definitions of these impermissible services and the applicability of exceptions to certain of the SEC’s prohibitions.
VI. Pre-approval of Fee levels and Budgeted Amounts
The Committee will annually establish pre-approval fee levels or budgeted amounts for audit, audit-related, tax and non-audit services to be provided to the Funds by the independent auditors. Any proposed services exceeding these levels or amounts require the Committee’s specific pre-approval. The Committee considers fees for audit and non-audit services when deciding whether to pre-approve services. The Committee may determine, for a pre-approval period of 12 months, the appropriate ratio between the total amount of fees for the Fund’s audit, audit-related, and tax services (including fees for services provided to Fund affiliates that are subject to pre-approval), and the total amount of fees for certain permissible non-audit services for the Fund classified as other services (including any such services provided to Fund affiliates that are subject to pre-approval).
VII. Procedures
Requests or applications for services to be provided by the independent auditors will be submitted to management. If management determines that the services do not fall within those services generally pre-approved by the Committee and set out in the appendices to these procedures, management will submit the services to the Committee or its delagee. Any such submission will include a detailed description of the services to be rendered. Notwithstanding this paragraph, the Committee will, on a quarterly basis, receive from the independent auditors a list of services provided for the previous calendar quarter on a cumulative basis by the auditors during the Pre-Approval Period.
VIII. Delegation
The Committee may delegate pre-approval authority to one or more of the Committee’s members. Any member or members to whom such pre-approval authority is delegated must report any pre-approval decisions, including any pre-approved services, to the Committee at its next scheduled meeting. The Committee will identify any member to whom pre-approval authority is delegated in writing. The member will retain such authority for a period of 12 months from the date of pre-approval unless the Committee determines that a different period is appropriate. The period of delegated authority may be terminated by the Committee or at the option of the member.
IX. Additional Requirements
The Committee will take any measures the Committee deems necessary or appropriate to oversee the work of the independent auditors and to assure the auditors’ independence from the Funds. This may include reviewing a formal written statement from the independent auditors delineating all relationships between the auditors and the Funds, consistent with Independence Standards Board No. 1, and discussing with the auditors their methods and procedures for ensuring independence.
Last Approved: November 19, 2020
Appendix A
Pre-Approved Audit Services for the Pre-Approval Period January 1, 2021 through December 31, 2021
| Service |
| | The Fund(s) | Fee Range |
| Statutory audits or financial audits (including tax services associated with audit services) | √ | As presented to Audit Committee1 |
| Services associated with SEC registration statements, periodic reports and other documents filed with the SEC or other documents issued in connection with securities offerings (e.g., consents), and assistance in responding to SEC comment letters. | √ | Not to exceed $9,750 per filing |
| Consultations by Fund management with respect to accounting or disclosure treatment of transactions or events and/or the actual or potential effect of final or proposed rules, standards or interpretations by the SEC, Financial Accounting Standards Board, or other regulatory or standard setting bodies. | √ | Not to exceed $8,000 during the Pre-Approval Period |
| Seed capital audit and related review and issuance of consent on the N-2 registration statement | √ | Not to exceed $14,750 per audit |
| Audit of summary portfolio of investments | √ | Not to exceed $750 per fund |
| 1 | For new Funds launched during the Pre-Approval Period, the fee ranges pre-approved will be the same as those for existing Funds, pro-rated in accordance with inception dates as provided in the auditors’ Proposal or any Engagement Letter covering the period at issue. Fees in the Engagement Letter will be controlling. |
Appendix B
Pre-Approved Audit-Related Services for the Pre-Approval Period January 1, 2021 through December 31, 2021
| Service |
| | The Fund(s) | Fund Affiliates | Fee Range |
| Services related to Fund mergers (Excludes tax services - See Appendix C for tax services associated with Fund mergers) | √ | √ | Not to exceed $10,000 per merger |
| Consultations by Fund management with respect to accounting or disclosure treatment of transactions or events and/or the actual or potential effect of final or proposed rules, standards or interpretations by the SEC, Financial Accounting Standards Board, or other regulatory or standard setting bodies. [Note: Under SEC rules some consultations may be “audit” services and others may be “audit-related” services.] | √ | | Not to exceed $5,000 per occurrence during the Pre-Approval Period |
| Review of the Funds’ semi-annual and quarterly financial statements | √ | | Not to exceed $2,700 per set of financial statements per fund |
| Reports to regulatory or government agencies related to the annual engagement | √ | | Up to $5,000 per occurrence during the Pre-Approval Period |
| Regulatory compliance assistance | √ | √ | Not to exceed $5,000 per quarter |
| Training courses | | √ | Not to exceed $5,000 per course |
| | | | |
Appendix C
Pre-Approved Tax Services for the Pre-Approval Period January 1, 2021 through December 31, 2021
| Service |
| | The Fund(s) | Fund Affiliates | Fee Range |
| Preparation of federal and state income tax returns and federal excise tax returns for the Funds including assistance and review with excise tax distributions | √ | | As presented to Audit Committee2 |
| Review of IRC Sections 851(b) and 817(h) diversification testing on a real-time basis | √ | | As presented to Audit Committee2 |
| Tax assistance and advice regarding statutory, regulatory or administrative developments | √ | √ | Not to exceed $5,000 for the Funds or for the Funds’ investment adviser during the Pre-Approval Period |
| 2 | For new Funds launched during the Pre-Approval Period, the fee ranges pre-approved will be the same as those for existing Funds, pro-rated in accordance with inception dates as provided in the auditors’ Proposal or any Engagement Letter covering the period at issue. Fees in the Engagement Letter will be controlling. |
Appendix C, continued
Pre-Approved Tax Services for the Pre-Approval Period January 1, 2021 through December 31, 2021
| Service |
| | The Fund(s) | Fund Affiliates | Fee Range |
| Tax and technology training sessions | | √ | Not to exceed $5,000 per course during the Pre-Approval Period |
| Tax services associated with Fund mergers | √ | √ | Not to exceed $4,000 per fund per merger during the Pre-Approval Period |
| Ernst & Young LLP Passive Foreign Investment Company (“PFIC”) Analyzer | | √ | Not to exceed $95,000 during the Pre-Approval Period |
| Other tax-related assistance and consultation, including, without limitation, assistance in evaluating derivative financial instruments and international tax issues, qualification and distribution issues, year-end reporting for 1099’s, tax compliance services in foreign jurisdictions and similar routine tax consultations as requested. | √ | | Not to exceed $300,000 during the Pre-Approval Period |
Appendix D
Pre-Approved Other Services for the Pre-Approval Period January 1, 2021 through December 31, 2021
| Service |
| | The Fund(s) | Fund Affiliates | Fee Range |
| Agreed-upon procedures for Class B share 12b-1 programs | | √ | Not to exceed $60,000 during the Pre-Approval Period |
Security counts performed pursuant to Rule 17f-2 of the 1940 Act (i.e., counts for Funds holding securities with affiliated sub-custodians) Cost to be borne 50% by the Funds and 50% by Voya Investments, LLC. | √ | √ | Not to exceed $5,700 per Fund during the Pre-Approval Period |
| Agreed upon procedures for 15 (c) FACT Books | √ | | Not to exceed $50,000 during the Pre-Approval Period |
Appendix E
Prohibited Non-Audit Services
Dated: January 1, 2021 to December 31, 2021
| ● | Bookkeeping or other services related to the accounting records or financial statements of the Funds |
| ● | Financial information systems design and implementation |
| ● | Appraisal or valuation services, fairness opinions, or contribution-in-kind reports |
| ● | Internal audit outsourcing services |
| ● | Broker-dealer, investment adviser, or investment banking services |
| ● | Expert services unrelated to the audit |
| ● | Any other service that the Public Company Accounting Oversight Board determines, by regulation, is impermissible |
EXHIBIT A
VOYA ASIA PACIFIC HIGH DIVIDEND EQUITY INCOME FUND
VOYA BALANCED PORTFOLIO, INC.
VOYA EMERGING MARKETS HIGH DIVIDEND EQUITY FUND
VOYA EQUITY TRUST
VOYA FUNDS TRUST
VOYA GLOBAL ADVANTAGE AND PREMIUM OPPORTUNITY FUND
VOYA GLOBAL EQUITY DIVIDEND AND PREMIUM OPPORTUNITY FUND
VOYA INFRASTRUCTURE, INDUSTRIALS, AND MATERIALS FUND
VOYA INTERMEDIATE BOND PORTFOLIO
VOYA INVESTORS TRUST
VOYA GOVERNMENT MONEY MARKET PORTFOLIO
VOYA MUTUAL FUNDS
VOYA PARTNERS, INC.
VOYA SENIOR INCOME FUND
VOYA SEPARATE PORTFOLIOS TRUST
VOYA STRATEGIC ALLOCATIONS PORTFOLIOS, INC.
VOYA VARIABLE FUNDS
VOYA VARIABLE INSURANCE TRUST
VOYA VARIABLE PORTFOLIOS INC.
VOYA VARIABLE PRODUCTS TRUST
| (e)(2) | Percentage of services referred to in 4(b) – (4)(d) that were approved by the audit committee |
| | |
| | 100% of the services were approved by the audit committee. |
| (f) | Percentage of hours expended attributable to work performed by other than full time employees of EY if greater than 50% |
| | |
| | Not applicable. |
| (g) | Non-Audit Fees: The following table presents (i) the aggregate non-audit fees (i.e., fees for audit-related, tax, and other services) billed to each Registrant by the independent registered public accounting firm for each Registrant’s fiscal years ended December 31, 2021 and December 31, 2020; and (ii) the aggregate non-audit fees billed to the investment adviser, or any of its affiliates that provide ongoing services to the registrant, by the independent registered public accounting firm for the same time periods. |
| Registrant/Investment Adviser | | 2021(1) | | | 2020(1) | |
| Voya Variable Insurance Trust | | $ | 5,300 | | | $ | 1,325 | |
| Voya Investments, LLC (2) | | $ | 13,583,983 | | | $ | 14,804,511 | |
(1) For the years ended December 31, 2021 and December 31, 2020, the previous independent public accounting firm billed the Registrant $0 and $22, respectively, for Non-Audit Fees.
(2) Each Registrant’s investment adviser and any of its affiliates, which are subsidiaries of Voya Financial, Inc.
| (h) | Principal Accountants Independence: The Registrant’s Audit committee has considered whether the provision of non-audit services that were rendered to the registrant’s investment adviser and any entity controlling, controlled by, or under common control with the investment adviser that provides ongoing services to the registrant that were not pre-approved pursuant to Rule 2-01(c)(7)(ii) of Regulation S-X is compatible with maintaining EY’s independence. |
Item 5. Audit Committee of Listed Registrants.
Not applicable.
Item 6. Schedule of Investments.
Schedule is included as part of the report to shareholders filed under Item 1 of this Form.
Item 7. Disclosure of Proxy Voting Policies and Procedures for Closed-End Management Investment Companies.
Not applicable.
Item 8. Portfolio Managers of Closed-End Management Investment Companies.
Not applicable.
Item 9. Purchases of Equity Securities by Closed-End Management Investment Company and Affiliated Purchasers.
Not applicable.
Item 10. Submission of Matters to a Vote of Security Holders.
Not applicable.
Item 11. Controls and Procedures.
| (a) | Based on our evaluation conducted within 90 days of the filing date, hereof, the design and operation of the registrant’s disclosure controls and procedures are effective to ensure that material information relating to the registrant is made known to the certifying officers by others within the appropriate entities, particularly during the period in which Forms N-CSR are being prepared, and the registrant’s disclosure controls and procedures allow timely preparation and review of the information for the registrant’s Form N-CSR and the officer certifications of such Form N-CSR. |
| (b) | There were no significant changes in the registrant’s internal controls that occurred during the second fiscal quarter of the period covered by this report that has materially affected, or is reasonably likely to materially affect, the registrant’s internal control over financial reporting. |
Item 12. Disclosure of Securities Lending Activities for Closed-End Management Investment Companies.
Not applicable.
Item 13. Exhibits.
SIGNATURES
Pursuant to the requirements of the Securities Exchange Act of 1934 and the Investment Company Act of 1940, the registrant has duly caused this report to be signed on its behalf by the undersigned, thereunto duly authorized.
(Registrant): Voya Variable Insurance Trust
| By | /s/ Michael Bell | |
| | Michael Bell | |
| | Chief Executive Officer | |
Date: March 4, 2022
Pursuant to the requirements of the Securities Exchange Act of 1934 and the Investment Company Act of 1940, this report has been signed below by the following persons on behalf of the registrant and in the capacities and on the dates indicated.
| By | /s/ Michael Bell | |
| | Michael Bell | |
| | Chief Executive Officer | |
Date: March 4, 2022
| By | /s/ Todd Modic | |
| | Todd Modic | |
| | Senior Vice President and Chief Financial Officer | |
Date: March 4, 2022