
Annual Report
December 31, 2023
Voya Investors Trust
| g | VY® BlackRock Inflation Protected Bond Portfolio
Classes ADV, I and S |
Voya Variable Insurance Trust
| g | VY® BrandywineGLOBAL – Bond Portfolio |
Effective January 24, 2023, the U.S. Securities and Exchange Commission adopted rule and form amendments to require mutual funds to transmit concise and visually engaging streamlined annual and semi-annual reports to shareholders that highlight key information deemed important for investors to assess and monitor their fund investments. Other information, including financial statements, will no longer appear in the funds’ streamlined shareholder reports but must be available online, delivered free of charge upon request, and filed on a semi-annual basis on Form N-CSR. The rule and form amendments have a compliance date of July 24, 2024.
This report is submitted for general information to shareholders of the Voya mutual funds. It is not authorized for distribution to prospective shareholders unless accompanied or preceded by a prospectus which includes details regarding the funds’ investment objectives, risks, charges, expenses and other information. This information should be read carefully.
|  | E-Delivery Sign-up – details inside |
INVESTMENT MANAGEMENT voyainvestments.com |  |
TABLE OF CONTENTS
| Go Paperless with E-Delivery! | |
Sign up now for on-line prospectuses, fund reports, and proxy statements. Just go to individuals.voya.com/page/e-delivery, follow the directions and complete the quick 5 Steps to Enroll. You will be notified by e-mail when these communications become available on the internet. |
PROXY VOTING INFORMATION
A description of the policies and procedures that the Portfolios use to determine how to vote proxies related to portfolio securities is available: (1) without charge, upon request, by calling Shareholder Services toll-free at (800) 992-0180; (2) on the Portfolios’ website at www.voyainvestments.com; and (3) on the U.S. Securities and Exchange Commission’s (“SEC’s”) website at www.sec.gov. Information regarding how the Portfolios voted proxies related to portfolio securities during the most recent 12-month period ended June 30 is available without charge on the Portfolios’ website at www. voyainvestments.com and on the SEC’s website at www.sec.gov.
QUARTERLY PORTFOLIO HOLDINGS
The Portfolios file their complete schedule of portfolio holdings with the SEC for the first and third quarters of each fiscal year on Form NPORT-P. The Portfolios’ Forms NPORT-P are available on the SEC’s website at www.sec.gov. Each Portfolio’s complete schedule of portfolio holdings is available at: www.voyainvestments.com and without charge upon request from the Portfolio by calling Shareholder Services toll-free at (800) 992-0180.
Benchmark Descriptions
| Index | Description |
| Bloomberg U.S. Aggregate Bond Index (“Bloomberg U.S. Aggregate Bond”) | An index of publicly issued investment grade U.S. government, mortgage-backed, assetbacked and corporate debt securities. |
| Bloomberg U.S. Treasury Inflation Protected Securities Index (“TIPS Index”) | A market index comprised of all U.S. Treasury Inflation Linked Securities. |
| VY® BlackRock Inflation Protected Bond Portfolio | Portfolio Managers’ rePort |
VY® BlackRock Inflation Protected Bond Portfolio (the “Portfolio”) seeks to maximize real return, consistent with preservation of real capital and prudent investment management. The Portfolio is managed by Chris Allen, Managing Director and Akiva Dickstein, Managing Director, and David Rogal, Portfolio Managers of BlackRock Financial Management, Inc. – the Sub-Adviser.
Performance: For the year ended December 31, 2023, the Portfolio’s Class I shares provided a total return of 4.30% compared to the Bloomberg U.S. Treasury Inflation Protected Securities Index (“TIPS Index” or “TIPS”) which returned 3.90% for the same period.
Portfolio Specifics: 2023 was a volatile year for macroeconomic data and interest rates. The Portfolio’s tactical long when earlier in the year the team added a long breakeven position on the view that inflation would remain stickier than the market expected. As that dynamic played out, inflation expectations increased. The team later unwound the position in June. Risk assets in general performed extremely well over the year as the US economy was more resilient than expected. Given this dynamic the Portfolio’s structural long position in rental-linked commercial mortgage-backed (“CMBS”) securities, primarily focused in single family rentals (SFR) contributed positively to the Portfolio. Increasing rental prices and a broad positive risk sentiment led to strong performance. Another contributor for the period was the Portfolio’s tactical long position in Agency mortgage-backed securities (“MBS”) which outperformed due to spreads being at historically wide levels while performance was strong late in the year. The Portfolio’s short position in European inflation contributed positively to performance driven by moderating inflation in the euro region. Our relative value strategies also added to performance.
| | | | |
| | Investment Type Allocation | | |
| | as of December 31, 2023 | |
| | (as a percentage of net assets) | |
| | U.S. Treasury Obligations | | | 51.7 | % | |
| | Corporate Bonds/Notes | | | 26.1 | % | |
| | U.S. Government Agency Obligations | | | 19.0 | % | |
| | Commercial Mortgage-Backed Securities | | | 4.9 | % | |
| | Collateralized Mortgage Obligations | | | 1.8 | % | |
| | Asset-Backed Securities | | | 1.7 | % | |
| | Sovereign Bonds | | | 1.5 | % | |
| | Municipal Bonds | | | 0.1 | % | |
| | Liabilities in Excess of Other Assets* | | | (6.8) | % | |
| | Net Assets | | | 100.0 | % | |
| | * Includes short-term investments and purchased options. | | | | | |
| | Portfolio holdings are subject to change daily. | | |
The Portfolio’s underweight position in Japanese rates was a notable detractor from returns. The combination of the Bank of Japan’s lack of policy shift for much of the year, increased volatility, and Japanese nominal rates falling over parts of the year detracted from performance. Meanwhile, tactical positioning in US rates detracted over the period. At the start of the year, the position outperformed where the Portfolio was long duration in January before moving to an underweight in February as stickier inflation led rates to sell off. The team flipped the position back to being overweight duration in late June given our view that inflation was likely to come in softer than expected in the second half of the year, allowing the market to remove more hawkish Fed outcomes. While the Portfolio’s inflation conviction was correct with CPI printing more softly, strong growth and economic data broadly in the US resulted in rates selling off causing our overweight duration position to detract. The Portfolio’s overweight position was concentrated in the front end of the curve which shielded the Portfolio from further losses as the curve steepened. The team moved to a short duration position in the fourth quarter on the view that the market had begun to price in far too many rate cuts in 2024. While conviction remains in that view, the shift was too early and thus detracted from returns. Lastly, the Portfolio’s position in FX was a detractor for the period. While European inflation fell further relative to the US, the USD surprised to the upside and strengthened against the euro. Additionally, as the BoJ held rates, the yen weakened against the USD.
| | |
| | Top Ten Holdings |
| | as of December 31, 2023 |
| | (as a percentage of net assets) |
| | United States Treasury Inflation Indexed
Notes, 0.625%, 07/15/32 | | | 3.7 | % |
| | United States Treasury Inflation Indexed
Notes, 1.125%, 01/15/33 | | | 3.7 | % |
| | United States Treasury Inflation Indexed
Notes, 1.375%, 07/15/33 | | | 3.6 | % |
| | United States Treasury Inflation Indexed
Notes, 0.125%, 01/15/32 | | | 3.3 | % |
| | Uniform Mortgage-Backed Securities,
5.500%, 01/01/54 | | | 3.2 | % |
| | United States Treasury Inflation Indexed
Notes, 0.125%, 07/15/31 | | | 3.1 | % |
| | Uniform Mortgage-Backed Securities,
5.000%, 01/01/54 | | | 2.9 | % |
| | United States Treasury Inflation Indexed
Notes, 1.250%, 04/15/28 | | | 2.6 | % |
| | United States Treasury Inflation Indexed
Notes, 0.750%, 07/15/28 | | | 2.5 | % |
| | United States Treasury Inflation Indexed
Notes, 0.125%, 01/15/31 | | | 1.8 | % |
| Portfolio holdings are subject to change daily. |
Current Strategy and Outlook: As 2024 unfolds, we expect economic data to soften, inflation to continue to move back towards the Federal Reserve’s target and for the Fed to be able to recalibrate policy beginning in the second half of 2024. We believe the market is currently pricing in too many rate cuts for 2024 and thus are underweight duration in the front end of the curve. We are long US breakevens as the market is pricing a quick return to the Fed’s 2% target and are long spread risk in portions of the market that we believe are attractive.
| Portfolio Managers’ rePort | VY® BlackRock Inflation Protected Bond Portfolio |
The views expressed in this commentary are informed opinions. They should not be considered promises or advice. The views expressed reflect those of the portfolio managers, only through the end of the period as stated on the cover. The portfolio managers’ views are subject to change at any time based on market and other conditions.
Portfolio holdings and characteristics are subject to change and may not be representative of current holdings and characteristics. Portfolio holdings are subject to change daily. The outlook for this Portfolio may differ from that presented for other Voya mutual funds. This report contains statements that may be “forward-looking” statements. Actual results may differ materially from those projected in the “forward-looking” statements. The Portfolio’s performance returns shown reflect applicable fee waivers and/or expense limits in effect during this period. Absent such fee waivers/expense limitations, if any, performance would have been lower. Performance for the different classes of shares will vary based on differences in fees associated with each class. An index has no cash in its portfolio and imposes no sales charges. An investor cannot invest directly in an index.
VY® BlackRock Inflation Protected
Bond Portfolio | Portfolio Managers’ rePort |
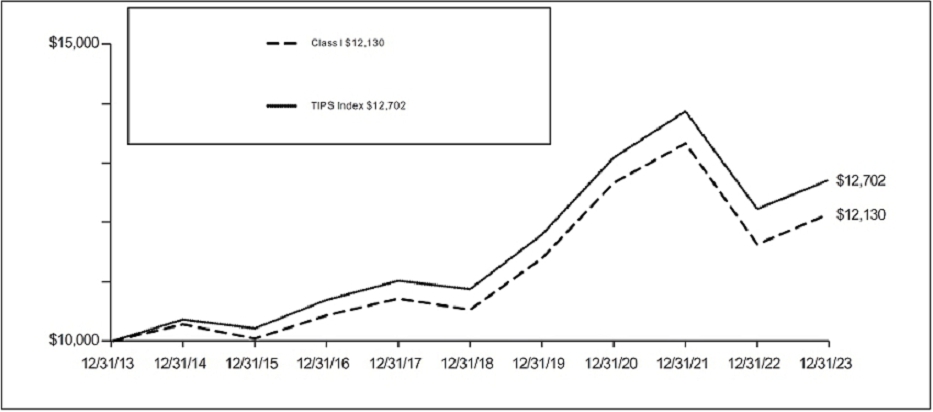
| Average Annual Total Returns for the Periods Ended December 31, 2023 |
| 1 Year | 5 Year | 10 Year |
| Class ADV | 3.83% | 2.28% | 1.35% |
| Class I | 4.30% | 2.87% | 1.95% |
| Class S | 4.17% | 2.64% | 1.70% |
| TIPS Index | 3.90% | 3.15% | 2.42% |
Based on a $10,000 initial investment, the graph and table above illustrate the total return of VY® BlackRock Inflation Protected Bond Portfolio against the index indicated. The index is unmanaged and has no cash in its portfolio and imposes no sales charges. An investor cannot invest directly in an index.
The Portfolio’s performance is shown both without the imposition of any expenses or charges which are, or may be, imposed under your variable annuity contract or variable life insurance policy. Total returns would have been lower if such expenses or charges were included.
The performance graph and table do not reflect the deduction of taxes that a shareholder will pay on Portfolio distributions or the redemption of Portfolio shares.
The performance shown includes, if applicable, the effect of fee waivers and/or expense reimbursements by the Investment Adviser and/or other service providers, which have the effect of increasing total return. Had all fees and expenses been considered, the total returns would have been lower.
The performance update illustrates performance for a variable investment option available through a variable annuity contract or a variable life insurance policy. The performance shown indicates past performance and is not a projection or prediction of future results. Actual investment returns and principal value will fluctuate so that shares and/or units, at redemption, may be worth more or less than their original cost. Please log on to www.voyainvestments. com or call (800) 366-0066 to get performance through the most recent month end.
Portfolio holdings are subject to change daily
| Portfolio Managers’ rePort | VY® Brandywine global - Bond Portfolio |
VY® BrandywineGLOBAL - Bond Portfolio (the “Portfolio”) seeks total return consisting of capital appreciation and income. The Portfolio is managed by David F. Hoffman, CFA, John P. McIntyre, CFA, and Anujeet Sareen, CFA, Portfolio Managers of Brandywine Global Investment Management, LLC (“Brandywine”). – the Sub-Adviser
Performance: For the year ended December 31, 2023, the Portfolio’s shares provided a total return of 5.53% compared to the Bloomberg U.S. Aggregate Bond Index (“Bloomberg U.S. Aggregate Bond”), which returned 5.53% for the same period.
Portfolio Specifics — For the year ended December 31, 2023, the Portfolio performed inline the Bloomberg U.S. Aggregate Bond. We maintained an overweight duration position in the Portfolio for the full calendar year in 2023. The decision to overweight duration was driven by a combination of macro and value factors. Most notably, we expected the Fed’s aggressive rate hiking cycle to slow inflation and growth and bond valuations looked attractive. Our long-duration posturing proved to be the primary driver to relative performance during the calendar year, with much of the outperformance coming in the later part of the year.
| | | |
| | Investment Type Allocation | |
| | as of December 31, 2023 | |
| | (as a percentage of net assets) | |
| | U.S. Government Agency Obligations | | | 50.8 | % | |
| | U.S. Treasury Obligations | | | 39.2 | % | |
| | Corporate Bonds/Notes | | | 5.5 | % | |
| | Assets in Excess of Other Liabilities* | | | 4.5 | % | |
| | Net Assets | | | 100.0 | % | |
| | * | Includes short-term investments. | | | | | |
| Portfolio holdings are subject to change daily. |
Looking back over the year, the US Fixed Income market rallied during the first quarter, but those gains were erased in the second and third quarters. The market’s setback was triggered by expectations for a “higher for longer” interest rate environment given persistent inflation. The market then rallied sharply over the fourth quarter, as the Federal Reserve (“Fed”) “pivoted” by indicating an end to its monetary tightening campaign and announcing its intention to cut rates three times in 2024 as inflation normalized. All told, the 10-year U.S. Treasury fell 71 basis points during the fourth quarter, ending at 3.88%. The decline was noteworthy, as the 10-year yield briefly exceeded 5.0% in October.
On the positioning front, we decreased exposure to investment grade corporate positions early in the year and increased exposure to agency mortgage-backed securities (“MBS”). We made this change due to tight corporate credit spreads and attractive spreads and yields within the agency MBS market. We actively managed our US Treasury exposure during the year, generally favoring the 5-, 10- and 30-year portions of the market. The strategy remains overweight U.S. Treasury duration. We maintain the belief that U.S. Treasuries offer value in both soft and hard-landing scenarios, with potentially greater rewards in the event of a hard landing.
| | | |
| | Top Ten Holdings | |
| | as of December 31, 2023 | |
| | (as a percentage of net assets) | |
| | United States Treasury Notes, 3.875%,
08/15/33 | 17.8 | % | |
| | United States Treasury Bonds, 3.000%,
08/15/52 | 12.1 | % | |
| | Federal Home Loan Banks, 4.875%,
09/13/24 | 8.0 | % | |
| | Uniform Mortgage-Backed Securities,
4.000%, 06/01/52 | 7.8 | % | |
| | United States Treasury Notes, 4.125%,
11/15/32 | 5.2 | % | |
| | Uniform Mortgage-Backed Securities,
4.500%, 09/01/52 | 4.4 | % | |
| | Uniform Mortgage-Backed Securities,
5.000%, 11/01/52 | 4.3 | % | |
| | Uniform Mortgage-Backed Securities,
5.500%, 11/01/52 | 3.6 | % | |
| | Ginnie Mae, 5.500%, 04/20/53 | 3.4 | % | |
| | Ginnie Mae, 5.500%, 05/20/53 | 2.9 | % | |
| | | | | |
| | Portfolio holdings are subject to change daily. | | | |
| | | | | |
Current Strategy and Outlook: A U.S. economic soft landing appears to be the most likely scenario in 2024, although recession risks remain. We expect the economy to continue to slow as higher rates make their way through the economy. Fiscal policy, which has played a significant role in U.S. economic resilience, is likely to be less supportive in 2024. On the other hand, in our view, a strong labor market combined with rate cuts could allow the economy to avoid recession. In our opinion with inflation falling sharply, growth slowing, and the Fed about to embark on a ratecutting cycle, the macro environment appears generally favorable for bonds in 2024.
| VY® Brandywine global - Bond Portfolio | Portfolio Managers’ rePort |
The views expressed in this commentary are informed opinions. They should not be considered promises or advice. The views expressed reflect those of the portfolio managers, only through the end of the period as stated on the cover. The portfolio managers’ views are subject to change at any time based on market and other conditions.
Portfolio holdings and characteristics are subject to change and may not be representative of current holdings and characteristics. Portfolio holdings are subject to change daily. The outlook for this Portfolio may differ from that presented for other Voya mutual funds. This report contains statements that may be “forward-looking” statements. Actual results may differ materially from those projected in the “forward-looking” statements. The Portfolio’s performance returns shown reflect applicable fee waivers and/or expense limits in effect during this period. Absent such fee waivers/expense limitations, if any, performance would have been lower. Performance for the different classes of shares will vary based on differences in fees associated with each class. An index has no cash in its portfolio and imposes no sales charges. An investor cannot invest directly in an index.
| PORTFOLIO MANAGERS’ REPORT | VY® BRANDYWINE GLOBAL - BOND PORTFOLIO |
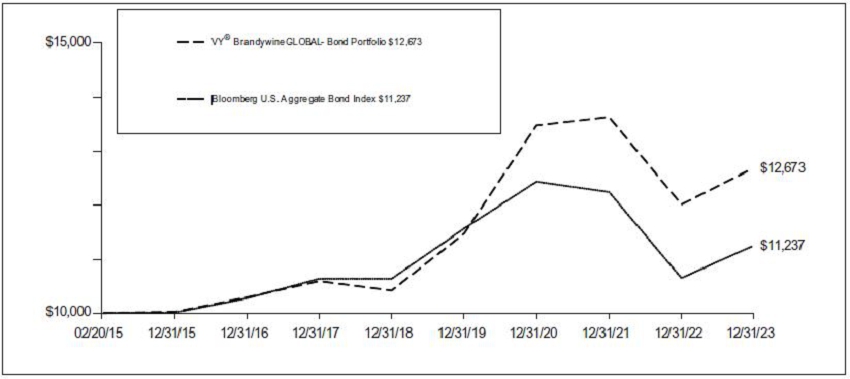
| Average Annual Total Returns for the Periods Ended December 31, 2023 |
| | | Since |
| | 1 Year | 5 Year | Inception |
| VY® BrandywineGLOBAL- Bond Portfolio | 5.53% | 4.00% | 2.71%(1) |
| Bloomberg U.S. Aggregate Bond Index | 5.53% | 1.10% | 1.32% |
Based on a $10,000 initial investment, the graph and table above illustrate the total return of VY® BrandywineGLOBAL – Bond Portfolio against the index indicated. The index is unmanaged and has no cash in its portfolio and imposes no sales charges. An investor cannot invest directly in an index.
The Portfolio’s performance is shown both without the imposition of any expenses or charges which are, or may be, imposed under your variable annuity contract or variable life insurance policy. Total returns would have been lower if such expenses or charges were included.
The performance graph and table do not reflect the deduction of taxes that a shareholder will pay on Portfolio distributions or the redemption of Portfolio shares.
The performance shown includes, if applicable, the effect of fee waivers and/or expense reimbursements by the Investment Adviser and/or other service providers, which have the effect of increasing total return. Had all fees and expenses been considered, the total returns would have been lower.
The performance update illustrates performance for a variable investment option available through a variable annuity contract or a variable life insurance policy. The performance shown indicates past performance and is not a projection or prediction of future results. Actual investment returns and principal value will fluctuate so that shares and/or units, at redemption, may be worth more or less than their original cost. Please log on to www.voyainvestments. com or call (800) 992-0180 to get performance through the most recent month end.
Portfolio holdings are subject to change daily.
Prior to August 9, 2019, the Portfolio was managed by a different sub- adviser. The Portfolio’s performance information for these periods reflects returns achieved by different sub-advisers.
| (1) | Portfolio incepted on February 20, 2015. |
SHAREHOLDER EXPENSE EXAMPLES (UNAUDITED)
As a shareholder of a Portfolio, you incur two types of costs: (1) transaction costs, including redemption fees and exchange fees; and (2) ongoing costs, including management fees, distribution and/or service (12b-1) fees and other Portfolio expenses. These Examples are intended to help you understand your ongoing costs (in dollars) of investing in a Portfolio and to compare these costs with the ongoing costs of investing in other mutual funds.
The Examples are based on an investment of $1,000 invested at the beginning of the period and held for the entire period from July 1, 2023 to December 31, 2023. The Portfolios’ expenses are shown without the imposition of any charges which are, or may be, imposed under your variable annuity contract, variable life insurance policy, qualified pension, or retirement plan. Expenses would have been higher if such charges were included.
Actual Expenses
The left section of the table shown below, “Actual Portfolio Return,” provides information about actual account values and actual expenses. You may use the information in this section, together with the amount you invested, to estimate the expenses that you paid over the period. Simply divide your account value by $1,000 (for example, an $8,600 account value divided by $1,000 = 8.6), then multiply the result by the number in the first section under the heading entitled “Expenses Paid During the Period” to estimate the expenses you paid on your account during this period.
Hypothetical Example for Comparison Purposes
The right section of the table shown below, “Hypothetical (5% return before expenses),” provides information about hypothetical account values and hypothetical expenses based on a Portfolio’s actual expense ratio and an assumed rate of return of 5% per year before expenses, which is not a Portfolio’s actual return. The hypothetical account values and expenses may not be used to estimate the actual ending account balance or expenses you paid for the period. You may use this information to compare the ongoing costs of investing in a Portfolio and other mutual funds. To do so, compare this 5% hypothetical example with the 5% hypothetical examples that appear in the shareholder reports of the other mutual funds.
Please note that the expenses shown in the table are meant to highlight your ongoing costs only and do not reflect any transactional costs, such as redemption fees or exchange fees. Therefore, the hypothetical section of the table is useful in comparing ongoing costs only, and will not help you determine the relative total costs of owning different mutual funds. In addition, if these transactional costs were included, your costs would have been higher.
| | | Actual Portfolio Return | | Hypothetical (5% return before expenses) |
| | | Beginning
Account
Value
July 1,
2023 | | Ending
Account
Value
December 31,
2023 | | Annualized
Expense
Ratio | | Expenses Paid
During the
Period Ended
December 31,
2023* | | Beginning
Account
Value
July 1,
2023 | | Ending
Account
Value
December 31,
2023 | | Annualized
Expense
Ratio | | Expenses Paid
During the
Period Ended
December 31,
2023* |
| | |
| VY® BlackRock Inflation Protected Bond Portfolio | |
| Class ADV | | $1,000.00 | | $1,016.30 | | 1.22% | | $6.20 | | $1,000.00 | | $1,019.06 | | 1.22% | | $6.21 | |
| Class I | | 1,000.00 | | 1,018.90 | | 0.62 | | 3.16 | | 1,000.00 | | 1,022.08 | | 0.62 | | 3.16 | |
| Class S | | 1,000.00 | | 1,017.70 | | 0.87 | | 4.42 | | 1,000.00 | | 1,020.82 | | 0.87 | | 4.43 | |
VY® BrandywineGLOBAL- Bond Portfolio | |
| Portfolio | | $1,000.00 | | $1,025.40 | | 0.55% | | $2.81 | | $1,000.00 | | $1,022.43 | | 0.55% | | $2.80 | |
| * | Expenses are equal to each Portfolio’s respective annualized expense ratios multiplied by the average account value over the period, multiplied by 184/365 to reflect the most recent fiscal half-year. |
REPORT OF INDEPENDENT REGISTERED PUBLIC ACCOUNTING FIRM
To the Shareholders of VY® BlackRock Inflation Protected Bond Portfolio and VY®BrandywineGLOBAL – Bond Portfolio and the Boards of Trustees of Voya Investors Trust and Voya Variable Insurance Trust
Opinion on the Financial Statements
We have audited the accompanying statements of assets and liabilities of VY® BlackRock Inflation Protected Bond Portfolio and VY® BrandywineGLOBAL – Bond Portfolio (collectively referred to as the “Portfolios”) (each a portfolio of Voya Investors Trust and Voya Variable Insurance Trust, respectively (collectively referred to as the “Trusts”)), including the portfolios of investments, as of December 31, 2023, and the related statements of operations for the year then ended, the statements of changes in net assets for each of the two years in the period then ended, the financial highlights for each of the four years in the period then ended and the related notes (collectively referred to as the “financial statements”). In our opinion, the financial statements present fairly, in all material respects, the financial position of each of the Portfolios at December 31, 2023, the results of their operations for the year then ended, the changes in their net assets for each of the two years in the period then ended and their financial highlights for each of the four years in the period then ended, in conformity with U.S. generally accepted accounting principles.
The financial highlights for the period ended December 31, 2019, were audited by another independent registered public accounting firm whose report, dated February 21, 2020, expressed an unqualified opinion on those financial highlights.
Basis for Opinion
These financial statements are the responsibility of the Trusts’ management. Our responsibility is to express an opinion on the Portfolios’ financial statements based on our audits. We are a public accounting firm registered with the Public Company Accounting Oversight Board (United States) ("PCAOB") and are required to be independent with respect to the Trusts in accordance with the U.S. federal securities laws and the applicable rules and regulations of the Securities and Exchange Commission and the PCAOB.
We conducted our audits in accordance with the standards of the PCAOB. Those standards require that we plan and perform the audits to obtain reasonable assurance about whether the financial statements are free of material misstatement, whether due to error or fraud. The Trusts are not required to have, nor were we engaged to perform, an audit of the Trusts’ internal control over financial reporting. As part of our audits, we are required to obtain an understanding of internal control over financial reporting, but not for the purpose of expressing an opinion on the effectiveness of the Trusts’ internal control over financial reporting. Accordingly, we express no such opinion.
Our audits included performing procedures to assess the risks of material misstatement of the financial statements, whether due to error or fraud, and performing procedures that respond to those risks. Such procedures included examining, on a test basis, evidence regarding the amounts and disclosures in the financial statements. Our procedures included confirmation of securities owned as of December 31, 2023, by correspondence with the custodian, brokers and others; when replies were not received from brokers and others, we performed other auditing procedures. Our audits also included evaluating the accounting principles used and significant estimates made by management, as well as evaluating the overall presentation of the financial statements. We believe that our audits provide a reasonable basis for our opinion.

We have served as the auditor of one or more Voya investment companies since 2019.
Boston, Massachusetts
February 28, 2024
STATEMENTS OF ASSETS AND LIABILITIES AS OF DECEMBER 31, 2023
| | | VY®
BlackRock
Inflation
Protected Bond
Portfolio | | | VY®
Brandywine
GLOBAL —
Bond
Portfolio | |
| ASSETS: | | | | | | | | |
| Investments in securities at fair value* | | $ | 234,667,959 | | | $ | 218,354,679 | |
| Short-term investments at fair value† | | | 419,879 | | | | 5,632,805 | |
| Cash collateral for futures contracts | | | – | | | | 3,779,984 | |
| Cash pledged for centrally cleared swaps (Note 2) | | | 3,158,000 | | | | – | |
| Foreign currencies at value‡ | | | 128,522 | | | | – | |
| Receivables: | | | | | | | | |
| Investment securities and currencies sold | | | 4,934,914 | | | | – | |
| Investment securities sold on a delayed-delivery or when-issued basis | | | 5,946,852 | | | | – | |
| Fund shares sold | | | 114,893 | | | | 145,214 | |
| Dividends | | | 2,308 | | | | 18,979 | |
| Interest | | | 1,323,223 | | | | 1,890,388 | |
| Variation margin on futures contracts | | | 59,682 | | | | – | |
| Unrealized appreciation on forward foreign currency contracts | | | 4,207 | | | | – | |
| Unrealized appreciation on OTC swap agreements | | | 230,593 | | | | – | |
| Prepaid expenses | | | 2,201 | | | | 2,274 | |
| Other assets | | | 17,873 | | | | 6,488 | |
| Total assets | | | 251,011,106 | | | | 229,830,811 | |
| | | | | | | | | |
| LIABILITIES: | | | | | | | | |
| Payable for investment securities and currencies purchased | | | 5,431,399 | | | | 1,089,448 | |
| Payable for investment securities purchased on a delayed-delivery or when-issued basis | | | 22,749,193 | | | | – | |
| Payable for fund shares redeemed | | | 119,970 | | | | 122,888 | |
| Sales commitments^^^ | | | 2,162,083 | | | | – | |
| Unrealized depreciation on forward foreign currency contracts | | | 2,922 | | | | – | |
| Upfront payments received on OTC swap agreements | | | 19,896 | | | | – | |
| Unrealized depreciation on OTC swap agreements | | | 4,642 | | | | – | |
| Variation margin payable on centrally cleared swaps | | | 1,263 | | | | – | |
| Cash received as collateral for OTC derivatives (Note 2) | | | 50,000 | | | | – | |
| Payable for investment management fees | | | 91,948 | | | | 95,174 | |
| Payable for distribution and shareholder service fees | | | 43,445 | | | | – | |
| Payable to trustees under the deferred compensation plan (Note 6) | | | 17,873 | | | | 6,488 | |
| Payable for trustee fees | | | 594 | | | | 586 | |
| Other accrued expenses and liabilities | | | 95,226 | | | | 44,974 | |
| Written options, at fair value^ | | | 757,848 | | | | – | |
| Total liabilities | | | 31,548,302 | | | | 1,359,558 | |
| NET ASSETS | | $ | 219,462,804 | | | $ | 228,471,253 | |
| | | | | | | | | |
| NET ASSETS WERE COMPRISED OF: | | | | | | | | |
| Paid-in capital | | $ | 306,764,060 | | | $ | 252,574,860 | |
| Total distributable loss | | | (87,301,256 | ) | | | (24,103,607 | ) |
| NET ASSETS | | $ | 219,462,804 | | | $ | 228,471,253 | |
| | | | | | | | | |
| * | Cost of investments in securities | | $ | 245,972,524 | | | $ | 217,433,720 | |
| † | Cost of short-term investments | | $ | 419,879 | | | $ | 5,632,805 | |
| ‡ | Cost of foreign currencies | | $ | 125,794 | | | $ | — | |
| ^ | Premiums received on written options | | $ | 688,551 | | | $ | — | |
| ^^^ | Proceeds receivable from sales commitments | | $ | 2,119,517 | | | $ | — | |
See Accompanying Notes to Financial Statements
STATEMENTS OF ASSETS AND LIABILITIES AS OF DECEMBER 31, 2023 (CONTINUED)
| | | VY®
BlackRock
Inflation
Protected Bond
Portfolio | | | VY®
Brandywine
GLOBAL —
Bond
Portfolio | |
| Class ADV | | | | | | | | |
| Net assets | | $ | 38,744,660 | | | | n/a | |
| Shares authorized | | | unlimited | | | | n/a | |
| Par value | | $ | 0.001 | | | | n/a | |
| Shares outstanding | | | 4,394,054 | | | | n/a | |
| Net asset value and redemption price per share | | $ | 8.82 | | | | n/a | |
| | | | | | | | | |
| Class I | | | | | | | | |
| Net assets | | $ | 69,071,217 | | | | n/a | |
| Shares authorized | | | unlimited | | | | n/a | |
| Par value | | $ | 0.001 | | | | n/a | |
| Shares outstanding | | | 7,513,879 | | | | n/a | |
| Net asset value and redemption price per share | | $ | 9.19 | | | | n/a | |
| | | | | | | | | |
| Class S | | | | | | | | |
| Net assets | | $ | 111,646,927 | | | | n/a | |
| Shares authorized | | | unlimited | | | | n/a | |
| Par value | | $ | 0.001 | | | | n/a | |
| Shares outstanding | | | 12,244,606 | | | | n/a | |
| Net asset value and redemption price per share | | $ | 9.12 | | | | n/a | |
| | | | | | | | | |
| Portfolio(1) | | | | | | | | |
| Net assets | | | n/a | | | $ | 228,471,253 | |
| Shares authorized | | | n/a | | | | unlimited | |
| Par value | | | n/a | | | $ | 0.001 | |
| Shares outstanding | | | n/a | | | | 23,811,661 | |
| Net asset value and redemption price per share | | | n/a | | | $ | 9.59 | |
(1) | Portfolio does not have a share class designation. |
See Accompanying Notes to Financial Statements
STATEMENTS OF OPERATIONS FOR THE YEAR ENDED DECEMBER 31, 2023
| | | VY®
BlackRock
Inflation
Protected Bond
Portfolio | | | VY®
Brandywine
GLOBAL —
Bond
Portfolio | |
| INVESTMENT INCOME: | | | | | | | | |
| Dividends | | $ | 155,137 | | | $ | 246,005 | |
| Interest, net of foreign taxes withheld* | | | 10,076,366 | (1) | | | 10,446,617 | |
| Other | | | 1,144 | | | | 1,126 | |
| Total investment income | | | 10,232,647 | | | | 10,693,748 | |
| EXPENSES: | | | | | | | | |
| Investment management fees | | | 1,286,623 | | | | 1,172,527 | |
| Distribution and shareholder service fees: | | | | | | | | |
| Class ADV | | | 246,117 | | | | — | |
| Class S | | | 306,408 | | | | — | |
| Transfer agent fees: | | | | | | | 1,214 | |
| Class ADV | | | 11,392 | | | | — | |
| Class I | | | 20,481 | | | | — | |
| Class S | | | 34,040 | | | | — | |
| Shareholder reporting expense | | | 11,034 | | | | 3,327 | |
| Professional fees | | | 54,115 | | | | 71,002 | |
| Custody and accounting expense | | | 150,391 | | | | 24,076 | |
| Trustee fees | | | 5,934 | | | | 5,863 | |
| Miscellaneous expense | | | 17,619 | | | | 15,590 | |
| Interest expense | | | 2,239 | | | | — | |
| Total expenses | | | 2,146,393 | | | | 1,293,599 | |
| Waived and reimbursed fees | | | (118,665 | ) | | | — | |
| Net expenses | | | 2,027,728 | | | | 1,293,599 | |
| Net investment income | | | 8,204,919 | | | | 9,400,149 | |
| REALIZED AND UNREALIZED GAIN (LOSS): | | | | | | | | |
| Net realized gain (loss) on: | | | | | | | | |
| Investments | | | (18,529,081 | ) | | | (16,993,269 | ) |
| Forward foreign currency contracts | | | (51,186 | ) | | | — | |
| Foreign currency related transactions | | | (38,227 | ) | | | — | |
| Futures | | | 3,517,056 | | | | (4,234,217 | ) |
| Swaps | | | 1,539,033 | | | | — | |
| Written options | | | 804,459 | | | | — | |
| Net realized loss | | | (12,757,946 | ) | | | (21,227,486 | ) |
| Net change in unrealized appreciation (depreciation) on: | | | | | | | | |
| Investments | | | 18,737,276 | | | | 22,432,460 | |
| Forward foreign currency contracts | | | 11,891 | | | | — | |
| Foreign currency related transactions | | | (3,437 | ) | | | — | |
| Futures | | | (2,593,231 | ) | | | 3,508,124 | |
| Swaps | | | (1,894,180 | ) | | | — | |
| Written options | | | (118,970 | ) | | | — | |
| Sales commitments | | | (70,534 | ) | | | — | |
| Net change in unrealized appreciation (depreciation) | | | 14,068,815 | | | | 25,940,584 | |
| Net realized and unrealized gain | | | 1,310,869 | | | | 4,713,098 | |
| Increase in net assets resulting from operations | | $ | 9,515,788 | | | $ | 14,113,247 | |
| * | Foreign taxes withheld | | $ | 20,699 | | | $ | — | |
| (1) | Includes net inflationary and deflationary adjustments. See Note 2 of the Notes to Financial Statements. |
See Accompanying Notes to Financial Statements
STATEMENTS OF CHANGES IN NET ASSETS
| | | VY®
BlackRock Inflation
Protected Bond Portfolio | | | VY®
BrandywineGLOBAL —
Bond Portfolio | |
| | | Year Ended
December 31,
2023 | | | Year Ended
December 31,
2022 | | | Year Ended
December 31,
2023 | | | Year Ended
December 31,
2022 | |
| FROM OPERATIONS: | | | | | | | | | | | | | | | | |
| Net investment income | | $ | 8,204,919 | | | $ | 11,610,939 | | | $ | 9,400,149 | | | $ | 4,766,216 | |
| Net realized gain (loss) | | | (12,757,946 | ) | | | 114,756 | | | | (21,227,486 | ) | | | (16,480,642 | ) |
| Net change in unrealized appreciation (depreciation) | | | 14,068,815 | | | | (52,631,376 | ) | | | 25,940,584 | | | | (26,396,665 | ) |
| Increase (decrease) in net assets resulting from operations | | | 9,515,788 | | | | (40,905,681 | ) | | | 14,113,247 | | | | (38,111,091 | ) |
| | | | | | | | | | | | | | | | | |
| FROM DISTRIBUTIONS TO SHAREHOLDERS: | | | | | | | | | | | | | | | | |
| Total distributions (excluding return of capital): | | | — | | | | — | | | | (5,046,842 | ) | | | (17,111,781 | ) |
| Class ADV | | | (1,253,985 | ) | | | (1,666,644 | ) | | | — | | | | — | |
| Class I | | | (2,616,072 | ) | | | (3,241,222 | ) | | | — | | | | — | |
| Class S | | | (4,021,674 | ) | | | (5,726,059 | ) | | | — | | | | — | |
| Return of capital: | | | | | | | | | | | | | | | | |
| Class ADV | | | — | | | | (251,719 | ) | | | — | | | | — | |
| Class I | | | — | | | | (413,119 | ) | | | — | | | | — | |
| Class S | | | — | | | | (766,743 | ) | | | — | | | | — | |
| Total distributions | | | (7,891,731 | ) | | | (12,065,506 | ) | | | (5,046,842 | ) | | | (17,111,781 | ) |
| | | | | | | | | | | | | | | | | |
| FROM CAPITAL SHARE TRANSACTIONS: | | | | | | | | | | | | | | | | |
| Net proceeds from sale of shares | | | 21,083,454 | | | | 37,100,330 | | | | 52,927,045 | | | | 84,693,352 | |
| Reinvestment of distributions | | | 7,891,731 | | | | 12,065,506 | | | | 5,046,842 | | | | 17,111,781 | |
| | | | 28,975,185 | | | | 49,165,836 | | | | 57,973,887 | | | | 101,805,133 | |
| Cost of shares redeemed | | | (65,352,589 | ) | | | (66,619,636 | ) | | | (104,883,514 | ) | | | (123,596,753 | ) |
| Net decrease in net assets resulting from capital share transactions | | | (36,377,404 | ) | | | (17,453,800 | ) | | | (46,909,627 | ) | | | (21,791,620 | ) |
| Net decrease in net assets | | | (34,753,347 | ) | | | (70,424,987 | ) | | | (37,843,222 | ) | | | (77,014,492 | ) |
| | | | | | | | | | | | | | | | | |
| NET ASSETS: | | | | | | | | | | | | | | | | |
| Beginning of year or period | | | 254,216,151 | | | | 324,641,138 | | | | 266,314,475 | | | | 343,328,967 | |
| End of year or period | | $ | 219,462,804 | | | $ | 254,216,151 | | | $ | 228,471,253 | | | $ | 266,314,475 | |
See Accompanying Notes to Financial Statements
FINANCIAL HIGHLIGHTS
Selected data for a share of beneficial interest outstanding throughout each year or period.
| | | | | Income (loss)
from investment
operations | | | Less Distributions | | | | | | | | | Ratios to average net assets | Supplemental
Data | |
| | |  | |  | |  | |  | |  | |  | |  | |  | |  | |  | |  | |  | |  | |  | |  | |  | |  | |
Year or
period ended | | ($) | | ($) | | ($) | | ($) | | ($) | | ($) | | ($) | | ($) | | ($) | | ($) | | (%) | | (%) | | (%) | | (%) | | (%) | | ($000's) | | (%) | |
| VY® BlackRock Inflation Protected Bond Portfolio | | | | | | | | | | | | | | | | | | | | | |
| Class ADV | | | | | | | | | | | | | | | | | | | | | | | | | | | | | | | | | | | |
| 12-31-23 | | 8.76 | | 0.27• | | 0.06 | | 0.33 | | 0.27 | | — | | — | | 0.27 | | — | | 8.82 | | 3.83 | | 1.27 | | 1.22 | | 1.22 | | 3.09 | | 38,745 | | 297 | |
| 12-31-22 | | 10.51 | | 0.35• | | (1.73 | ) | (1.38 | ) | 0.32 | | — | | 0.05 | | 0.37 | | — | | 8.76 | | (13.34 | ) | 1.23 | | 1.18 | | 1.18 | | 3.70 | | 43,212 | | 231 | |
| 12-31-21 | | 10.28 | | 0.22• | | 0.24 | | 0.46 | | 0.23 | | — | | — | | 0.23 | | — | | 10.51 | | 4.54 | | 1.22 | | 1.18 | | 1.18 | | 2.14 | | 56,857 | | 156 | |
| 12-31-20 | | 9.42 | | 0.05 | | 0.95 | | 1.00 | | 0.08 | | — | | 0.06 | | 0.14 | | — | | 10.28 | | 10.65 | | 1.26 | | 1.22 | | 1.22 | | 0.52 | | 47,352 | | 87 | |
| 12-31-19 | | 8.93 | | 0.11 | | 0.56 | | 0.67 | | 0.18 | | — | | — | | 0.18 | | — | | 9.42 | | 7.53 | | 1.20 | | 1.16 | | 1.16 | | 1.23 | | 44,885 | | 72 | |
| Class I | | | | | | | | | | | | | | | | | | | | | | | | | | | | | | | | | | | |
| 12-31-23 | | 9.13 | | 0.34• | | 0.05 | | 0.39 | | 0.33 | | — | | — | | 0.33 | | — | | 9.19 | | 4.30 | | 0.67 | | 0.62 | | 0.62 | | 3.70 | | 69,071 | | 297 | |
| 12-31-22 | | 10.94 | | 0.42• | | (1.79 | ) | (1.37 | ) | 0.39 | | — | | 0.05 | | 0.44 | | — | | 9.13 | | (12.74 | ) | 0.63 | | 0.58 | | 0.58 | | 4.27 | | 77,275 | | 231 | |
| 12-31-21 | | 10.68 | | 0.30• | | 0.25 | | 0.55 | | 0.29 | | — | | — | | 0.29 | | — | | 10.94 | | 5.25 | | 0.62 | | 0.58 | | 0.58 | | 2.75 | | 94,962 | | 156 | |
| 12-31-20 | | 9.78 | | 0.12 | | 0.97 | | 1.09 | | 0.13 | | — | | 0.06 | | 0.19 | | — | | 10.68 | | 11.15 | | 0.66 | | 0.62 | | 0.62 | | 1.11 | | 92,767 | | 87 | |
| 12-31-19 | | 9.26 | | 0.18 | | 0.57 | | 0.75 | | 0.23 | | — | | — | | 0.23 | | — | | 9.78 | | 8.21 | | 0.60 | | 0.56 | | 0.56 | | 1.98 | | 88,759 | | 72 | |
| Class S | | | | | | | | | | | | | | | | | | | | | | | | | | | | | | | | | | | |
| 12-31-23 | | 9.05 | | 0.31• | | 0.06 | | 0.37 | | 0.30 | | — | | — | | 0.30 | | — | | 9.12 | | 4.17 | | 0.92 | | 0.87 | | 0.87 | | 3.43 | | 111,647 | | 297 | |
| 12-31-22 | | 10.85 | | 0.40• | | (1.79 | ) | (1.39 | ) | 0.36 | | — | | 0.05 | | 0.41 | | — | | 9.05 | | (13.03 | ) | 0.88 | | 0.83 | | 0.83 | | 4.06 | | 133,729 | | 231 | |
| 12-31-21 | | 10.60 | | 0.26• | | 0.26 | | 0.52 | | 0.27 | | — | | — | | 0.27 | | — | | 10.85 | | 4.94 | | 0.87 | | 0.83 | | 0.83 | | 2.48 | | 172,822 | | 156 | |
| 12-31-20 | | 9.70 | | 0.09 | | 0.97 | | 1.06 | | 0.10 | | — | | 0.06 | | 0.16 | | — | | 10.60 | | 10.95 | | 0.91 | | 0.87 | | 0.87 | | 0.86 | | 159,383 | | 87 | |
| 12-31-19 | | 9.18 | | 0.15 | | 0.58 | | 0.73 | | 0.21 | | — | | — | | 0.21 | | — | | 9.70 | | 8.01 | | 0.85 | | 0.81 | | 0.81 | | 1.57 | | 144,313 | | 72 | |
| VY® BrandywineGLOBAL- Bond Portfolio | | | | | | | | | | | | | | | | | | | | | | | | | | | |
| | | | | | | | | | | | | | | | | | | | | | | | | | | | |
| 12-31-23 | | 9.29 | | 0.38• | | 0.13 | | 0.51 | | 0.21 | | — | | — | | 0.21 | | — | | 9.59 | | 5.53 | | 0.55 | | 0.55 | | 0.55 | | 4.01 | | 228,471 | | 126 | |
| 12-31-22 | | 11.22 | | 0.16• | | (1.45 | ) | (1.29 | ) | 0.11 | | 0.53 | | — | | 0.64 | | — | | 9.29 | | (11.89 | ) | 0.55 | | 0.56 | | 0.56 | | 1.60 | | 266,314 | | 184 | |
| 12-31-21 | | 12.03 | | 0.10• | | 0.04 | | 0.14 | | 0.19 | | 0.76 | | — | | 0.95 | | — | | 11.22 | | 1.15 | | 0.54 | | 0.58 | | 0.58 | | 0.84 | | 343,329 | | 57 | |
| 12-31-20 | | 10.51 | | 0.22• | | 1.59 | | 1.81 | | 0.21 | | 0.08 | | — | | 0.29 | | — | | 12.03 | | 17.47 | | 0.56 | | 0.58 | | 0.58 | | 1.92 | | 318,665 | | 134 | |
| 12-31-19 | | 9.73 | | 0.25• | | 0.73 | | 0.98 | | 0.20 | | — | | — | | 0.20 | | — | | 10.51 | | 10.12 | | 0.61 | | 0.58 | | 0.58 | | 2.48 | | 182,892 | | 449 | |
| (1) | Total return is calculated assuming reinvestment of all dividends, capital gain distributions and return of capital distributions, if any, at net asset value and does not reflect the effect of insurance contract charges. Total return for periods less than one year is not annualized. |
| (2) | Annualized for periods less than one year. |
| (3) | Ratios reflect operating expenses of a Portfolio. Expenses before reductions/additions do not reflect amounts reimbursed or recouped by the Investment Adviser and/or Distributor or reductions from brokerage service arrangements or other expense offset arrangements and do not represent the amount paid by a Portfolio during periods when reimbursements or reductions occur. Expenses net of fee waivers reflect expenses after reimbursement by the Investment Adviser and/or Distributor or recoupment of previously reimbursed fees by the Investment Adviser, but prior to reductions from brokerage service arrangements or other expense offset arrangements. Expenses net of all reductions/additions represent the net expenses paid by a Portfolio. Net investment income (loss) is net of all such additions or reductions. |
| (4) | Ratios do not include fees and expenses charged under the variable annuity contract or variable life insurance policy. |
| • | Calculated using average number of shares outstanding throughout the year or period. |
See Accompanying Notes to Financial Statements
NOTES TO FINANCIAL STATEMENTS AS OF DECEMBER 31, 2023
NOTE 1 — ORGANIZATION
Voya Investors Trust is registered under the Investment Company Act of 1940, as amended (the “1940 Act”), as an open-end management investment company and was organized as a Massachusetts business trust on August 3, 1988. Voya Investors Trust currently consists of twenty- two active separate investment series. The one series included in this report is: VY® BlackRock Inflation Protected Bond Portfolio (“BlackRock Inflation Protected Bond”), a diversified series of Voya Investors Trust.
Voya Variable Insurance Trust is registered under the 1940 Act as an open-end management investment company and was organized as a Delaware statutory trust on July 15, 1999. Voya Variable Insurance Trust consists of one active investment series which is included in this report: VY® BrandywineGLOBAL — Bond Portfolio (“Bond Portfolio”), a diversified series of Voya Variable Insurance Trust.
Voya Investors Trust and Voya Variable Insurance Trust are collectively referred to as the “Trusts.” BlackRock Inflation Protected Bond and Bond Portfolio are each, a “Portfolio” and together, the “Portfolios.” The investment objective of the Portfolios is described in each Portfolio’s Prospectus.
The classes of shares included in this report for BlackRock Inflation Protected Bond are: Adviser (“Class ADV”), Institutional (“Class I”), and Service (“Class S”). With the exception of class specific matters, each class has equal voting rights as to voting privileges. For class specific proposals, only the applicable class would have voting privileges. The classes differ principally in the applicable distribution and shareholder service fees, as well as differences in the amount of waiver of fees and reimbursement of expenses, if any. Generally, shareholders of each class also bear certain expenses that pertain to that particular class. All shareholders are allocated the common expenses of a portfolio and earn income and realized gains/ losses from a portfolio pro rata based on the daily ending net assets of each class, without distinction between share classes. Expenses that are specific to a portfolio or a class are charged directly to that portfolio or class. Other operating expenses shared by several portfolios are generally allocated among those portfolios based on average net assets. Distributions are determined separately for each class based on income and expenses allocated to each class. Realized gain distributions are allocated to each class pro rata based on the shares outstanding of each class on the date of distribution. Differences in per share dividend rates generally result from differences in separate class expenses, including distribution and shareholder service fees, if any, as well as differences in the amount of waiver of fees and reimbursement of expenses between the separate classes, if any. Bond Portfolio does not have a share class designation.
Voya Investments, LLC (“Voya Investments” or the “Investment Adviser”), an Arizona limited liability company, serves as the Investment Adviser to the Portfolios. Voya Investments Distributor, LLC (“VID” or the “Distributor”), a Delaware limited liability company, serves as the principal underwriter to the Portfolios.
NOTE 2 — SIGNIFICANT ACCOUNTING POLICIES
The following significant accounting policies are consistently followed by the Portfolios in the preparation of their financial statements. Each Portfolio is considered an investment company under U.S. generally accepted accounting principles (“GAAP”) and follows the accounting and reporting guidance applicable to investment companies.
A. Security Valuation. Each Portfolio is open for business every day the New York Stock Exchange (“NYSE”) opens for regular trading (each such day, a “Business Day”). The net asset value (“NAV”) per share for each class of each Portfolio is determined each Business Day as of the close of the regular trading session (“Market Close”), as determined by the Consolidated Tape Association (“CTA”), the central distributor of transaction prices for exchange- traded securities (normally 4:00 p.m. Eastern Time unless otherwise designated by the CTA). The NAV per share of each class of each Portfolio is calculated by taking the value of the Portfolio’s assets attributable to that class, subtracting the Portfolio’s liabilities attributable to that class, and dividing by the number of shares of that class that are outstanding. On days when a Portfolio is closed for business, Portfolio shares will not be priced and a Portfolio does not transact purchase and redemption orders. To the extent a Portfolio’s assets are traded in other markets on days when a Portfolio does not price its shares, the value of a Portfolio’s assets will likely change and you will not be able to purchase or redeem shares of a Portfolio.
Portfolio securities for which market quotations are readily available are valued at market value. Investments in open- end registered investment companies that do not trade on an exchange are valued at the end of day NAV per share. The prospectuses of the open-end registered investment companies in which each Portfolio may invest explain the circumstances under which they will use fair value pricing and the effects of using fair value pricing. Foreign securities’ prices are converted into U.S. dollar amounts using the applicable exchange rates as of Market Close.
When a market quotation for a portfolio security is not readily available or is deemed unreliable (for example when trading has been halted or there are unexpected market closures or other material events that would suggest that the market quotation is unreliable) and for purposes of determining the value of other Portfolio assets, the asset is priced at its fair value. The Board has designated the
NOTES TO FINANCIAL STATEMENTS AS OF DECEMBER 31, 2023 (CONTINUED)
NOTE 2 — SIGNIFICANT ACCOUNTING POLICIES (continued)
Investment Adviser, as the valuation designee, to make fair value determinations in good faith. In determining the fair value of each Portfolio’s assets, the Investment Adviser, pursuant to its fair valuation policy, may consider inputs from pricing service providers, broker-dealers, or each Portfolio’s sub-adviser(s). Issuer specific events, transaction price, position size, nature and duration of restrictions on disposition of the security, market trends, bid/ask quotes of brokers and other market data may be reviewed in the course of making a good faith determination of an asset’s fair value. Because trading hours for certain foreign securities end before Market Close, closing market quotations may become unreliable. The prices of foreign securities will generally be adjusted based on inputs from an independent pricing service that are intended to reflect valuation changes through the NYSE close. Because of the inherent uncertainties of fair valuation, the values used to determine each Portfolio’s NAV may materially differ from the value received upon actual sale of those investments. Thus, fair valuation may have an unintended dilutive or accretive effect on the value of shareholders’ investments in each Portfolio.
The Portfolios’ financial instruments are valued at the close of the NYSE and are reported at fair value, which GAAP defines as the price that would be received to sell an asset or paid to transfer a liability in an orderly transaction between market participants at the measurement date.
Various valuation techniques and inputs are used to determine the fair value of financial instruments. GAAP establishes the following fair value hierarchy that categorizes the inputs used to measure fair value:
Level 1 — quoted prices (unadjusted) in active markets for identical financial instruments that the portfolio can access at the reporting date.
Level 2 — inputs other than Level 1 quoted prices that are observable, either directly or indirectly (including, but not limited to, quoted prices for similar financial instruments in active markets, quoted prices for identical or similar financial instruments in inactive markets, interest rates and yield curves, implied volatilities, and credit spreads).
Level 3 — unobservable inputs (including the portfolio’s own assumptions in determining fair value).
Observable inputs are developed using market data, such as publicly available information about actual events or transactions, and reflect the assumptions that market participants would use to price the financial instrument. Unobservable inputs are those for which market data are not available and are developed using the best information available about the assumptions that market participants
would use to price the financial instrument. GAAP requires valuation techniques to maximize the use of relevant observable inputs and minimize the use of unobservable inputs. When multiple inputs are used to derive fair value, the financial instrument is assigned to the level within the fair value hierarchy based on the lowest-level input that is significant to the fair value of the financial instrument. Input levels are not necessarily an indication of the risk or liquidity associated with financial instruments at that level but rather the degree of judgment used in determining those values.
A table summarizing each Portfolio’s investments under these levels of classification is included within each Portfolio of Investments.
Each investment asset or liability of the Portfolios is assigned a level at measurement date based on the significance and source of the inputs to its valuation. Quoted prices in active markets for identical securities are classified as “Level 1,” inputs other than quoted prices for an asset or liability that are observable are classified as “Level 2” and significant unobservable inputs, including the sub-advisers’ or Pricing Committee’s judgment about the assumptions that a market participant would use in pricing an asset or liability are classified as “Level 3.” The inputs used for valuing securities are not necessarily an indication of the risks associated with investing in those securities. Short-term securities of sufficient credit quality are generally considered to be Level 2 securities under applicable accounting rules. A table summarizing each Portfolio’s investments under these levels of classification is included within the Portfolio of Investments.
GAAP requires a reconciliation of the beginning to ending balances for reported fair values that presents changes attributable to total realized and unrealized gains or losses, purchases and sales, and transfers in or out of the Level 3 category during the period. A reconciliation of Level 3 investments within the Portfolio of Investments is presented only when a Portfolio has a significant amount of Level 3 investments.
B. Securities Transactions and Revenue Recognition. Securities transactions are accounted for on the trade date. Realized gains and losses are reported on the basis of identified cost of securities sold. Interest income is recorded on an accrual basis. Dividend income is recorded on the ex-dividend date, or for certain foreign securities, when the information becomes available to the Portfolios. Premium amortization and discount accretion are determined by the effective yield method.
C. Foreign Currency Translation. The books and records of the Portfolios are maintained in U.S. dollars. Any foreign currency amounts are translated into U.S. dollars on the following basis:
NOTES TO FINANCIAL STATEMENTS AS OF DECEMBER 31, 2023 (CONTINUED)
NOTE 2 — SIGNIFICANT ACCOUNTING POLICIES (continued)
| (1) | Market value of investment securities, other assets and liabilities — at the exchange rates prevailing at Market Close. |
| | |
| (2) | Purchases and sales of investment securities, income and expenses — at the rates of exchange prevailing on the respective dates of such transactions. |
Although the net assets and the market values are presented at the foreign exchange rates at Market Close, the Portfolios do not isolate the portion of their results of operations resulting from changes in foreign exchange rates on investments from the fluctuations arising from changes in market prices of securities held. Such fluctuations are included with the net realized and unrealized gains or losses from investments. For securities, which are subject to foreign withholding tax upon disposition, liabilities are recorded on the Statements of Assets and Liabilities for the estimated tax withholding based on the securities’ current market value. Upon disposition, realized gains or losses on such securities are recorded net of foreign withholding tax.
Reported net realized foreign exchange gains or losses arise from sales of foreign currencies, currency gains or losses realized between the trade and settlement dates on securities transactions, the difference between the amounts of dividends, interest, and foreign withholding tax reclaims recorded on the Portfolios’ books, and the U.S. dollar equivalent of the amounts actually received or paid. Net unrealized foreign exchange gains and losses arise from changes in the value of assets and liabilities other than investments in securities, resulting from changes in the exchange rate. Foreign security and currency transactions may involve certain considerations and risks not typically associated with investing in U.S. companies and U.S. government securities. These risks include, but are not limited to, revaluation of currencies and future adverse political and economic developments which could cause securities and their markets to be less liquid, and prices more volatile than those of comparable U.S. companies and U.S. government securities. The foregoing risks are even greater with respect to securities of issuers in emerging markets.
D. Distributions to Shareholders. Net investment income dividends and net capital gain distributions, if any, for Bond Portfolio are declared and paid annually. For BlackRock Inflation Protected Bond, dividends from net investment income, if any, are declared and paid monthly and distributions of net capital gains, if any, are declared and paid annually. The Portfolios may make distributions on a more frequent basis to comply with the
distribution requirements of the Internal Revenue Code. The characteristics of income and gains to be distributed are determined in accordance with income tax regulations, which may differ from GAAP for investment companies.
E. Federal Income Taxes. It is the policy of each Portfolio to comply with the requirements of subchapter M of the Internal Revenue Code that are applicable to regulated investment companies and to distribute substantially all of its net investment income and any net realized capital gains to its shareholders. Therefore, a federal income tax or excise tax provision is not required. Management has considered the sustainability of the Portfolios’ tax positions taken on federal income tax returns for all open tax years in making this determination. No capital gain distributions shall be made until the capital loss carryforwards have been fully utilized.
The Portfolios may utilize equalization accounting for tax purposes, whereby a portion of redemption payments are treated as distributions of income or gain.
F. Use of Estimates. The preparation of financial statements in conformity with GAAP requires management to make estimates and assumptions that affect the reported amounts of assets and liabilities and disclosure of contingent assets and liabilities at the date of the financial statements and the reported amounts of increases and decreases in net assets from operations during the reporting period. Actual results could differ from those estimates.
G. Risk Exposures and the Use of Derivative Instruments. The Portfolios’ investment strategies permit the Portfolios to enter into various types of derivatives contracts, including, but not limited to, futures contracts, forward foreign currency exchange contracts, credit default swaps, interest rate swaps, total return swaps, and purchased and written options. In doing so, a Portfolio will employ strategies in differing combinations to permit it to increase or decrease the level of risk, or change the level or types of exposure to risk factors. This may allow a Portfolio to pursue its objectives more quickly and efficiently than if it were to make direct purchases or sales of securities capable of affecting a similar response to market or credit factors.
In pursuit of its investment objectives, a Portfolio may seek to increase or decrease its exposure to the following market or credit risk factors:
Credit Risk. The price of a bond or other debt instrument is likely to fall if the issuer’s actual or perceived financial health deteriorates, whether because of broad economic or issuer-specific reasons. In certain cases, the issuer could be late in paying interest or principal, or could fail to pay its financial obligations altogether.
NOTES TO FINANCIAL STATEMENTS AS OF DECEMBER 31, 2023 (CONTINUED)
NOTE 2 — SIGNIFICANT ACCOUNTING POLICIES (continued)
Equity Risk. Stock prices may be volatile or have reduced liquidity in response to real or perceived impacts of factors including, but not limited to, economic conditions, changes in market interest rates, and political events. Stock markets tend to be cyclical, with periods when stock prices generally rise and periods when stock prices generally decline. Any given stock market segment may remain out of favor with investors for a short or long period of time, and stocks as an asset class may underperform bonds or other asset classes during some periods. Additionally, legislative, regulatory or tax policies or developments in these areas may adversely impact the investment techniques available to a manager, add to costs and impair the ability of a Portfolio to achieve its investment objectives.
Foreign Exchange Rate Risk. To the extent that a Portfolio invests directly in foreign (non-U.S.) currencies or in securities denominated in, or that trade in, foreign (non-U.S.) currencies, it is subject to the risk that those foreign (non-U.S.) currencies will decline in value relative to the U.S. dollar or, in the case of hedging positions, that the U.S. dollar will decline in value relative to the currency being hedged by a Portfolio through foreign currency exchange transactions.
Currency rates may fluctuate significantly over short periods of time. Currency rates may be affected by changes in market interest rates, intervention (or the failure to intervene) by U.S. or foreign governments, central banks or supranational entities such as the International Monetary Fund, by the imposition of currency controls, or other political or economic developments in the United States or abroad.
Interest Rate Risk. With bonds and other fixed rate debt instruments, a rise in market interest rates generally causes values to fall; conversely, values generally rise as market interest rates fall. The higher the credit quality of the instrument, and the longer its maturity or duration, the more sensitive it is likely to be to interest rate risk. As of the date of this report, the United States experiences a rising market interest rate environment, which may increase a Portfolio’s exposure to risks associated with rising market interest rates. Rising market interest rates have unpredictable effects on the markets and may expose fixed-income and related markets to heightened volatility. For a fund that invests in fixed-income securities, an increase in market interest rates may lead to increased redemptions and increased portfolio turnover, which could reduce liquidity for certain investments, adversely affect values, and increase costs. If dealer capacity in fixed-income markets is insufficient for market conditions, it may further inhibit liquidity and increase volatility in the fixed-income markets.
Further, recent and potential changes in government policy may affect interest rates.
Risks of Investing in Derivatives. A Portfolio’s use of derivatives can result in losses due to unanticipated changes in the market or credit risk factors and the overall market. In instances where a Portfolio is using derivatives to decrease, or hedge, exposures to market or credit risk factors for securities held by a Portfolio, there are also risks that those derivatives may not perform as expected resulting in losses for the combined or hedged positions.
Derivative instruments are subject to a number of risks, including the risk of changes in the market price of the underlying securities, credit risk with respect to the counterparty, risk of loss due to changes in market interest rates and liquidity and volatility risk. The amounts required to purchase certain derivatives may be small relative to the magnitude of exposure assumed by a Portfolio. Therefore, the purchase of certain derivatives may have an economic leveraging effect on a Portfolio and exaggerate any increase or decrease in the NAV. Derivatives may not perform as expected, so a Portfolio may not realize the intended benefits. When used for hedging purposes, the change in value of a derivative may not correlate as expected with the currency, security or other risk being hedged. When used as an alternative or substitute for direct cash investments, the return provided by the derivative may not provide the same return as direct cash investment. In addition, given their complexity, derivatives expose a Portfolio to the risk of improper valuation.
Generally, derivatives are sophisticated financial instruments whose performance is derived, at least in part, from the performance of an underlying asset or assets. Derivatives include, among other things, swap agreements, options, forwards and futures. Investments in derivatives are generally negotiated over-the-counter (“OTC”) with a single counterparty and as a result are subject to credit risks related to the counterparty’s ability or willingness to perform its obligations; any deterioration in the counterparty’s creditworthiness could adversely affect the value of the derivative. In addition, derivatives and their underlying securities may experience periods of illiquidity which could cause a Portfolio to hold a security it might otherwise sell, or to sell a security it otherwise might hold at inopportune times or at an unanticipated price. A manager might imperfectly judge the direction of the market. For instance, if a derivative is used as a hedge to offset investment risk in another security, the hedge might not correlate to the market’s movements and may have unexpected or undesired results such as a loss or a reduction in gains.
Counterparty Credit Risk and Credit Related Contingent Features. Certain derivative positions are
NOTES TO FINANCIAL STATEMENTS AS OF DECEMBER 31, 2023 (CONTINUED)
NOTE 2 — SIGNIFICANT ACCOUNTING POLICIES (continued)
subject to counterparty credit risk, which is the risk that the counterparty will not fulfill its obligation to a Portfolio. Each Portfolio’s derivative counterparties are financial institutions who are subject to market conditions that may weaken their financial position. A Portfolio intends to enter into financial transactions with counterparties that it believes to be creditworthy at the time of the transaction. To reduce this risk, a Portfolio has entered into master netting arrangements, established within each Portfolio’s International Swap and Derivatives Association, Inc. (“ISDA”) Master Agreements (“Master Agreements”). These Master Agreements are with select counterparties and they govern transactions, including certain OTC derivative and forward foreign currency contracts, entered into by a Portfolio and the counterparty. The Master Agreements maintain provisions for general obligations, representations, agreements, collateral, and events of default or termination. The occurrence of a specified event of termination may give a counterparty the right to terminate all of its contracts and affect settlement of all outstanding transactions under the applicable Master Agreement.
A Portfolio may also enter into collateral agreements with certain counterparties to further mitigate counterparty credit risk on OTC derivative and forward foreign currency contracts. Subject to established minimum levels, collateral is generally determined based on the net aggregate unrealized gain or loss on contracts with a certain counterparty. Collateral pledged to or from a Portfolio is held in a segregated account by a third-party agent and can be in the form of cash or debt securities issued by the U.S. government or related agencies.
At December 31, 2023, the maximum amount of loss that BlackRock Inflation Protected Bond would incur if the counterparties to its derivative transactions failed to perform would be $431,433 which represents the gross payments to be received by the Portfolio on OTC purchased options, forward foreign currency contracts, and OTC inflation- linked swaps were they to be unwound as of December 31, 2023. At December 31, 2023, BlackRock Inflation Protected Bond had received $50,000 in cash collateral from certain counterparties.
Each Portfolio has credit related contingent features that if triggered would allow its derivative counterparties to close out and demand payment or additional collateral to cover their exposure from a Portfolio. Credit related contingent features are established between a Portfolio and its derivatives counterparties to reduce the risk that a Portfolio will not fulfill its payment obligations to its counterparties. These triggering features include, but are not limited to, a percentage decrease in a Portfolio’s net assets and/or
a percentage decrease in a Portfolio’s NAV, which could cause a Portfolio to accelerate payment of any net liability owed to the counterparty. The contingent features are established within each Portfolio’s Master Agreements.
At December 31, 2023, BlackRock Inflation Protected Bond had a liability position of $690,808 on forward foreign currency contracts, OTC credit default swaps, and OTC written options with credit related contingent features. If a contingent feature would have been triggered as of December 31, 2023, the Portfolio could have been required to pay this amount in cash to its counterparties. At December 31, 2023, BlackRock Inflation Protected Bond had not pledged any cash collateral for its open OTC derivative transactions.
H. Forward Foreign Currency Contracts. A Portfolio may enter into forward foreign currency contracts primarily to hedge against foreign currency exchange rate risk on its non-U.S. dollar denominated investment securities. When entering into a forward foreign currency contract, a Portfolio agrees to receive or deliver a fixed quantity of foreign currency for an agreed-upon price on an agreed future date. These contracts are valued daily and a Portfolio’s net equity therein, representing unrealized gain or loss on the contracts as measured by the difference between the forward foreign exchange rates at the dates of entry into the contracts and the forward rates at the reporting date, is included in the Statements of Assets and Liabilities. Realized and unrealized gains and losses are included in the Statements of Operations. These instruments involve market and/or credit risk in excess of the amount recognized in the Statements of Assets and Liabilities. Risks arise from the possible inability of counterparties to meet the terms of their contracts and from movement in currency and securities values and interest rates. Open forward foreign currency contracts are presented within the Portfolio of Investments.
For the year ended December 31, 2023, BlackRock Inflation Protected Bond had entered into forward foreign currency contracts with the obligation to buy and sell specified foreign currencies in the future at a currently negotiated forward rate in order to increase or decrease exposure to foreign exchange rate risk. The Portfolio uses forward foreign currency contracts primarily to protect any non-U.S. dollar- denominated holdings from adverse currency movements and to gain exposure to currencies for the purposes of risk management or enhanced return.
During the year ended December 31, 2023, BlackRock Inflation Protected Bond had average contract amounts of $1,761,450 and $3,118,356 on forward foreign currency contracts purchased and sold, respectively. Please refer to the tables within the Portfolio of Investments for open forward foreign currency contracts at December 31, 2023.
NOTES TO FINANCIAL STATEMENTS AS OF DECEMBER 31, 2023 (CONTINUED)
NOTE 2 — SIGNIFICANT ACCOUNTING POLICIES (continued)
I. Futures Contracts. Each Portfolio may enter into futures contracts involving foreign currency, interest rates, securities and security indices. A futures contract is a commitment to buy or sell a specific amount of a financial instrument at a negotiated price on a stipulated future date. Each Portfolio may buy and sell futures contracts. Futures contracts traded on a commodities or futures exchange will be valued at the final settlement price or official closing price on the principal exchange as reported by such principal exchange at its trading session ending at, or most recently prior to, the time when a Portfolio’s assets are valued.
Upon entering into a futures contract, a Portfolio is required to deposit either cash or securities (initial margin) in an amount equal to a certain percentage of the contract value. Subsequent payments (variation margin) are made or received by a Portfolio each day. The variation margin payments are equal to the daily changes in the contract value and are recorded as unrealized gains and losses and included within Cash collateral for futures contracts on the Statement of Assets and Liabilities. Open futures contracts are reported on a table within the Portfolio of Investments. Securities held in collateralized accounts to cover initial margin requirements on open futures contracts are footnoted in the Portfolio of Investments. Cash collateral held by the broker to cover initial margin requirements on open futures contracts are noted in the Statements of Assets and Liabilities. The net change in unrealized appreciation and depreciation is reported in the Statements of Operations. Realized gains (losses) are reported in the Statements of Operations at the closing or expiration of futures contracts.
Futures contracts are exposed to the market risk factor of the underlying financial instrument. Additional associated risks of entering into futures contracts include the possibility that there may be an illiquid market where a Portfolio is unable to liquidate the contract or enter into an offsetting position and, if used for hedging purposes, the risk that the price of the contract will correlate imperfectly with the prices of a Portfolio’s securities. With futures, there is minimal counterparty credit risk to a Portfolio since futures are exchange traded and the exchange’s clearinghouse, as counterparty to all exchange traded futures, guarantees the futures against default. During the year ended December 31, 2023, BlackRock Inflation Protected Bond and Bond Portfolio had purchased and sold futures contracts on various bonds and notes as part of their duration strategy. During the year ended December 31, 2023, the following Portfolios had average notional values on futures contracts purchased and sold as disclosed below:
| | | Purchased | | | Sold | |
| BlackRock Inflation Protected Bond | | $ | 77,279,106 | | | $ | 55,122,262 | |
| Bond Portfolio | | | 126,348,928 | | | | — | |
Please refer to the tables within Portfolio of Investments for open futures contracts for BlackRock Inflation Protected Bond and Bond Portfolio at December 31, 2023.
At December 31, 2023, BlackRock Inflation Protected Bond had pledged U.S. Treasuries with an original par value of $1,250,000 as collateral for open futures contracts.
J. Options Contracts. The Portfolios may purchase put and call options and may write (sell) put options and covered call options. The Portfolios may engage in option transactions as a hedge against adverse movements in the value of portfolio holdings or to increase market exposure. Option contracts are valued daily and unrealized gains or losses are recorded based upon the last sales price on the principal exchange on which the options are traded. An amount equal to the premium received by the Portfolios upon the writing of a put or call option is included in the Statements of Assets and Liabilities as a liability which is subsequently marked-to-market until it is exercised or closed, or it expires. The Portfolios will realize a gain or loss upon the expiration or closing of the option contract. When an option is exercised, the proceeds on sales of the underlying security for a written call option, the purchase cost of the security for a written put option, or the cost of the security for a purchased put or call option is adjusted by the amount of premium received or paid. Realized and unrealized gains or losses on option contracts are reflected in the accompanying financial statements. The risk in writing a covered call option is that a Portfolio gives up the opportunity for profit if the market price of the security increases and the option is exercised. The risk in writing a put option is that a Portfolio may incur a loss if the market price of the security decreases and the option is exercised. The risk in buying an option is that a Portfolio pays a premium whether or not the option is exercised. Risks may also arise from an illiquid secondary market or from the inability of counterparties to meet the terms of the contract.
During the year ended December 31, 2023, BlackRock Inflation Protected Bond had purchased and written options on exchange-traded futures contracts to manage its duration strategy and to generate income. BlackRock Inflation Protected Bond had average notional values of $118,800,026 and $116,468,900, respectively, on purchased and written exchange-traded futures contracts. Please refer to the tables within the Portfolio of Investments for open purchased and written options on exchange-traded futures contracts at December 31, 2023.
During the year ended December 31, 2023, BlackRock Inflation Protected Bond had purchased and written interest
NOTES TO FINANCIAL STATEMENTS AS OF DECEMBER 31, 2023 (CONTINUED)
NOTE 2 — SIGNIFICANT ACCOUNTING POLICIES (continued)
rate swap options (“swaptions”) to manage its duration strategy and to generate income. BlackRock Inflation Protected Bond had average notional values of $68,429,168 and $66,835,999, respectively, on purchased and written interest rate swaptions. Please refer to the tables within the Portfolio of Investments for open purchased and written interest rate swaptions at December 31, 2023.
During the year ended December 31, 2023, BlackRock Inflation Protected Bond had purchased and written foreign currency options to manage its foreign exchange exposure. BlackRock Inflation Protected Bond had an average notional value of $3,147,164 and $3,147,164, respectively on purchased and written foreign currency options. There were no open purchased or written foreign currency options at December 31, 2023.
K. Swap Agreements. The Portfolios may enter into swap agreements. A swap is an agreement between two parties pursuant to which each party agrees to make one or more payments to the other at specified future intervals based on the return of an asset (such as a stock, bond or currency) or non-asset reference (such as an interest rate or index). Swap agreements are privately negotiated in the OTC market and may be executed in a multilateral or other trade facility platform, such as a registered commodities exchange (“centrally cleared swaps”).
The swap agreement will specify the “notional” amount of the asset or non-asset reference to which the contract relates. Subsequent changes in market value, if any, are calculated based upon changes in the performance of the asset or non-asset reference multiplied by the notional value of the contract. The Portfolios may enter into credit default, interest rate, total return and currency swaps to manage its exposure to credit, currency and interest rate risk. All outstanding swap agreements are reported within the Portfolio of Investments.
Swaps are marked to market daily using quotations primarily from third party pricing services, counterparties or brokers. The value of the swap contract is recorded on the Statements of Assets and Liabilities. During the term of the swap, changes in the value of the swap, if any, are recorded as unrealized gains or losses on the Statements of Operations. Upfront payments paid or received by a Portfolio when entering into the agreements are reported on the Statements of Assets and Liabilities and as a component of the changes in unrealized gains or losses on the Statements of Operations. These upfront payments represent the amounts paid or received when initially entering into the swap agreement to compensate for differences between the stated terms of the swap agreement and the prevailing market conditions. The upfront payments are
included as a component in the realized gains or losses on the Statements of Operations upon termination or maturity of the swap. A Portfolio also records net periodic payments paid or received on the swap contract as a realized gain or loss on the Statements of Operations.
In a centrally cleared swap, immediately following execution of the swap agreement, the swap agreement is novated to a central counterparty (the “CCP”) and a Portfolio’s counterparty on the swap agreement becomes the CCP. A Portfolio is required to interface with the CCP through a broker. Upon entering into a centrally cleared swap, a Portfolio is required to deposit initial margin with the broker in the form of cash or securities in an amount that varies depending on the size and risk profile of the particular swap. Securities deposited as initial margin are footnoted as pledged on the Portfolio of Investments and cash deposited is recorded on the Statements of Assets and Liabilities as cash pledged for centrally cleared swaps. The daily change in valuation of centrally cleared swaps is recorded as a receivable or payable for variation margin in the Statements of Assets and Liabilities. Payments received from (paid to) the counterparty, including at termination, are recorded as realized gain (loss) on the Statements of Operations.
Entering into swap agreements involves the risk that the maximum potential loss of an investment exceeds the current value of the investment as reported on the Statements of Assets and Liabilities. Other risks involve the possibility that the counterparty to the agreements may default on its obligation to perform, that there will be no liquid market for these investments and that unfavorable changes in the market will have a negative impact on the value of the index or securities underlying the respective swap agreement.
Credit Default Swap Contracts. A credit default swap is a bilateral agreement between counterparties in which the buyer of the protection agrees to make a stream of periodic payments to the seller of protection in exchange for the right to receive a specified return in the event of a default or other credit event for a referenced entity, obligation or index. As a seller of protection on credit default swaps, a Portfolio will generally receive from the buyer a fixed payment stream based on the notional amount of the swap contract. This fixed payment stream will continue until the swap contract expires or a defined credit event occurs.
A Portfolio is subject to credit risk in the normal course of pursuing its investment objectives. As a seller of protection in a credit default swap, a Portfolio may execute these contracts to manage its exposure to the market or certain sectors of the market. Certain Portfolios may also enter into credit default swaps to speculate on changes in an issuer’s credit quality, to take advantage of perceived spread
NOTES TO FINANCIAL STATEMENTS AS OF DECEMBER 31, 2023 (CONTINUED)
NOTE 2 — SIGNIFICANT ACCOUNTING POLICIES (continued)
advantages, or to offset an existing short equivalent (i.e. buying protection on an equivalent reference entity).
Certain Portfolios may sell credit default swaps which expose these Portfolios to the risk of loss from credit risk- related events specified in the contract. Although contract specific, credit events are generally defined as bankruptcy, failure to pay, restructuring, obligation acceleration, obligation default or repudiation/moratorium. If a Portfolio is a seller of protection, and a credit event occurs, as defined under the terms of that particular swap agreement, a Portfolio will generally either (i) pay to the buyer an amount equal to the notional amount of the swap and take delivery of the referenced obligation, other deliverable obligations, or underlying securities comprising a referenced index or (ii) pay a net settlement amount in the form of cash or securities equal to the notional amount of the swap less the recovery value of the referenced obligation or underlying securities comprising a referenced index. If a Portfolio is a buyer of protection and a credit event occurs, as defined under the terms of that particular swap agreement, a Portfolio will either (i) receive from the seller of protection an amount equal to the notional amount of the swap and deliver the referenced obligation, other deliverable obligations or underlying securities comprising the referenced index or (ii) receive a net settlement amount in the form of cash or securities equal to the notional amount of the swap less the recovery value of the referenced obligation or underlying securities comprising the referenced index. Recovery values are assumed by market makers considering either industry standard recovery rates or entity specific factors and considerations until a credit event occurs. If a credit event has occurred, the recovery value is determined by a facilitated auction whereby a minimum number of allowable broker bids, together with a specified valuation method, are used to calculate the settlement value.
Implied credit spreads, represented in absolute terms, utilized in determining the fair value of credit default swap agreements on corporate issues or sovereign issues are disclosed in each Portfolio’s Portfolio of Investments and serve as an indicator of the current status of the payment/ performance risk and represent the likelihood or risk of default for the credit derivative. The implied credit spread of a particular referenced entity reflects the cost of buying/ selling protection and may include upfront payments required to be made to enter into the agreement. For credit default swaps on asset-backed securities or credit indices, the quoted market prices and resulting fair values serve as the indicator of the current status of the payment/ performance risk. Wider credit spreads and increasing fair values, in absolute terms when compared to the notional amount of the swap, represent a deterioration
of the referenced entity’s credit soundness and a greater likelihood or risk of default or other credit event occurring as defined under the terms of the agreement.
The maximum amount of future payments (undiscounted) that a Portfolio as seller of protection could be required to make under a credit default swap agreement would be an amount equal to the notional amount of the agreement. These potential amounts would be partially offset by any recovery values of the respective referenced obligations, upfront payments received upon entering into the agreements, or net amounts received from the settlement of buy protection credit default swap agreements entered into by a Portfolio for the same referenced entity or entities.
During the year ended December 31, 2023, BlackRock Inflation Protected Bond sold credit protection on credit default swap indices (“CDX”) with an average notional amount of $1,870,850 to gain additional exposure to the various sectors of the credit market. A CDX is a basket of credit instruments or exposures designed to be representative of some part of the credit market as a whole. There were no open credit default swaps to sell protection at December 31, 2023.
During the year ended December 31, 2023, BlackRock Inflation Protected Bond bought credit protection on certain single-name issuers (corporate or sovereign) with an average notional amount of $732,000 to reduce risk exposure to defaults of corporate and/or sovereign issuers or to create exposure to corporate and/or sovereign issuers to which the Portfolio is not otherwise exposed.
Interest Rate Swap Contracts. An interest rate swap involves the agreement between counterparties to exchange periodic payments based on interest rates. One payment will be based on a floating rate of a specified interest rate while the other will be a fixed rate. Risks involve the future fluctuations of interest rates in which a Portfolio may make payments that are greater than what a Portfolio received from the counterparty. Other risks include credit, liquidity and market risk.
For the year ended December 31, 2023, BlackRock Inflation Protected Bond had entered into interest rate swaps in which they pay a floating interest rate and receive a fixed interest rate (“Long interest rate swap”) in order to increase exposure to interest rate risk. Average notional amount on long interest rate swaps for BlackRock Inflation Protected Bond was $25,761,117.
For the year ended December 31, 2023, BlackRock Inflation Protected Bond had entered into interest rate swaps in which they pay a fixed interest rate and receives a floating interest rate (“Short interest rate swap”) in order to decrease exposure to interest rate risk. Average notional
NOTES TO FINANCIAL STATEMENTS AS OF DECEMBER 31, 2023 (CONTINUED)
NOTE 2 — SIGNIFICANT ACCOUNTING POLICIES (continued)
amount on short interest rate swaps for BlackRock Inflation Protected Bond was $8,233,882.
The Portfolios enter into interest rate swaps to adjust interest rate and yield curve exposures and to substitute for physical fixed-income securities. Please refer to the tables within the Portfolio of Investments for BlackRock Inflation Protected Bond for open interest rate swaps at December 31, 2023.
Inflation-linked Swap Contracts. In an inflation-linked swap, one party pays a fixed interest rate on a notional amount while the other party pays a floating rate linked to an inflation index on that same notional amount. The party paying the floating rate pays the inflation adjusted rate multiplied by the notional amount.
For the year ended December 31, 2023, BlackRock Inflation Protected Bond had entered into inflation-linked swaps in which they pay a floating rate linked to an inflation index and receive a fixed interest rate (“long inflation-linked swap”). Average notional amount on long inflation-linked swaps for BlackRock Inflation Protected Bond was $3,537,714.
For the year ended December 31, 2023, BlackRock Inflation Protected Bond had entered into inflation-linked swaps in which it pays a fixed interest rate and receives a floating rate linked to an inflation index (“short inflation- linked swap”). Average notional amount on short inflation linked-bonds was $115,388,605.
BlackRock Inflation Protected Bond used inflation-linked swaps as part of their inflation strategy. Please refer to the tables within the Portfolio of Investments for BlackRock Inflation Protected Bond for open inflation-linked swaps at December 31, 2023.
At December 31, 2023, BlackRock Inflation Protected Bond pledged $3,158,000 in cash collateral for open centrally cleared swaps.
L. Inflation-Indexed Bonds. Inflation-indexed bonds are fixed income securities whose principal value is periodically adjusted according to the rate of inflation. If the index measuring inflation rises or falls, the principal value of inflation-indexed bonds will be adjusted upward or downward, and consequently the interest payable on these securities (calculated with respect to a larger or smaller principal amount) will be increased or reduced, respectively. Any upward or downward adjustment in the principal amount of an inflation-indexed bond will be included in interest income in the Statement of Operations, even though investors do not receive their principal until maturity. Repayment of the original bond principal upon maturity (as adjusted for inflation) is guaranteed in the case
of US Treasury inflation-indexed bonds. For bonds that do not provide a similar guarantee, the adjusted principal value of the bond repaid at maturity may be less than the original principal.
M. Securities Lending. Each Portfolio may temporarily loan up to 33⅓% of its total assets to brokers, dealers or other financial institutions in exchange for a negotiated lender’s fee. Securities lending involves two primary risks: “investment risk” and “borrower default risk.” When lending securities, the Portfolios will receive cash or U.S. government securities as collateral. Investment risk is the risk that the Portfolios will lose money from the investment of the cash collateral received from the borrower. Borrower default risk is the risk that the Portfolios will lose money due to the failure of a borrower to return a borrowed security. Loans are subject to termination at the option of the borrower or the Portfolios. Securities lending may result in leverage. The use of leverage may exaggerate any increase or decrease in the NAV, causing the Portfolios to be more volatile. The use of leverage may increase expenses and increase the impact of the Portfolios’ other risks.
N. Sales Commitments. Sales commitments involve commitments to sell fixed income securities where the unit price and the estimated principal amount are established upon entering into the contract, with the actual principal amount being within a specified range of the estimate. A Portfolio will enter into sale commitments to hedge its portfolio positions or to sell mortgage-backed securities it owns under delayed delivery arrangements. Proceeds of sale commitments are not received until the contractual settlement date. During the time a sale commitment is outstanding, except for delayed delivery transactions, the Portfolio will maintain, in a segregated account, cash or marketable securities in an amount sufficient to meet the purchase price. Unsettled sale commitments are valued at current market value of the underlying securities. If the sale commitment is closed through the acquisition of an offsetting purchase commitment, the Portfolio realizes a gain or loss on the commitment without regard to any unrealized gain or loss on the underlying security. If the Portfolio delivers securities under the commitment, the Portfolio realizes a gain or loss from the sale of the securities, based upon the unit price established at the date the commitment was entered into. Please refer to the table following the Portfolio of Investments for open sales commitments held by BlackRock Inflation Protected Bond at December 31, 2023.
O. Indemnifications. In the normal course of business, the Portfolios may enter into contracts that provide certain indemnifications. The Trusts’ maximum exposure under these arrangements is dependent on future claims that may be made against the Portfolios and, therefore, cannot be estimated; however, based on experience, management considers the risk of loss from such claims remote.
NOTES TO FINANCIAL STATEMENTS AS OF DECEMBER 31, 2023 (CONTINUED)
NOTE 3 — INVESTMENT TRANSACTIONS
For the year ended December 31, 2023, the cost of purchases and the proceeds from the sales of securities, excluding U.S. government and short-term securities, were as follows:
| | | Purchases | | | Sales | |
| BlackRock Inflation Protected Bond | | $ | 239,263,170 | | | $ | 251,459,265 | |
| Bond Portfolio | | | 4,441,863 | | | | 52,538,844 | |
U.S. government securities not included above were as follows:
| | | Purchases | | | Sales | |
| BlackRock Inflation Protected Bond | | $ | 341,173,193 | | | $ | 349,879,189 | |
| Bond Portfolio | | | 279,233,347 | | | | 276,815,326 | |
NOTE 4 — INVESTMENT MANAGEMENT FEES
The Portfolios have entered into investment management agreements (“Management Agreements”) with the Investment Adviser. The Investment Adviser has overall responsibility for the management of the Portfolios. The Investment Adviser oversees all investment management and portfolio management services for the Portfolios and assists in managing and supervising all aspects of the general day-to-day business activities and operations of the Portfolios, including custodial, transfer agency, dividend disbursing, accounting, auditing, compliance and related services. Each Management Agreement compensates the Investment Adviser with a management fee, computed daily and payable monthly, based on the average daily net assets of each Portfolio, at the following annual rates:
| Portfolio | | Fee |
| BlackRock Inflation Protected | | 0.55% on the first $200 million; |
| Bond(1) | | 0.50% on the next $800 million; and 0.40% thereafter |
| Bond Portfolio | | 0.50% on the first $750 million; and 0.48% thereafter |
| (1) | The Investment Adviser has contractually agreed to waive 0.05% of the management fee. Any fees waived or reimbursed are not eligible for recoupment. Termination or modification of this obligation requires approval by the Board. |
The Investment Adviser has entered into sub-advisory agreements with each sub-adviser. These sub-advisers provide investment advice for the Portfolios and are paid by the Investment Adviser based on the average daily net assets of each Portfolio. Subject to such policies as the Board or the Investment Adviser may determine, the sub- advisers manage each Portfolio’s assets in accordance with that Portfolio’s investment objectives, policies, and limitations.
| Portfolio | | Sub-Adviser |
| BlackRock Inflation Protected Bond | | BlackRock Financial Management, Inc. |
| Bond Portfolio | | Brandywine Global Investment Management, LLC |
NOTE 5 — DISTRIBUTION AND SERVICE FEES
Voya Investors Trust has entered into a shareholder service plan (the “Plan”) for the Class S shares of BlackRock Inflation Protected Bond. The Plan compensates the Distributor for the provision of shareholder services and/ or account maintenance services to direct or indirect beneficial owners of Class S shares. Under the Plan, the Portfolio makes payments to the Distributor at an annual rate of 0.25% of the Portfolio’s average daily net assets attributable to Class S shares.
Class ADV shares of BlackRock Inflation Protected Bond have a shareholder service and distribution plan. The Portfolio pays the Distributor a shareholder service fee of 0.25% and a distribution fee of 0.35% of the Portfolio’s average daily net assets attributable to Class ADV shares.
NOTE 6 — OTHER TRANSACTIONS WITH AFFILIATES AND RELATED PARTIES
At December 31, 2023, the following direct or indirect, wholly-owned subsidiaries of Voya Financial, Inc. or affiliated investment companies owned more than 5% of the following Portfolios:
Subsidiary/Affiliated Investment
Company | | Portfolio | | Percentage |
| Voya Institutional Trust Company | | BlackRock Inflation Protected Bond | | 19.06% |
| Voya Solution 2025 Portfolio | | Bond Portfolio | | 13.05 |
| Voya Solution 2035 Portfolio | | Bond Portfolio | | 12.35 |
| Voya Solution Income Portfolio | | Bond Portfolio | | 9.39 |
| Voya Solution Moderately Aggressive Portfolio | | Bond Portfolio | | 7.87 |
The Portfolios have adopted a deferred compensation plan (the “DC Plan”), which allows eligible independent trustees, as described in the DC Plan, to defer the receipt of all or a portion of the trustees’ fees that they are entitled to receive from the Portfolios. For purposes of determining the amount owed to the trustee under the DC Plan, the amounts deferred are invested in shares of the funds selected by the trustee (the “Notional Funds”). When the Portfolios purchase shares of the Notional Funds, which are all advised by Voya Investments, in amounts equal to the trustees’ deferred fees, this results in a Portfolio asset equal to the deferred compensation liability. Such assets, if applicable, are included as a component of “Other assets” on the accompanying Statements of Assets and Liabilities.
NOTES TO FINANCIAL STATEMENTS AS OF DECEMBER 31, 2023 (CONTINUED)
NOTE 6 — OTHER TRANSACTIONS WITH AFFILIATES AND RELATED PARTIES (continued)
Deferral of trustees’ fees under the DC Plan will not affect net assets of the Portfolios, and will not materially affect a Portfolio’s assets, liabilities or net investment income per share. Amounts will be deferred until distributed in accordance with the DC Plan.
The Portfolios may pay per account fees to affiliates of Voya Investments for recordkeeping services provided on certain assets. For the year ended December 31, 2023, the per account fees for affiliated recordkeeping services paid by each Portfolio were as follows:
| Portfolio | | Amount |
| BlackRock Inflation Protected Bond | | $64,940 |
NOTE 7 — EXPENSE LIMITATION AGREEMENTS
The Investment Adviser has entered into written expense limitation agreements (“Expense Limitation Agreements”) with the below Portfolios, whereby the Investment Adviser has agreed to limit expenses, excluding interest, taxes, investment-related costs, leverage expenses, extraordinary expenses, and acquired fund fees and expenses to the levels listed below:
| Portfolio | | Maximum Operating Expense Limit (as a percentage of net assets) |
| BlackRock Inflation Protected | | Class ADV: 1.23% |
| Bond | | Class I: 0.63% |
| | | Class S: 0.88% |
| Bond Portfolio | | 0.58% |
With the exception of the non-recoupable management fee waiver for BlackRock Inflation Protected Bond, the Investment Adviser may, at a later date, recoup from a Portfolio for fees waived and/or other expenses reimbursed by the Investment Adviser during the previous 36 months, but only if, after such recoupment, a Portfolio’s expense ratio does not exceed the percentage described above. Waived and reimbursed fees net of any recoupment by the Investment Adviser of such waived and reimbursed fees are reflected on the accompanying Statements of Operations. Amounts payable by the Investment Adviser are reflected on the accompanying Statements of Assets and Liabilities.
The Expense Limitation Agreements are contractual through May 1, 2024 and shall renew automatically for one- year terms. Termination or modification of these obligations requires approval by the Board.
NOTE 8 — LINE OF CREDIT
Effective June 12, 2023, the Portfolios, in addition to certain other funds managed by the Investment Adviser, entered into a 364-day unsecured committed revolving line of credit agreement (the “Credit Agreement”) with The Bank
of New York Mellon (“BNY”) for an aggregate amount of $400,000,000 through June 10, 2024. The proceeds may be used only to finance temporarily: (1) the purchase or sale of investment securities; or (2) the repurchase or redemption of shares of the Portfolio or certain other funds managed by the Investment Adviser. The funds to which the line of credit is available pay a commitment fee equal to 0.15% per annum on the daily unused portion of the committed line amount payable quarterly in arrears. Prior to June 12, 2023, the predecessor line of credit was for an aggregate amount of $400,000,000 and the funds to which the line of credit was available paid a commitment fee equal to 0.15% per annum on the daily unused portion of the committed line amount through June 12, 2023.
Borrowings under the Credit Agreement accrue interest at the federal funds rate plus a specified margin. Repayments generally must be made within 60 days after the date of a revolving credit advance.
The following Portfolio utilized the line of credit during the year ended December 31, 2023:
Portfolio | | Days
Utilized | | | Approximate
Average
Daily Balance
For Days
Utilized | | | Approximate Weighted
Average
Interest Rate
For Days Utilized | |
| BlackRock Inflation Protected Bond | | | 9 | | | $ | 1,468,000 | | | | 6.10% | |
NOTES TO FINANCIAL STATEMENTS AS OF DECEMBER 31, 2023 (CONTINUED)
NOTE 9 — CAPITAL SHARES
Transactions in capital shares and dollars were as follows:
| | | Shares
sold | | Shares
issued in
merger | | Reinvestment
of
distributions | | Shares
redeemed | | Shares
converted | | Net
increase
(decrease)
in
shares
outstanding | | Shares
sold | | Proceeds from
shares
issued in
merger | | Reinvestment
of
distributions | | Shares
redeemed | | Shares
converted | | Net increase
(decrease) |
Year or
period ended | | # | | # | | # | | # | | # | | # | | ($) | | ($) | | ($) | | ($) | | ($) | | ($) |
| | | | | | | | | | | | | | | | | | | | | | | | | |
| BlackRock Inflation Protected Bond |
| Class ADV | | | | | | | | | | | | | | | | | | | | | | | | |
| 12/31/2023 | | 300,597 | | — | | 142,664 | | (980,003) | | — | | (536,742) | | 2,682,282 | | — | | 1,253,985 | | (8,599,596) | | — | | (4,663,329) |
| 12/31/2022 | | 742,141 | | — | | 201,639 | | (1,424,707) | | — | | (480,927) | | 7,118,548 | | — | | 1,918,363 | | (13,507,332) | | — | | (4,470,421) |
| Class I | | | | | | | | | | | | | | | | | | | | | | | | |
| 12/31/2023 | | 1,705,465 | | — | | 285,505 | | (2,945,229) | | — | | (954,259) | | 15,616,749 | | — | | 2,616,072 | | (26,971,145) | | — | | (8,738,324) |
| 12/31/2022 | | 1,613,713 | | — | | 370,479 | | (2,199,454) | | — | | (215,262) | | 15,791,074 | | — | | 3,654,341 | | (21,908,961) | | — | | (2,463,546) |
| Class S | | | | | | | | | | | | | | | | | | | | | | | | |
| 12/31/2023 | | 304,172 | | — | | 442,310 | | (3,274,121) | | — | | (2,527,639) | | 2,784,423 | | — | | 4,021,674 | | (29,781,848) | | — | | (22,975,751) |
| 12/31/2022 | | 1,396,821 | | — | | 661,960 | | (3,220,032) | | — | | (1,161,251) | | 14,190,708 | | — | | 6,492,802 | | (31,203,343) | | — | | (10,519,833) |
| Bond Portfolio | | | | | | | | | | | | | | | | | | | | | | | | |
| 12/31/2023 | | 5,634,277 | | — | | 535,758 | | (11,014,776) | | — | | (4,844,741) | | 52,927,045 | | — | | 5,046,842 | | (104,883,514) | | — | | (46,909,627) |
| 12/31/2022 | | 8,077,848 | | — | | 1,724,978 | | (11,748,216) | | — | | (1,945,390) | | 84,693,352 | | — | | 17,111,781 | | (123,596,753) | | — | | (21,791,620) |
NOTE 10 — SECURITIES LENDING
Under an agreement with BNY, the Portfolios can lend its securities to approved brokers, dealers and other financial institutions. Loans are collateralized by cash and U.S. government securities. The collateral must be equal to at least 105% of the market value of non-U.S. securities loaned and 102% of the market value of U.S. securities loaned. The market value of the loaned securities is determined at Market Close of a Portfolio at their last sale price or official closing price on the principal exchange or system on which they are traded and any additional collateral is delivered to a Portfolio on the next business day. The cash collateral received is invested in approved investments as defined in the Securities Lending Agreement with BNY (the “Agreement”). The Portfolios bear the risk of loss with respect to the investment of collateral with the following exception: BNY provides the Portfolios indemnification from loss with respect to the investment of collateral to the extent the cash collateral is invested in overnight repurchase agreements.
Cash collateral received in connection with securities lending is invested in cash equivalents, money market funds, repurchase agreements with maturities of not more than 99 days that are collateralized with U.S. Government securities, or certain short-term investments that have a remaining maturity of 190 days or less (“Permitted Investments”). Short-term investments include: securities, units, shares or other participations in short-term investment funds, pools or trusts; commercial paper, notes, bonds or other debt obligations, certificates of deposit, time deposits and other bank obligations and asset-backed commercial paper backed by diversified receivables and repurchase-
backed programs. Permitted Investments are subject to certain guidelines established by the Adviser regarding liquidity, diversification, credit quality and average credit life/duration requirements. The securities purchased with cash collateral received are reflected in the Portfolio of Investments under Short-Term Investments.
Generally, in the event of counterparty default, a Portfolio has the right to use the collateral to offset losses incurred. The Agreement contains certain guarantees by BNY in the event of counterparty default and/or a borrower’s failure to return a loaned security; however, there would be a potential loss to a Portfolio in the event a Portfolio is delayed or prevented from exercising its right to dispose of the collateral. Engaging in securities lending could have a leveraging effect, which may intensify the credit, market and other risks associated with investing in a portfolio.
At December 31, 2023, the Portfolios did not have any outstanding securities on loan.
NOTES TO FINANCIAL STATEMENTS AS OF DECEMBER 31, 2023 (CONTINUED)
NOTE 11 — FEDERAL INCOME TAXES
The amount of distributions from net investment income and net realized capital gains are determined in accordance with federal income tax regulations, which may differ from GAAP for investment companies. These book/tax differences may be either temporary or permanent. Permanent differences are reclassified within the capital accounts based on their federal tax-basis treatment; temporary differences are not reclassified. Key differences include the treatment of foreign currency transactions, futures contracts, paydowns, straddle loss deferrals, swaps and wash sale deferrals. Distributions in excess of net investment income and/or net realized capital gains for tax purposes are reported as return of capital.
The following permanent tax differences have been reclassified as of December 31, 2023:
| | Paid-in Capital | | Distributable Earnings |
| BlackRock Inflation Protected Bond | $2,529 | | $(2,529) |
Dividends paid by the Portfolios from net investment income and distributions of net realized short-term capital gains are, for federal income tax purposes, taxable as ordinary income to shareholders.
The tax composition of dividends and distributions to shareholders was as follows:
| | | Year Ended December 31,
2023 | | | Year Ended December 31, 2022 | |
| | | Ordinary Income | | | Ordinary Income | | | Long-term Capital Gains | | | Return of Capital | |
| BlackRock Inflation Protected Bond | | $ | 7,891,731 | | | $ | 10,633,925 | | | $ | — | | | $ | 1,431,581 | |
| Bond Portfolio | | | 5,046,842 | | | | 11,934,135 | | | | 5,177,646 | | | | — | |
The tax-basis components of distributable earnings and the capital loss carryforwards which may be used to offset future realized capital gains for federal income tax purposes as of December 31, 2023 were:
| | | Undistributed
Ordinary | | | Unrealized
Appreciation/ | | Capital Loss Carryforwards | | | Total
Distributable | |
| | | Income | | | (Depreciation) | | Amount | | Character | | | Earnings/(Loss) | |
| BlackRock Inflation Protected Bond | | $ | 79,598 | | | $ | (15,331,247) | | $ | (10,849,324) | | | Short-term | | | $ | (87,301,256) | |
| | | | | | | | | | | (61,200,283) | | | Long-t erm | | | | | |
| | | | | | | | | | $ | (72,049,607) | | | | | | | | |
| Bond Portfolio | | | 9,402,332 | | | | 176,932 | | | (26,875,666) | | | Short-term | | | | (24,103,607) | |
| | | | | | | | | | | (6,807,205) | | | Long-term | | | | | |
| | | | | | | | | | $ | (33,682,871) | | | | | | | | |
The Portfolios’ major tax jurisdictions are U.S. federal, Arizona state, and Massachusetts state (BlackRock Inflation Protected Bond).
As of December 31, 2023, no provision for income tax is required in the Portfolios’ financial statements as a result of tax positions taken on federal and state income tax returns for open tax years. The Portfolios’ federal and state income and federal excise tax returns for tax years for which the applicable statutes of limitations have not expired are subject to examination by the Internal Revenue Service and state department of revenue. Generally, the preceding four tax years remain subject to examination by these jurisdictions.
NOTES TO FINANCIAL STATEMENTS AS OF DECEMBER 31, 2023 (CONTINUED)
NOTE 12 — LONDON INTERBANK OFFERED RATE (“LIBOR”)
The London Interbank Offered Rate (“LIBOR”) was the offered rate for short-term Eurodollar deposits between major international banks. The terms of investments, financings or other transactions (including certain derivatives transactions) to which the Portfolio may be a party have historically been tied to LIBOR. In connection with the global transition away from LIBOR led by regulators and market participants, LIBOR was last published on a representative basis at the end of June 2023. Alternative reference rates to LIBOR have been established in most major currencies and markets in these new rates are continuing to develop. The transition away from LIBOR to the use of replacement rates has gone relatively smoothly on the Portfolio and the financial instruments in which it invests; however, longer- term impacts are still uncertain.
In addition, interest rates or other types of rates and indices which are classed as “benchmarks” have been the subject of ongoing national and international regulatory reform, including under the European Union regulation on indices used as benchmarks in financial instruments and financial contracts (known as the “Benchmarks Regulation”). The Benchmarks Regulation has been enacted into United Kingdom law by virtue of the European Union (Withdrawal) Act 2018 (as amended), subject to amendments made by the Benchmarks (Amendment and Transitional Provision) (EU Exit) Regulations 2019 (SI 2019/657) and other statutory instruments. Following the implementation of these reforms, the manner of administration of benchmarks has changed and may further change in the future, with the result that relevant benchmarks may perform differently than in the past, the use of benchmarks that are not compliant with the new standards by certain supervised entities may be restricted, and certain benchmarks may be eliminated entirely. Such changes could cause increased market volatility and disruptions in liquidity for instruments that rely on or are impacted by such benchmarks. Additionally, there could be other consequences which cannot be predicted.
NOTE 13 — MARKET DISRUPTION
A Portfolio is subject to the risk that geopolitical events will disrupt securities markets and adversely affect global economies and markets. Due to the increasing interdependence among global economies and markets, conditions in one country, market, or region might adversely impact markets, issuers and/or foreign exchange rates in other countries, including the United States. Wars, terrorism, global health crises and pandemics, and other geopolitical events that have led, and may continue to lead, to increased market volatility and may have adverse short- or long- term effects on U.S. and global economies and markets,
generally. For example, the COVID-19 pandemic resulted in significant market volatility, exchange suspensions and closures, declines in global financial markets, higher default rates, supply chain disruptions, and a substantial economic downturn in economies throughout the world. The economic impacts of COVID-19 have created a unique challenge for real estate markets. Many businesses have either partially or fully transitioned to a remote-working environment and this transition may negatively impact the occupancy rates of commercial real estate over time. Natural and environmental disasters and systemic market dislocations are also highly disruptive to economies and markets. In addition, military action by Russia in Ukraine has, and may continue to, adversely affect global energy and financial markets and therefore could affect the value of investments, including beyond those with direct exposure to Russian issuers or nearby geographic regions. The extent and duration of the military action, sanctions, and resulting market disruptions are impossible to predict and could be substantial. A number of U.S. domestic banks and foreign (non-U.S.) banks have recently experienced financial difficulties and, in some cases, failures. There can be no certainty that the actions taken by regulators to limit the effect of those financial difficulties and failures on other banks or other financial institutions or on the U.S. or foreign (non-U.S.) economies generally will be successful. It is possible that more banks or other financial institutions will experience financial difficulties or fail, which may affect adversely other U.S. or foreign (non-U.S.) financial institutions and economies. These events as well as other changes in foreign (non-U.S.) and domestic economic, social, and political conditions also could adversely affect individual issuers or related groups of issuers, securities markets, interest rates, credit ratings, inflation, investor sentiment, and other factors affecting the value of a Portfolio’s investments. Any of these occurrences could disrupt the operations of a Portfolio and of a Portfolio’s service providers.
NOTE 14 — OTHER ACCOUNTING PRONOUNCEMENTS
In June 2022, the FASB issued Accounting Standards Update (ASU), ASU 2022-03, Fair Value Measurement (Topic 820) — Fair Value Measurement of Equity Securities Subject to Contractual Sale Restrictions, which clarifies that a contractual restriction on the sale of an equity security is not considered part of the unit of account of the equity security and, therefore, is not considered in measuring fair value. The amendments under this ASU are effective for fiscal years beginning after December 15, 2023; however, early adoption is permitted. The amendment was early adopted. Management expects that the adoption of the guidance will not have a material impact on the Portfolios' financial statements.
NOTES TO FINANCIAL STATEMENTS AS OF DECEMBER 31, 2023 (CONTINUED)
NOTE 15 — SUBSEQUENT EVENTS
Dividends: Subsequent to December 31, 2023, the following Portfolio paid dividends from net investment income of:
| | | Per Share
Amount | | | Payable Date | | Record
Date |
| BlackRock Inflation Protected Bond |
| Class ADV | | $0.0058 | | | February 1, 2024 | | January 30, 2024 |
| Class I | | $0.0101 | | | February 1, 2024 | | January 30, 2024 |
| Class S | | $0.0083 | | | February 1, 2024 | | January 30, 2024 |
The Portfolios have evaluated events occurring after the Statements of Assets and Liabilities date through the date that the financial statements were issued (“subsequent events”), to determine whether any subsequent events necessitated adjustment to or disclosure in the financial statements. Other than the above, no such subsequent events were identified.
VY® BlackRock Inflation
Protected Bond Portfolio | PORTFOLIO OF INVESTMENTS
as of December 31, 2023 |
Principal
Amount† | | | | | Value | | | Percentage
of Net
Assets | |
| U.S. TREASURY OBLIGATIONS: 51.7% | |
| | | | United States Treasury Inflation Indexed Bonds: 19.3% |
| 2,365,000 | | | 0.125%, 02/15/2051 | | $ | 1,732,654 | | | | 0.8 | |
| 3,005,000 | | | 0.125%, 02/15/2052 | | | 2,039,170 | | | | 0.9 | |
| 2,776,390 | | | 0.250%, 02/15/2050 | | | 1,812,485 | | | | 0.8 | |
| 2,736,660 | | | 0.625%, 02/15/2043 | | | 2,140,081 | | | | 1.0 | |
| 3,573,818 | | | 0.750%, 02/15/2042 | | | 2,899,732 | | | | 1.3 | |
| 4,207,123 (1) | | | 0.750%, 02/15/2045 | | | 3,293,138 | | | | 1.5 | |
| 2,759,444 | | | 0.875%, 02/15/2047 | | | 2,177,266 | | | | 1.0 | |
| 2,181,463 | | | 1.000%, 02/15/2046 | | | 1,786,605 | | | | 0.8 | |
| 1,721,785 | | | 1.000%, 02/15/2048 | | | 1,390,978 | | | | 0.6 | |
| 240,000 | | | 1.000%, 02/15/2049 | | | 236,507 | | | | 0.1 | |
| 3,735,996 (1) | | | 1.375%, 02/15/2044 | | | 3,342,874 | | | | 1.5 | |
| 2,923,988 | | | 1.500%, 02/15/2053 | | | 2,653,834 | | | | 1.2 | |
| 710,812 (1) | | | 1.750%, 01/15/2028 | | | 706,649 | | | | 0.3 | |
| 1,325,687 | | | 2.125%, 02/15/2040 | | | 1,362,767 | | | | 0.6 | |
| 2,247,920 | | | 2.125%, 02/15/2041 | | | 2,310,700 | | | | 1.1 | |
| 2,325,000 | | | 2.375%, 10/15/2028 | | | 2,406,251 | | | | 1.1 | |
| 2,092,224 | | | 2.500%, 01/15/2029 | | | 2,163,635 | | | | 1.0 | |
| 1,274,020 | | | 3.375%, 04/15/2032 | | | 1,426,146 | | | | 0.7 | |
| 2,545,224 | | | 3.625%, 04/15/2028 | | | 2,727,431 | | | | 1.3 | |
| 3,336,974 | | | 3.875%, 04/15/2029 | | | 3,679,791 | | | | 1.7 | |
| | | | | | | 42,288,694 | | | | 19.3 | |
| | | | United States Treasury Inflation Indexed Notes: 32.3% |
| 1,974,307 | | | 0.125%, 10/15/2025 | | | 1,898,702 | | | | 0.9 | |
| 1,845,000 | | | 0.125%, 10/15/2026 | | | 1,973,090 | | | | 0.9 | |
| 98,072 | | | 0.125%, 04/15/2027 | | | 92,179 | | | | 0.0 | |
| 1,201,819 | | | 0.125%, 01/15/2030 | | | 1,089,811 | | | | 0.5 | |
| 4,050,034 | | | 0.125%, 07/15/2030 | | | 3,660,765 | | | | 1.7 | |
| 4,491,258 | | | 0.125%, 01/15/2031 | | | 4,011,092 | | | | 1.8 | |
| 7,559,185 | | | 0.125%, 07/15/2031 | | | 6,724,277 | | | | 3.1 | |
| 8,246,631 (1) | | | 0.125%, 01/15/2032 | | | 7,247,455 | | | | 3.3 | |
| 3,065,000 | | | 0.250%, 07/15/2029 | | | 3,408,562 | | | | 1.5 | |
| 207,530 | | | 0.375%, 07/15/2027 | | | 197,253 | | | | 0.1 | |
| 8,863,244 | | | 0.625%, 07/15/2032 | | | 8,102,560 | | | | 3.7 | |
| 5,779,176 | | | 0.750%, 07/15/2028 | | | 5,532,684 | | | | 2.5 | |
| 1,776,900 | | | 0.875%, 01/15/2029 | | | 2,072,852 | | | | 0.9 | |
| 8,474,780 (1) | | | 1.125%, 01/15/2033 | | | 8,023,118 | | | | 3.7 | |
| 5,754,401 | | | 1.250%, 04/15/2028 | | | 5,606,421 | | | | 2.6 | |
| 8,115,000 | | | 1.375%, 07/15/2033 | | | 7,976,573 | | | | 3.6 | |
| 3,300,800 | | | 1.625%, 10/15/2027 | | | 3,403,311 | | | | 1.5 | |
| | | | | | | 71,020,705 | | | | 32.3 | |
| | | | United States Treasury Notes: 0.1% |
| 160,000 | | | 3.875%, 08/15/2033 | | | 159,850 | | | | 0.1 | |
| | | | Total U.S. Treasury Obligations
(Cost $122,549,625) | | | 113,469,249 | | | | 51.7 | |
| |
| CORPORATE BONDS/NOTES: 26.1% |
| | | | Basic Materials: 0.1% |
| 65,000 (2) | | | Glencore Funding LLC, 3.875%, 10/27/2027 | | | 62,868 | | | | 0.0 | |
| 142,000 (2) | | | Glencore Funding LLC, 6.375%, 10/06/2030 | | | 152,613 | | | | 0.1 | |
| 32,000 | | | Newmont Corp., 2.600%, 07/15/2032 | | | 27,374 | | | | 0.0 | |
| | | | | | | 242,855 | | | | 0.1 | |
Principal
Amount† | | | | | Value | | | Percentage
of Net
Assets | |
| CORPORATE BONDS/NOTES: (continued) | |
| | | | Communications: 2.7% | |
| 207,000 | | | AT&T, Inc., 3.550%, 09/15/2055 | | $ | 148,971 | | | | 0.1 | |
| 149,000 | | | AT&T, Inc., 3.650%, 09/15/2059 | | | 106,917 | | | | 0.0 | |
| 323,000 | | | AT&T, Inc., 4.300%, 02/15/2030 | | | 316,556 | | | | 0.1 | |
| 175,000 | | | AT&T, Inc., 4.500%, 03/09/2048 | | | 152,881 | | | | 0.1 | |
| 264,000 | | | AT&T, Inc., 5.400%, 02/15/2034 | | | 272,374 | | | | 0.1 | |
| 213,000 | | | Charter Communications Operating LLC / Charter Communications Operating Capital, 3.900%, 06/01/2052 | | | 143,452 | | | | 0.1 | |
| 88,000 | | | Charter Communications Operating LLC / Charter Communications Operating Capital, 3.950%, 06/30/2062 | | | 55,461 | | | | 0.0 | |
| 338,000 | | | Charter Communications Operating LLC / Charter Communications Operating Capital, 4.800%, 03/01/2050 | | | 262,070 | | | | 0.1 | |
| 223,000 | | | Comcast Corp., 2.937%, 11/01/2056 | | | 146,803 | | | | 0.1 | |
| 46,000 | | | Comcast Corp., 3.750%, 04/01/2040 | | | 39,594 | | | | 0.0 | |
| 145,000 | | | Comcast Corp., 4.800%, 05/15/2033 | | | 146,873 | | | | 0.1 | |
| 155,000 | | | FactSet Research Systems, Inc., 3.450%, 03/01/2032 | | | 138,936 | | | | 0.1 | |
| 109,000 | | | Meta Platforms, Inc., 5.750%, 05/15/2063 | | | 119,464 | | | | 0.1 | |
| 259,000 | | | Motorola Solutions, Inc., 2.750%, 05/24/2031 | | | 221,520 | | | | 0.1 | |
| 33,000 | | | Motorola Solutions, Inc., 5.500%, 09/01/2044 | | | 32,894 | | | | 0.0 | |
| 100,000 | | | Motorola Solutions, Inc., 5.600%, 06/01/2032 | | | 103,234 | | | | 0.0 | |
| 423,000 | | | Sprint LLC, 7.125%, 06/15/2024 | | | 425,120 | | | | 0.2 | |
| 543,000 | | | Sprint LLC, 7.625%, 02/15/2025 | | | 552,837 | | | | 0.3 | |
| 678,000 | | | Sprint LLC, 7.625%, 03/01/2026 | | | 708,749 | | | | 0.3 | |
| 187,000 | | | T-Mobile USA, Inc., 3.750%, 04/15/2027 | | | 181,433 | | | | 0.1 | |
| 78,000 | | | T-Mobile USA, Inc., 4.800%, 07/15/2028 | | | 78,700 | | | | 0.0 | |
| 234,000 | | | Verizon Communications, Inc., 1.750%, 01/20/2031 | | | 192,572 | | | | 0.1 | |
See Accompanying Notes to Financial Statements
VY® BlackRock Inflation
Protected Bond Portfolio | PORTFOLIO OF INVESTMENTS
as of December 31, 2023 (continued) |
Principal
Amount† | | | | | Value | | | Percentage
of Net
Assets | |
| CORPORATE BONDS/NOTES: (continued) | |
| | | | Communications: (continued) |
| 419,000 | | | Verizon Communications, Inc., 2.100%, 03/22/2028 | | $ | 379,211 | | | | 0.2 | |
| 362,000 | | | Verizon Communications, Inc., 2.550%, 03/21/2031 | | | 312,234 | | | | 0.1 | |
| 10,000 | | | Verizon Communications, Inc., 2.650%, 11/20/2040 | | | 7,212 | | | | 0.0 | |
| 265,000 | | | Verizon Communications, Inc., 4.400%, 11/01/2034 | | | 255,137 | | | | 0.1 | |
| 402,000 | | | Verizon Communications, Inc., 5.050%, 05/09/2033 | | | 410,307 | | | | 0.2 | |
| | | | | | | 5,911,512 | | | | 2.7 | |
| | | | | | | | | | | | |
| | | | Consumer, Cyclical: 0.1% |
| 43,000 | | | Lowe’s Cos., Inc., 1.700%, 09/15/2028 | | | 38,063 | | | | 0.0 | |
| 190,000 | | | Lowe’s Cos., Inc., 1.700%, 10/15/2030 | | | 157,905 | | | | 0.1 | |
| 81,000 | | | Lowe’s Cos., Inc., 3.650%, 04/05/2029 | | | 78,137 | | | | 0.0 | |
| 35,000 | | | Tapestry, Inc., 7.850%, 11/27/2033 | | | 37,354 | | | | 0.0 | |
| | | | | | | 311,459 | | | | 0.1 | |
| | | | | | | | | | | | |
| | | | Consumer, Non-cyclical: 3.0% |
| 445,000 | | | AbbVie, Inc., 4.500%, 05/14/2035 | | | 435,511 | | | | 0.2 | |
| 155,000 | | | Altria Group, Inc., 2.450%, 02/04/2032 | | | 126,498 | | | | 0.1 | |
| 109,000 | | | Altria Group, Inc., 3.400%, 02/04/2041 | | | 79,942 | | | | 0.0 | |
| 274,000 | | | Altria Group, Inc., 4.800%, 02/14/2029 | | | 273,377 | | | | 0.1 | |
| 115,000 | | | Altria Group, Inc., 6.875%, 11/01/2033 | | | 126,723 | | | | 0.1 | |
| 278,000 | | | Amgen, Inc., 4.050%, 08/18/2029 | | | 272,330 | | | | 0.1 | |
| 100,000 | | | Amgen, Inc., 4.200%, 02/22/2052 | | | 84,757 | | | | 0.0 | |
| 318,000 | | | Amgen, Inc., 5.150%, 03/02/2028 | | | 325,684 | | | | 0.1 | |
| 121,000 | | | Amgen, Inc., 5.650%, 03/02/2053 | | | 127,395 | | | | 0.1 | |
| 168,000 | | | Amgen, Inc., 5.750%, 03/02/2063 | | | 176,467 | | | | 0.1 | |
| 41,000 | | | BAT Capital Corp., 4.540%, 08/15/2047 | | | 31,547 | | | | 0.0 | |
| 20,000 | | | BAT Capital Corp., 4.758%, 09/06/2049 | | | 15,883 | | | | 0.0 | |
| 46,000 | | | BAT Capital Corp., 7.079%, 08/02/2043 | | | 48,897 | | | | 0.0 | |
| 114,000 | | | BAT Capital Corp., 7.081%, 08/02/2053 | | | 121,988 | | | | 0.1 | |
| 446,000 | | | BAT International Finance PLC, 4.448%, 03/16/2028 | | | 438,976 | | | | 0.2 | |
Principal
Amount† | | | | | Value | | | Percentage
of Net
Assets | |
| CORPORATE BONDS/NOTES: (continued) | |
| | | | Consumer, Non-cyclical: (continued) |
| 320,000 (2) | | | Bayer US Finance LLC, 6.375%, 11/21/2030 | | $ | 329,475 | | | | 0.2 | |
| 150,000 | | | BHSH System Obligated Group 19A, 3.487%, 07/15/2049 | | | 115,093 | | | | 0.1 | |
| 225,000 | | | CommonSpirit Health, 2.782%, 10/01/2030 | | | 195,197 | | | | 0.1 | |
| 300,000 | | | CommonSpirit Health, 3.817%, 10/01/2049 | | | 237,909 | | | | 0.1 | |
| 291,000 | | | CVS Health Corp., 5.000%, 01/30/2029 | | | 296,498 | | | | 0.1 | |
| 24,000 | | | Elevance Health, Inc., 5.125%, 02/15/2053 | | | 24,060 | | | | 0.0 | |
| 115,000 | | | Elevance Health, Inc., 6.100%, 10/15/2052 | | | 130,506 | | | | 0.1 | |
| 300,000 | | | Franciscan Missionaries of Our Lady Health System, Inc. B, 3.914%, 07/01/2049 | | | 233,872 | | | | 0.1 | |
| 380,000 | | | Gilead Sciences, Inc., 2.600%, 10/01/2040 | | | 280,063 | | | | 0.1 | |
| 119,000 | | | Global Payments, Inc., 4.950%, 08/15/2027 | | | 119,264 | | | | 0.1 | |
| 101,000 | | | HCA, Inc., 3.500%, 09/01/2030 | | | 91,586 | | | | 0.0 | |
| 51,000 | | | HCA, Inc., 5.200%, 06/01/2028 | | | 51,556 | | | | 0.0 | |
| 107,000 | | | HCA, Inc., 5.625%, 09/01/2028 | | | 109,575 | | | | 0.0 | |
| 273,000 | | | HCA, Inc., 5.875%, 02/01/2029 | | | 282,030 | | | | 0.1 | |
| 150,000 | | | Kaiser Foundation Hospitals 2021, 3.002%, 06/01/2051 | | | 106,973 | | | | 0.0 | |
| 175,000 | | | Mount Nittany Medical Center Obligated Group 2022, 3.799%, 11/15/2052 | | | 138,362 | | | | 0.1 | |
| 204,000 | | | Pfizer Investment Enterprises Pte Ltd., 4.750%, 05/19/2033 | | | 204,533 | | | | 0.1 | |
| 33,000 | | | Pfizer Investment Enterprises Pte Ltd., 5.300%, 05/19/2053 | | | 33,714 | | | | 0.0 | |
| 236,000 | | | Pfizer Investment Enterprises Pte Ltd., 5.340%, 05/19/2063 | | | 238,461 | | | | 0.1 | |
| 130,000 | | | Philip Morris International, Inc., 4.875%, 02/15/2028 | | | 131,465 | | | | 0.1 | |
| 25,000 (2) | | | S&P Global, Inc., 5.250%, 09/15/2033 | | | 26,174 | | | | 0.0 | |
| 129,000 | | | Shire Acquisitions Investments Ireland DAC, 3.200%, 09/23/2026 | | | 124,148 | | | | 0.1 | |
| 16,000 | | | Thermo Fisher Scientific, Inc., 2.000%, 10/15/2031 | | | 13,488 | | | | 0.0 | |
See Accompanying Notes to Financial Statements
VY® BlackRock Inflation
Protected Bond Portfolio | PORTFOLIO OF INVESTMENTS
as of December 31, 2023 (continued) |
Principal
Amount† | | | | | Value | | | Percentage
of Net
Assets | |
| CORPORATE BONDS/NOTES: (continued) | |
| | | | Consumer, Non-cyclical: (continued) |
| 187,000 | | | Thermo Fisher Scientific, Inc., 5.086%, 08/10/2033 | | $ | 195,000 | | | | 0.1 | |
| 139,000 | | | UnitedHealth Group, Inc., 2.900%, 05/15/2050 | | | 97,360 | | | | 0.0 | |
| 114,000 | | | UnitedHealth Group, Inc., 5.050%, 04/15/2053 | | | 115,269 | | | | 0.1 | |
| | | | | | | 6,607,606 | | | | 3.0 | |
| | | | | | | | | | | | |
| | | | Energy: 5.5% |
| 40,000 | | | Apache Corp., 4.750%, 04/15/2043 | | | 31,543 | | | | 0.0 | |
| 104,000 | | | Apache Corp., 5.100%, 09/01/2040 | | | 89,271 | | | | 0.0 | |
| 254,000 (2) | | | Cameron LNG LLC, 3.302%, 01/15/2035 | | | 216,545 | | | | 0.1 | |
| 288,000 (2) | | | Cameron LNG LLC, 3.402%, 01/15/2038 | | | 243,412 | | | | 0.1 | |
| 271,000 | | | Cheniere Corpus Christi Holdings LLC, 3.700%, 11/15/2029 | | | 256,133 | | | | 0.1 | |
| 663,000 | | | Cheniere Corpus Christi Holdings LLC, 5.125%, 06/30/2027 | | | 666,687 | | | | 0.3 | |
| 402,000 | | | Cheniere Energy Partners L.P., 3.250%, 01/31/2032 | | | 343,009 | | | | 0.2 | |
| 207,000 | | | Cheniere Energy Partners L.P., 4.000%, 03/01/2031 | | | 188,467 | | | | 0.1 | |
| 485,000 | | | Cheniere Energy Partners L.P., 4.500%, 10/01/2029 | | | 464,510 | | | | 0.2 | |
| 152,000 (2) | | | Cheniere Energy Partners L.P., 5.950%, 06/30/2033 | | | 156,255 | | | | 0.1 | |
| 125,000 | | | Devon Energy Corp., 4.500%, 01/15/2030 | | | 120,113 | | | | 0.1 | |
| 649,000 | | | Diamondback Energy, Inc., 3.125%, 03/24/2031 | | | 577,158 | | | | 0.3 | |
| 615,000 | | | Diamondback Energy, Inc., 3.250%, 12/01/2026 | | | 595,906 | | | | 0.3 | |
| 1,397,000 | | | Diamondback Energy, Inc., 3.500%, 12/01/2029 | | | 1,298,349 | | | | 0.6 | |
| 17,000 | | | Energy Transfer L.P., 3.900%, 05/15/2024 | | | 16,875 | | | | 0.0 | |
| 186,000 | | | Energy Transfer L.P., 5.000%, 05/15/2050 | | | 166,127 | | | | 0.1 | |
| 819,000 | | | Energy Transfer L.P., 5.500%, 06/01/2027 | | | 829,551 | | | | 0.4 | |
| 106,000 | | | Energy Transfer L.P., 6.250%, 04/15/2049 | | | 109,857 | | | | 0.1 | |
| 96,000 | | | Energy Transfer L.P., 6.400%, 12/01/2030 | | | 102,753 | | | | 0.0 | |
Principal
Amount† | | | | | Value | | | Percentage
of Net
Assets | |
| CORPORATE BONDS/NOTES: (continued) | |
| | | | Energy: (continued) |
| 30,000 | | | Energy Transfer L.P., 6.550%, 12/01/2033 | | $ | 32,599 | | | | 0.0 | |
| 425,000 (2) | | | EQT Corp., 3.625%, 05/15/2031 | | | 380,088 | | | | 0.2 | |
| 143,000 | | | EQT Corp., 3.900%, 10/01/2027 | | | 136,890 | | | | 0.1 | |
| 463,000 | | | EQT Corp., 5.700%, 04/01/2028 | | | 470,275 | | | | 0.2 | |
| 207,000 | | | Kinder Morgan, Inc., 5.200%, 06/01/2033 | | | 205,867 | | | | 0.1 | |
| 25,000 | | | Kinder Morgan, Inc., 5.450%, 08/01/2052 | | | 23,957 | | | | 0.0 | |
| 96,000 (2) | | | NGPL PipeCo LLC, 3.250%, 07/15/2031 | | | 83,406 | | | | 0.0 | |
| 365,000 (2) | | | NGPL PipeCo LLC, 4.875%, 08/15/2027 | | | 358,686 | | | | 0.2 | |
| 462,000 | | | Northwest Pipeline LLC, 4.000%, 04/01/2027 | | | 456,469 | | | | 0.2 | |
| 66,000 | | | ONEOK, Inc., 6.625%, 09/01/2053 | | | 73,946 | | | | 0.0 | |
| 90,000 | | | Ovintiv, Inc., 6.250%, 07/15/2033 | | | 93,115 | | | | 0.0 | |
| 650,000 | | | Sabine Pass Liquefaction LLC, 4.200%, 03/15/2028 | | | 636,946 | | | | 0.3 | |
| 327,000 | | | Sabine Pass Liquefaction LLC, 5.000%, 03/15/2027 | | | 328,555 | | | | 0.1 | |
| 99,000 | | | Targa Resources Corp., 5.200%, 07/01/2027 | | | 99,538 | | | | 0.0 | |
| 67,000 | | | Targa Resources Corp., 6.125%, 03/15/2033 | | | 70,582 | | | | 0.0 | |
| 31,000 | | | Targa Resources Corp., 6.150%, 03/01/2029 | | | 32,434 | | | | 0.0 | |
| 190,000 | | | Targa Resources Partners L.P. / Targa Resources Partners Finance Corp., 4.875%, 02/01/2031 | | | 184,814 | | | | 0.1 | |
| 238,000 | | | Targa Resources Partners L.P. / Targa Resources Partners Finance Corp., 5.000%, 01/15/2028 | | | 235,267 | | | | 0.1 | |
| 438,000 (2) | | | Texas Eastern Transmission L.P., 3.500%, 01/15/2028 | | | 413,361 | | | | 0.2 | |
| 172,000 (2) | | | Texas Eastern Transmission L.P., 4.150%, 01/15/2048 | | | 141,826 | | | | 0.1 | |
| 174,000 | | | Transcontinental Gas Pipe Line Co. LLC, 4.000%, 03/15/2028 | | | 168,726 | | | | 0.1 | |
| 783,000 | | | Transcontinental Gas Pipe Line Co. LLC, 7.850%, 02/01/2026 | | | 820,360 | | | | 0.4 | |
See Accompanying Notes to Financial Statements
VY® BlackRock Inflation
Protected Bond Portfolio | PORTFOLIO OF INVESTMENTS
as of December 31, 2023 (continued) |
Principal
Amount† | | | | | Value | | | Percentage
of Net
Assets | |
| CORPORATE BONDS/NOTES: (continued) | |
| | | | Energy: (continued) |
| 41,000 | | | Western Midstream Operating L.P., 6.350%, 01/15/2029 | | $ | 42,846 | | | | 0.0 | |
| | | | | | | 11,963,074 | | | | 5.5 | |
| | | | | | | | | | | | |
| | | | Financial: 8.5% |
| 10,000 | | | American Tower Corp., 2.100%, 06/15/2030 | | | 8,396 | | | | 0.0 | |
| 189,000 | | | American Tower Corp., 3.550%, 07/15/2027 | | | 181,420 | | | | 0.1 | |
| 241,000 | | | American Tower Corp., 3.800%, 08/15/2029 | | | 229,040 | | | | 0.1 | |
| 142,000 | | | American Tower Corp., 5.800%, 11/15/2028 | | | 147,655 | | | | 0.1 | |
| 103,000 | | | Aon Corp. / Aon Global Holdings PLC, 5.350%, 02/28/2033 | | | 105,685 | | | | 0.0 | |
| 189,000 (3) | | | Bank of America Corp., 5.288%, 04/25/2034 | | | 189,536 | | | | 0.1 | |
| 657,000 (3) | | | Bank of America Corp., 5.819%, 09/15/2029 | | | 678,612 | | | | 0.3 | |
| 60,000 (3) | | | Bank of America Corp., 5.872%, 09/15/2034 | | | 62,843 | | | | 0.0 | |
| 200,000 (3) | | | Bank of America Corp., MTN, 2.551%, 02/04/2028 | | | 185,370 | | | | 0.1 | |
| 129,000 (3) | | | Bank of America Corp., MTN, 3.970%, 03/05/2029 | | | 123,321 | | | | 0.1 | |
| 300,000 (3) | | | Bank of America Corp., MTN, 3.974%, 02/07/2030 | | | 284,235 | | | | 0.1 | |
| 302,000 (3) | | | Citigroup, Inc., 2.666%, 01/29/2031 | | | 262,110 | | | | 0.1 | |
| 133,000 (3) | | | Citigroup, Inc., 3.057%, 01/25/2033 | | | 113,518 | | | | 0.0 | |
| 441,000 (3) | | | Citigroup, Inc., 3.668%, 07/24/2028 | | | 420,576 | | | | 0.2 | |
| 265,000 (3) | | | Citigroup, Inc., 3.785%, 03/17/2033 | | | 238,434 | | | | 0.1 | |
| 250,000 | | | Credit Suisse AG/New York NY, 5.000%, 07/09/2027 | | | 250,196 | | | | 0.1 | |
| 300,000 | | | Credit Suisse AG/New York NY, 7.500%, 02/15/2028 | | | 328,742 | | | | 0.1 | |
| 577,000 | | | Credit Suisse AG/New York NY, MTN, 3.700%, 02/21/2025 | | | 565,593 | | | | 0.3 | |
| 201,000 | | | Crown Castle, Inc., 2.250%, 01/15/2031 | | | 166,576 | | | | 0.1 | |
| 10,000 | | | Equinix, Inc., 2.000%, 05/15/2028 | | | 8,928 | | | | 0.0 | |
| 10,000 | | | Equinix, Inc., 2.150%, 07/15/2030 | | | 8,480 | | | | 0.0 | |
| 224,000 | | | Equinix, Inc., 3.200%, 11/18/2029 | | | 205,944 | | | | 0.1 | |
| 437,000 | | | GLP Capital L.P. / GLP Financing II, Inc., 3.250%, 01/15/2032 | | | 369,382 | | | | 0.2 | |
Principal
Amount† | | | | | Value | | | Percentage
of Net
Assets | |
| CORPORATE BONDS/NOTES: (continued) | |
| | | | Financial: (continued) |
| 144,000 | | | GLP Capital L.P. / GLP Financing II, Inc., 4.000%, 01/15/2030 | | $ | 131,546 | | | | 0.1 | |
| 89,000 | | | GLP Capital L.P. / GLP Financing II, Inc., 4.000%, 01/15/2031 | | | 80,252 | | | | 0.0 | |
| 189,000 | | | GLP Capital L.P. / GLP Financing II, Inc., 5.300%, 01/15/2029 | �� | | 188,025 | | | | 0.1 | |
| 44,000 (3) | | | Goldman Sachs Group, Inc., 2.650%, 10/21/2032 | | | 36,681 | | | | 0.0 | |
| 588,000 (3) | | | Goldman Sachs Group, Inc., 3.102%, 02/24/2033 | | | 504,924 | | | | 0.2 | |
| 223,000 (3) | | | Goldman Sachs Group, Inc., 3.615%, 03/15/2028 | | | 213,961 | | | | 0.1 | |
| 295,000 (3) | | | Goldman Sachs Group, Inc., 4.482%, 08/23/2028 | | | 289,922 | | | | 0.1 | |
| 559,000 (3) | | | Goldman Sachs Group, Inc., 6.484%, 10/24/2029 | | | 593,526 | | | | 0.3 | |
| 496,000 (3) | | | Goldman Sachs Group, Inc., 6.561%, 10/24/2034 | | | 545,274 | | | | 0.2 | |
| 205,000 (3) | | | JPMorgan Chase & Co., 2.545%, 11/08/2032 | | | 171,111 | | | | 0.1 | |
| 258,000 (3) | | | JPMorgan Chase & Co., 2.963%, 01/25/2033 | | | 221,179 | | | | 0.1 | |
| 143,000 (3) | | | JPMorgan Chase & Co., 4.565%, 06/14/2030 | | | 140,036 | | | | 0.1 | |
| 40,000 (3) | | | JPMorgan Chase & Co., 5.299%, 07/24/2029 | | | 40,612 | | | | 0.0 | |
| 24,000 (3) | | | JPMorgan Chase & Co., 5.350%, 06/01/2034 | | | 24,356 | | | | 0.0 | |
| 294,000 (3) | | | JPMorgan Chase & Co., 6.087%, 10/23/2029 | | | 309,269 | | | | 0.1 | |
| 485,000 (3) | | | JPMorgan Chase & Co., 6.254%, 10/23/2034 | | | 526,016 | | | | 0.2 | |
| 59,000 | | | Marsh & McLennan Cos., Inc., 2.250%, 11/15/2030 | | | 50,826 | | | | 0.0 | |
| 400,000 (3) | | | Morgan Stanley, 2.943%, 01/21/2033 | | | 340,400 | | | | 0.2 | |
| 118,000 (3) | | | Morgan Stanley, 4.210%, 04/20/2028 | | | 115,390 | | | | 0.1 | |
| 849,000 (3) | | | Morgan Stanley, 5.449%, 07/20/2029 | | | 865,593 | | | | 0.4 | |
| 537,000 (3) | | | Morgan Stanley, 6.407%, 11/01/2029 | | | 569,475 | | | | 0.3 | |
| 470,000 (3) | | | Morgan Stanley, 6.627%, 11/01/2034 | | | 520,618 | | | | 0.2 | |
| 60,000 (3) | | | Morgan Stanley, GMTN, 2.239%, 07/21/2032 | | | 48,997 | | | | 0.0 | |
| 245,000 (3) | | | Morgan Stanley, MTN, 3.622%, 04/01/2031 | | | 225,799 | | | | 0.1 | |
| 721,000 (3) | | | Morgan Stanley, MTN, 5.164%, 04/20/2029 | | | 725,548 | | | | 0.3 | |
See Accompanying Notes to Financial Statements
VY® BlackRock Inflation
Protected Bond Portfolio | PORTFOLIO OF INVESTMENTS
as of December 31, 2023 (continued) |
Principal
Amount† | | | | | Value | | | Percentage
of Net
Assets | |
| CORPORATE BONDS/NOTES: (continued) | |
| | | | Financial: (continued) |
| 904,000 (3) | | | Morgan Stanley, MTN, 5.250%, 04/21/2034 | | $ | 904,333 | | | | 0.4 | |
| 230,000 (3) | | | Morgan Stanley, MTN, 5.424%, 07/21/2034 | | | 233,533 | | | | 0.1 | |
| 144,000 | | | Nasdaq, Inc., 5.550%, 02/15/2034 | | | 149,687 | | | | 0.1 | |
| 69,000 | | | National Retail Properties, Inc., 3.000%, 04/15/2052 | | | 45,113 | | | | 0.0 | |
| 28,000 | | | NNN REIT, Inc., 3.500%, 04/15/2051 | | | 20,304 | | | | 0.0 | |
| 597,000 | | | UBS Group AG, 3.750%, 03/26/2025 | | | 585,368 | | | | 0.3 | |
| 330,000 (2)(3) | | | UBS Group AG, 6.537%, 08/12/2033 | | | 352,367 | | | | 0.2 | |
| 361,000 | | | VICI Properties L.P., 4.750%, 02/15/2028 | | | 353,631 | | | | 0.2 | |
| 124,000 (2) | | | VICI Properties L.P. / VICI Note Co., Inc., 3.750%, 02/15/2027 | | | 117,128 | | | | 0.1 | |
| 194,000 (2) | | | VICI Properties L.P. / VICI Note Co., Inc., 3.875%, 02/15/2029 | | | 178,366 | | | | 0.1 | |
| 163,000 (2) | | | VICI Properties L.P. / VICI Note Co., Inc., 4.125%, 08/15/2030 | | | 148,649 | | | | 0.1 | |
| 132,000 (2) | | | VICI Properties L.P. / VICI Note Co., Inc., 4.250%, 12/01/2026 | | | 127,114 | | | | 0.1 | |
| 442,000 (2) | | | VICI Properties L.P. / VICI Note Co., Inc., 4.500%, 09/01/2026 | | | 428,150 | | | | 0.2 | |
| 78,000 (3) | | | Wells Fargo & Co., 5.389%, 04/24/2034 | | | 78,384 | | | | 0.0 | |
| 404,000 (3) | | | Wells Fargo & Co., 6.303%, 10/23/2029 | | | 426,035 | | | | 0.2 | |
| 481,000 (3) | | | Wells Fargo & Co., 6.491%, 10/23/2034 | | | 523,552 | | | | 0.2 | |
| 79,000 (3) | | | Wells Fargo & Co., MTN, 3.584%, 05/22/2028 | | | 75,302 | | | | 0.0 | |
| 487,000 (3) | | | Wells Fargo & Co., MTN, 5.557%, 07/25/2034 | | | 496,073 | | | | 0.2 | |
| 374,000 (3) | | | Wells Fargo & Co., MTN, 5.574%, 07/25/2029 | | | 382,102 | | | | 0.2 | |
| 427,000 | | | Wells Fargo Bank NA, 5.450%, 08/07/2026 | | | 434,134 | | | | 0.2 | |
| | | | | | | 18,673,253 | | | | 8.5 | |
| | | | | | | | | | | | |
| | | | Industrial: 2.1% |
| 51,000 | | | Amcor Flexibles North America, Inc., 2.690%, 05/25/2031 | | | 43,928 | | | | 0.0 | |
| 715,000 (2) | | | BAE Systems Holdings, Inc., 3.850%, 12/15/2025 | | | 699,762 | | | | 0.3 | |
| 122,000 | | | Boeing Co., 3.950%, 08/01/2059 | | | 93,460 | | | | 0.0 | |
Principal
Amount† | | | | | Value | | | Percentage
of Net
Assets | |
| CORPORATE BONDS/NOTES: (continued) | |
| | | | Industrial: (continued) |
| 336,000 | | | Boeing Co., 4.875%, 05/01/2025 | | $ | 334,600 | | | | 0.2 | |
| 56,000 | | | Burlington Northern Santa Fe LLC, 2.875%, 06/15/2052 | | | 39,188 | | | | 0.0 | |
| 209,000 | | | Burlington Northern Santa Fe LLC, 3.300%, 09/15/2051 | | | 158,992 | | | | 0.1 | |
| 80,000 | | | CSX Corp., 2.500%, 05/15/2051 | | | 51,734 | | | | 0.0 | |
| 130,000 | | | CSX Corp., 4.500%, 11/15/2052 | | | 120,804 | | | | 0.1 | |
| 429,000 | | | Huntington Ingalls Industries, Inc., 2.043%, 08/16/2028 | | | 377,403 | | | | 0.2 | |
| 5,000 | | | Huntington Ingalls Industries, Inc., 3.483%, 12/01/2027 | | | 4,731 | | | | 0.0 | |
| 128,000 | | | L3Harris Technologies, Inc., 3.850%, 12/15/2026 | | | 125,506 | | | | 0.1 | |
| 580,000 | | | L3Harris Technologies, Inc., 4.400%, 06/15/2028 | | | 573,708 | | | | 0.3 | |
| 26,000 | | | L3Harris Technologies, Inc., 5.600%, 07/31/2053 | | | 27,709 | | | | 0.0 | |
| 236,000 | | | Lockheed Martin Corp., 4.450%, 05/15/2028 | | | 237,408 | | | | 0.1 | |
| 184,000 | | | Norfolk Southern Corp., 3.050%, 05/15/2050 | | | 131,069 | | | | 0.1 | |
| 263,000 | | | Norfolk Southern Corp., 3.800%, 08/01/2028 | | | 256,366 | | | | 0.1 | |
| 15,000 | | | Norfolk Southern Corp., 5.550%, 03/15/2034 | | | 15,850 | | | | 0.0 | |
| 146,000 | | | Northrop Grumman Corp., 4.700%, 03/15/2033 | | | 147,328 | | | | 0.1 | |
| 61,000 | | | Northrop Grumman Corp., 5.250%, 05/01/2050 | | | 62,865 | | | | 0.0 | |
| 34,000 | | | Raytheon Technologies Corp., 2.820%, 09/01/2051 | | | 22,510 | | | | 0.0 | |
| 213,000 | | | Raytheon Technologies Corp., 3.125%, 07/01/2050 | | | 150,205 | | | | 0.1 | |
| 74,000 | | | Raytheon Technologies Corp., 4.125%, 11/16/2028 | | | 72,356 | | | | 0.0 | |
| 30,000 | | | Republic Services, Inc., 3.950%, 05/15/2028 | | | 29,440 | | | | 0.0 | |
| 239,000 | | | RTX Corp., 5.150%, 02/27/2033 | | | 243,686 | | | | 0.1 | |
| 60,000 | | | RTX Corp., 6.100%, 03/15/2034 | | | 65,139 | | | | 0.0 | |
| 179,000 | | | Textron, Inc., 2.450%, 03/15/2031 | | | 152,609 | | | | 0.1 | |
| 105,000 | | | Textron, Inc., 3.900%, 09/17/2029 | | | 99,896 | | | | 0.0 | |
See Accompanying Notes to Financial Statements
VY® BlackRock Inflation
Protected Bond Portfolio | PORTFOLIO OF INVESTMENTS
as of December 31, 2023 (continued) |
Principal
Amount† | | | | | Value | | | Percentage
of Net
Assets | |
| CORPORATE BONDS/NOTES: (continued) | |
| | | | Industrial: (continued) |
| 46,000 | | | Union Pacific Corp., 3.250%, 02/05/2050 | | $ | 35,272 | | | | 0.0 | |
| 29,000 | | | Union Pacific Corp., 3.500%, 02/14/2053 | | | 22,998 | | | | 0.0 | |
| 151,000 | | | Union Pacific Corp., 4.500%, 01/20/2033 | | | 151,937 | | | | 0.1 | |
| | | | | | | 4,548,459 | | | | 2.1 | |
| | | | | | | | | | | | |
| | | | Technology: 1.0% |
| 414,000 | | | Broadcom Corp. / Broadcom Cayman Finance Ltd., 3.500%, 01/15/2028 | | | 397,340 | | | | 0.2 | |
| 194,000 (2) | | | Broadcom, Inc., 3.137%, 11/15/2035 | | | 159,373 | | | | 0.1 | |
| 13,000 | | | Dell International LLC / EMC Corp., 3.450%, 12/15/2051 | | | 9,413 | | | | 0.0 | |
| 130,000 | | | Hewlett Packard Enterprise Co., 5.250%, 07/01/2028 | | | 132,982 | | | | 0.1 | |
| 88,000 | | | Intel Corp., 3.200%, 08/12/2061 | | | 60,722 | | | | 0.0 | |
| 163,000 | | | KLA Corp., 4.100%, 03/15/2029 | | | 162,267 | | | | 0.1 | |
| 43,000 | | | KLA Corp., 5.250%, 07/15/2062 | | | 44,911 | | | | 0.0 | |
| 182,000 (2) | | | MSCI, Inc., 3.250%, 08/15/2033 | | | 152,334 | | | | 0.1 | |
| 90,000 (2) | | | MSCI, Inc., 3.625%, 11/01/2031 | | | 79,321 | | | | 0.0 | |
| 243,000 (2) | | | MSCI, Inc., 3.875%, 02/15/2031 | | | 222,320 | | | | 0.1 | |
| 115,000 | | | NXP BV / NXP Funding LLC / NXP USA, Inc., 4.300%, 06/18/2029 | | | 111,826 | | | | 0.0 | |
| 308,000 | | | Oracle Corp., 3.650%, 03/25/2041 | | | 244,628 | | | | 0.1 | |
| 14,000 | | | Oracle Corp., 3.800%, 11/15/2037 | | | 11,911 | | | | 0.0 | |
| 101,000 | | | Oracle Corp., 4.100%, 03/25/2061 | | | 77,125 | | | | 0.0 | |
| 176,000 | | | Oracle Corp., 5.550%, 02/06/2053 | | | 176,254 | | | | 0.1 | |
| 200,000 | | | TSMC Arizona Corp., 4.250%, 04/22/2032 | | | 196,830 | | | | 0.1 | |
| | | | | | | 2,239,557 | | | | 1.0 | |
| | | | | | | | | | | | |
| | | | Utilities: 3.1% |
| 100,000 | | | AEP Texas, Inc., 3.450%, 05/15/2051 | | | 71,704 | | | | 0.0 | |
| 397,000 | | | AEP Texas, Inc., 5.400%, 06/01/2033 | | | 403,375 | | | | 0.2 | |
| 329,000 | | | AEP Transmission Co. LLC N, 2.750%, 08/15/2051 | | | 213,782 | | | | 0.1 | |
| 131,000 | | | Alabama Power Co., 3.125%, 07/15/2051 | | | 93,143 | | | | 0.1 | |
| 32,000 | | | Ameren Illinois Co., 2.900%, 06/15/2051 | | | 21,819 | | | | 0.0 | |
Principal
Amount† | | | | | Value | | | Percentage
of Net
Assets | |
| CORPORATE BONDS/NOTES: (continued) | |
| | | | Utilities: (continued) |
| 31,000 (2) | | | American Transmission Systems, Inc., 2.650%, 01/15/2032 | | $ | 26,245 | | | | 0.0 | |
| 67,000 | | | Atmos Energy Corp., 2.850%, 02/15/2052 | | | 45,628 | | | | 0.0 | |
| 136,000 | | | Baltimore Gas and Electric Co., 4.550%, 06/01/2052 | | | 124,841 | | | | 0.1 | |
| 122,000 | | | CenterPoint Energy Houston Electric LLC, 4.950%, 04/01/2033 | | | 124,277 | | | | 0.1 | |
| 30,000 | | | CenterPoint Energy Houston Electric LLC AD, 2.900%, 07/01/2050 | | | 20,989 | | | | 0.0 | |
| 87,000 | | | CenterPoint Energy Houston Electric LLC AH, 3.600%, 03/01/2052 | | | 69,135 | | | | 0.0 | |
| 54,000 | | | CenterPoint Energy Resources Corp., 1.750%, 10/01/2030 | | | 44,881 | | | | 0.0 | |
| 66,000 | | | CenterPoint Energy Resources Corp., 5.250%, 03/01/2028 | | | 67,734 | | | | 0.0 | |
| 35,000 | | | Commonwealth Edison Co., 5.300%, 02/01/2053 | | | 35,610 | | | | 0.0 | |
| 185,000 | | | Commonwealth Edison Co. 131, 2.750%, 09/01/2051 | | | 120,880 | | | | 0.1 | |
| 31,000 | | | Consolidated Edison Co. of New York, Inc., 5.900%, 11/15/2053 | | | 34,164 | | | | 0.0 | |
| 115,000 | | | Consumers Energy Co., 2.650%, 08/15/2052 | | | 76,492 | | | | 0.0 | |
| 113,000 | | | Consumers Energy Co., 4.200%, 09/01/2052 | | | 99,615 | | | | 0.1 | |
| 30,000 | | | Dominion Energy South Carolina, Inc., 6.250%, 10/15/2053 | | | 34,672 | | | | 0.0 | |
| 42,000 | | | DTE Electric Co., 3.950%, 03/01/2049 | | | 35,386 | | | | 0.0 | |
| 147,000 | | | DTE Electric Co., 5.400%, 04/01/2053 | | | 154,601 | | | | 0.1 | |
| 90,000 | | | DTE Electric Co. B, 3.650%, 03/01/2052 | | | 71,231 | | | | 0.0 | |
| 52,000 | | | Duke Energy Carolinas LLC, 2.450%, 02/01/2030 | | | 45,979 | | | | 0.0 | |
| 71,000 | | | Duke Energy Carolinas LLC, 3.450%, 04/15/2051 | | | 53,777 | | | | 0.0 | |
| 229,000 | | | Duke Energy Carolinas LLC, 4.950%, 01/15/2033 | | | 233,383 | | | | 0.1 | |
| 90,000 | | | Duke Energy Carolinas LLC, 5.350%, 01/15/2053 | | | 92,395 | | | | 0.1 | |
See Accompanying Notes to Financial Statements
VY® BlackRock Inflation
Protected Bond Portfolio | PORTFOLIO OF INVESTMENTS
as of December 31, 2023 (continued) |
Principal
Amount† | | | | | Value | | | Percentage
of Net
Assets | |
| CORPORATE BONDS/NOTES: (continued) | |
| | | | Utilities: (continued) |
| 137,000 | | | Duke Energy Florida LLC, 1.750%, 06/15/2030 | | $ | 114,368 | | | | 0.1 | |
| 310,000 | | | Duke Energy Florida LLC, 2.500%, 12/01/2029 | | | 276,680 | | | | 0.1 | |
| 188,000 | | | Duke Energy Florida LLC, 3.800%, 07/15/2028 | | | 182,644 | | | | 0.1 | |
| 51,000 | | | Duke Energy Florida LLC, 5.950%, 11/15/2052 | | | 55,902 | | | | 0.0 | |
| 262,000 | | | Duke Energy Progress LLC, 2.900%, 08/15/2051 | | | 177,556 | | | | 0.1 | |
| 80,000 | | | Edison International, 6.950%, 11/15/2029 | | | 86,899 | | | | 0.0 | |
| 24,000 | | | Entergy Louisiana LLC, 2.350%, 06/15/2032 | | | 19,979 | | | | 0.0 | |
| 134,000 | | | Eversource Energy, 5.450%, 03/01/2028 | | | 137,789 | | | | 0.1 | |
| 2,000 | | | Exelon Corp., 4.700%, 04/15/2050 | | | 1,803 | | | | 0.0 | |
| 40,000 | | | Exelon Corp., 5.150%, 03/15/2028 | | | 40,689 | | | | 0.0 | |
| 188,000 (2) | | | FirstEnergy Transmission LLC, 4.350%, 01/15/2025 | | | 185,101 | | | | 0.1 | |
| 60,000 (2) | | | FirstEnergy Transmission LLC, 4.550%, 04/01/2049 | | | 52,043 | | | | 0.0 | |
| 100,000 | | | Florida Power & Light Co., 2.875%, 12/04/2051 | | | 69,445 | | | | 0.0 | |
| 30,000 | | | Florida Power & Light Co., 3.950%, 03/01/2048 | | | 25,567 | | | | 0.0 | |
| 88,000 | | | Georgia Power Co., 4.950%, 05/17/2033 | | | 88,775 | | | | 0.1 | |
| 22,000 | | | Kentucky Utilities Co. KENT, 5.450%, 04/15/2033 | | | 22,868 | | | | 0.0 | |
| 22,000 | | | Louisville Gas and Electric Co. LOU, 5.450%, 04/15/2033 | | | 22,931 | | | | 0.0 | |
| 25,000 | | | NextEra Energy Capital Holdings, Inc., 5.749%, 09/01/2025 | | | 25,246 | | | | 0.0 | |
| 177,000 | | | Northern States Power Co., 3.200%, 04/01/2052 | | | 131,276 | | | | 0.1 | |
| 433,000 | | | Ohio Power Co., 5.000%, 06/01/2033 | | | 435,821 | | | | 0.2 | |
| 56,000 | | | Ohio Power Co. R, 2.900%, 10/01/2051 | | | 37,992 | | | | 0.0 | |
| 19,000 | | | Oncor Electric Delivery Co. LLC, 3.100%, 09/15/2049 | | | 13,612 | | | | 0.0 | |
Principal
Amount† | | | | | Value | | | Percentage
of Net
Assets | |
| CORPORATE BONDS/NOTES: (continued) | |
| | | | Utilities: (continued) |
| 713,000 | | | Pacific Gas and Electric Co., 6.400%, 06/15/2033 | | $ | 750,941 | | | | 0.4 | |
| 192,000 | | | PECO Energy Co., 2.850%, 09/15/2051 | | | 129,815 | | | | 0.1 | |
| 60,000 | | | Public Service Co. of New Hampshire, 5.150%, 01/15/2053 | | | 60,953 | | | | 0.0 | |
| 62,000 | | | Public Service Electric and Gas Co., MTN, 3.700%, 05/01/2028 | | | 60,093 | | | | 0.0 | |
| 170,000 | | | Public Service Electric and Gas Co., MTN, 4.900%, 12/15/2032 | | | 172,822 | | | | 0.1 | |
| 200,000 | | | San Diego Gas & Electric Co. UUU, 3.320%, 04/15/2050 | | | 142,542 | | | | 0.1 | |
| 270,000 | | | Southern California Edison Co., 5.650%, 10/01/2028 | | | 281,645 | | | | 0.1 | |
| 120,000 | | | Southern California Edison Co., 5.875%, 12/01/2053 | | | 129,246 | | | | 0.1 | |
| 200,000 | | | Southern California Edison Co., 5.950%, 11/01/2032 | | | 214,978 | | | | 0.1 | |
| 73,000 | | | Southwest Gas Corp., 5.450%, 03/23/2028 | | | 74,674 | | | | 0.0 | |
| 23,000 | | | Southwestern Electric Power Co., 5.300%, 04/01/2033 | | | 23,019 | | | | 0.0 | |
| 20,000 | | | Spire Missouri, Inc., 4.800%, 02/15/2033 | | | 19,987 | | | | 0.0 | |
| 23,000 | | | Union Electric Co., 5.450%, 03/15/2053 | | | 23,758 | | | | 0.0 | |
| 69,000 | | | Virginia Electric and Power Co., 5.700%, 08/15/2053 | | | 73,250 | | | | 0.0 | |
| 20,000 | | | Wisconsin Power and Light Co., 4.950%, 04/01/2033 | | | 20,064 | | | | 0.0 | |
| | | | | | | 6,798,511 | | | | 3.1 | |
| | | | Total Corporate Bonds/ Notes
(Cost $57,375,004) | | | 57,296,286 | | | | 26.1 | |
| | | | | | | | | | | | |
| U.S. GOVERNMENT AGENCY OBLIGATIONS: 19.0% |
| | | | Government National Mortgage Association: 2.3% |
| 91,631 | | | 2.000%, 11/20/2050 | | | 77,640 | | | | 0.0 | |
| 811,275 | | | 2.000%, 12/20/2050 | | | 687,386 | | | | 0.3 | |
| 188,257 | | | 2.000%, 01/20/2051 | | | 159,577 | | | | 0.1 | |
| 138,460 | | | 2.000%, 02/20/2051 | | | 117,347 | | | | 0.0 | |
| 614,438 | | | 2.500%, 06/20/2052 | | | 537,418 | | | | 0.2 | |
| 346,417 | | | 2.500%, 07/20/2052 | | | 303,106 | | | | 0.1 | |
| 146,400 (4) | | | 2.500%, 01/20/2054 | | | 128,089 | | | | 0.1 | |
| 423,504 | | | 3.000%, 08/20/2051 | | | 384,372 | | | | 0.2 | |
| 112,776 | | | 3.000%, 12/20/2051 | | | 102,132 | | | | 0.0 | |
| 297,000 (4) | | | 3.000%, 01/20/2054 | | | 268,947 | | | | 0.1 | |
| 508,401 | | | 3.500%, 05/20/2047 | | | 479,362 | | | | 0.2 | |
See Accompanying Notes to Financial Statements
VY® BlackRock Inflation
Protected Bond Portfolio | PORTFOLIO OF INVESTMENTS
as of December 31, 2023 (continued) |
Principal
Amount† | | | | | Value | | | Percentage
of Net
Assets | |
| U.S. GOVERNMENT AGENCY OBLIGATIONS: (continued) | |
| | | | Government National Mortgage Association (continued) |
| 159,000 (4) | | | 3.500%, 01/20/2054 | | $ | 148,094 | | | | 0.1 | |
| 211,017 | | | 4.000%, 09/20/2048 | | | 202,937 | | | | 0.1 | |
| 229,000 (4) | | | 4.000%, 01/20/2054 | | | 218,660 | | | | 0.1 | |
| 158,021 | | | 4.500%, 08/20/2048 | | | 156,215 | | | | 0.1 | |
| 203,000 (4) | | | 4.500%, 01/20/2054 | | | 198,147 | | | | 0.1 | |
| 345,000 (4) | | | 5.000%, 01/20/2054 | | | 342,628 | | | | 0.2 | |
| 269,000 (4) | | | 5.500%, 01/20/2054 | | | 270,976 | | | | 0.1 | |
| 183,000 (4) | | | 6.000%, 01/20/2054 | | | 186,095 | | | | 0.1 | |
| 143,000 (4) | | | 6.500%, 01/20/2054 | | | 146,402 | | | | 0.1 | |
| | | | | | | 5,115,530 | | | | 2.3 | |
| | | | Uniform Mortgage-Backed Securities: 16.7% |
| 161,079 | | | 1.500%, 04/01/2036 | | | 141,599 | | | | 0.1 | |
| 54,952 | | | 1.500%, 05/01/2036 | | | 48,170 | | | | 0.0 | |
| 118,331 | | | 1.500%, 06/01/2036 | | | 103,511 | | | | 0.1 | |
| 519,699 | | | 1.500%, 11/01/2041 | | | 431,012 | | | | 0.2 | |
| 306,866 | | | 1.500%, 12/01/2041 | | | 254,498 | | | | 0.1 | |
| 52,638 | | | 1.500%, 10/01/2050 | | | 41,165 | | | | 0.0 | |
| 61,307 | | | 1.500%, 10/01/2050 | | | 47,870 | | | | 0.0 | |
| 47,818 | | | 1.500%, 11/01/2050 | | | 37,425 | | | | 0.0 | |
| 62,936 | | | 1.500%, 03/01/2051 | | | 49,138 | | | | 0.0 | |
| 79,489 | | | 1.500%, 03/01/2051 | | | 62,164 | | | | 0.0 | |
| 10,276 | | | 1.500%, 05/01/2051 | | | 8,034 | | | | 0.0 | |
| 7,756 | | | 1.500%, 06/01/2051 | | | 6,059 | | | | 0.0 | |
| 42,044 | | | 1.500%, 10/01/2051 | | | 32,793 | | | | 0.0 | |
| 9,781 | | | 1.500%, 11/01/2051 | | | 7,627 | | | | 0.0 | |
| 36,098 | | | 2.000%, 09/01/2035 | | | 32,594 | | | | 0.0 | |
| 77,592 | | | 2.000%, 01/01/2036 | | | 69,947 | | | | 0.0 | |
| 22,647 | | | 2.000%, 02/01/2036 | | | 20,443 | | | | 0.0 | |
| 61,033 | | | 2.000%, 02/01/2036 | | | 55,094 | | | | 0.0 | |
| 36,883 | | | 2.000%, 03/01/2036 | | | 33,293 | | | | 0.0 | |
| 30,201 | | | 2.000%, 04/01/2036 | | | 27,285 | | | | 0.0 | |
| 89,895 | | | 2.000%, 05/01/2036 | | | 81,214 | | | | 0.0 | |
| 187,729 | | | 2.000%, 05/01/2036 | | | 169,601 | | | | 0.1 | |
| 34,017 | | | 2.000%, 07/01/2036 | | | 30,707 | | | | 0.0 | |
| 46,837 | | | 2.000%, 11/01/2036 | | | 42,298 | | | | 0.0 | |
| 91,553 | | | 2.000%, 02/01/2037 | | | 82,321 | | | | 0.0 | |
| 78,783 | | | 2.000%, 03/01/2037 | | | 71,112 | | | | 0.0 | |
| 98,278 | | | 2.000%, 03/01/2037 | | | 88,726 | | | | 0.1 | |
| 114,958 | | | 2.000%, 03/01/2037 | | | 103,490 | | | | 0.1 | |
| 65,935 | | | 2.000%, 04/01/2037 | | | 59,513 | | | | 0.0 | |
| 506,616 | | | 2.000%, 02/01/2042 | | | 432,936 | | | | 0.2 | |
| 132,681 | | | 2.000%, 09/01/2050 | | | 109,193 | | | | 0.1 | |
| 239,439 | | | 2.000%, 10/01/2050 | | | 197,088 | | | | 0.1 | |
| 1,441,515 | | | 2.000%, 01/01/2051 | | | 1,185,795 | | | | 0.6 | |
| 292,871 | | | 2.000%, 02/01/2051 | | | 240,552 | | | | 0.1 | |
| 265,570 | | | 2.000%, 03/01/2051 | | | 218,129 | | | | 0.1 | |
| 90,956 | | | 2.000%, 04/01/2051 | | | 75,588 | | | | 0.0 | |
| 134,471 | | | 2.000%, 04/01/2051 | | | 111,930 | | | | 0.1 | |
| 215,546 | | | 2.000%, 04/01/2051 | | | 179,564 | | | | 0.1 | |
| 38,029 | | | 2.000%, 10/01/2051 | | | 31,149 | | | | 0.0 | |
| 50,881 | | | 2.000%, 11/01/2051 | | | 42,299 | | | | 0.0 | |
| 130,843 | | | 2.000%, 11/01/2051 | | | 108,801 | | | | 0.1 | |
| 151,524 | | | 2.000%, 11/01/2051 | | | 124,204 | | | | 0.1 | |
| 236,786 | | | 2.000%, 11/01/2051 | | | 196,684 | | | | 0.1 | |
| 268,925 | | | 2.000%, 11/01/2051 | | | 223,086 | | | | 0.1 | |
| 57,230 | | | 2.000%, 12/01/2051 | | | 46,871 | | | | 0.0 | |
| 437,155 | | | 2.000%, 01/01/2052 | | | 362,914 | | | | 0.2 | |
| 172,792 | | | 2.000%, 03/01/2052 | | | 143,524 | | | | 0.1 | |
Principal
Amount† | | | | | Value | | | Percentage
of Net
Assets | |
| U.S. GOVERNMENT AGENCY OBLIGATIONS: (continued) | |
| | | | Uniform Mortgage-Backed Securities (continued) |
| 246,568 | | | 2.000%, 03/01/2052 | | $ | 204,482 | | | | 0.1 | |
| 448,992 | | | 2.000%, 03/01/2052 | | | 372,377 | | | | 0.2 | |
| 563,037 | | | 2.500%, 10/01/2036 | | | 521,155 | | | | 0.2 | |
| 19,863 | | | 2.500%, 07/01/2050 | | | 17,144 | | | | 0.0 | |
| 65,919 | | | 2.500%, 07/01/2050 | | | 57,320 | | | | 0.0 | |
| 126,173 | | | 2.500%, 07/01/2050 | | | 109,203 | | | | 0.1 | |
| 128,474 | | | 2.500%, 07/01/2050 | | | 111,194 | | | | 0.1 | |
| 130,101 | | | 2.500%, 07/01/2050 | | | 112,602 | | | | 0.1 | |
| 33,112 | | | 2.500%, 08/01/2050 | | | 28,658 | | | | 0.0 | |
| 106,202 | | | 2.500%, 08/01/2050 | | | 91,917 | | | | 0.1 | |
| 129,351 | | | 2.500%, 08/01/2050 | | | 111,952 | | | | 0.1 | |
| 74,533 | | | 2.500%, 11/01/2050 | | | 65,008 | | | | 0.0 | |
| 20,484 | | | 2.500%, 01/01/2051 | | | 17,701 | | | | 0.0 | |
| 66,737 | | | 2.500%, 02/01/2051 | | | 57,506 | | | | 0.0 | |
| 110,979 | | | 2.500%, 02/01/2051 | | | 96,437 | | | | 0.1 | |
| 10,279 | | | 2.500%, 03/01/2051 | | | 8,846 | | | | 0.0 | |
| 5,975 | | | 2.500%, 04/01/2051 | | | 5,147 | | | | 0.0 | |
| 11,458 | | | 2.500%, 04/01/2051 | | | 9,863 | | | | 0.0 | |
| 3,120 | | | 2.500%, 05/01/2051 | | | 2,690 | | | | 0.0 | |
| 6,061 | | | 2.500%, 05/01/2051 | | | 5,220 | | | | 0.0 | |
| 90,551 | | | 2.500%, 05/01/2051 | | | 79,099 | | | | 0.0 | |
| 105,092 | | | 2.500%, 05/01/2051 | | | 90,614 | | | | 0.1 | |
| 9,536 | | | 2.500%, 07/01/2051 | | | 8,209 | | | | 0.0 | |
| 3,634 | | | 2.500%, 10/01/2051 | | | 3,124 | | | | 0.0 | |
| 35,485 | | | 2.500%, 10/01/2051 | | | 30,472 | | | | 0.0 | |
| 88,628 | | | 2.500%, 11/01/2051 | | | 76,785 | | | | 0.0 | |
| 1,045,016 | | | 2.500%, 11/01/2051 | | | 901,861 | | | | 0.4 | |
| 27,393 | | | 2.500%, 12/01/2051 | | | 23,560 | | | | 0.0 | |
| 271,477 | | | 2.500%, 01/01/2052 | | | 233,221 | | | | 0.1 | |
| 1,080,102 | | | 2.500%, 01/01/2052 | | | 930,421 | | | | 0.4 | |
| 323,429 | | | 3.000%, 01/01/2036 | | | 306,900 | | | | 0.2 | |
| 242,587 | | | 3.000%, 09/01/2050 | | | 220,371 | | | | 0.1 | |
| 54,496 | | | 3.000%, 07/01/2051 | | | 48,977 | | | | 0.0 | |
| 229,486 | | | 3.000%, 09/01/2051 | | | 205,080 | | | | 0.1 | |
| 69,730 | | | 3.000%, 10/01/2051 | | | 62,305 | | | | 0.0 | |
| 125,699 | | | 3.000%, 11/01/2051 | | | 111,969 | | | | 0.1 | |
| 55,539 | | | 3.000%, 12/01/2051 | | | 49,693 | | | | 0.0 | |
| 7,322 | | | 3.000%, 01/01/2052 | | | 6,536 | | | | 0.0 | |
| 26,962 | | | 3.000%, 01/01/2052 | | | 24,033 | | | | 0.0 | |
| 40,193 | | | 3.000%, 02/01/2052 | | | 36,205 | | | | 0.0 | |
| 931,892 | | | 3.000%, 03/01/2052 | | | 835,677 | | | | 0.4 | |
| 36,749 | | | 3.000%, 04/01/2052 | | | 32,940 | | | | 0.0 | |
| 57,723 | | | 3.000%, 05/01/2052 | | | 51,496 | | | | 0.0 | |
| 232,592 | | | 3.000%, 08/01/2052 | | | 208,240 | | | | 0.1 | |
| 126,599 | | | 3.500%, 05/01/2036 | | | 122,461 | | | | 0.1 | |
| 1,052,059 | | | 3.500%, 09/01/2051 | | | 978,890 | | | | 0.5 | |
| 29,901 | | | 3.500%, 05/01/2052 | | | 27,864 | | | | 0.0 | |
| 20,395 | | | 3.500%, 06/01/2052 | | | 18,780 | | | | 0.0 | |
| 52,864 | | | 3.500%, 06/01/2052 | | | 49,160 | | | | 0.0 | |
| 55,035 | | | 3.500%, 06/01/2052 | | | 50,677 | | | | 0.0 | |
| 31,653 | | | 3.500%, 07/01/2052 | | | 29,437 | | | | 0.0 | |
| 22,817 | | | 3.500%, 08/01/2052 | | | 21,273 | | | | 0.0 | |
| 5,310 | | | 3.500%, 09/01/2052 | | | 4,936 | | | | 0.0 | |
| 15,100 | | | 3.500%, 09/01/2052 | | | 14,034 | | | | 0.0 | |
| 19,919 | | | 3.500%, 09/01/2052 | | | 18,376 | | | | 0.0 | |
| 23,744 | | | 3.500%, 09/01/2052 | | | 21,865 | | | | 0.0 | |
| 44,000 (4) | | | 4.000%, 01/01/2039 | | | 43,175 | | | | 0.0 | |
| 14,067 | | | 4.000%, 01/01/2048 | | | 13,555 | | | | 0.0 | |
| 8,571 | | | 4.000%, 04/01/2048 | | | 8,256 | | | | 0.0 | |
See Accompanying Notes to Financial Statements
VY® BlackRock Inflation
Protected Bond Portfolio | PORTFOLIO OF INVESTMENTS
as of December 31, 2023 (continued) |
Principal
Amount† | | | | | Value | | | Percentage
of Net
Assets | |
| U.S. GOVERNMENT AGENCY OBLIGATIONS: (continued) | |
| | | | Uniform Mortgage-Backed Securities (continued) |
| 9,005 | | | 4.000%, 08/01/2048 | | $ | 8,663 | | | | 0.0 | |
| 12,955 | | | 4.000%, 09/01/2048 | | | 12,468 | | | | 0.0 | |
| 111,277 | | | 4.000%, 03/01/2050 | | | 106,586 | | | | 0.1 | |
| 623,289 | | | 4.000%, 04/01/2050 | | | 597,982 | | | | 0.3 | |
| 27,446 | | | 4.000%, 07/01/2050 | | | 26,424 | | | | 0.0 | |
| 65,020 | | | 4.000%, 07/01/2050 | | | 62,559 | | | | 0.0 | |
| 214,064 | | | 4.000%, 05/01/2051 | | | 204,864 | | | | 0.1 | |
| 39,153 | | | 4.000%, 04/01/2052 | | | 37,446 | | | | 0.0 | |
| 232,778 | | | 4.000%, 05/01/2052 | | | 223,973 | | | | 0.1 | |
| 27,300 | | | 4.000%, 06/01/2052 | | | 26,273 | | | | 0.0 | |
| 61,000 (4) | | | 4.500%, 01/01/2039 | | | 60,704 | | | | 0.0 | |
| 459,484 | | | 4.500%, 03/01/2048 | | | 454,104 | | | | 0.2 | |
| 59,319 | | | 4.500%, 03/01/2050 | | | 58,479 | | | | 0.0 | |
| 18,375 | | | 4.500%, 07/01/2052 | | | 17,825 | | | | 0.0 | |
| 19,450 | | | 4.500%, 07/01/2052 | | | 18,867 | | | | 0.0 | |
| 112,768 | | | 4.500%, 07/01/2052 | | | 109,390 | | | | 0.1 | |
| 35,784 | | | 4.500%, 08/01/2052 | | | 34,712 | | | | 0.0 | |
| 83,434 | | | 4.500%, 08/01/2052 | | | 81,308 | | | | 0.0 | |
| 70,741 | | | 4.500%, 11/01/2052 | | | 68,622 | | | | 0.0 | |
| 4,096,800 (4) | | | 4.500%, 01/01/2054 | | | 3,971,656 | | | | 1.8 | |
| 4,842 | | | 5.000%, 07/01/2052 | | | 4,823 | | | | 0.0 | |
| 195,670 | | | 5.000%, 07/01/2052 | | | 196,991 | | | | 0.1 | |
| 13,917 | | | 5.000%, 08/01/2052 | | | 13,873 | | | | 0.0 | |
| 908 | | | 5.000%, 09/01/2052 | | | 905 | | | | 0.0 | |
| 1,674 | | | 5.000%, 10/01/2052 | | | 1,665 | | | | 0.0 | |
| 40,960 | | | 5.000%, 11/01/2052 | | | 40,591 | | | | 0.0 | |
| 45,725 | | | 5.000%, 12/01/2052 | | | 45,307 | | | | 0.0 | |
| 49,375 | | | 5.000%, 12/01/2052 | | | 48,907 | | | | 0.0 | |
| 52,576 | | | 5.000%, 12/01/2052 | | | 52,102 | | | | 0.0 | |
| 87,181 | | | 5.000%, 12/01/2052 | | | 86,396 | | | | 0.0 | |
| 24,478 | | | 5.000%, 01/01/2053 | | | 24,248 | | | | 0.0 | |
| 54,061 | | | 5.000%, 01/01/2053 | | | 53,560 | | | | 0.0 | |
| 146,884 | | | 5.000%, 01/01/2053 | | | 145,519 | | | | 0.1 | |
| 26,485 | | | 5.000%, 02/01/2053 | | | 26,236 | | | | 0.0 | |
| 82,337 | | | 5.000%, 04/01/2053 | | | 81,782 | | | | 0.0 | |
| 6,348,004 (4) | | | 5.000%, 01/01/2054 | | | 6,281,052 | | | | 2.9 | |
| 66,864 | | | 5.500%, 01/01/2053 | | | 67,331 | | | | 0.0 | |
| 86,839 | | | 5.500%, 01/01/2053 | | | 87,408 | | | | 0.1 | |
| 100,263 | | | 5.500%, 01/01/2053 | | | 100,782 | | | | 0.1 | |
| 94,737 | | | 5.500%, 03/01/2053 | | | 95,305 | | | | 0.1 | |
| 36,314 | | | 5.500%, 05/01/2053 | | | 36,503 | | | | 0.0 | |
| 85,659 | | | 5.500%, 05/01/2053 | | | 86,178 | | | | 0.0 | |
| 92,999 | | | 5.500%, 05/01/2053 | | | 93,581 | | | | 0.1 | |
| 102,858 | | | 5.500%, 05/01/2053 | | | 103,417 | | | | 0.1 | |
| 104,029 | | | 5.500%, 05/01/2053 | | | 104,658 | | | | 0.1 | |
| 75,907 | | | 5.500%, 06/01/2053 | | | 76,349 | | | | 0.0 | |
| 6,887,672 (4) | | | 5.500%, 01/01/2054 | | | 6,917,806 | | | | 3.2 | |
| 44,625 | | | 6.000%, 10/01/2052 | | | 45,436 | | | | 0.0 | |
| 57,697 | | | 6.000%, 01/01/2053 | | | 58,692 | | | | 0.0 | |
| 79,365 | | | 6.000%, 01/01/2053 | | | 80,701 | | | | 0.0 | |
| 49,431 | | | 6.000%, 02/01/2053 | | | 50,258 | | | | 0.0 | |
| 45,068 | | | 6.000%, 04/01/2053 | | | 45,818 | | | | 0.0 | |
| 67,084 | | | 6.000%, 04/01/2053 | | | 68,249 | | | | 0.0 | |
| 48,729 | | | 6.000%, 05/01/2053 | | | 49,568 | | | | 0.0 | |
| 56,102 | | | 6.000%, 05/01/2053 | | | 57,049 | | | | 0.0 | |
| 88,139 | | | 6.000%, 05/01/2053 | | | 89,677 | | | | 0.1 | |
| 88,643 | | | 6.000%, 05/01/2053 | | | 90,081 | | | | 0.1 | |
| 67,821 | | | 6.000%, 06/01/2053 | | | 68,999 | | | | 0.0 | |
| 110,150 | | | 6.000%, 07/01/2053 | | | 112,047 | | | | 0.1 | |
Principal
Amount† | | | | | Value | | | Percentage
of Net
Assets | |
| U.S. GOVERNMENT AGENCY OBLIGATIONS: (continued) | |
| | | | Uniform Mortgage-Backed Securities (continued) |
| 117,638 | | | 6.500%, 08/01/2053 | | $ | 120,886 | | | | 0.1 | |
| 65,168 | | | 6.500%, 10/01/2053 | | | 66,991 | | | | 0.0 | |
| 35,656 | | | 6.500%, 11/01/2053 | | | 36,640 | | | | 0.0 | |
| 126,700 (4) | | | 6.500%, 01/01/2054 | | | 129,853 | | | | 0.1 | |
| | | | | | | 36,503,084 | | | | 16.7 | |
| | | | Total U.S. Government Agency Obligations
(Cost $42,769,619) | | | 41,618,614 | | | | 19.0 | |
| | | | | | | | | | | | |
| COMMERCIAL MORTGAGE-BACKED SECURITIES: 4.9% |
| 366,000 | | | BANK 2019-BN23 A3, 2.920%, 12/15/2052 | | | 324,524 | | | | 0.1 | |
| 280,000 (3) | | | BANK 2022-BNK42 A5, 4.493%, 06/15/2055 | | | 269,364 | | | | 0.1 | |
| 300,000 | | | Barclays Commercial Mortgage Trust 2019-C3 B, 4.096%, 05/15/2052 | | | 260,158 | | | | 0.1 | |
| 280,000 | | | Barclays Commercial Mortgage Trust 2019-C4 B, 3.322%, 08/15/2052 | | | 221,243 | | | | 0.1 | |
| 240,000 (3) | | | BBCMS Mortgage Trust 2022-C16 A5, 4.600%, 06/15/2055 | | | 233,725 | | | | 0.1 | |
| 17,500 (2)(3) | | | BHP Trust 2019-BXHP C, 6.931%, (TSFR1M + 1.569%), 08/15/2036 | | | 17,292 | | | | 0.0 | |
| 800,000 (2)(3) | | | BX Trust 2021-ARIA A, 6.376%, (TSFR1M + 1.014%), 10/15/2036 | | | 782,868 | | | | 0.4 | |
| 410,000 | | | CD Mortgage Trust 2017-CD3 A4, 3.631%, 02/10/2050 | | | 381,088 | | | | 0.2 | |
| 500,000 | | | CD Mortgage Trust 2017-CD6 A5, 3.456%, 11/13/2050 | | | 468,035 | | | | 0.2 | |
| 798,015 (2)(3) | | | Credit Suisse Mortgage Capital Certificates 2019-ICE4 A, 6.389%, (TSFR1M + 1.027%), 05/15/2036 | | | 798,105 | | | | 0.4 | |
| 205,000 | | | CSAIL Commercial Mortgage Trust 2015- C3 A4, 3.718%, 08/15/2048 | | | 197,976 | | | | 0.1 | |
| 549,361 (2)(3) | | | ELP Commercial Mortgage Trust 2021-ELP A, 6.177%, (TSFR1M + 0.815%), 11/15/2038 | | | 539,559 | | | | 0.2 | |
| 364,042 (2)(3) | | | Extended Stay America Trust 2021-ESH A, 6.556%, (TSFR1M + 1.194%), 07/15/2038 | | | 360,953 | | | | 0.2 | |
| 980,000 (3) | | | Fannie Mae-Aces 2022-M10 A2, 1.938%, 01/25/2032 | | | 816,005 | | | | 0.4 | |
See Accompanying Notes to Financial Statements
VY® BlackRock Inflation
Protected Bond Portfolio | PORTFOLIO OF INVESTMENTS
as of December 31, 2023 (continued) |
Principal
Amount† | | | | | Value | | | Percentage
of Net
Assets | |
| COMMERCIAL MORTGAGE-BACKED SECURITIES: (continued) |
| 1,760,000 | | | Freddie Mac Multifamily WI Certificates Series WI-K146 K146 A2, 2.920%, 07/25/2032 | | $ | 1,575,192 | | | | 0.7 | |
| 1,000,000 | | | GS Mortgage Securities Trust 2016-GS2 A4, 3.050%, 05/10/2049 | | | 946,665 | | | | 0.4 | |
| 600,000 (2)(3) | | | JP Morgan Chase Commercial Mortgage Securities Trust 2021-NYAH A, 6.236%, (TSFR1M + 0.874%), 06/15/2038 | | | 587,101 | | | | 0.3 | |
| 378,185 (2)(3) | | | Med Trust 2021-MDLN A, 6.426%, (TSFR1M + 1.064%), 11/15/2038 | | | 371,266 | | | | 0.2 | |
| 100,000 (2)(3) | | | MF1 2021-W10 A, 6.432%, (TSFR1M + 1.070%), 12/15/2034 | | | 97,657 | | | | 0.0 | |
| 215,000 (2)(3) | | | MTN Commercial Mortgage Trust 2022-LPFL A, 6.767%, (TSFR1M + 1.397%), 03/15/2039 | | | 209,933 | | | | 0.1 | |
| 250,000 (2)(3) | | | Taubman Centers Commercial Mortgage Trust 2022-DPM A, 7.548%, (TSFR1M + 2.186%), 05/15/2037 | | | 248,948 | | | | 0.1 | |
| 422,500 | | | Wells Fargo Commercial Mortgage Trust 2015-C26 B, 3.783%, 02/15/2048 | | | 397,279 | | | | 0.2 | |
| 700,000 | | | Wells Fargo Commercial Mortgage Trust 2017-C39 A5, 3.418%, 09/15/2050 | | | 655,659 | | | | 0.3 | |
| | | | Total Commercial Mortgage-Backed Securities (Cost $11,468,128) | | | 10,760,595 | | | | 4.9 | |
| | | | | | | | | | | | |
| COLLATERALIZED MORTGAGE OBLIGATIONS: 1.8% |
| 273,343 (2)(3) | | | BRAVO Residential Funding Trust 2023-NQM3 A1, 4.850%, 09/25/2062 | | | 269,290 | | | | 0.1 | |
| 267,031 (2)(3) | | | CSMC Trust 2022-NQM4 A1A, 4.819%, 06/25/2067 | | | 263,345 | | | | 0.1 | |
| 505,542 (2)(3) | | | CSMC Trust 2022-NQM5 A1, 5.169%, 05/25/2067 | | | 502,604 | | | | 0.2 | |
| 338,652 (2)(3) | | | Ellington Financial Mortgage Trust 2021-3 A1, 1.241%, 09/25/2066 | | | 269,965 | | | | 0.1 | |
| 841,789 (2)(3) | | | J.P. Morgan Mortgage Trust 2022-INV3 A3B, 3.000%, 09/25/2052 | | | 719,786 | | | | 0.3 | |
Principal
Amount† | | | | | Value | | | Percentage
of Net
Assets | |
| COLLATERALIZED MORTGAGE OBLIGATIONS: (continued) |
| 146,858 (2)(3) | | | J.P. Morgan Mortgage Trust 2023-DSC1 A1, 4.625%, 07/25/2063 | | $ | 138,697 | | | | 0.1 | |
| 1,000,544 (2)(3) | | | Mello Mortgage Capital Acceptance 2022-INV2 A3, 3.000%, 04/25/2052 | | | 858,024 | | | | 0.4 | |
| 89,604 (2)(3) | | | PRKCM Trust 2022-AFC2 A1, 5.335%, 08/25/2057 | | | 88,362 | | | | 0.0 | |
| 384,539 (2)(3) | | | SG Residential Mortgage Trust 2021-1 A1, 1.160%, 07/25/2061 | | | 304,441 | | | | 0.1 | |
| 124,759 (2)(3) | | | SG Residential Mortgage Trust 2022-2 A1, 5.353%, 08/25/2062 | | | 124,858 | | | | 0.1 | |
| 362,013 (2)(3) | | | Verus Securitization Trust 2022-7 A1, 5.152%, 07/25/2067 | | | 362,764 | | | | 0.2 | |
| 99,872 (2)(3) | | | Verus Securitization Trust 2022-INV2 A1, 6.790%, 10/25/2067 | | | 101,410 | | | | 0.1 | |
| | | | Total Collateralized Mortgage Obligations (Cost $4,163,904) | | | 4,003,546 | | | | 1.8 | |
| | | | | | | | | | | | |
| ASSET-BACKED SECURITIES: 1.7% |
| | | | Automobile Asset-Backed Securities: 0.1% |
| 360,492 (2) | | | Credit Acceptance Auto Loan Trust 2021-4 A, 1.260%, 10/15/2030 | | | 352,918 | | | | 0.1 | |
| | | | | | | | | | | | |
| | | | Other Asset-Backed Securities: 0.8% |
| 401,000 (2) | | | AMSR Trust 2022-SFR3 D, 4.000%, 10/17/2039 | | | 367,863 | | | | 0.2 | |
| 102,246 (2) | | | GoodLeap Sustainable Home Solutions Trust 2022-1GS A, 2.700%, 01/20/2049 | | | 81,101 | | | | 0.0 | |
| 400,000 (2) | | | New Residential Mortgage Loan Trust 2022-SFR2 D, 4.000%, 09/04/2039 | | | 366,170 | | | | 0.2 | |
| 395,000 (2) | | | Progress Residential Trust 2022-SFR6 D, 6.035%, 07/20/2039 | | | 389,437 | | | | 0.2 | |
| 525,000 (2) | | | Progress Residential Trust 2022-SFR7 D, 5.500%, 10/27/2039 | | | 507,765 | | | | 0.2 | |
| | | | | | | 1,712,336 | | | | 0.8 | |
| | | | | | | | | | | | |
| | | | Student Loan Asset-Backed Securities: 0.8% |
| 123,044 (2) | | | College Ave Student Loans LLC 2021-B A2, 1.760%, 06/25/2052 | | | 107,911 | | | | 0.1 | |
| 118,970 (2) | | | Navient Student Loan Trust 2019-BA A2A, 3.390%, 12/15/2059 | | | 113,768 | | | | 0.1 | |
See Accompanying Notes to Financial Statements
VY® BlackRock Inflation
Protected Bond Portfolio | PORTFOLIO OF INVESTMENTS
as of December 31, 2023 (continued) |
Principal
Amount† | | | | | Value | | | Percentage
of Net
Assets | |
| ASSET-BACKED SECURITIES: (continued) | |
| | | | Student Loan Asset-Backed Securities: (continued) |
| 525,683 (2)(3) | | | Nelnet Student Loan Trust 2021-BA AFL, 6.252%, (TSFR1M + 0.894%), 04/20/2062 | | $ | 518,793 | | | | 0.2 | |
| 459,614 (3) | | | SLM Private Credit Student Loan Trust 2005-A A4, 5.956%, (TSFR3M + 0.572%), 12/15/2038 | | | 446,145 | | | | 0.2 | |
| 340,606 (2) | | | SMB Private Education Loan Trust 2021-D A1A, 1.340%, 03/17/2053 | | | 306,631 | | | | 0.1 | |
| 183,274 (2) | | | Sofi Professional Loan Program Trust 2018-C A2FX, 3.590%, 01/25/2048 | | | 177,988 | | | | 0.1 | |
| | | | | | | 1,671,236 | | | | 0.8 | |
| | | | Total Asset-Backed Securities
(Cost $3,835,542) | | | 3,736,490 | | | | 1.7 | |
| SOVEREIGN BONDS: 1.5% |
| 250,000 | | | Chile Government International Bond, 2.550%, 07/27/2033 | | | 207,266 | | | | 0.1 | |
| EUR170,000 | | | European Union NGEU, 2.500%, 10/04/2052 | | | 166,786 | | | | 0.1 | |
| EUR165,000 | | | European Union NGEU, 3.000%, 03/04/2053 | | | 178,892 | | | | 0.1 | |
| 200,000 | | | Indonesia Government International Bond, 5.650%, 01/11/2053 | | | 219,812 | | | | 0.1 | |
| MXN4,500,000 | | | Mexican Bonos M, 8.500%, 03/01/2029 | | | 258,870 | | | | 0.1 | |
| MXN9,000,000 | | | Mexican Bonos M, 8.500%, 05/31/2029 | | | 519,786 | | | | 0.2 | |
| 400,000 | | | Mexico Government International Bond, 3.500%, 02/12/2034 | | | 339,687 | | | | 0.1 | |
| 300,000 | | | Mexico Government International Bond, 4.600%, 02/10/2048 | | | 248,437 | | | | 0.1 | |
| 250,000 | | | Mexico Government International Bond, 4.875%, 05/19/2033 | | | 241,602 | | | | 0.1 | |
| 200,000 | | | Panama Government International Bond, 3.298%, 01/19/2033 | | | 158,844 | | | | 0.1 | |
| 200,000 | | | Panama Government International Bond, 4.500%, 04/01/2056 | | | 134,906 | | | | 0.1 | |
| 200,000 | | | Peruvian Government International Bond, 2.783%, 01/23/2031 | | | 174,500 | | | | 0.1 | |
| 53,000 | | | Peruvian Government International Bond, 3.300%, 03/11/2041 | | | 41,323 | | | | 0.0 | |
Principal
Amount† | | | | | Value | | | Percentage
of Net
Assets | |
| SOVEREIGN BONDS: (continued) |
| 200,000 | | | Philippine Government International Bond, 3.700%, 02/02/2042 | | $ | 171,937 | | | | 0.1 | |
| GBP155,000 | | | United Kingdom Gilt, 3.750%, 10/22/2053 | | | 184,541 | | | | 0.1 | |
| 45,049 | | | Uruguay Government International Bond, 5.100%, 06/18/2050 | | | 45,331 | | | | 0.0 | |
| | | | | | | | | | | | |
| | | | Total Sovereign Bonds
(Cost $3,359,776) | | | 3,292,520 | | | | 1.5 | |
| MUNICIPAL BONDS: 0.1% |
| | | | California: 0.1% |
| 300,000 | | | University of California BF, 2.650%, 05/15/2050 | | | 203,432 | | | | 0.1 | |
| | | | Total Municipal Bonds
(Cost $220,915) | | | 203,432 | | | | 0.1 | |
| PURCHASED OPTIONS(5): 0.1% |
| | | | Total Purchased Options
(Cost $230,011) | | | 287,227 | | | | 0.1 | |
| | | | Total Long-Term Investments
(Cost $245,972,524) | | | 234,667,959 | | | | 106.9 | |
| Shares | | | | | Value | | | Percentage
of Net
Assets | |
| SHORT-TERM INVESTMENTS: 0.2% |
| | | | Mutual Funds: 0.2% |
| 419,879 (6) | | | BlackRock Liquidity Funds, FedFund, Institutional Class, 5.162% (Cost $419,879) | | $ | 419,879 | | | | 0.2 | |
| | | | | | | | | | | | |
| | | | Total Short-Term Investments (Cost $419,879) | | | 419,879 | | | | 0.2 | |
| | | | Total Investments in Securities (Cost $246,392,403) | | $ | 235,087,838 | | | | 107.1 | |
| | | | Liabilities in Excess of Other Assets | | | (15,625,034 | ) | | | (7.1) | |
| | | | Net Assets | | $ | 219,462,804 | | | | 100.0 | |
See Accompanying Notes to Financial Statements
VY® BlackRock Inflation
Protected Bond Portfolio | PORTFOLIO OF INVESTMENTS
as of December 31, 2023 (continued) |
| † | Unless otherwise indicated, principal amount is shown in USD. |
| (1) | All or a portion of this security has been pledged as collateral in connection with open futures contracts. Please refer to Note 2 for additional details. |
| (2) | Securities with purchases pursuant to Rule 144A or section 4(a)(2), under the Securities Act of 1933 and may not be resold subject to that rule except to qualified institutional buyers. |
| (3) | Variable rate security. Rate shown is the rate in effect as of December 31, 2023. |
| (4) | Represents or includes a TBA transaction. |
| (5) | The tables within the Portfolio of Investments detail open purchased options which are non-income producing securities. |
| (6) | Rate shown is the 7-day yield as of December 31, 2023. |
| Currency Abbreviations: |
| |
| EUR | EU Euro |
| GBP | British Pound |
| MXN | Mexican Peso |
Reference Rate Abbreviations:
| TSFR1M | 1-month CME Term Secured Overnight Financing Rate |
| TSFR3M | 3-month CME Term Secured Overnight Financing Rate |
Fair Value Measurements^
The following is a summary of the fair valuations according to the inputs used as of December 31, 2023 in valuing the assets and liabilities:
| | | Quoted Prices
in Active Markets
for Identical
Investments
(Level 1) | | | Significant Other
Observable
Inputs
(Level 2) | | | Significant
Unobservable
Inputs
(Level 3) | | | Fair Value
at
December 31, 2023 | |
| Asset Table | | | | | | | | | | | | | | | | |
| Investments, at fair value | | | | | | | | | | | | | | | | |
| U.S. Treasury Obligations | | $ | — | | | $ | 113,469,249 | | | $ | — | | | $ | 113,469,249 | |
| Corporate Bonds/Notes | | | — | | | | 57,296,286 | | | | — | | | | 57,296,286 | |
| U.S. Government Agency Obligations | | | — | | | | 41,618,614 | | | | — | | | | 41,618,614 | |
| Commercial Mortgage-Backed Securities | | | — | | | | 10,760,595 | | | | — | | | | 10,760,595 | |
| Collateralized Mortgage Obligations | | | — | | | | 4,003,546 | | | | — | | | | 4,003,546 | |
| Asset-Backed Securities | | | — | | | | 3,736,490 | | | | — | | | | 3,736,490 | |
| Sovereign Bonds | | | — | | | | 3,292,520 | | | | — | | | | 3,292,520 | |
| Purchased Options | | | 90,594 | | | | 196,633 | | | | — | | | | 287,227 | |
| Municipal Bonds | | | — | | | | 203,432 | | | | — | | | | 203,432 | |
| Short-Term Investments | | | 419,879 | | | | — | | | | — | | | | 419,879 | |
| Total Investments, at fair value | | $ | 510,473 | | | $ | 234,577,365 | | | $ | — | | | $ | 235,087,838 | |
| Other Financial Instruments+ | | | | | | | | | | | | | | | | |
| Centrally Cleared Inflation-Linked Swaps | | | — | | | | 468,734 | | | | — | | | | 468,734 | |
| Centrally Cleared Interest Rate Swaps | | | — | | | | 333,955 | | | | — | | | | 333,955 | |
| Forward Foreign Currency Contracts | | | — | | | | 4,207 | | | | — | | | | 4,207 | |
| Futures | | | 99,225 | | | | — | | | | — | | | | 99,225 | |
| OTC Inflation-Linked Swaps | | | — | | | | 230,593 | | | | — | | | | 230,593 | |
| Total Assets | | $ | 609,698 | | | $ | 235,614,854 | | | $ | — | | | $ | 236,224,552 | |
| Liabilities Table | | | | | | | | | | | | | | | | |
| Other Financial Instruments | | | | | | | | | | | | | | | | |
| Centrally Cleared Inflation-Linked Swaps | | $ | — | | | $ | (758,229 | ) | | $ | — | | | $ | (758,229 | ) |
| Centrally Cleared Interest Rate Swaps | | | — | | | | (297,332 | ) | | | — | | | | (297,332 | ) |
| Forward Foreign Currency Contracts | | | — | | | | (2,922 | ) | | | — | | | | (2,922 | ) |
| Futures | | | (2,284,692 | ) | | | — | | | | — | | | | (2,284,692 | ) |
| OTC Credit Default Swaps | | | — | | | | (24,538 | ) | | | — | | | | (24,538 | ) |
| Sales Commitments | | | — | | | | (2,162,083 | ) | | | — | | | | (2,162,083 | ) |
| Written Options | | | (94,500 | ) | | | (663,348 | ) | | | — | | | | (757,848 | ) |
| Total Liabilities | | $ | (2,379,192 | ) | | $ | (3,908,452 | ) | | $ | — | | | $ | (6,287,644 | ) |
| ^ | See Note 2, “Significant Accounting Policies” in the Notes to Financial Statements for additional information. |
| + | Other Financial Instruments may include open forward foreign currency contracts, futures, centrally cleared swaps, OTC swaps and written options. Forward foreign currency contracts, futures and centrally cleared swaps are fair valued at the unrealized appreciation (depreciation) on the instrument. OTC swaps and written options are valued at the fair value of the instrument. |
See Accompanying Notes to Financial Statements
VY® BlackRock Inflation
Protected Bond Portfolio | PORTFOLIO OF INVESTMENTS
as of December 31, 2023 (continued) |
At December 31, 2023, the following forward foreign currency contracts were outstanding for VY® BlackRock Inflation Protected Bond Portfolio:
| Currency Purchased | | Currency Sold | | Counterparty | | Settlement Date | | Unrealized
Appreciation
(Depreciation) | |
| EUR | | | 292,000 | | | USD | | | 323,902 | | | BNP Paribas | | 01/03/24 | | $ | (1,535 | ) |
| USD | | | 324,287 | | | EUR | | | 292,000 | | | BNP Paribas | | 02/02/24 | | | 1,505 | |
| USD | | | 75,692 | | | AUD | | | 110,821 | | | BNP Paribas | | 02/02/24 | | | 90 | |
| GBP | | | 140,000 | | | USD | | | 178,640 | | | Citibank N.A. | | 01/03/24 | | | (188 | ) |
| USD | | | 178,668 | | | GBP | | | 140,000 | | | Citibank N.A. | | 02/02/24 | | | 185 | |
| USD | | | 361,914 | | | GBP | | | 283,000 | | | HSBC Bank PLC | | 01/03/24 | | | 1,186 | |
| USD | | | 304,837 | | | EUR | | | 277,000 | | | Morgan Stanley & Co. International PLC | | 01/03/24 | | | (970 | ) |
| USD | | | 16,330 | | | EUR | | | 15,000 | | | The Bank of New York Mellon | | 01/03/24 | | | (229 | ) |
| GBP | | | 143,655 | | | USD | | | 181,870 | | | UBS AG | | 01/03/24 | | | 1,241 | |
| | | | | | | | | | | | | | | | | $ | 1,285 | |
At December 31, 2023, the following futures contracts were outstanding for VY® BlackRock Inflation Protected Bond Portfolio:
| Description | | Number
of Contracts | | Expiration
Date | | Notional
Amount | | | Unrealized
Appreciation/
(Depreciation) | |
| Long Contracts: | | | | | | | | | | | | | |
| 3-month SOFRRATE | | | 71 | | 06/18/24 | | $ | 16,865,163 | | | $ | 38,731 | |
| 3-month SOFRRATE | | | 14 | | 09/16/25 | | | 3,387,650 | | | | 6,627 | |
| Australia 10-Year Bond | | | 9 | | 03/15/24 | | | 715,516 | | | | 19,848 | |
| Euro-Bund | | | 3 | | 03/07/24 | | | 454,451 | | | | 2,810 | |
| U.S. Treasury 5-Year Note | | | 21 | | 03/28/24 | | | 2,284,242 | | | | 31,209 | |
| | | | | | | | $ | 23,707,022 | | | $ | 99,225 | |
| Short Contracts: | | | | | | | | | | | | | |
| 3-month SOFR | | | (61) | | 12/17/24 | | | (14,625,513 | ) | | | (69,644 | ) |
| 3-month SOFR | | | (44) | | 06/17/25 | | | (10,623,800 | ) | | | (52,209 | ) |
| Canada 10-Year Bond | | | (35) | | 03/19/24 | | | (3,280,103 | ) | | | (155,325 | ) |
| Euro-Buxl 30-year German Government Bond | | | (5) | | 03/07/24 | | | (782,257 | ) | | | (24,720 | ) |
| Long Gilt | | | (3) | | 03/26/24 | | | (392,528 | ) | | | (8,668 | ) |
| U.S. Treasury 10-Year Note | | | (87) | | 03/19/24 | | | (9,821,484 | ) | | | (278,359 | ) |
| U.S. Treasury Long Bond | | | (62) | | 03/19/24 | | | (7,746,125 | ) | | | (522,537 | ) |
| U.S. Treasury Ultra 10-Year Note | | | (121) | | 03/19/24 | | | (14,279,891 | ) | | | (561,192 | ) |
| U.S. Treasury Ultra Long Bond | | | (51) | | 03/19/24 | | | (6,813,281 | ) | | | (612,038 | ) |
| | | | | | | | $ | (68,364,982 | ) | | $ | (2,284,692 | ) |
At December 31, 2023, the following over-the-counter credit default swaps were outstanding for VY® BlackRock Inflation Protected Bond Portfolio:
OTC Credit Default Swaps on Securities - Buy Protection(1)
| Counterparty | | Reference Entity/
Obligation(2) | | Buy/Sell
Protection | | (Pay)/
Receive
Financing
Rate (%) | | | Termination
Date | | Notional
Amount(3) | | | Fair
Value(4) | | | Upfront
Payments
Paid/
(Received) | | | Unrealized
Appreciation/
(Depreciation) | |
| | | | | | | | | | | | | | | | | | | | | | | | |
| Bank of America N.A. | | American Electric Power Co., Inc. | | Buy | | (1.000) | | | 12/20/28 | | USD | | 102,522 | | | $ | (2,826 | ) | | $ | (2,332 | ) | | $ | (494 | ) |
| Deutsche Bank AG | | American Electric Power Co., Inc. | | Buy | | (1.000) | | | 12/20/28 | | USD | | 128,478 | | | | (3,541 | ) | | | (2,575 | ) | | | (966 | ) |
| Goldman Sachs International | | American Electric Power Co., Inc. | | Buy | | (1.000) | | | 12/20/28 | | USD | | 250,000 | | | | (6,890 | ) | | | (6,362 | ) | | | (528 | ) |
| Citibank N.A. | | American Express Co. | | Buy | | (1.000) | | | 12/20/28 | | USD | | 250,000 | | | | (6,713 | ) | | | (5,001 | ) | | | (1,712 | ) |
| Barclays Bank PLC | | Dominion Energy, Inc. | | Buy | | (1.000) | | | 12/20/28 | | USD | | 25,874 | | | | (507 | ) | | | (403 | ) | | | (104 | ) |
| Citibank N.A. | | Dominion Energy, Inc. | | Buy | | (1.000) | | | 12/20/28 | | USD | | 50,949 | | | | (999 | ) | | | (755 | ) | | | (244 | ) |
| Bank of America N.A. | | Dominion Energy, Inc. | | Buy | | (1.000) | | | 12/20/28 | | USD | | 53,662 | | | | (1,052 | ) | | | (819 | ) | | | (233 | ) |
| Bank of America N.A. | | Dominion Energy, Inc. | | Buy | | (1.000) | | | 12/20/28 | | USD | | 102,515 | | | | (2,010 | ) | | | (1,649 | ) | | | (361 | ) |
| | | | | | | | | | | | | | | | | $ | (24,538 | ) | | $ | (19,896 | ) | | $ | (4,642 | ) |
| (1) | If a Portfolio is a buyer of protection and a credit event occurs, as defined under the terms of that particular swap agreement, a Portfolio will either i) receive from the seller of protection an amount equal to the notional amount of the swap and deliver the referenced obligation, other deliverable obligations or underlying securities comprising the referenced index or ii) receive a net settlement amount in the form of cash or securities equal to the notional amount of the swap less the recovery value of the referenced obligation or underlying securities comprising the referenced index. |
See Accompanying Notes to Financial Statements
VY® BlackRock Inflation
Protected Bond Portfolio | PORTFOLIO OF INVESTMENTS
as of December 31, 2023 (continued) |
| (2) | Payments made quarterly. |
| (3) | The maximum amount of future payments (undiscounted) that a Portfolio as seller of protection could be required to make or receive as a buyer of credit protection under a credit default swap agreement would be an amount equal to the notional amount of the agreement. |
| (4) | The fair values for credit default swap agreements serve as an indicator of the current status of the payment/performance risk and represent the likelihood or risk of default for the credit derivative. Increasing fair values, in absolute terms, when compared to the notional amount of the agreement, represent a deterioration of the referenced obligation’s credit soundness and a greater likelihood or risk of default or other credit event occurring. |
At December 31, 2023, the following centrally cleared interest rate swaps were outstanding for VY® BlackRock Inflation Protected Bond Portfolio:
Pay/Receive
Floating Rate | | Floating Rate Index | | Floating
Rate Index
Payment
Frequency | | Fixed
Rate | | Fixed Rate
Payment
Frequency | | Maturity
Date | | Notional
Amount | | | Fair
Value | | | Unrealized
Appreciation/
(Depreciation) | |
| Pay | | 1-day CAD-CORRA-OIS-COMPOUND | | Semi-Annual | | 4.002% | | Semi-Annual | | 09/21/33 | | CAD | | 185,000 | | | $ | 10,857 | | | $ | 10,857 | |
| Pay | | 1-day CAD-CORRA-OIS-COMPOUND | | Semi-Annual | | 3.540 | | Semi-Annual | | 06/15/33 | | CAD | | 804,497 | | | | 23,458 | | | | 23,458 | |
| Pay | | 6-month EUR-EURIBOR | | Semi-Annual | | 3.216 | | Annual | | 11/08/33 | | EUR | | 444,750 | | | | 30,863 | | | | 30,863 | |
| Pay | | 6-month EUR-EURIBOR | | Semi-Annual | | 3.224 | | Annual | | 11/08/33 | | EUR | | 444,751 | | | | 31,205 | | | | 31,205 | |
| Pay | | 6-month EUR-EURIBOR | | Semi-Annual | | 3.528 | | Annual | | 11/08/25 | | EUR | | 1,968,750 | | | | 24,716 | | | | 24,716 | |
| Pay | | 6-month EUR-EURIBOR | | Semi-Annual | | 3.535 | | Annual | | 11/08/25 | | EUR | | 1,968,750 | | | | 24,969 | | | | 24,969 | |
| Pay | | 1-day Secured Overnight Financing Rate | | Annual | | 3.425 | | Annual | | 06/17/29 | | USD | | 517,532 | | | | 1,946 | | | | 1,946 | |
| Pay | | 1-day Secured Overnight Financing Rate | | Annual | | 3.363 | | Annual | | 06/17/29 | | USD | | 690,033 | | | | 680 | | | | 680 | |
| Pay | | 1-day Secured Overnight Financing Rate | | Annual | | 3.439 | | Annual | | 06/17/29 | | USD | | 690,044 | | | | 3,042 | | | | 3,042 | |
| Pay | | 1-day Secured Overnight Financing Rate | | Annual | | 3.331 | | Annual | | 06/17/29 | | USD | | 920,064 | | | | (410 | ) | | | (410 | ) |
| Pay | | 1-day Secured Overnight Financing Rate | | Annual | | 3.408 | | Annual | | 06/17/29 | | USD | | 1,380,100 | | | | 4,170 | | | | 4,170 | |
| Pay | | 1-day Secured Overnight Financing Rate | | Annual | | 4.839 | | Annual | | 10/19/26 | | USD | | 3,810,000 | | | | 103,019 | | | | 103,019 | |
| Pay | | 1-day Secured Overnight Financing Rate | | Annual | | 4.562 | | Annual | | 10/12/26 | | USD | | 3,850,000 | | | | 75,030 | | | | 75,030 | |
| Receive | | 1-day CAD-CORRA-OIS-COMPOUND | | Semi-Annual | | 3.722 | | Semi-Annual | | 09/21/53 | | CAD | | 80,000 | | | | (8,900 | ) | | | (8,900 | ) |
| Receive | | 1-day CAD-CORRA-OIS-COMPOUND | | Semi-Annual | | 3.404 | | Semi-Annual | | 06/15/53 | | CAD | | 358,000 | | | | (22,780 | ) | | | (22,780 | ) |
| Receive | | 6-month EUR-EURIBOR | | Semi-Annual | | 3.157 | | Annual | | 11/08/28 | | EUR | | 1,642,875 | | | | (58,551 | ) | | | (58,551 | ) |
| Receive | | 6-month EUR-EURIBOR | | Semi-Annual | | 3.165 | | Annual | | 11/08/28 | | EUR | | 1,642,875 | | | | (59,168 | ) | | | (59,168 | ) |
| Receive | | 1-day Secured Overnight Financing Rate | | Annual | | 5.092 | | Annual | | 10/19/25 | | USD | | 5,570,000 | | | | (85,860 | ) | | | (85,860 | ) |
| Receive | | 1-day Secured Overnight Financing Rate | | Annual | | 4.852 | | Annual | | 10/12/25 | | USD | | 5,625,000 | | | | (61,663 | ) | | | (61,663 | ) |
| | | | | | | | | | | | | | | | | | $ | 36,623 | | | $ | 36,623 | |
At December 31, 2023, the following centrally cleared inflation-linked swaps were outstanding for VY® BlackRock Inflation Protected Bond Portfolio:
Pay/Receive
Floating
Rate | | Floating Rate
Index | | Floating Rate
Index Payment
Frequency | | Fixed
Rate | | Fixed Rate
Payment
Frequency | | Maturity
Date | | Notional Amount | | Fair
Value | | | Unrealized
Appreciation/
(Depreciation) | |
| Pay | | Eurostat Eurozone HICP ex Tobacco NSA (CPTFEMU) | | At Termination Date | | 2.055% | | At Termination Date | | 12/15/28 | | EUR | | 695,000 | | | $ | 2,238 | | | $ | 2,802 | |
| Pay | | Eurostat Eurozone HICP ex Tobacco NSA (CPTFEMU) | | At Termination Date | | 2.780 | | At Termination Date | | 08/15/53 | | EUR | | 35,000 | | | | 4,077 | | | | 4,055 | |
| Pay | | Eurostat Eurozone HICP ex Tobacco NSA (CPTFEMU) | | At Termination Date | | 2.529 | | At Termination Date | | 11/15/53 | | EUR | | 70,000 | | | | 2,054 | | | | 2,054 | |
| Pay | | Eurostat Eurozone HICP ex Tobacco NSA (CPTFEMU) | | At Termination Date | | 2.640 | | At Termination Date | | 11/15/53 | | EUR | | 35,000 | | | | 2,400 | | | | 2,212 | |
| Pay | | Eurostat Eurozone HICP ex Tobacco NSA (CPTFEMU) | | At Termination Date | | 2.512 | | At Termination Date | | 12/15/53 | | EUR | | 170,000 | | | | 4,038 | | | | 4,038 | |
| Pay | | U.S. CPI Urban Consumers NSA (CPURNSA) | | At Termination Date | | 2.207 | | At Termination Date | | 12/05/25 | | USD | | 415,000 | | | | 1,354 | | | | 1,354 | |
| Pay | | U.S. CPI Urban Consumers NSA (CPURNSA) | | At Termination Date | | 2.101 | | At Termination Date | | 12/08/25 | | USD | | 410,000 | | | | 498 | | | | 498 | |
| Pay | | U.S. CPI Urban Consumers NSA (CPURNSA) | | At Termination Date | | 2.147 | | At Termination Date | | 12/13/25 | | USD | | 810,000 | | | | 1,704 | | | | 1,704 | |
| Receive | | Eurostat Eurozone HICP ex Tobacco NSA (CPTFEMU) | | At Termination Date | | 1.839 | | At Termination Date | | 12/15/25 | | EUR | | 695,000 | | | | (651 | ) | | | (1,337 | ) |
| Receive | | U.S. CPI Urban Consumers NSA (CPURNSA) | | At Termination Date | | 0.945 | | At Termination Date | | 03/12/25 | | USD | | 1,650,000 | | | | 267,004 | | | | 267,004 | |
| Receive | | U.S. CPI Urban Consumers NSA (CPURNSA) | | At Termination Date | | 3.794 | | At Termination Date | | 04/08/25 | | USD | | 5,300,000 | | | | (5,430 | ) | | | (5,430 | ) |
| Receive | | U.S. CPI Urban Consumers NSA (CPURNSA) | | At Termination Date | | 3.563 | | At Termination Date | | 06/24/25 | | USD | | 4,900,000 | | | | (48,187 | ) | | | (48,187 | ) |
| Receive | | U.S. CPI Urban Consumers NSA (CPURNSA) | | At Termination Date | | 3.100 | | At Termination Date | | 08/08/25 | | USD | | 2,200,000 | | | | (17,398 | ) | | | (17,398 | ) |
| Receive | | U.S. CPI Urban Consumers NSA (CPURNSA) | | At Termination Date | | 2.315 | | At Termination Date | | 11/14/25 | | USD | | 1,000,000 | | | | (4,583 | ) | | | (4,584 | ) |
See Accompanying Notes to Financial Statements
VY® BlackRock Inflation
Protected Bond Portfolio | PORTFOLIO OF INVESTMENTS
as of December 31, 2023 (continued) |
Pay/Receive
Floating
Rate | | Floating Rate
Index | | Floating Rate
Index Payment
Frequency | | Fixed
Rate | | Fixed Rate
Payment
Frequency | | Maturity
Date | | Notional Amount | | Fair
Value | | | Unrealized
Appreciation/
(Depreciation) | |
| Receive | | U.S. CPI Urban Consumers NSA (CPURNSA) | | At Termination Date | | 2.197% | | At Termination Date | | 12/19/25 | | USD | | 1,000,000 | | | $ | (2,858 | ) | | $ | (2,858 | ) |
| Receive | | U.S. CPI Urban Consumers NSA (CPURNSA) | | At Termination Date | | 3.526 | | At Termination Date | | 04/08/26 | | USD | | 13,500,000 | | | | (89,594 | ) | | | (89,594 | ) |
| Receive | | U.S. CPI Urban Consumers NSA (CPURNSA) | | At Termination Date | | 3.270 | | At Termination Date | | 06/24/26 | | USD | | 6,500,000 | | | | (72,724 | ) | | | (72,724 | ) |
| Receive | | U.S. CPI Urban Consumers NSA (CPURNSA) | | At Termination Date | | 2.453 | | At Termination Date | | 08/11/26 | | USD | | 360,000 | | | | (1,368 | ) | | | (1,368 | ) |
| Receive | | U.S. CPI Urban Consumers NSA (CPURNSA) | | At Termination Date | | 2.925 | | At Termination Date | | 02/02/27 | | USD | | 3,400,000 | | | | 72,420 | | | | 72,420 | |
| Receive | | U.S. CPI Urban Consumers NSA (CPURNSA) | | At Termination Date | | 3.000 | | At Termination Date | | 02/25/27 | | USD | | 5,540,000 | | | | 81,090 | | | | 81,090 | |
| Receive | | U.S. CPI Urban Consumers NSA (CPURNSA) | | At Termination Date | | 3.213 | | At Termination Date | | 03/02/27 | | USD | | 1,350,000 | | | | 4,954 | | | | 4,954 | |
| Receive | | U.S. CPI Urban Consumers NSA (CPURNSA) | | At Termination Date | | 3.290 | | At Termination Date | | 03/07/27 | | USD | | 2,200,000 | | | | (2,173 | ) | | | (2,173 | ) |
| Receive | | U.S. CPI Urban Consumers NSA (CPURNSA) | | At Termination Date | | 3.646 | | At Termination Date | | 05/04/27 | | USD | | 2,500,000 | | | | (71,896 | ) | | | (71,896 | ) |
| Receive | | U.S. CPI Urban Consumers NSA (CPURNSA) | | At Termination Date | | 3.262 | | At Termination Date | | 05/12/27 | | USD | | 1,955,000 | | | | (22,705 | ) | | | (22,705 | ) |
| Receive | | U.S. CPI Urban Consumers NSA (CPURNSA) | | At Termination Date | | 2.903 | | At Termination Date | | 07/05/27 | | USD | | 2,025,000 | | | | (5,562 | ) | | | (5,562 | ) |
| Receive | | U.S. CPI Urban Consumers NSA (CPURNSA) | | At Termination Date | | 3.030 | | At Termination Date | | 08/02/27 | | USD | | 2,400,000 | | | | (39,864 | ) | | | (45,094 | ) |
| Receive | | U.S. CPI Urban Consumers NSA (CPURNSA) | | At Termination Date | | 2.765 | | At Termination Date | | 09/23/27 | | USD | | 485,000 | | | | (6,662 | ) | | | (6,662 | ) |
| Receive | | U.S. CPI Urban Consumers NSA (CPURNSA) | | At Termination Date | | 2.607 | | At Termination Date | | 12/12/27 | | USD | | 8,245,000 | | | | (44,380 | ) | | | (44,380 | ) |
| Receive | | U.S. CPI Urban Consumers NSA (CPURNSA) | | At Termination Date | | 2.613 | | At Termination Date | | 12/12/27 | | USD | | 1,295,000 | | | | (7,344 | ) | | | (7,344 | ) |
| Receive | | U.S. CPI Urban Consumers NSA (CPURNSA) | | At Termination Date | | 2.440 | | At Termination Date | | 01/30/28 | | USD | | 2,300,000 | | | | 1,397 | | | | 11,628 | |
| Receive | | U.S. CPI Urban Consumers NSA (CPURNSA) | | At Termination Date | | 2.348 | | At Termination Date | | 05/15/28 | | USD | | 1,000,000 | | | | 3,411 | | | | 3,411 | |
| Receive | | U.S. CPI Urban Consumers NSA (CPURNSA) | | At Termination Date | | 2.624 | | At Termination Date | | 08/02/28 | | USD | | 1,670,000 | | | | (16,968 | ) | | | (16,968 | ) |
| Receive | | U.S. CPI Urban Consumers NSA (CPURNSA) | | At Termination Date | | 2.650 | | At Termination Date | | 10/20/28 | | USD | | 2,250,000 | | | | (32,607 | ) | | | (27,659 | ) |
| Receive | | U.S. CPI Urban Consumers NSA (CPURNSA) | | At Termination Date | | 2.583 | | At Termination Date | | 11/02/28 | | USD | | 4,000,000 | | | | (49,151 | ) | | | (49,151 | ) |
| Receive | | U.S. CPI Urban Consumers NSA (CPURNSA) | | At Termination Date | | 2.336 | | At Termination Date | | 12/05/28 | | USD | | 415,000 | | | | (629 | ) | | | (629 | ) |
| Receive | | U.S. CPI Urban Consumers NSA (CPURNSA) | | At Termination Date | | 2.250 | | At Termination Date | | 12/08/28 | | USD | | 410,000 | | | | 1,029 | | | | 1,029 | |
| Receive | | U.S. CPI Urban Consumers NSA (CPURNSA) | | At Termination Date | | 2.317 | | At Termination Date | | 12/13/28 | | USD | | 810,000 | | | | (330 | ) | | | (330 | ) |
| Receive | | U.S. CPI Urban Consumers NSA (CPURNSA) | | At Termination Date | | 2.890 | | At Termination Date | | 08/02/29 | | USD | | 2,100,000 | | | | (33,496 | ) | | | (38,888 | ) |
| Receive | | U.S. CPI Urban Consumers NSA (CPURNSA) | | At Termination Date | | 2.583 | | At Termination Date | | 11/03/29 | | USD | | 935,000 | | | | (11,682 | ) | | | (11,682 | ) |
| Receive | | U.S. CPI Urban Consumers NSA (CPURNSA) | | At Termination Date | | 2.480 | | At Termination Date | | 01/30/30 | | USD | | 1,200,000 | | | | 276 | | | | 7,791 | |
| Receive | | U.S. CPI Urban Consumers NSA (CPURNSA) | | At Termination Date | | 2.524 | | At Termination Date | | 03/30/30 | | USD | | 2,500,000 | | | | (8,352 | ) | | | (8,352 | ) |
| Receive | | U.S. CPI Urban Consumers NSA (CPURNSA) | | At Termination Date | | 3.087 | | At Termination Date | | 04/08/30 | | USD | | 550,000 | | | | (6,416 | ) | | | (6,416 | ) |
| Receive | | U.S. CPI Urban Consumers NSA (CPURNSA) | | At Termination Date | | 2.535 | | At Termination Date | | 10/11/30 | | USD | | 2,240,000 | | | | (18,773 | ) | | | (18,773 | ) |
| Receive | | U.S. CPI Urban Consumers NSA (CPURNSA) | | At Termination Date | | 2.633 | | At Termination Date | | 11/02/30 | | USD | | 1,200,000 | | | | (19,564 | ) | | | (19,564 | ) |
| Receive | | U.S. CPI Urban Consumers NSA (CPURNSA) | | At Termination Date | | 2.593 | | At Termination Date | | 11/06/30 | | USD | | 1,200,000 | | | | (16,522 | ) | | | (16,522 | ) |
| Receive | | U.S. CPI Urban Consumers NSA (CPURNSA) | | At Termination Date | | 2.482 | | At Termination Date | | 11/17/30 | | USD | | 1,150,000 | | | | (8,067 | ) | | | (8,067 | ) |
| Receive | | U.S. CPI Urban Consumers NSA (CPURNSA) | | At Termination Date | | 2.383 | | At Termination Date | | 12/15/33 | | USD | | 260,000 | | | | 647 | | | | 647 | |
| Receive | | U.S. CPI Urban Consumers NSA (CPURNSA) | | At Termination Date | | 2.410 | | At Termination Date | | 12/15/33 | | USD | | 260,000 | | | | 43 | | | | 43 | |
| Receive | | U.S. CPI Urban Consumers NSA (CPURNSA) | | At Termination Date | | 2.459 | | At Termination Date | | 12/19/33 | | USD | | 833,333 | | | | (3,416 | ) | | | (3,416 | ) |
See Accompanying Notes to Financial Statements
VY® BlackRock Inflation
Protected Bond Portfolio | PORTFOLIO OF INVESTMENTS
as of December 31, 2023 (continued) |
Pay/Receive
Floating
Rate | | Floating Rate
Index | | Floating Rate
Index Payment
Frequency | | Fixed
Rate | | Fixed Rate
Payment
Frequency | | Maturity
Date | | Notional Amount | | Fair
Value | | | Unrealized
Appreciation/
(Depreciation) | |
| Receive | | U.S. CPI Urban Consumers NSA (CPURNSA) | | At Termination Date | | 2.464% | | At Termination Date | | 12/20/33 | | USD | | 783,333 | | | $ | (3,502 | ) | | $ | (3,502 | ) |
| Receive | | U.S. CPI Urban Consumers NSA (CPURNSA) | | At Termination Date | | 2.436 | | At Termination Date | | 12/21/33 | | USD | | 503,500 | | | | (1,009 | ) | | | (1,009 | ) |
| Receive | | U.S. CPI Urban Consumers NSA (CPURNSA) | | At Termination Date | | 2.430 | | At Termination Date | | 12/28/33 | | USD | | 379,834 | | | | (497 | ) | | | (497 | ) |
| Receive | | U.S. CPI Urban Consumers NSA (CPURNSA) | | At Termination Date | | 2.660 | | At Termination Date | | 11/13/53 | | USD | | 1,150,000 | | | | (73,105 | ) | | | (73,105 | ) |
| Receive | | U.S. CPI Urban Consumers NSA (CPURNSA) | | At Termination Date | | 2.475 | | At Termination Date | | 12/18/53 | | USD | | 225,000 | | | | (4,403 | ) | | | (4,403 | ) |
| | | | | | | | | | | | | | | | | | $ | (301,234 | ) | | $ | (289,495 | ) |
At December 31, 2023, the following OTC inflation-linked swaps were outstanding for VY® BlackRock Inflation Protected Bond Portfolio:
| Counterparty | | Pay/
Receive
Floating
Rate | | Floating
Rate Index | | Floating Rate
Index
Payment
Frequency | | Fixed
Rate | | Fixed Rate
Payment
Frequency | | Maturity
Date | | Notional
Amount | | Fair
Value | | | Upfront
Payments
Paid/
(Received) | | | Unrealized
Appreciation/ | |
| Citibank N.A. | | Receive | | U.S. CPI Urban Consumers NSA (CPURNSA) | | At Termination Date | | 3.562% | | At Termination Date | | 01/15/25 | | USD | | 8,800,000 | | | $ | 230,593 | | | $ | — | | | $ | 230,593 | |
| | | | | | | | | | | | | | | | | | | | $ | 230,593 | | | $ | — | | | $ | 230,593 | |
At December 31, 2023, the following purchased exchange-traded options were outstanding for VY® BlackRock Inflation Protected Bond Portfolio:
| Description | | | Put/Call | | | Expiration
Date | | Exercise
Price | | | Number of
Contracts | | | Notional Amount | | Cost | | | Fair Value | |
| 3-month SOFRRATE | | | Call | | | 03/15/24 | | 94.94 USD | | | 223 | | | USD | | 53,232,888 | | | $ | 52,900 | | | $ | 90,594 | |
| | | | | | | | | | | | | | | | | | | | $ | 52,900 | | | $ | 90,594 | |
At December 31, 2023, the following exchange-traded written options were outstanding for VY® BlackRock Inflation Protected Bond Portfolio:
| Description | | | Put/Call | | | Expiration
Date | | Exercise
Price | | | Number of
Contracts | | | Notional
Amount | | Premiums
Received | | | Fair Value | |
| 3-month SOFRRATE | | | Call | | | 03/15/24 | | 96.50 USD | | | 112 | | | USD | | 26,735,800 | | | $ | 50,113 | | | $ | (94,500 | ) |
| | | | | | | | | | | | | | | | | | | | $ | 50,113 | | | $ | (94,500 | ) |
At December 31, 2023, the following OTC purchased interest rate swaptions were outstanding for VY® BlackRock Inflation Protected Bond Portfolio:
| Description | | Counterparty | | Pay/
Receive
Exercise
Rate | | Exercise
Rate | | Floating Rate
Index | | Expiration
Date | | Notional
Amount | | Cost | | | Fair Value | |
| Call on 5-Year Interest Rate Swap(1) | | Citibank N.A. | | Receive | | 4.235% | | 1-day Secured Overnight Financing Rate | | 03/26/24 | | USD | | 4,616,000 | | | $ | 71,087 | | | $ | 169,951 | |
| Put on 10-Year Interest Rate Swap(2) | | JPMorgan Chase Bank N.A. | | Pay | | 2.834% | | 6-month EUR-EURIBOR | | 03/12/24 | | EUR | | 3,313,500 | | | | 34,938 | | | | 19,858 | |
| Put on 5-Year Interest Rate Swap(2) | | Citibank N.A. | | Pay | | 4.235% | | 1-day Secured Overnight Financing Rate | | 03/26/24 | | USD | | 4,616,000 | | | | 71,086 | | | | 6,824 | |
| | | | | | | | | | | | | | | | | | $ | 177,111 | | | $ | 196,633 | |
At December 31, 2023, the following OTC written interest rate swaptions were outstanding for VY® BlackRock Inflation Protected Bond Portfolio:
| Description | | Counterparty | | Pay/Receive
Exercise
Rate | | Exercise
Rate | | Floating Rate
Index | | Expiration
Date | | Notional
Amount | | Premiums
Received | | | Fair Value | |
| Call on 5-Year Interest Rate Swap(2) | | Barclays Bank PLC | | Pay | | 3.958% | | 1-day Secured Overnight Financing Rate | | 03/14/24 | | USD | | 4,616,000 | | | $ | 65,201 | | | $ | (116,044 | ) |
| Call on 5-Year Interest Rate Swap(2) | | Citibank N.A. | | Pay | | 3.750% | | 1-day Secured Overnight Financing Rate | | 06/12/24 | | USD | | 11,540,000 | | | | 183,425 | | | | (296,307 | ) |
| Call on 5-Year Interest Rate Swap(2) | | Deutsche Bank AG | | Pay | | 3.903% | | 1-day Secured Overnight Financing Rate | | 11/14/24 | | USD | | 3,077,549 | | | | 68,322 | | | | (116,592 | ) |
| Put on 10-Year Interest Rate Swap(1) | | JPMorgan Chase Bank N.A. | | Receive | | 3.234% | | 6-month EUR-EURIBOR | | 03/12/24 | | EUR | | 3,313,500 | | | | 10,817 | | | | (5,859 | ) |
| Put on 5-Year Interest Rate Swap(1) | | Barclays Bank PLC | | Receive | | 3.958% | | 1-day Secured Overnight Financing Rate | | 03/14/24 | | USD | | 4,616,000 | | | | 65,201 | | | | (12,492 | ) |
See Accompanying Notes to Financial Statements
VY® BlackRock Inflation
Protected Bond Portfolio | PORTFOLIO OF INVESTMENTS
as of December 31, 2023 (continued) |
| Description | | Counterparty | | Pay/Receive
Exercise
Rate | | Exercise
Rate | | Floating Rate
Index | | Expiration
Date | | Notional
Amount | | Premiums
Received | | | Fair Value | |
| Put on 5-Year Interest Rate Swap(1) | | Citibank N.A. | | Receive | | 3.750% | | 1-day Secured Overnight Financing Rate | | 06/12/24 | | USD | | 11,540,000 | | | $ | 177,150 | | | $ | (86,411 | ) |
| Put on 5-Year Interest Rate Swap(1) | | Deutsche Bank AG | | Receive | | 3.903% | | 1-day Secured Overnight Financing Rate | | 11/14/24 | | USD | | 3,077,549 | | | | 68,322 | | | | (29,643 | ) |
| | | | | | | | | | | | | | | | | | $ | 638,438 | | | $ | (663,348 | ) |
| (1) | Portfolio pays the exercise rate semi-annually and receives the floating rate index quarterly. |
| (2) | Portfolio receives the exercise rate semi-annually and pays the floating rate index quarterly. |
The following sales commitments were held by the VY® BlackRock Inflation Protected Bond Portfolio at December 31, 2023:
| Principal Amount | | Description | | Contractual
Settlement Date | | Fair Value | |
| $ | (101,000 | ) | | Ginnie Mae, 2.000%, due 01/20/54 | | 01/22/24 | | $ | (85,538 | ) |
| | (119,000 | ) | | Uniform Mortgage-Backed Securities, 1.500%, due 01/01/39 | | 01/18/24 | | | (103,437 | ) |
| | (125,200 | ) | | Uniform Mortgage-Backed Securities, 1.500%, due 01/01/54 | | 01/16/24 | | | (97,539 | ) |
| | (329,000 | ) | | Uniform Mortgage-Backed Securities, 2.000%, due 01/01/39 | | 01/18/24 | | | (295,021 | ) |
| | (504,290 | ) | | Uniform Mortgage-Backed Securities, 2.000%, due 01/01/54 | | 01/16/24 | | | (412,257 | ) |
| | (169,000 | ) | | Uniform Mortgage-Backed Securities, 2.500%, due 01/01/39 | | 01/18/24 | | | (155,731 | ) |
| | (279,600 | ) | | Uniform Mortgage-Backed Securities, 2.500%, due 01/01/54 | | 01/16/24 | | | (237,900 | ) |
| | (79,000 | ) | | Uniform Mortgage-Backed Securities, 3.000%, due 01/01/39 | | 01/18/24 | | | (74,491 | ) |
| | (165,000 | ) | | Uniform Mortgage-Backed Securities, 3.000%, due 01/01/54 | | 01/16/24 | | | (145,980 | ) |
| | (21,000 | ) | | Uniform Mortgage-Backed Securities, 3.500%, due 01/01/39 | | 01/18/24 | | | (20,218 | ) |
| | (225,700 | ) | | Uniform Mortgage-Backed Securities, 4.000%, due 01/01/54 | | 01/16/24 | | | (213,489 | ) |
| | (315,600 | ) | | Uniform Mortgage-Backed Securities, 6.000%, due 01/01/54 | | 01/16/24 | | | (320,482 | ) |
| | | | | Total Sales Commitments | | | | | | |
| | | | | Proceeds receivable $(2,119,517) | | | | $ | (2,162,083 | ) |
| Currency Abbreviations: |
| |
| AUD | — | Australian Dollar |
| CAD | — | Canadian Dollar |
| EUR | — | EU Euro |
| GBP | — | British Pound |
| USD | — | United States Dollar |
A summary of derivative instruments by primary risk exposure is outlined in the following tables.
The fair value of derivative instruments as of December 31, 2023 was as follows:
| Derivatives not accounted for as hedging instruments | | Location on Statement
of Assets and Liabilities | | Fair Value | |
| Asset Derivatives | | | | | | |
| Interest rate contracts | | Investments in securities at value* | | $ | 287,227 | |
| Foreign exchange contracts | | Unrealized appreciation on forward foreign currency contracts | | | 4,207 | |
| Interest rate contracts | | Variation margin receivable on futures contracts** | | | 99,225 | |
| Interest rate contracts | | Variation margin receivable on centrally cleared swaps** | | | 802,689 | |
| Interest rate contracts | | Unrealized appreciation on OTC swap agreements | | | 230,593 | |
| Total Asset Derivatives | | | | $ | 1,423,941 | |
| Liability Derivatives | | | | | | |
| Foreign exchange contracts | | Unrealized depreciation on forward foreign currency contracts | | $ | 2,922 | |
| Interest rate contracts | | Variation margin payable on futures contracts** | | | 2,284,692 | |
| Interest rate contracts | | Variation margin payable on centrally cleared swaps** | | | 1,055,561 | |
| Credit contracts | | Upfront payments received on OTC swap agreements | | | 19,896 | |
| Credit contracts | | Unrealized depreciation on OTC swap agreements | | | 4,642 | |
| Interest rate contracts | | Written options, at fair value | | | 757,848 | |
| Total Liability Derivatives | | | | $ | 4,125,561 | |
* Includes purchased options.
See Accompanying Notes to Financial Statements
VY® BlackRock Inflation
Protected Bond Portfolio | PORTFOLIO OF INVESTMENTS
as of December 31, 2023 (continued) |
| ** | The fair value presented above represents the cumulative unrealized appreciation (depreciation) on futures contracts and centrally cleared swaps as reported in the tables within the Portfolio of Investments. In the Statement of Assets and Liabilities, only current day’s unsettled variation margin is reported in receivables or payables on futures contracts and centrally cleared swaps and the net cumulative unrealized appreciation (depreciation) is included in total distributable earnings (loss). |
The effect of derivative instruments on the Portfolio’s Statement of Operations for the year ended December 31, 2023 was as follows:
Amount of Realized Gain or (Loss) on Derivatives Recognized in Income
Derivatives not accounted for as hedging
instruments | | Investments* | | | Forward
foreign
currency
contracts | | | Futures | | | Swaps | | | Written
options | | | Total | |
| Credit contracts | | $ | — | | | $ | — | | | $ | — | | | $ | 75,722 | | | $ | — | | | $ | 75,722 | |
| Foreign exchange contracts | | | (103,731 | ) | | | (51,186 | ) | | | — | | | | — | | | | 16,158 | | | | (138,759 | ) |
| Interest rate contracts | | | (1,113,034 | ) | | | — | | | | 3,517,056 | | | | 1,463,311 | | | | 788,301 | | | | 4,655,634 | |
| Total | | $ | (1,216,765 | ) | | $ | (51,186 | ) | | $ | 3,517,056 | | | $ | 1,539,033 | | | $ | 804,459 | | | $ | 4,592,597 | |
Change in Unrealized Appreciation or (Depreciation) on Derivatives Recognized in Income
Derivatives not accounted for as hedging
instruments | | Investments* | | | Forward
foreign
currency
contracts | | | Futures | | | Swaps | | | Written
options | | | Total | |
| Credit contracts | | $ | — | | | $ | — | | | $ | — | | | $ | (4,642 | ) | | $ | — | | | $ | (4,642 | ) |
| Foreign exchange contracts | | | — | | | | 11,891 | | | | — | | | | — | | | | — | | | | 11,891 | |
| Interest rate contracts | | | 162,348 | | | | — | | | | (2,593,231 | ) | | | (1,889,538 | ) | | | (118,970 | ) | | | (4,439,391 | ) |
| Total | | $ | 162,348 | | | $ | 11,891 | | | $ | (2,593,231 | ) | | $ | (1,894,180 | ) | | $ | (118,970 | ) | | $ | (4,432,142 | ) |
| * | Amounts recognized for purchased options are included in net realized gain (loss) on investments and net change in unrealized appreciation or depreciation on investments. |
The following is a summary by counterparty of the fair value of OTC derivative instruments subject to Master Netting Agreements and collateral pledged (received), if any, at December 31, 2023:
| | | Bank of
America N.A. | | | Barclays Bank
PLC | | | BNP Paribas | | | Citibank N.A. | | | Deutsche
Bank AG | | | Goldman
Sachs
International | | | HSBC Bank
PLC | | | JPMorgan
Chase Bank
N.A. | | | Morgan
Stanley & Co.
International
PLC | | | The Bank of New York
Mellon | | | UBS AG | | | Total | |
| Assets: | |
| Purchased options | | $ | — | | | $ | — | | | $ | — | | | $ | 176,775 | | | $ | — | | | $ | — | | | $ | — | | | $ | 19,858 | | | $ | — | | | $ | — | | | $ | — | | | $ | 196,633 | |
| Forward foreign currency contracts | | | — | | | | — | | | | 1,595 | | | | 185 | | | | — | | | | — | | | | 1,186 | | | | — | | | | — | | | | — | | | | 1,241 | | | | 4,207 | |
| OTC Inflation-linked swaps | | | — | | | | — | | | | — | | | | 230,593 | | | | — | | | | — | | | | — | | | | — | | | | — | | | | — | | | | — | | | | 230,593 | |
| Total Assets | | $ | — | | | $ | — | | | $ | 1,595 | | | $ | 407,553 | | | $ | — | | | $ | — | | | $ | 1,186 | | | $ | 19,858 | | | $ | — | | | $ | — | | | $ | 1,241 | | | $ | 431,433 | |
| Liabilities: |
| Forward foreign currency contracts | | $ | — | | | $ | — | | | $ | 1,535 | | | $ | 188 | | | $ | — | | | $ | — | | | $ | — | | | $ | — | | | $ | 970 | | | $ | 229 | | | $ | — | | | $ | 2,922 | |
| OTC credit default swaps | | | 5,888 | | | | 507 | | | | — | | | | 7,712 | | | | 3,541 | | | | 6,890 | | | | — | | | | — | | | | — | | | | — | | | | — | | | | 24,538 | |
| Written options | | | — | | | | 128,536 | | | | — | | | | 382,718 | | | | 146,235 | | | | — | | | | — | | | | 5,859 | | | | — | | | | — | | | | — | | | | 663,348 | |
| Total Liabilities | | $ | 5,888 | | | $ | 129,043 | | | $ | 1,535 | | | $ | 390,618 | | | $ | 149,776 | | | $ | 6,890 | | | $ | — | | | $ | 5,859 | | | $ | 970 | | | $ | 229 | | | $ | — | | | $ | 690,808 | |
| Net OTC derivative instruments by counterparty, at fair value | | $ | (5,888 | ) | | $ | (129,043 | ) | | $ | 60 | | | $ | 16,935 | | | $ | (149,776 | ) | | $ | (6,890 | ) | | $ | 1,186 | | | $ | 13,999 | | | $ | (970 | ) | | $ | (229 | ) | | $ | 1,241 | | | $ | (259,375 | ) |
| Total collateral pledged by the Portfolio/(Received from counterparty) | | $ | — | | | $ | — | | | $ | — | | | $ | (16,935 | ) | | $ | — | | | $ | — | | | $ | — | | | $ | (13,999 | ) | | $ | — | | | $ | — | | | $ | — | | | $ | (30,934 | ) |
| Net Exposure(1)(2) | | $ | (5,888 | ) | | $ | (129,043 | ) | | $ | 60 | | | $ | — | | | $ | (149,776 | ) | | $ | (6,890 | ) | | $ | 1,186 | | | $ | — | | | $ | (970 | ) | | $ | (229 | ) | | $ | 1,241 | | | $ | (290,309 | ) |
See Accompanying Notes to Financial Statements
VY® BlackRock Inflation
Protected Bond Portfolio | PORTFOLIO OF INVESTMENTS
as of December 31, 2023 (continued) |
| (1) | Positive net exposure represents amounts due from each respective counterparty. Negative exposure represents amounts due from the Portfolio. Please refer to Note 2 for additional details regarding counterparty credit risk and credit related contingent features. |
| (2) | At December 31, 2023, the Portfolio had received $30,000 and $20,000, respectively, in cash collateral from Citibank N.A. and JPMorgan Chase Bank N.A., respectively. Excess cash collateral is not shown for financial reporting purposes. |
At December 31, 2023, the aggregate cost of securities and other investments and the composition of unrealized appreciation and depreciation of securities and other investments on a tax basis were:
| Cost for federal income tax purposes was $247,529,443. | | | |
| Net unrealized depreciation consisted of: | | | |
| Gross Unrealized Appreciation | | $ | 3,568,735 | |
| Gross Unrealized Depreciation | | | (18,899,982 | ) |
| Net Unrealized Depreciation | | $ | (15,331,247 | ) |
See Accompanying Notes to Financial Statements
VY® BrandywineGLOBAL -
Bond Portfolio | PORTFOLIO OF INVESTMENTS
as of December 31, 2023 |
Principal
Amount† | | | | | Value | | | Percentage
of Net
Assets | |
| U.S. GOVERNMENT AGENCY OBLIGATIONS: 50.8% | | | | |
| | | | Federal Home Loan Banks: 8.0% |
| 18,200,000 | | | 4.875%, 09/13/2024 | | $ | 18,188,175 | | | | 8.0 | |
| | | | Government National Mortgage Association: 20.8% |
| 5,680,247 | | | 5.000%, 02/20/2053 | | | 5,646,563 | | | | 2.5 | |
| 5,902,487 | | | 5.000%, 03/20/2053 | | | 5,865,967 | | | | 2.6 | |
| 3,512,376 | | | 5.000%, 06/20/2053 | | | 3,487,386 | | | | 1.5 | |
| 3,334,281 | | | 5.500%, 02/20/2053 | | | 3,361,614 | | | | 1.5 | |
| 7,788,624 | | | 5.500%, 04/20/2053 | | | 7,847,776 | | | | 3.4 | |
| 6,699,683 | | | 5.500%, 05/20/2053 | | | 6,750,565 | | | | 2.9 | |
| 2,048,978 | | | 5.500%, 06/20/2053 | | | 2,064,540 | | | | 0.9 | |
| 4,354,452 | | | 5.500%, 09/20/2053 | | | 4,387,523 | | | | 1.9 | |
| 4,524,188 | | | 5.500%, 10/20/2053 | | | 4,558,548 | | | | 2.0 | |
| 3,506,713 | | | 6.000%, 08/20/2053 | | | 3,567,278 | | | | 1.6 | |
| | | | | | | 47,537,760 | | | | 20.8 | |
| | | | Uniform Mortgage-Backed Securities: 22.0% |
| 18,842,260 | | | 4.000%, 06/01/2052 | | | 17,830,550 | | | | 7.8 | |
| 4,411,547 | | | 4.500%, 09/01/2052 | | | 4,279,413 | | | | 1.9 | |
| 5,997,353 | | | 4.500%, 09/01/2052 | | | 5,817,721 | | | | 2.5 | |
| 3,212,118 | | | 4.500%, 10/01/2052 | | | 3,115,908 | | | | 1.4 | |
| 9,998,530 | | | 5.000%, 11/01/2052 | | | 9,899,255 | | | | 4.3 | |
| 1,197,375 | | | 5.000%, 12/01/2052 | | | 1,185,484 | | | | 0.5 | |
| 8,174,496 | | | 5.500%, 11/01/2052 | | | 8,238,465 | | | | 3.6 | |
| | | | | | | 50,366,796 | | | | 22.0 | |
| | | | Total U.S. Government Agency Obligations | | | | | | | | |
| | | | (Cost $116,446,742) | | | 116,092,731 | | | | 50.8 | |
| | | | | | | | | | | | |
| U.S. TREASURY OBLIGATIONS: 39.2% | | | | | | | | |
| | | | United States Treasury Bonds: 13.9% | |
| 5,200,000 | | | 2.875%, 05/15/2052 | | | 4,141,719 | | | | 1.8 | |
| 33,730,000 | | | 3.000%, 08/15/2052 | | | 27,592,721 | | | | 12.1 | |
| | | | | | | 31,734,440 | | | | 13.9 | |
| | | | United States Treasury Floating Rate Notes: 2.3% | |
| 5,390,000 (1) | | | 5.418%, 04/30/2025 | | | 5,387,989 | | | | 2.3 | |
| | | | | | | | | | | | |
| | | | United States Treasury Notes: 23.0% | |
| 40,780,000 | | | 3.875%, 08/15/2033 | | | 40,741,769 | | | | 17.8 | |
| 11,580,000 | | | 4.125%, 11/15/2032 | | | 11,775,186 | | | | 5.2 | |
| | | | | | | 52,516,955 | | | | 23.0 | |
| | | | | | | | | | | | |
| | | | Total U.S. Treasury Obligations | | | | | | | | |
| | | | (Cost $88,769,500) | | | 89,639,384 | | | | 39.2 | |
| | | | | |
| CORPORATE BONDS/NOTES: 5.5% | | | | |
| | | | Consumer, Cyclical: 1.7% | |
| 3,990,000 | | | Toyota Motor Credit Corp., 4.450%, 05/18/2026 | | | 3,985,396 | | | | 1.7 | |
| | | | | | | | | | | | |
| | | | Energy: 1.3% | |
| 530,000 | | | Devon Energy Corp., 7.875%, 09/30/2031 | | | 617,476 | | | | 0.3 | |
| 2,120,000 | | | Diamondback Energy, Inc., 6.250%, 03/15/2033 | | | 2,266,405 | | | | 1.0 | |
| | | | | | | 2,883,881 | | | | 1.3 | |
Principal
Amount† | | | | | Value | | | Percentage
of Net
Assets | |
| CORPORATE BONDS/NOTES: (continued) | |
| | | | Financial: 1.9% | |
| 2,120,000 | | | Equinix, Inc., 2.500%, 05/15/2031 | | $ | 1,800,928 | | | | 0.8 | |
| 2,235,000 | | | Golub Capital BDC, Inc., 2.500%, 08/24/2026 | | | 2,026,988 | | | | 0.9 | |
| 590,000 (1)(2) | | | UBS Group AG, 6.301%, 09/22/2034 | | | 625,020 | | | | 0.2 | |
| | | | | | | 4,452,936 | | | | 1.9 | |
| | | | | | | | | | | | |
| | | | Technology: 0.6% |
| 1,720,000 | | | Dell International LLC / EMC Corp., 3.375%, 12/15/2041 | | | 1,300,351 | | | | 0.6 | |
| | | | Total Corporate Bonds/ Notes (Cost $12,217,478) | | | 12,622,564 | | | | 5.5 | |
| | | | Total Long-Term Investments (Cost $217,433,720) | | | 218,354,679 | | | | 95.5 | |
| | | | | | | | | | | | |
| Shares | | | | | Value | | | Percentage
of Net
Assets | |
| SHORT-TERM INVESTMENTS: 2.5% |
| | | | Mutual Funds: 2.5% |
| 5,632,805 (3) | | | BlackRock Liquidity Funds, FedFund, Institutional Class, 5.260% (Cost $5,632,805) | | $ | 5,632,805 | | | | 2.5 | |
| | | | | | | | | | | | |
| | | | Total Short-Term Investments (Cost $5,632,805) | | | 5,632,805 | | | | 2.5 | |
| | | | Total Investments in Securities (Cost $223,066,525) | | $ | 223,987,484 | | | | 98.0 | |
| | | | Assets in Excess of Other Liabilities | | | 4,483,769 | | | | 2.0 | |
| | | | Net Assets | | $ | 228,471,253 | | | | 100.0 | |
| † | Unless otherwise indicated, principal amount is shown in USD. |
| (1) | Variable rate security. Rate shown is the rate in effect as of December 31, 2023. |
| (2) | Securities with purchases pursuant to Rule 144A or section 4(a)(2), under the Securities Act of 1933 and may not be resold subject to that rule except to qualified institutional buyers. |
| (3) | Rate shown is the 7-day yield as of December 31, 2023. |
Reference Rate Abbreviations:
USBMMY3M U.S. Treasury 3-month Bill Money Market Yield
See Accompanying Notes to Financial Statements
VY® BrandywineGLOBAL -
Bond Portfolio | PORTFOLIO OF INVESTMENTS
as of December 31, 2023 (continued) |
Fair Value Measurements^
The following is a summary of the fair valuations according to the inputs used as of December 31, 2023 in valuing the assets and liabilities:
| | | Quoted Prices
in Active Markets
for Identical
Investments
(Level 1) | | | Significant Other
Observable
Inputs
(Level 2) | | | Significant
Unobservable
Inputs
(Level 3) | | | Fair Value
at
December 31, 2023 | |
| Asset Table | | | | | | | | | | | | | | | | |
| Investments, at fair value | | | | | | | | | | | | | | | | |
| U.S. Government Agency Obligations | | $ | — | | | $ | 116,092,731 | | | $ | — | | | $ | 116,092,731 | |
| U.S. Treasury Obligations | | | — | | | | 89,639,384 | | | | — | | | | 89,639,384 | |
| Corporate Bonds/Notes | | | — | | | | 12,622,564 | | | | — | | | | 12,622,564 | |
| Short-Term Investments | | | 5,632,805 | | | | — | | | | — | | | | 5,632,805 | |
| Total Investments, at fair value | | $ | 5,632,805 | | | $ | 218,354,679 | | | $ | — | | | $ | 223,987,484 | |
| Other Financial Instruments+ | | | | | | | | | | | | | | | | |
| Futures | | | 3,508,124 | | | | — | | | | — | | | | 3,508,124 | |
| Total Assets | | $ | 9,140,929 | | | $ | 218,354,679 | | | $ | — | | | $ | 227,495,608 | |
| ^ | See Note 2, “Significant Accounting Policies” in the Notes to Financial Statements for additional information. |
| + | Other Financial Instruments may include open forward foreign currency contracts, futures, centrally cleared swaps, OTC swaps and written options. Forward foreign currency contracts, futures and centrally cleared swaps are fair valued at the unrealized appreciation (depreciation) on the instrument. OTC swaps and written options are valued at the fair value of the instrument. |
At December 31, 2023, the following futures contracts were outstanding for VY® BrandywineGLOBAL- Bond Portfolio:
| Description | | Number
of Contracts | | Expiration
Date | | Notional
Amount | | | Unrealized
Appreciation | |
| Long Contracts: | | | | | | | | | | | | | |
| U.S. Treasury 5-Year Note | | | 1,167 | | 03/28/24 | | $ | 126,938,602 | | | $ | 2,913,046 | |
| U.S. Treasury Ultra 10-Year Note | | | 120 | | 03/19/24 | | | 14,161,875 | | | | 595,078 | |
| | | | | | | | $ | 141,100,477 | | | $ | 3,508,124 | |
A summary of derivative instruments by primary risk exposure is outlined in the following tables.
The fair value of derivative instruments as of December 31, 2023 was as follows:
| Derivatives not accounted for as hedging instruments | | Location on Statement
of Assets and Liabilities | | Fair Value | |
| Asset Derivatives | | | | | | |
| Interest rate contracts | | Variation margin receivable on futures contracts* | | $ | 3,508,124 | |
| Total Asset Derivatives | | | | $ | 3,508,124 | |
| * | The fair value presented above represents the cumulative unrealized appreciation (depreciation) on futures contracts as reported in the tables within the Portfolio of Investments. In the Statement of Assets and Liabilities, only current day’s unsettled variation margin is reported in receivables or payables on futures contracts and the net cumulative unrealized appreciation (depreciation) is included in total distributable earnings (loss). |
The effect of derivative instruments on the Portfolio’s Statement of Operations for the year ended December 31, 2023 was as follows:
Amount of Realized Gain or (Loss) on Derivatives Recognized in Income
| Derivatives not accounted for as hedging instruments | | Futures | |
| Interest rate contracts | | $ | (4,234,217 | ) |
| Total | | $ | (4,234,217 | ) |
See Accompanying Notes to Financial Statements
VY® BrandywineGLOBAL -
Bond Portfolio | PORTFOLIO OF INVESTMENTS
as of December 31, 2023 (continued) |
Change in Unrealized Appreciation or (Depreciation) on Derivatives Recognized in Income
| Derivatives not accounted for as hedging instruments | | Futures | |
| Interest rate contracts | | $ | 3,508,124 | |
| Total | | $ | 3,508,124 | |
At December 31, 2023, the aggregate cost of securities and other investments and the composition of unrealized appreciation and depreciation of securities and other investments on a tax basis were:
| Cost for federal income tax purposes was $227,318,675. | | | |
| Net unrealized appreciation consisted of: | | | |
| Gross Unrealized Appreciation | | $ | 3,262,614 | |
| Gross Unrealized Depreciation | | | (3,085,682 | ) |
| Net Unrealized Appreciation | | $ | 176,932 | |
See Accompanying Notes to Financial Statements
TAX INFORMATION (Unaudited)
Dividends and distributions paid during the year ended December 31, 2023 were as follows:
| Portfolio Name | Type | Per Share Amount |
| VY® BlackRock Inflation Protected Bond Portfolio | | |
| Class ADV | NII | $0.2703 |
| Class I | NII | $0.3263 |
| Class S | NII | $0.3000 |
| | | |
| VY® BrandywineGLOBAL – Bond Portfolio | NII | $0.2094 |
NII - Net investment income
Above figures may differ from those cited elsewhere in this report due to differences in the calculation of income and gains under U.S. generally accepted accounting principles (book) purposes and Internal Revenue Service (tax) purposes.
Shareholders are strongly advised to consult their own tax advisers with respect to the tax consequences of their investments in the Portfolios. In January, shareholders, excluding corporate shareholders, receive an IRS 1099-DIV regarding the federal tax status of the dividends and distributions they received in the calendar year.
TRUSTEE AND OFFICER INFORMATION (Unaudited)
The business and affairs of each Trust are managed under the direction of the Board. A Trustee, who is not an interested person of the Trust, as defined in the 1940 Act, is an independent trustee (“Independent Trustee”). The Trustees and Officers of the Trust are listed below. The Statement of Additional Information includes additional information about trustees of the Trust and is available, without charge, upon request at (800) 992-0180 for Voya Variable Insurance Trust (“VVIT”) and (800) 366-0066 for Voya Investors Trust (“VIT”).
Name, Address and Age | | Position(s)
Held with the
Trust | | Term of Office and
Length of Time
Served(1) | | Principal
Occupation(s) –
During the Past 5 Years | | Number of
funds in
Fund
Complex
Overseen
by
Trustee(2) | | Other Board Positions
Held by Trustee |
| Independent Trustees(3): | | | | | | | | | | |
| | | | | | | | | | | |
Colleen D. Baldwin
(1960) 7337 East Doubletree Ranch Rd.
Suite 100 Scottsdale, Arizona 85258 | | Chairperson Trustee | | January 2020 – Present November 2007 –Present | | President, Glantuam Partners, LLC, a business consulting firm (January 2009 – Present). | | 138 | | Stanley Global Engineering (2020 – Present). |
| | | | | | | | | | | |
John V. Boyer
(1953) 7337 East Doubletree Ranch Rd.
Suite 100 Scottsdale, Arizona 85258 | | Trustee | | January 2005 – Present | | Retired. Formerly, President and Chief Executive Officer, Bechtler Arts Foundation, an arts and education foundation (January 2008 – December 2019). | | 138 | | None. |
| | | | | | | | | | | |
Martin J. Gavin
(1950) 7337 East Doubletree Ranch Rd.
Suite 100 Scottsdale, Arizona 85258 | | Trustee | | August 2015 – Present | | Retired. | | 138 | | None. |
| | | | | | | | | | | |
Joseph E. Obermeyer
(1957) 7337 East Doubletree Ranch Rd.
Suite 100 Scottsdale, Arizona 85258 | | Trustee | | May 2013 – Present | | President, Obermeyer & Associates, Inc., a provider of financial and economic consulting services (November 1999 – Present). | | 138 | | None. |
| | | | | | | | | | | |
Sheryl K. Pressler
(1950) 7337 East Doubletree Ranch Rd.
Suite 100 Scottsdale, Arizona 85258 | | Trustee | | January 2006 – Present | | Consultant (May 2001 – Present). | | 138 | | Centerra Gold Inc. (May 2008 – Present). |
| | | | | | | | | | | |
Christopher P. Sullivan
(1954) 7337 East Doubletree Ranch Rd.
Suite 100 Scottsdale, Arizona 85258 | | Trustee | | October 2015 – Present | | Retired. | | 138 | | None. |
| (1) | Trustees serve until their successors are duly elected and qualified. The tenure of each Trustee who is not an “interested person” as defined in the 1940 Act, of each Portfolio (“Independent Trustee”) is subject to the Board’s retirement policy which states that each duly elected or appointed Independent Trustee shall retire from and cease to be a member of the Board of Trustees at the close of business on December 31 of the calendar year in which the Independent Trustee attains the age of 75. A majority vote of the Board’s other Independent Trustees may extend the retirement date of an Independent Trustee if the retirement would trigger a requirement to hold a meeting of shareholders of the Trust under applicable law, whether for the purposes of appointing a successor to the Independent Trustee or otherwise comply under applicable law, in which case the extension would apply until such time as the shareholder meeting can be held or is no longer required (as determined by a vote of a majority of the other Independent Trustees). |
| | |
| (2) | For the purposes of this table, “Fund Complex” means the Voya family of funds including the following investment companies: Voya Asia Pacif- ic High Dividend Equity Income Fund; Voya Balanced Portfolio, Inc.; Voya Credit Income Fund; Voya Emerging Markets High Dividend Equity Fund; Voya Equity Trust; Voya Funds Trust; Voya Global Advantage and Premium Opportunity Fund; Voya Global Equity Dividend and Premium |
TRUSTEE AND OFFICER INFORMATION (Unaudited) (Continued)
Opportunity Fund; Voya Government Money Market Portfolio; Voya Infrastructure, Industrials and Materials Fund; Voya Intermediate Bond Portfolio; Voya Investors Trust; Voya Mutual Funds; Voya Partners, Inc.; Voya Separate Portfolios Trust; Voya Strategic Allocation Portfolios, Inc.; Voya Variable Funds; Voya Variable Insurance Trust; Voya Variable Portfolios, Inc.; and Voya Variable Products Trust. The number of funds in the Fund Complex is as of January 31, 2024.
| (3) | Effective December 31, 2023, Patricia W. Chadwick retired as a Trustee of the Board. |
TRUSTEE AND OFFICER INFORMATION (Unaudited) (Continued)
Name, Address and Age | | Position(s)
Held with the
Trust | | Term of Office and
Length of Time
Served(1) | | Principal
Occupation(s) – During the Past 5 Years |
Andy Simonoff
(1973) 5780 Powers Ferry Road NW Atlanta, Georgia 30327 | | President and Chief Executive Officer | | January 2023 – Present | | Director, President and Chief Executive Officer, Voya Funds Services, LLC, Voya Capital, LLC and Voya Investments, LLC (January 2023 – Present); Managing Director, Chief Strategy and Transformation Officer, Voya Investment Management (January 2020 – Present). Formerly, Managing Director, Head of Business Management, Voya Investment Management (March 2019 – January 2020); Managing Director, Head of Business Management, Fixed Income, Voya Investment Management (November 2015 – March 2019). |
| | | | | | | |
Jonathan Nash
(1967) 230 Park Avenue New York, New York 10169 | | Executive Vice President and Chief Investment Risk Officer | | March 2020 – Present | | Executive Vice President and Chief Investment Risk Officer, Voya Investments, LLC (March 2020 – Present); Senior Vice President, Investment Risk Management, Voya Investment Management (March 2017 – Present). Formerly, Vice President, Voya Investments, LLC (September 2018 – March 2020). |
| | | | | | | |
James M. Fink
(1958) 5780 Powers Ferry Road NW
Atlanta, Georgia 30327 | | Executive Vice President | | March 2018 – Present | | Senior Vice President, Voya Investments Distributor, LLC (April 2018 – Present); Managing Director, Voya Investments, LLC, Voya Capital, LLC, and Voya Funds Services, LLC (March 2018 – Present); Chief Administrative Officer, Voya Investment Management (September 2017 – Present). |
| | | | | | | |
Steven Hartstein
(1963) 230 Park Avenue New York, New York 10169 | | Chief Compliance Officer | | December 2022 – Present | | Senior Vice President, Voya Investment Management (December 2022 – Present). Formerly, Head of Funds Compliance, Brighthouse Financial, Inc. and Chief Compliance Officer – Brighthouse Funds and Brighthouse Investment Advisers, LLC (March 2017- December 2022). |
| | | | | | | |
Todd Modic
(1967) 7337 East Doubletree Ranch Rd.
Suite 100 Scottsdale, Arizona 85258 | | Senior Vice President, Chief/ Principal Financial Officer and Assistant Secretary | | March 2005 – Present | | Director and Senior Vice President, Voya Capital, LLC, and Voya Funds Services, LLC (September 2022 – Present); Director, Voya Investments, LLC (September 2022 – Present); Senior Vice President, Voya Investments, LLC (April 2005 – Present). Formerly, President, Voya Funds Services, LLC (March 2018 – September 2022). |
| | | | | | | |
Kimberly A. Anderson
(1964) 7337 East Doubletree Ranch Rd.
Suite 100 Scottsdale, Arizona 85258 | | Senior Vice President | | November 2003 – Present | | Senior Vice President, Voya Investments, LLC (September 2003 – Present). |
| | | | | | | |
Sara M. Donaldson
(1959) 7337 East Doubletree Ranch Rd.
Suite 100 Scottsdale, Arizona 85258 | | Senior Vice President | | June 2022 – Present | | Senior Vice President, Voya Investments, LLC (February 2022 – Present); Senior Vice President, Head of Active Ownership, Voya Investment Management (September 2021 – Present). Formerly, Vice President, Voya Investments, LLC (October 2015 – February 2022); Vice President, Head of Proxy Voting, Voya Investment Management (October 2015 – August 2021). |
| | | | | | | |
Jason Kadavy
(1976) 7337 East Doubletree Ranch Rd.
Suite 100 Scottsdale, Arizona 85258 | | Senior Vice President | | September 2023 – Present | | Senior Vice President, Voya Investments, LLC and Voya Funds Services, LLC (September 2023 – Present); Formerly, Vice President, Voya Investments, LLC (October 2015 - September 2023); Vice President, Voya Funds Services, LLC (July 2007 – September 2023). |
TRUSTEE AND OFFICER INFORMATION (Unaudited) (Continued)
Name, Address and Age | | Position(s)
Held with the
Trust | | Term of Office and
Length of Time
Served(1) | | Principal
Occupation(s) – During the Past 5 Years |
Andrew K. Schlueter
(1976) 7337 East Doubletree Ranch Rd.
Suite 100 Scottsdale, Arizona 85258 | | Senior Vice President | | June 2022 – Present | | Senior Vice President, Head of Investment Operations Support, Voya Investment Management (April 2023 – Present); Vice President, Voya Investments Distributor, LLC (April 2018 – Present); Vice President, Voya Investments, LLC and Voya Funds Services, LLC (March 2018-Present); Formerly, Vice President, Head of Mutual Fund Operations, Voya Investment Management (March 2022 – March 2023); Vice President, Head of Mutual Fund Operations, Voya Investment Management (February 2018 – February 2022). |
| | | | | | | |
Joanne F. Osberg
(1982) 7337 East Doubletree Ranch Rd.
Suite 100 Scottsdale, Arizona 85258 | | Senior Vice President Secretary | | March 2023 – Present September 2020 – Present | | Vice President, Voya family of funds (June 2022 – Present); Secretary, Voya family of funds (September 2020 – Present); Vice President and Senior Counsel, Voya Investment Management – Mutual Fund Legal Department (September 2020 – Present). Formerly, Assistant Secretary, Voya family of funds (January 2020 – September 2020); Vice President and Counsel, Voya Investment Management – Mutual Fund Legal Department (January 2013 – September 2020). |
| | | | | | | |
Robert Terris
(1970) 5780 Powers Ferry Road NW
Atlanta, Georgia 30327 | | Senior Vice President | | May 2006 – Present | | Senior Vice President, Head of Future State Operating Model Design, Voya Investment Management (April 2023 – Present); Senior Vice President, Voya Investments Distributor, LLC (April 2018 – Present); Senior Vice President, Head of Investment Services, Voya Investments, LLC (April 2018 – Present); Senior Vice President, Head of Investment Services, Voya Funds Services, LLC (March 2006 – Present). |
| | | | | | | |
Fred Bedoya
(1973) 7337 East Doubletree Ranch Rd.
Suite 100 Scottsdale, Arizona 85258 | | Vice President Principal Accounting Officer and Treasurer | | September 2012 – Present | | Vice President, Voya Investments, LLC (October 2015 – Present); Vice President, Voya Funds Services, LLC (July 2012 – Present). |
| | | | | | | |
Robyn L. Ichilov
(1967) 7337 East Doubletree Ranch Rd.
Suite 100 Scottsdale, Arizona 85258 | | Vice President | | VIT: November 1999 – Present VVIT: October 2000 - Present | | Vice President, Voya Investments, LLC (August 1997 – Present); Vice President, Voya Funds Services, LLC (November 1995 – Present). |
| | | | | | | |
Erica McKenna
(1972) 7337 East Doubletree Ranch Rd.
Suite 100 Scottsdale, Arizona 85258 | | Vice President | | June 2022 – Present | | Vice President, Head of Mutual Fund Compliance, and Chief Compliance Officer, Voya Investments, LLC (May 2022 – Present). Formerly, Vice President, Fund Compliance Manager, Voya Investments, LLC (March 2021 – May 2022); Assistant Vice President, Fund Compliance Manager, Voya Investments, LLC (December 2016 – March 2021). |
| | | | | | | |
Craig Wheeler
(1969) 7337 East Doubletree Ranch Rd.
Suite 100 Scottsdale, Arizona 85258 | | Vice President | | May 2013 – Present | | Vice President – Director of Tax, Voya Investments, LLC (October 2015 – Present). |
| | | | | | | |
Nicholas C.D. Ward
(1993) 7337 East Doubletree Ranch Rd.
Suite 100 Scottsdale, Arizona 85258 | | Assistant Vice President and Assistant Secretary | | June 2022 – Present | | Counsel, Voya Investment Management – Mutual Fund Legal Department (November 2021 – Present). Formerly, Associate, Dechert LLP (October 2018 – November 2021). |
TRUSTEE AND OFFICER INFORMATION (Unaudited) (Continued)
Name, Address and Age | | Position(s)
Held with the
Trust | | Term of Office and
Length of Time
Served(1) | | Principal
Occupation(s) – During the Past 5 Years |
Gizachew Wubishet
(1976) 7337 East Doubletree Ranch Rd.
Suite 100 Scottsdale, Arizona 85258 | | Assistant Vice President and Assistant Secretary | | June 2022 – Present | | Assistant Vice President and Counsel, Voya Investment Management – Mutual Fund Legal Department (May 2019 – Present). Formerly, Attorney, Ropes & Gray LLP (October 2011 – April 2019). |
| | | | | | | |
Monia Piacenti
(1976) One Orange Way Windsor, Connecticut 06095 | | Anti-Money Laundering Officer | | June 2018 – Present | | Compliance Manager, Voya Financial, Inc. (March 2023 – Present); Anti-Money Laundering Officer, Voya Investments Distributor, LLC, Voya Investment Management and Voya Investment Management Trust Co. (June 2018 – Present). Formerly, Compliance Consultant, Voya Financial, Inc. (January 2019 – February 2023). |
| (1) | The Officers hold office until the next annual meeting of the Board of Trustees and until their successors shall have been elected and qualified. |
ADVISORY AND SUB-ADVISORY CONTRACT APPROVAL DISCUSSION (Unaudited)
BOARD CONSIDERATION AND APPROVAL OF INVESTMENT MANAGEMENT CONTRACTS AND SUB-ADVISORY CONTRACTS AND SUB-SUB ADVI- SORY CONTRACTS
At a meeting held on November 16, 2023, the Boards of Trustees (“Board”) of Voya Investors Trust (“VIT”) and Voya Variable Insurance Trust (“VVIT,” and together with VIT, the “Trusts”), including a majority of the Board members who have no direct or indirect interest in the investment management, sub-advisory and sub-sub-advisory contracts, and who are not “interested persons” of VY® BlackRock Inflation Protected Bond Portfolio (“BlackRock Portfolio”), a series of VIT, and VY® BrandywineGLOBAL — Bond Portfolio, a series of VVIT (together, the “Portfolios”), as such term is defined under the Investment Company Act of 1940, as amended (the “Independent Trustees”), considered and approved the renewal of the investment management contracts (the “Management Contracts”) between Voya Investments, LLC (the “Manager”) and the Trusts, on behalf of the Portfolios, and the sub-advisory contracts (the “Sub-Advisory Contracts”) with BlackRock Financial Management, Inc. and Brandywine Global Investment Management, LLC, the respective sub-advisers to each Portfolio (the “Sub-Advisers”), for an additional one-year period ending November 30, 2024, and the sub- sub-advisory contract (the “Sub-Sub-Advisory Contract,” and together with the Management Contracts and Sub- Advisory Contracts, the “Contracts”) with BlackRock International Limited, the sub-sub-adviser to BlackRock Portfolio (the “Sub-Sub-Adviser”), for an additional one- year period ending November 30, 2024.
In addition to the Board meeting on November 16, 2023, the Independent Trustees also held meetings outside the presence of representatives of the Manager, Sub-Advisers and Sub-Sub-Adviser (collectively, such persons are referred to herein as “management”) on October 9, 2023 and November 14, 2023. At those meetings, the Board members reviewed and considered materials related to the proposed continuance of the Contracts that they had requested and believed to be relevant to the renewal of the Contracts in light of their own business judgment and the legal advice furnished to them by K&L Gates LLP, their independent legal counsel. The Board also considered information furnished to it throughout the year at meetings of the Board and its committees, including information regarding performance, expenses, and other relevant matters. While the Board considered the renewal of the management contracts, sub-advisory contracts and sub-sub-advisory contracts for all of the applicable investment companies in the Voya family of funds at the same meetings, the Board considered each Voya fund’s investment management, sub-advisory and sub-sub- advisory relationships separately.
The Board has established a Contracts Committee and two Investment Review Committees (the “IRCs”), each of which includes only Independent Trustees as members. The Contracts Committee meets several times throughout the year to provide oversight with respect to the management, sub-advisory and sub-sub-advisory contracts approval and renewal process for the Voya funds, among other functions, and each IRC meets several times throughout the year with respect to each Voya fund (assigned to that IRC) to provide oversight regarding the investment performance of the sub-advisers and sub-sub-advisers, as well as the Manager’s role in monitoring the sub-advisers and sub- sub-advisers.
The Contracts Committee oversees, and annually recommends Board approval of updates to, a methodology guide for the Voya funds (“Methodology Guide”), which sets out a framework pursuant to which the Independent Trustees request, and management provides, certain information that the Independent Trustees deem to be important or potentially relevant to the contracts renewal process for the Voya funds. The Independent Trustees retain the services of an independent consultant with experience in the mutual fund industry to assist the Contracts Committee in developing and recommending to the Board: (1) a selected peer group of investment companies for each Portfolio (“Selected Peer Group”) based on that Portfolio’s particular attributes; and (2) updates to the Methodology Guide with respect to the content and format of various data prepared in connection with the renewal process. In addition, the Independent Trustees periodically have retained an independent firm to test and verify the accuracy of certain information presented to the Board for a representative sample of the Voya funds.
The Manager, a Sub-Adviser or the Sub-Sub-Adviser may not have been able to, or opted not to, provide information in response to certain information requests, in which case the Board conducted its evaluation based on the information that was provided. In such cases, the omission of any such information was determined to not be material to the Board’s considerations.
Provided below is an overview of certain material factors that the Board considered at its meetings regarding the renewal of the Contracts and the compensation to be paid thereunder. The Board members did not identify any particular information or factor that was most relevant to its consideration.
Nature, Extent and Quality of Services
The Manager oversees, subject to the authority of the Board, and is responsible for the provision of, all investment advisory and portfolio management services for the Portfolios, but may delegate certain of these responsibilities to one or more sub-advisers and their sub-sub-advisers.
ADVISORY AND SUB-ADVISORY CONTRACT APPROVAL DISCUSSION (Unaudited) (Continued)
In addition, the Manager provides administrative services reasonably necessary for the operation of the Portfolios as set forth in the Management Contracts, including oversight of the Portfolios’ operations and risk management and the oversight of their various other service providers.
The Board considered the “manager-of-managers” structure of the Voya funds that has been developed by the Manager pursuant to which the Manager selects, subject to the Board’s approval, sub-advisers and their sub-sub- advisers, if any, to provide day-to-day management services to all or a portion of each Voya fund. The Board recognized that the Manager is responsible for monitoring the Sub- Advisers’ and Sub-Sub-Adviser’s investment programs, performance, developments, ongoing operations, and compliance with applicable regulations and investment policies and restrictions with respect to the Portfolios under this manager-of-managers arrangement. The Board also considered the techniques and resources that the Manager has developed to provide this ongoing due diligence and oversight with respect to the sub-advisers and sub-sub-advisers and to recommend appropriate changes in investment strategies, sub-advisers and sub- sub-advisers, or allocation among sub-advisers in an effort to improve a Voya fund’s performance. In connection with the Manager’s performance of these duties, the Board considered that the Manager has developed an oversight process formulated by its Manager Research & Selection Group that reviews, among other matters, performance data, each Sub-Adviser’s and the Sub-Sub-Adviser’s management team, portfolio data and attribution analysis related to each Sub-Adviser and Sub-Sub-Adviser through various means, including, but not limited to, in-person meetings, on-site or virtual visits, and telephonic meetings with each Sub-Adviser and the Sub-Sub-Adviser.
Further, the Board considered periodic compliance reports it receives from the Trusts’ Chief Compliance Officer evaluating, among other related matters, whether the regulatory compliance systems and procedures of the Manager, Sub-Advisers and Sub-Sub-Adviser are reasonably designed to ensure compliance with the federal securities laws and whether the investment policies and restrictions for each Portfolio are complied with on a consistent basis.
The Board considered the portfolio management team assigned by the Sub-Advisers and the Sub-Sub-Adviser to the Portfolios and the level of resources committed to the Portfolios (and other relevant funds in the Voya funds) by the Manager, Sub-Advisers and the Sub-Sub-Adviser, and whether those resources are sufficient to provide high- quality services to the Portfolios.
Based on their deliberations and the materials presented to them, the Board concluded that the nature, extent and
quality of the overall services provided by the Manager, each Sub-Adviser and the Sub-Sub-Adviser under the Contracts were appropriate.
Portfolio Performance
In assessing the investment management, sub-advisory and sub-sub-advisory relationships, the Board placed emphasis on the investment returns of each Portfolio, including its investment performance over certain time periods compared to the Portfolio’s Morningstar, Inc. (an independent provider of mutual fund data) category and primary benchmark, a broad-based securities market index. The Board also considered information from the Manager Research & Selection Group and received reports summarizing a separate analysis of each Portfolio’s performance and risk, including risk-adjusted investment return information, from the Trusts’ Chief Investment Risk Officer.
Economies of Scale
When evaluating the reasonableness of the management fee schedules, the Board considered whether economies of scale have been or likely will be realized by the Manager, Sub-Advisers and the Sub-Sub-Adviser as a Portfolio grows larger and the extent to which any such economies are shared with the Portfolio. In this regard, the Board noted any breakpoints in the management fee schedules that will result in a lower management fee rate when a Portfolio achieves sufficient asset levels to receive a breakpoint discount. The Board also considered that in addition to the management fee breakpoints, the Portfolios have fee waiver and expense reimbursement arrangements. The Board considered the extent to which economies of scale realized by the Manager, Sub-Advisers and Sub-Sub- Adviser could be shared with each Portfolio through such fee waivers, expense reimbursements or other expense reductions. In the case of sub-advisory or sub-sub-advisory fees, the Board considered that breakpoints, if any, would inure to the benefit of the Manager or relevant Sub-Adviser, respectively.
Information Regarding Services, Performance, and Fee Schedules Offered to Other Clients
The Board considered comparative information regarding the nature of services, performance, and fee schedules offered by the Manager, Sub-Advisers and Sub-Sub- Adviser to other clients with similar investment objectives, if applicable, including other registered investment companies and relevant institutional accounts. When the fee schedules offered to or the performance of such other clients differed materially from a Portfolio, the Board took into account the underlying rationale provided by the Manager, Sub-Advisers or Sub-Sub-Adviser, as applicable, for these differences. For the non-Voya-affiliated Sub-
ADVISORY AND SUB-ADVISORY CONTRACT APPROVAL DISCUSSION (Unaudited) (Continued)
Advisers and Sub-Sub-Adviser, the Board viewed the information related to any material differences in the fee schedules as not being a key factor in its deliberations because of the arm’s-length nature of negotiations between the Manager and non-Voya-affiliated Sub-Advisers and the Sub-Sub-Adviser with respect to the sub-advisory and sub-sub-advisory fee schedules, that the Manager is responsible for paying the fees of the Sub-Advisers and that the applicable Sub-Adviser is responsible for paying the fees of the Sub-Sub-Adviser.
Fee Schedules, Profitability, and Fall-out Benefits
The Board reviewed and considered the contractual management fee schedule and net management fee rate payable by each Portfolio to the Manager compared to the Portfolio’s Selected Peer Group. The Board also considered the compensation payable by the Manager to each Sub-Adviser for sub-advisory services for each Portfolio, including the portion of the contractual and net management fee rates that are paid to each Sub-Adviser, as compared to the compensation paid to the Manager, and the contractual sub-sub-advisory fee schedule payable to the Sub-Sub-Adviser by the relevant Sub- Adviser. In this regard, the Board considered that the Sub- Sub-Adviser is compensated by its relevant Sub-Adviser and not the Manager. In addition, the Board considered any fee waivers, expense limitations, and recoupment arrangements that apply to the fees payable by the Portfolios, including whether the Manager proposed any changes thereto. For each Portfolio, the Board separately determined that the fees payable to the Manager and the fee schedule payable to each Sub-Adviser and the Sub- Sub-Adviser are reasonable for the services that each performs, which were considered in light of the nature, extent and quality of the services that each has performed and is expected to perform.
For each Portfolio, the Board considered information on revenues, costs and profits or losses realized by the Manager related to its services to the Portfolio. In analyzing the profitability of the Manager and its affiliates in connection with services they render to a Portfolio, the Board took into account the sub-advisory fee rate payable by the Manager to each Sub-Adviser. The Board also considered the profitability of the Manager attributable to servicing each Portfolio both with and without taking into account the profitability of the distributor of the Portfolios and any revenue sharing payments made by the Manager. The Board did not request profitability data from the Sub- Advisers, and the Sub-Sub-Adviser which are not affiliated with the Manager because the Board did not view this data as a key factor to its deliberations given the arm’s- length nature of the relationship between the Manager and these non-Voya-affiliated Sub-Advisers and Sub-Sub- Adviser with respect to the negotiation of sub-advisory and
sub-sub-advisory fee schedules. In addition, the Board noted that non-Voya-affiliated sub-advisers or sub-sub- advisers may not account for their profits on an account- by-account basis and those that do often employ different methodologies in connection with these calculations.
Although the Methodology Guide establishes a framework for profit calculation by the Manager, the Board recognized that there is no uniform methodology within the asset management industry for determining profitability for this purpose. The Board also recognized that the use of different reasonable methodologies can give rise to dramatically different reported profit and loss results with respect to the Manager, as well as other industry participants with whom the profits of the Manager could be compared. In addition, the Board recognized that management’s calculations regarding its costs incurred in establishing the infrastructure necessary for the Portfolios’ operations may not be fully reflected in the expenses allocated to each Portfolio in determining profitability. The Board also recognized that the information presented may not portray all of the costs borne by the Manager or reflect all of the risks associated with offering and managing a mutual fund complex in the current regulatory and market environment, including entrepreneurial, regulatory, legal and operational risks.
The Board also considered that the Manager is entitled to earn a reasonable level of profits for the services that it provides to the Portfolios. The Board also considered information regarding the potential fall-out benefits to the Manager, Sub-Advisers and Sub-Sub-Adviser and their respective affiliates from their association with the Portfolios. Following its reviews, the Board determined that the Manager’s profitability with respect to its services to the Portfolios and the Manager’s, Sub-Advisers’ and Sub-Sub- Adviser’s potential fall-out benefits were not unreasonable.
Portfolio-by-Portfolio Analysis
Set forth below are certain of the specific factors that the Board considered at its October 9, 2023, November 14, 2023, and/or November 16, 2023 meetings in relation to approving each Portfolio’s Contracts and the conclusions reached by the Board. These specific factors are in addition to those considerations discussed above. The performance data provided to the Board primarily was for various periods ended March 31, 2023. In addition, the Board also considered at its October 9, 2023, November 14, 2023, and/or November 16, 2023 meetings certain additional data regarding each Portfolio’s more recent performance, asset levels and asset flows. Each Portfolio’s management fee rate and expense ratio were compared to the management fee rates and expense ratios of the funds in its Selected Peer Group. With respect to the quintile rankings noted below, the first quintile represents the
ADVISORY AND SUB-ADVISORY CONTRACT APPROVAL DISCUSSION (Unaudited) (Continued)
range of funds with the highest performance or the lowest management fee rate or expense ratio, as applicable, and the fifth quintile represents the range of funds with the lowest performance or the highest management fee rate or expense ratio, as applicable.
VY® BlackRock Inflation Protected Bond Portfolio
In considering whether to approve the renewal of the Contracts for VY® BlackRock Inflation Protected Bond Portfolio, the Board considered that, based on performance data for the periods ended March 31, 2023: (1) the Portfolio is ranked in the first quintile of its Morningstar category for the year-to-date period, the third quintile for the three-year period, and the fourth quintile for the one-year, five-year and ten-year periods; and (2) the Portfolio underperformed its primary benchmark for all periods presented, with the exception of the year-to-date and three-year periods, during which it outperformed. In analyzing this performance data, the Board took into account management’s representations regarding: (1) the competitiveness of the Portfolio’s performance during certain periods; (2) the impact that interest rates have had on the Portfolio’s performance; and (3) the continuation of monitoring the Sub-Adviser’s performance.
In considering the fees payable under the Contracts for the Portfolio, the Board took into account the factors described above and also considered: (1) the economies of scale benefits to the Portfolio and its shareholders from breakpoint discounts applicable to the Portfolio’s management fee rate, which result in lower fees at higher asset levels; and (2) the pricing structure (including the net expense ratio to be borne by shareholders) of the Portfolio, as compared to its Selected Peer Group, including that: (a) the net management fee rate for the Portfolio is ranked in the third quintile of net management fee rates of the funds in its Selected Peer Group; (b) the contractual management fee rate for the Portfolio is ranked in the fourth quintile of contractual management fee rates of the funds in its Selected Peer Group; and (c) the net expense ratio for the Portfolio is ranked in the third quintile of net expense ratios of the funds in its Selected Peer Group. In analyzing this fee data, the Board took into account management’s representations regarding the competitiveness of the Portfolio’s management fee rate and net expense ratio.
VY® BrandywineGLOBAL – Bond Portfolio
In considering whether to approve the renewal of the Contracts for VY® BrandywineGLOBAL – Bond Portfolio,
the Board considered that, based on performance data for the periods ended March 31, 2023: (1) the Portfolio is ranked in the first quintile of its Morningstar category for the year-to-date, three-year and five-year periods, and the second quintile for the one-year period; and (2) the Portfolio outperformed its primary benchmark for all periods presented.
In considering the fees payable under the Contracts for the Portfolio, the Board took into account the factors described above and also considered: (1) the fairness of the compensation under a Management Contract with a breakpoint fee schedule where the asset level necessary to achieve a breakpoint discount had not been reached by the Portfolio; and (2) the pricing structure (including the net expense ratio to be borne by shareholders) of the Portfolio, as compared to its Selected Peer Group, including that: (a) the net management fee rate for the Portfolio is ranked in the fourth quintile of net management fee rates of the funds in its Selected Peer Group; (b) the contractual management fee rate for the Portfolio is ranked in the third quintile of contractual management fee rates of the funds in its Selected Peer Group; and (c) the net expense ratio for the Portfolio is ranked in the first quintile of net expense ratios of the funds in its Selected Peer Group. In analyzing this fee data, the Board took into account management’s representations regarding the competitiveness of the Portfolio’s management fee rate and net expense ratio.
Board Conclusions
After its deliberation, the Board concluded that, in its business judgment, the terms of the Contracts are fair and reasonable to each Portfolio and that approval of the continuation of the Contracts is in the best interests of each Portfolio and its shareholders. In doing so, the Board reviewed all factors it considered to be material, including those discussed above. Within the context of its overall conclusions regarding the Contracts, and based on the information provided and management’s related representations, the Board concluded that it was satisfied with management’s responses relating to each Portfolio’s investment performance and the fees payable under the Contracts. During this renewal process, each Board member may have accorded different weight to various factors in reaching his or her conclusions. Based on these conclusions and other factors, the Board voted to renew the Contracts for each Portfolio for the year ending November 30, 2024.
| Investment Adviser | Independent Registered Public Accounting Firm |
Voya Investments, LLC 7337 East Doubletree Ranch Road, Suite 100
Scottsdale, Arizona 85258 | Ernst & Young LLP
200 Clarendon Street Boston, Massachusetts 02116 |
| Distributor | Custodian |
Voya Investments Distributor, LLC 7337 East Doubletree Ranch Road, Suite 100
Scottsdale, Arizona 85258 | The Bank of New York Mellon
225 Liberty Street New York, New York 10286 |
| Transfer Agent | Legal Counsel |
BNY Mellon Investment Servicing (U.S.) Inc.
301 Bellevue Parkway Wilmington, Delaware 19809 | Ropes & Gray LLP
Prudential Tower
800 Boylston Street Boston, Massachusetts 02199 |
Before investing, carefully consider the investment objectives, risks, charges and expenses of the variable annuity contract or variable life insurance policy and the underlying variable investment options. This and other information is contained in the prospectus for the variable annuity contract or variable life insurance policy and the underlying variable investment options. Obtain these prospectuses from your agent/registered representative and read them carefully before investing.
RETIREMENT | INVESTMENTS | INSURANCE
voyainvestments.com | | 
VPAR-VIT3AIS (1223) |
Appendix A
AUDIT AND NON-AUDIT SERVICES
PRE-APPROVAL POLICY
| I. | Statement of Principles |
Under the Sarbanes-Oxley Act of 2002 (the “Act”), the Audit Committee of the Board of Directors or Trustees (the “Committee”) of the Voya funds (each a “Fund,” collectively, the “Funds”) set out on Exhibit A to this Audit and Non-Audit Services Pre-Approval Policy (“Policy”) is responsible for the oversight of the work of the Funds’ independent auditors. As part of its responsibilities, the Committee must pre-approve the audit and non-audit services performed by the auditors in order to assure that the provision of these services does not impair the auditors’ independence from the Funds. The Committee has adopted, and the Board has ratified, this Policy, which sets out the procedures and conditions under which the services of the independent auditors may be pre-approved.
Under Securities and Exchange Commission (“SEC”) rules promulgated in accordance with the Act, the Funds may establish two different approaches to pre-approving audit and non-audit services. The Committee may approve services without consideration of specific case-by-case services (“general pre-approval”) or it may pre-approve specific services (“specific pre-approval”). The Committee believes that the combination of these approaches contemplated in this Policy results in an effective and efficient method for pre-approving audit and non-audit services to be performed by the Funds’ independent auditors. Under this Policy, services that are not of a type that may receive general pre-approval require specific pre-approval by the Committee. Any proposed services that exceed pre-approved cost levels or budgeted amounts will also require the Committee’s specific pre-approval.
For both types of approval, the Committee considers whether the subject services are consistent with the SEC’s rules on auditor independence and that such services are compatible with maintaining the auditors independence. The Committee also considers whether a particular audit firm is in the best position to provide effective and efficient services to the Funds. Reasons that the auditors are in the best position include the auditors’ familiarity with the Funds’ business, personnel, culture, accounting systems, risk profile, and other factors, and whether the services will enhance the Funds’ ability to manage and control risk or improve audit quality. Such factors will be considered as a whole, with no one factor being determinative.
The appendices attached to this Policy describe the audit, audit-related, tax-related, and other services that have the Committee’s general pre-approval. For any service that has been approved through general pre-approval, the general pre-approval will remain in place for a period 12 months from the date of pre-approval, unless the Committee determines that a different period is appropriate. The Committee will annually review and pre-approve the services that may be provided by the independent auditors without specific pre-approval. The Committee will revise the list of services subject to general pre-approval as appropriate. This Policy does not serve as a delegation to Fund management of the Committee’s duty to pre-approve services performed by the Funds’ independent auditors.
The annual audit services engagement terms and fees are subject to the Committee’s specific pre-approval. Audit services are those services that are normally provided by auditors in connection with statutory and regulatory filings or engagements or those that generally only independent auditors can reasonably provide. They include the Funds’ annual financial statement audit and procedures that the independent auditors must perform in order to form an opinion on the Funds’ financial statements (e.g., information systems and procedural reviews and testing). The Committee will monitor the audit services engagement and approve any changes in terms, conditions or fees deemed by the Committee to be necessary or appropriate.
The Committee may grant general pre-approval to other audit services, such as statutory audits and services associated with SEC registration statements, periodic reports and other documents filed with the SEC or issued in connection with securities offerings.
The Committee has pre-approved the audit services listed on Appendix A. The Committee must specifically approve all audit services not listed on Appendix A.
| III. | Audit-related Services |
Audit-related services are assurance and related services that are reasonably related to the performance of the audit or the review of the Funds’ financial statements or are traditionally performed by the independent auditors. The Committee believes that the provision of audit-related services will not impair the independent auditors’ independence, and therefore may grant pre-approval to audit-related services. Audit-related services include accounting consultations related to accounting, financial reporting or disclosure matters not classified as “audit services;” assistance with understanding and implementing new accounting and financial reporting guidance from rulemaking authorities; agreed-upon or expanded audit procedures relating to accounting and/or billing records required to respond to or comply with financial, accounting or regulatory reporting matters; and assistance with internal control reporting requirements under Form N-CEN or Form N-CSR.
The Committee has pre-approved the audit-related services listed on Appendix B. The Committee must specifically approve all audit-related services not listed on Appendix B.
The Committee believes the independent auditors can provide tax services to the Funds, including tax compliance, tax planning, and tax advice, without compromising the auditors’ independence. Therefore, the Committee may grant general pre-approval with respect to tax services historically provided by the Funds’ independent auditors that do not, in the Committee’s view, impair auditor independence and that are consistent with the SEC’s rules on auditor independence.
The Committee will not grant pre-approval if the independent auditors initially recommends a transaction the sole business purpose of which is tax avoidance and the tax treatment of which may not be supported in the Internal Revenue Code and related regulations. The Committee may consult outside counsel to determine that tax planning and reporting positions are consistent with this Policy.
The Committee has pre-approved the tax-related services listed on Appendix C. The Committee must specifically approve all tax-related services not listed on Appendix C.
The Committee believes it may grant approval of non-audit services that are permissible services for independent auditors to a Fund. The Committee has determined to grant general pre-approval to other services that it believes are routine and recurring, do not impair auditor independence, and are consistent with SEC rules on auditor independence.
The Committee has pre-approved the non-audit services listed on Appendix D. The Committee must specifically approve all non-audit services not listed on Appendix D.
A list of the SEC’s prohibited non-audit services is attached to this Policy as Appendix E. The SEC’s rules and relevant guidance should be consulted to determine the precise definitions of these impermissible services and the applicability of exceptions to certain of the SEC’s prohibitions.
| VI. | Pre-approval of Fee levels and Budgeted Amounts |
The Committee will annually establish pre-approval fee levels or budgeted amounts for audit, audit-related, tax and non-audit services to be provided to the Funds by the independent auditors. Any proposed services exceeding these levels or amounts require the Committee’s specific pre-approval. The Committee considers fees for audit and non-audit services when deciding whether to pre-approve services. The Committee may determine, for a pre-approval period of 12 months, the appropriate ratio between the total amount of fees for the Fund’s audit, audit-related, and tax services (including fees for services provided to Fund affiliates that are subject to pre-approval), and the total amount of fees for certain permissible non-audit services for the Fund classified as other services (including any such services provided to Fund affiliates that are subject to pre-approval).
Requests or applications for services to be provided by the independent auditors will be submitted to management. If management determines that the services do not fall within those services generally pre-approved by the Committee and set out in the appendices to these procedures, management will submit the services to the Committee or its delagee. Any such submission will include a detailed description of the services to be rendered. Notwithstanding this paragraph, the Committee will, on a quarterly basis, receive from the independent auditors a list of services provided for the previous calendar quarter on a cumulative basis by the auditors during the Pre-Approval Period.
The Committee may delegate pre-approval authority to one or more of the Committee’s members. Any member or members to whom such pre-approval authority is delegated must report any pre-approval decisions, including any pre-approved services, to the Committee at its next scheduled meeting. The Committee will identify any member to whom pre-approval authority is delegated in writing. The member will retain such authority for a period of 12 months from the date of pre-approval unless the Committee determines that a different period is appropriate. The period of delegated authority may be terminated by the Committee or at the option of the member.
| IX. | Additional Requirements |
The Committee will take any measures the Committee deems necessary or appropriate to oversee the work of the independent auditors and to assure the auditors’ independence from the Funds. This may include reviewing a formal written statement from the independent auditors delineating all relationships between the auditors and the Funds, consistent with Independence Standards Board No. 1, and discussing with the auditors their methods and procedures for ensuring independence.
Last Approved: November 17, 2022
Appendix A
Pre-Approved Audit Services for the Pre-Approval Period January 1, 2023 through December 31, 2023
| Service |
| | The Fund(s) | Fee Range |
| Statutory audits or financial audits (including tax services associated with audit services) | √ | As presented to Audit Committee1 |
| Services associated with SEC registration statements, periodic reports and other documents filed with the SEC or other documents issued in connection with securities offerings (e.g., consents), and assistance in responding to SEC comment letters. | √ | Not to exceed $9,750 per filing |
| Consultations by Fund management with respect to accounting or disclosure treatment of transactions or events and/or the actual or potential effect of final or proposed rules, standards or interpretations by the SEC, Financial Accounting Standards Board, or other regulatory or standard setting bodies. | √ | Not to exceed $8,000 during the Pre-Approval Period |
| Seed capital audit and related review and issuance of consent on the N-2 registration statement | √ | Not to exceed $14,750 per audit |
| Audit of summary portfolio of investments | √ | Not to exceed $840 per fund |
| 1 | For new Funds launched during the Pre-Approval Period, the fee ranges pre-approved will be the same as those for existing Funds, pro-rated in accordance with inception dates as provided in the auditors’ Proposal or any Engagement Letter covering the period at issue. Fees in the Engagement Letter will be controlling. |
Appendix B
Pre-Approved Audit-Related Services for the Pre-Approval Period January 1, 2023 through December 31, 2023
| Service |
| | The Fund(s) | Fund Affiliates | Fee Range |
| Services related to Fund mergers (Excludes tax services - See Appendix C for tax services associated with Fund mergers) | √ | √ | Not to exceed $10,000 per merger |
| Consultations by Fund management with respect to accounting or disclosure treatment of transactions or events and/or the actual or potential effect of final or proposed rules, standards or interpretations by the SEC, Financial Accounting Standards Board, or other regulatory or standard setting bodies. [Note: Under SEC rules some consultations may be “audit” services and others may be “audit-related” services.] | √ | | Not to exceed $5,000 per occurrence during the Pre-Approval Period |
| Review of the Funds’ semi-annual and quarterly financial statements | √ | | Not to exceed $2,700 per set of financial statements per fund |
| Reports to regulatory or government agencies related to the annual engagement | √ | | Up to $5,000 per occurrence during the Pre-Approval Period |
| Regulatory compliance assistance | √ | √ | Not to exceed $5,000 per quarter |
| Training courses | | √ | Not to exceed $5,000 per course |
Appendix C
Pre-Approved Tax Services for the Pre-Approval Period January 1, 2023 through December 31, 2023
| Service |
| | The Fund(s) | Fund Affiliates | Fee Range |
| Preparation of federal and state income tax returns and federal excise tax returns for the Funds including assistance and review with excise tax distributions (Funds fees) | √ | | As presented to Audit Committee2 |
| Review of IRC Sections 851(b) and 817(h) diversification testing on a real-time basis | √ | | As presented to Audit Committee2 |
| Tax assistance and advice regarding statutory, regulatory or administrative developments | √ | √ | Not to exceed $5,000 for the Funds or for the Funds’ investment adviser during the Pre-Approval Period |
| 2 | For new Funds launched during the Pre-Approval Period, the fee ranges pre-approved will be the same as those for existing Funds, pro-rated in accordance with inception dates as provided in the auditors’ Proposal or any Engagement Letter covering the period at issue. Fees in the Engagement Letter will be controlling. |
Appendix C, continued Pre-Approved Tax Services for the Pre-Approval Period January 1, 2023 through December 31, 2023
| Service |
| | The Fund(s) | Fund Affiliates | Fee Range |
| Tax and technology training sessions | | √ | Not to exceed $5,000 per course during the Pre-Approval Period |
| Tax services associated with Fund mergers | √ | √ | Not to exceed $4,000 per fund per merger during the Pre-Approval Period |
| Tax compliance services related to return preparation for the Funds (Adviser Fees) | | √ | As presented to Audit Committee3 |
| Other tax-related assistance and consultation, including, without limitation, assistance in evaluating derivative financial instruments and international tax issues, qualification and distribution issues, year-end reporting for 1099’s, tax compliance services in foreign jurisdictions and similar routine tax consultations as requested. | √ | | Not to exceed $300,000 during the Pre-Approval Period |
| EU Reclaims IRS Closing Agreement Filings | √ | | $20,000 per Fund first closing agreement, $5,000 for subsequent closing agreements for same Fund |
| 3 | For new Funds launched during the Pre-Approval Period, the fee ranges pre-approved will be the same as those for existing Funds, pro-rated in accordance with inception dates as provided in the auditors’ Proposal or any Engagement Letter covering the period at issue. Fees in the Engagement Letter will be controlling. |
Appendix D
Pre-Approved Other Services for the Pre-Approval Period January 1, 2023 through December 31, 2023
| Service |
| | The Fund(s) | Fund Affiliates | Fee Range |
| Agreed-upon procedures for Class B share 12b-1 programs | | √ | Not to exceed $60,000 during the Pre-Approval Period |
Security counts performed pursuant to Rule 17f-2 of the 1940 Act (i.e., counts for Funds holding securities with affiliated sub-custodians) Cost to be borne 50% by the Funds and 50% by Voya Investments, LLC. | √ | √ | Not to exceed $5,700 per Fund during the Pre-Approval Period |
| Agreed upon procedures for 15 (c) FACT Books | √ | | Not to exceed $50,000 during the Pre-Approval Period |
Appendix E
Prohibited Non-Audit Services
Dated: January 1, 2023 to December 31, 2023
| ● | Bookkeeping or other services related to the accounting records or financial statements of the Funds |
| ● | Financial information systems design and implementation |
| ● | Appraisal or valuation services, fairness opinions, or contribution-in-kind reports |
| ● | Internal audit outsourcing services |
| ● | Broker-dealer, investment adviser, or investment banking services |
| ● | Expert services unrelated to the audit |
| ● | Any other service that the Public Company Accounting Oversight Board determines, by regulation, is impermissible |
EXHIBIT A
VOYA ASIA PACIFIC HIGH DIVIDEND EQUITY INCOME FUND
VOYA BALANCED PORTFOLIO, INC.
VOYA CREDIT INCOME FUND
VOYA EMERGING MARKETS HIGH DIVIDEND EQUITY FUND
VOYA EQUITY TRUST
VOYA FUNDS TRUST
VOYA GLOBAL ADVANTAGE AND PREMIUM OPPORTUNITY FUND
VOYA GLOBAL EQUITY DIVIDEND AND PREMIUM OPPORTUNITY FUND
VOYA INFRASTRUCTURE, INDUSTRIALS, AND MATERIALS FUND
VOYA INTERMEDIATE BOND PORTFOLIO
VOYA INVESTORS TRUST
VOYA GOVERNMENT MONEY MARKET PORTFOLIO
VOYA MUTUAL FUNDS
VOYA PARTNERS, INC.
VOYA SEPARATE PORTFOLIOS TRUST
VOYA STRATEGIC ALLOCATIONS PORTFOLIOS, INC.
VOYA VARIABLE FUNDS
VOYA VARIABLE INSURANCE TRUST
VOYA VARIABLE PORTFOLIOS INC,
VOYA VARIABLE PRODUCTS TRUST