UNITED STATES
SECURITIES AND EXCHANGE COMMISSION
Washington, D.C. 20549
FORM N-CSR
CERTIFIED SHAREHOLDER REPORT OF REGISTERED
MANAGEMENT INVESTMENT COMPANIES
Investment Company Act File Number: 811-09561
Century Capital Management Trust
(Exact name of registrant as specified in charter)
c/o Century Capital Management, LLC
100 Federal Street, Boston, Massachusetts 02110
(Address of principal executive offices) (Zip code)
Maureen Kane
Century Capital Management, LLC
100 Federal Street, Boston, Massachusetts 02110
(Name and address of agent for service)
Registrant's telephone number, including area code: (617) 482-3060
Date of fiscal year end: October 31
Date of reporting period: October 31, 2010
Item 1. Reports to Shareholders.

Century Funds Annual Report
October 31, 2010
Century Shares Trust &
Century Small Cap Select Fund

TOTAL RETURNS FOR THE YEAR ENDED OCTOBER 31, 2010
| Ticker Symbol | 1 Year | |
| Century Shares Trust (“CST”) | ||
Institutional Shares | CENSX | 16.72% |
Investor Shares | CENVX | 16.36% |
| S&P 500 Index | 16.52% | |
| Century Small Cap Select Fund (“CSCS”) | ||
Institutional Shares | CSMCX | 28.52% |
Investor Shares | CSMVX | 28.06% |
| Russell 2000 Growth Index | 28.67% |
Past performance is no guarantee of future results. The recent growth rate in the global equity markets has helped to produce short-term returns for some sectors/asset classes that are not typical and may not continue in the future. Because of ongoing market volatility, Fund performance may be subject to substantial short-term changes.
TABLE OF CONTENTS | |
| Page | |
| Letter to Shareholders | 1 |
| Fund Summaries: | |
Century Small Cap Select Fund | 5 |
Century Shares Trust | 8 |
Shareholder Expense Example | 11 |
| Financial Statements: | |
Portfolios of Investments | 12 |
Statements of Assets and Liabilities | 20 |
Statements of Operations | 21 |
Statements of Changes in Net Assets | 22 |
| Financial Highlights | 23 |
| Notes to Financial Statements | 27 |
| Report of Independent Public Accounting Firm | 33 |
| Tax Information | 34 |
| Trustees and Officers | 35 |
This report is submitted for the general information of the shareholders of Century Shares Trust and Century Small Cap Select Fund (each a “Fund” and collectively, the “Funds”). It is not authorized for distribution to prospective investors unless it is preceded or accompanied by the Funds’ current prospectus, which includes information regarding the Funds’ objective(s), risks, and charges and expenses, experience of its management, and other information. The Funds’ prospectus contains this and other important information about the Funds. Please read the prospectus carefully before you invest.
Investments in mutual funds involve risks. Century Small Cap Select Fund concentrates its investments in the financial services and health care group of industries. Concentration in a particular industry subjects the Fund to the risks associated with that industry and, as a result, the Fund may be subject to greater price volatility than funds with less concentrated portfolios. In addition, the Fund invests in smaller companies which pose greater risks than those associated with larger, more established companies. Century SharesTrust may invest a significant portion of assets in securities of companies within the same market sector. If the Fund’s portfolio is over weighted in a sector, any negative development affecting th at sector will have a greater impact on the Fund than a fund that is not over weighted in that sector.
The views in this report were those of the Century Funds’Chief Investment Officer and Portfolio Managers as of October 31,2010 and may not reflect their views on the date that this report is first published or anytime thereafter. These views are intended to assist shareholders in understanding their investments and do not constitute investment advice.There is no assurance that the Funds will continue to invest in the securities mentioned. Foreside Fund Services, LLC, Distributor.
CENTURY FUNDS
DEAR FELLOW SHAREHOLDERS:
Over the last decade, the world has experienced two wars, an energy crisis, financial scandals, the “Great Recession”, and wild stock market swings. It is times like these when some perspective can be helpful. In 1978, in the fiftieth annual report for Century Shares Trust, the Trustees wrote, “Much of the nation’s history has been compressed into this period – the Depression of the Thirties, three wars, inflation, deflation, times of enthusiasm for common stocks and other times when concern for safety or income has been paramount.” Shareholders have witnessed and endured during these times and that remains true today. We recognize that you may have little choice to be a witness to current events, but we believe that choosing to endure provides a potential to achieve your financial goals in the futur e. We hope to help you understand what is happening today, what role risk and reward play into your endurance, and why a long-term view has historically been deemed essential for successful investing.
Changing Gears
During the past year, the economic recovery marched forward, and we continued to see slow progress in consumer spending, paychecks and some stability in the job market. As of the date of this report, some economic indicators have rebounded to their 2008 pre-recession levels. Although the housing market and Europe still face headwinds and recent industrial growth appears to be slowing, we are returning to a “normal” economic environment as we move past the financial crisis of 2008 and its aftermath.
Following November’s mid-term elections, investors turned their gaze to the 2011 outlook. We expect economic growth to continue as the Federal Reserve begins its second round of quantitative easing (QE2,) in order to pursue its dual mandate of stable prices and full employment. Longer term, the rising pressures of our government spending (demand) outstripping tax revenues (supply) are likely to impact consumer behavior beyond the next Presidential cycle.
The American economy spent the last forty years developing and refining its consumer orientation, accounting for over 70% of U.S. GDP. The U.S. consumer still accounts for about 18% of global GDP and remains the most important bellwether of global trade. As we look at Europe’s recent bailouts of Greek and Irish debt and the rising debt of most developed countries, we believe that there are important lessons about the finite limits of spending and the need to instill a greater sense of savings and austerity to meet life’s sustainable goals.
Perhaps, the next forty years will see a collective journey back towards saving and self-sufficiency that permeated our society for decades following the Great Depression. The November 2010 issue of National Geographic magazine focuses on the mysteries of Great Migrations that several animals (Monarch butterflies, Sandhill Cranes, etc) endure to achieve a larger purpose “undistracted by temptations.” Changing any population’s behavior takes time, but there are several signs that disciplined consumers and governments are actively
CENTURY FUNDS
1
reducing many of the temptations of debt and excess that resulted in bailouts. We anticipate the average investor may need to migrate a larger portion of their earnings to save and invest for future needs, especially with current interest rates and investment yields remaining low.
Risk and Reward
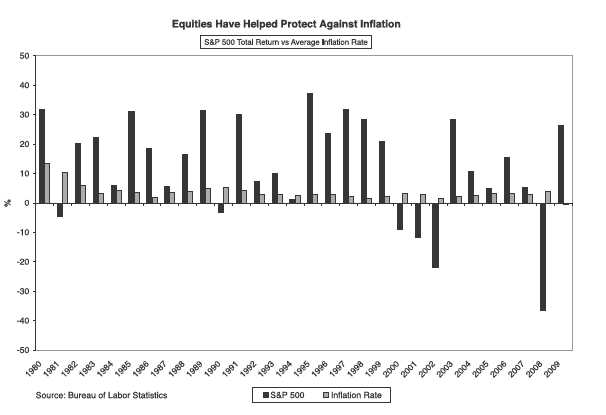
Equities have historically proven to be an effective way to protect purchasing power. The S&P 500 Index has outpaced the average inflation rate 75% of the time over the past three decades. But investor reluctance to invest is a result of the distrust and the battering that their personal wealth has taken over the past couple of years. The equity market losses of 2008 and early 2009 still weigh heavily, ultimately resulting in a significant decline in investor risk tolerance.
CENTURY FUNDS
2
There is no way to remove risk completely from the equity investing equation, and the past decade has had its share of volatility. We still believe in the horsepower of equity investing to help investors achieve, and in some cases, exceed their long-term financial needs.
At Century, we believe that fundamental, in-house research can help mitigate the risk exposure in our portfolios. It is our goal to do the necessary research work to understand and anticipate the risks inherit in our portfolio companies. We believe this research-intensive process helps us maintain the proper risk/reward balance in the Funds, as we strive to add value in optimistic markets and preserve capital during periods of stress.
Gone in a Flash
As of October 31, 2010, the S&P 500 Index returned over 70% since the March 9, 2009 low. Yet, countless domestic equity mutual funds remain in net outflows. Many retail investors have bypassed the equity markets for the perceived safety of the fixed income market. Is this really a fundamental shift in the retail investor’s asset allocation mindset or is there something behavioral happening?
The aging population will increase the demand for steady yield and fixed income products, but there appears to be a larger trend at play today. Consumers are left wondering if the playing field is tilted and unfair for the average investor, following the Enron, market-timing and Bernard Madoff scandals, the May 2010 Flash Crash and the failure of Lehman Brothers.
High unemployment, a moribund housing market, and slow economic growth certainly contribute to investors’ concerns, but the flash crash and these other scandals destroy trust - the binding cement in the relationship between investors and their fiduciary advisers. This doubt and distrust come at a terrible time, when the challenges investors face today are serious: Baby boomers are preparing for a retirement with low yielding investments, while younger generations face the uncertain costs of education, health care and a delayed retirement that may need to be entirely self-funded.
In the intermediate-term, we believe inflation will become a threat to individuals’ purchasing power. The Federal Reserve recently announced that it will invest another $600 billion in long-term Treasuries in an effort to spur economic growth. The massive expansion of the Federal Reserve’s balance sheet will likely lead to higher inflation. We are beginning to see some higher commodity prices, particularly oil and energy prices.
CENTURY FUNDS
3
Taking the Long View
We understand the challenges that investors face on the path to their long-term goals because we invest alongside you and face similar challenges. While our compass points to the long-term horizon, we must tactically steer through the market’s current weather conditions.
“Climate is what we expect, weather is what we get.” – Mark Twain
Investors are constantly bombarded with new products that promise better investment climates or protection from the market’s shifting weather patterns. We believe that our fundamental investment style will be effective over the long-run and help us as we strive to provide our shareholders with favorable, risk-adjusted returns over the long-term.
Thank you for your investments in the Century Funds. We look ahead to the opportunities and challenges that face all of us with a shared commitment and enthusiasm. We welcome your questions and comments always.
Respectfully submitted,

Alexander L. Thorndike
Chairman of the Century Funds
CENTURY FUNDS
4
CENTURY SMALL CAP SELECT FUND COMMENTARY
HOW DID THE PORTFOLIO PERFORM?
For the one-year period ended October 31, 2010, Century Small Cap Select Fund’s Institutional and Investor Shares returned 28.52% and 28.06%, respectively, versus 28.67% for the Russell 2000 Growth Index.
WHAT FACTORS INFLUENCED PERFORMANCE?
Equity markets overcame sovereign debt concerns to march higher last year, buoyed by strong returns after Labor day. Quarterly earnings reports showed positive growth each quarter over the past year. High-quality companies assumed market leadership during the opening months of 2010, and we rotated into more cyclical areas – Consumer Discretionary and Industrials – to take advantage of more positive sustainable momentum in the economic recovery.
For the one-year period ended October 31, 2010, Health Care stocks were the top contributors to performance with holdings NxStage Medical Inc (a medical device manufacturer), SXC Health Solutions Corp. (a pharmacy benefit manager), and Par Pharmaceutical Cos. (a generic and branded drug manufacturer) all contributing significantly. The Financial sector was another leading contributor to the Fund’s performance. This performance was driven by stock selection, with Cohen & Steers, Inc. (an investment manager) and Wintrust Financial (a diversified bank) being two of the most notable.
The Technology sector was among the best performers as corporations sought out productivity improvements and merger & acquisition activity increased. The sector’s strong results were partially offset by under-performing DG FastChannel (a provider of digital media technology) and Pegasystems Inc. (an enterprise software provider). Consumer Staples, Material, and Telecom sectors were laggards within the Portfolio.
DESCRIBE RECENT PORTFOLIO ACTIVITY.
We increased exposure to the Industrial and Consumer Discretionary sectors over the past year, because we believe that the economic recovery is sustainable. Industrial demand rebounded strongly over the past year as corporations sought to improve productivity and position themselves to increase market share and grow. Consumer Discretionary allocations focused on specialty retailers and distributors. In general, as we grew more confident in the recovery, we sought to increase the risk profile of the portfolio while focusing on high-quality, market leaders.
In order to increase the Fund’s exposure to the Industrial and Consumer Discretionary sectors, we trimmed holdings in the Consumer Staples, Energy, Health Care, and Telecommunication sectors.
CENTURY FUNDS
5
CENTURY SMALL CAP SELECT FUND COMMENTARY (CONTINUED)
DESCRIBE PORTFOLIO POSITIONING AT PERIOD-END.
We continue to expect the economy to improve at a slow, steady pace. While a number of early cycle areas of the economy (such as Industrials and Consumer Discretionary) have performed well, we are cautious as to whether these segments will be able to sustain performance in the second leg of a recovery. As of October 31, 2010, the Portfolio was positioned with a mix of what we believe are high quality, franchise companies and well-financed, cyclical firms. In our opinion, the Health Care sector generates relatively steady growth. As a result, we believe this sector should perform well in a slow growth environment. We also think that the Financial Services sector remains one of the most attractively valued segments of the market, as credit issues improve. We believe our in-depth research approach will help us to identify opportunities in the sector. We will continue to be selective with our investments in Consumer Discretionary, a reflection of our longer-term concern over consumer spending.
| Ten Largest Holdings* | |
| BRUKER CORP. | 3.12% |
| Life science instruments | |
| J2 GLOBAL COMMUNICATIONS, INC. | 2.97% |
| Electronic communication services | |
| PAR PHARMACEUTICAL CO., INC. | 2.72% |
| Generic and branded drug manufacturer | |
| NXSTAGE MEDICAL, INC. | 2.62% |
| Medical device manufacturer | |
| BROOKDALE SENIOR LIVING, INC. | 2.57% |
| Operates senior living communities | |
| MONRO MUFFLER BRAKE, INC. | 2.43% |
| Provides automotive repair services | |
| MICROS SYSTEMS, INC. | 2.24% |
| Information Services | |
| RIGHTNOW TECHNOLOGIES, INC. | 2.23% |
| Provider of customer service software | |
| over the Internet | |
| INFORMATICA CORP. | 2.22% |
| Provider of enterprise data integration software | |
| PANERA BREAD CO. CLASS A | 2.22% |
| Operates bakery-cafes | |
| Portfolio Composition* | |
| Information Technology | 24.9% |
| Health Care | 22.7% |
| Consumer Discretionary | 16.1% |
| Industrials | 16.1% |
| Financials | 8.1% |
| Materials | 4.3% |
| Short-term investment less net liabilities | 3.2% |
| Energy | 2.8% |
| Consumer Staples | 1.8% |
*Based on the Fund’s net assets at October 31, 2010 and subject to change.
CENTURY FUNDS
6
PERFORMANCE SUMMARY
Century Small Cap Select Fund – Institutional Shares and Investor Shares
The performance information shown below is historical and doesnot guarantee future results.Investment return and principal value fluctuate with changing market conditions so that,when redeemed,shares may be worth more or less than their original cost.Current performance may be substantially lower or higher than the Fund’s historical performance.Please call (800) 303-1928 for the Fund’s most recent month-end performance. As stated in the Fund’s current prospectus, the total (gross) annual operating expense ratios are 1.55% for the Investor Shares and 1.16% for the Institutional Shares. Returns would have been lower during relevant periods if certain fees had not been waived or expenses reimbursed.To discourage short-term trading,the Fund may impose a redemption fee of 1.00% on shares held less than 90 d ays.Performance figures and graphs do not reflect the deduction of taxes that a shareholder would pay on Fund distributions or redemption of Fund shares.Returns may vary by share class.
| Average Annual Total Returns as of 10/31/10 (%) | ||||||||||||||||
| 1 Year | 3 Years | 5 Years | 10 Years | |||||||||||||
| Century Small Cap Select Institutional Shares | 28.52 | -3.94 | 1.37 | 7.41 | ||||||||||||
| Russell 2000 Growth Index | 28.67 | -3.81 | 3.99 | 1.15 | ||||||||||||
| 1 Year | 3 Years | 5 Years | 10 Years | |||||||||||||
| Century Small Cap Select Investor Shares | 28.06 | -4.30 | 1.02 | 7.06 | ||||||||||||
| Russell 2000 Growth Index | 28.67 | -3.81 | 3.99 | 1.15 | ||||||||||||
| Sources: Century Capital Management, LLC and Russell | ||||||||||||||||
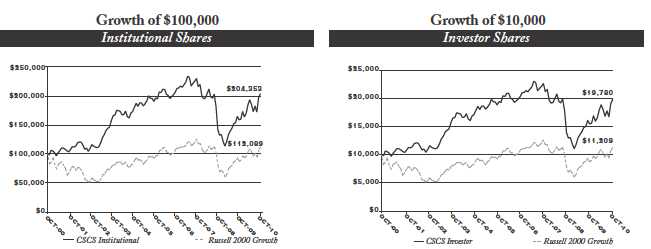
The graphs and table reflect the change in value of a hypothetical investment in the Fund, including reinvest of dividends and distributions, compared with the listed indices.
Index returns assume reinvestment of dividends and, unlike Fund returns, do not reflect any fees or expenses. It is not possible to invest directly in an index. Minimum initial investment for Institutional Shares is $100,000.
The Russell 2000® Growth Index measures the performance of the small-cap growth segment of the U.S. equity universe.
CENTURY FUNDS
7
CENTURY SHARES TRUST COMMENTARY
HOW DID THE PORTFOLIO PERFORM?
For the one-year period ended October 31, 2010, Century Shares Trust’s Institutional Shares returned 16.72% versus the S&P 500 Index’s return of 16.52%, while the Investor Shares return of 16.36% trailed the benchmark.
WHAT FACTORS INFLUENCED PERFORMANCE?
The S&P 500 Index experienced its share of peaks and valleys before one of the strongest Septembers on record helped propel it into positive territory for the fiscal year. Cyclical sectors such as Consumer Discretionary, Industrials, and Materials outperformed. The Portfolio was comprised of what we believe are high quality franchises as well as well-positioned cyclical firms. This diversification helped to smooth out the Trust’s performance relative to the stock market’s volatility.
Much of the sector allocation benefit came from avoiding trouble. Underweighting Financial Services and Energy, the two weakest performing sectors, benefitted the Trust’s overall performance. In addition, overweighting Consumer Discretionary, which was the best performing sector in the S&P 500 Index (+31%), was a positive contributor. The Portfolio’s underweight of Materials was a drag on performance as the sector was the beneficiary of increased demand for commodities, especially from China.
Health Care stocks were strong contributors to overall performance. AmerisourceBergen (a drug distributor) and Alexion Pharmaceuticals (a biopharmaceutical company) were two of the top Health Care holdings. Telecommunications, another area of strength, was led by NII Holdings (a wireless service provider). Deere & Company (a heavy equipment manufacturer) and Discovery Communication (a global media company) were also strong contributors during the year. CVS Caremark (a pharmacy benefit manager & retailer) and Strayer Education (a for-profit education company) were laggards. The Trust’s lack of exposure to Real Estate Investment Trusts (REITS) also proved to be a drag on performance.
DESCRIBE RECENT PORTFOLIO ACTIVITY.
The most notable changes to the Portfolio over the past year were the increased exposures to Consumer Discretionary and Energy stocks. In the Consumer Discretionary sector, we established positions in the Auto and Media industries to benefit from the rebound in car sales and advertising spending, plus the drive to improve fuel efficiency. We added exposure to Integrated Energy firms that offer international exposure, stability, and attractive dividend yields.
Our exposure to the Financial, Information Technology, and Consumer Staples sectors all decreased over the past six months. We continue to believe there are attractive investment opportunities in the Financial and Information Technology sectors and will seek to add companies when appropriate.
CENTURY FUNDS
8
CENTURY SHARES TRUST COMMENTARY (CONTINUED)
DESCRIBE PORTFOLIO POSITIONING AT PERIOD-END.
The Portfolio is comprised primarily of high quality, “blue chip” corporations. We believe our holdings are well diversified and represent a good mix of steady franchises, growth businesses, and economically sensitive companies. The Portfolio holds Amazon (an online retailer) and Apple (a provider of electronic devices and services), both franchise leaders. It also owns McDonald’s (a fast food restaurant chain) and Johnson & Johnson (a diversified health care company), consistent growth companies with attractive dividend yields. In addition, it owns Ford Motor Co. (an auto manufacturer), CSX Corp (a transportation company) and Deere & Company (a heavy equipment manufacturer), industrial companies that we believe are well positioned to benefit during a continuing recovery.
As of October 31, 2010, Information Technology and Consumer Discretionary were the highest overweight sectors, while Financial and Consumer Staples were underweight. While the economic outlook has improved versus a year ago, there is still a great deal of uncertainty as to the pace of the recovery. We are positioning the portfolio in companies that we believe have strong business models, are financially sound, and that have invested in their businesses during the economic downturn. We believe these companies are most likely to gain market share and have the potential to grow at above average rates over the next several years.
| Ten Largest Holdings* | |
| APPLE, INC. | 4.40% |
| Worldwide technology company | |
| EXPRESS SCRIPTS, INC. | 4.10% |
| Pharmacy benefit manager | |
| ORACLE CORP. | 4.08% |
| Enterprise software provider | |
| GOOGLE, INC. CLASS A | 2.88% |
| Internet solutions | |
| DISCOVERY COMMUNICATIONS, INC. | 2.65% |
| Worldwide media and entertainment company | |
| NII HOLDINGS, INC. | 2.43% |
| Wireless communication services provider | |
| CHEVRON CORP. | 2.43% |
| Integrated energy company | |
| EMC CORP. | 2.43% |
| Electronic storage provider | |
| ALEXION PHARMACEUTICALS, INC. | 2.32% |
| A biopharmaceutical company | |
| O’REILLY AUTOMOTIVE, INC. | 2.21% |
| Automotive parts retailer | |
| Portfolio Composition* | |
| Information Technology | 29.4% |
| Consumer Discretionary | 16.1% |
| Health Care | 12.3% |
| Industrials | 11.2% |
| Energy | 9.5% |
| Consumer Staples | 7.2% |
| Telecommunication Services | 4.4% |
| Short-term investment | |
less net liabilities | 4.1% |
| Financials | 3.7% |
| Materials | 2.1% |
*Based on the Fund’s net assets at October 31, 2010 and subject to change.
CENTURY FUNDS
9
PERFORMANCE SUMMARY
Century Shares Trust – Institutional Shares and Investor Shares
The performance information shown below is historical and does not guarantee future results. Investment return and principal value fluctuate with changing market conditions so that, when redeemed, shares may be worth more or less than their original cost. Current performance may be substantially lower or higher than the Fund’s historical performance. Please call (800) 303-1928 for the Fund’s most recent month-end performance. As stated in the Fund’s current prospectus, the total (gross) annual operating expense ratios are 1.22% for the Institutional Shares and 2.66% for the Investor Shares. The adviser has agreed contractually to reimburse or pay operating expenses for the Fund’s Investor Shares to the extent necessary to maintain net operating expenses at 1.45% through February 28, 2011. Returns would have been lower during relevant periods if certain fees had not been waived or expenses reimbursed.To discourage short-term trading, the Fund may impose a redemption fee of 1.00% on shares held less than 90 days. Performance figures and graphs do not reflect the deduction of taxes that a shareholder would pay on Fund distributions or redemption of Fund shares. Returns may vary by share class.
| Average Annual Total Returns as of 10/31/10 (%) | ||||||||||||||||
| 1 Year | 3 Years | 5 Years | 10 Years | |||||||||||||
| CST Institutional Shares | 16.72 | -4.98 | 1.12 | 3.17 | ||||||||||||
| S&P 500 Index | 16.52 | -6.49 | 1.73 | -0.02 | ||||||||||||
| Since | ||||||||||||||||
| 1 Year | 3 Years | 5 Years | Inception* | |||||||||||||
| CST Investor Shares | 16.36 | -5.21 | 0.70 | 0.86 | ||||||||||||
| S&P 500 Index | 16.52 | -6.49 | 1.73 | 1.51 | ||||||||||||
| Sources: Century Capital Management, LLC and S&P | ||||||||||||||||

The graphs and table reflect the change in value of a hypothetical investment in the Fund, including reinvest of dividends and distributions, compared with the listed indices.
Index returns assume reinvestment of dividends and, unlike Fund returns, do not reflect any fees or expenses. It is not possible to invest directly in an index. Minimum initial investment for Institutional Shares is $100,000.
The S&P 500® Index is a broad based unmanaged index representing the performance of 500 widely held common stocks. One cannot invest directly in an index.
*Inception Date July 18, 2005
CENTURY FUNDS
10
SHAREHOLDER EXPENSE EXAMPLE
As a shareholder of a Fund, you incur two types of costs: (1) transaction costs including redemption fees, and (2) ongoing costs, including management fees, distribution and service fees (in the case of Investor Shares of both Funds) and other Fund expenses.This Example is intended to help you understand your ongoing costs (in dollars) of investing in the Fund and to compare those costs with the ongoing costs of investing in other mutual funds.
The Example is based on an investment of $1,000 invested at the beginning of the period and held for the entire period (May 1, 2010 to October 31, 2010).
Actual Expenses
The first line of the table below provides information about actual account values and actual expenses. You may use the information in this line, together with the amount you invested, to estimate the expenses that you paid over the period. Simply divide your account value by $1,000.00 (for example, an $8,600 account value divided by $1,000.00=8.6), then multiply the result by the number in the first line under the heading entitled “Expenses Paid During Period” to estimate the expenses you paid on your account during this period. An annual maintenance fee of $10.00 that is charged once a year may apply for certain IRA accounts. This fee is not included in the table below. If it were, the estimate of expenses you paid during the period would be higher, and your ending account value lower, by this amount.
Hypothetical Example for Comparison Purposes
The second line of the table below provides information about hypothetical account values and hypothetical expenses based on the Fund’s actual expense ratio and an assumed rate of return of 5% per year before expenses, which is not the Fund’s actual return.The hypothetical account values and expenses may not be used to estimate the actual ending account balance or expenses you paid for the period. You may use this information to compare the ongoing costs of investing in the Fund and other funds. To do so, compare this 5% hypothetical example with the 5% hypothetical examples that appear in the shareholder reports of the other funds.
Please note that the expenses shown in the table are meant to highlight your ongoing costs only and do not reflect any transactional costs such as redemption fees. Therefore, the second line of the table is useful in comparing ongoing costs only, and will not help you determine the relative total costs of owning different funds. In addition, if these transactional costs were included, your costs would have been higher.
| Century Shares Trust | Expenses Paid | |||||||||||
| Beginning | Ending | During Period* | ||||||||||
| Account Value | Account Value | Six Months Ending | ||||||||||
| May 1, 2010 | October 31, 2010 | October 31, 2010 | ||||||||||
| Based on Actual Fund Return | ||||||||||||
| Institutional Shares | $ | 1,000.00 | $ | 1,010.80 | $ | 5.73 | ||||||
| Investor Shares | $ | 1,000.00 | $ | 1,009.30 | $ | 7.34 | ||||||
| Based on Hypothetical 5% Yearly Return before expenses | ||||||||||||
| Institutional Shares | $ | 1,000.00 | $ | 1,019.51 | $ | 5.75 | ||||||
| Investor Shares | $ | 1,000.00 | $ | 1,017.90 | $ | 7.37 | ||||||
| * | The Fund’s annualized expense ratios are 1.13% for Institutional Shares and 1.45% for Investor Shares. The dollar amounts shown as “Expenses Paid” are equal to the annual expense ratio multiplied by the average account value over the period, multiplied by the number of days in the most recent fiscal half-year, then divided by 365. |
| Century Small Cap Select Fund | Expenses Paid | |||||||||||
| Beginning | Ending | During Period* | ||||||||||
| Account Value | Account Value | Six Months Ending | ||||||||||
| May 1, 2010 | October 31, 2010 | October 31, 2010 | ||||||||||
| Based on Actual Fund Return | ||||||||||||
| Institutional Shares | $ | 1,000.00 | $ | 1,054.20 | $ | 5.75 | ||||||
| Investor Shares | $ | 1,000.00 | $ | 1,052.40 | $ | 7.55 | ||||||
| Based on Hypothetical 5% Yearly Return before expenses | ||||||||||||
| Institutional Shares | $ | 1,000.00 | $ | 1,019.61 | $ | 5.65 | ||||||
| Investor Shares | $ | 1,000.00 | $ | 1,017.85 | $ | 7.43 | ||||||
| * | The Fund’s annualized expense ratios are 1.11% for Institutional Shares and 1.46% for Investor Shares. The dollar amounts shown as “Expenses Paid” are equal to the annual expense ratio multiplied by the average account value over the period, multiplied by the number of days in the most recent fiscal half-year, then divided by 365. |
CENTURY FUNDS
11
CENTURY SHARES TRUST | ||||||||
PORTFOLIO OF INVESTMENTS – AS OF OCTOBER 31, 2010 | ||||||||
| Shares | Value | |||||||
| COMMON STOCK - 95.9% | ||||||||
| Consumer Discretionary - 16.1% | ||||||||
| AUTO COMPONENTS - 2.1% | ||||||||
| BorgWarner, Inc.* | 65,700 | $ | 3,686,427 | |||||
| AUTOMOBILES - 2.1% | ||||||||
| Ford Motor Co.* | 263,100 | 3,717,603 | ||||||
| HOTELS, RESTAURANTS & LEISURE - 2.7% | ||||||||
| McDonald’s Corp. | 34,300 | 2,667,511 | ||||||
| Panera Bread Co. Class A* | 23,600 | 2,112,436 | ||||||
| 4,779,947 | ||||||||
| INTERNET & CATALOG RETAIL - 1.0% | ||||||||
| Amazon.com, Inc.* | 11,350 | 1,874,339 | ||||||
| MEDIA - 4.1% | ||||||||
| Discovery Communications, Inc.* | 106,100 | 4,733,121 | ||||||
| Time Warner, Inc. | 79,750 | 2,592,672 | ||||||
| 7,325,793 | ||||||||
| SPECIALTY RETAIL - 4.1% | ||||||||
| Guess?, Inc. | 87,750 | 3,415,230 | ||||||
| O’Reilly Automotive, Inc.* | 67,650 | 3,957,525 | ||||||
| 7,372,755 | ||||||||
| 28,756,864 | ||||||||
| Consumer Staples - 7.2% | ||||||||
| BEVERAGES - 1.3% | ||||||||
| PepsiCo, Inc. | 37,050 | 2,419,365 | ||||||
| FOOD & STAPLES RETAILING - 1.5% | ||||||||
| Costco Wholesale Corp. | 41,600 | 2,611,232 | ||||||
| FOOD PRODUCTS - 0.9% | ||||||||
| ConAgra Foods, Inc. | 71,700 | 1,612,533 | ||||||
| HOUSEHOLD PRODUCTS - 1.1% | ||||||||
| Kimberly-Clark Corp. | 30,650 | 1,941,371 | ||||||
| PERSONAL PRODUCTS - 0.9% | ||||||||
| Avon Products, Inc. | 54,200 | 1,650,390 | ||||||
| TOBACCO - 1.5% | ||||||||
| Philip Morris International, Inc. | 45,850 | 2,682,225 | ||||||
| 12,917,116 | ||||||||
| See notes to financial statements. |
CENTURY FUNDS
12
CENTURY SHARES TRUST (CONTINUED) | ||||||||
PORTFOLIO OF INVESTMENTS – AS OF OCTOBER 31, 2010 | ||||||||
| Shares | Value | |||||||
| Energy - 9.5% | ||||||||
| ENERGY EQUIPMENT & SERVICES - 3.8% | ||||||||
| Helmerich & Payne, Inc. | 80,697 | $ | 3,452,218 | |||||
| Schlumberger Ltd. | 48,553 | 3,393,369 | ||||||
| 6,845,587 | ||||||||
| OIL, GAS & CONSUMABLE FUELS - 5.7% | ||||||||
| Apache Corp. | 30,234 | 3,054,239 | ||||||
| Chevron Corp. | 52,600 | 4,345,286 | ||||||
| CONSOL Energy, Inc. | 75,350 | 2,769,866 | ||||||
| 10,169,391 | ||||||||
| 17,014,978 | ||||||||
| Financials - 3.7% | ||||||||
| CAPITAL MARKETS - 1.3% | ||||||||
| Och-Ziff Capital Management Group LLC | 158,650 | 2,343,261 | ||||||
| DIVERSIFIED FINANCIAL SERVICES - 1.4% | ||||||||
| JPMorgan Chase & Co. | 65,650 | 2,470,409 | ||||||
| INSURANCE - 1.0% | ||||||||
| Berkshire Hathaway, Inc. Class A* | 15 | 1,789,500 | ||||||
| 6,603,170 | ||||||||
| Health Care - 12.3% | ||||||||
| BIOTECHNOLOGY - 2.3% | ||||||||
| Alexion Pharmaceuticals, Inc.* | 60,650 | 4,142,395 | ||||||
| HEALTH CARE PROVIDERS & SERVICES - 6.2% | ||||||||
| AmerisourceBergen Corp. | 114,850 | 3,769,377 | ||||||
| Express Scripts, Inc.* | 151,000 | 7,326,520 | ||||||
| 11,095,897 | ||||||||
| LIFE SCIENCES TOOLS & SERVICES - 1.8% | ||||||||
| Waters Corp.* | 43,850 | 3,250,600 | ||||||
| PHARMACEUTICALS - 2.0% | ||||||||
| Johnson & Johnson | 54,500 | 3,470,015 | ||||||
| 21,958,907 | ||||||||
| Industrials - 11.2% | ||||||||
| AEROSPACE & DEFENSE - 2.0% | ||||||||
| Rockwell Collins, Inc. | 57,600 | 3,485,376 | ||||||
| AIR FREIGHT & LOGISTICS - 1.9% | ||||||||
| FedEx Corp. | 38,950 | 3,416,694 | ||||||
| See notes to financial statements. |
CENTURY FUNDS
13
CENTURY SHARES TRUST (CONTINUED) | ||||||||
PORTFOLIO OF INVESTMENTS – AS OF OCTOBER 31, 2010 | ||||||||
| Shares | Value | |||||||
| Industrials (continued) | ||||||||
| INDUSTRIAL CONGLOMERATES - 1.5% | ||||||||
| 3M Co. | 31,000 | $ | 2,610,820 | |||||
| MACHINERY - 3.1% | ||||||||
| Deere & Co. | 50,150 | 3,851,520 | ||||||
| Illinois Tool Works, Inc. | 38,450 | 1,757,165 | ||||||
| 5,608,685 | ||||||||
| ROAD & RAIL - 1.2% | ||||||||
| CSX Corp. | 36,050 | 2,215,272 | ||||||
| TRADING COMPANIES & DISTRIBUTORS - 1.5% | ||||||||
| Fastenal Co. | 25,900 | 1,333,332 | ||||||
| W.W. Grainger, Inc. | 11,200 | 1,389,136 | ||||||
| 2,722,468 | ||||||||
| 20,059,315 | ||||||||
| Information Technology - 29.4% | ||||||||
| COMMUNICATIONS EQUIPMENT - 3.1% | ||||||||
| Cisco Systems, Inc.* | 79,500 | 1,814,985 | ||||||
| QUALCOMM, Inc. | 82,350 | 3,716,455 | ||||||
| 5,531,440 | ||||||||
| COMPUTERS & PERIPHERALS - 8.8% | ||||||||
| Apple, Inc.* | 26,150 | 7,867,750 | ||||||
| EMC Corp.* | 206,350 | 4,335,414 | ||||||
| Hewlett-Packard Co. | 83,800 | 3,524,628 | ||||||
| 15,727,792 | ||||||||
| INTERNET SOFTWARE & SERVICES - 2.9% | ||||||||
| Google, Inc. Class A* | 8,400 | 5,149,116 | ||||||
| IT SERVICES - 7.9% | ||||||||
| Accenture PLC | 85,100 | 3,804,821 | ||||||
| International Business Machines Corp. | 21,450 | 3,080,220 | ||||||
| MasterCard, Inc. Class A | 15,550 | 3,732,933 | ||||||
| Paychex, Inc. | 126,350 | 3,499,895 | ||||||
| 14,117,869 | ||||||||
| SOFTWARE - 6.7% | ||||||||
| Adobe Systems, Inc.* | 99,600 | 2,803,740 | ||||||
| Microsoft Corp. | 70,790 | 1,885,846 | ||||||
| Oracle Corp. | 248,200 | 7,297,080 | ||||||
| 11,986,666 | ||||||||
| 52,512,883 | ||||||||
| See notes to financial statements. |
CENTURY FUNDS
14
CENTURY SHARES TRUST (CONTINUED) | |||||||||
PORTFOLIO OF INVESTMENTS – AS OF OCTOBER 31, 2010 | |||||||||
| Shares | Value | ||||||||
| Materials - 2.1% | |||||||||
| CHEMICALS - 2.1% | |||||||||
| Air Products & Chemicals, Inc. | 44,216 | $ | 3,757,034 | ||||||
| Telecommunication Services - 4.4% | |||||||||
| DIVERSIFIED TELECOMMUNICATION SERVICES - 1.9% | |||||||||
| AT&T, Inc. | 120,800 | 3,442,800 | |||||||
| WIRELESS TELECOMMUNICATION SERVICES - 2.5% | |||||||||
| NII Holdings, Inc.* | 104,050 | 4,350,331 | |||||||
| 7,793,131 | |||||||||
| Total Investment in Common Stocks - 95.9% | |||||||||
| (Identified cost, $130,916,666) | 171,373,398 | ||||||||
| Short-Term Investment - 4.8% | |||||||||
| (Identified cost, $8,533,903) | |||||||||
| State Street Institutional U.S. | |||||||||
| Government Money Market Fund | 8,533,903 | 8,533,903 | |||||||
| Total Investments - 100.7% | |||||||||
| (Identified cost, $139,450,569) | 179,907,301 | ||||||||
| Liabilities in Excess of Other Assets - (0.7)% | (1,236,877 | ) | |||||||
| Net Assets - 100% | $ | 178,670,424 | |||||||
| * | Non-income producing security | ||||||||
See notes to financial statements.
CENTURY FUNDS
15
CENTURY SMALL CAP SELECT FUND | ||||||||
PORTFOLIO OF INVESTMENTS – AS OF OCTOBER 31, 2010 | ||||||||
| Shares | Value | |||||||
| COMMON STOCK - 96.8% | ||||||||
| Consumer Discretionary - 16.1% | ||||||||
| DISTRIBUTORS - 2.0% | ||||||||
| LKQ Corp.* | 317,400 | $ | 6,900,276 | |||||
| DIVERSIFIED CONSUMER SERVICES - 0.8% | ||||||||
| Capella Education Co.* | 47,650 | 2,612,650 | ||||||
| HOTELS, RESTAURANTS & LEISURE - 2.2% | ||||||||
| Panera Bread Co. Class A* | 84,650 | 7,577,021 | ||||||
| SPECIALTY RETAIL - 9.5% | ||||||||
| DSW, Inc. Class A* | 220,550 | 7,337,698 | ||||||
| Lumber Liquidators Holdings, Inc.* | 297,600 | 7,166,208 | ||||||
| Monro Muffler Brake, Inc. | 174,000 | 8,306,760 | ||||||
| Rue21, Inc.* | 96,450 | 2,567,499 | ||||||
| Williams-Sonoma, Inc. | 220,150 | 7,126,256 | ||||||
| 32,504,421 | ||||||||
| TEXTILES, APPAREL & LUXURY GOODS - 1.6% | ||||||||
| G-III Apparel Group Ltd.* | 204,200 | 5,390,880 | ||||||
| 54,985,248 | ||||||||
| Consumer Staples - 1.8% | ||||||||
| FOOD & STAPLES RETAILING - 1.8% | ||||||||
| BJ’s Wholesale Club, Inc.* | 151,150 | 6,307,490 | ||||||
| Energy - 2.8% | ||||||||
| ENERGY EQUIPMENT & SERVICES - 1.6% | ||||||||
| Core Laboratories NV | 70,250 | 5,463,343 | ||||||
| OIL, GAS & CONSUMABLE FUELS - 1.2% | ||||||||
| Berry Petroleum Co. Class A | 124,600 | 4,262,566 | ||||||
| 9,725,909 | ||||||||
| Financials - 8.1% | ||||||||
| CAPITAL MARKETS - 3.3% | ||||||||
| Cohen & Steers, Inc. | 262,200 | 6,573,354 | ||||||
| Evercore Partners, Inc. Class A | 150,450 | 4,567,662 | ||||||
| 11,141,016 | ||||||||
| COMMERCIAL BANKS - 3.4% | ||||||||
| PrivateBancorp, Inc. | 426,400 | 5,027,256 | ||||||
| Signature Bank* | 158,900 | 6,711,936 | ||||||
| 11,739,192 | ||||||||
See notes to financial statements.
CENTURY FUNDS
16
CENTURY SMALL CAP SELECT FUND (CONTINUED) | ||||||||
PORTFOLIO OF INVESTMENTS – AS OF OCTOBER 31, 2010 | ||||||||
| Shares | Value | |||||||
| Financials (continued) | ||||||||
| REAL ESTATE INVESTMENT TRUSTS (REITS) - 1.4% | ||||||||
| MFA Financial, Inc. | 611,350 | $ | 4,835,779 | |||||
| 27,715,987 | ||||||||
| Health Care - 22.7% | ||||||||
| HEALTH CARE EQUIPMENT & SUPPLIES - 3.8% | ||||||||
| Align Technology, Inc.* | 235,600 | 4,012,268 | ||||||
| NxStage Medical, Inc.* | 444,050 | 8,952,048 | ||||||
| 12,964,316 | ||||||||
| HEALTH CARE PROVIDERS & SERVICES - 9.5% | ||||||||
| Bio-Reference Labs, Inc.* | 342,600 | 7,386,456 | ||||||
| Brookdale Senior Living, Inc.* | 468,250 | 8,793,735 | ||||||
| Healthspring, Inc.* | 168,450 | 4,917,055 | ||||||
| IPC The Hospitalist Co., Inc.* | 220,200 | 7,053,006 | ||||||
| Lincare Holdings, Inc. | 164,825 | 4,321,712 | ||||||
| 32,471,964 | ||||||||
| HEALTH CARE TECHNOLOGY - 3.6% | ||||||||
| Quality Systems, Inc. | 95,600 | 6,143,256 | ||||||
| SXC Health Solutions Corp.* | 156,200 | 6,085,552 | ||||||
| 12,228,808 | ||||||||
| LIFE SCIENCES TOOLS & SERVICES - 3.1% | ||||||||
| Bruker Corp.* | 712,900 | 10,686,371 | ||||||
| PHARMACEUTICALS - 2.7% | ||||||||
| Par Pharmaceutical Cos., Inc.* | 286,350 | 9,309,238 | ||||||
| 77,660,697 | ||||||||
| Industrials - 16.1% | ||||||||
| AEROSPACE & DEFENSE - 1.9% | ||||||||
| Ladish Co., Inc.* | 204,150 | 6,530,759 | ||||||
| AIR FREIGHT & LOGISTICS - 1.6% | ||||||||
| Atlas Air Worldwide Holdings, Inc.* | 104,850 | 5,479,461 | ||||||
| ELECTRICAL EQUIPMENT - 7.4% | ||||||||
| General Cable Corp.* | 152,500 | 4,260,850 | ||||||
| II-VI, Inc.* | 186,050 | 7,319,207 | ||||||
| Polypore International, Inc.* | 183,700 | 6,111,699 | ||||||
| Woodward Governor Co. | 239,000 | 7,490,260 | ||||||
| 25,182,016 | ||||||||
See notes to financial statements.
CENTURY FUNDS
17
CENTURY SMALL CAP SELECT FUND (CONTINUED) | ||||||||
PORTFOLIO OF INVESTMENTS – AS OF OCTOBER 31, 2010 | ||||||||
| Shares | Value | |||||||
| Industrials (continued) | ||||||||
| MACHINERY - 1.0% | ||||||||
| Chart Industries, Inc.* | 148,650 | $ | 3,463,545 | |||||
| PROFESSIONAL SERVICES - 2.0% | ||||||||
| Kforce, Inc.* | 460,740 | 6,915,707 | ||||||
| TRADING COMPANIES & DISTRIBUTORS - 2.2% | ||||||||
| Applied Industrial Technologies, Inc. | 241,150 | 7,333,371 | ||||||
| 54,904,859 | ||||||||
| Information Technology - 24.9% | ||||||||
| COMMUNICATIONS EQUIPMENT - 1.2% | ||||||||
| Acme Packet, Inc.* | 103,300 | 4,085,515 | ||||||
| INTERNET SOFTWARE & SERVICES - 7.2% | ||||||||
| Internet Brands, Inc. Class A* | 318,850 | 4,221,574 | ||||||
| j2 Global Communications, Inc.* | 385,100 | 10,147,385 | ||||||
| LivePerson, Inc.* | 599,300 | 5,549,518 | ||||||
| LoopNet, Inc.* | 446,600 | 4,711,630 | ||||||
| Vocus, Inc.* | 6,550 | 145,083 | ||||||
| 24,775,190 | ||||||||
| IT SERVICES - 5.4% | ||||||||
| Online Resources Corp.* | 793,200 | 4,108,776 | ||||||
| RightNow Technologies, Inc.* | 292,400 | 7,637,488 | ||||||
| Sapient Corp. | 503,600 | 6,627,376 | ||||||
| 18,373,640 | ||||||||
| SEMICONDUCTORS & | ||||||||
| SEMICONDUCTOR EQUIPMENT - 2.4% | ||||||||
| Hittite Microwave Corp.* | 131,000 | 6,768,770 | ||||||
| Power Integrations, Inc. | 43,600 | 1,489,376 | ||||||
| 8,258,146 | ||||||||
| SOFTWARE - 8.7% | ||||||||
| CommVault Systems, Inc.* | 137,600 | 3,980,768 | ||||||
| Informatica Corp.* | 186,450 | 7,586,650 | ||||||
| MICROS Systems, Inc.* | 168,600 | 7,652,754 | ||||||
| Pegasystems, Inc. | 139,150 | 3,764,007 | ||||||
| Solarwinds, Inc.* | 131,400 | 2,384,910 | ||||||
| Sourcefire, Inc.* | 65,950 | 1,555,761 | ||||||
| Websense, Inc.* | 139,700 | 2,810,764 | ||||||
| 29,735,614 | ||||||||
| 85,228,105 | ||||||||
See notes to financial statements.
CENTURY FUNDS
18
CENTURY SMALL CAP SELECT FUND (CONTINUED) | |||||||||
PORTFOLIO OF INVESTMENTS – AS OF OCTOBER 31, 2010 | |||||||||
| Shares | Value | ||||||||
| Materials - 4.3% | |||||||||
| CHEMICALS - 2.9% | |||||||||
| Balchem Corp. | 194,500 | $ | 5,943,920 | ||||||
| STR Holdings, Inc.* | 156,250 | 3,882,812 | |||||||
| 9,826,732 | |||||||||
| METALS & MINING - 1.4% | |||||||||
| Schnitzer Steel Industries, Inc. Class A | 93,150 | 4,814,924 | |||||||
| 14,641,656 | |||||||||
| Total Investment in Common Stocks - 96.8% | |||||||||
| (Identified cost, $249,954,617) | 331,169,951 | ||||||||
| Short-Term Investment - 3.7% | |||||||||
| (Identified cost, $12,729,884) | |||||||||
| State Street Institutional U.S. | |||||||||
| Government Money Market Fund | 12,729,884 | 12,729,884 | |||||||
| Total Investments - 100.5% | |||||||||
| (Identified cost, $262,684,501) | 343,899,835 | ||||||||
| Liabilities in Excess of Other Assets – (0.5)% | (1,851,868 | ) | |||||||
| Net Assets - 100% | $ | 342,047,967 | |||||||
| * | Non-income producing security | ||||||||
See notes to financial statements.
CENTURY FUNDS
19
STATEMENTS OF ASSETS AND LIABILITIES - AS OF OCTOBER 31, 2010 | ||||||||
| Century Shares | Century Small Cap | |||||||
| Trust | Select Fund | |||||||
| Assets: | ||||||||
| Investments, at value (Note 1A) (Identified cost of | ||||||||
| $139,450,569 and $262,684,501, respectively) | $ | 179,907,301 | $ | 343,899,835 | ||||
| Cash | 50 | — | ||||||
| Dividends receivable | 214,004 | 37,963 | ||||||
| Receivable for investments sold | — | 8,159,352 | ||||||
| Receivable for Fund shares sold | 2,255 | 841,793 | ||||||
| Receivable for dividend reclaims | 29,696 | — | ||||||
| Prepaid expenses | 4,058 | 6,885 | ||||||
| Total Assets | 180,157,364 | 352,945,828 | ||||||
| LIABILITIES: | ||||||||
| Payable to Affiliates: | ||||||||
| Investment adviser fee (Note 4) | 120,246 | 274,142 | ||||||
| Administration fee (Note 5) | 15,072 | 5,000 | ||||||
| Distribution and service fees (Note 6) | 2,515 | 16,205 | ||||||
| Accrued expenses and other liabilities | 118,168 | 159,749 | ||||||
| Payable for investments purchased | 1,220,834 | 10,022,047 | ||||||
| Payable for Fund shares repurchased | 10,105 | 420,718 | ||||||
| Total Liabilities | 1,486,940 | 10,897,861 | ||||||
| NET ASSETS | $ | 178,670,424 | $ | 342,047,967 | ||||
| At October 31, 2010, net assets consisted of: | ||||||||
| Paid-in capital | $ | 130,462,020 | $ | 418,279,838 | ||||
| Accumulated undistributed net realized gains/(losses) on investments | 7,751,672 | (157,447,205 | ) | |||||
| Unrealized appreciation in value of investments | 40,456,732 | 81,215,334 | ||||||
| Net assets applicable to outstanding capital stock | $ | 178,670,424 | $ | 342,047,967 | ||||
| Net Assets consist of: | ||||||||
| Institutional Shares | $ | 177,042,399 | $ | 249,429,497 | ||||
| Investor Shares | $ | 1,628,025 | $ | 92,618,470 | ||||
| Shares Outstanding consist of (Note 2): | ||||||||
| Institutional Shares | 9,007,529 | 11,881,632 | ||||||
| Investor Shares | 82,916 | 4,521,185 | ||||||
| NET ASSET VALUE PER SHARE | ||||||||
| (Represents both the offering and redemption price*) | ||||||||
| Institutional Shares | $ | 19.65 | $ | 20.99 | ||||
| Investor Shares | $ | 19.63 | $ | 20.49 | ||||
| * | In general, shares of the Funds may be redeemed at net asset value. However, upon the redemption of shares held less than 90 days, a redemption fee of 1% of the current net asset value of the shares may be assessed and retained by each share class of each Fund for the benefit of their respective remaining shareholders. The redemption fee is accounted for as an addition to paid-in-capital. |
See notes to financial statements.
CENTURY FUNDS
20
STATEMENTS OF OPERATIONS - YEAR ENDED OCTOBER 31, 2010 | ||||||||
| Century Shares | Century Small Cap | |||||||
| Trust | Select Fund | |||||||
| Investment Income: | ||||||||
| Dividends (net of foreign withholding tax of $1,403 and $14,360, respectively) | $ | 1,890,253 | $ | 2,457,343 | ||||
| Other Income | 23,433 | 333,662 | ||||||
| Total investment income | 1,913,686 | 2,791,005 | ||||||
| Expenses: | ||||||||
| Investment adviser fee (Notes 4 and 7) | 1,384,741 | 3,005,580 | ||||||
| Non-interested trustees’ remuneration | 89,598 | 161,169 | ||||||
| Transfer agent | ||||||||
| Institutional Shares | 116,129 | 67,181 | ||||||
| Investor Shares | 10,713 | 180,295 | ||||||
| Custodian | 53,095 | 69,746 | ||||||
| Administration fees (Note 5) | 173,398 | 5,000 | ||||||
| Insurance | 16,831 | 31,096 | ||||||
| Professional fees | 68,314 | 88,925 | ||||||
| Registration | 30,741 | 37,034 | ||||||
| Distribution and service fees (Note 6) | 3,465 | 173,168 | ||||||
| Printing and other expenses | 60,916 | 78,388 | ||||||
| Total expenses | 2,007,941 | 3,897,582 | ||||||
| Adviser reimbursements (Note 7) | (9,114 | ) | — | |||||
| Net expenses | 1,998,827 | 3,897,582 | ||||||
| Net investment loss | (85,141 | ) | (1,106,577 | ) | ||||
| Realized and unrealized gain on investments: | ||||||||
| Net realized gain from investment transactions | 20,112,837 | 40,471,216 | ||||||
| Increase in unrealized appreciation on investments | 7,033,491 | 40,930,084 | ||||||
| Net realized and unrealized gain on investments | 27,146,328 | 81,401,300 | ||||||
| Net increase in net assets resulting from operations | $ | 27,061,187 | $ | 80,294,723 | ||||
See notes to financial statements.
CENTURY FUNDS
21
STATEMENTS OF CHANGES IN NET ASSETS | ||||||||||||||||
Century Shares Trust | Century Small Cap Select Fund | |||||||||||||||
INCREASE (DECREASE) | Year Ended | Year Ended | Year Ended | Year Ended | ||||||||||||
IN NET ASSETS: | October 31, 2010 | October 31, 2009 | October 31, 2010 | October 31, 2009 | ||||||||||||
| Operations: | ||||||||||||||||
| Net investment income/(loss) | $ | (85,141 | ) | $ | 38,240 | $ | (1,106,577 | ) | $ | (602,965 | ) | |||||
| Net realized gain/(loss) on | ||||||||||||||||
| investment transactions | 20,112,837 | (9,196,030 | ) | 40,471,216 | (89,355,285 | ) | ||||||||||
| Change in net unrealized appreciation | 7,033,491 | 21,964,091 | 40,930,084 | 121,153,665 | ||||||||||||
| Net increase/(decrease) in net assets | ||||||||||||||||
| resulting from operations | 27,061,187 | 12,806,301 | 80,294,723 | 31,195,415 | ||||||||||||
| Distributions to shareholders from: | ||||||||||||||||
| Net investment income | ||||||||||||||||
| Institutional Shares | (47,060 | ) | (321,578 | ) | — | — | ||||||||||
| Capital share transactions - net (Note 2) | (15,968,796 | ) | (13,680,291 | ) | (46,355,327 | ) | (88,146,797 | ) | ||||||||
| Redemption fees | 43 | 553 | 4,353 | 10,751 | ||||||||||||
| Total increase/(decrease) | 11,045,374 | (1,195,015 | ) | 33,943,749 | (56,940,631 | ) | ||||||||||
| Net Assets: | ||||||||||||||||
| Beginning of year | 167,625,050 | 168,820,065 | 308,104,218 | 365,044,849 | ||||||||||||
| End of year | $ | 178,670,424 | $ | 167,625,050 | $ | 342,047,967 | $ | 308,104,218 | ||||||||
See notes to financial statements.
CENTURY FUNDS
22
FINANCIAL HIGHLIGHTS | ||||||||||||||||||||
| Century Shares Trust | Year Ended October 31, | |||||||||||||||||||
| Institutional Shares | 2010 | 2009 | 2008 | 2007 | 2006 | |||||||||||||||
| Net Asset Value, beginning of period | $ | 16.84 | $ | 15.51 | $ | 29.52 | $ | 35.69 | $ | 35.40 | ||||||||||
| Income/(loss) from Investment Operations: | ||||||||||||||||||||
Net investment income/(loss)(a) | (0.01 | ) | 0.00 | † | (0.01 | ) | 0.16 | 0.10 | ||||||||||||
| Net realized and unrealized gain/(loss) | ||||||||||||||||||||
| on investments | 2.82 | 1.36 | (7.44 | ) | 2.95 | 3.31 | ||||||||||||||
| Total income/(loss) from investment | ||||||||||||||||||||
| operations | 2.81 | 1.36 | (7.45 | ) | 3.11 | 3.41 | ||||||||||||||
| Less Distributions From: | ||||||||||||||||||||
| Net investment income | (0.00 | )† | (0.03 | ) | (0.30 | ) | (0.43 | ) | (0.77 | ) | ||||||||||
| Net realized gain on investment transactions | (0.00 | ) | (0.00 | ) | (6.26 | ) | (8.85 | ) | (2.35 | ) | ||||||||||
| Total distributions | (0.00 | ) | (0.03 | ) | (6.56 | ) | (9.28 | ) | (3.12 | ) | ||||||||||
| Redemption fees | 0.00 | † | 0.00 | † | 0.00 | † | 0.00 | † | 0.00 | † | ||||||||||
| Net Asset Value, end of period | $ | 19.65 | $ | 16.84 | $ | 15.51 | $ | 29.52 | $ | 35.69 | ||||||||||
| Total Return | 16.72 | % | 8.59 | % | (32.31 | )% | 11.86 | % | 10.17 | % | ||||||||||
| Ratios and supplemental data | ||||||||||||||||||||
| Net assets, end of period (000 omitted) | $ | 177,042 | $ | 166,574 | $ | 168,199 | $ | 287,670 | $ | 305,172 | ||||||||||
| Ratio of expenses to average net assets | 1.15 | % | 1.20 | % | 1.17 | % | 1.10 | % | 1.11 | % | ||||||||||
| Ratio of net investment income/(loss) | ||||||||||||||||||||
| to average net assets | (0.05 | )% | 0.03 | % | (0.02 | )% | 0.56 | % | 0.29 | % | ||||||||||
| Portfolio Turnover Rate | 67 | % | 79 | % | 91 | % | 38 | % | 48 | % | ||||||||||
| (a) | Calculated based on average shares outstanding during the period. |
| † | Amount represents less than $0.005 per share. |
See notes to financial statements.
CENTURY FUNDS
23
FINANCIAL HIGHLIGHTS | ||||||||||||||||||||
| Century Shares Trust | Year Ended October 31, | |||||||||||||||||||
| Investor Shares | 2010 | 2009 | 2008 | 2007 | 2006 | |||||||||||||||
| Net Asset Value, beginning of period | $ | 16.87 | $ | 15.54 | $ | 29.46 | $ | 35.41 | $ | 35.35 | ||||||||||
| Income/(loss) from Investment Operations: | ||||||||||||||||||||
Net investment income/(loss)(a) | (0.06 | ) | (0.03 | ) | (0.06 | ) | 0.01 | (0.19 | ) | |||||||||||
| Net realized and unrealized gain/(loss) | ||||||||||||||||||||
| on investments | 2.82 | 1.36 | (7.47 | ) | 2.96 | 3.27 | ||||||||||||||
| Total income/(loss) from investment operations | 2.76 | 1.33 | (7.53 | ) | 2.97 | 3.08 | ||||||||||||||
| Less Distributions From: | ||||||||||||||||||||
| Net investment income | (0.00 | ) | (0.00 | ) | (0.13 | ) | (0.07 | ) | (0.68 | ) | ||||||||||
| Net realized gain on investment transactions | (0.00 | ) | (0.00 | ) | (6.26 | ) | (8.85 | ) | (2.35 | ) | ||||||||||
| Total distributions | (0.00 | ) | (0.00 | ) | (6.39 | ) | (8.92 | ) | (3.03 | ) | ||||||||||
| Redemption fees | 0.00 | † | 0.00 | † | 0.00 | † | 0.00 | † | 0.01 | |||||||||||
| Net Asset Value, end of period | $ | 19.63 | $ | 16.87 | $ | 15.54 | $ | 29.46 | $ | 35.41 | ||||||||||
| Total Return | 16.36 | % | 8.35 | % | (32.45 | )% | 11.38 | % | 9.18 | % | ||||||||||
| Ratios and supplemental data | ||||||||||||||||||||
| Net assets, end of period (000 omitted) | $ | 1,628 | $ | 1,051 | $ | 621 | $ | 1,006 | $ | 1,844 | ||||||||||
| Ratio of expenses to average net assets | 1.45 | % | 1.45 | % | 1.45 | % | 1.56 | % | 2.00 | % | ||||||||||
| Ratio of expenses to average net assets | ||||||||||||||||||||
| without giving effect to contractual | ||||||||||||||||||||
| expense agreement | 2.11 | % | 2.64 | % | 1.61 | % | 1.95 | % | 2.15 | % | ||||||||||
| Ratio of net investment income/(loss) | ||||||||||||||||||||
| to average net assets | (0.34 | )% | (0.22 | )% | (0.31 | )% | 0.05 | % | (0.58 | )% | ||||||||||
| Portfolio turnover rate | 67 | % | 79 | % | 91 | % | 38 | % | 48 | % | ||||||||||
| (a) | Calculated based on average shares outstanding during the period. |
| † | Amount represents less than $0.005 per share. |
See notes to financial statements.
CENTURY FUNDS
24
FINANCIAL HIGHLIGHTS | |||||||||||||||||||
| Century Small Cap Select Fund | Year Ended October 31, | ||||||||||||||||||
| Institutional Shares | 2010 | 2009 | 2008 | 2007 | 2006 | ||||||||||||||
| Net Asset Value, beginning of period | $ | 16.34 | $ | 14.62 | $ | 26.13 | $ | 25.74 | $ | 24.15 | |||||||||
| Income/(loss) from Investment Operations: | |||||||||||||||||||
Net investment income/(loss)(a) | (0.05 | ) | (0.01 | ) | (0.12 | ) | 0.00 | † | 0.06 | ||||||||||
| Net realized and unrealized gain/(loss) | |||||||||||||||||||
| on investments | 4.70 | 1.73 | (9.00 | ) | 2.75 | 1.90 | |||||||||||||
| Total income/(loss) from investment | |||||||||||||||||||
| operations | 4.65 | 1.72 | (9.12 | ) | 2.75 | 1.96 | |||||||||||||
| Less Distributions From: | |||||||||||||||||||
| Net investment income | (0.00 | ) | (0.00 | ) | (0.10 | ) | (0.35 | ) | (0.09 | ) | |||||||||
| Net realized gain on investment transactions | (0.00 | ) | (0.00 | ) | (2.10 | ) | (2.01 | ) | (0.28 | ) | |||||||||
| Tax return of capital | (0.00 | ) | (0.00 | ) | (0.19 | ) | (0.00 | ) | (0.00 | ) | |||||||||
| Total distributions | (0.00 | ) | (0.00 | ) | (2.39 | ) | (2.36 | ) | (0.37 | ) | |||||||||
| Redemption fees | 0.00 | † | 0.00 | † | 0.00 | † | 0.00 | † | 0.00 | † | |||||||||
| Net Asset Value, end of period | $ | 20.99 | $ | 16.34 | $ | 14.62 | $ | 26.13 | $ | 25.74 | |||||||||
| Total Return | 28.52 | % | 11.69 | % | (38.24 | )% | 11.61 | % | 8.21 | % | |||||||||
| Ratios and supplemental data | |||||||||||||||||||
| Net assets, end of period (000 omitted) | $ | 249,429 | $ | 216,295 | $ | 262,793 | $ | 575,027 | $ | 540,697 | |||||||||
| Ratio of expenses to average net assets | 1.13 | % | 1.14 | % | 1.11 | % | 1.08 | % | 1.07 | % | |||||||||
| Ratio of net investment income/(loss) to | |||||||||||||||||||
| average net assets | (0.25 | )% | (0.08 | )% | (0.57 | )% | 0.02 | % | 0.25 | % | |||||||||
| Portfolio Turnover Rate | 85 | % | 133 | % | 104 | % | 100 | % | 127 | % | |||||||||
| (a) | Calculated based on average shares outstanding during the period. |
| † | Amount represents less than $0.005 per share. |
See notes to financial statements.
CENTURY FUNDS
25
FINANCIAL HIGHLIGHTS | |||||||||||||||||||
| Century Small Cap Select Fund | Year Ended October 31, | ||||||||||||||||||
| Investor Shares | 2010 | 2009 | 2008 | 2007 | 2006 | ||||||||||||||
| Net Asset Value, beginning of period | $ | 16.00 | $ | 14.37 | $ | 25.72 | $ | 25.40 | $ | 23.86 | |||||||||
| Income/(loss) from Investment Operations: | |||||||||||||||||||
Net investment loss(a) | (0.11 | ) | (0.07 | ) | (0.20 | ) | (0.06 | ) | (0.02 | ) | |||||||||
| Net realized and unrealized gain/(loss) | |||||||||||||||||||
| on investments | 4.60 | 1.70 | (8.86 | ) | 2.71 | 1.86 | |||||||||||||
| Total income/(loss) from investment operations | 4.49 | 1.63 | (9.06 | ) | 2.65 | 1.84 | |||||||||||||
| Less Distributions From: | |||||||||||||||||||
| Net investment income | (0.00 | ) | (0.00 | ) | (0.00 | ) | (0.32 | ) | (0.03 | ) | |||||||||
| Net realized gain on investment transactions | (0.00 | ) | (0.00 | ) | (2.10 | ) | (2.01 | ) | (0.28 | ) | |||||||||
| Tax return of capital | (0.00 | ) | (0.00 | ) | (0.19 | ) | (0.00 | ) | (0.00 | ) | |||||||||
| Total distributions | (0.00 | ) | (0.00 | ) | (2.29 | ) | (2.33 | ) | (0.31 | ) | |||||||||
| Redemption fees | 0.00 | † | 0.00 | † | 0.00 | † | 0.00 | † | 0.01 | ||||||||||
| Net Asset Value, end of period | $ | 20.49 | $ | 16.00 | $ | 14.37 | $ | 25.72 | $ | 25.40 | |||||||||
| Total Return | 28.06 | % | 11.27 | % | (38.49 | )% | 11.34 | % | 7.83 | % | |||||||||
| Ratios and supplemental data | |||||||||||||||||||
| Net assets, end of period (000 omitted) | $ | 92,618 | $ | 91,809 | $ | 102,252 | $ | 257,750 | $ | 353,581 | |||||||||
| Ratio of expenses to average net assets | 1.50 | % | 1.53 | % | 1.50 | % | 1.36 | % | 1.45 | % | |||||||||
| Ratio of net investment loss to average net assets | (0.61 | )% | (0.47 | )% | (0.96 | )% | (0.24 | )% | (0.09 | )% | |||||||||
| Portfolio turnover rate | 85 | % | 133 | % | 104 | % | 100 | % | 127 | % | |||||||||
| (a) | Calculated based on average shares outstanding during the period. |
| † | Amount represents less than $0.005 per share. |
See notes to financial statements.
CENTURY FUNDS
26
NOTES TO FINANCIAL STATEMENTS
(1) SIGNIFICANT ACCOUNTING POLICIES –– Century Capital Management Trust (the “Trust”) is registered under the Investment Company Act of 1940 (“1940 Act”), as amended, as an open-end management investment company organized as a Massachusetts business trust. Century Shares Trust and Century Small Cap Select Fund (each a “Fund” and, collectively, the “Funds”) are diversified series of the Trust.The following is a summary of significant accounting policies consistently followed by both Funds in the preparation of their financial statements.The policies are in conformity with accounting principles generally accepted in the United States of America (“generally accepted accounting principles”).
A. Security Valuations –– Equity securities are valued at the last reported sale price or official closing price on the primary exchange or market on which they are traded, as reported by an independent pricing service. If no sale price or official closing price is reported, market value is generally determined based on quotes or closing prices obtained from a quotation reporting system, established market maker, or reputable pricing service. For unlisted securities and for exchange-listed securities for which there are no reported sales or official closing prices, fair value is generally determined using closing bid prices. Short-term obligations, maturing in 60 days or less, are valued at amortized cost, which approximates current fair value. Investments in open-end mut ual funds are valued at their closing net asset value each business day.
Fair value is defined as the price that the Funds would receive to sell an investment in an orderly transaction with an independent buyer in the principal market, or in the absence of a principal market the most advantageous market for the investment or liability. The hierarchy of inputs that are used in determining the fair value of the Funds’ investments is summarized below.
| · | Level 1 – quoted prices in active markets for identical investments |
| · | Level 2 – significant other observable inputs (including quoted prices for similar investments, interest rates, prepayment speeds, credit risk, etc.) |
| · | Level 3 – significant unobservable inputs (including the Fund’s own assumptions in determining the fair value of investments) |
The inputs or methodology used for valuing securities are not necessarily an indication of the risk associated with investing in those securities.
The following is a summary of the inputs used as of October 31, 2010 in valuing the Funds’ investments carried at fair value:
| Quoted Prices | ||||||||||||||||
| In Active | Significant | |||||||||||||||
| Market for | Significant Other | Unobservable | ||||||||||||||
| Identical Assets | Observable Inputs | Inputs | ||||||||||||||
| (Level 1) | (Level 2) | (Level 3) | Total | |||||||||||||
| Century Shares Trust | ||||||||||||||||
| Common Stock* | $ | 171,373,398 | $ | — | $ | — | $ | 171,373,398 | ||||||||
| Money Market Fund | 8,533,903 | — | — | 8,533,903 | ||||||||||||
| Total Investments | $ | 179,907,301 | $ | — | $ | — | $ | 179,907,301 | ||||||||
| Century Small Cap Select Fund | ||||||||||||||||
| Common Stock* | $ | 331,169,951 | $ | — | $ | — | $ | 331,169,951 | ||||||||
| Money Market Fund | 12,729,884 | — | — | 12,729,884 | ||||||||||||
| Total Investments | $ | 343,899,835 | $ | — | $ | — | $ | 343,899,835 | ||||||||
| * | At October 31, 2010 the Funds held investments in common stocks classified as Level 1, with corresponding major categories as shown on each Fund’s Portfolio of Investments. |
CENTURY FUNDS
27
B. Security Transactions –– Security transactions are recorded on a trade date basis. Gain or loss on securities sold is determined by the use of the specific identification method, for both financial reporting and federal income tax purposes. Dividend income is recorded on the ex-dividend date. Payments received from certain investments held by the Funds may be comprised of dividends, capital gains and return of capital.The Funds originally estimate the expected character and classification of such payments.The amounts may subsequently be reclassified upon receipt of information from the issuer.The Funds may invest in equity securities issued or guaranteed by companies organized and based in countries outside of the United States. These securities may be traded on foreig n securities exchanges or in foreign over-the-counter markets. Foreign dividend income is recorded on ex-dividend date or as soon as practicable after the Fund determines the existence of a dividend declaration after exercising reasonable due diligence. Foreign income and capital gain on some foreign securities may be subject to foreign withholding taxes, which are accrued as applicable. Interest income is recorded daily on an accrual basis.
C. Use of Estimates –– The preparation of these financial statements in accordance with generally accepted accounting principles incorporates estimates made by management in determining the reported amounts of assets, liabilities, income and expenses of the Funds. Actual results could differ from those estimates.
D. Risks and Uncertainty — Century Small Cap Select Fund concentrates its investments in certain industries detailed in the Portfolio of Investments, which subjects the Fund to the risks associated with those industries and may result in greater fluctuation in share value than is experienced in more diversified portfolios. In addition, the Fund invests in smaller companies, which generally involves greater risk than investing in larger, more established companies.
Investments in securities issued by non U.S. companies have certain risks not present in domestic issuers.
At any given time, a significant portion of the assets of either Fund may be invested in securities of companies within the same market sector of the economy. Companies within the same sector often face similar issues and, consequently, may react similarly to changes in market conditions. If either Fund has a significant weighting in one or more sectors, it may be subject to more risk and price volatility than other funds.
E. Multiple Classes of Shares –– Each Fund offers two classes of shares, which differ in their respective distribution and service fees. Investment income, realized and unrealized capital gains and losses, the common expenses of the Fund, and certain fund-level expense reductions, if any, are allocated on a pro rata basis to each class based on the relative net assets of each class to the total net assets of the Fund. Certain expense reductions may differ by class. Because transfer agent fees include a per account fee, each class differs with respect to transfer agent fees incurred.
F. Redemption Fees –– In general, shares of each Fund may be redeemed at net asset value. However, upon the redemption of shares held less than 90 days, a redemption fee of 1% of the current net asset value of the shares may be assessed and retained by each share class of each Fund for the benefit of the Fund’s remaining shareholders. The redemption fee is accounted for as an addition to paid-in-capital.
G. Income Tax Information and Distributions to Shareholders –– Each year, each Fund intends to qualify as a regulated investment company by distributing all of its taxable income and sufficient net investment income and net realized gains, if any, under Subchapter M of the Internal Revenue Code. As a result, no provision for income taxes is required in the accompanying financial statements. Foreign taxes are provided for based on each Fund’s understanding of the tax rules and rates that exist in the foreign markets in which it invests. Income dividends and capital gain distributions are declared separately for each class. Distributions are recorded on the ex-dividend date. Income and capital gain distributions are determined in accordance with income tax regulations , which may differ from generally accepted accounting principles. Capital accounts within the financial statements are adjusted for permanent book and tax differences. Generally accepted accounting principles require that any distributions in excess of tax basis earnings and profits be reported in the financial statements as a tax return of capital.
CENTURY FUNDS
28
In order to present undistributed (distributions in excess of) net investment income (“UNII”) and accumulated net realized gain/loss (“Accumulated Gain/Loss”) more closely to its tax character, the following accounts for each Fund were increased (decreased):
| Paid-In | Accumulated | |||||||||||
| Capital | UNII | Gain/Loss | ||||||||||
| Century Shares Trust | $ | (132,251 | ) | $ | 132,201 | $ | 50 | |||||
| Century Small Cap Select Fund | $ | (1,658,120 | ) | $ | 1,106,577 | $ | 551,543 | |||||
These reclassifications have no impact on net assets or the results of operations. The Funds had temporary book/tax differences primarily attributable to wash sales or portfolio securities and permanent book/tax differences primarily attributable to net operating losses, distributions in excess of current earnings and litigation adjustment. Temporary differences will reverse in a subsequent period.
The federal income tax cost of investments and tax-basis components of distributable earnings as of October 31, 2010 were as follows:
| Century Shares Trust | ||||
| Gross unrealized appreciation | $ | 40,948,345 | ||
| Gross unrealized depreciation | (701,758 | ) | ||
| Unrealized net appreciation | $ | 40,246,587 | ||
| Cost for federal income tax purposes | $ | 139,660,714 | ||
| Undistributed Capital Gains | $ | 7,961,817 | ||
| Unrealized Appreciation | 40,246,587 | |||
| Total | $ | 48,208,404 | ||
The differences between the components of distributable earnings on a tax basis and the amounts reflected in the Statement of Assets and Liabilities are primarily due to wash sales.
During the year ended October 31, 2010, the Fund utilized a net capital loss carryforward of $12,151,070.
| The tax character of distributions paid were as follows: | ||
| Year Ended October 31, | ||
| 2010 | 2009 | |
| Ordinary Income | ||
| Institutional shares | $ 47,060 | $ 321,578 |
The federal income tax cost of investments and tax-basis components of distributable earnings and as of October 31, 2010 were as follows:
| Century Small Cap Select Fund | ||||
| Gross unrealized appreciation | $ | 83,991,891 | ||
| Gross unrealized depreciation | (3,387,684 | ) | ||
| Unrealized net appreciation | $ | 80,604,207 | ||
| Cost for federal income tax purposes | $ | 263,295,628 | ||
| Capital Loss Carryforward | $ | (156,836,078 | ) | |
| Unrealized Appreciation | 80,604,207 | |||
| Total | $ | (76,231,871 | ) | |
CENTURY FUNDS
29
The differences between the components of distributable earnings on a tax basis and the amounts reflected in the Statement of Assets and Liabilities are primarily due to wash sales.
As of October 31, 2010, the Fund had a capital loss carryforward of $156,836,078, of which $67,067,526 will expire on October 31, 2016 and $89,768,552 which will expire on October 31, 2017.This carryforward may be used to offset future capital gains to the extent provided by regulations.
During the year ended October 31, 2010, the Fund utilized a net capital loss carryforward of $39,712,319.
The Fund did not pay any distributions for the years ended October 31, 2010 and 2009.
As of October 31, 2010, the Funds had no uncertain tax positions that would require financial statement recognition or disclosure. The Funds’ federal tax returns filed for the fiscal years ended October 31, 2007, October 31, 2008 and October 31, 2009 remain subject to examination by the Internal Revenue Service.
(2) TRANSACTIONS IN SHARES
Century Shares Trust –– The number of authorized shares is unlimited. Transactions in each class of shares were as follows:
| Year Ended October 31, 2010 | |||||||||||||||
| Institutional Shares | Investor Shares | ||||||||||||||
| Shares | Amount | Shares | Amount | ||||||||||||
| Sold | 173,736 | $ | 3,164,426 | 34,109 | $ | 654,481 | |||||||||
| Issued to shareholders in reinvestment of distributions from: | |||||||||||||||
| Net investment income | 2,175 | 39,358 | — | — | |||||||||||
| 175,911 | 3,203,784 | 34,109 | 654,481 | ||||||||||||
| Repurchased | (1,062,442 | ) | (19,576,908 | ) | (13,509 | ) | (250,153 | ) | |||||||
| Net increase (decrease) | (886,531 | ) | $ | (16,373,124 | ) | 20,600 | $ | 404,328 | |||||||
| Year Ended October 31, 2009 | |||||||||||||||
| Institutional Shares | Investor Shares | ||||||||||||||
| Shares | Amount | Shares | Amount | ||||||||||||
| Sold | 139,209 | $ | 2,019,011 | 49,061 | $ | 712,476 | |||||||||
| Issued to shareholders in reinvestment of distributions from: | |||||||||||||||
| Net investment income | 18,364 | 266,814 | — | — | |||||||||||
| 157,573 | 2,285,825 | 49,061 | 712,476 | ||||||||||||
| Repurchased | (1,105,452 | ) | (16,290,154 | ) | (26,716 | ) | (388,438 | ) | |||||||
| Net increase (decrease) | (947,879 | ) | $ | (14,004,329 | ) | 22,345 | $ | 324,038 | |||||||
Century Small Cap Select –– The number of authorized shares is unlimited. Transactions in each class of shares were as follows:
| Year Ended October 31, 2010 | |||||||||||||||
| Institutional Shares | Investor Shares | ||||||||||||||
| Shares | Amount | Shares | Amount | ||||||||||||
| Sold | 2,490,612 | $ | 44,991,279 | 524,604 | $ | 9,706,292 | |||||||||
| Repurchased | (3,847,595 | ) | (69,892,481 | ) | (1,740,681 | ) | (31,160,417 | ) | |||||||
| Net decrease | (1,356,983 | ) | $ | (24,901,202 | ) | (1,216,077 | ) | $ | (21,454,125 | ) | |||||
CENTURY FUNDS
30
| Year Ended October 31, 2009 | |||||||||||||||
| Institutional Shares | Investor Shares | ||||||||||||||
| Shares | Amount | Shares | Amount | ||||||||||||
| Sold | 4,979,230 | $ | 66,831,146 | 938,066 | $ | 12,686,105 | |||||||||
| Repurchased | (9,720,611 | ) | (135,453,439 | ) | (2,315,783 | ) | (32,210,609 | ) | |||||||
| Net decrease | (4,741,381 | ) | $ | (68,622,293 | ) | (1,377,717 | ) | $ | (19,524,504 | ) | |||||
(3) INVESTMENT SECURITIES TRANSACTIONS
Century Shares Trust purchases and sales of investment securities (excluding short-term securities and U.S. Government obligations) aggregated $112,840,625 and $131,499,516, respectively, during the year ended October 31, 2010.
Century Small Cap Select Fund purchases and sales of investment securities (excluding short-term securities and U.S. Government obligations) aggregated $261,925,016 and $316,227,392, respectively, during the year ended October 31, 2010.
(4) INVESTMENT ADVISER FEE
Century Shares Trust: The Trust has entered into an Investment Advisory Agreement (the “Agreement”) with Century Capital Management, LLC (“CCM”) pursuant to which CCM provides an investment program for Century Shares Trust. Under the Agreement, the Fund pays a management fee based on the Fund’s average daily net assets computed at the following annual rates: 0.80% of the first $500 million and 0.70% of the amounts exceeding $500 million.
Century Small Cap Select Fund: The Trust has entered into an Investment Advisory and Management Services Agreement (the “Agreement”) with CCM pursuant to which CCM provides investment advisory, management and administrative services to Century Small Cap Select Fund. Under the Agreement, the Fund pays a monthly management fee at the annual rate of 0.95% of the Fund’s average daily net assets.
(5) ADMINISTRATION FEES
Century Shares Trust: The Trust has entered into an Administration Agreement with CCM pursuant to which CCM provides certain administrative services to Century Shares Trust at the annual rate of 0.10% of the Fund’s average daily net assets.
Century Small Cap Select Fund: Per the Investment Advisory and Management Services Agreement between the Trust and CCM, Century Small Cap Select Fund reimburses CCM for expenses associated with having the adviser’s personnel perform shareholder service functions and certain financial, accounting, administrative and clerical services.
CCM has entered into a Sub-Administration Agreement with State Street Bank and Trust Company (“State Street”) pursuant to which State Street provides certain administrative services to each Fund on behalf of CCM. CCM pays State Street a sub-administration fee for sub-administration services provided to each Fund.
(6) DISTRIBUTION AND SERVICE FEES –– The Trust has adopted Distribution and Service Plans (the “Plans”) pursuant to Rule 12b-1 under the 1940 Act on behalf of Century Shares Trust and Century Small Cap Select Fund. The Plans authorize each Fund to pay up to 0.25% of the average daily net assets of the Funds’ Investor Shares class for distribution and shareholder services. The Plans may be terminated at any time by the vote of a majority of the independent Trustees or by the vote of the holders of a majority of the outstanding shares of the Investor Shares.
The Trust has entered into agreements with financial intermediaries to provide recordkeeping, processing, shareholder communications and other services to customers of the intermediaries and have agreed to compensate the intermediaries for providing such services. Certain services would be provided by the Funds if the shares of each customer were registered directly with the Funds’ transfer agent. Each Fund pays a portion of the intermediary fees attributable to shares of the Fund not exceeding the estimated expense the Fund would have paid its transfer agent had each customer’s shares been registered directly with the transfer agent instead of held through the intermediary accounts.
CENTURY FUNDS
31
(7) ADVISER REIMBURSEMENTS — CCM contractually agreed to waive a portion of its management fee and reimburse or pay operating expenses of Century Shares Trust Investor Shares to the extent necessary to maintain the total operating expenses of the Investor Shares at 1.45% through February 28, 2011.
During the year ended October 31, 2010, CCM reimbursed Century Shares Trust and Century Small Cap Select Fund $2,445 and $5,781, respectively, for distribution fees paid by the Funds in their short-term money market fund investments.These amounts reduced the investment advisory fee expense shown on the Statement of Operations.
CCM may, out of its own resources and without additional cost to the Funds or their shareholders, provide compensation to certain financial intermediaries, such as broker-dealers and financial advisors, in connection with the sale of shares of the Funds or the provision of services to Fund shareholders. For example, such compensation may be paid to an intermediary for providing access to a third party platform, such as a mutual fund supermarket, or for providing services to shareholders who invest via such a platform.This compensation is in addition to any distribution and service fees paid by the Funds pursuant to a Rule 12b-1 Plan and in addition to sub-transfer agency fees paid by the Funds.
(8) SUBSEQUENT EVENTS — In preparing the financial statements as of October 31, 2010, management considered the impact of subsequent events for potential recognition or disclosure in these financial statements.
CENTURY FUNDS
32
REPORT OF INDEPENDENT REGISTERED PUBLIC ACCOUNTING FIRM
To the Trustees of Century Capital Management Trust and Shareholders of Century Shares Trust and Century Small Cap Select Fund:
We have audited the accompanying statements of assets and liabilities, including the portfolios of investments, of Century Shares Trust and Century Small Cap Select Fund (the “Funds”), each a series of Century Capital Management Trust (the “Trust”), as of October 31, 2010, and the related statements of operations for the year then ended, the statements of changes in net assets for each of the two years in the period then ended, and the financial highlights for each of the five years in the period then ended. These financial statements and financial highlights are the responsibility of the Trust’s management. Our responsibility is to express an opinion on these financial statements and financial highlights based on our audits.
We conducted our audits in accordance with the standards of the Public Company Accounting Oversight Board (United States). Those standards require that we plan and perform the audit to obtain reasonable assurance about whether the financial statements and financial highlights are free of material misstatement. The Trust is not required to have, nor were we engaged to perform, an audit of its internal control over financial reporting. Our audits included consideration of internal control over financial reporting as a basis for designing audit procedures that are appropriate in the circumstances, but not for the purpose of expressing an opinion on the effectiveness of the Fund's internal control over financial reporting. Accordingly, we express no such opinion. An audit also includes examining, on a test basis, evidence supporting the amoun ts and disclosures in the financial statements, assessing the accounting principles used and significant estimates made by management, as well as evaluating the overall financial statement presentation. Our procedures included confirmation of securities owned as of October 31, 2010, by correspondence with the custodian and brokers; where replies were not received from brokers, we performed other auditing procedures. We believe that our audits provide a reasonable basis for our opinion.
In our opinion, the financial statements and financial highlights referred to above present fairly, in all material respects, the financial position of Century Shares Trust and Century Small Cap Select Fund as of October 31, 2010, the results of their operations for the year then ended, the changes in their net assets for each of the two years in the period then ended, and the financial highlights for each of the five years in the period then ended, in conformity with accounting principles generally accepted in the United States of America.
DELOITTE & TOUCHE LLP
Boston, Massachusetts
December 17, 2010
CENTURY FUNDS
33
TAX INFORMATION
(Unaudited)
The following information represents the tax status of dividends and distributions paid by the Funds during the fiscal year ended October 31, 2010. This information is presented to meet regulatory requirements and no current action on your part is required.
Century Shares Trust
For Federal Income Tax purposes, the Fund designates $47,060, or the maximum amount allowable as qualified dividend income for purposes of Internal Revenue Code Section 1(h)(11).
Please consult a tax advisor if you have questions about federal or state income tax laws, or on how to prepare your tax returns.
CENTURY FUNDS
34
MANAGEMENT OF THE FUNDS
The following table provides certain information regarding the Trustees and officers of Century Shares Trust and Century Small Cap Select Fund as of October 31, 2010. Unless otherwise noted, (i) each Trustee and officer has engaged in the principal occupation(s) noted in the table for at least the most recent five years, although not necessarily in the same capacity, and (ii) the address of each Trustee and officer is c/o Century Capital Management, 100 Federal Street, 29th Floor, Boston, Massachusetts 02110. Each Trustee’s term of office continues until the Trustee retires, resigns or is removed in accordance with the Declaration of Trust or until the next shareholders’ meeting called for the purpose of electing Trustees and until the election and qualification of a successor.
| Name, Age, Position(s) | No. of | |
| held with Trust and | Principal Occupation During Past 5 Years | Portfolios |
| Length of Time Served | and Other Directorships Held | in Fund |
| Overseen | ||
William Gray (58) | Senior Advisor, The Blackstone Group (private equity firm); Special | 2 |
| Trustee, 2006 to present | Advisor, Chi & Partners (advertising firm); Vice Chairman, Ogilvy & | |
| Mather Group, NA (Retired 2009). Other Directorships: Harleysville | ||
| Group, Inc.; American Red Cross of Greater New York, (Chairman 2002- | ||
| 2008, Member since 1999); The New York Public Library; The National | ||
| Advertising Review Board; Wakeman Boys Club. | ||
Laura A. Johnson (56) | President, Massachusetts Audubon Society. Other directorships: | 2 |
| Trustee, 2007 to present | Corporation Member,Woods Hole Oceanographic Institute (2003 to pres- | |
| ent); Stewardship Council, Massachusetts Department of Conservation | ||
| and Recreation (2004 to present). | ||
Stephen W. Kidder (57) | Managing Partner, Hemenway & Barnes (law firm). Other Directorships: | 2 |
| Trustee, 2005 to present | Trustee, Wellesley College; Trustee, Isabella Stewart Gardner Museum; | |
| Trustee, Children’s Hospital Trust; Trustee and Secretary, Massachusetts | ||
| Biomedical Research Corporation; Director, The Concord Bookshop, Inc. | ||
Jerrold Mitchell (71) | Independent investment advisor; Partner, Saltonstall & Co. (family invest- | 2 |
| Trustee, 2004 to present | ment office) (2007 to present). Formerly, Chief Investment Officer, The | |
| Boston Foundation (2005 to 2007); Chief Investment Officer, | ||
| Massachusetts Pension Reserves Investment Management Board (2001 to | ||
| 2004). Other Directorships: Trustee, Boston Athenaeum; Trustee, Yale | ||
| Library Associates; Trustee,Trustees of Donations; Commissioner of Trust | ||
| Funds, Town of Wayland. | ||
Jerry S. Rosenbloom (71) | Frederick H. Ecker Emeritus Professor of Insurance and Risk Management | 2 |
| Trustee, 1998 to present | and Academic Director, Certified Employee Benefit Specialist Program, | |
| Wharton School, University of Pennsylvania. Other Directorships: | ||
| Harleysville Group, Inc.; American Institute for Chartered Property | ||
| Casualty Underwriters; S.S. Huebner Foundation for Insurance Education; | ||
| MBIA Claymore Managed Municipal Bond Fund (through June 2006). | ||
CENTURY FUNDS
35
| Name, Age, Position(s) | No. of | |
| held with Trust and | Principal Occupation During Past 5 Years | Portfolios |
| Length of Time Served | and Other Directorships Held | in Fund |
| Complex | ||
David D.Tripple (66) | Private investor. Formerly, Chief Executive Officer and Trustee, Pioneer | 2 |
| Trustee, 2004 to present | Funds (2000 to 2001); Executive Vice President and Director,The Pioneer | |
| Group, Inc. (asset management) (1998 to 2000). Other Directorships: | ||
| The Calamos Funds (overseeing 19 portfolios in fund complex). | ||
Ellen M. Zane (59) | President and Chief Executive Officer, Tufts Medical Center and Floating | 2 |
| Trustee, 2007 to present | Hospital for Children. Formerly, Network President, Partners Healthcare | |
| System (1994 to 2004). Other directorships: Parexel International | ||
| Corporation; Lincare Holdings Inc.; Fiduciary Trust Company; Harvard | ||
| School of Public Health, Health Policy & Management Executive | ||
| Council; Trustee, George Washington University; Board of Overseers, | ||
| Tufts University School of Medicine; Massachusetts Hospital Association; | ||
| Sisters of Mercy Health System – St. Louis. | ||
Interested Trustees and Officers1 | ||
Alexander L.Thorndike (44) | Managing Partner, Century Capital Management, LLC. No other direc- | 2 |
| Trustee, 1999 to present; | torships held. | |
| Chairman and Chief Executive | ||
| Officer, 2004 to present | ||
Davis R. Fulkerson (45) | Managing Partner, Century Capital Management, LLC. No other direc- | 2 |
| Trustee, 2000 to present | torships held. | |
Julie A. Smith (39) | Chief Financial Officer, Century Capital Management, LLC (May 2008 to | N/A |
| Chief Financial Officer, | present); prior thereto, Controller, Third Avenue Management LLC (1997 | |
| June 2008 to present | to 2006). | |
Maureen E. Kane (48) | General Counsel, Century Capital Management, LLC. | N/A |
| Chief Legal Officer, 2006 to | ||
| present; Secretary, 2007 to present; | ||
| Chief Compliance Officer, | ||
| 2009 to present | ||
| (1) | Each person listed is considered an “interested person” of the Trust within the meaning of the 1940 Act by virtue of being an officer or employee of the Adviser. |
CENTURY FUNDS
36
The Funds’ Statement of Additional Information (“SAI”) includes additional information about the Trustees. The SAI is available, without charge, upon request. If you would like to request a copy of the SAI, you may do so by calling the following toll-free number: 1-800-321-1928.
Availability of Quarterly Portfolio Schedules. Each fund files a complete schedule of its portfolio holdings with the SEC for the first and third quarters of the fund’s fiscal year on Form N-Q. The Forms N-Q are available on the SEC’s website at http://www.sec.gov, and they may be reviewed and copied at the SEC’s Public Reference Room in Washington, DC. Information on the operation of the SEC’s Public Reference Room may be obtained by calling 1-800-SEC-0330.
Availability of Proxy Voting Policies and Procedures and Proxy Voting Record. A description of the policies and procedures that each Fund uses to determine how to vote proxies relating to portfolio securities and each fund’s proxy voting record for the 12-month period ended June 30 are available, without charge, upon request, by calling 1-800-321-1928. You may also obtain a copy of the Funds’ proxy voting policies and procedures and proxy voting record on the SEC’s website at http://www.sec.gov.
CENTURY FUNDS
37
| FUND INFORMATION | |
INVESTMENT ADVISER Century Capital Management, LLC 100 Federal Street Boston, Massachusetts 02110 | SHAREHOLDER INFORMATION 1-800-303-1928 |
REGULAR MAILING ADDRESS Century Funds PO Box 588 Portland, ME 04112 | OVERNIGHT MAILING ADDRESS Century Funds c/o Atlantic Shareholder Services, LLC 3 Canal Plaza, Ground Floor Portland, ME 04101 |
DISTRIBUTOR Foreside Fund Services, LLC Three Canal Plaza, Suite 100 Portland, ME 04101 www.foreside.com | INDEPENDENT REGISTERED PUBLIC ACCOUNTING FIRM Deloitte & Touche LLP 200 Berkeley Street Boston, MA 02116 |


Item 2. Code of Ethics.
As of the end of the period covered by this report, Century Capital Management Trust has adopted a code of ethics, as defined in Item 2 of Form N-CSR, that applies to its Principal Executive Officer, Principal Financial Officer and Principal Accounting Officer.
During the period covered by this report, there were no amendments to, or waivers from, any provision of the code of ethics.
A copy of the code of ethics is filed as an exhibit hereto.
Item 3. Audit Committee Financial Expert.
The Board of Trustees has determined that Jerry Rosenbloom, who is a member of the Century Capital Management Trust Board of Trustees and Audit Committee, qualifies as an audit committee financial expert. Mr. Rosenbloom is an independent trustee, as defined in paragraph (a)(2) of this item's instructions. Mr. Rosenbloom received his B.S. degree in Business Administration from Temple University and his M.A. and Ph.D. degrees in Applied Economics, with a concentration in insurance, from the University of Pennsylvania. He is currently the Frederick H. Ecker Emeritus Professor of Insurance and Risk Management at the Wharton School. He was the past Chairman of the Insurance and Risk Management Department at Wharton and the past Executive Director of the S.S. Huebner F oundation for Insurance Education. He has served on the Boards of Directors of mutual funds and insurance companies, including in the capacity of audit committee member, and he has served as a consultant to numerous companies, funds and associations. In connection with his directorships and audit committee memberships, as well as his academic and teaching activities and his consulting activities for public and private companies, Mr. Rosenbloom has evaluated financial statements containing a breadth and level of complexity of accounting issues comparable to those that may arise in the financial statements of the Funds, and he has developed an understanding of internal controls and procedures for financial reporting, as well as audit committee functions. The SEC has stated that the designation or identification of a person as an audit committee financial expert pursuant to this Item 3 of Form N-CSR does not impose on such person any duties, obligations or liability that are greater than the duties, obli gations and liability imposed on such person as a member of the Audit Committee and the Board of Trustees in the absence of such designation or identification.
Item 4. Principal Accountant Fees and Services.
| (a) | Audit Fees. The aggregate fees billed to the Trust for each of the last two fiscal years for professional services rendered by the principal accountant for the audit of the financial statements of Century Capital Management Trust (the "Trust") or services that are normally provided by the accountant in connection with statutory and regulatory filings or engagements for these fiscal years were as follows: |
| FYE | Audit Fees |
| 10/31/10 | $77,000 |
| 10/31/09 | $77,000 |
| (b) | Audit-Related Fees. For each of the last two fiscal years, there were no fees billed to the Trust for assurance and related services by the principal accountant that are reasonably related to the performance of the audit of the Trust's financial statements and are not reported under Audit Fees. For each of the last two fiscal years of the Trust, there were no audit-related fees billed by the Fund's principal accountant to the Trust's investment adviser and any entity controlling, controlled by, or under common control with the adviser that provides ongoing services to the Fund (together, "Adviser Related Entities") for services that were related directly to the operations and financial reporting of the Trust. |
| (c) | Tax Fees. The aggregate fees billed to the Trust for each of the last two fiscal years for professional services provided by the Trust's principal accountant for tax compliance, tax advice and tax planning were as follows: |
| FYE | Tax Fees |
| 10/31/10 | $ 9,000 |
| 10/31/09 | $10,800 |
For the last two fiscal years of the Trust, there were no tax fees billed by the Fund's principal accountant to Adviser Related Entities for services that were related directly to the operations and financial reporting of the Trust.
| (d) | All Other Fees. All Other Fees are fees related to services other than those reported above under "Audit Fees," "Audit-Related Fees," and "Tax Fees." For each of the Trust's last two fiscal years, no such fees were billed by the Trust's principal accountant to the Trust or to Adviser Related Entities for services related directly to the operations and financial reporting of the Trust. |
(e)(1) The Audit Committee's pre-approval policies and procedures are as follows:
The Charter of the Audit Committee of the Board requires that the Committee approve (a) all audit and permissible non-audit services to be provided to the Funds and (b) all permissible non-audit services to be provided by the Funds' independent auditors to the Funds' investment adviser or any entity controlling, controlled by, or under common control with the investment adviser that provides ongoing services to the Funds, if the engagement relates directly to the operations and financial reporting of the Funds.
(2) No services described in each of paragraphs (b) through (d) of this Item were approved by the Audit Committee pursuant to paragraph (c)(7)(i)(C) of Rule 2-01 of Regulation S-X.
| (f) | Not applicable |
| (g) | The aggregate non-audit fees billed by the Trust's accountant, for the Trust's last two fiscal years, for services rendered to the Trust and Adviser Related Entities are shown in the table below: |
| Non-Audit Fees | |||
| Non-Audit Fees | for Adviser | Aggregate | |
| for Trust | Related Entities | Non-Audit Fees | |
| FYE | |||
| October 31, 2010 | None | None | None |
| October 31, 2009 | None | None | None |
| (h) | The Audit Committee of the Board of Trustees has considered whether the provision of services other than audit services performed by the auditors to the Registrant is compatible with maintaining the auditors' independence in performing audit services. |
Item 5. Audit Committee of Listed Registrants.
Not applicable.
Item 6. Schedule of Investments.
Schedule of Investments is included as part of the report to shareholders filed under Item 1 of this Form.
Item 7. Disclosure of Proxy Voting Policies and Procedures for Closed-End Management Investment Companies.
Not applicable.
Item 8. Portfolio Managers of Closed-End Management Investment Companies.
Not applicable.
Item 9. Purchases of Equity Securities by Closed-End Management Investment Company and Affiliated Purchases.
Not applicable.
Item 10. Submission of Matters to a Vote of Security Holders.
There have been no material changes to the procedures by which shareholders may recommend nominees to the Trust's Board of Trustees since the Trust last provided disclosure as to such procedures in response to the requirements of Item 407(c)(2)(iv) of Regulation S-K (as required by Item 22(b)(15) of Schedule 14A), or this Item.
Item 11. Controls and Procedures.
| (a) | The registrant's principal executive officer and principal financial officer, after evaluating the effectiveness of the registrant's "disclosure controls and procedures" (as defined in the Investment Company Act of 1940 Rule 30-a-2(c) under the Act (17 CFR 270.30a-2(c))) as of a date (the "Evaluation Date") within 90 days of the filing date of this report, have concluded that, as of the Evaluation Date, the registrant's disclosure controls and procedures were adequately designed to ensure that the information required to be disclosed by the registrant in this Form N-CSR is recorded, processed, summarized and reported within the time periods specified in the Commission's rules and forms. |
| (b) | There were no changes in the registrant's internal control over financial reporting (as defined in Rule 30a-3(d) under the Act (17 CFR 270.30a-3(d))) that occurred during the registrant's second fiscal quarter of the period covered by this report that has materially affected, or is reasonably likely to materially affect, the registrant's internal control over financial reporting. |
Items 12. Exhibits.
(a)(1) Registrant's Code of Ethics required to be disclosed under Item 2 hereof is filed and attached hereto as Exhibit 99.CODE ETH.
(a)(2) Certification pursuant to Rule 30a-2(a) under the Investment Company Act of 1940 (17 CFR 270.30a-2(a)) is filed and attached hereto as Exhibit 99.302CERT.
(b) Certification pursuant to Rule 30a-2(b) under the Investment Company Act of 1940 (17 CFR 270.30a-2(b)) is filed and attached hereto as Exhibit 99.906CERT
SIGNATURES
Pursuant to the requirements of the Securities Exchange Act of 1934 and the Investment Company Act of 1940, the registrant has duly caused this report to be signed on its behalf by the undersigned, thereunto duly authorized.
Century Capital Management Trust
By: /s/ Alexander L. Thorndike
Alexander L. Thorndike, Chairman
Date: January 7, 2011
Pursuant to the requirements of the Securities Exchange Act of 1934 and the Investment Company Act of 1940, this report has been signed below by the following persons on behalf of the registrant and in the capacities and on the dates indicated.
By: /s/ Alexander L. Thorndike
Alexander L. Thorndike, Principal Executive Officer
Date: January 7, 2011
By: /s/ Julie Smith
Julie Smith, Principal Financial Officer
Date: January 7, 2011