UNITED STATES
SECURITIES AND EXCHANGE COMMISSION
Washington, D.C. 20549
FORM N-CSR
CERTIFIED SHAREHOLDER REPORT OF REGISTERED
MANAGEMENT INVESTMENT COMPANIES
Investment Company Act File Number: 811-09561
Century Capital Management Trust
(Exact name of registrant as specified in charter)
c/o Century Capital Management, LLC
100 Federal Street, Boston, Massachusetts 02110
(Address of principal executive offices) (Zip code)
Maureen Kane
Century Capital Management, LLC
100 Federal Street, Boston, Massachusetts 02110
(Name and address of agent for service)
Registrant's telephone number, including area code: (617) 482-3060
Date of fiscal year end: October 31
Date of reporting period: October 31, 2011
Item 1. Reports to Shareholders.
TABLE OF CONTENTS | |
Page | |
Letter to Shareholders | 1 |
Fund Summaries | |
Century Small Cap Select Fund | 3 |
Century Shares Trust | 6 |
Century Growth Opportunities Fund | 9 |
Portfolio of Investments and Financial Statements | |
Century Small Cap Select Fund | 12 |
Century Shares Trust | 20 |
Century Growth Opportunities Fund | 26 |
Notes to the Financial Statements | 32 |
Report of Independent Registered Public Accounting Firm | 39 |
Shareholder Expense Example | 40 |
Tax Information | 42 |
Trustees and Officers | 43 |
This report is submitted for the general information of the shareholders of Century Small Cap Select Fund, Century Shares Trust, and Century Growth Opportunities Fund (each a “Fund” and collectively, the “Funds”). It is not authorized for distribution to prospective investors in a Fund unless it is preceded by or accompanied by the Fund’s current prospectus. The prospectus includes important information about the Fund’s objective, risks, charges and expenses, experience of its management, and other information. Please read the prospectus carefully before you invest.
The views expressed in this report are those of the Funds’ Portfolio Managers as of October 31, 2011, the end of the reporting period. Any such views are subject to change at any time and may not reflect the Portfolio Managers’ views on the date that this report is first published or anytime thereafter. These views are intended to assist shareholders in understanding their investments and do not constitute investment advice. There is no assurance that the Funds will continue to invest in the securities mentioned in this report.
CENTURY FUNDS
DEAR FELLOW SHAREHOLDERS,
We would like to thank you for your continued support of our three Century Funds. During the tumultuous one-year fiscal period ended October 31, 2011, Century Small Cap Select Fund outperformed its benchmark index, Century Shares Trust slightly underperformed its benchmark index, and Century Growth Opportunities Fund (launched in November 2010) underperformed its benchmark. We review each Fund’s performance, positioning and outlook following this letter. In general, we are hopeful that the outlook for stock valuations and growth prospects look favorable over the next decade, especially if our political leadership firmly addresses the structural issues facing Americans and Europeans today.
The third quarter earnings season (just completed) reveals that most companies continued to deliver robust double digit revenue and earnings growth, despite the economic sluggishness we saw in unemployment, lending and overseas markets. Although we believe the 2012 outlook for many companies remains favorable, the growth and margin expectations may need to come down, especially if global market concerns are not resolved.
Shifting Priorities
We are at an important fiscal and political crossroads, where Western society needs to determine what role government and economic growth will play over the next fifty years. The potential default of several southern European countries (followed by questions about the survival of the “Euro” currency) led to the recent turmoil in the equity markets.
There are no easy solutions, and the resulting difficult lifestyle and austerity choices will require inspired (and bipartisan) leadership on both sides of the Atlantic Ocean. I mention this need for courageous choices because the escalating European debt crisis already claimed the Greek and Italian Prime Ministers, and more victims will follow. Meanwhile, America’s 2012 election rhetoric is heating up, and the Congressional Supercommittee’s failure to find common ground on taxes and spending leaves many important questions unanswered about the size and scope of our government.
There is a growing consensus that Americans and Europeans need to structurally change their governments’ role in providing social services, considering the growing debt and deficit problems plaguing the Western world. Why? The price (and growing debt) of these services is crowding out other worthy “discretionary” spending priorities. The most basic questions we must face: Do we want a larger/smaller role for government in our society, how will we pay for these services and can we live within a budget?
“It has been said that democracy is the worst form of government except for all the others that have been tried.” – Sir Winston Churchill
Democracy may be the best form of government, but it often defers the toughest decisions (wars and debt/spending troubles) until there is a crisis of confidence in the short term. I am optimistic that we will work through this current challenge, and the equity markets will respond favorably over the next decade. It will require difficult choices and sacrifices by all parties, but there is too much to gain from success, and failure is not an option.
CENTURY FUNDS
1
Uncharted Territory
The battle lines are forming in the developed economies, but it will take over a decade to resolve these structural problems that have been building for forty years. We all want the support services that are available, but we are struggling to pay for them. The laws of Supply and Demand require us to collectively prioritize our needs and define a spending limit.
Today, there is no consensus about the boundaries of the private and public sectors. Are Americans prepared to leave important programs on the editing room floor, or will we agree which taxpayers should pay more? In Europe, the problems are more complex, since each country has a distinct tax and spending “fiscal” policy and culture, while all countries share a common Euro currency and “monetary” policy. Will countries secede from the Euro community, or will a consensus emerge (with painful austerity sacrifices from all sides) to maintain the current system? With so much to lose, I believe that finding common ground across such a wide group of nations and issues may set the stage for a prolonged period of global prosperity.
Leadership requires the courage to sacrifice easy, short-term options in order to achieve tougher, long-term goals; meanwhile, our elected officials are mostly influenced by short-term goals. I think this disconnect between good governance and popularity helps explain why tough decisions have been deferred for so long and why the equity markets do not have confidence in future policies or priorities. If courage can overcome this leadership lethargy, it will invigorate economic growth and productivity gains for nimble businesses to hire, borrow and innovate our way to a stronger economic recovery.
Courage starts with demanding our leaders to 1) think beyond the next couple elections and 2) be pragmatic about the short-term tradeoffs necessary to achieve long-term success. In all likelihood, we will each make painful sacrifices for the greater good, but the resulting opportunity will far exceed our expectations. In full disclosure, I am an optimist.
We hope to earn your trust over the coming year, and we wish you all a happy holiday season.
Respectfully Submitted,

Alexander L. Thorndike
Chairman of the Century Funds
CENTURY FUNDS
2
CENTURY SMALL CAP SELECT FUND COMMENTARY
How did the portfolio perform?
For the one-year period ended October 31, 2011, Century Small Cap Select Fund Institutional Shares returned 13.86% and the Investor Shares returned 13.47%, outperforming the Russell 2000 Growth Index’s return of 9.84%.
What factors influenced performance?
Strong performance by small cap stocks, which outperformed large cap stocks by over 6% during the first half of fiscal 2011, was a primary factor influencing performance. The improving economy was the underlying reason for the stock market’s strength. The Russell 2000 Growth Index appreciated steadily from October 31, 2010, through April 30, 2011, rising a noteworthy 27%. Unfortunately, macroeconomic concerns in the Middle East, Europe, and China weighed heavily on small cap stocks during the second half of fiscal 2011, with the Russell 2000 Growth Index falling about 13.6%.
Strong stock selection was the driver of the Fund’s outperformance relative to its benchmark. Significant contributions from HealthSpring Inc. (managed care organization), Jazz Pharmaceuticals, Inc. (specialty pharmaceuticals), Chart Industries, Inc. (industrial equipment), and DSW, Inc. (footwear retailer) more than offset relative weakness from STR Holdings, Inc. (solar power component producer), Online Resources Corp. (financial processor), NPS Pharmaceuticals, Inc. (biopharmaceuticals), and Schnitzer Steel Industries, Inc. (metal recycler).
Stock selection led the Fund to outperform in six of the eight benchmark sectors in which it was invested. Leading contributors to overall Fund performance included the Industrials, Health Care, and Consumer Discretionary sectors. Energy, Consumer Staples, and Financials were laggards overall.
Describe recent portfolio activity
The Fund recently increased its exposure to the Information Technology and Consumer Discretionary sectors, while reducing its exposure to Industrial and Financial stocks. Given the uncertain economic outlook and volatile stock market, we have underweighted Industrials, Energy, and the Consumer sectors relative to the Index. We believe going forward that stock selection will be a driver of performance rather than sector allocation.
CENTURY FUNDS
3
CENTURY SMALL CAP SELECT FUND COMMENTARY (CONTINUED)
Describe portfolio positioning at period-end
The Fund is positioned to take advantage of attractive investment opportunities across almost every sector. We are focused on investing in companies that we believe will be able to generate healthy growth in 2012 despite near term economic challenges. We are also focused on profitability and financial strength, which we think will help to ensure that the companies we invest in are able to weather potential downturns that may occur. We believe our focus on in-depth fundamental research will be an advantage, especially since stock selection is likely to be the primary driver of outperformance.
Risks: The Fund concentrates its investments in the financial services and health care group of industries. Concentration in a particular industry subjects the Fund to the risks associated with that industry and, as a result, the Fund may be subject to greater price volatility than funds with less concentrated portfolios. In addition, the Fund invests in smaller companies which pose greater risks than those associated with larger, more established companies. Please read the Fund’s prospectus for details regarding the Fund’s risk profile.
| Ten Largest Holdings* | |
J2 GLOBAL COMMUNICATIONS, INC. | 4.35% |
Electronic communications | |
HEALTHSPRING, INC. | 3.63% |
Managed care services | |
DSW, INC. CLASS A | 3.11% |
Footwear retailer | |
SOLARWINDS, INC. | 2.97% |
IT management software | |
EVERCORE PARTNERS, INC. | 2.75% |
Investment advisory services | |
RIGHTNOW TECHNOLOGIES, INC. | 2.65% |
Cloud-based software services. | |
CAI INTERNATIONAL, INC. | 2.61% |
Marine cargo container leasing | |
SELECT COMFORT CORP. | 2.38% |
Bedding retailer | |
BRUKER CORP. | 2.37% |
Scientific instruments | |
JAZZ PHARMACEUTICALS, INC. | 2.35% |
Specialty pharmaceuticals | |
| Portfolio Composition* | |
Information Technology | 27.3% |
Health Care | 19.6% |
Industrials | 14.9% |
Consumer Discretionary | 12.6% |
Financials | 8.8% |
Materials | 4.7% |
Energy | 4.6% |
Telecommunication Services | 2.0% |
Consumer Staples | 1.0% |
Short-term Investment | |
| plus net other liabilities | 4.5% |
* Based on the Fund’s net assets at October 31, 2011 and subject to change.
CENTURY FUNDS
4
CENTURY SMALL CAP SELECT FUND
Performance Summary – Institutional Shares and Investor Shares
The returns shown below represent past performance and do not guarantee future results. Investment return and share price will fluctuate with market conditions, and investors may have a gain or loss when shares are sold. Current performance may be significantly lower or higher than the Fund’s past performance. Please call (800) 303-1928 for the Fund’s most recent month-end performance. As stated in the Fund’s current prospectus, the total (gross) annual operating expenses are 1.50% for the Investor Shares and 1.13% for the Institutional Shares. Returns would have been lower during certain periods if certain fees had not been waived or expenses reimbursed. The recent growth rate in the global equity markets has helped to produce short-term returns for some sectors/asset classes that are not typical and may not continue in the future. Because of ongoing market volatility, Fund performance may be subject to substantial short-term changes.
The Fund’s total returns include the reinvestment of dividend and capital gain distributions, but have not been adjusted to reflect the deduction of taxes that a shareholder would pay on these distributions or the redemption of Fund shares. Shares held less than 90 days may be subject to a 1% redemption fee.
| Average Annual Total Returns as of 10/31/11 (%) | ||||
| 1 Year | 3 Years | 5 Years | 10 Years | |
| Century Small Cap Select Institutional Shares | 13.86 | 17.79 | 2.41 | 8.42 |
| Russell 2000 Growth Index | 9.84 | 16.31 | 2.68 | 6.04 |
| 1 Year | 3 Years | 5 Years | 10 Years | |
| Century Small Cap Select Investor Shares | 13.47 | 17.37 | 2.06 | 8.03 |
| Russell 2000 Growth Index | 9.84 | 16.31 | 2.68 | 6.04 |
| Sources: Century Capital Management, LLC and Russell |
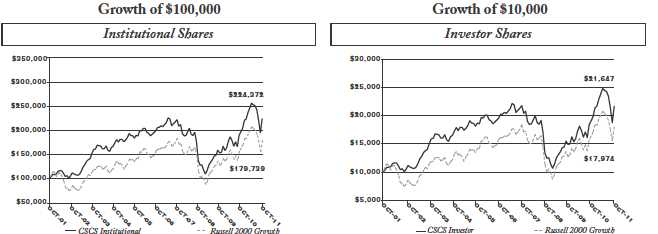
The graphs and table reflect the change in value of a hypothetical investment in the Fund, including reinvest of dividends and distributions, compared with the index. Index returns assume reinvestment of dividends and, unlike Fund returns, do not reflect any fees or expenses. It is not possible to invest directly in an index. Minimum initial investment for Institutional Shares is $100,000.
The Russell 2000® Growth Index measures the performance of the small-cap growth segment of the U.S. equity universe. It includes those Russell 2000® companies with higher price-to-value ratios and higher forecasted growth values. Index returns assume reinvestment of dividends but, unlike Fund returns, do not reflect fees or expenses. One cannot invest directly in an index.
CENTURY FUNDS
5
CENTURY SHARES TRUST COMMENTARY
How did the portfolio perform?
For the one-year period ended October 31, 2011, Century Shares Trust Institutional Shares returned 9.79%, slightly behind the Russell 1000 Growth Index while outperforming the S&P 500 Index, which returned 9.92% and 8.09%, respectively.
What factors influenced performance?
Although the stock market started off very strong from October 31, 2010 to mid-February 2011 with the Russell 1000 Growth Index rising about 14%, it plateaued at that level for about five months before experiencing some significant volatility at the end of the fiscal year. An improving economy sparked the rise early in the year. Thereafter, uncertainty entered the picture. Numerous geopolitical issues and natural disasters arose and resulted in a stock market driven by macro events, rather than underlying fundamentals.
The Fund underperformed during the market decline in August 2011, but subsequently outperformed in October 2011. Stock selection was the primary driver of performance. Strong performance by Tempur-Pedic International, Inc. (mattress manufacturer), Tiffany & Co. (jewelry retailer) and CBS Corp. (media company) was partially offset by weakness in NII Holdings, Inc. (Latin American wireless operator), CIT Group, Inc. (commercial finance) and MetroPCS Communications, Inc. (prepaid wireless operator).
In terms of sector allocation, the Fund was positioned to take advantage of an improving economy. The Fund was modestly overweight cyclical sectors such as Industrials and Consumer Discretionary while underweighting defensive sectors such as Consumer Staples and Health Care. Given the economy’s high unemployment rate and slower than expected recovery, the Fund’s sector allocation was a drag on performance.
Describe recent portfolio activity
The portfolio continued to be allocated across most sectors of the Russell 1000 Growth Index. Our continued belief in the slow economic recovery has led to portfolio overweight positions in Industrials, Consumer Discretionary, and Technology and an underweight in Consumer Staples. Over the past year, we have reduced the number of portfolio holdings to 34 stocks as of October 31, 2011 from 52 stocks a year ago. As we sold stocks, we reinvested most of the proceeds in existing holdings. As a result, Century Shares Trust is now comprised of a more focused group of our highest conviction investment ideas.
CENTURY FUNDS
6
CENTURY SHARES TRUST FUND COMMENTARY (CONTINUED)
Describe portfolio positioning at period-end
The Fund continues to invest in what we believe are high quality growth companies that offer the potential of outperformance over the long term. The Fund remains diversified, but is positioned to benefit from an improving economy. The pace of economic improvement has been and is expected to be slow, but seems to be showing signs of improvement. For example, auto sales rose above 13 million units in both September and October of 2011 while the ISM manufacturing and non-manufacturing indices were both above 50, which indicate expansion. Since we now believe the recovery will be slower than we expected six months ago, we seek to invest in companies with strong secular growth opportunities, solid profitability, and reasonable valuations.
Risks: The Fund may invest a significant portion of assets in a limited number of companies or in companies within the same market sector. As a result, the Fund may be more susceptible to financial, market and economic events affecting particular companies or sectors and therefore may experience greater price volatility than funds with more diversified portfolios. Please read the Fund’s prospectus for details regarding the Fund’s risk profile.
| Ten Largest Holdings* | |
APPLE, INC. | 5.64% |
Worldwide technology company | |
ALEXION PHARMACEUTICALS, INC. | 4.60% |
Biopharmaceutical company | |
TEMPUR-PEDIC INTERNATIONAL, INC. | 4.34% |
Bedding manufacturer | |
MASTERCARD, INC. | 4.13% |
Transaction processor | |
GOODRICH CORP. | 4.02% |
Aerospace systems and services | |
TIFFANY & CO. | 3.96% |
Fine jewelry designer and retailer | |
CBS CORP. | 3.91% |
Mass media company | |
ORACLE CORP. | 3.75% |
Enterprise software provider | |
FASTENAL CO. | 3.37% |
Construction Supplies | |
COSTCO WHOLESALE CORP. | 3.30% |
Warehouse retailer | |
| Portfolio Composition* | |
Information Technology | 30.7% |
Consumer Discretionary | 15.8% |
Industrials | 15.1% |
Health Care | 11.6% |
Energy | 8.4% |
Consumer Staples | 6.1% |
Financials | 4.2% |
Telecommunication Services | 3.8% |
Materials | 2.7% |
Short-term Investment plus | |
net other liabilities | 1.6% |
* Based on the Fund's net assets at October 31, 2011 and subject to change.
CENTURY FUNDS
7
CENTURY SHARES TRUST
Performance Summary – Institutional Shares
The returns shown below represent past performance and do not guarantee future results. Investment return and share price will fluctuate with market conditions,and investors may have a gain or loss when shares are sold. Current performance may be significantly lower or higher than the Fund’s past performance. Please call (800) 303-1928 for the Fund’s most recent month-end performance. As stated in the Fund’s current prospectus,the total (gross) annual operating expenses for the Institutional Shares are 1.15%.On May 27,2011,all of the Fund’s issued and outstanding Investor Shares were converted to Institutional Shares and the Investor Shares class was closed. Institutional Shares performance shown does not include fees or the higher expense rations applicable to the former Investor Shares. Otherwise, returns shown would have been lower. The recent growth rate in the global equity markets has helped to produce short-term returns for some sectors/asset classes that are not typical and may not continue in the future. Because of ongoing market volatility,Fund performance may be subject to substantial short-term changes.
The Fund’s total returns include the reinvestment of dividend and capital gain distributions, but have not been adjusted to reflect the deduction of taxes that a shareholder would pay on these distributions or the redemption of Fund shares. Shares held less than 90 days may be subject to a 1% redemption fee.
Effective October 31, 2011, the Russell 1000® Growth Index replaced the S&P 500® Index as the comparative index for the Fund. The Russell 1000 Growth Index measures the performance of the large-cap growth segment of the U.S. equity universe. It includes those Russell 1000 companies with higher price-to-book ratios and higher forecasted growth values. The S&P 500 Index is a broad based unmanaged index representing the performance of 500 widely held common stocks. The Fund’s Adviser believes that the Russell 1000 Growth Index is a more appropriate benchmark because the Fund’s sector weightings and other portfolio characteristics are more comparable to those of the Russell 1000 Growth Index.
| Average Annual Total Returns as of 10/31/11 (%) | ||||
| 1 Year | 3 Years | 5 Years | 10 Years | |
| CST Institutional Shares | 9.79 | 11.64 | 1.05 | 4.50 |
| Russell 1000 Growth Index | 9.92 | 15.62 | 3.04 | 3.56 |
| S&P 500 Index | 8.09 | 11.41 | 0.25 | 3.69 |
| Sources: Century Capital Management, LLC, S&P and Russell |

The graph and table reflect the change in value of a hypothetical investment in the Fund, including reinvest of dividends and distributions, compared with the listed indices.
Index returns assume reinvestment of dividends and, unlike Fund returns, do not reflect any fees or expenses. It is not possible to invest directly in an index. Minimum initial investment for Institutional Shares is $100,000.
CENTURY FUNDS
8
CENTURY GROWTH OPPORTUNITIES FUND COMMENTARY
How did the portfolio perform?
For the period November 17, 2010 (the Fund’s inception date) through October 31, 2011, Century Growth Opportunities Fund returned 6.70%, trailing its benchmark, the Russell 2500 Growth Index, which returned 10.67% during that same time period.
What factors influenced performance?
Equity markets experienced a strong beginning to the fiscal-year period, ending October 31, 2011, as economic activity showed signs of acceleration. Within the Russell 2500 Growth Index, a concentration of high-growth, high valuation stocks were catalysts for upward performance. Defensive and more domestically oriented sectors (Consumer Staples, Consumer Discretionary and Utilities) assumed leadership during the spring and summer, while, slowing global growth, mounting European debt, and the downgrade of the U.S. credit rating ushered in uncertainty and volatility. As the period drew to a close, all eyes were on Europe, and the markets ebbed and flowed with each new headline.
The Fund trailed its benchmark during the first half of the reporting period, but outperformed during the second half. Secular growth opportunities drove performance. Leading contributors included Alexion Pharmaceuticals, Inc. (biotechnology company), SolarWinds, Inc. ( IT services/software provider), Diamond Foods Inc. (packaged food), Tempur-Pedic International, Inc. (mattress manufacturer), and ION Geophysical Corporation (energy services).
As the prospect of slowing global growth became more evident, we added to the Fund’s holdings in companies that we believed offered more dependable growth prospects and reduced holdings in more economically sensitive sectors, such as Industrials. This proved beneficial. Consumer Discretionary and Health Care were leading contributors for the period. A significant underweight in Financials also contributed to performance. Economic growth concerns caused Industrials and Technology to be laggards, though our underweight position and stock selection did help performance in the second half of the reporting period.
Describe recent portfolio activity
The portfolio remains diversified across the sectors of the Russell 2500 Growth Index. Since our last report, we have continued to adopt a more defensive posture in our holdings. We have reduced allocations in Consumer Discretionary and Industrials. At the same time we have used sell offs in the market to acquire or add to stock holdings that we believe will thrive in slow growth environments.
CENTURY FUNDS
9
CENTURY GROWTH OPPORTUNITIES FUND COMMENTARY (CONTINUED)
Describe portfolio positioning at period-end
The Fund remains focused on companies that we believe offer higher visibility and the ability to generate returns in a slow growth environment. The European debt crisis continues to play out with no real solution in sight. We have reduced exposure to Europe and have increased exposure to secular growth companies whose financials have been resilient during this time of uncertainty. The United States economy has continued to improve albeit at a slow pace and so we have added to portfolio holdings that derive most of their revenues domestically.
Risks: The Fund invests mainly in small-cap and mid-cap companies, which, historically, have been more volatile in price than the stocks of large-cap companies. The Fund may invest in foreign companies, which involves risks not associated with investing solely in U.S. companies, such as currency fluctuations, unfavorable political developments, or economic instability. These risks are magnified in emerging markets. Please read the Fund’s prospectus for details regarding the Fund’s risk profile.
| Ten Largest Holdings* | |
SOLARWINDS, INC. | 2.70% |
IT management software | |
F5 NETWORKS, INC. | 2.41% |
Network equipment manufacturer | |
QUESTCOR PHARMACEUTICALS, INC. | 2.22% |
Biopharmaceutical company | |
KANSAS CITY SOUTHERN | 2.20% |
Freight rail transportation | |
TEMPUR-PEDIC INTERNATIONAL, INC. | 2.18% |
Bedding manufacturer | |
SALIX PHARMACEUTICALS LTD. | 2.15% |
Pharmaceutical company | |
CARBO CERAMICS, INC. | 2.13% |
Energy products and services | |
VERIFONE SYSTEMS, INC. | 2.13% |
Point of sale systems | |
BE AEROSPACE, INC. | 2.11% |
Aerospace systems | |
HERBALIFE LTD. | 2.09% |
Direct marketer of health products | |
| Portfolio Composition* | |
Information Technology | 24.6% |
Health Care | 19.5% |
Consumer Discretionary | 16.0% |
Industrials | 15.1% |
Energy | 6.1% |
Consumer Staples | 4.6% |
Financials | 4.0% |
Telecommunication Services | 1.8% |
Materials | 1.7% |
Short-term Investment plus | |
net other assets | 6.6% |
* Based on the Fund's net assets at October 31, 2011 and subject to change.
CENTURY FUNDS
10
CENTURY GROWTH OPPORTUNITIES FUND
Performance Summary – Institutional Shares
The returns shown below represent past performance and do not guarantee future results. Investment return and share price will fluctuate with market conditions, and investors may have a gain or loss when shares are sold. Current performance may be significantly lower or higher than the Fund’s past performance. Please call (800) 303-1928 for the Fund’s most recent month-end performance. As stated in the Fund’s current prospectus, the total (gross) annual operating expenses are 1.88% for the Institutional Shares. The Adviser has agreed contractually to limit the operating expenses for the Fund’s Institutional Shares to 1.10% through February 28, 2012. Returns would have been lower during relevant periods if certain fees had not been waived or expenses reimbursed. The recent growth rate in the global equity markets has helped to produce short-term returns for some sectors/asset classes that are not typical and may not continue in the future. Because of ongoing market volatility, Fund performance may be subject to substantial short-term changes.
The Fund’s total returns include the reinvestment of dividend and capital gain distributions, but have not been adjusted to reflect the deduction of taxes that a shareholder would pay on these distributions or the redemption of Fund shares. Shares held less than 90 days may be subject to a 1% redemption fee.
| Total Returns as of 10/31/11 (%) | ||
| Since | ||
| Inception* | ||
| Century Growth Opportunities Fund Institutional Shares | 6.70 | |
| Russell 2500 Growth Index | 10.67 | |
*11/17/2010 (not annualized)
Sources: Century Capital Management, LLC and Russell
The Russell 2500 Growth® Index measures the performance of the small- to mid-cap growth segment of the U.S. equity universe. It includes those Russell 2500 companies with higher price-to-book ratios and higher forecasted growth values. Index returns assume reinvestment of dividends but, unlike Fund returns, do not reflect fees or expenses. One cannot invest directly in an index.
CENTURY FUNDS
11
CENTURY SMALL CAP SELECT FUND
PORTFOLIO OF INVESTMENTS – AS OF OCTOBER 31, 2011
| Shares | Value | |
| COMMON STOCK - 95.5% | ||
| Consumer Discretionary - 12.6% | ||
Auto Components - 0.8% | ||
200,000 | China Zenix Auto International | |
Ltd. ADR* | $ 962,000 | |
200,500 | Modine Manufacturing Co.* | 2,119,285 |
3,081,285 | ||
Specialty Retail - 11.8% | ||
220,550 | DSW, Inc. Class A | 11,543,587 |
303,850 | Express, Inc. | 6,863,971 |
107,675 | Monro Muffler Brake, Inc. | 3,993,666 |
197,800 | Sally Beauty Holdings, Inc.* | 3,795,782 |
426,150 | Select Comfort Corp.* | 8,851,135 |
155,300 | The Men’s Wearhouse, Inc. | 4,795,664 |
420,450 | West Marine, Inc.* | 3,821,891 |
43,665,696 | ||
46,746,981 | ||
| Consumer Staples - 1.0% | ||
Food Products - 1.0% | ||
106,750 | The Hain Celestial Group, Inc.* | 3,582,530 |
| Energy - 4.6% | ||
Energy Equipment & Services - 1.6% | ||
595,700 | Pioneer Drilling Co.* | 5,891,473 |
Oil, Gas & Consumable Fuels - 3.0% | ||
194,800 | Berry Petroleum Co. Class A | 6,730,340 |
169,950 | Carrizo Oil & Gas, Inc.* | 4,622,640 |
11,352,980 | ||
17,244,453 | ||
| Financials - 8.8% | ||
Capital Markets - 6.7% | ||
277,950 | Cohen & Steers, Inc. | 7,551,901 |
372,050 | Evercore Partners, Inc. Class A | 10,209,052 |
646,600 | HFF, Inc. Class A* | 7,112,600 |
24,873,553 | ||
Commercial Banks - 2.1% | ||
143,350 | Signature Bank* | 7,991,763 |
32,865,316 | ||
| Shares | Value | |
| Health Care - 19.6% | ||
Biotechnology - 0.8% | ||
569,350 | NPS Pharmaceuticals, Inc.* | $ 2,943,540 |
Health Care Providers & Services - 8.0% | ||
23,250 | Air Methods Corp.* | 1,879,065 |
385,200 | Brookdale Senior Living, Inc.* | 6,386,616 |
250,000 | Healthspring, Inc.* | 13,485,000 |
195,350 | IPC The Hospitalist Co., Inc.* | 8,191,025 |
29,941,706 | ||
Health Care Technology - 2.8% | ||
152,700 | Quality Systems, Inc. | 5,941,557 |
92,350 | SXC Health Solutions Corp.* | 4,323,827 |
10,265,384 | ||
Life Sciences Tools & Services - 3.9% | ||
609,350 | Bruker Corp.* | 8,792,920 |
446,850 | WuXi PharmaTech (Cayman), | |
Inc. ADR* | 5,554,346 | |
14,347,266 | ||
Pharmaceuticals - 4.1% | ||
224,200 | Jazz Pharmaceuticals, Inc.* | 8,734,832 |
157,550 | Questcor Pharmaceuticals, Inc.* | 6,398,106 |
15,132,938 | ||
72,630,834 | ||
| Industrials - 14.9% | ||
Aerospace & Defense - 1.6% | ||
103,600 | Triumph Group, Inc. | 6,019,160 |
Commercial Services & Supplies - 0.8% | ||
218,250 | Interface, Inc. Class A | 2,845,980 |
Electrical Equipment - 3.9% | ||
138,750 | General Cable Corp.* | 3,890,550 |
264,150 | II-VI, Inc.* | 5,021,492 |
163,850 | Woodward, Inc. | 5,551,238 |
14,463,280 | ||
Machinery - 3.2% | ||
104,500 | Chart Industries, Inc.* | 5,905,295 |
261,950 | Titan International, Inc. | 5,893,875 |
11,799,170 | ||
See notes to financial statements.
CENTURY FUNDS
12CENTURY SMALL CAP SELECT FUND (CONTINUED)
PORTFOLIO OF INVESTMENTS – AS OF OCTOBER 31, 2011
| Shares | Value | |
| Industrials (Continued) | ||
Professional Services - 0.7% | ||
209,850 | Kforce, Inc.* | $ 2,677,686 |
Trading Companies & Distributors - 4.7% | ||
435,150 | Beacon Roofing Supply, Inc.* | 8,019,814 |
620,000 | CAI International, Inc.* | 9,678,200 |
17,698,014 | ||
55,503,290 | ||
| Information Technology - 27.3% | ||
Communications Equipment - 2.2% | ||
83,500 | Acme Packet, Inc.* | 3,023,535 |
186,700 | Radware Ltd.* | 4,936,348 |
7,959,883 | ||
Internet Software & Services - 9.9% | ||
525,300 | j2 Global Communications, Inc. | 16,168,734 |
159,850 | Liquidity Services, Inc.* | 5,204,716 |
140,300 | LogMeIn, Inc.* | 5,706,001 |
228,950 | RightNow Technologies, Inc.* | 9,847,139 |
36,926,590 | ||
IT Services - 4.0% | ||
349,900 | Echo Global Logistics, Inc.* | 5,402,456 |
793,200 | Online Resources Corp.* | 2,125,776 |
605,550 | Sapient Corp. | 7,484,598 |
15,012,830 | ||
Semiconductors & Semiconductor Equipment - 4.2% | ||
67,450 | Hittite Microwave Corp.* | 3,547,870 |
210,600 | Power Integrations, Inc. | 7,503,678 |
109,800 | Silicon Laboratories, Inc.* | 4,693,950 |
15,745,498 | ||
Software - 7.0% | ||
121,050 | CommVault Systems, Inc.* | 5,154,309 |
90,450 | Informatica Corp.* | 4,115,475 |
66,750 | Pegasystems, Inc. | 2,522,483 |
108,750 | QLIK Technologies, Inc.* | 3,106,987 |
382,300 | Solarwinds, Inc.* | 11,033,178 |
25,932,432 | ||
101,577,233 | ||
| Shares | Value | ||
| Materials - 4.7% | |||
Chemicals - 2.8% | |||
194,500 | Balchem Corp. | $ 7,171,215 | |
113,200 | Intrepid Potash, Inc.* | 3,150,356 | |
10,321,571 | |||
Metals & Mining - 1.9% | |||
148,650 | Schnitzer Steel Industries, | ||
Inc. Class A | 6,956,820 | ||
17,278,391 | |||
| Telecommunication Services - 2.0% | |||
Diversified Telecommunication Services - 2.0% | |||
456,900 | Cogent Communications | ||
Group, Inc.* | 7,333,245 | ||
| Total Investment in Common Stocks - 95.5% | |||
(Identified cost, $302,722,630) | 354,762,273 | ||
| Short-Term Investment - 4.7% | |||
17,549,302 | State Street Institutional U.S. | ||
Government Money | |||
Market Fund | |||
(Identified cost, $17,549,302) | 17,549,302 | ||
| Total Investments - 100.2% | |||
(Identified cost, $320,271,932) | 372,311,575 | ||
| Liabilities in Excess of | |||
| Other Assets - (0.2)% | (910,132) | ||
| Net Assets - 100% | $371,401,443 | ||
* | Non-income producing security | ||
ADR | American Depositary Receipt | ||
See notes to financial statements.
CENTURY FUNDS
13
CENTURY SMALL CAP SELECT FUND | ||||
STATEMENT OF ASSETS AND LIABILITIES - OCTOBER 31, 2011 | ||||
| Assets: | ||||
Investments, at value (Note 1A) (Identified cost of $320,271,932) | $ | 372,311,575 | ||
Dividends receivable | 3,028 | |||
Receivable for investments sold | 1,766,703 | |||
Receivable for Fund shares sold | 788,211 | |||
Prepaid expenses | 9,107 | |||
Total Assets | 374,878,624 | |||
| Liabilities: | ||||
Payable to Affiliates: | ||||
Investment adviser fee (Note 4) | 280,224 | |||
Administration fees (Note 5) | 271 | |||
Distribution and service fees (Note 6) | 30,474 | |||
Accrued expenses and other liabilities | 174,689 | |||
Payable for investments purchased | 2,659,984 | |||
Payable for Fund shares repurchased | 331,539 | |||
Total Liabilities | 3,477,181 | |||
| Net Assets | $ | 371,401,443 | ||
At October 31, 2011, net assets consisted of: | ||||
Paid-in capital | $ | 396,698,816 | ||
Accumulated net realized loss on investments | (77,337,016 | ) | ||
Unrealized appreciation in value of investments | 52,039,643 | |||
Net assets applicable to outstanding capital stock | $ | 371,401,443 | ||
Net Assets consist of: | ||||
Institutional shares | $ | 254,723,553 | ||
Investor shares | $ | 116,677,890 | ||
Shares Outstanding consist of (Note 2): | ||||
Institutional shares | 10,654,802 | |||
Investor shares | 5,019,132 | |||
| Net Asset Value Per Share | ||||
(Represents both the offering and redemption price*) | ||||
Institutional shares | $ | 23.91 | ||
Investor shares | $ | 23.25 | ||
| * | In general, shares of the Fund may be redeemed at net asset value. However, upon the redemption of shares held less than 90 days, a redemption fee of 1% of the current net asset value of the shares may be assessed and retained by each share class of the Fund for the benefit of remaining shareholders. The redemption fee is accounted for as an addition to paid-in-capital. |
See notes to financial statements.
CENTURY FUNDS
14
CENTURY SMALL CAP SELECT FUND | ||||
STATEMENT OF OPERATIONS - YEAR ENDED OCTOBER 31, 2011 | ||||
| Investment Income: | ||||
Dividends (net of foreign withholding tax of $7,256) | $ | 2,154,883 | ||
Other income | 773,804 | |||
Total investment income | 2,928,687 | |||
| Expenses: | ||||
Investment adviser fee (Note 4) | 3,732,479 | |||
Non-interested trustees’ remuneration | 169,174 | |||
Transfer agent | ||||
Institutional Shares | 58,797 | |||
Investor Shares | 226,999 | |||
Custodian | 79,512 | |||
Insurance | 29,680 | |||
Professional fees | 100,167 | |||
Registration | 26,253 | |||
Distribution and service fees (Note 6) | 240,249 | |||
Printing and other expenses | 130,513 | |||
Total expenses | 4,793,823 | |||
Net investment loss | (1,865,136 | ) | ||
Realized and unrealized gain/(loss) on investments: | ||||
Net realized gain from investment transactions | 79,336,385 | |||
Decrease in unrealized appreciation on investments | (29,175,691 | ) | ||
Net realized and unrealized gain on investments | 50,160,694 | |||
Net increase in net assets resulting from operations | $ | 48,295,558 | ||
See notes to financial statements.
CENTURY FUNDS
15
CENTURY SMALL CAP SELECT FUND | ||||||||
STATEMENT OF CHANGES IN NET ASSETS | ||||||||
INCREASE (DECREASE) | Year Ended | Year Ended | ||||||
IN NET ASSETS: | October 31, 2011 | October 31, 2010 | ||||||
Operations: | ||||||||
Net investment loss | $ | (1,865,136 | ) | $ | (1,106,577 | ) | ||
Net realized gain from investment transactions | 79,336,385 | 40,471,216 | ||||||
Change in net unrealized appreciation on investments | (29,175,691 | ) | 40,930,084 | |||||
Net increase in net assets resulting from operations | 48,295,558 | 80,294,723 | ||||||
Capital share transactions - net (Note 2) | (18,974,857 | ) | (46,355,327 | ) | ||||
Redemption fees | 32,775 | 4,353 | ||||||
Total increase | 29,353,476 | 33,943,749 | ||||||
| Net Assets: | ||||||||
Beginning of year | 342,047,967 | 308,104,218 | ||||||
End of year | $ | 371,401,443 | $ | 342,047,967 | ||||
See notes to financial statements.
CENTURY FUNDS
16
CENTURY SMALL CAP SELECT FUND | ||||||||||||||||||||
FINANCIAL HIGHLIGHTS - INSTITUTIONAL SHARES | ||||||||||||||||||||
| Year Ended October 31, | ||||||||||||||||||||
| 2011 | 2010 | 2009 | 2008 | 2007 | ||||||||||||||||
Net Asset Value, beginning of period | $ | 20.99 | $ | 16.34 | $ | 14.62 | $ | 26.13 | $ | 25.74 | ||||||||||
Income/(loss) from Investment Operations: | ||||||||||||||||||||
Net investment loss(a) | (0.09 | ) | (0.05 | ) | (0.01 | ) | (0.12 | ) | 0.00 | † | ||||||||||
Net realized and unrealized gain/(loss) on investments | 3.01 | 4.70 | 1.73 | (9.00 | ) | 2.75 | ||||||||||||||
Total income/(loss) from investment operations | 2.92 | 4.65 | 1.72 | (9.12 | ) | 2.75 | ||||||||||||||
Less Distributions From: | ||||||||||||||||||||
Net investment income | (0.00 | ) | (0.00 | ) | (0.00 | ) | (0.10 | ) | (0.35 | ) | ||||||||||
Tax return of capital | (0.00 | ) | (0.00 | ) | (0.00 | ) | (2.10 | ) | (2.01 | ) | ||||||||||
Net realized gain on investment transactions | (0.00 | ) | (0.00 | ) | (0.00 | ) | (0.19 | ) | (0.00 | ) | ||||||||||
Total distributions | (0.00 | ) | (0.00 | ) | (0.00 | ) | (2.39 | ) | (2.36 | ) | ||||||||||
Redemption fees | 0.00 | † | 0.00 | † | 0.00 | † | 0.00 | † | 0.00 | † | ||||||||||
Net Asset Value, end of period | $ | 23.91 | $ | 20.99 | $ | 16.34 | $ | 14.62 | $ | 26.13 | ||||||||||
Total Return | 13.86 | % | 28.52 | % | 11.69 | % | (38.24 | )% | 11.61 | % | ||||||||||
Ratios and supplemental data | ||||||||||||||||||||
Net assets, end of period (000 omitted) | $ | 254,724 | $ | 249,429 | $ | 216,295 | $ | 262,793 | $ | 575,027 | ||||||||||
Ratio of expenses to average net assets | 1.11 | % | 1.13 | % | 1.14 | % | 1.11 | % | 1.08 | % | ||||||||||
Ratio of net investment loss to | ||||||||||||||||||||
average net assets | (0.37 | )% | (0.25 | )% | (0.08 | )% | (0.57 | )% | 0.02 | % | ||||||||||
Portfolio Turnover Rate | 75 | % | 85 | % | 133 | % | 104 | % | 100 | % | ||||||||||
| (a) | Calculated based on average shares outstanding during the period. |
| † | Amount represents less than $0.005 per share. |
See notes to financial statements.
CENTURY FUNDS
17
CENTURY SMALL CAP SELECT FUND | ||||||||||||||||||||
FINANCIAL HIGHLIGHTS - INVESTOR SHARES | ||||||||||||||||||||
| Year Ended October 31, | ||||||||||||||||||||
| 2011 | 2010 | 2009 | 2008 | 2007 | ||||||||||||||||
Net Asset Value, beginning of period | $ | 20.49 | $ | 16.00 | $ | 14.37 | $ | 25.72 | $ | 25.40 | ||||||||||
Income/(loss) from Investment Operations: | ||||||||||||||||||||
Net investment loss(a) | (0.17 | ) | (0.11 | ) | (0.07 | ) | (0.20 | ) | (0.06 | ) | ||||||||||
Net realized and unrealized gain/(loss) on investments | 2.92 | 4.60 | 1.70 | (8.86 | ) | 2.71 | ||||||||||||||
Total income/(loss) from investment operations | 2.75 | 4.49 | 1.63 | (9.06 | ) | 2.65 | ||||||||||||||
Less Distributions From: | ||||||||||||||||||||
Net investment income | (0.00 | ) | (0.00 | ) | (0.00 | ) | (0.00 | ) | (0.32 | ) | ||||||||||
Tax return of capital | (0.00 | ) | (0.00 | ) | (0.00 | ) | (2.10 | ) | (2.01 | ) | ||||||||||
Net realized gain on investment transactions | (0.00 | ) | (0.00 | ) | (0.00 | ) | (0.19 | ) | (0.00 | ) | ||||||||||
Total distributions | (0.00 | ) | (0.00 | ) | (0.00 | ) | (2.29 | ) | (2.33 | ) | ||||||||||
Redemption fees | 0.01 | 0.00 | † | 0.00 | † | 0.00 | † | 0.00 | † | |||||||||||
Net Asset Value, end of period | $ | 23.25 | $ | 20.49 | $ | 16.00 | $ | 14.37 | $ | 25.72 | ||||||||||
| Total Return | 13.47 | % | 28.06 | % | 11.27 | % | (38.49 | )% | 11.34 | % | ||||||||||
Ratios and supplemental data | ||||||||||||||||||||
Net assets, end of period (000 omitted) | $ | 116,678 | $ | 92,618 | $ | 91,809 | $ | 102,252 | $ | 257,750 | ||||||||||
Ratio of expenses to average net assets | 1.48 | % | 1.50 | % | 1.53 | % | 1.50 | % | 1.36 | % | ||||||||||
Ratio of net investment loss to average net assets | (0.71 | )% | (0.61 | )% | (0.47 | )% | (0.96 | )% | (0.24 | )% | ||||||||||
Portfolio Turnover Rate | 75 | % | 85 | % | 133 | % | 104 | % | 100 | % | ||||||||||
| (a) | Calculated based on average shares outstanding during the period. |
| † | Amount represents less than $0.005 per share. |
See notes to financial statements.
CENTURY FUNDS
18
This Page Intentionally Left Blank.
19
CENTURY SHARES TRUST
PORTFOLIO OF INVESTMENTS – AS OF OCTOBER 31, 2011
| Shares | Value | |
| COMMON STOCK - 98.4% | ||
| Consumer Discretionary - 15.8% | ||
Household Durables - 4.3% | ||
113,650 | Tempur-Pedic International, Inc.* | $ 7,735,019 |
Internet & Catalog Retail - 0.7% | ||
5,800 | Amazon.com, Inc.* | 1,238,358 |
Media - 3.9% | ||
269,750 | CBS Corp. Class B | 6,962,248 |
Specialty Retail - 6.9% | ||
67,650 | O’Reilly Automotive, Inc.* | 5,144,782 |
88,500 | Tiffany & Co. | 7,056,105 |
12,200,887 | ||
28,136,512 | ||
| Consumer Staples - 6.1% | ||
Food & Staples Retailing - 3.3% | ||
70,550 | Costco Wholesale Corp. | 5,873,287 |
Food Products - 2.8% | ||
102,350 | McCormick & Co.Inc. | 4,970,116 |
10,843,403 | ||
| Energy - 8.4% | ||
Oil, Gas & Consumable Fuels - 8.4% | ||
52,600 | Chevron Corp. | 5,525,630 |
74,850 | ConocoPhillips | 5,213,302 |
53,550 | Exxon Mobil Corp. | 4,181,720 |
14,920,652 | ||
| Financials - 4.2% | ||
Commercial Banks - 1.3% | ||
68,450 | CIT Group, Inc.* | 2,385,483 |
Insurance - 2.9% | ||
4 | Berkshire Hathaway, Inc. Class A* | 467,800 |
87,650 | Prudential Financial, Inc. | 4,750,630 |
5,218,430 | ||
7,603,913 | ||
| Shares | Value | |
| Health Care - 11.6% | ||
Biotechnology - 4.6% | ||
121,300 | Alexion Pharmaceuticals, Inc.* | $ 8,188,963 |
Health Care Equipment & Supplies - 2.8% | ||
195,000 | CareFusion Corp.* | 4,992,000 |
Health Care Providers & Services - 4.2% | ||
96,700 | Cardinal Health, Inc. | 4,280,909 |
69,850 | Express Scripts, Inc.* | 3,194,240 |
7,475,149 | ||
20,656,112 | ||
| Industrials - 15.1% | ||
Aerospace & Defense - 4.0% | ||
58,450 | Goodrich Corp. | 7,167,723 |
Construction & Engineering - 3.2% | ||
154,350 | Chicago Bridge & Iron Co. NV | 5,646,123 |
Machinery - 1.7% | ||
71,950 | Timken Co. | 3,030,534 |
Road & Rail - 2.8% | ||
225,350 | CSX Corp. | 5,005,024 |
Trading Companies & Distributors - 3.4% | ||
157,600 | Fastenal Co. | 6,002,984 |
26,852,388 | ||
| Information Technology - 30.7% | ||
Communications Equipment - 6.0% | ||
54,750 | F5 Networks, Inc.* | 5,691,263 |
99,400 | QUALCOMM, Inc. | 5,129,040 |
10,820,303 | ||
Computers & Peripherals - 8.5% | ||
24,850 | Apple, Inc.* | 10,058,783 |
206,350 | EMC Corp.* | 5,057,638 |
15,116,421 | ||
See notes to financial statements.
CENTURY FUNDS
20
CENTURY SHARES TRUST (CONTINUED) |
PORTFOLIO OF INVESTMENTS – AS OF OCTOBER 31, 2011 |
| Shares | Value | ||
| Information Technology (Continued) | |||
Internet Software & Services - 2.8% | |||
8,400 | Google, Inc. Class A* | $ 4,978,176 | |
IT Services - 6.9% | |||
68,300 | Cognizant Technology Solutions | ||
Corp. Class A* | 4,968,825 | ||
21,200 | MasterCard, Inc. Class A | 7,361,488 | |
12,330,313 | |||
Software - 6.5% | |||
166,300 | Adobe Systems, Inc.* | 4,890,883 | |
204,000 | Oracle Corp. | 6,685,080 | |
11,575,963 | |||
54,821,176 | |||
| Materials - 2.7% | |||
Chemicals - 2.7% | |||
146,700 | LyondellBasell Industries | ||
NV Class A | 4,820,562 | ||
| Telecommunication Services - 3.8% | |||
Wireless Telecommunication Services - 3.8% | |||
323,700 | MetroPCS Communications, Inc.* | 2,751,450 | |
170,850 | NII Holdings, Inc.* | 4,020,101 | |
6,771,551 | |||
| Total Investment in Common Stocks - 98.4% | |||
(Identified cost, $136,122,844) | 175,426,269 | ||
| Short-Term Investment - 1.7% | |||
2,932,962 | State Street Institutional U.S. | ||
Government Money | |||
Market Fund | |||
(Identified cost, $2,932,962) | 2,932,962 | ||
| Value | |
| Total Investments - 100.1% | |
(Identified cost, $139,055,806) | $178,359,231 |
| Liabilities in Excess of | |
| Other Assets - (0.1)% | (158,184) |
| Net Assets - 100% | $178,201,047 |
* Non-income producing security |
See notes to financial statements.
CENTURY FUNDS
21
CENTURY SHARES TRUST | ||||
STATEMENT OF ASSETS AND LIABILITIES - OCTOBER 31, 2011 | ||||
| Assets: | ||||
Investments, at value (Note 1A) (Identified cost of $139,055,806) | $ | 178,359,231 | ||
Dividends receivable | 86,899 | |||
Receivable for Fund shares sold | 3,877 | |||
Prepaid expenses | 3,416 | |||
Total Assets | 178,453,423 | |||
| Liabilities: | ||||
Payable to Affiliates: | ||||
Investment adviser fee (Note 4) | 115,262 | |||
Administration fees (Note 5) | 14,408 | |||
Accrued expenses and other liabilities | 106,144 | |||
Payable for Fund shares repurchased | 16,562 | |||
Total Liabilities | 252,376 | |||
| Net Assets | $ | 178,201,047 | ||
At October 31, 2011, net assets consisted of: | ||||
Paid-in capital | $ | 120,726,081 | ||
Accumulated undistributed net realized gains on investments | 18,171,541 | |||
Unrealized appreciation in value of investments | 39,303,425 | |||
Net assets applicable to outstanding capital stock | $ | 178,201,047 | ||
Net Assets consist of: | ||||
Institutional shares | $ | 178,201,047 | ||
Shares Outstanding consist of (Note 2): | ||||
Institutional shares | 8,625,480 | |||
| Net Asset Value Per Share | ||||
(Represents both the offering and redemption price*) | ||||
Institutional shares | $ | 20.66 | ||
| * | In general, shares of the Fund may be redeemed at net asset value. However, upon the redemption of shares held less than 90 days, a redemption fee of 1% of the current net asset value of the shares may be assessed and retained by the Fund for the benefit of remaining shareholders. The redemption fee is accounted for as an addition to paid-in-capital. |
See notes to financial statements.
CENTURY FUNDS
22
CENTURY SHARES TRUST | ||||
STATEMENT OF OPERATIONS - YEAR ENDED OCTOBER 31, 2011 | ||||
| Investment Income: | ||||
Dividends (net of foreign withholding tax of $8,528) | $ | 1,883,006 | ||
Total investment income | 1,883,006 | |||
| Expenses: | ||||
Investment adviser fee (Notes 4 and 7) | 1,467,318 | |||
Non-interested trustees' remuneration | 76,407 | |||
Transfer agent | ||||
Institutional shares | 112,278 | |||
Investor shares | 6,684 | |||
Custodian | 52,184 | |||
Administration fees (Note 5) | 183,415 | |||
Insurance | 15,410 | |||
Professional fees | 77,089 | |||
Registration | 24,213 | |||
Printing and other expenses | 57,263 | |||
Total expenses | 2,072,261 | |||
Adviser reimbursements (Note 7) | (2,341 | ) | ||
Net expenses | 2,069,920 | |||
Net investment loss | (186,914 | ) | ||
Realized and unrealized gain/(loss) on investments: | ||||
Net realized gain from investment transactions | 18,620,958 | |||
Decrease in unrealized appreciation on investments | (1,153,307 | ) | ||
Net realized and unrealized gain on investments | 17,467,651 | |||
Net increase in net assets resulting from operations | $ | 17,280,737 | ||
See notes to financial statements.
CENTURY FUNDS
23
CENTURY SHARES TRUST | ||||||||
STATEMENT OF CHANGES IN NET ASSETS | ||||||||
INCREASE/(DECREASE) | Year Ended | Year Ended | ||||||
IN NET ASSETS: | October 31, 2011 | October 31, 2010 | ||||||
Operations: | ||||||||
Net investment loss | $ | (186,914 | ) | $ | (85,141 | ) | ||
Net realized gain on investment transactions | 18,620,958 | 20,112,837 | ||||||
Change in net unrealized appreciation | (1,153,307 | ) | 7,033,491 | |||||
Net increase in net assets resulting from operations | 17,280,737 | 27,061,187 | ||||||
Distributions to shareholders from: | ||||||||
Net investment income | ||||||||
Institutional shares | (51,630 | ) | (47,060 | ) | ||||
Net realized gain from investment transactions | ||||||||
Institutional shares | (7,888,685 | ) | — | |||||
Investor shares | (73,860 | ) | — | |||||
Capital share transactions - net (Note 2) | (9,736,363 | ) | (15,968,796 | ) | ||||
Redemption fees | 424 | 43 | ||||||
Total increase/(decrease) | (469,377 | ) | 11,045,374 | |||||
Net Assets: | ||||||||
Beginning of year | 178,670,424 | 167,625,050 | ||||||
End of year | $ | 178,201,047 | $ | 178,670,424 | ||||
See notes to financial statements.
CENTURY FUNDS
24
CENTURY SHARES TRUST | ||||||||||||||||||||
FINANCIAL HIGHLIGHTS - INSTITUTIONAL SHARES | ||||||||||||||||||||
| Year Ended October 31, | ||||||||||||||||||||
| 2011 | 2010 | 2009 | 2008 | 2007 | ||||||||||||||||
Net Asset Value, beginning of period | $ | 19.65 | $ | 16.84 | $ | 15.51 | $ | 29.52 | $ | 35.69 | ||||||||||
Income/(loss) from Investment Operations: | ||||||||||||||||||||
Net investment income/(loss)(a) | (0.02 | ) | (0.01 | ) | 0.00 | † | (0.01 | ) | 0.16 | |||||||||||
Net realized and unrealized gain/(loss) on investments | 1.93 | 2.82 | 1.36 | (7.44 | ) | 2.95 | ||||||||||||||
Total income/(loss) from investment operations | 1.91 | 2.81 | 1.36 | (7.45 | ) | 3.11 | ||||||||||||||
Less Distributions From: | ||||||||||||||||||||
Net investment income | (0.01 | ) | (0.00 | )† | (0.03 | ) | (0.30 | ) | (0.43 | ) | ||||||||||
Net realized gain on investment transactions | (0.89 | ) | (0.00 | ) | (0.00 | ) | (6.26 | ) | (8.85 | ) | ||||||||||
Total distributions | (0.90 | ) | (0.00 | )† | (0.03 | ) | (6.56 | ) | (9.28 | ) | ||||||||||
Redemption fees | 0.00 | † | 0.00 | † | 0.00 | † | 0.00 | † | 0.00 | † | ||||||||||
Net Asset Value, end of period | $ | 20.66 | $ | 19.65 | $ | 16.84 | $ | 15.51 | $ | 29.52 | ||||||||||
Total return | 9.79 | % | 16.72 | % | 8.59 | % | (32.31 | )% | 11.86 | % | ||||||||||
Ratios and supplemental data | ||||||||||||||||||||
Net assets, end of period (000 omitted) | $ | 178,201 | $ | 177,042 | $ | 166,574 | $ | 168,199 | $ | 287,670 | ||||||||||
Ratio of expenses to average net assets | 1.13 | % | 1.15 | % | 1.20 | % | 1.17 | % | 1.10 | % | ||||||||||
Ratio of net investment income/(loss) to average | ||||||||||||||||||||
net assets | (0.10 | )% | (0.05 | )% | 0.03 | % | (0.02 | )% | 0.56 | % | ||||||||||
Portfolio Turnover Rate | 72 | % | 67 | % | 79 | % | 91 | % | 38 | % | ||||||||||
| (a) | Calculated based on average shares outstanding during the period. |
| † | Amount represents less than $0.005 per share. |
See notes to financial statements.
CENTURY FUNDS
25
CENTURY GROWTH OPPORTUNITIES FUND
PORTFOLIO OF INVESTMENTS – AS OF OCTOBER 31, 2011
| Shares | Value | |
| COMMON STOCK - 93.4% | ||
| Consumer Discretionary - 16.0% | ||
Hotels, Restaurants & Leisure - 3.8% | ||
2,300 | Buffalo Wild Wings, Inc.* | $ 152,306 |
8,500 | Texas Roadhouse, Inc. | 121,805 |
274,111 | ||
Household Durables - 3.8% | ||
2,350 | Tempur-Pedic International, Inc.* | 159,941 |
2,050 | Tupperware Brands Corp. | 115,907 |
275,848 | ||
Multiline Retail - 1.9% | ||
1,750 | Dollar Tree, Inc.* | 139,930 |
Specialty Retail - 5.6% | ||
10,700 | Chico’s FAS, Inc. | 132,252 |
2,650 | DSW, Inc. Class A | 138,701 |
1,850 | O’Reilly Automotive, Inc.* | 140,692 |
411,645 | ||
Textiles, Apparel & Luxury Goods - 0.9% | ||
1,200 | lululemon Athletica, Inc.* | 67,776 |
1,169,310 | ||
| Consumer Staples - 4.6% | ||
Food & Staples Retailing - 1.8% | ||
3,700 | United Natural Foods, Inc.* | 135,087 |
Food Products - 0.7% | ||
800 | Diamond Foods, Inc. | 52,600 |
Personal Products - 2.1% | ||
2,450 | Herbalife Ltd. | 152,782 |
340,469 | ||
| Energy - 6.1% | ||
Energy Equipment & Services - 4.1% | ||
1,150 | CARBO Ceramics, Inc. | 156,227 |
2,250 | Dril-Quip, Inc.* | 146,475 |
302,702 | ||
Oil, Gas & Consumable Fuels - 2.0% | ||
3,050 | Whiting Petroleum Corp.* | 141,978 |
444,680 | ||
| Shares | Value | ||
| Financials - 4.0% | |||
Diversified Financial Services - 2.0% | |||
4,150 | Moody’s Corp. | $ 147,284 | |
Real Estate Investment Trusts (REITs) - 2.0% | |||
1,000 | Essex Property Trust, Inc. | 142,760 | |
290,044 | |||
| Health Care - 19.5% | |||
Biotechnology - 1.8% | |||
2,000 | Alexion Pharmaceuticals, Inc.* | 135,020 | |
Health Care Equipment & Supplies - 7.6% | |||
5,100 | CareFusion Corp.* | 130,560 | |
5,250 | Cyberonics, Inc.* | 151,200 | |
2,800 | Sirona Dental Systems, Inc.* | 134,120 | |
2,000 | The Cooper Cos., Inc. | 138,600 | |
554,480 | |||
Health Care Providers & Services - 4.3% | |||
1,850 | Catalyst Health Solutions, Inc.* | 101,694 | |
4,500 | Coventry Health Care, Inc.* | 143,145 | |
950 | MWI Veterinary Supply, Inc.* | 71,725 | |
316,564 | |||
Health Care Technology - 1.4% | |||
5,200 | Allscripts Healthcare Solutions, Inc.* | 99,580 | |
Pharmaceuticals - 4.4% | |||
4,000 | Questcor Pharmaceuticals, Inc.* | 162,440 | |
4,600 | Salix Pharmaceuticals Ltd.* | 157,573 | |
320,013 | |||
1,425,657 | |||
| Industrials - 15.1% | |||
Aerospace & Defense - 2.1% | |||
4,100 | BE Aerospace, Inc.* | 154,693 | |
Electrical Equipment - 3.9% | |||
1,850 | Roper Industries, Inc. | 150,035 | |
4,450 | Sensata Technologies Holding NV* | 133,233 | |
283,268 | |||
See notes to financial statements.
CENTURY FUNDS
26
CENTURY GROWTH OPPORTUNITIES FUND (CONTINUED)
PORTFOLIO OF INVESTMENTS – AS OF OCTOBER 31, 2011
| Shares | Value | |
| Industrials (Continued) | ||
Machinery - 6.9% | ||
3,300 | AGCO Corp.* | $ 144,639 |
2,600 | Chart Industries, Inc.* | 146,926 |
900 | Gardner Denver, Inc. | 69,597 |
3,750 | Kennametal, Inc. | 145,837 |
506,999 | ||
Road & Rail - 2.2% | ||
2,550 | Kansas City Southern* | 161,084 |
1,106,044 | ||
| Information Technology - 24.6% | ||
Communications Equipment - 5.1% | ||
1,450 | Acme Packet, Inc.* | 52,504 |
1,700 | F5 Networks, Inc.* | 176,715 |
5,200 | Riverbed Technology, Inc.* | 143,416 |
372,635 | ||
Electronic Equipment, Instruments & | ||
Components - 0.9% | ||
1,200 | IPG Photonics Corp.* | 63,432 |
Internet Software & Services - 3.3% | ||
2,550 | Akamai Technologies, Inc.* | 68,697 |
2,150 | LogMeIn, Inc.* | 87,441 |
2,000 | OpenTable, Inc.* | 87,720 |
243,858 | ||
IT Services - 5.6% | ||
6,100 | Cardtronics, Inc.* | 152,073 |
2,100 | Syntel, Inc. | 102,690 |
3,700 | VeriFone Systems, Inc.* | 156,177 |
| 410,940 | ||
| Semiconductors & Semiconductor Equipment - 2.0% | ||
4,200 | Power Integrations, Inc. | 149,646 |
Software - 7.7% | ||
2,800 | ANSYS, Inc.* | 152,208 |
3,450 | Pegasystems, Inc. | 130,375 |
2,950 | QLIK Technologies, Inc.* | 84,282 |
6,850 | Solarwinds, Inc.* | 197,691 |
564,556 | ||
1,805,067 | ||
| Shares | Value | ||
| Materials - 1.7% | |||
| Chemicals - 1.7% | |||
| 4,600 | Intrepid Potash, Inc.* | $ 128,018 | |
| Telecommunication Services - 1.8% | |||
| Diversified Telecommunication Services - 1.8% | |||
| 2,200 | AboveNet, Inc. | 130,570 | |
| Total Investment in Common Stocks - 93.4% | |||
| (Identified cost, $6,486,741) | 6,839,859 | ||
| Short-Term Investment - 2.5% | |||
| 182,447 | State Street Institutional | ||
U.S. Government Money | |||
Market Fund | |||
| (Identified cost, $182,447) | 182,447 | ||
| Total Investments - 95.9% | |||
| (Identified cost, $6,669,188) | 7,022,306 | ||
| Other Assets in Excess | |||
| of Liabilities - 4.1% | 301,142 | ||
| Net Assets - 100% | $ 7,323,448 | ||
| * Non-income producing security | |||
See notes to financial statements.
CENTURY FUNDS
27
CENTURY GROWTH OPPORTUNITIES FUND | ||||
STATEMENT OF ASSETS AND LIABILITIES - OCTOBER 31, 2011 | ||||
| Assets: | ||||
Investments, at value (Note 1A) (Identified cost of $6,669,188) | $ | 7,022,306 | ||
Dividends receivable | 327 | |||
Receivable for investments sold | 131,526 | |||
Receivable for Fund shares sold | 363,000 | |||
Receivable from investment adviser | 15,196 | |||
Prepaid expenses | 143 | |||
Total Assets | 7,532,498 | |||
| Liabilities: | ||||
Payable to Affiliates: | ||||
Investment advisor fee (Note 4) | 4,432 | |||
Administration fees (Note 5) | 554 | |||
Accrued expenses and other liabilities | 46,891 | |||
Payable for investments purchased | 157,173 | |||
Total Liabilities | 209,050 | |||
| Net Assets | $ | 7,323,448 | ||
At October 31, 2011, net assets consisted of: | ||||
Paid-in capital | $ | 7,507,779 | ||
Accumulated net realized loss on investments | (537,449 | ) | ||
Unrealized appreciation in value of investments | 353,118 | |||
Net assets applicable to outstanding capital stock | $ | 7,323,448 | ||
Net Assets consist of: | ||||
Institutional shares | $ | 7,323,448 | ||
Shares Outstanding consist of (Note 2): | ||||
Institutional shares | 686,369 | |||
| Net Asset Value Per Share | ||||
(Represents both the offering and redemption price*) | ||||
Institutional shares | $ | 10.67 | ||
| * | In general, shares of the Fund may be redeemed at net asset value. However, upon the redemption of shares held less than 90 days, a redemption fee of 1% of the current net asset value of the shares may be assessed and retained by the Fund for the benefit of remaining shareholders. The redemption fee is accounted for as an addition to paid-in-capital. |
See notes to financial statements.
CENTURY FUNDS
28
CENTURY GROWTH OPPORTUNITIES FUND
STATEMENT OF OPERATIONS - FOR THE PERIOD ENDED* OCTOBER 31, 2011
| Investment Income: | ||||
Dividends | $ | 21,895 | ||
Total investment income | 21,895 | |||
| Expenses: | ||||
Investment adviser fee (Notes 4 and 7) | 38,034 | |||
Non-interested trustees' remuneration | 2,462 | |||
Transfer agent | 12,962 | |||
Custodian | 57,683 | |||
Administration fees (Note 5) | 4,754 | |||
Insurance | 152 | |||
Professional fees | 31,305 | |||
Registration | 21,650 | |||
Printing and other expenses | 3,354 | |||
Total expenses | 172,356 | |||
Adviser reimbursements (Note 7) | (120,059 | ) | ||
Net expenses | 52,297 | |||
Net investment loss | (30,402 | ) | ||
Realized and unrealized gain/(loss) on investments: | ||||
Net realized loss from investment transactions | (537,714 | ) | ||
Increase in unrealized appreciation on investments | 353,118 | |||
Net realized and unrealized loss on investments | (184,596 | ) | ||
Net decrease in net assets resulting from operations | $ | (214,998 | ) | |
* For the period from the Fund’s inception, November 17, 2010, to October 31, 2011. | ||||
See notes to financial statements.
CENTURY FUNDS
29
CENTURY GROWTH OPPORTUNITIES FUND | ||||
STATEMENT OF CHANGES IN NET ASSETS | ||||
| For the Period Ended | ||||
INCREASE/(DECREASE) | October 31, | |||
IN NET ASSETS: | 2011(a) | |||
Operations: | ||||
Net investment loss | $ | (30,402 | ) | |
Net realized loss on investment transactions | (537,714 | ) | ||
Change in net unrealized appreciation | 353,118 | |||
Net decrease in net assets resulting from operations | (214,998 | ) | ||
Capital share transactions - net (Note 2) | 7,538,090 | |||
Redemption fees | 356 | |||
Total increase | 7,323,448 | |||
Net Assets: | ||||
Beginning of period | 0 | |||
End of period | $ | 7,323,448 | ||
(a) For the period from the Fund’s inception, November 17, 2010, to October 31, 2011. |
See notes to financial statements.
CENTURY FUNDS
30
CENTURY GROWTH OPPORTUNITIES FUND
FINANCIAL HIGHLIGHTS - INSTITUTIONAL SHARES
| For the Period Ended | ||||
| October 31, | ||||
2011(a) | ||||
Net Asset Value, beginning of period | $ | 10.00 | ||
Income/(loss) from Investment Operations: | ||||
Net investment loss(b) | (0.07) | |||
Net realized and unrealized gain on investments | 0.74 | |||
Total income from investment operations | 0.67 | |||
Redemption fees | 0.00 | † | ||
Net Asset Value, end of period | $ | 10.67 | ||
Total Return | 6.70% | ** | ||
Ratios and supplemental data | ||||
Net assets, end of period (000 omitted) | $ | 7,323 | ||
Ratio of expenses to average net assets | 1.10% | * | ||
Ratio of expenses to average net assets without | ||||
giving effect to contractual expense agreement | 3.62% | * | ||
Ratio of net investment loss to average net assets | (0.64)% | * | ||
Portfolio Turnover Rate | 119% | ** | ||
| (a) | For the period from the Fund’s inception, November 17, 2010, to October 31, 2011. |
| (b) | Calculated based on average shares outstanding during the period. |
| † | Amount represents less than $0.005 per share. |
| ** | Not annualized |
| * | Annualized |
See notes to financial statements.
CENTURY FUNDS
31
NOTES TO FINANCIAL STATEMENTS
(1) SIGNIFICANT ACCOUNTING POLICIES –– Century Capital Management Trust (the “Trust”) is registered under the Investment Company Act of 1940 (“1940 Act”), as amended, as an open-end management investment company organized as a Massachusetts business trust. Century Shares Trust, Century Small Cap Select Fund and Century Growth Opportunities Fund (each a “Fund” and, collectively, the “Funds”) are diversified series of the Trust.The Century Growth Opportunities Fund commenced operations on November 17, 2010. The Century Growth Opportunities Fund seeks long-term capital growth by investing primarily in stocks of small and medium-sized U.S. companies. The following is a summary of significant accounting policies consistently followed by the Funds in the preparation of their financial statements. The following are significant accounting policies consistently followed by the Funds and are in conformity with accounting principles generally accepted in the United States (GAAP).
A. Security Valuations –– Equity securities are valued at the last reported sale price or official closing price on the primary exchange or market on which they are traded, as reported by an independent pricing service. If no sale price or official closing price is reported, market value is generally determined based on quotes or closing prices obtained from a quotation reporting system, established market maker, or reputable pricing service. For unlisted securities and for exchange-listed securities for which there are no reported sales or official closing prices, fair value is generally determined using closing bid prices. Short-term obligations, maturing in 60 days or less, are valued at amortized cost, which approximates fair value. Investments in open-end mutual funds are valued at their closing net asset value each business day.
Under GAAP for fair value measurements, a three tier hierarchy to prioritize the assumptions, referred to as inputs, is used in valuation techniques to measure fair value.
| · | Level 1 – quoted prices in active markets for identical investments |
| · | Level 2 – significant other observable inputs (including quoted prices for similar investments, interest rates, prepayment speeds, credit risk, etc.) |
| · | Level 3 – significant unobservable inputs (including the Fund’s own assumptions in determining the fair value of investments) |
The inputs or methodology used for valuing securities are not necessarily an indication of the risk associated with investing in those securities.
The following is a summary of the inputs used as of October 31, 2011 in valuing the Funds’ investments carried at fair value:
| Quoted Prices | Significant | |||||||||||||||
| In Active | Other | Significant | ||||||||||||||
| Markets for | Observable | Unobservable | ||||||||||||||
| Identical Assets | Inputs | Inputs | ||||||||||||||
| (Level 1) | (Level 2) | (Level 3) | Total | |||||||||||||
| Century Shares Trust | ||||||||||||||||
Common Stock* | $ | 175,426,269 | $ | — | $ | — | $ | 175,426,269 | ||||||||
Money Market Funds | 2,932,962 | — | — | 2,932,962 | ||||||||||||
Total Investments | $ | 178,359,231 | $ | — | $ | — | $ | 178,359,231 | ||||||||
| Century Small Cap Select Fund | ||||||||||||||||
Common Stock* | $ | 354,762,273 | $ | — | $ | — | $ | 354,762,273 | ||||||||
Money Market Funds | 17,549,302 | — | — | 17,549,302 | ||||||||||||
Total Investments | $ | 372,311,575 | $ | — | $ | — | $ | 372,311,575 | ||||||||
CENTURY FUNDS
32
| Quoted Prices | Significant | |||||||||||||||
| In Active | Other | Significant | ||||||||||||||
| Market for | Observable | Unobservable | ||||||||||||||
| Identical Assets | Inputs | Inputs | ||||||||||||||
| (Level 1) | (Level 2) | (Level 3) | Total | |||||||||||||
| Century Growth Opportunities Fund | ||||||||||||||||
Common Stock* | $ | 6,839,859 | $ | — | $ | — | $ | 6,839,859 | ||||||||
Money Market Funds | 182,447 | — | — | 182,447 | ||||||||||||
Total Investments | $ | 7,022,306 | $ | — | $ | — | $ | 7,022,306 | ||||||||
* At October 31, 2011 the Funds held investments in common stocks classified as Level 1, with corresponding major categories as shown on each Fund’s Portfolio of Investments.
B. Security Transactions –– Security transactions are recorded on a trade date basis. Gain or loss on sales is determined by the use of a specific identification method, for both financial reporting and federal income tax purposes. Dividend income is recorded on the ex-dividend date. Payments received from certain investments held by the Funds may be comprised of dividends, capital gains and return of capital. The Funds originally estimate the expected classification of such payments. The amounts may subsequently be reclassified upon receipt of information from the issuer. The Funds may invest in equity securities issued or guaranteed by companies organized and based in countries outside of the United States. These securities may be traded on foreign securities exchanges or in foreign over-the-counter markets. Foreign dividend income is recorded on ex-dividend date or as soon as practicable after the Fund determines the existence of a dividend declaration after exercising reasonable due diligence. Foreign income and capital gain on some foreign securities may be subject to foreign withholding taxes, which are accrued as applicable. Interest income is recorded daily on an accrual basis.
C. Use of Estimates –– The preparation of these financial statements in accordance with GAAP incorporates estimates made by management in determining the reported amounts of assets, liabilities, income and expenses of the Funds. Actual results could differ from those estimates.
D. Risks and Uncertainty — Century Small Cap Select Fund concentrates its investments in certain industries detailed in the Portfolio of Investments, which subjects the Fund to the risks associated with those industries and may result in greater fluctuation in share value than is experienced in more diversified portfolios. In addition, the Fund invests in smaller companies, which generally involves greater risk than investing in larger, more established companies.
Century Shares Trust may invest a significant portion of assets in a limited number of companies. As a result, the Fund may be more susceptible to financial, market and economic events affecting particular companies and therefore may experience greater price volatility than funds with more diversified portfolios.
Century Growth Opportunities Fund invests mainly in small-cap and mid-cap companies, which, historically, have been more volatile in price than the stocks of large-cap companies.
Foreign investing involves certain risks and increased volatility not associated with investing solely in the U.S. These risks include currency fluctuations, economic or financial instability, lack of timely or reliable financial information or unfavorable political or legal developments.
At any given time, a significant portion of the assets of each Fund may be invested in securities of companies within the same market sector of the economy. Companies within the same sector often face similar issues and, consequently, may react similarly to changes in market conditions. If a Fund has a significant weighting in one or more sectors, it may be subject to more risk and price volatility.
E. Multiple Classes of Shares –– Century Small Cap Select Fund offers two classes of shares, which differ in their respective distribution and service fees. Investment income, realized and unrealized capital gains and losses, the common expenses of the Fund, and certain fund-level expense reductions, if any, are allocated on a pro rata basis to each class based on the relative net assets of each class to the total net assets of the Fund. Certain expense reductions may differ by class. Because transfer agent fees include a per account fee, each class differs with respect to transfer agent fees incurred.
CENTURY FUNDS
33
Prior to May 27, 2011, Century Shares Trust offered two classes of shares; however, effective as of that date, all 61,614 of the Fund’s issued and outstanding Investor Shares were converted to Institutional Shares and the Investor Shares class was closed.
F. Redemption Fees –– In general, shares of each Fund may be redeemed at net asset value. However, upon the redemption of shares held less than 90 days, a redemption fee of 1% of the current net asset value of the shares may be assessed and retained by each share class of each Fund for the benefit of the Fund’s remaining shareholders. The redemption fee is accounted for as an addition to paid-in-capital.
G. Income Tax Information and Distributions to Shareholders –– Each year, each Fund intends to qualify as a regulated investment company by distributing all of its taxable income and sufficient net investment income and net realized gains, if any, under Subchapter M of the Internal Revenue Code. As a result, no provision for income taxes is required in the accompanying financial statements. Foreign taxes are provided for based on each Fund’s understanding of the tax rules and rates that exist in the foreign markets in which it invests. Income dividends and capital gain distributions are declared separately for each class. Distributions are recorded on the ex-dividend date. Income and capital gain distributions are determined in accordance with income tax regulations, which may differ from generally accepted accounting principles. Capital accounts within the financial statements are adjusted for permanent book and tax differences. Generally accepted accounting principles require that any distributions in excess of tax basis earnings and profits be reported in the financial statements as a tax return of capital.
In order to present undistributed (distributions in excess of) net investment income (“UNII”) and accumulated net realized loss (“Accumulated Loss”) more closely to its tax character, the following accounts for each Fund were increased (decreased):
| Paid-In | Accumulated | |||||||||||
| Capital | UNII | gain/loss | ||||||||||
Century Shares Trust | $ | — | $ | 238,544 | $ | (238,544 | ) | |||||
Century Small Cap Select Fund | $ | (2,638,940 | ) | $ | 1,865,136 | $ | 773,804 | |||||
Century Growth Opportunities Fund | $ | (30,667 | ) | $ | 30,402 | $ | 265 | |||||
These reclassifications have no impact on net assets or the results of operations. The Funds had temporary book/tax differences primarily attributable to wash sales or portfolio securities and permanent book/tax differences primarily attributable to net operating losses. Temporary differences will reverse in a subsequent period.
The federal income tax cost of investments and tax-basis components of distributable earnings as of October 31, 2011 were as follows:
| Century Shares Trust | ||||
Gross unrealized appreciation | $ | 43,265,408 | ||
Gross unrealized depreciation | (3,961,983 | ) | ||
Unrealized net appreciation | $ | 39,303,425 | ||
Cost for federal income tax purposes | $ | 139,055,806 | ||
Undistributed ordinary income | $ | 621,899 | ||
Undistributed capital gains | 17,549,643 | |||
Unrealized appreciation | 39,303,425 | |||
Total | $ | 57,474,967 | ||
The differences between the components of distributable earnings on a tax basis and the amounts reflected in the Statement of Assets and Liabilities are primarily due to wash sales.
CENTURY FUNDS
34
The tax character of distributions paid were as follows: | ||||||||
| Year Ended October 31, | ||||||||
| 2011 | 2010 | |||||||
Ordinary income | ||||||||
Institutional Shares | $ | 51,630 | $ | 47,060 | ||||
Long-term capital gain | ||||||||
Institutional Shares | $ | 7,888,685 | $ | — | ||||
Investor Shares | $ | 73,860 | $ | — | ||||
The federal income tax cost of investments and tax-basis components of distributable earnings as of October 31, 2011 were as follows:
| Century Small Cap Select Fund | ||||
Gross unrealized appreciation | $ | 77,489,122 | ||
Gross unrealized depreciation | (25,884,847 | ) | ||
Unrealized net appreciation | $ | 51,604,275 | ||
Cost for federal income tax purposes | $ | 320,707,300 | ||
Capital loss carryforward | $ | (76,901,648 | ) | |
Unrealized appreciation | 51,604,275 | |||
Total | $ | (25,297,373 | ) | |
The differences between the components of distributable earnings on a tax basis and the amounts reflected in the Statement of Assets and Liabilities are primarily due to wash sales.
As of October 31, 2011, the Fund had a capital loss carryforward of $76,901,648 which will expire on October 31, 2017. This carry-forward may be used to offset future capital gains to the extent provided by regulations.
During the year ended October 31, 2011 the Fund utilized a net capital loss carryforward of $79,934,430.
The Fund did not pay any distributions for the years ended October 31, 2011 and 2010.
The federal income tax cost of investments and tax-basis components of distributable earnings as of October 31, 2011 were as follows:
| Century Growth Opportunities Fund | ||||
Gross unrealized appreciation | $ | 550,273 | ||
Gross unrealized depreciation | (232,589 | ) | ||
Unrealized net appreciation | $ | 317,684 | ||
Cost for federal income tax purposes | $ | 6,704,622 | ||
Capital loss carryforward | $ | (502,015 | ) | |
Unrealized appreciation | 317,684 | |||
Total | $ | (184,331 | ) | |
The differences between the components of distributable earnings on a tax basis and the amounts reflected in the Statement of Assets and Liabilities are primarily due to wash sales and real estate investment trust basis adjustments.
As of October 31, 2011, the Fund had a capital loss carryforward of $502,015 which will expire on October 31, 2019.This carryforward may be used to offset future capital gains to the extent provided by regulations.
The Fund did not pay any distributions for the year ended October 31, 2011.
CENTURY FUNDS
35
As of October 31, 2011, the Funds had no uncertain tax positions that would require financial statement recognition or disclosure. The Funds’ federal tax returns filed for the fiscal years ended October 31, 2008, October 31, 2009 and October 31, 2010 remain subject to examination by the Internal Revenue Service.
H. Indemnifications — In the normal course of business, the Funds enter into agreements with service providers that may contain indemnification clauses. The Funds maximum exposure under these arrangements is unknown as this would involve future claims that may be made against the Funds that have not yet occurred.
(2) TRANSACTIONS IN SHARES
Century Shares Trust –– The number of authorized shares is unlimited. Transactions in each class of shares were as follows:
| Year Ended October 31, 2011 | ||||||||||||||||
| Institutional Shares | Investor Shares | |||||||||||||||
| Shares | Amount | Shares | Amount | |||||||||||||
Sold | 187,391 | $ | 3,869,392 | 5,111 | $ | 105,667 | ||||||||||
Issued to shareholders in reinvestment of | ||||||||||||||||
distributions from: | ||||||||||||||||
Net investment income and capital gains | 348,040 | 7,019,974 | 3,523 | 70,955 | ||||||||||||
| 535,431 | 10,889,366 | 8,634 | 176,622 | |||||||||||||
Repurchased | (978,916 | ) | (20,173,913 | ) | (29,936 | ) | (628,438 | ) | ||||||||
Shares converted* | 61,436 | 1,331,322 | (61,614 | ) | (1,331,322 | ) | ||||||||||
Net increase (decrease) | (382,049 | ) | $ | (7,953,225 | ) | (82,916 | ) | $ | (1,783,138 | ) | ||||||
* On May 27, 2011, all 61,614 Investor Shares converted into Institutional Shares and the Investor Shares class was closed.
| Year Ended October 31, 2010 | ||||||||||||||||
| Institutional Shares | Investor Shares | |||||||||||||||
| Shares | Amount | Shares | Amount | |||||||||||||
Sold. | 173,736 | $ | 3,164,426 | 34,109 | $ | 654,481 | ||||||||||
Issued to shareholders in reinvestment of | ||||||||||||||||
distributions from: | ||||||||||||||||
Net investment income | 2,175 | 39,358 | — | — | ||||||||||||
| 175,911 | 3,203,784 | 34,109 | 654,481 | |||||||||||||
Repurchased | (1,062,442 | ) | (19,576,908 | ) | (13,509 | ) | (250,153 | ) | ||||||||
Net increase (decrease) | (886,531 | ) | $ | (16,373,124 | ) | 20,600 | $ | 404,328 | ||||||||
Century Small Cap Select Fund –– The number of authorized shares is unlimited. Transactions in each class of shares were as follows:
| Year Ended October 31, 2011 | ||||||||||||||||
| Institutional Shares | InvestorShares | |||||||||||||||
| Shares | Amount | Shares | Amount | |||||||||||||
Sold | 2,529,433 | $ | 61,015,656 | 2,015,598 | $ | 48,942,430 | ||||||||||
Repurchased | (3,756,263 | ) | (93,461,220 | ) | (1,517,651 | ) | (35,471,723 | ) | ||||||||
Net increase (decrease) | (1,226,830 | ) | $ | (32,445,564 | ) | 497,947 | $ | 13,470,707 | ||||||||
CENTURY FUNDS
36
| Year Ended October 31, 2010 | ||||||||||||||||
| Institutional Shares | Investor Shares | |||||||||||||||
| Shares | Amount | Shares | Amount | |||||||||||||
Sold | 2,490,612 | $ | 44,991,279 | 524,604 | $ | 9,706,292 | ||||||||||
Repurchased | (3,847,595 | ) | (69,892,481 | ) | (1,740,681 | ) | (31,160,417 | ) | ||||||||
Net (decrease) | (1,356,983 | ) | $ | (24,901,202 | ) | (1,216,077 | ) | $ | (21,454,125 | ) | ||||||
Century Growth Opportunities Fund –– The number of authorized shares is unlimited. Transactions were as follows:
| The Period Ended October 31, 2011* | ||||||||
| Institutional Shares | ||||||||
| Shares | Amount | |||||||
Sold | 712,248 | $ | 7,820,330 | |||||
Repurchased | (25,879 | ) | (282,240 | ) | ||||
Net increase | 686,369 | $ | 7,538,090 | |||||
* For the period from the Fund’s inception, November 17, 2010 to October 31, 2011.
(3) INVESTMENT SECURITIES TRANSACTIONS
Century Shares Trust purchases and sales of investment securities (excluding short-term securities and U.S. Government obligations) aggregated $130,440,702 and $143,855,482, respectively, during the year ended October 31, 2011.
Century Small Cap Select Fund purchases and sales of investment securities (excluding short-term securities and U.S. Government obligations) aggregated $283,678,200 and $310,246,572, respectively, during the year ended October 31, 2011.
Century Growth Opportunities Fund purchases and sales of investment securities (excluding short-term securities and U.S. Government obligations) aggregated $12,456,201 and $5,431,746, respectively, for the period from November 17, 2010 (the Fund’s inception date) through October 31, 2011.
(4) INVESTMENT ADVISER FEE
Century Shares Trust: The Trust has entered into an Investment Advisory Agreement (the “Agreement”) with Century Capital Management, LLC (“CCM”) pursuant to which CCM provides an investment program for Century Shares Trust. Under the Agreement, the Fund pays a management fee based on the Fund’s average daily net assets computed at the following annual rates: 0.80% of the first $500 million and 0.70% of the amounts exceeding $500 million.
Century Small Cap Select Fund: The Trust has entered into an Investment Advisory and Management Services Agreement (the “Agreement”) with CCM pursuant to which CCM provides investment advisory, management and administrative services to Century Small Cap Select Fund. Under the Agreement, the Fund pays a monthly management fee at the annual rate of 0.95% of the Fund’s average daily net assets.
Century Growth Opportunities Fund: The Trust has entered into an Investment Advisory Agreement (the “Agreement”) with CCM pursuant to which CCM provides investment advisory services to Century Growth Opportunities Fund. Under the Agreement, the Fund pays a management fee based on the Fund’s average daily net assets computed at the following annual rates: 0.80% of the first $500 million and 0.75% thereafter.
CENTURY FUNDS
37
(5) ADMINISTRATION FEES
Century Shares Trust: The Trust has entered into an Administration Agreement with CCM pursuant to which CCM provides certain administrative services to Century Shares Trust at the annual rate of 0.10% of the Fund’s average daily net assets.
Century Small Cap Select Fund: Per the Investment Advisory and Management Services Agreement between the Trust and CCM, Century Small Cap Select Fund reimburses CCM for expenses associated with having the adviser’s personnel perform shareholder service functions and certain financial, accounting, administrative and clerical services.
Century Growth Opportunities Fund: The Trust has entered into an Administration Agreement with CCM pursuant to which CCM provides certain administrative services to Century Growth Opportunities Fund at the annual rate of 0.10% of the Fund’s average daily net assets.
CCM has entered into a Sub-Administration Agreement with State Street Bank and Trust Company (“State Street”) pursuant to which State Street provides certain administrative services to each Fund on behalf of CCM. CCM pays State Street a sub-administration fee for sub-administration services provided to each Fund.
(6) DISTRIBUTION AND SERVICE FEES –– The Trust has adopted Distribution and Service Plans (the “Plans”) pursuant to Rule 12b-1 under the 1940 Act on behalf of Century Shares Trust and Century Small Cap Select Fund. The Plans authorize each Fund to pay up to 0.25% of the average daily net assets of the Funds’ Investor Shares class for distribution and shareholder services. The Plans may be terminated at any time by the vote of a majority of the independent Trustees or by the vote of the holders of a majority of the outstanding shares of the Investor Shares.
The Rule 12b-1 Plan for Century Shares Trust was terminated following the conversion of the Fund’s Investor Shares to Institutional Shares.
The Trust has entered into agreements with financial intermediaries to provide recordkeeping, processing, shareholder communications and other services to customers of the intermediaries and have agreed to compensate the intermediaries for providing such services. Certain services would be provided by the Funds if the shares of each customer were registered directly with the Funds’ transfer agent. Each Fund pays a portion of the intermediary fees attributable to shares of the Fund not exceeding the estimated expense the Fund would have paid its transfer agent had each customer’s shares been registered directly with the transfer agent instead of held through the intermediary accounts.
(7) ADVISER REIMBURSEMENTS
Century Shares Trust: CCM contractually agreed to limit the operating expenses of the Century Shares Trust Investor Shares to 1.45% through February 28, 2012. However, effective May 27, 2011, all the issued and outstanding Investor Shares were converted to Institutional Shares and the Investor Shares class was closed.
Century Growth Opportunities Fund: CCM contractually agreed to limit the operating expenses of Century Growth Opportunity Fund to 1.10% of average daily net assets through February 28, 2012.
CCM may, out of its own resources and without additional cost to the Funds or their shareholders, provide compensation to certain financial intermediaries, such as broker-dealers and financial advisors, in connection with the sale of shares of the Funds or the provision of services to Fund shareholders. For example, such compensation may be paid to an intermediary for providing access to a third party platform, such as a mutual fund supermarket, or for providing services to shareholders who invest via such a platform. This compensation is in addition to any distribution and service fees paid by the Funds pursuant to a Rule 12b-1 Plan and in addition to subtransfer agency fees paid by the Funds.
(8) SUBSEQUENT EVENTS - In preparing the financial statements as of October 31, 2011, management considered the impact of subsequent events for potential recognition or disclosure in these financial statements.
CENTURY FUNDS
38
REPORT OF INDEPENDENT REGISTERED PUBLIC ACCOUNTING FIRM
To the Trustees of Century Capital Management Trust and Shareholders of Century Shares Trust, Century Small Cap Select Fund and Century Growth Opportunities Fund (collectively, the “Funds”):
We have audited the accompanying statements of assets and liabilities, including the portfolios of investments, of Century Shares Trust and Century Small Cap Select Fund, each a series of Century Capital Management Trust (the “Trust”), as of October 31, 2011, and the related statements of operations for the year then ended, the statements of changes in net assets for each of the two years in the period then ended, and the financial highlights for each of the five years in the period then ended. We have also audited the accompanying statement of assets and liabilities, including the portfolio of investments, of Century Growth Opportunities Fund, a series of the Trust, as of October 31, 2011, and the related statements of operations, changes in net assets and the financial highlights for the period from inception, November 17, 2010, to October 31, 2011. These financial statements and financial highlights are the responsibility of the Trust's management. Our responsibility is to express an opinion on these financial statements and financial highlights based on our audits.
We conducted our audits in accordance with the standards of the Public Company Accounting Oversight Board (United States).Those standards require that we plan and perform the audit to obtain reasonable assurance about whether the financial statements and financial highlights are free of material misstatement. The Trust is not required to have, nor were we engaged to perform, an audit of its internal control over financial reporting. Our audits included consideration of internal control over financial reporting as a basis for designing audit procedures that are appropriate in the circumstances, but not for the purpose of expressing an opinion on the effectiveness of the Funds' internal control over financial reporting. Accordingly, we express no such opinion. An audit also includes examining, on a test basis, evidence supporting the amounts and disclosures in the financial statements, assessing the accounting principles used and significant estimates made by management, as well as evaluating the overall financial statement presentation. Our procedures included confirmation of securities owned as of October 31, 2011, by correspondence with the custodian; where replies were not received from brokers, we performed other auditing procedures. We believe that our audits provide a reasonable basis for our opinion.
In our opinion, the financial statements and financial highlights referred to above present fairly, in all material respects, the financial position of Century Shares Trust, Century Small Cap Select Fund and Century Growth Opportunities Fund as of October 31, 2011, and the results of operations of Century Shares Trust and Century Small Cap Select Fund for the year then ended, the changes in their net assets for each of the two years in the period then ended, and the financial highlights for each of the five years in the period then ended, and the results of operations, changes in its net assets, and the financial highlights of Century Growth Opportunities Fund for the period from inception, November 17, 2010, to October 31, 2011, in conformity with accounting principles generally accepted in the United States of America.
DELOITTE & TOUCHE LLP
Boston, Massachusetts
December 19, 2011
CENTURY FUNDS
39
SHAREHOLDER EXPENSE EXAMPLE
As a shareholder of a Fund, you incur two types of costs: (1) transaction costs including redemption fees, and (2) ongoing costs, including management fees, distribution and service fees (in the case of Investor Shares of both Funds) and other Fund expenses. This Example is intended to help you understand your ongoing costs (in dollars) of investing in the Fund and to compare those costs with the ongoing costs of investing in other mutual funds.
The Example is based on an investment of $1,000 invested at the beginning of the period and held for the period ended October 31, 2011.
Actual Expenses
The first line of the following table provides information about actual account values and actual expenses. You may use the information in this line, together with the amount you invested, to estimate the expenses that you paid over the period. Simply divide your account value by $1,000.00 (for example, an $8,600 account value divided by $1,000.00=8.6), then multiply the result by the number in the first line under the heading entitled “Expenses Paid During Period” to estimate the expenses you paid on your account during this period. An annual maintenance fee of $10.00 that is charged once a year may apply for certain IRA accounts. This fee is not included in the table below. If it were, the estimate of expenses you paid during the period would be higher, and your ending account value lower, by this amount.
Hypothetical Example for Comparison Purposes
The second line of the following table provides information about hypothetical account values and hypothetical expenses based on the Fund’s actual expense ratio and an assumed rate of return of 5% per year before expenses, which is not the Fund’s actual return. The hypothetical account values and expenses may not be used to estimate the actual ending account balance or expenses you paid for the period. You may use this information to compare the ongoing costs of investing in the Fund and other funds. To do so, compare this 5% hypothetical example with the 5% hypothetical examples that appear in the shareholder reports of the other funds.
Please note that the expenses shown in the table are meant to highlight your ongoing costs only and do not reflect any transactional costs such as redemption fees. Therefore, the second line of the table is useful in comparing ongoing costs only, and will not help you determine the relative total costs of owning different funds. In addition, if these transactional costs were included, your costs would have been higher.
| Century Shares Trust | Expenses Paid | |||||||||||
| Beginning | Ending | During Period* | ||||||||||
| Account Value | Account Value | Six Months Ending | ||||||||||
| May 1, 2011 | October 31, 2011 | October 31, 2011 | ||||||||||
Based on Actual Fund Return | ||||||||||||
Institutional Shares | $ | 1,000.00 | $ | 935.30 | $ | 5.46 | ||||||
Based on Hypothetical 5% Yearly Return before expenses | ||||||||||||
Institutional Shares | $ | 1,000.00 | $ | 1,019.56 | $ | 5.70 | ||||||
| * | The Fund's annualized expense ratio is 1.12%. The dollar amounts shown as “Expenses Paid” are equal to the annual expense ratio multiplied by the average account value over the period, multiplied by the number of days in the most recent fiscal period (184) divided by 365. |
CENTURY FUNDS
40
| Century Small Cap Select Fund | Expenses Paid | |||||||||||
| Beginning | Ending | During Period* | ||||||||||
| Account Value | Account Value | Six Months Ending | ||||||||||
| May 1, 2011 | October 31, 2011 | October 31, 2011 | ||||||||||
Based on Actual Fund Return | ||||||||||||
Institutional Shares | $ | 1,000.00 | $ | 874.20 | $ | 5.29 | ||||||
Investor Shares | $ | 1,000.00 | $ | 872.70 | $ | 7.32 | ||||||
Based on Hypothetical 5% Yearly Return before expenses | ||||||||||||
Institutional Shares | $ | 1,000.00 | $ | 1,019.56 | $ | 5.70 | ||||||
Investor Shares | $ | 1,000.00 | $ | 1,017.39 | $ | 7.88 | ||||||
| * | The Fund’s annualized expense ratios are 1.12% for Institutional Shares and 1.55% for Investor Shares. The dollar amounts shown as “Expenses Paid” are equal to the annual expense ratio multiplied by the average account value over the period, multiplied by the number of days in the most recent fiscal period (184) divided by 365. |
| Century Growth Opportunities Fund | Expenses Paid | |||||||||||
| Beginning | Ending | During Period* | ||||||||||
| Account Value | Account Value | Six Months Ending | ||||||||||
| May 1, 2011 | October 31, 2011 | October 31, 2011 | ||||||||||
Based on Actual Fund Return | ||||||||||||
Institutional Shares | $ | 1,000.00 | $ | 913.50 | $ | 5.31 | ||||||
Based on Hypothetical 5% Yearly Return before expenses | ||||||||||||
Institutional Shares | $ | 1,000.00 | $ | 1,019.66 | $ | 5.60 | ||||||
| * | The Fund’s annualized expense ratio (net of reimbursements) is 1.10%. The dollar amounts shown as “Expenses Paid” are equal to the annual expense ratio multiplied by the average account value over the period, multiplied by the number of days in the most recent fiscal period (184) divided by 365. |
CENTURY FUNDS
41
TAX INFORMATION
(Unaudited)
The following information represents the tax status of dividends and distributions paid by the Funds during the fiscal year ended October 31, 2011. This information is presented to meet regulatory requirements and no current action on your part is required.
Century Shares Trust
For Federal Income Tax purposes, the Fund designates $51,630, or the maximum amount allowable as qualified dividend income for purposes of Internal Revenue Code Section 1(h)(11).
Pursuant to section 852 of the Internal Revenue Code, the Fund designates $7,962,545 as long-term capital gain distribution of which 100% represents 15% rate gains.
Please consult a tax advisor if you have questions about federal or state income tax laws, or on how to prepare your tax returns.
CENTURY FUNDS
42
MANAGEMENT OF THE FUNDS
The following table provides certain information regarding the Trustees and officers of Century Shares Trust, Century Small Cap Select Fund and Century Growth Opportunities Fund as of October 31, 2011. Unless otherwise noted, (i) each Trustee and officer has engaged in the principal occupation(s) noted in the table for at least the most recent five years, although not necessarily in the same capacity, and (ii) the address of each Trustee and officer is c/o Century Capital Management, 100 Federal Street, 29th Floor, Boston, Massachusetts 02110. Each Trustee’s term of office continues until the Trustee retires, resigns or is removed in accordance with the Declaration of Trust or until the next shareholders’ meeting called for the purpose of electing Trustees and until the election and qualification of a successor.
| No. of | ||
| Portfolios | ||
| in | ||
| Name, Year of Birth, | Fund | |
| Position(s) held with Trust | Principal Occupation During Past 5 Years | Complex |
| and Length of Service | And Other Directorships Held | Overseen |
William Gray (1952) | Senior Advisor, The Blackstone Group (private equity firm); Special | 3 |
Trustee, 2006 to present | Advisor, Chi & Partners (advertising firm). Formerly, Vice Chairman, | |
Ogilvy & Mather Group, NA (advertising firm) (retired 2010). Other | ||
Directorships: American Red Cross of Greater New York, (Chairman | ||
2002-2008, Member since 1996); The New York Public Library; | ||
Wakeman Boys & Girls Club; First Tee of Connecticut. | ||
Laura A. Johnson (1954) | President, Massachusetts Audubon Society. Other Directorships: | 3 |
Trustee, 2007 to present | Corporation Member, Woods Hole Oceanographic Institute; Stewardship | |
Council, Massachusetts Department of Conservation and Recreation; | ||
Land Trust Alliance. | ||
Stephen W. Kidder (1952) | Managing Partner, Hemenway & Barnes (law firm). Other Directorships: | 3 |
Trustee, 2005 to present | Trustee, Wellesley College; Trustee, Isabella Stewart Gardner Museum; | |
Trustee, Children’s Hospital Trust; Director, The Concord Bookshop, Inc. | ||
Jerry S. Rosenbloom (1939) | Frederick H. Ecker Emeritus Professor of Insurance and Risk Management | 3 |
Trustee, 1998 to present | and Academic Director, Certified Employee Benefit Specialist Program, | |
The Wharton School, University of Pennsylvania. Other Directorships: | ||
Harleysville Group, Inc.; American Institute for Chartered Property Casualty | ||
Underwriters; S.S. Huebner Foundation for Insurance Education. Former | ||
Directorships: MBIA Claymore Managed Municipal Bond Fund | ||
(through June 2006). | ||
David D. Tripple (1944) | Private investor. Formerly, Chief Executive Officer and Trustee, Pioneer | 3 |
Trustee, 2004 to present | Funds (2000 to 2001); Executive Vice President and Director, The Pioneer | |
Group, Inc. (asset management) (1998 to 2000). Other Directorships: The | ||
| Calamos Funds (overseeing 19 portfolios in fund complex). | ||
CENTURY FUNDS
43
| No. of | ||
| Portfolios | ||
| in | ||
| Name, Year of Birth, | Fund | |
| Position(s) held with Trust | Principal Occupation During Past 5 Years | Complex |
| and Length of Service | And Other Directorships Held | Overseen |
Ellen M. Zane (1951) | Retired. Formerly, President and Chief Executive Officer, Tufts Medical | 3 |
Trustee, 2007 to present | Center and Floating Hospital for Children (2004 to 2011); Network | |
President, Partners Healthcare System (1994 to 2004). Other Directorships: | ||
Parexel International Corporation; Lincare Holdings Inc.; Fiduciary Trust | ||
Company; Harvard School of Public Health, Health Policy & Management | ||
Executive Council; Trustee, George Washington University; Massachusetts | ||
Hospital Association; Sisters of Mercy Health System – St. Louis. |
Interested Trustees and Officers1 | ||
Alexander L. Thorndike (1966) | Managing Partner, Century Capital Management, LLC. No | 3 |
Trustee, 1999 to present; | other directorships. | |
Chairman and Principal | ||
Executive Officer, | ||
2004 to present | ||
Davis R. Fulkerson (1965) | Managing Partner, Century Capital Management, LLC. No | 3 |
Trustee, 2000 to present | other directorships. | |
Julie A. Smith (1971) | Chief Financial Officer, Century Capital Management, LLC | N/A |
Principal Financial Officer, | (May 2008 to present); prior thereto, Controller, Third Avenue | |
2008 to present | Management LLC (1997 to 2006). | |
Maureen E. Kane (1962) | General Counsel, Century Capital Management, LLC. | N/A |
Chief Legal Officer, 2006 | ||
to present; Secretary, 2007 | ||
to present; Chief Compliance | ||
Officer, 2009 to present | ||
| (1) | Each person listed is considered an “interested person” of the Trust within the meaning of the 1940 Act by virtue of being an officer or employee of the Adviser. |
The Statement of Additional Information (“SAI”) for each Fund includes additional information about the Trustees. The SAI is available, without charge, upon request. If you would like to request a copy of the SAI, you may do so by calling the following toll-free number: (800) 321-1928.
CENTURY FUNDS
44
FUND INFORMATION
PORTFOLIO HOLDINGS
Each fund files a complete schedule of its portfolio holdings with the SEC for the first and third quarters of the fund’s fiscal year on Form N-Q. The Forms N-Q are available on the SEC’s website at http://www.sec.gov, and they may be reviewed and copied at the SEC’s Public Reference Room in Washington, DC. Information on the operation of the SEC’s Public Reference Room may be obtained by calling 1-800-SEC-0330.
PROXY VOTING
A description of the policies and procedures that each fund uses to determine how to vote proxies relating to portfolio securities and each fund’s proxy voting record for the 12-month period ended June 30 are available, without charge, upon request, by calling 1-800-321-1928. You may also obtain a copy of the funds’ proxy voting policies and procedures and proxy voting record on the SEC’s website at http://www.sec.gov.
FOR MORE INFORMATION
For more information about the Century Funds, please call 1-800-303-1928.
| Regular Mailing Address: | Overnight Mailing Address: |
Century Funds | Century Funds |
P.O. Box 588 | c/o Atlantic Shareholder Services, LLC |
Portland, ME 04112 | 3 Canal Plaza, Ground Floor |
Portland, ME 04101 | |
| Investment Adviser | Distributor |
Century Capital Management, LLC | Foreside Fund Services |
100 Federal Street | 3 Canal Plaza, Suite 100 |
Boston, MA 02110 | Portland, ME 04101 |
www.foreside.com |
Item 2. Code of Ethics.
As of the end of the period covered by this report, Century Capital Management Trust has adopted a code of ethics, as defined in Item 2 of Form N-CSR, that applies to its Principal Executive Officer, Principal Financial Officer and Principal Accounting Officer.
During the period covered by this report, there were no amendments to, or waivers from, any provision of the code of ethics.
A copy of the code of ethics is filed as an exhibit hereto.
Item 3. Audit Committee Financial Expert.
The Board of Trustees has determined that Jerry Rosenbloom, who is a member of the Century Capital Management Trust Board of Trustees and Audit Committee, qualifies as an audit committee financial expert. Mr. Rosenbloom is an independent trustee, as defined in paragraph (a)(2) of this item's instructions. Mr. Rosenbloom received his B.S. degree in Business Administration from Temple University and his M.A. and Ph.D. degrees in Applied Economics, with a concentration in insurance, from the University of Pennsylvania. He is currently the Frederick H. Ecker Emeritus Professor of Insurance and Risk Management at the Wharton School. He was the past Chairman of the Insurance and Risk Management Department at Wharton and the past Executive Director of the S.S. Huebner Foundation for Insurance Education. He has served on the Boards of Directors of mutual funds and insurance companies, including in the capacity of audit committee member, and he has served as a consultant to numerous companies, funds and associations. In connection with his directorships and audit committee memberships, as well as his academic and teaching activities and his consulting activities for public and private companies, Mr. Rosenbloom has evaluated financial statements containing a breadth and level of complexity of accounting issues comparable to those that may arise in the financial statements of the Funds, and he has developed an understanding of internal controls and procedures for financial reporting, as well as audit committee functions. The SEC has stated that the designation or identification of a person as an audit committee financial expert pursuant to this Item 3 of Form N-CSR does not impose on such person any duties, obligations or liability that are greater than the duties, obligations and liability imposed on such person as a member of the Audit Committee and the Board of Trustees in the absence of such designation or identification.
Item 4. Principal Accountant Fees and Services.
| (a) | Audit Fees. The aggregate fees billed to the Trust for each of the last two fiscal years for professional services rendered by the principal accountant for the audit of the financial statements of Century Capital Management Trust (the "Trust") or services that are normally provided by the accountant in connection with statutory and regulatory filings or engagements for these fiscal years were as follows: |
| FYE | Audit Fees |
| 10/31/11 | $102,000 |
| 10/31/10 | $ 77,000 |
| (b) | Audit-Related Fees. For each of the last two fiscal years, there were no fees billed to the Trust for assurance and related services by the principal accountant that are reasonably related to the performance of the audit of the Trust's financial statements and are not reported under Audit Fees. For each of the last two fiscal years of the Trust, there were no audit-related fees billed by the Fund's principal accountant to the Trust's investment adviser and any entity controlling, controlled by, or under common control with the adviser that provides ongoing services to the Fund (together, "Adviser Related Entities") for services that were related directly to the operations and financial reporting of the Trust. |
| (c) | Tax Fees. The aggregate fees billed to the Trust for each of the last two fiscal years for professional services provided by the Trust's principal accountant for tax compliance, tax advice and tax planning were as follows: |
| FYE | Tax Fees |
| 10/31/11 | $13,905 |
| 10/31/10 | $ 9,000 |
For the last two fiscal years of the Trust, there were no tax fees billed by the Fund's principal accountant to Adviser Related Entities for services that were related directly to the operations and financial reporting of the Trust.
| (d) | All Other Fees. All Other Fees are fees related to services other than those reported above under "Audit Fees," "Audit-Related Fees," and "Tax Fees." For each of the Trust's last two fiscal years, no such fees were billed by the Trust's principal accountant to the Trust or to Adviser Related Entities for services related directly to the operations and financial reporting of the Trust. |
(e)(1) The Audit Committee's pre-approval policies and procedures are as follows:
The Charter of the Audit Committee of the Board requires that the Committee approve (a) all audit and permissible non-audit services to be provided to the Funds and (b) all permissible non-audit services to be provided by the Funds' independent auditors to the Funds' investment adviser or any entity controlling, controlled by, or under common control with the investment adviser that provides ongoing services to the Funds, if the engagement relates directly to the operations and financial reporting of the Funds.
(2) No services described in each of paragraphs (b) through (d) of this Item were approved by the Audit Committee pursuant to paragraph (c)(7)(i)(C) of Rule 2-01 of Regulation S-X.
| (f) | Not applicable |
| (g) | The aggregate non-audit fees billed by the Trust's accountant, for the Trust's last two fiscal years, for services rendered to the Trust and Adviser Related Entities are shown in the table below: |
| Non-Audit Fees | |||
| Non-Audit Fees | for Adviser | Aggregate | |
| for Trust | Related Entities | Non-Audit Fees | |
| FYE | |||
| October 31, 2011 | None | None | None |
| October 31, 2010 | None | None | None |
| (h) | The Audit Committee of the Board of Trustees has considered whether the provision of services other than audit services performed by the auditors to the Registrant is compatible with maintaining the auditors' independence in performing audit services. |
Item 5. Audit Committee of Listed Registrants.
Not applicable.
Item 6. Schedule of Investments.
Schedule of Investments is included as part of the report to shareholders filed under Item 1 of this Form.
Item 7. Disclosure of Proxy Voting Policies and Procedures for Closed-End Management Investment Companies.
Not applicable.
Item 8. Portfolio Managers of Closed-End Management Investment Companies.
Not applicable.
Item 9. Purchases of Equity Securities by Closed-End Management Investment Company and Affiliated Purchases.
Not applicable.
Item 10. Submission of Matters to a Vote of Security Holders.
There have been no material changes to the procedures by which shareholders may recommend nominees to the Trust's Board of Trustees since the Trust last provided disclosure as to such procedures in response to the requirements of Item 407(c)(2)(iv) of Regulation S-K (as required by Item 22(b)(15) of Schedule 14A), or this Item.
Item 11. Controls and Procedures.
| (a) | The registrant's principal executive officer and principal financial officer, after evaluating the effectiveness of the registrant's "disclosure controls and procedures" (as defined in the Investment Company Act of 1940 Rule 30-a-2(c) under the Act (17 CFR 270.30a-2(c))) as of a date (the "Evaluation Date") within 90 days of the filing date of this report, have concluded that, as of the Evaluation Date, the registrant's disclosure controls and procedures were adequately designed to ensure that the information required to be disclosed by the registrant in this Form N-CSR is recorded, processed, summarized and reported within the time periods specified in the Commission's rules and forms. |
| (b) | There were no changes in the registrant's internal control over financial reporting (as defined in Rule 30a-3(d) under the Act (17 CFR 270.30a-3(d))) that occurred during the registrant's second fiscal quarter of the period covered by this report that has materially affected, or is reasonably likely to materially affect, the registrant's internal control over financial reporting. |
Items 12. Exhibits.
(a)(1) Registrant's Code of Ethics required to be disclosed under Item 2 hereof is filed and attached hereto as Exhibit 99.CODE ETH.
(a)(2) Certification pursuant to Rule 30a-2(a) under the Investment Company Act of 1940 (17 CFR 270.30a-2(a)) is filed and attached hereto as Exhibit 99.302CERT.
(b) Certification pursuant to Rule 30a-2(b) under the Investment Company Act of 1940 (17 CFR 270.30a-2(b)) is filed and attached hereto as Exhibit 99.906CERT
SIGNATURES
Pursuant to the requirements of the Securities Exchange Act of 1934 and the Investment Company Act of 1940, the registrant has duly caused this report to be signed on its behalf by the undersigned, thereunto duly authorized.
Century Capital Management Trust
By: /s/ Alexander L. Thorndike
Alexander L. Thorndike, Chairman
Date: January 6, 2012
Pursuant to the requirements of the Securities Exchange Act of 1934 and the Investment Company Act of 1940, this report has been signed below by the following persons on behalf of the registrant and in the capacities and on the dates indicated.
By: /s/ Alexander L. Thorndike
Alexander L. Thorndike, Principal Executive Officer
Date: January 6, 2012
By: /s/ Julie Smith
Julie Smith, Principal Financial Officer
Date: January 6, 2012