UNITED STATES
SECURITIES AND EXCHANGE COMMISSION
Washington, D.C. 20549
FORM N-CSR
CERTIFIED SHAREHOLDER REPORT OF REGISTERED
MANAGEMENT INVESTMENT COMPANIES
Investment Company Act File Number: 811-09561
Century Capital Management Trust
(Exact name of registrant as specified in charter)
c/o Century Capital Management, LLC
100 Federal Street, Boston, Massachusetts 02110
(Address of principal executive offices) (Zip code)
Maureen Kane
Century Capital Management, LLC
100 Federal Street, Boston, Massachusetts 02110
(Name and address of agent for service)
Registrant's telephone number, including area code: (617) 482-3060
Date of fiscal year end: October 31
Date of reporting period: October 31, 2012
Item 1. Reports to Shareholders.
Table of Contents | |
Page | |
Letter to Shareholders | 1 |
Fund Summaries | |
Century Small Cap Select Fund | 5 |
Century Shares Trust | 9 |
Century Growth Opportunities Fund | 13 |
Portfolio of Investments | |
Century Small Cap Select Fund | 18 |
Century Shares Trust | 20 |
Century Growth Opportunities Fund | 22 |
Financial Statements | 24 |
Notes to the Financial Statements | 32 |
Report of Independent Registered Public Accounting Firm | 40 |
Disclosure of Fund Expenses | 41 |
Tax Information | 42 |
Approval of Investment Management Agreements | 43 |
Trustees and Officers | 47 |
This report is submitted for the general information of the shareholders of Century Small Cap Select Fund, Century Shares Trust, and Century Growth Opportunities Fund (each a “Fund” and collectively, the “Funds”). It is not authorized for distribution to prospective investors in a Fund unless it is preceded by or accompanied by the Fund’s current prospectus. The prospectus includes important information about the Fund’s objective, risks, charges and expenses, experience of its management, and other information. Please read the prospectus carefully before you invest.
The views expressed in this report are those of the Funds’Portfolio Managers as of October 31, 2012, the end of the reporting period. Any such views are subject to change at any time and may not reflect the Portfolio Managers’views on the date that this report is first published or anytime thereafter. These views are intended to assist shareholders in understanding their investments and do not constitute investment advice. There is no assurance that the Funds will continue to invest in the securities mentioned in this report.
| Century Funds | Letter to Shareholders |
October 31, 2012 (Unaudited)
Dear Fellow Shareholders,
The equity markets rewarded patient investors over the Funds’ latest fiscal year, which ended October 31, 2012. In general, domestic U.S. equities outperformed most other asset classes, despite limited Congressional progress on the same structural issues (taxes and spending) that we outlined in last year’s Annual Report.
During the fiscal year ended October 31, 2012, Century Small Cap Select Fund’s Institutional Shares outperformed the Fund’s benchmark, while the Fund’s Investor Shares, Century Shares Trust and Century Growth Opportunities Fund underperformed their benchmarks. We review each Fund’s performance, positioning and outlook following this letter.
Despite the near-term “fiscal cliff” concerns, we view the outlook for stock valuations and growth prospects as favorable over the next decade. The third quarter earnings season (just completed) reveals that most companies continue to deliver reasonable revenue and earnings growth, but we believe the 2013 outlook for many companies may require growth and margin expectations to come down, especially if global growth concerns in Europe and Asia are not resolved.
Favorable Horizon
Why are we optimistic on the long-term outlook for equities and the economy? We continue to see 1) moderate economic growth, 2) improving consumer confidence, 3) low inflation and 4) increasing employment, which combine to drive long-term corporate profit growth. We think it is important to keep a long-term investment perspective, and long-term equity returns have risen a resounding 7%-8% annually since 1926, which is more than double the rate of Gross Domestic Product (GDP) or economic growth in the US during this timeframe. However, I should note that annual growth results may be highly variable and sometimes negative. In summary, we believe the equity return opportunity remains very attractive, assuming shareholders are willing to tolerate some degree of risk. Our goal is to invest in companies with high expected returns and below average risk exposure to your portfolio.
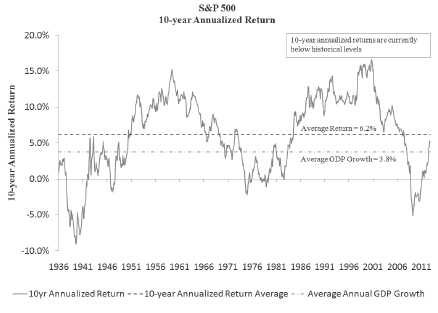
Source: Bloomberg (Data as of 10/31/2012; Data range is 1/1/1936 through 10/31/2012)
| Annual Report | October 31, 2012 | 1 |
| Century Funds | Letter to Shareholders |
October 31, 2012 (Unaudited)
In addition, we are confident that the US’ democratic system of free-market capitalism and regulatory transparency remains the most robust and dynamic foundation on which to nurture great ideas into innovative and efficient businesses. This stimulating environment of constant change and analysis is the reason why our Century investment team comes to work each day. We are constantly trying to identify the best companies to own in our Fund portfolios, from the 4,000 stocks in our investable universe.
With interest rates declining to their lowest levels since World War I and the Federal Reserve committed to keeping rates low until 2015, we believe that owning common equity shares in these entrepreneurial companies will provide solid investor returns over the next 10-20 years, especially with current price-to-earnings (P/E) valuations at attractive levels of 12.7x next-twelve months (NTM) earnings’ estimates versus long-term historical average of 13.3x NTM P/E and 25.6x back in 2000.
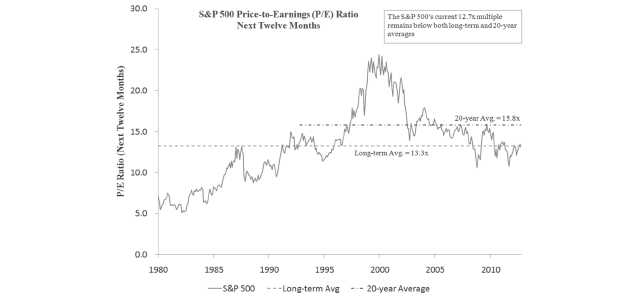
Source: Bloomberg (Data as of 11/28/2012; Data range is 1/1/1980 through 11/18/2012)
Past performance does not guarantee future results.
Price-to-earnings ratio is the value of a company’s stock price relative to company earnings. Estimated earnings growth is the year over year growth in earnings per share.
Superpower Transitions
As I write this letter, the two largest world economies (America & China) have just selected their political leaders for the next few years. In many respects, these world powers are facing equal challenges from opposite sides of the same coin. How each country addresses these challenges will greatly impact their standards of living. The Chinese are struggling with how to sustain their torrid economic growth, while expanding middle class opportunities, without
| 2 | www.centuryfunds.com |
| Century Funds | Letter to Shareholders |
October 31, 2012 (Unaudited)
imperiling their Communist party system. Meanwhile, Americans are struggling with the finite limits of government in society (expanding taxes, social spending programs and federal deficits) while trying to break free from the last vestiges of the Great Recession of 2008-2009, which inhibited job growth and kept the unemployment rate above 7.7% for the last four years.
These challenges are delicate balancing acts for both nations, and the recent volatility in the capital markets reflects these investor concerns, along with similar geopolitical challenges in Europe, Middle East and North Africa. This global uncertainty has contributed to the steady withdrawal of fund flows from domestic equity mutual funds over the last five years. (see equity & bond fund chart below.) There is always some degree of geopolitical uncertainty in the world, but we think that these crisis situations also provide tremendous growth opportunity in corporate profits, if we resolve some of these questions over the next several years.
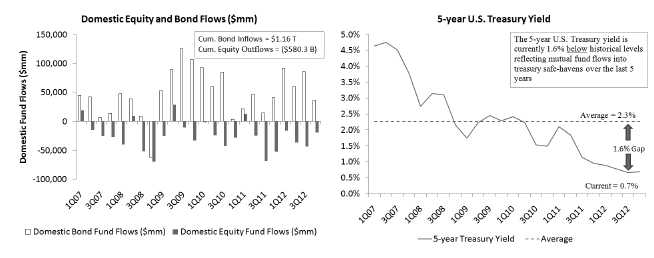
Source: Investment Company Institute (Data as of 11/14/2012) Source: Bloomberg (Data as of 11/23/2012)
Corporate balance sheets remain high in cash and relatively unlevered by debt. Management teams are hesitating to invest in new hiring and production, until the economic and partisan political climate improves. We hope that the recent November election results facilitate a quick bipartisan compromise and some measure of clarity to the markets, setting the stage for accelerating GDP growth in 2013. We believe that this confluence of factors will eventually renew interest in domestic equities. We anticipate a return to positive and more normalized equity mutual fund flows as investors withdraw from their overextended allocations to low-yielding, fixed income investments and seek out inflation protecting returns of equities over the long-term.
| Annual Report | October 31, 2012 | 3 |
| Century Funds | Letter to Shareholders |
October 31, 2012 (Unaudited)
Investing amidst low interest rates
With interest rates at such low levels (see 5-yr US Treasury Bond yield chart on the prior page), investors are struggling to find decent investment returns that exceed future inflation expectations, which are likely to rise from current levels. The Federal Reserve is trying to push these investors toward more risky asset classes. We encourage investors to be prudent and thrifty in their investment choices, while maintaining a “quality bias” and a disciplined research process.
We also emphasize our collective need to increase the savings rate and the tremendous power of long-term compounding interest, enabling investors to increase their investment returns over long periods of time (please see Einstein’s quote below.) This compounding concept of the time value of money is best exemplified by the “Rule of 72,”which helps explain how much faster an amount will double in value for a given interest rate, if its investment return is reinvested and compounds annually. For instance, $100 will double in approximately 8.1 years if compounding at 9% returns versus approximately 11.2 years (3.1 years longer) if using simple interest returns and not reinvesting gains.
“Compound Interest is the eighth wonder of the world. He who understands it, earns it…he who doesn’t, pays it.” – Albert Einstein
This arithmetic formula is a powerful investment and savings motivator in the low interest rate environment we find ourselves in today. This key takeaway point reinforces the need to save more and allow the long term compounding of reinvested returns to work to your advantage. Great investors are rewarded by the patience and discipline in the mathematical power of compounding.
It is our hope to find great companies that compound earnings at a faster rate than their peers over the next several years and deliver superior risk-adjusted returns to your Funds over time. We view a quality-bias and long-term investment horizon as strategic advantages in our investment process.
In the meantime, we reiterate that success starts with demanding our political leaders to 1) think beyond the next couple elections and 2) be courageous about choosing long-term goals above short-term popularity.
We thank you for your continued support, and we wish you all a happy holiday season.
Respectfully Submitted,

Alexander L. Thorndike
Chairman of the Century Funds
| 4 | www.centuryfunds.com |
| Century Small Cap Select Fund | Fund Commentary |
October 31, 2012 (Unaudited)
HOW DID THE PORTFOLIO PERFORM?
For the one-year period ended October 31, 2012, Century Small Cap Select Fund’s Institutional Shares returned +9.87% and the Investor Shares returned +9.46%, versus the +9.70% return for the Russell 2000 Growth Index, the Fund’s benchmark.
WHAT FACTORS INFLUENCED PERFORMANCE?
Good stock selection was the primary driver of the Fund’s performance during the one-year period ended October 31, 2012. In general, companies with healthy growth rates and improving margins propelled the market higher. Stocks such as Beacon Roofing Supply (roofing distributor), Hain Celestial Group Inc. (organic consumer products), Catamaran Corp. (pharmacy benefit manager), and NPS Pharmaceuticals Inc. (biopharmaceuticals) were the top contributors to the Fund’s performance during the period. Underperforming stocks included Pioneer Energy Services Corp. (Exploration & Production), Express, Inc. (specialty retailer), Questcor Pharmaceuticals Inc. (biopharmaceuticals) and Log MeIn Inc. (cloud-based services).
Sector allocation for Fiscal Year 2012. Underweighting Energy and Consumer Staples benefitted Fund performance, while overweighting Technology and underweighting Consumer Discretionary was a drag on performance.
DESCRIBE RECENT PORTFOLIO ACTIVITY
Over the last six months, we have made small increases in the Industrial and Financial Services sectors, while reducing Technology and Consumer Staples sectors slightly. The Fund is diversified across most sectors, except Utilities.
The Fund is positioned with an overweight in Financial Services, Technology and Telecommunication Services stocks. In contrast, the Fund is meaningfully underweight Consumer Discretionary and Consumer Staple stocks. We continue to focus on revenue growth, profitability and financial strength when evaluating securities. While we remain vigilant regarding the near-term fiscal cliff and international concerns mentioned elsewhere in this report, we are optimistic about the long-term future of the U.S. economy and the potential for domestic equity returns. We believe the portfolio is properly positioned to benefit from the slow, sustained improvements within the U.S. and global economies.
| Annual Report | October 31, 2012 | 5 |
| Century Small Cap Select Fund | Fund Commentary |
October 31, 2012 (Unaudited)
Risks: The Fund concentrates its investments in the financial services and health care group of industries. Concentration in a particular industry subjects the Fund to the risks associated with that industry, and as a result, the Fund may be subject to greater price volatility than funds with less concentrated portfolios. In addition, the Fund invests in smaller companies which pose greater risks than those associated with larger, more established companies. Please read the Fund’s prospectus for details regarding the Fund’s risk profile.
| Ten Largest Holdings* | Portfolio Composition* | |||
J2 GLOBAL, INC. | 4.00% | Information Technology | 23.6% | |
Internet Software & Services | Health Care | 20.3% | ||
CAI INTERNATIONAL, INC. | 3.78% | Industrials | 18.7% | |
Trading Companies & Distributors | Financials | 11.3% | ||
BEACON ROOFING SUPPLY, INC. | 2.87% | Consumer Discretionary | 10.5% | |
Trading Companies & Distributors | Energy | 4.8% | ||
DSW, INC., CLASS A | 2.86% | Materials | 3.6% | |
Specialty Retail | Telecommunication Services | 2.4% | ||
BROOKDALE SENIOR LIVING, INC. | 2.63% | Consumer Staples | 2.0% | |
Health Care Providers & Services | Cash, Cash Equivalents, & Other Net Assets | 2.8% | ||
SIGNATURE BANK | 2.60% | |||
Commercial Banks | ||||
DFC GLOBAL CORP. | 2.53% | |||
Consumer Finance | ||||
COGENT COMMUNICATIONS GROUP, INC. | 2.45% | |||
Diversified Telecommunication Services | ||||
WINTRUST FINANCIAL CORP. | 2.43% | |||
Commercial Banks | ||||
ATLAS AIR WORLDWIDE HOLDINGS, INC. | 2.27% | |||
Air Freight & Logistics | ||||
| *Based on the Fund’s net assets at October 31, 2012 and subject to change. | ||||
| 6 | www.centuryfunds.com |
Century Small Cap Select Fund | Performance Summary |
October 31, 2012 (Unaudited)
Institutional Shares and Investor Shares
The returns shown below represent past performance. Past performance does not guarantee future results. Investment return and principal value of an investment will fluctuate so that an investor’s shares, when sold or redeemed, may be worth more or less than the original cost. Current performance may be higher or lower than the Fund’s past performance. For the most recent month-end performance, please call 800-303-1928.
As stated in the Fund’s current prospectus, the total (gross) operating expenses are 1.11% for the Institutional Shares and 1.48% for the Investor Shares. Returns would have been lower during the 10-year period if certain fees had not been waived or expenses reimbursed. The Fund’s total returns include the reinvestment of dividend and capital gain distributions, but have not been adjusted to reflect the deduction of taxes that a shareholder would pay on these distributions or the redemption of Fund shares. Shares held less than 90 days may be subject to a 1% redemption fee.
| Average Annual Total Returns October 31, 2012 | ||||
| 1 Year | 3 Years | 5 Years | 10 Years | |
Century Small Cap Select Fund – | ||||
Institutional Shares | 9.87% | 17.15% | 2.09% | 8.83% |
Century Small Cap Select Fund – | ||||
Investor Shares | 9.46% | 16.73% | 1.71% | 8.44% |
Russell 2000 Growth Index | 9.70% | 15.74% | 1.41% | 9.66% |
| Annual Report | October 31, 2012 | 7 |
| Century Small Cap Select Fund | Performance Summary |
October 31, 2012 (Unaudited)
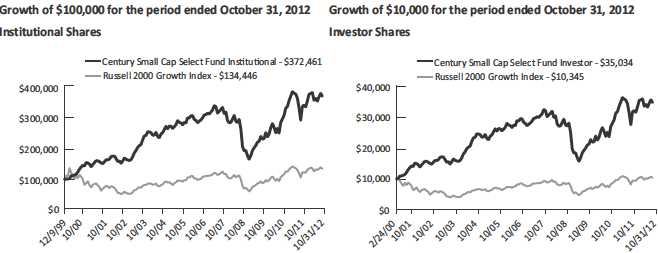
The graphs and table reflect the change in value of a hypothetical investment in the Fund, including reinvest of dividends and distributions, compared with the index. Index returns assume reinvestment of dividends and, unlike Fund returns, do not reflect any fees or expenses. It is not possible to invest directly in an index. Minimum initial investment for Institutional Shares is $100,000.
The Russell 2000® Growth Index measures the performance of the small-cap growth segment of the U.S. equity universe. It includes those Russell 2000® companies with higher price-to-value ratios and higher forecasted growth values. Index returns assume reinvestment of dividends but, unlike Fund returns, do not reflect fees or expenses. One cannot invest directly in an index.
| 8 | www.centuryfunds.com |
| Century Shares Trust | Fund Commentary |
October 31, 2012 (Unaudited)
HOW DID THE PORTFOLIO PERFORM?
For the one-year period ended October 31, 2012, Century Shares Trust returned +7.63%, underperforming the Russell 1000 Growth Index, the Fund’s benchmark, which returned +13.02%. The S&P 500 Index gained +15.21% during the period.
WHAT FACTORS INFLUENCED PERFORMANCE?
The Fund benefitted from the strong performance of domestic equity markets. 2012 saw stock markets build on gains from 2011, with the S&P 500 index +15% and the Russell 1000 Growth index +13% for the one-year period ended October 31, 2012. In fact the overall market, as measured by the S&P 500 Index, is up a cumulative +59% since October 31, 2008. The stock market performance reflects the return to 2.0-2.5% US Gross Domestic Product (GDP) growth after the ‘Great Recession’. However, rising equity prices have come with rising volatility and corrections of 10% or so, roughly twice a year.
While Century Shares Trust participated in the rising stock market, the Fund’s performance was negatively impacted by four stocks that experienced sharp corrections. Green Mountain Coffee Roasters Inc. (specialty coffee), Tempur-Pedic International Inc. (premium mattress manufacturer), Tiffany & Co. (jewelry retailer), and Cognizant Technology Solutions Corp. (IT outsourcing) all declined materially upon announcing weak financial results. Since the Fund invests in a relatively limited number of companies, the impact that each investment has on the Fund’s performance can be significant. Stocks that partially offset the weak performers included LyondellBasell Industries (chemicals), Alexion Pharmaceuticals (biotechnology), ResMed Inc. (sleep-disorder breathing equipment) and CBS Corp. (mass media).
The Fund’s performance did benefit slightly from sector allocation decisions. The Fund was positively impacted by overweighting the Energy and Health Care sectors; this outperformance was partially offset by weakness in the Consumer Staples and Telecommunication Services sectors.
DESCRIBE RECENT PORTFOLIO ACTIVITY
Stock selection is driven by our bottom-up, fundamental investment process. We increased investments in Health Care and Energy stocks due to our belief in their steady, long-term growth prospects and their attractive valuations. We decreased investments in Consumer Staples, primarily because appreciation in the stock prices of some of our holdings resulted in high valuations.
The portfolio remains diversified across most sectors with a modest overweight in Health Care and Energy and a modest underweight in Consumer Staples and Discretionary. The Fund is positioned in anticipation of slow growth over the next year in light of the many challenges still facing investors, including tensions in the Middle East, fiscal challenges in Europe and the U.S., and slowing growth in China. Given our expectations for a slow growth world economy, we seek to invest in companies that we believe have strong secular growth opportunities, solid profitability, and reasonable valuations.
| Annual Report | October 31, 2012 | 9 |
| Century Shares Trust | Fund Commentary |
October 31, 2012 (Unaudited)
Risks: The Fund may invest a significant portion of assets in a limited number of companies or in companies within the same market sector. As a result, the Fund may be more susceptible to financial, market and economic events affecting particular companies or sectors and therefore may experience greater price volatility than funds with more diversified portfolios. Please read the Fund’s prospectus for details regarding the Fund’s risk profile.
| Ten Largest Holdings* | |
APPLE, INC. | 7.62% |
Computers & Peripherals | |
EXPRESS SCRIPTS HOLDING CO. | 4.27% |
Health Care Providers & Services | |
LYONDELLBASELL INDUSTRIES NV, CLASS A | 4.08% |
Chemicals | |
GOOGLE, INC., CLASS A | 3.86% |
Internet Software & Services | |
QUALCOMM, INC. | 3.81% |
Communications Equipment | |
RESMED, INC. | 3.70% |
Health Care Equipment & Supplies | |
ORACLE CORP. | 3.63% |
Software | |
ADOBE SYSTEMS, INC. | 3.53% |
Software | |
TIFFANY & CO. | 3.33% |
Specialty Retail | |
MARRIOTT INTERNATIONAL, INC., CLASS A | 3.30% |
Hotels Restaurants & Leisure |
| Portfolio Composition* | |
Information Technology | 29.9% |
Health Care | 15.0% |
Consumer Discretionary | 13.2% |
Industrials | 12.2% |
Consumer Staples | 8.5% |
Energy | 8.2% |
Financials | 6.1% |
Materials | 4.1% |
Cash, Cash Equivalents, & Other Net Assets | 2.8% |
*Based on the Fund’s net assets at October 31, 2012 and subject to change.
| 10 | www.centuryfunds.com |
| Century Shares Trust | Performance Summary |
October 31, 2012 (Unaudited)
Institutional Shares
The returns shown below represent past performance. Past performance does not guarantee future results. Investment return and principal value of an investment will fluctuate so that an investor’s shares, when sold or redeemed, may be worth more or less than the original cost. Current performance may be higher or lower than the Fund’s past performance. For the most recent month-end performance, please call 800-303-1928.
As stated in the Fund’s current prospectus, the total (gross) operating expenses are 1.13% for the Fund’s Institutional Shares. The Fund’s total returns include the reinvestment of dividend and capital gain distributions, but have not been adjusted to reflect the deduction of taxes that a shareholder would pay on these distributions or the redemption of Fund shares. Shares held less than 90 days may be subject to a 1% redemption fee.
| Average Annual Total Returns October 31, 2012 | ||||
| 1 Year | 3 Years | 5 Years | 10 Years | |
Century Shares Trust Institutional Shares | 7.63% | 11.31% | 0.27% | 5.89% |
Russell 1000 Growth Index | 13.02% | 14.12% | 1.95% | 7.15% |
S&P 500 Index | 15.21% | 13.21% | 0.36% | 6.91% |
| Annual Report | October 31, 2012 | 11 |
| Century Shares Trust | Performance Summary |
October 31, 2012 (Unaudited)
The graph and table reflect the change in value of a hypothetical investment in the Fund, including reinvest of dividends and distributions, compared with the listed indices. Index returns assume reinvestment of dividends and, unlike Fund returns, do not reflect any fees or expenses. It is not possible to invest directly in an index. Minimum initial investment for Institutional Shares is $100,000.
The Russell 1000® Growth Index measures the performance of the large-cap growth segment of the U.S. equity universe. It includes those Russell 1000 companies with higher price-to-book ratios and higher forecasted growth values. The S&P 500® Index is a broad based unmanaged index representing the performance of 500 widely held common stocks.
| 12 | www.centuryfunds.com |
| Century Growth Opportunities Fund | Fund Commentary |
October 31, 2012 (Unaudited)
HOW DID THE PORTFOLIO PERFORM?
For the one-year period ended October 31, 2012, Century Growth Opportunities Fund returned +1.31%, underperforming the +10.08% Russell 2500 Growth Index, the Fund’s benchmark.
WHAT FACTORS INFLUENCED PERFORMANCE?
The Fund underperformed over the past year due to negative stock selection and allocation decisions in seven of eleven sectors. In addition, the Fund failed to benefit from stock market rallies that were triggered by actions taken by the Federal Reserve. In the late spring/early summer, we oriented the portfolio towards domestic companies in the healthcare and consumer sectors. Some of these names were defensive in nature and lagged during the market rally.
The Fund’s performance was boosted by contributions from SolarWinds, Inc. (software), Cyberonics, Inc. (medical devices), and D.R. Horton, Inc. (homebuilding). Performance was hindered by poor performance from Green Mountain Coffee Roasters Inc. (specialty coffee), Berry Petroleum Company (energy) and Intrepid Potash, Inc. (fertilizers). Additionally, significant one-day declines in three holdings - Green Mountain Coffee Roasters Inc., Tempur-Pedic International Inc. (premium mattress manufacturer), and Herbalife Ltd. (nutritional supplements) - hurt performance. All three holdings have been sold.
DESCRIBE RECENT PORTFOLIO ACTIVITY
The portfolio continues to remain focused on domestically-oriented holdings that we believe can generate organic growth in a slow growth world economy. This positioning was initiated in the late Spring, in response to our fear of a European recession and concerns that the Chinese and Brazilian economies were slowing. Although these slowdowns have indeed occurred, the equity markets have risen in response to Federal Reserve Bank and European Central Bank operations. Looking ahead on the domestic front, homebuilding and auto sales have seen fairly strong recoveries over the year. However, unemployment continues to be a drag on the economy. In Europe, a recession seems to be taking hold with few signs of recovery. The Chinese and Brazilian economies have slowed with recent signs of stabilization.
| Annual Report | October 31, 2012 | 13 |
| Century Growth Opportunities Fund | Fund Commentary |
October 31, 2012 (Unaudited)
Risks: The Fund invests mainly in small-cap and mid-cap companies, which, historically, have been more volatile in price than the stocks of large-cap companies. The Fund may invest in foreign companies, which involves risks not associated with investing solely in U.S. companies, such as currency fluctuations, unfavorable political developments, or economic instability. These risks are magnified in emerging markets. Please read the Fund’s prospectus for details regarding the Fund’s risk profile.
| Ten Largest Holdings* | |
B/E AEROSPACE, INC. | 2.27% |
Aerospace & Defense | |
ALLIANCE DATA SYSTEMS CORP. | 2.26% |
IT Services | |
KANSAS CITY SOUTHERN | 2.25% |
Road & Rail | |
MOODY’S CORP. | 2.23% |
Diversified Financial Services | |
AO SMITH CORP. | 2.19% |
Building Products | |
NEWMARKET CORP. | 2.16% |
Chemicals | |
HANESBRANDS, INC. | 2.16% |
Textiles Apparel & Luxury Goods | |
CABOT OIL & GAS CORP. | 2.14% |
Oil Gas & Consumable Fuels | |
MSC INDUSTRIAL DIRECT CO., INC., CLASS A | 2.13% |
Trading Companies & Distributors | |
ASSOCIATED BANC CORP. | 2.11% |
Commercial Banks |
| Portfolio Composition* | |
Consumer Discretionary | 20.8% |
Information Technology | 19.9% |
Health Care | 18.2% |
Industrials | 15.1% |
Financials | 8.4% |
Energy | 6.0% |
Materials | 5.9% |
Consumer Staples | 2.3% |
Telecommunication Services | 2.0% |
Utilities | 0.5% |
Cash, Cash Equivalents, & Other Net Assets | 0.9% |
*Based on the Fund’s net assets at October 31, 2012 and subject to change.
| 14 | www.centuryfunds.com |
| Century Growth Opportunities Fund | Performance Summary |
October 31, 2012 (Unaudited)
Performance Summary – Institutional Shares
The returns shown below represent past performance. Past performance does not guarantee future results. Investment return and principal value of an investment will fluctuate so that an investor’s shares, when sold or redeemed, may be worth more or less than the original cost. Current performance may be higher or lower than the Fund’s past performance. For the most recent month-end performance, please call 800-303-1928.
As stated in the Fund’s current prospectus, the total (gross) annual operating expenses are 1.88% for the Fund’s Institutional Shares. The Adviser has agreed contractually to limit the operating expenses for the Fund’s Institutional Shares to 1.10% through June 30, 2013. Returns would have been lower during all periods if certain fees had not been waived or expenses reimbursed. The Fund’s total returns include the reinvestment of dividend and capital gain distributions, but have not been adjusted to reflect the deduction of taxes that a shareholder would pay on these distributions or the redemption of Fund shares. Shares held less than 90 days may be subject to a 1% redemption fee.
| Average Annual Total Returns October 31, 2012 | ||
Since | ||
1 Year | Inception* | |
Century Growth Opportunities Fund – | ||
Institutional Shares | 1.31% | 4.07% |
Russell 2500 Growth | 10.08% | 10.64% |
| * Fund Inception date of November 17, 2010. |
| Annual Report | October 31, 2012 | 15 |
| Century Growth Opportunities Fund | Performance Summary |
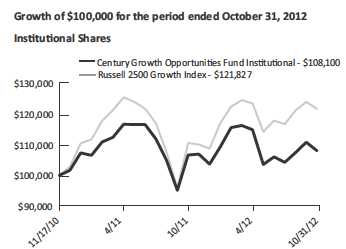
The graph and table reflect the change in value of a hypothetical investment in the Fund, including reinvest of dividends and distributions, compared with the listed indices. Index returns assume reinvestment of dividends and, unlike Fund returns, do not reflect any fees or expenses. It is not possible to invest directly in an index.
The Russell 2500 Growth® Index measures the performance of the small- to mid-cap growth segment of the U.S. equity universe. It includes those Russell 2500 companies with higher price-to-book ratios and higher forecasted growth values. Index returns assume reinvestment of dividends but, unlike Fund returns, do not reflect fees or expenses. One cannot invest directly in an index.
| 16 | www.centuryfunds.com |
This Page Intentionally Left Blank.
| Annual Report | October 31, 2012 | 17 |
| Century Small Cap Select Fund | Portfolio of Investments |
October 31, 2012
| Shares | Description | Value |
| COMMON STOCKS - 97.2% | |||
| Consumer Discretionary - 10.5% | |||
Distributors - 1.1% | |||
| 89,393 | Core-Mark Holding Co., Inc. | $ 4,279,243 | |
Household Durables - 0.8% | |||
91,488 | The Ryland Group, Inc. | 3,098,699 | |
Leisure Equipment & Products - 1.3% | |||
106,950 | Sturm Ruger & Co., Inc. | 5,051,248 | |
Specialty Retail - 7.3% | |||
179,550 | DSW, Inc., Class A | 11,238,034 | |
178,825 | The Men’s Wearhouse, Inc. | 5,863,672 | |
116,600 | Sally Beauty Holdings, Inc.(a) | 2,807,728 | |
132,618 | Select Comfort Corp.(a) | 3,690,759 | |
519,973 | West Marine, Inc.(a) | 5,376,521 | |
28,976,714 | |||
| Total Consumer Discretionary | 41,405,904 | ||
| Consumer Staples - 2.0% | |||
Food Products - 1.5% | |||
100,657 | The Hain Celestial Group, Inc.(a) | 5,817,975 | |
Personal Products - 0.5% | |||
116,475 | Prestige Brands Holdings, Inc.(a) | 2,025,500 | |
| Total Consumer Staples | 7,843,475 | ||
| Energy - 4.8% | |||
Energy Equipment & Services - 2.7% | |||
383,300 | Matrix Service Co.(a) | 4,020,817 | |
996,466 | Pioneer Energy Services Corp.(a) | 6,576,675 | |
10,597,492 | |||
Oil, Gas & Consumable Fuels - 2.1% | |||
316,496 | Carrizo Oil & Gas, Inc.(a) | 8,488,423 | |
| Total Energy | 19,085,915 | ||
| Financials - 11.3% | |||
Capital Markets - 3.7% | |||
| 258,190 | Cohen & Steers, Inc. | 7,226,738 | |
| 528,701 | HFF, Inc., Class A(a) | 7,364,805 | |
14,591,543 | |||
| Shares | Description | Value |
| Financials (continued) | |||
Commercial Banks - 5.0% | |||
| 143,350 | Signature Bank(a) | $ 10,212,254 | |
| 258,450 | Wintrust Financial Corp. | 9,549,728 | |
19,761,982 | |||
Consumer Finance - 2.6% | |||
| 591,065 | DFC Global Corp.(a) | 9,959,445 | |
| Total Financials | 44,312,970 | ||
| Health Care - 20.3% | |||
Biotechnology - 2.2% | |||
| 940,333 | NPS Pharmaceuticals, Inc.(a) | 8,688,677 | |
Health Care Equipment & Supplies - 1.8% | |||
| 196,891 | Thoratec Corp.(a) | 7,029,009 | |
Health Care Providers & Services - 9.6% | |||
| 336,347 | Acadia Healthcare Co., Inc.(a) | 6,918,658 | |
| 47,100 | Air Methods Corp.(a) | 5,163,573 | |
| 440,700 | Brookdale Senior Living, Inc.(a) | 10,338,822 | |
| 167,600 | Catamaran Corp.(a) | 7,904,016 | |
| 67,458 | Centene Corp.(a) | 2,562,055 | |
| 145,129 | IPC The Hospitalist Co., Inc.(a) | 5,005,499 | |
37,892,623 | |||
Health Care Technology - 1.1% | |||
| 233,511 | MedAssets, Inc.(a) | 4,140,150 | |
Life Sciences Tools & Services - 3.4% | |||
| 569,555 | Bruker Corp.(a) | 6,885,920 | |
| 446,850 | WuXi PharmaTech (Cayman), | ||
Inc., ADR(a) | 6,340,801 | ||
13,226,721 | |||
Pharmaceuticals - 2.2% | |||
| 163,740 | Jazz Pharmaceuticals PLC(a) | 8,797,750 | |
| Total Health Care | 79,774,930 | ||
| Industrials - 18.7% | |||
Aerospace & Defense - 2.0% | |||
| 120,450 | Triumph Group, Inc. | 7,879,839 | |
Air Freight & Logistics - 2.8% | |||
| 162,648 | Atlas Air Worldwide Holdings, Inc.(a) | 8,944,013 | |
| 120,048 | Echo Global Logistics, Inc.(a) | 2,018,007 | |
10,962,020 | |||
See notes to financial statements
| 18 | www.centuryfunds.com |
| Century Small Cap Select Fund | Portfolio of Investments |
October 31, 2012
| Shares | Description | Value | |
| Industrials (continued) | |||
Commercial Services & Supplies - 0.6% | |||
| 133,443 | Heritage-Crystal Clean, Inc.(a) | $ 2,361,941 | |
Electrical Equipment - 0.5% | |||
| 57,699 | Polypore International, Inc.(a) | 2,035,621 | |
Machinery - 6.1% | |||
| 26,624 | Chart Industries, Inc.(a) | 1,884,713 | |
| 151,790 | Graco, Inc. | 7,295,027 | |
| 100,483 | Lindsay Corp. | 7,673,887 | |
| 175,159 | Titan International, Inc. | 3,674,836 | |
| 105,221 | Woodward, Inc. | 3,524,903 | |
24,053,366 | |||
Trading Companies & Distributors - 6.7% | |||
| 348,613 | Beacon Roofing Supply, Inc.(a) | 11,274,145 | |
| 670,300 | CAI International, Inc.(a) | 14,853,848 | |
26,127,993 | |||
| Total Industrials | 73,420,780 | ||
| Information Technology - 23.6% | |||
Communications Equipment - 2.7% | |||
| 235,438 | Aruba Networks, Inc.(a) | 4,277,908 | |
| 194,111 | Radware Ltd.(a) | 6,366,841 | |
10,644,749 | |||
Internet Software & Services - 10.7% | |||
| 215,581 | DealerTrack Holdings, Inc.(a) | 5,891,829 | |
| 524,296 | j2 Global, Inc. | 15,749,852 | |
| 170,360 | Liquidity Services, Inc.(a) | 7,023,943 | |
| 325,950 | LivePerson, Inc.(a) | 5,114,155 | |
| 302,449 | Stamps.com, Inc.(a) | 8,323,396 | |
42,103,175 | |||
IT Services - 2.2% | |||
| 793,200 | Online Resources Corp.(a) | 2,284,416 | |
| 605,550 | Sapient Corp.(a) | 6,225,054 | |
8,509,470 | |||
Semiconductors & Semiconductor Equipment - 3.3% | |||
| 99,459 | Hittite Microwave Corp.(a) | 5,633,358 | |
| 180,150 | Silicon Laboratories, Inc.(a) | 7,281,663 | |
12,915,021 | |||
Software - 4.7% | |||
| 63,375 | CommVault Systems, Inc.(a) | 3,959,036 | |
| 332,714 | NetScout Systems, Inc.(a) | 8,228,017 | |
| 127,501 | SolarWinds, Inc.(a) | 6,450,276 | |
18,637,329 | |||
| Total Information Technology | 92,809,744 | ||
| Shares | Description | Value |
| Materials - 3.6% | |||
Chemicals - 2.6% | |||
93,316 | LSB Industries, Inc.(a) | $ 3,757,835 | |
141,500 | TPC Group, Inc.(a) | 6,364,670 | |
10,122,505 | |||
Metals & Mining - 1.0% | |||
259,684 | Globe Specialty Metals, Inc. | 3,903,051 | |
| Total Materials | 14,025,556 | ||
| Telecommunication Services - 2.4% | |||
Diversified Telecommunication Services - 2.4% | |||
443,276 | Cogent Communications Group, Inc. | 9,623,522 | |
| TOTAL COMMON STOCKS | |||
(Cost $325,211,925) | 382,302,796 | ||
| SHORT-TERM INVESTMENTS - 3.0% | |||
Money Market Mutual Funds - 3.0% | |||
11,759,750 | State Street Institutional U.S. | ||
Government Money Market Fund | |||
(0.00%(b) 7 Day Yield) | 11,759,750 | ||
| TOTAL SHORT-TERM INVESTMENTS | |||
(Cost $11,759,750) | 11,759,750 | ||
| Total Investments - 100.2% | |||
(Cost, $336,971,675) | 394,062,546 | ||
| Liabilities in Excess of Other Assets - (0.2%) | (618,302) | ||
| Net Assets - 100% | $393,444,244 | ||
(a) Non-income producing security.
(b) Less than 0.005%.
Abbreviations:
ADR - American Depositary Receipt
Ltd. - Limited
PLC - Public Limited Liability
See notes to financial statements
| Annual Report | October 31, 2012 | 19 |
| Century Shares Trust | Portfolio of Investments |
October 31, 2012
| Shares | Description | Value |
| COMMON STOCKS - 97.2% | |||
| Consumer Discretionary - 13.2% | |||
Auto Components - 1.6% | |||
64,435 | Lear Corp. | $ 2,744,931 | |
Hotels, Restaurants & Leisure - 3.3% | |||
158,050 | Marriott International, Inc., Class A | 5,765,664 | |
Media - 5.0% | |||
130,966 | CBS Corp., Class B | 4,243,298 | |
88,055 | DIRECTV(a) | 4,500,491 | |
8,743,789 | |||
Specialty Retail - 3.3% | |||
91,943 | Tiffany & Co. | 5,812,637 | |
| Total Consumer Discretionary | 23,067,021 | ||
| Consumer Staples - 8.5% | |||
Beverages - 2.9% | |||
73,639 | PepsiCo, Inc. | 5,098,764 | |
Food & Staples Retailing - 1.5% | |||
56,955 | CVS Caremark Corp. | 2,642,712 | |
Food Products - 4.1% | |||
140,900 | Green Mountain Coffee | ||
Roasters, Inc.(a) | 3,404,144 | ||
60,566 | McCormick & Co., Inc. | 3,732,077 | |
7,136,221 | |||
| Total Consumer Staples | 14,877,697 | ||
| Energy - 8.2% | |||
Energy Equipment & Services - 4.4% | |||
116,124 | Halliburton Co. | 3,749,644 | |
53,514 | Oil States International, Inc.(a) | 3,911,873 | |
7,661,517 | |||
Oil, Gas & Consumable Fuels - 3.8% | |||
60,850 | Apache Corp. | 5,035,338 | |
34,262 | Phillips 66 | 1,615,796 | |
6,651,134 | |||
| Total Energy | 14,312,651 | ||
| Financials - 6.1% | |||
Diversified Financial Services - 2.9% | |||
121,974 | JPMorgan Chase & Co. | 5,083,876 |
| Shares | Description | Value |
| Financials (continued) | |||
| Insurance - 3.2% | |||
4 | Berkshire Hathaway, Inc., Class A(a) | $ 518,020 | |
87,650 | Prudential Financial, Inc. | 5,000,433 | |
5,518,453 | |||
| Total Financials | 10,602,329 | ||
| Health Care - 15.0% | |||
Biotechnology - 3.3% | |||
62,620 | Alexion Pharmaceuticals, Inc.(a) | 5,659,596 | |
Health Care Equipment & Supplies - 3.7% | |||
161,714 | ResMed, Inc. | 6,458,857 | |
Health Care Providers & Services - 8.0% | |||
121,150 | Express Scripts Holding Co.(a) | 7,455,571 | |
59,121 | Humana, Inc. | 4,390,917 | |
51,139 | Universal Health Services, Inc., | ||
Class B | 2,116,643 | ||
13,963,131 | |||
| Total Health Care | 26,081,584 | ||
| Industrials - 12.2% | |||
Aerospace & Defense - 3.2% | |||
123,550 | B/E Aerospace, Inc.(a) | 5,570,869 | |
Air Freight & Logistics - 2.0% | |||
57,755 | C.H. Robinson Worldwide, Inc. | 3,484,359 | |
Commercial Services & Supplies - 3.1% | |||
57,183 | Stericycle, Inc.(a) | 5,418,661 | |
Construction & Engineering - 3.0% | |||
92,954 | Fluor Corp. | 5,191,481 | |
Industrial Conglomerates - 0.9% | |||
19,156 | 3M Co. | 1,678,066 | |
| Total Industrials | 21,343,436 | ||
| Information Technology - 29.9% | |||
Communications Equipment - 8.4% | |||
296,607 | Cisco Systems, Inc. | 5,083,844 | |
35,722 | F5 Networks, Inc.(a) | 2,946,351 | |
113,550 | QUALCOMM, Inc. | 6,651,191 | |
14,681,386 | |||
Computers & Peripherals - 10.5% | |||
22,353 | Apple, Inc. | 13,302,270 | |
206,350 | EMC Corp.(a) | 5,039,067 | |
18,341,337 | |||
See notes to financial statements
| 20 | www.centuryfunds.com |
| Century Shares Trust | Portfolio of Investments |
October 31, 2012
| Shares | Description | Value | |
| Information Technology (continued) | |||
Internet Software & Services - 3.8% | |||
9,900 | Google, Inc., Class A(a) | $ 6,729,723 | |
Software - 7.2% | |||
181,350 | Adobe Systems, Inc.(a) | 6,165,900 | |
204,000 | Oracle Corp. | 6,334,200 | |
12,500,100 | |||
| Total Information Technology | 52,252,546 | ||
| Materials - 4.1% | |||
Chemicals - 4.1% | |||
133,504 | LyondellBasell Industries NV, | ||
Class A | 7,127,778 | ||
| TOTAL COMMON STOCKS | |||
(Cost $139,166,743) | 169,665,042 | ||
| SHORT-TERM INVESTMENTS - 5.7% | |||
Money Market Mutual Funds - 5.7% | |||
9,860,726 | State Street Institutional U.S. | ||
Government Money Market Fund | |||
(0.00%(b) 7 Day Yield) | 9,860,726 | ||
| TOTAL SHORT-TERM INVESTMENTS | |||
(Cost $9,860,726) | 9,860,726 | ||
| Total Investments - 102.9% | |||
(Cost, $149,027,469) | 179,525,768 | ||
| Liabilities in Excess of Other Assets - (2.9%) | (4,991,439) | ||
| Net Assets - 100.0% | $174,534,329 | ||
(a) Non-income producing security.
(b) Less than 0.005%.
Abbreviations:
NV - Naamloze Vennootschap (Dutch: Limited Liability Company)
See notes to financial statements
| Annual Report | October 31, 2012 | 21 |
| Century Growth Opportunities Fund | Portfolio of Investments |
October 31, 2012
| Shares | Description | Value |
| COMMON STOCKS - 99.1% | |||
| Consumer Discretionary - 20.8% | |||
Hotels, Restaurants & Leisure - 3.8% | |||
23,862 | Buffalo Wild Wings, Inc.(a) | $ 1,812,319 | |
43,467 | Penn National Gaming, Inc.(a) | 1,757,371 | |
3,569,690 | |||
Household Durables - 5.8% | |||
83,717 | DR Horton, Inc. | 1,754,708 | |
36,161 | Jarden Corp. | 1,800,818 | |
19,913 | Whirlpool Corp. | 1,945,102 | |
5,500,628 | |||
Specialty Retail - 7.5% | |||
92,023 | American Eagle Outfitters, Inc. | 1,920,520 | |
37,232 | Dick’s Sporting Goods, Inc. | 1,861,600 | |
28,798 | DSW, Inc., Class A | 1,802,467 | |
25,381 | Vitamin Shoppe, Inc.(a) | 1,452,808 | |
7,037,395 | |||
Textiles, Apparel & Luxury Goods - 3.7% | |||
60,722 | Hanesbrands, Inc.(a) | 2,032,365 | |
47,558 | Vera Bradley, Inc.(a) | 1,417,704 | |
3,450,069 | |||
| Total Consumer Discretionary | 19,557,782 | ||
| Consumer Staples - 2.3% | |||
Food Products - 1.4% | |||
44,705 | B&G Foods, Inc. | 1,353,220 | |
Household Products - 0.9% | |||
16,133 | Church & Dwight Co., Inc. | 818,911 | |
| Total Consumer Staples | 2,172,131 | ||
| Energy - 6.0% | |||
Energy Equipment & Services - 1.9% | |||
25,693 | Dril-Quip, Inc.(a) | 1,779,497 | |
Oil, Gas & Consumable Fuels - 4.1% | |||
42,922 | Cabot Oil & Gas Corp. | 2,016,476 | |
29,465 | Gulfport Energy Corp.(a) | 977,649 | |
20,961 | Whiting Petroleum Corp.(a) | 880,781 | |
3,874,906 | |||
| Total Energy | 5,654,403 | ||
| Shares | Description | Value |
| Financials - 8.4% | ||||
Commercial Banks - 2.1% | ||||
| 154,426 | Associated Banc-Corp. | $ 1,990,551 | ||
Diversified Financial Services - 2.2% | ||||
43,581 | Moody’s Corp. | 2,098,861 | ||
Insurance - 1.9% | ||||
69,637 | Brown & Brown, Inc. | 1,779,226 | ||
Real Estate Investment Trusts (REITs) - 2.2% | ||||
6,611 | Essex Property Trust, Inc. | 991,650 | ||
46,480 | Omega Healthcare Investors, Inc. | 1,066,251 | ||
2,057,901 | ||||
| Total Financials | 7,926,539 | |||
| Health Care - 18.2% | ||||
Health Care Equipment & Supplies - 7.3% | ||||
19,892 | The Cooper Cos., Inc. | 1,909,234 | ||
38,683 | Cyberonics, Inc.(a) | 1,789,089 | ||
46,689 | ResMed, Inc. | 1,864,758 | ||
37,524 | Thoratec Corp.(a) | 1,339,607 | ||
6,902,688 | ||||
Health Care Providers & Services - 4.8% | ||||
45,191 | Hanger, Inc.(a) | 1,145,592 | ||
10,358 | MWI Veterinary Supply, Inc.(a) | 1,087,797 | ||
25,088 | Universal Health Services, Inc., Class B | 1,038,393 | ||
26,012 | WellCare Health Plans, Inc.(a) | 1,238,171 | ||
4,509,953 | ||||
Health Care Technology - 1.0% | ||||
54,765 | MedAssets, Inc.(a) | 970,983 | ||
Life Sciences Tools & Services - 1.4% | ||||
42,695 | PAREXEL International Corp.(a) | 1,310,310 | ||
Pharmaceuticals - 3.7% | ||||
34,964 | Jazz Pharmaceuticals PLC(a) | 1,878,615 | ||
40,318 | Salix Pharmaceuticals Ltd.(a) | 1,574,015 | ||
3,452,630 | ||||
| Total Health Care | 17,146,564 | |||
| Industrials - 15.1% | ||||
Aerospace & Defense - 2.3% | ||||
47,445 | B/E Aerospace, Inc.(a) | 2,139,295 | ||
See notes to financial statements
| 22 | www.centuryfunds.com |
| Century Growth Opportunities Fund | Portfolio of Investments |
October 31, 2012
| Shares | Description | Value | |
| Industrials (continued) | |||
Building Products - 2.2% | |||
33,990 | AO Smith Corp. | $ 2,065,572 | |
Electrical Equipment - 2.1% | |||
17,754 | Roper Industries, Inc. | 1,938,204 | |
Machinery - 2.1% | |||
33,507 | Nordson Corp. | 1,977,918 | |
Road & Rail - 2.2% | |||
26,347 | Kansas City Southern | 2,119,880 | |
Trading Companies & Distributors - 4.2% | |||
26,915 | MSC Industrial Direct Co., Inc., Class A | 2,007,859 | |
48,316 | United Rentals, Inc.(a) | 1,964,529 | |
3,972,388 | |||
| Total Industrials | 14,213,257 | ||
| Information Technology - 19.9% | |||
Communications Equipment - 3.4% | |||
89,993 | Aruba Networks, Inc.(a) | 1,635,173 | |
19,697 | F5 Networks, Inc.(a) | 1,624,608 | |
3,259,781 | |||
Electronic Equipment Instruments & Components - 1.8% | |||
31,532 | IPG Photonics Corp.(a) | 1,673,718 | |
Internet Software & Services - 2.0% | |||
49,413 | Akamai Technologies, Inc.(a) | 1,877,200 | |
IT Services - 4.2% | |||
14,864 | Alliance Data Systems Corp.(a) | 2,126,295 | |
63,616 | Cardtronics, Inc.(a) | 1,807,331 | |
3,933,626 | |||
Semiconductors & Semiconductor Equipment - 2.1% | |||
80,096 | NXP Semiconductor NV(a) | 1,943,129 | |
Software - 6.4% | |||
26,944 | ANSYS, Inc.(a) | 1,909,791 | |
47,019 | BroadSoft, Inc.(a) | 1,797,066 | |
57,730 | NetScout Systems, Inc.(a) | 1,427,663 | |
18,332 | SolarWinds, Inc.(a) | 927,416 | |
6,061,936 | |||
| Total Information Technology | 18,749,390 | ||
| Shares | Description | Value |
| Materials - 5.9% | |||
Chemicals - 4.0% | |||
79,578 | Intrepid Potash, Inc.(a) | $ 1,729,230 | |
7,518 | NewMarket Corp. | 2,039,709 | |
3,768,939 | |||
Metals & Mining - 1.9% | |||
49,286 | Allied Nevada Gold Corp.(a) | 1,819,639 | |
| Total Materials | 5,588,578 | ||
| Telecommunication Services - 2.0% | |||
Diversified Telecommunication Services - 2.0% | |||
73,871 | tw telecom, Inc.(a) | 1,881,494 | |
| Utilities - 0.5% | |||
Water Utilities - 0.5% | |||
19,423 | Aqua America, Inc. | 493,150 | |
| TOTAL COMMON STOCKS | |||
(Cost $88,159,093) | 93,383,288 | ||
| SHORT-TERM INVESTMENTS - 0.7% | |||
Money Market Mutual Funds - 0.7% | |||
672,761 | State Street Institutional U.S. | ||
Government Money Market Fund | |||
(0.00%(b) 7 Day Yield) | 672,761 | ||
| TOTAL SHORT-TERM INVESTMENTS | |||
(Cost $672,761) | 672,761 | ||
| Total Investments - 99.8% | |||
(Cost, $88,831,854) | 94,056,049 | ||
| Other Assets in Excess of Liabilities - 0.2% | 229,402 | ||
| Net Assets - 100.0% | $ 94,285,451 | ||
(a) Non-income producing security.
(b) Less than 0.005%.
Abbreviations:
Ltd. - Limited
NV - Naamloze Vennootschap (Dutch: Limited Liability Company)
PLC - Public Limited Liability
See notes to financial statements
| Annual Report | October 31, 2012 | 23 |
| Century Funds | Statement of Assets and Liabilities |
October 31, 2012
| Century Small | Century | Century Growth | ||||||||||
| Cap Select | Shares | Opportunities | ||||||||||
| Fund | Trust | Fund | ||||||||||
| ASSETS: | ||||||||||||
Investments, at value (Note 1) (cost - see below) | $ | 394,062,546 | $ | 179,525,768 | $ | 94,056,049 | ||||||
Receivable for investments sold | – | 1,414,601 | 701,700 | |||||||||
Receivable for fund shares subscribed | 498,926 | 637 | 111,829 | |||||||||
Dividends receivable | 34,234 | 68,615 | 27,252 | |||||||||
Prepaid expenses | 8,208 | 3,558 | 578 | |||||||||
Total Assets | 394,603,914 | 181,013,179 | 94,897,408 | |||||||||
| LIABILITIES: | ||||||||||||
Payable to Affiliates: | ||||||||||||
Investment adviser fee (Note 4) | 318,428 | 122,047 | 55,744 | |||||||||
Administration fees (Note 5) | – | 15,256 | 8,114 | |||||||||
Distribution and service fees (Note 6) | 18,467 | – | – | |||||||||
Payable for investments purchased | 178,268 | 6,023,255 | 356,669 | |||||||||
Payable for shares redeemed | 474,657 | 201,235 | 98,466 | |||||||||
Accrued expenses and other liabilities | 169,850 | 117,057 | 92,964 | |||||||||
Total Liabilities | 1,159,670 | 6,478,850 | 611,957 | |||||||||
| NET ASSETS | $ | 393,444,244 | $ | 174,534,329 | $ | 94,285,451 | ||||||
| NET ASSETS CONSIST OF: | ||||||||||||
Paid-in capital | $ | 382,277,431 | $ | 122,799,641 | $ | 97,962,452 | ||||||
Accumulated net investment loss | (1,927,740 | ) | (129,905 | ) | (117,847 | ) | ||||||
Accumulated net realized gain/(loss) on investments | (43,996,318 | ) | 21,366,294 | (8,783,349 | ) | |||||||
Unrealized appreciation in value of investments | 57,090,871 | 30,498,299 | 5,224,195 | |||||||||
| NET ASSETS | $ | 393,444,244 | $ | 174,534,329 | $ | 94,285,451 | ||||||
Net Assets: | ||||||||||||
Institutional Shares | $ | 281,479,510 | $ | 174,534,329 | $ | 94,285,451 | ||||||
Investor Shares | $ | 111,964,734 | N/A | N/A | ||||||||
Shares Outstanding (Note 2): | ||||||||||||
Institutional Shares | 10,713,856 | 8,809,172 | 8,724,642 | |||||||||
Investor Shares | 4,398,713 | N/A | N/A | |||||||||
Net Asset Value Per Share | ||||||||||||
(Represents both the offering and redemption price) | ||||||||||||
Institutional Shares | $ | 26.27 | $ | 19.81 | $ | 10.81 | ||||||
Investor Shares | $ | 25.45 | N/A | N/A | ||||||||
Cost of investments | $ | 336,971,675 | $ | 149,027,469 | $ | 88,831,854 | ||||||
See notes to financial statements
| 24 | www.centuryfunds.com |
| Century Funds | Statement of Operations |
October 31, 2012
| Century Small | Century | Century Growth | ||||||||||
| Cap Select | Shares | Opportunities | ||||||||||
| Fund | Trust | Fund | ||||||||||
| INVESTMENT INCOME: | ||||||||||||
Dividends | $ | 2,446,060 | $ | 2,557,536 | $ | 667,502 | ||||||
Foreign taxes withheld | – | (130,566 | ) | – | ||||||||
Total Investment Income | 2,446,060 | 2,426,970 | 667,502 | |||||||||
| EXPENSES: | ||||||||||||
Investment adviser fees (Notes 4 and 7) | 3,722,243 | 1,435,223 | 580,495 | |||||||||
Distribution and service fees - (Note 6) | ||||||||||||
Investor Shares | 227,307 | – | – | |||||||||
Administration fees | – | 179,403 | 72,562 | |||||||||
Transfer agency fees: | ||||||||||||
Institutional Shares | 73,684 | 122,661 | 26,696 | |||||||||
Investor Shares | 230,720 | – | – | |||||||||
Custodian and Fund accounting fees | 103,628 | 54,755 | 73,001 | |||||||||
Insurance fees | 32,371 | 14,429 | 1,438 | |||||||||
Professional fees | 79,032 | 60,510 | 56,923 | |||||||||
Registration fees | 49,391 | 20,610 | 21,004 | |||||||||
Trustee fees | 135,118 | 62,532 | 32,725 | |||||||||
Printing fees | 62,233 | 41,241 | 5,982 | |||||||||
Other expenses | 22,490 | 10,555 | 824 | |||||||||
Total Expenses | 4,738,217 | 2,001,919 | 871,650 | |||||||||
Adviser waivers/reimbursements (Note 7) | – | – | (73,469 | ) | ||||||||
Net Expenses | 4,738,217 | 2,001,919 | 798,181 | |||||||||
| NET INVESTMENT INCOME/(LOSS) | (2,292,157 | ) | 425,051 | (130,679 | ) | |||||||
| REALIZED AND UNREALIZED GAIN/(LOSS) ON INVESTMENTS: | ||||||||||||
Net realized gain/(loss) on investments | 33,340,695 | 21,366,294 | (8,245,814 | ) | ||||||||
Net change in unrealized appreciation/(depreciation) of investments | 5,051,228 | (8,805,126 | ) | 4,871,077 | ||||||||
| NET REALIZED AND UNREALIZED | ||||||||||||
| GAIN/(LOSS) ON INVESTMENTS | 38,391,923 | 12,561,168 | (3,374,737 | ) | ||||||||
| NET INCREASE/(DECREASE) IN NET ASSETS | ||||||||||||
| RESULTING FROM OPERATIONS | $ | 36,099,766 | $ | 12,986,219 | $ | (3,505,416 | ) | |||||
See notes to financial statements
| Annual Report | October 31, 2012 | 25 |
| Century Funds | Statement of Changes in Net Assets |
| Century Small Cap Select Fund | ||||||||
| For the Year Ended October 31, | ||||||||
| 2012 | 2011 | |||||||
| OPERATIONS: | ||||||||
Net investment income/(loss) | $ | (2,292,157 | ) | $ | (1,865,136 | ) | ||
Net realized gain/(loss) on investments | 33,340,695 | 79,336,385 | ||||||
Change in net unrealized appreciation/(depreciation) | 5,051,228 | (29,175,691 | ) | |||||
Net increase/(decrease) in net assets resulting | ||||||||
from operations | 36,099,766 | 48,295,558 | ||||||
| DISTRIBUTIONS TO SHAREHOLDERS: | ||||||||
| Institutional Shares | ||||||||
From net investment income | – | – | ||||||
From net realized gains on investments | – | – | ||||||
| Investor Shares | ||||||||
From net investment income | – | – | ||||||
From net realized gains on investments | – | – | ||||||
Total distributions | – | – | ||||||
| CAPITAL SHARE TRANSACTIONS: | ||||||||
Increase/(decrease) in net assets from capital | ||||||||
share transactions (Note 2) | (14,062,915 | ) | (18,974,857 | ) | ||||
Redemption fees | 5,950 | 32,775 | ||||||
Net increase/(decrease) from share transactions | (14,056,965 | ) | (18,942,082 | ) | ||||
Total increase/(decrease) | 22,042,801 | 29,353,476 | ||||||
| NET ASSETS: | ||||||||
Beginning of year | 371,401,443 | 342,047,967 | ||||||
End of year* | $ | 393,444,244 | $ | 371,401,443 | ||||
*Including accumulated net investment income/(loss) | $ | (1,927,740 | ) | $ | – | |||
See notes to financial statements
| 26 | www.centuryfunds.com |
| Century Funds | Statement of Changes in Net Assets |
| Century Shares Trust | Century Growth Opportunities Fund | |||||||||||||||
| For the Period | ||||||||||||||||
| November 17, 2010 | ||||||||||||||||
| For the Year Ended October 31, | (Inception) to | |||||||||||||||
| 2012 | 2011 | 2012 | October 31, 2011 | |||||||||||||
| OPERATIONS: | ||||||||||||||||
Net investment income/(loss) | $ | 425,051 | $ | (186,914 | ) | $ | (130,679 | ) | $ | (30,402 | ) | |||||
Net realized gain/(loss) on investments | 21,366,294 | 18,620,958 | (8,245,814 | ) | (537,714 | ) | ||||||||||
Change in net unrealized | ||||||||||||||||
appreciation/(depreciation) | (8,805,126 | ) | (1,153,307 | ) | 4,871,077 | 353,118 | ||||||||||
Net increase/(decrease) in net assets resulting | ||||||||||||||||
from operations | 12,986,219 | 17,280,737 | (3,505,416 | ) | (214,998 | ) | ||||||||||
| DISTRIBUTIONS TO SHAREHOLDERS: | ||||||||||||||||
| Institutional Shares | ||||||||||||||||
From net investment income | (554,986 | ) | (51,630 | ) | – | – | ||||||||||
From net realized gains on investments | (18,171,512 | ) | (7,888,685 | ) | – | – | ||||||||||
| Investor Shares | ||||||||||||||||
From net investment income | – | – | – | – | ||||||||||||
From net realized gains on investments | – | (73,860 | ) | – | – | |||||||||||
Total distributions | (18,726,498 | ) | (8,014,175 | ) | – | – | ||||||||||
| CAPITAL SHARE TRANSACTIONS: | ||||||||||||||||
Increase/(decrease) in net assets from capital | ||||||||||||||||
share transactions (Note 2) | 2,059,194 | (9,736,363 | ) | 90,460,716 | 7,538,090 | |||||||||||
Redemption fees | 14,367 | 424 | 6,703 | 356 | ||||||||||||
Net increase/(decrease) from share transactions | 2,073,561 | (9,735,939 | ) | 90,467,419 | 7,538,446 | |||||||||||
Total increase/(decrease) | (3,666,718 | ) | (469,377 | ) | 86,962,003 | 7,323,448 | ||||||||||
| NET ASSETS: | ||||||||||||||||
Beginning of year | 178,201,047 | 178,670,424 | 7,323,448 | – | ||||||||||||
End of year* | $ | 174,534,329 | $ | 178,201,047 | $ | 94,285,451 | $ | 7,323,448 | ||||||||
*Including accumulated net investment income/(loss) | $ | (129,905 | ) | $ | – | $ | (117,847 | ) | $ | – | ||||||
See notes to financial statements
| Annual Report | October 31, 2012 | 27 |
Century Small Cap Select Fund – Institutional Shares | Financial Highlights |
| For a share outstanding throughout the periods presented. | ||||||||||||||||||||
| Year Ended October 31, | ||||||||||||||||||||
| 2012 | 2011 | 2010 | 2009 | 2008 | ||||||||||||||||
| NET ASSET VALUE, BEGINNING OF PERIOD | $ | 23.91 | $ | 20.99 | $ | 16.34 | $ | 14.62 | $ | 26.13 | ||||||||||
| INCOME/(LOSS) FROM OPERATIONS: | ||||||||||||||||||||
Net investment loss(a) | (0.12 | ) | (0.09 | ) | (0.05 | ) | (0.01 | ) | (0.12 | ) | ||||||||||
Net realized and unrealized gain/(loss) on investments | 2.48 | 3.01 | 4.70 | 1.73 | (9.00 | ) | ||||||||||||||
Total income/(loss) from investment operations | 2.36 | 2.92 | 4.65 | 1.72 | (9.12 | ) | ||||||||||||||
| LESS DISTRIBUTIONS FROM: | ||||||||||||||||||||
Net investment income | – | – | – | – | (0.10 | ) | ||||||||||||||
Tax return of capital | – | – | – | – | (0.19 | ) | ||||||||||||||
Net realized gain on investment transactions | – | – | – | – | (2.10 | ) | ||||||||||||||
Total distributions | – | – | – | – | (2.39 | ) | ||||||||||||||
| REDEMPTION FEES | 0.00 | (b) | 0.00 | (b) | 0.00 | (b) | 0.00 | (b) | 0.00 | (b) | ||||||||||
| NET ASSET VALUE, END OF PERIOD | $ | 26.27 | $ | 23.91 | $ | 20.99 | $ | 16.34 | $ | 14.62 | ||||||||||
Total Return | 9.87 | % | 13.86 | % | 28.52 | % | 11.69 | % | (38.24 | %) | ||||||||||
RATIOS AND SUPPLEMENTAL DATA | ||||||||||||||||||||
Net assets, end of period (000’s) | $ | 281,480 | $ | 254,724 | $ | 249,429 | $ | 216,295 | $ | 262,793 | ||||||||||
Ratio of expenses to average net assets | 1.10 | % | 1.11 | % | 1.13 | % | 1.14 | % | 1.11 | % | ||||||||||
Ratio of net investment loss to average net assets | (0.48 | %) | (0.37 | %) | (0.25 | %) | (0.08 | %) | (0.57 | %) | ||||||||||
Portfolio Turnover Rate | 53 | % | 75 | % | 85 | % | 133 | % | 104 | % | ||||||||||
(a) Per share numbers have been calculated using the average shares method. | ||||||||||||||||||||
(b) Less than $0.005 per share. | ||||||||||||||||||||
See notes to financial statements
| 28 | www.centuryfunds.com |
| Century Small Cap Select Fund – Investor Shares | Financial Highlights |
| For a share outstanding throughout the periods presented. | ||||||||||||||||||||
| Year Ended October 31, | ||||||||||||||||||||
| 2012 | 2011 | 2010 | 2009 | 2008 | ||||||||||||||||
| NET ASSET VALUE, BEGINNING OF PERIOD | $ | 23.25 | $ | 20.49 | $ | 16.00 | $ | 14.37 | $ | 25.72 | ||||||||||
| INCOME/(LOSS) FROM OPERATIONS: | ||||||||||||||||||||
Net investment loss(a) | (0.21 | ) | (0.17 | ) | (0.11 | ) | (0.07 | ) | (0.20 | ) | ||||||||||
Net realized and unrealized gain/(loss) on investments | 2.41 | 2.92 | 4.60 | 1.70 | (8.86 | ) | ||||||||||||||
Total income/(loss) from investment operations | 2.20 | 2.75 | 4.49 | 1.63 | (9.06 | ) | ||||||||||||||
| LESS DISTRIBUTIONS FROM: | ||||||||||||||||||||
Tax return of capital | – | – | – | – | (0.19 | ) | ||||||||||||||
Net realized gain on investment transactions | – | – | – | – | (2.10 | ) | ||||||||||||||
Total distributions | – | – | – | – | (2.29 | ) | ||||||||||||||
| REDEMPTION FEES | 0.00 | (b) | 0.01 | (b) | 0.00 | (b) | 0.00 | (b) | 0.00 | (b) | ||||||||||
| NET ASSET VALUE, END OF PERIOD | $ | 25.45 | $ | 23.25 | $ | 20.49 | $ | 16.00 | $ | 14.37 | ||||||||||
Total Return | 9.46 | % | 13.47 | % | 28.06 | % | 11.27 | % | (38.49 | %) | ||||||||||
RATIOS AND SUPPLEMENTAL DATA | ||||||||||||||||||||
Net assets, end of period (000’s) | $ | 111,965 | $ | 116,678 | $ | 92,618 | $ | 91,809 | $ | 102,252 | ||||||||||
Ratio of expenses to average net assets | 1.47 | % | 1.48 | % | 1.50 | % | 1.53 | % | 1.50 | % | ||||||||||
Ratio of net investment loss to average net assets | (0.84 | %) | (0.71 | %) | (0.61 | %) | (0.47 | %) | (0.96 | %) | ||||||||||
Portfolio Turnover Rate | 53 | % | 75 | % | 85 | % | 133 | % | 104 | % | ||||||||||
(a) Per share numbers have been calculated using the average shares method. | ||||||||||||||||||||
(b) Less than $0.005 per share. | ||||||||||||||||||||
See notes to financial statements
| Annual Report | October 31, 2012 | 29 |
| Century Shares Trust – Institutional Shares | Financial Highlights |
| For a share outstanding throughout the periods presented. | ||||||||||||||||||||
| Year Ended October 31, | ||||||||||||||||||||
| 2012 | 2011 | 2010 | 2009 | 2008 | ||||||||||||||||
| NET ASSET VALUE, BEGINNING OF PERIOD | $ | 20.66 | $ | 19.65 | $ | 16.84 | $ | 15.51 | $ | 29.52 | ||||||||||
| INCOME/(LOSS) FROM OPERATIONS: | ||||||||||||||||||||
Net investment income/(loss)(a) | 0.05 | (0.02 | ) | (0.01 | ) | 0.00 | (b) | (0.01 | ) | |||||||||||
Net realized and unrealized gain/(loss) on investments | 1.28 | 1.93 | 2.82 | 1.36 | (7.44 | ) | ||||||||||||||
Total income/(loss) from investment operations | 1.33 | 1.91 | 2.81 | 1.36 | (7.45 | ) | ||||||||||||||
| LESS DISTRIBUTIONS FROM: | ||||||||||||||||||||
Net investment income | (0.06 | ) | (0.01 | ) | (0.00 | )(b) | (0.03 | ) | (0.30 | ) | ||||||||||
Net realized gain on investment transactions | (2.12 | ) | (0.89 | ) | – | – | (6.26 | ) | ||||||||||||
Total distributions | (2.18 | ) | (0.90 | ) | (0.00 | )(b) | (0.03 | ) | (6.56 | ) | ||||||||||
| REDEMPTION FEES | 0.00 | (b) | 0.00 | (b) | 0.00 | (b) | 0.00 | (b) | 0.00 | (b) | ||||||||||
| NET ASSET VALUE, END OF PERIOD | $ | 19.81 | $ | 20.66 | $ | 19.65 | $ | 16.84 | $ | 15.51 | ||||||||||
Total Return | 7.63 | % | 9.79 | % | 16.72 | % | 8.59 | % | (32.31 | %) | ||||||||||
RATIOS AND SUPPLEMENTAL DATA | ||||||||||||||||||||
Net assets, end of period (000’s) | $ | 174,534 | $ | 178,201 | $ | 177,042 | $ | 166,574 | $ | 168,199 | ||||||||||
Ratio of expenses to average net assets | 1.12 | % | 1.13 | % | 1.15 | % | 1.20 | % | 1.17 | % | ||||||||||
Ratio of net investment loss to average net assets | 0.24 | % | (0.10 | %) | (0.05 | %) | 0.03 | % | (0.02 | %) | ||||||||||
Portfolio Turnover Rate | 79 | % | 72 | % | 67 | % | 79 | % | 91 | % | ||||||||||
(a) Per share numbers have been calculated using the average shares method. | ||||||||||||||||||||
(b) Less than $0.005 per share. | ||||||||||||||||||||
See notes to financial statements
| 30 | www.centuryfunds.com |
| Century Growth Opportunities Fund – Institutional Shares | Financial Highlights |
| For a share outstanding throughout the periods presented. | ||||||||
| For the Period | ||||||||
| For the | November 17, 2010 | |||||||
| Year Ended | (Inception) to | |||||||
| October 31, 2012 | October 31, 2011 | |||||||
| NET ASSET VALUE, BEGINNING OF PERIOD | $ | 10.67 | $ | 10.00 | ||||
| INCOME/(LOSS) FROM OPERATIONS: | ||||||||
Net investment loss(a) | (0.02 | ) | (0.07 | ) | ||||
Net realized and unrealized gain on investments | 0.16 | 0.74 | ||||||
Total income from investment operations | 0.14 | 0.67 | ||||||
| REDEMPTION FEES | 0.00 | (b) | 0.00 | (b) | ||||
| NET ASSET VALUE, END OF PERIOD | $ | 10.81 | $ | 10.67 | ||||
Total Return | 1.31 | % | 6.70 | %(c) | ||||
RATIOS AND SUPPLEMENTAL DATA | ||||||||
Net assets, end of period (000’s) | $ | 94,285 | $ | 7,323 | ||||
Ratio of expenses to average net assets without | ||||||||
giving effect to contractual expense agreement | 1.20 | % | 3.62 | %(d) | ||||
Ratio of expenses to average net assets | 1.10 | % | 1.10 | %(d) | ||||
Ratio of net investment loss to average net assets | (0.18 | %) | (0.64 | %)(d) | ||||
Portfolio Turnover Rate | 148 | % | 119 | %(c) | ||||
| (a) | Per share numbers have been calculated using the average shares method. |
| (b) | Less than $0.005 per share. |
| (c) | Not annualized. |
| (d) | Annualized. |
See notes to financial statements
| Annual Report | October 31, 2012 | 31 |
| Century Funds | Notes to Financial Statements |
October 31, 2012
(1) SIGNIFICANT ACCOUNTING POLICIES
Century Capital Management Trust (the “Trust”) is registered under the Investment Company Act of 1940 (“1940 Act”), as amended, as an open-end management investment company organized as a Massachusetts business trust. Century Shares Trust, Century Small Cap Select Fund and Century Growth Opportunities Fund (each a “Fund” and, collectively, the “Funds”) are diversified series of the Trust. The following are significant accounting policies consistently followed by the Funds and are in conformity with accounting principles generally accepted in the United States (GAAP).
The investment objective of Century Shares Trust is to seek long-term growth of principal and income. The investment objective of each of Century Small Cap Select Fund and Century Growth Opportunities Fund is to seek long-term capital growth.
A. Security Valuations — Equity securities are valued at the last reported sale price or official closing price on the primary exchange or market on which they are traded, as reported by an independent pricing service. If no sale price or official closing price is reported, market value is generally determined based on quotes or closing prices obtained from a quotation reporting system, established market maker, or reputable pricing service. For unlisted securities and for exchange-listed securities for which there are no reported sales or official closing prices, fair value is generally determined using closing bid prices. In the absence of readily available market quotes, securities and other assets will be valued at fair value, as determined in good faith under procedures established by and under the general supervision of the Funds’ Board of Trustees. Short-term obligations, maturing in 60 days or less, are valued at amortized cost, which approximates fair value. Investments in open-end mutual funds are valued at their closing net asset value each business day.
A three-tier hierarchy has been established to classify fair value measurements for disclosure purposes. Inputs refer broadly to the assumptions that market participants would use in pricing the asset or liability, including assumptions about risk. Inputs may be observable or unobservable. Observable inputs are inputs that reflect the assumptions market participants would use in pricing the asset or liability that are developed based on market data obtained from sources independent of the reporting entity. Unobservable inputs are inputs that reflect the reporting entity’s own assumptions about the assumptions market participants would use in pricing the asset or liability that are developed based on the best information available.
Various inputs are used in determining the value of each Fund’s investments as of the reporting period end. These inputs are categorized in the following hierarchy under applicable financial accounting standards:
Level 1 — Unadjusted quoted prices in active markets for identical, unrestricted assets or liabilities that the Funds have the ability to access at the measurement date;
Level 2 — Quoted prices which are not active, quoted prices for similar assets or liabilities in active markets or inputs other than quoted prices that are observable (either directly or indirectly) for substantially the full term of the asset or liability; and
Level 3 — Significant unobservable prices or inputs (including the Fund’s own assumptions in determining the fair value of investments) where there is little or no market activity for the asset or liability at the measurement date.
The availability of observable inputs can vary from security to security and is affected by a wide variety of factors, including, for example, the type of security, whether the security is new and not yet established in the marketplace, the liquidity of markets, and other characteristics particular to the security. To the extent that valuation is based on models or inputs that are less observable or unobservable in the market, the determination of fair value requires more judgment. Accordingly, the degree of judgment exercised in determining fair value is greatest for instruments categorized in Level 3.
| 32 | www.centuryfunds.com |
| Century Funds | Notes to Financial Statements |
October 31, 2012
The following is a summary of the inputs used as of October 31, 2012 in valuing the Funds’ investments carried at fair value:
| Century Small Cap Select Fund | Level 2 - | |||||||||||||||
| Other | Level 3 - | |||||||||||||||
| Significant | Significant | |||||||||||||||
| Investments in Securities at | Level 1 - | Observable | Unobservable | |||||||||||||
| Value* | Quoted Prices | Inputs | Inputs | Total | ||||||||||||
Common Stocks | $ | 382,302,796 | $ | — | $ | — | $ | 382,302,796 | ||||||||
Short-Term Investments | 11,759,750 | — | — | 11,759,750 | ||||||||||||
TOTAL | $ | 394,062,546 | $ | — | $ | — | $ | 394,062,546 | ||||||||
| Century Shares Trust | Level 2 - | |||||||||||||||
| Other | Level 3 - | |||||||||||||||
| Significant | Significant | |||||||||||||||
| Investments in Securities at | Level 1 - | Observable | Unobservable | |||||||||||||
| Value* | Quoted Prices | Inputs | Inputs | Total | ||||||||||||
Common Stocks | $ | 169,665,042 | $ | — | $ | — | $ | 169,665,042 | ||||||||
Short-Term Investments | 9,860,726 | — | — | 9,860,726 | ||||||||||||
TOTAL | $ | 179,525,768 | $ | — | $ | — | $ | 179,525,768 | ||||||||
| Century Growth Opportunities Fund | Level 2 - | |||||||||||||||
| Other | Level 3 - | |||||||||||||||
| Significant | Significant | |||||||||||||||
| Investments in Securities at | Level 1 - | Observable | Unobservable | |||||||||||||
| Value* | Quoted Prices | Inputs | Inputs | Total | ||||||||||||
Common Stocks | $ | 93,383,288 | $ | — | $ | — | $ | 93,383,288 | ||||||||
Short-Term Investments | 672,761 | — | — | 672,761 | ||||||||||||
TOTAL | $ | 94,056,049 | $ | — | $ | — | $ | 94,056,049 | ||||||||
* At October 31, 2012 the Funds held investments in common stocks classified as Level 1, with corresponding major categories as shown on each Fund’s Portfolio of Investments.
The Funds recognize transfers into and out of all levels at the end of the reporting period. There were no transfers into or out of Levels 1 and 2 during the period.
There were no securities classified as Level 3 securities during the period, thus, a reconciliation of assets in which significant unobservable inputs (Level 3) were used is not applicable for these Funds.
B. Security Transactions — Security transactions are recorded on a trade date basis. Gain or loss on sales is determined by the use of the highest-cost method, for both financial reporting and federal income tax purposes. Dividend income is recorded on the ex-dividend date. Payments received from certain investments held by the Funds may be comprised of dividends, capital gains and return of capital. The Funds originally estimate the expected classification of such payments. The amounts may subsequently be reclassified upon receipt of information from the issuer. The Funds may invest in equity securities issued or guaranteed by companies organized and based in countries outside of the United States. These securities may be traded on foreign securities exchanges or in foreign over-the-counter markets. Foreign dividend income is recorded on ex-dividend date or as soon as practicable after the Fund determines the existence of a dividend declaration after exercising reasonable due diligence. Foreign income and capital gain on some foreign securities may be subject to foreign withholding taxes, which are accrued as applicable. Interest income is recorded daily on an accrual basis.
| Annual Report | October 31, 2012 | 33 |
| Century Funds | Notes to Financial Statements |
October 31, 2012
C. Use of Estimates — The preparation of these financial statements in accordance with GAAP incorporates estimates made by management in determining the reported amounts of assets, liabilities, income and expenses of the Funds. Actual results could differ from those estimates.
D. Risks and Uncertainty — Century Small Cap Select Fund concentrates its investments in certain industries detailed in the Portfolio of Investments, which subjects the Fund to the risks associated with those industries and may result in greater fluctuation in share value than is experienced in more diversified portfolios. In addition, the Fund invests in smaller companies, which generally involves greater risk than investing in larger, more established companies.
Century Shares Trust may invest a significant portion of assets in a limited number of companies. As a result, the Fund may be more susceptible to financial, market and economic events affecting particular companies and therefore may experience greater price volatility than funds with more diversified portfolios. Century Growth Opportunities Fund invests mainly in small-cap and mid-cap companies, which, historically, have been more volatile in price than the stocks of large-cap companies.
Foreign investing involves certain risks and increased volatility not associated with investing solely in the U.S. These risks include currency fluctuations, economic or financial instability, lack of timely or reliable financial information or unfavorable political or legal developments.
At any given time, a significant portion of the assets of each Fund may be invested in securities of companies within the same market sector of the economy. Companies within the same sector often face similar issues and, consequently, may react similarly to changes in market conditions. If a Fund has a significant weighting in one or more sectors, it may be subject to more risk and price volatility.
E. Multiple Classes of Shares — Century Small Cap Select Fund offers two classes of shares, which differ in their respective distribution and service fees. Investment income, realized and unrealized capital gains and losses, the common expenses of the Fund, and certain fund-level expense reductions, if any, are allocated on a pro rata basis to each class based on the relative net assets of each class to the total net assets of the Fund. Certain expense reductions may differ by class. Because transfer agent fees include a per account fee, each class differs with respect to transfer agent fees incurred.
Prior to May 27, 2011, Century Shares Trust offered two classes of shares; however, effective as of that date, all 61,614 of the Fund’s issued and outstanding Investor Shares were converted to Institutional Shares and the Investor Shares class was closed.
F. Redemption Fees — In general, shares of each Fund may be redeemed at net asset value. However, upon the redemption of shares held less than 90 days, a redemption fee of 1% of the current net asset value of the shares may be assessed and retained by each share class of each Fund for the benefit of the Fund’s remaining shareholders. The redemption fee is accounted for as an addition to paid-in-capital and amounts are shown on the Schedule of Changes in Net Assets.
G. Income Tax Information and Distributions to Shareholders — Each year, each Fund intends to qualify as a regulated investment company by distributing all of its taxable income and sufficient net investment income and net realized gains, if any, under Subchapter M of the Internal Revenue Code (the “Code”). As a result, no provision for income taxes is required in the accompanying financial statements. Foreign taxes are provided for based on each Fund’s understanding of the tax rules and rates that exist in the foreign markets in which it invests. Income dividends and capital gain distributions are declared separately for each class. Distributions are recorded on the ex-dividend date. Income and capital gain distributions are determined in accordance with income tax regulations, which may differ from generally accepted accounting principles. Capital accounts within the financial statements are adjusted for permanent book and tax differences. Generally accepted accounting principles require that any distributions in excess of tax basis earnings and profits be reported in the financial statements as a tax return of capital.
In order to present undistributed (distributions in excess of) net investment income (“UNII”) and accumulated net realized loss (“Accumulated Loss”) more closely to its tax character, the following accounts for each Fund were increased (decreased) as of October 31, 2012:
| 34 | www.centuryfunds.com |
| Century Funds | Notes to Financial Statements |
October 31, 2012
| Accumulated | ||||||||||||
| Fund | Paid-In Capital | UNII | gain/loss | |||||||||
Century Small Cap Select Fund | $ | (364,420 | ) | $ | 364,417 | $ | 3 | |||||
Century Shares Trust | (1 | ) | 30 | (29 | ) | |||||||
Century Growth Opportunities Fund | (12,746 | ) | 12,832 | (86 | ) | |||||||
These reclassifications have no impact on net assets or the results of operations. The Funds had temporary book/tax differences primarily attributable to wash sales or portfolio securities and permanent book/tax differences primarily attributable to net operating losses. Temporary differences will reverse in a subsequent period.
Included in the amounts reclassified was a net operating loss offset to Paid-In Capital of $364,417 for the Century Small Cap Select Fund and $12,818 for Century Growth Opportunities Fund.
The net unrealized appreciation/depreciation of investments based on federal tax cost as of October 31, 2012 was as follows:
| Century | ||||||||||||
| Century | Century | Growth | ||||||||||
| Small Cap | Shares | Opportunities | ||||||||||
| Select Fund | Trust | Fund | ||||||||||
Gross appreciation (excess of value over tax cost) | $ | 76,383,440 | $ | 37,745,274 | $ | 7,595,098 | ||||||
Gross depreciation (excess of tax cost over value) | (19,674,124 | ) | (7,246,975 | ) | (3,003,012 | ) | ||||||
Net appreciation | $ | 56,709,316 | $ | 30,498,299 | $ | 4,592,086 | ||||||
Cost of investments for federal income tax purposes | $ | 337,353,230 | $ | 149,027,469 | $ | 89,463,963 | ||||||
The components of distributable earnings on a tax basis as of October 31, 2012 were as follows:
| Century | ||||||||||||
| Century | Century | Growth | ||||||||||
| Small Cap | Shares | Opportunities | ||||||||||
| Select Fund | Trust | Fund | ||||||||||
Undistributed Ordinary Income | $ | 0 | $ | 153,857 | $ | 0 | ||||||
Accumulated Capital Gains/(Losses) | (43,614,763 | ) | 21,330,899 | (8,151,240 | ) | |||||||
Unrealized Appreciation/ (Depreciation) | 56,709,316 | 30,498,299 | 4,592,086 | |||||||||
Other Cumulative Effect of Timing Differences | (1,927,740 | ) | (248,367 | ) | (117,847 | ) | ||||||
Total | $ | 11,166,813 | $ | 51,734,688 | $ | (3,677,001 | ) | |||||
The differences between the components of distributable earnings on a tax basis and the amounts reflected in the Statement of Assets and Liabilities are primarily due to wash sales and real estate investment trust basis adjustments.
The tax character of distributions paid by the Funds during the year ended October 31, 2012 was as follows:
| Century | ||||||||||||
| Century | Century | Growth | ||||||||||
| Small Cap | Shares | Opportunities | ||||||||||
| Select Fund | Trust | Fund | ||||||||||
Ordinary Income | $ | 0 | $ | 1,057,727 | $ | 0 | ||||||
Long-Term Capital Gain | 0 | 17,668,771 | 0 | |||||||||
Total | $ | 0 | $ | 18,726,498 | $ | 0 |
The tax character of distributions paid by the Funds during the year ended October 31, 2011 was as follows:
| Century | ||||||||||||
| Century | Century | Growth | ||||||||||
| Small Cap | Shares | Opportunities | ||||||||||
| Select Fund | Trust | Fund | ||||||||||
Ordinary Income | $ | 0 | $ | 51,630 | $ | 0 | ||||||
Long-Term Capital Gain | 0 | 7,962,545 | 0 | |||||||||
Total | $ | 0 | $ | 8,014,175 | $ | 0 |
| Annual Report | October 31, 2012 | 35 |
| Century Funds | Notes to Financial Statements |
October 31, 2012
As of October 31, 2012 the Funds had pre-RIC Modernization enactment capital loss carryforwards which may reduce the Funds’ taxable income arising from future net realized gains on investments, if any, to the extent permitted by the Code and thus may reduce the amount of the distributions to shareholders which would otherwise be necessary to relieve the Funds of any liability for federal tax. Pursuant to the Code, such capital loss carryforwards will expire as follows:
| Century | ||||||||||||
| Century | Century | Growth | ||||||||||
| Small Cap | Shares | Opportunities | ||||||||||
Expiration Date | Select Fund | Trust | Fund | |||||||||
October 31, 2017 | $ | 43,614,763 | $ | 0 | $ | 0 | ||||||
October 31, 2019 | $ | 0 | $ | 0 | $ | 501,921 | ||||||
The Century Small Cap Select Fund utilized $33,286,885 of capital loss carryforwards during the period ended October 31, 2012.
As of October 31, 2012 the Funds had post-RIC Modernization enactment capital loss carryforwards as follows:
| Century | ||||||||||||
| Century | Century | Growth | ||||||||||
| Small Cap | Shares | Opportunities | ||||||||||
Character | Select Fund | Trust | Fund | |||||||||
Short-Term | $ | 0 | $ | 0 | $ | 7,649,319 | ||||||
Long-Term | $ | 0 | $ | 0 | $ | 0 | ||||||
Post-enactment capital losses arise in fiscal years beginning after December 22, 2010. As a result of the enactment of the Regulated Investment Company Act of 2010, pre-enactment capital loss carryforwards may be more likely to expire unused. Additionally, post-enactment capital losses that are carried forward will retain their character as either short-term or long-term losses rather than being considered all short-term as under previous law.
The Funds elect to defer to the period ending October 31, 2013, late year ordinary losses in the amounts of $1,927,740 for Century Small Cap Select Fund, $248,367 for Century Shares Trust and $117,847 for Century Growth Opportunities Fund.
As of October 31, 2012, the Funds had no uncertain tax positions that would require financial statement recognition or disclosure. The Funds’ federal tax returns filed for the fiscal years ended October 31, 2009, October 31, 2010, October 31, 2011 and returns to be filed for the year ended October 31, 2012 remain subject to examination by the Internal Revenue Service.
H. Indemnifications — In the normal course of business, the Funds enter into agreements with service providers that may contain indemnification clauses. The Funds maximum exposure under these arrangements is unknown as this would involve future claims that may be made against the Funds that have not yet occurred.
(2) TRANSACTIONS IN SHARES
Century Small Cap Select Fund — The number of authorized shares is unlimited. Transactions in each class of shares were as follows:
| For the Year Ended October 31, 2012 | ||||||||||||||||
| Institutional Shares | Investor Shares | |||||||||||||||
| Shares | Amount | Shares | Amount | |||||||||||||
Sold | 2,049,071 | $ | 52,385,431 | 500,910 | $ | 12,388,387 | ||||||||||
Repurchased | (1,990,017 | ) | (50,928,700 | ) | (1,121,329 | ) | (27,908,033 | ) | ||||||||
Net Increase/(Decrease) | 59,054 | $ | 1,456,731 | (620,419 | ) | $ | (15,519,646 | ) | ||||||||
| 36 | www.centuryfunds.com |
| Century Funds | Notes to Financial Statements |
October 31, 2012
| For the Year Ended October 31, 2011 | ||||||||||||||||
| Institutional Shares | Investor Shares | |||||||||||||||
| Shares | Amount | Shares | Amount | |||||||||||||
Sold | 2,529,433 | $ | 61,015,656 | 2,015,598 | $ | 48,942,430 | ||||||||||
Repurchased | (3,756,263 | ) | (93,461,220 | ) | (1,517,651 | ) | (35,471,723 | ) | ||||||||
Net Increase/(Decrease) | (1,226,830 | ) | $ | (32,445,564 | ) | 497,947 | $ | 13,470,707 | ||||||||
Century Shares Trust — The number of authorized shares is unlimited. Transactions in each class of shares were as follows:
| For the Year Ended October 31, 2012 | ||||||
| Institutional Shares | ||||||
| Shares | Amount | |||||
Sold | 180,586 | $ | 3,625,862 | |||
Issued to shareholders in reinvestment of distributions | 931,203 | 16,696,472 | ||||
| 1,111,789 | 20,322,334 | |||||
Repurchased | (928,097 | ) | (18,263,140 | ) | ||
Net Increase | 183,692 | $ | 2,059,194 | |||
| For the Year Ended October 31, 2011 | ||||||||||||||||
| Institutional Shares | Investor Shares | |||||||||||||||
| Shares | Amount | Shares | Amount | |||||||||||||
Sold | 187,391 | $ | 3,869,392 | 5,111 | $ | 105,667 | ||||||||||
Issued to shareholders in reinvestment of distributions | 348,040 | 7,019,974 | 3,523 | 70,955 | ||||||||||||
| 535,431 | 10,889,366 | 8,634 | 176,622 | |||||||||||||
Repurchased | (978,916 | ) | (20,173,913 | ) | (29,936 | ) | (628,438 | ) | ||||||||
Shares Converted* | 61,436 | 1,331,322 | (61,614 | ) | (1,331,322 | ) | ||||||||||
Net increase/(decrease) | (382,049 | ) | $ | (7,953,225 | ) | (82,916 | ) | $ | (1,783,138 | ) | ||||||
* On May 27, 2011, all 61,614 Investor Shares converted into Institutional shares and the Investor Shares class was closed.
Century Growth Opportunities Fund – The number of authorized shares is unlimited. Transactions in each class of shares were as follows:
| For the Year Ended October 31, 2012 | ||||||||
| Institutional Shares | ||||||||
| Shares | Amount | |||||||
Sold | 9,129,642 | $ | 102,323,974 | |||||
Repurchased | (1,091,369 | ) | (11,863,258 | ) | ||||
Net Increase | 8,038,273 | $ | 90,460,716 | |||||
| Annual Report | October 31, 2012 | 37 |
| Century Funds | Notes to Financial Statements |
October 31, 2012
| For the Period Ended October 31, 2011* | ||||||||
| Institutional Shares | ||||||||
| Shares | Amount | |||||||
Sold | 712,248 | $ | 7,820,330 | |||||
Repurchased | (25,879 | ) | (282,240 | ) | ||||
Net Increase | 686,369 | $ | 7,538,090 | |||||
* For the period from the Fund’s inception, November 17, 2010 to October 31, 2011.
(3) INVESTMENT SECURITIES TRANSACTIONS
Century Small Cap Select Fund purchases and sales of investment securities (excluding short- term securities and U.S. Government obligations) aggregated $200,976,705 and $198,047,323, respectively, during the year ended October 31, 2012.
Century Shares Trust purchases and sales of investment securities (excluding short-term securities and U.S. Government obligations) aggregated $137,488,245 and $155,810,640, respectively, during the year ended October 31, 2012.
Century Growth Opportunities Fund purchases and sales of investment securities (excluding short-term securities and U.S. Government obligations) aggregated $192,748,611 and $102,807,448, respectively, during the year ended October 31, 2012.
(4) INVESTMENT ADVISER FEE
Century Small Cap Select Fund: The Trust has entered into an Investment Advisory and Management Services Agreement (the “Agreement”) with Century Capital Management, LLC (“CCM”) pursuant to which CCM provides investment advisory, management and administrative services to Century Small Cap Select Fund. Under the Agreement, the Fund pays a monthly management fee at the annual rate of 0.95% of the Fund’s average daily net assets.
Century Shares Trust: The Trust has entered into an Investment Advisory Agreement (the “Agreement”) with CCM pursuant to which CCM provides an investment program for Century Shares Trust. Under the Agreement, the Fund pays a management fee based on the Fund’s average daily net assets computed at the following annual rates: 0.80% of the first $500 million and 0.70% of the amounts exceeding $500 million.
Century Growth Opportunities Fund: The Trust has entered into an Investment Advisory Agreement (the “Agreement”) with CCM pursuant to which CCM provides investment advisory services to Century Growth Opportunities Fund. Under the Agreement, the Fund pays a management fee based on the Fund’s average daily net assets at the following annual rates: 0.80% of the first $500 million and 0.75% thereafter.
(5) ADMINISTRATION FEES
Century Small Cap Select Fund: Per the Investment Advisory and Management Services Agreement between the Trust and CCM, Century Small Cap Select Fund may reimburse CCM for expenses associated with having the adviser’s personnel perform shareholder service functions and certain financial, accounting, administrative and clerical services.
Century Shares Trust: The Trust has entered into an Administration Agreement with CCM pursuant to which CCM provides certain administrative services to Century Shares Trust at the annual rate of 0.10% of the Fund’s average daily net assets.
Century Growth Opportunities Fund: The Trust has entered into an Administration Agreement with CCM pursuant to which CCM provides certain administrative services to Century Growth Opportunities Fund at the annual rate of 0.10% of the Fund’s average daily net assets.
| 38 | www.centuryfunds.com |
| Century Funds | Notes to Financial Statements |
October 31, 2012
Effective September 1, 2012, CCM has entered into a Sub-Administration Agreement with ALPS Fund Services, Inc. (“ALPS”) pursuant to which ALPS provides certain administrative services to each Fund on behalf of CCM. CCM pays ALPS a sub-administration fee for sub-administration services provided to each Fund. Prior to September 4, 2012, CCM had a Sub-Administration Agreement with State Street Bank and Trust Company.
(6) DISTRIBUTION AND OTHER FEES
The Trust has adopted a Distribution and Service Plan (the “Plan”) pursuant to Rule 12b-1 under the 1940 Act on behalf of Century Small Cap Select Fund. The Plan authorizes the Fund to pay up to 0.25% of the average daily net assets of the Fund’s Investor Shares class for distribution and shareholder services. The Plan may be terminated at any time by the vote of a majority of the independent Trustees or by the vote of the holders of a majority of the outstanding shares of the Investor Shares.
The Trust has entered into agreements with financial intermediaries to provide recordkeeping, processing, shareholder communications and other services to customers of the intermediaries and have agreed to compensate the intermediaries for providing such services. Certain services would be provided by the Funds if the shares of each customer were registered directly with the Funds’ transfer agent. Each Fund pays a portion of the intermediary fees attributable to shares of the Fund not exceeding the estimated expense the Fund would have paid its transfer agent had each customer’s shares been registered directly with the transfer agent instead of held through the intermediary accounts.
(7) ADVISER REIMBURSEMENTS
Century Growth Opportunities Fund: CCM contractually agreed to limit the operating expenses of Century Growth Opportunities Fund to 1.10% of average daily net assets through June 30, 2013.
(8) TRUSTEE AND OFFICER FEES
As of October 31, 2012, there were eight Trustees, six of whom are not “interested persons” (within the meaning of the 1940 Act) of the Trust (the “Independent Trustees”). Each Independent Trustee receives a retainer of $3,500 per calendar quarter from the Trust for his or her services. The chairperson of the Audit Committee receives an additional retainer of $750 per calendar quarter, and the Lead Independent Trustee and the Chairpersons of the Oversight and Governance Committee and Nominating Committee each receive an additional retainer of $375 per calendar quarter. In addition, each Independent Trustee is also paid a fee of $5,000 for each meeting of the Board of Trustees attended or participated in, as the case may be. The Independent Trustees are not paid an additional fee from the Trust for attendance at and/or participation in meetings of the various committees of the Board. The Independent Trustees are also reimbursed for meeting- related expenses. Officers of the Trust and Trustees who are interested persons of the Trust receive no salary or fees from the Trust.
| Annual Report | October 31, 2012 | 39 |
| Century Funds | Report of Independent Registered Public Accounting Firm |
October 31, 2012
To the Board of Trustees and Shareholders of Century Capital Management Trust:
We have audited the accompanying statements of assets and liabilities, including the portfolios of investments, of Century Small Cap Select Fund and Century Shares Trust, each a series of Century Capital Management Trust (the “Trust”) as of October 31, 2012, and the related statements of operations for the year then ended, the statements of changes in net assets for each of the two years in the period then ended, and the financial highlights for each of the five years in the period then ended. We have also audited the accompanying statement of assets and liabilities, including the portfolio of investments, of Century Growth Opportunities Fund, a series of the Trust, as of October 31, 2012, and the related statements of operations for the year then ended, and the statements of changes in net assets and the financial highlights for the year then ended and for the period from November 17, 2010 (inception) to October 31, 2011. These financial statements and financial highlights are the responsibility of the Trust’s management. Our responsibility is to express an opinion on these financial statements and financial highlights based on our audits.
We conducted our audits in accordance with the standards of the Public Company Accounting Oversight Board (United States). Those standards require that we plan and perform the audit to obtain reasonable assurance about whether the financial statements and financial highlights are free of material misstatement. The Trust is not required to have, nor were we engaged to perform, an audit of their internal control over financial reporting. Our audits included consideration of internal control over financial reporting as a basis for designing audit procedures that are appropriate in the circumstances, but not for the purpose of expressing an opinion on the effectiveness of the Trust’s internal control over financial reporting. Accordingly, we express no such opinion. An audit also includes examining, on a test basis, evidence supporting the amounts and disclosures in the financial statements, assessing the accounting principles used and significant estimates made by management, as well as evaluating the overall financial statement presentation. Our procedures included confirmation of securities owned as of October 31, 2012 by correspondence with the custodian and brokers; where replies were not received from brokers, we performed other auditing procedures. We believe that our audits provide a reasonable basis for our opinion.
In our opinion, the financial statements and financial highlights referred to above present fairly, in all material respects, the financial position of Century Small Cap Select Fund, Century Shares Trust, and Century Growth Opportunities Fund as of October 31, 2012, the results of their operations for the year then ended, and the changes in their net assets and the financial highlights for each of the periods presented, in conformity with accounting principles generally accepted in the United States of America.
DELOITTE & TOUCHE LLP
Denver, Colorado
December 18, 2012
| 40 | www.centuryfunds.com |
| Century Funds | Disclosure of Fund Expenses |
October 31, 2012 (Unaudited)
As a shareholder of a Fund, you incur two types of costs: direct costs, such as short-term redemption fees and wire fees, and indirect costs, including management fees, and other fund operating expenses. This example is intended to help you understand your indirect costs, also referred to as “ongoing costs” (in dollars), of investing in the Fund and to compare these costs with the ongoing costs of investing in other mutual funds.
This example is based on an investment of $1,000 invested at the beginning of the period and held for the entire period as indicated below.
Actual Expenses The first line of the table below provides information about actual account values and actual expenses. You may use the information in this line, together with the amount you invested at the beginning of the period, to estimate the expenses that you paid over the period. Simply divide your account value by $1,000 (for example, an $8,600 account value divided by $1,000 = 8.6), then multiply the result by the number in the first line under the heading “Expenses Paid During Period” to estimate the expenses you paid on your account during this period.
Hypothetical Example for Comparison Purposes The second line of the table provides information about hypothetical account values and hypothetical expenses based on the Fund’s actual expense ratio and an assumed rate of return of 5% per year before expenses, which is not the Fund’s actual return. The hypothetical account values and expenses may not be used to estimate the actual ending account balance or expenses you paid for the period. You may use this information to compare ongoing costs of investing in the Fund and other funds. To do so, compare this 5% hypothetical example with the 5% hypothetical examples that appear in the shareholder reports of other funds.
Please note that the expenses shown in the table are meant to highlight your ongoing costs only and do not reflect any direct costs, such as wire fees or low balance fees. Therefore, the second line of the table is useful in comparing ongoing costs only and will not help you determine the relative total costs of owning different funds. In addition, if these direct costs were included, your costs would be higher.
| Expenses Paid | ||||||||||||||||
| Beginning | Ending | During period | ||||||||||||||
| Account Value | Account Value | Expense | May 1, 2012 to | |||||||||||||
| May 1, 2012 | October 31, 2012 | Ratio(a) | October 31, 2012 | (b) | ||||||||||||
| Century Small Cap Select Fund | ||||||||||||||||
Institutional Shares | ||||||||||||||||
Actual | $ | 1,000.00 | $ | 968.70 | 1.09 | % | $ | 5.39 | ||||||||
Hypothetical (5% return before expenses) | $ | 1,000.00 | $ | 1,019.66 | 1.09 | % | $ | 5.53 | ||||||||
Investor Shares | ||||||||||||||||
Actual | $ | 1,000.00 | $ | 966.60 | 1.47 | % | $ | 7.27 | ||||||||
Hypothetical (5% return before expenses) | $ | 1,000.00 | $ | 1,017.75 | 1.47 | % | $ | 7.46 | ||||||||
| Century Shares Trust | ||||||||||||||||
Institutional Shares | ||||||||||||||||
Actual | $ | 1,000.00 | $ | 963.50 | 1.12 | % | $ | 5.53 | ||||||||
Hypothetical (5% return before expenses) | $ | 1,000.00 | $ | 1,019.51 | 1.12 | % | $ | 5.69 | ||||||||
| Century Growth Opportunities Fund | ||||||||||||||||
Institutional Shares | ||||||||||||||||
Actual | $ | 1,000.00 | $ | 940.00 | 1.10 | % | $ | 5.36 | ||||||||
Hypothetical (5% return before expenses) | $ | 1,000.00 | $ | 1,019.61 | 1.10 | % | $ | 5.58 | ||||||||
| (a) | Annualized, based on the Fund’s most recent fiscal half year expenses. |
| (b) | Expenses are equal to the Fund’s annualized expense ratio multiplied by the average account value over the period, multiplied by the number of days in the most recent fiscal half year (184), divided by 366. |
| Annual Report | October 31, 2012 | 41 |
| Century Funds | Tax Information |
October 31, 2012 (Unaudited)
The following information represents the tax status of dividends and distributions paid by the Funds during the calendar year ended December 31, 2011. This information is presented to meet regulatory requirements and no current action on your part is required.
For Federal Income Tax purposes, the Century Shares Trust designates $1,057,727, or the maximum allowable as qualified dividend income for purposes of Internal Revenue Code Section 1(h)(11).
Pursuant to Section 852(b)(3) of the Internal Revenue Code, the Century Shares Trust designates $17,668,771 as a long-term capital gain distribution.
Please consult a tax advisor if you have questions about federal or state income tax laws, or how to prepare your tax returns.
| 42 | www.centuryfunds.com |
| Century Funds | Approval of Investment Management Agreements |
October 31, 2012 (Unaudited)
Century Capital Management, LLC (CCM) serves as the investment adviser and administrator to each of Century Shares Trust (CST) and Century Growth Opportunities Fund (CGOF) pursuant to an investment advisory agreement and an amended and restated administration agreement, each between Century Capital Management Trust, on behalf of CST and CGOF, and CCM. CCM also serves as the investment adviser and provides administrative services to Century Small Cap Select Fund (CSCS) pursuant to an investment advisory and management services agreement between Century Capital Management Trust, on behalf of CSCS, and CCM. The Trustees of Century Capital Management Trust determine annually whether to continue the investment advisory and administration agreements for each of CST, CSCS and CGOF.
At a meeting held on June 12, 2012, based on their evaluation of the information provided by CCM, the Trustees, including the independent Trustees voting separately, unanimously approved the continuation of the investment advisory agreement for each of CST, CSCS and CGOF for another year.
In advance of the meeting, the Board, including all of the independent Trustees, received, among other things: (i) a Lipper Inc. report comparing each Fund’s fees and expenses to those of a peer group and peer universe for that Fund, each selected by Lipper; (ii) information regarding the average annual total returns for each Fund, as well as comparative total return information for various securities indicies and the applicable Lipper and Morningstar peer groups; (iii) reports from CCM that described (a) the services provided to each Fund and information about the personnel providing those services, (b) the fees paid under the investment advisory and administration agreements, (c) compliance and oversight, (d) “fall-out” benefits to CCM, (e) brokerage and soft dollar arrangements, and (f) the fees paid by and services provided to comparable accounts; (iv) CCM’s profitability analysis with respect to advisory services provided to each Fund; and (v) CCM’s Form ADV. In addition, at each regularly scheduled Board meeting, the Trustees receive and review, among other things, information concerning each Fund’s performance and the services provided to each Fund by CCM. The independent Trustees also received a memorandum from their counsel outlining the legal standards and certain other considerations relevant to the Trustees’ deliberations.
After receiving the requested information, the independent Trustees met in an executive session to consider the investment advisory and administrative arrangements. The Trustees then unanimously determined to approve the continuance of the investment advisory and administration agreements with respect to each Fund for another year.
In determining to approve the continuation of the investment advisory and administration agreements, the Trustees considered a number of factors as outlined below. The Trustees did not identify any single factor as controlling. The Trustees evaluated all information available to them on a Fund-by-Fund basis, and their determinations were made separately in respect of each Fund. They also took into account the common interests of the Funds in their review. Throughout their deliberations, the independent Trustees were represented by counsel.
Nature, Quality and Extent of Services Provided
In considering the nature, extent and quality of the services provided by CCM under the investment advisory and administration agreements, the Board considered the terms of those agreements and reviewed information provided by CCM relating to its operations and personnel. The Trustees also considered their knowledge of the nature and quality of the services provided by CCM to the Funds gained from their experience as trustees of the Funds and noted the expectations of the shareholders who had invested in the Funds. The Board considered that CCM was responsible for the management and administration of each Fund’s operations. They also considered that CCM provides day-to-day management of each Fund’s portfolio of investments, including making purchases and sales of portfolio securities consistent with each Fund’s investment objectives and policies.
The Board considered CCM’s resources and personnel, focusing in particular on investment and compliance resources and personnel. The Board reviewed each portfolio manager’s experience and qualifications, as well as CCM’s investment approach and research process. The Board also reviewed CCM’s trading procedures and brokerage practices, including information regarding soft dollar arrangements.
| Annual Report | October 31, 2012 | 43 |
| Century Funds | Approval of Investment Management Agreements |
October 31, 2012 (Unaudited)
The Board also considered that, as administrator, CCM is responsible for the administration of each Fund’s business and other affairs. It was noted that CCM supervises and monitors the performance of each Fund’s service providers and provides each Fund with personnel (including officers) as are necessary for the Fund’s operations. It was noted that CCM pays all of the compensation of Mr. Thorndike and Mr. Fulkerson, the interested Trustees, and the Funds’ officers. The Board also noted that CCM assisted the Funds in meeting legal and regulatory requirements and considered, among other things, CCM’s compliance program. The Board considered the fees paid to CCM for the provisions of such services. The Board also considered CCM’s risk management program.
Taking all of the foregoing into account, the Trustees concluded that they were satisfied with the nature, extent and quality of services provided to the Funds under the investment advisory and administration agreements.
Costs of Services Provided and Profitability
The Trustees reviewed information concerning the costs of services provided to the Funds by CCM, and the profitability to CCM of its investment advisory and administrative relationship with each Fund for the periods ended December 31, 2011 and, for CST and CSCS, December 31, 2010, along with a description of the methodology used by CCM in preparing the profitability information.
The Trustees recognized that CCM should be entitled to earn a reasonable level of profit for the services provided to each Fund, and that it is difficult to make comparisons of profitability from fund advisory and administration contracts because comparative information is not generally available and is affected by numerous factors, including the structure of the particular adviser, the types of funds it manages, its business mix, numerous assumptions about allocations and the adviser’s capital structure and cost of capital. The Trustees concluded that, taking all of the foregoing into account, they were satisfied that CCM’s level of profitability from its relationship with each Fund was not excessive.
Fall-Out Benefits
The Trustees considered the extent to which CCM benefited from soft dollar arrangements whereby it receives brokerage and research services from brokers that execute a Fund’s purchases and sales of investment securities. It was noted that CCM had represented that it fulfills its fiduciary obligation of seeking best execution when engaging in portfolio transactions for the Funds. The Trustees concluded that the direct and indirect benefits to CCM from its relationship with the Funds were reasonable.
Economies of Scale
The Trustees considered the extent to which CCM may realize economies of scale or other efficiencies in managing and supporting the Funds. It was noted that as assets increase certain fixed costs may be spread across a larger asset base, and it was noted that any economies of scale or other efficiencies might be realized (if at all) across a variety of products and services, including the Funds, and not only in respect of a single Fund. The Trustees recognized that economies of scale are difficult to identify and quantify, rarely identifiable on a Fund-by-Fund basis, and that, among other factors that may be relevant, are the following: fee levels, expense subsidization, investment by CCM in research and analytical capabilities and CCM’s commitment and resource allocation to the Funds. The Trustees noted that profitability also may be an indicator of the availability of any economies of scale, although profitability may vary for other reasons particularly when the level of services are maintained notwithstanding a decline in fee revenues. The Trustees noted that the advisory fee schedule for each of CST and CGOF included breakpoints that would allow the shareholders of the Fund to share in economies of scale, if any, experienced by CCM in managing that Fund. The Trustees noted that the advisory fee schedule for CSCS did not include breakpoints that would reduce the fee rate on assets above specified levels. The Board determined that the current fee structure for CSCS was acceptable given the fee level and the fees waived by CCM in prior years in respect of CSCS. Accordingly, the Trustees concluded that economies of scale, if any, were being appropriately shared with each of the Funds.
| 44 | www.centuryfunds.com |
| Century Funds | Approval of Investment Management Agreements |
October 31, 2012 (Unaudited)
Investment Results
CST. The Trustees reviewed comparative information that showed that CST’s average annual total return for the Institutional class of shares was better than the average annual total return of the Standard & Poor’s 500 Index for the 1, 5 and 10 years ended March 31, 2012, but that such average annual total return lagged the average annual total return for the 3 years ended March 31, 2012. They noted that CST’s average annual total return for Institutional class of shares was better than the average annual total return of the Russell 1000 Growth Index for the 10 year period ended March 31, 2012 but lagged the average annual return of the Russell 1000 Growth Index for the 1, 3 and 5 year periods ended March 31, 2012. The Trustees considered that CST’s average annual total return for the 3, 5 and 10 years ended March 31, 2012 lagged the average annual returns of CST’s Lipper peer group for the same periods. They also noted that CST’s average annual total return for the 1 year ended March 31, 2012 was better than its peer group for the same period. The Trustees also noted that CST’s average annual total return was in the first quartile of its Morningstar peer group for the one year period ended March 31, 2012. (In all quartile rankings referred to throughout this disclosure, first quartile is most favorable to the Fund’s shareholders. Thus, highest relative performance would be first quartile and lowest relative expenses would also be first quartile.) The Trustees noted the recent changes made to the composition of CST’s portfolio and the reduction in the number of stocks held by the Fund in the past year and considered CST’s improved performance when compared to its peer groups. They also considered the impact of market conditions on CST’s performance in light of CST’s strategies.
CSCS. The Trustees reviewed comparative information that showed that CSCS’s average annual total return for the Institutional class of shares was better than the average annual total returns of the Russell 2000 Index for the 1, 3,. 5 and 10 year periods ended March 31, 2012 and better than the average annual total returns of the Russell 200 Growth Index for the 1, 3 and 10 year periods ended March 31, 2012, but that it lagged the average annual total return of the Russell 2000 Growth Index for the 5 year period ended March 31, 2012. With respect to CSCS’s Investor class of shares, the Trustees considered that the average annual total return of the Investor class of shares was better than or in line with the average annual total returns of the Russell 2000 Growth Index and the Russell 2000 Index for 1, 3, 5 and 10 year periods ended March 31, 2012. They noted that CSCS’s average annual total return for Institutional class of shares was better than the average annual total return of CSCS’s Lipper peer group for the 1, 3, and 10 year periods ended March 31, 2012, but that it lagged the average annual total return of the Lipper group for the 5 year period ended March 31, 2012. The Trustees considered that the average annual return of the Investor class of shares was better than with the average annual return of CST’s Lipper peer group for the 1 and 10 year periods ended March 31, 2012, but slightly lagged the average annual return of the Lipper peer group for the 3 and 5 year periods ended March 31, 2012. The Trustees noted that CSCS’s average annual total return was in the second quartile of its Morningstar peer group for the one year ended March 31, 2012. The Trustees concluded that the investment performance of the Fund was satisfactory.
CGOF. The Trustees reviewed comparative information that showed that CGOF’s average annual total return for the Institutional class of shares was better than the average annual total returns of the Russell 2500 Growth Index for the 1 year period ended March 31, 2012. They noted, however, that CGOF’s average annual total return for the Institutional class of shares lagged the average annual total return of CGOF’s Lipper peer group for the 1 year period ended March 31, 2012. The Trustees noted that CGOF’s average annual total return was in the second quartile of its Morningstar peer group for the one year ended March 31, 2012. The Trustees considered the relatively short performance history of the Fund, CCM’s investment process and the impact of market conditions on CGOF’s performance, and concluded that the investment performance of the Fund was satisfactory.
Fees and Other Expenses
The Trustees considered the advisory fees paid by each Fund to CCM. The Trustees also considered the administrative fee rate paid by each of CST and CGOF to CCM. The Trustees considered (i) the level of each Fund’s advisory fee versus its peer group and peer universe as shown in the Lipper materials and (ii) each Fund’s total expense ratio as compared to its peer group and peer universe as shown in the Lipper materials.
| Annual Report | October 31, 2012 | 45 |
| Century Funds | Approval of Investment Management Agreements |
October 31, 2012 (Unaudited)
The Trustees also considered the fees that CCM charges institutional investors and other clients. The Trustees reviewed materials from CCM describing the differences in services provided to these other clients, which noted that typically more services were provided to the Funds than these other clients and that, because of the constant issuance and redemption of Fund shares, the Funds were more difficult to manage than other clients. With respect to CCM’s subadvisory relationship with other mutual funds, the Trustees considered that CCM provided fewer services to those funds than it provided to the Funds. The materials showed that the fee rates charged by CCM to each Fund were generally similar to (but not necessarily as low as, in all cases) the fees paid by CCM’s other clients.
The information obtained from Lipper for the meeting compared the advisory fee, transfer agency/custodian fees, distribution fees, other nonmanagement expenses and total expenses for the Institutional and Investor class of shares of each Fund to those of a group of competitor funds of roughly equivalent size, as well as a universe of competitor funds. The Trustees did not independently verify any of the information provided by Lipper.
CST. The Trustees reviewed information that showed that CST’s advisory fee was higher than the Lipper peer group and peer universe averages. The Trustees also considered that CST’s total expense ratio for the Institutional class of shares was lower than the Lipper peer group and peer universe averages. The Trustees considered that certain of the funds in the peer group had lower advisory fees than CST as a result of fee waivers that could be terminated. They also noted that a number of the funds in the peer group were part of large fund complexes and that the lower advisory fees charged to those funds may be a result of economies of scale spread across the complex. The Trustees also considered the services provided by CCM as compared to the services provided by other advisers and the ability of the other advisers to realize economies of scale across a larger fund complex. The Trustees concluded that the advisory fee, administrative fee and total expense ratio of CST were reasonable in relation to the nature and quality of the services provided by CCM.
CSCS. The Trustees reviewed information that showed that CSCS’s advisory fee was higher than the Lipper peer group average and peer universe averages. The Trustees also reviewed information that showed that the total expense ratio for CSCS’s Institutional class of shares was slightly higher than the average total expense ratio of the Lipper peer group average but lower than the average total expense ratio of the Lipper peer universe, and that the total expense ratio for CSCS’s Investor class of shares was higher than both the Lipper peer group and peer universe averages. They noted that a number of the funds in the peer group were part of large fund complexes and that the lower advisory fees charged to those funds may be a result of economies of scale spread across the complex. The Trustees also considered information provided to them regarding the costs to CCM of providing investment advisory services to CSCS, noting in particular the competitive market for analysts and portfolio managers and that the research needed to implement CSCS’s investment strategy was relatively costly. The Trustees also considered the services provided by CCM compared to the other advisers and ability of the other advisers to realize economies of scale across a larger fund complex. The Trustees concluded that the advisory fee and total expense ratios of CSCS were reasonable in relation to the nature and quality of the services provided by CCM.
CGOF. The Trustees reviewed information that showed that CGOF’s contractual advisory fee was higher than the Lipper peer group and peer universe averages. They noted that CCM had reimbursed amounts in excess of the aggregate amount of advisory fee payments received by CCM from the Fund. The Trustees also considered that CGOF’s total expense ratio for the Institutional class of shares was lower than the Lipper peer group and peer universe averages. The Trustees concluded that the advisory fee, administrative fee and total expense ratio of CGOF were reasonable in relation to the nature and quality of the services provided by CCM.
| 46 | www.centuryfunds.com |
| Century Funds | Trustees and Officers |
October 31, 2012 (Unaudited)
The following table provides certain information regarding the Trustees and officers of the Century Funds as of October 31, 2012. Each Trustee’s year of birth is set forth in parentheses after his or her name. Unless otherwise noted, (i) each Trustee and officer has engaged in the principal occupation(s) noted in the table for at least the most recent five years, although not necessarily in the same capacity; and (ii) the address of each Trustee and officer is c/o Century Capital Management, 100 Federal Street, 29th Floor, Boston, MA 02110. Each Trustee’s term of office continues until the election and qualification of a successor, or until such Trustee dies, retires, resigns or is removed in accordance with Declaration of Trust. Because the Funds do not hold an annual meeting of shareholders, each Trustee will hold office for an indeterminate period.
| No. of | ||
| Portfolios | ||
| Name, Year of Birth, | in Fund | |
| Position(s) held with Trust and | Principal Occupation During Past 5 Years | Complex |
| Length of Time Served | And Other Directorships Held | Overseen |
William Gray (1952) | Senior Advisor, The Blackstone Group LP (private equity firm); Special | 3 |
Trustee, 2006 to present | Advisor, Chi & Partners (communications firm); Senior Advisor, Orca TV, | |
LLC (campus-based social media firm); Senior Advisor, Digital Artists | ||
(social media technology platform). Formerly, North American CEO, | ||
Vice Chairman, Director, Ogilvy Group Inc. (communications firm) | ||
(retired 2010). Other Directorships: Zinio Holdings LLC (digital newsstand | ||
firm); The New York Public Library; First Tee of Connecticut. Former | ||
Directorships: Harleysville Group, Inc. (through 2011); American Red | ||
Cross of Greater New York (Trustee, 1996 to 2002; Chairman 2002 | ||
to 2008; Chairman Emeritus, since 2008). | ||
Laura A. Johnson (1954) | President, Massachusetts Audubon Society. Other Directorships: | 3 |
Trustee, 2007 to present | Corporation Member, Woods Hole Oceanographic Institute; Board of | |
Directors, Land Trust Alliance; Member, Global Warming Solutions Act | ||
Implementation Advisory Committee, Commonwealth of Massachusetts. | ||
Stephen W. Kidder (1952) | Managing Partner, Hemenway & Barnes LLP (law firm); President, | 3 |
Trustee, 2005 to present | Hemenway Trust Company. Other Directorships: Trustee, Wellesley | |
College; President of the Board, Isabella Stewart Gardner Museum; | ||
Trustee, Children’s Hospital Trust. | ||
Jerry S. Rosenbloom (1939) | Frederick H. Ecker Emeritus Professor of Insurance and Risk Management | 3 |
Trustee, 1998 to present | and Senior Academic Advisor, Certified Employee Benefit Specialist Program, | |
The Wharton School, University of Pennsylvania. Fellow, Financial Institutions | ||
Center and Fellow, Leonard Davis Institute for Health Economics, The Wharton | ||
School, University of Pennsylvania. Other Directorships: American Institute for | ||
Chartered Property Casualty Underwriters; The Insurance Institute of America. | ||
Former Directorships: Harleysville Group, Inc. (through April 2012). | ||
David D. Tripple (1944) | Private investor. Formerly, Chief Executive Officer and Trustee, Pioneer | 3 |
Trustee, 2004 to present | Funds (2000 to 2001); Executive Vice President and Director, The Pioneer | |
Group, Inc. (asset management) (1998 to 2000). Other Directorships: | ||
The Calamos Funds (overseeing 19 portfolios in fund complex). |
| Annual Report | October 31, 2012 | 47 |
| Century Funds | Trustees and Officers |
October 31, 2012 (Unaudited)
| No. of | ||
| Portfolios | ||
| in | ||
| Name, Year of Birth, | Fund | |
| Position(s) held with Trust | Principal Occupation During Past 5 Years | Complex |
| and Length of Service | And Other Directorships Held | Overseen |
Ellen M. Zane (1951) | CEO Emeritus and Vice Chairman, Board of Trustees of Tufts Medical | 3 |
Trustee, 2007 to present | Center. Formerly, President and CEO of Tufts Medical Center and Floating | |
Hospital for Children (2004 to 2011); Network President, Partners | ||
Healthcare System (1994 to 2004). Other Directorships: Haemonetics | ||
Corporation; Brooks Automation, Inc.; Parexel International Corporation; | ||
Fiduciary Trust Company; Harvard School of Public Health, Health Policy | ||
& Management Executive Council; Trustee, George Washington | ||
University; Massachusetts Hospital Association; Sisters of Mercy | ||
Health System – St. Louis. Former Directorships: Lincare Corporation | ||
(through August 2012). | ||
INTERESTED TRUSTEES and OFFICERS1 | ||
Alexander L. Thorndike (1966) | Managing Partner, Century Capital Management, LLC. No other | 3 |
Trustee, 1999 to present; | directorships held. | |
Chairman and Principal | ||
Executive Officer, | ||
2004 to present | ||
Davis R. Fulkerson (1965) | Managing Partner, Century Capital Management, LLC. No other | 3 |
Trustee, 2000 to present | directorships held. | |
Julie A. Smith (1971) | Chief Financial Officer, Century Capital Management, LLC (May | N/A |
Principal Financial Officer, | 2008 to present); prior thereto, Controller, Third Avenue | |
June 2008 to present | Management LLC (1997 to 2006). | |
Maureen E. Kane (1962) | General Counsel, Century Capital Management, LLC. | N/A |
Chief Legal Officer, 2006 to | ||
present; Secretary, 2007 to | ||
present; Chief Compliance | ||
Officer, 2009 to present | ||
1 Each person listed is considered an “interested person” of the Trust within the meaning of the 1940 Act by virtue of being an officer or employee of the Adviser.
The Statement of Additional Information (“SAI”) for each Fund includes additional information about the Trustees. The SAI is available, without charge, upon request. If you would like to request a copy of the SAI, you may do so by calling the following toll-free number: (800) 321-1928.
| 48 | www.centuryfunds.com |
Fund Information
PORTFOLIO HOLDINGS
Each fund files a complete schedule of its portfolio holdings with the SEC for the first and third quarters of the fund’s fiscal year on Form N-Q. The Forms N-Q are available on the SEC’s website at http://www.sec.gov, and they may be reviewed and copied at the SEC’s Public Reference Room in Washington, DC. Information on the operation of the SEC’s Public Reference Room may be obtained by calling 1-800-SEC-0330.
PROXY VOTING
A description of the policies and procedures that each fund uses to determine how to vote proxies relating to portfolio securities and each fund’s proxy voting record for the 12-month period ended June 30 are available, without charge, upon request, by calling 1-800-321-1928. You may also obtain a copy of the funds’ proxy voting policies and procedures and proxy voting record on the SEC’s website at http://www.sec.gov.
FOR MORE INFORMATION
For more information about the Century Funds, please call 1-800-303-1928.
Regular Mailing Address: Century Funds P.O. Box 588 Portland, ME 04112 | Overnight Mailing Address: Century Funds c/o Atlantic Shareholder Services, LLC 3 Canal Plaza, Ground Floor Portland, ME 04101 |
Investment Adviser Century Capital Management, LLC 100 Federal Street Boston, MA 02110 | Distributor ALPS Distributors, Inc. 1290 Broadway, Suite 1100 Denver, CO 80203 |


Item 2. Code of Ethics.
| (a) | As of the end of the period covered by this report, Century Capital Management Trust (the “registrant”) has adopted a code of ethics, as defined in Item 2 of Form N-CSR, that applies to its Principal Executive Officer, Principal Financial Officer, and Principal Accounting Officer. |
| (c) | During the period covered by this report, the code of ethics was amended to provide that violations be reported to the registrant’s Chief Compliance Officer rather than to the Adviser’s General Counsel. |
| (d) | During the period covered by this report, no waivers from any provision of the code of ethics were granted. |
| (f)(1) | A copy of the code of ethics is filed as an exhibit hereto. |
Item 3. Audit Committee Financial Expert.
| (a)(1) | The registrant’s board of trustees has determined that the registrant has an “audit committee financial expert” serving on its audit committee, as that term is defined in paragraph (b) of Item 3 of Form N-CSR. |
| (a)(2) | Jerry Rosenbloom is the audit committee financial expert. Mr. Rosenbloom is an “independent” member of the audit committee as that term is defined in paragraph (a)(2) of Item 3 of Form N-CSR. |
| (c)(4) | Mr. Rosenbloom is an independent trustee, as defined in paragraph (a)(2) of this item's instructions. Mr. Rosenbloom received his B.S. degree in Business Administration from Temple University and his M.A. and Ph.D. degrees in Applied Economics, with a concentration in insurance, from the University of Pennsylvania. He is currently the Frederick H. Ecker Emeritus Professor of Insurance and Risk Management at the Wharton School. He was the past Chairman of the Insurance and Risk Management Department at Wharton and the past Executive Director of the S.S. Huebner Foundation for Insurance Education. He has served on the Boards of Directors of mutual funds and insurance companies, including in the capacity of audit committee member, and he has served as a consultant to numerous companies, funds and associations. In connection with his directorships and audit committee memberships, as well as his academic and teaching activities and his consulting activities for public and private companies, Mr. Rosenbloom has evaluated financial statements containing a breadth and level of complexity of accounting issues comparable to those that may arise in the financial statements of the Funds, and he has developed an understanding of internal controls and procedures for financial reporting, as well as audit committee functions. The SEC has stated that the designation or identification of a person as an audit committee financial expert pursuant to this Item 3 of Form N-CSR does not impose on such person any duties, obligations or liability that are greater than the duties, obligations and liability imposed on such person as a member of the Audit Committee and the Board of Trustees in the absence of such designation or identification. |
Item 4. Principal Accountant Fees and Services.
| (a) | Audit Fees. The aggregate fees billed to the registrant for each of the last two fiscal years for professional services rendered by the registrant’s principal accountant (“Accountant”) for the audit of the registrant’s annual financial statements or services that are normally provided by the Accountant in connection with statutory and regulatory filings or engagements for these fiscal years were as follows: |
| FYE | Fees | ||||
| 10/31/2012 | $129,500 | ||||
| 10/31/2011 | $102,000 |
| (b) | Audit-Related Fees. For each of the last two fiscal years, there were no fees billed to the registrant for assurance and related services by the Accountant that are reasonably related to the performance of the audit of the registrant's financial statements and are not reported under Audit Fees. For each of the last two fiscal years of the registrant, there were no audit-related fees billed by the registrant's Accountant to the registrant's investment adviser and any entity controlling, controlled by, or under common control with the adviser that provides ongoing services to the registrant (together, "Adviser Related Entities") for services that were related directly to the operations and financial reporting of the registrant. |
| (c) | Tax Fees. The aggregate fees billed to the registrant for each of the last two fiscal years for professional services provided by the registrant's Accountant for tax compliance, tax advice and tax planning were as follows: |
| FYE | Fees | ||||
| 10/31/2012 | $15,000 | ||||
| 10/31/2011 | $13,905 |
For the last two fiscal years of the registrant, there were no tax fees billed by the registrant's Accountant to Adviser Related Entities for services that were related directly to the operations and financial reporting of the registrant.
| (d) | All Other Fees. All Other Fees are fees related to services other than those reported above under "Audit Fees," "Audit-Related Fees," and "Tax Fees." For each of the registrant’s last two fiscal years, no such fees were billed by the registrant's Accountant to the registrant or to Adviser Related Entities for services related directly to the operations and financial reporting of the registrant. |
| (e)(1) | The audit committee's pre-approval policies and procedures are as follows: Generally, the registrant’s audit committee must approve (a) all audit and permissible non-audit services to be provided to the registrant and (b) all permissible non-audit services to be provided by the principal accountant to the registrant’s investment adviser or any entity controlling, controlled by, or under common control with the investment adviser that provides ongoing services to the registrant, if the engagement relates directly to the operations and financial reporting of the registrant. The Chairman of the audit committee is authorized to pre-approve the provision of additional non-audit services, including tax services, provided that the Chairman reports his decision at the next succeeding audit committee meeting. |
| (e)(2) | No services described in paragraphs (b) through (d) of this Item were approved by the registrant’s audit committee pursuant to paragraph (c)(7)(i)(C) of Rule 2-01 of Regulation S-X. |
| (f) | Not applicable |
| (g) | The aggregate non-audit fees billed by the registrant's Accountant, for the Trust's last two fiscal years, for services rendered to the registrant and Adviser Related Entities are shown in the table below: |
| Non-Audit Fees | |||
| Non-Audit Fees | for Adviser | Aggregate | |
| for Registrant | Related Entities | Non-Audit Fees | |
| FYE | |||
| October 31, 2012 | None | None | None |
| October 31, 2011 | None | None | None |
| (h) | Not applicable. |
Item 5. Audit Committee of Listed Registrants.
Not applicable.
Item 6. Schedule of Investments.
The registrant’s “Schedule I – Investments in securities of unaffiliated issuers” (as set forth in 17 CFR 210.12-12) is included in Item 1 of this Form N-CSR.
Item 7. Disclosure of Proxy Voting Policies and Procedures for Closed-End Management Investment Companies.
Not applicable.
Item 8. Portfolio Managers of Closed-End Management Investment Companies.
Not applicable.
Item 9. Purchases of Equity Securities by Closed-End Management Investment Company and Affiliated Purchases.
Not applicable.
Item 10. Submission of Matters to a Vote of Security Holders.
There have been no material changes to the procedures by which shareholders may recommend nominees to the Trust's Board of Trustees since the Trust last provided disclosure as to such procedures in response to the requirements of Item 407(c)(2)(iv) of Regulation S-K (as required by Item 22(b)(15) of Schedule 14A), or this Item.
Item 11. Controls and Procedures.
| (a) | The registrant's principal executive officer and principal financial officer, after evaluating the effectiveness of the registrant's "disclosure controls and procedures" (as defined in the Investment Company Act of 1940 Rule 30-a-2(c) under the Act (17 CFR 270.30a-2(c))) as of a date (the "Evaluation Date") within 90 days of the filing date of this report, have concluded that, as of the Evaluation Date, the registrant's disclosure controls and procedures were adequately designed to ensure that the information required to be disclosed by the registrant in this Form N-CSR is recorded, processed, summarized and reported within the time periods specified in the Commission's rules and forms. |
| (b) | There were no changes in the registrant's internal control over financial reporting (as defined in Rule 30a-3(d) under the Act (17 CFR 270.30a-3(d))) that occurred during the registrant's second fiscal quarter of the period covered by this report that has materially affected, or is reasonably likely to materially affect, the registrant's internal control over financial reporting. |
Items 12. Exhibits.
(a)(1) Registrant's Code of Ethics required to be disclosed under Item 2 hereof is filed and attached hereto as Exhibit 99.CODE ETH.
(a)(2) Certification pursuant to Rule 30a-2(a) under the Investment Company Act of 1940 (17 CFR 270.30a-2(a)) is filed and attached hereto as Exhibit 99.302CERT.
(b) Certification pursuant to Rule 30a-2(b) under the Investment Company Act of 1940 (17 CFR 270.30a-2(b)) is filed and attached hereto as Exhibit 99.906CERT
SIGNATURES
Pursuant to the requirements of the Securities Exchange Act of 1934 and the Investment Company Act of 1940, the registrant has duly caused this report to be signed on its behalf by the undersigned, thereunto duly authorized.
Century Capital Management Trust
By: /s/ Alexander L. Thorndike
Alexander L. Thorndike, Chairman
Date: January 4, 2013
Pursuant to the requirements of the Securities Exchange Act of 1934 and the Investment Company Act of 1940, this report has been signed below by the following persons on behalf of the registrant and in the capacities and on the dates indicated.
By: /s/ Alexander L. Thorndike
Alexander L. Thorndike, Principal Executive Officer
Date: January 4, 2013
By: /s/ Julie Smith
Julie Smith, Principal Financial Officer
Date: January 4, 2013