UNITED STATES
SECURITIES AND EXCHANGE COMMISSION
Washington, D.C. 20549
FORM N-CSR
CERTIFIED SHAREHOLDER REPORT OF REGISTERED
MANAGEMENT INVESTMENT COMPANIES
Investment Company Act File Number: 811-09561
Century Capital Management Trust
(Exact name of registrant as specified in charter)
c/o Century Capital Management, LLC
100 Federal Street, Boston, Massachusetts 02110
(Address of principal executive offices) (Zip code)
Maureen Kane
Century Capital Management, LLC
100 Federal Street, Boston, Massachusetts 02110
(Name and address of agent for service)
Registrant's telephone number, including area code: (617) 482-3060
Date of fiscal year end: October 31
Date of reporting period: October 31, 2013
Item 1. Reports to Shareholders.
Table of Contents | |||
Page | |||
Letter to Shareholders | . | 1 | |
Fund Summaries | |||
| Century Shares Trust | 5 | ||
Century Small Cap Select Fund | 8 | ||
Century Growth Opportunities Fund | 11 | ||
Portfolio of Investments | |||
| Century Shares Trust | 14 | ||
Century Small Cap Select Fund | 16 | ||
Century Growth Opportunities Fund | 18 | ||
Statements of Assets and Liabilities | 20 | ||
| Statements of Operations | 21 | ||
Statements of Changes in Net Assets | 22 | ||
Financial Highlights | |||
| Century Shares Trust | 24 | ||
Century Small Cap Select Fund | 25 | ||
Century Growth Opportunities Fund | 27 | ||
Notes to Financial Statements | 28 | ||
| Report of Independent Registered Public Accounting Firm | 37 | ||
Disclosure of Fund Expenses | 38 | ||
| Tax Information | 39 | ||
| Approval of Investment Management Agreements | 40 | ||
Trustees and Officers | 44 | ||
This report is submitted for the general information of the shareholders of Century Small Cap Select Fund, Century Shares Trust, and Century Growth Opportunities Fund (each a “Fund” and collectively, the “Funds”). It is not authorized for distribution to prospective investors in a Fund unless it is preceded by or accompanied by the Fund’s current prospectus. The prospectus includes important information about the Fund’s objective, risks, charges and expenses, experience of its management, and other information. Please read the prospectus carefully before you invest.
The views expressed in this report are those of the Funds’ Portfolio Managers as of October 31, 2013, the end of the reporting period. Any such views are subject to change at any time and may not reflect the Portfolio Managers’ views on the date that this report is first published or anytime thereafter. These views are intended to assist shareholders in understanding their investments and do not constitute investment advice. There is no assurance that the Funds will continue to invest in the securities mentioned in this report.
| Century Funds | Letter to Shareholders |
October 31, 2013 (Unaudited) | |
Dear Fellow Shareholders,
As I write this annual letter, the Standard & Poor’s 500 Index is trading above 1,800 for the first time ever. This has been a good year to be invested in the stock market, with the S&P 500 Index up about 35%, and this remarkable milestone is worthy of some reflection and perspective. Why?
We just completed 5 tremendous years of economic recovery from the darkest days of the financial crisis, which followed Lehman Brothers collapse in the autumn of 2008. The equity markets have fully rebounded and are currently trading above all prior peaks, highlighting the resiliency of our economy and its ability to repair itself, despite continued investor uncertainty. Investors who ‘stayed the course’ through these tumultuous times were amply rewarded as the chart below shows.
We believe that these results cement the lesson that investors are best-served by remaining invested in the equity markets over time to take advantage of long-term capital appreciation. Despite the equity market downdraft in 2008-2009, the S&P 500 Index is up 96% over the last five years. Over longer time periods, equities tend to significantly outperform inflation and other types of investment assets. Why?
Industry competition leads to constant innovation and efficiency. As companies develop new products and improve services, customer demand correspondingly increases, leading to faster revenue and earnings growth than other peers. Shareholders typically respond by paying more for these faster-growing and adaptive companies. At Century, we devote our research to trying to 1) discover these innovative and/or efficiency-driven companies and 2) forecast how far into the future their competitive advantage can last.
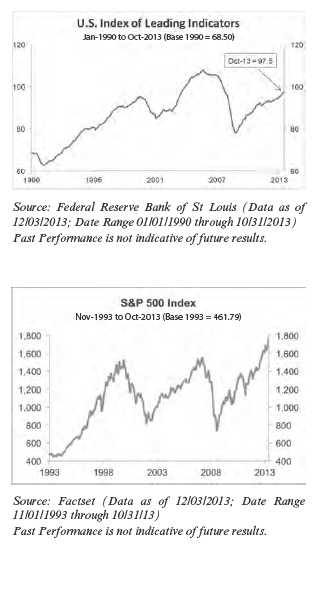
Century Shares Trust was launched in 1928 and remains the fourth oldest mutual fund in existence, and U.S. equity markets have generally thrived over its lifetime, despite surviving the Great Depression, World War II, several recessions and geopolitical crises over the last 85 years. It is important to remember that stock markets can decline precipitously, but they usually recover as resilient companies adapt to changing conditions and learn to grow again. The chart on the following page shows the S&P 500 index appreciating higher despite corrections along the way.
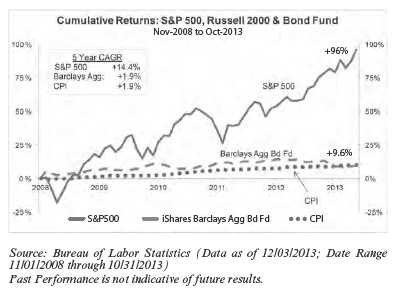
S&P 500® Index is a broad-based, unmanaged measurement of changes in stock market conditions based on the average of 500 widely held common stocks.
iShares Barclays Aggregate Bond Fund seeks investment results that correspond generally to the price and yield performance, of the total United States investment grade bond market as defined by the Barclays Capital U.S. Aggregate Bond Index.
Consumer Price Index (CPI) is a measure that examines the weighted average of prices of a basket of consumer goods and services, such as transportation, food and medical care.
One cannot invest directly in an index.
Annual Report | October 31, 2013 | 1 | |
| Century Funds | Letter to Shareholders |
October 31, 2013 (Unaudited) | |
Current Outlook: Longer and Slower Growth
Although we would like to see faster Gross Domestic Product (GDP) growth at this stage of the recovery, it is remarkable how significantly the U.S. domestic economy has rebounded since its 2009 nadir, working off the many excesses of the financial crisis. We are encouraged to see an improving housing market, rising household wealth and debt leverage return to normal levels. Meanwhile, muted inflation, stable energy prices and steady employment growth continue to support the economic recovery.
The equity markets were pleasantly surprised to see these favorable trend scontinuing in 2013. The accompanying chart of leading indicators supports our theory that the current expansion is likely to continue into 2014. While this recovery is slower than previous economic cycle upturns, we believe these tailwinds can continue for a couple more years, so long as U.S. policy makers’ dysfunction, inflationary excesses or international crises do not disrupt our forecast. We are encouraged to see improving economic outlook in Europe and Asia, adding global strength to our North American growth.
The Federal Reserve is determined to support the recovery with low interest rates for the foreseeable future. This Quantitative Easing (“QE”) will continue to incent investors to seek higher returns in “riskier” assets, rather than fixed income bonds, which may lose value when interest rates return to higher levels.
For the first time in five years, we are seeing net inflows into equity funds as investors regain confidence in their long term appreciation potential. The S&P 500 Index has doubled in the last 5 years as depicted in the accompanying chart. Furthermore, consensus earnings growth expectations have accelerated above 8% for 2014, while the valuation of the market remains quite reasonable at 15x the next twelve months’ price-to-earnings ratio. We remain optimistic regarding the outlook for investors.
QE - Action by a central bank to reduce interest rates and boost money supply as means to stimulate economic activity.
Price to earnings (P/E) ratio is the value of a company’s stock price to company earnings.
| 2 | centuryfunds.com |
| Century Funds | Letter to Shareholders |
October 31, 2013 (Unaudited) | |
We would like to thank you for your continued support of our three Century Funds. We review each fund’s performance, positioning and outlook following this letter. In general, we are hopeful that the outlook for stock valuations and growth prospects remain favorable over the next decade, especially if our political leadership firmly addresses its own dysfunction and the structural issues facing the next generation of Americans today.
We hope to earn your trust over the coming year, and we wish you all a happy holiday season.
Respectfully Submitted,

Alexander L. Thorndike
Chairman of the Century Funds
Annual Report | October 31, 2013 | 3 | |
Intentionally Left Blank
| Century Funds | Fund Commentary |
CENTURY SHARES TRUST | October 31, 2013 (Unaudited) |
HOW DID THE PORTFOLIO PERFORM?
For the one-year period ended October 31, 2013, Century Shares Trust Institutional shares returned 28.85%, outperforming the Russell 1000 Growth Index, the Fund’s benchmark, which returned 28.29%. The S&P 500 Index gained 27.18%.
WHAT FACTORS INFLUENCED PERFORMANCE?
The two primary drivers of performance over the past year were strong stock market appreciation and portfolio stock selection. The Fund continued to benefit from strong performance of domestic equity markets. In particular, the Consumer Discretionary and Health Care sectors performed best while the Information Technology and Utilities sectors were the weakest. The Federal Reserve’s quantitative easing program helped support slow and steady GDP growth and the stock market’s rise.
Century Shares Trust’s performance was positively impacted by several stocks. Specifically, BE Aerospace (aerospace supplier), Green Mountain Coffee Roasters (coffee retailer), CBS Corporation (media) and Lear Corporation (automotive supplier) all contributed to performance over the past year. Each of these companies benefited from positive industry trends that are driving growth. The commercial aerospace industry is profiting from record order backlog and rising passenger traffic. Positive coffee trends and improved execution helped Green Mountain. CBS and Lear are leading companies in their respective segments that are rebounding from cyclical lows in the last recession. Stocks that partially detracted from performance included Express Scripts (pharmacy benefit management), F5 Network (IT networking), EMC Corporation (data storage) and Tiffany & Co (jewelry retailer).
Sector allocation was neutral for Fiscal Year 2013. Positive contribution from underweighting the Consumer Staples sector and overweighting the Information Technology sector was offset by weakness from overweighting Energy and cash balances. Underweighting the Consumer Staples sector is a reflection of our bottom-up investment process. While we frequently seek new investment ideas in this sector, slow growth and high valuations prevented us from increasing our exposure.
HOW WAS THE PORTFOLIO POSTIONED AT PERIOD END?
Stock selection drives our bottom-up, fundamental investment process. Recent investments in Technology and Financials stocks reflect our strategy of looking for opportunities to buy into attractive, well-managed companies at discounted valuations. We note that the Information Technology sector was the weakest performing sector in the Russell 1000 Growth over the past year. We recently reduced our holdings in Energy, Consumer Staples and Consumer Discretionary stocks for valuation reasons or due to weakness in company fundamentals.
The Fund continues to invest in high quality growth companies that we believe will outperform over the long-term. With the Russell 1000 Growth up about 28% over the past year, investment ideas are not as plentiful but there are still attractive investment opportunities. The portfolio remains diversified across most sectors with a modest overweight in Financials and Information Technology and an underweight in Telecommunication Services and Consumer Staples. We expect modestly improving GDP growth over the next year despite fiscal challenges in Europe and the U.S., continuing tensions in the Middle East, and slower growth in China. While a stock market pullback is likely to occur from time to time, we believe that healthy corporate balance sheets will support growth longer term and, ultimately, the stock market.
Annual Report | October 31, 2013 | 5 | |
| Century Funds | Fund Commentary |
CENTURY SHARES TRUST | October 31, 2013 (Unaudited) |
Risks: The Fund may invest a significant portion of assets in a limited number of companies or in companies within the same market sector. As a result, the Fund may be more susceptible to financial, market and economic events affecting particular companies or sectors and therefore may experience greater price volatility than funds with more diversified portfolios. Please read the Fund’s prospectus for details regarding the Fund’s risk profile.
Ten Largest Holdings* | |
B/E AEROSPACE, INC. | 4.70% |
Aerospace & Defense | |
GOOGLE, INC., CLASS A | 4.58% |
Internet Software & Services | |
LYONDELLBASELL INDUSTRIES NV, CLASS A | 4.23% |
Chemicals | |
COGNIZANT TECHNOLOGY SOLUTIONS CORP., | 3.90% |
CLASS A | |
IT Services | |
ACTAVIS PLC | 3.61% |
Pharmaceuticals | |
APPLE, INC. | 3.56% |
Computers & Peripherals | |
ORACLE CORP. | 3.40% |
Software | |
EXPRESS SCRIPTS HOLDING CO. | 3.32% |
Health Care Providers & Services | |
PRICELINE.COM, INC. | 3.31% |
Internet & Catalog Retail | |
LEAR CORP. | 3.22% |
Auto Components |
Portfolio Composition* | |
Information Technology | 30.0% |
Consumer Discretionary | 19.3% |
Health Care | 13.1% |
Industrials | 12.5% |
Financials | 9.5% |
Consumer Staples | 6.6% |
Materials | 4.2% |
Energy | 3.1% |
Cash, Cash Equivalents, & Other Net Assets | 1.7% |
*Based on the Fund’s net assets at October 31, 2013 and subject to change.
| 6 | centuryfunds.com |
| Century Funds | Performance Summary |
CENTURY SHARES TRUST | October 31, 2013 (Unaudited) |
Institutional Shares
The returns shown below represent past performance. Past performance does not guarantee future results. Investment return and principal value of an investment will fluctuate so that an investor’s shares, when sold or redeemed, may be worth more or less than the original cost. Current performance may be higher or lower than the Fund’s past performance. For the most recent month-end performance, please call 800-303-1928.
As stated in the Fund’s current prospectus, the total (gross) operating expenses are 1.12% for the Institutional Shares. The Fund’s total returns include the reinvestment of dividend and capital gain distributions, but have not been adjusted to reflect the deduction of taxes that a shareholder would pay on these distributions or the redemption of Fund shares. Shares held less than 90 days may be subject to a 1% redemption fee.
Average Annual Total Returns October 31, 2013 | ||||
1 Year | 3 Years | 5 Years | 10 Years | |
Century Shares Trust - Institutional Shares | 28.85% | 15.04% | 14.05% | 6.92% |
Russell 1000® Growth Index | 28.29% | 16.81% | 17.51% | 7.70% |

The graph and table reflect the change in value of a hypothetical investment in the Fund, including reinvest of dividends and distributions, compared with the listed indices. Index returns assume reinvestment of dividends and, unlike Fund returns, do not reflect any fees or expenses. It is not possible to invest directly in an index. Minimum initial investment for Institutional Shares is $100,000.
The Russell 1000® Growth Index measures the performance of the large-cap growth segment of the U.S. equity universe. It includes those Russell 1000® companies with higher price-to-book ratios and higher forecasted growth values.
Annual Report | October 31, 2013 | 7 | |
| Century Funds | Fund Commentary |
CENTRUY SMALL CAP SELECT FUND | October 31, 2013 (Unaudited) |
HOW DID THE PORTFOLIO PERFORM?
For the one-year period ended October 31, 2013, Century Small Cap Select Fund Institutional Shares returned 29.20% and the Investor Shares returned 28.80%, versus 39.84% for the Russell 2000 Growth Index, the Fund’s benchmark.
WHAT FACTORS INFLUENCED PERFORMANCE?
Strong market appreciation was offset by stock selection and sector allocation. Equity indexes repeatedly hit new all-time highs in 2013 despite the political drama in Washington regarding the budget and debt ceiling, the concerns regarding GDP and job growth and the financial crisis in Europe. An accommodative Federal Reserve helped bolster GDP growth and the stock market’s rise. Given the Fund’s high quality focus, performance tends to lag in periods when the benchmark is up by more than 20% and this period was no exception.
Holdings that detracted from performance included Tower Group International (insurance), CAI International (air freight), Lindsay Corporation (agricultural machinery), and DFC Global (consumer lending). Most of the stock selection weakness was in the Information Technology and Industrials sectors. Weak performance by these companies was partially offset by strong stock-picking in the Health Care sector. Three of the top four performing stocks were Health Care stocks which included NPS Pharmaceuticals (biopharmaceutical), Wuxi PharmaTech (contract R&D services) and Acadia Healthcare (behavioral healthcare). The fourth stock, J2 Global, Inc. (business cloud services), is a long-term technology holding.
Sector allocation was a drag on performance. Weakness from overweighting the Information Technology and Telecommunication Services sectors more than offset positive contribution from underweighting Materials and overweighting the Energy sector.
HOW WAS THE PORTFOLIO POSTIONED AT PERIOD END?
Given the moderately growing economy and the strong stock market appreciation in Fiscal Year 2013, we are investing in companies on the expectation that future earnings growth will drive more appreciation than expanding multiples. During the first half of the fiscal year, the Fund was positioned with an overweight in the Industrials and Energy sectors and an underweight in Consumer Staples, Information Technology and Consumer Discretionary sectors.
Sector allocation within the Portfolio changed over the past six months. We raised our exposure to the Consumer Discretionary, Materials and Information Technology sectors, while reducing our weighting in the Financial Services and Telecommunication Services sectors. Sector weightings are a by-product of our bottom-up investment approach. Reductions in sector exposures were based on either valuation (i.e. reaching a price target) or deteriorating fundamentals. The Fund is diversified across most sectors.
We continue to focus on profitability and financial strength when evaluating securities. While we remain vigilant regarding the issues facing investors (the U.S. fiscal cliff, ongoing European debt issues, China’s slowing growth, and tensions in the Middle East), we are optimistic about the long-term future growth of the U.S. economy and the potential for positive returns from domestic equities to continue. We believe the portfolio is properly positioned to benefit from moderate economic growth and sustained improvements in the U.S. and global economies.
| 8 | centuryfunds.com |
| Century Funds | Fund Commentary |
CENTRUY SMALL CAP SELECT FUND | October 31, 2013 (Unaudited) |
Risks: The Fund concentrates its investments in the financial services and health care group of industries. Concentration in a particular industry subjects the Fund to the risks associated with that industry, and as a result, the Fund may be subject to greater price volatility than funds with less concentrated portfolios. In addition, the Fund invests in smaller companies which pose greater risks than those associated with larger, more established companies. Please read the Fund’s prospectus for details regarding the Fund’s risk profile.
Ten Largest Holdings* | |
CAI INTERNATIONAL, INC. | 3.42% |
Trading Companies & Distributors | |
COHEN & STEERS, INC. | 3.06% |
Capital Markets | |
RYLAND GROUP, INC. | 2.83% |
Household Durables | |
J2 GLOBAL, INC. | 2.78% |
Internet Software & Services | |
DSW, INC., CLASS A | 2.73% |
Specialty Retail | |
CARRIZO OIL & GAS, INC. | 2.61% |
Oil, Gas & Consumable Fuels | |
ACADIA HEALTHCARE CO., INC. | 2.57% |
Health Care Providers & Services | |
PROOFPOINT, INC. | 2.56% |
Software | |
MOVADO GROUP, INC. | 2.55% |
Textiles, Apparel & Luxury Goods | |
WUXI PHARMATECH (CAYMAN), INC., | 2.54% |
SPONSORED ADR | |
Life Sciences Tools & Services |
Portfolio Composition* | |
Information Technology | 22.5% |
Health Care | 21.9% |
Industrials | 18.6% |
Consumer Discretionary | 16.0% |
Financials | 6.4% |
Energy | 4.9% |
Materials | 4.3% |
Consumer Staples | 1.8% |
Cash, Cash Equivalents, & Other Net Assets | 3.6% |
*Based on the Fund’s net assets at October 31, 2013 and subject to change.
Annual Report | October 31, 2013 | 9 | |
| Century Funds | Performance Summary |
CENTRUY SMALL CAP SELECT FUND | October 31, 2013 (Unaudited) |
Institutional Shares and Investor Shares
The returns shown below represent past performance. Past performance does not guarantee future results. Investment return and principal value of an investment will fluctuate so that an investor’s shares, when sold or redeemed, may be worth more or less than the original cost. Current performance may be higher or lower than the Fund’s past performance. For the most recent month-end performance, please call 800-303-1928.
As stated in the Fund’s current prospectus, the total (gross) operating expenses are 1.10% for the Institutional Shares and 1.47% for the Investor Shares. Returns would have been lower during the 10 year period if certain fees had not been waived or expenses reimbursed. The Fund’s total returns include the reinvestment of dividend and capital gain distributions, but have not been adjusted to reflect the deduction of taxes that a shareholder would pay on these distributions or the redemption of Fund shares. Shares held less than 90 days may be subject to a 1% redemption fee.
Average Annual Total Returns October 31, 2013 | ||||
1 Year | 3 Years | 5 Years | 10 Years | |
Century Small Cap Select Fund - Institutional Shares | 29.20% | 17.35% | 18.33% | 7.67% |
Century Small Cap Select Fund - Investor Shares | 28.80% | 16.96% | 17.92% | 7.31% |
Russell 2000® Growth Index | 39.84% | 19.00% | 19.27% | 9.14% |
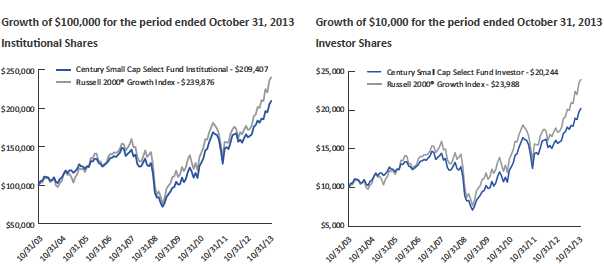
The graphs and table reflect the change in value of a hypothetical investment in the Fund, including reinvest of dividends and distributions, compared with the index. Index returns assume reinvestment of dividends and, unlike Fund returns, do not reflect any fees or expenses. It is not possible to invest directly in an index. Minimum initial investment for Institutional Shares is $100,000.
The Russell 2000® Growth Index measures the performance of the small-cap growth segment of the U.S. equity universe. It includes those Russell 2000® companies with higher price-to-value ratios and higher forecasted growth values. Index returns assume reinvestment of dividends but, unlike Fund returns, do not reflect fees or expenses. One cannot invest directly in an index.
10 | centuryfunds.com |
| Century Funds | Fund Commentary |
| CENTURY GROWTH OPPORTUNITIES FUND | October 31, 2013 (Unaudited) |
HOW DID THE PORTFOLIO PERFORM?
For the one-year period ended October 31, 2013, Century Growth Opportunities Fund Institutional Shares returned 28.54%, versus 37.60% for the Russell 2500 Growth Index, the Fund’s benchmark.
WHAT FACTORS INFLUENCED PERFORMANCE?
A rising stock market and stock selection were the primary drivers of Fund performance for the one-year period ended October 31, 2013. The Russell 2500 Growth Index increased 37.60% during this period and is up an impressive 158% cumulatively over the past five years. It is notable that performance within the index was not driven by the traditional growth sectors one would expect to lead the market higher. Consumer Staples (+59.1%), Energy (+47.4%), Industrials (+42.7%), Consumer Discretionary (+40.9%) and Health Care (+38.0%) were the top performing sectors within the index during the period, while Materials (+18.9%), Utilities (+20.0%), Financials (+31.8%) Telecommunication Services (+33.3%) and Information Technology (+34.7%) were weaker performers. We believe a recent shift in sector leadership within the index towards more traditional growth sectors has helped more recent performance results for the Fund and is an encouraging development moving forward .
While the Fund benefitted from the rising stock market, stocks such as Vera Bradley, Inc. (retailer - women accessories), BroadSoft, Inc. (telecom software), Francesca’s Holdings Corp. (specialty retailer) and Axiall Corp. (commodity chemicals) hindered performance. Partly offsetting these results was positive contribution from Hanesbrands, Inc. (basic apparel), Tripadvisor Inc. (online travel), Salix Pharmaceuticals, Ltd. (prescription drugs and medical devices) and NXP Semiconductors NV (semiconductors).
Sector allocation was neutral for Fiscal Year 2013. Underweighting Materials and overweighting Consumer Discretionary benefitted Fund performance, while overweighting Information Technology and underweighting Consumer Staples impeded performance.
HOW WAS THE PORTFOLIO POSITIONED AT PERIOD-END?
The Fund’s sector allocation has shifted over the past six months. We increased our exposure to the Information Technology, Industrials and Energy sectors, while reducing the Financials, Health Care and Consumer Discretionary sectors. The Fund is diversified across market sectors.
We are optimistic regarding the long-term outlook for both equities and the U.S. economy. While real GDP growth remains stuck in the low 2% range and inflation remains well-controlled, we expect growth to accelerate toward 3% over the next year as the fiscal drag should be less than in 2013. Given the improvement in price-to-earnings ratios over the past year, we believe investors will focus increasingly on earnings growth to drive appreciation. As this shift continues to take hold, we expect traditional growth segments to outperform. The Fund is positioned to take advantage of this improvement by investing in companies with attractive secular growth opportunities.
Annual Report | October 31, 2013 | 11 | |
| Century Funds | Fund Commentary |
CENTURY GROWTH OPPORTUNITIES FUND | October 31, 2013 (Unaudited) |
Risks: The Fund invests mainly in small-cap and mid-cap companies, which, historically, have been more volatile in price than the stocks of largecap companies. The Fund may invest in foreign companies, which involves risks not associated with investing solely in U.S. companies, such as currency fluctuations, unfavorable political developments, or economic instability. These risks are magnified in emerging markets. Please read the Fund’s prospectus for details regarding the Fund’s risk profile.
Ten Largest Holdings* | |
ALLIANCE DATA SYSTEMS CORP. | 2.30% |
IT Services | |
GRAND CANYON EDUCATION, INC. | 2.24% |
Diversified Consumer Services | |
CHICAGO BRIDGE & IRON CO., NV | 2.23% |
Construction & Engineering | |
B/E AEROSPACE, INC. | 2.23% |
Aerospace & Defense | |
NXP SEMICONDUCTOR NV | 2.19% |
Semiconductors & Semiconductor Equipment | |
WADDELL & REED FINANCIAL, INC., CLASS A | 2.19% |
Capital Markets | |
CYBERONICS, INC. | 2.18% |
Health Care Equipment & Supplies | |
UNITED RENTALS, INC. | 2.18% |
Trading Companies & Distributors | |
FERRO CORP. | 2.14% |
Chemicals | |
ITT CORP. | 2.12% |
Machinery |
Portfolio Composition* | |
Information Technology | 25.5% |
Industrials | 21.6% |
Consumer Discretionary | 19.9% |
Health Care | 16.5% |
Energy | 5.4% |
Materials | 4.1% |
Financials | 2.2% |
Consumer Staples | 2.0% |
Telecommunication Services | 1.2% |
Cash, Cash Equivalents, & Other Net Assets | 1.6% |
*Based on the Fund’s net assets at October 31, 2013 and subject to change.
12 | centuryfunds.com |
| Century Funds | Performance Summary |
CENTURY GROWTH OPPORTUNITIES FUND | October 31, 2013 (Unaudited) |
InstitutionalShares
The returns shown below represent past performance. Past performance does not guarantee future results. Investment return and principal value of an investment will fluctuate so that an investor’s shares, when sold or redeemed, may be worth more or less than the original cost. Current performance may be higher or lower than the Fund’s past performance. For the most recent month-end performance, please call 800-303-1928.
As stated in the Fund’s current prospectus, the total (gross) operating expenses are 1.20%. The Adviser has agreed contractually to limit the operating expenses for the Fund’s Institutional Shares to 1.10% through February 28, 2014. Returns would have been lower during all periods if certain fees had not been waived or expenses reimbursed. The Fund’s total returns include the reinvestment of dividend and capital gain distributions, but have not been adjusted to reflect the deduction of taxes that a shareholder would pay on these distributions or the redemption of Fund shares. Shares held less than 90 days may be subject to a 1% redemption fee.
Average Annual Total Returns October 31, 2013 | ||
1 Year | SinceInception* | |
Century Growth Opportunities Fund - Institutional Shares | 28.54% | 11.78% |
Russell 2500® Growth Index | 37.60% | 19.12% |
| * Fund inception date of November 17, 2010. |
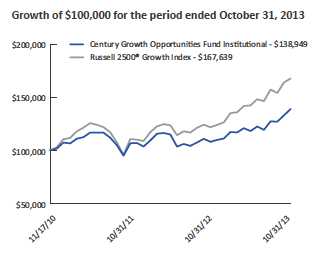
The graph and table reflect the change in value of a hypothetical investment in the Fund, including reinvest of dividends and distributions, compared with the listed indices. Index returns assume reinvestment of dividends and, unlike Fund returns, do not reflect any fees or expenses. It is not possible to invest directly in an index. Minimum initial investment for Institutional Shares is $100,000.
The Russell 2500® Growth Index measures the performance of the small- to mid-cap growth segment of the U.S. equity universe. It includes those Russell 2500 companies with higher price-to-book ratios and higher forecasted growth values. Index returns assume reinvestment of dividends but, unlike Fund returns, do not reflect fees or expenses. One cannot invest directly in an index.
Annual Report | October 31, 2013 | 13 | |
| Century Funds | Portfolio of Investments |
CENTURY SHARES TRUST | October 31, 2013 |
| Shares | Value | |||
| COMMON STOCKS - 98.3% | ||||
| Consumer Discretionary - 19.3% | ||||
| Auto Components - 3.2% | ||||
| 83,734 | Lear Corp. | $ 6,480,174 | ||
| Hotels, Restaurants & Leisure - 1.1% | ||||
| 46,333 | Marriott International, Inc., Class A | 2,088,692 | ||
| Household Durables - 2.0% | ||||
| 216,126 | D.R. Horton, Inc. | 4,095,588 | ||
| Internet & Catalog Retail - 3.3% | ||||
| 6,327 | Priceline.com, Inc.(a) | 6,667,582 | ||
| Media - 4.2% | ||||
| 73,585 | CBS Corp., Class B | 4,351,817 | ||
| 65,334 | DIRECTV(a) | 4,082,722 | ||
8,434,539 | ||||
| Multiline Retail - 2.6% | ||||
| 91,224 | Dollar General Corp.(a) | 5,270,923 | ||
| Textiles Apparel & Luxury Goods - 2.9% | ||||
| 119,204 | Gildan Activewear, Inc. | 5,757,553 | ||
| Total Consumer Discretionary | 38,795,051 | |||
| Consumer Staples - 6.6% | ||||
| Beverages - 3.1% | ||||
| 73,639 | PepsiCo, Inc. | 6,192,303 | ||
| Food & Staples Retailing - 2.0% | ||||
| 66,400 | CVS Caremark Corp. | 4,134,064 | ||
| Tobacco - 1.5% | ||||
| 33,548 | Philip Morris International, Inc. | 2,989,798 | ||
| Total Consumer Staples | 13,316,165 | |||
| Energy - 3.1% | ||||
Energy Equipment & Services - 3.1% | ||||
| 116,124 | Halliburton Co. | 6,158,056 | ||
| Financials - 9.5% | ||||
Capital Markets - 2.0% | ||||
| 124,117 | SEI Investments Co. | 4,119,443 | ||
Diversified Financial Services - 3.5% | ||||
| 121,974 | JPMorgan Chase & Co. | 6,286,540 | ||
| 4 | Berkshire Hathaway, Inc., Class A(a) | 691,979 | ||
6,978,519 | ||||
| Shares | Value | |||
| Financials - 9.5% (continued) | ||||
Real Estate Investment Trust (REITs) - 4.0% | ||||
| 76,124 | American Tower Corp. | $ 6,040,440 | ||
| 66,591 | Weyerhaeuser Co. | 2,024,366 | ||
8,064,806 | ||||
| Total Financials | 19,162,768 | |||
| Health Care - 13.1% | ||||
Biotechnology - 3.5% | ||||
| 38,369 | Alexion Pharmaceuticals, Inc.(a) | 4,717,468 | ||
| 14,924 | Celgene Corp.(a) | 2,216,065 | ||
6,933,533 | ||||
Health Care Equipment & Supplies - 2.7% | ||||
| 105,165 | ResMed, Inc. | 5,441,237 | ||
Health Care Providers & Services - 3.3% | ||||
| 106,972 | Express Scripts Holding Co.(a) | 6,687,890 | ||
Pharmaceuticals - 3.6% | ||||
| 46,973 | Actavis PLC(a) | 7,261,086 | ||
| Total Health Care | 26,323,746 | |||
| Industrials - 12.5% | ||||
Aerospace & Defense - 4.7% | ||||
| 116,439 | B/E Aerospace, Inc.(a) | 9,450,189 | ||
Commercial Services & Supplies - 2.9% | ||||
| 50,415 | Stericycle, Inc.(a) | 5,858,223 | ||
Construction & Engineering - 2.9% | ||||
| 79,426 | Fluor Corp. | 5,894,998 | ||
Industrial Conglomerates - 1.2% | ||||
| 19,156 | 3M Co. | 2,410,783 | ||
Trading Companies & Distributors - 0.8% | ||||
| 32,107 | Fastenal Co. | 1,598,928 | ||
| Total Industrials | 25,213,121 | |||
| Information Technology - 30.0% | ||||
Communications Equipment - 4.7% | ||||
| 180,277 | Cisco Systems, Inc. | 4,056,233 | ||
| 78,575 | QUALCOMM, Inc. | 5,458,605 | ||
9,514,838 | ||||
Computers & Peripherals - 6.2% | ||||
| 13,700 | Apple, Inc. | 7,156,195 | ||
| 222,164 | EMC Corp. | �� 5,347,488 | ||
12,503,683 | ||||
| See Notes to Financial Statements | |
14 | centuryfunds.com |
| Century Funds | Portfolio of Investments |
CENTURY SHARES TRUST | October 31, 2013 |
Shares | Value | ||||
| Information Technology - 30.0% (continued) | |||||
Internet Software & Services - 7.3% | |||||
| 105,724 | eBay, Inc.(a) | $ 5,572,712 | |||
| 8,952 | Google, Inc., Class A(a) | 9,225,752 | |||
14,798,464 | |||||
IT Services - 6.6% | |||||
| 90,206 | Cognizant Technology Solutions Corp., Class A(a) | 7,841,608 | |||
| 314,461 | Western Union Co. | 5,352,126 | |||
13,193,734 | |||||
Software - 5.2% | |||||
| 65,992 | Adobe Systems, Inc.(a) | 3,576,766 | |||
| 204,000 | Oracle Corp. | 6,834,000 | |||
10,410,766 | |||||
| Total Information Technology | 60,421,485 | ||||
| Materials - 4.2% | |||||
Chemicals - 4.2% | |||||
| 113,993 | LyondellBasell Industries NV, Class A | 8,503,878 | |||
| TOTAL COMMON STOCKS | |||||
| (Cost $132,643,641) | 197,894,270 | ||||
| SHORT-TERM INVESTMENTS - 1.8% | |||||
Money Market Mutual Funds - 1.8% | |||||
| 3,640,512 | State Street Institutional | ||||
U.S. Government Money | |||||
Market Fund | |||||
(0.00%(b) 7 Day Yield) | 3,640,512 | ||||
| TOTAL SHORT-TERM INVESTMENTS | |||||
| (Cost $3,640,512) | 3,640,512 | ||||
| TOTAL INVESTMENTS - 100.1% | |||||
| (Cost, $136,284,153) | 201,534,782 | ||||
| Liabilities in Excess of Other Assets - (0.1%) | (263,851) | ||||
| NET ASSETS - 100.0% | $201,270,931 | ||||
(a) | Non-income producing security. | ||
(b) | Less than 0.005%. | ||
| Abbreviations: | |
| NV - Naamloze Vennootschap | |
| (Dutch: Limited Liability Company) | |
| PLC - Public Limited Company | |
| See Notes to Financial Statements | |
Annual Report | October 31, 2013 | 15 |
| Century Funds | Portfolio of Investments |
CENTRUY SMALL CAP SELECT FUND | October 31, 2013 |
Shares | Value | |||
| COMMON STOCKS - 96.4% | ||||
| Consumer Discretionary - 16.0% | ||||
Auto Components - 1.1% | ||||
| 208,760 | Gentherm, Inc.(a) | $ 4,874,546 | ||
Hotels, Restaurants & Leisure - 2.6% | ||||
| 94,870 | Bally Technologies, Inc.(a) | 6,938,792 | ||
| 28,243 | Buffalo Wild Wings, Inc.(a) | 4,026,887 | ||
10,965,679 | ||||
Household Durables - 2.8% | ||||
| 301,933 | Ryland Group, Inc. | 12,137,706 | ||
Specialty Retail - 5.0% | ||||
| 129,356 | Big 5 Sporting Goods Corp. | 2,446,122 | ||
| 133,703 | DSW, Inc., Class A | 11,721,742 | ||
| 346,426 | Stage Stores, Inc. | 7,153,697 | ||
21,321,561 | ||||
Textiles, Apparel & Luxury Goods - 4.5% | ||||
| 120,993 | Hanesbrands, Inc. | 8,242,043 | ||
| 234,725 | Movado Group, Inc. | 10,945,227 | ||
19,187,270 | ||||
| Total Consumer Discretionary | 68,486,762 | |||
| Consumer Staples - 1.8% | ||||
Personal Products - 1.8% | ||||
| 242,212 | Prestige Brands Holdings, Inc.(a) | 7,564,281 | ||
| Energy - 4.9% | ||||
Energy Equipment & Services - 2.3% | ||||
| 253,852 | Basic Energy Services, Inc.(a) | 3,724,009 | ||
| 758,883 | Pioneer Energy Services Corp.(a) | 6,374,617 | ||
10,098,626 | ||||
Oil, Gas & Consumable Fuels - 2.6% | ||||
| 255,107 | Carrizo Oil & Gas, Inc.(a) | 11,183,891 | ||
| Total Energy | 21,282,517 | |||
| Financials - 6.4% | ||||
Capital Markets - 5.6% | ||||
| 342,037 | Cohen & Steers, Inc. | 13,120,540 | ||
| 264,816 | Stifel Financial Corp.(a) | 10,844,215 | ||
23,964,755 | ||||
Commercial Banks - 0 .8% | ||||
| 35,016 | Signature Bank(a) | 3,565,329 | ||
| Total Financials | 27,530,084 | |||
Shares | Value | |||
| Health Care - 21.9% | ||||
Biotechnology - 4.3% | ||||
| 199,976 | Gentium SpA, Sponsored ADR(a) | $ 8,442,987 | ||
| 289,844 | NPS Pharmaceuticals, Inc.(a) | 8,341,710 | ||
| 160,245 | Repligen Corp.(a) | 1,753,080 | ||
18,537,777 | ||||
Health Care Equipment & Supplies - 2.4% | ||||
| 117,306 | Cyberonics, Inc.(a) | 6,775,595 | ||
| 152,330 | Tornier NV(a) | 3,276,618 | ||
10,052,213 | ||||
Health Care Providers & Services - 7.4% | ||||
| 254,317 | Acadia Healthcare Co., Inc.(a) | 11,027,185 | ||
| 164,609 | Air Methods Corp. | 7,196,705 | ||
| 287,349 | Brookdale Senior Living, Inc.(a) | 7,781,411 | ||
| 183,967 | Molina Healthcare, Inc.(a) | 5,820,716 | ||
31,826,017 | ||||
Health Care Technology - 0.9% | ||||
| 164,589 | MedAssets, Inc.(a) | 3,790,485 | ||
Life Sciences Tools & Services - 4.0% | ||||
| 315,112 | Bruker Corp.(a) | 6,444,040 | ||
| 372,354 | WuXi PharmaTech (Cayman), Inc., Sponsored ADR(a) | 10,891,355 | ||
17,335,395 | ||||
Pharmaceuticals - 2.9% | ||||
| 87,383 | Jazz Pharmaceuticals PLC(a) | 7,929,134 | ||
| 87,967 | Pacira Pharmaceuticals, Inc.(a) | 4,443,213 | ||
12,372,347 | ||||
| Total Health Care | 93,914,234 | |||
| Industrials - 18.6% | ||||
Air Freight & Logistics - 1.3% | ||||
| 151,515 | Hub Group, Inc., Class A(a) | 5,565,146 | ||
Building Products - 0.7% | ||||
| 56,193 | Universal Forest Products, Inc. | 2,973,734 | ||
Commercial Services & Supplies - 2.2% | ||||
| 308,692 | Herman Miller, Inc. | 9,365,715 | ||
Machinery - 3.3% | ||||
| 101,241 | Graco, Inc. | 7,821,879 | ||
| See Notes to Financial Statements | |
16 | centuryfunds.com |
| Century Funds | Portfolio of Investments |
CENTRUY SMALL CAP SELECT FUND | October 31, 2013 |
Shares | Value | |||
| Industrials - 18.6% (continued) | ||||
| 166,785 | Sun Hydraulics Corp. | $ 6,618,029 | ||
14,439,908 | ||||
Professional Services - 4.3%�� | ||||
| 117,592 | Corporate Executive Board Co. | 8,572,457 | ||
| 499,706 | Kforce, Inc. | 9,839,211 | ||
18,411,668 | ||||
Road & Rail - 1.9% | ||||
| 249,530 | Saia, Inc.(a) | 8,117,211 | ||
Trading Companies & Distributors - 4.9% | ||||
| 670,300 | CAI International, Inc.(a) | 14,672,867 | ||
| 67,635 | DXP Enterprises, Inc.(a) | 6,215,656 | ||
20,888,523 | ||||
| Total Industrials | 79,761,905 | |||
| Information Technology - 22.5% | ||||
Communications Equipment - 4.1% | ||||
| 60,431 | Palo Alto Networks, Inc.(a) | 2,547,771 | ||
| 382,649 | Ruckus Wireless, Inc.(a) | 5,548,411 | ||
| 249,830 | Ubiquiti Networks, Inc. | 9,638,441 | ||
17,734,623 | ||||
Electronic Equipment Instruments & Components - 1.4% | ||||
| 351,365 | InvenSense, Inc.(a) | 5,934,555 | ||
Internet Software & Services - 9.2% | ||||
| 215,430 | Constant Contact, Inc.(a) | 5,581,791 | ||
| 218,036 | Dealertrack Technologies, Inc.(a) | 8,132,743 | ||
| 113,320 | E2 open, Inc.(a) | 2,549,700 | ||
| 217,037 | j2 Global, Inc. | 11,932,694 | ||
| 352,382 | Millennial Media, Inc.(a) | 2,477,245 | ||
| 320,066 | Web.com Group, Inc.(a) | 8,625,779 | ||
39,299,952 | ||||
Semiconductors & Semiconductor Equipment - 1.2% | ||||
| 222,998 | Diodes, Inc.(a) | 5,401,012 | ||
Software - 6.6% | ||||
| 614,277 | Callidus Software, Inc.(a) | 6,357,767 | ||
| 104,147 | Imperva, Inc.(a) | 3,992,996 | ||
| 347,659 | Proofpoint, Inc.(a) | 10,999,931 | ||
| 70,827 | Tyler Technologies, Inc.(a) | 6,849,679 | ||
28,200,373 | ||||
| Total Information Technology | 96,570,515 | |||
Shares | Value | |||
Materials - 4.3% | ||||
Chemicals - 4.3% | ||||
| 363,479 | American Vanguard Corp. | $ 9,486,802 | ||
| 197,570 | Koppers Holdings, Inc. | 8,793,840 | ||
18,280,642 | ||||
Total Materials | 18,280,642 | |||
TOTAL COMMON STOCKS | ||||
(Cost $310,514,230) | 413,390,940 | |||
SHORT-TERM INVESTMENTS - 4.1% | ||||
| Money Market Mutual Funds - 4.1% | ||||
| 17,720,002 | StateStreet Institutional | |||
U.S. Government | ||||
Money Market Fund | ||||
(0.00%(b) 7 Day Yield) | 17,720,002 | |||
TOTAL SHORT-TERM INVESTMENTS | ||||
(Cost $17,720,002) | 17,720,002 | |||
TOTAL INVESTMENTS - 100.5% | ||||
(Cost, $328,234,232) | 431,110,942 | |||
| Liabilities in Excess of Other Assets - (0.5%) | (2,249,038) | |||
NET ASSETS - 100.0% | $ 428,861,904 | |||
| (a) | Non-income producing security. | ||
| (b) | Less than 0.005%. | ||
| Abbreviations: | |||
| ADR - American Depositary Receipt | |||
| NV - Naamloze Vennootschap | |||
| (Dutch: Limited Liability Company) | |||
| PLC - Public Limited Company | |||
| See Notes to Financial Statements | |
Annual Report | October 31, 2013 | 17 |
| Century Funds | Portfolio of Investments |
CENTURY GROWTH OPPORTUNITIES FUND | October 31, 2013 |
Shares | Value | |||
| COMMON STOCKS - 98.4% | ||||
| Consumer Discretionary - 19.9% | ||||
Auto Components - 1.1% | ||||
| 53,175 | American Axle & | |||
Manufacturing | ||||
Holdings, Inc. (a) | $ 989,587 | |||
Diversified Consumer Services - 2.2% | ||||
| 44,208 | Grand Canyon Education, Inc.(a) | 2,089,712 | ||
Hotels, Restaurants & Leisure - 3.1% | ||||
| 19,020 | Bally Technologies, Inc.(a) | 1,391,123 | ||
| 10,644 | Buffalo Wild Wings, Inc.(a) | 1,517,621 | ||
2,908,744 | ||||
Household Durables - 3.5% | ||||
| 69,732 | D.R. Horton, Inc. | 1,321,421 | ||
| 35,111 | Jarden Corp.(a) | 1,943,745 | ||
3,265,166 | ||||
Internet & Catalog Retail - 2.1% | ||||
| 23,148 | TripAdvisor, Inc.(a) | 1,914,571 | ||
Media -1.8% | ||||
| 53,193 | Sinclair Broadcast Group, | |||
Inc., Class A | 1,705,368 | |||
Specialty Retail - 4.1% | ||||
| 22,027 | DSW, Inc., Class A | 1,931,107 | ||
| 14,696 | Ulta Salon Cosmetics & Fragrance, Inc.(a) | 1,893,580 | ||
3,824,687 | ||||
Textiles, Apparel & Luxury Goods - 2.0% | ||||
| 28,050 | Hanesbrands, Inc. | 1,910,766 | ||
| Total Consumer Discretionary | 18,608,601 | |||
| Consumer Staples - 2.0% | ||||
Food & Staples Retailing - 2.0% | ||||
| 26,598 | United Natural Foods, Inc.(a) | 1,900,427 | ||
| Energy - 5.4% | ||||
Energy Equipment & Services - 2.5% | ||||
| 7,909 | Dril-Quip, Inc.(a) | 928,675 | ||
| 50,960 | Superior Energy Services, Inc.(a) | 1,367,257 | ||
2,295,932 | ||||
Oil, Gas & Consumable Fuels - 2.9% | ||||
| 15,330 | Gulfport Energy Corp.(a) | 899,718 | ||
| 27,303 | Whiting Petroleum Corp.(a) | 1,826,297 | ||
2,726,015 | ||||
| Total Energy | 5,021,947 | |||
Shares | Value | |||
| Financials - 2.2% | ||||
Capital Markets -2.2% | ||||
| 33,064 | Waddell & Reed Financial, Inc., Class A | $ 2,041,702 | ||
| Health Care - 16.5% | ||||
Biotechnology - 1.5% | ||||
| 40,540 | Alkermes PLC(a) | 1,426,602 | ||
Health Care Equipment & Supplies - 7.2% | ||||
| 10,527 | Cooper Cos., Inc. | 1,360,194 | ||
| 35,333 | Cyberonics, Inc.(a) | 2,040,834 | ||
| 98,636 | Globus Medical, Inc., Class A(a) | 1,893,811 | ||
| 30,619 | West Pharmaceutical Services, Inc. | 1,480,429 | ||
6,775,268 | ||||
Health Care Providers & Services - 2.0% | ||||
| 22,746 | Universal Health Services, Inc., Class B | 1,832,418 | ||
Life Sciences Tools & Services - 1.7% | ||||
| 42,703 | PerkinElmer, Inc. | 1,624,422 | ||
Pharmaceuticals - 4.1% | ||||
| 21,266 | Jazz Pharmaceuticals PLC(a) | 1,929,677 | ||
| 25,876 | Salix Pharmaceuticals Ltd.(a) | 1,856,603 | ||
3,786,280 | ||||
| Total Health Care | 15,444,990 | |||
| Industrials - 21.6% | ||||
Aerospace & Defense - 2.2% | ||||
| 25,705 | B/E Aerospace, Inc.(a) | 2,086,218 | ||
Building Products - 1.9% | ||||
| 32,205 | Armstrong World Industries, Inc.(a) | 1,720,713 | ||
Construction & Engineering - 2.3% | ||||
| 28,159 | Chicago Bridge & Iron Co., NV | 2,086,300 | ||
Electrical Equipment - 2.1% | ||||
| 11,563 | Acuity Brands, Inc. | 1,162,197 | ||
| 6,513 | Roper Industries, Inc. | 825,914 | ||
1,988,111 | ||||
Machinery - 8.0% | ||||
| 22,971 | Actuant Corp., Class A | 862,791 | ||
| 15,536 | Crane Co. | 986,536 | ||
| 49,904 | ITT Corp. | 1,982,686 | ||
| 38,481 | Kennametal, Inc. | 1,770,126 | ||
| 17,753 | Snap-on, Inc. | 1,847,554 | ||
7,449,693 | ||||
| See Notes to Financial Statements | |
18 | centuryfunds.com |
| Century Funds | Portfolio of Investments |
CENTURY GROWTH OPPORTUNITIES FUND | October 31, 2013 |
Shares | Value | |||
| Industrials - 21.6% (continued) | ||||
Professional Services - 1.4% | ||||
| 18,305 | Corporate Executive Board Co. | $ 1,334,434 | ||
Road & Rail - 1.5% | ||||
| 11,784 | Kansas City Southern | 1,431,992 | ||
Trading Companies & Distributors - 2.2% | ||||
| 31,517 | United Rentals, Inc.(a) | 2,035,683 | ||
| Total Industrials | 20,133,144 | |||
| Information Technology - 25.5% | ||||
Communications Equipment - 3.2% | ||||
| 78,969 | Finisar Corp.(a) | 1,817,077 | ||
| 29,473 | Ubiquiti Networks, Inc. | 1,137,068 | ||
2,954,145 | ||||
Electronic Equipment Instruments & Components - 2.6% | ||||
| 48,579 | InvenSense, Inc.(a) | 820,499 | ||
| 24,148 | IPG Photonics Corp. | 1,600,288 | ||
2,420,787 | ||||
Internet Software & Services - 3.8% | ||||
| 12,910 | MercadoLibre SA | 1,738,138 | ||
| 66,461 | Web.com Group, Inc.(a) | 1,791,124 | ||
3,529,262 | ||||
IT Services - 7.4% | ||||
| 9,079 | Alliance Data Systems Corp.(a) | 2,152,268 | ||
| 46,786 | Cardtronics, Inc.(a) | 1,836,350 | ||
| 47,633 | EPAM Systems, Inc.(a) | 1,784,809 | ||
| 24,474 | MAXIMUS, Inc. | 1,185,765 | ||
6,959,192 | ||||
Semiconductors & Semiconductor Equipment - 4.2% | ||||
| 177,104 | Integrated Device Technology, Inc.(a) | 1,884,386 | ||
| 48,547 | NXP Semiconductor NV(a) | 2,044,800 | ||
3,929,186 | ||||
Software - 4.3% | ||||
| 19,850 | ANSYS, Inc.(a) | 1,735,883 | ||
| 41,366 | BroadSoft, Inc.(a) | 1,353,496 | ||
| 30,099 | FleetMatics Group PLC(a) | 955,643 | ||
4,045,022 | ||||
| Total Information Technology | 23,837,594 | |||
Shares | Value | |||
| Materials - 4.1% | ||||
Chemicals - 2.1% | ||||
| 155,979 | Ferro Corp.(a) | $ 2,001,211 | ||
Metals & Mining - 2.0% | ||||
| 77,738 | Steel Dynamics, Inc. | 1,396,952 | ||
| 13,364 | U.S. Silica Holdings, Inc. | 465,334 | ||
1,862,286 | ||||
| Total Materials | 3,863,497 | |||
| Telecommunication Services - 1.2% | ||||
Diversified Telecommunication Services -1.2% | ||||
| 34,922 | tw telecom, Inc., Class A(a) | 1,100,741 | ||
| TOTAL COMMON STOCKS | ||||
(Cost $70,548,531) | 91,952,643 | |||
| SHORT-TERM INVESTMENTS - 2.1% | ||||
Money Market Mutual Funds - 2.1% | ||||
| 1,937,742 | State Street Institutional | |||
U.S. Government Money | ||||
Market Fund | ||||
(0.00%(b) 7 Day Yield) | 1,937,742 | |||
| TOTAL SHORT-TERM INVESTMENTS | ||||
(Cost $1,937,742) | 1,937,742 | |||
| TOTAL INVESTMENTS - 100.5% | ||||
(Cost, $72,486,273) | 93,890,385 | |||
| Liabilities in Excess of Other Assets - (0.5%) | (477,461) | |||
| NET ASSETS - 100.0% | $ 93,412,924 | |||
| (a) | Non-income producing security. | ||
| (b) | Less than 0.005%. | ||
| Abbreviations: | |||
| Ltd. - Limited | |||
| NV - Naamloze Vennootschap | |||
| (Dutch: Limited Liability Company) | |||
| PLC - Public Limited Company | |||
| SA - Generally designated corporations in various countries, | |||
| mostly those employing civil law | |||
| See Notes to Financial Statements | |
Annual Report | October 31, 2013 | 19 |
| Century Funds | Statements of Assets and Liabilities |
October 31, 2013 |
| Century | Century | Century Growth | ||||||||||
| Small Cap | Shares | Opportunities | ||||||||||
| Select Fund | Trust | Fund | ||||||||||
ASSETS: | ||||||||||||
Investments, at value (Note 1) (cost - see below) | $ | 431,110,942 | $ | 201,534,782 | $ | 93,890,385 | ||||||
Cash | 493,822 | – | 46,193 | |||||||||
Receivable for investments sold | 6,658,759 | – | 1,880,209 | |||||||||
Receivable for fund shares subscribed | 695,438 | 189 | 36,345 | |||||||||
Dividends receivable | 25,311 | 37,617 | 17,564 | |||||||||
Prepaid expenses | 7,277 | 3,093 | 1,739 | |||||||||
Total Assets | 438,991,549 | 201,575,681 | 95,872,435 | |||||||||
LIABILITIES: | ||||||||||||
Payable to Affiliates: | ||||||||||||
Investment adviser fees (Note 4) | 345,152 | 135,059 | 65,174 | |||||||||
Administration fees (Note 5) | – | 16,882 | 7,923 | |||||||||
Distribution and service fees (Note 6) | 35,807 | – | – | |||||||||
Payable for investments purchased | 9,008,498 | – | 2,251,894 | |||||||||
Payable for shares redeemed | 586,216 | 34,892 | 47,068 | |||||||||
Payable to custodian | – | 9,449 | – | |||||||||
Accrued expenses and other liabilities | 153,972 | 108,468 | 87,452 | |||||||||
Total Liabilities | 10,129,645 | 304,750 | 2,459,511 | |||||||||
NET ASSETS | $ | 428,861,904 | $ | 201,270,931 | $ | 93,412,924 | ||||||
NET ASSETS CONSIST OF: | ||||||||||||
Paid-in capital | $ | 308,320,093 | $ | 124,382,621 | $ | 72,470,278 | ||||||
Accumulated net investment loss | (2,663,042 | ) | (166,506 | ) | (560,030 | ) | ||||||
Accumulated net realized gain on investments | 20,328,143 | 11,804,187 | 98,564 | |||||||||
Unrealized appreciation in value of investments | 102,876,710 | 65,250,629 | 21,404,112 | |||||||||
NET ASSETS | $ | 428,861,904 | $ | 201,270,931 | $ | 93,412,924 | ||||||
Net Assets: | ||||||||||||
Institutional Shares | $ | 300,832,601 | $ | 201,270,931 | $ | 93,412,924 | ||||||
Investor Shares | $ | 128,029,303 | N/A | N/A | ||||||||
Shares Outstanding (Note 2): | ||||||||||||
Institutional Shares | 8,864,786 | 8,982,754 | 6,735,761 | |||||||||
Investor Shares | 3,905,988 | N/A | N/A | |||||||||
Net Asset Value Per Share | ||||||||||||
(Represents both the offering and redemption price) | ||||||||||||
Institutional Shares | $ | 33.94 | $ | 22.41 | $ | 13.87 | ||||||
Investor Shares | $ | 32.78 | N/A | N/A | ||||||||
Cost of investments | $ | 328,234,232 | $ | 136,284,153 | $ | 72,486,273 | ||||||
| See Notes to Financial Statements | |
20 | centuryfunds.com |
| Century Funds | Statements of Operations |
| For the Year Ended October 31, 2013 | |
| Century | Century | Century Growth | ||||||||||
| Small Cap | Shares | Opportunities | ||||||||||
| Select Fund | Trust | Fund | ||||||||||
INVESTMENT INCOME: | ||||||||||||
Dividends | $ | 4,165,516 | $ | 2,432,702 | $ | 821,205 | ||||||
Foreign taxes withheld | – | (83,629 | ) | (478 | ) | |||||||
Total Investment Income | 4,165,516 | 2,349,073 | 820,727 | |||||||||
EXPENSES: | ||||||||||||
Investment adviser fees (Notes 4 and 7) | 4,062,970 | 1,478,954 | 795,709 | |||||||||
Distribution and service fees - (Note 6) | ||||||||||||
Investor Shares | 254,849 | – | – | |||||||||
Administrative fees | – | 184,869 | 99,463 | |||||||||
Transfer agency fees: | ||||||||||||
Institutional Shares | 156,613 | 104,014 | 30,528 | |||||||||
Investor Shares | 155,023 | – | – | |||||||||
Fund accounting fees | 49,910 | 22,054 | 14,096 | |||||||||
Custodian fees | 37,525 | 11,405 | 24,493 | |||||||||
Insurance fees | 29,799 | 12,736 | 5,736 | |||||||||
Professional fees | 70,818 | 58,646 | 54,446 | |||||||||
Registration fees | 53,221 | 23,621 | 33,416 | |||||||||
Trustee fees | 157,278 | 67,384 | 36,864 | |||||||||
Printing fees | 63,639 | 49,978 | 14,092 | |||||||||
Other expenses | 36,364 | 44,583 | 6,317 | |||||||||
Total Expenses | 5,128,009 | 2,058,244 | 1,115,160 | |||||||||
Adviser waivers/reimbursements (Note 7) | – | – | (21,059 | ) | ||||||||
Net Expenses | 5,128,009 | 2,058,244 | 1,094,101 | |||||||||
NET INVESTMENT INCOME/(LOSS) | (962,493 | ) | 290,829 | (273,374 | ) | |||||||
REALIZED AND UNREALIZED GAIN | ||||||||||||
ON INVESTMENTS: | ||||||||||||
Net realized gain on investments | 64,324,461 | 11,876,647 | 8,886,734 | |||||||||
Net change in unrealized appreciation of investments | 45,785,839 | 34,752,330 | 16,179,917 | |||||||||
NET REALIZED AND UNREALIZED GAIN | ||||||||||||
ON INVESTMENTS | 110,110,300 | 46,628,977 | 25,066,651 | |||||||||
NET INCREASE IN NET ASSETS RESULTING | ||||||||||||
FROM OPERATIONS | $ | 109,147,807 | $ | 46,919,806 | $ | 24,793,277 | ||||||
| See Notes to Financial Statements | ||||||||||||
Annual Report | October 31, 2013 | 21 | |||||||||||
| Century Funds |
| Century Small Cap Select Fund | ||||||||
| Year Ended October 31, | ||||||||
| 2013 | 2012 | |||||||
OPERATIONS: | ||||||||
Net investment income/(loss) | $ | (962,493 | ) | $ | (2,292,157 | ) | ||
Net realized gain/(loss) on investments | 64,324,461 | 33,340,695 | ||||||
Change in net unrealized appreciation/(depreciation) | 45,785,839 | 5,051,228 | ||||||
Net increase/(decrease) in net assets resulting from operations | 109,147,807 | 36,099,766 | ||||||
DISTRIBUTIONS TO SHAREHOLDERS: | ||||||||
Institutional Shares | ||||||||
From net investment income | – | – | ||||||
From net realized gains on investments | – | – | ||||||
Total distributions | – | – | ||||||
CAPITAL SHARE TRANSACTIONS: | ||||||||
Increase/(decrease) in net assets from capital share | ||||||||
transactions (Note 2) | (73,741,581 | ) | (14,062,915 | ) | ||||
Redemption fees | 11,434 | 5,950 | ||||||
Net increase/(decrease) from share transactions | (73,730,147 | ) | (14,056,965 | ) | ||||
Total increase/(decrease) | 35,417,660 | 22,042,801 | ||||||
NET ASSETS: | ||||||||
Beginning of year | 393,444,244 | 371,401,443 | ||||||
End of year* | $ | 428,861,904 | $ | 393,444,244 | ||||
*Including accumulated net investment loss | $ | (2,663,042 | ) | $ | (1,927,740 | ) | ||
| See Notes to Financial Statements | |
22 | centuryfunds.com |
Statements of Changes in Net Assets |
| Century Shares Trust | Century Growth Opportunities Fund | |||||||||||||
| Year Ended October 31, | Year Ended October 31, | |||||||||||||
| 2013 | 2012 | 2013 | 2012 | |||||||||||
| $ | 290,829 | $ | 425,051 | $ | (273,374 | ) | $ | (130,679 | ) | |||||
| 11,876,647 | 21,366,294 | 8,886,734 | (8,245,814 | ) | ||||||||||
| 34,752,330 | (8,805,126 | ) | 16,179,917 | 4,871,077 | ||||||||||
| 46,919,806 | 12,986,219 | 24,793,277 | (3,505,416 | ) | ||||||||||
| (399,960 | ) | (554,986 | ) | (173,998 | ) | – | ||||||||
| (21,366,224 | ) | (18,171,512 | ) | – | – | |||||||||
| (21,766,184 | ) | (18,726,498 | ) | (173,998 | ) | – | ||||||||
| 1,582,539 | 2,059,194 | (25,491,806 | ) | 90,460,716 | ||||||||||
| 441 | 14,367 | – | 6,703 | |||||||||||
| 1,582,980 | 2,073,561 | (25,491,806 | ) | 90,467,419 | ||||||||||
| 26,736,602 | (3,666,718 | ) | (872,527 | ) | 86,962,003 | |||||||||
| 174,534,329 | 178,201,047 | 94,285,451 | 7,323,448 | |||||||||||
| $ | 201,270,931 | $ | 174,534,329 | $ | 93,412,924 | $ | 94,285,451 | |||||||
| $ | (166,506 | ) | $ | (129,905 | ) | $ | (560,030 | ) | $ | (117,847 | ) | |||
Annual Report | October 31, 2013 | 23 | |
| Century Funds | Financial Highlights |
CENTURY SHARES TRUST INSTITUTIONAL SHARES | For a share outstanding throughout the periods presented |
| Year Ended October 31, | |||||||||||||||||||
| 2013 | 2012 | 2011 | 2010 | 2009 | |||||||||||||||
NET ASSET VALUE, BEGINNING OF PERIOD | $ | 19.81 | $ | 20.66 | $ | 19.65 | $ | 16.84 | $ | 15.51 | |||||||||
INCOME/(LOSS) FROM OPERATIONS: | |||||||||||||||||||
Net investment income/(loss)(a) | 0.03 | 0.05 | (0.02 | ) | (0.01 | ) | 0.00 | (b) | |||||||||||
Net realized and unrealized gain | |||||||||||||||||||
on investments | 5.09 | 1.28 | 1.93 | 2.82 | 1.36 | ||||||||||||||
Total income from investment operations | 5.12 | 1.33 | 1.91 | 2.81 | 1.36 | ||||||||||||||
LESS DISTRIBUTIONS FROM: | |||||||||||||||||||
Net investment income | (0.05 | ) | (0.06 | ) | (0.01 | ) | (0.00 | )(b) | (0.03 | ) | |||||||||
Net realized gain on | |||||||||||||||||||
investment transactions | (2.47 | ) | (2.12 | ) | (0.89 | ) | – | – | |||||||||||
Total distributions | (2.52 | ) | (2.18 | ) | (0.90 | ) | (0.00 | )(b) | (0.03 | ) | |||||||||
REDEMPTION FEES | 0.00 | (b) | 0.00 | (b) | 0.00 | (b) | 0.00 | (b) | 0.00 | (b) | |||||||||
NET ASSET VALUE, END OF PERIOD | $ | 22.41 | $ | 19.81 | $ | 20.66 | $ | 19.65 | $ | 16.84 | |||||||||
TOTAL RETURN | 28.85 | % | 7.63 | % | 9.79 | % | 16.72 | % | 8.59 | % | |||||||||
RATIOS AND SUPPLEMENTAL DATA | |||||||||||||||||||
Net assets, end of period (000's) | $ | 201,271 | $ | 174,534 | $ | 178,201 | $ | 177,042 | $ | 166,574 | |||||||||
Ratio of expenses to average net assets | 1.11 | % | 1.12 | % | 1.13 | % | 1.15 | % | 1.20 | % | |||||||||
Ratio of net investment income/(loss) to | |||||||||||||||||||
average net assets | 0.16 | % | 0.24 | % | (0.10 | %) | (0.05 | %) | 0.03 | % | |||||||||
| PORTFOLIO TURNOVER RATE | 39 | % | 79 | % | 72 | % | 67 | % | 79 | % | |||||||||
(a) Per share numbers have been calculated using the average shares method. | |||||||||||||||||||
(b) Less than $0.005 per share. | |||||||||||||||||||
| See Notes to Financial Statements | ||||||||||
24 | centuryfunds.com | |||||||||
| Century Funds | Financial Highlights |
CENTURY SMALL CAP SELECT FUND INSTITUTIONAL SHARES | For a share outstanding throughout the periods presented |
| Year Ended October 31, | |||||||||||||||||||
| 2013 | 2012 | 2011 | 2010 | 2009 | |||||||||||||||
NET ASSET VALUE, BEGINNING OF PERIOD | $ | 26.27 | $ | 23.91 | $ | 20.99 | $ | 16.34 | $ | 14.62 | |||||||||
INCOME/(LOSS) FROM OPERATIONS: | |||||||||||||||||||
Net investment loss(a) | (0.04 | ) | (0.12 | ) | (0.09 | ) | (0.05 | ) | (0.01 | ) | |||||||||
Net realized and unrealized gain | |||||||||||||||||||
on investments | 7.71 | 2.48 | 3.01 | 4.70 | 1.73 | ||||||||||||||
Total income from investment operations | 7.67 | 2.36 | 2.92 | 4.65 | 1.72 | ||||||||||||||
REDEMPTION FEES | 0.00 | (b) | 0.00 | (b) | 0.00 | (b) | 0.00 | (b) | 0.00 | (b) | |||||||||
NET ASSET VALUE, END OF PERIOD | $ | 33.94 | $ | 26.27 | $ | 23.91 | $ | 20.99 | $ | 16.34 | |||||||||
TOTAL RETURN | 29.20 | % | 9.87 | % | 13.86 | % | 28.52 | % | 11.69 | % | |||||||||
RATIOS AND SUPPLEMENTAL DATA | |||||||||||||||||||
Net assets, end of period (000's) | $ | 300,833 | $ | 281,480 | $ | 254,724 | $ | 249,429 | $ | 216,295 | |||||||||
Ratio of expenses to average net assets | 1.12 | % | 1.10 | % | 1.11 | % | 1.13 | % | 1.14 | % | |||||||||
Ratio of net investment loss to average | |||||||||||||||||||
net assets | (0.14 | %) | (0.48 | %) | (0.37 | %) | (0.25 | %) | (0.08 | %) | |||||||||
| PORTFOLIO TURNOVER RATE | 91 | % | 53 | % | 75 | % | 85 | % | 133 | % | |||||||||
(a) Per share numbers have been calculated using the average shares method. |
(b) Less than $0.005 per share. |
| See Notes to Financial Statements | |
Annual Report | October 31, 2013 | 25 |
| Century Funds | Financial Highlights |
CENTURY SMALL CAP SELECT FUND INVESTOR SHARES | For a share outstanding throughout the periods presented |
| Year Ended October 31, | |||||||||||||||||||
| 2013 | 2012 | 2011 | 2010 | 2009 | |||||||||||||||
NET ASSET VALUE, BEGINNING OF PERIOD | $ | 25.45 | $ | 23.25 | $ | 20.49 | $ | 16.00 | $ | 14.37 | |||||||||
INCOME/(LOSS) FROM OPERATIONS: | |||||||||||||||||||
Net investment loss(a) | (0.13 | ) | (0.21 | ) | (0.17 | ) | (0.11 | ) | (0.07 | ) | |||||||||
Net realized and unrealized gain | |||||||||||||||||||
on investments | 7.46 | 2.41 | 2.92 | 4.60 | 1.70 | ||||||||||||||
Total income from investment operations | 7.33 | 2.20 | 2.75 | 4.49 | 1.63 | ||||||||||||||
REDEMPTION FEES | 0.00 | (b) | 0.00 | (b) | 0.01 | 0.00 | (b) | 0.00 | (b) | ||||||||||
NET ASSET VALUE, END OF PERIOD | $ | 32.78 | $ | 25.45 | $ | 23.25 | $ | 20.49 | $ | 16.00 | |||||||||
TOTAL RETURN | 28.80 | % | 9.46 | % | 13.47 | % | 28.06 | % | 11.27 | % | |||||||||
RATIOS AND SUPPLEMENTAL DATA | |||||||||||||||||||
Net assets, end of period (000's) | $ | 128,029 | $ | 111,965 | $ | 116,678 | $ | 92,618 | $ | 91,809 | |||||||||
Ratio of expenses to average net assets | 1.41 | % | 1.47 | % | 1.48 | % | 1.50 | % | 1.53 | % | |||||||||
Ratio of net investment loss to average | |||||||||||||||||||
net assets | (0.44 | %) | (0.84 | %) | (0.71 | %) | (0.61 | %) | (0.47 | %) | |||||||||
PORTFOLIO TURNOVER RATE | 91 | % | 53 | % | 75 | % | 85 | % | 133 | % | |||||||||
(a) Per share numbers have been calculated using the average shares method. |
(b) Less than $0.005 per share. |
| See Notes to Financial Statements | |
26 | centuryfunds.com |
| Century Funds | Financial Highlights |
CENTURY GROWTH OPPORTUNITIES FUND INSTITUTIONAL SHARES | For a share outstanding throughout the periods presented |
| Year Ended October 31, | For the Period November 17, 2010 (Inception) to | ||||||||||
| 2013 | 2012 | October 31, 2011 | |||||||||
NET ASSET VALUE, BEGINNING OF PERIOD | $ | 10.81 | $ | 10.67 | $ | 10.00 | |||||
INCOME/(LOSS) FROM OPERATIONS: | |||||||||||
Net investment loss(a) | (0.03 | ) | (0.02 | ) | (0.07 | ) | |||||
Net realized and unrealized gain | |||||||||||
on investments | 3.11 | 0.16 | 0.74 | ||||||||
Total income from investment operations | 3.08 | 0.14 | 0.67 | ||||||||
LESS DISTRIBUTIONS FROM: | |||||||||||
Net investment income | (0.02 | ) | – | – | |||||||
Total distributions | (0.02 | ) | – | – | |||||||
REDEMPTION FEES | 0.00 | (b) | 0.00 | (b) | 0.00 | (b) | |||||
NET ASSET VALUE, END OF PERIOD | $ | 13.87 | $ | 10.81 | $ | 10.67 | |||||
TOTAL RETURN | 28.54 | % | 1.31 | % | 6.70 | %(c) | |||||
RATIOS AND SUPPLEMENTAL DATA | |||||||||||
Net assets, end of period (000's) | $ | 93,413 | $ | 94,285 | $ | 7,323 | |||||
Ratio of expenses to average net assets | |||||||||||
without giving effect to contractual | |||||||||||
expense agreement | 1.12 | % | 1.20 | % | 3.62 | %(d) | |||||
Ratio of expenses to average net assets | 1.10 | % | 1.10 | % | 1.10 | %(d) | |||||
Ratio of net investment loss to average | |||||||||||
net assets | (0.27 | %) | (0.18 | %) | (0.64 | %)(d) | |||||
PORTFOLIO TURNOVER RATE | 155 | % | 148 | % | 119 | %(c) | |||||
(a) Per share numbers have been calculated using the average shares method. |
(b) Less than $0.005 per share. |
(c) Not annualized. |
(d) Annualized. |
| See Notes to Financial Statements | |
Annual Report | October 31, 2013 | 27 |
| Century Funds | Notes to Financial Statements |
October 31, 2013 |
1. SIGNIFICANT ACCOUNTING POLICIES
Century Capital Management Trust (the “Trust”) is registered under the Investment Company Act of 1940 (“1940 Act”), as amended, as an open-end management investment company organized as a Massachusetts business trust. Century Small Cap Select Fund, Century Shares Trust and Century Growth Opportunities Fund (each a “Fund” and, collectively, the “Funds”) are diversified series of the Trust. The following are significant accounting policies consistently followed by the Funds and are in conformity with accounting principles generally accepted in the United States (GAAP).
The investment objective of Century Shares Trust is to seek long-term growth of principal and income. The investment objective of each of Century Small Cap Select Fund and Century Growth Opportunities Fund is to seek long-term capital growth.
A. Security Valuations — Equity securities are valued at the last reported sale price or official closing price on the primary exchange or market on which they are traded, as reported by an independent pricing service. If no sale price or official closing price is reported, market value is generally determined based on quotes or closing prices obtained from a quotation reporting system, established market maker, or reputable pricing service. For unlisted securities and for exchange-listed securities for which there are no reported sales or official closing prices, fair value is generally determined using closing bid prices. In the absence of readily available market quotes, securities and other assets will be valued at fair value, as determined in good faith under procedures established by and under the general supervision of the Funds’ Board of Trustees. Short-term obligations, maturing in 60 days or less, are valued at amortized cost, which approximates fair value. Investments in open-end mutual funds are valued at their closing net asset value each business day.
A three-tier hierarchy has been established to classify fair value measurements for disclosure purposes. Inputs refer broadly to the assumptions that market participants would use in pricing the asset or liability, including assumptions about risk. Inputs may be observable or unobservable. Observable inputs are inputs that reflect the assumptions market participants would use in pricing the asset or liability that are developed based on market data obtained from sources independent of the reporting entity. Unobservable inputs are inputs that reflect the reporting entity’s own assumptions about the assumptions market participants would use in pricing the asset or liability that are developed based on the best information available.
Various inputs are used in determining the value of each Fund’s investments as of the reporting period end. These inputs are categorized in the following hierarchy under applicable financial accounting standards:
| Level 1 — Unadjusted quoted prices in active markets for identical, unrestricted assets or liabilities that the Funds have the ability to access at the measurement date; |
| Level 2 — Quoted prices which are not active, quoted prices for similar assets or liabilities in active markets or inputs other than quoted prices that are observable (either directly or indirectly) for substantially the full term of the asset or liability; and |
| Level 3 — Significant unobservable prices or inputs (including the Fund’s own assumptions in determining the fair value of investments) where there is little or no market activity for the asset or liability at the measurement date. |
The availability of observable inputs can vary from security to security and is affected by a wide variety of factors, including, for example, the type of security, whether the security is new and not yet established in the marketplace, the liquidity of markets, and other characteristics particular to the security. To the extent that valuation is based on models or inputs that are less observable or unobservable in the market, the determination of fair value requires more judgment. Accordingly, the degree of judgment exercised in determining fair value is greatest for instruments categorized in Level 3.
28 | centuryfunds.com |
| Century Funds | Notes to Financial Statements |
October 31, 2013 |
| The following is a summary of the inputs used as of October 31, 2013 in valuing the Funds’ investments carried at fair value: |
Century Small Cap Select Fund | ||||||||||||
| Level 2 - | Level 3 - | |||||||||||
| Other Significant | Significant | |||||||||||
| Level 1 - | Observable | Unobservable | ||||||||||
Investments in Securities at Value* | Quoted Prices | Inputs | Inputs | Total | ||||||||
Common Stocks | $ | 413,390,940 | $ | – | $ | – | $ | 413,390,940 | ||||
Short-Term Investments | 17,720,002 | – | – | 17,720,002 | ||||||||
TOTAL | $ | 431,110,942 | $ | – | $ | – | $ | 431,110,942 | ||||
Century Shares Trust | ||||||||||||
| Level 2 - | Level 3 - | |||||||||||
| Other Significant | Significant | |||||||||||
| Level 1 - | Observable | Unobservable | ||||||||||
Investments in Securities at Value* | Quoted Prices | Inputs | Inputs | Total | ||||||||
Common Stocks | $ | 197,894,270 | $ | – | $ | – | $ | 197,894,270 | ||||
Short-Term Investments | 3,640,512 | – | – | 3,640,512 | ||||||||
TOTAL | $ | 201,534,782 | $ | – | $ | – | $ | 201,534,782 | ||||
Century Growth Opportunities Fund | ||||||||||||
| Level 2 - | Level 3 - | |||||||||||
| Other Significant | Significant | |||||||||||
| Level 1 - | Observable | Unobservable | ||||||||||
Investments in Securities at Value* | Quoted Prices | Inputs | Inputs | Total | ||||||||
Common Stocks | $ | 91,952,643 | $ | – | $ | – | $ | 91,952,643 | ||||
Short-Term Investments | 1,937,742 | – | – | 1,937,742 | ||||||||
TOTAL | $ | 93,890,385 | $ | – | $ | – | $ | 93,890,385 | ||||
| * At October 31, 2013 the Funds held investments in common stocks classified as Level 1, with corresponding major categories | ||||||||
| as shown on each Fund’s Portfolio of Investments. | ||||||||
The Funds recognize transfers into and out of all levels at the end of the reporting period. There were no transfers into or out of Levels 1 and 2 during the period.
There were no securities classified as Level 3 securities during the period, thus, a reconciliation of assets in which significant unobservable inputs (Level 3) were used is not applicable for these Funds.
B. Security Transactions — Security transactions are recorded on a trade date basis. Gain or loss on sales is determined by the use of the highest cost-method, for both financial reporting and federal income tax purposes. Dividend income is recorded on the ex-dividend date. Payments received from certain investments held by the Funds may be comprised of dividends, capital gains and return of capital. The Funds originally estimate the expected classification of such payments. The amounts may sub-
Annual Report | October 31, 2013 | 29 | |
| Century Funds | Notes to Financial Statements |
October 31, 2013 |
sequently be reclassified upon receipt of information from the issuer. The Funds may invest in equity securities issued or guaranteed by companies organized and based in countries outside of the United States. These securities may be traded on foreign securities exchanges or in foreign over-the-counter markets. Foreign dividend income is recorded on ex-dividend date or as soon as practicable after the Fund determines the existence of a dividend declaration after exercising reasonable due diligence. Foreign income and capital gain on some foreign securities may be subject to foreign withholding taxes, which are accrued as applicable. Interest income is recorded daily on an accrual basis.
C. Use of Estimates — The preparation of these financial statements in accordance with GAAP incorporates estimates made by management in determining the reported amounts of assets, liabilities, income and expenses of the Funds. Actual results could differ from those estimates.
D. Risks and Uncertainty — Century Small Cap Select Fund concentrates its investments in certain industries detailed in the Portfolio of Investments, which subjects the Fund to the risks associated with those industries and may result in greater fluctuation in share value than is experienced in more diversified portfolios. In addition, the Fund invests in smaller companies, which generally involves greater risk than investing in larger, more established companies.
Century Shares Trust may invest a significant portion of assets in a limited number of companies. As a result, the Fund may be more susceptible to financial, market and economic events affecting particular companies and therefore may experience greater price volatility than funds with more diversified portfolios. Century Growth Opportunities Fund invests mainly in small-cap and mid-cap companies, which, historically, have been more volatile in price than the stocks of large-cap companies.
Foreign investing involves certain risks and increased volatility not associated with investing solely in the U.S. These risks include currency fluctuations, economic or financial instability, lack of timely or reliable financial information or unfavorable political or legal developments.
At any given time, a significant portion of the assets of each Fund may be invested in securities of companies within the same market sector of the economy. Companies within the same sector often face similar issues and, consequently, may react similarly to changes in market conditions. If a Fund has a significant weighting in one or more sectors, it may be subject to more risk and price volatility.
E. Multiple Classes of Shares — Century Small Cap Select Fund offers two classes of shares, which differ in their respective distribution and service fees. Investment income, realized and unrealized capital gains and losses, the common expenses of the Fund, and certain fund-level expense reductions, if any, are allocated on a pro rata basis to each class based on the relative net assets of each class to the total net assets of the Fund. Certain expense reductions may differ by class. Because transfer agent fees include a per account fee, each class differs with respect to transfer agent fees incurred.
F. Redemption Fees — In general, shares of each Fund may be redeemed at net asset value. However, upon the redemption of shares held less than 90 days, a redemption fee of 1% of the current net asset value of the shares may be assessed and retained by each share class of each Fund for the benefit of the Fund’s remaining shareholders. The redemption fee is accounted for as an addition to paid-in-capital and amounts are shown on the Statement of Changes in Net Assets.
G. Income Tax Information and Distributions to Shareholders — Each year, each Fund intends to qualify as a regulated investment company by distributing all of its taxable income and sufficient net investment income and net realized gains, if any, under Subchapter M of the Internal Revenue Code of 1986 (“Code”), as amended. As a result, no provision for income taxes is required
30 | centuryfunds.com |
| Century Funds | Notes to Financial Statements |
October 31, 2013 |
in the accompanying financial statements. Foreign taxes are provided for based on each Fund’s understanding of the tax rules and rates class. Distributions are recorded on the ex-dividend date. Income and capital gain distributions are determined in accordance with income tax regulations, which may differ from generally accepted accounting principles. Capital accounts within the financial statements are adjusted for permanent book and tax differences. Generally accepted accounting principles require that any distributions in excess of tax basis earnings and profits be reported in the financial statements as a tax return of capital.
In order to present accumulated net investment income loss and accumulated net realized gain more closely to its tax character, the following accounts for each Fund were increased (decreased) as of October 31, 2013:
Fund | Paid-In Capital | Accumulated Net Investment Loss | Accumulated Net Realized Gain | |||
Century Small Cap Select Fund | $ | (227,191) | $ | 227,191 | $ | – |
Century Shares Trust | – | 72,530 | (72,530) | |||
Century Growth Opportunities Fund | (368) | 5,189 | (4,821) | |||
These reclassifications have no impact on net assets or the results of operations. The Funds had temporary book/tax differences primarily attributable to wash sales or portfolio securities and permanent book/tax differences primarily attributable to net operating losses. Temporary differences will reverse in a subsequent period.
The amount reclassified for the Century Small Cap Select Fund was a net operating loss offset to Paid-In Capital of $227,191.
The net unrealized appreciation/depreciation of investments based on federal tax cost as of October 31, 2013 was as follows:
Century Small Cap Select Fund | Century Shares Trust | Century Growth Opportunities Fund | ||||
| Gross appreciation on investments (excess of value over tax cost) | $ | 110,833,414 | $ | 65,848,521 | $ | 21,374,553 |
| Gross depreciation on investments (excess of tax cost over value) | (8,995,560) | (597,892) | (859,194) | |||
| Net unrealized appreciation | $ | 101,837,854 | $ | 65,250,629 | $ | 20,515,359 |
| Cost of investments for federal income tax purposes | $ | 329,273,088 | $ | 136,284,153 | $ | 73,375,026 |
As of October 31, 2013, the components of distributable earnings on a tax basis were as follows:
Century Small Cap Select Fund | Century Shares Trust | Century Growth Opportunities Fund | ||||
| Accumulated capital gains | $ | 21,366,999 | $ | 11,804,187 | $ | 987,317 |
| Unrealized apprecation | 101,837,854 | 65,250,629 | 20,515,359 | |||
| Other cumulative effect of timing differences | (2,663,042) | (166,506) | (560,030) | |||
| Total | $ | 120,541,811 | $ | 76,888,310 | $ | 20,942,646 |
| Annual Report | October 31, 2013 | 31 |
| Century Funds | Notes to Financial Statements |
October 31, 2013 |
The differences between the components of distributable earnings on a tax basis and the amounts reflected in the Statement of Assets and Liabilities are primarily due to wash sales and real estate investment trust basis adjustments.
The tax character of distributions paid by the Funds during the year ended October 31, 2013, were as follows:
| Century Small | Century Shares | Century Growth | ||||
| Distributions Paid From: | Cap Select Fund | Trust | Opportunities Fund | |||
| Ordinary Income | $ | 0 | $ | 391,587 | $ | 169,177 |
| Long-term capital gains | 0 | 21,374,597 | 4,821 | |||
| Total | $ | 0 | $ | 21,766,184 | $ | 173,998 |
The tax character of distributions paid by the Funds during the year ended October 31, 2012 was as follows:
| Century Small | Century Shares | Century Growth | ||||
| Distributions Paid From: | Cap Select Fund | Trust | Opportunities Fund | |||
| Ordinary Income | $ | 0 | $ | 1,057,727 | $ | 0 |
| Long-term capital gains | 0 | 17,668,771 | 0 | |||
| Total | $ | 0 | $ | 18,726,498 | $ | 0 |
During the year ended October 31, 2013, the funds utilized the following capital loss carryforwards:
| Century Small | Century Shares | Century Growth | ||||
| Used October 31, 2013 | Cap Select Fund | Trust | Opportunities Fund | |||
| $ | (43,614,763) | $ | – | $ | (501,921) | |
As of October 31, 2013, each of the Funds had utilized all capital loss carryforwards available.
The Funds elect to defer to the period ending October 31, 2014, late year ordinary losses in the amounts of $2,663,042 for Century Small Cap Select Fund, $166,506 for Century Shares Trust and $560,030 for Century Growth Opportunities Fund.
As of October 31, 2013, the Funds had no uncertain tax positions that would require financial statement recognition or disclosure. The Funds’ federal tax returns filed for the fiscal years ended October 31, 2010, October 31, 2011, October 31, 2012, and returns to be filed for the year ended October 31, 2013, remain subject to examination by the Internal Revenue Service.
H. Indemnifications — In the normal course of business, the Funds enter into agreements with service providers that may contain indemnification clauses. The Funds maximum exposure under these arrangements is unknown as this would involve future claims that may be made against the Funds that have not yet occurred.
32 | centuryfunds.com |
| Century Funds | Notes to Financial Statements |
October 31, 2013 |
2. TRANSACTIONS IN SHARES
Century Small Cap Select Fund — The number of authorized shares is unlimited. Transactions in each class of shares were as follows:
| Institutional | |||||||
| Year Ended October 31, 2013 | Year Ended October 31, 2012 | ||||||
| Shares | Amount | Shares | Amount | ||||
| Sold | 1,565,973 | $ | 45,639,628 | 2,049,071 | $ | 52,385,431 | |
| Repurchased | (3,415,043) | (105,149,014) | (1,990,017) | (50,928,700) | |||
| Net Increase/(Decrease) | (1,849,070) | $ | (59,509,386) | 59,054 | $ | 1,456,731 | |
| Investor | |||||||
| Year Ended October 31, 2013 | Year Ended October 31, 2012 | ||||||
| Shares | Amount | Shares | Amount | ||||
| Sold | 462,270 | $ | 13,100,017 | 500,910 | $ | 12,388,387 | |
| Repurchased | (954,995) | (27,332,212) | (1,121,329) | (27,908,033) | |||
| Net Decrease | (492,725) | $ | (14,232,195) | (620,419) | $ | (15,519,646) | |
Century Shares Trust — The number of authorized shares is unlimited. Transactions in Institutional Class shares were as follows:
| Institutional | |||||||
| Year Ended October 31, 2013 | Year Ended October 31, 2012 | ||||||
| Shares | Amount | Shares | Amount | ||||
| Sold | 76,251 | $ | 1,482,250 | 180,586 | $ | 3,625,862 | |
| Issued to shareholders in reinvestment | |||||||
| of distributions | 1,095,688 | 19,733,349 | 931,203 | 16,696,472 | |||
| 1,171,939 | 21,215,599 | 1,111,789 | 20,322,334 | ||||
| Repurchased | (998,357) | (19,633,060) | (928,097) | (18,263,140) | |||
| Net Increase | 173,582 | $ | 1,582,539 | 183,692 | $ | 2,059,194 | |
Annual Report | October 31, 2013 | 33 |
| Century Funds | Notes to Financial Statements |
October 31, 2013 |
Century Growth Opportunities Fund — The number of authorized shares is unlimited. Transactions in Institutional Class shares were as follows:
| Institutional | |||||||
| Year Ended October 31, 2013 | Year Ended October 31, 2012 | ||||||
| Shares | Amount | Shares | Amount | ||||
| Sold | 1,322,762 | $ | 16,005,747 | 9,129,642 | $ | 102,323,974 | |
Issued to shareholders in reinvestment of distributions | 15,506 | 173,198 | – | – | |||
| 1,338,268 | 16,178,945 | 9,129,642 | 102,323,974 | ||||
| Repurchased | (3,327,149) | (41,670,751) | (1,091,369) | (11,863,258) | |||
| Net Increase/(Decrease) | (1,988,881) | $ | (25,491,806) | 8,038,273 | $ | 90,460,716 | |
3. INVESTMENT SECURITIES TRANSACTIONS
Century Small Cap Select Fund purchases and sales of investment securities (excluding short-term securities and U.S. Government obligations) aggregated $368,682,725 and $447,546,610, respectively, during the year ended October 31, 2013.
Century Shares Trust purchases and sales of investment securities (excluding short-term securities and U.S. Government obligations) aggregated $70,314,106 and $88,522,688, respectively, during the year ended October 31, 2013.
Century Growth Opportunities Fund purchases and sales of investment securities (excluding short-term securities and U.S. Government obligations) aggregated $150,019,231 and $176,497,861, respectively, during the year ended October 31, 2013.
4. INVESTMENT ADVISER FEE
Century Small Cap Select Fund: The Trust has entered into an Investment Advisory and Management Services Agreement (the “Agreement”) with Century Capital Management, LLC (“CCM”) pursuant to which CCM provides investment advisory, management and administrative services to Century Small Cap Select Fund. Under the Agreement, the Fund pays a monthly management fee at the annual rate of 0.95% of the Fund’s average daily net assets.
Century Shares Trust: The Trust has entered into an Investment Advisory Agreement (the “Agreement”) with CCM pursuant to which CCM provides an investment program for Century Shares Trust. Under the Agreement, the Fund pays a management fee based on the Fund’s average daily net assets computed at the following annual rates: 0.80% of the first $500 million and 0.70% of the amounts exceeding $500 million.
Century Growth Opportunities Fund: The Trust has entered into an Investment Advisory Agreement (the “Agreement”) with CCM pursuant to which CCM provides investment advisory services to Century Growth Opportunities Fund. Under the Agreement, the Fund pays a management fee based on the Fund’s average daily net assets at the following annual rates: 0.80% of the first $500 million and 0.75% thereafter.
34 | centuryfunds.com |
| Century Funds | Notes to Financial Statements |
October 31, 2013 |
5. ADMINISTRATION FEES
Century Small Cap Select Fund: Per the Investment Advisory and Management Services Agreement between the Trust and CCM, Century Small Cap Select Fund may reimburse CCM for expenses associated with having the adviser’s personnel perform shareholder service functions and certain financial, accounting, administrative and clerical services. No reimbursements were paid to CCM during the year ended October 31, 2013.
Century Shares Trust: The Trust has entered into an Administration Agreement with CCM pursuant to which CCM provides certain administrative services to Century Shares Trust at the annual rate of 0.10% of the Fund’s average daily net assets.
Century Growth Opportunities Fund: The Trust has entered into an Administration Agreement with CCM pursuant to which CCM provides certain administrative services to Century Growth Opportunities Fund at the annual rate of 0.10% of the Fund’s average daily net assets.
CCM has entered into a Sub-Administration Agreement with ALPS Fund Services, Inc. (“ALPS”) pursuant to which ALPS provides certain administrative services to each Fund on behalf of CCM. CCM pays ALPS a sub-administration fee for sub-administration services provided to each Fund.
6. DISTRIBUTION AND OTHER FEES
The Trust has adopted a Distribution and Service Plan (the “Plan”) pursuant to Rule 12b-1 under the 1940 Act on behalf of Century Small Cap Select Fund. The Plan authorizes the Fund to pay up to 0.25% of the average daily net assets of the Fund’s Investor Shares class for distribution and shareholder services. The Plan may be terminated at any time by the vote of a majority of the independent Trustees or by the vote of the holders of a majority of the outstanding shares of the Investor Shares.
The Trust has entered into agreements with financial intermediaries to provide recordkeeping, processing, shareholder communications and other services to customers of the intermediaries and has agreed to compensate the intermediaries for providing such services. Certain services would be provided by the Funds if the shares of each customer were registered directly with the Funds’ transfer agent. Each Fund pays a portion of the intermediary fees attributable to shares of the Fund not exceeding the estimated expense the Fund would have paid its transfer agent had each customer’s shares been registered directly with the transfer agent instead of held through the intermediary accounts.
Century Growth Opportunities Fund: CCM contractually agreed to limit the operating expenses of Century Growth Opportunities Fund to 1.10% of average daily net assets through February 28, 2014.
8. TRUSTEE AND OFFICER FEES
As of October 31, 2013, there were eight Trustees, six of whom are not “interested persons” (within the meaning of the 1940 Act) of the Trust (the “Independent Trustees”). Each Independent Trustee receives a retainer of $4,000 per calendar quarter from the Trust for his or her services. The chairperson of the Audit Committee receives an additional retainer of $1,125 per calendar quarter; the Lead Independent Trustee receives an additional retainer of $750 per calendar quarter; and the Chairpersons of the Oversight and Governance Committee and Nominating Committee each receive an additional retainer of $375 per calendar quarter. In addition, each Independent Trustee is paid a fee of $5,500 for each meeting of the Board of Trustees
| Annual Report | October 31, 2013 | 35 |
| Century Funds | Notes to Financial Statements |
October 31, 2013 |
attended or participated in, as the case may be. The Independent Trustees are not paid an additional fee from the Trust for attendance at and/or participation in meetings of the various committees of the Board. The Independent Trustees are also reimbursed for meeting-related expenses. Officers of the Trust and Trustees who are interested persons of the Trust receive no salary or fees from the Trust.
9. RECENT ACCOUNTING PRONOUNCEMENTS
In June 2013, the Financial Accounting Standards Board (the “FASB”) issued Accounting Standards Update (“ASU”) No. 2013-08, Financial Services-Investment Companies (Topic 946): Amendments to the Scope, Measurement, and Disclosure Requirements. The FASB standard identifies characteristics a company must assess to determine whether it is considered an investment company for financial reporting purposes. This ASU is effective for fiscal years beginning after December 15, 2013. The Funds believe the adoption of this ASU will not have a material impact on the financial statements.
36 | centuryfunds.com |
| Century Funds | Report of Independent Registered Public Accounting Firm |
To the Board of Trustees and Shareholders of Century Capital Management Trust
We have audited the accompanying statements of assets and liabilities, including the portfolios of investments, of Century Capital Management Trust (the “Trust”) comprising the Century Small Cap Select Fund, Century Shares Trust and Century Growth Opportunities Fund as of October 31, 2013, and the related statements of operations for the year then ended, the statements of changes in net assets for each of the two years in the period then ended, and the financial highlights for each of the periods presented. These financial statements and financial highlights are the responsibility of the Trust’s management. Our responsibility is to express an opinion on these financial statements and financial highlights based on our audits.
We conducted our audits in accordance with the standards of the Public Company Accounting Oversight Board (United States). Those standards require that we plan and perform the audit to obtain reasonable assurance about whether the financial statements and financial highlights are free of material misstatement. The Trust is not required to have, nor were we engaged to perform, an audit of their internal control over financial reporting. Our audits included consideration of internal control over financial reporting as a basis for designing audit procedures that are appropriate in the circumstances, but not for the purpose of expressing an opinion on the effectiveness of the Trust’s internal control over financial reporting. Accordingly, we express no such opinion. An audit also includes examining, on a test basis, evidence supporting the amounts and disclosures in the financial statements, assessing the accounting principles used and significant estimates made by management, as well as evaluating the overall financial statement presentation. Our procedures included confirmation of securities owned as of October 31, 2013, by correspondence with the custodian and brokers; where replies were not received from brokers, we performed other auditing procedures. We believe that our audits provide a reasonable basis for our opinion.
In our opinion, the financial statements and financial highlights referred to above present fairly, in all material respects, the financial position of each of the funds constituting the Century Capital Management Trust as of October 31, 2013, the results of their operations for the year then ended, the position changes in their net assets for each of the two years in the period then ended, and the financial highlights for each of the periods presented, in conformity with accounting principles generally accepted in the United States of America.
DELOITTE & TOUCHE LLP
Denver, Colorado
December 18, 2013
Annual Report | October 31, 2013 | 37 |
| Century Funds | Disclosure of Fund Expenses |
October 31, 2013 (Unaudited) | |
As a shareholder of a Fund, you incur two types of costs: direct costs, such as short-term redemption fees and wire fees, and indirect costs, including management fees, and other fund operating expenses. This example is intended to help you understand your indirect costs, also referred to as “ongoing costs” (in dollars), of investing in the Fund and to compare these costs with the ongoing costs of investing in other mutual funds.
This example is based on an investment of $1,000 invested at the beginning of the period and held for the entire period as indicated below.
Actual Expenses The first line of the table below provides information about actual account values and actual expenses. You may use the information in this line, together with the amount you invested at the beginning of the period, to estimate the expenses that you paid over the period. Simply divide your account value by $1,000 (for example, an $8,600 account value divided by $1,000 = 8.6), then multiply the result by the number in the first line under the heading “Expenses Paid During Period” to estimate the expenses you paid on your account during this period.
Hypothetical Example for Comparison Purposes The second line of the table provides information about hypothetical account values and hypothetical expenses based on the Fund’s actual expense ratio and an assumed rate of return of 5% per year before expenses, which is not the Fund’s actual return. The hypothetical account values and expenses may not be used to estimate the actual ending account balance or expenses you paid for the period. You may use this information to compare ongoing costs of investing in the Fund and other funds. To do so, compare this 5% hypothetical example with the 5% hypothetical examples that appear in the shareholder reports of other funds.
Please note that the expenses shown in the table are meant to highlight your ongoing costs only and do not reflect any direct costs, such as wire fees or low balance fees. Therefore, the second line of the table is useful in comparing ongoing costs only and will not help you determine the relative total costs of owning different funds. In addition, if these direct costs were included, your costs would be higher.
| Beginning | Ending | Expenses Paid During | |||||
| Account Value | Account Value | Expense | Period May 1, 2013 to | ||||
| May 1, 2013 | October 31, 2013 | Ratio(a) | October 31, 2013(b) | ||||
| Century Small Cap Select Fund | |||||||
| Institutional Shares | |||||||
| Actual | $ | 1,000.00 | $ | 1,156.80 | 1.10% | $ | 5.98 |
| Hypothetical (5% return before expenses) | $ | 1,000.00 | $ | 1,019.66 | 1.10% | $ | 5.60 |
| Investor Shares | |||||||
| Actual | $ | 1,000.00 | $ | 1,155.00 | 1.40% | $ | 7.60 |
| Hypothetical (5% return before expenses) | $ | 1,000.00 | $ | 1,018.15 | 1.40% | $ | 7.12 |
| Century Shares Trust | |||||||
| Institutional Shares | |||||||
| Actual | $ | 1,000.00 | $ | 1,144.50 | 1.10% | $ | 5.95 |
| Hypothetical (5% return before expenses) | $ | 1,000.00 | $ | 1,019.66 | 1.10% | $ | 5.60 |
| Century Growth Opportunities Fund | |||||||
| Institutional Shares | |||||||
| Actual | $ | 1,000.00 | $ | 1,175.40 | 1.10% | $ | 6.03 |
| Hypothetical (5% return before expenses) | $ | 1,000.00 | $ | 1,019.66 | 1.10% | $ | 5.60 |
(a) The Fund’s expense ratios have been based on the Fund’s most recent fiscal half year expenses.
(b) Expenses are equal to the Fund’s annualized expense ratio multiplied by the average account value over the period, multiplied by the number of days in the most recent fiscal half year (184), divided by 365.
38 | centuryfunds.com |
| Century Funds | Tax Information |
October 31, 2013 (Unaudited) | |
The following information represents the tax status of dividends and distributions paid by the Funds during the calendar year ended December31, 2012. This information is presented to meet regulatory requirements and no current action on your part is required.
Century Shares | Century Small | Century Growth | |
Trust | Cap Select Fund | Opportunities Fund | |
Dividends Received Deduction | 97.86% | 0.00% | 100.00% |
Qualified Dividend Income | 97.18% | 0.00% | 100.00% |
Pursuant to Section 852(b)(3) of the Internal Revenue Code, the Century Shares Trust and the Century Growth Opportunities Fund designate $21,374,597 and $4,821 respectively as long-term capital gain distributions.
In early 2013, if applicable, shareholders of record received this information for the distributions paid to them by the Funds during the calendar year 2012 via Form 1099. The Funds will notify shareholders in early 2014 of amounts paid to them by the Funds, if any, during the calendar year 2013.
Please consult a tax advisor if you have questions about federal or state income tax laws, or how to prepare your tax returns.
Annual Report | October 31, 2013 | 39 |
| Century Funds | Approval of Investment Management Agreements |
| October 31, 2013 (Unaudited) |
Century Capital Management, LLC (CCM) serves as the investment adviser and administrator to each of Century Shares Trust (CST) and Century Growth Opportunities Fund (CGOF) pursuant to an investment advisory agreement and an amended and restated administration agreement, each between Century Capital Management Trust, on behalf of CST and CGOF, and CCM. CCM also serves as the investment adviser and provides administrative services to Century Small Cap Select Fund (CSCS) pursuant to an investment advisory and management services agreement between Century Capital Management Trust, on behalf of CSCS, and CCM. The Trustees of Century Capital Management Trust determine annually whether to continue the investment advisory and administration agreements for each of CST, CSCS and CGOF.
At a meeting held on June 19, 2013, based on their evaluation of the information provided by CCM, the Trustees, including the independent Trustees voting separately, unanimously approved the continuation of the investment advisory agreement for each of CST, CSCS and CGOF for another year.
In advance of the meeting, the Board, including all of the independent Trustees, received, among other things: (i) a Lipper Inc. report comparing each Fund’s fees and expenses to those of a peer group and peer universe for that Fund, each selected by Lipper; (ii) information regarding the average annual total returns for each Fund, as well as comparative total return information for various securities indicies and the applicable Lipper and Morningstar peer groups; (iii) reports from CCM that described (a) the services provided to each Fund and information about the personnel providing those services, (b) the fees paid under the investment advisory and administration agreements, (c) compliance and oversight, (d) “fall-out” benefits to CCM, (e) brokerage and soft dollar arrangements, and (f) the fees paid by and services provided to comparable accounts; (iv) CCM’s profitability analysis with respect to advisory services provided to each Fund; and (v) CCM’s Form ADV. In addition, at each regularly scheduled Board meeting, the Trustees receive and review, among other things, information concerning each Fund’s performance and the services provided to each Fund by CCM. The independent Trustees also received a memorandum from their counsel outlining the legal standards and certain other considerations relevant to the Trustees’ deliberations.
After receiving the requested information, the independent Trustees met in an executive session to consider the investment advisory and administrative arrangements. The Trustees then unanimously determined to approve the continuance of the investment advisory and administration agreements with respect to each Fund for another year.
In determining to approve the continuation of the investment advisory and administration agreements, the Trustees considered a number of factors as outlined below. The Trustees did not identify any single factor as controlling. The Trustees evaluated all information available to them on a Fund-by-Fund basis, and their determinations were made separately in respect of each Fund. They also took into account the common interests of the Funds in their review. Throughout their deliberations, the independent Trustees were represented by counsel.
Nature, Quality and Extent of Services Provided
In considering the nature, extent and quality of the services provided by CCM under the investment advisory and administration agreements, the Board considered the terms of those agreements and reviewed information provided by CCM relating to its operations and personnel. The Trustees also considered their knowledge of the nature and quality of the services provided by CCM to the Funds gained from their experience as trustees of the Funds and noted the expectations of the shareholders who had invested in the Funds. The Board considered that CCM was responsible for the management and administration of each Fund’s operations. They also considered that CCM provides day-to-day management of each Fund’s portfolio of investments, including making purchases and sales of portfolio securities consistent with each Fund’s investment objectives and policies.
40 | centuryfunds.com |
| Century Funds | Approval of Investment Management Agreements |
October 31, 2013 (Unaudited) |
The Board considered CCM’s resources and personnel, focusing in particular on investment and compliance resources and personnel. The Board reviewed each portfolio manager’s experience and qualifications, as well as CCM’s investment approach and research process. The Board also reviewed CCM’s trading procedures and brokerage practices, including information regarding soft dollar arrangements.
The Board also considered that, as administrator, CCM is responsible for the administration of each Fund’s business and other affairs. It was noted that CCM supervises and monitors the performance of each Fund’s service providers and provides each Fund with personnel (including officers) as are necessary for the Fund’s operations. It was noted that CCM pays all of the compensation of Mr. Thorndike and Mr. Fulkerson, the interested Trustees, and the Funds’ officers. The Board also noted that CCM assisted the Funds in meeting legal and regulatory requirements and considered, among other things, CCM’s compliance program. The Board considered the fees paid to CCM for the provisions of such services. The Board also considered CCM’s risk management program.
Taking all of the foregoing into account, the Trustees concluded that they were satisfied with the nature, extent and quality of services provided to the Funds under the investment advisory and administration agreements.
Costs of Services Provided and Profitability
The Trustees reviewed information concerning the costs of services provided to the Funds by CCM, and the profitability to CCM of its investment advisory and administrative relationship with each Fund for the periods ended December 31, 2011 and December 31, 2012, along with a description of the methodology used by CCM in preparing the profitability information.
The Trustees recognized that CCM should be entitled to earn a reasonable level of profit for the services provided to each Fund, and that it is difficult to make comparisons of profitability from fund advisory and administration contracts because comparative information is not generally available and is affected by numerous factors, including the structure of the particular adviser, the types of funds it manages, its business mix, numerous assumptions about allocations and the adviser’s capital structure and cost of capital. The Trustees concluded that, taking all of the foregoing into account, they were satisfied that CCM’s level of profitability from its relationship with each Fund was not excessive.
Fall-Out Benefits
The Trustees considered the extent to which CCM benefited from soft dollar arrangements whereby it receives brokerage and research services from brokers that execute a Fund’s purchases and sales of investment securities. It was noted that CCM had represented that it fulfills its fiduciary obligation of seeking best execution when engaging in portfolio transactions for the Funds. The Trustees concluded that the direct and indirect benefits to CCM from its relationship with the Funds were reasonable.
Economies of Scale
The Trustees considered the extent to which CCM may realize economies of scale or other efficiencies in managing and supporting the Funds. It was noted that as assets increase certain fixed costs may be spread across a larger asset base, and it was noted that any economies of scale or other efficiencies might be realized (if at all) across a variety of products and services, including the Funds, and not only in respect of a single Fund. The Trustees recognized that economies of scale are difficult to identify and quantify, rarely identifiable on a Fund-by-Fund basis, and that, among other factors that may be relevant, are the following: fee levels, expense subsidization, investment by CCM in research and analytical capabilities and CCM’s commitment and resource
Annual Report | October 31, 2013 | 41 |
| Century Funds | Approval of Investment Management Agreements |
October 31, 2013 (Unaudited) |
allocation to the Funds. The Trustees noted that profitability also may be an indicator of the availability of any economies of scale, although profitability may vary for other reasons particularly when the level of services are maintained notwithstanding a decline in fee revenues. The Trustees noted that the advisory fee schedule for each of CST and CGOF included breakpoints that would allow the shareholders of the Fund to share in economies of scale, if any, experienced by CCM in managing that Fund. The Trustees noted that the advisory fee schedule for CSCS did not include breakpoints that would reduce the fee rate on assets above specified levels. The Board determined that the current fee structure for CSCS was acceptable given the fee level and the fees waived by CCM in prior years in respect of CSCS. Accordingly, the Trustees concluded that economies of scale, if any, were being appropriately shared with each of the Funds.
Investment Results
CST. The Trustees reviewed comparative information that showed that CST’s average annual total return for the Institutional class of shares lagged the average annual total return of both the Russell 1000 Growth Index and CST’s Lipper peer group for the 1, 3, 5 and 10 years ended April 30, 2013, but that such average annual total return was better than the average annual total return of the Russell 1000 Growth Index for the 1 year and 3 month periods ended May 31, 2013. The Trustees also noted that CST’s average annual total return was in the first quartile of its Morningstar peer group for the one year period ended May 31, 2013. (In all quartile rankings referred to throughout this disclosure, first quartile is most favorable to the Fund’s shareholders. Thus, highest relative performance would be first quartile and lowest relative expenses would also be first quartile.) The Trustees compared the portfolio characteristics of CST to the characteristics of the Russell 1000 Growth Index and considered the impact of the different portfolio characteristics on comparative performance, particularly in light of recent market conditions. The Trustees agreed that they would continue to closely monitor the performance of CST.
CSCS. The Trustees reviewed comparative information that showed that CSCS’s average annual total return for each of the Institutional class of shares and the Investor class of shares was better than the average annual total returns of the Russell 2000 Index, the Russell 2000 Growth Index and CSCS’s Lipper peer group for the 3 year period ended April 30, 2013, but that CSCS’s average annual total return for each of the Institutional class of shares and the Investor class of shares lagged the average annual total return of the Russell 2000 Index, the Russell 2000 Growth Index and CSCS’s Lipper peer group for the 1, 5 and 10 year periods ended April 30, 2013. The Trustees considered CCM’s explanation of CSCS’s relative underperformance, noting the impact of market conditions on CSCS’s performance. The Trustees agreed that they would continue to closely monitor the performance of CSCS.
CGOF. The Trustees reviewed comparative information that showed that CGOF’s average annual total return for the Institutional class of shares lagged the average annual total returns of the Russell 2500 Growth Index and CGOF’s Lipper peer group for the 1 year period ended April 30, 2013 and since CGOF’s inception (November 17, 2010). The Trustees considered the relatively short performance history of CGOF, CCM’s investment process and the impact of market conditions on CGOF’s performance. They also considered the recent adjustments made by CCM to its investment process with respect to CGOF. The Trustees agreed that they would continue to closely monitor the performance of CGOF.
Fees and Other Expenses
The Trustees considered the advisory fees paid by each Fund to CCM. The Trustees also considered the administrative fee rate paid by each of CST and CGOF to CCM. The Trustees considered (i) the level of each Fund’s advisory fee versus its peer group and peer universe as shown in the Lipper materials and (ii) each Fund’s total expense ratio as compared to its peer group and peer universe as shown in the Lipper materials.
42 | centuryfunds.com |
| Century Funds | Approval of Investment Management Agreements |
October 31, 2013 (Unaudited) |
The Trustees also considered the fees that CCM charges institutional investors and other clients. The Trustees reviewed materials from CCM describing the differences in services provided to these other clients, which noted that typically more services were provided to the Funds than these other clients and that, because of the constant issuance and redemption of Fund shares, the Funds were more difficult to manage than other clients. With respect to CCM’s subadvisory relationship with other mutual funds, the Trustees considered that CCM provided fewer services to those funds than it provided to the Funds. The materials showed that the fee rates charged by CCM to each Fund were generally similar to (but not necessarily as low as, in all cases) the fees paid by CCM’s other clients.
The information obtained from Lipper for the meeting compared the advisory fee, transfer agency/custodian fees, distribution fees, other nonmanagement expenses and total expenses for the Institutional and Investor class of shares of each Fund to those of a group of competitor funds of roughly equivalent size, as well as a universe of competitor funds. The Trustees did not independently verify any of the information provided by Lipper.
CST. The Trustees reviewed information that showed that CST’s advisory fee was higher than the Lipper peer group and peer universe averages. The Trustees also considered that CST’s total expense ratio for the Institutional class of shares was lower than the Lipper peer group and peer universe averages. The Trustees considered that certain of the funds in the peer group had lower advisory fees than CST as a result of fee waivers that could be terminated. They also noted that a number of the funds in the peer group were part of large fund complexes and that the lower advisory fees charged to those funds may be a result of economies of scale spread across the complex. The Trustees also considered the services provided by CCM as compared to the services provided by other advisers and the ability of the other advisers to realize economies of scale across a larger fund complex. The Trustees concluded that the advisory fee, administrative fee and total expense ratio of CST were reasonable in relation to the nature and quality of the services provided by CCM.
CSCS. The Trustees reviewed information that showed that CSCS’s advisory fee was higher than the Lipper peer group average and peer universe averages. The Trustees also reviewed information that showed that the total expense ratio for CSCS’s Institutional class of shares was slightly higher than the average total expense ratio of the Lipper peer group but slightly lower than the average total expense ratio of the Lipper peer universe, and that the total expense ratio for CSCS’s Investor class of shares was higher than both the Lipper peer group and peer universe averages. They noted that a number of the funds in the peer group were part of large fund complexes and that the lower advisory fees charged to those funds may be a result of economies of scale spread across the complex. The Trustees also considered information provided to them regarding the costs to CCM of providing investment advisory services to CSCS, noting in particular the competitive market for analysts and portfolio managers and that the research needed to implement CSCS’s investment strategy was relatively costly. The Trustees also considered the services provided by CCM compared to the other advisers and ability of the other advisers to realize economies of scale across a larger fund complex. The Trustees concluded that the advisory fee and total expense ratios of CSCS were reasonable in relation to the nature and quality of the services provided by CCM.
CGOF. The Trustees reviewed information that showed that CGOF’s contractual advisory fee was higher than the Lipper peer group and peer universe averages. They noted that CCM had reimbursed a portion of the advisory fee payments received from CGOF. The Trustees also considered that CGOF’s total expense ratio for the Institutional class of shares was slightly higher than the average total expense ratio of CGOF’s Lipper peer group but slightly lower than the average total expense ratio of the Lipper peer universe. The Trustees concluded that the advisory fee, administrative fee and total expense ratio of CGOF were reasonable in relation to the nature and quality of the services provided by CCM.
Annual Report | October 31, 2013 | 43 |
| Century Funds | Trustees and Officers |
October 31, 2013 (Unaudited) | |
The following table provides certain information regarding the Trustees and officers of the Century Funds as of October 31, 2013. Each Trustee’s year of birth is set forth in parentheses after his or her name. Unless otherwise noted, (i) each Trustee and officer has engaged in the principal occupation(s) noted in the table for at least the most recent five years, although not necessarily in the same capacity; and (ii) the address of each Trustee and officer is c/o Century Capital Management, 100 Federal Street, 29th Floor, Boston, MA 02110. Each Trustee’s term of office continues until the election and qualification of a successor, or until such Trustee dies, retires, resigns or is removed in accordance with Declaration of Trust. Because the Funds do not hold an annual meeting of shareholders, each Trustee will hold office for an indeterminate period.
Name, Year of Birth, Position(s) held with Trust and Length of Time Served | Principal Occupation During Past 5 Years And Other Directorships Held | No. of Portfolios in Fund Complex Overseen |
William Gray (1952) Trustee, 2006 to present | Senior Advisor, The Blackstone Group LP (private equity firm); Special Advisor, Chi & Partners (communications firm); Senior Advisor, Orca TV, LLC (campus-based social media firm); Senior Advisor, Digital Artists (social media technology platform); Advisor, TruEffect, Inc. (advertising data analytics); Advisor, Idomoo Ltd. (customer video targeting). Formerly, North American CEO, Vice Chairman, Director, Ogilvy Group Inc. (communications firm) (retired 2010). Other Directorships: HealthMarkets, Inc. (health insurance); Zinio Holdings LLC (digital newsstand firm); The New York Public Library; First Tee of Connecticut. Former Directorships: Harleysville Group, Inc. (through 2011); American Red Cross of Greater New York (Trustee, 1996 to 2002; Chairman 2002 to 2008; Chairman Emeritus, since 2008). | 3 |
Laura A. Johnson (1954) Trustee, 2007 to present | Bullard Fellow, Harvard Forest, Harvard University. Formerly, President, Massachusetts Audubon Society (1999-2012). Other Directorships: Corporation Member, Woods Hole Oceanographic Institute; Land Trust Alliance Board of Directors; WGBH Board of Oversees; Winsor School Alumnae Board; Member, Mount Auburn Cemetery Council of Visitors. | 3 |
Stephen W. Kidder (1952) Trustee, 2005 to present | Managing Partner, Hemenway & Barnes LLP (law firm); President, Hemenway Trust Company. Other Directorships: Trustee, Wellesley College; President of the Board, Isabella Stewart Gardner Museum; Trustee, Children’s Hospital Trust. | 3 |
Jerry S. Rosenbloom (1939) Trustee, 1998 to present | Frederick H. Ecker Emeritus Professor of Insurance and Risk Management and Senior Academic Advisor, Certified Employee Benefit Specialist Program, The Wharton School, University of Pennsylvania. Fellow, Financial Institutions Center and Fellow, Leonard Davis Institute for Health Economics, The Wharton School, University of Pennsylvania. Other Directorships: American Institute for Chartered Property Casualty Underwriters; The Insurance Institute of America; Advisory Board Member, International Foundation of Employee Benefit Plans. Former Directorships: Harleysville Mutual Insurance Company and Harleysville Group, Inc. (through May 2012). | 3 |
44 | centuryfunds.com |
| Century Funds | Trustees and Officers |
October 31, 2013 (Unaudited) | |
Name, Year of Birth, Position(s) held with Trust andLength of Time Served | Principal Occupation During Past 5 Years And Other Directorships Held | No. of Portfolios in Fund Complex Overseen |
David D. Tripple (1944) Trustee, 2004 to present | Private investor. Formerly, Chief Executive Officer and Trustee, Pioneer Funds (2000 to 2001); Executive Vice President and Director, The Pioneer Group, Inc. (asset management) (1998 to 2000). Other Directorships: The Calamos Funds (overseeing 22 portfolios in fund complex). | 3 |
Ellen M. Zane (1951) Trustee, 2007 to present | CEO Emeritus and Vice Chairman, Board of Trustees of Tufts Medical Center. Formerly, President and CEO of Tufts Medical Center and Floating Hospital for Children (2004 to 2011); Network President, Partners Healthcare System (1994 to 2004). Other Directorships: Haemonetics Corporation; Brooks Automation, Inc.; Parexel International Corporation; Fiduciary Trust Company; Harvard School of Public Health, Health Policy & Management Executive Council; Trustee, George Washington University. Former Directorships: Lincare Corporation (through August 2012). | 3 |
INTERESTED TRUSTEES AND OFFICERS1 | ||
Alexander L. Thorndike (1966) Trustee, 1999 to present; Chairman and Chief Executive Officer, 2004 to present | Managing Partner, Century Capital Management, LLC. No other directorships held. | 3 |
Davis R. Fulkerson (1965) Trustee, 2000 to present | Managing Partner, Century Capital Management, LLC. No other directorships held. | 3 |
Julie Smith (1971) Chief Financial Officer, 2008 to present | Chief Financial Officer, Century Capital Management, LLC. | N/A |
Maureen E . Kane (1962) Chief Legal Officer, 2006 to present; Secretary, 2007 to present; Chief Compliance Officer, 2009 to present | General Counsel, Century Capital Management, LLC. | N/A |
| 1 | Each person listed is considered an “interested person” of the Trust within the meaning of the 1940 Act by virtue of being an officer or employee of the Adviser. |
The Statement of Additional Information (“SAI”) for each Fund includes additional information about the Trustees. The SAI is available, without charge, upon request. If you would like to request a copy of the SAI, you may do so by calling the following toll-free number: (800) 321-1928.
Annual Report | October 31, 2013 | 45 |
Intentionally Left Blank
Fund Information
PORTFOLIO HOLDINGS
Each fund files a complete schedule of its portfolio holdings with the SEC for the first and third quarters of the fund’s fiscal year on Form N-Q. The Forms N-Q are available on the SEC’s website at http://www.sec.gov, and they may be reviewed and copied at the SEC’s Public Reference Room in Washington, DC. Information on the operation of the SEC’s Public Reference Room may be obtained by calling 1-800-SEC-0330.
PROXY VOTING
A description of the policies and procedures that each fund uses to determine how to vote proxies relating to portfolio securities and each fund’s proxy voting record for the 12-month period ended June 30 are available, without charge, upon request, by calling 1-800-321-1928. You may also obtain a copy of the funds’ proxy voting policies and procedures and proxy voting record on the SEC’s website at http://www.sec.gov.
FOR MORE INFORMATION
For more information about the Century Funds, please call 1-800-303-1928.
Regular Mailing Address: Century Funds P.O. Box 588 Portland, ME 04112 | Overnight Mailing Address: Century Funds c/o Atlantic Shareholder Services, LLC 3 Canal Plaza, Ground Floor Portland, ME 04101 |
Investment Adviser Century Capital Management, LLC 100 Federal Street Boston, MA 02110 | Distributor ALPS Distributors, Inc. 1290 Broadway, Suite 1100 Denver, CO 80203 |
Item 2. Code of Ethics.
| (a) | As of the end of the period covered by this report, Century Capital Management Trust (the “registrant”) has adopted a code of ethics, as defined in Item 2 of Form N-CSR, that applies to its Principal Executive Officer, Principal Financial Officer, and Principal Accounting Officer. |
| (c) | During the period covered by this report, there were no amendments to the code of ethics. |
| (d) | During the period covered by this report, no waivers from any provision of the code of ethics were granted. |
| (f)(1) | A copy of the code of ethics is filed as an exhibit hereto. |
Item 3. Audit Committee Financial Expert.
| (a)(1) | The registrant’s board of trustees has determined that the registrant has an “audit committee financial expert” serving on its audit committee, as that term is defined in paragraph (b) of Item 3 of Form N-CSR. |
| (a)(2) | Jerry Rosenbloom is the audit committee financial expert. Mr. Rosenbloom is an “independent” member of the audit committee as that term is defined in paragraph (a)(2) of Item 3 of Form N-CSR. |
| (c)(4) | Mr. Rosenbloom is an independent trustee, as defined in paragraph (a)(2) of this item's instructions. Mr. Rosenbloom received his B.S. degree in Business Administration from Temple University and his M.A. and Ph.D. degrees in Applied Economics, with a concentration in insurance, from the University of Pennsylvania. He is currently the Frederick H. Ecker Emeritus Professor of Insurance and Risk Management at the Wharton School. He was the past Chairman of the Insurance and Risk Management Department at Wharton and the past Executive Director of the S.S. Huebner Foundation for Insurance Education. He has served on the Boards of Directors of mutual funds and insurance companies, including in the capacity of audit committee member, and he has served as a consultant to numerous companies, funds and associations. In connection with his directorships and audit committee memberships, as well as his academic and teaching activities and his consulting activities for public and private companies, Mr. Rosenbloom has evaluated financial statements containing a breadth and level of complexity of accounting issues comparable to those that may arise in the financial statements of the Funds, and he has developed an understanding of internal controls and procedures for financial reporting, as well as audit committee functions. The SEC has stated that the designation or identification of a person as an audit committee financial expert pursuant to this Item 3 of Form N-CSR does not impose on such person any duties, obligations or liability that are greater than the duties, obligations and liability imposed on such person as a member of the Audit Committee and the Board of Trustees in the absence of such designation or identification. |
Item 4. Principal Accountant Fees and Services.
| (a) | Audit Fees. The aggregate fees billed to the registrant for each of the last two fiscal years for professional services rendered by the registrant’s principal accountant (“Accountant”) for the audit of the registrant’s annual financial statements or services that are normally provided by the Accountant in connection with statutory and regulatory filings or engagements for these fiscal years were as follows: |
| FYE | Fees | ||||
| 10/31/2013 | $124,500 | ||||
| 10/31/2012 | $129,500 |
| (b) | Audit-Related Fees. For each of the last two fiscal years, there were no fees billed to the registrant for assurance and related services by the Accountant that are reasonably related to the performance of the audit of the registrant's financial statements and are not reported under Audit Fees. For each of the last two fiscal years of the registrant, there were no audit-related fees billed by the registrant's Accountant to the registrant's investment adviser and any entity controlling, controlled by, or under common control with the adviser that provides ongoing services to the registrant (together, "Adviser Related Entities") for services that were related directly to the operations and financial reporting of the registrant. |
| (c) | Tax Fees. The aggregate fees billed to the registrant for each of the last two fiscal years for professional services provided by the registrant's Accountant for tax compliance, tax advice and tax planning were as follows: |
| FYE | Fees | ||||
| 10/31/2013 | $15,000 | ||||
| 10/31/2012 | $15,000 |
For the last two fiscal years of the registrant, there were no tax fees billed by the registrant's Accountant to Adviser Related Entities for services that were related directly to the operations and financial reporting of the registrant.
| (d) | All Other Fees. All Other Fees are fees related to services other than those reported above under "Audit Fees," "Audit-Related Fees," and "Tax Fees." For each of the registrant’s last two fiscal years, no such fees were billed by the registrant's Accountant to the registrant or to Adviser Related Entities for services related directly to the operations and financial reporting of the registrant. |
| (e)(1) | The audit committee's pre-approval policies and procedures are as follows: Generally, the registrant’s audit committee must approve (a) all audit and permissible non-audit services to be provided to the registrant and (b) all permissible non-audit services to be provided by the principal accountant to the registrant’s investment adviser or any entity controlling, controlled by, or under common control with the investment adviser that provides ongoing services to the registrant, if the engagement relates directly to the operations and financial reporting of the registrant. The Chairman of the audit committee is authorized to pre-approve the provision of additional non-audit services, including tax services, provided that the Chairman reports his decision at the next succeeding audit committee meeting. |
| (e)(2) | No services described in paragraphs (b) through (d) of this Item were approved by the registrant’s audit committee pursuant to paragraph (c)(7)(i)(C) of Rule 2-01 of Regulation S-X. |
| (f) | Not applicable |
| (g) | The aggregate non-audit fees billed by the registrant's Accountant, for the Trust's last two fiscal years, for services rendered to the registrant and Adviser Related Entities are shown in the table below: |
| Non-Audit Fees | |||
| Non-Audit Fees | for Adviser | Aggregate | |
| for Registrant | Related Entities | Non-Audit Fees | |
| FYE | |||
| October 31, 2013 | None | None | None |
| October 31, 2012 | None | None | None |
| (h) | Not applicable. |
Item 5. Audit Committee of Listed Registrants.
Not applicable.
Item 6. Schedule of Investments.
The registrant’s “Schedule I – Investments in securities of unaffiliated issuers” (as set forth in 17 CFR 210.12-12) is included in Item 1 of this Form N-CSR.
Item 7. Disclosure of Proxy Voting Policies and Procedures for Closed-End Management Investment Companies.
Not applicable.
Item 8. Portfolio Managers of Closed-End Management Investment Companies.
Not applicable.
Item 9. Purchases of Equity Securities by Closed-End Management Investment Company and Affiliated Purchases.
Not applicable.
Item 10. Submission of Matters to a Vote of Security Holders.
There have been no material changes to the procedures by which shareholders may recommend nominees to the Trust's Board of Trustees since the Trust last provided disclosure as to such procedures in response to the requirements of Item 407(c)(2)(iv) of Regulation S-K (as required by Item 22(b)(15) of Schedule 14A), or this Item.
Item 11. Controls and Procedures.
| (a) | The registrant's principal executive officer and principal financial officer, after evaluating the effectiveness of the registrant's "disclosure controls and procedures" (as defined in the Investment Company Act of 1940 Rule 30-a-2(c) under the Act (17 CFR 270.30a-2(c))) as of a date (the "Evaluation Date") within 90 days of the filing date of this report, have concluded that, as of the Evaluation Date, the registrant's disclosure controls and procedures were adequately designed to ensure that the information required to be disclosed by the registrant in this Form N-CSR is recorded, processed, summarized and reported within the time periods specified in the Commission's rules and forms. |
| (b) | There were no changes in the registrant's internal control over financial reporting (as defined in Rule 30a-3(d) under the Act (17 CFR 270.30a-3(d))) that occurred during the registrant's second fiscal quarter of the period covered by this report that has materially affected, or is reasonably likely to materially affect, the registrant's internal control over financial reporting. |
Items 12. Exhibits.
(a)(1) Registrant's Code of Ethics required to be disclosed under Item 2 hereof is filed and attached hereto as Exhibit 99.CODE ETH.
(a)(2) Certification pursuant to Rule 30a-2(a) under the Investment Company Act of 1940 (17 CFR 270.30a-2(a)) is filed and attached hereto as Exhibit 99.302CERT.
(b) Certification pursuant to Rule 30a-2(b) under the Investment Company Act of 1940 (17 CFR 270.30a-2(b)) is filed and attached hereto as Exhibit 99.906CERT
SIGNATURES
Pursuant to the requirements of the Securities Exchange Act of 1934 and the Investment Company Act of 1940, the registrant has duly caused this report to be signed on its behalf by the undersigned, thereunto duly authorized.
Century Capital Management Trust
By: /s/ Alexander L. Thorndike
Alexander L. Thorndike, Chairman
Date: January 7, 2014
Pursuant to the requirements of the Securities Exchange Act of 1934 and the Investment Company Act of 1940, this report has been signed below by the following persons on behalf of the registrant and in the capacities and on the dates indicated.
By: /s/ Alexander L. Thorndike
Alexander L. Thorndike, Principal Executive Officer
Date: January 7, 2014
By: /s/ Julie Smith
Julie Smith, Principal Financial Officer
Date: January 7, 2014