| | | | | |
Zions Bancorporation, N.A.
One South Main
Salt Lake City, UT 84133
October 18, 2021 | |
| www.zionsbancorporation.com |
Third Quarter 2021 Financial Results: FOR IMMEDIATE RELEASE
Investor and Media Contact: James Abbott (801) 844-7637
| | |
| Zions Bancorporation, N.A. reports: 3Q21 Net Earnings of $234 million, diluted EPS of $1.45 |
compared with 3Q20 Net Earnings of $167 million, diluted EPS of $1.01,
and 2Q21 Net Earnings of $345 million, diluted EPS of $2.08 |
|
THIRD QUARTER RESULTS
| | | | | | | | | | | | | | | | | | | | |
| $1.45 | | $234 million | | 2.68% | | 10.9% |
Net earnings per diluted common share | | Net Earnings | | Net interest margin (“NIM”) | | Common Equity
Tier 1 |
| | | | | | | | |
| THIRD QUARTER HIGHLIGHTS¹ |
| | |
| Net Interest Income and NIM | • | Net interest income remained stable at $555 million |
| • | NIM was 2.68%, compared with 3.06%, and continued to be significantly impacted by low interest rates and higher average money market balances of $12.7 billion, compared with $3.1 billion |
| Operating Performance | • | Pre-provision net revenue ("PPNR") was $272 million, down 2%, and adjusted PPNR² was $290 million, up 9% |
| • | Noninterest expense was $429 million, down 3%, and adjusted noninterest expense² was $432 million, down 2% |
| • | The efficiency ratio² was 59.8%, compared with 62.2% |
| | |
| Loans and Credit Quality | • | Loans and leases were $50.7 billion, down $4.1 billion, or 7%; excluding PPP, loans and leases were $47.6 billion, down $0.3 billion, or 1% |
| • | Nonperforming assets3 were $324 million, or 0.7%, of loans (ex-PPP), compared with $372 million, or 0.8%, of loans (ex-PPP) |
| • | The provision for credit losses was a negative $46 million, compared with a positive $55 million |
| • | The allowance for credit losses was 1.1% of loans (ex-PPP), compared with 1.9% of loans (ex-PPP) |
| |
| Capital | • | The CET1 capital ratio was 10.9%, compared with 10.4% |
| • | Common stock repurchases of $325 million, 5.8 million shares, or 3.6% of shares outstanding as of June 30, 2021 |
| | |
| Notable items | • | Net unrealized loss related to SBIC investment in Recursion Pharmaceuticals, Inc. of $24 million ($28 million fair value adjustment less $4 million reversal of an accrued success fee), compared with a net unrealized gain of $54 million ($63 million fair value adjustment less $9 million success fee accrual) in second quarter of 2021 |
| • | About 19,000 PPP loans were forgiven by the SBA, totaling $1.5 billion, which contributed $41 million of interest income through accelerated recognition of net unamortized deferred fees |
| • | Deposits were $77.9 billion, up $10.8 billion, or 16%, resulting in a loan-to-deposit ratio of 65% |
| | |
| CEO COMMENTARY |
|
Harris H. Simmons, Chairman and CEO of Zions Bancorporation, commented, “We are pleased with the quarter’s financial results. Following several quarters of weak loan demand, we’re particularly encouraged by the loan growth we reported during the quarter, which, excluding PPP loans, was 5.6% on an annualized basis. We also reported continued strong deposit growth at an annualized pace of 9.3%. Credit outcomes remained strong, with net recoveries at an annualized 0.01% of total loans, and one of the lowest gross charge-off rates in a number of years. These positive outcomes, together with an improving economic outlook, produced a $46 million reversal of loss reserves into income.”
Mr. Simmons continued, “We’re optimistic that, despite lingering supply chain issues and a tight labor market, the economy seems poised for continued growth over the next several quarters as, thanks to a great deal of government stimulus, consumers and most businesses are emerging from the pandemic in relatively strong condition.” |
|
|
OPERATING PERFORMANCE3 |
1 Comparisons noted in the bullet points are calculated for the current quarter versus the same prior-year period, unless otherwise specified.
2 Adjusted PPNR for the third quarter of 2020 included a one-time $30 million charitable contribution, and when excluded, PPNR was $307 million and adjusted PPNR was $297 million. For information on non-GAAP financial measures, see pages 15-17.
3 Does not include banking premises held for sale.
4 EPS calculations assume a 24.5% statutory tax rate.
ZIONS BANCORPORATION, N.A.
Press Release – Page 2
October 18, 2021
Comparisons noted in the sections below are calculated for the current quarter versus the same prior-year period, unless otherwise specified. Growth rates of 100% or more are considered not meaningful (“NM”) as they are generally reflective of a low initial starting point.
RESULTS OF OPERATIONS
| | | | | | | | | | | | | | | | | | | | | | | | | | | | | | | | | | | | | | | | | |
| Net Interest Income and Margin |
| | | | | | | 3Q21 - 2Q21 | | 3Q21 - 3Q20 |
| (In millions) | 3Q21 | | 2Q21 | | 3Q20 | | $ | | % | | $ | | % |
| Interest and fees on loans | $ | 484 | | $ | 492 | | $ | 505 | | $ | (8) | | | (2) | % | | $ | (21) | | | (4) | % |
| Interest on money market investments | 7 | | 4 | | 2 | | 3 | | | 75 | | | 5 | | | NM |
| Interest on securities | 78 | | 74 | | 74 | | 4 | | | 5 | | | 4 | | | 5 | |
| Total interest income | 569 | | 570 | | 581 | | (1) | | | — | | | (12) | | | (2) | |
| Interest on deposits | 7 | | 7 | | 18 | | — | | | — | | | (11) | | | (61) | |
| Interest on short- and long-term borrowings | 7 | | 8 | | 8 | | (1) | | | (13) | | | (1) | | | (13) | |
| Total interest expense | 14 | | 15 | | 26 | | (1) | | | (7) | | | (12) | | | (46) | |
| Net interest income | $ | 555 | | $ | 555 | | $ | 555 | | $ | — | | | — | | | $ | — | | | — | |
| | | | | | | bps | | | | bps | | |
Yield on interest-earning assets1 | 2.75 | % | | 2.86 | % | | 3.20 | % | | (11) | | | | | (45) | | | |
Rate paid on total deposits and interest-bearing liabilities1 | 0.07 | % | | 0.08 | % | | 0.15 | % | | (1) | | | | | (8) | | | |
Cost of total deposits1 | 0.03 | % | | 0.04 | % | | 0.11 | % | | (1) | | | | | (8) | | | |
Net interest margin1 | 2.68 | % | | 2.79 | % | | 3.06 | % | | (11) | | | | | (38) | | | |
1 Rates are calculated using amounts in thousands and taxable-equivalent rates are used where applicable.
Net interest income remained stable at $555 million in the third quarter of 2021. Total interest income decreased $12 million, or 2%, primarily due to a $21 million decrease in interest and fees on loans, partially offset by a $5 million increase in interest on money market investments, and a $4 million increase in interest on securities. The decrease in total interest income was primarily attributable to the low interest rate environment. Interest expense decreased $12 million, or 46%, largely due to an $11 million decline in interest paid on deposits, which was also attributable to low interest rates.
The net interest margin was 2.68%, compared with 3.06% in the same prior year period. The yield on average interest-earning assets was 2.75% in the third quarter of 2021, a decrease of 45 basis points, compared with the same prior year quarter. Average money market investments, including short-term deposits held at the Federal Reserve, increased to 15.3% of average interest-earning assets, compared with 4.3% in the same prior year period. This increase had a significant dilutive effect on the net interest margin.
Average interest-earning assets included $3.8 billion of Small Business Administration (“SBA”) Paycheck Protection Program (“PPP”). During the third quarter of 2021, about 19,000 PPP loans, totaling $1.5 billion, received forgiveness by the SBA. Total interest income from PPP loans was $63 million during the third quarter of 2021, of which, $41 million was related to accelerated recognition of net unamortized deferred fees on these loans due to forgiveness. At September 30, 2021, unamortized net origination fees related to the PPP loans totaled approximately $83 million.
The yield on loans increased 14 basis points from the third quarter of 2020, primarily due to accelerated amortization of deferred fees on forgiven PPP loans. Excluding PPP loans, the yield on loans decreased 18 basis points from the third quarter of 2020. The yield on non-PPP loans originated during the third quarter of 2021 was moderately less than the yield on loans maturing or otherwise paying down. The yield on securities decreased 41 basis points from the third quarter of 2020, primarily due to lower yields on re-investment of principal payments and other purchases throughout the previous four quarters.
ZIONS BANCORPORATION, N.A.
Press Release – Page 3
October 18, 2021
The annualized cost of total deposits for the third quarter of 2021 was 0.03%, compared with 0.11% for the third quarter of 2020. The rate paid on total deposits and interest-bearing liabilities was 0.07%, a decrease from 0.15% during the third quarter of 2020, which was primarily due to low deposit rates and strong noninterest bearing deposit growth. Average noninterest bearing deposits as a percentage of total deposits were 50% for the third quarter of 2021, compared with 46% for the same prior year period.
| | | | | | | | | | | | | | | | | | | | | | | | | | | | | | | | | | | | | | | | | |
| Noninterest Income |
| | | | | | | 3Q21 - 2Q21 | | 3Q21 - 3Q20 |
| (In millions) | 3Q21 | | 2Q21 | | 3Q20 | | $ | | % | | $ | | % |
| Commercial account fees | $ | 34 | | | $ | 34 | | | $ | 32 | | | $ | — | | | — | % | | $ | 2 | | | 6 | % |
| Card fees | 25 | | | 24 | | | 21 | | | 1 | | | 4 | | | 4 | | | 19 | |
| Retail and business banking fees | 20 | | | 18 | | | 17 | | | 2 | | | 11 | | | 3 | | | 18 | |
| Loan-related fees and income | 27 | | | 21 | | | 32 | | | 6 | | | 29 | | | (5) | | | (16) | |
| Capital markets and foreign exchange fees | 17 | | | 17 | | | 16 | | | — | | | — | | | 1 | | | 6 | |
| Wealth management fees | 13 | | | 12 | | | 10 | | | 1 | | | 8 | | | 3 | | | 30 | |
| Other customer-related fees | 15 | | | 13 | | | 11 | | | 2 | | | 15 | | | 4 | | | 36 | |
| Customer-related fees | 151 | | | 139 | | | 139 | | | 12 | | | 9 | | | 12 | | | 9 | |
| Fair value and nonhedge derivative income (loss) | 2 | | | (5) | | | 8 | | | 7 | | | NM | | (6) | | | (75) | |
| Dividends and other income | 9 | | | 8 | | | 6 | | | 1 | | | 13 | | | 3 | | | 50 | |
| Securities gains (losses), net | (23) | | | 63 | | | 4 | | | (86) | | | NM | | (27) | | | NM |
| Total noninterest income | $ | 139 | | | $ | 205 | | | $ | 157 | | | $ | (66) | | | (32) | | | $ | (18) | | | (11) | |
Total customer-related fees increased $12 million to $151 million from the prior year quarter, primarily due to improved customer transaction volume, new client activity, and deepening of existing client relationships. Loan-related fees and income decreased $5 million, primarily due to a decline in our residential mortgage originations held for sale.
Securities gains and losses decreased $27 million from the third quarter of 2020, largely as a result of a $28 million unrealized loss (compared with a $63 million unrealized gain in the second quarter of 2021) relating to our SBIC investment in Recursion Pharmaceuticals, Inc. This investment will continue to be marked-to-market until the SBIC fund manager divests of the shares, which are subject to a minimum 180-day lock-up period from the initial offering in April 2021. During the second quarter of 2021, we accrued an associated success fee of $9 million in other noninterest expense, and reversed $4 million of this accrual during the current quarter based on the fair value of the investment.
We recognized a $2 million gain related to a credit valuation adjustment (“CVA”) on client-related interest rate swaps, compared with a $8 million CVA gain in the third quarter of 2020. The CVA gain for the current quarter was primarily due to improvements in the credit quality of our clients with interest rate swaps, as well as changes in interest rates, which decreased the value of, and our credit exposure to, the client-related interest rate swaps.
ZIONS BANCORPORATION, N.A.
Press Release – Page 4
October 18, 2021
| | | | | | | | | | | | | | | | | | | | | | | | | | | | | | | | | | | | | | | | | |
| Noninterest Expense |
| | | | | | | 3Q21 - 2Q21 | | 3Q21 - 3Q20 |
| (In millions) | 3Q21 | | 2Q21 | | 3Q20 | | $ | | % | | $ | | % |
| Salaries and employee benefits | $ | 285 | | | $ | 272 | | | $ | 269 | | | $ | 13 | | | 5 | % | | $ | 16 | | | 6 | % |
| Occupancy, net | 33 | | | 33 | | | 33 | | | — | | | — | | | — | | | — | |
| Furniture, equipment and software, net | 31 | | | 32 | | | 32 | | | (1) | | | (3) | | | (1) | | | (3) | |
| Other real estate expense, net | — | | | — | | | — | | | — | | | — | | | — | | | — |
| Credit-related expense | 7 | | | 6 | | | 6 | | | 1 | | | 17 | | | 1 | | | 17 | |
| Professional and legal services | 16 | | | 17 | | | 12 | | | (1) | | | (6) | | | 4 | | | 33 | |
| Advertising | 4 | | | 4 | | | 7 | | | — | | | — | | | (3) | | | (43) | |
| FDIC premiums | 5 | | | 6 | | | 7 | | | (1) | | | (17) | | | (2) | | | (29) | |
| Other | 48 | | | 58 | | | 76 | | | (10) | | | (17) | | | (28) | | | (37) | |
| Total noninterest expense | $ | 429 | | | $ | 428 | | | $ | 442 | | | $ | 1 | | | — | | | $ | (13) | | | (3) | |
Adjusted noninterest expense 1 | $ | 432 | | | $ | 419 | | | $ | 440 | | | $ | 13 | | | 3 | | | $ | (8) | | | (2) | |
1 For information on non-GAAP financial measures, see pages 15-17.
Noninterest expense declined $13 million, when compared with the third quarter of 2020. The decline was largely attributable to a $28 million decrease in other noninterest expense that was primarily due to a $30 million donation to our charitable foundation during the third quarter of 2020, which was related to the origination fees earned on PPP loans. Salaries and benefits expense increased $16 million, or 6%, primarily due to higher incentive compensation and profit sharing as a result of improved profitability. Professional and legal services expense increased $4 million, or 33%, mainly due to various technology-related and other outsourced services.
Adjusted noninterest expense decreased $8 million, or 2%, to $432 million, compared with $440 million for the same prior year quarter, primarily due to the decrease in other noninterest expense previously discussed. The efficiency ratio was 59.8%, compared with 62.2% for the third quarter of 2020. For information on non-GAAP financial measures, including differences between noninterest expense and adjusted noninterest expense, see pages 15-17.
BALANCE SHEET ANALYSIS
| | | | | | | | | | | | | | | | | | | | | | | | | | | | | | | | | | | | | | | | | |
| Asset Quality |
| | | | | | | 3Q21 - 2Q21 | | 3Q21 - 3Q20 |
| (In millions) | 3Q21 | | 2Q21 | | 3Q20 | | bps | | | | bps | | |
Ratio of nonperforming assets1 to loans and leases and other real estate owned | 0.64 | % | | 0.60 | % | | 0.68 | % | | 4 | | | | | (4) | | | |
| Annualized ratio of net loan and lease charge-offs to average loans | (0.01) | % | | (0.02) | % | | 0.38 | % | | 1 | | | | | (39) | | | |
Ratio of total allowance for credit losses to loans1 and leases outstanding, at period end | 1.04 | % | | 1.12 | % | | 1.68 | % | | (8) | | | | | (64) | | | |
Ratio of total allowance for credit losses to loans1 and leases outstanding (excluding PPP loans), at period end | 1.11 | % | | 1.22 | % | | 1.91 | % | | (11) | | | | | (80) | | | |
| | | | | | | $ | | % | | $ | | % |
| Classified loans | $ | 1,397 | | $ | 1,557 | | $ | 1,639 | | $ | (160) | | | (10)% | | $ | (242) | | | (15)% |
Nonperforming assets2 | 324 | | 308 | | 372 | | 16 | | | 5 | | (48) | | | (13) |
| Net loan and lease charge-offs (recoveries) | (1) | | (2) | | 52 | | 1 | | | 50 | | (53) | | | NM |
| Provision for credit losses | (46) | | (123) | | 55 | | 77 | | | 63 | | (101) | | | NM |
1 Does not include loans held for sale.
2 Does not include banking premises held for sale.
ZIONS BANCORPORATION, N.A.
Press Release – Page 5
October 18, 2021
Net loan and lease recoveries were $1 million in the third quarter of 2021, compared with net charge-offs of $52 million in the prior year quarter. The ratio of nonaccrual loans and accruing loans past due 90 days or more to loans and leases (ex-PPP) was 0.69%, compared with 0.78% for the third quarter of 2020, and the ratio of classified loans to total loans and leases (ex-PPP) was 2.9%, compared with 3.4%, for the prior year quarter.
We recorded a negative $46 million provision for credit losses, compared with a positive $55 million provision for the third quarter of 2020. The allowance for credit losses (“ACL”) was $529 million at September 30, 2021, compared with $917 million at September 30, 2020. The decrease in the ACL was due largely to improvements in economic forecasts and credit quality, compared with the economic stress caused by the COVID-19 pandemic in the prior year period. The ratio of total ACL to total loans and leases (ex-PPP) was 1.11% at September 30, 2021, compared with 1.91% at September 30, 2020.
| | | | | | | | | | | | | | | | | | | | | | | | | | | | | | | | | | | | | | | | | |
| Loans and Leases |
| | | | | | | 3Q21 - 2Q21 | | 3Q21 - 3Q20 |
| (In millions) | 3Q21 | | 2Q21 | | 3Q20 | | $ | | % | | $ | | % |
| Loans held for sale | $ | 67 | | | $ | 66 | | | $ | 89 | | | $ | 1 | | | 2% | | $ | (22) | | | (25)% |
| Loans and leases: | | | | | | | | | | | | | |
Commercial – excluding PPP loans | 25,369 | | | 24,700 | | | 24,704 | | | 669 | | | 3 | | 665 | | | 3 |
Commercial – PPP loans | 3,080 | | | 4,461 | | | 6,810 | | | (1,381) | | | (31) | | (3,730) | | | (55) |
| Commercial real estate | 12,153 | | | 12,108 | | | 12,027 | | | 45 | | | — | | 126 | | | 1 |
| Consumer | 10,076 | | | 10,129 | | | 11,204 | | | (53) | | | (1) | | (1,128) | | | (10) |
| Loans and leases, net of unearned income and fees | 50,678 | | | 51,398 | | | 54,745 | | | (720) | | | (1) | | (4,067) | | | (7) |
| Less allowance for loan losses | 491 | | | 535 | | | 853 | | | (44) | | | (8) | | (362) | | | (42) |
| Loans and leases held for investment, net of allowance | $ | 50,187 | | | $ | 50,863 | | | $ | 53,892 | | | $ | (676) | | | (1) | | $ | (3,705) | | | (7) |
| | | | | | | | | | | | | |
| Unfunded lending commitments and letters of credit | $ | 26,138 | | | $ | 25,689 | | | $ | 24,845 | | | $ | 449 | | | 2 | | $ | 1,293 | | | 5 |
Loans and leases, net of unearned income and fees, decreased $4.1 billion, or 7%, to $50.7 billion at September 30, 2021, from $54.7 billion at September 30, 2020, primarily due to the forgiveness of PPP loans. Excluding PPP loans, total loans and leases decreased $0.3 billion, or 1%, to $47.6 billion at September 30, 2021. Within commercial loans, a $0.7 billion increase in municipal loans and a $0.3 billion increase in owner occupied loans were partially offset by a $0.3 billion decrease in commercial and industrial loans. Commercial real estate construction and land development loans increased $0.5 billion. Consumer 1-4 family residential mortgage loans decreased $1.1 billion, primarily due to continued refinancing activity. Unfunded lending commitments and letters of credit increased $1.3 billion, or 5%, to $26.1 billion at September 30, 2021, primarily due to growth in our home equity credit line and commercial and industrial loan portfolios as well as a decrease in commitment utilization.
| | | | | | | | | | | | | | | | | | | | | | | | | | | | | | | | | | | | | | | | | |
| Deposits and Borrowed Funds |
| | | | | | | 3Q21 - 2Q21 | | 3Q21 - 3Q20 |
| (In millions) | 3Q21 | | 2Q21 | | 3Q20 | | $ | | % | | $ | | % |
| Noninterest-bearing demand | $ | 39,150 | | | $ | 38,128 | | | $ | 31,338 | | | $ | 1,022 | | | 3 | % | | $ | 7,812 | | | 25 | % |
| Interest-bearing: | | | | | | | | | | | | | |
| Savings and money market | 37,046 | | | 36,037 | | | 32,305 | | | 1,009 | | | 3 | | | 4,741 | | | 15 | |
| Time | 1,688 | | | 1,940 | | | 3,451 | | | (252) | | | (13) | | | (1,763) | | | (51) | |
| | | | | | | | | | | | | |
| Total deposits | $ | 77,884 | | | $ | 76,105 | | | $ | 67,094 | | | $ | 1,779 | | | 2 | | | $ | 10,790 | | | 16 | |
| Borrowed funds: | | | | | | | | | | | | | |
| Federal funds purchased and other short-term borrowings | $ | 579 | | | $ | 741 | | | $ | 1,252 | | | $ | (162) | | | (22) | | | $ | (673) | | | (54) | |
| Long-term debt | 1,020 | | | 1,308 | | | 1,347 | | | (288) | | | (22) | | | (327) | | | (24) | |
| Total borrowed funds | $ | 1,599 | | | $ | 2,049 | | | $ | 2,599 | | | $ | (450) | | | (22) | | | $ | (1,000) | | | (38) | |
ZIONS BANCORPORATION, N.A.
Press Release – Page 6
October 18, 2021
Total deposits increased $10.8 billion, or 16%, to $77.9 billion at September 30, 2021, primarily due to a $7.8 billion increase in noninterest-bearing deposits. Average total deposits increased to $77.4 billion, compared with $66.5 billion for the third quarter of 2020. Average noninterest-bearing deposits increased 24% to $38.3 billion, from $30.8 billion for the prior year quarter, and were 50% and 46% of average total deposits, respectively, for the same periods.
Total borrowed funds decreased $1.0 billion, or 38%, to $1.6 billion at September 30, 2021. Average borrowed funds decreased to $1.8 billion, compared with $2.4 billion for the prior year quarter. The decrease in long-term debt was primarily due to the maturity of $281 million of 3-year, 3.50% senior notes during the current quarter. The decrease in overall borrowed funds continues to reflect less reliance on federal funds purchased and other short-term borrowings due to strong deposit growth, which significantly exceeded earning asset growth over this period.
| | | | | | | | | | | | | | | | | | | | | | | | | | | | | | | | | | | | | | | | | |
| Shareholders’ Equity |
| | | | | | | 3Q21 - 2Q21 | | 3Q21 - 3Q20 |
| (In millions, except share data) | 3Q21 | | 2Q21 | | 3Q20 | | $ | | % | | $ | | % |
| Shareholders’ equity: | | | | | | | | | | | | | |
| Preferred stock | $ | 440 | | $ | 440 | | $ | 566 | | $ | — | | | — | % | | $ | (126) | | | (22) | % |
| Common stock and additional paid-in capital | 2,245 | | 2,565 | | 2,680 | | (320) | | | (12) | | | (435) | | | (16) | |
| Retained earnings | 5,025 | | 4,853 | | 4,090 | | 172 | | | 4 | | | 935 | | | 23 | |
| Accumulated other comprehensive income | 64 | | 175 | | 332 | | (111) | | | (63) | | | (268) | | | (81) | |
| Total shareholders' equity | $ | 7,774 | | $ | 8,033 | | $ | 7,668 | | $ | (259) | | | (3) | | | $ | 106 | | | 1 | |
| Capital distributions: | | | | | | | | | | | | | |
| Common dividends paid | $ | 62 | | $ | 56 | | $ | 56 | | $ | 6 | | | 11 | | $ | 6 | | | 11 |
| Bank common stock repurchased | 325 | | 100 | | 50 | | 225 | | | NM | | 275 | | | NM |
| Total capital distributed to common shareholders | $ | 387 | | $ | 156 | | $ | 106 | | $ | 231 | | | NM | | $ | 281 | | | NM |
| | | | | | | | | | | | | |
| | | | | | | shares | | % | | shares | | % |
| Weighted average diluted common shares outstanding (in thousands) | 160,480 | | 163,054 | | 163,779 | | (2,574) | | (2) | % | | (3,299) | | (2) | % |
| Common shares outstanding, at period end (in thousands) | 156,530 | | 162,248 | | 164,009 | | (5,718) | | (4) | | | (7,479) | | (5) | |
| | | | | | | | | | | | | |
| | | | | | | | | | | | | |
During the third quarter of 2021, the common stock dividend increased to $0.38 per share, from $0.34 during the prior year quarter. Weighted average diluted shares outstanding decreased 3.3 million from the third quarter of 2020, primarily due to share repurchases. During the third quarter of 2021, we repurchased 5.8 million common shares outstanding for $325 million, which is equivalent to 3.6% of common stock outstanding as of June 30, 2021.
Preferred stock decreased $126 million due to the redemption of the outstanding shares of our 5.75% Series H Non-Cumulative Perpetual Preferred Stock at par value during the second quarter of 2021. Accumulated other comprehensive income decreased $268 million to $64 million at September 30, 2021, primarily due to decreases in the fair value of available-for-sale securities as a result of changes in interest rates.
Tangible book value per common share increased to $40.37 at September 30, 2021, compared with $37.11 at September 30, 2020. Basel III common equity tier 1 (“CET1”) capital was $6.2 billion at September 30, 2021 and $5.8 billion at September 30, 2020. The estimated Basel III CET1 capital ratio was 10.9% at September 30, 2021, compared with 10.4% at September 30, 2020. For information on non-GAAP financial measures, see pages 15-17.
Supplemental Presentation and Conference Call
Zions has posted a supplemental presentation to its website, which will be used to discuss these third quarter results at 5:30 p.m. ET this afternoon (October 18, 2021). Media representatives, analysts, investors, and the public are invited to join this discussion by calling (253) 237-1247 (domestic and international) and entering the passcode 7682874, or via on-demand webcast. A link to the webcast will be available on the Zions Bancorporation website at zionsbancorporation.com. The webcast of the conference call will also be archived and available for 30 days.
ZIONS BANCORPORATION, N.A.
Press Release – Page 7
October 18, 2021
About Zions Bancorporation, N.A.
Zions Bancorporation, N.A. is one of the nation's premier financial services companies with annual net revenue of $2.8 billion in 2020 and more than $85 billion of total assets. Zions operates under local management teams and distinct brands in 11 western states: Arizona, California, Colorado, Idaho, Nevada, New Mexico, Oregon, Texas, Utah, Washington, and Wyoming. The Bank is a consistent recipient of national and state-wide customer survey awards in small and middle-market banking, as well as a leader in public finance advisory services and Small Business Administration lending, recently ranking as the tenth largest provider in the U.S. of the SBA’s Paycheck Protection Program loans (including both rounds). In addition, Zions is included in the S&P 500 and NASDAQ Financial 100 indices. Investor information and links to local banking brands can be accessed at zionsbancorporation.com. Forward-Looking Information
This earnings release includes “forward-looking statements” as that term is defined in the Private Securities Litigation Reform Act of 1995. These statements are based on management’s current expectations and assumptions regarding future events or determinations, all of which are subject to known and unknown risks, uncertainties and other factors that may cause our actual results, performance or achievements, industry trends, and results or regulatory outcomes to differ materially from those expressed or implied. Forward-looking statements include, among others:
•statements with respect to the beliefs, plans, objectives, goals, targets, commitments, designs, guidelines, expectations, anticipations, and future financial condition, results of operations and performance of Zions Bancorporation, National Association and its subsidiaries (collectively “Zions Bancorporation, N.A.,” “the Bank,” “we,” “our,” “us”); and
•statements preceded by, followed by, or that include the words “may,” “might,” “can,” “continue,” “could,” “should,” “would,” “believe,” “anticipate,” “estimate,” “forecasts,” “expect,” “intend,” “target,” “commit,” “design,” “plan,” “projects,” “will,” and the negative thereof and similar words and expressions.
These forward-looking statements are not guarantees, nor should they be relied upon as representing management’s
views as of any subsequent date. Actual results and outcomes may differ materially from those presented.
Although this list is not comprehensive, important factors that may cause such material differences include changes
in general economic and industry conditions; changes and uncertainties in legislation and fiscal, monetary,
regulatory, trade and tax policies; changes in interest rates and uncertainty regarding the transition away from the
London Interbank Offered Rate (“LIBOR”) toward other reference rates; the quality and composition of our loan
and securities portfolios; competitive pressures and other factors that may affect aspects of our business, such as
pricing and demand for our products and services; our ability to execute our strategic plans, manage our risks, and
achieve our business objectives; our ability to develop and maintain information security systems and controls
designed to guard against fraud, cyber, and privacy risks; and the effects of the COVID-19 pandemic or other
national or international crises or conflicts that may occur in the future and governmental responses to such matters.
These factors, risks, and uncertainties, among others, are discussed in our 2020 Form 10-K and subsequent filings
with the Securities and Exchange Commission (SEC) and are available at the SEC’s Internet site (https://www.sec.gov/). In addition, you may obtain documents filed with the SEC by the Bank free of charge by contacting: Investor Relations, Zions Bancorporation, N.A., One South Main Street, 16th Floor, Salt Lake City, Utah 84133, (801) 844-7637.
We caution against the undue reliance on forward-looking statements, which reflect our views only as of the date
they are made. Except to the extent required by law, we specifically disclaim any obligation to update any factors or
to publicly announce the revisions to any of the forward-looking statements included herein to reflect future events
or developments.
ZIONS BANCORPORATION, N.A.
Press Release – Page 8
October 18, 2021
FINANCIAL HIGHLIGHTS
(Unaudited)
| | | | | | | | | | | | | | | | | | | | | | | | | | | | | |
| Three Months Ended |
| (In millions, except share, per share, and ratio data) | September 30,
2021 | | June 30,
2021 | | March 31,
2021 | | December 31,
2020 | | September 30,
2020 |
BALANCE SHEET 1 | | | | | | | | | |
| Loans held for investment, net of allowance | $ | 50,187 | | $ | 50,863 | | $ | 52,826 | | $ | 52,699 | | $ | 53,892 |
| Total assets | 88,306 | | 87,208 | | 85,121 | | 81,479 | | 78,357 |
| Deposits | 77,884 | | 76,105 | | 73,853 | | 69,653 | | 67,094 |
| Total shareholders’ equity | 7,774 | | 8,033 | | 7,933 | | 7,886 | | 7,668 |
| STATEMENT OF INCOME | | | | | | | | | |
| Net earnings applicable to common shareholders | $ | 234 | | $ | 345 | | $ | 314 | | $ | 275 | | $ | 167 |
| Net interest income | 555 | | 555 | | 545 | | 550 | | 555 |
Taxable-equivalent net interest income 2 | 562 | | 562 | | 553 | | 557 | | 562 |
| Total noninterest income | 139 | | 205 | | 169 | | 166 | | 157 |
| Total noninterest expense | 429 | | 428 | | 435 | | 424 | | 442 |
Adjusted pre-provision net revenue 2 | 290 | | 290 | | 253 | | 280 | | 267 |
| Provision for credit losses | (46) | | (123) | | (132) | | (67) | | 55 |
| SHARE AND PER COMMON SHARE AMOUNTS | | | | | | | | | |
| Net earnings per diluted common share | $ | 1.45 | | $ | 2.08 | | $ | 1.90 | | $ | 1.66 | | $ | 1.01 |
| Dividends | 0.38 | | 0.34 | | 0.34 | | 0.34 | | 0.34 |
Book value per common share 1 | 46.85 | | 46.80 | | 44.98 | | 44.61 | | 43.30 |
Tangible book value per common share 1, 2 | 40.37 | | 40.54 | | 38.77 | | 38.42 | | 37.11 |
| Weighted average share price | 54.78 | | 55.86 | | 51.34 | | 36.86 | | 32.09 |
| Weighted average diluted common shares outstanding (in thousands) | 160,480 | | 163,054 | | 163,887 | | 163,900 | | 163,779 |
Common shares outstanding (in thousands) 1 | 156,530 | | 162,248 | | 163,800 | | 164,090 | | 164,009 |
| SELECTED RATIOS AND OTHER DATA | | | | | | | | | |
| Return on average assets | 1.08 | % | | 1.65 | % | | 1.57 | % | | 1.41 | % | | 0.89 | % |
| Return on average common equity | 12.3 | % | | 18.6 | % | | 17.4 | % | | 15.3 | % | | 9.4 | % |
Return on average tangible common equity 2 | 14.2 | % | | 21.6 | % | | 20.2 | % | | 17.8 | % | | 11.0 | % |
| Net interest margin | 2.68 | % | | 2.79 | % | | 2.86 | % | | 2.95 | % | | 3.06 | % |
| Cost of total deposits, annualized | 0.03 | % | | 0.04 | % | | 0.05 | % | | 0.08 | % | | 0.11 | % |
Efficiency ratio 2 | 59.8 | % | | 59.1 | % | | 63.5 | % | | 60.2 | % | | 62.2 | % |
| Effective tax rate | 22.8 | % | | 22.2 | % | | 21.7 | % | | 20.9 | % | | 18.6 | % |
| Ratio of nonperforming assets to loans and leases and other real estate owned | 0.64 | % | | 0.60 | % | | 0.61 | % | | 0.69 | % | | 0.68 | % |
| Annualized ratio of net loan and lease charge-offs to average loans | (0.01) | % | | (0.02) | % | | 0.06 | % | | 0.11 | % | | 0.38 | % |
Ratio of total allowance for credit losses to loans and leases outstanding 1 | 1.04 | % | | 1.12 | % | | 1.30 | % | | 1.56 | % | | 1.68 | % |
| Full-time equivalent employees | 9,641 | | 9,727 | | 9,682 | | 9,678 | | 9,726 |
CAPITAL RATIOS AND DATA 1 | | | | | | | | | |
Common equity tier 1 capital 3 | $ | 6,236 | | $ | 6,383 | | $ | 6,206 | | $ | 6,013 | | $ | 5,804 |
Risk-weighted assets 3 | 57,459 | | 56,339 | | 55,402 | | 55,866 | | 55,654 |
| Tangible common equity ratio | 7.2 | % | | 7.6 | % | | 7.6 | % | | 7.8 | % | | 7.9 | % |
Common equity tier 1 capital ratio 3 | 10.9 | % | | 11.3 | % | | 11.2 | % | | 10.8 | % | | 10.4 | % |
Tier 1 leverage ratio 3 | 7.6 | % | | 8.0 | % | | 8.3 | % | | 8.3 | % | | 8.3 | % |
Tier 1 risk-based capital ratio 3 | 11.6 | % | | 12.1 | % | | 12.2 | % | | 11.8 | % | | 11.4 | % |
Total risk-based capital ratio 3 | 13.6 | % | | 14.2 | % | | 14.5 | % | | 14.1 | % | | 13.7 | % |
1 At period end.
2 For information on non-GAAP financial measures, see pages 15-17.
3 Current period ratios and amounts represent estimates.
ZIONS BANCORPORATION, N.A.
Press Release – Page 9
October 18, 2021
CONSOLIDATED BALANCE SHEETS
| | | | | | | | | | | | | | | | | | | | | | | | | | | | | |
| (In millions, shares in thousands) | September 30,
2021 | | June 30,
2021 | | March 31,
2021 | | December 31,
2020 | | September 30,
2020 |
| (Unaudited) | | (Unaudited) | | (Unaudited) | | | | (Unaudited) |
| ASSETS | | | | | | | | | |
| Cash and due from banks | $ | 597 | | | $ | 525 | | | $ | 576 | | | $ | 543 | | | $ | 576 | |
| Money market investments: | | | | | | | | | |
| Interest-bearing deposits | 9,442 | | | 10,086 | | | 8,427 | | | 1,074 | | | 856 | |
| Federal funds sold and security resell agreements | 1,858 | | | 1,714 | | | 1,315 | | | 5,765 | | | 2,804 | |
| Investment securities: | | | | | | | | | |
Held-to-maturity1, at amortized cost | 459 | | | 620 | | | 583 | | | 636 | | | 592 | |
| Available-for-sale, at fair value | 20,461 | | | 18,170 | | | 16,644 | | | 15,731 | | | 14,662 | |
| Trading account, at fair value | 305 | | | 181 | | | 189 | | | 266 | | | 198 | |
| | | | | | | | | |
| Total securities, net of allowance | 21,225 | | | 18,971 | | | 17,416 | | | 16,633 | | | 15,452 | |
| Loans held for sale | 67 | | | 66 | | | 77 | | | 81 | | | 89 | |
| Loans and leases, net of unearned income and fees | 50,678 | | | 51,398 | | | 53,472 | | | 53,476 | | | 54,745 | |
| Less allowance for loan losses | 491 | | | 535 | | | 646 | | | 777 | | | 853 | |
| Loans held for investment, net of allowance | 50,187 | | | 50,863 | | | 52,826 | | | 52,699 | | | 53,892 | |
| Other noninterest-bearing investments | 868 | | | 895 | | | 815 | | | 817 | | | 830 | |
| Premises, equipment and software, net | 1,282 | | | 1,239 | | | 1,236 | | | 1,209 | | | 1,187 | |
| Goodwill and intangibles | 1,015 | | | 1,015 | | | 1,016 | | | 1,016 | | | 1,016 | |
| Other real estate owned | 21 | | | 23 | | | 3 | | | 4 | | | 6 | |
| Other assets | 1,744 | | | 1,811 | | | 1,414 | | | 1,638 | | | 1,649 | |
| Total assets | $ | 88,306 | | | $ | 87,208 | | | $ | 85,121 | | | $ | 81,479 | | | $ | 78,357 | |
| LIABILITIES AND SHAREHOLDERS’ EQUITY | | | | | | | | | |
| Deposits: | | | | | | | | | |
| Noninterest-bearing demand | $ | 39,150 | | | $ | 38,128 | | | $ | 35,882 | | | $ | 32,494 | | | $ | 31,338 | |
| Interest-bearing: | | | | | | | | | |
| Savings and money market | 37,046 | | | 36,037 | | | 35,762 | | | 34,571 | | | 32,305 | |
| Time | 1,688 | | | 1,940 | | | 2,209 | | | 2,588 | | | 3,451 | |
| | | | | | | | | |
| Total deposits | 77,884 | | | 76,105 | | | 73,853 | | | 69,653 | | | 67,094 | |
| Federal funds purchased and other short-term borrowings | 579 | | | 741 | | | 1,032 | | | 1,572 | | | 1,252 | |
| Long-term debt | 1,020 | | | 1,308 | | | 1,299 | | | 1,336 | | | 1,347 | |
| Reserve for unfunded lending commitments | 38 | | | 39 | | | 49 | | | 58 | | | 64 | |
| Other liabilities | 1,011 | | | 982 | | | 955 | | | 974 | | | 932 | |
| Total liabilities | 80,532 | | | 79,175 | | | 77,188 | | | 73,593 | | | 70,689 | |
| Shareholders’ equity: | | | | | | | | | |
| Preferred stock, without par value; authorized 4,400 shares | 440 | | | 440 | | | 566 | | | 566 | | | 566 | |
Common stock2 ($0.001 par value; authorized 350,000 shares) and additional paid-in capital | 2,245 | | | 2,565 | | | 2,653 | | | 2,686 | | | 2,680 | |
| Retained earnings | 5,025 | | | 4,853 | | | 4,566 | | | 4,309 | | | 4,090 | |
| Accumulated other comprehensive income | 64 | | | 175 | | | 148 | | | 325 | | | 332 | |
| | | | | | | | | |
| | | | | | | | | |
| Total shareholders’ equity | 7,774 | | | 8,033 | | | 7,933 | | | 7,886 | | | 7,668 | |
| Total liabilities and shareholders’ equity | $ | 88,306 | | | $ | 87,208 | | | $ | 85,121 | | | $ | 81,479 | | | $ | 78,357 | |
1 Held-to-maturity (approximate fair value) | $ | 461 | | | $ | 622 | | | $ | 584 | | | $ | 640 | | | $ | 596 | |
2 Common shares (issued and outstanding) | 156,530 | | | 162,248 | | | 163,800 | | | 164,090 | | | 164,009 | |
ZIONS BANCORPORATION, N.A.
Press Release – Page 10
October 18, 2021
CONSOLIDATED STATEMENTS OF INCOME
| | | | | | | | | | | | | | | | | | | | | | | | | | | | | |
| (Unaudited) | Three Months Ended |
| (In millions, except share and per share amounts) | September 30,
2021 | | June 30,
2021 | | March 31,
2021 | | December 31,
2020 | | September 30,
2020 |
| Interest income: | | | | | | | | | |
| Interest and fees on loans | $ | 484 | | | $ | 492 | | | $ | 488 | | | $ | 499 | | | $ | 505 | |
| Interest on money market investments | 7 | | | 4 | | | 3 | | | 3 | | | 2 | |
| Interest on securities | 78 | | | 74 | | | 71 | | | 69 | | | 74 | |
| Total interest income | 569 | | | 570 | | | 562 | | | 571 | | | 581 | |
| Interest expense: | | | | | | | | | |
| Interest on deposits | 7 | | | 7 | | | 9 | | | 13 | | | 18 | |
| Interest on short- and long-term borrowings | 7 | | | 8 | | | 8 | | | 8 | | | 8 | |
| Total interest expense | 14 | | | 15 | | | 17 | | | 21 | | | 26 | |
| Net interest income | 555 | | | 555 | | | 545 | | | 550 | | | 555 | |
| Provision for credit losses: | | | | | | | | | |
| Provision for loan losses | (45) | | | (113) | | | (123) | | | (61) | | | 45 | |
| Provision for unfunded lending commitments | (1) | | | (10) | | | (9) | | | (6) | | | 10 | |
| | | | | | | | | |
| Total provision for credit losses | (46) | | | (123) | | | (132) | | | (67) | | | 55 | |
| Net interest income after provision for credit losses | 601 | | | 678 | | | 677 | | | 617 | | | 500 | |
| Noninterest income: | | | | | | | | | |
| Commercial account fees | 34 | | | 34 | | | 32 | | | 32 | | | 32 | |
| Card fees | 25 | | | 24 | | | 21 | | | 22 | | | 21 | |
| Retail and business banking fees | 20 | | | 18 | | | 17 | | | 18 | | | 17 | |
| Loan-related fees and income | 27 | | | 21 | | | 25 | | | 25 | | | 32 | |
| Capital markets and foreign exchange fees | 17 | | | 17 | | | 15 | | | 19 | | | 16 | |
| Wealth management fees | 13 | | | 12 | | | 12 | | | 10 | | | 10 | |
| Other customer-related fees | 15 | | | 13 | | | 11 | | | 13 | | | 11 | |
| Customer-related fees | 151 | | | 139 | | | 133 | | | 139 | | | 139 | |
| Fair value and nonhedge derivative income (loss) | 2 | | | (5) | | | 18 | | | 8 | | | 8 | |
| Dividends and other income | 9 | | | 8 | | | 7 | | | 7 | | | 6 | |
| Securities gains (losses), net | (23) | | | 63 | | | 11 | | | 12 | | | 4 | |
| Total noninterest income | 139 | | | 205 | | | 169 | | | 166 | | | 157 | |
| Noninterest expense: | | | | | | | | | |
| Salaries and employee benefits | 285 | | | 272 | | | 288 | | | 277 | | | 269 | |
| Occupancy, net | 33 | | | 33 | | | 33 | | | 33 | | | 33 | |
| Furniture, equipment and software, net | 31 | | | 32 | | | 32 | | | 30 | | | 32 | |
| Other real estate expense, net | — | | | — | | | — | | | 1 | | | — | |
| Credit-related expense | 7 | | | 6 | | | 6 | | | 6 | | | 6 | |
| Professional and legal services | 16 | | | 17 | | | 20 | | | 19 | | | 12 | |
| Advertising | 4 | | | 4 | | | 5 | | | 6 | | | 7 | |
| FDIC premiums | 5 | | | 6 | | | 7 | | | 6 | | | 7 | |
| Other | 48 | | | 58 | | | 44 | | | 46 | | | 76 | |
| Total noninterest expense | 429 | | | 428 | | | 435 | | | 424 | | | 442 | |
| Income before income taxes | 311 | | | 455 | | | 411 | | | 359 | | | 215 | |
| Income taxes | 71 | | | 101 | | | 89 | | | 75 | | | 40 | |
| Net income | 240 | | | 354 | | | 322 | | | 284 | | | 175 | |
| | | | | | | | | |
| | | | | | | | | |
| Preferred stock dividends | (6) | | | (9) | | | (8) | | | (9) | | | (8) | |
| | | | | | | | | |
| Net earnings applicable to common shareholders | $ | 234 | | | $ | 345 | | | $ | 314 | | | $ | 275 | | | $ | 167 | |
| Weighted average common shares outstanding during the period: | | | | | | | | |
| Basic shares (in thousands) | 160,221 | | | 162,742 | | | 163,551 | | | 163,658 | | | 163,608 | |
| Diluted shares (in thousands) | 160,480 | | | 163,054 | | | 163,887 | | | 163,900 | | | 163,779 | |
| Net earnings per common share: | | | | | | | | | |
| Basic | $ | 1.45 | | | $ | 2.08 | | | $ | 1.90 | | | $ | 1.66 | | | $ | 1.01 | |
| Diluted | 1.45 | | | 2.08 | | | 1.90 | | | 1.66 | | | 1.01 | |
ZIONS BANCORPORATION, N.A.
Press Release – Page 11
October 18, 2021
Loan Balances Held for Investment by Portfolio Type
(Unaudited)
| | | | | | | | | | | | | | | | | | | | | | | | | | | | | |
| (In millions) | September 30,
2021 | | June 30,
2021 | | March 31,
2021 | | December 31,
2020 | | September 30,
2020 |
| Commercial: | | | | | | | | | |
| Commercial and industrial | $ | 13,230 | | | $ | 12,947 | | | $ | 12,843 | | | $ | 13,444 | | | $ | 13,543 | |
| PPP | 3,080 | | | 4,461 | | | 6,465 | | | 5,572 | | | 6,810 | |
| Leasing | 293 | | | 307 | | | 310 | | | 320 | | | 319 | |
| Owner occupied | 8,446 | | | 8,231 | | | 8,112 | | | 8,185 | | | 8,136 | |
| Municipal | 3,400 | | | 3,215 | | | 3,234 | | | 2,951 | | | 2,706 | |
| Total commercial | 28,449 | | | 29,161 | | | 30,964 | | | 30,472 | | | 31,514 | |
| Commercial real estate: | | | | | | | | | |
| Construction and land development | 2,843 | | | 2,576 | | | 2,443 | | | 2,345 | | | 2,298 | |
| Term | 9,310 | | | 9,532 | | | 9,617 | | | 9,759 | | | 9,729 | |
| Total commercial real estate | 12,153 | | | 12,108 | | | 12,060 | | | 12,104 | | | 12,027 | |
| Consumer: | | | | | | | | | |
| Home equity credit line | 2,834 | | | 2,727 | | | 2,695 | | | 2,745 | | | 2,797 | |
| 1-4 family residential | 6,140 | | | 6,269 | | | 6,630 | | | 6,969 | | | 7,209 | |
| Construction and other consumer real estate | 584 | | | 593 | | | 589 | | | 630 | | | 633 | |
| Bankcard and other revolving plans | 395 | | | 415 | | | 409 | | | 432 | | | 431 | |
| Other | 123 | | | 125 | | | 125 | | | 124 | | | 134 | |
| Total consumer | 10,076 | | | 10,129 | | | 10,448 | | | 10,900 | | | 11,204 | |
| Loans and leases, net of unearned income and fees | $ | 50,678 | | | $ | 51,398 | | | $ | 53,472 | | | $ | 53,476 | | | $ | 54,745 | |
Nonperforming Assets
(Unaudited)
| | | | | | | | | | | | | | | | | | | | | | | | | | | | | |
| (In millions) | September 30,
2021 | | June 30,
2021 | | March 31,
2021 | | December 31,
2020 | | September 30,
2020 |
| | | | | | | | | |
Nonaccrual loans1 | $ | 323 | | | $ | 307 | | | $ | 324 | | | $ | 367 | | | $ | 366 | |
Other real estate owned2 | 1 | | | 1 | | | 3 | | | 4 | | | 6 | |
| Total nonperforming assets | $ | 324 | | | $ | 308 | | | $ | 327 | | | $ | 371 | | | $ | 372 | |
Ratio of nonperforming assets to loans1 and leases and other real estate owned2 | 0.64 | % | | 0.60 | % | | 0.61 | % | | 0.69 | % | | 0.68 | % |
| Accruing loans past due 90 days or more | $ | 4 | | | $ | 6 | | | $ | 9 | | | $ | 12 | | | $ | 9 | |
Ratio of accruing loans past due 90 days or more to loans1 and leases | 0.01 | % | | 0.01 | % | | 0.02 | % | | 0.02 | % | | 0.02 | % |
| Nonaccrual loans and accruing loans past due 90 days or more | $ | 327 | | | $ | 313 | | | $ | 333 | | | $ | 379 | | | $ | 375 | |
Ratio of nonaccrual loans and accruing loans past due 90 days or more to loans1 and leases | 0.64 | % | | 0.61 | % | | 0.62 | % | | 0.71 | % | | 0.68 | % |
| Accruing loans past due 30-89 days | $ | 114 | | | $ | 29 | | | $ | 100 | | | $ | 112 | | | $ | 58 | |
| Restructured loans included in nonaccrual loans | 121 | | | 128 | | | 134 | | | 113 | | | 84 | |
| Restructured loans on accrual | 231 | | | 330 | | | 280 | | | 198 | | | 197 | |
| Classified loans | 1,397 | | | 1,557 | | | 1,660 | | | 1,641 | | | 1,639 | |
1 Includes loans held for sale.
2 Does not include banking premises held for sale.
ZIONS BANCORPORATION, N.A.
Press Release – Page 12
October 18, 2021
Allowance for Credit Losses
(Unaudited)
| | | | | | | | | | | | | | | | | | | | | | | | | | | | | |
| Three Months Ended |
| (In millions) | September 30,
2021 | | June 30,
2021 | | March 31,
2021 | | December 31,
2020 | | September 30,
2020 |
| Allowance for Loan Losses | | | | | | | | | |
| Balance at beginning of period | $ | 535 | | | $ | 646 | | | $ | 777 | | | $ | 853 | | | $ | 860 | |
| | | | | | | | | |
| Provision for loan losses | (45) | | | (113) | | | (123) | | | (61) | | | 45 | |
| | | | | | | | | |
| Loan and lease charge-offs | 8 | | | 8 | | | 21 | | | 21 | | | 58 | |
| Less: Recoveries | 9 | | | 10 | | | 13 | | | 6 | | | 6 | |
| Net loan and lease charge-offs | (1) | | | (2) | | | 8 | | | 15 | | | 52 | |
| Balance at end of period | $ | 491 | | | $ | 535 | | | $ | 646 | | | $ | 777 | | | $ | 853 | |
Ratio of allowance for loan losses to loans1 and leases, at period end | 0.97 | % | | 1.04 | % | | 1.21 | % | | 1.45 | % | | 1.56 | % |
Ratio of allowance for loan losses to nonaccrual loans1 at period end | 152 | % | | 175 | % | | 199 | % | | 212 | % | | 242 | % |
| Annualized ratio of net loan and lease charge-offs to average loans | (0.01) | % | | (0.02) | % | | 0.06 | % | | 0.11 | % | | 0.38 | % |
| Annualized ratio of net loan and lease charge-offs to average loans (excluding PPP loans) | (0.01) | % | | (0.02) | % | | 0.07 | % | | 0.13 | % | | 0.43 | % |
| Reserve for Unfunded Lending Commitments | | | | | | | | | |
| Balance at beginning of period | $ | 39 | | | $ | 49 | | | $ | 58 | | | $ | 64 | | | $ | 54 | |
| Provision for unfunded lending commitments | (1) | | | (10) | | | (9) | | | (6) | | | 10 | |
| Balance at end of period | $ | 38 | | | $ | 39 | | | $ | 49 | | | $ | 58 | | | $ | 64 | |
| Allowance for Credit Losses | | | | | | | | | |
| Allowance for loan losses | $ | 491 | | | $ | 535 | | | $ | 646 | | | $ | 777 | | | $ | 853 | |
| Reserve for unfunded lending commitments | 38 | | | 39 | | | 49 | | | 58 | | | 64 | |
| Total allowance for credit losses | $ | 529 | | | $ | 574 | | | $ | 695 | | | $ | 835 | | | $ | 917 | |
Ratio of total allowance for credit losses to loans1 and leases outstanding, at period end | 1.04 | % | | 1.12 | % | | 1.30 | % | | 1.56 | % | | 1.68 | % |
Ratio of total allowance for credit losses to loans1 and leases outstanding (excluding PPP loans), at period end | 1.11 | % | | 1.22 | % | | 1.48 | % | | 1.74 | % | | 1.91 | % |
1 Does not include loans held for sale.
ZIONS BANCORPORATION, N.A.
Press Release – Page 13
October 18, 2021
Nonaccrual Loans by Portfolio Type
(Unaudited)
| | | | | | | | | | | | | | | | | | | | | | | | | | | | | |
| (In millions) | September 30,
2021 | | June 30,
2021 | | March 31,
2021 | | December 31,
2020 | | September 30,
2020 |
| | | | | | | | | |
| Loans held for sale | $ | — | | | $ | 1 | | | $ | — | | | $ | — | | | $ | 14 | |
| Commercial: | | | | | | | | | |
| Commercial and industrial | $ | 157 | | | $ | 111 | | | $ | 119 | | | $ | 140 | | | $ | 158 | |
| PPP | — | | | 1 | | | — | | | — | | | — | |
| Leasing | — | | | — | | | — | | | — | | | 1 | |
| Owner occupied | 67 | | | 69 | | | 74 | | | 76 | | | 81 | |
| Municipal | — | | | — | | | — | | | — | | | — | |
| Total commercial | 224 | | | 181 | | | 193 | | | 216 | | | 240 | |
| Commercial real estate: | | | | | | | | | |
| Construction and land development | — | | | — | | | — | | | — | | | — | |
| Term | 25 | | | 28 | | | 31 | | | 31 | | | 37 | |
| Total commercial real estate | 25 | | | 28 | | | 31 | | | 31 | | | 37 | |
| Consumer: | | | | | | | | | |
| Home equity credit line | 15 | | | 18 | | | 19 | | | 16 | | | 16 | |
| 1-4 family residential | 58 | | | 78 | | | 80 | | | 103 | | | 59 | |
| Construction and other consumer real estate | — | | | — | | | — | | | — | | | — | |
| Bankcard and other revolving plans | 1 | | | 1 | | | 1 | | | 1 | | | — | |
| Other | — | | | — | | | — | | | — | | | — | |
| Total consumer | 74 | | | 97 | | | 100 | | | 120 | | | 75 | |
| | | | | | | | | |
| Total nonaccrual loans | $ | 323 | | | $ | 307 | | | $ | 324 | | | $ | 367 | | | $ | 366 | |
Net Charge-Offs by Portfolio Type
(Unaudited)
| | | | | | | | | | | | | | | | | | | | | | | | | | | | | |
| (In millions) | September 30,
2021 | | June 30,
2021 | | March 31,
2021 | | December 31,
2020 | | September 30,
2020 |
| Commercial: | | | | | | | | | |
| Commercial and industrial | $ | (2) | | | $ | (2) | | | $ | 8 | | | $ | 15 | | | $ | 51 | |
| PPP | — | | | — | | | — | | | — | | | — | |
| Leasing | — | | | — | | | — | | | — | | | — | |
| Owner occupied | (1) | | | — | | | — | | | — | | | (1) | |
| Municipal | — | | | — | | | — | | | — | | | — | |
| Total commercial | (3) | | | (2) | | | 8 | | | 15 | | | 50 | |
| Commercial real estate: | | | | | | | | | |
| Construction and land development | — | | | — | | | — | | | — | | | — | |
| Term | — | | | — | | | — | | | — | | | 1 | |
| Total commercial real estate | — | | | — | | | — | | | — | | | 1 | |
| Consumer: | | | | | | | | | |
| Home equity credit line | 1 | | | (1) | | | (1) | | | — | | | — | |
| 1-4 family residential | 1 | | | — | | | (1) | | | (1) | | | — | |
| Construction and other consumer real estate | — | | | — | | | — | | | — | | | — | |
| Bankcard and other revolving plans | — | | | 1 | | | 1 | | | — | | | 1 | |
| Other | — | | | — | | | 1 | | | 1 | | | — | |
| Total consumer loans | 2 | | | — | | | — | | | — | | | 1 | |
| Total net charge-offs (recoveries) | $ | (1) | | | $ | (2) | | | $ | 8 | | | $ | 15 | | | $ | 52 | |
ZIONS BANCORPORATION, N.A.
Press Release – Page 14
October 18, 2021
CONSOLIDATED AVERAGE BALANCE SHEETS, YIELDS AND RATES
| | | | | | | | | | | | | | | | | | | | | | | | | | | | | | | | | | | |
| (Unaudited) | Three Months Ended |
| September 30, 2021 | | June 30, 2021 | | September 30, 2020 |
| (In millions) | Average balance | | Average
yield/rate 1 | | Average balance | | Average
yield/rate 1 | | Average balance | | Average
yield/rate 1 |
| ASSETS | | | | | | | | | | | |
| Money market investments | $ | 12,716 | | | 0.20 | % | | $ | 10,253 | | | 0.17 | % | | $ | 3,116 | | | 0.25 | % |
| Securities: | | | | | | | | | | | |
| Held-to-maturity | 557 | | | 2.87 | % | | 579 | | | 2.91 | % | | 672 | | | 3.39 | % |
| Available-for-sale | 18,814 | | | 1.56 | % | | 17,041 | | | 1.63 | % | | 14,083 | | | 1.95 | % |
| Trading account | 199 | | | 4.41 | % | | 211 | | | 4.43 | % | | 158 | | | 4.31 | % |
| Total securities | 19,570 | | | 1.63 | % | | 17,831 | | | 1.71 | % | | 14,913 | | | 2.04 | % |
| Loans held for sale | 52 | | | 3.03 | % | | 62 | | | 2.50 | % | | 86 | | | 4.32 | % |
Loans and leases:2 | | | | | | | | | | | |
| Commercial - excluding PPP loans | 24,854 | | | 3.76 | % | | 24,560 | | | 3.85 | % | | 24,909 | | | 3.96 | % |
| Commercial - PPP loans | 3,795 | | | 6.66 | % | | 5,945 | | | 4.56 | % | | 6,771 | | | 3.03 | % |
| Commercial real estate | 12,144 | | | 3.42 | % | | 12,037 | | | 3.46 | % | | 11,986 | | | 3.52 | % |
| Consumer | 10,058 | | | 3.38 | % | | 10,228 | | | 3.51 | % | | 11,327 | | | 3.60 | % |
| Total loans and leases | 50,851 | | | 3.82 | % | | 52,770 | | | 3.77 | % | | 54,993 | | | 3.68 | % |
| Total interest-earning assets | 83,189 | | | 2.75 | % | | 80,916 | | | 2.86 | % | | 73,108 | | | 3.20 | % |
| Cash and due from banks | 597 | | | | | 579 | | | | | 583 | | | |
| Allowance for credit losses on loans and debt securities | (536) | | | | | (647) | | | | | (852) | | | |
| Goodwill and intangibles | 1,015 | | | | | 1,015 | | | | | 1,015 | | | |
| Other assets | 4,291 | | | | | 4,094 | | | | | 4,129 | | | |
| Total assets | $ | 88,556 | | | | | $ | 85,957 | | | | | $ | 77,983 | | | |
| LIABILITIES AND SHAREHOLDERS’ EQUITY | | | | | | | | | | |
| Interest-bearing deposits: | | | | | | | | | | | |
| Savings and money market | $ | 37,262 | | | 0.05 | % | | $ | 35,987 | | | 0.06 | % | | $ | 32,111 | | | 0.11 | % |
| Time | 1,829 | | | 0.32 | % | | 2,108 | | | 0.42 | % | | 3,602 | | | 0.96 | % |
| | | | | | | | | | | |
| Total interest-bearing deposits | 39,091 | | | 0.07 | % | | 38,095 | | | 0.08 | % | | 35,713 | | | 0.20 | % |
| Borrowed funds: | | | | | | | | | | | |
| Federal funds purchased and other short-term borrowings | 630 | | | 0.08 | % | | 834 | | | 0.06 | % | | 1,078 | | | 0.09 | % |
| Long-term debt | 1,204 | | | 2.34 | % | | 1,303 | | | 2.31 | % | | 1,353 | | | 2.32 | % |
| Total borrowed funds | 1,834 | | | 1.56 | % | | 2,137 | | | 1.43 | % | | 2,431 | | | 1.33 | % |
| Total interest-bearing funds | 40,925 | | | 0.13 | % | | 40,232 | | | 0.15 | % | | 38,144 | | | 0.27 | % |
| Noninterest-bearing demand deposits | 38,320 | | | | | 36,545 | | | | | 30,789 | | | |
| Other liabilities | 1,302 | | | | | 1,200 | | | | | 1,406 | | | |
| Total liabilities | 80,547 | | | | | 77,977 | | | | | 70,339 | | | |
| Shareholders’ equity: | | | | | | | | | | | |
| Preferred equity | 440 | | | | | 544 | | | | | 566 | | | |
| Common equity | 7,569 | | | | | 7,436 | | | | | 7,078 | | | |
| | | | | | | | | | | |
| | | | | | | | | | | |
| Total shareholders’ equity | 8,009 | | | | | 7,980 | | | | | 7,644 | | | |
| Total liabilities and shareholders’ equity | $ | 88,556 | | | | | $ | 85,957 | | | | | $ | 77,983 | | | |
| Spread on average interest-bearing funds | | | 2.62 | % | | | | 2.71 | % | | | | 2.93 | % |
| Impact of net noninterest-bearing sources of funds | | | 0.06 | % | | | | 0.08 | % | | | | 0.13 | % |
| Net interest margin | | | 2.68 | % | | | | 2.79 | % | | | | 3.06 | % |
| Memo: total loans and leases, excluding PPP loans | 47,056 | | | 3.59 | % | | 46,825 | | | 3.67 | % | | 48,222 | | | 3.77 | % |
| | | | | | | | | | | |
| Memo: total cost of deposits | | | 0.03 | % | | | | 0.04 | % | | | | 0.11 | % |
| Memo: total deposits and interest-bearing liabilities | 79,245 | | | 0.07 | % | | 76,777 | | | 0.08 | % | | 68,933 | | | 0.15 | % |
1 Rates are calculated using amounts in thousands and a tax rate of 21% for the periods presented.
2 Net of unamortized purchase premiums, discounts, and deferred loan fees and costs.
ZIONS BANCORPORATION, N.A.
Press Release – Page 15
October 18, 2021
GAAP to Non-GAAP Reconciliations
(Unaudited)
This press release presents non-GAAP financial measures, in addition to GAAP financial measures, to provide investors with additional information. The adjustments to reconcile from the applicable GAAP financial measures to the non-GAAP financial measures are presented in the following schedules. We consider these adjustments to be relevant to ongoing operating results and to provide a meaningful base for period-to-period and company-to-company comparisons. We use these non-GAAP financial measures to assess our performance, financial position, and for presentations of our performance to investors. We believe that presenting these non-GAAP financial measures permits investors to assess our performance on the same basis as that applied by our management and the financial services industry.
Non-GAAP financial measures have inherent limitations and are not necessarily comparable to similar capital measures that may be presented by other financial services companies. Although non-GAAP financial measures are frequently used by stakeholders to evaluate a company, they have limitations as an analytical tool and should not be considered in isolation or as a substitute for analysis of results reported under GAAP.
Tangible Common Equity and Related Measures
Tangible common equity and related measures are non-GAAP measures that exclude the impact of intangible assets and their related amortization. We believe these non-GAAP measures provide useful information about our use of shareholders’ equity and provide a basis for evaluating the performance of a business more consistently, whether acquired or developed internally.
| | | | | | | | | | | | | | | | | | | | | | | | | | | | | | | | |
| | Three Months Ended |
| (Dollar amounts in millions) | | September 30,
2021 | | June 30,
2021 | | March 31,
2021 | | December 31,
2020 | | September 30,
2020 |
| Return on Average Tangible Common Equity | | | | | | | | | |
| | | | | | | | | | |
| | | | | | | | | | |
| | | | | | | | | | |
| | | | | | | | | | |
| Net earnings applicable to common shareholders, net of tax | (a) | $ | 234 | | | $ | 345 | | | $ | 314 | | | $ | 275 | | | $ | 167 | |
| Average common equity (GAAP) | | $ | 7,569 | | | $ | 7,436 | | | $ | 7,333 | | | $ | 7,166 | | | $ | 7,078 | |
| Average goodwill and intangibles | | (1,015) | | | (1,015) | | | (1,016) | | | (1,016) | | | (1,015) | |
| Average tangible common equity (non-GAAP) | (b) | $ | 6,554 | | | $ | 6,421 | | | $ | 6,317 | | | $ | 6,150 | | | $ | 6,063 | |
| Number of days in quarter | (c) | 92 | | | 91 | | | 90 | | | 92 | | | 92 | |
| Number of days in year | (d) | 365 | | | 365 | | | 365 | | | 366 | | | 366 | |
| Return on average tangible common equity (non-GAAP) | (a/b/c)*d | 14.2 | % | | 21.6 | % | | 20.2 | % | | 17.8 | % | | 11.0 | % |
| | | | | | | | | | | | | | | | | | | | | | | | | | | | | | | | |
| (In millions, except shares and per share amounts) | | September 30,
2021 | | June 30,
2021 | | March 31,
2021 | | December 31,
2020 | | September 30,
2020 |
| Tangible Book Value per Common Share | | | | | | | | | | |
| Total shareholders’ equity (GAAP) | | $ | 7,774 | | | $ | 8,033 | | | $ | 7,933 | | | $ | 7,886 | | | $ | 7,668 | |
| Preferred stock | | (440) | | | (440) | | | (566) | | | (566) | | | (566) | |
| Goodwill and intangibles | | (1,015) | | | (1,015) | | | (1,016) | | | (1,016) | | | (1,016) | |
| Tangible common equity (non-GAAP) | (a) | $ | 6,319 | | | $ | 6,578 | | | $ | 6,351 | | | $ | 6,304 | | | $ | 6,086 | |
| Common shares outstanding (in thousands) | (b) | 156,530 | | | 162,248 | | | 163,800 | | | 164,090 | | | 164,009 | |
| Tangible book value per common share (non-GAAP) | (a/b) | $ | 40.37 | | | $ | 40.54 | | | $ | 38.77 | | | $ | 38.42 | | | $ | 37.11 | |
ZIONS BANCORPORATION, N.A.
Press Release – Page 16
October 18, 2021
Efficiency Ratio and Adjusted Pre-Provision Net Revenue
The efficiency ratio is a measure of operating expense relative to revenue. We believe the efficiency ratio provides useful information regarding the cost of generating revenue. The methodology of determining the efficiency ratio may differ among companies. We make adjustments to exclude certain items that are not generally expected to recur frequently, as identified in the subsequent schedule, which we believe allow for more consistent comparability among periods. Adjusted noninterest expense provides a measure as to how well we are managing our expenses; adjusted pre-provision net revenue (“PPNR”) enables management and others to assess our ability to generate capital to cover credit losses through a credit cycle. Taxable-equivalent net interest income allows us to assess the comparability of revenue arising from both taxable and tax-exempt sources.
| | | | | | | | | | | | | | | | | | | | | | | | | | | | | | | | |
| | Three Months Ended |
| (In millions) | | September 30,
2021 | | June 30,
2021 | | March 31,
2021 | | December 31,
2020 | | September 30,
2020 |
| Efficiency Ratio | | | | | | | | | | |
| Noninterest expense (GAAP) | (a) | $ | 429 | | | $ | 428 | | | $ | 435 | | | $ | 424 | | | $ | 442 | |
| Adjustments: | | | | | | | | | | |
| Severance costs | | 1 | | | — | | | — | | | 1 | | | 1 | |
| Other real estate expense, net | | — | | | — | | | — | | | 1 | | | — | |
| | | | | | | | | | |
| | | | | | | | | | |
| Restructuring costs | | — | | | — | | | — | | | (1) | | | 1 | |
| Pension termination-related expense | | — | | | — | | | (5) | | | — | | | — | |
| | | | | | | | | | |
SBIC investment success fee accrual 1 | | (4) | | | 9 | | | — | | | — | | | — | |
| Total adjustments | (b) | (3) | | | 9 | | | (5) | | | 1 | | | 2 | |
| Adjusted noninterest expense (non-GAAP) | (a-b)=(c) | $ | 432 | | | $ | 419 | | | $ | 440 | | | $ | 423 | | | $ | 440 | |
| Net interest income (GAAP) | (d) | $ | 555 | | | $ | 555 | | | $ | 545 | | | $ | 550 | | | $ | 555 | |
| Fully taxable-equivalent adjustments | (e) | 7 | | | 7 | | | 8 | | | 7 | | | 7 | |
| Taxable-equivalent net interest income (non-GAAP) | (d+e)=(f) | 562 | | | 562 | | | 553 | | | 557 | | | 562 | |
| Noninterest income (GAAP) | (g) | 139 | | | 205 | | | 169 | | | 166 | | | 157 | |
| Combined income (non-GAAP) | (f+g)=(h) | 701 | | | 767 | | | 722 | | | 723 | | | 719 | |
| Adjustments: | | | | | | | | | | |
| Fair value and nonhedge derivative income (loss) | | 2 | | | (5) | | | 18 | | | 8 | | | 8 | |
| Securities gains (losses), net | | (23) | | | 63 | | | 11 | | | 12 | | | 4 | |
| Total adjustments | (i) | (21) | | | 58 | | | 29 | | | 20 | | | 12 | |
Adjusted taxable-equivalent revenue (non-GAAP) | (h-i)=(j) | $ | 722 | | | $ | 709 | | | $ | 693 | | | $ | 703 | | | $ | 707 | |
| Pre-provision net revenue (PPNR) (non-GAAP) | (h)-(a) | $ | 272 | | | $ | 339 | | | $ | 287 | | | $ | 299 | | | $ | 277 | |
| Adjusted PPNR (non-GAAP) | (j)-(c) | 290 | | | 290 | | | 253 | | | 280 | | | 267 | |
Efficiency ratio (non-GAAP) 2 | (c/j) | 59.8 | % | | 59.1 | % | | 63.5 | % | | 60.2 | % | | 62.2 | % |
1 The success fee accrual is associated with the unrealized gain/(loss) from our SBIC investment in Recursion Pharmaceuticals, Inc., and is adjusted based on the mark-to-market value of the investment. The unrealized gain/(loss) is excluded from the efficiency ratio through securities gains (losses), net.
2 Excluding the $30 million charitable contribution, the efficiency ratio for the three months ended September 30, 2020 would have been 58.0%.
ZIONS BANCORPORATION, N.A.
Press Release – Page 17
October 18, 2021
| | | | | | | | | | | | | | | | |
| | Nine Months Ended |
| (In millions) | | September 30,
2021 | | September 30,
2020 | | |
| Efficiency Ratio | | | | | | |
| Noninterest expense (GAAP) | (a) | $ | 1,292 | | | $ | 1,279 | | | |
| Adjustments: | | | | | | |
| Severance costs | | 1 | | | — | | | |
| | | | | | |
| | | | | | |
| | | | | | |
| Restructuring costs | | — | | | 2 | | | |
| Pension termination-related expense | | (5) | | | 28 | | | |
SBIC investment success fee accrual 1 | | 5 | | | — | | | |
| Total adjustments | (b) | 1 | | | 30 | | | |
| Adjusted noninterest expense (non-GAAP) | (a-b)=(c) | $ | 1,291 | | | $ | 1,249 | | | |
| Net interest income (GAAP) | (d) | $ | 1,655 | | | $ | 1,665 | | | |
| Fully taxable-equivalent adjustments | (e) | 22 | | | 21 | | | |
| Taxable-equivalent net interest income (non-GAAP) | (d+e)=(f) | 1,677 | | | 1,686 | | | |
| Noninterest income (GAAP) | (g) | 513 | | | 408 | | | |
| Combined income (non-GAAP) | (f+g)=(h) | 2,190 | | | 2,094 | | | |
| Adjustments: | | | | | | |
| Fair value and nonhedge derivative loss | | 15 | | | (15) | | | |
| Securities gains, net | | 51 | | | (5) | | | |
| Total adjustments | (i) | 66 | | | (20) | | | |
| Adjusted taxable-equivalent revenue (non-GAAP) | (h-i)=(j) | $ | 2,124 | | | $ | 2,114 | | | |
| Pre-provision net revenue (PPNR) | (h)-(a) | $ | 898 | | | $ | 815 | | | |
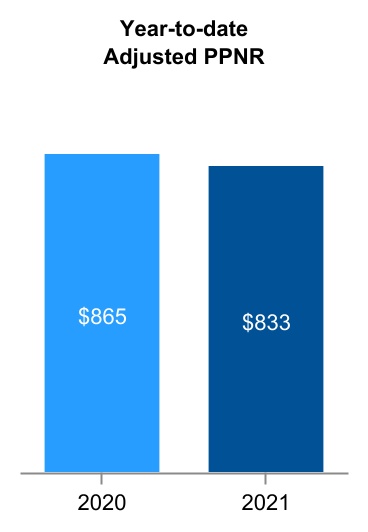
| Adjusted PPNR (non-GAAP) | (j)-(c) | 833 | | | 865 | | | |
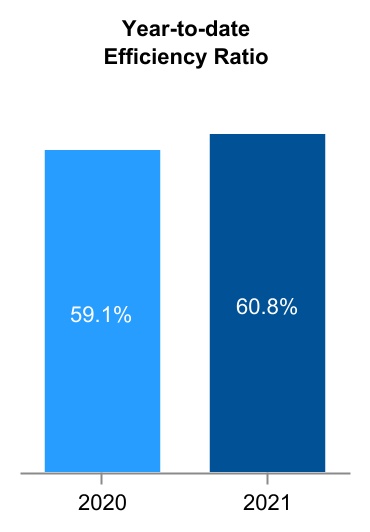
| Efficiency ratio (non-GAAP) | (c/j) | 60.8 | % | | 59.1 | % | | |
1 The success fee accrual is associated with the unrealized gain/(loss) from our SBIC investment in Recursion Pharmaceuticals, Inc., and is adjusted based on the mark-to-market value of the investment. The unrealized gain/(loss) is excluded from the efficiency ratio through securities gains (losses), net.
