UNITED STATES
SECURITIES AND EXCHANGE COMMISSION
Washington, D.C. 20549
FORM N-CSRS
CERTIFIED SHAREHOLDER REPORT OF REGISTERED
MANAGEMENT INVESTMENT COMPANIES
Investment Company Act file number: 811-09603
AMERICAN BEACON SELECT FUNDS
(Exact name of registrant as specified in charter)
4151 Amon Carter Boulevard, MD 2450
Fort Worth, Texas 76155
(Address of principal executive offices)-(Zip code)
Gene L. Needles, Jr., PRESIDENT
4151 Amon Carter Boulevard, MD 2450
Fort Worth, Texas 76155
(Name and address of agent for service)
Registrant’s telephone number, including area code: (817) 391-6100
Date of fiscal year end: December 31, 2012
Date of reporting period: June 30, 2012
ITEM 1. REPORT TO STOCKHOLDERS.
About American Beacon Advisors
Since 1986, American Beacon Advisors has offered a variety of products and investment advisory services to numerous institutional and retail clients, including a variety of mutual funds, corporate cash management, and separate account management.
Our clients include defined benefit plans, defined contribution plans, foundations, endowments, corporations, financial planners, and other institutional investors. With American Beacon Advisors, you can put the experience of a multi-billion dollar asset management firm to work for your company.
| | |
Any opinions herein, including forecasts, reflect our judgment as of the end of the reporting period and are subject to change. Each advisor’s strategies and each Fund’s portfolio composition will change depending on economic and market conditions. This report is not a complete analysis of market conditions and therefore, should not be relied upon as investment advice. Although economic and market information has been compiled from reliable sources, American Beacon Advisors, Inc. makes no representation as to the completeness or accuracy of the statements contained herein. |
American Beacon Select Funds
June 30, 2012
1
| | |
 | | Dear Shareholders, The first half of 2012 began with renewed optimism in the markets as economic data for the U.S. appeared to be strengthening and concerns of “European contagion” were lessened. However, by the end of June, the optimism had waned as domestic economic data weakened and global pressures took a toll on the U.S. economy. Interest rates remained extremely low, continuing the challenging environment for money market funds. For the six months ended June 30, 2012, the American Beacon Money Market Select Fund returned 0.10% and the American Beacon U.S. Government Money Market Select Fund returned 0.05%. |
With ongoing uncertainty in the eurozone, the upcoming Presidential election and the looming “fiscal cliff” of expiring tax cuts and automatic spending cuts, we may see further market turbulence in the months to come. But regardless of the headlines, American Beacon remains focused on seeking opportunities and meeting market challenges to deliver the type of consistency in performance and service that our shareholders value.
Thank you for your continued investment in the American Beacon Select Funds. For additional information about the Funds or to access your account information, please visit our website at www.americanbeaconfunds.com.
Sincerely,

Gene L. Needles, Jr.
President
American Beacon Select Funds
1
Economic Overview
June 30, 2012 (Unaudited)
Signs of market improvement emerged during the first three months of 2012. The U.S. economic recovery gained ground and the European sovereign debt crisis appeared to abate – at least temporarily. The “risk trade” came back in vogue as investors rotated out of the relative safety of U.S. Treasuries and into corporate bonds and equities, driving U.S. interest rates higher and credit spreads narrower during the quarter.
However, market volatility returned during the second quarter on news of ongoing stress in Europe, slowing economic growth and uncertain U.S. fiscal policy. These familiar themes once again tempered investors’ willingness to add risk and fueled the flight-to-quality trade. Equities sold off, corporate credit spreads widened and demand for U.S. Treasuries increased as investors became less concerned with returns and more concerned with getting their principal back.
“Eurogeddon” (one of many new terms coined to describe the ongoing financial saga in Europe) dominated headlines during the second quarter. Greece was again pulled back from the brink of imminent euro exit when the pro-bailout New Democracy party won a narrow victory in the second round of Greek elections in June. Although much debate remains over Greece’s ability to adhere to imposed austerity measures, the victory enabled the country to remain eligible for much-needed bailout funds and allowed markets a brief sigh of relief.
Facing rising debt costs and a need to recapitalize a number of its regional banks, Spain joined the bailout party in late June when it became the fourth country to officially request aid from the European Union (“EU”). With the crisis escalating, European leaders came together at the end of June for another EU summit meeting. While hopes for a definitive solution to the crisis were low, the summit exceeded expectations and eased immediate tensions in the financial markets by approving the bailout of Spanish banks and establishing some broad goals toward greater fiscal and political union.
While Europe worked to stem its debt crisis, the U.S. struggled with slowing growth and its own fiscal hurdles. After showing signs of improvement earlier in the year, U.S.
economic data came in weaker than expected during the second quarter. After a few months of decent job growth, the labor market recovery lost momentum. Political, fiscal and regulatory uncertainty in the U.S. — combined with slowing global growth from the European fiscal crisis — resulted in a slowdown in hiring. In turn, consumer spending, which accounts for a majority of gross domestic product, weakened as confidence in the economic recovery waned. In addition, the housing sector’s contribution to growth was minimal. Despite a gradual improvement in activity, the housing market continued to bump along the bottom as access to credit remained tight and inventories of foreclosed properties remained high. The looming “fiscal cliff” also increased uncertainty about the economic recovery. The Congressional Budget Office estimated that if the full range of tax increases and spending cuts were allowed to take effect at the beginning of next year, the U.S. would enter a mild recession and fewer jobs would be created in 2013.
With economic growth moderating from already modest levels and political brinkmanship making any near-term resolution to the U.S. fiscal situation unlikely, market expectations for additional easing of monetary policy increased. The Federal Reserve Bank (the “Fed”) responded in June by extending Operation Twist — the program allowing it to sell shorter-term Treasuries and buy longer-term Treasuries in an effort to reduce consumer lending rates — through year end. While not as aggressive as another round of quantitative easing, the goal of the maturity extension program is to put downward pressure on longer-term interest rates, thereby making “broader financial conditions more accommodative.” The Fed also expected “that economic conditions – including low rates of resource utilization and a subdued outlook for inflation over the medium run – are likely to warrant exceptionally low levels for the federal funds rate at least through late 2014.” While the bar for a third round of quantitative easing (QE3) is set relatively high, the Fed stated that it’s prepared to take further action if necessary to achieve its dual mandate of maximum employment and price stability. With downside risk to the economic outlook increasing, the Fed may be dipping back into its policy toolbox sooner rather than later.
2
American Beacon Money Market Select FundSM
Performance Overview
June 30, 2012 (Unaudited)
After showing signs of improvement earlier in the year, U.S. economic data came in weaker than expected during the second quarter. After a few months of decent job growth, the labor market recovery lost momentum. Ongoing stress in Europe, slowing economic growth, and uncertain U.S. fiscal policy were the key drivers of market volatility during the first half of 2012.
With economic growth moderating from already modest levels and political brinkmanship making any near-term resolution to the U.S. fiscal situation unlikely, market expectations for additional easing of monetary policy increased. The Fed, responded in June by extending Operation Twist through year-end. The Fed maintained its 0% to 0.25% fed funds target during the first half of the year and extended the timeframe of their pledge to keep the federal funds rate exceptionally low through at least late-2014 from mid-2013.
With credit quality and liquidity continuing to be a priority due to global uncertainty, the American Beacon Money Market Select Fund’s primary strategy for the first half of the year was to buy high quality, short-term money market instruments and overnight investments. The strategies implemented during the period enabled the Fund to outperform its Lipper peer group.
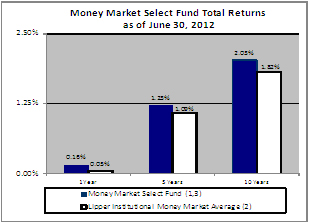
For the six months ended June 30, 2012, the total return of the American Beacon Money Market Select Fund was 0.10%. The Fund outperformed the Lipper Institutional Money Market Average return of 0.03% by 7 basis points (0.07%). Based on annualized total returns, Lipper Analytical Services ranked the Fund 22nd among 302, 47th among 264 and 15th among 171 Institutional Money Market Funds for the one-year, five-year, and ten-year periods ended June 30, 2012, respectively.
*annualized
| | | | | | | | | | | | |
| | | Annualized Total Returns
As of 6/30/2012 | |
| | | 1 Year | | | 5 Years | | | 10 Years | |
Money Market Select(1,2,4) | | | 0.16 | % | | | 1.23 | % | | | 2.03 | % |
Lipper Institutional Money Market Average (3) | | | 0.05 | % | | | 1.07 | % | | | 1.82 | % |
| 1 | Performance shown is historical and is not indicative of future returns. Investment returns will vary, and shares may be worth more or less at redemption than at original purchase. An investment in the Fund is neither insured nor guaranteed by the Federal Deposit Insurance Corporation or any other government agency. Although the Fund seeks to preserve the value of an investment at $1.00 per share, it is possible to lose money by investing in the Fund. Fund performance in the table above does not reflect the deduction of taxes a shareholder would pay on distributions or the redemption of shares. |
| 2 | The Lipper Institutional Money Market Funds Average is calculated by taking an arithmetic average of the returns of the mutual funds in the Lipper Institutional Money Market Funds category. Lipper is an independent mutual fund research and ranking service. |
| 3 | The total annual Fund operating expense ratio set forth in the most recent prospectus for the Fund was 0.16%. The expense ratio above may vary from the expense ratio presented in other sections of this report, which is based on expenses incurred during the period covered by this report. |
3
American Beacon Money Market Select FundSM
Performance Overview
June 30, 2012 (Unaudited)
Fund Statistics as of June 30, 2012
| | |
7-day Current Yield* | | 0.18% |
7-day Effective Yield* | | 0.18% |
30-day Yield* | | 0.19% |
Weighted Avg. Maturity | | 29 Days |
Standard & Poor’s Rating | | AAAm |
| * | Annualized. You may call 1-800-231-4252 to obtain the Funds’ current 7-day yields. Yield is a more accurate reflection of the Funds’ current earnings than total returns. |
Asset Allocation as of June 30, 2012
| | |
| | | % of
Net Assets |
Financial Company Commercial Paper | | 49.0% |
Other Repurchase Agreements | | 36.7% |
Certificate of Deposits | | 5.9% |
Asset-Backed Commercial Paper | | 4.5% |
Government Agency Repurchase Agreements | | 2.8% |
Investment Companies | | 1.1% |
Liabilities, Net of Other Assets | | 0.0% |
Top Ten Holdings
| | |
| | | % of
Net Assets |
Svenska Handelsbanken AB | | 4.5% |
Sumitomo Mitsui Banking Corp. | | 4.5% |
Bank of Tokyo Mitsubishi | | 4.5% |
Oversea-Chinese Banking Corporation Ltd. | | 4.5% |
Kells Funding LLC | | 4.5% |
Nordea Bank AB | | 4.5% |
Rabobank USA Financial Corp. | | 4.2% |
Toyota Credit Canada, Inc. | | 4.5% |
Toronto Dominion Holdings USA, Inc. | | 4.5% |
General Electric Capital Corp. (FDIC Guaranteed) | | 4.5% |
4
American Beacon U.S. Government Money Market Select FundSM
Performance Overview
June 30, 2012 (Unaudited)
After showing signs of improvement earlier in the year, U.S. economic data came in weaker than expected during the second quarter. After a few months of decent job growth, the labor market recovery lost momentum. Ongoing stress in Europe, slowing economic growth, and uncertain U.S. fiscal policy were the key drivers of market volatility during the first half of 2012.
With economic growth moderating from already modest levels and political brinkmanship making any near-term resolution to the U.S. fiscal situation unlikely, market expectations for additional easing of monetary policy increased. The Fed responded in June by extending Operation Twist through year-end. The Fed maintained its 0% to 0.25% fed funds target during the first half of the year and extended the timeframe of their pledge to keep the federal funds rate exceptionally low through at least late-2014 from mid-2013.
The American Beacon U.S. Government Money Market Select Fund’s primary strategy for the first half of the year was to buy both fixed and floating rate agencies and overnight repurchase agreements. The strategies implemented during the period enabled the Fund to outperform its Lipper peer group.
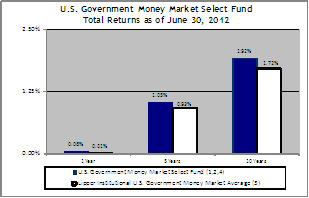
For the six months ended June 30, 2012, the total return of the American Beacon U.S. Government Money Market Select Fund was 0.05%. The Fund outperformed the Lipper Institutional U.S. Government Money Market Average return of 0.01% by 4 basis points (0.04%). Based on annualized total returns, Lipper Analytical Services ranked the Fund 1st among 171, 10th among 131 and 1st among 85 Institutional U.S. Government Money Market Funds for the one-year, five-year, and ten-year periods ended June 30, 2012, respectively.
*annualized
| | | | | | | | | | | | |
| | | Annualized Total Returns
As of 6/30/2012 | |
| | | 1 Year | | | 5 Years | | | 10 Years | |
U.S. Government Money Market Select(1,2,4) | | | 0.06 | % | | | 1.05 | % | | | 1.92 | % |
Lipper Institutional U.S. Government Money Market Average (3) | | | 0.01 | % | | | 0.93 | % | | | 1.72 | % |
| 1 | Performance shown is historical and is not indicative of future returns. Investment returns will vary, and shares may be worth more or less at redemption than at original purchase. An investment in the Fund is neither insured nor guaranteed by the Federal Deposit Insurance Corporation or any other government agency. Although the Fund seeks to preserve the value of an investment at $1.00 per share, it is possible to lose money by investing in the Fund. Fund performance in the table above does not reflect the deduction of taxes a shareholder would pay on distributions or the redemption of shares. |
| 2 | A portion of the fees charged to the Fund has been waived through 2012. Performance prior to waiving fees was lower than the actual returns shown. |
| 3 | The Lipper Institutional U.S. Government Money Market Funds Average is calculated by taking an arithmetic average of the returns of the mutual funds in the Lipper Institutional U.S. Government Money Market Funds category. Lipper is an independent mutual fund research and ranking service. |
| 4 | The total annual Fund operating expense ratio set forth in the most recent prospectus for the Fund was 0.17%. The expense ratio above may vary from the expense ratio presented in other sections of this report, which is based on expenses incurred during the period covered by this report. |
5
American Beacon U.S. Government Money Market Select FundSM
Performance Overview
June 30, 2012 (unaudited)
Fund Statistics as of June 30, 2012
| | | | |
| | | U.S. Government | |
7-day Current Yield* | | | 0.09 | % |
7-day Effective Yield* | | | 0.09 | % |
30-day Yield* | | | 0.10 | % |
Weighted Avg. Maturity | | | 32 Days | |
Standard & Poor’s Rating | | | AAAm | |
| * | Annualized. You may call 1-800-231-4252 to obtain the Funds’ current 7-day yields. Yield is a more accurate reflection of the Funds’ current earnings than total returns. |
Top Holdings
| | | | |
| | | % of Net
Assets | |
Federal Home Loan Banks | | | 20.6 | % |
Federal Home Loan Discount Note | | | 10.0 | % |
Federal Home Loan Mortgage Corp. | | | 8.4 | % |
Federal National Mortgage Association | | | 5.0 | % |
Straight-A Funding LLC (Liquidity Facility Federal Financing Bank) | | | 4.5 | % |
Asset Allocation as of June 30, 2012
| | | | |
| | | % of Net
Assets | |
U.S. Government and Government Agency Obligations | | | 48.5 | % |
Government Agency Repurchase Agreements | | | 33.7 | % |
Other Repurchase Agreements | | | 17.8 | % |
Liabilities, Net of Other Assets | | | 0.0 | % |
6
American Beacon Select FundsSM
Fund Expenses
June 30, 2012 (Unaudited)
Fund Expense Example
As a shareholder of a Fund, you incur two types of costs: (1) transaction costs and (2) ongoing costs, including management fees, administrative service fees, and other Fund expenses. The examples below are intended to help you understand the ongoing cost (in dollars) of investing in a Fund and to compare these costs with the ongoing costs of investing in other mutual funds. The examples are based on an investment of $1,000 invested at the beginning of the period and held for the entire period from January 1, 2012 through June 30, 2012.
Actual Expenses
The “Actual” lines of the table provide information about actual account values and actual expenses. You may use the information in these lines, together with the amount you invested, to estimate the expenses that you paid over the period. Simply divide your account value by $1,000 (for example, an $8,600 account value divided by $1,000 = 8.6), then multiply the result by the number in the “Actual” line under the heading “Expenses Paid During Period” for the applicable Fund to estimate the expenses you paid on your account during this period.
Hypothetical Example for Comparison Purposes
The “Hypothetical” lines of the table provide information about hypothetical account values and hypothetical expenses based on a Fund’s actual expense ratio and an assumed 5% per year rate of return before expenses (not a Fund’s actual return).
You may compare the ongoing costs of investing in a Fund with other funds by contrasting this 5% hypothetical example and the 5% hypothetical examples that appear in the shareholder reports of the other funds. The hypothetical account values and expenses may not be used to estimate the actual ending account balance or expenses you paid for the period.
You should also be aware that the expenses shown in the table highlight only your ongoing costs and do not reflect any transaction costs charged by the Funds. Similarly, the expense examples for other funds do not reflect any transaction costs charged by those funds, such as sales charges (loads), redemption fees or exchange fees. Therefore, the “Hypothetical” lines of the table are useful in comparing ongoing costs only and will not help you determine the relative total costs of owning different funds. If you were subject to any transaction costs during the period, your costs would have been higher.
| | | | | | | | | | | | |
| | | Beginning
Account
Value
1/1/12 | | | Ending
Account
Value
6/30/12 | | | Expenses paid
During Period*
1/1/12 -
6/30/12 | |
Money Market | | | | | | | | | | | | |
Actual | | $ | 1,000.00 | | | $ | 1,000.97 | | | $ | 0.60 | |
Hypothetical (5% return before expenses) | | $ | 1,000.00 | | | $ | 1,024.27 | | | $ | 0.60 | |
U.S. Government Money Market | | | | | | | | | | | | |
Actual | | $ | 1,000.00 | | | $ | 1,000.48 | | | $ | 0.70 | |
Hypothetical (5% return before expenses) | | $ | 1,000.00 | | | $ | 1,024.17 | | | $ | 0.70 | |
| * | Expenses are equal to the Fund’s annualized expense ratios for the six-month period of 0.12% and 0.14% for the Money Market Select and U.S. Government Money Market Select Funds respectively, multiplied by the average account value over the period, multiplied by the number derived by dividing the number of days in the most recent fiscal half-year (182) by days in the year (366) to reflect the half-year period. |
7
American Beacon Money Market Select FundSM
Schedule of Investments
June 30, 2012 (Unaudited)
| | | | | | | | |
| | | Par Amount | | | Fair Value | |
| | | | | | (000’s) | |
ASSET-BACKED COMMERCIAL PAPER- 4.53% (Cost $31,985) | | | | | | | | |
Kells Funding LLC, 0.41%, Due 8/13/2012 A B | | $ | 32,000 | | | $ | 31,985 | |
| | | | | | | | |
CERTIFICATE OF DEPOSITS- 5.95% | | | | | | | | |
Canadian Imperial Bank of Commerce NY, 0.335%, Due 7/25/2012 C | | | 10,000 | | | | 10,000 | |
Svenska Handelsbanken NY, 0.29%, Due 9/10/2012 | | | 32,000 | | | | 32,000 | |
| | | | | | | | |
Total Certificate of Deposits (Cost $42,000) | | | | | | | 42,000 | |
| | | | | | | | |
FINANCIAL COMPANY COMMERCIAL PAPER- 48.96% | | | | | | | | |
Bank of Nova Scotia, 0.21%, Due 9/7/2012 | | | 15,000 | | | | 14,994 | |
Bank of Tokyo Mitsubishi UFS NY, 0.36%, Due 7/23/2012 | | | 32,000 | | | | 31,993 | |
Commonwealth Bank of Australia, 0.205%, Due 8/21/2012 B | | | 15,000 | | | | 14,996 | |
DNB Bank ASA, | | | | | | | | |
0.365%, Due 7/2/2012 B | | | 15,000 | | | | 15,000 | |
0.30%, Due 8/21/2012 B | | | 17,000 | | | | 16,993 | |
General Electric Capital Corp., 0.23%, Due 7/30/2012 | | | 32,000 | | | | 31,994 | |
Nordea North America Inc., 0.29%, Due 8/31/2012 | | | 32,000 | | | | 31,984 | |
Oversea-Chinese Banking Corporation Ltd., | | | | | | | | |
0.27%, Due 8/22/2012 | | | 10,000 | | | | 9,996 | |
0.26%, Due 9/5/2012 | | | 22,000 | | | | 21,990 | |
Rabobank USA Financial Corp., 0.39%, Due 7/16/2012 | | | 30,000 | | | | 29,995 | |
Sumitomo Mitsui Banking Corp., 0.36%, Due 7/19/2012 B | | | 32,000 | | | | 31,995 | |
Toronto Dominion Holdings USA, Inc., 0.19%, Due 8/17/2012 B | | | 32,000 | | | | 31,992 | |
Toyota Motor Credit Corp., 0.25%, Due 8/29/2012 | | | 32,000 | | | | 31,987 | |
Westpac Banking Corp., 0.25%, Due 9/14/2012 B | | | 30,000 | | | | 29,984 | |
| | | | | | | | |
Total Financial Company Commercial Paper (Cost $345,893) | | | | | | | 345,893 | |
| | | | | | | | |
| | |
| | | Shares | | | | |
INVESTMENT COMPANIES - 1.07% (Cost $7,532) | | | | | | | | |
State Street Institutional Liquidity Reserves Fund, Institutional Class | | | 7,532,273 | | | | 7,532 | |
| | | | | | | | |
| | |
| | | Par Amount | | | | |
GOVERNMENT AGENCY REPURCHASE AGREEMENTS - 2.83% (Cost $20,006) | | | | | | | | |
Goldman Sachs & Co., 0.25%, Due 7/2/2012 (Held at Bank of New York Mellon, Collateralized by a U.S Government Agency Obligation valued at $20,407, 2.481%, 5/1/42) | | $ | 20,006 | | | | 20,006 | |
| | | | | | | | |
OTHER REPURCHASE AGREEMENTS - 36.67% | | | | | | | | |
Barclays Capital, Inc., 0.38%, Due 7/2/2012 (Held at Bank of New York Mellon, Collateralized by a U.S. Government Agency Obligation and Corporate Obligations valued at $36,060, 6.0% - 12.0%, 12/1/15 - 4/15/2040) | | | 34,000 | | | | 34,000 | |
BNP Paribas Securities Corp., 0.38%, Due 7/2/2012 (Held at Bank of New York Mellon, Collateralized by Corporate Obligations valued at $37,400, 3.88% - 11.88%, 10/31/13 - 12/8/99) | | | 34,000 | | | | 34,000 | |
Credit Suisse Securities (USA) LLC, 0.25%, Due 7/2/2012 (Held at JPMorgan Chase, Collateralized by Equity Securities and Corporate Obligations valued at $34,653, 5.88% - 10.38%, 2/27/14 - 8/15/18)A | | | 33,000 | | | | 33,000 | |
Deutsche Bank Securities, Inc., 0.28%, Due 7/2/2012 (Held at Bank of New York Mellon, Collateralized by Equity Securities valued at $36,300) | | | 33,000 | | | | 33,000 | |
JPMorgan Securities, LLC., 0.35%, Due 7/02/2012 (Held at JPMorgan Chase, Collateralized by Mortgage Loan Obligations valued at $13,650, 0.41%, 9/25/36 - 12/25/37 Due 7/30/2012) | | | 13,000 | | | | 13,000 | |
JPMorgan Securities, LLC., 0.35%, Due 7/30/2012 (Held at JPMorgan Chase, Collateralized by Mortgage Loan Obligations valued at $22,051, 0.40% - 1.05%, 8/26/36 - 8/25/47) | | | 21,000 | | | | 21,000 | |
Merrill Lynch, Pierce, Fenner & Smith, Inc., 0.25%, Due 7/2/2012 (Held at Bank of New York Mellon, Collateralized by Equity Securities valued at $33,000) | | | 30,000 | | | | 30,000 | |
RBC Capital Markets LLC., 0.17%, Due 7/2/2012 (Held at Bank of New York Mellon, Collateralized by Municipal Securities valued at $32,550, 0.0% - 7.5%, 8/1/12 - 6/1/47) | | | 31,000 | | | | 31,000 | |
Wells Fargo Securities LLC, 0.30%, Due 7/2/2012 (Held at Bank of New York Mellon, Collateralized by Corporate Obligations valued at $31,500, 0.0% - 10.88%, 10/25/13 - 12/31/99)A | | | 30,000 | | | | 30,000 | |
| | | | | | | | |
Total Other Repurchase Agreements (Cost $259,000) | | | | | | | 259,000 | |
| | | | | | | | |
See accompanying notes
8
American Beacon Money Market Select FundSM
Schedule of Investments
June 30, 2012 (Unaudited)
| | | | | | |
TOTAL INVESTMENTS - 100.01% (Cost $706,416) | | | | $ | 706,416 | |
LIABILITIES, NET OF OTHER ASSETS - (0.01%) | | | | | (98 | ) |
TOTAL NET ASSETS - 100.00% | | | | $ | 706,318 | |
| | | | | | |
Percentages are stated as a percent of net assets.
All rates represent either the annualized yield at the date of purchase, or the stated coupon rate, or, for floating and adjustable rate securities, the rate at period end.
| A | Limited Liability Company. |
| B | Security exempt from registration under the Securities Act of 1933. These securities may be resold to qualified institutional buyers pursuant to Rule 144A. At the period end, the value of these securities amounted to $172,944 or 24.49% of net assets. The Fund has no right to demand registration of these securities. |
| C | Floating or adjustable rate securities. The due date on these types of securities reflects the final maturity date. |
See accompanying notes
9
American Beacon U.S. Government Money Market Select FundSM
Schedule of Investments
June 30, 2012 (Unaudited)
| | | | | | | | |
| | | Par Amount | | | Fair Value | |
| | | | | | (000’s) | |
U.S. GOVERNMENT and GOVERNMENT AGENCY OBLIGATIONS - 48.47% | | | | | | | | |
Federal Home Loan Bank, | | | | | | | | |
0.16%, Due 8/29/2012 | | $ | 8,000 | | | $ | 7,998 | |
0.25%, Due 9/19/2012 A | | | 1,250 | | | | 1,250 | |
0.17%, Due 10/16/2012 | | | 5,000 | | | | 4,997 | |
0.19%, Due 11/1/2012 | | | 5,000 | | | | 4,997 | |
0.20%, Due 11/19/2012 | | | 10,000 | | | | 10,000 | |
0.18%, Due 11/23/2012 | | | 5,000 | | | | 5,000 | |
0.12%, Due 12/3/2012 | | | 8,500 | | | | 8,498 | |
0.30%, Due 2/5/2013 A | | | 5,000 | | | | 5,001 | |
0.35%, Due 2/25/2013 A | | | 7,300 | | | | 7,305 | |
Federal Home Loan Mortgage Corp., 0.34%, Due 1/10/2013 A | | | 15,000 | | | | 15,007 | |
Federal National Mortgage Association, 0.265%, Due 11/23/2012 A | | | 8,922 | | | | 8,926 | |
Straight A Funding LLC, | | | | | | | | |
0.18%, Due 7/23/2012 BC | | | 5,000 | | | | 4,999 | |
0.18%, Due 8/2/2012 BC | | | 3,000 | | | | 3,000 | |
| | | | | | | | |
Total U.S. Government and Government Agency Obligations (Cost $86,978) | | | | | | | 86,978 | |
| | | | | | | | |
GOVERNMENT AGENCY REPURCHASE AGREEMENTS - 33.72% | | | | | | | | |
Barclays Capital, Inc., 0.15%, Due 7/2/2012 (Held at Bank of New York Mellon, Collateralized by a U.S Treasury Obligation valued at $20,400, 4.50%, 8/15/39) | | | 20,000 | | | | 20,000 | |
BNP Paribas Securities Corp., 0.18%, Due 7/2/2012 (Held at Bank of New York Mellon, Collateralized by a U.S. Government Agency Obligation valued at $30,600, 3.50%, 1/1/26) | | | 30,000 | | | | 30,000 | |
Goldman Sachs & Co., 0.25%, Due 7/2/2012 (Held at Bank of New York Mellon, Collateralized by a U.S. Government Agency Obligation valued $10,723, 2.48%, 5/1/42) | | | 10,513 | | | | 10,513 | |
| | | | | | | | |
Total Government Agency Repurchase Agreements (Cost $60,513) | | | | | | | 60,513 | |
| | | | | | | | |
OTHER REPURCHASE AGREEMENTS - 17.83% | | | | | | | | |
Barclays Capital, Inc., 0.38%, Due 7/2/2012 (Held at Bank of New York Mellon, Collateralized by a U.S. Government Agency Obligation valued at $8,160, 6.00%, 8/15/40) | | | 8,000 | | | | 8,000 | |
BNP Paribas Securities Corp., 0.38%, Due 7/2/2012 (Held at Bank of New York Mellon, Collateralized by Corporate Obligations valued at $8,800, 5.63% - 7.25, 4/15/15 - 9/15/27) | | | 8,000 | | | | 8,000 | |
Deutsche Bank Securities, Inc., 0.28%, Due 7/2/2012 (Held at Bank of New York Mellon, Collateralized by Equity Securities valued at $8,800) | | | 8,000 | | | | 8,000 | |
JPMorgan Securities, LLC., 0.35%, Due 7/2/2012 (Held at JPMorgan Chase, Collateralized by Mortgage Loan Obligations valued at $8,400, 0.41%, 9/25/36 - 12/25/37)C | | | 8,000 | | | | 8,000 | |
| | | | | | | | |
Total Other Repurchase Agreements (Cost $32,000) | | | | | | | 32,000 | |
| | | | | | | | |
TOTAL INVESTMENTS - 100.02% (Cost $179,491) | | | | | | | 179,491 | |
LIABILITIES, NET OF OTHER ASSETS - (0.02%) | | | | | | | (45 | ) |
TOTAL NET ASSETS - 100.00% | | | | | | $ | 179,446 | |
| | | | | | | | |
Percentages are stated as a percent of net assets.
All rates represent either the annualized yield at the date of purchase, or the stated coupon rate, or, for floating and adjustable rate securities, the rate at period end.
| A | Floating or adjustable rate securities. The due date on these types of securities reflects the final maturity date. |
| B | Security exempt from registration under the Securities Act of 1933. These securities may be resold to qualified institutional buyers pursuant to Rule 144A. At the period end, the value of these securities amounted to $7,999 or 4.46% of net assets. The Fund has no right to demand registration of these securities. |
| C | Limited Liability Company. |
See accompanying notes
10
American Beacon Select FundsSM
Statements of Assets and Liabilities
June 30, 2012 (Unaudited) (in thousands, except share and per share amounts)
| | | | | | | | |
| | | Money Market | | | U.S. Government
Money Market | |
Assets: | | | | | | | | |
Investments in securities, at fair value (cost—$427,410 and 86,978) | | $ | 427,410 | | | $ | 86,978 | |
Repurchase agreements, at fair value (cost—$279,006 and 92,513) | | | 279,006 | | | | 92,513 | |
Receivable for fund shares sold | | | 1 | | | | 11 | |
Dividends and interest receivable | | | 15 | | | | 23 | |
| | | | | | | | |
Total assets | | | 706,432 | | | | 179,525 | |
| | | | | | | | |
Liabilities: | | | | | | | | |
Payable for fund shares redeemed | | | 7 | | | | — | |
Management and investment advisory fees payable (Note 2) | | | 53 | | | | 15 | |
Dividends payable | | | 11 | | | | 16 | |
Administrative service and service fees payable (Note 2) | | | 6 | | | | 2 | |
Professional fees payable | | | 9 | | | | 18 | |
Custody and fund accounting fees payable | | | 8 | | | | 6 | |
Transfer agent fees payable | | | — | | | | 4 | |
Trustee fees payable | | | — | | | | 6 | |
Payable for prospectus and shareholder reports | | | 3 | | | | 5 | |
Insurance fees payable | | | — | | | | 2 | |
Other liabilities | | | 17 | | | | 5 | |
| | | | | | | | |
Total liabilities | | | 114 | | | | 79 | |
| | | | | | | | |
Net Assets | | $ | 706,318 | | | $ | 179,446 | |
| | | | | | | | |
Analysis of Net Assets: | | | | | | | | |
Paid-in-capital | | | 706,260 | | | | 179,446 | |
Undistributed net investment income | | | 58 | | | | — | |
| | | | | | | | |
Net assets | | $ | 706,318 | | | $ | 179,446 | |
| | | | | | | | |
Shares outstanding at no par value (Unlimited shares authorized) | | | 706,259,730 | | | | 179,446,101 | |
Net Assets | | $ | 706,317,736 | | | $ | 179,446,096 | |
Net asset value, offering and redemption price per share | | $ | 1 .00 | | | $ | 1 .00 | |
See accompanying notes
11
American Beacon Select Funds
Statements of Operations
For the Six Months ended June 30, 2012 (in thousands)
| | | | | | | | |
| | | Money Market | | | U.S. Government
Money Market | |
Investment Income: | | | | | | | | |
Dividend income | | $ | 26 | | | $ | — | |
Interest income | | | 1,055 | | | | 285 | |
| | | | | | | | |
Total investment income | | | 1,081 | | | | 285 | |
| | | | | | | | |
Fund Expenses: | | | | | | | | |
Management and investment advisory fees (Note 2) | | | 310 | | | | 110 | |
Custodian fees | | | 40 | | | | 14 | |
Administrative service fees (Note 2) | | | 34 | | | | 12 | |
Transfer agent fees | | | 1 | | | | 5 | |
Professional fees | | | 16 | | | | 22 | |
Printing expense | | | 1 | | | | 3 | |
Trustee expense | | | 8 | | | | 9 | |
Insurance expense | | | 18 | | | | 6 | |
Other expenses | | | — | | | | 1 | |
| | | | | | | | |
Total expenses | | | 427 | | | | 182 | |
| | | | | | | | |
Net fees waived and expenses reimbursed (Note 2) | | | — | | | | (9 | ) |
| | | | | | | | |
Net expenses | | | 427 | | | | 173 | |
| | | | | | | | |
Net investment income | | | 654 | | | | 112 | |
| | | | | | | | |
Realized Gains: | | | | | | | | |
Net realized gain from investments | | | 18 | | | | 4 | |
| | | | | | | | |
Net increase in net assets resulting from operations | | $ | 672 | | | $ | 116 | |
| | | | | | | | |
Statement of Changes in Net Assets (in thousands)
| | | | | | | | | | | | | | | | |
| | | Money Market | | | U.S. Government Money Market | |
| | | Six Months ended
June 30, 2012 | | | Year ended
December 31,
2011 | | | Six Months ended
June 30, 2012 | | | Year ended
December 31,
2011 | |
| | | (unaudited) | | | | | | (unaudited) | | | | |
Increase in Net Assets: | | | | | | | | | | | | | | | | |
Operations: | | | | | | | | | | | | | | | | |
Net investment income | | $ | 654 | | | $ | 895 | | | $ | 112 | | | $ | 140 | |
Net realized gain on investments | | | 18 | | | | 24 | | | | 4 | | | | 1 | |
| | | | | | | | | | | | | | | | |
Net increase in net assets resulting from operations | | | 672 | | | | 919 | | | | 116 | | | | 141 | |
| | | | | | | | | | | | | | | | |
Distributions to Shareholders: | | | | | | | | | | | | | | | | |
Net investment income | | | (649 | ) | | | (842 | ) | | | (112 | ) | | | (140 | ) |
Net realized gain on investments | | | (18 | ) | | | (24 | ) | | | (4 | ) | | | (1 | ) |
| | | | | | | | | | | | | | | | |
Distributions to shareholders | | | (667 | ) | | | (866 | ) | | | (116 | ) | | | (141 | ) |
| | | | | | | | | | | | | | | | |
Capital Share Transactions (at $1.00 per share): | | | | | | | | | | | | | | | | |
Proceeds from sales of shares | | | 417,976 | | | | 329,726 | | | | 672,414 | | | | 2,059,170 | |
Reinvestment of dividends and distributions | | | 599 | | | | 780 | | | | 4 | | | | 19 | |
Cost of shares redeemed | | | (374,772 | ) | | | (313,607 | ) | | | (746,748 | ) | | | (2,130,108 | ) |
| | | | | | | | | | | | | | | | |
Net increase (decrease) in net assets | | | 43,803 | | | | 16,899 | | | | (74,330 | ) | | | (70,919 | ) |
| | | | | | | | | | | | | | | | |
Net increase (decrease) in net assets | | | 43,808 | | | | 16,952 | | | | (74,330 | ) | | | (70,919 | ) |
| | | | | | | | | | | | | | | | |
Net Assets: | | | | | | | | | | | | | | | | |
Beginning of period | | | 662,509 | | | | 645,557 | | | | 253,776 | | | | 324,695 | |
| | | | | | | | | | | | | | | | |
End of Period* | | $ | 706,318 | | | $ | 662,509 | | | $ | 179,446 | | | $ | 253,776 | |
| | | | | | | | | | | | | | | | |
* Includes undistributed net investment income of | | $ | 58 | | | $ | 53 | | | $ | — | | | $ | — | |
| | | | | | | | | | | | | | | | |
See accompanying notes
12
American Beacon Select FundsSM
Notes to Financial Statements
June 30, 2012 (Unaudited)
| 1. | Organization and Significant Accounting Policies |
American Beacon Select Funds (the “Trust”) is organized as a Massachusetts business trust and is registered under the Investment Company Act of 1940 (the “Act”), as amended, as a diversified, open-end management investment company with separate series. The following series are included in this report: American Beacon Money Market Select Fund (the “Money Market Fund”) and American Beacon U.S. Government Money Market Select Fund (the “Government Fund”)(each a “Fund” and collectively, the “Funds”).
American Beacon Advisors, Inc. (the “Manager”) is a wholly owned subsidiary of Lighthouse Holdings, Inc. and was organized in 1986 to provide business management, advisory, administrative and asset management consulting services to the Trust and other investors.
New Accounting Pronouncements
In May 2011, the Financial Accounting Standards Board (“FASB”) issued an Accounting Standards Update (“ASU”) ASU No. 2011-04 “Amendments to Achieve Common Fair Value Measurement and Disclosure Requirements in U.S. Generally Accepted Accounting Principles (“U.S. GAAP”) and the International Financial Reporting Standards (“IFRSs”)”. ASU No. 2011-04 amends FASB ASC Topic 820, Fair Value Measurements and Disclosures, to establish common requirements for measuring fair value and for disclosing information about fair value measurements in accordance with U.S. GAAP and IFRSs. ASU No. 2011-04 is effective for fiscal years beginning after December 15, 2011 and for interim period January 1, 2012 to June 30, 2012.
Management has evaluated the implications of these changes and determined that the impact of the new guidance will only affect the disclosure requirements related to the financial statements. However, as the Fund did not hold any Level 3 investments as of June 30, 2012, the financial statement disclosures were not affected.
| 2. | Transactions with Affiliates |
Management Agreement
The Funds and the Manager are parties to a Management Agreement that obligates the Manager to provide or oversee the provisions of all investment advisory and portfolio management services. The Manager serves as the sole investment advisor to the Funds. As compensation for performing the duties required under the Management Agreement, the Manager receives 0.09% of the average daily net assets of the Funds.
Administrative Services Agreement
The Manager and the Funds entered into an Administrative Services Agreement that obligates the Manager to provide or oversee administrative services to the Funds. As compensation for performing the duties required under the Administrative Services Agreement, the Manager receives an annualized fee of 0.01% of the average daily net assets of the Funds.
Expense Reimbursement Plan
The Manager voluntarily agreed to reimburse the Government Fund for other expenses. For the six months ended June 30, 2012, the Manager reimbursed expenses totaling $8,810 to the Government Fund.
The Funds have adopted an Expense Reimbursement Plan whereby the Manager may seek recoupment of expenses reimbursed for a period of up to three years. However, recoupment will occur only if a Fund’s average net assets have grown or expenses have declined sufficiently to allow recoupment without causing its expense ratio to exceed the previously agreed upon contractual expense limit.
13
American Beacon Select FundsSM
Notes to Financial Statements
June 30, 2012 (Unaudited)
Reimbursed expenses subject to potential recovery for the Government Fund totaling $88,851, $13,786, and $18,452 will expire in 2012, 2013 and 2014 respectively. The Funds have not recorded a liability for these potential reimbursements due to the current assessment that reimbursements are unlikely.
| 3. | Security Valuation and Fair Value Measurements |
Each Fund values its investments and computes the net asset value per share each day that the New York Stock Exchange is open for business. In accordance with Rule 2a-7 under the Act, money market securities are valued at amortized cost, which approximates fair value. Securities for which amortized cost is deemed not to reflect fair value are stated at fair value as determined in good faith by the Valuation Committee, established by the Trust’s Board of Trustees (the “Board”). In the event that a deviation of 1/2 of 1% or more exists between the $1.00 per share price of a Fund, calculated at amortized cost, and the price per share calculated by reference to market quotations, or if there is any other deviation that the Board believes would result in a material dilution to shareholders or purchasers, the Board will promptly consider the appropriate action that should be initiated.
Valuation Inputs
Various inputs may be used to determine the fair value of the Funds’ investments. These inputs are summarized in three broad levels for financial statement purposes.
| | | | |
| Level 1 | | — | | Quoted prices in active markets for identical securities. |
| | |
| Level 2 | | — | | Prices determined using other significant observable inputs. These may include quoted prices for similar securities, interest rates, prepayment speeds, credit risk, and others. Level 2 securities are fixed income securities that are valued using observable inputs as stated above. |
| | |
| Level 3 | | — | | Prices determined using other significant unobservable inputs. Unobservable inputs reflect the Fund’s own assumptions about the factors market participants would use in pricing an investment, and would be based on the best information available. |
Observable inputs are those based on market data obtained from sources independent of the fund, and unobservable inputs reflect the fund’s own assumptions based on the best information available. The input levels are not necessarily an indication of the risk or liquidity associated with financial instruments at that level. For example, securities held by a money market fund are generally high quality and liquid; however, they are reflected as Level 2 because the inputs used to determine fair value are not quoted prices in an active market.
The Funds’ investments are summarized by level based on the inputs used to determine their values. During the six months ended June 30, 2012, there were no significant transfers between levels. At June 30, 2012, the investments were classified as described below (in thousands):
| | | | | | | | | | | | | | | | |
Money Market Fund | | Level 1 | | | Level 2 | | | Level 3 | | | Total | |
Asset-Backed Commercial Paper | | $ | — | | | $ | 31,985 | | | $ | — | | | $ | 31,985 | |
Certificates of Deposit | | | — | | | | 42,000 | | | | — | | | | 42,000 | |
Financial Company Commercial Paper | | | — | | | | 345,893 | | | | — | | | | 345,893 | |
Investment Companies | | | 7,532 | | | | — | | | | — | | | | 7,532 | |
Government Agency Repurchase Agreements | | | — | | | | 20,006 | | | | — | | | | 20,006 | |
Other Repurchase Agreements | | | — | | | | 259,000 | | | | — | | | | 259,000 | |
| | | | | | | | | | | | | | | | |
Total Investments in Securities | | $ | 7,532 | | | $ | 698,884 | | | $ | — | | | $ | 706,416 | |
| | | | | | | | | | | | | | | | |
| | | | | | | | | | | | | | | | |
Government Fund | | Level 1 | | | Level 2 | | | Level 3 | | | Total | |
U.S. Government and U.S. Agency Obligations | | $ | — | | | $ | 86,978 | | | $ | — | | | $ | 86,978 | |
Government Agency Repurchase Agreements | | | — | | | | 60,513 | | | | — | | | | 60,513 | |
Other Repurchase Agreements | | | — | | | | 32,000 | | | | — | | | | 32,000 | |
| | | | | | | | | | | | | | | | |
Total Investments in Securities | | $ | — | | | $ | 179,491 | | | $ | — | | | $ | 179,491 | |
| | | | | | | | | | | | | | | | |
14
American Beacon Select FundsSM
Notes to Financial Statements
June 30, 2012 (Unaudited)
Security Transactions and Investment Income
Security transactions for the Funds are recorded on the trade date of the security purchase or sale.
Interest income for the Funds is earned from settlement date, recorded on an accrual basis, and adjusted, if necessary, for amortization of premiums or accretion of discounts on investment grade short-term securities and zero coupon instruments. For financial and tax reporting purposes, realized gains and losses are determined on the basis of specific lot identification.
Dividends to Shareholders
Dividends from net investment income and net short-term capital gain, if any, will be declared and paid monthly. Dividends to shareholders are determined in accordance with federal income tax principles that may treat certain transactions differently than U.S. GAAP.
Use of Estimates
The preparation of financial statements in conformity with U.S. GAAP requires management to make estimates and assumptions that affect the amounts reported in the financial statements and accompanying notes. Actual results may differ from those estimated.
Other
Under the Trust’s organizational documents, its officers and trustees are indemnified against certain liability arising out of the performance of their duties to the Trust. In the normal course of business, the Trust enters into contracts that provide indemnification to the other party or parties against potential costs or liabilities. The Trust’s maximum exposure under these arrangements is dependent on claims that may be made in the future and, therefore, cannot be estimated. The Trust has had no prior claims or losses pursuant to any such agreement.
| 4. | Securities and Other Investments |
Repurchase Agreements
Under the terms of a repurchase agreement, securities are acquired by the Funds from a securities dealer or a bank that are subject to resale at a later date. Repurchase agreements are fully collateralized by government or non-government securities. All collateral is valued at cost, which approximates fair value and is held at the custodian bank. The collateral is monitored daily by the Manager from reports provided by the custody bank to make the determination that the collateral’s fair value exceeds the carrying value of the repurchase agreement plus accrued interest.
Restricted Securities
Certain Funds may invest in securities that are subject to legal or contractual restrictions on resale. These securities may be sold privately, but are required to be registered or exempted from such registration before being sold to the public. Private placement securities are generally considered to be restricted except for those securities traded between qualified institutional investors under the provisions of Rule 144A of the Securities Act of 1933. Disposal of restricted securities may involve time-consuming negotiations and expenses, and prompt sale at an acceptable price may be difficult to achieve. Restricted securities outstanding at the period ended June 30, 2012 are disclosed in the Notes to the Schedules of Investments.
15
American Beacon Select FundsSM
Notes to Financial Statements
June 30, 2012 (Unaudited)
It is the policy of each Fund to qualify as a regulated investment company, by complying with all applicable provisions of Subchapter M of the Internal Revenue Code, as amended, and to make distribution of taxable income sufficient to relieve it from substantially all federal income and excise taxes. For federal income tax purposes, each Fund is treated as a single entity for the purpose of determining such qualification.
The Funds do not have any unrecognized tax benefits in the accompanying financial statements. Each of the tax years in the four year period ended December 31, 2011 remains subject to examination by the Internal Revenue Service. If applicable, the Funds recognize interest accrued related to unrecognized tax benefits in interest expense and penalties in “Other expense” on the Statements of Operations.
Dividends are categorized in accordance with income tax regulations which may treat certain transactions differently than U.S. GAAP. Accordingly, the character of distributions and composition of net assets for tax purposes may differ from those reflected in the accompanying financial statements.
The tax character of distributions paid were as follows (in thousands):
| | | | | | | | | | | | | | | | |
| | | Money Market | | | U.S. Government Money Market | |
| | | Six Months Ended
June 30,
2012 | | | Year Ended
December 31,
2011 | | | Six Months Ended
June 30,
2012 | | | Year Ended
December 31,
2011 | |
| | | (unaudited) | | | | | | (unaudited) | | | | |
Distributions paid from: | | | | | | | | | | | | | | | | |
Ordinary income* | | $ | 667 | | | $ | 866 | | | $ | 116 | | | $ | 141 | |
| | | | | | | | | | | | | | | | |
Total distributions paid | | $ | 667 | | | $ | 866 | | | $ | 116 | | | $ | 141 | |
| | | | | | | | | | | | | | | | |
| * | For tax purposes short-term capital gains distributions are considered ordinary income distributions. |
As of June 30, 2012, the components of distributable earnings on a tax basis were the same as book. The cost basis of investments for federal income tax purposes was also the same as the book basis.
On December 22, 2010, the Regulated Investment Company Modernization Act of 2010 (the “RIC MOD”) was enacted, which changed various technical rules governing the tax treatment of regulated investment companies. The changes are generally effective for taxable years beginning after the date of enactment. One of the more prominent changes addresses capital loss carryforwards. Under the RIC MOD, each Fund will be permitted to carry forward capital losses incurred in taxable years beginning after the date of enactment for an unlimited period. However, any losses incurred during those future taxable years will be required to be utilized prior to the losses incurred in pre-enactment taxable years, which carry an expiration date. As a result of this ordering rule, pre-enactment capital loss carryforwards may be more likely to expire unused. Additionally, post-enactment capital loss carryforwards will retain their character as either short-term or long-term capital losses rather than being considered all short-term as permitted under previous regulation.
Finally, the RIC MOD contains several provisions aimed at preserving the character of distributions made by a fiscal year RIC during the portion of its taxable year ending after October 31 or December 31, reducing the circumstances under which a RIC might be required to file amended Forms 1099 to restate previously reported distributions. Except for the simplification provisions related to RIC qualification, the RIC MOD is effective for taxable years beginning after December 22, 2010. The provisions related to RIC qualification are effective for taxable years for which the extended due date of the tax return is after December 22, 2010.
The Funds did not have capital loss carryforwards as of June 30, 2012.
16
American Beacon Money Market Select FundSM
Financial Highlights
(For a share outstanding throughout the period)
| | | | | | | | | | | | | | | | | | | | | | | | |
| | | Six Months
Ended June 30,
2012 | | | Year Ended December 31, | |
| | | | 2011 | | | 2010 | | | 2009 | | | 2008 | | | 2007 | |
| | | (unaudited) | | | | | | | | | | | | | | | | |
Net asset value, beginning of period | | $ | 1 .00 | | | $ | 1 .00 | | | $ | 1 .00 | | | $ | 1 .00 | | | $ | 1 .00 | | | $ | 1 .00 | |
| | | | | | | | | | | | | | | | | | | | | | | | |
Income from investment operations: | | | | | | | | | | | | | | | | | | | | | | | | |
Net investment incomeA | | | 0 .00 | B | | | 0 .00 | B | | | 0 .00 | B | | | 0 .00 | B | | | 0 .03 | | | | 0 .05 | |
Net realized gain from investments | | | 0 .00 | B | | | 0 .00 | B | | | 0 .00 | B | | | 0 .00 | B | | | 0 .00 | B | | | 0 .00 | B |
| | | | | | | | | | | | | | | | | | | | | | | | |
Total income from investment operations | | | 0 .00 | | | | 0 .00 | | | | 0 .00 | | | | 0 .00 | | | | 0 .03 | | | | 0 .05 | |
| | | | | | | | | | | | | | | | | | | | | | | | |
Less distributions: | | | | | | | | | | | | | | | | | | | | | | | | |
Dividends from net investment income | | | 0 .00 | B | | | 0 .00 | B | | | 0 .00 | B | | | 0 .00 | B | | | (0 .03 | ) | | | (0 .05 | ) |
Distributions from net realized gains on investments | | | 0 .00 | B | | | 0 .00 | B | | | 0 .00 | B | | | 0 .00 | B | | | 0 .00 | B | | | 0 .00 | B |
| | | | | | | | | | | | | | | | | | | | | | | | |
Total distributions | | | 0 .00 | | | | 0 .00 | | | | 0 .00 | | | | 0 .00 | | | | (0 .03 | ) | | | (0 .05 | ) |
| | | | | | | | | | | | | | | | | | | | | | | | |
Net asset value, end of period | | $ | 1 .00 | | | $ | 1 .00 | | | $ | 1 .00 | | | $ | 1 .00 | | | $ | 1 .00 | | | $ | 1 .00 | |
| | | | | | | | | | | | | | | | | | | | | | | | |
Total return | | | 0 .10 | %C | | | 0 .14 | % | | | 0 .21 | % | | | 0 .39 | % | | | 2 .73 | % | | | 5 .32 | % |
| | | | | | | | | | | | | | | | | | | | | | | | |
Ratios and supplemental data: | | | | | | | | | | | | | | | | | | | | | | | | |
Net assets, end of period (in thousands) | | $ | 706,318 | | | $ | 662,509 | | | $ | 645,557 | | | $ | 643,165 | | | $ | 708,366 | | | $ | 8,579,288 | |
Ratios to average net assets (annualized):A | | | | | | | | | | | | | | | | | | | | | | | | |
Expenses, before reimbursements | | | 0 .12 | % | | | 0 .13 | % | | | 0 .13 | % | | | 0 .16 | % | | | 0 .12 | % | | | 0 .11 | % |
Expenses, net of reimbursements | | | 0 .12 | % | | | 0 .13 | % | | | 0 .13 | % | | | 0 .16 | % | | | 0 .12 | % | | | 0 .11 | % |
Net investment income, before reimbursements | | | 0 .19 | % | | | 0 .14 | % | | | 0 .21 | % | | | 0 .38 | % | | | 2 .95 | % | | | 5 .20 | % |
Net investment income, net of reimbursements | | | 0 .19 | % | | | 0 .14 | % | | | 0 .21 | % | | | 0 .38 | % | | | 2 .95 | % | | | 5 .20 | % |
| A | The per share amounts and ratios reflect income and expenses assuming inclusion of the Fund’s proportionate share of the income and expenses of the American Beacon Master Money Market Portfolio which terminated on September 30, 2011. |
| B | Amount is less than $0.01 per share. |
17
American Beacon U.S. Government Money Market Select FundSM
Financial Highlights
(For a share outstanding throughout the period)
| | | | | | | | | | | | | | | | | | | | | | | | |
| | | Six Months
Ended June 30,
2012 | | | Year Ended December 31, | |
| | | | 2011 | | | 2010 | | | 2009 | | | 2008 | | | 2007 | |
| | | (unaudited) | | | | | | | | | | | | | | | | |
Net asset value, beginning of period | | $ | 1 .00 | | | $ | 1 .00 | | | $ | 1 .00 | | | $ | 1 .00 | | | $ | 1 .00 | | | $ | 1 .00 | |
| | | | | | | | | | | | | | | | | | | | | | | | |
Income from investment operations: | | | | | | | | | | | | | | | | | | | | | | | | |
Net investment incomeA | | | 0 .00 | B | | | 0 .00 | B | | | 0 .00 | B | | | 0 .00 | B | | | 0 .02 | | | | 0 .05 | |
Net realized gain from investments | | | 0 .00 | B | | | 0 .00 | B | | | 0 .00 | B | | | 0 .00 | B | | | 0 .00 | B | | | 0 .00 | B |
| | | | | | | | | | | | | | | | | | | | | | | | |
Total income from investment operations | | | 0 .00 | | | | 0 .00 | | | | 0 .00 | | | | 0 .00 | | | | 0 .02 | | | | 0 .05 | |
| | | | | | | | | | | | | | | | | | | | | | | | |
Less distributions: | | | | | | | | | | | | | | | | | | | | | | | | |
Dividends from net investment income | | | 0 .00 | B | | | 0 .00 | B | | | 0 .00 | B | | | 0 .00 | B | | | (0 .02 | ) | | | (0 .05 | ) |
Distributions from net realized gains on investments | | | 0 .00 | B | | | 0 .00 | B | | | 0 .00 | B | | | 0 .00 | B | | | 0 .00 | B | | | 0 .00 | B |
| | | | | | | | | | | | | | | | | | | | | | | | |
Total distributions | | | 0 .00 | | | | 0 .00 | | | | 0 .00 | | | | 0 .00 | | | | (0 .02 | ) | | | (0 .05 | ) |
| | | | | | | | | | | | | | | | | | | | | | | | |
Net asset value, end of period | | $ | 1 .00 | | | $ | 1 .00 | | | $ | 1 .00 | | | $ | 1 .00 | | | $ | 1 .00 | | | $ | 1 .00 | |
| | | | | | | | | | | | | | | | | | | | | | | | |
Total return | | | 0 .05 | %C | | | 0 .04 | % | | | 0 .13 | % | | | 0 .25 | % | | | 2 .32 | % | | | 5 .17 | % |
| | | | | | | | | | | | | | | | | | | | | | | | |
Ratios and supplemental data: | | | | | | | | | | | | | | | | | | | | | | | | |
Net assets, end of period (in thousands) | | $ | 179,446 | | | $ | 253,776 | | | $ | 324,695 | | | $ | 353,444 | | | $ | 374,550 | | | $ | 1,361,459 | |
Ratios to average net assets (annualized):A | | | | | | | | | | | | | | | | | | | | | | | | |
Expenses, before reimbursements | | | 0 .15 | % | | | 0 .14 | % | | | 0 .14 | % | | | 0 .15 | % | | | 0 .13 | % | | | 0 .12 | % |
Expenses, net of reimbursements | | | 0 .14 | % | | | 0 .14 | % | | | 0 .13 | % | | | 0 .12 | % | | | 0 .12 | % | | | 0 .12 | % |
Net investment income, before reimbursements | | | 0 .08 | % | | | 0 .04 | % | | | 0 .12 | % | | | 0 .23 | % | | | 2 .69 | % | | | 4 .98 | % |
Net investment income, net of reimbursements | | | 0 .09 | % | | | 0 .04 | % | | | 0 .12 | % | | | 0 .26 | % | | | 2 .70 | % | | | 4 .99 | % |
| A | The per share amounts and ratios reflect income and expenses assuming inclusion of the Fund’s proportionate share of the income and expenses of the American Beacon U.S. Government Master Money Market Portfolio which terminated on May 18, 2009. |
| B | Amount is less than $0.01 per share. |
18
Disclosure Regarding the Board of Trustees’ Approval of the Management
Agreements of the Funds (Unaudited)
At its May 9, 2012 meeting, the Board of Trustees (“Board”) considered the renewal of the Management Agreement (the “Agreement”) between the Manager and the American Beacon Select Funds (“Select Trust”) on behalf of its series (collectively, the “Funds”). In preparation for the Board’s consideration to renew and approve these Agreements, the Board and its Investment Committee undertook steps to gather and consider information furnished by the Manager and Lipper, Inc. (“Lipper”). The Board, with the assistance of independent legal counsel, requested and received certain relevant information from the Manager.
In addition, the Board’s Investment Committee worked with Lipper to obtain relevant comparative information regarding the performance, fees and expenses of the Funds. The Investment Committee held a separate meeting on May 4, 2012 to consider the information provided by Lipper. Further, the Board took into consideration information furnished for the Board’s review and consideration throughout the year at regular Board and Investment Committee meetings, as well as information specifically prepared in connection with the renewal process.
In connection with the Board’s consideration of the Management Agreement, the Trustees received and evaluated such information as they deemed necessary. The materials requested by the Board included, among other information, the following:
a description of any significant changes (actual or anticipated) to principal activities, personnel, services provided to the Funds, or any other area, including how these changes might affect the Funds;
| | • | | a copy of the firm’s most recent audited or unaudited financial statements, as well as Parts 1 and 2 of its Form ADV registration statement with the SEC; |
| | • | | a summary of any material pending or anticipated litigation or regulatory proceedings involving the Manager or its personnel, including the results of any recent regulatory examination or independent audit; |
| | • | | a comparison of the performance of Fund assets managed or to be managed by the Manager with the performance of other similar accounts managed by the Manager, including a discussion of relative performance versus a peer group average and any remedial measures if the Manager’s performance was materially below that of the peer group; |
| | • | | any actual or anticipated economies of scale in relation to the services the Manager provides or will provide to each Fund and whether the current fee rates charged or to be charged to each Fund reflects these economies of scale for the benefit of the Fund’s investors; |
| | • | | an analysis of compensation, including a comparison with fee rates charged to other clients for which similar services are provided, any proposed changes to the fee schedule, if applicable, and the effect of any fee waivers; |
| | • | | a copy of the firm’s proxy voting policies and procedures and, if applicable, the name of the third party voting service used by the firm; |
| | • | | an evaluation of any other benefits to the Manager or Funds as a result of their relationship, if any; |
| | • | | confirmation that the Manager’s financial condition would not impair its ability to provide high-quality advisory services to the Funds; |
| | • | | a description of the scope of portfolio management services provided or to be provided to the Funds, including whether such services differ from the services provided to other clients, including other registered investment companies, and any advantages or disadvantages that might accrue to the Funds due to the Manager’s involvement in other activities; |
| | • | | a description of the personnel who are or will be assigned primary responsibility for managing the Funds, including any changes during the past year, and a discussion of the adequacy of current and projected staffing levels to service the Funds; |
| | • | | a description of the basis upon which portfolio managers are compensated, including any “incentive” arrangements, and a description of the oversight mechanisms used to prevent a portfolio manager whose compensation is tied to performance of a Fund from taking undue risks; |
| | • | | a description of the Manager’s practices in monitoring the quality of portfolio holdings and in reviewing portfolio valuation; |
| | • | | a description of the Manager’s use of derivatives, short sells, leveraged trading strategies or other similar trading strategies for the Funds; |
| | • | | a discussion regarding the Manager’s participation in third-party and proprietary “soft dollar” arrangements, if any, or other brokerage allocation policies with respect to Fund transactions; |
| | • | | a discussion of the Manager’s methodology for obtaining best execution, including any plans to improve the quality of execution in the upcoming year, and the use of any affiliated broker-dealers; |
| | • | | a description of any actual or potential conflicts of interest anticipated in managing Fund assets; |
| | • | | a discussion of whether the Manager has identified any investment or operational matters that likely present a high risk in managing Fund assets; |
| | • | | a description of the Manager’s criteria for assessing counterparties and counterparty risk to the extent the firm enters into transactions with counterparties on a Fund’s behalf; |
| | • | | a description of trade allocation procedures among accounts managed by the Manager; |
| | • | | a discussion of whether the Manager utilizes “commission recapture” or “directed brokerage” arrangements for the benefit of the Funds or “step-out” transactions; |
| | • | | a discussion of whether the Manager receives, or anticipates receiving, other compensation, including any payment for order flow or ECN liquidity rebates with respect to the Funds; |
| | • | | a certification by the Manager regarding the reasonable design of its compliance program; |
| | • | | a summary of the results of the Manager’s most recent annual review of its compliance program; |
| | • | | information regarding the Manager’s code of ethics, insider trading policy and disaster recovery plan, including a description of any material changes thereto and a related certification of compliance by the Manager; |
19
Disclosure Regarding the Board of Trustees’ Approval of the Management
Agreements of the Funds (Unaudited)
| | • | | a description of the Manager’s affiliation with any broker-dealer; |
| | • | | a discussion of any anticipated change in the Manager’s controlling persons; and |
| | • | | verification of the Manager’s insurance coverage with regards to the services provided to the Funds. |
In addition to the foregoing, the Manager provided the following information specific to the renewal of the Management Agreement:
| | • | | a comparison of the performance of each Fund to comparable investment companies and appropriate indices, including comments on the relative performance of each Fund versus the respective peer group average; |
| | • | | a comparison of advisory fee rates and expense ratios for comparable mutual funds; |
| | • | | a profit/loss analysis of the Manager; |
| | • | | an analysis of any material complaints received from Fund shareholders; |
| | • | | a description of the Manager’s distribution activities with respect to promoting sales of Fund shares, including any revenue sharing practices; |
| | • | | a description of the Manager’s securities lending practices and the fees received from such practices; |
| | • | | a discussion of any rebate arrangements between the Manager and a service provider to the Funds pursuant to which the Manager receives direct or indirect benefits from the service provider; |
| | • | | a description of the portfolio turnover rate and average execution costs for each Fund; and |
| | • | | a description of how expenses that are not readily identifiable to a particular Fund are allocated. |
In connection with the Management Agreement, the Board also obtained an analysis provided by Lipper that compared: (i) investment performance of each Fund versus comparable investment companies and appropriate indices; (ii) total Fund expenses of each Fund versus comparable mutual funds; and (iii) each Fund’s investment advisory fee rate versus comparable mutual funds. For each Fund with more than one class of shares, the class of shares used for comparative purposes was the class with the longest performance history, which in most cases was the Institutional Class. References below to each Fund’s Lipper peer group are to the group of comparable mutual funds included in the analysis provided by Lipper.
Provided below is an overview of the primary factors the Trustees considered at the Investment Committee meeting on May 4, 2012 at which the Trustees reviewed the investment performance of the Manager and the primary factors considered by the Board at its May 9, 2012 meeting at which the Board considered the renewal of the Management Agreement.
The Board did not identify any particular information that was most relevant to its consideration to renew the Agreement, and each Trustee may have afforded different weight to the various factors. Legal counsel to the independent Trustees provided the Board with a memorandum regarding its responsibilities pertaining to the renewal of the Agreement. The memorandum explained the regulatory requirements surrounding the Trustees’ process for evaluating investment advisors and the terms of the contracts. Based on its evaluation, the Board unanimously concluded that the terms of the Agreement were reasonable and fair and that the renewal of the Agreement was in the best interests of the Funds and their shareholders.
Considerations With Respect to the Renewal of the Management Agreement
In determining whether to renew the Management Agreement on behalf of the Funds, the Trustees considered the best interests of each Fund separately. While the Management Agreement of the Funds was considered at the May 9, 2012 meeting, the Board considered each Fund’s investment management relationships separately.
In each instance, the Board considered, among other things, the following factors: (1) the nature, extent and quality of the services provided; (2) the investment performance of a Fund; (3) the costs incurred by the Manager in rendering services to the Funds and its resulting profits or losses; (4) the extent to which economies of scale have been taken into account in setting each fee schedule; (5) whether fee levels reflect these economies of scale for the benefit of Fund investors; (6) comparisons of services and fee rates with contracts entered into by the Manager or their affiliates with other clients (such as pension funds and other institutional funds); and (7) any other benefits derived or anticipated to be derived by the Manager from its relationship with a Fund. The Trustees posed questions to various management personnel of the Manager regarding certain key aspects of the materials submitted in support of the renewal.
Nature, Extent and Quality of Services. With respect to the renewal of the Management Agreement, the Board considered, among other factors: each Fund’s long-term performance and the background and experience of key investment personnel at the Manager; the low cost structure of the Funds; the Manager’s culture of compliance and support for compliance operations that reduce risks to the Funds; the Manager’s commitment to enhance the Funds’ product line and increase assets in the Funds; the Manager’s high quality of services; the Manager’s active role in monitoring; the Manager’s commitment to training employees; and the Manager’s efforts to retain key employees and maintain staff levels.
Based on the foregoing information, the Board concluded that the nature, extent and quality of the management and advisory services provided by the Manager were appropriate for each Fund and, thus, determined to renew the Management Agreement for each Fund.
Investment Performance. The Board evaluated the comparative information provided by Lipper and the Manager regarding each Fund’s investment performance relative to its benchmark index(es) and peer group. The Board considered the information provided by Lipper regarding its independent peer selection methodology to select all peer groups and universes. The Board also considered the performance reports and discussions with management at Board and Committee meetings throughout the year. A discussion regarding the Board’s considerations with respect to each Fund’s performance appears below under “Additional Considerations and Conclusions with Respect to Each Fund.”
20
Disclosure Regarding the Board of Trustees’ Approval of the Management
Agreements of the Funds (Unaudited)
Costs of the Services Provided to the Funds and the Profits Realized by the Manager from its Relationship with the Funds. In analyzing the cost of services and profitability of the Manager, the Board considered the revenues earned and the expenses incurred by the Manager. The profits or losses were noted at both an aggregate level for all Funds and at an individual Fund level, with some Funds being profitable for the Manager and with the Manager sustaining losses with respect to other Funds. Although the Board noted that, in certain cases, the fee rates paid by other clients of the Manager are lower than the fee rates paid by the Funds, the difference reflects the greater level of responsibility and regulatory requirements associated with managing the Funds.
The Board considered that the Manager receives service and administrative fees to compensate the Manager for providing administrative services to the Funds and to compensate third-party administrators and broker-dealers for services to Fund shareholders.
Based on the foregoing information, the Board concluded that the profitability levels of the Manager were reasonable in light of the services performed by the Manager. A discussion regarding the Board’s considerations with respect to each Fund’s fee rates is set forth below under “Additional Considerations and Conclusions with Respect to Each Fund.”
Economies of Scale. The Board noted the Manager’s representation that many of the Funds benefit from economies of scale because comparably low fee rate levels are reflected in the current management and administration fee rates the Manager charges. The Board further noted the Manager’s representation that many of the Funds benefit from these comparably low fee rate levels despite not having yet reached an asset size at which economies of scale would traditionally be considered to exist, and the Manager’s belief that breakpoints are not appropriate at this time. Based on the foregoing information, the Board concluded that the Manager fee schedules for each Fund provides for a reasonable sharing of benefits from any economies of scale with the Funds.
Benefits Derived from the Relationship with the Funds. The Board considered the “fall-out” or ancillary benefits that accrue to the Manager as a result of the advisory relationships with the Funds, including greater exposure in the marketplace with respect to the Manager’s investment process and expanding the level of assets under management by the Manager.
In addition, the Manager noted that the Trusts also derive benefits from their association with the Manager. Specifically, the Board noted the Manager’s representation that it provides services to most Funds at a lower than industry average cost. The Board also considered that the Funds did not pay commissions to any affiliated broker-dealer of the Manager during the most recent fiscal year ended December 31, 2011.
Based on the foregoing information, the Board concluded that the potential benefits accruing to the Manager by virtue of their relationships with the Funds appear to be fair and reasonable.
Additional Considerations and Conclusions with Respect to Each Fund
The Funds were compared to the respective Lipper Average, which includes all comparable funds in the Lipper category. In reviewing the performance, the Trustees viewed longer-term performance over five years or longer as the most important consideration, because relative performance over shorter periods may be significantly impacted by market or economic events that do not reflect manager skill.
Additional Considerations and Conclusions with Respect to American Beacon Money Market Select Fund
In considering the renewal of the Management Agreement for the American Beacon Money Market Select Fund, the Trustees considered the following additional factors: (1) the American Beacon Money Market Select Fund outperformed the peer universe median for the one-, three- and five-year periods ended March 31, 2012; (2) the Fund outperformed the Lipper Average for all reported periods ended March 31, 2012; and (3) the Fund’s actual total expense ratio was the second lowest of its Lipper expense group and was lower than the median of its Lipper expense universe.
Based on these and other considerations the Trustees (1) concluded that the fees paid to the Manager under the Management Agreement are fair and reasonable, (2) determined that the American Beacon Money Market Select Fund and its shareholders would benefit from the Manager’s continued management of the Fund and (3) approved the renewal of the Management Agreement with respect to the American Beacon Money Market Select Fund.
Additional Considerations and Conclusions with Respect to the American Beacon U.S. Government Money Market Select Fund
In considering the renewal of the Management Agreement for the American Beacon U.S. Government Money Market Select Fund, the Trustees considered the following additional factors: (1) the American Beacon U.S. Government Money Market Select Fund outperformed the peer universe median for the one-, three- and five-year periods ended March 31, 2012; (2) the Fund outperformed the Lipper Average for all reported periods ended March 31, 2012; and (3) the Fund’s actual total expense ratio was the fourth lowest of its Lipper expense group.
Based on these and other considerations the Trustees (1) concluded that the fees paid to the Manager under the Management Agreement are fair and reasonable, (2) determined that the American Beacon U.S. Government Money Market Select Fund and its shareholders would benefit from the Manager’s continued management of the Fund and (3) approved the renewal of the Management Agreement with respect to the American Beacon U.S. Government Money Market Select Fund.
21

Delivery of Documents
eDelivery is NOW AVAILABLE - Stop traditional mail delivery and receive your
shareholder reports and summary prospectus on-line. Sigh up at
www.americanbeaconfunds.com
To reduce expenses, your financial institution may mail only one copy of the Summary Prospectus, Annual Report and Semi-Annual Report to those addresses shared by two or more accounts. If you wish to receive individual copies of these documents, please contact your financial institution. Delivery of individual copies will commence thirty days after receiving your request.
To obtain more information about the Fund:
| | |
| 7 | | 8 |
| |
By E-mail: american_beacon.funds@ambeacon.com | | On the Internet: Visit our website at www.americanbeaconfunds.com |
| |
| ' | | - |
| |
By Telephone: Call (800) 658-5811 | | By Mail: American Beacon Select Funds P.O. Box 219643 Kansas City, MO 64121 |
| |
Availability of Quarterly Portfolio Schedules In addition to the Schedule of Investments provided in each semi-annual and annual report, the Fund files a complete schedule of its portfolio holdings with the Securities and Exchange Commission (“SEC”) on Form N-Q as of the first and third fiscal quarters. The Fund’s Forms N-Q are available on the SEC’s website at www.sec.gov. The Forms N-Q may also be reviewed and copied at the SEC’s Public Reference Section, 100 F Street, NE, Washington, D.C. 20549-1520. Information regarding the operation of the SEC’s Public Reference Room may be obtained by calling (202) 551-8090. A complete schedule of the Fund’s portfolio holdings is also available on (www.americanbeaconfunds.com), the Funds’ website approximately five days after the end of each month. | | Availability of Proxy Voting Policy and Records A description of the policies and procedures the Fund uses to determine how to vote proxies relating to portfolio securities is available in the Fund’s Statement of Additional Information, is available free of charge on the Fund’s website (www.americanbeaconfunds.com) and by calling 1-800-967-9009 or by accessing the SEC’s website at www.sec.gov. The Fund’s proxy voting record for the most recent year ended June 30 is filed annually with the SEC on Form N-PX. The Fund’s Forms N-PX are available on the SEC’s website at www.sec.gov. The Fund’s proxy voting record may also be obtained by calling 1-800-967-9009. |
Fund Service Providers:
| | | | | | | | | | | | |
CUSTODIAN State Street Bank and Trust Boston, Massachusetts | | | | TRANSFER AGENT Boston Financial Data Services Kansas City, Missouri | | | | INDEPENDENT REGISTERED PUBLIC ACCOUNTING FIRM Ernst & Young LLP Dallas, Texas | | | | DISTRIBUTOR Foreside Fund Services, LLC Portland, Maine |
This report is prepared for shareholders of the American Beacon Money Market Select Funds and may be distributed to others only if preceded or accompanied by a current Prospectus or Summary Prospectus.
American Beacon Select Funds, American Beacon Money Market Select Fund, and American Beacon U.S. Government Money Market Select Fund are service marks of American Beacon Advisors, Inc.
ITEM 2. CODE OF ETHICS.
The Trust did not amend the code of ethics that applies to its principal executive and financial officers (the “Code”) nor did it grant any waivers to the provisions of the Code during the period covered by the shareholder reports presented in Item 1.
ITEM 3. AUDIT COMMITTEE FINANCIAL EXPERT.
Not Applicable.
ITEM 4. PRINCIPAL ACCOUNTANT FEES AND SERVICES.
Not Applicable.
ITEM 5. AUDIT COMMITTEE OF LISTED REGISTRANTS.
Not Applicable.
ITEM 6. SCHEDULE OF INVESTMENTS.
The schedules of investments for each series of the Trust are included in the shareholder reports presented in Item 1.
ITEM 7. DISCLOSURE OF PROXY VOTING POLICIES AND PROCEDURES FOR CLOSED-END MANAGEMENT INVESTMENT COMPANIES.
Not Applicable.
ITEM 8. PORTFOLIO MANAGERS OF CLOSED-END MANAGEMENT INVESTMENT COMPANIES.
Not applicable.
ITEM 9. PURCHASES OF EQUITY SECURITIES BY CLOSED-END MANAGEMENT INVESTMENT COMPANY AND AFFILIATED PURCHASERS.
Not Applicable.
ITEM 10. SUBMISSION OF MATTERS TO A VOTE OF SECURITY HOLDERS.
The Trust has made no material changes to the procedures by which shareholders may recommend nominees to the Trust’s Board of Trustees since the Trust last disclosed such procedures in Schedule 14A.
ITEM 11. CONTROLS AND PROCEDURES.
(a) Based upon an evaluation within 90 days of the filing date of this report, the principal executive and financial officers concluded that the disclosure controls and procedures of the Trust are effective.
(b) There were no changes in the Trust’s internal control over financial reporting during the second fiscal quarter of the period covered by this report that has materially affected, or is reasonably likely to materially affect, the Trust’s internal control over financial reporting.
ITEM 12. EXHIBITS.
(a)(1) Not Applicable.
(a)(2) A separate certification for each principal executive officer and principal financial officer of the Trust as required by Rule 30a-2(a) under the Investment Company Act of 1940 is attached hereto as EX-99.CERT.
(a)(3) Not Applicable.
(b) The certifications required by Rule 30a-2(b) under the Investment Company Act of 1940 are attached hereto as
EX-99.906CERT.
SIGNATURES
Pursuant to the requirements of the Securities Exchange Act of 1934 and the Investment Company Act of 1940, the registrant has duly caused this report to be signed on its behalf by the undersigned, thereunto duly authorized.
(Registrant): American Beacon Select Funds
| | |
| By | | /s/ Gene L. Needles, Jr. |
| | Gene L. Needles, Jr. |
| | President |
Date: September 7, 2012
Pursuant to the requirements of the Securities Exchange Act of 1934 and the Investment Company Act of 1940, this report has been signed below by the following persons on behalf of the registrant and in the capacities and on the dates indicated.
| | |
| By | | /s/ Gene L. Needles, Jr. |
| | Gene L. Needles, Jr. |
| | President |
Date: September 7, 2012
| | |
| By | | /s/ Melinda G. Heika |
| | Melinda G. Heika |
| | Treasurer |
Date: September 7, 2012