UNITED STATES
SECURITIES AND EXCHANGE COMMISSION
Washington, D.C. 20549
FORM N-CSRS
CERTIFIED SHAREHOLDER REPORT OF REGISTERED
MANAGEMENT INVESTMENT COMPANIES
Investment Company Act file number: 811-09603
AMERICAN BEACON SELECT FUNDS
(Exact name of registrant as specified in charter)
220 East Las Colinas Boulevard, Suite 1200
Irving, Texas 75039
(Address of principal executive offices)-(Zip code)
Gene L. Needles, Jr., PRESIDENT
220 East Las Colinas Boulevard, Suite 1200
Irving, Texas 75039
(Name and address of agent for service)
Registrant’s telephone number, including area code: (817) 391-6100
Date of fiscal year end: December 31, 2015
Date of reporting period: June 30, 2015
ITEM 1. REPORT TO STOCKHOLDERS.

American Beacon
SELECT FUNDS
2015 SEMI-ANNUAL REPORT
JUNE 30, 2015
MONEY MARKET SELECT FUND
U.S. GOVERNMENT MONEY MARKET SELECT FUND
About American Beacon Advisors
Since 1986, American Beacon Advisors has offered a variety of products and investment advisory services to numerous institutional and retail clients, including a variety of mutual funds, corporate cash management, and separate account management.
Our clients include defined benefit plans, defined contribution plans, foundations, endowments, corporations, financial planners, and other institutional investors. With American Beacon Advisors, you can put the experience of a multi-billion dollar asset management firm to work for your company.
Any opinions herein, including forecasts, reflect our judgment as of the end of the reporting period and are subject to change. Each advisor’s strategies and each Fund’s portfolio composition will change depending on economic and market conditions. This report is not a complete analysis of market conditions and therefore, should not be relied upon as investment advice. Although economic and market information has been compiled from reliable sources, American Beacon Advisors, Inc. makes no representation as to the completeness or accuracy of the statements contained herein.
| | |
| American Beacon Select Funds | | June 30, 2015 |
| | |
 | | Dear Shareholders, Due to their ability to provide relative stability of principal and liquidity, money market funds remain reliable choices for many investors during both good times and bad. And yet money market funds are commonly maligned as rainy day resources. In reality, investors often move assets into money market funds to await new opportunities after cashing out other positions. During the first half of 2015, U.S. equity markets had to contend with slower economic growth, modestly higher-than-average valuations, and geopolitical and financial turmoil in Greece. Uncertainty over the timing of the U.S. Federal Reserve’s first interest rate increase since emergency lending rates were established during the financial crisis have also weighed on the market. |
| |
| |
American Beacon, which is well-known for innovative and actively managed portfolios, is proud to also offer two money market funds designed to help ensure maximum flexibility for our shareholders.
For the six months ended June 30, 2015:
| • | | American Beacon Money Market Select Fund returned 0.05%. |
| • | | American Beacon U.S. Government Money Market Select Fund returned 0.01%. |
American Beacon Advisors identifies and partners with experienced asset managers from across all asset classes to help protect our shareholders’ portfolios over the long term, offering investors a variety of funds for building an overall portfolio tailored to their objectives.
Thank you for your continued investment in the American Beacon Select Funds. For additional information about the Funds or to access your account information, please visit our website at www.americanbeaconfunds.com.
|
| Sincerely, |
|
 |
| Gene L. Needles, Jr. |
| President |
| American Beacon Select Funds |
1
American Beacon Money Market Select FundSM
Performance Overview
June 30, 2015 (Unaudited)
After a slow start to 2015, primarily due to weather, the U.S. economy improved during the second quarter. GDP improved to an annualized rate of 2.3% during the second quarter, up from a revised 0.6% for the first quarter. The unemployment rate dropped to 5.3% and non-farm payrolls averaged an increase of 208,000 jobs per month for the first half of the year. As domestic data improved, there is still uncertainty surrounding Greece’s financial situation along with a slump in China’s stock market.
The Federal Reserve Bank (the “Fed”) acknowledged the pickup in U.S. economic growth at their June Federal Open Market Committee (the “FOMC”) meeting. The committee also released its median estimate for the year-end 2015 fed funds rate at 0.625%, implying two 25 basis point rate increases by the end of the year. The market is currently projecting a strong possibility that the Fed will begin raising the fed funds target at the September FOMC meeting.
With liquidity and credit quality continued priorities, the American Beacon Money Market Select Fund’s (the “Fund”) primary strategy for the first half of the year was to buy high quality, short-term money market instruments and overnight investments. The strategies implemented during the period enabled the Fund to outperform its Lipper peer group.
For the six months ended June 30, 2015, the total return of the Fund was 0.05%. The Fund outperformed the Lipper Institutional Money Market Fund’s Average return of 0.02% by three basis points (0.03%). Based on annualized total returns, Lipper Analytical Services ranked the Fund 14th among 277, 8th among 265 and 20th among 212 Institutional Money Market Funds for the one-year, five-year, and ten-year periods ended June 30, 2015, respectively.
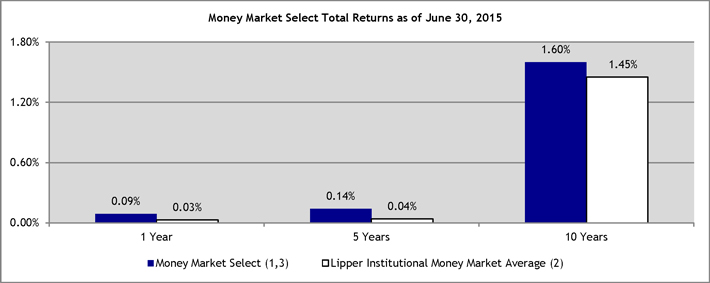
Total Returns for the Period ended 6/30/15
| | | | | | | | | | | | | | | | |
| | | Ticker | | | 1 Year | | | 5 Years | | | 10 Years | |
Money Market Select (1,3) | | | ASRXX | | | | 0.09 | % | | | 0.14 | % | | | 1.60 | % |
Lipper Institutional Money Market Average (2) | | | | | | | 0.03 | % | | | 0.04 | % | | | 1.45 | % |
| 1 | Performance shown is historical and is not indicative of future returns. Investment returns will vary, and shares may be worth more or less at redemption than at original purchase. An investment in the Fund is neither insured nor guaranteed by the Federal Deposit Insurance Corporation or any other government agency. Although the Fund seeks to preserve the value of an investment at $1.00 per share, it is possible to lose money by investing in the Fund. Fund performance in the table above does not reflect the deduction of taxes a shareholder would pay on distributions or the redemption of shares. |
2
American Beacon Money Market Select FundSM
Performance Overview
June 30, 2015 (Unaudited)
| 2 | The Lipper Institutional Money Market Funds Average is calculated by taking an arithmetic average of the returns of the mutual funds in the Lipper Institutional Money Market Funds category. Lipper is an independent mutual fund research and ranking service. |
| 3 | The total annual Fund operating expense ratio set forth in the most recent prospectus for the Fund was 0.13%. The expense ratio above may vary from the expense ratio presented in other sections of this report, which is based on expenses incurred during the period covered by this report. |
| | | | |
Fund Statistics as of 6/30/15 | |
7-day Current Yield* | | | 0.10 | % |
7-day Effective Yield* | | | 0.10 | % |
30-day Yield* | | | 0.11 | % |
Weighted Average Maturity | | | 33 Days | |
Standard & Poor’s Rating** | | | AAAm | |
| * | Annualized. You may call 1-800-231-4252 to obtain the Fund’s current 7-day yields. Yield is a more accurate reflection of the Fund’s current earnings than total returns. The seven-day yields refer to the income generated by an investment in the Fund over a seven-day period. This income is then annualized. The seven-day effective yield is calculated similarly, but the income earned is assumed to have been reinvested. The effective yield will be slightly higher than the current yield because of the compounding effect of this assumed reinvestment. |
| ** | Standard & Poor’s (S&P) Rating: The fund is not sponsored, endorsed, sold or promoted by S&P, and S&P makes no representation regarding the advisability of investing in the fund. The credit rating is a forward-looking opinion about a fund’s potential capacity to maintain stable principal or stable net asset value. The rating is an opinion as of the date expressed and not a statement of fact or recommendation to purchase, hold or sell any security. Standard & Poor’s rates the creditworthiness of money market funds from AAAm (highest) to Dm (lowest). For more information on S&P’s rating methodology, please visit www.standardandpoors.com and select “Understanding Ratings” under Ratings Resources on the home page. |
| | | | |
Asset Allocation as of 6/30/15 (% of Net Assets) | |
Financial Company Commercial Paper | | | 54.8 | % |
Other Repurchase Agreements | | | 28.3 | % |
Investment Companies | | | 8.6 | % |
Asset-Backed Commercial Paper | | | 4.8 | % |
Certificates of Deposit | | | 3.5 | % |
| | | | |
Effective Maturity Distribution (% of net assets) | |
1 to 7 Days | | | 41.8 | |
8 to 30 Days | | | 11.6 | |
31 to 90 Days | | | 43.1 | |
91 to 120 Days | | | 3.5 | |
| | | | |
Credit Quality (% of net assets) | |
A-1+/P-1** | | | 79.9 | |
A-1/P-1 | | | 20.1 | |
| ** | Includes A-1 rated obligations with maturities of five business days or less. |
The credit quality ratings reflect the ratings of the securities held by the Fund, which are subject to change. A short-term obligation rated A-1 is rated in the highest category by Standard & Poor’s. The obligator’s capacity to meet its financial commitment on the obligation is strong. Within this category, certain obligations are designated with a plus sign (+). This indicates that the obligator’s capacity to meet its financial commitment on these obligations is extremely strong. A short-term obligation rated P-1 is rated in the highest category by Moody’s Investor Services. Issuers (or supporting institutions) rated Prime-1 have a superior ability to repay short-term debt obligations.
3
American Beacon U.S. Government Money Market Select FundSM
Performance Overview
June 30, 2015 (Unaudited)
After a slow start to 2015, primarily due to weather, the U.S. economy improved during the second quarter. GDP improved to an annualized rate of 2.3% during the second quarter, up from a revised 0.6% for the first quarter. The unemployment rate dropped to 5.3% and non-farm payrolls averaged an increase of 208,000 jobs per month for the first half of the year. As domestic data improved, there is still uncertainty surrounding Greece’s financial situation along with a slump in China’s stock market.
The Federal Reserve Bank (the “Fed”) acknowledged the pickup in U.S. economic growth at their June Federal Open Market Committee (the “FOMC”) meeting. The committee also released its median estimate for the year-end 2015 fed funds rate at 0.625%, implying two 25 basis point rate increases by the end of the year. The market is currently projecting a strong possibility that the Fed will begin raising the fed funds target at the September FOMC meeting.
The American Beacon U.S. Government Money Market Select Fund’s (the “Fund”) primary strategy for the first half of the year was to buy both fixed and floating rate agencies along with overnight repurchase agreements.
For the six month period ended June 30, 2015, the total return of the Fund was 0.01%. The Fund was equal to the Lipper Institutional U.S. Government Money Market Fund’s Average return of 0.01%. Based on annualized total returns, Lipper Analytical Services ranked the Fund 49th among 168, 1st among 158 and 1st among 106 Institutional U.S. Government Money Market Funds for the one-year, five-year, and ten-year periods ended June 30, 2015, respectively.
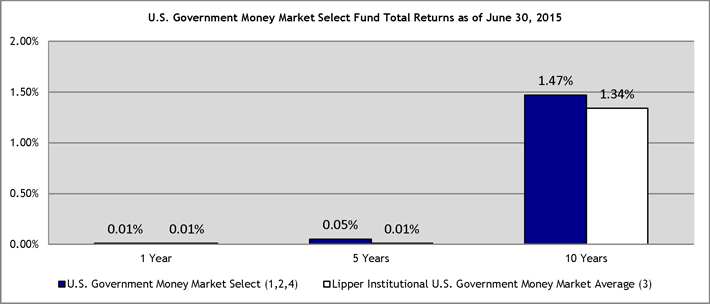
Total Returns for the Period Ended 6/30/15
| | | | | | | | | | | | | | | | |
| | | Ticker | | | 1 Year | | | 5 Years | | | 10 Years | |
U.S. Government Money Market Select (1,2,4) | | | AAOXX | | | | 0.01 | % | | | 0.05 | % | | | 1.47 | % |
Lipper Institutional U.S. Government Money Market Average (3) | | | | | | | 0.01 | % | | | 0.01 | % | | | 1.34 | % |
| 1 | Performance shown is historical and is not indicative of future returns. Investment returns will vary, and shares may be worth more or less at redemption than at original purchase. An investment in the Fund is neither insured nor guaranteed by the Federal Deposit Insurance Corporation or any other government agency. Although the Fund seeks to preserve the value of an investment at $1.00 per share, it is possible to lose money by investing in the Fund. Fund performance in the table above does not reflect the deduction of taxes a shareholder would pay on distributions or the redemption of shares. |
4
American Beacon U.S. Government Money Market Select FundSM
Performance Overview
June 30, 2015 (Unaudited)
| 2 | A portion of the fees charged to the Fund has been waived. Performance prior to waiving fees was lower than the actual returns shown. |
| 3 | The Lipper Institutional U.S. Government Money Market Funds Average is calculated by taking an arithmetic average of the returns of the mutual funds in the Lipper Institutional U.S. Government Money Market Funds category. Lipper is an independent mutual fund research and ranking service. |
| 4 | The total annual Fund operating expense ratio set forth in the most recent prospectus for the Fund was 0.14%. The expense ratio above may vary from the expense ratio presented in other sections of this report, which is based on expenses incurred during the period covered by this report. |
| | | | |
Fund Statistics as of 6/30/15 | |
7-day Current Yield* | | | 0.01 | % |
7-day Effective Yield* | | | 0.01 | % |
30-day Yield* | | | 0.01 | % |
Weighted Average. Life | | | 34 Days | |
Standard & Poor’s Rating** | | | AAAm | |
| * | Annualized. You may call 1-800-231-4252 to obtain the Fund’s current 7-day yields. Yield is a more accurate reflection of the Fund’s current earnings than total returns. The seven-day yields refer to the income generated by an investment in the Fund over a seven-day period. This income is then annualized. The seven-day effective yield is calculated similarly, but the income earned is assumed to have been reinvested. The effective yield will be slightly higher than the current yield because of the compounding effect of this assumed reinvestment. |
| ** | Standard & Poor’s (S&P) Rating: The fund is not sponsored, endorsed, sold or promoted by S&P, and S&P makes no representation regarding the advisability of investing in the fund. The credit rating is a forward-looking opinion about a fund’s potential capacity to maintain stable principal or stable net asset value. The rating is an opinion as of the date expressed and not a statement of fact or recommendation to purchase, hold or sell any security. Standard & Poor’s rates the creditworthiness of money market funds from AAAm (highest) to Dm (lowest). For more information on S&P’s rating methodology, please visit www.standardandpoors.com and select “Understanding Ratings” under Ratings Resources on the home page. |
| | | | |
Asset Allocation as of 6/30/15 (% of net assets) | |
U.S. Government Agency Obligations | | | 41.2 | |
U.S. Government Agency Repurchase Agreements | | | 38.5 | |
Other Repurchase Agreements | | | 14.8 | |
Investment Companies | | | 5.5 | |
| | | | |
Effective Maturity Distribution (% of net assets) | |
1 to 7 Days | | | 58.9 | |
8 to 30 Days | | | 31.3 | |
31 to 60 Days | | | 9.8 | |
5
American Beacon Select FundsSM
Fund Expenses
June 30, 2015 (Unaudited)
Fund Expense Example
As a shareholder of a Fund, you incur two types of costs: (1) transaction costs and (2) ongoing costs, including management fees, administrative service fees, and other Fund expenses. The examples below are intended to help you understand the ongoing cost (in dollars) of investing in a Fund and to compare these costs with the ongoing costs of investing in other mutual funds. The examples are based on an investment of $1,000 invested at the beginning of the period and held for the entire period from January 1, 2015 through June 30, 2015.
Actual Expenses
The “Actual” lines of the table provide information about actual account values and actual expenses. You may use the information in these lines, together with the amount you invested, to estimate the expenses that you paid over the period. Simply divide your account value by $1,000 (for example, an $8,600 account value divided by $1,000 = 8.6), then multiply the result by the number in the “Actual” line under the heading “Expenses Paid During Period” for the applicable Fund to estimate the expenses you paid on your account during this period.
Hypothetical Example for Comparison Purposes
The “Hypothetical” lines of the table provide information about hypothetical account values and hypothetical expenses based on a Fund’s actual expense ratio and an assumed 5% per year rate of return before expenses (not a Fund’s actual return).
You may compare the ongoing costs of investing in a Fund with other funds by contrasting this 5% hypothetical example and the 5% hypothetical examples that appear in the shareholder reports of the other funds. The hypothetical account values and expenses may not be used to estimate the actual ending account balance or expenses you paid for the period.
You should also be aware that the expenses shown in the table highlight only your ongoing costs and do not reflect any transaction costs charged by the Funds. Similarly, the expense examples for other funds do not reflect any transaction costs charged by those funds, such as sales charges (loads), redemption fees or exchange fees. Therefore, the “Hypothetical” lines of the table are useful in comparing ongoing costs only and will not help you determine the relative total costs of owning different funds. If you were subject to any transaction costs during the period, your costs would have been higher.
| | | | | | | | | | | | |
| | | Beginning
Account
Value
1/1/15 | | | Ending
Account
Value
6/30/15 | | | Expenses paid
During Period*
1/1/15-6/30/15 | |
| | | |
Money Market | | | | | | | | | | | | |
Actual | | $ | 1,000.00 | | | $ | 1,000.48 | | | $ | 0.64 | |
Hypothetical (5% return before expenses) | | $ | 1,000.00 | | | $ | 1,024.15 | | | $ | 0.65 | |
| | | |
U.S. Government Money Market | | | | | | | | | | | | |
Actual | | $ | 1,000.00 | | | $ | 1,000.06 | | | $ | 0.64 | |
Hypothetical (5% return before expenses) | | $ | 1,000.00 | | | $ | 1,024.15 | | | $ | 0.65 | |
| * | Expenses are equal to the Fund’s annualized expense ratios for the six-month period of 0.13% and 0.13% for the Money Market Select Fund and the U.S. Government Money Market Select Fund respectively, multiplied by the average account value over the period, multiplied by the number derived by dividing the number of days in the most recent fiscal half-year (181) by days in the year (365) to reflect the half-year period. |
6
American Beacon Money Market Select FundSM
Schedule of Investments
June 30, 2015 (Unaudited)
| | | | | | | | |
| | | Par Amount | | | Fair Value | |
| | | (000’s) | | | (000’s) | |
ASSET-BACKED COMMERCIAL PAPER- 4.83% | | | | | | | | |
Kells Funding LLC, | | | | | | | | |
0.19%, Due 7/20/2015 A B | | $ | 5,000 | | | $ | 4,998 | |
0.20%, Due 7/28/2015 A B | | | 5,000 | | | | 4,999 | |
0.195%, Due 8/17/2015 A B | | | 5,000 | | | | 4,999 | |
Old Line Funding LLC, | | | | | | | | |
0.21%, Due 8/5/2015 A B | | | 5,000 | | | | 4,999 | |
0.285%, Due 9/1/2015 A B | | | 5,000 | | | | 4,998 | |
0.20%, Due 9/16/2015 A B | | | 5,000 | | | | 4,998 | |
0.28%, Due 9/28/2015 A B | | | 5,000 | | | | 4,997 | |
| | | | | | | | |
Total Asset-Backed Commercial Paper (Cost $34,988) | | | | | | | 34,988 | |
| | | | | | | | |
| | |
CERTIFICATES OF DEPOSIT- 3.51% | | | | | | | | |
Mizuho Bank Ltd., | | | | | | | | |
0.27%, Due 7/31/2015 | | | 10,000 | | | | 10,000 | |
0.25%, Due 8/3/2015 | | | 15,400 | | | | 15,401 | |
| | | | | | | | |
Total Certificates of Deposit (Cost $25,401) | | | | | | | 25,401 | |
| | | | | | | | |
| | |
FINANCIAL COMPANY COMMERCIAL PAPER- 54.76% | | | | | | | | |
Australia & New Zealand Banking Group Ltd., | | | | | | | | |
0.28%, Due 10/29/2015 B | | | 5,000 | | | | 4,995 | |
Bank of Montreal, | | | | | | | | |
0.21%, Due 9/14/2015 | | | 10,000 | | | | 9,996 | |
0.01%, Due 9/21/2015 | | | 5,000 | | | | 4,998 | |
Bank of Nova Scotia NY, | | | | | | | | |
0.18%, Due 8/4/2015 B | | | 10,000 | | | | 9,998 | |
0.20%, Due 8/5/2015 B | | | 10,000 | | | | 9,998 | |
0.205%, Due 9/9/2015 B | | | 10,000 | | | | 9,996 | |
Bank of Tokyo-Mitsubishi UFJ NY, | | | | | | | | |
0.24%, Due 7/6/2015 | | | 10,000 | | | | 10,000 | |
0.25%, Due 9/3/2015 | | | 5,000 | | | | 4,998 | |
0.25%, Due 9/16/2015 | | | 10,000 | | | | 9,995 | |
Caisse Des Depots et Con, | | | | | | | | |
0.22%, Due 7/8/2015 B | | | 5,000 | | | | 5,000 | |
Coca-Cola Co., | | | | | | | | |
0.19%, Due 7/27/2015 B | | | 5,000 | | | | 4,999 | |
0.20%, Due 9/16/2015 B | | | 6,850 | | | | 6,847 | |
0.23%, Due 10/19/2015 B | | | 5,000 | | | | 4,996 | |
Commonwealth Bank of Australia, | | | | | | | | |
0.25%, Due 7/2/2015 B | | | 5,000 | | | | 5,000 | |
0.25%, Due 9/2/2015 B | | | 5,000 | | | | 4,998 | |
0.23%, Due 9/29/2015 B | | | 5,000 | | | | 4,997 | |
0.245%, Due 10/2/2015 B | | | 5,000 | | | | 4,997 | |
DNB Bank ASA, | | | | | | | | |
0.20%, Due 9/10/2015 B | | | 15,000 | | | | 14,993 | |
Erste Abwicklungsanstalt, | | | | | | | | |
0.205%, Due 8/4/2015 B | | | 5,000 | | | | 4,999 | |
0.24%, Due 9/17/2015 B | | | 5,000 | | | | 4,997 | |
General Electric Capital Corp., | | | | | | | | |
0.25%, Due 8/3/2015 | | | 5,000 | | | | 4,999 | |
0.19%, Due 9/11/2015 | | | 5,000 | | | | 4,998 | |
0.18%, Due 9/23/2015 | | | 5,000 | | | | 4,998 | |
0.26%, Due 10/9/2015 | | | 5,000 | | | | 4,996 | |
National Australia Bank Ltd., | | | | | | | | |
0.19%, Due 8/31/2015 B | | | 10,000 | | | | 9,997 | |
0.19%, Due 9/1/2015 B | | | 5,000 | | | | 4,998 | |
Nederlandse Waterschapsbank N.V., | | | | | | | | |
0.20%, Due 9/8/2015 B | | | 10,000 | | | | 9,996 | |
See accompanying notes
7
American Beacon Money Market Select FundSM
Schedule of Investments
June 30, 2015 (Unaudited)
| | | | | | | | |
| | | Par Amount | | | Fair Value | |
| | | (000’s) | | | (000’s) | |
Nestle Capital Corp., | | | | | | | | |
0.21%, Due 7/2/2015 B | | $ | 5,000 | | | $ | 5,000 | |
0.235%, Due 7/13/2015 B | | | 5,000 | | | | 5,000 | |
0.18%, Due 9/21/2015 B | | | 5,000 | | | | 4,998 | |
Nordea Bank AB, | | | | | | | | |
0.18%, Due 7/6/2015 B | | | 5,800 | | | | 5,800 | |
0.205%, Due 9/8/2015 B | | | 10,000 | | | | 9,996 | |
0.205%, Due 9/22/2015 B | | | 10,000 | | | | 9,995 | |
NRW Bank, | | | | | | | | |
0.195%, Due 7/17/2015 B | | | 10,000 | | | | 9,999 | |
0.175%, Due 8/11/2015 B | | | 10,000 | | | | 9,998 | |
0.20%, Due 8/17/2015 B | | | 5,000 | | | | 4,999 | |
Oversea-Chinese Banking Corp. Ltd., | | | | | | | | |
0.18%, Due 7/2/2015 | | | 10,000 | | | | 10,000 | |
0.19%, Due 7/20/2015 | | | 9,150 | | | | 9,149 | |
Skandinaviska Enskilda Banken AB, | | | | | | | | |
0.21%, Due 8/17/2015 B | | | 10,000 | | | | 9,997 | |
0.21%, Due 9/17/2015 B | | | 5,000 | | | | 4,998 | |
0.215%, Due 9/18/2015 B | | | 5,000 | | | | 4,998 | |
Sumitomo Mitsui Banking Corp., | | | | | | | | |
0.205%, Due 7/13/2015 B | | | 10,000 | | | | 9,999 | |
0.175%, Due 7/20/2015 B | | | 10,000 | | | | 9,999 | |
0.145%, Due 8/10/2015 B | | | 5,000 | | | | 4,999 | |
Svenska Handelsbanken AB, | | | | | | | | |
0.19%, Due 7/10/2015 B | | | 5,000 | | | | 5,000 | |
0.20%, Due 8/12/2015 B | | | 5,000 | | | | 4,999 | |
0.20%, Due 8/25/2015 B | | | 5,000 | | | | 4,998 | |
0.22%, Due 9/16/2015 B | | | 5,000 | | | | 4,998 | |
Toronto Dominion Holdings (USA), Inc., | | | | | | | | |
0.20%, Due 7/28/2015 B | | | 10,000 | | | | 9,999 | |
0.20%, Due 9/8/2015 B | | | 5,000 | | | | 4,998 | |
0.22%, Due 9/15/2015 B | | | 5,000 | | | | 4,998 | |
Toyota Motor Credit Corp., | | | | | | | | |
0.25%, Due 7/9/2015 | | | 5,000 | | | | 5,000 | |
0.20%, Due 9/17/2015 | | | 15,000 | | | | 14,993 | |
0.20%, Due 9/23/2015 | | | 10,000 | | | | 9,995 | |
Westpac Banking Corp., | | | | | | | | |
0.20%, Due 9/8/2015 B | | | 10,000 | | | | 9,996 | |
| | | | | | | | |
Total Financial Company Commercial Paper (Cost $396,677) | | | | | | | 396,677 | |
| | | | | | | | |
| | | | | | | | |
| | | Shares | | | | |
INVESTMENT COMPANIES - 8.61% | | | | | | | | |
Blackrock Cash Fund, Prime Class | | | 32,390,935 | | | | 32,391 | |
State Street Institutional Liquidity Reserves Fund, Institutional Class | | | 30,000,000 | | | | 30,000 | |
| | | | | | | | |
Total Investment Companies (Cost $62,391) | | | | | | | 62,391 | |
| | | | | | | | |
| | | | | | | | |
| | | Par Amount | | | | |
| | | (000’s) | | | | |
REPURCHASE AGREEMENTS - 28.30% | | | | | | | | |
BNP Paribas Securities Corp., 0.29%, Acquired on 6/30/2015, Due 7/1/2015, at $35,000 (Held at Bank of New York Mellon, Collateralized by Corporate Obligations valued at $38,452, 2.575% - 10.75%, 8/4/2016 – 12/31/2099) | | $ | 35,000 | | | | 35,000 | |
JP Morgan Clearing Corp., 0.28%, Acquired on 6/30/2015, Due 7/7/2015, at $30,000 (Held at JP Morgan Chase, Collateralized by Corporate Obligations valued at $31,502, 2.875% - 8.25%, 7/15/2015 – 6/1/2022) | | | 30,000 | | | | 30,000 | |
Merrill Lynch, Pierce, Fenner & Smith, Inc., 0.20%, Acquired on 6/30/2015, Due 7/1/2015, at $35,000 (Held at Bank of New York Mellon, Collateralized by Equity Securities valued at $38,500) | | | 35,000 | | | | 35,000 | |
RBC Capital Markets LLC, 0.28%, Acquired on 6/25/2015, Due 7/2/2015, at $35,000 (Held at Bank of New York Mellon, Collateralized by Corporate Obligations valued at $36,750, 3.00% - 14.00%, 8/5/2015 – 6/5/2115)A | | | 35,000 | | | | 35,000 | |
See accompanying notes
8
American Beacon Money Market Select FundSM
Schedule of Investments
June 30, 2015 (Unaudited)
| | | | | | | | |
| | | Par Amount | | | Fair Value | |
| | | (000’s) | | | (000’s) | |
SG Americas Securities LLC, 0.20%, Acquired on 6/30/2015, Due 7/1/2015, at $35,000 (Held at JP Morgan Chase, Collateralized by Equity Securities valued at $36,750)A | | $ | 35,000 | | | $ | 35,000 | |
Wells Fargo Securities LLC, 0.20%, Acquired on 6/30/2015, Due 7/1/2015, at $35,000 (Held at Bank of New York Mellon, Collateralized by Corporate Obligations valued at $36,750, 0.23% - 11.25%, 7/15/2015 – 1/1/2049)A | | | 35,000 | | | | 35,000 | |
| | | | | | | | |
Total Repurchase Agreements (Cost $205,000) | | | | | | | 205,000 | |
| | | | | | | | |
| | |
TOTAL INVESTMENTS - 100.01% (Cost $724,457) | | | | | | | 724,457 | |
LIABILITIES, NET OF OTHER ASSETS - (0.01%) | | | | | | | (79 | ) |
| | | | | | | | |
TOTAL NET ASSETS - 100.00% | | | | | | $ | 724,378 | |
| | | | | | | | |
Percentages are stated as a percent of net assets.
All rates represent either the annualized yield at the date of purchase, or the stated coupon rate, or, for floating and adjustable rate securities, the rate at period end.
| A | LLC - Limited Liability Company. |
| B | Security exempt from registration under the Securities Act of 1933. These securities may be resold to qualified institutional buyers pursuant to Rule 144A. At the period end, the value of these securities amounted to $322,550 or 44.53% of net assets. The Fund has no right to demand registration of these securities. |
See accompanying notes
9
American Beacon U.S. Government Money Market Select FundSM
Schedule of Investments
June 30, 2015 (Unaudited)
| | | | | | | | |
| | | Par Amount | | | Fair Value | |
| | | (000’s) | | | (000’s) | |
U.S. GOVERNMENT AGENCY OBLIGATIONS- 41.17% | | | | | | | | |
Federal Farm Credit Bank, | | | | | | | | |
0.205%, Due 7/10/2015 A | | $ | 5,000 | | | $ | 5,000 | |
0.215%, Due 9/18/2015 A | | | 5,000 | | | | 5,001 | |
0.237%, Due 10/26/2015 A | | | 5,000 | | | | 5,001 | |
0.21%, Due 12/18/2015 A | | | 5,000 | | | | 5,001 | |
0.186%, Due 12/28/2015 A | | | 10,000 | | | | 10,001 | |
0.134%, Due 4/8/2016 A | | | 5,000 | | | | 5,000 | |
Federal Home Loan Bank, | | | | | | | | |
0.14%, Due 7/8/2015 | | | 4,600 | | | | 4,600 | |
0.14%, Due 7/10/2015 | | | 5,000 | | | | 5,000 | |
0.18%, Due 7/16/2015 | | | 5,000 | | | | 5,000 | |
0.17%, Due 7/23/2015 | | | 5,000 | | | | 5,000 | |
0.10%, Due 7/24/2015 | | | 5,000 | | | | 5,000 | |
0.14%, Due 8/5/2015 | | | 3,000 | | | | 3,000 | |
0.19%, Due 8/7/2015 | | | 5,000 | | | | 4,999 | |
0.15%, Due 8/10/2015 A | | | 10,000 | | | | 9,999 | |
0.15%, Due 8/11/2015 | | | 7,500 | | | | 7,499 | |
0.10%, Due 8/14/2015 | | | 10,000 | | | | 9,999 | |
0.09%, Due 8/28/2015 | | | 5,000 | | | | 5,000 | |
0.142%, Due 10/16/2015 A | | | 5,000 | | | | 5,000 | |
0.137%, Due 3/23/2016 A | | | 5,000 | | | | 5,000 | |
Federal Home Loan Mortgage Corp., | | | | | | | | |
0.175%, Due 7/16/2015 A | | | 5,000 | | | | 5,000 | |
0.165%, Due 10/16/2015 A | | | 8,000 | | | | 8,001 | |
Federal National Mortgage Association, 0.50%, Due 7/2/2015 | | | 5,000 | | | | 5,000 | |
| | | | | | | | |
Total U.S. Government Agency Obligations (Cost $128,101) | | | | | | | 128,101 | |
| | | | | | | | |
| | |
| | | Shares | | | | |
INVESTMENT COMPANIES - 5.52% | | | | | | | | |
Deutsche Government Cash Fund, Institutional Class | | | 7,056,496 | | | | 7,056 | |
Morgan Stanley Government Portfolio, Institutional Class | | | 10,134,409 | | | | 10,135 | |
| | | | | | | | |
Total Investment Companies (Cost $17,191) | | | | | | | 17,191 | |
| | | | | | | | |
| | |
| | | Par Amount | | | | |
GOVERNMENT AGENCY REPURCHASE AGREEMENTS - 38.55% | | | | | | | | |
Credit Agricole CIB, 0.14%, Acquired on 6/30/2015, Due 7/1/2015, at $50,000 (Held at JP Morgan Chase, Collateralized by U.S. Government Agency Obligations valued at $52,000, 0.00% - 2.491%, 7/23/2015 – 1/1/2042) | | $ | 50,000 | | | | 50,000 | |
Goldman Sachs & Co., 0.12%, Acquired on 6/30/2015, Due 7/1/2015, at $60,000 (Held at Bank of New York Mellon, Collateralized by U.S. Government Agency Obligations valued at $61,200, 2.50% - 4.50%, 5/1/2027 – 12/1/2044) | | | 60,000 | | | | 60,000 | |
TD Securities (USA) LLC, 0.12%, Acquired on 6/15/2015, Due 7/15/2015, at $10,000 (Held at JP Morgan Chase, Collateralized by U.S. Government Agency Obligations valued at $10,200, 0.00% - 4.00%, 6/23/2016 – 4/1/2045)B C | | | 10,000 | | | | 10,000 | |
| | | | | | | | |
Total Government Agency Repurchase Agreements (Cost $120,000) | | | | | | | 120,000 | |
| | | | | | | | |
| | |
OTHER REPURCHASE AGREEMENTS - 14.78% | | | | | | | | |
BNP Paribas Securities Corp., 0.29%, Acquired on 6/30/2015, Due 7/1/2015, at $12,000 (Held at Bank of New York Mellon, Collateralized by Corporate Obligations valued at $13,200, 2.42% - 7.75%, Due 2/6/2017 – 12/31/2099) | | | 12,000 | | | | 12,000 | |
Merrill Lynch, Pierce, Fenner & Smith, Inc., 0.20%, Acquired on 6/30/2015, Due 7/1/2015, at $12,000 (Held at Bank of New York Mellon, Collateralized by an Equity Security valued at $13,200) | | | 12,000 | | | | 12,000 | |
SG Americas Securities LLC, 0.20%, Acquired on 6/30/2015, Due 7/1/2015, at $10,000 (Held at JP Morgan Chase, Collateralized by Equity Securities valued at $10,500)C | | | 10,000 | | | | 10,000 | |
Wells Fargo Securities LLC, 0.20%, Acquired on 6/30/2015, Due 7/1/2015, at $12,000 (Held at Bank of New York Mellon, Collateralized by Corporate Obligations valued at $12,600, 3.25% - 8.375%, 5/15/2018 – 5/15/2039)C | | | 12,000 | | | | 12,000 | |
See accompanying notes
10
American Beacon U.S. Government Money Market Select FundSM
Schedule of Investments
June 30, 2015 (Unaudited)
| | | | |
| | | Fair Value | |
| | | (000’s) | |
Total Other Repurchase Agreements (Cost $46,000) | | $ | 46,000 | |
| | | | |
| |
TOTAL INVESTMENTS - 100.02% (Cost $311,292) | | | 311,292 | |
LIABILITIES, NET OF OTHER ASSETS - (0.02%) | | | (48 | ) |
| | | | |
TOTAL NET ASSETS - 100.00% | | $ | 311,244 | |
| | | | |
Percentages are stated as a percent of net assets.
All rates represent either the annualized yield at the date of purchase, or the stated coupon rate, or, for floating and adjustable rate securities, the rate at period end.
| C | LLC - Limited Liability Company. |
See accompanying notes
11
American Beacon Select FundsSM
Statements of Assets and Liabilities
June 30, 2015 (Unaudited) (in thousands, except share and per share amounts)
| | | | | | | | |
| | | | | | U.S. | |
| | | | | | Government | |
| | | Money Market | | | Money Market | |
| | | Select Fund | | | Select Fund | |
Assets: | | | | | | | | |
Investments in securities, at fair value A | | $ | 519,457 | | | $ | 145,292 | |
Repurchase agreements, at fair value B | | | 205,000 | | | | 166,000 | |
Dividends and interest receivable | | | 18 | | | | 30 | |
Receivable for fund shares sold | | | 28 | | | | — | |
Receivable for expense reimbursement (Note 2) | | | — | | | | 1 | |
Prepaid expenses | | | 1 | | | | 2 | |
| | | | | | | | |
Total assets | | | 724,504 | | | | 311,325 | |
| | | | | | | | |
Liabilities: | | | | | | | | |
Payable for fund shares redeemed | | | 1 | | | | — | |
Dividends payable | | | — | | | | 3 | |
Management and investment advisory fees payable | | | 56 | | | | 25 | |
Administrative service and service fees payable | | | 6 | | | | 3 | |
Transfer agent fees payable | | | 4 | | | | 3 | |
Custody and fund accounting fees payable | | | 9 | | | | 6 | |
Professional fees payable | | | 20 | | | | 20 | |
Trustee fees payable | | | 14 | | | | 7 | |
Payable for prospectus and shareholder reports | | | 1 | | | | 5 | |
Dues and subscriptions payable | | | 15 | | | | 9 | |
| | | | | | | | |
Total liabilities | | | 126 | | | | 81 | |
| | | | | | | | |
Net Assets | | $ | 724,378 | | | $ | 311,244 | |
| | | | | | | | |
| | |
Analysis of Net Assets: | | | | | | | | |
Paid-in-capital | | | 724,377 | | | | 311,244 | |
Undistributed (or overdistribution of) net investment income | | | 1 | | | | — | |
| | | | | | | | |
Net assets | | $ | 724,378 | | | $ | 311,244 | |
| | | | | | | | |
| | |
Shares outstanding at no par value (unlimited shares authorized): | | | 724,378,391 | | | | 311,244,096 | |
Net assets (not in thousands): | | $ | 724,378,391 | | | $ | 311,244,099 | |
Net asset value, offering and redemption price per share: | | $ | 1.00 | | | $ | 1.00 | |
| | |
A Cost of investments in unaffiliated securities | | $ | 519,457 | | | $ | 145,292 | |
B Cost of repurchase agreements | | $ | 205,000 | | | $ | 166,000 | |
See accompanying notes
12
American Beacon Select FundsSM
Statements of Operations
For the Six Months ended June 30, 2015 (Unaudited) (in thousands)
| | | | | | | | |
| | | | | | U.S. Government | |
| | | Money Market | | | Money Market | |
| | |
Investment Income: | | | | | | | | |
Dividend income from unaffiliated securities | | $ | 11 | | | $ | 2 | |
Interest income | | | 800 | | | | 234 | |
| | | | | | | | |
Net investment income | | | 811 | | | | 236 | |
| | | | | | | | |
Fund Expenses: | | | | | | | | |
Management and investment advisory fees (Note 2) | | | 323 | | | | 149 | |
Custodian fees | | | 35 | | | | 17 | |
Administrative service fees (Note 2) | | | 36 | | | | 17 | |
Transfer agent fees | | | 13 | | | | 10 | |
Professional fees | | | 21 | | | | 18 | |
Registration fees and expenses | | | 1 | | | | — | |
Printing expense | | | 7 | | | | 3 | |
Trustee expense | | | 15 | | | | 7 | |
Insurance expense | | | 6 | | | | 4 | |
Dues and subscription expense | | | 8 | | | | 6 | |
| | | | | | | | |
Total fund expenses | | | 465 | | | | 231 | |
| | | | | | | | |
Net fees waived and expenses reimbursed (Note 2) | | | — | | | | (14 | ) |
| | | | | | | | |
Net fund expenses | | | 465 | | | | 217 | |
| | | | | | | | |
Net investment income | | | 346 | | | | 19 | |
| | | | | | | | |
| | |
Realized Gains: | | | | | | | | |
Net realized gain on investments | | | — | | | | 1 | |
Net gain on investments | | | — | | | | 1 | |
| | | | | | | | |
Net increase in net assets resulting from operations | | $ | 346 | | | $ | 20 | |
| | | | | | | | |
Statements of Changes in Net Assets (in thousands)
| | | | | | | | | | | | | | | | |
| | | Money Market | | | U.S. Government Money Market | |
| | | Six Months ended
June 30, 2015 | | | Year ended
December 31,
2014 | | | Six Months ended
June 30, 2015 | | | Year ended
December 31,
2014 | |
| | | (unaudited) | | | | | | (unaudited) | | | | |
Increase in Net Assets: | | | | | | | | | | | | | | | | |
Operations: | | | | | | | | | | | | | | | | |
Net investment income | | $ | 346 | | | $ | 608 | | | $ | 19 | | | $ | 43 | |
Net realized gain on investments | | | — | | | | 8 | | | | 1 | | | | — | |
| | | | | | | | | | | | | | | | |
Net increase in net assets resulting from operations | | | 346 | | | | 616 | | | | 20 | | | | 43 | |
| | | | | | | | | | | | | | | | |
Distributions to Shareholders: | | | | | | | | | | | | | | | | |
Net investment income | | | (346 | ) | | | (608 | ) | | | (19 | ) | | | (43 | ) |
Net realized gain on investments | | | — | | | | (8 | ) | | | (1 | ) | | | — | |
| | | | | | | | | | | | | | | | |
Distributions to shareholders | | | (346 | ) | | | (616 | ) | | | (20 | ) | | | (43 | ) |
| | | | | | | | | | | | | | | | |
Capital Share Transactions (at $1.00 per share): | | | | | | | | | | | | | | | | |
Proceeds from sales of shares | | | 593,347 | | | | 332,391 | | | | 1,212,996 | | | | 2,249,995 | |
Reinvestment of dividends and distributions | | | 344 | | | | 609 | | | | 3 | | | | 5 | |
Cost of shares redeemed | | | (588,358 | ) | | | (407,362 | ) | | | (1,203,430 | ) | | | (2,316,026 | ) |
| | | | | | | | | | | | | | | | |
Net increase (decrease) in net assets | | | 5,333 | | | | (74,362 | ) | | | 9,569 | | | | (66,026 | ) |
| | | | | | | | | | | | | | | | |
Net increase (decrease) in net assets | | | 5,333 | | | | (74,362 | ) | | | 9,569 | | | | (66,026 | ) |
| | | | | | | | | | | | | | | | |
Net Assets: | | | | | | | | | | | | | | | | |
Beginning of period | | | 719,046 | | | | 793,408 | | | | 301,675 | | | | 367,701 | |
| | | | | | | | | | | | | | | | |
End of Period* | | $ | 724,378 | | | $ | 719,046 | | | $ | 311,244 | | | $ | 301,675 | |
| | | | | | | | | | | | | | | | |
*Includes undistributed net investment income of | | $ | — | | | $ | 1 | | | $ | — | | | $ | — | |
| | | | | | | | | | | | | | | | |
See accompanying notes
13
American Beacon Select FundsSM
Notes to Financial Statements
June 30, 2015 (Unaudited)
1. Organization and Significant Accounting Policies
American Beacon Select Funds (the “Trust”) is organized as a Massachusetts business trust and is registered under the Investment Company Act of 1940 (the “Act”), as amended, as a diversified, open-end management investment company. As of June 30, 2015, the Trust consisted of the following active series included in this report: American Beacon Money Market Select Fund (the “Money Market Fund”) and American Beacon U.S. Government Money Market Select Fund (the “Government Fund”) (collectively, the “Funds” and each individually a “Fund”).
Effective April 30, 2015, American Beacon Advisors, Inc. (the “Manager”) became a wholly-owned subsidiary of Astro AB Borrower, Inc., which is indirectly owned by investment funds affiliated with Kelso & Company, L.P. and Estancia Capital Management, LLC, two prominent private equity firms. Prior to April 30, the Manager was a wholly-owned subsidiary of Lighthouse Holdings, Inc., which was indirectly owned by investment funds affiliated with Pharos Capital Group, LLC and TPG Capital, L.P., two leading private equity firms.
Recently Adopted Accounting Pronouncements
In June 2013, the Financial Accounting Standards Board (“FASB”) issued Accounting Standards Update (“ASU”) No. 2013-08, “Financial Services - Investment Companies (Topic 946): Amendments to the Scope, Measurement, and Disclosure Requirements,” which amends the criteria that define an investment company and clarifies the measurement guidance and requires new disclosures for investment companies. Under the ASU, an entity that is registered under the Investment Company Act of 1940 automatically qualifies as an investment company. The Funds adopted this ASU for the fiscal year ended December 31, 2015. Management has evaluated the implications of the ASU and determined that adoption thereof will not have a material impact on the financial statements.
2. Transactions with Affiliates
Management Agreement
The Funds and the Manager are parties to a Management Agreement that obligates the Manager to provide or oversee the provisions of all investment advisory and portfolio management services. The Manager serves as the sole investment advisor to the Funds. As compensation for performing the duties required under the Management Agreement, the Manager receives 0.09% of the average daily net assets of the Funds.
Administrative Services Agreement
The Manager and the Funds entered into an Administrative Services Agreement that obligates the Manager to provide or oversee administrative services to the Funds. As compensation for performing the duties required under the Administrative Services Agreement, the Manager receives an annualized fee of 0.01% of the average daily net assets of the Funds.
Expense Reimbursement Plan
The Manager voluntarily agreed to reimburse the Government Fund for certain expenses. During the six months ended June 30, 2015, the Manager reimbursed expenses totaling $14,029 to the Government Fund. At June 30, 2015, $545 was receivable from the Manager for the Government Fund.
The Funds have adopted an Expense Reimbursement Plan whereby the Manager may seek repayment of expenses reimbursed for a period of up to three years. However, recoupment will occur only if a Fund’s average net assets have grown or expenses have declined sufficiently to allow reimbursement without causing its expense ratio to exceed the previously agreed upon contractual expense limit.
14
American Beacon Select FundsSM
Notes to Financial Statements
June 30, 2015 (Unaudited)
The carryover of excess expenses potentially reimbursable to the Manager, but not recorded as a liability for the Government Fund is $49,521 and $99,486, expiring in 2016 and 2017, respectively. The Government Fund did not record a liability for these potential reimbursements due to the current assessment that a reimbursement for the period ended June 30, 2015 is unlikely.
3. Security Valuation and Fair Value Measurements
Each Fund values its investments and computes the net asset value per share each day that the New York Stock Exchange is open for business. In accordance with Rule 2a-7 under the Act, money market securities are valued at amortized cost, which approximates fair value. Securities for which amortized cost is deemed not to reflect fair value are stated at fair value as determined in good faith by the Valuation Committee, established by the Trust’s Board of Trustees (the “Board”). In the event that a deviation of 1⁄2 of 1% or more exists between the $1.00 per share price of a Fund, calculated at amortized cost, and the price per share calculated by reference to market quotations, or if there is any other deviation that the Board believes would result in a material dilution to shareholders or purchasers, the Board will promptly consider the appropriate action that should be initiated.
Valuation Inputs
Various inputs may be used to determine the fair value of the Funds’ investments. These inputs are summarized in three broad levels for financial statement purposes.
| | |
| Level 1 - | | Quoted prices in active markets for identical securities. |
| |
| Level 2 - | | Prices determined using other significant observable inputs. These may include quoted prices for similar securities, interest rates, prepayment speeds, credit risk, and others. Level 2 securities are fixed income securities that are valued using observable inputs as stated above. |
| |
| Level 3 - | | Prices determined using other significant unobservable inputs. Unobservable inputs reflect the Fund’s own assumptions about the factors market participants would use in pricing an investment, and would be based on the best information available. |
Observable inputs are those based on market data obtained from sources independent of the fund, and unobservable inputs reflect the fund’s own assumptions based on the best information available. The input levels are not necessarily an indication of the risk or liquidity associated with financial instruments at that level. For example, securities held by a money market fund are generally high quality and liquid; however, they are reflected as Level 2 because the inputs used to determine fair value are not quoted prices in an active market.
The Funds’ investments are summarized by level based on the inputs used to determine their values. U.S. Generally Accepted Accounting Practices (“U.S. GAAP”) also requires all transfer between levels to be disclosed. The end of period timing recognition has been adopted for the transfer between levels of the Funds’ asset and liabilities. During the six months ended June 30, 2015, there were no transfers between levels. As of June 30, 2015, the investments were classified as described below (in thousands):
| | | | | | | | | | | | | | | | |
Money Market Fund | | Level 1 | | | Level 2 | | | Level 3 | | | Total | |
Asset-Backed Commercial Paper | | $ | — | | | $ | 34,988 | | | $ | — | | | $ | 34,988 | |
Certificates of Deposit | | | — | | | | 25,401 | | | | — | | | | 25,401 | |
Financial Company Commercial Paper | | | — | | | | 396,677 | | | | — | | | | 396,677 | |
Investment Companies | | | 62,391 | | | | — | | | | — | | | | 62,391 | |
Repurchase Agreements | | | — | | | | 205,000 | | | | — | | | | 205,000 | |
| | | | | | | | | | | | | | | | |
Total Investments in Securities | | $ | 62,391 | | | $ | 662,066 | | | $ | — | | | $ | 724,457 | |
| | | | | | | | | | | | | | | | |
15
American Beacon Select FundsSM
Notes to Financial Statements
June 30, 2015 (Unaudited)
| | | | | | | | | | | | | | | | |
Government Fund | | Level 1 | | | Level 2 | | | Level 3 | | | Total | |
U.S. Government Agency Obligations | | $ | — | | | $ | 128,101 | | | $ | — | | | $ | 128,101 | |
Investment Companies | | | 17,191 | | | | — | | | | — | | | | 17,191 | |
Government Agency Repurchase Agreements | | | — | | | | 120,000 | | | | — | | | | 120,000 | |
Other Repurchase Agreements | | | — | | | | 46,000 | | | | — | | | | 46,000 | |
| | | | | | | | | | | | | | | | |
Total Investments in Securities | | $ | 17,191 | | | $ | 294,101 | | | $ | — | | | $ | 311,292 | |
| | | | | | | | | | | | | | | | |
Security Transactions and Investment Income
Security transactions for the Funds are recorded on the trade date of the security purchase or sale.
Interest income for the Funds is earned from settlement date, recorded on an accrual basis, and adjusted, if necessary, for amortization of premiums or accretion of discounts on investment grade short-term securities and zero coupon instruments. For financial and tax reporting purposes, realized gains and losses are determined on the basis of specific lot identification.
Dividends to Shareholders
Dividends from net investment income and net short-term capital gain, if any, will be declared and paid monthly. Dividends to shareholders are determined in accordance with federal income tax principles that may treat certain transactions differently than U.S. GAAP.
Use of Estimates
The preparation of financial statements in conformity with U.S. GAAP requires management to make estimates and assumptions that affect the amounts reported in the financial statements and accompanying notes. Actual results may differ from those estimated.
Other
Under the Trust’s organizational documents, its officers and trustees are indemnified against certain liability arising out of the performance of their duties to the Trust. In the normal course of business, the Trust enters into contracts that provide indemnification to the other party or parties against potential costs or liabilities. The Trust’s maximum exposure under these arrangements is dependent on claims that may be made in the future and, therefore, cannot be estimated. The Trust has had no prior claims or losses pursuant to any such agreement.
4. Securities and Other Investments
Repurchase Agreements
A repurchase agreement is a fixed income security in the form of an agreement between a Fund as purchaser and an approved counterparty as seller. The agreement is backed by collateral in the form of securities and/or cash transferred by the seller to the buyer to be held by an eligible third-party custodian. Under the agreement a Fund acquires securities from the seller and the seller simultaneously commits to repurchase the securities at an agreed upon price and date, normally within a week. The price for the seller to repurchase the securities is greater than a Fund’s purchase price, reflecting an agreed upon “interest rate” that is effective for the period of time the purchaser’s money is invested in the security. During the term of the repurchase agreement, a Fund monitors on a daily basis the market value of the collateral subject to the agreement and, if the market value of the securities falls below the seller’s repurchase amount provided under the repurchase agreement, the seller is required to transfer additional securities or cash collateral equal to the amount by which the market value of the securities falls below the repurchase amount. Repurchase agreements may exhibit the economic characteristics of loans by a Fund.
16
American Beacon Select FundsSM
Notes to Financial Statements
June 30, 2015 (Unaudited)
The obligation of the seller under the repurchase agreement is not guaranteed, and there is a risk that the seller may fail to repurchase the underlying securities, whether because of the seller’s bankruptcy or otherwise. In such event, a Fund would attempt to exercise its rights with respect to the underlying collateral, including possible sale of the securities. A Fund may incur various expenses in connection with the exercise of its rights and may be subject to various delays and risks of loss, including (a) possible declines in the value of the underlying collateral, (b) possible reduction in levels of income and (c) lack of access to the collateral held through a third-party custodian and possible inability to enforce the Fund’s rights. The Board has established procedures pursuant to which the Manager monitors the creditworthiness of the counterparties with which the Fund enters into repurchase agreement transactions.
The Funds may enter into repurchase agreements with member banks of the Federal Reserve System or registered broker-dealers who, in the opinion of the Manager, present a minimal risk of default during the term of the agreement. The underlying securities which serve as collateral for repurchase agreements may include fixed income and equity securities such as U.S. Government and agency securities, municipal obligations, corporate obligations, asset-backed securities, mortgage-backed securities, common and preferred stock, American Depository Receipts, exchange-traded funds and convertible securities. There is no percentage restriction on each Fund’s ability to enter into repurchase agreements with terms of seven days or less.
As of June 30, 2015, the following funds had investments in repurchase agreements with a gross value as disclosed in the Schedule of Investments and the Statements of Assets and Liabilities.
| | | | |
Fund | | Total | |
Money Market Fund | | $ | 205,000 | |
Government Fund | | | 166,000 | |
The value of the related collateral disclosed on the Schedules of Investments exceeded the value of the repurchase agreements at period end.
Restricted Securities
Certain Funds may invest in securities that are subject to legal or contractual restrictions on resale. These securities may be sold privately, but are required to be registered or exempted from such registration before being sold to the public. Private placement securities are generally considered to be restricted except for those securities traded between qualified institutional investors under the provisions of Rule 144A of the Securities Act of 1933. Disposal of restricted securities may involve time-consuming negotiations and expenses, and prompt sale at an acceptable price may be difficult to achieve. Restricted securities outstanding at the period ended June 30, 2015 are disclosed in the Notes to the Schedules of Investments.
5. Federal Income Taxes
It is the policy of each Fund to qualify as a regulated investment company, by complying with all applicable provisions of Subchapter M of the Internal Revenue Code, as amended, and to make distribution of taxable income sufficient to relieve it from substantially all federal income and excise taxes. For federal income tax purposes, each Fund is treated as a single entity for the purpose of determining such qualification.
The Funds do not have any unrecognized tax benefits in the accompanying financial statements. Each of the tax years in the four year period ended December 31, 2014 remains subject to examination by the Internal Revenue Service. If applicable, the Funds recognize interest accrued related to unrecognized tax benefits in interest expense and penalties in “Other expense” on the Statements of Operations.
Dividends are categorized in accordance with income tax regulations which may treat certain transactions differently than U.S. GAAP. Accordingly, the character of distributions and composition of net assets for tax purposes may differ from those reflected in the accompanying financial statements.
17
American Beacon Select FundsSM
Notes to Financial Statements
June 30, 2015 (Unaudited)
The tax character of distributions paid were as follows (in thousands):
| | | | | | | | | | | | | | | | |
| | | Money Market Fund | | | Government Fund | |
| | | Six Months Ended
June 30, 2015 | | | Year Ended
December 31, 2014 | | | Six Months Ended
June 30, 2015 | | | Year Ended
December 31, 2014 | |
| | | (unaudited) | | | | | | (unaudited) | | | | |
| | | | |
Distributions paid from: | | | | | | | | | | | | | | | | |
Ordinary income* | | $ | 346 | | | $ | 616 | | | $ | 20 | | | $ | 43 | |
| | | | | | | | | | | | | | | | |
Total distributions paid | | $ | 346 | | | $ | 616 | | | $ | 20 | | | $ | 43 | |
| | | | | | | | | | | | | | | | |
| * | For tax purposes short-term capital gains distributions are considered ordinary income distributions. |
As of June 30, 2015, the components of distributable earnings or (deficits) on a tax basis were as follows (in thousands):
| | | | | | | | |
| | | Money Market
Fund | | | Government
Fund | |
Cost basis of investments for federal income tax purposes | | $ | 724,457 | | | $ | 311,292 | |
| | |
Unrealized appreciation | | | — | | | | — | |
Unrealized depreciation | | | — | | | | — | |
| | | | | | | | |
Net unrealized appreciation or (depreciation) | | | — | | | | — | |
| | |
Undistributed ordinary income | | | 1 | | | | — | |
Accumulated long-term gain or (loss) | | | — | | | | — | |
Other temporary differences | | | — | | | | — | |
| | | | | | | | |
Distributable earnings or (deficits) | | $ | 1 | | | $ | — | |
| | | | | | | | |
Under the Regulated Investment Company Modernization Act of 2010 (the “RIC MOD”), net capital losses recognized by Funds in taxable years beginning after December 22, 2010 are carried forward indefinitely and retain their character as short-term and/or long-term losses. Prior to RIC MOD, net capital losses incurred by the Funds were carried forward for eight years and treated as short-term losses. RIC MOD requires that post-enactment net capital losses be used before pre-enactment net capital losses.
For the six months ended June 30, 2015 the Funds did not have capital loss carryforwards.
6. Principal Risks
In the normal course of business the Funds trade financial instruments and enter into financial transactions where risk of potential loss exists. Security values fluctuate (market risk) and may decline due to factors affecting securities markets in general, particular industries represented in the securities markets or conditions specifically related to a particular company. Failure of the other party to a transaction to perform (credit and counterparty risk), for example by not making principal and interest payments when due, reduces the value of the issuer’s debt and could reduce the Funds’ income. Similar to credit risk, the Funds may be exposed to counterparty risk, or the risk that an institution or other entity with which the Funds have unsettled or open transactions will fail to make required payments or otherwise comply with the terms of the instrument, transaction or contract. The potential loss could exceed the value of the financial assets recorded in the financial statements. Some of the Funds’ investments may be illiquid and the Funds may not be able to vary the portfolio investments in response to changes in economic and other conditions. If a Fund is required to liquidate all or a portion of its investments quickly, the Fund may realize significantly less than the value at which it previously recorded those investments.
Offsetting Assets and Liabilities
The Funds are parties to Master Repurchase Agreements (“Master Repo Agreements”) that govern transactions between the Funds and selected counterparties. The Master Repo Agreements contain provisions for, among other things, initiation, income payments, events of default, and maintenance of collateral for Repurchase Agreements. The Funds have elected not to offset qualifying financial and derivative instruments
18
American Beacon Select FundsSM
Notes to Financial Statements
June 30, 2015 (Unaudited)
on the Statements of Assets and Liabilities, as such financial and derivative instruments are presented on a gross basis. The impacts of netting arrangements that provide the right to offset are detailed below. The net amount represents the net receivable or payable that would be due from or to the counterparty in the event of default. Exposure from borrowings and other financing agreements such as repurchase agreements can only be netted across transactions governed by the same Master Repo Agreement with the same legal entity. All amounts reported below represent the balance as of the report date, June 30, 2015 (in thousands).
Money Market Fund
Offsetting of Financial Assets and Derivative Assets as of June 30, 2015:
| | | | | | | | | | | | |
Description | | Gross Amounts of
Recognized Assets | | | Gross Amounts
Offset in the
Statement of Assets
and Liabilities | | | Net Amounts of Liabilities
Presented in the
Statement of Assets
and Liabilities | |
Repurchase Agreements | | $ | 205,000 | | | $ | — | | | $ | 205,000 | |
Financial Assets, Derivative Assets, and Collateral Pledged by Counterparty as of June 30, 2015:
| | | | | | | | | | | | | | | | |
| | | Net Amounts of
Assets Presented in
the Statement of
Assets and
Liabilities | | | Gross Amounts Not Offset in the
Statement of Assets and Liabilities | | | | |
Counterparty | | | Financial
Instruments1 | | | Cash Collateral
Received | | | Net Amount | |
BNP Paribas Securities Corp. | | $ | 35,000 | | | $ | (35,000 | ) | | $ | — | | | $ | — | |
JPMorgan Clearing Corp. | | | 30,000 | | | | (30,000 | ) | | | — | | | | — | |
Merrill Lynch, Pierce, Fenner & Smith, Inc. | | | 35,000 | | | | (35,000 | ) | | | — | | | | — | |
RBC Capital Markets LLC | | | 35,000 | | | | (35,000 | ) | | | — | | | | — | |
SG Americas Securities LLC | | | 35,000 | | | | (35,000 | ) | | | — | | | | — | |
Wells Fargo Securities LLC | | | 35,000 | | | | (35,000 | ) | | | — | | | | — | |
| | | | | | | | | | | | | | | | |
| | $ | 205,000 | | | $ | (205,000 | ) | | $ | — | | | $ | — | |
| | | | | | | | | | | | | | | | |
U.S. Government Money Market Fund
Offsetting of Financial Assets and Derivative Assets as of June 30, 2015:
| | | | | | | | | | | | |
Description | | Gross Amounts of
Recognized Assets | | | Gross Amounts
Offset in the
Statement of Assets
and Liabilities | | | Net Amounts of Liabilities
Presented in the
Statement of Assets
and Liabilities | |
Repurchase Agreements | | $ | 166,000 | | | $ | — | | | $ | 166,000 | |
Financial Assets, Derivative Assets, and Collateral Pledged by Counterparty as of June 30, 2015:
| | | | | | | | | | | | | | | | |
| | | Net Amounts of
Assets Presented in
the Statement of
Assets and
Liabilities | | | Gross Amounts Not Offset in the
Statement of Assets and Liabilities | | | | |
Counterparty | | | Financial
Instruments2 | | | Cash Collateral
Received | | | Net Amount | |
BNP Paribas Securities Corp. | | $ | 12,000 | | | $ | (12,000 | ) | | $ | — | | | $ | — | |
Credit Agricole CIB | | | 50,000 | | | | (50,000 | ) | | | — | | | | — | |
Goldman Sachs & Co. | | | 60,000 | | | | (60,000 | ) | | | — | | | | — | |
Merrill Lynch, Pierce, Fenner & Smith, Inc. | | | 12,000 | | | | (12,000 | ) | | | — | | | | — | |
SG Americas Securities LLC | | | 10,000 | | | | (10,000 | ) | | | — | | | | — | |
TD Securities (USA) LLC | | | 10,000 | | | | (10,000 | ) | | | — | | | | — | |
Wells Fargo Securities LLC | | | 12,000 | | | | (12,000 | ) | | | — | | | | — | |
| | | | | | | | | | | | | | | | |
| | $ | 166,000 | | | $ | (166,000 | ) | | $ | — | | | $ | — | |
| | | | | | | | | | | | | | | | |
| 1 | Excess of collateral received from the individual counterparty is not shown for financial statement purposes. Collateral with a value of $218,704 has been received in connection with repurchase transactions. |
| 2 | Excess of collateral received from the individual counterparty is not shown for financial statement purposes. Collateral with a value of $172,900 has been received in connection with repurchase transactions. |
19
American Beacon Money Market Select FundSM
Financial Highlights
(For a share outstanding throughout the period)
| | | | | | | | | | | | | | | | | | | | | | | | |
| | | Six Months
Ended
June 30,
2015 | | | Year Ended December 31, | |
| | | | 2014 | | | 2013 | | | 2012 | | | 2011 | | | 2010 | |
| | | (unaudited) | | | | | | | | | | | | | | | | |
| | | | | | |
Net asset value, beginning of period | | $ | 1.00 | | | $ | 1.00 | | | $ | 1.00 | | | $ | 1.00 | | | $ | 1.00 | | | $ | 1.00 | |
| | | | | | | | | | | | | | | | | | | | | | | | |
Income from investment operations: | | | | | | | | | | | | | | | | | | | | | | | | |
Net investment income | | | 0.00 | A | | | 0.00 | A | | | 0.00 | A | | | 0.00 | A | | | 0.00 | A,B | | | 0.00 | A,B |
Net realized loss on investments | | | 0.00 | A | | | 0.00 | A | | | 0.00 | A | | | 0.00 | A | | | 0.00 | A | | | 0.00 | A |
| | | | | | | | | | | | | | | | | | | | | | | | |
Total loss from investment operations | | | 0.00 | | | | 0.00 | | | | 0.00 | | | | 0.00 | | | | 0.00 | | | | 0.00 | |
| | | | | | | | | | | | | | | | | | | | | | | | |
Less distributions: | | | | | | | | | | | | | | | | | | | | | | | | |
Dividends from net investment income | | | 0.00 | A | | | 0.00 | A | | | 0.00 | A | | | 0.00 | A | | | 0.00 | A | | | 0.00 | A |
Distributions from net realized gains on investments | | | 0.00 | A | | | 0.00 | A | | | 0.00 | A | | | 0.00 | A | | | 0.00 | A | | | 0.00 | A |
| | | | | | | | | | | | | | | | | | | | | | | | |
Total distributions | | | 0.00 | | | | 0.00 | | | | 0.00 | | | | 0.00 | | | | 0.00 | | | | 0.00 | |
| | | | | | | | | | | | | | | | | | | | | | | | |
Net asset value, end of period | | $ | 1.00 | | | $ | 1.00 | | | $ | 1.00 | | | $ | 1.00 | | | $ | 1.00 | | | $ | 1.00 | |
| | | | | | | | | | | | | | | | | | | | | | | | |
Total return | | | 0.05 | %C | | | 0.08 | % | | | 0.11 | % | | | 0.19 | % | | | 0.14 | % | | | 0.21 | % |
| | | | | | | | | | | | | | | | | | | | | | | | |
Ratios and supplemental data: | | | | | | | | | | | | | | | | | | | | | | | | |
Net assets, end of period (in thousands) | | $ | 724,378 | | | $ | 719,046 | | | $ | 793,408 | | | $ | 760,503 | | | $ | 662,509 | | | $ | 645,557 | |
Ratios to average net assets: | | | | | | | | | | | | | | | | | | | | | | | | |
Expenses, before reimbursements | | | 0.13 | %D | | | 0.13 | % | | | 0.13 | % | | | 0.13 | % | | | 0.13 | %B | | | 0.13 | %B |
Expenses, net of reimbursements | | | 0.13 | %D | | | 0.13 | % | | | 0.13 | % | | | 0.13 | % | | | 0.13 | %B | | | 0.13 | %B |
Net investment income, before reimbursements | | | 0.10 | %D | | | 0.08 | % | | | 0.11 | % | | | 0.18 | % | | | 0.14 | %B | | | 0.21 | %B |
Net investment income, net of reimbursements | | | 0.10 | %D | | | 0.08 | % | | | 0.11 | % | | | 0.18 | % | | | 0.14 | %B | | | 0.21 | %B |
| A | Amount is less than $0.01 per share. |
| B | The per share amounts and ratios reflect income and expenses assuming inclusion of the Fund’s proportionate share of the income and expenses of the American Beacon Master Money Market Portfolio which terminated on September 30, 2011. |
20
American Beacon U.S. Government Money Market Select FundSM
Financial Highlights
(For a share outstanding throughout the period)
| | | | | | | | | | | | | | | | | | | | | | | | |
| | | Six Months
Ended
June 30,
2015 | | | Year Ended December 31, | |
| | | | 2014 | | | 2013 | | | 2012 | | | 2011 | | | 2010 | |
| | | (unaudited) | | | | | | | | | | | | | | | | |
| | | | | | |
Net asset value, beginning of period | | $ | 1.00 | | | $ | 1.00 | | | $ | 1.00 | | | $ | 1.00 | | | $ | 1.00 | | | $ | 1.00 | |
| | | | | | | | | | | | | | | | | | | | | | | | |
Income from investment operations: | | | | | | | | | | | | | | | | | | | | | | | | |
Net investment income | | | 0.00 | A | | | 0.00 | A | | | 0.00 | A | | | 0.00 | A | | | 0.00 | A | | | 0.00 | A |
Net realized gain on investments | | | — | | | | — | | | | 0.00 | A | | | 0.00 | A | | | 0.00 | A | | | 0.00 | A |
| | | | | | | | | | | | | | | | | | | | | | | | |
Total income from investment operations | | | 0.00 | | | | 0.00 | | | | 0.00 | | | | 0.00 | | | | 0.00 | | | | 0.00 | |
| | | | | | | | | | | | | | | | | | | | | | | | |
Less distributions: | | | | | | | | | | | | | | | | | | | | | | | | |
Dividends from net investment income | | | 0.00 | A | | | 0.00 | A | | | 0.00 | A | | | 0.00 | A | | | 0.00 | A | | | 0.00 | A |
Distributions from net realized gains | | | — | | | | — | | | | 0.00 | A | | | 0.00 | A | | | 0.00 | A | | | 0.00 | A |
| | | | | | | | | | | | | | | | | | | | | | | | |
Total distributions | | | 0.00 | | | | 0.00 | | | | 0.00 | | | | 0.00 | | | | 0.00 | | | | 0.00 | |
| | | | | | | | | | | | | | | | | | | | | | | | |
Net asset value, end of period | | $ | 1.00 | | | $ | 1.00 | | | $ | 1.00 | | | $ | 1.00 | | | $ | 1.00 | | | $ | 1.00 | |
| | | | | | | | | | | | | | | | | | | | | | | | |
Total return | | | 0.01 | %B | | | 0.01 | % | | | 0.02 | % | | | 0.09 | % | | | 0.04 | % | | | 0.13 | % |
| | | | | | | | | | | | | | | | | | | | | | | | |
| | | | | | |
Ratios and supplemental data: | | | | | | | | | | | | | | | | | | | | | | | | |
Net assets, end of period (in thousands) | | $ | 311,244 | | | $ | 301,675 | | | $ | 367,701 | | | $ | 238,236 | | | $ | 253,776 | | | $ | 324,695 | |
Ratios to average net assets: | | | | | | | | | | | | | | | | | | | | | | | | |
Expenses, before expense reimbursements | | | 0.14 | %C | | | 0.14 | % | | | 0.14 | % | | | 0.15 | % | | | 0.14 | % | | | 0.14 | % |
Expenses, net of expense reimbursements | | | 0.13 | %C | | | 0.11 | % | | | 0.13 | % | | | 0.14 | % | | | 0.14 | % | | | 0.13 | % |
Net investment income, before expense reimbursements | | | 0.00 | %C | | | (0.01 | )% | | | 0.01 | % | | | 0.09 | % | | | 0.04 | % | | | 0.12 | % |
Net investment income, net of expense reimbursements | | | 0.01 | %C | | | 0.01 | % | | | 0.02 | % | | | 0.09 | % | | | 0.04 | % | | | 0.12 | % |
| A | Amount is less than $0.01 per share. |
21
American Beacon Select FundsSM
Results of Shareholder Meeting (Unaudited)
A special meeting of shareholders of each of the portfolios of the American Beacon Select Funds (the “Trust”) was held on April 7, 2015. The shareholders of the Money Market Select and U.S. Government Money Market Select Funds (the “Funds”) approved a new investment management agreement between American Beacon Advisors, Inc. and the Funds. Approval of this proposal required a majority of the outstanding voting securities of each Fund. The following are the results of the shareholder votes for this proposal:
| | | | | | | | | | | | | | | | |
Funds | | For | | | Against | | | Abstain | | | Non-Voting | |
Money Market Select Fund | | | 573,607,899.06 | | | | 0 | | | | 0 | | | | 24,466.00 | |
U.S. Government Money Market Select Fund | | | 265,420,762.99 | | | | 0 | | | | 0 | | | | 3,650,255.00 | |
A special meeting of shareholders of the Trust was held on April 7, 2015. The shareholders of the Trust approved the re-election of nine of the current Trustees to the Board of the Trust and the election of two additional Trustees to the Board. Approval of this proposal required a plurality vote of the Trust’s shares. The following are the results of the election of each Trustee:
| | | | |
Gilbert G. Alvarado | | | | |
Affirmative | | | 842,703,383.05 | |
Withhold | | | 0.00 | |
| |
Joseph B. Armes | | | | |
Affirmative | | | 842,703,383.05 | |
Withhold | | | 0.00 | |
| |
Gerard J. Arpey | | | | |
Affirmative | | | 842,703,383.05 | |
Withhold | | | 0.00 | |
| |
W. Humphrey Bogart | | | | |
Affirmative | | | 842,703,383.05 | |
Withhold | | | 0.00 | |
| |
Brenda A. Cline | | | | |
Affirmative | | | 842,703,383.05 | |
Withhold | | | 0.00 | |
| |
Eugene J. Duffy | | | | |
Affirmative | | | 842,703,383.05 | |
Withhold | | | 0.00 | |
| |
Thomas M. Dunning | | | | |
Affirmative | | | 842,703,383.05 | |
Withhold | | | 0.00 | |
| |
Alan D. Feld | | | | |
Affirmative | | | 842,703,383.05 | |
Withhold | | | 0.00 | |
| |
Richard A. Massman | | | | |
Affirmative | | | 842,703,383.05 | |
Withhold | | | 0.00 | |
| |
Barbara J. McKenna | | | | |
Affirmative | | | 842,703,383.05 | |
Withhold | | | 0.00 | |
| |
R. Gerald Turner | | | | |
Affirmative | | | 842,703,383.05 | |
Withhold | | | 0.00 | |
22
This page intentionally left blank.
23
This page intentionally left blank.
24
This page intentionally left blank.
25

Delivery of Documents
eDelivery is NOW AVAILABLE- Stop traditional mail delivery and receive your
shareholder reports and summary prospectus on-line. Sigh up at
www.americanbeaconfunds.com
If you invest in the Funds through a financial institution, you may be able to receive the Fund’s regulatory mailings, such as the Summary Prospectus, Annual Report and Semi-Annual Report, by e-mail. If you are interested in this option, please go to www.icsdelivery.com and search for your financial institution’s name or contact your financial institution directly.
To obtain more information about the Fund:
| | |
 | |  |
By E-mail: american_beacon.funds@ambeacon.com | | On the Internet: Visit our website at www.americanbeaconfunds.com |
| |
 | |  |
| |
By Telephone: Call (800) 658-5811 | | By Mail: American Beacon Select Funds P.O. Box 219643 Kansas City, MO 64121 |
Availability of Quarterly Portfolio Schedules | | Availability of Proxy Voting Policy and Records |
In addition to the Schedule of Investments provided in each semi-annual and annual report, the Fund files a complete schedule of its portfolio holdings with the Securities and Exchange Commission (“SEC”) on Form N-Q as of the first and third fiscal quarters. The Fund’s Forms N-Q are available on the SEC’s website at www.sec.gov. The Forms N-Q may also be reviewed and copied at the SEC’s Public Reference Section, 100 F Street, NE, Washington, D.C. 20549-1520. Information regarding the operation of the SEC’s Public Reference Room may be obtained by calling (202) 551-8090. A complete schedule of the Fund’s portfolio holdings is also available at www.americanbeaconfunds.com approximately five days after the end of each month. | | A description of the policies and procedures the Fund uses to determine how to vote proxies relating to portfolio securities is available in the Fund’s Statement of Additional Information, is available free of charge on the Fund’s website www.americanbeaconfunds.com and by calling 1-800-967-9009 or by accessing the SEC’s website at www.sec.gov. The Fund’s proxy voting record for the most recent year ended June 30 is filed annually with the SEC on Form N-PX. The Fund’s Forms N-PX are available on the SEC’s website at www.sec.gov. The Fund’s proxy voting record may also be obtained by calling 1-800-967-9009. |
Fund Service Providers:
| | | | | | |
CUSTODIAN State Street Bank and Trust Boston, Massachusetts | | TRANSFER AGENT Boston Financial Data Services Kansas City, Missouri | | INDEPENDENT REGISTERED PUBLIC ACCOUNTING FIRM Ernst & Young LLP Dallas, Texas | | DISTRIBUTOR Foreside Fund Services, LLC Portland, Maine |
This report is prepared for shareholders of the American Beacon Money Market Select Funds and may be distributed to others only if preceded or accompanied by a current Prospectus or Summary Prospectus.
American Beacon Select Funds, American Beacon Money Market Select Fund, and American Beacon U.S. Government Money Market Select Fund are service marks of American Beacon Advisors, Inc.
SAR 6/15
ITEM 2. CODE OF ETHICS.
The Trust did not amend the code of ethics that applies to its principal executive and financial officers (the “Code”) nor did it grant any waivers to the provisions of the Code during the period covered by the shareholder reports presented in Item 1.
ITEM 3. AUDIT COMMITTEE FINANCIAL EXPERT.
Not Applicable.
ITEM 4. PRINCIPAL ACCOUNTANT FEES AND SERVICES.
Not Applicable.
ITEM 5. AUDIT COMMITTEE OF LISTED REGISTRANTS.
Not Applicable.
ITEM 6. SCHEDULE OF INVESTMENTS.
The schedules of investments for each series of the Trust are included in the shareholder reports presented in Item 1.
| ITEM 7. | DISCLOSURE OF PROXY VOTING POLICIES AND PROCEDURES FOR CLOSED-END MANAGEMENT INVESTMENT COMPANIES. |
Not Applicable.
ITEM 8. PORTFOLIO MANAGERS OF CLOSED-END MANAGEMENT INVESTMENT COMPANIES.
Not applicable.
ITEM 9. PURCHASES OF EQUITY SECURITIES BY CLOSED-END MANAGEMENT INVESTMENT COMPANY AND AFFILIATED PURCHASERS.
Not Applicable.
ITEM 10. SUBMISSION OF MATTERS TO A VOTE OF SECURITY HOLDERS.
The Trust has made no material changes to the procedures by which shareholders may recommend nominees to the Trust’s Board of Trustees since the Trust last disclosed such procedures in Schedule 14A.
ITEM 11. CONTROLS AND PROCEDURES.
(a) Based upon an evaluation within 90 days of the filing date of this report, the principal executive and financial officers concluded that the disclosure controls and procedures of the Trust are effective.
(b) There were no changes in the Trust’s internal control over financial reporting during the second fiscal quarter of the period covered by this report that has materially affected, or is reasonably likely to materially affect, the Trust’s internal control over financial reporting.
ITEM 12. EXHIBITS.
(a)(1) Not Applicable.
(a)(2) A separate certification for each principal executive officer and principal financial officer of the Trust as required by Rule 30a-2(a) under the Investment Company Act of 1940 is attached hereto as EX-99.CERT.
(a)(3) Not Applicable.
(b) The certifications required by Rule 30a-2(b) under the Investment Company Act of 1940 are attached hereto as EX-99.906CERT.
SIGNATURES
Pursuant to the requirements of the Securities Exchange Act of 1934 and the Investment Company Act of 1940, the registrant has duly caused this report to be signed on its behalf by the undersigned, thereunto duly authorized.
| | |
| (Registrant): American Beacon Select Funds |
| |
| By | | /s/ Gene L. Needles, Jr. |
| | Gene L. Needles, Jr. |
| | President |
|
| Date: September 8, 2015 |
Pursuant to the requirements of the Securities Exchange Act of 1934 and the Investment Company Act of 1940, this report has been signed below by the following persons on behalf of the registrant and in the capacities and on the dates indicated.
| | |
| By | | /s/ Gene L. Needles, Jr. |
| | Gene L. Needles, Jr. |
| | President |
|
| Date: September 8, 2015 |
| |
| By | | /s/ Melinda G. Heika |
| | Melinda G. Heika |
| | Treasurer |
|
| Date: September 8, 2015 |