UNITED STATES
SECURITIES AND EXCHANGE COMMISSION
Washington, D.C. 20549
FORM N-CSRS
CERTIFIED SHAREHOLDER REPORT OF REGISTERED
MANAGEMENT INVESTMENT COMPANIES
Investment Company Act file number: 811-09603
AMERICAN BEACON SELECT FUNDS
(Exact name of registrant as specified in charter)
4151 Amon Carter Boulevard, MD 2450
Fort Worth, Texas 76155
(Address of principal executive offices)-(Zip code)
Gene L. Needles, Jr., PRESIDENT
4151 Amon Carter Boulevard, MD 2450
Fort Worth, Texas 76155
(Name and address of agent for service)
Registrant’s telephone number, including area code: (817) 391-6100
Date of fiscal year end: December 31, 2014
Date of reporting period: June 30, 2014
ITEM 1. REPORT TO STOCKHOLDERS.
About American Beacon Advisors
Since 1986, American Beacon Advisors has offered a variety of products and investment advisory services to numerous institutional and retail clients, including a variety of mutual funds, corporate cash management, and separate account management.
Our clients include defined benefit plans, defined contribution plans, foundations, endowments, corporations, financial planners, and other institutional investors. With American Beacon Advisors, you can put the experience of a multi-billion dollar asset management firm to work for your company.
Any opinions herein, including forecasts, reflect our judgment as of the end of the reporting period and are subject to change. Each advisor’s strategies and the Fund’s portfolio composition will change depending on economic and market conditions. This report is not a complete analysis of market conditions and therefore, should not be relied upon as investment advice. Although economic and market information has been compiled from reliable sources, American Beacon Advisors, Inc. makes no representation as to the completeness or accuracy of the statements contained herein.
| | |
| American Beacon Select Funds | | June 30, 2014 |
| | |
 | | Dear Shareholders, |
| | Money market funds are an important vehicle for people who invest in all types of other asset classes. It is not quite accurate to think of money market assets as sitting on the sidelines or as a resource for investors who don’t want to participate in the market. Many institutional investors and asset managers make deposits into money market accounts when they have cashed out a position and are deciding on their next opportunity. |
| | That’s why when the stock market started to boom after bottoming out in early 2009, funds flowed out of money market accounts. Money market funds saw net annual outflows every year from 2009 to 2012, before seeing a modest inflow of $15 billion last year. By the end of the first |
half of 2014, there was more than $2.5 trillion in money market funds.
These funds serve an important role in the investing community. Most investors recognize how important it is to have a reliable, stable money market fund, even if most of your assets are invested in other types of securities. American Beacon is well-known for its innovative actively managed funds, but we are also proud to offer two money market funds for our shareholders’ maximum flexibility.
For the six months ended June 30, 2014:
| | • | | The American Beacon Money Market Select Fund returned 0.04%. |
| | • | | The American Beacon U.S. Government Money Market Select Fund returned 0.00%. |
Thank you for your continued investment in the American Beacon Select Funds. For additional information about the Funds or to access your account information, please visit our website at www.americanbeaconfunds.com.
|
| Sincerely, |
|
 |
| Gene L. Needles, Jr. |
| President |
| American Beacon Select Funds |
1
American Beacon Money Market Select FundSM
Performance Overview
June 30, 2014 (Unaudited)
During the first half of 2014 the U.S. economy continued to rebound, even with a disappointing weather related first quarter GDP. Most recently, there have been rising geopolitical tensions and continued speculation on when the Fed will begin to normalize monetary policy. Much of this speculation has been driven by an uptick in inflation and improvements in the labor market. The unemployment rate has dropped to 6.1% and non-farm payrolls have averaged an increase of 233,000 jobs per month for the first half of the year. Despite economic improvements, concerns remain about the subdued improvements in the housing sector and the weak pace of wage growth.
The Fed has continued its pace of reducing asset purchases by $10 billion at each Federal Open Market Committee (FOMC) meeting this year and is likely to end the Quantitative Easing (QE) program in October of this year. The Committee continues to anticipate that “it likely will be appropriate to maintain the current target range for the federal funds rate for a considerable time after the asset purchase program ends.” The market is currently projecting that the Fed will begin raising the fed funds target in mid-2015.
With liquidity and credit quality continued priorities, the American Beacon Money Market Select Fund’s (the “Fund”) primary strategy for the first half of the year was to buy high quality, short-term money market instruments and overnight investments. The strategies implemented during the period enabled the Fund to outperform its Lipper peer group.
For the six months ended June 30, 2014, the total return of the Fund was 0.04%. The Fund outperformed the Lipper Institutional Money Market Average return of 0.01% by three basis points (0.03%). Based on annualized total returns, Lipper Analytical Services ranked the Fund 8th among 278, 10th among 253 and 17th among 183 Institutional Money Market Funds for the one-year, five-year, and ten-year periods ended June 30, 2014, respectively.
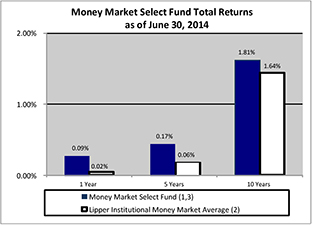
Total Returns for the Period ended 6/30/14
| | | | | | | | | | | | |
| | | 1 Year | | | 5 Years | | | 10 Years | |
Money Market Select (1,3) | | | 0.09 | % | | | 0.17 | % | | | 1.81 | % |
Lipper Institutional Money Market Average (2) | | | 0.02 | % | | | 0.06 | % | | | 1.64 | % |
| 1 | Performance shown is historical and is not indicative of future returns. Investment returns will vary, and shares may be worth more or less at redemption than at original purchase. An investment in the Fund is neither insured nor guaranteed by the Federal Deposit Insurance Corporation or any other government agency. Although the Fund seeks to preserve the value of an investment at $1.00 per share, it is possible to lose money by investing in the Fund. Fund performance in the table above does not reflect the deduction of taxes a shareholder would pay on distributions or the redemption of shares. |
| 2 | The Lipper Institutional Money Market Funds Average is calculated by taking an arithmetic average of the returns of the mutual funds in the Lipper Institutional Money Market Funds category. Lipper is an independent mutual fund research and ranking service. |
| 3 | The total annual Fund operating expense ratio set forth in the most recent prospectus for the Fund was 0.13%. The expense ratio above may vary from the expense ratio presented in other sections of this report, which is based on expenses incurred during the period covered by this report. |
2
American Beacon Money Market Select FundSM
Performance Overview
June 30, 2014 (Unaudited)
Fund Statistics as of 6/30/14
| | | | |
7-day Current Yield* | | | 0.07 | % |
7-day Effective Yield* | | | 0.07 | % |
30-day Yield* | | | 0.07 | % |
Weighted Avg. Maturity | | | 43 Days | |
Standard & Poor’s Rating** | | | AAAm | |
| * | Annualized. You may call 1-800-231-4252 to obtain the Fund’s current 7-day yields. Yield is a more accurate reflection of the Fund’s current earnings than total returns. The seven-day yields refer to the income generated by an investment in the Fund over a seven-day period. This income is then annualized. The seven-day effective yield is calculated similarly, but the income earned is assumed to have been reinvested. The effective yield will be slightly higher than the current yield because of the compounding effect of this assumed reinvestment. |
| ** | Standard & Poor’s (S&P) Rating: The fund is not sponsored, endorsed, sold or promoted by S&P, and S&P makes no representation regarding the advisability of investing in the fund. The credit rating is a forward-looking opinion about a fund’s potential capacity to maintain stable principal or stable net asset value. The rating is an opinion as of the date expressed and not a statement of fact or recommendation to purchase, hold or sell any security. Standard & Poor’s rates the creditworthiness of money market funds from AAAm (highest) to Dm (lowest). For more information on S&P’s rating methodology, please visit www.standardandpoors.com and select “Understanding Ratings” under Ratings Resources on the home page. |
Asset Allocation as of 6/30/14 (% of Net Assets)
| | | | |
Financial Company Commercial Paper | | | 48.2 | % |
Other Repurchase Agreements | | | 33.3 | % |
Certificate of Deposit | | | 13.0 | % |
Asset-Backed Commercial Paper | | | 4.2 | % |
Investment Company | | | 1.3 | % |
Effective Maturity Distribution (% of net assets)
| | | | |
1 to 7 Days | | | 37.8 | |
8 to 30 Days | | | 13.4 | |
31 to 90 Days | | | 32.5 | |
91 to 120 Days | | | 16.3 | |
Credit Quality (% of net assets)
| | | | |
A-1+/P-1** | | | 73.4 | |
A-1/P-1 | | | 26.6 | |
| ** | Includes A-1 rated obligations with maturities of five business days or less. |
| | The credit quality ratings reflect the ratings of the securities held by the Fund, which are subject to change. A short-term obligation rated A-1 is rated in the highest category by Standard & Poor’s. The obligator’s capacity to meet its financial commitment on the obligation is strong. Within this category, certain obligations are designated with a plus sign (+). This indicates that the obligator’s capacity to meet its financial commitment on these obligations is extremely strong. A short-term obligation rated P-1 is rated in the highest category by Moody’s Investor Services. Issuers (or supporting institutions) rated Prime-1 have a superior ability to repay short-term debt obligations. |
3
American Beacon U.S. Government Money Market Select FundSM
Performance Overview
June 30, 2014 (Unaudited)
During the first half of 2014 the U.S. economy continued to rebound, even with a disappointing weather related first quarter GDP. Most recently, there have been rising geopolitical tensions and continued speculation on when the Fed will begin to normalize monetary policy. Much of this speculation has been driven by an uptick in inflation and improvements in the labor market. The unemployment rate has dropped to 6.1% and non-farm payrolls have averaged an increase of 233,000 jobs per month for the first half of the year. Despite economic improvements, concerns remain about the subdued improvements in the housing sector and the weak pace of wage growth.
The Fed has continued its pace of reducing asset purchases by $10 billion at each Federal Open Market Committee (FOMC) meeting this year and is likely to end the Quantitative Easing (QE) program in October of this year. The Committee continues to anticipate that “it likely will be appropriate to maintain the current target range for the federal funds rate for a considerable time after the asset purchase program ends.” The market is currently projecting that the Fed will begin raising the fed funds target in mid-2015.
The American Beacon U.S. Government Money Market Select Fund’s (the “Fund”) primary strategy for the first half of the year was to buy both fixed and floating rate agencies along with overnight repurchase agreements.
For the six months and one year periods ended June 30, 2014, the total return of the Fund was 0.00% and 0.01%, respectively. The Fund was one basis point (0.01%) below the Lipper Institutional U.S. Government Money Market Average return of 0.01% for six months and equal to the Lipper Institutional U.S. Government Money Market Average return of 0.01% for one year. Based on annualized total returns, Lipper Analytical Services ranked the Fund 41st among 169, 1st among 151 and 1st among 94 Institutional U.S. Government Money Market Funds for the one-year, five-year, and ten-year periods ended June 30, 2014, respectively.
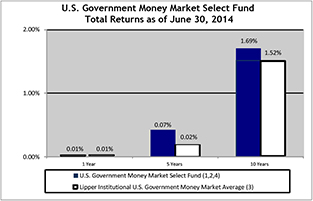
Total Returns for the Period Ended 6/30/14
| | | | | | | | | | | | |
| | | 1 Year | | | 5 Years | | | 10 Years | |
U.S. Government Money Market Select (1,2,4) | | | 0.01 | % | | | 0.07 | % | | | 1.69 | % |
Lipper Institutional U.S. Government Money Market Average (3) | | | 0.01 | % | | | 0.02 | % | | | 1.52 | % |
| 1 | Performance shown is historical and is not indicative of future returns. Investment returns will vary, and shares may be worth more or less at redemption than at original purchase. An investment in the Fund is neither insured nor guaranteed by the Federal Deposit Insurance Corporation or any other government agency. Although the Fund seeks to preserve the value of an investment at $1.00 per share, it is possible to lose money by investing in the Fund. Fund performance in the table above does not reflect the deduction of taxes a shareholder would pay on distributions or the redemption of shares. |
| 2 | A portion of the fees charged to the Fund has been waived. Performance prior to waiving fees was lower than the actual returns shown. |
| 3 | The Lipper Institutional U.S. Government Money Market Funds Average is calculated by taking an arithmetic average of the returns of the mutual funds in the Lipper Institutional U.S. Government Money Market Funds category. Lipper is an independent mutual fund research and ranking service. |
| 4 | The total annual Fund operating expense ratio set forth in the most recent prospectus for the Fund was 0.14%. The expense ratio above may vary from the expense ratio presented in other sections of this report, which is based on expenses incurred during the period covered by this report. |
4
American Beacon U.S. Government Money Market Select FundSM
Performance Overview
June 30, 2014 (Unaudited)
Fund Statistics as of 6/30/14
| | | | |
7-day Current Yield* | | | 0.01 | % |
7-day Effective Yield* | | | 0.01 | % |
30-day Yield* | | | 0.01 | % |
Weighted Avg. Maturity | | | 36 Days | |
Standard & Poor’s Rating** | | | AAAm | |
| * | Annualized. You may call 1-800-231-4252 to obtain the Fund’s current 7-day yields. Yield is a more accurate reflection of the Fund’s current earnings than total returns. The seven-day yields refer to the income generated by an investment in the Fund over a seven-day period. This income is then annualized. The seven-day effective yield is calculated similarly, but the income earned is assumed to have been reinvested. The effective yield will be slightly higher than the current yield because of the compounding effect of this assumed reinvestment. |
| ** | Standard & Poor’s (S&P) Rating: The fund is not sponsored, endorsed, sold or promoted by S&P, and S&P makes no representation regarding the advisability of investing in the fund. The credit rating is a forward-looking opinion about a fund’s potential capacity to maintain stable principal or stable net asset value. The rating is an opinion as of the date expressed and not a statement of fact or recommendation to purchase, hold or sell any security. Standard & Poor’s rates the creditworthiness of money market funds from AAAm (highest) to Dm (lowest). For more information on S&P’s rating methodology, please visit www.standardandpoors.com and select “Understanding Ratings” under Ratings Resources on the home page. |
Asset Allocation as of 6/30/14 (% of net assets)
| | | | |
Government Agency Debt | | | 32.0 | |
Government Agency Repurchase Agreements | | | 55.4 | |
Other Repurchase Agreements | | | 12.6 | |
Effective Maturity Distribution (% of net assets)
| | | | |
1 to 7 Days | | | 74.9 | |
8 to 30 Days | | | 7.2 | |
31 to 90 Days | | | 3.1 | |
91 to 397 Days | | | 14.8 | |
5
American Beacon Select FundsSM
Fund Expenses
June 30, 2014 (Unaudited)
Fund Expense Example
As a shareholder of a Fund, you incur two types of costs: (1) transaction costs and (2) ongoing costs, including management fees, administrative service fees, and other Fund expenses. The examples below are intended to help you understand the ongoing cost (in dollars) of investing in a Fund and to compare these costs with the ongoing costs of investing in other mutual funds. The examples are based on an investment of $1,000 invested at the beginning of the period and held for the entire period from January 1, 2014 through June 30, 2014.
Actual Expenses
The “Actual” lines of the table provide information about actual account values and actual expenses. You may use the information in these lines, together with the amount you invested, to estimate the expenses that you paid over the period. Simply divide your account value by $1,000 (for example, an $8,600 account value divided by $1,000 = 8.6), then multiply the result by the number in the “Actual” line under the heading “Expenses Paid During Period” for the applicable Fund to estimate the expenses you paid on your account during this period.
Hypothetical Example for Comparison Purposes
The “Hypothetical” lines of the table provide information about hypothetical account values and hypothetical expenses based on a Fund’s actual expense ratio and an assumed 5% per year rate of return before expenses (not a Fund’s actual return).
You may compare the ongoing costs of investing in a Fund with other funds by contrasting this 5% hypothetical example and the 5% hypothetical examples that appear in the shareholder reports of the other funds. The hypothetical account values and expenses may not be used to estimate the actual ending account balance or expenses you paid for the period.
You should also be aware that the expenses shown in the table highlight only your ongoing costs and do not reflect any transaction costs charged by the Funds. Similarly, the expense examples for other funds do not reflect any transaction costs charged by those funds, such as sales charges (loads), redemption fees or exchange fees. Therefore, the “Hypothetical” lines of the table are useful in comparing ongoing costs only and will not help you determine the relative total costs of owning different funds. If you were subject to any transaction costs during the period, your costs would have been higher.
| | | | | | | | | | | | |
| | | Beginning
Account
Value
1/1/14 | | | Ending
Account
Value
6/30/14 | | | Expenses paid
During Period*
1/1/14-
6/30/14 | |
U.S. Government Money Market | |
Actual | | $ | 1,000.00 | | | $ | 1,000.05 | | | $ | 0.55 | |
Hypothetical (5% return before expenses) | | $ | 1,000.00 | | | $ | 1,024.25 | | | $ | 0.55 | |
Money Market | |
Actual | | $ | 1,000.00 | | | $ | 1,000.38 | | | $ | 0.64 | |
Hypothetical (5% return before expenses) | | $ | 1,000.00 | | | $ | 1,024.15 | | | $ | 0.65 | |
| * | Expenses are equal to the Fund’s annualized expense ratios for the six-month period of 0.11% and 0.13% for the U.S. Government Money Market Select and Money Market Select Funds respectively, multiplied by the average account value over the period, multiplied by the number derived by dividing the number of days in the most recent fiscal half-year (181) by days in the year (365) to reflect the half-year period. |
6
American Beacon Money Market Select FundSM
Schedule of Investments
June 30, 2014 (Unaudited)
| | | | | | | | |
| | | Par Amount | | | Fair Value | |
| | | (000’s) | | | (000’s) | |
ASSET-BACKED COMMERCIAL PAPER- 4.17% | | | | | | | | |
Old Line Funding LLC, | | | | | | | | |
0.17%, Due 7/17/2014 A B | | $ | 22,000 | | | $ | 21,999 | |
0.17%, Due 10/8/2014 A B | | | 10,000 | | | | 9,995 | |
| | | | | | | | |
Total Asset-Backed Commercial Paper (Cost $31,994) | | | | | | | 31,994 | |
| | | | | | | | |
CERTIFICATE OF DEPOSIT- 12.97% | | | | | | | | |
Bank of Montreal Chicago, 0.17%, Due 9/2/2014 | | | 10,000 | | | | 10,000 | |
Bank of Nova Scotia Houston, 0.18%, Due 10/30/2014 | | | 10,000 | | | | 10,000 | |
Canadian Imperial Bank of Commerce NY, 0.18%, Due 8/21/2014 | | | 20,000 | | | | 20,000 | |
Mizuho Bank Ltd. N.Y., | | | | | | | | |
0.21%, Due 7/15/2014 | | | 13,000 | | | | 13,000 | |
0.16%, Due 7/28/2014 | | | 10,000 | | | | 10,000 | |
0.20%, Due 7/29/2014 | | | 6,500 | | | | 6,500 | |
Skandinaviska Enskilda Banken N.Y. , 0.25%, Due 8/25/2014 | | | 30,000 | | | | 30,004 | |
| | | | | | | | |
Total Certificate of Deposit (Cost $99,504) | | | | | | | 99,504 | |
| | | | | | | | |
FINANCIAL COMPANY COMMERCIAL PAPER- 48.22% | | | | | | | | |
Australia & New Zealand Banking Group Ltd., | | | | | | | | |
0.16%, Due 7/3/2014 B | | | 20,000 | | | | 19,999 | |
0.14%, Due 9/5/2014 B | | | 5,000 | | | | 4,999 | |
0.165%, Due 9/15/2014 B | | | 10,000 | | | | 9,997 | |
Bank of Nova Scotia N.Y., | | | | | | | | |
0.20%, Due 7/7/2014 | | | 10,000 | | | | 10,000 | |
0.15%, Due 8/7/2014 | | | 8,700 | | | | 8,699 | |
Bank Tokyo-Mitsubishi UFJ N.Y., | | | | | | | | |
0.175%, Due 7/11/2014 | | | 20,000 | | | | 19,999 | |
0.20%, Due 8/25/2014 | | | 10,000 | | | | 9,997 | |
Coca-Cola Co., | | | | | | | | |
0.15%, Due 7/15/2014 B | | | 12,500 | | | | 12,499 | |
0.18%, Due 9/17/2014 B | | | 10,000 | | | | 9,996 | |
0.21%, Due 2/23/2015 B | | | 10,000 | | | | 9,986 | |
Commonwealth Bank of Australia, 0.20%, Due 12/16/2014 B | | | 10,000 | | | | 9,991 | |
DNB Bank ASA, | | | | | | | | |
0.17%, Due 7/7/2014 B | | | 10,000 | | | | 10,000 | |
0.16%, Due 8/13/2014 B | | | 15,000 | | | | 14,997 | |
General Electric Capital Corp., 0.19%, Due 10/24/2014 | | | 10,000 | | | | 9,994 | |
National Australia Funding Delaware, Inc., 0.18%, Due 12/12/2014 B | | | 10,000 | | | | 9,992 | |
Nestle Capital Corp., 0.16%, Due 9/8/2014 B | | | 15,000 | | | | 14,995 | |
Nordea Bank AB, | | | | | | | | |
0.205%, Due 7/9/2014 B | | | 14,000 | | | | 13,999 | |
0.18%, Due 8/14/2014 B | | | 10,000 | | | | 9,998 | |
0.215%, Due 11/12/2014 B | | | 10,000 | | | | 9,992 | |
Sumitomo Mitsui Banking Corp., | | | | | | | | |
0.155%, Due 7/1/2014 B | | | 20,000 | | | | 19,999 | |
0.205%, Due 7/21/2014 B | | | 5,000 | | | | 4,999 | |
0.205%, Due 9/2/2014 B | | | 10,000 | | | | 9,996 | |
Svenska Handelsbanken AB, | | | | | | | | |
0.165%, Due 9/8/2014 B | | | 15,000 | | | | 14,995 | |
Svenska Handelsbanken, Inc., | | | | | | | | |
0.205%, Due 10/22/2014 B | | | 10,000 | | | | 9,994 | |
0.20%, Due 10/24/2014 B | | | 10,000 | | | | 9,994 | |
Toronto Dominion Holdings (U.S.A.), Inc., | | | | | | | | |
0.19%, Due 9/8/2014 B | | | 15,000 | | | | 14,995 | |
0.19%, Due 10/8/2014 B | | | 10,000 | | | | 9,995 | |
0.19%, Due 11/7/2014 B | | | 10,000 | | | | 9,993 | |
Toyota Motor Credit Corp., | | | | | | | | |
0.19%, Due 8/18/2014 | | | 20,000 | | | | 19,994 | |
0.20%, Due 12/19/2014 | | | 15,000 | | | | 14,986 | |
See accompanying notes
7
American Beacon Money Market Select FundSM
Schedule of Investments
June 30, 2014 (Unaudited)
| | | | | | | | |
| | | Par Amount | | | Fair Value | |
| | | (000’s) | | | (000’s) | |
Westpac Banking Corp., 0.185%, Due 9/26/2014 B | | $ | 10,000 | | | $ | 9,996 | |
| | | | | | | | |
Total Financial Company Commercial Paper (Cost $370,065) | | | | | | | 370,065 | |
| | | | | | | | |
| | |
| | | Shares | | | | |
INVESTMENT COMPANIES - 1.29% (Cost $9,867) | | | | | | | | |
Blackrock Cash Fund, Prime Class | | | 9,866,675 | | | | 9,867 | |
| | | | | | | | |
| | |
| | | Par Amount | | | | |
REPURCHASE AGREEMENTS - 33.36% | | | | | | | | |
Barclays Capital, Inc., 0.23%, acquired 6/30/2014, Due 7/1/2014 at $36,000 (Held at Bank of New York Mellon, Collateralized by Corporate Obligations valued at $39,600, 3.38% - 10.0%, 1/5/2016 - 12/31/2099) | | $ | 36,000 | | | | 36,000 | |
BNP Paribas Securities Corp., 0.27%, acquired 6/30/2014, Due 7/1/2014 at $36,000 (Held at Bank of New York Mellon, Collateralized by Corporate Obligations valued at $39,600, 3.75% - 8.75%, 7/15/2014 - 8/15/2031) | | | 36,000 | | | | 36,000 | |
Credit Suisse Securities (USA) LLC, 0.18%, acquired 6/30/2014, Due 7/1/2014 at $38,000 (Held at JP Morgan Chase, Collateralized by Equity Securities valued at $38,904)A | | | 38,000 | | | | 38,000 | |
JP Morgan Clearing Corp., 0.30%, acquired 6/19/2014, Due 7/31/2014 at $36,000, (Held at JP Morgan Chase, Collateralized by Corporate Obligations valued at $37,808, 6.88% - 9.25%, 2/1/2015 - 5/1/2031)C | | | 36,000 | | | | 36,000 | |
Merrill Lynch, Pierce, Fenner & Smith, Inc., 0.18%, acquired 6/30/2014, Due 7/1/2014 at $38,000 (Held at Bank of New York Mellon, Collateralized by Equity Securities valued at $41,800) | | | 38,000 | | | | 38,000 | |
RBC Capital Markets LLC, 0.19%, acquired 6/26/2014, Due 7/3/2014 at $37,000 (Held at Bank of New York Mellon, Collateralized by Municipal Obligations valued at $38,850, 0.00% - 8.5%, 7/15/2014 - 9/1/2047)A | | | 37,000 | | | | 37,000 | |
Wells Fargo Securities LLC, 0.18%, acquired 6/30/2014, Due 7/1/2014 at $35,000 (Held at Bank of New York Mellon, Collateralized by Corporate Obligations valued at $36,750, 0.00% - 12.25%, 9/30/2014 - 6/15/2045)A | | | 35,000 | | | | 35,000 | |
| | | | | | | | |
Total Repurchase Agreements (Cost $256,000) | | | | | | | 256,000 | |
| | | | | | | | |
TOTAL INVESTMENTS - 100.01% (Cost $767,430) | | | | | | | 767,430 | |
LIABILITIES, NET OF OTHER ASSETS - (0.01%) | | | | | | | (92 | ) |
| | | | | | | | |
TOTAL NET ASSETS - 100.00% | | | | | | $ | 767,338 | |
| | | | | | | | |
Percentages are stated as a percent of net assets.
All rates represent either the annualized yield at the date of purchase, or the stated coupon rate, or, for floating and adjustable rate securities, the rate at period end.
| A | LLC - Limited Liability Company. |
| B | Security exempt from registration under the Securities Act of 1933. These securities may be resold to qualified institutional buyers pursuant to Rule 144A. At the period end, the value of these securities amounted to $308,390 or 40.19% of net assets. The Fund has no right to demand registration of these securities. |
See accompanying notes
8
American Beacon U.S. Government Money Market Select FundSM
Schedule of Investments
June 30, 2014 (Unaudited)
| | | | | | | | |
| | | Par Amount | | | Fair Value | |
| | | (000’s) | | | (000’s) | |
U.S. GOVERNMENT AGENCY OBLIGATIONS- 32.05% | | | | | | | | |
Federal Farm Credit Bank, | | | | | | | | |
0.28%, Due 7/14/2014 A | | $ | 5,700 | | | $ | 5,700 | |
0.41%, Due 11/28/2014 A | | | 5,000 | | | | 5,006 | |
0.10%, Due 2/9/2015 A | | | 10,000 | | | | 9,999 | |
0.24%, Due 5/5/2015 A | | | 5,000 | | | | 5,005 | |
Federal Home Loan Bank, | | | | | | | | |
0.09%, Due 7/8/2014 | | | 5,000 | | | | 5,000 | |
0.12%, Due 8/12/2014 | | | 5,000 | | | | 5,000 | |
0.12%, Due 8/25/2014 | | | 5,000 | | | | 5,000 | |
0.17%, Due 9/5/2014 | | | 5,000 | | | | 5,000 | |
0.13%, Due 10/30/2014 | | | 5,000 | | | | 5,000 | |
0.14%, Due 11/21/2014 | | | 5,000 | | | | 5,000 | |
0.14%, Due 2/18/2015 | | | 15,000 | | | | 14,999 | |
0.25%, Due 2/20/2015 | | | 5,000 | | | | 5,004 | |
0.091%, Due 2/27/2015 A | | | 5,000 | | | | 5,000 | |
0.10%, Due 3/6/2015 | | | 5,000 | | | | 4,999 | |
0.12%, Due 3/6/2015 | | | 4,600 | | | | 4,596 | |
0.16%, Due 3/11/2015 | | | 5,000 | | | | 5,000 | |
0.16%, Due 3/12/2015 | | | 5,000 | | | | 4,999 | |
0.125%, Due 3/20/2015 | | | 5,000 | | | | 4,998 | |
0.125%, Due 4/1/2015 | | | 5,000 | | | | 4,998 | |
0.097%, Due 5/12/2015 A | | | 10,000 | | | | 9,999 | |
Federal Home Loan Mortgage Corp., | | | | | | | | |
0.14%, Due 7/1/2014 | | | 7,760 | | | | 7,760 | |
0.12%, Due 7/8/2014 | | | 5,000 | | | | 5,000 | |
0.14%, Due 10/21/2014 | | | 5,000 | | | | 4,998 | |
0.095%, Due 11/12/2014 | | | 2,225 | | | | 2,224 | |
0.142%, Due 6/26/2015 A | | | 10,000 | | | | 10,003 | |
Federal National Mortgage Association, 0.375%, Due 3/16/2015 | | | 5,000 | | | | 5,007 | |
| | | | | | | | |
Total U.S. Government Agency Obligations (Cost $155,294) | | | | | | | 155,294 | |
| | | | | | | | |
GOVERNMENT AGENCY REPURCHASE AGREEMENTS - 55.37% | | | | | | | | |
Credit Agricole CIB, 0.09%, acquired 6/30/2014, Due 7/1/2014 at $75,000 (Held at Bank of New York Mellon, Collateralized by U.S. Government Agency Obligations valued at $78,718, 1.99% - 6.50%, 9/1/2023 - 11/1/2048)A | | | 75,000 | | | | 75,000 | |
Deutsche Bank Securities, Inc., 0.15%, acquired 6/30/2014, Due 7/1/2014 at $25,000 (Held at Bank of New York Mellon, Collateralized by U.S. Government Agency Obligations valued at $25,501, 0.00%, 6/1/2017 - 10/15/2020) | | | 25,000 | | | | 25,000 | |
Goldman Sachs & Co., 0.10%, acquired 6/30/2014, Due 7/1/2014 at $118.328 (Held at Bank of New York Mellon, Collateralized by U.S. Government Agency Obligations valued at $120,695, 2.58% - 4.50%, 9/1/2027 - 5/1/2044) | | | 118,328 | | | | 118,329 | |
RBC Capital Markets LLC., 0.08%, acquired 6/30/2014, Due 7/1/2014 at $50,000 (Held at Bank of New York Mellon, Collateralized by U.S. Government Agency Obligations valued at $51,000, 2.67% - 4.00%, 6/1/2028 - 7/1/2044)B | | | 50,000 | | | | 50,000 | |
| | | | | | | | |
Total Government Agency Repurchase Agreements (Cost $268,329) | | | | | | | 268,329 | |
| | | | | | | | |
OTHER REPURCHASE AGREEMENTS - 12.59% | | | | | | | | |
Barclays Capital, Inc., 0.23%, acquired 6/30/2014, Due 7/1/2014 at $11,000 (Held at Bank of New York Mellon, Collateralized by Corporate Obligations valued at $12,100, 3.38% - 9.50%, 3/15/2016 - 12/29/2099) | | | 11,000 | | | | 11,000 | |
BNP Paribas Securities Corp., 0.27%, acquired 6/30/2014, Due 7/1/2014 at $15,000 (Held at Bank of New York Mellon, Collateralized by Corporate Obligations valued at $16,578, 5.63% - 7.25%, 2/15/2014 - 9/15/2027) | | | 15,000 | | | | 15,000 | |
Credit Suisse Securities (USA) LLC, 0.18%, acquired 6/30/2014, Due 7/1/2014 at $18,000 (Held at JP Morgan Chase, Collateralized by Equity Securities valued at $18,902)BC | | | 18,000 | | | | 18,000 | |
Merrill Lynch, Pierce, Fenner & Smith, Inc., 0.18%, acquired 6/30/2014, Due 7/1/2014 at $17,000 (Held at Bank of New York Mellon, Collateralized by Equity Securities valued at $18,700) | | | 17,000 | | | | 17,000 | |
See accompanying notes
9
American Beacon U.S. Government Money Market Select FundSM
Schedule of Investments
June 30, 2014 (Unaudited)
| | | | |
| | | Fair Value | |
| | | (000’s) | |
| | | | |
Total Other Repurchase Agreements (Cost $61,000) | | $ | 61,000 | |
| | | | |
TOTAL INVESTMENTS - 100.01% (Cost $484,623) | | | 484,623 | |
LIABILITIES, NET OF OTHER ASSETS - (0.01%) | | | (42 | ) |
| | | | |
TOTAL NET ASSETS - 100.00% | | $ | 484,581 | |
| | | | |
Percentages are stated as a percent of net assets.
All rates represent either the annualized yield at the date of purchase, or the stated coupon rate, or, for floating and adjustable rate securities, the rate at period end.
| A | The coupon rate shown on floating or adjustable rate securities represents the rate at period end. The due date on these types of securities reflects the final maturity date. |
| B | LLC - Limited Liability Company. |
See accompanying notes
10
American Beacon Select FundsSM
Statements of Assets and Liabilities
June 30, 2014 (Unaudited) (in thousands, except share and per share amounts)
| | | | | | | | |
| | | Money Market | | | U.S. Government
Money Market | |
Assets: | | | | | | | | |
Investments in securities, at fair value A | | $ | 511,430 | | | $ | 155,294 | |
Repurchase agreements, at fair value B | | | 256,000 | | | | 329,329 | |
Receivable from Manager for expense reimbursement (Note 2) | | | — | | | | 6 | |
Dividends and interest receivable | | | 55 | | | | 49 | |
Prepaid expenses | | | 1 | | | | 2 | |
| | | | | | | | |
Total assets | | | 767,486 | | | | 484,680 | |
| | | | | | | | |
Liabilities: | | | | | | | | |
Payable for fund shares redeemed | | | — | | | | — | |
Management and investment advisory fees | | | 59 | | | | 34 | |
Dividends payable | | | — | | | | 3 | |
Administrative service and service fees payable | | | 7 | | | | 4 | |
Professional fees payable | | | 21 | | | | 20 | |
Custody and fund accounting fees payable | | | 9 | | | | 6 | |
Transfer agent fees payable | | | 17 | | | | 4 | |
Trustee fees payable | | | 18 | | | | 12 | |
Prospectus and shareholder reports | | | 3 | | | | 7 | |
Other liabilities | | | 14 | | | | 9 | |
| | | | | | | | |
Total liabilities | | | 148 | | | | 99 | |
| | | | | | | | |
Net Assets | | $ | 767,338 | | | $ | 484,581 | |
| | | | | | | | |
Analysis of Net Assets: | | | | | | | | |
Paid-in-capital | | | 767,337 | | | | 484,581 | |
Undistributed net investment income | | | 1 | | | | — | |
| | | | | | | | |
Net assets | | $ | 767,338 | | | $ | 484,581 | |
| | | | | | | | |
Shares outstanding at no par value (Unlimited shares authorized) | | | 767,338,324 | | | | 484,580,634 | |
Net Assets (not in thousands) | | $ | 767,338,323 | | | $ | 484,580,638 | |
Net asset value, offering and redemption price per share | | $ | 1 .00 | | | $ | 1 .00 | |
A Cost of investments in securities | | $ | 511,430 | | | $ | 155,294 | |
B Cost of repurchase agreements | | | 256,000 | | | | 329,329 | |
See accompanying notes
11
American Beacon Select FundsSM
Statements of Operations
For the Six Months ended June 30, 2014 (Unaudited) (in thousands)
| | | | | | | | |
| | | Money Market | | | U.S. Government
Money Market | |
Investment Income: | | | | | | | | |
Dividend income | | $ | 60 | | | $ | 11 | |
Interest income | | | 752 | | | | 238 | |
| | | | | | | | |
Net investment income | | | 812 | | | | 249 | |
| | | | | | | | |
Fund Expenses: | | | | | | | | |
Management and investment advisory fees (Note 2) | | | 356 | | | | 192 | |
Custodian fees | | | 38 | | | | 21 | |
Administrative service fees (Note 2) | | | 40 | | | | 21 | |
Transfer agent fees | | | 15 | | | | 9 | |
Professional fees | | | 23 | | | | 19 | |
Printing expense | | | 6 | | | | 4 | |
Trustee expense | | | 22 | | | | 13 | |
Insurance expense | | | 8 | | | | 4 | |
Other expenses | | | 8 | | | | 6 | |
| | | | | | | | |
Total fund expenses | | | 516 | | | | 289 | |
| | | | | | | | |
Net fees waived and expenses reimbursed by Manager (Note 2) | | | — | | | | (61 | ) |
| | | | | | | | |
Net fund expenses | | | 516 | | | | 228 | |
| | | | | | | | |
Net investment income | | | 296 | | | | 21 | |
| | | | | | | | |
Realized Gains: | | | | | | | | |
Net realized gain from investments | | | 8 | | | | — | |
| | | | | | | | |
Net gain on investments | | | 8 | | | | — | |
| | | | | | | | |
Net increase in net assets resulting from operations | | $ | 304 | | | $ | 21 | |
| | | | | | | | |
Statements of Changes in Net Assets (in thousands)
| | | | | | | | | | | | | | | | |
| | | Money Market | | | U.S. Government Money Market | |
| | | Six Months ended
June 30, 2014 | | | Year ended
December 31,
2013 | | | Six Months ended
June 30, 2014 | | | Year ended
December 31,
2013 | |
| | | (unaudited) | | | | | | (unaudited) | | | | |
Increase in Net Assets: | | | | | | | | | | | | | | | | |
Operations: | | | | | | | | | | | | | | | | |
Net investment income | | $ | 296 | | | $ | 855 | | | $ | 21 | | | $ | 86 | |
Net realized gain from investments | | | 8 | | | | 8 | | | | — | | | | — | |
| | | | | | | | | | | | | | | | |
Net increase in net assets resulting from operations | | | 304 | | | | 863 | | | | 21 | | | | 86 | |
| | | | | | | | | | | | | | | | |
Distributions to Shareholders: | | | | | | | | | | | | | | | | |
Net investment income | | | (296 | ) | | | (855 | ) | | | (21 | ) | | | (86 | ) |
Net realized gain | | | (8 | ) | | | (8 | ) | | | — | | | | — | |
| | | | | | | | | | | | | | | | |
Net distributions to shareholders | | | (304 | ) | | | (863 | ) | | | (21 | ) | | | (86 | ) |
| | | | | | | | | | | | | | | | |
Capital Share Transactions (at $1.00 per share): | | | | | | | | | | | | | | | | |
Proceeds from sales of shares | | | 249,865 | | | | 246,240 | | | | 1,383,665 | | | | 2,056,158 | |
Reinvestment of dividends and distributions | | | 300 | | | | 831 | | | | 2 | | | | 15 | |
Cost of shares redeemed | | | (276,235 | ) | | | (214,166 | ) | | | (1,266,787 | ) | | | (1,926,708 | ) |
| | | | | | | | | | | | | | | | |
Net increase (decrease) in net assets from capital share transactions | | | (26,070 | ) | | | 32,905 | | | | 116,880 | | | | 129,465 | |
| | | | | | | | | | | | | | | | |
Net increase (decrease) in net assets | | | (26,070 | ) | | | 32,905 | | | | 116,880 | | | | 129,465 | |
| | | | | | | | | | | | | | | | |
Net Assets: | | | | | | | | | | | | | | | | |
Beginning of period | | | 793,408 | | | | 760,503 | | | | 367,701 | | | | 238,236 | |
| | | | | | | | | | | | | | | | |
End of Period* | | $ | 767,338 | | | $ | 793,408 | | | $ | 484,581 | | | $ | 367,701 | |
| | | | | | | | | | | | | | | | |
*Includes undistributed net investment income of | | $ | 1 | | | $ | 1 | | | $ | — | | | $ | — | |
| | | | | | | | | | | | | | | | |
See accompanying notes
12
American Beacon Select FundsSM
Notes to Financial Statements
June 30, 2014 (Unaudited)
1. Organization and Significant Accounting Policies
American Beacon Select Funds (the “Trust”) is organized as a Massachusetts business trust and is registered under the Investment Company Act of 1940 (the “Act”), as amended, as a diversified, open-end management investment company with separate series. The following series are included in this report: American Beacon Money Market Select Fund (the “Money Market Fund”) and American Beacon U.S. Government Money Market Select Fund (the “Government Fund”)(each a “Fund” and collectively, the “Funds”).
American Beacon Advisors, Inc. (the “Manager”) is a wholly owned subsidiary of Lighthouse Holdings, Inc. and was organized in 1986 to provide business management, advisory, administrative and asset management consulting services to the Trust and other investors.
2. Transactions with Affiliates
Management Agreement
The Funds and the Manager are parties to a Management Agreement that obligates the Manager to provide or oversee the provisions of all investment advisory and portfolio management services. The Manager serves as the sole investment advisor to the Funds. As compensation for performing the duties required under the Management Agreement, the Manager receives 0.09% of the average daily net assets of the Funds.
Administrative Services Agreement
The Manager and the Funds entered into an Administrative Services Agreement that obligates the Manager to provide or oversee administrative services to the Funds. As compensation for performing the duties required under the Administrative Services Agreement, the Manager receives an annualized fee of 0.01% of the average daily net assets of the Funds.
Expense Reimbursement Plan
The Manager voluntarily agreed to reimburse the Government Fund for other expenses. During the six months ended June 30, 2014, the Manager reimbursed expenses totaling $60,606 to the Government Fund. At June 30, 2014, $6,376 was receivable from the Manager for the Government Fund.
The Funds have adopted an Expense Reimbursement Plan whereby the Manager may seek recoupment of expenses reimbursed for a period of up to three years. However, recoupment will occur only if a Fund’s average net assets have grown or expenses have declined sufficiently to allow recoupment without causing its expense ratio to exceed the previously agreed upon contractual expense limit.
The carryover of excess expenses potentially reimbursable to the Manager, but not recorded as a liability for the Government Fund is $8,810 and $49,521, expiring in 2015 and 2016, respectively. The Government Fund did not record a liability for these potential reimbursements due to the current assessment that a reimbursement for the period ended June 30, 2014 is unlikely.
3. Security Valuation and Fair Value Measurements
Each Fund values its investments and computes the net asset value per share each day that the New York Stock Exchange is open for business. In accordance with Rule 2a-7 under the Act, money market securities are valued at amortized cost, which approximates fair value. Securities for which amortized cost is deemed not to reflect fair value are stated at fair value as determined in good faith by the Manager’s Valuation Committee, in accordance with procedures established by the Trust’s Board of Trustees (the “Board”). In the event that a deviation of 1⁄2 of 1% or more exists between the $1.00 per share price of a Fund, calculated at amortized cost,
13
American Beacon Select FundsSM
Notes to Financial Statements
June 30, 2014 (Unaudited)
and the price per share calculated by reference to market quotations, or if there is any other deviation that the Board believes would result in a material dilution to shareholders or purchasers, the Board will promptly consider the appropriate action that should be initiated.
Valuation Inputs
Various inputs may be used to determine the fair value of the Funds’ investments. These inputs are summarized in three broad levels for financial statement purposes.
| | |
| Level 1 — | | Quoted prices in active markets for identical securities. |
| |
| Level 2 — | | Prices determined using other significant observable inputs. These may include quoted prices for similar securities, interest rates, prepayment speeds, credit risk, and others. Level 2 securities are fixed income securities that are valued using observable inputs as stated above. |
| |
| Level 3 — | | Prices determined using other significant unobservable inputs. Unobservable inputs reflect the Fund’s own assumptions about the factors market participants would use in pricing an investment, and would be based on the best information available. |
Observable inputs are those based on market data obtained from sources independent of the fund, and unobservable inputs reflect the fund’s own assumptions based on the best information available. The input levels are not necessarily an indication of the risk or liquidity associated with financial instruments at that level. For example, securities held by a money market fund are generally high quality and liquid; however, they are reflected as Level 2 because the inputs used to determine fair value are not quoted prices in an active market.
The Funds’ investments are summarized by level based on the inputs used to determine their values. U.S. Generally Accepted Accounting Practices (“U.S. GAAP”) also requires all transfer between levels to be disclosed. The end of period timing recognition has been adopted for the transfer between levels of the Funds’ asset and liabilities. During the six months ended June 30, 2014, there were no transfers between levels. As of June 30, 2014, the investments were classified as described below (in thousands):
| | | | | | | | | | | | | | | | |
Money Market Fund | | Level 1 | | | Level 2 | | | Level 3 | | | Total | |
Asset-Backed Commercial Paper | | $ | — | | | $ | 31,994 | | | $ | — | | | $ | 31,994 | |
Certificate of Deposit | | | — | | | | 99,504 | | | | — | | | | 99,504 | |
Financial Company Commercial Paper | | | — | | | | 370,065 | | | | — | | | | 370,065 | |
Short-Term Investments – Money Market Funds | | | 9,867 | | | | — | | | | — | | | | 9,867 | |
Other Repurchase Agreements | | | — | | | | 256,000 | | | | — | | | | 256,000 | |
| | | | | | | | | | | | | | | | |
Total Investments in Securities | | $ | 9,867 | | | $ | 757,563 | | | $ | — | | | $ | 767,430 | |
| | | | | | | | | | | | | | | | |
| | | | | | | | | | | | | | | | |
Government Fund | | Level 1 | | | Level 2 | | | Level 3 | | | Total | |
U.S. Government Agency Obligations | | $ | — | | | $ | 155,294 | | | $ | — | | | $ | 155,294 | |
Government Agency Repurchase Agreements | | | — | | | | 268,329 | | | | — | | | | 268,329 | |
Other Repurchase Agreements | | | — | | | | 61,000 | | | | — | | | | 61,000 | |
| | | | | | | | | | | | | | | | |
Total Investments in Securities | | $ | — | | | $ | 484,623 | | | $ | — | | | $ | 484,623 | |
| | | | | | | | | | | | | | | | |
Security Transactions and Investment Income
Security transactions for the Funds are recorded on the trade date of the security purchase or sale.
Interest income for the Funds is earned from settlement date, recorded on an accrual basis, and adjusted, if necessary, for amortization of premiums or accretion of discounts on investment grade short-term
14
American Beacon Select FundsSM
Notes to Financial Statements
June 30, 2014 (Unaudited)
securities and zero coupon instruments. For financial and tax reporting purposes, realized gains and losses are determined on the basis of specific lot identification.
Dividends to Shareholders
Dividends from net investment income and net short-term capital gain, if any, will be declared and paid monthly. Dividends to shareholders are determined in accordance with federal income tax principles that may treat certain transactions differently than U.S. GAAP.
Use of Estimates
The preparation of financial statements in conformity with U.S. GAAP requires management to make estimates and assumptions that affect the amounts reported in the financial statements and accompanying notes. Actual results may differ from those estimated.
Other
Under the Trust’s organizational documents, its officers and trustees are indemnified against certain liability arising out of the performance of their duties to the Trust. In the normal course of business, the Trust enters into contracts that provide indemnification to the other party or parties against potential costs or liabilities. The Trust’s maximum exposure under these arrangements is dependent on claims that may be made in the future and, therefore, cannot be estimated. The Trust has had no prior claims or losses pursuant to any such agreement.
4. Securities and Other Investments
Repurchase Agreements
A repurchase agreement is a fixed income security in the form of an agreement between a Fund as purchaser and an approved counterparty as seller. The agreement is backed by collateral in the form of securities and/or cash transferred by the seller to the buyer to be held by an eligible third-party custodian. Under the agreement a Fund acquires securities from the seller and the seller simultaneously commits to repurchase the securities at an agreed upon price and date, normally within a week. The price for the seller to repurchase the securities is greater than a Fund’s purchase price, reflecting an agreed upon “interest rate” that is effective for the period of time the purchaser’s money is invested in the security. During the term of the repurchase agreement, a Fund monitors on a daily basis the market value of the collateral subject to the agreement and, if the market value of the securities falls below the seller’s repurchase amount provided under the repurchase agreement, the seller is required to transfer additional securities or cash collateral equal to the amount by which the market value of the securities falls below the repurchase amount. Repurchase agreements may exhibit the economic characteristics of loans by a Fund.
The obligation of the seller under the repurchase agreement is not guaranteed, and there is a risk that the seller may fail to repurchase the underlying securities, whether because of the seller’s bankruptcy or otherwise. In such event, a Fund would attempt to exercise its rights with respect to the underlying collateral, including possible sale of the securities. A Fund may incur various expenses in the connection with the exercise of its rights and may be subject to various delays and risks of loss, including (a) possible declines in the value of the underlying collateral, (b) possible reduction in levels of income and (c) lack of access to the collateral held through a third-party custodian and possible inability to enforce the Fund’s rights. The Board has established procedures pursuant to which the Manager monitors the creditworthiness of the counterparties with which the Fund enters into repurchase agreement transactions.
The Funds may enter into repurchase agreements with member banks of the Federal Reserve System or registered broker-dealers who, in the opinion of the Manager, present a minimal risk of default during the term
15
American Beacon Select FundsSM
Notes to Financial Statements
June 30, 2014 (Unaudited)
of the agreement. The underlying securities which serve as collateral for repurchase agreements may include fixed income and equity securities such as U.S. Government and agency securities, municipal obligations, corporate obligations, asset-backed securities, mortgage-backed securities, common and preferred stock, American Depository Receipts, exchange-traded funds and convertible securities. There is no percentage restriction on each Fund’s ability to enter into repurchase agreements with terms of seven days or less.
As of June 30, 2014, the following funds had investments in repurchase agreements with a gross value as disclosed in the Schedule of Investments and the Statements of Assets and Liabilities.
| | | | |
Fund | | Total | |
Money Market Fund | | $ | 256,000 | |
Government Fund | | $ | 329,329 | |
The value of the related collateral disclosed on the Schedules of Investments exceeded the value of the repurchase agreements at period end.
Restricted Securities
Certain Funds may invest in securities that are subject to legal or contractual restrictions on resale. These securities may be sold privately, but are required to be registered or exempted from such registration before being sold to the public. Private placement securities are generally considered to be restricted except for those securities traded between qualified institutional investors under the provisions of Rule 144A of the Securities Act of 1933. Disposal of restricted securities may involve time-consuming negotiations and expenses, and prompt sale at an acceptable price may be difficult to achieve. Restricted securities outstanding at the period ended June 30, 2014 are disclosed in the Notes to the Schedules of Investments.
5. Federal Income Taxes
It is the policy of each Fund to qualify as a regulated investment company, by complying with all applicable provisions of Subchapter M of the Internal Revenue Code, as amended, and to make distribution of taxable income sufficient to relieve it from substantially all federal income and excise taxes. For federal income tax purposes, each Fund is treated as a single entity for the purpose of determining such qualification.
The Funds do not have any unrecognized tax benefits in the accompanying financial statements. Each of the tax years in the four year period ended December 31, 2013 remains subject to examination by the Internal Revenue Service. If applicable, the Funds recognize interest accrued related to unrecognized tax benefits in interest expense and penalties in “Other expense” on the Statements of Operations.
Dividends are categorized in accordance with income tax regulations which may treat certain transactions differently than U.S. GAAP. Accordingly, the character of distributions and composition of net assets for tax purposes may differ from those reflected in the accompanying financial statements.
The tax character of distributions paid were as follows (in thousands):
| | | | | | | | | | | | | | | | |
| | | Money Market Fund | | | Government Fund | |
| | | Six Months Ended
June 30, 2014 | | | Year Ended
December 31, 2013 | | | Six Months Ended
June 30, 2014 | | | Year Ended
December 31, 2013 | |
| | | (unaudited) | | | | | | (unaudited) | | | | |
Distributions paid from: | | | | | | | | | | | | | | | | |
Ordinary income* | | $ | 304 | | | $ | 863 | | | $ | 21 | | | $ | 86 | |
| | | | | | | | | | | | | | | | |
Total distributions paid | | $ | 304 | | | $ | 863 | | | $ | 21 | | | $ | 86 | |
| | | | | | | | | | | | | | | | |
| * | For tax purposes short-term capital gains distributions are considered ordinary income distributions. |
16
American Beacon Select FundsSM
Notes to Financial Statements
June 30, 2014 (Unaudited)
As of June 30, 2014, the components of distributable earnings or (deficits) on a tax basis were as follows (in thousands):
| | | | | | | | |
| | | Money Market
Fund | | | Government
Fund | |
Cost basis of investments for federal income tax purposes | | $ | 767,430 | | | $ | 484,623 | |
Unrealized appreciation | | | — | | | | — | |
Unrealized depreciation | | | — | | | | — | |
| | | | | | | | |
Net unrealized appreciation or (depreciation) | | | — | | | | — | |
Undistributed ordinary income | | | 1 | | | | — | |
Accumulated long-term gain or (loss) | | | — | | | | — | |
Other temporary differences | | | — | | | | — | |
| | | | | | | | |
Distributable earnings or (deficits) | | $ | 1 | | | $ | — | |
| | | | | | | | |
Under the Regulated Investment Company Modernization Act of 2010 (the “RIC MOD”), net capital losses recognized by Funds in taxable years beginning after December 22, 2010 are carried forward indefinitely and retain their character as short-term and/or long-term losses. Prior to RIC MOD, net capital losses incurred by the Funds were carried forward for eight years and treated as short-term losses. RIC MOD requires that post-enactment net capital losses be used before pre-enactment net capital losses.
For the six months ended June 30, 2014 the Funds did not have capital loss carryforwards.
6. Principal Risks
In the normal course of business the Funds trade financial instruments and enter into financial transactions where risk of potential loss exists. Security values fluctuate (market risk) and may decline due to factors affecting securities markets in general, particular industries represented in the securities markets or conditions specifically related to a particular company. Failure of the other party to a transaction to perform (credit and counterparty risk), for example by not making principal and interest payments when due, reduces the value of the issuer’s debt and could reduce the Funds’ income. Similar to credit risk, the Funds may be exposed to counterparty risk, or the risk that an institution or other entity with which the Funds have unsettled or open transactions will fail to make required payments or otherwise comply with the terms of the instrument, transaction or contract. The potential loss could exceed the value of the financial assets recorded in the financial statements. Some of the Funds’ investments may be illiquid and the Funds may not be able to vary the portfolio investments in response to changes in economic and other conditions. If a Fund is required to liquidate all or a portion of its investments quickly, the Fund may realize significantly less than the value at which it previously recorded those investments.
Offsetting Assets and Liabilities
The Funds are parties to a Master Repurchase Agreement (“Master Repo Agreements”) that governs transactions between the Funds and selected counterparties. The master Repo Agreements maintain provision for, among other things, initiation, income payments, events of default, and maintenance of collateral for Repurchase Agreements. The Funds have elected not to offset qualifying financial and derivative instruments on the Statements of Assets and Liabilities, as such financial and derivative instruments are presented on a gross basis. The impacts of netting arrangements that provide the right to offset are detailed below. The net amount represents the net receivable or payable that would be due from or to the counterparty in the event of default. Exposure from borrowings and other financing agreements such as repurchase agreements can only be netted across transactions governed by the same Master Repo Agreement with the same legal entity. All amounts reported below represent the balance as of the report date, June 30, 2014 (in thousands).
17
American Beacon Select FundsSM
Notes to Financial Statements
June 30, 2014 (Unaudited)
Money Market Fund
Offsetting of Financial Assets and Derivative Assets as of June 30, 2014:
| | | | | | | | | | | | |
Description | | Gross Amounts of
Recognized Assets | | | Gross Amounts
Offset in the
Statement of Assets
and Liabilities | | | Net Amounts of Liabilities
Presented in the
Statement of Assets
and Liabilities | |
Repurchase Agreements | | $ | 256,000 | | | $ | — | | | $ | 256,000 | |
Financial Assets, Derivative Assets, and Collateral Pledged by Counterparty as of June 30, 2014:
| | | | | | | | | | | | | | | | |
| | | Net Amounts of Assets Presented in the Statement of | | | Gross Amounts Not Offset in the
Statement of Assets and Liabilities | | | | |
Counterparty | | Assets and
Liabilities | | | Financial
Instruments1 | | | Cash Collateral
Received | | | Net Amount | |
Barclays Capital Inc. | | $ | 36,000 | | | $ | (36,000 | ) | | $ | — | | | $ | — | |
BNP Paribas Securities Corp. | | | 36,000 | | | | (36,000 | ) | | | — | | | | — | |
Credit Suisse Securities LLC | | | 38,000 | | | | (38,000 | ) | | | — | | | | — | |
JPMorgan Clearing Corp. | | | 36,000 | | | | (36,000 | ) | | | — | | | | — | |
Merrill Lynch, Pierce, Fenner & Smith, Inc. | | | 38,000 | | | | (38,000 | ) | | | — | | | | — | |
RBC Capital Markets LLC | | | 37,000 | | | | (37,000 | ) | | | — | | | | — | |
Wells Fargo Securities LLC | | | 35,000 | | | | (35,000 | ) | | | — | | | | — | |
| | | | | | | | | | | | | | | | |
| | $ | 256,000 | | | $ | (256,000 | ) | | $ | — | | | $ | — | |
| | | | | | | | | | | | | | | | |
U.S. Government Money Market Fund
Offsetting of Financial Assets and Derivative Assets as of June 30, 2014:
| | | | | | | | | | | | |
Description | | Gross Amounts of
Recognized Assets | | | Gross Amounts
Offset in the
Statement of Assets
and Liabilities | | | Net Amounts of Liabilities
Presented in the
Statement of Assets
and Liabilities | |
Repurchase Agreements | | $ | 329,329 | | | $ | — | | | $ | 329,329 | |
Financial Assets, Derivative Assets, and Collateral Pledged by Counterparty as of June 30, 2014:
| | | | | | | | | | | | | | | | |
| | | Net Amounts of Assets Presented in
the Statement of | | | Gross Amounts Not Offset in the
Statement of Assets and Liabilities | | | | |
Counterparty | | Assets and
Liabilities | | | Financial
Instruments2 | | | Cash Collateral
Received | | | Net Amount | |
Barclays Capital Inc. | | $ | 11,000 | | | $ | (11,000 | ) | | $ | — | | | $ | — | |
BNP Paribas Securities Corp. | | | 15,000 | | | | (15,000 | ) | | | — | | | | — | |
Credit Agricole CIB | | | 75,000 | | | | (75,000 | ) | | | — | | | | — | |
Credit Suisse Securities LLC | | | 18,000 | | | | (18,000 | ) | | | — | | | | — | |
Deutsche Bank Securities, Inc. | | | 25,000 | | | | (25,000 | ) | | | — | | | | — | |
Goldman Sachs & Co. | | | 118,329 | | | | (118,329 | ) | | | — | | | | — | |
Merrill Lynch, Pierce, Fenner & Smith, Inc. | | | 17,000 | | | | (17,000 | ) | | | — | | | | — | |
RBC Capital Markets Corp. | | | 50,000 | | | | (50,000 | ) | | | — | | | | — | |
| | | | | | | | | | | | | | | | |
| | $ | 329,329 | | | $ | (329,329 | ) | | $ | — | | | $ | — | |
| | | | | | | | | | | | | | | | |
| 1 | Excess of collateral received from the individual counterparty is not shown for financial statement purposes. Collateral with a value of $270,312 has been received in connection with repurchase transactions. |
| 2 | Excess of collateral received from the individual counterparty is not shown for financial statement purposes. Collateral with a value of $342,094 has been received in connection with repurchase transactions. |
18
American Beacon Money Market Select FundSM
Financial Highlights
(For a share outstanding throughout the period)
| | | | | | | | | | | | | | | | | | | | | | | | |
| | | Six Months
Ended June 30, | | | Year Ended December 31, | |
| | | 2014 | | | 2013 | | | 2012 | | | 2011 | | | 2010 | | | 2009 | |
| | | (unaudited) | | | | | | | | | | | | | | | | |
Net asset value, beginning of period | | $ | 1 .00 | | | $ | 1 .00 | | | $ | 1 .00 | | | $ | 1 .00 | | | $ | 1 .00 | | | $ | 1 .00 | |
| | | | | | | | | | | | | | | | | | | | | | | | |
Income from investment operations: | | | | | | | | | | | | | | | | | | | | | | | | |
Net investment income | | | 0 .00 | A | | | 0 .00 | A | | | 0 .00 | A | | | 0.00 | A,B | | | 0 .00 | A,B | | | 0 .00 | A,B |
Net realized gain from investments | | | 0 .00 | A | | | 0 .00 | A | | | 0 .00 | A | | | 0 .00 | A | | | 0 .00 | A | | | 0 .00 | A |
| | | | | | | | | | | | | | | | | | | | | | | | |
Total income from investment operations | | | 0 .00 | | | | 0 .00 | | | | 0 .00 | | | | 0 .00 | | | | 0 .00 | | | | 0 .00 | |
| | | | | | | | | | | | | | | | | | | | | | | | |
Less distributions: | | | | | | | | | | | | | | | | | | | | | | | | |
Dividends from net investment income | | | 0 .00 | A | | | 0 .00 | A | | | 0 .00 | A | | | 0 .00 | A | | | 0 .00 | A | | | 0 .00 | A |
Distributions from net realized gains | | | 0 .00 | A | | | 0 .00 | A | | | 0 .00 | A | | | 0 .00 | A | | | 0 .00 | A | | | 0 .00 | A |
| | | | | | | | | | | | | | | | | | | | | | | | |
Total distributions | | | 0 .00 | | | | 0 .00 | | | | 0 .00 | | | | 0 .00 | | | | 0 .00 | | | | 0 .00 | |
| | | | | | | | | | | | | | | | | | | | | | | | |
Net asset value, end of period | | $ | 1 .00 | | | $ | 1 .00 | | | $ | 1 .00 | | | $ | 1 .00 | | | $ | 1 .00 | | | $ | 1 .00 | |
| | | | | | | | | | | | | | | | | | | | | | | | |
Total return | | | 0 .04 | %C | | | 0 .11 | % | | | 0 .19 | % | | | 0 .14 | % | | | 0 .21 | % | | | 0 .39 | % |
| | | | | | | | | | | | | | | | | | | | | | | | |
Ratios and supplemental data: | | | | | | | | | | | | | | | | | | | | | | | | |
Net assets, end of period (in thousands) | | $ | 767,338 | | | $ | 793,408 | | | $ | 760,503 | | | $ | 662,509 | | | $ | 645,557 | | | $ | 643,165 | |
Ratios to average net assets (annualized): | | | | | | | | | | | | | | | | | | | | | | | | |
Expenses, before reimbursements | | | 0 .13 | %D | | | 0 .13 | % | | | 0 .13 | % | | | 0 .13 | %B | | | 0 .13 | %B | | | 0 .16 | %B |
Expenses, net of reimbursements | | | 0 .13 | %D | | | 0 .13 | % | | | 0 .13 | % | | | 0 .13 | %B | | | 0 .13 | %B | | | 0 .16 | %B |
Net investment income, before reimbursements | | | 0 .07 | %D | | | 0 .11 | % | | | 0 .18 | % | | | 0 .14 | %B | | | 0 .21 | %B | | | 0 .38 | %B |
Net investment income, net of reimbursements | | | 0 .07 | %D | | | 0 .11 | % | | | 0 .18 | % | | | 0 .14 | %B | | | 0 .21 | %B | | | 0 .38 | %B |
| A | Amount is less than $0.01 per share. |
| B | The per share amounts and ratios reflect income and expenses assuming inclusion of the Fund’s proportionate share of the income and expenses of the American Beacon Master Money Market Portfolio which terminated on September 30, 2011. |
19
American Beacon U.S. Government Money Market Select FundSM
Financial Highlights
(For a share outstanding throughout the period)
| | | | | | | | | | | | | | | | | | | | | | | | |
| | | Six Months
Ended June 30, | | | Year Ended December 31, | |
| | | 2014 | | | 2013 | | | 2012 | | | 2011 | | | 2010 | | | 2009 | |
| | | (unaudited) | | | | | | | | | | | | | | | | |
Net asset value, beginning of period | | $ | 1 .00 | | | $ | 1 .00 | | | $ | 1 .00 | | | $ | 1 .00 | | | $ | 1 .00 | | | $ | 1 .00 | |
| | | | | | | | | | | | | | | | | | | | | | | | |
Income from investment operations: | | | | | | | | | | | | | | | | | | | | | | | | |
Net investment income | | | 0 .00 | A | | | 0 .00 | A | | | 0 .00 | A | | | 0 .00 | A | | | 0 .00 | A | | | 0 .00 | AC |
Net realized gain from investments | | | 0 .00 | A | | | 0 .00 | A | | | 0 .00 | A | | | 0 .00 | A | | | 0 .00 | A | | | 0 .00 | A |
| | | | | | | | | | | | | | | | | | | | | | | | |
Total income from investment operations | | | 0 .00 | | | | 0 .00 | | | | 0 .00 | | | | 0 .00 | | | | 0 .00 | | | | 0 .00 | |
| | | | | | | | | | | | | | | | | | | | | | | | |
Less distributions: | | | | | | | | | | | | | | | | | | | | | | | | |
Dividends from net investment income | | | 0 .00 | A | | | 0 .00 | A | | | 0 .00 | A | | | 0 .00 | A | | | 0 .00 | A | | | 0 .00 | A |
Distributions from net realized gains | | | 0 .00 | A | | | 0 .00 | A | | | 0 .00 | A | | | 0 .00 | A | | | 0 .00 | A | | | 0 .00 | A |
| | | | | | | | | | | | | | | | | | | | | | | | |
Total distributions | | | 0 .00 | | | | 0 .00 | | | | 0 .00 | | | | 0 .00 | | | | 0 .00 | | | | 0 .00 | |
| | | | | | | | | | | | | | | | | | | | | | | | |
Net asset value, end of period | | $ | 1 .00 | | | $ | 1 .00 | | | $ | 1 .00 | | | $ | 1 .00 | | | $ | 1 .00 | | | $ | 1 .00 | |
| | | | | | | | | | | | | | | | | | | | | | | | |
Total return | | | 0 .00 | %B | | | 0 .02 | % | | | 0 .09 | % | | | 0 .04 | % | | | 0 .13 | % | | | 0 .25 | % |
| | | | | | | | | | | | | | | | | | | | | | | | |
Ratios and supplemental data: | | | | | | | | | | | | | | | | | | | | | | | | |
Net assets, end of period (in thousands) | | $ | 484,581 | | | $ | 367,701 | | | $ | 238,236 | | | $ | 253,776 | | | $ | 324,695 | | | $ | 353,444 | |
Ratios to average net assets (annualized): | | | | | | | | | | | | | | | | | | | | | | | | |
Expenses, before reimbursements | | | 0 .14 | %D | | | 0 .14 | % | | | 0 .15 | % | | | 0 .14 | % | | | 0 .14 | % | | | 0 .15 | % |
Expenses, net of reimbursements | | | 0 .11 | %D | | | 0 .13 | % | | | 0 .14 | % | | | 0 .14 | % | | | 0 .13 | % | | | 0 .12 | % |
Net investment income, before reimbursements | |
| (0
.02 |
)%D | | | 0 .01 | % | | | 0 .09 | % | | | 0 .04 | % | | | 0 .12 | % | | | 0 .23 | % |
Net investment income, net of reimbursements | | | 0 .01 | %D | | | 0 .02 | % | | | 0 .09 | % | | | 0 .04 | % | | | 0 .12 | % | | | 0 .26 | % |
| A | Amount is less than $0.01 per share. |
| C | The per share amounts and ratios reflect income and expenses assuming inclusion of the Fund’s proportionate share of the income and expenses of the American Beacon Master Money Market Portfolio which terminated on September 30, 2011. |
20
Disclosure Regarding the Board of Trustees’ Approval of the Management
Agreements of the Funds (Unaudited)
At in-person meetings held on May 15, 2014 and June 5, 2014 (collectively, the “Meetings”), the Board of Trustees (“Board”) considered and then, at its June 5 meeting, approved: (1) the renewal of the Management Agreement between American Beacon Advisors, Inc. (“Manager”) and the American Beacon Funds (“Beacon Trust”) and American Beacon Select Funds (“Select Trust”) on behalf of each of their series that had been operational for at least one year (collectively, the “Funds”); and (2) the renewal of the investment advisory agreements (each an “Investment Advisory Agreement”) among the Manager, each subadvisor and, as applicable, the Beacon Trust, other than the Investment Advisory Agreements with subadvisors with respect to which the Board approved a new Investment Advisory Agreement within the past year (each a “subadvisor”). The Management Agreement and the Investment Advisory Agreements are collectively referred to herein as the “Agreements.” In preparation for the Board to consider the renewal of these Agreements, the Board undertook steps to gather and consider information furnished by the Manager, the subadvisors, Lipper, Inc. (“Lipper”), Morningstar, Inc. (“Morningstar”), Bobroff Consulting, Inc. and Callan Associates, Inc. (“Callan”). The Board, with the assistance of independent legal counsel, requested and received certain relevant information from the Manager and each subadvisor.
In advance of the Meetings, the Board’s Investment Committee coordinated the production of information from Lipper and Morningstar regarding the performance, fees and expenses of the Funds as well as information from the Manager and the subadvisors. At the Meetings, the Board considered the information provided. Further, the Board took into consideration information furnished for the Board’s review and consideration throughout the year at regular meetings of the Board and its committees, as well as information specifically prepared in connection with the renewal process.
In connection with the Board’s consideration of the Management Agreement and each Investment Advisory Agreement, the Trustees received and evaluated such information as they deemed necessary. The information requested on behalf of the Board included, among other information, the following materials. References herein to the “firm” refer to the Manager and/or each applicable subadvisor.
| | • | | comparisons of the performance of an appropriate share class of each Fund to comparable investment companies and appropriate benchmark indices, including peer group averages and performance analyses provided by Lipper and Morningstar, and to the performance of any similar accounts managed by the firm; |
| | • | | for Funds having multiple firms managing assets, information regarding the performance of the individual firms with respect to their allocated portions of a Fund’s portfolio, and the performance of certain relevant benchmarks and other similar accounts managed by the firm; |
| | • | | comparisons of each Fund’s management and subadvisory fee rates and expense ratio with those of comparable mutual funds, including peer group averages and fee and expense analyses provided by Lipper and Morningstar, and the advisory fee rates charged to other clients for which similar services are provided; |
| | • | | a description of any applicable fee waivers and/or expense reimbursements in place for each Fund during the past year, and any proposed changes to the expense caps; |
| | • | | the Manager’s profitability with respect to the services that it provided to each Fund; |
| | • | | any actual or anticipated economies of scale in relation to the services the firm provides or will provide to each Fund and whether the current fee rates charged or to be charged to each Fund reflect these economies of scale for the benefit of the Fund’s investors; |
| | • | | an evaluation of any other benefits to the firm or Funds as a result of their relationship, if any; |
| | • | | information regarding the securities lending, cash management, administrative and accounting-related services that the Manager provides to certain Funds and the fees that the Manager receives for such services, including Callan’s review of the Funds’ securities lending program; and |
| | • | | information regarding a firm’s financial condition, the personnel who are or will be assigned primary responsibility for managing the Funds, staffing levels, portfolio managers’ compensation, disaster recovery plans, insurance coverage, material pending litigation, code of ethics, compliance matters, trading activities, and actual or potential conflicts of interest that the firm experiences, or anticipates that it will experience, in providing services to the Funds. |
The Board considered that the Manager provides management and administrative services to the Funds pursuant to separate agreements. The Board noted, in this regard, that many mutual funds have a single contract governing both types of services, and observed that the actual management fee rates provided by Lipper for peer group funds reflect the combined advisory and administrative expenses, reduced by any fee waivers and/or reimbursements.
Certain firms may not have been able to, or opted not to, provide information in response to certain information requests, in which case the Board conducted its evaluation of those firms based on information that was provided. For each Fund with more than one class of shares, the class of shares used for comparative performance purposes was the share class with the lowest expenses available for purchase by the general public, which, in most cases, was the Institutional Class. The Board also considered that the use of Institutional Class performance generally facilitates a meaningful comparison for expense and performance purposes.
Provided below is an overview of certain factors the Board considered in connection with its renewal and approval of the Management Agreement and Investment Advisory Agreements. The Board did not identify any particular information that was most relevant to its consideration to renew or approve each Agreement, and each Trustee may have afforded different weight to the various factors. Legal counsel to the independent Trustees provided the Board with a memorandum regarding its responsibilities pertaining to the renewal and approval of each Agreement. The memorandum explained the regulatory requirements surrounding the Trustees’ process for evaluating investment advisors and the terms of the contracts. Based on its evaluation, the Board unanimously concluded that the terms of each Agreement were reasonable and fair and that the renewal and approval of each Agreement was in the best interests of the Funds and their shareholders.
21
Disclosure Regarding the Board of Trustees’ Approval of the Management
Agreements of the Funds (Unaudited)
Considerations With Respect to the Renewal of the Management Agreement and Each Investment Advisory Agreement
In determining whether to renew the Management Agreement and each Investment Advisory Agreement on behalf of the Funds, the Trustees considered the best interests of each Fund separately. While the Management Agreement and the Investment Advisory Agreements for all of the Funds were considered at the Meetings, the Board considered each Fund’s investment management and subadvisory relationships separately.
In each instance, the Board considered, among other things, the following factors: (1) the nature, extent and quality of the services provided; (2) the investment performance of a Fund and, as applicable, each subadvisor for a Fund; (3) the costs incurred by the Manager in rendering services to the Funds and its resulting profits or losses; (4) comparisons of services and fee rates with contracts entered into by the Manager or a subadvisor or their affiliates with other clients (such as pension funds and other institutional clients); (5) the extent to which economies of scale have been taken into account in setting each fee rate schedule; (6) whether fee rate levels reflect these economies of scale for the benefit of Fund investors; and (7) any other benefits derived or anticipated to be derived by the Manager or a subadvisor from their relationship with a Fund. The Trustees posed questions to various management personnel of the Manager regarding certain key aspects of the materials submitted in support of the renewal.
Nature, Extent and Quality of Services. With respect to the renewal of the Management Agreement, the Board considered, among other factors: each Fund’s long-term performance and the background and experience of key investment personnel at the Manager; the cost structure of the Funds; the Manager’s culture of compliance and support for compliance operations that reduce risks to the Funds; the Manager’s commitment to enhance the Funds’ product line and increase assets in the Funds; the Manager’s quality of services; the Manager’s active role in monitoring and, as appropriate, recommending additional or replacement subadvisors; the Manager’s commitment to training employees; and the Manager’s efforts to retain key employees and maintain staffing levels.
With respect to the renewal of each Investment Advisory Agreement, the Trustees considered the level of staffing, quality, background and experience of each subadvisor’s investment personnel responsible for managing the Funds, the size of the subadvisor and the subadvisor’s ability to continue to attract and retain qualified investment personnel. The Board also considered the adequacy of the resources committed to the Funds by each subadvisor, and whether those resources were commensurate with the needs of the Funds and are sufficient to sustain appropriate levels of performance and compliance needs. In this regard, the Board considered the financial stability of each subadvisor. The Board also considered the subadvisors’ representations regarding their compliance programs and codes of ethics. Based on the foregoing information, the Board concluded that the nature, extent and quality of the management and advisory services provided by the Manager and each subadvisor were appropriate for each Fund and, thus, determined to renew the Management Agreement and the Investment Advisory Agreement for each Fund.
Investment Performance. The Board evaluated the comparative information provided by Lipper and the Manager regarding each Fund’s investment performance relative to its Lipper performance universe, Lipper performance group, and/or benchmark index(es) as well as the Fund’s Morningstar rating. The Board considered the information provided by Lipper regarding its independent peer selection methodology to select all performance groups and universes. The Board also considered that the performance groups and universes selected by Lipper may not provide appropriate comparisons for certain Funds. In addition, the Board considered the performance reports and discussions with management at Board and Committee meetings throughout the year. The Board also considered in each instance the Manager’s recommendation to continue to retain each subadvisor. A discussion regarding the Board’s considerations with respect to each Fund’s performance appears below under “Additional Considerations and Conclusions with Respect to Each Fund.”
Costs of the Services Provided to the Funds and the Profits Realized by the Manager from its Relationship with the Funds. In analyzing the cost of services and profitability of the Manager, the Board considered the revenues earned and the expenses incurred by the Manager. The profits or losses were noted at both an aggregate level for all Funds and at an individual Fund level, with some Funds being profitable for the Manager and with the Manager sustaining losses with respect to other Funds. Although the Board noted that, in certain cases, the fee rates paid by other clients of the Manager are lower than the fee rates paid by the Funds, the Manager represented that the difference reflects the greater level of responsibility and regulatory requirements associated with managing the Funds.
The Board also noted that the Manager proposed to continue the expense waivers and reimbursements for certain Funds and share classes that were in place during the last fiscal year. The Board further considered that, with respect to the Fund, the Management Agreement provides for the Manager to receive a management fee comprised of an annualized fee that is retained by the Manager and, in some instances, the amount payable by the Manager to a subadvisor. The Board also considered that the Manager receives service and administrative fees to compensate the Manager for providing administrative services to the Funds and to compensate third-party administrators and broker-dealers for services to Fund shareholders. In addition, the Board considered that the Manager receives management fees for overseeing the securities lending program on behalf of certain Funds. In considering the management fees for overseeing the securities lending program, the Board reviewed the analysis of the securities lending program prepared by Callan. The Board also noted that certain share classes of the Funds maintain higher expense ratios in order to compensate third-party distributors.
In analyzing the fee rates charged by each subadvisor in connection with its investment advisory services to the Fund, the Board considered that, in many cases, the Manager has negotiated the lowest fee rate a subadvisor charges for any comparable client accounts. The Board did not request profitability data from the subadvisors because the Board did not view this data as imperative to its deliberations given the arm’s-length nature of the relationship between the Manager and the subadvisors with respect to the negotiation of subadvisory fee rates. In addition, the Board noted that subadvisors may not account for their profits on an account-by-account basis and those that do likely employ different methodologies in connection with these calculations.
Based on the foregoing information, the Board concluded that the profitability levels of the Manager were reasonable in light of the services performed by the Manager. A discussion regarding the Board’s considerations with respect to each Fund’s fee rates is set forth below under “Additional Considerations and Conclusions with Respect to Each Fund.”
22
Disclosure Regarding the Board of Trustees’ Approval of the Management
Agreements of the Funds (Unaudited)
Economies of Scale. In considering the reasonableness of the management and investment advisory fees rates, the Board considered whether economies of scale will be realized as the Funds grow and whether fee rate levels reflect these economies of scale for the benefit of Fund shareholders. In this regard, the Board considered that the Manager has negotiated breakpoints in many subadvisory fee rates. The Board also noted that, for purposes of determining the fee rates chargeable to the Funds, certain subadvisors have agreed to take into account assets of American Airlines Group and its pension plans that are managed by the subadvisors. Thus, the Funds are able to receive lower effective fee rates.
In addition, the Board noted the Manager’s representation that many of the Funds benefit from economies of scale because comparably low fee rate levels are reflected in the current fee rates the Manager charges. The Board further noted the Manager’s representation that many of the Funds benefit from these comparably low fee rate levels despite not having yet reached an asset size at which economies of scale would traditionally be considered to exist, and the Manager’s belief that breakpoints are not appropriate at this time. Based on the foregoing information, the Board concluded that the Manager and subadvisor fee rate schedules for each Fund provide for a reasonable sharing of benefits from any economies of scale with the Funds.
Benefits Derived from the Relationship with the Funds. The Board considered the “fall-out” or ancillary benefits that accrue to the Manager and/or the subadvisors as a result of the advisory relationships with the Funds, including greater exposure in the marketplace with respect to the Manager’s or subadvisor’s investment process and expanding the level of assets under management by the Manager and the subadvisors. In addition, the Board noted that certain subadvisors benefit from soft dollar arrangements for third party and proprietary research.
In addition, the Manager noted that the Funds also derive benefits from their association with the Manager. Specifically, the Board noted the Manager’s representation that it provides services to most Funds at a lower than industry average cost. The Board considered that certain subadvisors reimburse the Manager for certain costs relating to distribution activities for the Funds, as well as representations by all such subadvisors that they would not reduce their fee rates in lieu of providing such reimbursements. Based on the foregoing information, the Board concluded that the potential benefits accruing to the Manager and the subadvisors by virtue of their relationships with the Funds appear to be fair and reasonable.
Additional Considerations and Conclusions with Respect to Each Fund
The performance comparisons below were made versus each Fund’s Lipper performance universe and Lipper performance group, with the 1st Quintile representing the top twenty percent of the universe or group based on performance and the 5th Quintile representing the bottom twenty percent of the universe or group based on performance. References below to each Fund’s Lipper performance group and Lipper performance universe are to the respective group or universe of comparable mutual funds included in the analysis provided by Lipper. A Lipper performance group consists of the Fund and a representative sample of funds with similar investment classifications and objectives as the Fund, as selected by Lipper. A Lipper performance universe is an expansion of the performance group, providing a broader view of performance across the Fund’s investment classification/objective and allowing for a more extensive comparison. In reviewing the performance, the Trustees viewed longer-term performance over a full market cycle, typically five years or longer, as the most important consideration, because relative performance over shorter periods may be significantly impacted by market or economic events that do not reflect manager skill.
The expense comparisons below were made versus each Fund’s Lipper expense universe and Lipper expense group, with the 1st Quintile representing the top twenty percent of the universe or group based on lowest total expense and the 5th Quintile representing the bottom twenty percent of the universe or group based on highest total expense. References below to each Fund’s expense group and expense universe are to the respective group or universe of comparable mutual funds included in the analysis by Lipper. A Lipper expense group consists of the Fund and a representative sample of funds with similar operating structures, as selected by Lipper. A Lipper expense universe includes all funds in the investment classification/objective with a similar load type to the share class of the Fund included in the Lipper comparative information and provides a broader view of expenses across the Fund’s investment classification/objective. For all Funds, other than for the American Beacon Money Market Select Fund and American Beacon U.S. Government Money Market Select Fund for which information was not available, the Trustees also considered a Fund’s Morningstar fee level category. In reviewing expenses, the Trustees considered the positive impact of fee waivers where applicable and the Manager’s agreement to continue the fee waivers. In addition, information regarding the use of soft dollars was requested from the Manager and all subadvisors and was considered by the Trustees.
Additional Considerations and Conclusions with Respect to the American Beacon Money Market Select Fund
In considering the renewal of the Management Agreement for American Beacon Money Market Select Fund, the Trustees considered the following additional factors:
Lipper Total Expense Analysis
| | | | |
Compared to Lipper Expense Universe | | | 1st Quintile | |
Compared to Lipper Expense Group | | | 1st Quintile | |
Lipper Fund Performance Analysis (five-year period ended March 31, 2014)
| | | | |
Compared to Lipper Performance Universe | | | 1st Quintile | |
Compared to Lipper Performance Group | | | 1st Quintile | |
Based on these and other considerations, the Trustees: (1) concluded that the fees paid to the Manager under the Management Agreement are fair and reasonable; (2) determined that the American Beacon Money Market Select Fund and its shareholders would benefit from the Manager’s continued management of the Fund; and (3) approved the renewal of the Management Agreement with respect to the American Beacon Money Market Select Fund.
23
Disclosure Regarding the Board of Trustees’ Approval of the Management
Agreements of the Funds (Unaudited)
Additional Considerations and Conclusions with Respect to the American Beacon U.S. Government Money Market Select Fund
In considering the renewal of the Management Agreement for the American Beacon U.S. Government Money Market Select Fund, the Trustees considered the following additional factors:
Lipper Total Expense Analysis
| | | | |
Compared to Lipper Expense Universe | | | 3rd Quintile | |
Compared to Lipper Expense Group | | | 3rd Quintile | |
Lipper Fund Performance Analysis (five-year period ended March 31, 2014)
| | | | |
Compared to Lipper Performance Universe | | | 1st Quintile | |
Compared to Lipper Performance Group | | | 1st Quintile | |
Based on these and other considerations, the Trustees: (1) concluded that the fees paid to the Manager under the Management Agreement are fair and reasonable; (2) determined that the American Beacon U.S. Government Money Market Select Fund and its shareholders would benefit from the Manager’s continued management of the Fund; and (3) approved the renewal of the Management Agreement with respect to the American Beacon U.S. Government Money Market Select Fund.
24
This page intentionally left blank.
25

Delivery of Documents
eDelivery is NOW AVAILABLE- Stop traditional mail delivery and receive your
shareholder reports and summary prospectus on-line. Sigh up at
www.americanbeaconfunds.com
If you invest in the Funds through a financial institution, you may be able to receive the Fund’s regulatory mailings, such as the Summary Prospectus, Annual Report and Semi-Annual Report, by e-mail. If you are interested in this option, please go to www.icsdelivery.com and search for your financial institution’s name or contact your financial institution directly.
To obtain more information about the Fund:
| | |
 | |  |
By E-mail: american_beacon.funds@ambeacon.com | | On the Internet: Visit our website at www.americanbeaconfunds.com |
| | |
| | | |
 | |  |
By Telephone: Call (800) 658-5811 | | By Mail: American Beacon Select Funds P.O. Box 219643 Kansas City, MO 64121 |
| | |
| | | |
Availability of Quarterly Portfolio Schedules In addition to the Schedule of Investments provided in each semi-annual and annual report, the Fund files a complete schedule of its portfolio holdings with the Securities and Exchange Commission (“SEC”) on Form N-Q as of the first and third fiscal quarters. The Fund’s Forms N-Q are available on the SEC’s website at www.sec.gov. The Forms N-Q may also be reviewed and copied at the SEC’s Public Reference Section,
100 F Street, NE, Washington, D.C. 20549-1520. Information regarding the operation of the SEC’s Public Reference Room may be obtained by calling (202) 551-8090. A complete schedule of the Fund’s portfolio holdings is also available at www.americanbeaconfunds.com approximately five days after the end of each month. | | Availability of Proxy Voting Policy and Records A description of the policies and procedures the Fund uses to determine how to vote proxies relating to portfolio securities is available in the Fund’s Statement of Additional Information, is available free of charge on the Fund’s website www.americanbeaconfunds.com and by calling 1-800-967-9009 or by accessing the SEC’s website at www.sec.gov. The Fund’s proxy voting record for the most recent year ended June 30 is filed annually with the SEC on Form N-PX. The Fund’s Forms N-PX are available on the SEC’s website at www.sec.gov. The Fund’s proxy voting record may also be obtained by calling 1-800-967-9009. |
Fund Service Providers:
| | | | | | | | | | | | |
CUSTODIAN State Street Bank and Trust Boston, Massachusetts | | | | TRANSFER AGENT Boston Financial Data Services Kansas City, Missouri | | | | INDEPENDENT REGISTERED PUBLIC ACCOUNTING FIRM Ernst & Young LLP Dallas, Texas | | | | DISTRIBUTOR Foreside Fund Services, LLC Portland, Maine |
This report is prepared for shareholders of the American Beacon Money Market Select Funds and may be distributed to others only if preceded or accompanied by a current Prospectus or Summary Prospectus.
American Beacon Select Funds, American Beacon Money Market Select Fund, and American Beacon U.S. Government Money Market Select Fund are service marks of American Beacon Advisors, Inc.
SAR 6/14
ITEM 2. CODE OF ETHICS.
The Trust did not amend the code of ethics that applies to its principal executive and financial officers (the “Code”) nor did it grant any waivers to the provisions of the Code during the period covered by the shareholder reports presented in Item 1.
ITEM 3. AUDIT COMMITTEE FINANCIAL EXPERT.
Not Applicable.
ITEM 4. PRINCIPAL ACCOUNTANT FEES AND SERVICES.
Not Applicable.
ITEM 5. AUDIT COMMITTEE OF LISTED REGISTRANTS.
Not Applicable.
ITEM 6. SCHEDULE OF INVESTMENTS.
The schedules of investments for each series of the Trust are included in the shareholder reports presented in Item 1.
ITEM 7. DISCLOSURE OF PROXY VOTING POLICIES AND PROCEDURES FOR CLOSED-END MANAGEMENT INVESTMENT COMPANIES.
Not Applicable.
ITEM 8. PORTFOLIO MANAGERS OF CLOSED-END MANAGEMENT INVESTMENT COMPANIES.
Not applicable.
ITEM 9. PURCHASES OF EQUITY SECURITIES BY CLOSED-END MANAGEMENT INVESTMENT COMPANY AND AFFILIATED PURCHASERS.
Not Applicable.
ITEM 10. SUBMISSION OF MATTERS TO A VOTE OF SECURITY HOLDERS.
The Trust has made no material changes to the procedures by which shareholders may recommend nominees to the Trust’s Board of Trustees since the Trust last disclosed such procedures in Schedule 14A.
ITEM 11. CONTROLS AND PROCEDURES.
(a) Based upon an evaluation within 90 days of the filing date of this report, the principal executive and financial officers concluded that the disclosure controls and procedures of the Trust are effective.
(b) There were no changes in the Trust’s internal control over financial reporting during the second fiscal quarter of the period covered by this report that has materially affected, or is reasonably likely to materially affect, the Trust’s internal control over financial reporting.
ITEM 12. EXHIBITS.
(a)(1) Not Applicable.
(a)(2) A separate certification for each principal executive officer and principal financial officer of the Trust as required by Rule 30a-2(a) under the Investment Company Act of 1940 is attached hereto as EX-99.CERT.
(a)(3) Not Applicable.
(b) The certifications required by Rule 30a-2(b) under the Investment Company Act of 1940 are attached hereto as EX-99.906CERT.
SIGNATURES
Pursuant to the requirements of the Securities Exchange Act of 1934 and the Investment Company Act of 1940, the registrant has duly caused this report to be signed on its behalf by the undersigned, thereunto duly authorized.
(Registrant): American Beacon Select Funds
| | |
| By | | /s/ Gene L. Needles, Jr. |
| | Gene L. Needles, Jr. |
| | President |
Date: September 5, 2014
Pursuant to the requirements of the Securities Exchange Act of 1934 and the Investment Company Act of 1940, this report has been signed below by the following persons on behalf of the registrant and in the capacities and on the dates indicated.
| | |
| By | | /s/ Gene L. Needles, Jr. |
| | Gene L. Needles, Jr. |
| | President |
Date: September 5, 2014
| | |
| By | | /s/ Melinda G. Heika |
| | Melinda G. Heika |
| | Treasurer |
Date: September 5, 2014