UNITED STATES
SECURITIES AND EXCHANGE COMMISSION
Washington, D.C. 20549
FORM N-CSR
CERTIFIED SHAREHOLDER REPORT OF REGISTERED
MANAGEMENT INVESTMENT COMPANIES
Investment Company Act file number: 811-9603
AMERICAN BEACON SELECT FUND
(Exact name of registrant as specified in charter)
220 East Las Colinas Boulevard, Suite 1200
Irving, Texas 75039
(Address of principal executive offices)-(Zip code)
Gene L. Needles, Jr., PRESIDENT
220 East Las Colinas Boulevard, Suite 1200
Irving, Texas 75039
(Name and address of agent for service)
Registrant’s telephone number, including area code: (817) 967-3509
Date of fiscal year end: December 31, 2014
Date of reporting period: December 31, 2014
ITEM 1. REPORT TO STOCKHOLDERS.
About American Beacon Advisors
Since 1986, American Beacon Advisors has offered a variety of products and investment advisory services to numerous institutional and retail clients, including a variety of mutual funds, corporate cash management, and separate account management.
Our clients include defined benefit plans, defined contribution plans, foundations, endowments, corporations, financial planners, and other institutional investors. With American Beacon Advisors, you can put the experience of a multi-billion dollar asset management firm to work for your company.
Any opinions herein, including forecasts, reflect our judgment as of the end of the reporting period and are subject to change. Each advisor’s strategies and each Fund’s portfolio composition will change depending on economic and market conditions. This report is not a complete analysis of market conditions, and therefore, should not be relied upon as investment advice. Although economic and market information has been compiled from reliable sources, American Beacon Advisors, Inc. makes no representation as to the completeness or accuracy of the statements contained herein.
| | |
| American Beacon Funds | | December 31, 2014 |
Dear Shareholders,
The U.S. economy – fueled by cheap gas, record stock prices, healthy job growth and reductions in unemployment – showed steady improvement in 2014. Yet, despite the country’s economic gains, an uneven housing market and slow wage growth continued throughout the year and inflationary pressure helped drive yields to historically depressed levels.
During good times and bad, money market funds remain reliable choices for many investors given their ability to provide relative stability of principal and liquidity. Too often, money market funds are maligned as rainy day resources. In reality, investors often move assets into money market funds to await new opportunities after cashing out other positions.
American Beacon Funds, which is well-known for innovative and actively managed portfolios, is proud to offer two money market funds designed to help ensure maximum flexibility for our shareholders.
For the 12 months ended December 31, 2014:
| | • | | American Beacon Money Market Select Fund returned 0.08%. |
| | • | | American Beacon U.S. Government Money Market Select Fund returned 0.01%. |
Thank you for your continued investment in the American Beacon Funds. For additional information about the Select Funds or to access your account information, please visit www.americanbeaconfunds.com.
|
| Best Regards, |
 |
| Gene L. Needles, Jr. |
| President |
| American Beacon Select Funds |
|
1
Market Overview
December 31, 2014 (Unaudited)
Despite a rocky start, 2014 was a good year for the U.S. economy. After strong second- and third-quarter gross domestic product (“GDP”) reports, the positive economic momentum extended into the fourth quarter. Labor market conditions continued to improve as the U.S. added approximately 866,000 new jobs during the fourth quarter and the unemployment rate fell to a six-year low of 5.6% in December. The combination of healthy job growth, record stock prices and cheaper gas boosted consumer confidence and drove an increase in discretionary purchases. Gains in consumer spending helped to offset weaker global demand and powered a continued expansion in manufacturing and services during the quarter. Housing was the one area where consumer demand waned. Despite low mortgage rates, first-time homebuyers remained reluctant to take the home-buying plunge. Strict lending standards, higher home prices and low inventories almost certainly contributed to their reluctance. So while the U.S. economic recovery gained ground in 2014, headwinds like an uneven housing market and slow wage growth remain.
While the U.S. economy advanced, economic growth throughout the rest of the world lagged. China’s economic expansion continued, but at a much weaker pace as tepid demand at home and abroad led to a slowdown in manufacturing. Meanwhile, sanctions and plummeting oil prices pushed Russia’s economy into a free fall during the quarter. True to form, Russian President Vladimir Putin blamed the West for his country’s economic woes and, thus far, has made no concessions on the Ukraine conflict. While falling oil prices could drive Russia’s economy into recession in 2015, Japan is already there. The country reported two consecutive quarters of negative GDP growth after implementing a consumption tax increase in April that slowed consumer spending. Things weren’t much better in Europe. The region continued to battle stagnant growth and declining inflation. Opposition from Germany has delayed the implementation of a comprehensive quantitative easing program, but as the eurozone inches closer to deflation, the European Central Bank is likely to begin sovereign bond purchases in 2015.
While most of the globe was easing monetary policy during the fourth quarter, the Federal Reserve (“the Fed”) was prepping for its first tightening in eight years. Plunging oil prices and weak global growth did not sway the Federal Open Market Committee (“FOMC”) from its path to begin normalizing interest rates in mid-2015. At its December meeting, the FOMC acknowledged that falling oil prices would pull inflation lower, but the effect should be transitory. The FOMC believes low oil prices should be an overall net positive for the economy. There was some concern about slowing growth abroad and the negative impact it could have on the U.S., but most participants believed the downside risks to the U.S. growth outlook have been balanced by upside potential.
After debating about what the Fed should do with its “considerable time” language, the FOMC opted to ease markets into the change in forward guidance by mixing the old with the new. The new guidance says, “Based on its current assessment, the Committee judges that it can be patient in beginning to normalize the stance of monetary policy.” It goes on to explain that this guidance is consistent with the previous “considerable time” language. At the post-meeting press conference on December 17, 2014, Federal Reserve Board Chair Janet Yellen defined patience as meaning no change in the fed funds rate for “at least the next couple of meetings.” She stressed that liftoff is data dependent and could happen sooner or later depending on how the economy progresses.
2
American Beacon Money Market Select FundSM
Performance Overview
December 31, 2014 (Unaudited)
After a rocky start, 2014 proved to be a good year for the U.S. economy. Positive economic momentum was evident in the release of stronger GDP reports, especially during the second and third quarters, after a negative print in the first quarter that appeared to be weather related. Equities ended the year at record levels and job growth picked up steam, causing the unemployment rate to fall to 5.6% at year-end after starting the year at 6.7%.
As we approached the end of the year the Federal Reserve Bank (the “Fed”) began prepping markets for its first tightening in eight years. The Federal Open Market Committee (the “FOMC”) members began making comments they could begin normalizing interest rates by mid-2015. The Fed did acknowledge that falling oil prices will pull inflation lower but that low oil prices would be an overall net positive for the economy. Fed Chair, Janet Yellen, did stress that liftoff remains data dependent and could happen sooner or later depending on how the economy progresses.
Although credit conditions remained stable during the year there was continued focus on credit quality and liquidity. The American Beacon Money Market Select Fund’s primary strategy for the year was to buy high quality, short-term money market instruments and overnight investments. The strategies implemented during the year enabled the Fund to outperform its Lipper peer group.
For the twelve months ended December 31, 2014, the total return of the American Beacon Money Market Select Fund was 0.08%. The Fund outperformed the Lipper Institutional Money Market Average return of 0.02% by 6 basis points (0.06%). Based on annualized total returns, Lipper Analytical Services ranked the Fund 11th among 280, 10th among 260 and 21st among 197 Institutional Money Market Funds for the one-year, five-year, and ten-year periods ended December 31, 2014, respectively.
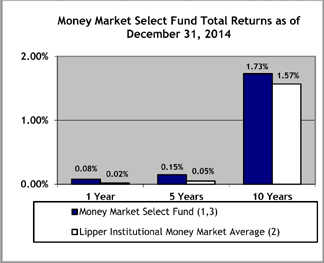
Total Returns for the Period ended 12/31/14
| | | | | | | | | | | | |
| | | 1 Year | | | 5 Years | | | 10 Years | |
Money Market Select Fund (1,3) | | | 0.08 | % | | | 0.15 | % | | | 1.73 | % |
Lipper Institutional Money Market Average (2) | | | 0.02 | % | | | 0.05 | % | | | 1.57 | % |
| 1. | Performance shown is historical and is not indicative of future returns. Investment returns will vary, and shares may be worth more or less at redemption than at original purchase. An investment in these Funds is neither insured nor guaranteed by the Federal Deposit Insurance Corporation or any other government agency. Although the Funds seek to preserve the value of an investment at $1.00 per share it is possible to lose money by investing in the Funds. Fund performance in the table above does not reflect the deduction of taxes a shareholder would pay on distributions or the redemption of shares. |
| 2. | The Lipper Institutional Money Market Average is calculated by taking an arithmetic average of the returns of the mutual funds in the Lipper Institutional Money Market Funds category. Lipper is an independent mutual fund research and ranking service. |
| 3. | The total annual Fund operating expense ratio set forth in the most recent Fund prospectus was 0.13%. The expense ratio above may vary from the expense ratio presented in other sections of this report that are based on expenses incurred during the period covered by this report. |
3
American Beacon Money Market Select FundSM
Performance Overview
December 31, 2014 (Unaudited)
Fund Statistics as of 12/31/14
| | | | |
7-day Current Yield* | | | 0.11 | % |
7-day Effective Yield* | | | 0.11 | % |
30-day Yield* | | | 0.10 | % |
Weighted Avg. Maturity | | | 37 Days | |
Standard & Poor’s Rating** | | | AAAm | |
| * | Annualized. You may call 1-800-231-4252 to obtain the Funds’ current 7-day yields. Yield is a more accurate reflection of the Funds’ current earnings than total returns. The seven-day yields refer to the income generated by an investment in the Fund over a seven-day period. This income is then annualized. The seven-day effective yield is calculated similarly, but the income earned is assumed to have been reinvested. The effective yield will be slightly higher than the current yield because of the compounding effect of this assumed reinvestment. |
| ** | Standard & Poor’s (S&P) Rating: The fund is not sponsored, endorsed, sold or promoted by S&P, and S&P makes no representation regarding the advisability of investing in the fund. The credit rating is a forward-looking opinion about a fund’s potential capacity to maintain stable principal or stable net asset value. The rating is an opinion of the date expressed and not a statement of fact or recommendation to purchase, hold or sell any security. Standard & Poor’s rates the creditworthiness of money market funds from AAAm (highest) to Dm (lowest). For more information on S&P’s rating methodology, please visit www.standardandpoors.com and select “Understanding Ratings” under Ratings Resources on the home page. |
Asset Allocation as of 12/31/14 (% of Net Assets)
| | | | |
Financial Company Commercial Paper | | | 49.9 | |
Repurchase Agreements | | | 29.6 | |
Investment Company | | | 9.1 | |
Certificate of Deposit | | | 7.5 | |
Asset-Backed Commercial Paper | | | 3.9 | |
Effective Maturity Distribution (%)
| | | | |
1 to 7 Days | | | 43.7 | |
8 to 30 Days | | | 14.1 | |
31 to 90 Days | | | 26.2 | |
91 to 120 Days | | | 16.0 | |
Credit Quality (%)
| | | | |
A-1+/P-1** | | | 78.3 | |
A-1/P-1 | | | 21.7 | |
| ** | Includes A-1 rated obligations with maturities of five business days or less. |
The credit quality ratings reflect the ratings of the securities held by the Fund, which are subject to change. A short-term obligation rated A-1 is rated in the highest category by Standard & Poor’s. The obligator’s capacity to meet its financial commitment on the obligation is strong. Within this category, certain obligations are designated with a plus sign (+). This indicates that the obligator’s capacity to meet its financial commitment on these obligations is extremely strong. A short-term obligation rated P-1 is rated in the highest category by Moody’s Investor Services. Issuers (or supporting institutions) rated Prime-1 have a superior ability to repay short-term debt obligations.
4
American Beacon U.S. Government Money Market Select FundSM
Performance Overview
December 31, 2014 (Unaudited)
After a rocky start, 2014 proved to be a good year for the U.S. economy. Positive economic momentum was evident in the release of stronger GDP reports, especially during the second and third quarters, after a negative print in the first quarter that appeared to be weather related. Equities ended the year at record levels and job growth picked up steam, causing the unemployment rate to fall to 5.6% at year-end after starting the year at 6.7%.
As we approached the end of the year the Federal Reserve Bank (the “Fed”) began prepping markets for its first tightening in eight years. The Federal Open Market Committee (the “FOMC”) members began making comments they could begin normalizing interest rates by mid-2015. The Fed did acknowledge that falling oil prices will pull inflation lower but that low oil prices would be an overall net positive for the economy. Fed Chair, Janet Yellen, did stress that liftoff remains data dependent and could happen sooner or later depending on how the economy progresses.
During the year, the American Beacon U.S. Government Money Market Select Fund’s primary strategy was to buy short-dated agencies, both fixed and variable rate, and overnight investments. The strategies implemented during the year enabled the Fund to match its Lipper peer group.
For the twelve months ended December 31, 2014, the total return of the American Beacon U.S. Government Money Market Select Fund was 0.01%. The Fund matched the Lipper Institutional U.S. Government Money Market Average return of 0.01%. Based on annualized total returns, Lipper Analytical Services ranked the Fund 74th among 169, 1st among 154 and 1st among 103 Institutional U.S. Government Money Market Funds for the one-year, five-year, and ten-year periods ended December 31, 2014, respectively.
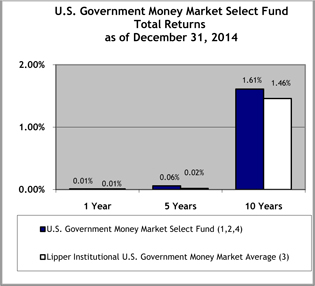
Total Returns for the Period ended 12/31/14
| | | | | | | | | | | | |
| | | 1 Year | | | 5 Years | | | 10 Years | |
U.S. Government Money Market Select Fund (1,2,4) | | | 0.01 | % | | | 0.06 | % | | | 1.61 | % |
Lipper Institutional U.S. Government Money Market Average (3) | | | 0.01 | % | | | 0.02 | % | | | 1.46 | % |
| 1. | Performance shown is historical and is not indicative of future returns. Investment returns will vary, and shares may be worth more or less at redemption than at original purchase. An investment in these Funds is neither insured nor guaranteed by the Federal Deposit Insurance Corporation or any other government agency. Although the Funds seek to preserve the value of an investment at $1.00 per share it is possible to lose money by investing in the Funds. Fund performance in the table above does not reflect the deduction of taxes a shareholder would pay on distributions or the redemption of shares. |
| 2. | A portion of the fees charged to the Fund has been waived. Performance prior to waiving fees was lower than the actual returns shown. |
| 3. | The Lipper Institutional U.S. Government Money Market Average is calculated by taking an arithmetic average of the returns of the mutual funds in the Lipper Institutional U.S. Government Money Market Funds category. Lipper is an independent mutual fund research and ranking service. |
| 4. | The total annual Fund operating expense ratio set forth in the most recent Fund prospectus was 0.14%. The expense ratio above may vary from the expense ratio presented in other sections of this report that are based on expenses incurred during the period covered by this report. |
5
American Beacon U.S. Government Money Market Select FundSM
Performance Overview
December 31, 2014 (Unaudited)
Fund Statistics as of 12/31/14
| | | | |
7-day Current Yield* | | | 0.02 | % |
7-day Effective Yield* | | | 0.02 | % |
30-day Yield* | | | 0.02 | % |
Weighted Avg. Maturity | | | 36 Days | |
Standard & Poor’s Rating** | | | AAAm | |
| * | Annualized. You may call 1-800-231-4252 to obtain the Funds’current 7-day yields. Yield is a more accurate reflection of the Funds’ current earnings than total returns. The seven-day yields refer to the income generated by an investment in the Fund over a seven-day period. This income is then annualized. The seven-day effective yield is calculated similarly, but the income earned is assumed to have been reinvested. The effective yield will be slightly higher than the current yield because of the compounding effect of this assumed reinvestment. |
| ** | Standard & Poor’s (S&P) Rating: The fund is not sponsored, endorsed, sold or promoted by S&P, and S&P makes no representation regarding the advisability of investing in the fund. The credit rating is a forward-looking opinion about a fund’s potential capacity to maintain stable principal or stable net asset value. The rating is an opinion of the date expressed and not a statement of fact or recommendation to purchase, hold or sell any security. Standard & Poor’s rates the creditworthiness of money market funds from AAAm (highest) to Dm (lowest). For more information on S&P’s rating methodology, please visit www.standardandpoors.com and select “Understanding Ratings” under Ratings Resources on the home page. |
Asset Allocation as of 12/31/14 (% of net assets)
| | | | |
Government Agency Debt | | | 63.3 | |
Government Agency Repurchase Agreements | | | 20.8 | |
Other Repurchase Agreements | | | 12.6 | |
Investment Company | | | 3.3 | |
Effective Maturity Distribution (%)
| | | | |
1 to 7 Days | | | 41.7 | |
8 to 30 Days | | | 24.2 | |
31 to 90 Days | | | 23.7 | |
91 to 397 Days | | | 10.4 | |
6
American Beacon Select FundsSM
Fund Expenses
December 31, 2014 (Unaudited)
Fund Expense Example
As a shareholder of a Fund, you incur two types of costs: (1) transaction costs and (2) ongoing costs, including management fees, administrative service fees, and other Fund expenses. The examples below are intended to help you understand the ongoing cost (in dollars) of investing in a Fund and to compare these costs with the ongoing costs of investing in other mutual funds. The examples are based on an investment of $1,000 invested at the beginning of the period and held for the entire period from July 1, 2014 through December 31, 2014.
Actual Expenses
The “Actual” lines of the table provide information about actual account values and actual expenses. You may use the information in these lines, together with the amount you invested, to estimate the expenses that you paid over the period. Simply divide your account value by $1,000 (for example, an $8,600 account value divided by $1,000 = 8.6), then multiply the result by the number in the “Actual” line under the heading “Expenses Paid During Period” for the applicable Fund to estimate the expenses you paid on your account during this period.
Hypothetical Example for Comparison Purposes
The “Hypothetical” lines of the table provide information about hypothetical account values and hypothetical expenses based on a Fund’s actual expense ratio and an assumed 5% per year rate of return before expenses (not a Fund’s actual return).
You may compare the ongoing costs of investing in a Fund with other funds by contrasting this 5% hypothetical example and the 5% hypothetical examples that appear in the shareholder reports of the other funds. The hypothetical account values and expenses may not be used to estimate the actual ending account balance or expenses you paid for the period.
You should also be aware that the expenses shown in the table highlight only your ongoing costs and do not reflect any transaction costs charged by the Funds. Similarly, the expense examples for other funds do not reflect any transaction costs charged by those funds, such as sales charges (loads), redemption fees or exchange fees. Therefore, the “Hypothetical” lines of the table are useful in comparing ongoing costs only and will not help you determine the relative total costs of owning different funds. If you were subject to any transaction costs during the period, your costs would have been higher.
| | | | | | | | | | | | |
| | | Beginning
Account
Value
7/1/14 | | | Ending
Account
Value
12/31/14 | | | Expenses paid
During Period*
7/1/14-
12/31/14 | |
Money Market | |
Actual | | $ | 1,000.00 | | | $ | 1,000.41 | | | $ | 0.66 | |
Hypothetical (5% return before expenses) | | $ | 1,000.00 | | | $ | 1,024.55 | | | $ | 0.66 | |
U.S. Government Money Market | | | | | | | | | | | | |
Actual | | $ | 1,000.00 | | | $ | 1,000.05 | | | $ | 0.55 | |
Hypothetical (5% return before expenses) | | $ | 1,000.00 | | | $ | 1,024.65 | | | $ | 0.56 | |
| * | Expenses are equal to the Fund’s annualized expense ratios for the six-month period of 0.13% and 0.11% for the Money Market Select Fund and the U.S. Government Money Market Select Fund respectively, multiplied by the average account value over the period, multiplied by the number derived by dividing the number of days in the most recent fiscal half-year (184) by days in the year (365) to reflect the half-year period. |
7
American Beacon Select FundsSM
Report of Independent Registered Public Accounting Firm
To the Shareholders and the Board of Trustees of
American Beacon Money Market Select Fund and American Beacon U.S. Government Money Market Select Fund:
We have audited the accompanying statements of assets and liabilities, including the schedules of investments, of the American Beacon Money Market Select Fund and the American Beacon U.S. Government Money Market Select Fund (two of the funds constituting the American Beacon Select Funds) (collectively, the “Funds”), as of December 31, 2014, and the related statements of operations for the year then ended, the statements of changes in net assets for each of the two years in the period then ended, and the financial highlights for each of the five years in the period then ended. These financial statements and financial highlights are the responsibility of the Funds’ management. Our responsibility is to express an opinion on these financial statements and financial highlights based on our audits.
We conducted our audits in accordance with the standards of the Public Company Accounting Oversight Board (United States). Those standards require that we plan and perform the audit to obtain reasonable assurance about whether the financial statements and financial highlights are free of material misstatement. We were not engaged to perform an audit of the Funds’ internal control over financial reporting. Our audits included consideration of internal control over financial reporting as a basis for designing audit procedures that are appropriate in the circumstances, but not for the purpose of expressing an opinion on the effectiveness of each Fund’s internal control over financial reporting. Accordingly, we express no such opinion. An audit also includes examining, on a test basis, evidence supporting the amounts and disclosures in the financial statements and financial highlights, assessing the accounting principles used and significant estimates made by management, and evaluating the overall financial statement presentation. Our procedures included confirmation of securities owned as of December 31, 2014, by correspondence with the custodian and brokers or by other appropriate auditing procedures where replies from brokers were not received. We believe that our audits provide a reasonable basis for our opinion.
In our opinion, the financial statements and financial highlights referred to above present fairly, in all material respects, the financial position of the American Beacon Money Market Select Fund and the American Beacon U.S. Government Money Market Select Fund at December 31, 2014, the results of their operations for the year then ended, the changes in their net assets for each of the two years in the period then ended, and the financial highlights for each of the five years in the period then ended, in conformity with U.S. generally accepted accounting principles.

Dallas, Texas
February 27, 2015
8
American Beacon Money Market Select FundSM
Schedule of Investments
December 31, 2014
| | | | | | | | |
| | | Par Amount | | | Fair Value | |
| | | (000’s) | | | (000’s) | |
ASSET-BACKED COMMERCIAL PAPER- 3.89% | | | | | | | | |
Kells Funding LLC, | | | | | | | | |
0.175%, Due 2/13/2015 A B | | $ | 8,000 | | | $ | 7,998 | |
0.215%, Due 4/17/2015 A B | | | 5,000 | | | | 4,997 | |
Old Line Funding LLC, | | | | | | | | |
0.175%, Due 2/6/2015 A B | | | 8,000 | | | | 7,998 | |
0.195%, Due 4/2/2015 A B | | | 7,000 | | | | 6,997 | |
| | | | | | | | |
Total Asset-Backed Commercial Paper (Cost $27,990) | | | | | | | 27,990 | |
| | | | | | | | |
CERTIFICATE OF DEPOSIT- 7.51% | | | | | | | | |
Bank of Montreal Chicago, | | | | | | | | |
0.18%, Due 2/10/2015 | | | 8,000 | | | | 8,000 | |
0.16%, Due 2/11/2015 | | | 4,000 | | | | 4,000 | |
Mizuho Bank Ltd. NY, | | | | | | | | |
0.20%, Due 2/4/2015 | | | 10,000 | | | | 10,000 | |
0.20%, Due 2/9/2015 | | | 7,000 | | | | 7,000 | |
Skandinaviska Enskilda Banken NY, 0.25%, Due 2/17/2015 | | | 10,000 | | | | 10,001 | |
Svenska Handelsbanken NY, 0.195%, Due 2/2/2015 | | | 5,000 | | | | 5,000 | |
Toronto Dominion Bank NY, 0.20%, Due 1/9/2015 | | | 10,000 | | | | 10,000 | |
| | | | | | | | |
Total Certificate of Deposit (Cost $54,001) | | | | | | | 54,001 | |
| | | | | | | | |
FINANCIAL COMPANY COMMERCIAL PAPER- 49.93% | | | | | | | | |
Australia & New Zealand Banking Group Ltd., 0.195%, Due 4/23/2015 B | | | 8,000 | | | | 7,995 | |
Bank of Montreal, 0.17%, Due 3/2/2015 | | | 10,000 | | | | 9,997 | |
Bank of Nova Scotia NY, | | | | | | | | |
0.18%, Due 1/20/2015 B | | | 5,000 | | | | 5,000 | |
0.21%, Due 4/28/2015 B | | | 5,000 | | | | 4,997 | |
Bank Tokyo-Mitsubishi UFJ NY, 0.148%, Due 1/2/2015 | | | 35,000 | | | | 34,999 | |
Caisse des Depots et Consignations, | | | | | | | | |
0.155%, Due 1/12/2015 B | | | 10,000 | | | | 9,999 | |
0.16%, Due 1/30/2015 B | | | 10,000 | | | | 9,999 | |
0.17%, Due 2/17/2015 B | | | 5,506 | | | | 5,505 | |
Canadian Imperial Holdings, Inc., 0.22%, Due 5/1/2015 | | | 5,000 | | | | 4,996 | |
Coca-Cola Co., | | | | | | | | |
0.21%, Due 2/23/2015 B | | | 10,000 | | | | 9,997 | |
0.18%, Due 4/27/2015 B | | | 5,000 | | | | 4,997 | |
0.20%, Due 5/13/2015 B | | | 5,000 | | | | 4,996 | |
Commonwealth Bank of Australia, 0.18%, Due 3/16/2015 B | | | 10,000 | | | | 9,996 | |
DNB Bank ASA, | | | | | | | | |
0.18%, Due 1/5/2015 B | | | 8,710 | | | | 8,710 | |
0.19%, Due 2/6/2015 B | | | 7,000 | | | | 6,999 | |
0.20%, Due 3/20/2015 B | | | 5,000 | | | | 4,998 | |
0.20%, Due 4/28/2015 B | | | 5,600 | | | | 5,596 | |
Erste Abwicklungsanstalt, | | | | | | | | |
0.17%, Due 1/23/2015 B | | | 5,000 | | | | 4,999 | |
0.175%, Due 2/25/2015 B | | | 10,000 | | | | 9,997 | |
General Electric Capital Corp., | | | | | | | | |
0.18%, Due 3/18/2015 | | | 5,000 | | | | 4,998 | |
0.20%, Due 4/17/2015 | | | 5,000 | | | | 4,997 | |
0.20%, Due 5/15/2015 | | | 5,000 | | | | 4,996 | |
Mizuho Funding LLC, 0.183%, Due 1/6/2015 A B | | | 13,270 | | | | 13,269 | |
National Australia Bank Ltd., 0.22%, Due 4/16/2015 B | | | 10,000 | | | | 9,994 | |
Nestle Capital Corp., | | | | | | | | |
0.18%, Due 2/18/2015 B | | | 5,000 | | | | 4,999 | |
0.21%, Due 7/2/2015 B | | | 5,000 | | | | 4,995 | |
0.235%, Due 7/13/2015 B | | | 5,000 | | | | 4,994 | |
Nordea Bank AB, | | | | | | | | |
0.18%, Due 1/15/2015 B | | | 5,000 | | | | 5,000 | |
0.175%, Due 3/3/2015 B | | | 5,000 | | | | 4,999 | |
See accompanying notes
9
American Beacon Money Market Select FundSM
Schedule of Investments
December 31, 2014
| | | | | | | | |
| | | Par Amount | | | Fair Value | |
| | | (000’s) | | | (000’s) | |
0.225%, Due 4/14/2015 B | | $ | 5,000 | | | $ | 4,997 | |
Oversea-Chinese Banking Corp Ltd., 0.175%, Due 2/17/2015 | | | 5,000 | | | | 4,999 | |
Rabobank USA Financial Co., 0.175%, Due 2/13/2015 | | | 8,000 | | | | 7,998 | |
Skandinaviska Enskilda Banken AB, | | | | | | | | |
0.20%, Due 1/16/2015 B | | | 5,000 | | | | 5,000 | |
0.205%, Due 2/3/2015 B | | | 5,000 | | | | 4,999 | |
Sumitomo Mitsui Banking Corp., | | | | | | | | |
0.175%, Due 1/2/2015 B | | | 10,000 | | | | 9,999 | |
0.205%, Due 1/5/2015 B | | | 5,000 | | | | 5,000 | |
0.205%, Due 1/26/2015 B | | | 5,000 | | | | 4,999 | |
0.205%, Due 2/3/2015 B | | | 5,000 | | | | 4,999 | |
0.215%, Due 2/23/2015 B | | | 10,000 | | | | 9,997 | |
Svenska Handelsbanken AB, 0.20%, Due 3/19/2015 B | | | 8,000 | | | | 7,997 | |
Toronto Dominion Holdings (USA) Inc., | | | | | | | | |
0.17%, Due 3/4/2015 B | | | 5,000 | | | | 4,999 | |
0.18%, Due 3/23/2015 B | | | 10,000 | | | | 9,996 | |
0.20%, Due 5/4/2015 B | | | 5,000 | | | | 4,997 | |
0.22%, Due 5/26/2015 B | | | 5,000 | | | | 4,996 | |
Toyota Motor Credit Corp., | | | | | | | | |
0.20%, Due 1/30/2015 | | | 10,000 | | | | 9,998 | |
0.20%, Due 4/15/2015 | | | 10,000 | | | | 9,994 | |
0.23%, Due 5/29/2015 | | | 10,000 | | | | 9,991 | |
Westpac Banking Corp., 0.23%, Due 5/27/2015 B | | | 5,000 | | | | 4,995 | |
| | | | | | | | |
Total Financial Company Commercial Paper (Cost $358,963) | | | | | | | 358,963 | |
| | | | | | | | |
| | |
| | | Shares | | | | |
INVESTMENT COMPANIES—9.06% | | | | | | | | |
Blackrock Cash Fund, Prime Class | | | 33,180,511 | | | | 33,181 | |
State Street Institutional Liquidity Reserves Fund, Institutional Class | | | 32,000,000 | | | | 32,000 | |
| | | | | | | | |
Total Investment Companies (Cost $65,181) | | | | | | | 65,181 | |
| | | | | | | | |
| | |
| | | Par Amount | | | | |
REPURCHASE AGREEMENTS—29.62% | | | | | | | | |
Barclays Capital, Inc., 0.25%, Acquired on 12/31/14, Due 1/2/2015, at $35,000 (Held at Bank of New York Mellon, Collateralized by Corporate Obligations valued at $37,926, 0.34%—11.00%, 1/25/2016 – 12/31/2099) | | $ | 35,000 | | | | 35,000 | |
BNP Paribas Securities Corp., 0.29%, Acquired on 12/31/2014, Due 1/2/2015, at $35,000 (Held at Bank of New York Mellon, Collateralized by Corporate Obligations valued at $38,500, 3.50%—8.75%, 8/15/2015 – 5/1/2025) | | | 35,000 | | | | 35,000 | |
JP Morgan Clearing Corp., 0.32%, Acquired on 12/26/2014, Due 1/8/2015, $36,000 (Held at JP Morgan Chase, Collateralized by Corporate Obligations valued at $37,806, 0.00%—11.25%, 11/15/2016 – 4/1/2037)C | | | 36,000 | | | | 36,000 | |
Merrill Lynch, Pierce, Fenner & Smith, Inc., 0.20%, Acquired on 12/31/2014, Due 1/2/2015, at $35,000 (Held at Bank of New York Mellon, Collateralized by Equity Securities valued at $38,500) | | | 35,000 | | | | 35,000 | |
RBC Capital Markets LLC, 0.28%, Acquired on 12/26/2014, Due 1/2/2015, at $37,000 (Held at Bank of New York Mellon, Collateralized by Corporate Obligations valued at $38,850, 3.375%—14.00%, 5/1/2016 – 2/15/2067)A | | | 37,000 | | | | 37,000 | |
Wells Fargo Securities LLC, 0.20%, Acquired on 12/31/2014, Due 1/2/2015, at $35,000 (Held at Bank of New York Mellon, Collateralized by Corporate Obligations valued at $36,750, 0.00%—15.00%, 1/15/2015 – 11/1/2111)A | | | 35,000 | | | | 35,000 | |
| | | | | | | | |
Total Repurchase Agreements (Cost $213,000) | | | | | | | 213,000 | |
| | | | | | | | |
TOTAL INVESTMENTS —100.01% (Cost $719,135) | | | | | | $ | 719,135 | |
LIABILITIES, NET OF OTHER ASSETS—(0.01%) | | | | | | | (89 | ) |
| | | | | | | | |
TOTAL NET ASSETS—100.00% | | | | | | $ | 719,046 | |
| | | | | | | | |
| | |
Percentages are stated as a percent of net assets. | | | | | | | | |
See accompanying notes
10
American Beacon Money Market Select FundSM
Schedule of Investments
December 31, 2014
All rates represent either the annualized yield at the date of purchase, or the stated coupon rate, or, for floating and adjustable rate securities, the rate at period end.
| A | LLC - Limited Liability Company. |
| B | Security exempt from registration under the Securities Act of 1933. These securities may be resold to qualified institutional buyers pursuant to Rule 144A. At the period end, the value of these securities amounted to $278,990 or 38.80% of net assets. The Fund has no right to demand registration of these securities. |
| C | Illiquid. At the period end, the amount of illiquid securities was $36,000 or 5.00% of net assets. |
See accompanying notes
11
American Beacon U.S. Government Money Market Select FundSM
Schedule of Investments
December 31, 2014
| | | | | | | | |
| | | Par Amount | | | Fair Value | |
| | | (000’s) | | | (000’s) | |
U.S. GOVERNMENT AGENCY OBLIGATIONS- 63.31% | | | | | | | | |
Federal Farm Credit Bank, | | | | | | | | |
0.13%, Due 2/9/2015 A | | $ | 10,000 | | | $ | 10,000 | |
0.27%, Due 5/5/2015 A | | | 5,000 | | | | 5,002 | |
0.185%, Due 6/22/2015 A | | | 10,000 | | | | 10,002 | |
0.192%, Due 9/18/2015 A | | | 5,000 | | | | 5,003 | |
0.220%, Due 10/26/2015 A | | | 5,000 | | | | 5,003 | |
Federal Home Loan Bank, | | | | | | | | |
0.14%, Due 2/18/2015 | | | 15,000 | | | | 15,000 | |
0.09%, Due 2/19/2015 | | | 5,000 | | | | 5,000 | |
0.25%, Due 2/20/2015 | | | 5,000 | | | | 5,001 | |
0.11%, Due 2/27/2015 A | | | 5,000 | | | | 5,000 | |
0.10%, Due 3/6/2015 | | | 5,000 | | | | 5,000 | |
0.12%, Due 3/6/2015 | | | 4,600 | | | | 4,599 | |
0.16%, Due 3/11/2015 | | | 5,000 | | | | 5,000 | |
0.16%, Due 3/12/2015 | | | 5,000 | | | | 5,000 | |
0.125%, Due 3/20/2015 | | | 5,000 | | | | 5,000 | |
0.13%, Due 3/27/2015 | | | 2,700 | | | | 2,699 | |
0.125%, Due 4/1/2015 | | | 5,000 | | | | 4,999 | |
0.125%, Due 4/14/2015 | | | 3,000 | | | | 3,000 | |
0.106%, Due 5/12/2015 A | | | 10,000 | | | | 10,000 | |
0.18%, Due 7/16/2015 | | | 5,000 | | | | 5,001 | |
0.17%, Due 7/23/2015 | | | 5,000 | | | | 5,001 | |
0.10%, Due 7/24/2015 | | | 5,000 | | | | 4,999 | |
0.127%, Due 8/10/2015 A | | | 10,000 | | | | 10,000 | |
0.119%, Due 10/16/2015 A | | | 5,000 | | | | 5,000 | |
Federal Home Loan Mortgage Corp., | | | | | | | | |
0.16%, Due 3/19/2015 | | | 5,300 | | | | 5,298 | |
0.12%, Due 3/25/2015 | | | 4,000 | | | | 3,999 | |
0.12%, Due 4/1/2015 | | | 3,100 | | | | 3,099 | |
0.160%, Due 6/26/2015 A | | | 10,000 | | | | 10,000 | |
0.151%, Due 7/16/2015 A | | | 5,000 | | | | 5,001 | |
0.141%, Due 10/16/2015 A | | | 8,000 | | | | 8,002 | |
Federal National Mortgage Association, | | | | | | | | |
0.16%, Due 3/4/2015 | | | 5,000 | | | | 4,999 | |
0.375%, Due 3/16/2015 | | | 5,000 | | | | 5,002 | |
0.12%, Due 4/13/2015 | | | 2,900 | | | | 2,899 | |
0.11%, Due 4/27/2015 | | | 2,370 | | | | 2,369 | |
| | | | | | | | |
Total U.S. Government Agency Obligations (Cost $190,977) | | | | | | | 190,977 | |
| | | | | | | | |
| | |
| | | Shares | | | | |
INVESTMENT COMPANIES—3.31% (Cost $10,000) | | | | | | | | |
Morgan Stanley Government Portfolio, Institutional Class | | | 10,000,000 | | | | 10,000 | |
| | | | | | | | |
| | |
| | | Par Amount | | | | |
GOVERNMENT AGENCY REPURCHASE AGREEMENTS – 20.79% | | | | | | | | |
Goldman Sachs & Co., 0.08%, Acquired on 12/31/2014, Due 1/2/2015, at $42,729 (Held at Bank of New York Mellon, Collateralized by U.S. Treasury Obligations valued at $43,583, 0.00%, 2/15/2029 – 2/15/2044) | | $ | 42,729 | | | | 42,729 | |
RBC Capital Markets LLC, 0.10%, Acquired on 12/31/2014, Due 1/2/2015, at $10,000 (Held at Bank of New York Mellon, Collateralized by U.S. Government Agency Obligations valued at $10,200, 1.989%—4.50%, 9/1/2026 – 12/20/2044)B | | | 10,000 | | | | 10,000 | |
RBC Capital Markets LLC, 0.08%, Acquired on 12/1/2014, Due 1/2/2015, at $10,000 (Held at Bank of New York Mellon, Collateralized by U.S. Government Agency Obligations valued at $10,200, 2.50%—4.00%, 11/1/2027 – 12/20/2044)BB | | | 10,000 | | | | 10,000 | |
| | | | | | | | |
Total Government Agency Repurchase Agreements (Cost $62,729) | | | | | | | 62,729 | |
| | | | | | | | |
See accompanying notes
12
American Beacon U.S. Government Money Market Select FundSM
Schedule of Investments
December 31, 2014
| | | | | | | | |
| | | Par Amount | | | Fair Value | |
| | | (000’s) | | | (000’s) | |
OTHER REPURCHASE AGREEMENTS – 12.60% | | | | | | | | |
Barclays Capital, Inc., 0.25%, Acquired on 12/31/2014, Due 1/2/2015, at $12,000 (Held at Bank of New York Mellon, Collateralized by Corporate Obligations valued at $12,962, 0.34%—10.75%, 1/25/2016 – 12/31/2099) | | $ | 12,000 | | | $ | 12,000 | |
BNP Paribas Securities Corp., 0.29%, Acquired on 12/31/2014, Due 1/2/2015, at $13,000 (Held at Bank of New York Mellon, Collateralized by Corporate Obligations valued at $14,300, 2.575%—11.00%, 10/15/2017 – 10/15/2022) | | | 13,000 | | | | 13,000 | |
Merrill Lynch, Pierce, Fenner & Smith, Inc., 0.20%, Acquired on 12/31/2014, Due 1/2/2015, at $13,000 (Held at Bank of New York Mellon, Collateralized by Equity Securities valued at $14,300) | | | 13,000 | | | | 13,000 | |
| | | | | | | | |
Total Other Repurchase Agreements (Cost $38,000) | | | | | | | 38,000 | |
| | | | | | | | |
TOTAL INVESTMENTS —100.01% (Cost $301,706) | | | | | | | 301,706 | |
LIABILITIES, NET OF OTHER ASSETS—(0.01%) | | | | | | | (31 | ) |
| | | | | | | | |
TOTAL NET ASSETS—100.00% | | | | | | $ | 301,675 | |
| | | | | | | | |
Percentages are stated as a percent of net assets.
All rates represent either the annualized yield at the date of purchase, or the stated coupon rate, or, for floating and adjustable rate securities, the rate at period end.
| B | LLC - Limited Liability Company. |
See accompanying notes
13
American Beacon Select FundsSM
Statements of Assets and Liabilities
December 31, 2014 (in thousands, except share and per share amounts)
| | | | | | | | |
| | | Money Market
Select Fund | | | U.S. Government
Money Market
Select Fund | |
Assets: | | | | | | | | |
Investments in securities, at fair value A | | $ | 506,135 | | | $ | 200,977 | |
Repurchase agreements, at fair value B | | | 213,000 | | | | 100,729 | |
Dividends and interest receivable | | | 39 | | | | 45 | |
Receivable for fund shares sold | | | 1 | | | | — | |
Prepaid expenses | | | 8 | | | | 6 | |
| | | | | | | | |
Total assets | | | 719,183 | | | | 301,757 | |
| | | | | | | | |
Liabilities: | | | | | | | | |
Payable for fund shares redeemed | | | 10 | | | | — | |
Payable under excess expense reimbursement plan (Note 2) | | �� | — | | | | 2 | |
Dividends payable | | | — | | | | 4 | |
Management and investment advisory fees payable | | | 60 | | | | 26 | |
Administrative service and service fees payable | | | 7 | | | | 3 | |
Transfer agent fees payable | | | 4 | | | | 3 | |
Custody and fund accounting fees payable | | | 10 | | | | 6 | |
Professional fees payable | | | 18 | | | | 19 | |
Trustee fees payable | | | 8 | | | | 4 | |
Payable for prospectus and shareholder reports | | | 1 | | | | 5 | |
Dues and subscriptions payable | | | 19 | | | | 10 | |
| | | | | | | | |
Total liabilities | | | 137 | | | | 82 | |
| | | | | | | | |
Net Assets | | $ | 719,046 | | | $ | 301,675 | |
| | | | | | | | |
Analysis of Net Assets: | | | | | | | | |
Paid-in-capital | | | 719,045 | | | | 301,675 | |
Undistributed (or overdistribution of) net investment income | | | 1 | | | | — | |
| | | | | | | | |
Net assets | | $ | 719,046 | | | $ | 301,675 | |
| | | | | | | | |
Shares outstanding at no par value (unlimited shares authorized) | | | 719,045,858 | | | | 301,674,869 | |
Net Assets (not in thousands) | | $ | 719,045,858 | | | $ | 301,674,873 | |
Net asset value, offering and redemption price per share | | $ | 1.00 | | | $ | 1.00 | |
A Cost of investments in unaffiliated securities | | $ | 506,135 | | | $ | 200,977 | |
B Cost of repurchase agreements | | $ | 213,000 | | | $ | 100,729 | |
See accompanying notes
14
American Beacon Select FundsSM
Statements of Operations
For the year ended December 31, 2014 (in thousands)
| | | | | | | | |
| | | Money
Market
Select Fund | | | U.S.
Government
Money
Market
Select Fund | |
Investment Income: | | | | | | | | |
Dividend income from unaffiliated securities | | $ | 128 | | | $ | 12 | |
Interest income | | | 1,482 | | | | 484 | |
| | | | | | | | |
Total investment income | | | 1,610 | | | | 496 | |
| | | | | | | | |
Expenses: | | | | | | | | |
Management and investment advisory fees (Note 2) | | | 700 | | | | 367 | |
Administrative service fees (Note 2) | | | 78 | | | | 41 | |
Transfer agent fees | | | 18 | | | | 21 | |
Custodian fees | | | 76 | | | | 40 | |
Professional fees | | | 44 | | | | 38 | |
Registration fees and expenses | | | 1 | | | | 1 | |
Prospectus and shareholder report expenses | | | 14 | | | | 6 | |
Trustee fees | | | 40 | | | | 19 | |
Insurance fees | | | 14 | | | | 8 | |
Dues and subscriptions expense | | | 17 | | | | 11 | |
| | | | | | | | |
Total expenses | | | 1,002 | | | | 552 | |
| | | | | | | | |
Net fees waived and expenses reimbursed (Note 2) | | | — | | | | (99 | ) |
| | | | | | | | |
Net expenses | | | 1,002 | | | | 453 | |
| | | | | | | | |
Net investment income | | | 608 | | | | 43 | |
| | | | | | | | |
Realized Gains: | | | | | | | | |
Net realized gain (loss) from: | | | | | | | | |
Investments | | | 8 | | | | — | |
| | | | | | | | |
Net gain from investments | | | 8 | | | | — | |
| | | | | | | | |
Net increase in net assets resulting from operations | | $ | 616 | | | $ | 43 | |
| | | | | | | | |
See accompanying notes
15
American Beacon Select FundsSM
Statements of Changes in Net Assets (in thousands)
| | | | | | | | | | | | | | | | |
| | | Money Market Select Fund | | | U.S. Government Money Market
Select Fund | |
| | | Year Ended
December 31,
2014 | | | Year Ended
December 31,
2013 | | | Year Ended
December 31,
2014 | | | Year Ended
December 31,
2013 | |
Increase (Decrease) in Net Assets: | | | | | | | | | | | | | | | | |
Operations: | | | | | | | | | | | | | | | | |
Net investment income | | $ | 608 | | | $ | 855 | | | $ | 43 | | | $ | $86 | |
Net realized gain from investments | | | 8 | | | | 8 | | | | — | | | | — | |
| | | | | | | | | | | | | | | | |
Net increase in net assets resulting from operations | | | 616 | | | | 863 | | | | 43 | | | | 86 | |
| | | | | | | | | | | | | | | | |
Distributions to Shareholders: | | | | | | | | | | | | | | | | |
Net investment income | | | (608 | ) | | | (855 | ) | | | (43 | ) | | | (86 | ) |
Net realized gain | | | (8 | ) | | | (8 | ) | | | — | | | | — | |
| | | | | | | | | | | | | | | | |
Net distributions to shareholders | | | (616 | ) | | | (863 | ) | | | (43 | ) | | | (86 | ) |
| | | | | | | | | | | | | | | | |
Capital Share Transactions: | | | | | | | | | | | | | | | | |
Proceeds from sales of shares | | | 332,391 | | | | 246,240 | | | | 2,249,995 | | | | 2,056,158 | |
Reinvestment of dividends and distributions | | | 609 | | | | 831 | | | | 5 | | | | 15 | |
Cost of shares redeemed | | | (407,362 | ) | | | (214,166 | ) | | | (2,316,026 | ) | | | (1,926,708 | ) |
| | | | | | | | | | | | | | | | |
Net increase (decrease) in net assets from capital share transactions | | | (74,362 | ) | | | 32,905 | | | | (66,026 | ) | | | 129,465 | |
| | | | | | | | | | | | | | | | |
Net increase (decrease) in net assets | | | (74,362 | ) | | | 32,905 | | | | (66,026 | ) | | | 129,465 | |
| | | | | | | | | | | | | | | | |
Net Assets: | | | | | | | | | | | | | | | | |
Beginning of period | | | 793,408 | | | | 760,503 | | | | 367,701 | | | | 238,236 | |
| | | | | | | | | | | | | | | | |
End of Period * | | $ | 719,046 | | | $ | 793,408 | | | $ | 301,675 | | | $ | 367,701 | |
| | | | | | | | | | | | | | | | |
* Includes undistributed (or overdistribution of) net investment income | | $ | 1 | | | $ | 1 | | | $ | — | | | $ | — | |
| | | | | | | | | | | | | | | | |
See accompanying notes
16
American Beacon Select FundsSM
Notes to Financial Statements
December 31, 2014
1. Organization and Significant Accounting Policies
American Beacon Select Funds (the “Trust”), which is comprised of two Funds, is organized as a Massachusetts business trust and is registered under the Investment Company Act of 1940, as amended (the “Act”), as a diversified, open-end management investment company. These financial statements and notes to the financial statements relate to the American Beacon Money Market Select Fund (the “Money Market Fund”) and American Beacon U.S. Government Money Market Select Fund (the “Government Fund”) (each a “Fund” and collectively, the “Funds”), each a series of the Trust.
American Beacon Advisors, Inc. (the “Manager”) is a wholly-owned subsidiary of Lighthouse Holdings, Inc., and was organized in 1986 to provide business management, advisory, administrative and asset management consulting services to the Trust and other investors.
New Accounting Pronouncements
In June 2013, the Financial Accounting Standards Board (“FASB”) issued Accounting Standards Update (“ASU”) No. 2013-08, “Financial Services – Investment Companies (Topic 946): Amendments to the Scope, Measurement, and Disclosure Requirements,” which amends the criteria that define an investment company and clarifies the measurement guidance and requires new disclosures for investment companies. Under the ASU, an entity that is registered under the Investment Company Act of 1940 automatically qualifies as an investment company. The ASU was effective for the periods ending after December 31, 2013. Management has evaluated the implications of the ASU and determined that adoption thereof will not have a material impact on the financial statements.
2. Transactions with Affiliates
Management Agreement
The Trust and the Manager are parties to a Management Agreement that obligates the Manager to provide or oversee the provisions of all investment advisory and portfolio management services. The Manager serves as the sole investment advisor to the Funds. As compensation for performing the duties required under the Management Agreement, the Manager receives 0.09% of the average daily net assets of the Funds.
Administrative Services Agreement
The Manager and the Trust entered into an Administrative Services Agreement which obligates the Manager to provide or oversee administrative services to the Funds. As compensation for performing the duties required under the Administrative Services Agreement, the Manager receives an annualized fee of 0.01% of the average daily net assets of the Funds.
Expense Reimbursement Plan
The Manager voluntarily agreed to reimburse the Government Fund for certain expenses. During the year ended December 31, 2014, the Manager reimbursed expenses totaling $99,486. At December 31, 2014, $2,135 was payable to the Manager for the Government Fund.
The Funds have adopted an Expense Reimbursement Plan whereby the Manager may seek repayment of expenses reimbursed for a period of up to three years. However, reimbursement will occur only if a Fund’s average net assets have grown or expenses have declined sufficiently to allow reimbursement without causing its expense ratio to exceed the previously agreed upon contractual expense limit.
The carryover of excess expenses potentially reimbursable to the Manager, but not recorded as a liability for the Government Fund is $8,810 and $49,521, expiring in 2015 and 2016, respectively. The
17
American Beacon Select FundsSM
Notes to Financial Statements
December 31, 2014
Government Fund did not record a liability for these potential reimbursements due to the current assessment that a reimbursement for the year ended December 31, 2014, is unlikely.
3. Security Valuation and Fair Value Measurements
Each Fund values its investments and computes the net asset value per share each day that the New York Stock Exchange is open for business. In accordance with Rule 2a-7 under the Act, money market securities are valued at amortized cost, which approximates fair value. Securities for which amortized cost is deemed not to reflect fair value are stated at fair value as determined in good faith by the Valuation Committee, established by the Trust’s Board of Trustees (the “Board”). In the event that a deviation of 1/2 of 1% or more exists between the $1.00 per share price of a Fund, calculated at amortized cost, and the price per share calculated by reference to market quotations, or if there is any other deviation that the Board believes would result in a material dilution to shareholders or purchasers, the Board will promptly consider the appropriate action that should be initiated.
Valuation Inputs
Various inputs may be used to determine the fair value of the Funds’ investments. These inputs are summarized in three broad levels for financial statement purposes.
| | | | |
| | Level 1 - | | Quoted prices in active markets for identical securities. |
| | |
| | Level 2 - | | Prices determined using other significant observable inputs. These may include quoted prices for similar securities, interest rates, prepayment speeds, credit risk, and others. Level 2 securities are fixed income securities that are valued using observable inputs as stated above. |
| | |
| | Level 3 - | | Prices determined using other significant unobservable inputs. Unobservable inputs reflect the Fund’s own assumptions about the factors market participants would use in pricing an investment, and would be based on the best information available. |
Observable inputs are those based on market data obtained from sources independent of the fund, and unobservable inputs reflect the fund’s own assumptions based on the best information available. The input levels are not necessarily an indication of the risk or liquidity associated with financial instruments at that level. For example, securities held by a money market fund are generally high quality and liquid; however, they are reflected as Level 2 because the inputs used to determine fair value are not quoted prices in an active market.
The Funds’ investments are summarized by level based on the inputs used to determine their values. U.S. Generally Accepted Accounting Principles (“U.S. GAAP”) also requires all transfer between levels to be disclosed. The end of period timing recognition has been adopted for the transfer between levels of the Funds’ asset and liabilities. During the year ended December 31, 2014, there were no transfers between levels. As of December 31, 2014, the investments were classified as described below (in thousands):
| | | | | | | | | | | | | | | | |
Money Market Fund | | Level 1 | | | Level 2 | | | Level 3 | | | Total | |
Asset-Backed Commercial Paper | | $ | — | | | $ | 27,990 | | | $ | — | | | $ | 27,990 | |
Certificate of Deposit | | | | | | | 54,001 | | | | | | | | 54,001 | |
Financial Company Commercial Paper | | | — | | | | 358,963 | | | | — | | | | 358,963 | |
Investment Companies – Money Market Funds | | | 65,181 | | | | — | | | | | | | | 65,181 | |
Repurchase Agreements | | | — | | | | 213,000 | | | | — | | | | 213,000 | |
| | | | | | | | | | | | | | | | |
Total Investments in Securities | | $ | 65,181 | | | $ | 653,954 | | | $ | — | | | $ | 719,135 | |
| | | | | | | | | | | | | | | | |
| | | | |
Government Fund | | Level 1 | | | Level 2 | | | Level 3 | | | Total | |
U.S. Government Agency Obligations | | $ | — | | | $ | 190,977 | | | $ | — | | | $ | 190,977 | |
Investment Companies – Money Market Funds | | | 10,000 | | | | — | | | | | | | | 10,000 | |
Government Agency Repurchase Agreements | | | — | | | | 62,729 | | | | — | | | | 62,729 | |
Other Repurchase Agreements | | | — | | | | 38,000 | | | | — | | | | 38,000 | |
| | | | | | | | | | | | | | | | |
Total Investments in Securities | | $ | 10,000 | | | $ | 291,706 | | | $ | — | | | $ | 301,706 | |
| | | | | | | | | | | | | | | | |
18
American Beacon Select FundsSM
Notes to Financial Statements
December 31, 2014
Security Transactions and Investment Income
Security transactions for the Funds are recorded on the trade date of the security purchase or sale.
Interest income for the Funds is earned from settlement date, recorded on an accrual basis, and adjusted, if necessary, for amortization of premiums or accretion of discounts on investment grade short-term securities and zero coupon instruments. For financial and tax reporting purposes, realized gains and losses are determined on the basis of specific lot identification.
Dividends to Shareholders
Dividends from net investment income and net short-term capital gain, if any, will be declared and paid monthly. Dividends to shareholders are determined in accordance with federal income tax principles that may treat certain transactions differently than U.S. GAAP.
Use of Estimates
The preparation of financial statements in conformity with U.S. GAAP requires management to make estimates and assumptions that affect the amounts reported in the financial statements and accompanying notes. Actual results may differ from those estimated.
Other
Under the Trust’s organizational documents, its officers and trustees are indemnified against certain liability arising out of the performance of their duties to the Trust. In the normal course of business, the Trust enters into contracts that provide indemnification to the other party or parties against potential costs or liabilities. The Trust’s maximum exposure under these arrangements is dependent on claims that may be made in the future and, therefore, cannot be estimated. The Trust has had no prior claims or losses pursuant to any such agreement.
4. Securities and Other Investments
Repurchase Agreements
A repurchase agreement is a fixed income security in the form of an agreement between a Fund as purchaser and an approved counterparty as seller. The agreement is backed by collateral in the form of securities and/or cash transferred by the seller to the buyer to be held by an eligible third-party custodian. Under the agreement a Fund acquires securities from the seller and the seller simultaneously commits to repurchase the securities at an agreed upon price and date, normally within a week. The price for the seller to repurchase the securities is greater than a Fund’s purchase price, reflecting an agreed upon “interest rate” that is effective for the period of time the purchaser’s money is invested in the security. During the term of the repurchase agreement, a Fund monitors on a daily basis the market value of the collateral subject to the agreement and, if the market value of the securities falls below the seller’s repurchase amount provided under the repurchase agreement, the seller is required to transfer additional securities or cash collateral equal to the amount by which the market value of the securities falls below the repurchase amount. Repurchase agreements may exhibit the economic characteristics of loans by a Fund.
The obligation of the seller under the repurchase agreement is not guaranteed, and there is a risk that the seller may fail to repurchase the underlying securities, whether because of the seller’s bankruptcy or otherwise. In such event, a Fund would attempt to exercise its rights with respect to the underlying collateral, including possible sale of the securities. A Fund may incur various expenses in the connection with the exercise of its rights and may be subject to various delays and risks of loss, including (a) possible declines in the value
19
American Beacon Select FundsSM
Notes to Financial Statements
December 31, 2014
of the underlying collateral, (b) possible reduction in levels of income and (c) lack of access to the collateral held through a third-party custodian and possible inability to enforce the Fund’s rights. The Board has established procedures pursuant to which the Manager monitors the creditworthiness of the counterparties with which the Fund enters into repurchase agreement transactions.
The Funds may enter into repurchase agreements with member banks of the Federal Reserve System or registered broker-dealers who, in the opinion of the Manager, present a minimal risk of default during the term of the agreement. The underlying securities which serve as collateral for repurchase agreements may include fixed income and equity securities such as U.S. Government and agency securities, municipal obligations, corporate obligations, asset-backed securities, mortgage-backed securities, common and preferred stock, American Depository Receipts, exchange-traded funds and convertible securities. There is no percentage restriction on each Fund’s ability to enter into repurchase agreements with terms of seven days or less.
As of December 31, 2014, the following funds had investments in repurchase agreement with a gross value as disclosed in the Schedule of Investments and the Statement of Assets and Liabilities:
| | | | |
Fund | | Total | |
Money Market Fund | | $ | 213,000 | |
Government Fund | | | 100,729 | |
The value of the related collateral disclosed on the Schedules of Investments exceeded the value of the repurchase agreements at period end.
Restricted Securities
Certain Funds may invest in securities that are subject to legal or contractual restrictions on resale. These securities may be sold privately, but are required to be registered or exempted from such registration before being sold to the public. Private placement securities are generally considered to be restricted except for those securities traded between qualified institutional investors under the provisions of Rule 144A of the Securities Act of 1933. Disposal of restricted securities may involve time-consuming negotiations and expenses, and prompt sale at an acceptable price may be difficult to achieve. Restricted securities outstanding at the period ended December 31, 2014 are disclosed in the Notes to the Schedules of Investments.
5. Federal Income Taxes
It is the policy of each Fund to qualify as a regulated investment company (“RIC”), by complying with all applicable provisions of Subchapter M of the Internal Revenue Code, as amended, and to make distribution of taxable income sufficient to relieve it from substantially all federal income and excise taxes. For federal income tax purposes, each Fund is treated as a single entity for the purpose of determining such qualification.
The Funds do not have any unrecognized tax benefits in the accompanying financial statements. Each of the tax years in the four year period ended December 31, 2014 remains subject to examination by the Internal Revenue Service. If applicable, the Funds recognize interest accrued related to unrecognized tax benefits in interest expense and penalties in “Other expense” on the Statements of Operations.
Dividends are categorized in accordance with income tax regulations which may treat certain transactions differently than U.S. GAAP. Accordingly, the character of distributions and composition of net assets for tax purposes may differ from those reflected in the accompanying financial statements.
The tax character of distributions paid were as follows (in thousands):
20
American Beacon Select FundsSM
Notes to Financial Statements
December 31, 2014
| | | | | | | | | | | | | | | | |
| | | Money Market Fund | | | Government Fund | |
| | | Year Ended
December 31,2014 | | | Year Ended
December 31,2013 | | | Year Ended
December 31,2014 | | | Year Ended
December 31,2013 | |
Distributions paid from: | | | | | | | | | | | | | | | | |
Ordinary income* | | $ | 616 | | | $ | 863 | | | $ | 43 | | | $ | 86 | |
| | | | | | | | | | | | | | | | |
Total distributions paid | | $ | 616 | | | $ | 863 | | | $ | 43 | | | $ | 86 | |
| | | | | | | | | | | | | | | | |
| * | For tax purposes short-term capital gains distributions are considered ordinary income distributions. |
As of December 31, 2014, the components of distributable earnings or (deficits) on a tax basis were as follows (in thousands):
| | | | | | | | |
| | | Money Market
Fund | | | Government
Fund | |
Cost basis of investments for federal income tax purposes | | $ | 719,135 | | | $ | 301,706 | |
Unrealized appreciation | | | — | | | | — | |
Unrealized depreciation | | | — | | | | — | |
| | | | | | | | |
Net unrealized appreciation or (depreciation) | | | — | | | | — | |
Undistributed ordinary income | | | 1 | | | | — | |
Accumulated long-term gain or (loss) | | | — | | | | — | |
Other temporary differences | | | — | | | | — | |
| | | | | | | | |
Distributable earnings or (deficits) | | $ | 1 | | | $ | — | |
| | | | | | | | |
Under the Regulated Investment Company Modernization Act of 2010 (the “RIC MOD”), net capital losses recognized by Funds in taxable years beginning after December 22, 2010 are carried forward indefinitely and retain their character as short-term and/or long-term losses. Prior to RIC MOD, net capital losses incurred by the Funds were carried forward for eight years and treated as short-term losses. RIC MOD requires that post-enactment net capital losses be used before pre-enactment net capital losses.
For the year ended December 31, 2014 the Funds did not have capital loss carryforwards.
6. Principal Risks
In the normal course of business the Funds trade financial instruments and enter into financial transactions where risk of potential loss exists. Security values fluctuate (market risk) and may decline due to factors affecting securities markets in general, particular industries represented in the securities markets or conditions specifically related to a particular company. Failure of the other party to a transaction to perform (credit and counterparty risk), for example by not making principal and interest payments when due, reduces the value of the issuer’s debt and could reduce the Funds’ income. Similar to credit risk, the Funds may be exposed to counterparty risk, or the risk that an institution or other entity with which the Funds have unsettled or open transactions will fail to make required payments or otherwise comply with the terms of the instrument, transaction or contract. The potential loss could exceed the value of the financial assets recorded in the financial statements. Some of the Funds’ investments may be illiquid and the Funds may not be able to vary the portfolio investments in response to changes in economic and other conditions. If a Fund is required to liquidate all or a portion of its investments quickly, the Fund may realize significantly less than the value at which it previously recorded those investments.
Offsetting Assets and Liabilities
The Funds are parties to a Master Repurchase Agreement (“Master Repo Agreements”) that governs transactions between the Funds and selected counterparties. The master Repo Agreements maintain provision for, among other things, initiation, income payments, events of default, and maintenance of collateral for Repurchase Agreements. The Funds have elected not to offset qualifying financial and derivative instruments on the Statements of Assets and Liabilities, as such all financial and derivative instruments are presented on a gross basis. The impacts of netting arrangements that provide the right to offset are detailed below. The net
21
American Beacon Select FundsSM
Notes to Financial Statements
December 31, 2014
amount represents the net receivable or payable that would be due from or to the counterparty in the event of default. Exposure from borrowings and other financing agreements such as repurchase agreements can only be netted across transactions governed by the same Master Repo Agreement with the same legal entity. All amounts reported below represent the balance as of the report date, December 31, 2014 (in thousands).
Money Market Fund
Offsetting of Financial Assets and Derivative Assets as of December 31, 2014:
| | | | | | | | | | | | |
Description | | Gross Amounts of
Recognized Assets | | | Gross Amounts
Offset in the
Statement of Assets
and Liabilities | | | Net Amounts of Liabilities
Presented in the
Statement of Assets
and Liabilities | |
Repurchase Agreements | | $ | 213,000 | | | $ | — | | | $ | 213,000 | |
Financial Assets, Derivative Assets, and Collateral Pledged by Counterparty as of December 31, 2014:
| | | | | | | | | | | | | | | | |
| | | Net Amounts of
Assets Presented in
the Statement of
Assets and
Liabilities | | | Gross Amounts Not Offset in the
Statement of Assets and Liabilities | | | | |
Counterparty | | | Financial
Instruments1 | | | Cash Collateral
Received | | | Net Amount | |
Barclays Capital Inc. | | $ | 35,000 | | | $ | (35,000 | ) | | $ | — | | | $ | — | |
BNP Paribas Securities Corp. | | | 35,000 | | | | (35,000 | ) | | | — | | | | — | |
JPMorgan Clearing Corp. | | | 36,000 | | | | (36,000 | ) | | | — | | | | — | |
Merrill Lynch, Pierce, Fenner & Smith, Inc. | | | 35,000 | | | | (35,000 | ) | | | — | | | | — | |
RBC Capital Markets LLC | | | 37,000 | | | | (37,000 | ) | | | — | | | | — | |
Wells Fargo Securities LLC | | | 35,000 | | | | (35,000 | ) | | | — | | | | — | |
| | | | | | | | | | | | | | | | |
| | $ | 213,000 | | | $ | (213,000 | ) | | $ | — | | | $ | — | |
| | | | | | | | | | | | | | | | |
U.S. Government Money Market Fund
Offsetting of Financial Assets and Derivative Assets as of December 31, 2014:
| | | | | | | | | | | | |
Description | | Gross Amounts of
Recognized Assets | | | Gross Amounts
Offset in the
Statement of Assets
and Liabilities | | | Net Amounts of Liabilities
Presented in the
Statement of Assets
and Liabilities | |
Repurchase Agreements | | $ | 100,729 | | | $ | — | | | $ | 100,729 | |
Financial Assets, Derivative Assets, and Collateral Pledged by Counterparty as of December 31, 2014:
| | | | | | | | | | | | | | | | |
| | | Net Amounts of
Assets Presented in
the Statement of
Assets and
Liabilities | | | Gross Amounts Not Offset in the
Statement of Assets and Liabilities | | | | |
Counterparty | | | Financial
Instruments2 | | | Cash Collateral
Received | | | Net Amount | |
Barclays Capital Inc. | | $ | 12,000 | | | $ | (12,000 | ) | | $ | — | | | $ | — | |
BNP Paribas Securities Corp. | | | 13,000 | | | | (13,000 | ) | | | — | | | | — | |
Goldman Sachs & Co. | | | 42,729 | | | | (42,729 | ) | | | — | | | | — | |
Merrill Lynch, Pierce, Fenner & Smith, Inc. | | | 13,000 | | | | (13,000 | ) | | | — | | | | — | |
RBC Capital Markets LLC | | | 20,000 | | | | (20,000 | ) | | | — | | | | — | |
| | | | | | | | | | | | | | | | |
| | $ | 100,729 | | | $ | (100,729 | ) | | $ | — | | | $ | — | |
| | | | | | | | | | | | | | | | |
| 1 | Excess of collateral received from the individual counterparty is not shown for financial reporting purposes. Collateral with a value of $228,332 has been received in connection with repurchase transactions. |
| 2 | Excess of collateral received from the individual counterparty is not shown for financial reporting purposes. Collateral with a value of $105,545 has been received in connection with repurchase transactions. |
22
American Beacon Select FundsSM
Notes to Financial Statements
December 31, 2014
7. Subsequent Event
Agreement and Plan of Merger
On November 20, 2014, Lighthouse Holdings Parent, Inc. (“LHPI”), the indirect parent company of American Beacon Advisors, Inc., the Trusts’ investment manager, entered into an Agreement and Plan of Merger pursuant to which LHPI agreed to be acquired by investment funds managed by Kelso & Company, L.P. and Estancia Capital Management, LLC, both of which are private equity firms (“Transaction”). The Transaction is expected to close in the second calendar quarter of 2015, subject to customary closing conditions, including obtaining necessary client consents and approval from the Funds’ shareholders. There can be no assurance that the Transaction will be consummated as contemplated or that necessary conditions will be satisfied.
This change in control is deemed to be an “assignment” under the Investment Company Act of 1940 (the “1940 Act”) of the Trusts’ existing investment management agreement with the Manager and will result in automatic termination of the agreement. A new investment management agreement has been submitted to the Funds’ shareholders for approval under substantially the same terms as the current agreement.
The Transaction is not expected to result in any change in the portfolio management of the Fund or in the Fund’s investment objectives or policies.
23
American Beacon Money Market Select FundSM
Financial Highlights
(For a share outstanding throughout the period)
| | | | | | | | | | | | | | | | | | | | |
| | | Year Ended December 31, | |
| | 2014 | | | 2013 | | | 2012 | | | 2011 | | | 2010 | |
Net asset value, beginning of period | | $ | 1 .00 | | | $ | 1 .00 | | | $ | 1 .00 | | | $ | 1 .00 | | | $ | 1 .00 | |
| | | | | | | | | | | | | | | | | | | | |
Income from investment operations: | | | | | | | | | | | | | | | | | | | | |
Net investment income | | | 0 .00 | A | | | 0 .00 | A | | | 0.00 | A | | | 0.00 | A,B | | | 0 .00 | A,B |
Net realized gain on investments | | | 0 .00 | A | | | 0 .00 | A | | | 0 .00 | A | | | 0 .00 | A | | | 0 .00 | A |
| | | | | | | | | | | | | | | | | | | | |
Total income from investment operations | | | 0 .00 | | | | 0 .00 | | | | 0 .00 | | | | 0 .00 | | | | 0 .00 | |
| | | | | | | | | | | | | | | | | | | | |
Less distributions: | | | | | | | | | | | | | | | | | | | | |
Dividends from net investment income | | | 0 .00 | A | | | 0 .00 | A | | | 0 .00 | A | | | 0 .00 | A | | | 0 .00 | A |
Distributions from net realized gains on investments | | | 0 .00 | A | | | 0 .00 | A | | | 0 .00 | A | | | 0 .00 | A | | | 0 .00 | A |
| | | | | | | | | | | | | | | | | | | | |
Total distributions | | | 0 .00 | | | | 0 .00 | | | | 0 .00 | | | | 0 .00 | | | | 0 .00 | |
| | | | | | | | | | | | | | | | | | | | |
Net asset value, end of period | | $ | 1 .00 | | | $ | 1 .00 | | | $ | 1 .00 | | | $ | 1 .00 | | | $ | 1 .00 | |
| | | | | | | | | | | | | | | | | | | | |
Total return | | | 0 .08 | % | | | 0 .11 | % | | | 0 .19 | % | | | 0 .14 | % | | | 0 .21 | % |
| | | | | | | | | | | | | | | | | | | | |
Ratios and supplemental data: | | | | | | | | | | | | | | | | | | | | |
Net assets, end of period (in thousands) | | $ | 719,046 | | | $ | 793,408 | | | $ | 760,503 | | | $ | 662,509 | | | $ | 645,557 | |
Ratios to average net assets (annualized): | | | | | | | | | | | | | | | | | | | | |
Expenses, before reimbursements | | | 0 .13 | % | | | 0 .13 | % | | | 0 .13 | % | | | 0 .13 | %B | | | 0 .13 | %B |
Expenses, net of reimbursements | | | 0 .13 | % | | | 0 .13 | % | | | 0 .13 | % | | | 0 .13 | %B | | | 0 .13 | %B |
Net investment income, before reimbursements | | | 0 .08 | % | | | 0 .11 | % | | | 0 .18 | % | | | 0 .14 | %B | | | 0 .21 | %B |
Net investment income, net of reimbursements | | | 0 .08 | % | | | 0 .11 | % | | | 0 .18 | % | | | 0 .14 | %B | | | 0 .21 | %B |
| A | Amount is less than $0.01 per share. |
| B | The per share amounts and ratios reflect income and expenses assuming inclusion of the Fund’s proportionate share of the income and expenses of the American Beacon Master Money Market Portfolio which terminated on September 30, 2011. |
24
American Beacon U.S. Government Money Market Select FundSM
Financial Highlights
(For a share outstanding throughout the period)
| | | | | | | | | | | | | | | | | | | | |
| | | Year Ended December 31, | |
| | 2014 | | | 2013 | | | 2012 | | | 2011 | | | 2010 | |
Net asset value, beginning of period | | $ | 1 .00 | | | $ | 1 .00 | | | $ | 1 .00 | | | $ | 1 .00 | | | $ | 1 .00 | |
| | | | | | | | | | | | | | | | | | | | |
Income from investment operations: | | | | | | | | | | | | | | | | | | | | |
Net investment income | | | 0 .00 | A | | | 0 .00 | A | | | 0 .00 | A | | | 0 .00 | A | | | 0 .00 | A |
Net realized gain on investments | | | — | | | | 0 .00 | A | | | 0 .00 | A | | | 0 .00 | A | | | 0 .00 | A |
| | | | | | | | | | | | | | | | | | | | |
Total income from investment operations | | | 0 .00 | | | | 0 .00 | | | | 0 .00 | | | | 0 .00 | | | | 0 .00 | |
| | | | | | | | | | | | | | | | | | | | |
Less distributions: | | | | | | | | | | | | | | | | | | | | |
Dividends from net investment income | | | 0 .00 | A | | | 0 .00 | A | | | 0 .00 | A | | | 0 .00 | A | | | 0 .00 | A |
Distributions from net realized gains | | | — | | | | 0 .00 | A | | | 0 .00 | A | | | 0 .00 | A | | | 0 .00 | A |
| | | | | | | | | | | | | | | | | | | | |
Total distributions | | | 0 .00 | | | | 0 .00 | | | | 0 .00 | | | | 0 .00 | | | | 0 .00 | |
| | | | | | | | | | | | | | | | | | | | |
Net asset value, end of period | | $ | 1 .00 | | | $ | 1 .00 | | | $ | 1 .00 | | | $ | 1 .00 | | | $ | 1 .00 | |
| | | | | | | | | | | | | | | | | | | | |
Total return | | | 0 .01 | % | | | 0 .02 | % | | | 0 .09 | % | | | 0 .04 | % | | | 0 .13 | % |
| | | | | | | | | | | | | | | | | | | | |
Ratios and supplemental data: | | | | | | | | | | | | | | | | | | | | |
Net assets, end of period (in thousands) | | $ | 301,675 | | | $ | 367,701 | | | $ | 238,236 | | | $ | 253,776 | | | $ | 324,695 | |
Ratios to average net assets (annualized): | | | | | | | | | | | | | | | | | | | | |
Expenses, before expense reimbursements | | | 0 .14 | % | | | 0 .14 | % | | | 0 .15 | % | | | 0 .14 | % | | | 0 .14 | % |
Expenses, net of expense reimbursements | | | 0 .11 | % | | | 0 .13 | % | | | 0 .14 | % | | | 0 .14 | % | | | 0 .13 | % |
Net investment income, before expense reimbursements | | | (0 .01 | )% | | | 0 .01 | % | | | 0 .09 | % | | | 0 .04 | % | | | 0 .12 | % |
Net investment income, net of expense reimbursements | | | 0 .01 | % | | | 0 .02 | % | | | 0 .09 | % | | | 0 .04 | % | | | 0 .12 | % |
| A | Amount is less than $0.01 per share. |
25
American Beacon Select FundsSM
Privacy Policy and Federal Tax Information
December 31, 2014 (Unaudited)
Privacy Policy
The American Beacon Select Funds recognize and respect the privacy of our shareholders. We are providing this notice to you so you will understand how shareholder information may be collected and used.
We may collect nonpublic personal information about you from one or more of the following sources:
| | • | | information we receive from you on applications or other forms; |
| | • | | information about your transactions with us or our service providers; and |
| | • | | information we receive from third parties. |
We do not disclose any nonpublic personal information about our customers or former customers to anyone, except as permitted by law.
We restrict access to your nonpublic personal information to those employees or service providers who need to know that information to provide products or services to you. To ensure the confidentiality of your nonpublic personal information, we maintain safeguards that comply with federal standards.
Federal Tax Information
Certain tax information regarding the Funds is required to be provided to shareholders upon the distribution of the Funds’ Income for the taxable year ended December 31, 2014. The information and distributions reported herein may differ from information and distributions taxable to the shareholders for the calendar year ended December 31, 2014.
The distributions to shareholders during the tax year ended December 31, 2014 include short-term capital gains of $8,198 for the Money Market Fund and $2 for the U.S. Government Money Market Fund.
Of the ordinary dividends paid to shareholders of the Government Fund during the tax year ended December 31, 2014, .48% were derived from U.S. Treasury Obligations.
Shareholders will receive notification in January 2015 of the applicable tax information necessary to prepare their 2014 income tax returns.
26
Trustees and Officers of the American Beacon Select FundsSM
(Unaudited)
The Trustees and officers of the American Beacon Select Funds (the “Trust”) are listed below, together with their principal occupations during the past five years. Unless otherwise indicated, the address of each person listed below is 220 East Las Colinas Boulevard, Suite 1200, Irving, Texas 75039. Each Trustee oversees thirty-three funds in the fund complex that includes the Trust and the American Beacon Funds. The Trust’s Statement of Additional Information contains additional information about the Trustees and is available without charge by calling 1-800-658-5811.
| | | | |
Name, Age and Address | | Position, Term of Office and Length of Time Served with the Trust | | Principal Occupation(s) During Past 5 Years and Current Directorships |
| | |
| INTERESTED TRUSTEES | | Term | | |
| | Lifetime of Trust until removal, resignation or retirement* | | |
| | |
| Alan D. Feld** (78) | | Trustee since 1999 | | Sole Shareholder of a professional corporation which is a Partner in the law firm of Akin, Gump, Strauss, Hauer & Feld, LLP (law firm) (1960-Present); Director, Clear Channel Communications (1984-2008); Trustee, American Beacon Mileage Funds (1996-2012); Trustee, American Beacon Funds (1999-Present); Trustee, American Beacon Master Trust (1996-2012). |
| | |
| NON-INTERESTED TRUSTEES | | Term Lifetime of Trust until removal, resignation or retirement* | | |
| | |
| Gerard J. Arpey (56) | | Trustee since 2012 | | Partner, Emerald Creek Group (private equity firm) (2011-Present); Chairman and Chief Executive Officer, (2003-2011), AMR Corp. and American Airlines; Inc.; Director, S. C. Johnson & Son, Inc. (privately held company) (2008-present); Trustee, American Beacon Funds (2012-Present). |
| | |
| W. Humphrey Bogart (70) | | Trustee since 2004 | | Trustee, American Beacon Mileage Funds (2004-2012); Trustee, American Beacon Funds (2004-Present); Trustee, American Beacon Master Trust (2004-2012). |
| | |
| Brenda A. Cline (54) | | Trustee since 2004 | | Executive Vice President, Chief Financial Officer, Treasurer and Secretary, Kimbell Art Foundation (1993-Present); Trustee, American Beacon Mileage Funds (2004-2012); Trustee, American Beacon Funds (2004-Present); Trustee, American Beacon Master Trust (2004-2012). |
| | |
| Eugene J. Duffy (60) | | Trustee since 2008 | | Principal and Executive Vice President, Paradigm Asset Management (1994-Present); Director, Sunrise Bank of Atlanta (2008-Present); Trustee, American Beacon Mileage Funds (2008-2012); Trustee, American Beacon Funds (2008-Present); Trustee, American Beacon Master Trust (2008-2012). |
| | |
| Thomas M. Dunning (72) | | Trustee since 2008 | | Chairman Emeritus (2008-Present); Chairman (1998-2008) and Chief Executive Officer (1998-2007), Lockton Dunning Benefits (consulting firm in employee benefits); Board Director, Oncor Electric Delivery Company LLC (2007-Present); Board Member, BancTec (2010-Present); Trustee, American Beacon Mileage Funds (2008-2012); Trustee, American Beacon Funds (2008-Present); Trustee, American Beacon Master Trust (2008-2012). |
| | |
| Richard A. Massman (71) | | Trustee since 2004 Chairman since 2008 | | Consultant and General Counsel Emeritus (2009-Present) and Senior Vice President and General Counsel (1994-2009), Hunt Consolidated, Inc. (holding company engaged in oil and gas exploration and production, refining, real estate, farming, ranching and venture capital activities); Trustee, American Beacon Mileage Funds (2004-2012); Trustee, American Beacon Funds (2004-Present); Trustee, American Beacon Master Trust (2004-2012). |
| | |
| Barbara J. McKenna, CFA (51) | | Trustee since 2012 | | Managing Principal, Longfellow Investment Management Company (2005-Present); Trustee, American Beacon Funds (2012-Present). |
| | |
R. Gerald Turner (69) 225 Perkins Admin. Bldg. Southern Methodist Univ. Dallas, Texas75275 | | Trustee since 2001 | | President, Southern Methodist University (1995-Present); Director, J.C. Penney Company, Inc. (1996-Present); Director, Kronus Worldwide Inc. (chemical manufacturing) (2003-Present); Director, First Broadcasting Investment Partners, LLC (2003-2007); Trustee, American Beacon Mileage Funds (2001-2012); Trustee, American Beacon Funds (2001-Present); Trustee, American Beacon Master Trust (2001-2012). |
27
Trustees and Officers of the American Beacon Select FundsSM
(Unaudited)
| | | | |
Name, Age and Address | | Position, Term of Office and Length of Time Served with the Trust | | Principal Occupation(s) During Past 5 Years and Current Directorships |
| | |
| OFFICERS | | Term | | |
| | One Year | | |
| | |
| Gene L. Needles, Jr. (60) | | President since 2009 Executive Vice President 2009 | | President, CEO and Director (2009-Present), American Beacon Advisors, Inc.; President (2009-Present), President, CEO and Director (2009-Present), Lighthouse Holdings, Inc.; President and CEO (2009-Present), Lighthouse Holdings Parent, Inc.; President (2009-Present), American Beacon Funds; President (2009-Present), American Beacon Mileage Funds; President (2008-2009), Touchstone Investments; President (2003-2007), CEO (2004-2007), AIM Distributors. |
| | |
| Rosemary K. Behan (55) | | VP, Secretary and Chief Legal Officer since 2006 | | General Counsel, Vice President, Legal and Compliance, American Beacon Advisors, Inc. (2006-Present); Secretary, American Beacon Advisors, Inc. (2008 – present); Secretary, Lighthouse Holdings, Inc. (2008-Present); Secretary, Lighthouse Holdings Parent, Inc. (2008-Present). |
| | |
| Brian E. Brett (54) | | VP since 2004 | | Vice President, Director of Sales, American Beacon Advisors, Inc. (2004-Present). |
| | |
| Wyatt L. Crumpler (48) | | VP since 2007 | | Chief Investment Officer (2012-Present), Vice President, Asset Management (2009-2011), and Vice President, Trust Investments (2007-2009), American Beacon Advisors, Inc. |
| | |
| Erica Duncan (44) | | VP since 2011 | | Vice President, Marketing and Client Services (2011-Present), American Beacon Advisors, Inc.; Supervisor, Brand Marketing (2010-2011), Invesco; Supervisor, Marketing Communications (2009-2010) and Senior Financial Writer (2004-2009), Invesco AIM. |
| | |
| Michael W. Fields (60) | | VP since 1989 | | Chief Fixed Income Officer (2011-Present) and Vice President, Fixed Income Investments, American Beacon Advisors, Inc. (1988-2011); Director, American Beacon Global Funds SPC (2002-2011); Director, American Beacon Global Funds plc (2007-2009). |
| | |
| Melinda G. Heika (53) | | Treasurer since 2010 | | Treasurer (2010-Present), and Controller (2005-2009), American Beacon Advisors, Inc.; Treasurer, Lighthouse Holdings, Inc. (2010 – Present); Treasurer, Lighthouse Holdings Parent, Inc. (2010-Present). |
| | |
| Terri L. McKinney (51) | | VP since 2010 | | Vice President, Enterprise Services (2009-Present) and Managing Director (2003-2009), American Beacon Advisors, Inc. |
| | |
| Jeffrey K. Ringdahl (39) | | VP since 2010 | | Chief Operating Officer, American Beacon Advisors, Inc. (2010-Present); Vice President, Product Management, Touchstone Advisors, Inc. (2007-2010); Senior Director, Business Integration, Fidelity Investments (2005-2007). |
| | |
| Samuel J. Silver (51) | | VP since 2011 | | Vice President, Fixed Income Investments (2011-Present) and Senior Portfolio Manager, Fixed Income Investments (1999-2011), American Beacon Advisors, Inc. |
| | |
| Christina E. Sears (43) | | Chief Compliance Officer since 2004 and Asst. Secretary since 1999 | | Chief Compliance Officer (2004-Present) and Senior Compliance Analyst (1998-2004), American Beacon Advisors, Inc. |
| | |
| Sonia L. Bates (58) | | Asst. Treasurer since 2011 | | Director, Tax and Financial Reporting (2011-Present) and Manager, Tax and Financial Reporting (2005-2010), American Beacon Advisors, Inc.; Asst. Treasurer (2011-Present), Lighthouse Holdings, Inc.; Asst. Treasurer (2011-Present), Lighthouse Holdings Parent, Inc. |
| * | As of 11/12/2014, the Board adopted a retirement plan that requires Trustees to retire no later than the last day of the calendar year in which they reach the age of 75. |
| ** | Mr. Feld is deemed to be an “interested person” of the Trusts, as defined by the 1940 Act. Mr. Feld’s law firm of Akin, Gump, Strauss, Hauer & Feld LLP has provided legal services within the past two fiscal years to the Manager and one or more other Trust’s sub-advisors to the American Beacon Funds. |
28
This page intentionally left blank.
29

Delivery of Documents
eDelivery is NOW AVAILABLE – Stop traditional mail delivery and receive your shareholder reports and summary prospectus on-line. Sign up at www.americanbeaconfunds.com
If you invest in the Funds through a financial institution, you may be able to receive the Fund’s regulatory mailings, such as the Summary Prospectus, Annual Report and Semi-Annual Report, by e-mail. If you are interested in this option, please go to www.icsdelivery.com and search for your financial institution’s name or contact your financial institution directly.
To obtain more information about the Fund:
| | | | |
 | | | |  |
| | |
By E-mail: american_beacon.funds@ambeacon.com | | | | On the Internet: Visit our website at www.americanbeaconfunds.com |
| | | | |
| | | |
 | | | |  |
| | |
By Telephone: Call (800) 658-5811 | | | | By Mail: American Beacon Select Funds P.O. Box 219643 Kansas City, MO 64121 |
| | | | |
| | | | | |
| | |
Availability of Quarterly Portfolio Schedules In addition to the Schedule of Investments provided in each semi-annual and annual report, the Fund files a complete schedule of its portfolio holdings with the Securities and Exchange Commission (“SEC”) on Form N-Q as of the first and third fiscal quarters. The Fund’s Forms N-Q are available on the SEC’s website at www.sec.gov. The Forms N-Q may also be reviewed and copied at the SEC’s Public Reference Section, 100 F Street, NE, Washington, D.C. 20549-1520. Information regarding the operation of the SEC’s Public Reference Room may be obtained by calling (202) 551-8090. A complete schedule of the Fund’s portfolio holdings is also available on www.americanbeaconfunds.com approximately five days after the end of each month. | | | | Availability of Proxy Voting Policy and Records A description of the policies and procedures the Fund uses to determine how to vote proxies relating to portfolio securities is available in the Fund’s Statement of Additional Information, is available free of charge on the Fund’s website www.americanbeaconfunds.com and by calling 1-800-967-9009 or by accessing the SEC’s website at www.sec.gov. The Fund’s proxy voting record for the most recent year ended June 30 is filed annually with the SEC on Form N-PX. The Fund’s Forms N-PX are available on the SEC’s website at www.sec.gov. The Fund’s proxy voting record may also be obtained by calling 1-800-967-9009. |
Fund Service Providers:

This report is prepared for shareholders of the American Beacon Select Funds and may be distributed to others only if preceded or accompanied by a current Prospectus or Summary Prospectus.
American Beacon Select Funds, American Beacon Money Market Select Fund, and American Beacon U.S. Government Money Market Select Fund are service marks of American Beacon Advisors, Inc.
AR 12/14
ITEM 2. CODE OF ETHICS.
The Trust has adopted a code of ethics that applies to its principal executive and financial officers (the “Code”). The Trust amended its code November 12, 2013 to disclose the removal of terminated Investment Companies. The Trust did not grant any waivers to the provisions of the Code during the period covered by the shareholder report presented in Item 1. The Code is filed herewith as Exhibit 99.CODE ETH.
ITEM 3. AUDIT COMMITTEE FINANCIAL EXPERT.
The Trust’s Board of Trustees has determined that Ms. Brenda A. Cline, a member of the Trust’s Audit and Compliance Committee, is an “audit committee financial expert” as defined in Form N-CSR. Ms. Brenda A. Cline is “independent” as defined in Form N-CSR.
ITEM 4. PRINCIPAL ACCOUNTANT FEES AND SERVICES.
| | | | |
(a) Audit Fees | | Fiscal Year Ended | |
$57,888 | | | 12/31/2013 | |
$59,740 | | | 12/31/2014 | |
| |
(b) Audit-Related Fees | | Fiscal Year Ended | |
$0 | | | 12/31/2013 | |
$0 | | | 12/31/2014 | |
| |
(c) Tax Fees | | Fiscal Year Ended | |
$0 | | | 12/31/2013 | |
$0 | | | 12/31/2014 | |
| |
(d) All Other Fees | | Fiscal Year Ended | |
$0 | | | 12/31/2013 | |
$0 | | | 12/31/2014 | |
(e)(1) Pursuant to its charter, the Trust’s Audit and Compliance Committee shall have the following duties and powers pertaining to pre-approval of audit and non-audit services provided by the Trust’s principal accountant:
- to approve, prior to appointment, the engagement of auditors to annually audit and provide their opinion on the Trusts’ financial statements, and, in connection therewith, reviewing and evaluating matters potentially affecting the independence and capabilities of the auditors;
- to approve, prior to appointment, the engagement of the auditors to provide non-audit services to the Trusts, an investment adviser to any series of the Trusts or any entity controlling, controlled by, or under common control with an investment adviser (“adviser affiliate”) that provides ongoing services to the Trusts, if the engagement relates directly to the operations and financial reporting of the Trusts;
- to consider whether the non-audit services provided by a Trust’s auditor to an investment adviser or any adviser affiliate that provides ongoing services to a series of the Trusts, which services were not pre-approved by the Committee, are compatible with maintaining the auditor’s independence;
- to review the arrangements for and scope of the annual audit and any special audits; and
- to review and approving the fees proposed to be charged to the Trusts by the auditors for each audit and non-audit service.
The Audit and Compliance Committee may delegate any portion of its authority, including the authority to grant pre-approvals of audit and permitted non-audit services, to a subcommittee of one or more members. Any decisions of the subcommittee to grant pre-approvals shall be presented to the full audit committee at its next regularly scheduled meeting.
(e)(2) None of the fees disclosed in paragraphs (b) through (d) above were approved by the audit committee pursuant to paragraph (c)(7)(i)(C) of Rule 2-01 of Regulation S-X.
(f) Not applicable.
Aggregate Non-Audit Fees for Services Rendered to the:
| | | | | | | | | | | | |
| | | | | | Adviser’s Affiliates Providing | | | | |
Registrant | | Adviser | | | Ongoing Services to Registrant | | | Fiscal Year Ended | |
$ 0 | | $ | 50,950 | | | | N/A | | | | 12/31/2013 | |
$ 0 | | $ | 34,905 | | | | N/A | | | | 12/31/2014 | |
(h) Not applicable.
ITEM 5. AUDIT COMMITTEE OF LISTED REGISTRANTS.
Not applicable.
ITEM 6. SCHEDULE OF INVESTMENTS.
The schedules of investments for each series of the Trust are included in the shareholder report presented in Item 1.
ITEM 7. DISCLOSURE OF PROXY VOTING POLICIES AND PROCEDURES FOR CLOSED-END MANAGEMENT INVESTMENT COMPANIES.
Not applicable.
ITEM 8. PORTFOLIO MANAGERS OF CLOSED-END MANAGEMENT INVESTMENT COMPANIES.
Not applicable.
ITEM 9. PURCHASES OF EQUITY SECURITIES BY CLOSED-END MANAGEMENT INVESTMENT COMPANY AND AFFILIATED PURCHASERS.
Not applicable.
ITEM 10. SUBMISSION OF MATTERS TO A VOTE OF SECURITY HOLDERS.
The Trust has made no material changes to the procedures by which shareholders may recommend nominees to the Trust’s Board of Trustees since the Trust last disclosed such procedures in Schedule 14A.
ITEM 11. CONTROLS AND PROCEDURES.
(a) Based upon an evaluation within 90 days of the filing date of this report, the principal executive and financial officers concluded that the disclosure controls and procedures of the Trust are effective.
(b) There were no changes in the Trust’s internal control over financial reporting during the second fiscal quarter of the period covered by this report that has materially affected, or is reasonably likely to materially affect, the Trust’s internal control over financial reporting.
ITEM 12. EXHIBITS.
(a)(1) Filed herewith as EX-99.CODE ETH.
(a)(2) A separate certification for each principal executive officer and principal financial officer of the Trust as required by Rule 30a-2(a) under the Investment Company Act of 1940 is attached hereto as EX-99.CERT.
(a)(3) Not applicable.
(b) The certifications required by Rule 30a-2(b) under the Investment Company Act of 1940 are attached hereto as EX-99.906CERT.
SIGNATURES
Pursuant to the requirements of the Securities Exchange Act of 1934 and the Investment Company Act of 1940, the registrant has duly caused this report to be signed on its behalf by the undersigned, thereunto duly authorized.
(Registrant): American Beacon Select Funds
| | |
| By | | /s/ Gene L. Needles, Jr. |
| | Gene L. Needles, Jr. |
| | President |
Date: March 6, 2015
| | |
| By | | /s/ Melinda G. Heika |
| | Melinda G. Heika |
| | Treasurer |
Date: March 6, 2015
Pursuant to the requirements of the Securities Exchange Act of 1934 and the Investment Company Act of 1940, this report has been signed below by the following persons on behalf of the registrant and in the capacities and on the dates indicated.
| | |
| By | | /s/ Gene L. Needles, Jr. |
| | Gene L. Needles, Jr. |
| | President |
Date: March 6, 2015
| | |
| By | | /s/ Melinda G. Heika |
| | Melinda G. Heika |
| | Treasurer |
Date: March 6, 2015